تحليل فجوة الطاقة في مواد MOF: تمييز الانتقالات المباشرة وغير المباشرة باستخدام مطيافية الأشعة فوق البنفسجية والمرئية Band gap analysis in MOF materials: Distinguishing direct and indirect transitions using UV–vis spectroscopy

المجلة: Applied Materials Today، المجلد: 37
DOI: https://doi.org/10.1016/j.apmt.2024.102094
تاريخ النشر: 2024-02-10

تحليل فجوة الطاقة في مواد MOF: تمييز الانتقالات المباشرة وغير المباشرة باستخدام مطيافية الأشعة فوق البنفسجية والمرئية

بيدرو أندرادي، كريستوف فولكرينجر، تييري لوازو، أنطونيو تيخيدا، ماثيو هوريو، ألان موازيت

للاستشهاد بهذه النسخة:

بيدرو أندرادي، كريستوف فولكرينجر، تييري لوازو، أنطونيو تيخيدا، ماثيو هوريو، وآخرون. تحليل فجوة الطاقة في مواد MOF: تمييز الانتقالات المباشرة وغير المباشرة باستخدام مطيافية الأشعة فوق البنفسجية والمرئية. المواد التطبيقية اليوم، 2024، المواد التطبيقية اليوم، 37، الصفحات 102094. 10.1016/j.apmt.2024.102094 . hal-04467475
HAL Id: hal-04467475
https://hal.univ-lille.fr/hal-04467475v1
تم التقديم في 20 فبراير 2024
HAL هو أرشيف مفتوح متعدد التخصصات لإيداع ونشر الوثائق البحثية العلمية، سواء كانت منشورة أم لا. قد تأتي الوثائق من مؤسسات التعليم والبحث في فرنسا أو في الخارج، أو من مراكز البحث العامة أو الخاصة.
الأرشيف المفتوح متعدد التخصصات HAL مخصص لإيداع ونشر الوثائق العلمية على مستوى البحث، سواء كانت منشورة أم لا، والتي تصدر عن مؤسسات التعليم والبحث الفرنسية أو الأجنبية، أو المختبرات العامة أو الخاصة.

تحليل فجوة النطاق في مواد MOF: تمييز الانتقالات المباشرة وغير المباشرة باستخدام طيف الأشعة فوق البنفسجية والمرئية

بيدرو إتش. إم. أندرادي كريستوف فولكرينجر تييري لوازو أنتونيو تيخيدا ماثيو هوريو ألان موازيت مختبر الطيفية للتفاعلات، التفاعل والبيئة (LASIRE)، جامعة ليل – العلوم والتكنولوجيا، فيلنوف داسك 59655، فرنسا وحدة التحفيز وكيمياء المواد الصلبة (UCCS)، جامعة ليل، CNRS، سنترال ليل، جامعة أرتوا، UMR 8181، فيلنوف داسك 59655، فرنسا جامعة باريس-ساكلاي، المركز الوطني للبحث العلمي، مختبر فيزياء المواد الصلبة، أورساي 91405، فرنسا

معلومات المقال

الكلمات المفتاحية:

فجوة الطاقة
وزارة المالية
انحدار بولتزمان
كرامر-كرونيغ
UV-مرئي

الملخص

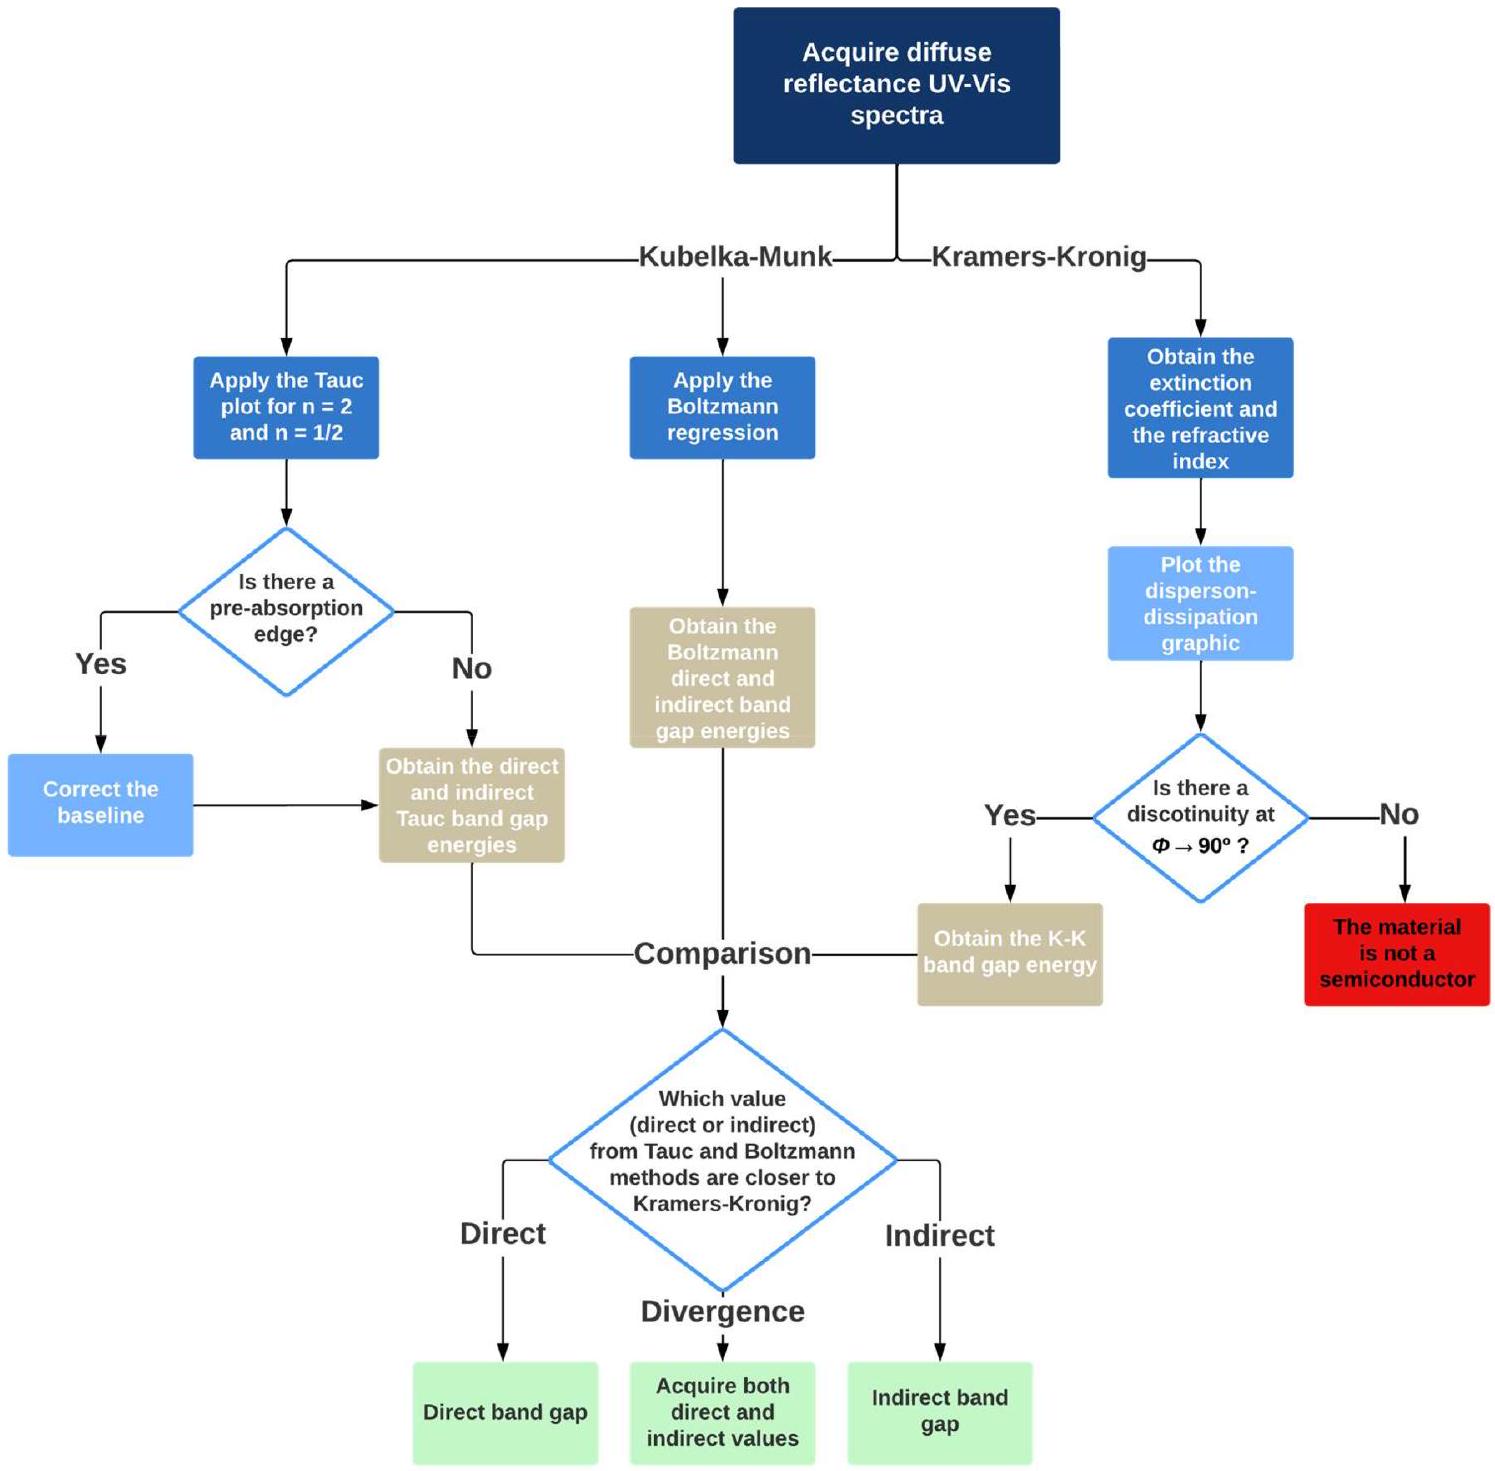
إطارات المعادن العضوية (MOFs) قد حظيت باهتمام كبير بسبب تطبيقاتها المحتملة في تخزين الغاز، والفصل، والحفز. هذه المواد المسامية تظهر خصائص تهم في فيزياء أشباه الموصلات والحفز الضوئي المتجانس، حيث يتم غالبًا مزج المفاهيم من كيمياء التنسيق وفيزياء أشباه الموصلات. في مجال الحفز الضوئي، يعتبر فجوة الطاقة البصرية لأشباه الموصلات معلمة حاسمة تحدد وظيفتها. على الرغم من كل الاهتمام بـ MOFs، لا يزال هناك نقص كبير في المعلومات حول تقييم فجوة الطاقة الخاصة بها (خاصة إذا كانت الفجوة مباشرة أو غير مباشرة) باستخدام مطيافية الأشعة فوق البنفسجية والمرئية، وهناك تباين كبير في هذه القيم. تُستخدم طريقة مخطط تاوك بشكل متكرر للوصول إلى فجوات الطاقة، على الرغم من أنها ليست دقيقة دائمًا، خاصة في تمييز الفجوات المباشرة وغير المباشرة. يمكن الوصول إلى تحليل أكثر اكتمالاً ودقة من خلال استخدام تقنيات تجريبية إضافية (مطيافية XPS وUPS وIPES)، التي ليست دائمًا سهلة الوصول. تتناول هذه الدراسة عدة طرق لتحديد فجوة الطاقة لمواد MOF وتقترح منهجيات لتفسير البيانات بشكل صحيح، مما يؤدي إلى توافق أفضل بين الفجوات التجريبية والنظرية. تم تحليل عدة طرق للوصول إلى فجوة الطاقة لمواد MOF المختلفة – UiO-66(Zr)، UiO-66(Hf)، UiO-66(Zr/Ti)، UiO-66(Hf/Ti)، UiO-67(Zr)_NH2، UiO-67(Zr/Hf)_NH2، UiO67(Hf)_NH2، MIL-125(Ti)، وMIL-125(Ti)_NH2 – فقط من بيانات الانعكاس المنتشر للأشعة فوق البنفسجية والمرئية (DR-UV-vis). طريقة كوبيلكا-مونك و تمت دراسة أساليب مختلفة لتحويل طيف DR-UV-vis، وتظهر النتائج أن الطريقة السابقة أكثر ملاءمة، حيث توفر أطيافًا بحواف امتصاص أكثر حدة، مما يسهل تفسير وتوصيف فجوات النطاق البصرية. كما يبرز هذا البحث أهمية معالجة البيانات المسبقة وتصحيح الخط الأساسي في الحالات التي يكون فيها حافة امتصاص مسبقة موجودة. أخيرًا، من خلال تطبيق تحويل كرامرز-كرونيغ على أطياف الانعكاس، والانحدار بولتزمان على بيانات كوبيلكا-مونك، تم إنشاء قاعدة صلبة لتحديد ما إذا كان للمادة فجوة مباشرة أو غير مباشرة. بالإضافة إلى ذلك، تم مناقشة الحاجة إلى الحصول على قيم فجوة النطاق غير المباشرة والمباشرة لبعض المواد، حيث يمكن أن تحدث كلا الانتقالين في بعض هذه المواد الهجينة في وقت واحد. يوجه هذا البحث المجتمع البحثي نحو منهجية أكثر ملاءمة لتقييم فجوات النطاق البصرية في المواد الهجينة، حيث يساعد الباحثين في اختيار أفضل منهجية لاحتياجاتهم مع تجنب الأخطاء الشائعة في تفسير البيانات.

1. المقدمة

أصبح التحفيز الضوئي غير المتجانس مجالًا ذا اهتمام كبير منذ تطوره المبكر في السبعينيات [1]. ومنذ ذلك الحين، أصبح منطقة متعددة التخصصات تضم فيزياء أشباه الموصلات، وعلوم السطح، والكيمياء الفيزيائية، وعلوم المواد، وعلم الأحياء،
وهندسة الكيمياء [2،3]. بعد عرض تحليل الماء الضوئي في وجود من قبل فوجيشيمَا وهوندا في عام 1972 [1]، تم تقييم أنواع مختلفة من أشباه الموصلات بشكل مكثف وفقًا لخصائصها الضوئية في الخلائط السائلة والغازية، ومن الجدير بالذكر ، و CdS [2،4]. في وقت لاحق، تم تطوير العديد من المواد والوصلة غير المتجانسة الأخرى لـ
تطبيقات التحفيز الضوئي، مثل البوليمرات [5]، والهياكل العضوية المعدنية (MOFs) [6]، وMOFs- الهجائن [7]. لقد تم تحسين خصائص تلك المواد – مثل المسامية، المساحة السطحية النوعية (SSA)، حجم الجسيمات، والبنية الإلكترونية – باستمرار على مر السنين بسبب الأبحاث المكثفة في هذا المجال [8-10]. عند النظر في أشباه الموصلات غير العضوية الأكثر شيوعًا، فإن خصائصها الرئيسية (مثل البنية الإلكترونية، طاقات فجوة النطاق وأنواعها) معروفة تمامًا، وذلك بفضل العدد الكبير من البيانات التجريبية والنظرية التي تم جمعها بالفعل. من ناحية أخرى، بسبب العدد الكبير من الهياكل الإطارية المعدنية العضوية (MOFs) التي توجد بالفعل والتي يتم اكتشافها يوميًا (هناك أكثر من 90,000 هيكل MOF موثق في قاعدة بيانات كامبريدج الهيكلية وأكثر من 500,000 تم التنبؤ بها) [11,12]، فإن الدراسات النظرية التي تستغرق عادةً عدة أشهر لإجرائها لا يمكن أن تواكب السرعة التي يتم بها اكتشاف هياكل جديدة.
تتميز هذه المواد الهجينة البلورية المسامية بخصائص تجمع، في بعض الجوانب، بين فيزياء أشباه الموصلات والتصوير الضوئي المتجانس. وبالتالي، يمكن اعتبارها مواد صلبة ذات حدود محددة جيدًا مع المحلول، ولكن أيضًا كجزيئات شبه لانهائية. من غير المعتاد كيف يتم غالبًا خلط مفاهيم كيمياء التنسيق مع تلك الخاصة بفيزياء أشباه الموصلات في أدبيات MOFs. تطرح هذه الطبيعة المزدوجة تحديًا عند معالجة الخصائص الكلاسيكية لأشباه الموصلات، مثل الموصلية الكهربائية، وهي معلمة حاسمة لتصنيف الموصلات، وأشباه الموصلات، أو مواد العوازل، والتي لم يتم استكشافها بشكل موسع في سياق تصوير MOF الضوئي. تمتلك أشباه الموصلات غير العضوية الكلاسيكية موصلية في نطاق إلى [15-17]. على النقيض من ذلك، فإن MOFs مثل UiO-66 ( ) و MIL-100(Fe) ( س. ) تعرض قيمًا أقل ملحوظة [ 18,19 ]. تثير هذه الفجوة السؤال عما إذا كان ينبغي تصنيف بعض MOFs كعوازل أو أشباه موصلات. من الضروري الاعتراف بأنه، على عكس أشباه الموصلات التقليدية ذات الشبكات البلورية المعبأة بكثافة والمسارات المستمرة، تعتمد الموصلية الكهربائية لـ MOFs على مجمعات نقل الشحنات بين مكوناتها العضوية وغير العضوية [13]. وبالتالي، فإن حركة حامل الشحنة تعتمد على الكثافة والديناميات لهذه الحالات القافزة [14]. يجب أيضًا أن يؤخذ في الاعتبار أن الهيكل المسامي لـ MOFs يخلق قربًا بين المواقع النشطة ضوئيًا والأنواع المستهدفة، مما يلغي الحاجة إلى هجرة حاملات الشحنة نحو السطح الخارجي للمادة (كما هو الحال في معظم أشباه الموصلات غير العضوية). لهذا السبب، يمكن أن تظهر مواد MOF غالبًا أنشطة ضوئية أعلى من أشباه الموصلات التقليدية على الرغم من أن قيم موصليتها أصغر بكثير [20].
واحدة من أهم خصائص شبه الموصل هي ما إذا كانت فجوة النطاق البصري الخاصة بها تظهر انتقالًا مباشرًا أو غير مباشر، حيث سيكون لذلك عواقب مباشرة على ديناميات الإلكترون والثقب والتفاعل عند التحفيز الضوئي [21]. في الواقع، إذا كان لدى شبه الموصل فجوة نطاق مباشرة وكان الانتقال الكهربائي ثنائي القطب من الحد الأقصى لحزمة التكافؤ (VBM) إلى الحد الأدنى لحزمة التوصيل (CBM) مسموحًا به، فإن أزواج الإلكترون والثقب ستعيد التركيب إشعاعيًا باحتمالية عالية [21]. من ناحية أخرى، فإن إعادة التركيب تعيق في مواد فجوة النطاق غير المباشرة بسبب فرق الزخم في منطقة بريلوان بين VBM و CBM [21]. لذلك، من المتوقع أن تظهر أشباه الموصلات ذات فجوة النطاق غير المباشرة أنشطة ضوئية أعلى مقارنة بتلك ذات الفجوات المباشرة.
بالنسبة لأشباه الموصلات غير العضوية، غالبًا ما يتم الحصول على هذه الفجوة باستخدام مخطط تاوك المطبق على بيانات UV-vis، وطبيعة الانتقال تغير بشكل كبير القيم المستخلصة [22]. ومع ذلك، فإن الأساليب المعتمدة فقط على هذه الطريقة ليست دقيقة بشكل عام، خاصة لتمييز الفجوات المباشرة وغير المباشرة. لمواجهة هذه القيود، غالبًا ما يجمع الباحثون بين تقنيات تجريبية أخرى للحصول على هذه المعلومات، مثل مطيافية الإلكترونات الضوئية بالأشعة السينية (XPS)، ومطيافية الإلكترونات الضوئية فوق البنفسجية (UPS)، ومطيافية الإلكترونات الضوئية العكسية (IPES) [23]. ومع ذلك، فإن هذه التقنيات ليست دائمًا سهلة الوصول، مما يعيق تحليلًا أكثر اكتمالًا ودقة. لهذا السبب، يلفت هذا البحث الانتباه إلى الدراسات العديدة التي تم إجراؤها في العقود القليلة الماضية من أجل
الشكل 1. مخطط يوضح الأنواع المختلفة من الانتقالات البصرية بين حزمة التكافؤ وحزمة التوصيل في شبه موصل. باللون الأسود: الانتقالات المسموح بها. باللون الأحمر: الانتقالات المحظورة. الأسهم الصلبة تمثل الانتقالات المباشرة والأسهم المنقطة تمثل غير المباشرة. المعامل يعتمد على انتقال الإلكترون الذي يظهره المادة – على سبيل المثال، الانتقال غير المباشر المسموح به ( )، الانتقال المباشر المسموح به ( )، الانتقال غير المباشر المحظور ( )، والانتقال المباشر المحظور ( ).
تقييم الهيكل الإلكتروني للأطر المعدنية العضوية. كما يناقش موثوقية النتائج المستخلصة ومنهجياتها المعنية، مقترحًا مجموعة من المنهجيات لتحديد طاقات وأنواع فجوة النطاق فقط من بيانات الانعكاس المنتشر UV-vis، مما ينبغي أن يقلل الفجوة بين التجربة والنظرية في مجال MOF.

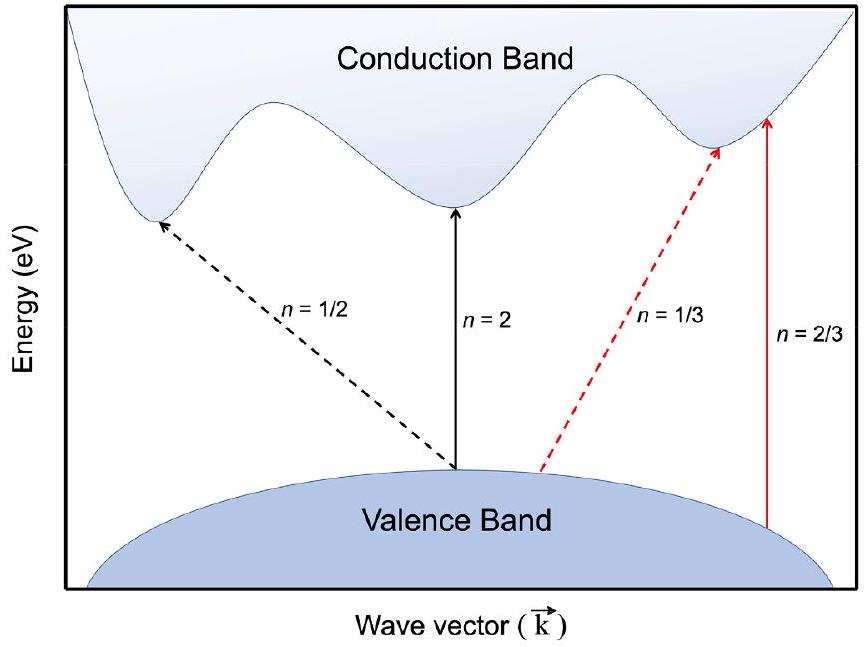
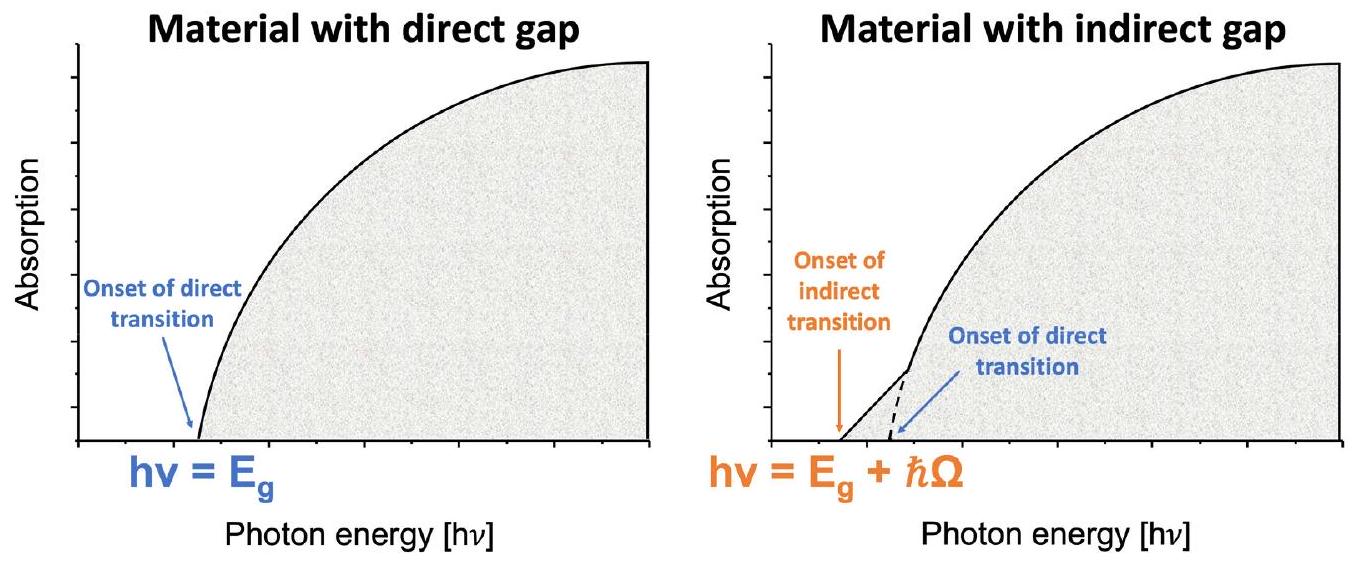
1.1. نظرية فجوة النطاق في مطيافية UV-vis

يمكن تمييز فئات مختلفة من المواد مثل المعادن وأشباه الموصلات والعوازل من خلال توزيع الطاقة لحالاتها الإلكترونية بالقرب من مستوى فيرمي [24,25]. في المعادن وغيرها من المواد الموصلة، يقع مستوى فيرمي داخل على الأقل حزمة واحدة؛ بينما في أشباه الموصلات والعوازل يقع في نطاق طاقة حيث لا يمكن أن توجد حالة إلكترونية [26]. تشير هذه المنطقة، المعروفة عمومًا بفجوة النطاق ( )، إلى الفرق في الطاقة (عادةً بالـ eV) بين VBM و CBM. بعبارة أخرى، تمثل الحد الأدنى من الطاقة اللازمة ( ) لترقية إلكترون مرتبط بذرة إلى إلكترون توصيل، والذي يمكنه التحرك بحرية عبر الشبكة البلورية، مما يعمل كحامل شحنة.
على سبيل المثال، تمتلك أشباه الموصلات القدرة على امتصاص الفوتونات بكمية معينة من الطاقة واستخدامها لتحفيز الإلكترونات من حزمة التكافؤ (VB) إلى حزمة التوصيل (CB) [27]. تم إجراء العديد من الدراسات بهدف الحصول على مركبات ذات فجوات نطاق أضيق، مما يسمح بتحفيز الإلكترونات ضمن منطقة الضوء المرئي وقريب من الأشعة تحت الحمراء [28-31]. هذه الميزة مرغوبة للغاية من أجل التخفيف البيئي من الملوثات المختلفة حيث يمكن أن تكون تلك المواد نشطة ضوئيًا تحت ضوء الشمس، مما يضمن عائد تفاعل أفضل للمركبات ذات مخفضة [32]. ومع ذلك، يتم تصور فجوات نطاق أوسع أيضًا في تطبيقات أخرى، مثل الإلكترونيات الضوئية وجمع الطاقة [33]. لهذا السبب، فإن تقييم طاقة فجوة النطاق لأشباه الموصلات أمر حاسم لدراسة مثل هذه المواد، خاصة في مجال التحفيز الضوئي.
يمكن أن تقدم هذه الانتقالات البصرية تغييرات في متجه موجة الإلكترون أو لا. هنا، يجدر بالذكر أن الانتقالات المباشرة وغير المباشرة تتميز بفارق الزخم في منطقة بريلوان بين الحالة ذات الطاقة الدنيا في CB والحالة ذات الطاقة القصوى في VB [34,35]، كما هو موضح في الشكل 1. إذا حدثت تلك الحالات في متجهات k مختلفة، فإن المادة تمتلك فجوة نطاق غير مباشرة
الشكل 2. مخطط يمثل أطياف الامتصاص البصرية عند 0 كلفن لمادة بلورية ذات فجوات مباشرة (يسار) وغير مباشرة (يمين). يتم عرض الطاقة لبداية الانتقال المباشر باللون الأزرق وللانتقال غير المباشر، باللون البرتقالي. حقوق الطبع والنشر © 2005 جون وايلي وأولاده، Inc. مستخدم بإذن من المرجع [38].
فجوة النطاق والانتقال يُصنف على أنه “مساعد صوتي”، حيث يتم نقل معظم التغيير في زخم النظام من صوت [35]. من ناحية أخرى، إذا تم الحفاظ على زخم حاملات الشحنة، يتم نسب فجوة نطاق مباشرة إلى المركب وتشارك الفوتونات فقط في الانتقال [35]. وفقًا لقواعد الاختيار للانتقالات البصرية [36,37]، فإن الانتقالات مسموح بها (احتمالية أعلى) أو محظورة (احتمالية أقل)، مما يؤثر على القياسات لتحديد .
في سيناريو مثالي، عند درجة حرارة صفر مطلق (بدون أصوات متاحة)، يظهر امتصاص الضوء المرسوم مقابل طاقة الفوتون سلوكًا مختلفًا للبلورات ذات الفجوات المباشرة وغير المباشرة، كما هو موضح في الشكل 2. في البداية، في المواد ذات الفجوات المباشرة، تحدد حافة النطاق طاقة الفجوة حيث لا يوجد تغيير كبير في وبالتالي، [38]. ومع ذلك، في مواد فجوة النطاق غير المباشرة، تكون حواف النطاق لـ VB و CB متباعدة على نطاق واسع في الفضاء. لهذا السبب، يجب أن يتم إصدار صوت بطاقة ومتجه موجة لكي يحدث الانتقال. ونتيجة لذلك، يكون الامتصاص البصري أضعف بالقرب من حافة النطاق [38]. في مثل هذه الأنظمة، تكون الطاقة اللازمة لحدوث العملية غير المباشرة أكبر من فجوة النطاق الحقيقية – حيث يجب استخدامها جزئيًا لإصدار صوت – وعتبة الامتصاص للانتقال غير المباشر بين VB و CB تكون عند (الشكل 2) [38]. أخيرًا، عند درجات حرارة أعلى، إذا تم امتصاص صوت مع فوتون، يحدث الانتقال عند [38].
في كل من فجوات النطاق المباشرة وغير المباشرة، من المتوقع أن يكون معامل الامتصاص صفرًا لقيم الطاقة الأصغر من فجوة النطاق للمادة، كما هو موضح في المعادلة (1). بالنسبة لفجوات النطاق المباشرة وغير المباشرة، هناك اختلافات كبيرة في العلاقة بين و ، كما هو موضح في المعادلتين (2) و (3)، على التوالي،
حيث يمثل طاقة صوت. بسبب هذه العلاقات، يمكن تحديد فجوات النطاق من خلال قياس معامل الامتصاص. إذا كانت الفجوة مباشرة، يمكن تقييم من خلال استقراء الملاءمة الخطية لأقل المربعات لـ في مخطط ” مقابل ” الذي يتقاطع مع -محور [34]. بالمثل، إذا كانت فجوة النطاق غير مباشرة، يمكن الحصول عليها من خلال استقراء ملاءمة المربعات الصغرى الخطية لـ إلى الصفر، في ” مقابل hy” رسم بياني [34]. ومع ذلك، فإن هذا النهج شبه الكلاسيكي يقدم بعض الإخفاقات عند درجات الحرارة المنخفضة (حيث لا يتم أخذ أي جذب كولوم في الاعتبار)، في المواد التي تحتوي على عيوب وشوائب (بسبب الامتصاص الخارجي)، وللطاقات [34]. أيضًا، يجب أخذ بعض التأثيرات الأخرى
مثل درجة الحرارة المحلية [39]، والحقول الكهربائية أو المغناطيسية الخارجية القوية [40،41]، وتأثيرات التخصيب-السبائك في الاعتبار لأنها يمكن أن تؤثر على الملفات الشخصية [34].
عندما يكون هناك اضطراب هيكلي-إلكتروني (مثل أشباه الموصلات غير المتبلورة، على سبيل المثال)، فإن تحديد فجوة النطاق من الامتصاص البصري يتطلب منهجية أخرى، خاصة بسبب وجود حالات ذيل بالقرب من VB وCB [34]. تم اقتراح هذا النهج لأول مرة من قبل تاوك [42] من خلال فرض بعض القيود على عمليات الامتصاص البصري، مثل اعتبار غياب الحفاظ على متجه k، عنصر مصفوفة انتقال الزخم الثابت، وكثافة حالات الإلكترون القريبة من VB وCB التي تتناسب مع الجذر التربيعي لطاقة الفوتون. خلال الدراسة، قام تاوك [42] بتقييم الخصائص البصرية والهياكل الإلكترونية للجرمانيوم غير المتبلور، وأظهر أن هناك مناطق حيث تعتمد خطيًا على طاقة الفوتون ( )، حيث هو ثابت بلانك المخفض ( هو تردد الفوتون الزاوي (rad.s )، و هو الجزء التخيلي من السماحية النسبية. يتم تعريفه وفقًا للمعادلة (4)،
حيث هو معامل الانكسار و هو معامل الانقراض. في هذا السياق، تحقق تاوك وآخرون [42] من وجود نطاق امتصاص ممثل بخط مستقيم حيث . لقد أظهروا أن فجوة النطاق للمادة يمكن الحصول عليها من خلال التقاطع بين استقراء هذا الخط ومحور طاقة الفوتون. كما تحقق المؤلفون من أنه في هذه الحالة يتم الحفاظ فقط على الطاقة (الإلكترون والفوتون) ولكن ليس الزخم (متجه k)، مما يدل على انتقال غير مباشر [42].
تمت دراسة الخصائص البصرية والإلكترونية لأشباه الموصلات غير المتبلورة بشكل أكبر من قبل ديفيس وموت في أنظمة أكثر عمومية [43]. اقترحوا علاقة قدمت أفضل ملاءمة لحافة الامتصاص البصري من خلال اعتبار الموصلية عند تردد زاوي معين ، وفقًا للمعادلة (5). ثم، من رسم مقابل طاقة الفوتون ، حيث هو معامل الامتصاص ، تم الحصول على منطقة خطية واستقراءها إلى محور الإحداثيات لتقييم قيمة .
تم إنشاء علاقة أخرى بين الامتصاص المقاس والطاقة، مما يظهر أن قوة الامتصاص البصري تعتمد على الفرق بين طاقة الفوتون وطاقة فجوة النطاق كما هو موضح في المعادلة (6) [44]. في هذه الحالة، هو ثابت بلانك (4.1357 هو تردد الفوتون (Hz)، هو ميل رسم تاوك في المنطقة الخطية، و تعتمد على انتقال الإلكترون الذي يظهره المادة (الشكل 1) – على سبيل المثال، انتقال غير مباشر مسموح (
الجدول 1
طرق متاحة للحصول على معامل الامتصاص ( ) باستخدام بيانات UV-vis. هو سمك العينة، هو النفاذية، هو الانعكاسية، هو الانعكاسية المنتشرة لمادة غير ماصة، و هما معامل امتصاص وكسر كابلكا-مونك، على التوالي.
طريقة صيغة اعتبارات
بوجر-لامبرت-بير [52-54] لا تأخذ في الاعتبار الانعكاسية
بانكوف [55] يعتبر أن المنتج كبير
بانكوف-فاهالوفا [55، يشمل الانعكاسات الداخلية للقيم الصغيرة من
56]
كابلكا-مونك [57] يعتبر نموذج إشعاع ذو تدفقين
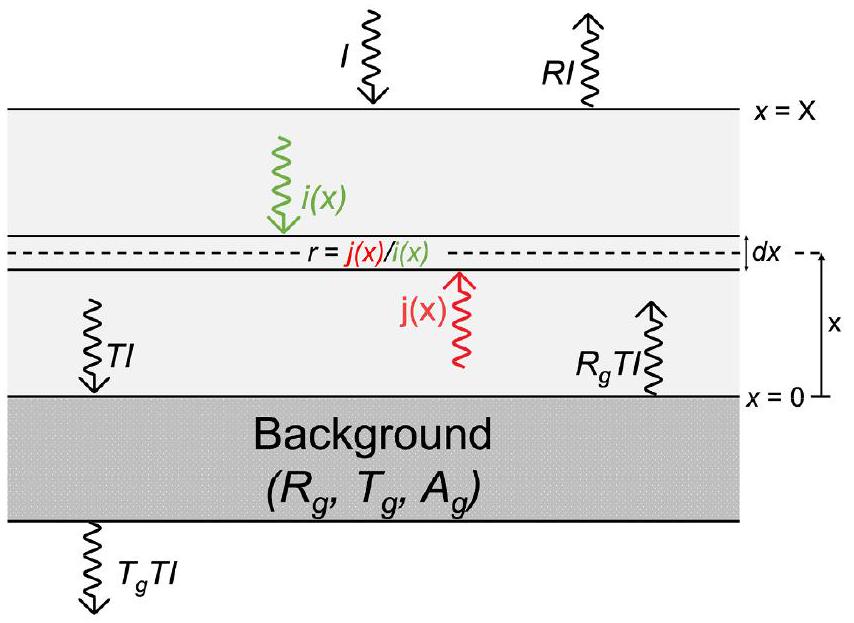
)، انتقال مباشر مسموح ( )، انتقال غير مباشر محظور ، وانتقال مباشر محظور .
على الرغم من أن طريقة تاوك تم تطويرها في الأصل لتقييم الامتصاص في أشباه الموصلات غير المتبلورة، إلا أنها تُستخدم على نطاق واسع لتقييم فجوة النطاق للأفلام الرقيقة البلورية [44] والآن، تُستخدم عادةً لأنواع أخرى من المواد البلورية أيضًا – مثل المسحوق وزنك أوكسيد [45-47]. أكد دولغونوس وماسون وبوبلماير [48] أن رسم تاوك قابل للتطبيق فقط على المواد التي يمكن افتراض أن لديها توطين لحالات الطاقة (وهو الحال بالنسبة للمواد غير المتبلورة والجسيمات النانوية)، مما يشير إلى أن الطريقة غير مناسبة للتعامل مع أشباه الموصلات البلورية و/أو المخصبة بشكل كبير. ومع ذلك، أظهرت دراسة حديثة أن خطية رسم تاوك الذي تم الحصول عليه للجسيمات النانوية ليست ذات أهمية كبيرة عند مقارنتها بتلك الخاصة بالمواد الضخمة [45]. تم عزو هذه الميزة الأخيرة إلى التمييز والانزياح الأزرق لطيف الطاقة من الحالات الإلكترونية، ولكن أيضًا إلى استرخاء قاعدة اختيار الزخم التي لا يمكن اعتبارها للبلورات ذات الحجم الصغير بشكل ملحوظ [45].
الإجراء المعتاد لتحليل تاوك يتكون من الحصول على بيانات الامتصاص البصري ورسم مقابل ، بينما يتم اختبار قيم – ( أو ) حتى يتم الحصول على أفضل ملاءمة لحافة الامتصاص، مما يسمح بتعيين النوع الصحيح من الانتقال البصري للمادة [44]. هذه التحليل ليس دائمًا واضحًا. غالبًا ما يكون التعيين صعبًا للمواد ذات الأشرطة المسطحة، وأحيانًا حتى للمواد ذات الأشرطة المتناثرة [49]. بالإضافة إلى ذلك، تقدم بعض المركبات امتصاصًا قبل الحافة في أطياف UV-vis الخاصة بها، مما يمكن أن يؤثر على التفسير ودقة تقدير فجوة النطاق [50]. أيضًا، أبرز كولتر وبيرني [44] أن المواد التي تظهر فجوات نطاق غير مباشرة قد تقدم أيضًا انتقالات مباشرة عند طاقات أعلى، مما يبرر الحصول على كلا القيمتين (لـ و ). هذا يعني أن كل من الانتقالات المباشرة وغير المباشرة يمكن أن تحدث في جميع مواد أشباه الموصلات إذا كانت الظروف الطاقية مواتية [47].
نظرًا لجميع الحالات المذكورة سابقًا التي أدت إلى انحرافات عن نظرية تاوك، تم اقتراح منهجيات أخرى لتقييم طاقات فجوة النطاق من بيانات UV-vis. على سبيل المثال، اعتمد كودي وآخرون [51] منهجية تفترض عنصر مصفوفة انتقال ثنائي القطب ثابت، حيث يتم الحصول عليه من استقراء ملاءمة المربعات الصغرى الخطية لـ إلى الصفر في رسم ” مقابل ” (عادةً، ). تم اقتراح نهج آخر من قبل زاناتا [34]، الذي أبلغ عن طريقة للحصول على من خلال ملاءمة دالة سيغمويد (بولتزمان) لأطياف الامتصاص البصري لأشباه الموصلات البلورية (عينات على شكل لوح ومسحوق) وغير المتبلورة ومركبات GaAs. في تلك الدراسة، تم الاستنتاج أنه، بغض النظر عن الطريقة، فإن معامل الامتصاص ( ) أو الامتصاص هو أحد أهم
الشكل 3. مخطط نموذج كابلكا-مونك للانعكاسية والنفاذية لعينة ضوء متشتت ذات سمك نهائي (سمك ) موضوعة في اتصال مع ركيزة خلفية ذات انعكاسية معروفة ( )، نفاذية ( ) وامتصاص ( ). هو شدة الإشعاع الساقط، هو تدفق الضوء الذي يتدفق عبر السطح المضيء، هو تدفق الضوء المتدفق مرة أخرى إلى السطح المضيء، هو نسبة الضوء الساقط الذي ينفذ من خلال الركيزة، و هو الانعكاسية الكلية للنظام.
معلمات فيزيائية مهمة لتقييم فجوة النطاق. الجدول 1 يظهر بدقة أن قيم فجوة النطاق مستقلة عن النموذج.
يمكن أيضًا دمج تقنيات أخرى لتقييم فجوة النطاق لأشباه الموصلات [14]. على سبيل المثال، يمكن الحصول على VBM من خلال دمج مطيافية الإلكترونات الضوئية بالأشعة السينية (XPS)، ومطيافية الإلكترونات الضوئية فوق البنفسجية (UPS)، ومطيافية الإلكترونات الضوئية في الهواء (PESA)؛ بينما يمكن تقييم CBM من خلال مطيافية الإلكترونات الضوئية العكسية (IPES) [23،58-61].
نظرية كابلكا-مونك هي الطريقة الأكثر تطبيقًا للحصول على أطياف “الامتصاص” من بيانات الانعكاسية المنتشرة [57]. يعتمد النموذج على حقل إشعاعي داخل عينة متشتتة للضوء، حيث يتقاطع تدفقان عبر قسم عشوائي ( ) في اتجاهين متعاكسين (الشكل 3) [62]. في الواقع، تم الحصول على دالة K-M المعروفة – – من خلال تطبيق بعض الشروط الحدودية على هذا النظام (مثل اعتبار العينات بسماكة لا نهائية)، مما أدى إلى المعادلة (7) [63].
تحويل كوبيلكا-مونك يُستخدم بانتظام في قياسات الطيفية للحالة الصلبة حيث أن العينات غالبًا ما تكون غير شفافة ويمكن اعتبارها كطلاء سميك بلا حدود [47،64]. ومع ذلك، بالنسبة لطيف الانعكاس المنتشر UV-vis، يتم قياس العينات بانتظام في حالتها الجزيئية الطبيعية. وبالتالي، تصبح هذه الفرضية السابقة غير صحيحة وتلاحظ انحرافات أكبر عن الخطية [65]. في الواقع، تظهر نظرية K-M انحرافات عالية عن البيانات التجريبية عندما تكون قيم الانعكاس أقل من 0.13) [66]. على سبيل المثال، أظهر لاندي وآخرون [67] أن سمكًا يبلغ حوالي 0.5 مم ليس كافيًا لتطبيق دالة K-M في بيانات الانعكاس المنتشر UV-vis المكتسبة لـ الجسيمات النانوية. ومع ذلك، على الرغم من أن نظرية كوبيلكا-مونك تُعتبر دالة امتصاص زائفة [34]، إلا أنها مقبولة على نطاق واسع اليوم لتقييم طاقات فجوة النطاق لمعظم المواد شبه الموصلة من خلال قياسات الانعكاس المنتشر UV-vis [47]. من ناحية أخرى، في عدة حالات، يستخدم الباحثون دالة كمعالجة تجريبية للبيانات من أجل تطبيعها [65].

1.3. تقييم طاقة فجوة النطاق في مواد MOF

تُعتبر MOFs فئة جديدة نسبيًا من المواد، تتكون من تجمعات غير عضوية متصلة ببعضها البعض بواسطة روابط عضوية، مما يشكل هيكلًا بلوريًا هجينًا ذو مسامية عالية ومساحات سطحية محددة عالية (SSAs) [68]. واحدة من أكثر الميزات إثارة للاهتمام في MOFs هي إمكانية تعديلها كيميائيًا، إما عن طريق تزيين مسامها بالجسيمات النانوية، أو عن طريق تفعيل روابطها بمجموعات عضوية مختلفة، أو عن طريق استبدال مواقع المعادن، أو حتى عن طريق إنشاء عيوب في هياكلها [68]. هذه الخصائص، مقترنة بالاحتمالات الهائلة لدمج روابط عضوية مختلفة ومواقع معدنية، تسمح بتشكيل عدة هياكل مع معقدات نقل الشحنة المتميزة (CTC) عند إثارة UV-vis – مع الأخذ في الاعتبار التجمع غير العضوي، والرابط العضوي، وأنواع الضيوف الأخرى. على سبيل المثال، الانتقال القائم على الرابط (LBT) [69،70]، الانتقال القائم على المعدن (MBT) [71]، نقل الشحنة من رابط إلى رابط (LLCT) [72]، نقل الشحنة من معدن إلى معدن (MMCT) [73]، نقل الشحنة من معدن إلى رابط (MLCT) [74]، ونقل الشحنة من رابط إلى معدن (LMCT) [69] هي بعض من هذه CTC التي تم ملاحظتها بالفعل في أنظمة MOF مختلفة.
عند التعامل مع هذه المواد الهجينة في التحفيز الضوئي، غالبًا ما يتم خلط المفاهيم بين فيزياء أشباه الموصلات والتحفيز الضوئي المتجانس [14]. أشار كولوبوف، غوستين، وغاسكون [14] إلى مدى غرابة خلط مفاهيم كيمياء التنسيق (مثل LMCT) مع أخرى من فيزياء أشباه الموصلات (مثل نطاق التوصيل) كما يحدث في أدبيات MOFs. ومع ذلك، يحدث هذا بسبب الطابع المزدوج لهذه المواد الهجينة. على سبيل المثال، يمكن تعديل محاذاة النطاقات الإلكترونية في MOFs (فيزياء أشباه الموصلات) عن طريق تفعيل روابطها (كيمياء التنسيق)، بشكل مشابه لما يحدث في المحلول [75]. تكمن قرب MOFs من حالة المحلول بشكل خاص في حقيقة أن هذه المواد تحتوي على حجم كبير من المسام التي تُملأ، بشكل روتيني، بجزيئات المذيب [14]. ومع ذلك، في بعض الحالات، يمكن أن تتصرف أيضًا مثل أشباه الموصلات غير الجزيئية في الخلايا الشمسية، خاصة عند النظر في أقصى انحناء لها (VBM وCBM) وأيضًا توصيلها، على الرغم من أن هذه الميزة الأخيرة ليست مستكشفة كثيرًا في مجال تحفيز MOFs الضوئي [14]. لهذه الأسباب، تم تعديل بعض المفاهيم للتعامل مع مثل هذه الأنظمة، ومن الجدير بالذكر استخدام HOCO (أعلى مدار بلوري مشغول) وLUCO (أدنى مدار بلوري غير مشغول) بدلاً من التسميات المعروفة المستخدمة للجزيئات (HOMO – أعلى مدار جزيئي مشغول وLUMO – أدنى مدار جزيئي غير مشغول) [69].
نظرًا لثراء التوبولوجيات والهياكل الإلكترونية في MOFs، فإنها مركبات متكيفة بشكل خاص لدراسة الإجراءات لتحديد فجوات النطاق. تم تخليق عدة MOFs خلال هذا العمل – UiO-66(Zr)، UiO-66(Hf)، UiO-66(Zr/Ti)، UiO-66(Hf/Ti)، UiO-67 (Zr)_NH2، UiO-67(Hf)_NH2، UiO-67(Zr/Hf)_NH2، MIL-125(Ti)، وMIL125(Ti)_NH2 – وتم توصيفها بواسطة XRD وقياسات الانعكاس المنتشر UV-vis. تم إجراء توصيفات هيكلية أخرى في أعمال سابقة، ومن الجدير بالذكر إيزوثيرمات الامتصاص، رامان، FTIR، وEPR [70،76،77]. تم تقييم طاقات فجوة النطاق بواسطة طرق مختلفة وتم مقارنة النتائج التي تم الحصول عليها مع تقارير أخرى موجودة في الأدبيات.

2. المواد والطرق

التخليق: تم وصف إجراءات التخليق لجميع MOFs المقدمة هنا في ملف المعلومات الداعمة.
حيود الأشعة السينية: تم إجراء تجارب حيود الأشعة السينية (PXRD) باستخدام جهاز حيود SmartLab Rigaku مزود بمولد أشعة سينية أنود دوار بقوة 9 كيلو وات ( )، مزود بكاشف بكسل هجين متعدد الأبعاد HyPix-3000، باستخدام أنابيب في هندسة نقل متوازٍ. تم إجراء مسح في النطاق ، مع حجم خطوة قدره ، وسرعة قدرها . تم إجراء تجارب حيود الأشعة السينية أحادية البلورة باستخدام جهاز حيود Bruker Kappa Apex Duo مزود بكاميرا CCD ثنائية الأبعاد 4 K
الجدول 2
الخصائص التركيبية والفيزيائية الكيميائية للمركبات التي تم تخليقها في هذا العمل والتي تعرض النسبة الذرية، حجم البلورات، ، وحجم المسام الدقيقة.
MOF محتوى المعدن ICP-OES حجم البلورة SSA ( ) حجم المسام الدقيقة ( )
UiO-66(Zr) 0.10 0.25 33 0.60(3)
UiO-66(Hf) 0.18 3.33 0.41(3)
UiO-66(Zr/Ti) 0.10 – 0.47(5)
0.25 28
UiO-66(Hf/Ti) 0.20 – 0.30(9)
0.34
UiO-67(Zr)_NH2 32-51 36 0.68(4)
UiO-67(Zr/Hf) 105-140 0.65(7)
34
UiO-67(Hf)_NH2 24-44 0.48(4)
MIL-125(Ti) 0.76 – 0.60(4)
1.32 34
MIL-125(Ti) 3.2-5.3 0.51(4)
_NH2 26
كاشف وموارد 2 م (مو وكوب).
التحليل الطيفي للانبعاث الضوئي – البلازما المقترنة: تم إجراء تجارب التحليل الطيفي للانبعاث الضوئي – البلازما المقترنة (ICP-OES) باستخدام جهاز طيفي Agilent 5110 ICP-OES في وضع الرؤية الشعاعية. تم إجراء تحلل العينات باستخدام 100 ملغ من مركبات UiO-66 المنشطة. أولاً، تم هضم العينات المسحوقة باستخدام محلول يحتوي على 10 مل من HF و5 مل من ثم تم تسخينها إلى لمدة 48 ساعة، تليها خطوة تبخر جاف. بعد ذلك، تم حفرها باستخدام ماء الملك ( لمدة 24 ساعة وجففت إلى بقايا قدرها 0.5 مل. أخيرًا، أضيف 9.5 مل من الماء، وبعد الترشيح، تم تخفيف المحلول إلى قبل أن يتم تحليله.
قياس المساحة السطحية: تم إجراء امتصاص عند درجة حرارة النيتروجين السائل (77 كلفن) باستخدام جهاز Micromeritics ASAP2020. تم إزالة الغازات من عينات UiO-66، UiO-67_NH2، MIL-125، وMIL-125_NH2 مسبقًا تحت فراغ عند ، و ، على التوالي. تم تقييم المساحة السطحية المحددة وتوزيع حجم المسام للعينات المفحوصة بواسطة نموذج BET متعدد النقاط (برونور-إيميت-تيلر) في النطاق .
المجهر الإلكتروني الماسح: تم إجراء SEM على مجهر FEG (Hitachi SU 5000) عند جهد تسريع قدره 5 كيلو فولت، باستخدام عينات تم تغليفها مسبقًا بالكربون.
التحليل الطيفي بالأشعة تحت الحمراء: تم إجراء FTIR على جهاز طيفي Perkin Elmer Spectrum 2 باستخدام ملحق الانعكاس الكلي المخفف (ATR) وبلورة ماسية كعنصر عاكس. تم أخذ الأطياف بدقة قدرها و128 مسحًا.
التحليل الطيفي بالرنين المغناطيسي النووي: تم إجراء التحليل الطيفي السائل NMR في جهاز Bruker AVANCE III HD 300 MHz عبر جهاز عينة Xpress الأوتوماتيكي ذو 60 موضع. تم الإشارة إلى التحولات الكيميائية بواسطة الرنين الخارجي للتيتراميثيلسيلان. تم إجراء هضم العينة باستخدام 10 ملغ من مركبات UiO-66. تم نقع المادة في 1 مل من محلول وتمت الموجات فوق الصوتية لمدة 15 دقيقة. ثم، تم استرداد 0.6 مل من السائل عن طريق الترشيح ووضعه في أنبوب NMR بحجم 5 مم قبل أن يتم تحليله عند 8 مسحات.
التحليل الطيفي للانعكاس المنتشر UV-vis: تم إجراء تجارب UV-vis على جهاز طيفي Varian Cary 5000 باستخدام ملحق الانعكاس المنتشر Praying Mantis المعدل لتوصيف عينات المسحوق. تم تسجيل الأطياف في النطاق نطاق الطيف مع دقة 1 نانومتر. تم رسم طيف الانعكاس المنتشر بالإضافة إلى ودالة كوبيلكا-مونك.
تقييم فجوة النطاق: تم تقييم طاقات فجوة النطاق أولاً بواسطة طيفية الانعكاس المنتشر للأشعة فوق البنفسجية والمرئية. تم تقديره بواسطة مختلف
طرق، ومن الجدير بالذكر استقراء منحنى الانعكاس المنتشر R [34]، واستقراء منحنى K-M ، استقراء الـ منحنى، فجوة النطاق لكودي [51] [ ضد ]، فجوة النطاق غير المباشرة [ ضد الفجوة النطاقية المباشرة ضد ] [34]، فجوة النطاق غير المباشرة لتوك [ ضد ] [42]، النسخة المباشرة من فجوة النطاق لتوك [ ضد ] [35] ، ودالة سيغمويد-بولتزمان [34]. الـ تم أيضًا تحديد القيم باستخدام تحويل كرامرز-كرونيغ من بيانات الأشعة فوق البنفسجية والمرئية الخام.

3. النتائج والمناقشة

3.1. توصيف المواد النقية

لتسهيل مناقشة هذه الورقة، يتم عرض الخصائص الرئيسية للمواد التي تم الحصول عليها هنا في الجدول 2. تم تمييز جودة MOFs المُركبة من خلال أنماط PXRD الخاصة بها (الشكل S2)، والمعلمات البلورية (الجداول S2-S4)، و ICP-OES (الجدول 2)، الامتصاص (الشكل S3)، صور SEM (الشكل S4)، طيف FTIR (الشكل S5)، والسائل الرنين المغناطيسي النووي (الشكل S6). كانت هذه التوصيفات متوافقة مع أعمال أخرى من الأدبيات، مما يظهر أن المركبات تم تخليقها بنجاح. عرضت معظم المركبات منحنيات إيزوثرمية من النوع الأول وفقًا لتصنيف IUPAC، وهو ما يميز المواد المسامية الدقيقة. أظهرت مزيجًا من الأنماط الأولى والرابعة، مما يدل على وجود المسامية المتوسطة داخل المركب. يمكن ربط هذا التأثير بتجمع الجسيمات النانوية وتكوين العيوب. جميع قيم SSA تتماشى مع التقارير السابقة من الأدبيات [78-82]: UiO-66(Hf) UiO-67(Hf)_NH2 ، MIL-125(Ti) = ، و MIL-125(Ti)_NH2 تظهر صور SEM لمواد UiO-66 وUiO-67 شكل بلوري لكتل نموذجية بأشكال ثمانية الأوجه التي تميز هذه المركبات [79،83]. عرض MIL-125(Ti) بلورات تشبه الشكل الهرمي المربع المقطوع.تشكل NH2 أشكال صفائح رباعية السطوح، وهي أيضًا سمة مميزة لهذه المواد [80،84]. كانت مطيافية FTIR قادرة على تحديد أوضاع اهتزازية مختلفة للتسعة مركبات. يمكن تقسيم طيفها إلى ثلاث مناطق: من 400 إلى ، حيث ترتبط نطاقات الامتصاص في الغالب باهتزازات الكتل غير العضوية؛ من 700 إلى ، حيث يتم ملاحظة التفاعل بين الرابط العضوي والعقدة غير العضوية؛ ومن 900 إلى ، حيث تكون الاهتزازات العضوية للرابط فقط نشطة. نظرًا لأن مواد UiO-66 تتميز بوجود عيوب هيكلية قد تؤثر على ميزات امتصاص الأشعة فوق البنفسجية والمرئية، تم تقييم محتوى رابط BDC المفقود باستخدام السائل طيف الرنين المغناطيسي النووي (الشكل S6). في الواقع، يمكن للفورمات (الذي يأتي من إزالة البروتون من حمض الفورميك المستخدم كمنظم في عملية التخليق وأيضًا من تحلل DMF) أن يحل جزئيًا محل رابط BDC من خلال توليد عيوب في الروابط العضوية ثنائية الموضع. عندما يتم إزالة رابط ثنائي الكربوكسيلات من هيكل UiO-66، فإنه يترك موقع التنسيق مع مراكز معدنية متاحة لجزيئين من الفورمات أحادي الموضع بدلاً من ذلك. بالنظر إلى هذين النوعين من أوضاع التنسيق (أحادي الموضع مقابل ثنائي الموضع)، إذا تم تمثيل الصيغة الجزيئية لمركب UiO-66 النقي بـ [ ] ( غياب رابطات ثنائية الموضوع تخلق عيوب الكربوكسيلات. لذلك، بالنظر إلى وجود الفورمات يجب كتابة الصيغة الجزيئية التجريبية على أنها مع وضع ذلك في الاعتبار، تم مقارنة دمج إشارة الرنين المغناطيسي النووي المتعلقة بحمض الفورميك مع تلك الخاصة بالموصل BDC لأربعة مركبات UiO-66. ، ، و تم العثور على العينات لتظهر 9.5 و 7.0 و 11.2 و 11.2 % من الروابط المفقودة BDC، على التوالي (الشكل S6). تظهر هذه النتائج أن عدد العيوب في العينات يزداد في وجود التيتانيوم. تم إجراء تشخيصات مماثلة في عمل سابق باستخدام UiO-67. عينات، لم يُلاحظ أي ارتباط بين العيوب الهيكلية ومحتوى المعدن [76].
الشكل 4. (أ) الانعكاس المنتشر للأشعة فوق البنفسجية والمرئية، (ب) ، و (ج) بيانات كوبيلكا-مونك التي تم الحصول عليها لـ UiO-66(Zr) و UiO-66(Hf) و MIL-125(Ti) و MIL-125(Ti)_NH2. الـ و الـ تم تطبيع الطيف بين 0 و 100 لأغراض المقارنة.

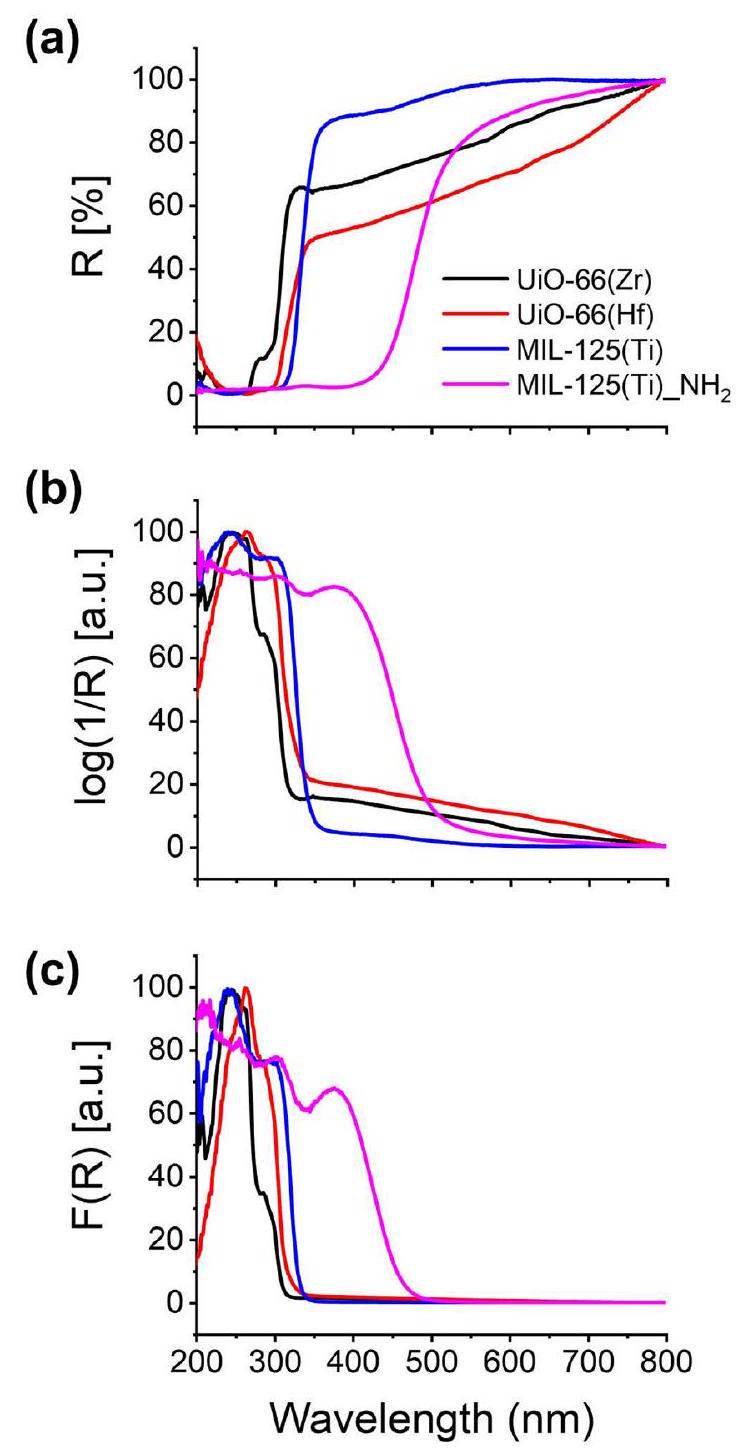
3.2. طيف الامتصاص الضوئي المرئي فوق البنفسجي بالانعكاس المنتشر

تُعرض طيف الانعكاس المنتشر للأشعة فوق البنفسجية والمرئية الذي تم الحصول عليه للمواد العضوية المعدنية النقية التي تم تصنيعها في هذا العمل في الأشكال 4 و S7، جنبًا إلى جنب مع وتمثيل كوبيلكا-مونك. تم تطبيع جميع الأطياف من 0 إلى 100 لأغراض المقارنة. الاختلافات عند تقييم أطياف الانعكاس المنتشر باستخدام نهج K-M و مرئية بوضوح (الأشكال 4 و S7). على سبيل المثال، فيما يتعلق بعائلة UiO-66، تظهر قيم K-M نطاق امتصاص أرق (بين 200 و 320 نانومتر) وانحدار أكبر بالقرب من ذيل الامتصاص مقارنةً بـ البيانات. ميزة مشابهة موجودة أيضًا في طيف UiO-67_ ، ومركبات MIL-125. يمكن أن يكون هذا الاختلاف البسيط، بمفرده، مصدرًا لتقييم خاطئ لفجوات الطاقة للمواد، حيث إن استقراء هذه المنحنيات إلى الصفر ( ، و ضد يقطع محور السينات في أماكن مختلفة القيم. علاوة على ذلك، يبدو أن طريقة K-M أدت إلى طيف أكثر اتساقًا عند النظر في حواف نطاق الامتصاص الخاصة بها، والتي تم تحديدها بشكل أفضل من تلك التي تم الحصول عليها باستخدام البيانات. ومع ذلك، لأنه من غير الممكن الحصول على بيانات الامتصاص والنقل للأشعة فوق البنفسجية والمرئية للعينات المسحوقة دون معالجة مسبقة،
الشكل 5. توضيح كيفية تقييم قيمة فجوة الطاقة باستخدام استقراء المنحنى المستخلص من نطاق الامتصاص المسجل لـ UiO-67(Zr) _ . (أ) فجوة غير مباشرة مع تصحيح الأساس؛ (ب) فجوة مباشرة بدون تصحيح الأساس.
الـ K-M و تعتبر الأساليب أفضل التقريبات الممكنة لـ في هذا العمل.

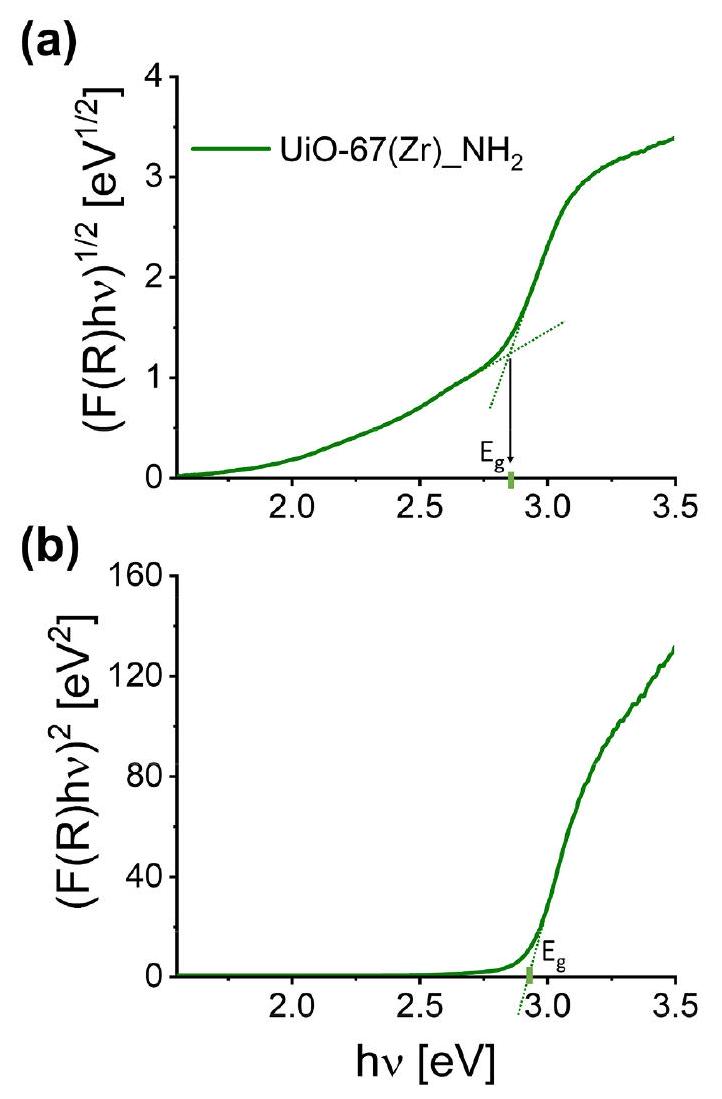
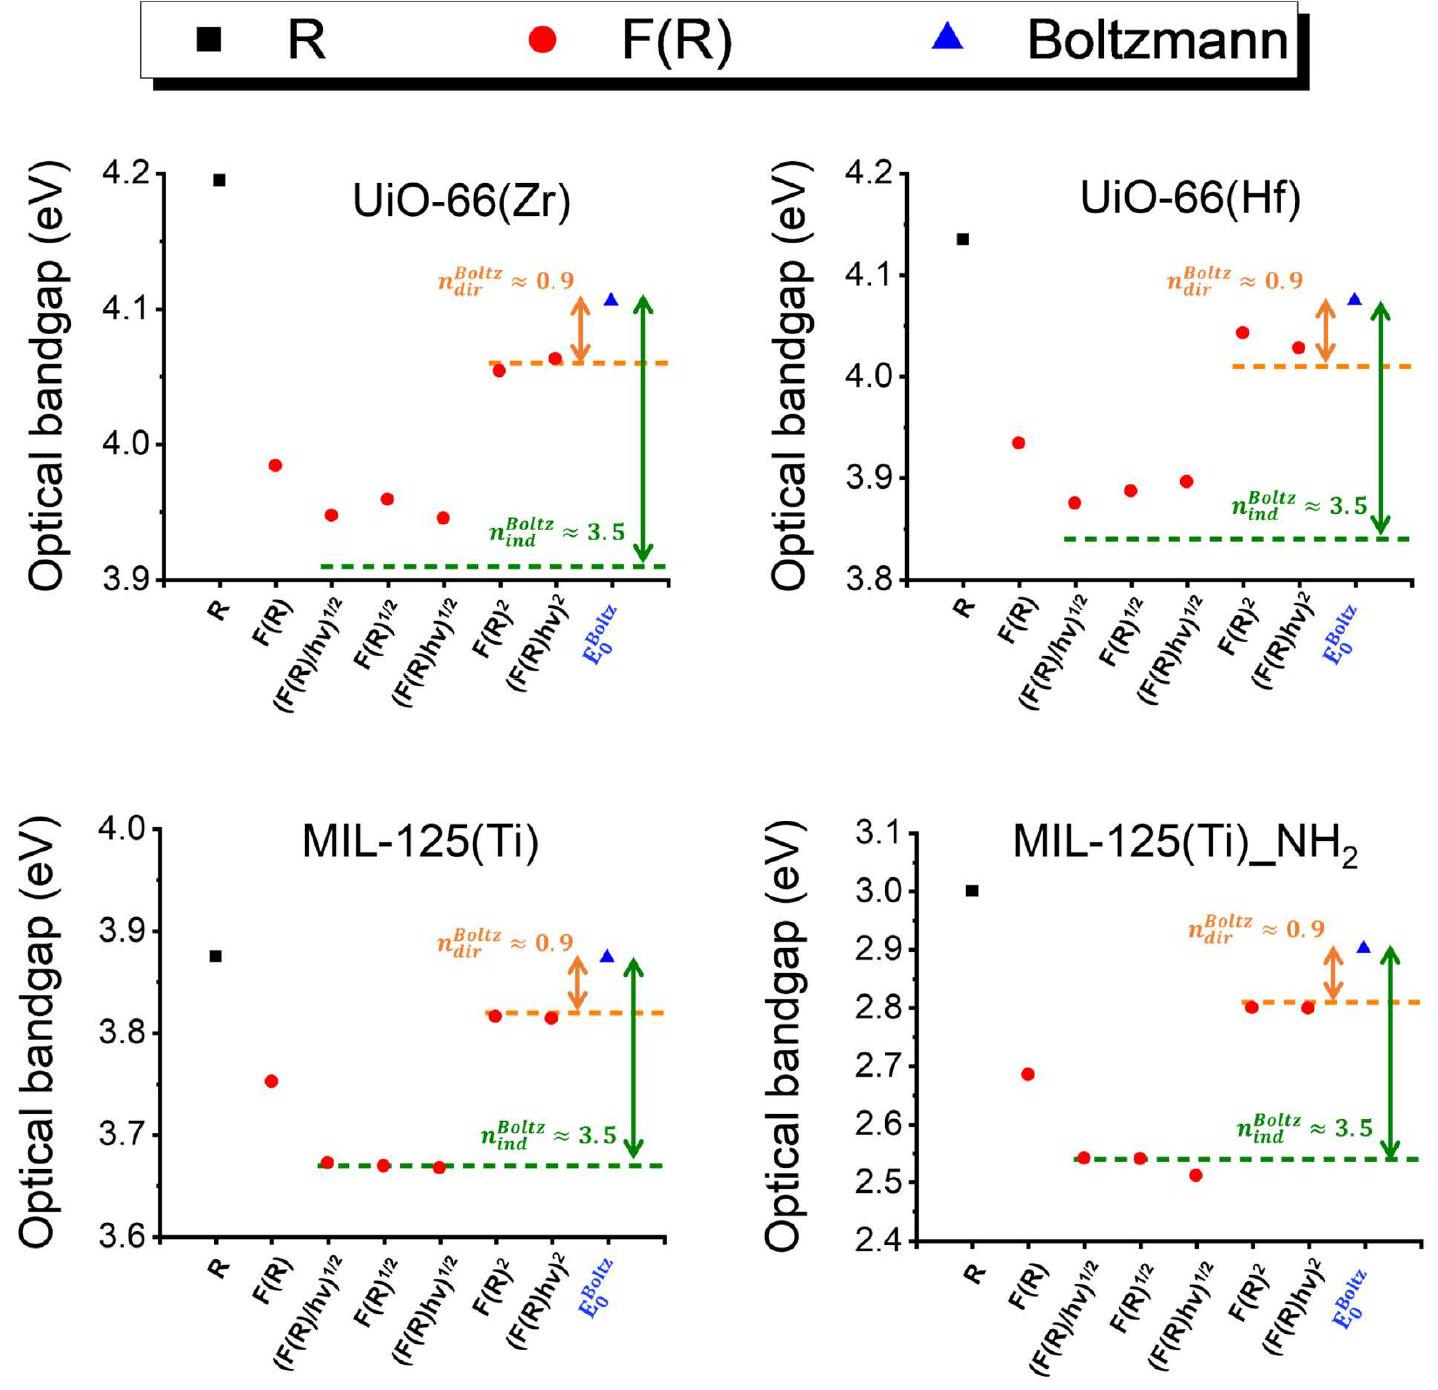
3.3. تقييم فجوة الطاقة: طرق كودي، تاوك، والمباشرة/غير المباشرة

عند تقييم طيف الأشعة فوق البنفسجية والمرئية لمختلف أشباه الموصلات، من الشائع أن نواجه مواد تظهر طاقة تحت فجوة النطاق، خاصة في حالة المواد المعيبة أو المشوبة أو المعدلة على السطح أو الكتلة. هذه التعديلات تخلق حالات داخل فجوة النطاق تنعكس في طيف الامتصاص الخاص بها من خلال تشكيل ذيل شبيه بأورباخ، مما يؤثر على تقييم فجوة النطاق بطرق مختلفة [50]. في هذه الحالات، تحتاج المنحنيات إلى تصحيح خط الأساس قبل تقييمها عند نقطة تقاطع المحور، كما ناقشها ماكولا، باشيا، وماسيك [50]. تم التوصل إلى هذا الاستنتاج من خلال دراسة صبغة معدلة أشباه الموصلات، حيث تم قياس النظام عن طريق وضع خليط من كبريتات الباريوم المطحونة بشكل منفصل مع التيتانيوم والبرتقالي الميثيلي [50]. في الخطوة الأولى، تم وضع هذه الخلائط جنبًا إلى جنب في الحامل، ثم في الخطوة الثانية، تم خلطها وتقييمها في نظام يمكن أن تتفاعل فيه كلا المكونين [50]. في هذه الحالة الأخيرة، تحقق المؤلفون من أن الطيف الناتج ليس مجرد مجموع بسيط للطيف الفردي، بل هو تركيبة خطية من كلاهما [50]. يمكن تعميم هذه النتيجة على المواد الهجينة حيث يمكن أن تؤدي مكوناتها المختلفة (في هذه الحالة الكتل غير العضوية والروابط العضوية) إلى طيف لا يمكن فصل مساهماته بالكامل. يمكن التعرف بسهولة على هذه الميزة في الأطياف حيث، في هذه الحالات، تظهر المنحنيات ارتفاعًا سلسًا من -المحور قبل الوصول إلى المنطقة الخطية. من ناحية أخرى، فإن تصحيح الخط الأساسي ليس ضروريًا إذا ظهرت المنطقة الخطية مباشرة بعد ارتفاع مفاجئ للمنحنى من محور الإحداثيات. وبالتالي، يجب إجراء معالجة مسبقة في الحالات التي يظهر فيها المركب حافة امتصاص مسبقة، كما هو موضح في الشكل 5. تم الحصول على مخططات تاوك
الشكل 6. تقييم طاقات فجوة النطاق باستخدام دالة كوبيلكا-مونك لمواد UiO-66(Zr) وUiO-66(Hf) وMIL-125(Ti) وMIL-125(Ti)_NH2. (أ) فجوة نطاق كودي؛ (ب) فجوة نطاق غير مباشرة؛ (ج) فجوة نطاق غير مباشرة تاوك؛ (د) فجوة نطاق مباشرة؛ (هـ) فجوة نطاق مباشرة تاوك.
الجدول 3
قيم فجوة النطاق (eV) التي تم تقييمها من خلال الرسم لـ ، و مقابل طاقة الفوتون .
طريقة UiO-66 UiO-67_NH2 MIL-125
زر Hf زركونيوم/تيتانيوم Hf/Ti زر زركونيوم/هفنيوم Hf H
ر ٤.٢٠ ٤.١٤ ٤.٠٩ 3.97 3.08 3.04 3.08 3.88 ٣.٠٠
ف(ر) 3.98 3.93 3.89 3.94 2.83 2.88 ٢.٩٠ 3.75 2.69
(F(R)/h 3.95 3.88 3.74 3.74 2.84 2.89 2.92 3.67 2.54
3.96 3.89 3.78 3.79 2.85 2.92 ٢.٩٠ 3.67 2.52
3.96 3.90 3.79 3.82 2.85 2.91 2.92 3.67 2.53
٤.٠٥ ٤.٠٤ ٤.٠٠ ٤.٠٤ 2.92 2.95 2.98 3.82 2.80
٤.٠٦ ٤.٠٣ ٤.٠٢ ٤.٠٥ 2.93 2.96 2.98 3.81 2.80
من UiO-67(Zr)_NH2، تظهر منطقة خطية عند النظر في كل من الفجوات النطاقية غير المباشرة (الشكل 5أ) والمباشرة (الشكل 5ب). ومع ذلك، لضمان ملاءمة أفضل لدالة تاوك، يجب ملاحظة أنه يلزم إجراء تصحيح للخط الأساسي قبل استقراء المنحنى في حالة الفجوة النطاقية غير المباشرة. للقيام بذلك، يتم رسم خط مماس للمنحنى في المنطقة التي تسبق المنطقة الخطية للرسم البياني غير المباشر. ثم يتم تقييم قيمة الفجوة النطاقية باستخدام موضع التقاطع بين هذا الخط المماس والخط القادم من المنطقة الخطية (الشكل 5أ). هذه التصحيح مطلوب أيضًا لفجوة كودي وللنوع المباشر وغير مباشر طرق.
لتحديد ما إذا كان المركب لديه فجوة نطاق مباشرة أو غير مباشرة في غياب الحسابات، يُوصى برسم كل من فجوات النطاق المباشرة وغير المباشرة كدالة لطاقة الفوتون [34]. يجب اعتبار الرسم الذي يظهر منطقة خطية واضحة كأفضل ملاءمة، وبالتالي يُفترض أنه النوع الصحيح لفجوة النطاق [34]. قد تُظهر اختلافات في طيف الامتصاص البصري ما إذا كان المادة تعرض فجوة مباشرة أو غير مباشرة. في الواقع، بالنسبة للفجوات المباشرة، هناك ارتفاع مفاجئ في الامتصاص (انظر أطياف مركبات UiO-66 في الأشكال 4 و S7)، بينما بالنسبة للفجوات غير المباشرة، هناك أولاً ارتفاع تدريجي صغير في نطاق التردد، يتبعه ارتفاع مفاجئ في الامتصاص (انظر أطياف MIL-125(Ti)_NH2 في الشكل 4) [85]. في هذه الحالة الأخيرة، فإن التردد الذي يبدأ عنده معامل الامتصاص في الارتفاع تدريجياً هو مقياس للفجوة غير المباشرة [85]. ومع ذلك، فإن هذا التحديد ليس بسيطًا كما يبدو. على سبيل المثال، تم تقييم الهيكل الإلكتروني لمركب UiO-66 بشكل عميق في أعمال مختلفة وتم الاستنتاج أن UiO-66(Zr) يظهر فجوة نطاق مباشرة [86،87]. تم تأكيد هذه الملاحظة بشكل أكبر من قبل ياسين وآخرين [88]، الذين وجدوا من خلال حسابات DFT والتجارب أن استبدال الزركونيوم بالهافنيوم في UiO-66 لا يغير نوع فجوة النطاق، التي تظل مباشرة بغض النظر عن المعدن. ومع ذلك، من الممكن العثور على العديد من الدراسات التي تعتبر مواد UiO-66 تقدم فجوة نطاق غير مباشرة [89، 90]. هذه التناقضات شائعة بشكل خاص في مجال MOFs، حيث أن معظم هذه المركبات تظهر مناطق خطية بغض النظر عن نوع الرسم (مباشر أو غير مباشر) الذي يتم اعتباره (الأشكال 6 و S8 و S9). تُظهر هذه الميزة ضرورة توحيد طريقة لتحديد ما إذا كانت المادة تحتوي على فجوة نطاق مباشرة أو غير مباشرة فقط من خلال البيانات التجريبية. بهدف معالجة هذه القضية، تم تقييم طاقات فجوة النطاق لمركبات MOFs التي تم تصنيعها هنا باستخدام أساليب مختلفة من خلال دالة كوبيلكا-مونك، كما هو موضح في الجدول 3 وفي الأشكال 6 و S8. في هذه الحالة، تم الوصول إلى فجوة النطاق من الخط المماس لحافة نطاق الامتصاص حتى يتقاطع مع محور الإحداثيات. القيمة. في حالة فجوة النطاق غير المباشرة لتوك، فجوة النطاق كودي، والفجوة غير المباشرة، تم اعتبار خط الأساس أولاً كما تم مناقشته سابقًا (الشكل 5أ). لاحظ أنه من الضروري أن -المحور يبدأ من الصفر.
من المعقول أن نفترض أن أول انتقال إلكتروني يُلاحظ في طيف الأشعة فوق البنفسجية والمرئية بدءًا من طاقات منخفضة إلى طاقات أعلى (بعبارة أخرى، من أطوال موجية أعلى إلى أطوال موجية أقل) يتوافق مع انتقال HOCO LUCO في المواد البلورية [69]. لهذا السبب، من الممكن استقراء خط المماس إلى حافة نطاق الامتصاص حتى يتقاطع مع محور السينات، ثم تحويل قيمة الطول الموجي إلى إلكترون فولت للعثور على قيمة المادة. يتم تسليط الضوء على هذه النتيجة في الجدول 3 كـ طريقة . تم تنفيذ هذا النهج في مكان آخر لـ MIL-100(Al)، وتم العثور على نوع فجوة الطاقة
أن تكون غير مباشر بسبب القرب بين و الـ القيم [7]. في أنظمة MOF، تعتبر هذه الطريقة أكثر دقة من الطرق الأخرى المقدمة سابقًا، حيث تعتمد فقط على البيانات التجريبية وليس على افتراضات جزئية (أي، أفضل خطية أو ارتفاع مختلف في بيانات الامتصاص UV-vis). من المثير للاهتمام، أن هذه القيم تقع بين الفجوات النطاقية غير المباشرة والمباشرة لجميع المركبات المدروسة هنا (أي، و ) [87].
عند النظر في فجوة الطاقة لعينات UiO-66، تنتهي جميع الطرق بإنتاج مخططات تحتوي على مناطق خطية بين 3.5 و 4.5 إلكترون فولت. القيم التي تم الحصول عليها باستخدام طريقة كودي، والطريقة غير المباشرة، وطريقة تاوك غير المباشرة تظهر حافة امتصاص مسبقة، وبالتالي، يجب تصحيحها بواسطة خط أساسي – وهو نفس الحال بالنسبة لـ UiO-67_NH. ومركبات MIL-125 (الأشكال 6 و S8 و S9). كما ذُكر سابقًا، تعتبر بعض الأعمال في الأدبيات أن UiO-66 يظهر فجوة نطاق مباشرة، بينما يفترض آخرون أنه يتصرف كموصل غير مباشر. في الواقع، قيمة فجوة النطاق المباشرة وفقًا لطريقة تاوك لـ يتطابق مع ما تم الحصول عليه من محاكاة DFT (4.07 eV) [87] وأيضًا من البيانات التجريبية من ناحية أخرى، فإن فجوة النطاق غير المباشرة لـ UiO-66(Zr) مشابهة أيضًا لتلك التي تم العثور عليها من خلال بيانات الأشعة فوق البنفسجية والمرئية التجريبية في أماكن أخرى [90]. لذلك، فإن الحصول على كل من القيم المباشرة وغير المباشرة مبرر في هذه الحالة [86،87،89،90].
تظهر أعمال أخرى أن وجود الهفنيوم و/أو التيتانيوم يقلل من فجوة الطاقة لمواد UiO-66 [70،89]. ومع ذلك، في وجود الهفنيوم أو التيتانيوم، فإن محاكاة DFT ليست دقيقة كما هو الحال بالنسبة للمادة القائمة على الزركونيوم. في الواقع، فإن طريقة تاوك المباشرة تم العثور على قيمة الفجوة الإلكترونية المستندة إلى هافنيوم UiO-66(Hf) باستخدام البيانات الحاسوبية (3.74 eV) [87] وهي أصغر من تلك التي تم الحصول عليها من طيف الانعكاس المنتشر للأشعة فوق البنفسجية والمرئية في هذا العمل (4.03 eV) وفي دراسات سابقة [70]. تُظهر هذه الميزة كيف يمكن أن تختلف حسابات الفجوة الإلكترونية النظرية بشكل كبير عن البيانات التجريبية في العديد من المركبات. على سبيل المثال، فإن القيمة المتوقعة للفجوة الإلكترونية لـ مبني على التيتانيوم تم العثور عليه ليكون 3.64 إلكترون فولت [87]، وهو أقل من الطاقات التي تم الحصول عليها في هذه الدراسة باستخدام طريقة تاوك: و . أعمال أخرى أيضًا أفادت بقيم تجريبية مماثلة لفجوة النطاق لـ المادة [90].
UiO-67 هو مركب آخر تم العثور عليه كموصل مباشر أو غير مباشر في دراسات مختلفة [91،92]. كما أنه مثال جيد على كيفية أن يوفر مخطط تاوك تقييمًا مختلفًا لفجوة الطاقة مقارنةً بطرق أخرى. على سبيل المثال، إذا لم يتم تطبيق تصحيح الخط الأساسي على بيانات مخطط تاوك غير المباشر، فإن فجوة الطاقة تكون حوالي 2.0 إلكترون فولت لـ UiO-67 [91]، وهو ما يختلف كثيرًا عن القيمة المتوقعة باستخدام المحاكاة الحاسوبية. ) [87,93] وأيضًا من التجريبي ( 3.68 eV ) [94]. قام وانغ وآخرون [95] بالوصول إلى الفجوات الطيفية التجريبية لسلسلة من UiO المعتمدة على الزركونيوم – 6، 7، أو 8) واستخدام مخطط تاوك وجد فجوة نطاق مباشرة قدرها 2.76 إلكترون فولت لـ ، وهو قريب من القيمة التي تم الحصول عليها هنا (الجدول 3). على عكس ما لوحظ بالنسبة لـ UiO-66 [70]، فإن وجود الهفنيوم ليس له تأثير كبير على قيم فجوة النطاق المحسوبة لعينات UiO-67_NH2 [76]، والتي يمكن أن تزيد حتى من 2.93 إلى 2.98 إلكترون فولت عند استبدال الزركونيوم بالهفنيوم (الجدول 3). يُعزى هذا السلوك المختلف إلى تغيير في حالات الإلكترونات في نطاق التكافؤ الناتج عن وجود المجموعة الأمينية [88]. في الواقع، فإن استبدال زركونيوم بأيونات هفنيوم
الشكل 7. طاقات فجوة النطاق البصرية المحسوبة باستخدام انحدار بولتزمان وفقًا للمعادلة (8) بواسطة بيانات كوبيلكا-مونك لـ (أ) UiO-66(Zr)، (ب) UiO66(Hf)، (ج) MIL-125(Ti)، و(د) MIL-125(Ti)_NH2. تمثل الخطوط السوداء البيانات والخطوط الحمراء هي انحدار بولتزمان.
يمكن أن يزيد من قيمة VBM من خلال إضافة حالات طاقة في نطاق التوصيل لـ UiO-66، والتي تتعلق بذرات الأكسجين [88]. ومع ذلك، لم يتم ملاحظة هذا التأثير في UiO-67. لأن مجموعة الأمين تخلق حالات في منتصف الفجوة التي تؤثر على طاقات فجوة النطاق، مما يقلل من تأثير المعدن على موضع VBM. وقد تم تسليط الضوء على هذه الميزة من قبل ياسين وآخرين [88] من خلال رسم PDOS للأوربيتال الجزيئي لـ UiO-66 و UiO-66_NH2 مع الأخذ في الاعتبار كل من المعادن الزركونيوم والهفنيوم.
أخيرًا، يمتلك MIL-125(Ti) فجوة نطاق تاوك غير المباشرة التي تقل من 3.67 إلى 2.53 إلكترون فولت بعد التعديل بالأمينو (الجدول 3). هذه النتيجة قابلة للمقارنة مع تلك التي تم الحصول عليها في أماكن أخرى [30] ويجب أن ترتبط بنفس الظاهرة كما في حالة تعديل UiO- عينات ( أو 7 ) مع المجموعات. هنا، من الواضح أن فجوات النطاق المباشرة وغير المباشرة لتوك متشابهة إلى حد كبير لكل من MIL-125 ( (تي) ) وإصدارها المفعّل بالأمينات . علاوة على ذلك، الـ القيمة المستمدة مباشرة من طيف UV-vis لكوبيلكا-مونك تقع بين هاتين القيمتين المباشرتين وغير المباشرتين: 3.75 و 2.69 إلكترون فولت لـ MIL-125(Ti) و MIL-125(Ti)_NH2، على التوالي. لهذا السبب، يجب الحصول على كلا القيمتين وذكرهما عند وصف الهيكل الإلكتروني لمثل هذه المواد، كما تم مناقشته سابقًا [44].
ال تم استخدام البيانات أيضًا للوصول إلى طاقات فجوة النطاق لمختلف MOFs وتظهر النتائج مناطق خطية حيث يمكن استخراج القيم بشكل صحيح (الشكل S9). ومع ذلك، يبدو أن النتائج التي تم الحصول عليها أقل دقة عند مقارنتها بتلك المبلغ عنها في الأدبيات لجميع عينات MOFs (الجدول S5) [30،87،89،90، 93-95]. يمكن أن يُعزى ذلك إلى أن معظم الأعمال التي تتعامل مع العينات المسحوقة تستخدم نموذج كوبيلكا-مونك للحصول على UV-vis.
الطيف الذي يتم تحليله بشكل إضافي للحصول على فجوة الطاقة للعينات. كما أنه من الواضح أن حواف نطاقات الامتصاص محددة بشكل أفضل باستخدام طريقة K-M من البيانات (الأشكال 4 و S7)، والتي يمكن أن تكون مصدرًا آخر للخطأ.

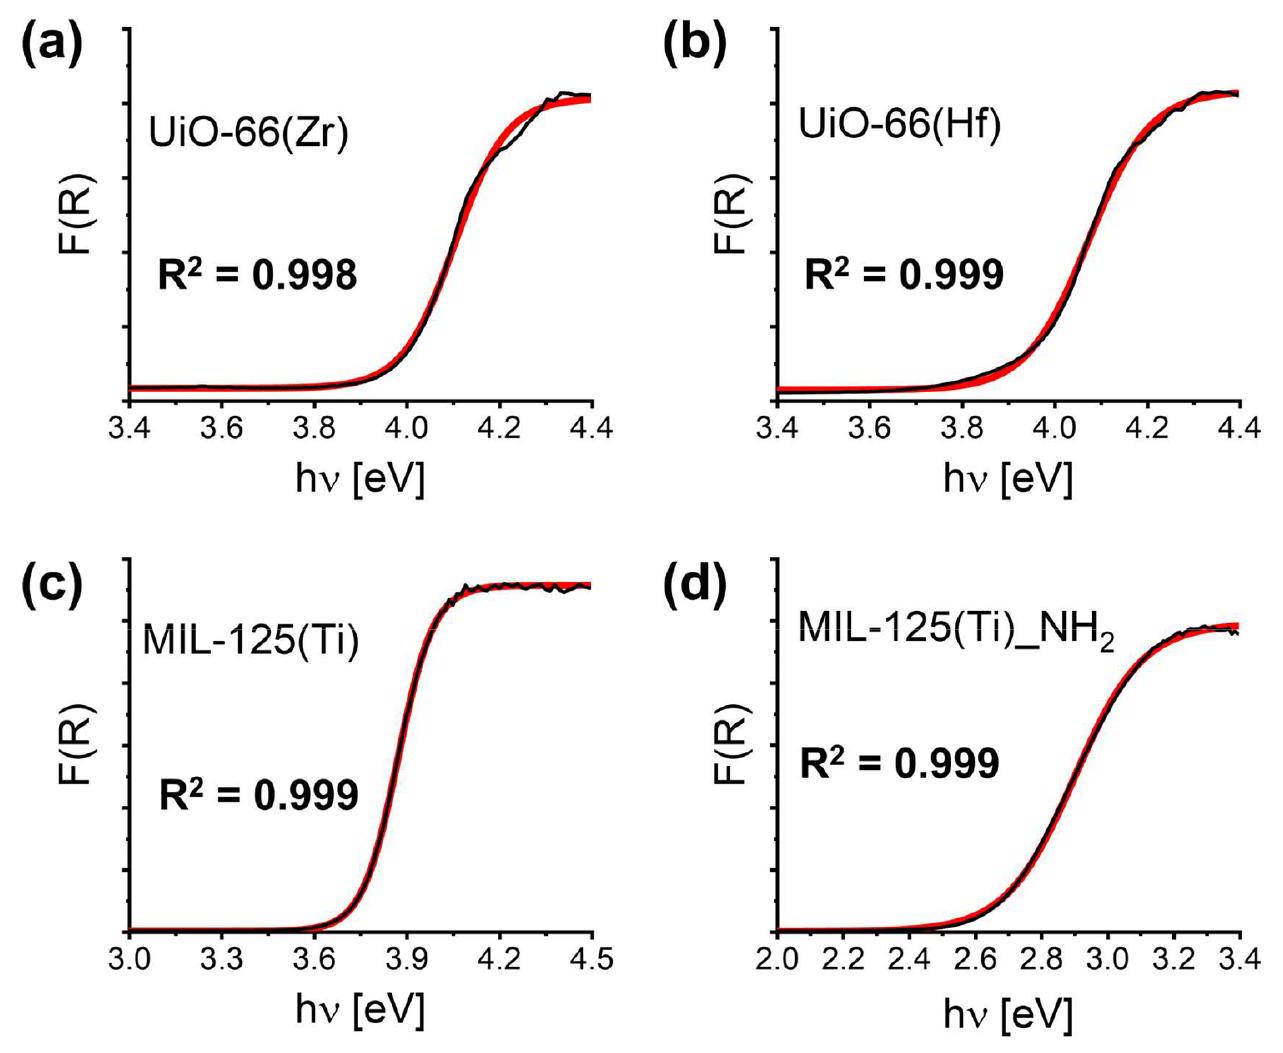
3.4. تقييم فجوة الطاقة: انحدار بولتزمان

تم اقتراح طريقة أكثر حداثة لتقييم فجوة النطاق لمواد أشباه الموصلات من قبل زاناتا [34]، والتي قامت بتقييم موثوقية دالة سيغمويد-بولتزمان الممثلة في المعادلة (8) من خلال ملاءمة البيانات المجمعة من الـ الطيف (الجدول 1). هنا، و هي معاملات الامتصاص القصوى والدنيا، هو إحداثي الطاقة (محور السينات) الذي يكون فيه معامل الامتصاص في منتصف الطريق بين و ، و يتعلق بزاوية ميل منحنى السجمويد.
تم اقتراح أن يمكن فهم القيمة على أنها طاقة مركزية تدور حولها معظم الانتقالات البصرية (اعتمادًا على طبيعة فجوات النطاق ووجود الاضطرابات) [34]. لهذا السبب، يجب تقديم قيم طاقة فجوة النطاق من خلال توزيع يشبه التوزيع الغاوسي مع طاقة متوسطة. الانحراف المعياري ، وعامل بولتزمان وفقًا للمعادلة (9). يتم الحصول عليه من المدرج التكراري الذي يتوافق مع مجموعة بيانات واسعة مع الأخذ في الاعتبار الانحرافات المعيارية 0.1 أو 0.2 ويتأثر بشكل كبير بنوع الانتقال الذي يظهره المادة [34].
الجدول 4
طاقات فجوة النطاق (eV) المحسوبة من المعادلة (9) مع الأخذ في الاعتبار القيم المستمدة من دالة كابلان-ماير واستخدام و .
طريقة UiO-66 UiO-67_NH2 MIL-125
زر Hf زركونيوم/تيتانيوم Hf/Ti زر زركونيوم/هفنيوم Hf H
٤.١١ ٤.٠٧ ٤.١٨ ٤.٤٩ ٢.٩٩ 2.98 3.01 3.87 ٢.٩٠
0.056 0.067 0.171 0.215 0.111 0.061 0.065 0.058 0.١٠٣
٤.٠٦ ٤.٠١ ٤.٠٣ ٤.٣٠ 2.89 2.93 2.95 3.82 2.81
3.91 3.84 3.58 3.74 2.61 2.77 2.78 3.67 2.54
الشكل 8. طاقات فجوة النطاق البصري التي تم الحصول عليها باستخدام طرق مختلفة: استقراء منحنى الانعكاس استقراء منحنى كوبيلكا-مونك فجوة كودي فجوة نطاق غير مباشرة فجوة النطاق غير المباشرة لتوك فجوة نطاق مباشرة فجوة النطاق المباشرة لتوك ، وتناسب بولتزمان لـ طيف . تمثل الخطوط الأفقية القيم التي تم الحصول عليها لـ (برتقال) ومن أجل (أخضر) عند النظر في و ، على التوالي. تمثل الأسهم الرأسية المسافة بين و (برتقالية) و (أخضر).
استنادًا إلى هذا المنطق، تم تطبيق ملاءمة دالة بولتزمان على نموذج كوبيلكا-مونك (الأشكال 7 و S10) وأيضًا على البيانات (الشكل S11) للمركبات المختلفة التي تم تصنيعها في هذا العمل. عند استخدام دالة كوبيلكا-مونك، كانت معاملات الارتباط التي تم الحصول عليها ( قيم الانحدار بولتزمان جميعها فوق 0.99، مما يظهر التوافق الجيد بين بيانات كابان-ماير التجريبية والطريقة التجريبية. ومع ذلك، فإن ملاءمة الانحدار بولتزمان لـ البيانات أظهرت معامل تحديد أقل لمعظم
المركبات، التي تُنسب إلى الدقة المنخفضة لهذه الطريقة عند التعامل مع بيانات الانعكاس المنتشر للأشعة فوق البنفسجية والمرئية.
بعد ملاءمة بيانات الانعكاس المنتشر للأشعة فوق البنفسجية والمرئية مع دالة بولتزمان، تم الحصول عليها لكل مركب مع الأخذ في الاعتبار دالة كوبيلكا-مونك (الجدول 4) و البيانات (الجدول S6). في عمله الأصلي، تحقق زاناتا [34] من القيمة التي تم الحصول عليها لـ مستقل عن المنهجية المطبقة لتقييم معامل الامتصاص أي، – مما يكشف أنه يجب أن يكون غير متأثر أيضًا بالقياسات أو تفاصيل معالجة البيانات مثل تصحيح الأطياف غير الصحيح، على سبيل المثال. تم العثور على هذه النتيجة
أن تكون غير دقيقة في حالة MOFs، حيث أن القيم المستمدة من نموذج كوبيلكا-مونك تختلف عن تلك الموجودة باستخدام النهج (الجدولان 4 و S6).
يمكن فصل طاقات فجوة النطاق التي تم الحصول عليها بواسطة الطرق المختلفة إلى مجموعات ذات قيم مشابهة اعتمادًا على نوع الانتقال (الأشكال 8 و S12 و S13). لاحظ أن الطاقات التي تم الحصول عليها بواسطة فجوة نطاق كودي كانت دائمًا تقع في منطقة فجوة النطاق غير المباشرة، وبيانات الانعكاس المنتشر الخام. قدر بشكل مبالغ فيه القيم في معظم الحالات. أيضًا، الفجوات النطاقية المباشرة وغير المباشرة أقرب في حالة UiO-67_ عند المقارنة مع المركبات الأخرى. الـ تم تقدير الطاقات باستخدام بيانات K-M بشكل مبالغ فيه وكانت أقرب إلى طاقات الفجوة المباشرة لجميع المركبات، كما هو موضح في الشكل 8. تم الحفاظ على هذه المعلمة أيضًا لمعظم المركبات عند استخدام البيانات باستثناء مواد UiO-67_NH2 (الشكل S13). يُعزى ذلك إلى سوء توافق دالة بولتزمان، كما تم التحقق من ذلك من خلال معامل الارتباط الأدنى في هذه الحالات (الشكل S11). أخيرًا، للتحقق مما إذا كان يمكن تقييم الفجوة في هذه الأنظمة من MOF بطريقة مشابهة للمواد شبه الموصلة الأخرى كما اقترح زاناتا [34]، و تم حسابها وفقًا للمعادلة (9). التجريبي تم الحصول على القيم من مجموعة بيانات كبيرة تأخذ في الاعتبار العينات المسحوقة مع مباشرة ( ) وغير مباشر ( فجوات النطاق [34]. تم استخراج القيم من ملاءمة دالة بولتزمان للبيانات التجريبية، والقيم المستخرجة معروضة في الجداول 4 و S6.
عند تحليل القيم المحسوبة و ومقارنةً بالطرق الأخرى، تم تحديد أربعة سيناريوهات مختلفة. في السيناريو الأول، يوجد تطابق فقط بين الـ القيم والفجوات النطاقية المباشرة – أي، ، و . في الحالة الثانية، فقط يتوافق مع القيم التجريبية، كما هو بالنسبة لـ المادة. في الحالة الثالثة، لا تتطابق أي من المجموعات مع انحدار بولتزمان، لكن يكمن بين المنطقتين (المباشرة وغير المباشرة)، كما لوحظ في كامل UiO-67_ سلسلة (الشكل S12). أخيرًا، بالنسبة لمركبات MIL-125(Ti) وMIL-125(Ti)_NH2، كلاهما و قريبة من مناطق فجوة النطاق المباشرة وغير المباشرة، على التوالي. توفر هذه السلوكيات المختلفة الدليل الأول لتحديد نوع الانتقال البصري الذي يظهره المادة.
على سبيل المثال، في حالة الـ و قرب الطاقات التي تم الحصول عليها باستخدام و الرسوم البيانية (الشكل 8) تدعم البيان بأن UiO-66(M) ( أو Hf) لديه فجوة نطاق مباشرة، وهو ما يتماشى مع تقارير أخرى ومحاكاة حسابية [79،87]. ثم، بعد إدخال التيتانيوم، القيم التي تم الحصول عليها لـ الفجوة النطاقية المباشرة تتبع بشكل أفضل الانحدار بولتزمان (الشكل 8)، على الرغم من أن القيم غير المباشرة أقرب إلى ما تم الإبلاغ عنه في الأدبيات [87]. يُعزى هذا التباين إلى استخدام مخطط تاوك (مع اختلافات في المعاملات: أو ) دون اعتبار مسبق لنوع انتقال فجوة الطاقة، مما يبرز أهمية الحصول على مثل هذه المعلومات من البيانات التجريبية. من ناحية أخرى، فإن وجود التيتانيوم في UiO-66 ( يبدو أنه يعدل نوع فجوة النطاق الملحوظة لمواد UiO-66 من مباشرة إلى غير مباشرة. في الواقع، هناك توافق أفضل بين و الـ مخطط لهذه المركب، مستنتجًا أن إضافة التيتانيوم يمكن أن تغير نوع فجوة الطاقة الملاحظة لمواد UiO-66 من مباشرة إلى غير مباشرة في بعض الحالات، كما ذُكر سابقًا [89، 90]. وبالمثل، عند النظر في UiO-67_ المركبات، وُجد أنه أقرب إلى القيم التي تم الحصول عليها لفراغات النطاق المباشرة (الشكل S12)، وهو أيضًا إشارة إلى أن هذه المواد تظهر انتقالًا إلكترونيًا مباشرًا عند الإثارة. أخيرًا، بالنسبة لـ MIL-125(Ti) و MIL-125(Ti)_NH2، كلاهما و تتفق مع الطاقات المستمدة من طرق أخرى. أظهرت MIL-125(Ti) الذي يقارن بـ ، و مقارنة بـ
3.67 إلكترون فولت؛ بينما قدم MIL-125(Ti)_NH2 بينما ، و بينما لذلك، لا يمكن استنتاج ما إذا كانت هذه المواد تمثل فجوة نطاق مباشرة أو غير مباشرة استنادًا فقط إلى الطاقات التي تم الحصول عليها من تحليل بولتزمان، مما يبرز ضرورة الحصول على كلا القيمتين في هذه الحالة.

3.5. تقييم فجوة الطاقة: الدالة العزلية المعقدة وتحويل كرامرز-كرونيغ

تقييم فجوة النطاق بواسطة الطرق المختلفة المقدمة أعلاه (تاوك، كودي، وبولتمان) يأخذ في الاعتبار كثافة الحالات للمادة [96،97] ويعتمد على بعض الافتراضات. على سبيل المثال، تعتبر فجوة كودي أن عناصر ثنائي القطب في المصفوفة البصرية مستقلة عن طاقة الفوتون [51]. من ناحية أخرى، يعتبر نموذج تاوك أن الزخم مستقل عن طاقة الفوتون في حافة الامتصاص [98]. ومع ذلك، هناك طريقة أخرى تُسمى تحويل كرامرز-كرونيغ التي تستخدم تحويلًا عازلًا، حيث أن الثوابت البصرية – معامل الانكسار معامل الانقراض وانعكاسية – يتم التعبير عنها كدوال للأجزاء الحقيقية والتخيلية من الدالة العازلة المعقدة ( )، كما هو موضح في المعادلة (10) [99].
في هذه الحالة، نظرًا لأن المادة السائبة مستقلة مكانيًا، فإنه من الممكن مقارنة القيم التي تم الحصول عليها بتلك الخاصة بنماذج المذبذبات ثنائية القطب الكلاسيكية [98،100]. في الواقع، يمكن العثور على عدة محاولات لربط البيانات التجريبية بين طاقات فجوة النطاق وتردد الرنين للمذبذبات في الأدبيات [101،102]. على سبيل المثال، ربط موس [102] معامل الانكسار بطاقة فجوة النطاق وتمكن من ملاءمة قانون تجريبي لمجموعة هائلة من المواد. كما تم مناقشة تباينات أخرى للنموذج في الأدبيات، كما هو الحال في علاقات رافيندرا وريدي [103]. في هذه الحالة، تم اقتراح علاقة بين فجوة النطاق ومعامل الانكسار للمواد شبه الموصلة. يمكن أيضًا الإشارة إلى النهج الذري لموس [102]، ونموذج الإلكترون شبه الحر لبن [104]، ومفهوم المذبذب لويمبل [105]، ونهج الاستقطاب البصري لفينكراث [101]. أخيرًا، قام هيرفي وفاندام [100] بتوسيع نموذج بن بناءً على الروابط التساهمية والأيونية داخل المادة شبه الموصلة، مما خلق أساسًا رياضيًا للنماذج المذكورة أعلاه.
تسمح الأجزاء الحقيقية والتخيلية من دالة العزل الكهربائي بتحديد المعلمات البصرية الكلية (مثل الانعكاسية، معامل الامتصاص، معامل الانكسار، وعمق الاختراق) على سبيل المثال، يمكن ربط الأجزاء الحقيقية والتخيلية من دالة العزل الكهربائي بمعامل الانقراض ( ) ومؤشر الانكسار ، التي هي دوال التردد -وفقًا للمعادلتين (11) و(12).
لوصف الاستقلال المكاني، يتم إجراء التحويل المعقد لدالة العزل في نظام إحداثيات قطبي. ومن ثم يصبح من الممكن التعبير عن نموذج بن باستخدام معلمتين فقط مع الاستقلال المكاني (أي وسط غير متجانس لانهائي)، كما هو موضح في المعادلة (13) [106].
تحويل كرامرز-كرونيغ [107،108] (تحويل ك-ك) له أهمية كبيرة، حيث يمكن استخدامه للحصول على معامل الانقراض ( ) ومؤشر الانكسار ( ) من المادة من خلال طيف الانعكاس المنتشر، كما هو موضح في المعادلتين (14) و (15) [109]، حيث، هي بيانات الانعكاس المنتشر (مُعَيارَة من 0 إلى 1).
الشكل 9. مخططات التشتت-التحلل مقابل الطاقة لـ (أ) UiO-66(Zr)، (ب) UiO-66(Hf)، (ج) MIL-125(Ti)، و (د) MIL-125(Ti)_NH2. حافة الامتصاص المرتبطة بالانقطاع عند يمثل كمنطقة زرقاء.
تكمن الابتكار في استخدام نهج K-K في حقيقة أن الأجزاء الحقيقية والتخيلية من الانعكاسية المعقدة مرتبطة عبر السببية، وبالتالي يمكن الحصول على زاوية التحول الطوري المجهولة باستخدام تحويل هيلبرت. باختصار، فإن علاقات كرامرز-كرونيغ هي خاصية عامة لوظائف الاستجابة يمكن تتبعها إلى مبدأ السببية [107،108]. الجزء التخييلي من وظيفة الاستجابة يصف كيف يقوم النظام بتفريغ الطاقة، حيث إنه في الطور مع القوة الدافعة. تشير علاقات كرامرز-كرونيغ إلى أن ملاحظة الاستجابة المبددة لنظام ما كافية لتحديد استجابته خارج الطور (التفاعلية)، والعكس صحيح. في هذه الحالة، زاوية التحول الطوري للعينة. مُعطى بواسطة المعادلة (16)، حيث هو التردد المتوسط في نطاق الطيف الم collected [109].
التشتت-الانتشار و – تم رسمه مقابل طاقة الفوتون (h تتميز الخصائص البصرية للمادة منذ في المنطقة حيث [109]. في الواقع، بالنسبة لمواد أشباه الموصلات، فإن مقابل ( ) الرسم البياني يظهر انقطاعًا و تحول الطور عندما [109]. تم عزو هذا التأثير إلى تأثير الاستقطاب في أشباه الموصلات والعوازل [110]. الانقطاع الملحوظ في مقابل ( تؤكد الرسوم البيانية لمواد MOF (الأشكال 9 و S14) بالتالي على طابعها كأشباه موصلات.
أخيرًا، من خلال دمج المعادلات (11) إلى (16) وطريقة تاوك (المعادلة (6))، يمكن اشتقاق المعادلة (17) التي تربط بين طاقات فجوة النطاق ( ) إلى معامل الانكسار وإلى طاقة الفوتون ، حيث هو نفاذية الفراغ [109].
الشكل 10. طاقات فجوة النطاق المحسوبة لـ (أ) UiO-66(Zr)، (ب) UiO-66(Hf)، (ج) MIL-125(Ti)، و (د) MIL-125(Ti)_NH2 باستخدام تحويل كرامرز-كرونيغ من خلال رسم ضد . الخط الأحمر يبرز الموقع حيث تم تقييم القيم. هذه الخط له ميل إيجابي للفجوات النطاقية المباشرة وميل سلبي للفجوات النطاقية غير المباشرة.
الجدول 5
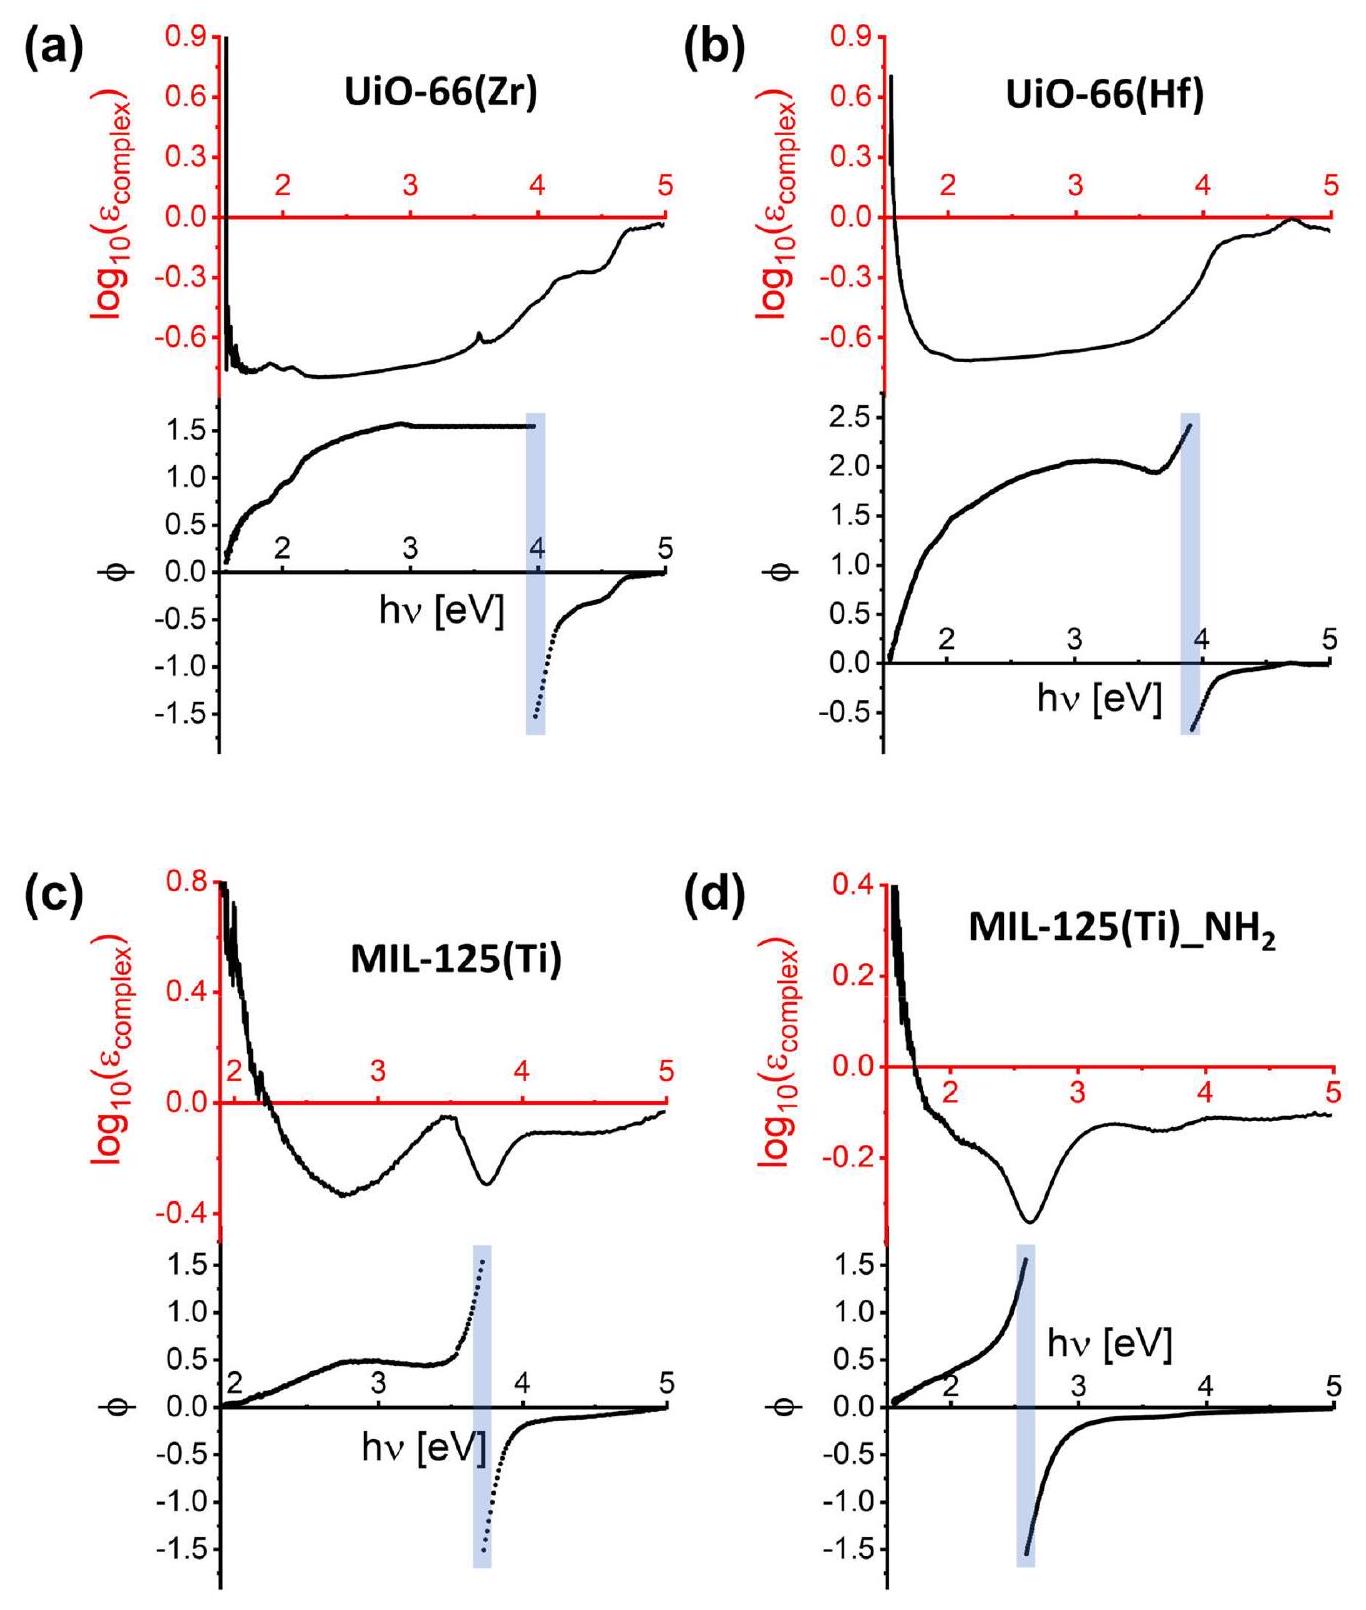
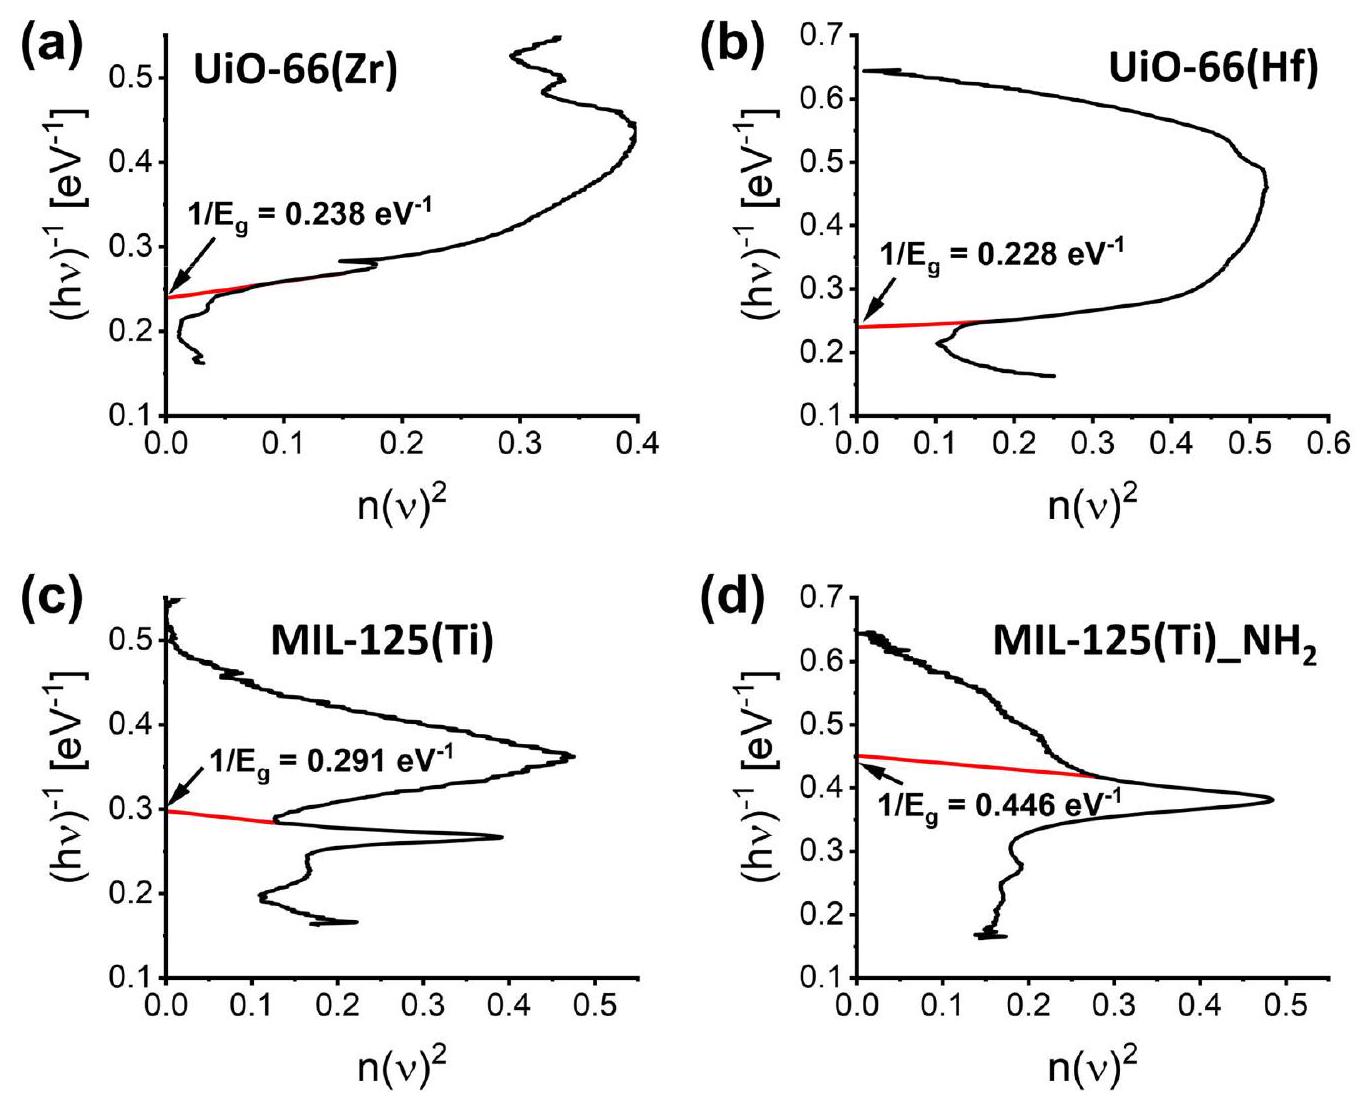
طاقات فجوة النطاق المحسوبة باستخدام تحويل كرامرز-كرونيغ، مقارنة مع المتوسط للقيم المباشرة وغير المباشرة ، ونسبة الخطأ بين و .
وزارة المالية
مباشر [eV] غير مباشر [eV] مباشر [%] غير مباشر [%]
[eV]
UiO-66(Zr) ٤.٢٠ ٤.٠٧ 3.94 3.2 6.6
UiO-66(Hf) ٤.٣٩ ٤.٠٤ 3.86 ٨.٦ 13.7
UiO-66(Zr/Ti) ٤.٣٥ ٤.٠٥ 3.69 ٧.٤ 17.9
UiO-66(Hf/Ti) ٤.٤١ ٤.١٧ 3.73 5.8 18.2
UiO-67(Zr)_NH2 3.22 2.93 2.76 9.9 ١٦.٧
UiO-67(Zr/Hf)_NH2 3.13 ٢.٩٦ 2.86 5.7 9.4
UiO-67(Hf)_NH2 3.13 2.98 2.87 5.0 9.1
ميل-125(تي) 3.44 3.83 3.66 10.2 6.0
MIL-125(Ti)_NH2 ٢.٢٤ 2.82 2.51 ٢٠.٦ 10.8
  • تم الحصول على القيم المباشرة من خلال اعتبار المتوسط بين فجوات النطاق المباشرة لتوك، والفجوات المباشرة النقية، وفجوات النطاق المباشرة لبولتزمان. وتم الحصول على القيم غير المباشرة من خلال اعتبار المتوسط بين فجوات النطاق غير المباشرة لكودي، وتوك غير المباشرة، والفجوات غير المباشرة النقية، وفجوات النطاق غير المباشرة لبولتزمان.
حبكة من (عكس طاقة الفوتون ) في الـ محور مقابل على -المحور يجعل منطقة النظام الخطي واضحة والتي تشير إلى بداية الامتصاص [109]. إن استقراء هذه المنحنى إلى -المحور يتوافق مع عكس طاقة فجوة النطاق للمادة (الشكل 10). قيم فجوة النطاق التي تم الحصول عليها من خلال تحويل كرامر-كلاوسيوس مُعروضة في الجدول 5، جنبًا إلى جنب مع القيم المتوسطة للقيم المباشرة (تاوك المباشرة، بولتزمان المباشرة، والمباشرة النقية) وغير المباشرة (تاوك غير المباشرة، كودي، بولتزمان غير المباشرة، وغير المباشرة النقية)
طرق، وخطأ بين وكل نوع من فجوة الطاقة (مباشرة أو غير مباشرة).
يمكن الحصول على معلومات مثيرة للاهتمام عند تحليل فجوة الطاقة وقيم الخطأ بين طاقات فجوة الطاقة التي تم الحصول عليها باستخدام تحويل كرامرز-كرونيغ والقيمة المتوسطة من طرق تاوك وكودي وبولتمان. أولاً، يبالغ نهج كرامرز-كرونيغ في تقدير فجوة الطاقة البصرية لمعظم المركبات، باستثناء MIL-125(Ti) وMIL. . بالإضافة إلى ذلك، فإن التباينات الملحوظة مرتبطة ارتباطًا وثيقًا بنوع الانتقال، حيث و يمكن أن يختلف بمقدار يصل إلى ترتيب من حيث الحجم عند اعتبار نفس العينة. بشكل عام، الطاقة المستخرجة لـ UiO- كانت السلاسل أقرب إلى القيم المتوسطة للانتقالات المباشرة، مما يشير إلى أن هذه العائلة من المواد تظهر فجوة نطاق مباشرة، بما يتماشى مع نتائج الانحدار بولتزمان (الأشكال 8 و S12 و S13). ومع ذلك، هو استثناء. يبدو أنه يظهر فجوة نطاق غير مباشرة عند النظر في قرب لكنها أقرب إلى المتوسط المباشر عند النظر في (الجدول 3-5). أخيرًا، يظهر MIL-125(Ti) و MIL-125(Ti)_NH2 خطأً أصغر بالنسبة للفجوة النطاقية غير المباشرة، مما يشير إلى أن هذا النوع من الانتقال مفضل في هذه المواد. بالمقابل، باستخدام الانحدار بولتزمان، فإن افتراضات الفجوات النطاقية المباشرة وغير المباشرة معقولة لهذين المادتين.
من الجدير بالذكر أن استخدام الدالة العزلية المعقدة لتقييم طاقات فجوة النطاق للموصلات نصفية يجب أن يتم بحذر. في الواقع، نظرًا لأن الطريقة تأخذ في الاعتبار الرسم العكسي للطاقة ضد أي تغيير في موقع خط الاعتراض يمكن أن يؤثر بشكل كبير على النتائج – أي: لـ eV ؛ بينما . علاوة على ذلك، هناك عدة مناطق مختلفة تظهر سلوكًا خطيًا عند رسم 1/ ضد (الأشكال 10 و S15). لذلك، هناك عدة أماكن حيث يتصل المماس بالمنحنى إلى يمكن رسم المحور – (كما في
الجدول 6
نسب انتقال فجوة النطاق البصري (مباشر أو غير مباشر) مع الأخذ في الاعتبار القيم الطاقية المتوسطة المحسوبة من طيف الأشعة فوق البنفسجية والمرئية المحول بواسطة كوبيلكا-مونك. تم اعتبار الانتقالات المباشرة للمتوسط: “مباشر” نقي و”مباشر” تاوك. تم اعتبار الانتقالات غير المباشرة للمتوسط: “غير مباشر” نقي، “غير مباشر” تاوك، وفجوة نطاق كودي. تمت مقارنة القيم بالطاقة المحسوبة باستخدام انحدار بولتزمان. و ) وكرايمرز-كرونيغ ( ) التحول.
وزارة المالية نسبة بولتزمان نسبة K-K استنتاج
[eV] [eV] [eV] [eV] [eV]
UiO-66(Zr) ٤.٠٦ 3.96 ٤.٠٦ 3.91 مباشر ٤.٢٠ مباشر مباشر
UiO-66(Hf) ٤.٠٤ 3.89 ٤.٠١ 3.84 مباشر ٤.٣٩ مباشر مباشر
UiO-66(Zr/Ti) ٤.٠١ 3.77 ٤.٠٣ 3.58 مباشر ٤.٣٥ مباشر مباشر
UiO-66(Hf/Ti) ٤.٠٥ 3.78 ٤.٣٠ 3.74 غير مباشر ٤.٤١ مباشر غير حاسم
UiO-67(Zr)_NH2 2.93 2.85 2.89 2.61 مباشر 3.22 مباشر مباشر
UiO-67(Zr/Hf)_NH 2.96 2.91 2.93 2.77 مباشر 3.13 مباشر مباشر
UiO-67(Hf)_NH2 2.98 2.91 ٢.٩٥ 2.78 مباشر 3.13 مباشر مباشر
ميل-125(تي) 3.82 ٣.٦٧ 3.82 ٣.٦٧ مباشر/غير مباشر 3.44 غير مباشر غير مباشر
MIL-125(Ti)_NH 2.80 2.53 2.81 2.54 مباشر/غير مباشر ٢.٢٤ غير مباشر غير مباشر
الشكل 11. مخطط انسيابي يوضح المنهجية لتحديد ما إذا كان للمادة انتقال فجوة مباشرة أو غير مباشرة.
مخطط تاوك للظل المستخرج إلى -المحور، كما تم مناقشته أعلاه)، مما قد يفضل خطأ هائل في تحديد باستخدام تحويل K-K. ومع ذلك، فإن الطريقة جذابة جدًا لتأكيد نوع فجوة النطاق لمواد مختلفة. يمكن أن تؤكد النتائج المستخلصة من طرق أخرى، مثل مخطط تاوك (مباشر وغير مباشر)، وكودي (غير مباشر)، والأساليب المباشرة النقية، وغير المباشرة النقية.
أخيرًا، تم حساب متوسط الطاقة لمجموعات المناطق من الانتقالات المباشرة (المباشرة النقية، والمباشرة تاوك) وغير المباشرة (غير المباشرة النقية، وغير المباشرة تاوك، وفجوة كودي) باستخدام نموذج كوبيلكا-مونك وتمت مقارنتها بأساليب أخرى (بولتزمان وكرايمرز-كرونيغ) لتحديد نوع فجوة النطاق البصرية لمواد MOF (الجدول 6). تتقارب نسب بولتزمان وكرايمرز-كرونيغ لـ
معظم المواد. في الواقع، فإن UiO بالكامل- تظهر السلسلة انتقالات فجوة نطاق مباشرة، باستثناء حيث كانت التحليلات غير حاسمة (بولتزمان: غير مباشر؛ ك-ك: مباشر). على النقيض من ذلك، تم تخصيص كلا نوعي الانتقال إلى MIL-125(Ti) و MIL-125(Ti) بالنظر إلى انحدار بولتزمان، بينما كان نموذج كرامرز-كرونيغ أقرب إلى متوسط طاقات فجوة النطاق البصرية غير المباشرة. لذلك، يُفترض أن هذه المواد تظهر انتقالات غير مباشرة. بالإضافة إلى ذلك، لاحظ أن الخط المماس الذي يربط انحناء إلى -المحور في رسم كرامرز-كرونيغ له ميل سلبي لـ MIL-125 (Ti) و MIL-125(Ti)_NH2 (الشكل 10). هذا الميل إيجابي لجميع مركبات MOF الأخرى، مما يشير إلى أنه يمكن أن يكون أداة لتحديد نوع انتقال فجوة الطاقة: بالنسبة للميل الإيجابي، تكون فجوة الطاقة مباشرة؛ وبالنسبة للميل السلبي، تكون فجوة الطاقة غير مباشرة.
لتلخيص ذلك، تم اقتراح منهجية كاملة لتحديد أنواع فجوة الطاقة باستخدام طيف الامتصاص الضوئي بالأشعة فوق البنفسجية والمرئية في المواد شبه الموصلة المسحوقة (الشكل 11).

4. الاستنتاجات

هذا العمل قام بتقييم الطرق المختلفة للوصول إلى فجوة الطاقة لمواد MOF المسحوقة والبلورية المفردة من خلال بيانات الانعكاس المنتشر للأشعة فوق البنفسجية والمرئية. تم مقارنة النتائج بشكل موسع مع الأدبيات. تم استخدام طريقة كوبيلكا-مونك و تمت مراعاة كل منها بشكل فردي عند معالجة بيانات الانعكاس المنتشر. تظهر النتائج أنه، على الرغم من أن طريقة كوبيلكا-مونك تقدم بعض القيود فيما يتعلق بالعينات ذات الامتصاص العالي، إلا أنها أكثر ملاءمة من النهج لأنه يوفر طيفًا بحواف امتصاص أكثر حدة، مما يسهل التفسير الإضافي وتوصيف فجوات الطاقة. تم تطبيق عدة طرق للحصول على قيم المواد المختلفة، ومن الجدير بالذكر فجوة النطاق التي تم الحصول عليها مباشرة من بيانات الانعكاس المنتشر، ومن بيانات كوبيلكا-مونك، من بيانات، فجوة كودي فجوة النطاق غير المباشرة ( فجوة النطاق غير المباشرة لتوك ]، فجوة النطاق المباشرة ( )، فجوة النطاق المباشرة لتوك [ فجوة بولتزمان، وفجوة كرامرز-كرونيغ. تم مقارنة هذه الأساليب المختلفة مع كل من البيانات التجريبية والحسابية من الأدبيات وتم التأكيد على قيود بعض الإجراءات. تم اقتراح طريقة مقارنة لتحديد نوع فجوة النطاق التي تظهرها المواد المختلفة دون الحاجة إلى محاكاة الكمبيوتر. يوفر الانحدار بولتزمان المرتبط بتحويل كرامرز-كرونيغ قاعدة قوية لتحديد ما إذا كان للمادة فجوة مباشرة أو غير مباشرة من خلال مقارنة النتائج التي تم الحصول عليها فقط. و النتيجة مع تلك من المنهجيات الأخرى (أي فجوة النطاق المباشرة وغير المباشرة لطريقة تاوك). تم تسليط الضوء أيضًا على تأثير معالجة البيانات المسبقة وتصحيح الخط الأساسي في الحالات التي تكون فيها حافة الامتصاص المسبق موجودة، مما قد يؤدي إلى تقييم خاطئ لقيم فجوة النطاق. أخيرًا، بالنسبة لبعض المواد مثل MIL-125(Ti) وMIL-125(Ti)_NH2، تم مناقشة الحاجة إلى الحصول على كل من قيم فجوة النطاق غير المباشرة والمباشرة. يبرز هذا العمل مدى دقة تحديد طبيعة فجوة النطاق وقيمتها باستخدام مطيافية الأشعة فوق البنفسجية والمرئية، مما يفسر تشتت النتائج في الأدبيات. يجب أن تسهم هذه الدراسة أيضًا في تحديد فجوات النطاق بدقة أكبر، مما يؤدي إلى موثوقية أكبر في مجالات مختلفة من الكيمياء والفيزياء وهندسة المواد حيث تكون هذه الفجوات ذات أهمية.

بيان مساهمة مؤلفي CRediT

بيدرو إتش. إم. أندرادي: التصور، المنهجية، التحليل الرسمي، التحقيق، تنظيم البيانات، التصور، الكتابة – المسودة الأصلية. كريستوف فولكرينجر: الكتابة – المراجعة والتحرير، التصور، التحقق، الإشراف، إدارة المشروع، الحصول على التمويل. تييري لويسو: الكتابة – المراجعة والتحرير، التصور، التحقق، الإشراف، إدارة المشروع، الحصول على التمويل. أنطونيو تيخيدا: الكتابة – المراجعة والتحرير، التصور، التحقق. ماثيو هوريو: الكتابة – المراجعة والتحرير، التصور.
التحقق، الإشراف، الموارد، إدارة المشروع، الحصول على التمويل. ألان مويست: الكتابة – المراجعة والتحرير، التصور، التحقق، الإشراف، الموارد، إدارة المشروع، الحصول على التمويل.

إعلان عن تضارب المصالح

يعلن المؤلفون أنهم ليس لديهم أي مصالح مالية متنافسة معروفة أو علاقات شخصية قد تبدو أنها تؤثر على العمل المبلغ عنه في هذه الورقة.

توفر البيانات

ستكون البيانات متاحة عند الطلب.

شكر وتقدير

يتم الاعتراف بـ “صندوق التنمية الإقليمي الأوروبي” (FEDER) و”المركز الوطني للبحث العلمي” (CNRS) و”منطقة أوت دو فرانس” و”وزارة التعليم الوطني والتعليم العالي والبحث” لتمويل أجهزة قياس حيود الأشعة السينية من منصة معهد شيفرول. يتم الاعتراف بالدكتور سيلفان دوفال لمساهمته القيمة في تحليل H NMR السائل. يود P. H. M. A. أن يشكر جامعة ليل على منحة الدكتوراه.

References

[1] A. Fujishima, K. Honda, Electrochemical photolysis of water at a semiconductor electrode, Nature 238 (1972) 37-38, https://doi.org/10.1038/238037a0.
[2] M.A. Fox, M.T. Dulay, Heterogeneous photocatalysis, Chem. Rev. 93 (1993) 341-357, https://doi.org/10.1021/cr00017a016.
[3] A. Chatterjee, L. Wang, P. Van Der Voort, Metal-organic frameworks in photocatalytic Z-scheme heterojunctions: an emerging technology, Chem. Commun. 59 (2023) 3627-3654, https://doi.org/10.1039/D2CC05819G.
[4] F. Fischer, Photoelectrode, photovoltaic and photosynthetic microbial fuel cells, Renew. Sustain. Energy Rev. 90 (2018) 16-27, https://doi.org/10.1016/j. rser.2018.03.053.
[5] S. Chu, Y. Wang, Y. Guo, J. Feng, C. Wang, W. Luo, X. Fan, Z. Zou, Band structure engineering of carbon nitride: in search of a polymer photocatalyst with high photooxidation property, ACS Catal. 3 (2013) 912-919, https://doi.org/ 10.1021/cs4000624.
[6] L. Jiao, Y. Wang, H.L. Jiang, Q. Xu, Metal-organic frameworks as platforms for catalytic applications, Adv. Mater. 30 (2018) 1-23, https://doi.org/10.1002/ adma. 201703663.
[7] P.H.M. Andrade, A.L.M. Gomes, H.G. Palhares, C. Volkringer, Post-synthetic modification of aluminum trimesate and copper trimesate with TiO2 nanoparticles for photocatalytic applications, J. Mater. Sci. 57 (2022) 4481-4503, https://doi.org/10.1007/s10853-021-06842-w.
[8] M.R. Hoffmann, S.T. Martin, W. Choi, D.W. Bahnemann, Environmental applications of semiconductor photocatalysis, Chem. Rev. 95 (1995) 69-96, https://doi.org/10.1021/cr00033a004.
[9] X. Deng, Z. Li, H. García, Visible light induced organic transformations using metal-organic-frameworks (MOFs), Chem. Eur. J. 23 (2017) 11189-11209, https://doi.org/10.1002/chem. 201701460.
[10] R. Asahi, T. Morikawa, T. Ohwaki, K. Aoki, Y. Taga, Visible-light photocatalysis in nitrogen-doped titanium oxides, Science 293 (2001) 269-271, https://doi.org/ 10.1126/science. 1061051 (80.).
[11] C.W. Jones, Metal-organic frameworks and covalent organic frameworks: emerging advances and applications, JACS Au 2 (2022) 1504-1505, https://doi. org/10.1021/jacsau.2c00376.
[12] S.M. Moosavi, A. Nandy, K.M. Jablonka, D. Ongari, J.P. Janet, P.G. Boyd, Y. Lee, B. Smit, H.J. Kulik, Understanding the diversity of the metal-organic framework ecosystem, Nat. Commun. 11 (2020) 1-10, https://doi.org/10.1038/s41467-020-17755-8.
[13] J.L. Mancuso, A.M. Mroz, K.N. Le, C.H. Hendon, Electronic structure modeling of metal-organic frameworks, Chem. Rev. 120 (2020) 8641-8715, https://doi.org/ 10.1021/acs.chemrev.0c00148.
[14] N. Kolobov, M.G. Goesten, J. Gascon, Metal-organic frameworks: molecules or semiconductors in photocatalysis? Angew. Chem. Int. Ed. 60 (2021) 26038-26052, https://doi.org/10.1002/anie. 202106342.
[15] S. Wang, L. Pan, J.J. Song, W. Mi, J.J. Zou, L. Wang, X. Zhang, Titanium-defected undoped anatase TiO2 with p-type conductivity, room-temperature ferromagnetism, and remarkable photocatalytic performance, J. Am. Chem. Soc. 137 (2015) 2975-2983, https://doi.org/10.1021/ja512047k.
[16] J.P. Kleider, Y.M. Soro, R. Chouffot, A.S. Gudovskikh, P. Roca i Cabarrocas, J. Damon-Lacoste, D. Eon, P.J. Ribeyron, High interfacial conductivity at amorphous silicon/crystalline silicon heterojunctions, J. Non-Cryst. Solids 354 (2008) 2641-2645, https://doi.org/10.1016/j.jnoncrysol.2007.09.087.
[17] K. Lu, D. Erb, M. Liu, Thermal stability and electrical conductivity of carbonenriched silicon oxycarbide, J. Mater. Chem. C. 4 (2016) 1829-1837, https://doi. org/10.1039/c6tc00069j.
[18] V. Somjit, P. Thinsoongnoen, S. Waiprasoet, T. Pila, P. Pattanasattayavong, S. Horike, K. Kongpatpanich, Processable UiO-66 metal-organic framework fluid gel and electrical conductivity of its nanofilm with sub-100 nm thickness, ACS Appl. Mater. Interfaces 13 (2021) 30844-30852, https://doi.org/10.1021/ acsami.1c07262.
[19] P. Salcedo-Abraira, A. Santiago-Portillo, P. Atienzar, P. Bordet, F. Salles, N. Guillou, E. Elkaim, H. Garcia, S. Navalon, P. Horcajada, A highly conductive nanostructured PEDOT polymer confined into the mesoporous MIL-100(Fe), Dalton Trans. 48 (2019) 9807-9817, https://doi.org/10.1039/C9DT00917E.
[20] P.H.M. Andrade, H. Palhares, C. Volkringer, T. Loiseau, M. Hureau, E. Nunes, A. Moissette, State of the art in visible-light photocatalysis of aqueous pollutants using metal-organic frameworks, J. Photochem. Photobiol. C Photochem. Rev. 57 (2023) 100635, https://doi.org/10.1016/j.jphotochemrev.2023.100635.
[21] L.D. Yuan, H.X. Deng, S.S. Li, S.H. Wei, J.W. Luo, Unified theory of direct or indirect band-gap nature of conventional semiconductors, Phys. Rev. B 98 (2018) 1-10, https://doi.org/10.1103/PhysRevB.98.245203.
[22] X. Guo, L. Liu, Y. Xiao, Y. Qi, C. Duan, F. Zhang, Band gap engineering of metalorganic frameworks for solar fuel productions, Coord. Chem. Rev. 435 (2021), https://doi.org/10.1016/j.ccr.2021.213785.
[23] R. Elzein, C.M. Chang, I. Ponomareva, W.Y. Gao, S. Ma, R. Schlaf, Advanced photoemission spectroscopy investigations correlated with DFT calculations on the self-assembly of 2D metal organic frameworks nano thin films, ACS Appl. Mater. Interfaces 8 (2016) 31403-31412, https://doi.org/10.1021/ acsami.6b10340.
[24] A.H. Wilson, The theory of electronic semi-conductors, Proc. R. Soc. Lond. Ser. A Math. Phys. Sci. 133 (1931) 458-491, https://doi.org/10.1098/rspa.1931.0162.
[25] A.H. Wilson, The theory of electronic semi-conductors II, Proc. R. Soc. Lond. Ser. A Math. Phys. Sci. 134 (1931) 277-287, https://doi.org/10.1098/ rspa.1931.0196.
[26] C.A. Mead, W.G. Spitzer, Fermi level position at semiconductor surfaces, Phys. Rev. Lett. 10 (1963) 471-472, https://doi.org/10.1103/PhysRevLett.10.471.
[27] Z. Huang, M. Lee Tang, Semiconductor nanocrystal light absorbers for photon upconversion, J. Phys. Chem. Lett. 9 (2018) 6198-6206, https://doi.org/ 10.1021/acs.jpclett.8b02154.
[28] C. Dette, M.A. Pérez-Osorio, C.S. Kley, P. Punke, C.E. Patrick, P. Jacobson, F. Giustino, S.J. Jung, K. Kern, TiO2 anatase with a bandgap in the visible region, Nano Lett. 14 (2014) 6533-6538, https://doi.org/10.1021/nl503131s.
[29] L.M. Yang, G.Y. Fang, J. Ma, E. Ganz, S.S. Han, Band gap engineering of paradigm MOF-5, Cryst. Growth Des. 14 (2014) 2532-2541, https://doi.org/10.1021/ cg500243s.
[30] C.H. Hendon, D. Tiana, M. Fontecave, C. Sanchez, L. D’Arras, C. Sassoye, L. Rozes, C. Mellot-Draznieks, A. Walsh, Engineering the optical response of the titanium-MIL-125 metal-organic framework through ligand functionalization, J. Am. Chem. Soc. 135 (2013) 10942-10945, https://doi.org/10.1021/ja405350u.
[31] L.M. Yang, G.Y. Fang, J. Ma, R. Pushpa, E. Ganz, Halogenated MOF-5 variants show new configuration, tunable band gaps and enhanced optical response in the visible and near infrared, Phys. Chem. Chem. Phys. 18 (2016) 32319-32330, https://doi.org/10.1039/c6cp06981a.
[32] Q. Wang, Q. Gao, A.M. Al-Enizi, A. Nafady, S. Ma, Recent advances in MOF-based photocatalysis: environmental remediation under visible light, Inorg. Chem. Front. 7 (2020) 300-339, https://doi.org/10.1039/c9qi01120j.
[33] C.J.H. Wort, R.S. Balmer, Diamond as an electronic material, Mater. Today 11 (2008) 22-28, https://doi.org/10.1016/S1369-7021(07)70349-8.
[34] A.R. Zanatta, Revisiting the optical bandgap of semiconductors and the proposal of a unified methodology to its determination, Sci. Rep. 9 (2019) 11225, https:// doi.org/10.1038/s41598-019-47670-y.
[35] V. Sarritzu, N. Sestu, D. Marongiu, X. Chang, Q. Wang, S. Masi, S. Colella, A. Rizzo, A. Gocalinska, E. Pelucchi, M.L. Mercuri, F. Quochi, M. Saba, A. Mura, G. Bongiovanni, Direct or indirect bandgap in hybrid lead halide perovskites? Adv. Opt. Mater. 6 (2018) 1-8, https://doi.org/10.1002/adom. 201701254.
[36] G. Wang, C. Robert, M.M. Glazov, F. Cadiz, E. Courtade, T. Amand, D. Lagarde, T. Taniguchi, K. Watanabe, B. Urbaszek, X. Marie, In-plane propagation of light in transition metal dichalcogenide monolayers: optical selection rules, Phys. Rev. Lett. 119 (2017) 1-7, https://doi.org/10.1103/PhysRevLett.119.047401.
[37] W. Eberhardt, F.J. Himpsel, Dipole selection rules for optical transitions in the fcc and bcc lattices, Phys. Rev. B 21 (1980) 5572-5576, https://doi.org/10.1103/ PhysRevB.21.5572.
[38] C. Kittel, Introduction to Solid State Physics, Wiley, 2005, pp. 185-219.
[39] Y.P. Varshni, Band-to-band radiative recombination in groups IV, VI, and III-V semiconductors (I), Phys. Status Solidi 19 (1967) 459-514, https://doi.org/ 10.1002/pssb. 19670190202.
[40] R. Soref, B. Bennett, Electrooptical effects in silicon, IEEE J. Quantum Electron. 23 (1987) 123-129, https://doi.org/10.1109/JQE.1987.1073206.
[41] S. Zwerdling, B. Lax, L.M. Roth, Oscillatory magneto-absorption in semiconductors, Phys. Rev. 108 (1957) 1402-1408, https://doi.org/10.1103/ PhysRev.108.1402.
[42] J. Tauc, R. Grigorovici, A. Vancu, Optical properties and electronic structure of amorphous germanium, Phys. Status Solidi 15 (1966) 627-637, https://doi.org/ 10.1002/pssb. 19660150224.
[43] N.F. Mott, E.A. Davis, Conduction in non-crystalline systems V. Conductivity, optical absorption and photoconductivity in amorphous semiconductors, Philos. Mag. 22 (1970) 903-922, https://doi.org/10.1080/14786437008221061.
[44] J.B. Coulter, D.P. Birnie, Assessing tauc plot slope quantification: ZnO thin films as a model system, Phys. Status Solidi Basic Res. 255 (2018) 1-7, https://doi.org/ 10.1002/pssb. 201700393.
[45] Y. Feng, S. Lin, S. Huang, S. Shrestha, G. Conibeer, Can Tauc plot extrapolation be used for direct-band-gap semiconductor nanocrystals? J. Appl. Phys. 117 (2015) https://doi.org/10.1063/1.4916090.
[46] B.D. Viezbicke, S. Patel, B.E. Davis, D.P. Birnie, Evaluation of the Tauc method for optical absorption edge determination: ZnO thin films as a model system, Phys. Status Solidi Basic Res. 252 (2015) 1700-1710, https://doi.org/10.1002/ pssb. 201552007.
[47] R. López, R. Gómez, Band-gap energy estimation from diffuse reflectance measurements on sol-gel and commercial TiO2: a comparative study, J. Sol-Gel Sci. Technol. 61 (2012) 1-7, https://doi.org/10.1007/s10971-011-2582-9.
[48] A. Dolgonos, T.O. Mason, K.R. Poeppelmeier, Direct optical band gap measurement in polycrystalline semiconductors: a critical look at the Tauc method, J. Solid State Chem. 240 (2016) 43-48, https://doi.org/10.1016/j. jssc.2016.05.010.
[49] M. Meinert, G. Reiss, Electronic structure and optical band gap determination of NiFe2O4, J. Phys. Condens. Matter 26 (2014) 115503, https://doi.org/10.1088/ 0953-8984/26/11/115503.
[50] P. Makuła, M. Pacia, W. Macyk, How to correctly determine the band gap energy of modified semiconductor photocatalysts based on UV-vis spectra, J. Phys. Chem. Lett. 9 (2018) 6814-6817, https://doi.org/10.1021/acs.jpclett.8b02892.
[51] G.D. Cody, B.G. Brooks, B. Abeles, Optical absorption above the optical gap of amorphous silicon hydride, Sol. Energy Mater. 8 (1982) 231-240, https://doi. org/10.1016/0165-1633(82)90065-X.
[52] P. Bouguer, Traité d’optique sur la gradation de la lumière, Guerin and Delatour, Paris, 1852. https://gallica.bnf.fr/ark:/12148/bpt6k948469/f2.item.
[53] J.H. Lambert, Photometria, Sive de Mensura et Gradibus Luminis, Colorum et Umbrae, Leipzig : W. Engelmann, 1760. https://archive.org/details/lambertsph otome00lambgoog.
[54] Beer, Bestimmung der Absorption des rothen Lichts in farbigen Flüssigkeiten, Ann. Phys. 162 (1852) 78-88, https://doi.org/10.1002/andp. 18521620505.
[55] J.I. Pankove, Optical Processes in Semiconductors, Dover Publications, New York, 1971. I. 0-486-60275-3.
[56] R. Vahalová, L. Tichý, M. Vlček, H. Tichá, Far infrared spectra and bonding arrangement in some Ge-Sb-S glasses, Phys. Status Solidi 181 (2000) 199-209, https://doi.org/10.1002/1521-396X(200009), 181:1<199::AID-PSSA199>3.0. CO;2-X.
[57] P. Kubelka, F. Munk, An article on optics of paint layers, Z. Tech. Phys. 12 (1931) 593-601.
[58] Y. Lee, S. Kim, J.K. Kang, S.M. Cohen, Photocatalytic CO2 reduction by a mixed metal ( ), mixed ligand metal-organic framework under visible light irradiation, Chem. Commun. 51 (2015) 5735-5738, https://doi.org/10.1039/ c5cc00686d.
[59] D. Yamashita, Y. Nakajima, A. Ishizaki, M. Uda, Photoelectron spectrometer equipped with open counter for electronic structures of organic materials, J. Surf. Anal. 14 (2008) 433-436. http://www.sasj.jp/JSA/CONTENTS. /vol.14_4/Vol. 14 No.4/Vol. 14 No. 4 433-436.pdf.
[60] R.J. Davis, M.T. Lloyd, S.R. Ferreira, M.J. Bruzek, S.E. Watkins, L. Lindell, P. Sehati, M. Fahlman, J.E. Anthony, J.W.P. Hsu, Determination of energy level alignment at interfaces of hybrid and organic solar cells under ambient environment, J. Mater. Chem. 21 (2011) 1721-1729, https://doi.org/10.1039/ C0JM02349C.
[61] J. Jasieniak, M. Califano, S.E. Watkins, Size-dependent valence and conduction band-edge energies of semiconductor nanocrystals, ACS Nano 5 (2011) 5888-5902, https://doi.org/10.1021/nn201681s.
[62] P. Kubelka, New contributions to the optics of intensely light-scattering materials. Part I, J. Opt. Soc. Am. 44 (1948) 330, https://doi.org/10.1364/josa.44.000330.
[63] D.R. Duncan, The colour of pigment mixtures, Proc. Phys. Soc. 52 (1940) 390-401, https://doi.org/10.1088/0959-5309/52/3/310.
[64] T. Burger, J. Kuhn, R. Caps, J. Fricke, Quantitative determination of the scattering and absorption coefficients from diffuse reflectance and transmittance measurements: application to pharmaceutical powders, Appl. Spectrosc. 51 (1997) 309-317, https://doi.org/10.1366/0003702971940404.
[65] D.J. Dahm, K.D. Dahm, Representative layer theory for diffuse reflectance, Appl. Spectrosc. 53 (1999) 647-654, https://doi.org/10.1366/0003702991947298.
[66] T. Burger, H.J. Ploss, J. Kuhn, S. Ebel, J. Fricke, Diffuse reflectance and transmittance spectroscopy for the quantitative determination of scattering and absorption coefficients in quantitative powder analysis, Appl. Spectrosc. 51 (1997) 1323-1329, https://doi.org/10.1366/0003702971941999.
[67] S. Landi, I.R. Segundo, E. Freitas, M. Vasilevskiy, J. Carneiro, C.J. Tavares, Use and misuse of the Kubelka-Munk function to obtain the band gap energy from diffuse reflectance measurements, Solid State Commun. 341 (2022) 1-7, https:// doi.org/10.1016/j.ssc.2021.114573.
[68] G. Férey, Hybrid porous solids: past, present, future, Chem. Soc. Rev. 37 (2008) 191-214, https://doi.org/10.1039/b618320b.
[69] M.A. Nasalevich, C.H. Hendon, J.G. Santaclara, K. Svane, B. Van Der Linden, S. L. Veber, M.V. Fedin, A.J. Houtepen, M.A. Van Der Veen, F. Kapteijn, A. Walsh, J. Gascon, Electronic origins of photocatalytic activity in d0 metal organic frameworks, Sci. Rep. 6 (2016) 1-9, https://doi.org/10.1038/srep23676.
[70] P.H.M. Andrade, N. Henry, C. Volkringer, T. Loiseau, H. Vezin, M. Hureau, A. Moissette, Iodine uptake by Zr -/Hf-Based UiO-66 materials: the influence of
metal substitution on iodine evolution, ACS Appl. Mater. Interfaces (2022), https://doi.org/10.1021/acsami.2c07288.
[71] J. Heine, K. Müller-Buschbaum, Engineering metal-based luminescence in coordination polymers and metal-organic frameworks, Chem. Soc. Rev. 42 (2013) 9232-9242, https://doi.org/10.1039/c3cs60232j.
[72] P. Huo, T. Chen, J. Le Hou, L. Yu, Q.Y. Zhu, J. Dai, Ligand-to-ligand charge transfer within metal-organic frameworks based on manganese coordination polymers with tetrathiafulvalene-bicarboxylate and bipyridine ligands, Inorg. Chem. 55 (2016) 6496-6503, https://doi.org/10.1021/acs.inorgchem.6b00571.
[73] C. Xu, Y. Pan, G. Wan, H. Liu, L. Wang, H. Zhou, S.H. Yu, H.L. Jiang, Turning on visible-light photocatalytic C-H oxidation over metal-organic frameworks by introducing metal-to-cluster charge transfer, J. Am. Chem. Soc. 141 (2019) 19110-19117, https://doi.org/10.1021/jacs.9b09954.
[74] C.A. Kent, D. Liu, L. Ma, J.M. Papanikolas, T.J. Meyer, W. Lin, Light harvesting in microscale metal-organic frameworks by energy migration and interfacial electron transfer quenching, J. Am. Chem. Soc. 133 (2011) 12940-12943, https://doi.org/10.1021/ja204214t.
[75] M.A. Nasalevich, M.G. Goesten, T.J. Savenije, F. Kapteijn, J. Gascon, Enhancing optical absorption of metal-organic frameworks for improved visible light photocatalysis, Chem. Commun. 49 (2013) 10575-10577, https://doi.org/ 10.1039/c3cc46398b.
[76] P.H.M. Andrade, M. Moreau, N. Henry, M.T. Bakouche, S. Duval, C. Volkringer, T. Loiseau, M. Hureau, A. Moissette, Raman mapping as a tool for evaluating I2 and I3- diffusion over single-crystal UiO-67_NH2(M) ( , or Hf), J. Phys. Chem. C 2 (2022), https://doi.org/10.1021/acs.jpcc.2c08723.
[77] P.H.M. Andrade, H. Ahouari, C. Volkringer, T. Loiseau, H. Vezin, M. Hureau, A. Moissette, Electron-donor functional groups, band gap tailoring, and efficient charge separation: three keys to improve the gaseous iodine uptake in MOF materials, ACS Appl. Mater. Interfaces 15 (2023) 31032-31048, https://doi.org/ 10.1021/acsami.3c04955.
[78] T. Ahnfeldt, N. Guillou, D. Gunzelmann, I. Margiolaki, T. Loiseau, G. Férey, J. Senker, N. Stock, a 12 -connected porous metal-organic framework with an unprecedented aluminum-containing brick, Angew. Chem. Int. Ed. 48 (2009) 5163-5166, https://doi.org/10.1002/ anie. 200901409.
[79] J.H. Cavka, S. Jakobsen, U. Olsbye, N. Guillou, C. Lamberti, S. Bordiga, K. P. Lillerud, A new zirconium inorganic building brick forming metal organic frameworks with exceptional stability, J. Am. Chem. Soc. 130 (2008) 13850-13851, https://doi.org/10.1021/ja8057953.
[80] M. Dan-Hardi, C. Serre, T. Frot, L. Rozes, G. Maurin, C. Sanchez, G. Férey, A new photoactive crystalline highly porous titanium(IV) dicarboxylate, J. Am. Chem. Soc. 131 (2009) 10857-10859, https://doi.org/10.1021/ja903726m.
[81] S. Jakobsen, D. Gianolio, D.S. Wragg, M.H. Nilsen, H. Emerich, S. Bordiga, C. Lamberti, U. Olsbye, M. Tilset, K.P. Lillerud, Structural determination of a highly stable metal-organic framework with possible application to interim radioactive waste scavenging: Hf-UiO-66, Phys. Rev. B Condens. Matter Mater. Phys. 86 (2012) 1-11, https://doi.org/10.1103/PhysRevB.86.125429.
[82] M.J. Katz, Z.J. Brown, Y.J. Colón, P.W. Siu, K.A. Scheidt, R.Q. Snurr, J.T. Hupp, O.K. Farha, A facile synthesis of UiO-66, UiO-67 and their derivatives, Chem. Commun. 49 (2013) 9449-9451, https://doi.org/10.1039/C3CC46105J.
[83] M. Leloire, C. Walshe, P. Devaux, R. Giovine, S. Duval, T. Bousquet, S. Chibani, J. Paul, A. Moissette, H. Vezin, P. Nerisson, L. Cantrel, C. Volkringer, T. Loiseau, Capture of gaseous iodine in isoreticular zirconium-based UiO-n metal-organic frameworks: influence of amino functionalization, DFT calculations, Raman and EPR spectroscopic investigation, Chem. Eur. J 28 (2022), https://doi.org/ 10.1002/chem. 202104437 e202104437.
[84] S. Hu, M. Liu, K. Li, Y. Zuo, A. Zhang, C. Song, G. Zhang, X. Guo, Solvothermal synthesis of NH2-MIL-125(Ti) from circular plate to octahedron, CrystEngComm 16 (2014) 9645-9650, https://doi.org/10.1039/c4ce01545b.
[85] A.Y. Galashev, A.S. Vorob’ev, Physical properties of silicene electrodes for Li -, , Mg-, and K-ion batteries, J. Solid State Electrochem. 22 (2018) 3383-3391, https://doi.org/10.1007/s10008-018-4050-8.
[86] K. Hendrickx, D.E.P. Vanpoucke, K. Leus, K. Lejaeghere, A. Van Yperen-De Deyne, V. Van Speybroeck, P. Van Der Voort, K. Hemelsoet, Understanding intrinsic light absorption properties of UiO-66 frameworks: a combined theoretical and experimental study, Inorg. Chem. 54 (2015) 10701-10710, https://doi.org/ 10.1021/acs.inorgchem.5b01593.
[87] L.M. Yang, E. Ganz, S. Svelle, M. Tilset, Computational exploration of newly synthesized zirconium metal-organic frameworks UiO-66, -67, -68 and analogues, J. Mater. Chem. C 2 (2014) 7111-7125, https://doi.org/10.1039/c4tc00902a.
[88] A.S. Yasin, J. Li, N. Wu, T. Musho, Study of the inorganic substitution in a functionalized UiO-66 metal-organic framework, Phys. Chem. Chem. Phys. 18 (2016) 12748-12754, https://doi.org/10.1039/c5cp08070c.
[89] A. Wang, Y. Zhou, Z. Wang, M. Chen, L. Sun, X. Liu, Titanium incorporated with UiO-66(Zr)-type metal-organic framework (MOF) for photocatalytic application, RSC Adv. 6 (2016) 3671-3679, https://doi.org/10.1039/c5ra24135a.
[90] J. Tu, X. Zeng, F. Xu, X. Wu, Y. Tian, X. Hou, Z. Long, Microwave-induced fast incorporation of titanium into UiO-66 metal-organic frameworks for enhanced photocatalytic properties, Chem. Commun. 53 (2017) 3361-3364, https://doi. org/10.1039/c7cc00076f.
[91] S. Liu, Z. Ren, H. Xu, Y. Xing, X. Jin, G. Ni, Z. Wang, Visible-light-responsive heterojunction with enhanced photocatalytic performance, Mater. Sci. Semicond. Process. 147 (2022) 106708, https://doi.org/10.1016/j. mssp.2022.106708.
[92] X. Zhao, M. Xu, X. Song, X. Liu, W. Zhou, H. Wang, P. Huo, Tailored linker defects in UiO-67 with high ligand-to-metal charge transfer toward efficient photoreduction of CO2, Inorg. Chem. 61 (2022) 1765-1777, https://doi.org/ 10.1021/acs.inorgchem.1c03690.
[93] E. Flage-Larsen, A. Røyset, J.H. Cavka, K. Thorshaug, Band gap modulations in UiO metal-organic frameworks, J. Phys. Chem. C 117 (2013) 20610-20616, https://doi.org/10.1021/jp405335q.
[94] S. Chavan, J.G. Vitillo, D. Gianolio, O. Zavorotynska, B. Civalleri, S. Jakobsen, M. H. Nilsen, L. Valenzano, C. Lamberti, K.P. Lillerud, S. Bordiga, H2 storage in isostructural UiO-67 and UiO-66 MOFs, Phys. Chem. Chem. Phys. 14 (2012) 1614-1626, https://doi.org/10.1039/c1cp23434j.
[95] S.Q. Wang, X. Wang, X.Y. Zhang, X.M. Cheng, J. Ma, W.Y. Sun, Effect of the defect modulator and ligand length of metal-organic frameworks on carbon dioxide photoreduction, ACS Appl. Mater. Interfaces 13 (2021) 61578-61586, https:// doi.org/10.1021/acsami.1c21663.
[96] R. Raciti, R. Bahariqushchi, C. Summonte, A. Aydinli, A. Terrasi, S. Mirabella, Optical bandgap of semiconductor nanostructures: methods for experimental data analysis, J. Appl. Phys. 121 (2017) 234304, https://doi.org/10.1063/1.4986436.
[97] C. Rotaru, S. Nastase, N. Tomozeiu, Amorphous phase influence on the optical bandgap of polysilicon, Phys. Status Solidi 171 (1999) 365-370, https://doi.org/ 10.1002/(SICI)1521-396X(199901)171. :1<365::AID-PSSA365>3.0.CO;2-M.
[98] B. Gu, N.H. Kwong, R. Binder, Relation between the interband dipole and momentum matrix elements in semiconductors, Phys. Rev. B 87 (2013) 125301, https://doi.org/10.1103/PhysRevB.87.125301.
[99] B. Jensen, Quantum theory of the complex dielectric constant of free carriers in polar semiconductors, IEEE J. Quantum Electron. 18 (1982) 1361-1370, https:// doi.org/10.1109/JQE.1982.1071713.
[100] P. Hervé, L.K.J. Vandamme, General relation between refractive index and energy gap in semiconductors, Infrared Phys. Technol. 35 (1994) 609-615, https://doi. org/10.1016/1350-4495(94)90026-4.
[101] H. Finkenrath, The Moss rule and the influence of doping on the optical dielectric constant of semiconductors-I, Infrared Phys. 28 (1988) 327-332, https://doi.org/ 10.1016/0020-0891(88)90054-1.
[102] T.S. Moss, Relations between the refractive index and energy gap of semiconductors, Phys. Status Solidi 131 (1985) 415-427, https://doi.org/ 10.1002/pssb. 2221310202.
[103] N.M. Ravindra, P. Ganapathy, J. Choi, Energy gap-refractive index relations in semiconductors-an overview, Infrared Phys. Technol. 50 (2007) 21-29, https:// doi.org/10.1016/j.infrared.2006.04.001.
[104] D.R. Penn, Wave-number-dependent dielectric function of semiconductors, Phys. Rev. 128 (1962) 2093-2097, https://doi.org/10.1103/PhysRev.128.2093.
[105] S.H. Wemple, Optical oscillator strengths and excitation energies in solids, liquids, and molecules, J. Chem. Phys. 67 (1977) 2151-2168, https://doi.org/ 10.1063/1.435102.
[106] P. George, P. Chowdhury, Complex dielectric transformation of UV-vis diffuse reflectance spectra for estimating optical band-gap energies and materials classification, Analyst 144 (2019) 3005-3012, https://doi.org/10.1039/ c8an02257g.
[107] H.A. Kramers, The quantum theory of dispersion, Nature 114 (1924) 310-311, https://doi.org/10.1038/114310b0.
[108] R. de L. Kronig, On the theory of dispersion of X-rays, J. Opt. Soc. Am. 12 (1926) 547-557, https://doi.org/10.1364/JOSA.12.000547.
[109] A.B. Kuzmenko, Kramers-Kronig constrained variational analysis of optical spectra, Rev. Sci. Instrum. 76 (2005) 83108, https://doi.org/10.1063/1.1979470.
[110] E. Yablonovitch, Photonic band-gap structures, J. Opt. Soc. Am. B 10 (1993) 283-295, https://doi.org/10.1364/JOSAB.10.000283.

    • Corresponding author.
    E-mail address: pedro.moraisandrade@univ-lille.fr (P.H.M. Andrade).

Journal: Applied Materials Today, Volume: 37
DOI: https://doi.org/10.1016/j.apmt.2024.102094
Publication Date: 2024-02-10

Band gap analysis in MOF materials: Distinguishing direct and indirect transitions using UV-vis spectroscopy

Pedro Andrade, Christophe Volkringer, Thierry Loiseau, Antonio Tejeda, Matthieu Hureau, Alain Moissette

To cite this version:

Pedro Andrade, Christophe Volkringer, Thierry Loiseau, Antonio Tejeda, Matthieu Hureau, et al.. Band gap analysis in MOF materials: Distinguishing direct and indirect transitions using UV-vis spectroscopy. Applied Materials Today, 2024, Applied Materials Today, 37, pp. 102094. 10.1016/j.apmt.2024.102094 . hal-04467475
HAL Id: hal-04467475
https://hal.univ-lille.fr/hal-04467475v1
Submitted on 20 Feb 2024
HAL is a multi-disciplinary open access archive for the deposit and dissemination of scientific research documents, whether they are published or not. The documents may come from teaching and research institutions in France or abroad, or from public or private research centers.
L’archive ouverte pluridisciplinaire HAL, est destinée au dépôt et à la diffusion de documents scientifiques de niveau recherche, publiés ou non, émanant des établissements d’enseignement et de recherche français ou étrangers, des laboratoires publics ou privés.

Band gap analysis in MOF materials: Distinguishing direct and indirect transitions using UV-vis spectroscopy

Pedro H.M. Andrade , Christophe Volkringer , Thierry Loiseau , Antonio Tejeda , Matthieu Hureau , Alain Moissette Laboratoire de Spectroscopie pour les Interactions, la Réactivité et l’Environnement (LASIRE), Université de Lille – Sciences et Technologies, Villeneuve d’Ascq 59655, France Unité de Catalyse et Chimie du Solide (UCCS), Univ. Lille, CNRS, Centrale Lille, Univ. Artois, UMR 8181, Villeneuve d’Ascq 59655, France Université Paris-Saclay, CNRS, Laboratoire de Physique des Solides, Orsay 91405, France

A R T I C L E I N F O

Keywords:

Band gap
MOF
Boltzmann regression
Kramers-Kronig
UV-vis

Abstract

Metal-Organic Frameworks (MOFs) have gained considerable attention due to their potential applications in gas storage, separation, and catalysis. These porous materials exhibit properties of interest for semiconductor physics and homogeneous photocatalysis, in which concepts from coordination chemistry and semiconductor physics are often mixed. In the photocatalysis field, the optical band gap of the semiconductors is a crucial parameter that determine their functionality. Despite all the interest of MOFs, there is still a considerable lack of information about their band gap evaluation (especially if the gap is direct or indirect) using UV-Vis spectroscopy, and there is a considerable scattering in these values. The Tauc plot method is frequently used to access band gaps, even though it is not always accurate, especially for distinguishing direct and indirect band gaps. A more complete and precise analysis can be reached by using additional experimental techniques (XPS, UPS, and IPES spectroscopies), that are not always of easy access. This work examines several approaches for determining the band gap of MOF materials and proposes methodologies for a correct data interpretation, which leads to a better agreement between experimental and theoretical gaps. Several methods were analyzed to access the band gap of different MOF materials – UiO-66(Zr), UiO-66(Hf), UiO-66(Zr/Ti), UiO-66(Hf/Ti), UiO-67(Zr)_NH2, UiO-67(Zr/Hf)_NH2, UiO67(Hf)_NH2, MIL-125(Ti), and MIL-125(Ti)_NH2 – purely from diffuse reflectance UV-vis (DR-UV-vis) data. The Kubelka-Munk and approaches were considered for transforming the DR-UV-vis spectra and the results demonstrate that the former method is more suitable, as it provides spectra with sharper absorption edges, which facilitates the interpretation and characterization of the optical band gaps. This study also highlights the importance of pre-data treatment and baseline correction in cases where a pre-absorption edge is present. Finally, by applying the Kramers-Kronig transformation to the reflectance spectra, and the Boltzmann regression to the Kubelka-Munk data, a solid base was created for determining if a material has a direct or an indirect gap. In addition, for some materials, the need for acquiring both the indirect and direct band gap values was discussed, as in some of these hybrid materials, both of these transitions can occur simultaneously. This paper guides the research community towards a most suitable methodology for assessing optical band gaps in hybrid materials, as it assists researchers in selecting the best methodology for their needs while avoiding typical mistakes in data interpretation.

1. Introduction

Heterogeneous photocatalysis has become a field of great interest since its early development back in the 70’s [1]. Since then, it has become a multidisciplinary area that incorporates semiconductor physics, surface sciences, physical chemistry, materials science, biology,
and chemical engineering [2,3]. After the demonstration of the water photolysis in the presence of by Fujishima and Honda in 1972 [1], different types of semiconductors have been extensively evaluated according to their photocatalytic properties in liquid and gaseous mixtures, worth mentioning , and CdS [2,4]. Later on, many other materials and heterojunctions have been developed for
photocatalytic applications, such as polymers [5], Metal-Organic Frameworks (MOFs) [6], and MOFs- heterojunctions [7]. The properties of those materials – e.g., porosity, Specific Surface Area (SSA), particle size, and electronic structure – have been continuously improved over the years due to the extensive research in this field [8-10]. When considering the most common inorganic semiconductors, their main properties (such as electronic structure, band gap energies and types) are already thoroughly known, mainly due to the large number of experimental and theoretical data that have already been collected. On the other hand, due to the large number of MOFs that already exist and that are discovered daily (there are more than 90,000 MOF-structures documented in the Cambridge Structural Database and more than 500,000 have been predicted) [11,12], theoretical studies that normally take several months to be conducted cannot keep up with the speed in which new structures are discovered.
These hybrid, crystalline, porous materials have characteristics that are, in certain aspects, gathered between semiconductor physics and homogeneous photocatalysis. Consequently, they can be thought as solids with well-defined boundaries with the solution, but also as infinite quasi-molecules [13]. It is rather unusual how concepts of coordination chemistry are often mixed with those of semiconductor physics in MOFs literature [14]. This dual nature poses a challenge when addressing classical semiconductor characteristics, such as electrical conductivity a crucial parameter for categorizing conductors, semiconductors, or insulator materials, which is not extensively explored in the context of MOF photocatalysis [14]. Classical inorganic semiconductors have conductivity in the range of to [15-17]. In contrast, MOFs like UiO-66 ( ) and MIL-100(Fe) ( S. ) display significant lower values [ 18,19 ]. This discrepancy raises the question of whether some MOFs should be classified as insulators or semiconductors. It is crucial to recognize that, unlike classical semiconductors with densely packed crystal lattices and continuous pathways, MOFs electrical conductivity relies on charge transfer complexes between their organic and inorganic components [13]. Consequently, the charge carrier mobility is contingent upon the density and dynamics of these hopping states [14]. It should also be considered that the porous structure of MOFs establishes proximity between the photoactive sites and the target species, eliminating the need for charge carriers to migrate toward the material’s external surface (as in most inorganic semiconductors). For this reason, MOF materials can often exhibit higher photoactivities than classical semiconductors even though their conductivity values are significantly smaller [20].
One of the most important characteristics of a semiconductor is whether its optical band gap exhibits a direct or an indirect transition, as this will have direct consequences over the electron-hole dynamics and reactivity upon photoexcitation [21]. Indeed, if a semiconductor has a direct band gap and the electric dipole transition from the valence band maximum (VBM) to the conduction band minimum (CBM) is allowed, the electron-hole pairs will recombine radiatively with a high probability [21]. On the other hand, the recombination is hampered in indirect band gap materials due to the momentum difference in the Brillouin zone between the VBM and the CBM [21]. Therefore, semiconductors with indirect band gap are expected to exhibit higher photoactivities when compared to those with direct gaps.
For inorganic semiconductors, this band gap is frequently obtained using the Tauc plot applied to the UV-vis data, and the nature of the transition greatly changes the obtained values [22]. However, approaches based purely on this method are not accurate in a general sense, especially for distinguishing direct and indirect band gaps. For dealing with this limitation, researchers often combine other experimental techniques to obtain this information, such as X-ray photoelectron spectroscopy (XPS), ultraviolet photoelectron spectroscopy (UPS), and inverse photoelectron spectroscopy (IPES) [23]. Nevertheless, these techniques are not always of easy access, which hinders a more complete and accurate analysis. For such reason, this paper draws attention to the several studies that have been conducted in the last few decades for
Fig. 1. Scheme showing the different types of optical transitions between the valence band and the conduction band in a semiconductor. In black: allowed transitions. In red: forbidden transitions. Solid arrows represent direct transitions and dotted arrows represent indirect ones. The coefficient depends on the electron transition exhibited by the material – e.g., indirect allowed transition ( ), direct allowed transition ( ), indirect forbidden transition ( ), and direct forbidden transition ( ).
assessing the electronic structure of Metal-Organic Frameworks. It also discusses the reliability of the obtained results and their respective methodologies, proposing a combination of methodologies for determining band gap energies and types purely from diffuse-reflectance UV-vis data, which should reduce the gap between experiment and theory in the MOF realm.

1.1. The band gap theory in UV-vis spectroscopy

Different classes of materials such as metals, semiconductors, and insulators can be distinguished by the energy distribution of their electronic states near the Fermi level [24,25]. In metals and other conductive materials, the Fermi level lies inside at least one band; whereas in semiconductors and insulators it is situated in an energy range where no electronic state can exist [26]. This region, commonly known as band gap ( ), refers to the energy difference (usually in eV ) between the VBM and the CBM. In other words, it represents the minimum energy necessary ( ) to promote an electron bounded to an atom to a conduction electron, which is free to move through the crystal lattice, serving as charge carrier.
For instance, semiconductors have the capacity to absorb photons with a certain amount of energy and use it to excite electrons from the valence band (VB) to the conduction band (CB) [27]. Several studies were conducted aiming to obtain compounds with narrower band gaps, which allows the excitation of electrons within the visible light and near-IR region [28-31]. This feature is greatly desired for the environmental remediation of different pollutants since those materials can be photoactive under solar light, which guarantees a better reaction yield for compounds with reduced [32]. However, wider band gaps are also envisaged in other applications, such as optoelectronic and energy harvesting [33]. For this reason, the assessment of the band gap energy of semiconductors is crucial to the study of such materials, especially in the photocatalysis field.
These optical transitions can present changes in the electron wavevector or not. Here, it is worth mentioning that direct and indirect transitions are characterized by the momentum difference in the Brillouin zone between the minimal-energy state in the CB and the maximal-energy state in the VB [34,35], as schematized in Fig. 1. If those states occur in different k -vectors, the material has an indirect
Fig. 2. Scheme representing the optical absorption spectra at 0 K for a crystalline material with direct (left) and indirect gaps (right). The energy for the onset of the direct transition is displayed in blue and for the indirect transition, in orange. Copyright © 2005 John Wiley & Sons, Inc. Used with permission from Ref. [38].
band gap and the transition is labeled as “phonon assisted”, since almost all the change in the momentum of the system is transferred from a phonon [35]. On the other hand, if the momentum of the charge carriers is preserved, a direct band gap is ascribed to the compound and only photons are involved in the transition [35]. According to the selection rules for optical transitions [36,37], the transitions are allowed (higher probability) or forbidden (lower probability), which affects the measurements for quantifying .
In an ideal scenario, at absolute zero temperature (with no phonons available), the optical absorption plotted versus the photon energy has a different behavior for crystals with direct and indirect gaps, as demonstrated in Fig. 2. At first, in materials with direct gaps, the band edge determines the gap energy as there is no significant change of and therefore, [38]. However, in indirect band gap materials, the band edges of the VB and CB are widely separated in the space. For this reason, a phonon with energy and wavevector has to be emitted for the transition to take place. As a consequence, the optical absorption is weaker near the band edge [38]. In such systems, the energy necessary for the indirect process to occur is greater than the true band gap – as it needs to be partially used to emit a phonon – and the absorption threshold for the indirect transition between the VB and the CB is at (Fig. 2) [38]. Finally, at higher temperatures, if a phonon is absorbed along with a photon, the transition takes place at [38].
In both the direct and indirect band gaps, the absorption coefficient is expected to be zero for energy values smaller than the band gap of the material, as indicated in Eq. (1). For direct and indirect band gaps, there are significant differences in the relation between and , as highlighted in Eqs. (2) and (3), respectively,
where represents the energy of a phonon. Due to these relationships, the band gaps can be determined by measuring the absorption coefficient. If the gap is direct, can be assessed through the extrapolation of the linear least squares fit of in a ” versus ” plot that intercept the -axis [34]. Similarly, if the band gap is indirect, can be obtained by the extrapolation of the linear least squares fit of to zero, in a ” versus hy” plot [34]. However, this semi-classical approach presents some failures at low temperatures (since no Coulomb attraction is taken into account), in materials presenting defects and impurities (due to extrinsic absorption), and for energies [34]. Also, some other
effects such as local temperature [39], external strong electric or magnetic fields [40,41], and doping-alloying effects should be considered as they can influence the profiles [34].
When structural-electronic disorder is present (for amorphous semiconductors, for example), the determination of the band gap from optical absorption requires other methodology, especially due to the presence of tail states nearby the VB and the CB [34]. Such approach was first proposed by Tauc [42] by imposing some restrictions to the optical absorption processes, such as considering an absence of k -vector conservation, a constant momentum transition matrix element, and a density of electron states close to the VB and CB that is proportional to the square root of the photon energy. During the study, Tauc [42] evaluated the optical properties and the electronic structures of amorphous germanium, and showed that there are regions in which is linearly dependent on the photon energy ( ), where is the reduced Plank constant ( ), is the photon angular frequency (rad.s ), and is the imaginary part of the relative permittivity. is defined according to the Eq. (4),
in which is the refractive index and is the extinction coefficient. In this context, Tauc et al. [42] verified an absorption band represented by a straight line where . They demonstrated that the band gap of the material can be obtained through the intercept between the extrapolation of this line and the photon-energy axis. The authors also verified that in this case only the energy is conserved (electron and photon) but not the momentum ( k -vector), which is indicative of an indirect transition [42].
The optical and electronic properties of amorphous semiconductors were further investigated by Davis and Mott in more general systems [43]. They proposed a relationship that offered the best fit to the optical absorption edge by considering the conductivity at a certain angular frequency , according to the Eq. (5). Then, from the plot of against the photon energy , where is the absorption coefficient , a linear region was obtained and extrapolated to the abscissa axis to assess the value.
A relation was further stablished between the measured absorbance and the energy, showing that the optical absorption strength depends on the difference between the photon and the band gap energy as represented in Eq. (6) [44]. In this case, is the Plank constant (4.1357 is the photon frequency (Hz), is the slope of the Tauc plot in the linear region, and depends on the electron transition exhibited by the material (Fig. 1) – e.g., indirect allowed transition (
Table 1
Available methods for obtaining the absorption coefficient ( ) using UV-vis data. is the thickness of the sample, is the transmittance, is the reflectance, is the diffuse reflectivity of a non-absorbing material, and are the Kubelka-Munk absorption and scattering coefficients, respectively.
Method Formula Considerations
Bouger-LambertBeer [52-54] Does not consider the reflectance
Pankove [55] Considers that the product is large
PankoveVahalová [55, Includes internal reflections for small values of
56]
Kubelka-Munk [57] Considers a two-flux radiation model
), direct allowed transition ( ), indirect forbidden transition , and direct forbidden transition .
Although the Tauc method was originally developed for the evaluation of absorption in amorphous semiconductors, it is extensively applied for assessing the band gap of crystalline thin films [44] and nowadays, it is commonly used for other types of crystalline materials as well – such as powdered and ZnO [45-47]. Dolgonos, Mason, and Poeppelmeier [48] emphasized that the Tauc plot is only applicable to materials in which a localization of energy states can be assumed (which is the case of amorphous materials and nanoparticles), indicating that the method is inappropriate to deal with crystalline and/or highly-doped semiconductors. However, a recent study demonstrated that the linearity of the Tauc plot obtained for nanocrystals is not as significant when compared to that of bulk materials [45]. This last feature was ascribed to the discretization and blueshift of the energy spectrum from the electronic states, but also to the relaxation of the momentum selection rule which cannot be considered for crystals with considerably small size [45].
The usual procedure for a Tauc analysis consists in acquiring optical absorbance data and plotting versus , while testing the -values ( or ) until the best fit is obtained for the absorption edge, allowing to assign the correct type of the optical transition to the material [44]. This analysis is not always obvious. The assignment is often difficult for materials with flat bands and, even sometimes for materials with dispersing bands [49]. In addition, some compounds present a pre-edge absorption in their UV-vis spectra, which can influence the interpretation and the accuracy of the band gap estimation [50]. Also, Coulter and Birnie [44] highlighted that materials that exhibit indirect band gaps may also present direct transitions at higher energies, which would justify the acquisition of both values (for and ). This means that both direct and indirect transitions can happen in all semiconductor materials if the energetic conditions are favorable [47].
In view of all the previously mentioned situation that led to deviations from the Tauc theory, other methodologies have been proposed for assessing the band gap energies from UV-vis data. For instance, Cody et al. [51] adopted a methodology that assumes a constant dipole transition matrix element, where is obtained from the extrapolation of the linear least squares fit of to zero in a ” versus ” plot (normally, ). Another approach was proposed by Zanatta [34], which reported a method to obtain by fitting a sigmoid (Boltzmann) function to the optical absorption spectra of crystalline (plate-like and powdered samples) and amorphous , and GaAs compounds. In that study it was concluded that, regardless of the method, the absorption coefficient ( ) or absorbance is one of the most
Fig. 3. Scheme of the Kubelka-Munk model for the reflectance and transmittance of a finite thick plane-parallel light-scattering specimen (thickness placed in contact with a background substrate with known reflectance ( ), transmittance ( ) and absorbance ( ). is the intensity of the incident radiation, is the light flux that flows through the illuminated surface, is the light flux flowing back to the illuminated surface, is the fraction of the incident light transmitted by the substrate, and is the total reflectance of the system.
important physical parameters for evaluating the band gap. Table 1 shows precisely that the band gap values are independent of the model.
Other techniques can be also combined for evaluating the band gap of semiconductors [14]. For instance, the VBM can be obtained by combining X-ray photoelectron spectroscopy (XPS), ultraviolet photoelectron spectroscopy (UPS), and photoelectron spectroscopy in air (PESA); while the CBM can be assessed through inverse photoelectron spectroscopy (IPES) [23,58-61].
The Kubelka-Munk theory is the most applied method for obtaining “absorbance” spectra from diffuse reflectance data [57]. The model is based on a radiation field inside a light-scattering sample, where two fluxes cross an arbitrary section ( ) in opposite directions (Fig. 3) [62]. In fact, the well-known K-M function – – was obtained by applying some boundary conditions to this system (such as considering samples as infinity thick), resulting in Eq. (7) [63].
The Kubelka-Munk transform is regularly used in solid-state spectroscopy measurements as, in this case, the samples are often opaque and can be considered as an infinitely thick coating [47,64]. However, for diffuse reflectance UV-vis spectroscopy the samples are regularly measured in their natural particulate state. Thus, this previous assumption becomes incorrect and higher deviations from linearity are observed [65]. In fact, the K-M theory exhibits high deviations from experimental data when the reflectance values are below 0.13) [66]. For instance, Landi et al. [67] demonstrated that a thickness of about 0.5 mm is not sufficient for applying the K-M function in diffuse reflectance UV-vis data acquired for nanoparticles. However, even though the Kubelka-Munk theory is considered as a pseudo-absorption function [34], it is widely accepted nowadays for evaluating the band gap energies of most semiconductor materials through diffuse reflectance UV-vis measurements [47]. On the other hand, in several cases, researchers use the function as an empirical pretreatment to the data in order to normalize it [65].

1.3. Assessment of the band gap energy in MOF materials

MOFs are a relatively new class of materials, composed by inorganic clusters connected to each other by organic linkers thus, forming a hybrid crystalline structure with high porosity and high Specific Surface Areas (SSAs) [68]. One of the most interesting features of MOFs is the possibility of chemically modifying them, either by decorating their pores with nanoparticles, by functionalizing their linkers with different organic groups, by replacing their metal sites, or even by creating defects on their structures [68]. These characteristics, coupled with the enormous possibilities of combining different organic linkers and metal sites, allow the formation of several structures with distinct charge transfer complexes (CTC) upon UV-vis excitation – considering the inorganic cluster, the organic linker, and other guest species. For instance, Linker-Based Transition (LBT) [69,70], Metal-Based Transition (MBT) [71], Linker-to-Linker Charge Transfer (LLCT) [72], Metal-to-Metal Charge Transfer (MMCT) [73], Metal-to-Linker Charge Transfer (MLCT) [74], and Linker-to-Metal Charge Transfer (LMCT) [69] are some of these CTC that were already observed in different MOF systems.
When dealing with these hybrid materials in photocatalysis, the concepts between semiconductor physics and homogeneous photocatalysis are often mixed [14]. Kolobov, Goesten, and Gascon [14] highlighted how unusual it is to mix coordination chemistry notions (such as LMCT) to others from semiconductors physics (such as conduction band) as it happens in MOFs literature. However, this happens because of the dual character of these hybrid materials. For instance, the alignment of the electronic bands in MOFs (semiconductor physics) can be manipulated by functionalizing their linkers (coordination chemistry), similarly to what occurs in solution [75]. The proximity of the MOFs from the solution state lies specially on the fact that these materials have a great volume of pores which are, routinely, filled with solvent molecules [14]. However, in some cases, they can also behave like nonmolecular semiconductors in photovoltaics, especially when considering their curvature maxima (VBM and CBM) and also their conductivity, even though this last feature is not much explored in the field of MOFs photocatalysis [14]. For these reasons, some concepts were adapted for dealing with such systems, worth mentioning the use of HOCO (Highest Occupied Crystalline Orbital) and LUCO (Lowest Unoccupied Crystalline Orbital) instead of the well-known nomenclatures used for molecules (HOMO – Highest Occupied Molecular Orbital and LUMO – Lowest Unoccupied Molecular Orbital) [69].
Due to the wealth of topologies and electronic structures in MOFs, they are particularly well-adapted compounds to study the procedures for determining band gaps. Several MOFs were synthesized during this work – UiO-66(Zr), UiO-66(Hf), UiO-66(Zr/Ti), UiO-66(Hf/Ti), UiO-67 (Zr)_NH2, UiO-67(Hf)_NH2, UiO-67(Zr/Hf)_NH2, MIL-125(Ti), and MIL125(Ti)_NH2 – and characterized by XRD and diffuse reflectance UV-vis spectroscopy. Other structural characterizations were conducted in previous works, worth mentioning sorption isotherms, Raman, FTIR, and EPR spectroscopies [70,76,77]. The band gap energies were assessed by different methods and the obtained results were further compared with other reports found in the literature.

2. Materials and methods

Syntheses: The synthesis procedures for all the MOFs presented here are described in the Supporting Information file.
X-ray diffraction: Powder X-ray Diffraction (PXRD) experiments were done using a SmartLab Rigaku diffractometer equipped with a 9 kW rotating anode X-ray generator ( ), endowed with a HyPix-3000 hybrid multi-dimensional pixel detector, using capillaries in parallel transmission geometry. The scans were performed in the range , with a step size of , and a speed of . Single crystal X-Ray Diffraction experiments were done using a Bruker Kappa Apex Duo diffractometer equipped with a two-dimensional CCD 4 K
Table 2
Textural and physical chemical properties of the compounds synthesized in this work displaying the atomic ratio, the crystallite size, the , and the microporous volume.
MOF Metal content ICP-OES Crystal size SSA ( ) Microporous volume ( )
UiO-66(Zr) 0.10 0.25 33 0.60(3)
UiO-66(Hf) 0.18 3.33 0.41(3)
UiO-66(Zr/Ti) 0.10 – 0.47(5)
0.25 28
UiO-66(Hf/Ti) 0.20 – 0.30(9)
0.34
UiO-67(Zr)_NH2 32-51 36 0.68(4)
UiO-67(Zr/Hf) 105-140 0.65(7)
34
UiO-67(Hf)_NH2 24-44 0.48(4)
MIL-125(Ti) 0.76 – 0.60(4)
1.32 34
MIL-125(Ti) 3.2-5.3 0.51(4)
_NH2 26
detector and 2 m -sources ( Mo and Cu ).
Inductively coupled plasma – optical emission spectrometry: Inductively coupled plasma – optical emission spectrometry (ICP-OES) experiments were conducted using an Agilent 5110 ICP-OES spectrometer in radial sighting mode. The mineralization of the samples was performed using 100 mg of the activated UiO-66 compounds. First, the powdered samples were digested using a solution containing 10 mL of HF and 5 mL of and then they were heated to for 48 h , followed by a dry evaporation step. Next, they were etched with aqua regia ( for 24 h and dried to a residue of 0.5 mL Finally, 9.5 mL of water was added and, after filtration, the solution was diluted at before being analyzed.
Surface area measurement: sorption was performed at liquid nitrogen temperature ( 77 K ) using a Micromeritics ASAP2020 apparatus. UiO-66, UiO-67_NH2, MIL-125, and MIL-125_NH2 samples were previously degassed under vacuum at , and , respectively. The specific surface area and pore size distribution of the examined samples were evaluated by the multipoint BET (Bru-nauer-Emmett-Teller) model in the range.
Scanning Electron Microscopy: SEM was conducted on a FEG microscope (Hitachi SU 5000) at an accelerating voltage of 5 kV , using samples previously sputter-coated with carbon.
Infrared spectroscopy: FTIR was performed on a Perkin Elmer Spectrum 2 spectrometer using an attenuated total reflectance (ATR) accessory and a diamond crystal as the reflective element. The spectra were taken at a resolution of and 128 scans.
Nuclear magnetic resonance spectroscopy: Liquid NMR spectroscopy was performed in a Bruker AVANCE III HD 300 MHz spectrometer via a 60 -position Sample Xpress autosampler. The chemical shifts were referenced by the external resonance of the tetramethylsilane. The sample digestion was performed using 10 mg of the UiO-66 compounds. The material was soaked into 1 mL of a solution and sonicated for 15 min . Then, 0.6 mL of the liquid was recovered by filtration and placed into a 5 mm NMR tube before being analysed at 8 scans.
Diffuse reflectance UV-vis spectroscopy: The UV-vis experiments were carried out on a Varian Cary 5000 spectrometer using Praying Mantis Diffuse Reflection Accessory adapted for the characterization of powder samples. The spectra were recorded in the spectral range with a resolution of 1 nm . The diffuse reflectance spectra were plotted as well as the and the Kubelka-Munk function.
Band gap evaluation: The band gap energies were first evaluated by diffuse reflectance UV-vis spectroscopy. was estimated by different
methods, worth mentioning the extrapolation of the diffuse reflectance curve R [34], the extrapolation of the K-M curve , the extrapolation of the curve, the Cody’s band gap [51] [ versus ], the indirect band gap [ versus ] [34], the direct band gap [ versus ] [34], the Tauc’s indirect band gap [ versus ] [42], the direct version of Tauc’s band gap [ versus ] [35], and the sigmoid-Boltzmann function [34]. The values were also determined using the Kramers-Kronig transformation from the UV-vis raw data.

3. Results and discussion

3.1. Characterization of the pristine materials

For facilitating the discussion of this paper, the main properties of the materials obtained here are displayed in Table 2. The quality of the synthesized MOFs was characterized by their PXRD patterns (Fig. S2), crystallographic parameters (Tables S2-S4), ICP-OES (Table 2), sorption (Fig. S3), SEM images (Fig. S4), FTIR spectroscopy (Fig. S5), and liquid NMR (Fig. S6). These characterizations were all in accord with other works from the literature, showing that the compounds were successfully synthesized. Most compounds exhibited type-I isotherms according to IUPAC classification, which is characteristic of microporous materials. exhibited a mixture of type-I and type-IV isotherms, indicating the presence of mesoporosity within the compound. This effect can be related to the agglomeration of the nanoparticles and to defect formation. The SSA values are all in accord with previous reports from literature [78-82]: , UiO-66(Hf) , UiO-67(Hf)_NH2 , MIL-125(Ti) = , and MIL-125(Ti)_NH2 . SEM images of UiO-66 and UiO-67 materials show crystal morphology of typical aggregates with octahedral shapes that are characteristic of these compounds [79,83]. MIL-125(Ti) exhibited crystallites that are analogous to truncated square pyramidal morphology and MIL-125(Ti)NH2 formed tetragonal plate shapes, which are also characteristic of these materials [80,84]. FTIR spectroscopy was able to identify different vibrational modes for the nine compounds. Their spectra can be divided into three regions: from 400 to , where the absorption bands are mostly related to inorganic cluster vibrations; from 700 to , where the interaction between the organic linker and inorganic node is observed; and from 900 to , where only organic linker vibrations are active. Because UiO-66 solids are characterized by the presence of structural defects that may affect the UV-vis absorption features, the missing BDC linker content was evaluated using liquid NMR spectroscopy (Fig. S6). Actually, the formate (coming from the deprotonation of formic acid used as modulator in the syntheses process and also from the degradation of DMF) is able to partially substitute the BDC linker by generating defects of organic ditopic linkers. When a dicarboxylate linker is removed from the UiO-66 structure, it leaves the coordinating site with metallic centers available for two monotopic formate molecules instead. Considering these two types of coordination modes (monotopic versus ditopic), if the molecular formula for the pristine UiO-66 compound is represented by [ ] ( ), the absence of ditopic linkers creates carboxylate defects. Therefore, considering the presence of formate , the experimental molecular formula must be written as . With that in mind, the integration of the NMR signal related to the formic acid was compared to that of the BDC linker for the four UiO-66 compounds. The , , and samples were found to exhibit 9.5, 7.0, 11.2, and 11.2 % of missing BDC linkers, respectively (Fig. S6). These results show that the number of defects in the samples increase in the presence of titanium. Similar characterizations were performed in a previous work using the UiO-67 samples, for which no correlation between the structural defects and the metal content was observed [76].
Fig. 4. (a) diffuse reflectance UV-vis, (b) , and (c) Kubelka-Munk data obtained for UiO-66(Zr), UiO-66(Hf), MIL-125(Ti), and MIL-125(Ti)_NH2. The and the spectra were normalized between 0 and 100 for comparative purposes.

3.2. Diffuse reflectance UV-vis spectroscopy

The diffuse reflectance UV-vis spectra obtained for the pristine MOFs synthesized in this work are displayed in Figs. 4 and S7, alongside the and the Kubelka-Munk representation. All the spectra were normalized from 0 to 100 for comparative purposes. The differences when evaluating the diffuse reflectance spectra using the K-M approach and the are clearly visible (Figs. 4, and S7). For instance, regarding the UiO-66 family, the K-M values present a thinner absorption band (between 200 and 320 nm ) and a greater slope near its absorption tail when compared to the data. A similar feature is also present in the spectra of the UiO-67_ , and MIL-125 compounds. This simple difference can, by itself, be a source of misevaluation of the materials’ band gaps, as the extrapolation of these curves to zero ( , and versus ) intercepts the abscissa axis in different values. Moreover, it seems that the K-M method led to spectra that are more consistent when considering their absorption band edges, which are better delimited than those obtained by using the data. Nevertheless, because it is not possible to acquire absorption and transmission UV-vis data for powdered samples without pre-treatment,
Fig. 5. Demonstration of how to assess the band gap value using the extrapolation of the curve obtained from the absorption band recorded for UiO-67(Zr) _ . (a) indirect band gap with baseline correction; (b) direct band gap without baseline correction.
the K-M and the approaches are the best possible approximations for the in this work.

3.3. Band gap evaluation: Cody, Tauc, and direct/indirect methods

When evaluating the UV-vis spectra of different semiconductors, it is common to come across materials that exhibit a sub-band gap energy especially in the case of defected, doped, bulk or surface modified materials. These modifications create intra-band gap states that reflect in their absorption spectra by forming an Urbach-like tail, which influences the band gap assessment by different methods [50]. In these cases, the curves need a baseline correction before being evaluated at the -axis intercept point, as discussed by Makuła, Pacia, and Macyk [50]. This conclusion was reached by studying a dye modified semiconductor, where the system was measured by placing barium sulfate mixtures grounded separately with titania and methyl orange [50]. In a first step, these mixtures were placed side by side in the holder and then, in a second step, they were mixed and evaluated in a system where both components can interact [50]. In this last case, the authors verified that the resulting spectrum is not a simple sum of the individual spectra, but a linear combination of both [50]. This result can be extrapolated to hybrid materials as their different components (in this case the inorganic clusters and organic linkers) can lead to a spectrum whose contributions cannot be fully resolved. This feature can be easily identified in the spectra as, in these cases, the curves exhibit a smooth rise from the -axis before reaching the linear region. On the other hand, the baseline correction is not necessary if the linear region appears right after a sudden rise of the curve from the abscises axis. Hence, a pre-treatment must be conducted in the cases where the compound presents a pre-absorption edge, as represented in Fig. 5. The Tauc plots obtained
Fig. 6. Band gap energies assessment using the Kubelka-Munk function for UiO-66(Zr), UiO-66(Hf), MIL-125(Ti), and MIL-125(Ti)_NH2 materials. (a) Cody band gap; (b) indirect band gap; (c) Tauc indirect band gap; (d) direct band gap; (e) Tauc direct band gap.
Table 3
Band gap values (eV) assessed through the plot of , and versus the photon energy .
Method UiO-66 UiO-67_NH2 MIL-125
Zr Hf Zr/Ti Hf/Ti Zr Zr/Hf Hf H
R 4.20 4.14 4.09 3.97 3.08 3.04 3.08 3.88 3.00
F(R) 3.98 3.93 3.89 3.94 2.83 2.88 2.90 3.75 2.69
(F(R)/h 3.95 3.88 3.74 3.74 2.84 2.89 2.92 3.67 2.54
3.96 3.89 3.78 3.79 2.85 2.92 2.90 3.67 2.52
3.96 3.90 3.79 3.82 2.85 2.91 2.92 3.67 2.53
4.05 4.04 4.00 4.04 2.92 2.95 2.98 3.82 2.80
4.06 4.03 4.02 4.05 2.93 2.96 2.98 3.81 2.80
from UiO-67(Zr)_NH2 absorption band exhibit a linear region when considering both indirect (Fig. 5a) and direct (Fig. 5b) band gaps. However, to guarantee a better fitting of the Tauc function, it should be noted that a baseline correction is required before the extrapolation of the curve in the case of indirect band gap. In order to do this, a tangent line is traced to the curve in the region just before the linear region of the indirect plot. The band gap value is then assessed using the position of the intercept between this tangent line and the one coming from the linear region (Fig. 5a). This correction is also needed for the Cody band gap and for the direct and indirect methods.
To determine if a compound has a direct or an indirect band gap in the absence of calculations, it is recommended to plot both the direct and indirect band gaps as a function of the photon energy [34]. The plot exhibiting a clear linear region should be considered as the best fitting and therefore, is presumed to be the correct band gap type [34]. A difference on the optical absorption spectra may also report if a material displays a direct or an indirect gap. In fact, for direct gaps, there is a sudden step rise in absorption (see spectra of UiO-66 compounds in Figs. 4 and S7), whereas for indirect gaps there is first a small gradual rise in a frequency range, followed by a sudden rise in absorption (see spectra of MIL-125(Ti)_NH2 in Fig. 4) [85]. In this last case, the frequency at which the absorption coefficient starts rising gradually is the measure of the indirect gap [85]. However, this determination is not as simple as it seems. For instance, the electronic structure of the UiO-66 compound has been deeply evaluated in different works and it was concluded that UiO-66(Zr) exhibits a direct band gap [86,87]. This observation was further confirmed by Yasin et al. [88], who found by DFT calculations and experiments that substituting zirconium by hafnium in UiO-66 does not change the band gap type, which is direct regardless the metal. Still, it is possible to find several studies that consider the UiO-66 materials as presenting an indirect band gap [89, 90]. These controversies are especially common in the realm of MOFs, since most of these compounds exhibit linear regions regardless the type of plot (direct or indirect) that is considered (Figs. 6, S8, and S9). This feature demonstrates the necessity to consolidate a method to determine if a material has a direct or an indirect band gap only by means of experimental data. Aiming to address this issue, the band gap energies of the MOFs synthesized here were assessed using different approaches by means of the Kubelka-Munk function, as represented in Table 3 and in Figs. 6 and S8. In this case, the band gap was accessed from the tangent line to the absorption band edge until it intercepts the abscissa axis at the value. In the case of Tauc indirect band gap, Cody band gap, and indirect band gap, a baseline was first considered as discussed before (Fig. 5a). Note that it is mandatory that the -axis starts at zero.
It is reasonable to assume that the first electronic transition observed in a UV-vis spectrum starting from lower to higher energies (in other words, from higher to lower wavelengths) corresponds to the HOCO LUCO transition in crystalline materials [69]. For this reason, it is possible to extrapolate the tangent line to the absorption band edge until it intercepts the abscissa axis and then, transform the wavelength value to electron-volts to find the value for the material. This result is highlighted in Table 3 as method . This approach was conducted elsewhere for MIL-100(Al), and the band gap type was found
to be indirect due to the proximity between the and the values [7]. In MOF systems, this is a more accurate approach than the others presented before, as it relies only on the experimental data and not on partial assumptions (i.e., the best linearity or different step rise in absorption UV-vis data). Interestingly, these values are in between the indirect and the direct band gaps for all the compounds studied here (i.e., and ) [87].
When considering the band gap for UiO-66 samples, all methods end up generating plots with linear regions between 3.5 and 4.5 eV . The values obtained using the Cody, the indirect, and the Tauc indirect methods exhibit a pre-absorption edge and therefore, must be corrected by a baseline – which is also the case for UiO-67_NH and MIL-125 compounds (Figs. 6, S8, and S9). As mentioned before, some works in the literature consider that UiO-66 exhibits a direct band gap, while others assume that it behaves as an indirect semiconductor. In fact, the Tauc direct band gap value for matches to that obtained from DFT simulations ( 4.07 eV ) [87] and also from experimental data . On the other hand, the UiO-66(Zr) Tauc indirect band gap is also similar to that found through experimental UV-vis data elsewhere [90]. Therefore, the acquisition of both direct and indirect values is justified in this case [86,87,89,90].
Other works demonstrate that the presence of hafnium and/or titanium reduces the band gap of the UiO-66 materials [70,89]. However, in the presence of hafnium or titanium, DFT simulations are not as accurate as for the zirconium-based material. In fact, the Tauc direct found for the hafnium-based UiO-66(Hf) using computational data ( 3.74 eV ) [87] is smaller than that obtained from diffuse reflectance UV-vis spectroscopy in this work ( 4.03 eV ) and in previous studies [70]. This feature demonstrates how theoretical band gap calculation can considerably differ from experimental data in many compounds. For instance, the predicted band gap value for a titanium-based was found to be 3.64 eV [87], which is smaller than the energies obtained in this study using the Tauc method: and . Other works also reported similar experimental values for the band gap of material [90].
UiO-67 is another compound that has been found both as direct or indirect semiconductor in different studies [91,92]. It is also a good example of how the Tauc plot can provide a different evaluation of the band gap than other methods. For example, if the baseline correction is not applied to the indirect Tauc plot data, the band gap is found to be around 2.0 eV for UiO-67 [91], which is very different from the predicted value using computational simulation ( ) [87,93] and also from the experimental one ( 3.68 eV ) [94]. Wang et al. [95] accessed the experimental band gaps for a series of zirconium-based UiO- 6,7 , or 8) and using the Tauc plot found a direct band gap of 2.76 eV for , which is close to the value obtained here (Table 3). Contrary to what was observed for UiO-66 [70], the presence of hafnium does not have a great influence on the calculated band gap values for the UiO-67_NH2 samples [76], which can even increase from 2.93 to 2.98 eV when replacing zirconium by hafnium (Table 3). This different behavior is ascribed to a change on the valence band electronic states caused by the presence of the amino group [88]. In fact, replacing Zr by Hf cations
Fig. 7. Optical band gap energies calculated using the Boltzmann regression according to the Eq. (8) by means of the Kubelka-Munk data for (a) UiO-66(Zr), (b) UiO66(Hf), (c) MIL-125(Ti), and (d) MIL-125(Ti)_NH2. The black lines represent the data and the red lines are the Boltzmann regression.
can increase the value of the VBM by adding energy states in the conduction band of UiO-66, which are related to oxygen atoms [88]. However, this effect is not observed in UiO-67_ because the amino group creates mid-gap states that influences the band gap energies, reducing the influence of the metal on the VBM position. This feature was highlighted by Yasin et al. [88] through the plot of the PDOS of the molecular orbitals for UiO-66 and UiO-66_NH2 considering both zirconium and hafnium metals.
Finally, the MIL-125(Ti) has an indirect Tauc band gap that reduces from 3.67 to 2.53 eV after the amino functionalization (Table 3). This result is comparable to that obtained elsewhere [30] and should be related to the same phenomenon as in the case of functionalizing UiO- samples ( or 7 ) with groups. Here, it is clear that the direct and indirect Tauc band gaps are quite similar for both MIL-125 ( (Ti) ) and its amino functionalized version . Moreover, the value obtained directly from the Kubelka-Munk UV-vis spectrum is in between both these direct and indirect values: 3.75 and 2.69 eV for MIL-125(Ti) and MIL-125(Ti)_NH2, respectively. For this reason, both values should be acquired and mentioned when describing the electronic structure of such materials, as discussed before [44].
The data was also applied to access the band gap energies for the different MOFs and the results demonstrate linear regions in which the values can be properly extracted (Fig. S9). However, the obtained results seem to be less accurate when compared to those reported in the literature for all MOFs samples (Table S5) [30,87,89,90, 93-95]. This can be ascribed to the fact that most works dealing with powdered samples use the Kubelka-Munk model to acquire the UV-vis
spectra that is further analyzed to obtain the band gap of the samples. Also, it is clear that the edges of the absorption bands are better defined using the K-M approach than the data (Figs. 4 and S7), which can be another source of error.

3.4. Band gap evaluation: the Boltzmann regression

A more recent method for assessing the band gap of semiconductor materials was proposed by Zanatta [34], which evaluated the reliability of the sigmoid-Boltzmann function represented in Eq. (8) by fitting collected data from the spectra (Table 1). Here, and are the maximum and minimum absorption coefficients, is the energy coordinate (abscissa axis) in which the absorption coefficient is in halfway between and , and is related to the slope of the sigmoid curve.
It was suggested that the value can be understood as a central energy around which most optical transitions take place (depending on the nature of the band gaps and on the presence of disorders) [34]. For such reason, the band gap energy values should be presented by a Gaussian-like distribution with average energy , standard deviation , and Boltzmann factor , according to Eq. (9). is obtained from the histogram corresponding to an extensive data collection considering standard deviations of 0.1 or 0.2 and is highly influenced by the type of transition exhibited by the material [34].
Table 4
Band gap energies (eV) calculated from Eq. (9) considering the values obtained from the K-M function and using and .
Method UiO-66 UiO-67_NH2 MIL-125
Zr Hf Zr/Ti Hf/Ti Zr Zr/Hf Hf H
4.11 4.07 4.18 4.49 2.99 2.98 3.01 3.87 2.90
0.056 0.067 0.171 0.215 0.111 0.061 0.065 0.058 0.103
4.06 4.01 4.03 4.30 2.89 2.93 2.95 3.82 2.81
3.91 3.84 3.58 3.74 2.61 2.77 2.78 3.67 2.54
Fig. 8. Optical band gap energies obtained using different methods: extrapolation of the reflectance curve , extrapolation of the Kubelka-Munk curve , Cody’s band gap , indirect band gap , Tauc indirect band gap , direct band gap , Tauc direct band gap , and Boltzmann fit of the spectra . The horizontal lines represent values obtained for the (orange) and for the (green) when considering and , respectively. The vertical arrows represent the distance between and (orange) and (green).
Following this reasoning, the fitting of the Boltzmann function was applied to the Kubelka-Munk (Figs. 7 and S10) and also to the data (Fig. S11) of the different compounds synthesized in this work. When using the Kubelka-Munk function, the obtained correlation coefficients ( ) values for the Boltzmann regression are all above 0.99, showing the good agreement between the experimental K-M data and the empirical method. However, the fit of the Boltzmann regression for the data exhibited lower coefficient of determination for most
compounds, which is ascribed to the inferior accuracy of this approach when dealing with diffuse reflectance UV-vis data.
After fitting the diffuse reflectance UV-vis data to the Boltzmann function, the was obtained for each compound considering the Kubelka-Munk function (Table 4) and the data (Table S6). In its original work, Zanatta [34] verified that the value obtained for is independent of the applied methodology for assessing the absorption coefficient – i.e., – revealing that it should be also unaffected to measurements or data treatment details such as improper different spectra correction, for example. This result was found
to be inaccurate in the case of MOFs, as the values obtained from the Kubelka-Munk differ from those found using the approach (Tables 4 and S6).
The band gap energies obtained by the different methods can be separated into groups with similar values depending on the type of the transition (Figs. 8, S12, and S13). Note that the energies obtained by the Cody band gap were always situated in the indirect band gap region, and the raw diffuse reflectance data overestimated the values in most cases. Also, the direct and indirect band gaps are closer in the case of UiO-67_ when comparing to the other compounds. The energies evaluated using the K-M data were also overestimated and are closer to the direct band gap energies for all the compounds, as demonstrated in Fig. 8. This parameter was also preserved for most of the compounds when using the data with the exception of the UiO-67_NH2 materials (Fig. S13). This is ascribed to the worse fit of the Boltzmann function, as verified by the inferior correlation coefficient in these cases (Fig. S11). Finally, in order to verify if the gap in these MOF systems can be evaluated similarly to other semiconductors as proposed by Zanatta [34], and were calculated according to the Eq. (9). The empiric values were obtained from a large data collection considering powdered samples with direct ( ) and indirect ( ) band gaps [34]. The values were extracted from the fitting of the Boltzmann function to the experimental data, and the obtained values are displayed in Tables 4 and S6.
When analyzing the calculated and and comparing them to the other methods, four different scenarios were identified. In the first scenario, there is a match only between the values and the direct band gaps – i.e., , and . In the second case, only the corresponds to the experimental values, as for the material. In the third situation, none of the groups matches the Boltzmann regression, but the lies in between the two regions (direct and indirect), as observed for the entire UiO-67_ series (Fig. S12). Finally, for MIL-125(Ti) and MIL-125(Ti)_NH2 compounds, both the and are close to the direct and indirect band gap regions, respectively. These different behaviors provide first evidence for determining the type of optical transition exhibited by the material.
For instance, in the case of the and , the proximity of the energies to those obtained by using the and plots (Fig. 8) supports the statement that UiO-66(M) ( or Hf) has a direct band gap, which is consistent with other reports and computational simulations [79,87]. Then, after introducing titanium, the values acquired for the direct band gap follow better the Boltzmann regression (Fig. 8), even though the indirect values are closer to that reported in the literature [87]. This discrepancy is ascribed to the use of the Tauc plot (with different coefficients: or ) without a previous consideration of the band gap transition type, which highlights the importance of obtaining such information from experimental data. On the other hand, the presence of titanium in UiO-66 ( ) seems to modify the type of band gap observed for the UiO-66 materials from direct to indirect. In fact, there is a better agreement between the and the plot for this compound, inferring that the Ti-doping can alter the band gap type observed for the UiO-66 materials from direct to indirect in some cases, as mentioned before [89, 90]. Similarly, when considering the UiO-67_ compounds, the was found to be closer to the values obtained for direct band gaps (Fig. S12), which is also a signal that these materials exhibit direct electronic transition upon excitation. Finally, for MIL-125(Ti) and MIL-125(Ti)_NH2, both and agree with the energies obtained from other methods. MIL-125(Ti) exhibited an that compares to , and comparing to
3.67 eV ; whereas MIL-125(Ti)_NH2 presented an while , and while . Therefore, it is not possible to infer whether these materials present a direct or indirect band gap based only on the energies obtained by the Boltzmann regression, which accentuates the necessity to acquire both values in this case.

3.5. Band gap evaluation: complex dielectric function and the KramersKronig transformation

The band gap assessment by the different methods presented above (Tauc, Cody, and Boltzmann) takes into consideration the density of states of the material [96,97] and relies on some assumptions. For instance, the Cody band gap considers that the dipole elements in the optical matrix are independent of the photon energy [51]. On the other hand, the Tauc model considers that the momentum is independent of the photon energy in the adsorption edge [98]. However, there is another method named Kramers-Kronig transformation that uses a dielectric transformation, where the optical constants – refractive index , extinction coefficient , and reflectivity – are expressed as functions of the real and imaginary parts of the complex dielectric function ( ), as represented in Eq. (10) [99].
In this case, because the bulk material is spatially independent, it is possible to compare the values obtained to those of classical dipole oscillator models [98,100]. In fact, several attempts to correlate empirical data between band gap energies and resonance frequency of oscillators can be found in the literature [101,102]. For instance, Moss [102] related the refractive index to the band gap energy and was able to fit an empirical law for an enormous range of materials. Other variations of the model were also discussed in the literature, as it is the case of the Ravindra and Reddy’s relationships [103]. In this case, a relationship between the band gap and the refractive index was proposed for semiconductors. It can also be mentioned the atomic approach of Moss [102], the nearly free electron model of Penn [104], the oscillator concept of Wemple [105], and the optical polarizability approach of Finkenrath [101]. Finally, Hervé and Vandamme [100] further expanded the Penn model based on covalent and ionic bonds within the semiconductor material, creating a mathematical basis for the above mentioned models.
The real and imaginary parts of the dielectric function allow the determination of the macroscopic optical parameters (such as reflectivity, absorption coefficient, refractive index, and penetration depth) . For instance, the real and imaginary parts of the dielectric function can be related to the extinction coefficient ( ) and the refractive index , which are functions of the frequency -according to the Eqs. (11) and (12).
In order to describe the spatial independence, the complex transformation of the dielectric function is conducted in a polar coordinate system. It is then possible to express the Penn model with only two parameters with spatial independence (i.e. an infinite inhomogeneous medium), as in Eq. (13) [106].
The Kramers-Kronig [107,108] transformation (K-K transformation) is of an extremely importance, as it can be used to obtain the extinction coefficient ( ) and the refractive index ( ) of the material through diffuse reflectance spectra, as highlighted in Eqs. (14) and (15) [109], where, is the diffuse reflectance data (normalized from 0 to 1 ).
Fig. 9. Dispersion-dissipation versus energy plots for (a) UiO-66(Zr), (b) UiO-66(Hf), (c) MIL-125(Ti), and (d) MIL-125(Ti)_NH2. The absorption edge corresponding to the discontinuity at is represented as a blue region.
The inovation in using the K-K aproach lies in the fact that the real and imaginary parts of the complex reflectance are related via causality and therefore, the unknown phase shift angle can be obtained using the Hilbert transform. In summary, the Kramers-Kronig relations are a general property of response functions that can be traced back to the causality principle [107,108]. The imaginary part of a response function describes how a system dissipates energy, since it is in phase with the driving force. The Kramers-Kronig relations imply that observing the dissipative response of a system is sufficient to determine its out of phase (reactive) response, and vice versa. In this case, the phase shift angle of the sample is given by Eq. (16), where is the medium frequency on the range of the collected spectra [109].
The dispersion-dissipation and – plotted against the photon energy (h ) characterises the optical properties of the material since in the region where [109]. In fact, for semiconductor materials, the vs ( ) plot exhibits a discontinuity and a phase shift when [109]. This effect was attributed to a polarization effect in semiconductors and insulators [110]. The discontinuity observed in the vs ( ) plot for the MOF materials (Figs. 9 and S14) confirms therefore their semiconductor character.
Finally, combining Eqs. (11) to (16) and the Tauc method (Eq. (6)), Eq. (17) can be derived, which relates the band gap energies ( ) to the refractive index and to the photon energy , where is the vaccum permeability [109].
Fig. 10. Band gap energies calculated for (a) UiO-66(Zr), (b) UiO-66(Hf), (c) MIL-125(Ti), and (d) MIL-125(Ti)_NH2 compounds by using the Kramers-Kronig transformation through the plot of versus . The red line highlights the position where the values were assessed. This line has a positive slope for direct band gaps and a negative slope for indirect band gaps.
Table 5
Band gap energies calculated using the Kramers-Kronig transformation, comparison with the average for direct and indirect values , and percentage of error between and .
MOF
Direct [eV] Indirect [eV] direct [%] indirect [%]
[eV]
UiO-66(Zr) 4.20 4.07 3.94 3.2 6.6
UiO-66(Hf) 4.39 4.04 3.86 8.6 13.7
UiO-66(Zr/Ti) 4.35 4.05 3.69 7.4 17.9
UiO-66(Hf/Ti) 4.41 4.17 3.73 5.8 18.2
UiO-67(Zr)_NH2 3.22 2.93 2.76 9.9 16.7
UiO-67(Zr/Hf)_NH2 3.13 2.96 2.86 5.7 9.4
UiO-67(Hf)_NH2 3.13 2.98 2.87 5.0 9.1
MIL-125(Ti) 3.44 3.83 3.66 10.2 6.0
MIL-125(Ti)_NH2 2.24 2.82 2.51 20.6 10.8
  • direct values were obtained considering the average between the Tauc direct, the pure direct, and the Boltzmann direct band gaps. Indirect values were obtained considering the average between the Cody, Tauc indirect, pure indirect, and Boltzmann indirect band gaps.
A plot of (the inverse of the photon energy ) in the axis versus on the -axis makes explicit a linear regime region which denotates the onset of absorption [109]. The extrapolation of this curve into the -axis corresponds to the inverse of the band gap energy of the material (Fig. 10). The band gap values obtained through the K-K transformation are shown in Table 5, alongside the average values for the direct (Tauc direct, Boltzmann direct, and pure direct) and indirect (Tauc indirect, Cody, Boltzmann indirect, and pure indirect)
methods, and an error between the and each band gap type (direct or indirect).
Interesting information can be obtained when analyzing the band gap and the error values between the band gap energies obtained using the K-K transform and the average value from Tauc, Cody, and Boltzmann methods. First, the Kramers-Kronig approach overestimates the optical band gap for most compounds, except for MIL-125(Ti) and MIL . In addition, the discrepancies observed are closely related to the type of transition, as and can vary by up to an order of magnitude considering the same sample. In general, the energies obtained for the UiO- series were closer to the average values of direct transitions, suggesting that this family of materials exhibits a direct band gap, in agreement with the Boltzmann regression results (Figs. 8, S12, and S 13 ). However, is an exception. It appears to exhibit an indirect band gap when considering the proximity of the but is closer to the direct average when considering the (Tables 3-5). Finally, MIL-125(Ti) and MIL-125(Ti)_NH2 shows a smaller error for the indirect band gap, indicating that this type of transition is favored in these materials. In contrast, using the Boltzmann regression, both direct and indirect band gaps assumptions are reasonable for these two materials.
It is worth mentioning that the use of the complex dielectric function to assess band gap energies of semiconductors must be applied carefully. In fact, since the method considers the inverse plot of energy against ) any variation in the position of the interception line can impact enormously the results – i.e.: for eV ; whereas . Moreover, there are several different regions that present a linear behavior when plotting 1/ against (Figs. 10 and S15). Therefore, there are several places where the tangent connecting the curve to the -axis can be plotted (as in
Table 6
Optical band gap transitions attributions (direct or indirect) considering the average energy values calculated from the Kubelka-Munk transformed UV-vis spectra. Direct transitions considered for the average: “pure” direct and Tauc direct. Indirect transitions considered for the average: “pure” indirect, Tauc indirect, and Cody band gap. The values were compared to the energies calculated using the Boltzmann regression ( and ) and the Kramers-Kronig ( ) transformation.
MOF Boltzmann attribution K-K attribution Conclusion
[eV] [eV] [eV] [eV] [eV]
UiO-66(Zr) 4.06 3.96 4.06 3.91 Direct 4.20 Direct Direct
UiO-66(Hf) 4.04 3.89 4.01 3.84 Direct 4.39 Direct Direct
UiO-66(Zr/Ti) 4.01 3.77 4.03 3.58 Direct 4.35 Direct Direct
UiO-66(Hf/Ti) 4.05 3.78 4.30 3.74 Indirect 4.41 Direct Inconclusive
UiO-67(Zr)_NH2 2.93 2.85 2.89 2.61 Direct 3.22 Direct Direct
UiO-67(Zr/Hf)_NH 2.96 2.91 2.93 2.77 Direct 3.13 Direct Direct
UiO-67(Hf)_NH2 2.98 2.91 2.95 2.78 Direct 3.13 Direct Direct
MIL-125(Ti) 3.82 3.67 3.82 3.67 Direct/indirect 3.44 Indirect Indirect
MIL-125(Ti)_NH 2.80 2.53 2.81 2.54 Direct/indirect 2.24 Indirect Indirect
Fig. 11. Flowchart demonstrating the methodology for determining whether a material has a direct or indirect band gap transition.
the Tauc plot for the tangent extrapolated to the -axis, as discussed above), potentially favoring enormous error in the determination using the K-K transform. Nevertheless, the method is very attractive to confirm the band gap type for different materials. It can confirm results obtained from other methods, such as the Tauc plot (direct and indirect), the Cody (indirect), the pure direct, and the pure indirect approaches.
Finally, the average energy grouping the regions of direct (pure direct, and Tauc direct) and indirect (pure indirect, Tauc indirect, and Cody band gap) transitions were calculated using the Kubelka-Munk model and were compared to other methods (Boltzmann and KramersKronig) for determining the optical band gap type of MOF materials (Table 6). Both Boltzmann and Kramers-Kronig attributions converge for
most materials. In fact, the entire UiO- series is found to present direct band gap transitions, with the exception of , where the analysis was inconclusive (Boltzmann: indirect; K-K: direct). In contrast, both transition types were assigned to MIL-125(Ti) and MIL-125(Ti) considering the Boltzmann regression, while the Kramers-Kronig model was closer to the average energies of the indirect optical band gap. Therefore, these materials are assumed to exhibit indirect transitions. In addition, note that the tangent line connecting the curve to the -axis in the Kramers-Kronig plot has a negative slope for MIL-125 (Ti) and MIL-125(Ti)_NH2 (Fig. 10). This slope is positive for all the other MOF compounds, indicating that it can also be a tool for determining the band gap transition type: for positive slopes, the band gap is direct; for negative slopes, the band gap is indirect.
To sum it up, a complete methodology for determining band gap types by using diffuse reflectance UV-vis spectroscopy in powdered semiconductor materials is proposed (Fig. 11).

4. Conclusions

This work evaluated the different methods to access the band gap of powdered and single-crystal MOF materials by means of diffuse reflectance UV-vis data. The results have been extensively compared to the literature. The Kubelka-Munk approach and the were individually considered when treating the diffuse reflectance data. The results demonstrate that, although the Kubelka-Munk method presents some constraints regarding high absorbent samples, it is more suitable than the approach because it provides spectra with sharper absorption edges, which facilitates the further interpretation and characterization of the band gaps. Several methods were applied to obtain the values of the different materials, worth mentioning the band gap obtained directly from the diffuse reflectance data, from the KubelkaMunk data, from the data, the Cody band gap , the indirect band gap ( ), the Tauc indirect band gap [ ], the direct band gap ( ), the Tauc direct band gap [ ], the Boltzmann band gap, and the Kramers-Kronig band gap. These different approaches were compared with both experimental and computational data from the literature and the limitations of some procedures were emphasized. A comparative method was proposed for determining the type of band gap exhibited by the different materials without needing computer simulations. The Boltzmann regression coupled to the Kramers-Kronig transformation offers a solid base for determining either if a material has a direct or an indirect gap by only comparing the obtained and result with those from the other methodologies (i.e. Tauc direct and indirect band gap). The influence of pre-data treatment and baseline correction were also highlighted in cases where a pre-absorption edge is present, which can lead to a misevaluation of the band gap values. Finally, for some materials such as MIL-125(Ti) and MIL-125(Ti)_NH2, the need of acquiring both the indirect and direct band gap values was also discussed. This work highlights how delicate is determining the nature of the band gap and its value by using UV-vis spectroscopy, which explains the scatter of results in the literature. This study should also contribute to determine band gaps more accurately, leading to more reliability in different areas of chemistry, physics, and materials engineering where these gaps are of importance.

CRediT authorship contribution statement

Pedro H.M. Andrade: Conceptualization, Methodology, Formal analysis, Investigation, Data curation, Visualization, Writing – original draft. Christophe Volkringer: Writing – review & editing, Visualization, Validation, Supervision, Project administration, Funding acquisition. Thierry Loiseau: Writing – review & editing, Visualization, Validation, Supervision, Project administration, Funding acquisition. Antonio Tejeda: Writing – review & editing, Visualization, Validation. Matthieu Hureau: Writing – review & editing, Visualization,
Validation, Supervision, Resources, Project administration, Funding acquisition. Alain Moissette: Writing – review & editing, Visualization, Validation, Supervision, Resources, Project administration, Funding acquisition.

Declaration of competing interest

The authors declare that they have no known competing financial interests or personal relationships that could have appeared to influence the work reported in this paper.

Data availability

Data will be made available on request.

Acknowledgements

The “Fonds Européen de Développement Régional” (FEDER), the “Centre National de la Recherche Scientifique” (CNRS), the “Région Hauts de France”, and the “Ministère de l’Education Nationale de l’Enseignement Supérieur et de la Recherche” are acknowledged for the funding of X-ray diffractometers from the Chevreul Institute platform. Dr. Sylvain Duval is recognized for its valuable contribution to the liquid H NMR analysis. P. H. M. A. would like to thank the University of Lille for the PhD grant.

References

[1] A. Fujishima, K. Honda, Electrochemical photolysis of water at a semiconductor electrode, Nature 238 (1972) 37-38, https://doi.org/10.1038/238037a0.
[2] M.A. Fox, M.T. Dulay, Heterogeneous photocatalysis, Chem. Rev. 93 (1993) 341-357, https://doi.org/10.1021/cr00017a016.
[3] A. Chatterjee, L. Wang, P. Van Der Voort, Metal-organic frameworks in photocatalytic Z-scheme heterojunctions: an emerging technology, Chem. Commun. 59 (2023) 3627-3654, https://doi.org/10.1039/D2CC05819G.
[4] F. Fischer, Photoelectrode, photovoltaic and photosynthetic microbial fuel cells, Renew. Sustain. Energy Rev. 90 (2018) 16-27, https://doi.org/10.1016/j. rser.2018.03.053.
[5] S. Chu, Y. Wang, Y. Guo, J. Feng, C. Wang, W. Luo, X. Fan, Z. Zou, Band structure engineering of carbon nitride: in search of a polymer photocatalyst with high photooxidation property, ACS Catal. 3 (2013) 912-919, https://doi.org/ 10.1021/cs4000624.
[6] L. Jiao, Y. Wang, H.L. Jiang, Q. Xu, Metal-organic frameworks as platforms for catalytic applications, Adv. Mater. 30 (2018) 1-23, https://doi.org/10.1002/ adma. 201703663.
[7] P.H.M. Andrade, A.L.M. Gomes, H.G. Palhares, C. Volkringer, Post-synthetic modification of aluminum trimesate and copper trimesate with TiO2 nanoparticles for photocatalytic applications, J. Mater. Sci. 57 (2022) 4481-4503, https://doi.org/10.1007/s10853-021-06842-w.
[8] M.R. Hoffmann, S.T. Martin, W. Choi, D.W. Bahnemann, Environmental applications of semiconductor photocatalysis, Chem. Rev. 95 (1995) 69-96, https://doi.org/10.1021/cr00033a004.
[9] X. Deng, Z. Li, H. García, Visible light induced organic transformations using metal-organic-frameworks (MOFs), Chem. Eur. J. 23 (2017) 11189-11209, https://doi.org/10.1002/chem. 201701460.
[10] R. Asahi, T. Morikawa, T. Ohwaki, K. Aoki, Y. Taga, Visible-light photocatalysis in nitrogen-doped titanium oxides, Science 293 (2001) 269-271, https://doi.org/ 10.1126/science. 1061051 (80.).
[11] C.W. Jones, Metal-organic frameworks and covalent organic frameworks: emerging advances and applications, JACS Au 2 (2022) 1504-1505, https://doi. org/10.1021/jacsau.2c00376.
[12] S.M. Moosavi, A. Nandy, K.M. Jablonka, D. Ongari, J.P. Janet, P.G. Boyd, Y. Lee, B. Smit, H.J. Kulik, Understanding the diversity of the metal-organic framework ecosystem, Nat. Commun. 11 (2020) 1-10, https://doi.org/10.1038/s41467-020-17755-8.
[13] J.L. Mancuso, A.M. Mroz, K.N. Le, C.H. Hendon, Electronic structure modeling of metal-organic frameworks, Chem. Rev. 120 (2020) 8641-8715, https://doi.org/ 10.1021/acs.chemrev.0c00148.
[14] N. Kolobov, M.G. Goesten, J. Gascon, Metal-organic frameworks: molecules or semiconductors in photocatalysis? Angew. Chem. Int. Ed. 60 (2021) 26038-26052, https://doi.org/10.1002/anie. 202106342.
[15] S. Wang, L. Pan, J.J. Song, W. Mi, J.J. Zou, L. Wang, X. Zhang, Titanium-defected undoped anatase TiO2 with p-type conductivity, room-temperature ferromagnetism, and remarkable photocatalytic performance, J. Am. Chem. Soc. 137 (2015) 2975-2983, https://doi.org/10.1021/ja512047k.
[16] J.P. Kleider, Y.M. Soro, R. Chouffot, A.S. Gudovskikh, P. Roca i Cabarrocas, J. Damon-Lacoste, D. Eon, P.J. Ribeyron, High interfacial conductivity at amorphous silicon/crystalline silicon heterojunctions, J. Non-Cryst. Solids 354 (2008) 2641-2645, https://doi.org/10.1016/j.jnoncrysol.2007.09.087.
[17] K. Lu, D. Erb, M. Liu, Thermal stability and electrical conductivity of carbonenriched silicon oxycarbide, J. Mater. Chem. C. 4 (2016) 1829-1837, https://doi. org/10.1039/c6tc00069j.
[18] V. Somjit, P. Thinsoongnoen, S. Waiprasoet, T. Pila, P. Pattanasattayavong, S. Horike, K. Kongpatpanich, Processable UiO-66 metal-organic framework fluid gel and electrical conductivity of its nanofilm with sub-100 nm thickness, ACS Appl. Mater. Interfaces 13 (2021) 30844-30852, https://doi.org/10.1021/ acsami.1c07262.
[19] P. Salcedo-Abraira, A. Santiago-Portillo, P. Atienzar, P. Bordet, F. Salles, N. Guillou, E. Elkaim, H. Garcia, S. Navalon, P. Horcajada, A highly conductive nanostructured PEDOT polymer confined into the mesoporous MIL-100(Fe), Dalton Trans. 48 (2019) 9807-9817, https://doi.org/10.1039/C9DT00917E.
[20] P.H.M. Andrade, H. Palhares, C. Volkringer, T. Loiseau, M. Hureau, E. Nunes, A. Moissette, State of the art in visible-light photocatalysis of aqueous pollutants using metal-organic frameworks, J. Photochem. Photobiol. C Photochem. Rev. 57 (2023) 100635, https://doi.org/10.1016/j.jphotochemrev.2023.100635.
[21] L.D. Yuan, H.X. Deng, S.S. Li, S.H. Wei, J.W. Luo, Unified theory of direct or indirect band-gap nature of conventional semiconductors, Phys. Rev. B 98 (2018) 1-10, https://doi.org/10.1103/PhysRevB.98.245203.
[22] X. Guo, L. Liu, Y. Xiao, Y. Qi, C. Duan, F. Zhang, Band gap engineering of metalorganic frameworks for solar fuel productions, Coord. Chem. Rev. 435 (2021), https://doi.org/10.1016/j.ccr.2021.213785.
[23] R. Elzein, C.M. Chang, I. Ponomareva, W.Y. Gao, S. Ma, R. Schlaf, Advanced photoemission spectroscopy investigations correlated with DFT calculations on the self-assembly of 2D metal organic frameworks nano thin films, ACS Appl. Mater. Interfaces 8 (2016) 31403-31412, https://doi.org/10.1021/ acsami.6b10340.
[24] A.H. Wilson, The theory of electronic semi-conductors, Proc. R. Soc. Lond. Ser. A Math. Phys. Sci. 133 (1931) 458-491, https://doi.org/10.1098/rspa.1931.0162.
[25] A.H. Wilson, The theory of electronic semi-conductors II, Proc. R. Soc. Lond. Ser. A Math. Phys. Sci. 134 (1931) 277-287, https://doi.org/10.1098/ rspa.1931.0196.
[26] C.A. Mead, W.G. Spitzer, Fermi level position at semiconductor surfaces, Phys. Rev. Lett. 10 (1963) 471-472, https://doi.org/10.1103/PhysRevLett.10.471.
[27] Z. Huang, M. Lee Tang, Semiconductor nanocrystal light absorbers for photon upconversion, J. Phys. Chem. Lett. 9 (2018) 6198-6206, https://doi.org/ 10.1021/acs.jpclett.8b02154.
[28] C. Dette, M.A. Pérez-Osorio, C.S. Kley, P. Punke, C.E. Patrick, P. Jacobson, F. Giustino, S.J. Jung, K. Kern, TiO2 anatase with a bandgap in the visible region, Nano Lett. 14 (2014) 6533-6538, https://doi.org/10.1021/nl503131s.
[29] L.M. Yang, G.Y. Fang, J. Ma, E. Ganz, S.S. Han, Band gap engineering of paradigm MOF-5, Cryst. Growth Des. 14 (2014) 2532-2541, https://doi.org/10.1021/ cg500243s.
[30] C.H. Hendon, D. Tiana, M. Fontecave, C. Sanchez, L. D’Arras, C. Sassoye, L. Rozes, C. Mellot-Draznieks, A. Walsh, Engineering the optical response of the titanium-MIL-125 metal-organic framework through ligand functionalization, J. Am. Chem. Soc. 135 (2013) 10942-10945, https://doi.org/10.1021/ja405350u.
[31] L.M. Yang, G.Y. Fang, J. Ma, R. Pushpa, E. Ganz, Halogenated MOF-5 variants show new configuration, tunable band gaps and enhanced optical response in the visible and near infrared, Phys. Chem. Chem. Phys. 18 (2016) 32319-32330, https://doi.org/10.1039/c6cp06981a.
[32] Q. Wang, Q. Gao, A.M. Al-Enizi, A. Nafady, S. Ma, Recent advances in MOF-based photocatalysis: environmental remediation under visible light, Inorg. Chem. Front. 7 (2020) 300-339, https://doi.org/10.1039/c9qi01120j.
[33] C.J.H. Wort, R.S. Balmer, Diamond as an electronic material, Mater. Today 11 (2008) 22-28, https://doi.org/10.1016/S1369-7021(07)70349-8.
[34] A.R. Zanatta, Revisiting the optical bandgap of semiconductors and the proposal of a unified methodology to its determination, Sci. Rep. 9 (2019) 11225, https:// doi.org/10.1038/s41598-019-47670-y.
[35] V. Sarritzu, N. Sestu, D. Marongiu, X. Chang, Q. Wang, S. Masi, S. Colella, A. Rizzo, A. Gocalinska, E. Pelucchi, M.L. Mercuri, F. Quochi, M. Saba, A. Mura, G. Bongiovanni, Direct or indirect bandgap in hybrid lead halide perovskites? Adv. Opt. Mater. 6 (2018) 1-8, https://doi.org/10.1002/adom. 201701254.
[36] G. Wang, C. Robert, M.M. Glazov, F. Cadiz, E. Courtade, T. Amand, D. Lagarde, T. Taniguchi, K. Watanabe, B. Urbaszek, X. Marie, In-plane propagation of light in transition metal dichalcogenide monolayers: optical selection rules, Phys. Rev. Lett. 119 (2017) 1-7, https://doi.org/10.1103/PhysRevLett.119.047401.
[37] W. Eberhardt, F.J. Himpsel, Dipole selection rules for optical transitions in the fcc and bcc lattices, Phys. Rev. B 21 (1980) 5572-5576, https://doi.org/10.1103/ PhysRevB.21.5572.
[38] C. Kittel, Introduction to Solid State Physics, Wiley, 2005, pp. 185-219.
[39] Y.P. Varshni, Band-to-band radiative recombination in groups IV, VI, and III-V semiconductors (I), Phys. Status Solidi 19 (1967) 459-514, https://doi.org/ 10.1002/pssb. 19670190202.
[40] R. Soref, B. Bennett, Electrooptical effects in silicon, IEEE J. Quantum Electron. 23 (1987) 123-129, https://doi.org/10.1109/JQE.1987.1073206.
[41] S. Zwerdling, B. Lax, L.M. Roth, Oscillatory magneto-absorption in semiconductors, Phys. Rev. 108 (1957) 1402-1408, https://doi.org/10.1103/ PhysRev.108.1402.
[42] J. Tauc, R. Grigorovici, A. Vancu, Optical properties and electronic structure of amorphous germanium, Phys. Status Solidi 15 (1966) 627-637, https://doi.org/ 10.1002/pssb. 19660150224.
[43] N.F. Mott, E.A. Davis, Conduction in non-crystalline systems V. Conductivity, optical absorption and photoconductivity in amorphous semiconductors, Philos. Mag. 22 (1970) 903-922, https://doi.org/10.1080/14786437008221061.
[44] J.B. Coulter, D.P. Birnie, Assessing tauc plot slope quantification: ZnO thin films as a model system, Phys. Status Solidi Basic Res. 255 (2018) 1-7, https://doi.org/ 10.1002/pssb. 201700393.
[45] Y. Feng, S. Lin, S. Huang, S. Shrestha, G. Conibeer, Can Tauc plot extrapolation be used for direct-band-gap semiconductor nanocrystals? J. Appl. Phys. 117 (2015) https://doi.org/10.1063/1.4916090.
[46] B.D. Viezbicke, S. Patel, B.E. Davis, D.P. Birnie, Evaluation of the Tauc method for optical absorption edge determination: ZnO thin films as a model system, Phys. Status Solidi Basic Res. 252 (2015) 1700-1710, https://doi.org/10.1002/ pssb. 201552007.
[47] R. López, R. Gómez, Band-gap energy estimation from diffuse reflectance measurements on sol-gel and commercial TiO2: a comparative study, J. Sol-Gel Sci. Technol. 61 (2012) 1-7, https://doi.org/10.1007/s10971-011-2582-9.
[48] A. Dolgonos, T.O. Mason, K.R. Poeppelmeier, Direct optical band gap measurement in polycrystalline semiconductors: a critical look at the Tauc method, J. Solid State Chem. 240 (2016) 43-48, https://doi.org/10.1016/j. jssc.2016.05.010.
[49] M. Meinert, G. Reiss, Electronic structure and optical band gap determination of NiFe2O4, J. Phys. Condens. Matter 26 (2014) 115503, https://doi.org/10.1088/ 0953-8984/26/11/115503.
[50] P. Makuła, M. Pacia, W. Macyk, How to correctly determine the band gap energy of modified semiconductor photocatalysts based on UV-vis spectra, J. Phys. Chem. Lett. 9 (2018) 6814-6817, https://doi.org/10.1021/acs.jpclett.8b02892.
[51] G.D. Cody, B.G. Brooks, B. Abeles, Optical absorption above the optical gap of amorphous silicon hydride, Sol. Energy Mater. 8 (1982) 231-240, https://doi. org/10.1016/0165-1633(82)90065-X.
[52] P. Bouguer, Traité d’optique sur la gradation de la lumière, Guerin and Delatour, Paris, 1852. https://gallica.bnf.fr/ark:/12148/bpt6k948469/f2.item.
[53] J.H. Lambert, Photometria, Sive de Mensura et Gradibus Luminis, Colorum et Umbrae, Leipzig : W. Engelmann, 1760. https://archive.org/details/lambertsph otome00lambgoog.
[54] Beer, Bestimmung der Absorption des rothen Lichts in farbigen Flüssigkeiten, Ann. Phys. 162 (1852) 78-88, https://doi.org/10.1002/andp. 18521620505.
[55] J.I. Pankove, Optical Processes in Semiconductors, Dover Publications, New York, 1971. I. 0-486-60275-3.
[56] R. Vahalová, L. Tichý, M. Vlček, H. Tichá, Far infrared spectra and bonding arrangement in some Ge-Sb-S glasses, Phys. Status Solidi 181 (2000) 199-209, https://doi.org/10.1002/1521-396X(200009), 181:1<199::AID-PSSA199>3.0. CO;2-X.
[57] P. Kubelka, F. Munk, An article on optics of paint layers, Z. Tech. Phys. 12 (1931) 593-601.
[58] Y. Lee, S. Kim, J.K. Kang, S.M. Cohen, Photocatalytic CO2 reduction by a mixed metal ( ), mixed ligand metal-organic framework under visible light irradiation, Chem. Commun. 51 (2015) 5735-5738, https://doi.org/10.1039/ c5cc00686d.
[59] D. Yamashita, Y. Nakajima, A. Ishizaki, M. Uda, Photoelectron spectrometer equipped with open counter for electronic structures of organic materials, J. Surf. Anal. 14 (2008) 433-436. http://www.sasj.jp/JSA/CONTENTS. /vol.14_4/Vol. 14 No.4/Vol. 14 No. 4 433-436.pdf.
[60] R.J. Davis, M.T. Lloyd, S.R. Ferreira, M.J. Bruzek, S.E. Watkins, L. Lindell, P. Sehati, M. Fahlman, J.E. Anthony, J.W.P. Hsu, Determination of energy level alignment at interfaces of hybrid and organic solar cells under ambient environment, J. Mater. Chem. 21 (2011) 1721-1729, https://doi.org/10.1039/ C0JM02349C.
[61] J. Jasieniak, M. Califano, S.E. Watkins, Size-dependent valence and conduction band-edge energies of semiconductor nanocrystals, ACS Nano 5 (2011) 5888-5902, https://doi.org/10.1021/nn201681s.
[62] P. Kubelka, New contributions to the optics of intensely light-scattering materials. Part I, J. Opt. Soc. Am. 44 (1948) 330, https://doi.org/10.1364/josa.44.000330.
[63] D.R. Duncan, The colour of pigment mixtures, Proc. Phys. Soc. 52 (1940) 390-401, https://doi.org/10.1088/0959-5309/52/3/310.
[64] T. Burger, J. Kuhn, R. Caps, J. Fricke, Quantitative determination of the scattering and absorption coefficients from diffuse reflectance and transmittance measurements: application to pharmaceutical powders, Appl. Spectrosc. 51 (1997) 309-317, https://doi.org/10.1366/0003702971940404.
[65] D.J. Dahm, K.D. Dahm, Representative layer theory for diffuse reflectance, Appl. Spectrosc. 53 (1999) 647-654, https://doi.org/10.1366/0003702991947298.
[66] T. Burger, H.J. Ploss, J. Kuhn, S. Ebel, J. Fricke, Diffuse reflectance and transmittance spectroscopy for the quantitative determination of scattering and absorption coefficients in quantitative powder analysis, Appl. Spectrosc. 51 (1997) 1323-1329, https://doi.org/10.1366/0003702971941999.
[67] S. Landi, I.R. Segundo, E. Freitas, M. Vasilevskiy, J. Carneiro, C.J. Tavares, Use and misuse of the Kubelka-Munk function to obtain the band gap energy from diffuse reflectance measurements, Solid State Commun. 341 (2022) 1-7, https:// doi.org/10.1016/j.ssc.2021.114573.
[68] G. Férey, Hybrid porous solids: past, present, future, Chem. Soc. Rev. 37 (2008) 191-214, https://doi.org/10.1039/b618320b.
[69] M.A. Nasalevich, C.H. Hendon, J.G. Santaclara, K. Svane, B. Van Der Linden, S. L. Veber, M.V. Fedin, A.J. Houtepen, M.A. Van Der Veen, F. Kapteijn, A. Walsh, J. Gascon, Electronic origins of photocatalytic activity in d0 metal organic frameworks, Sci. Rep. 6 (2016) 1-9, https://doi.org/10.1038/srep23676.
[70] P.H.M. Andrade, N. Henry, C. Volkringer, T. Loiseau, H. Vezin, M. Hureau, A. Moissette, Iodine uptake by Zr -/Hf-Based UiO-66 materials: the influence of
metal substitution on iodine evolution, ACS Appl. Mater. Interfaces (2022), https://doi.org/10.1021/acsami.2c07288.
[71] J. Heine, K. Müller-Buschbaum, Engineering metal-based luminescence in coordination polymers and metal-organic frameworks, Chem. Soc. Rev. 42 (2013) 9232-9242, https://doi.org/10.1039/c3cs60232j.
[72] P. Huo, T. Chen, J. Le Hou, L. Yu, Q.Y. Zhu, J. Dai, Ligand-to-ligand charge transfer within metal-organic frameworks based on manganese coordination polymers with tetrathiafulvalene-bicarboxylate and bipyridine ligands, Inorg. Chem. 55 (2016) 6496-6503, https://doi.org/10.1021/acs.inorgchem.6b00571.
[73] C. Xu, Y. Pan, G. Wan, H. Liu, L. Wang, H. Zhou, S.H. Yu, H.L. Jiang, Turning on visible-light photocatalytic C-H oxidation over metal-organic frameworks by introducing metal-to-cluster charge transfer, J. Am. Chem. Soc. 141 (2019) 19110-19117, https://doi.org/10.1021/jacs.9b09954.
[74] C.A. Kent, D. Liu, L. Ma, J.M. Papanikolas, T.J. Meyer, W. Lin, Light harvesting in microscale metal-organic frameworks by energy migration and interfacial electron transfer quenching, J. Am. Chem. Soc. 133 (2011) 12940-12943, https://doi.org/10.1021/ja204214t.
[75] M.A. Nasalevich, M.G. Goesten, T.J. Savenije, F. Kapteijn, J. Gascon, Enhancing optical absorption of metal-organic frameworks for improved visible light photocatalysis, Chem. Commun. 49 (2013) 10575-10577, https://doi.org/ 10.1039/c3cc46398b.
[76] P.H.M. Andrade, M. Moreau, N. Henry, M.T. Bakouche, S. Duval, C. Volkringer, T. Loiseau, M. Hureau, A. Moissette, Raman mapping as a tool for evaluating I2 and I3- diffusion over single-crystal UiO-67_NH2(M) ( , or Hf), J. Phys. Chem. C 2 (2022), https://doi.org/10.1021/acs.jpcc.2c08723.
[77] P.H.M. Andrade, H. Ahouari, C. Volkringer, T. Loiseau, H. Vezin, M. Hureau, A. Moissette, Electron-donor functional groups, band gap tailoring, and efficient charge separation: three keys to improve the gaseous iodine uptake in MOF materials, ACS Appl. Mater. Interfaces 15 (2023) 31032-31048, https://doi.org/ 10.1021/acsami.3c04955.
[78] T. Ahnfeldt, N. Guillou, D. Gunzelmann, I. Margiolaki, T. Loiseau, G. Férey, J. Senker, N. Stock, a 12 -connected porous metal-organic framework with an unprecedented aluminum-containing brick, Angew. Chem. Int. Ed. 48 (2009) 5163-5166, https://doi.org/10.1002/ anie. 200901409.
[79] J.H. Cavka, S. Jakobsen, U. Olsbye, N. Guillou, C. Lamberti, S. Bordiga, K. P. Lillerud, A new zirconium inorganic building brick forming metal organic frameworks with exceptional stability, J. Am. Chem. Soc. 130 (2008) 13850-13851, https://doi.org/10.1021/ja8057953.
[80] M. Dan-Hardi, C. Serre, T. Frot, L. Rozes, G. Maurin, C. Sanchez, G. Férey, A new photoactive crystalline highly porous titanium(IV) dicarboxylate, J. Am. Chem. Soc. 131 (2009) 10857-10859, https://doi.org/10.1021/ja903726m.
[81] S. Jakobsen, D. Gianolio, D.S. Wragg, M.H. Nilsen, H. Emerich, S. Bordiga, C. Lamberti, U. Olsbye, M. Tilset, K.P. Lillerud, Structural determination of a highly stable metal-organic framework with possible application to interim radioactive waste scavenging: Hf-UiO-66, Phys. Rev. B Condens. Matter Mater. Phys. 86 (2012) 1-11, https://doi.org/10.1103/PhysRevB.86.125429.
[82] M.J. Katz, Z.J. Brown, Y.J. Colón, P.W. Siu, K.A. Scheidt, R.Q. Snurr, J.T. Hupp, O.K. Farha, A facile synthesis of UiO-66, UiO-67 and their derivatives, Chem. Commun. 49 (2013) 9449-9451, https://doi.org/10.1039/C3CC46105J.
[83] M. Leloire, C. Walshe, P. Devaux, R. Giovine, S. Duval, T. Bousquet, S. Chibani, J. Paul, A. Moissette, H. Vezin, P. Nerisson, L. Cantrel, C. Volkringer, T. Loiseau, Capture of gaseous iodine in isoreticular zirconium-based UiO-n metal-organic frameworks: influence of amino functionalization, DFT calculations, Raman and EPR spectroscopic investigation, Chem. Eur. J 28 (2022), https://doi.org/ 10.1002/chem. 202104437 e202104437.
[84] S. Hu, M. Liu, K. Li, Y. Zuo, A. Zhang, C. Song, G. Zhang, X. Guo, Solvothermal synthesis of NH2-MIL-125(Ti) from circular plate to octahedron, CrystEngComm 16 (2014) 9645-9650, https://doi.org/10.1039/c4ce01545b.
[85] A.Y. Galashev, A.S. Vorob’ev, Physical properties of silicene electrodes for Li -, , Mg-, and K-ion batteries, J. Solid State Electrochem. 22 (2018) 3383-3391, https://doi.org/10.1007/s10008-018-4050-8.
[86] K. Hendrickx, D.E.P. Vanpoucke, K. Leus, K. Lejaeghere, A. Van Yperen-De Deyne, V. Van Speybroeck, P. Van Der Voort, K. Hemelsoet, Understanding intrinsic light absorption properties of UiO-66 frameworks: a combined theoretical and experimental study, Inorg. Chem. 54 (2015) 10701-10710, https://doi.org/ 10.1021/acs.inorgchem.5b01593.
[87] L.M. Yang, E. Ganz, S. Svelle, M. Tilset, Computational exploration of newly synthesized zirconium metal-organic frameworks UiO-66, -67, -68 and analogues, J. Mater. Chem. C 2 (2014) 7111-7125, https://doi.org/10.1039/c4tc00902a.
[88] A.S. Yasin, J. Li, N. Wu, T. Musho, Study of the inorganic substitution in a functionalized UiO-66 metal-organic framework, Phys. Chem. Chem. Phys. 18 (2016) 12748-12754, https://doi.org/10.1039/c5cp08070c.
[89] A. Wang, Y. Zhou, Z. Wang, M. Chen, L. Sun, X. Liu, Titanium incorporated with UiO-66(Zr)-type metal-organic framework (MOF) for photocatalytic application, RSC Adv. 6 (2016) 3671-3679, https://doi.org/10.1039/c5ra24135a.
[90] J. Tu, X. Zeng, F. Xu, X. Wu, Y. Tian, X. Hou, Z. Long, Microwave-induced fast incorporation of titanium into UiO-66 metal-organic frameworks for enhanced photocatalytic properties, Chem. Commun. 53 (2017) 3361-3364, https://doi. org/10.1039/c7cc00076f.
[91] S. Liu, Z. Ren, H. Xu, Y. Xing, X. Jin, G. Ni, Z. Wang, Visible-light-responsive heterojunction with enhanced photocatalytic performance, Mater. Sci. Semicond. Process. 147 (2022) 106708, https://doi.org/10.1016/j. mssp.2022.106708.
[92] X. Zhao, M. Xu, X. Song, X. Liu, W. Zhou, H. Wang, P. Huo, Tailored linker defects in UiO-67 with high ligand-to-metal charge transfer toward efficient photoreduction of CO2, Inorg. Chem. 61 (2022) 1765-1777, https://doi.org/ 10.1021/acs.inorgchem.1c03690.
[93] E. Flage-Larsen, A. Røyset, J.H. Cavka, K. Thorshaug, Band gap modulations in UiO metal-organic frameworks, J. Phys. Chem. C 117 (2013) 20610-20616, https://doi.org/10.1021/jp405335q.
[94] S. Chavan, J.G. Vitillo, D. Gianolio, O. Zavorotynska, B. Civalleri, S. Jakobsen, M. H. Nilsen, L. Valenzano, C. Lamberti, K.P. Lillerud, S. Bordiga, H2 storage in isostructural UiO-67 and UiO-66 MOFs, Phys. Chem. Chem. Phys. 14 (2012) 1614-1626, https://doi.org/10.1039/c1cp23434j.
[95] S.Q. Wang, X. Wang, X.Y. Zhang, X.M. Cheng, J. Ma, W.Y. Sun, Effect of the defect modulator and ligand length of metal-organic frameworks on carbon dioxide photoreduction, ACS Appl. Mater. Interfaces 13 (2021) 61578-61586, https:// doi.org/10.1021/acsami.1c21663.
[96] R. Raciti, R. Bahariqushchi, C. Summonte, A. Aydinli, A. Terrasi, S. Mirabella, Optical bandgap of semiconductor nanostructures: methods for experimental data analysis, J. Appl. Phys. 121 (2017) 234304, https://doi.org/10.1063/1.4986436.
[97] C. Rotaru, S. Nastase, N. Tomozeiu, Amorphous phase influence on the optical bandgap of polysilicon, Phys. Status Solidi 171 (1999) 365-370, https://doi.org/ 10.1002/(SICI)1521-396X(199901)171. :1<365::AID-PSSA365>3.0.CO;2-M.
[98] B. Gu, N.H. Kwong, R. Binder, Relation between the interband dipole and momentum matrix elements in semiconductors, Phys. Rev. B 87 (2013) 125301, https://doi.org/10.1103/PhysRevB.87.125301.
[99] B. Jensen, Quantum theory of the complex dielectric constant of free carriers in polar semiconductors, IEEE J. Quantum Electron. 18 (1982) 1361-1370, https:// doi.org/10.1109/JQE.1982.1071713.
[100] P. Hervé, L.K.J. Vandamme, General relation between refractive index and energy gap in semiconductors, Infrared Phys. Technol. 35 (1994) 609-615, https://doi. org/10.1016/1350-4495(94)90026-4.
[101] H. Finkenrath, The Moss rule and the influence of doping on the optical dielectric constant of semiconductors-I, Infrared Phys. 28 (1988) 327-332, https://doi.org/ 10.1016/0020-0891(88)90054-1.
[102] T.S. Moss, Relations between the refractive index and energy gap of semiconductors, Phys. Status Solidi 131 (1985) 415-427, https://doi.org/ 10.1002/pssb. 2221310202.
[103] N.M. Ravindra, P. Ganapathy, J. Choi, Energy gap-refractive index relations in semiconductors-an overview, Infrared Phys. Technol. 50 (2007) 21-29, https:// doi.org/10.1016/j.infrared.2006.04.001.
[104] D.R. Penn, Wave-number-dependent dielectric function of semiconductors, Phys. Rev. 128 (1962) 2093-2097, https://doi.org/10.1103/PhysRev.128.2093.
[105] S.H. Wemple, Optical oscillator strengths and excitation energies in solids, liquids, and molecules, J. Chem. Phys. 67 (1977) 2151-2168, https://doi.org/ 10.1063/1.435102.
[106] P. George, P. Chowdhury, Complex dielectric transformation of UV-vis diffuse reflectance spectra for estimating optical band-gap energies and materials classification, Analyst 144 (2019) 3005-3012, https://doi.org/10.1039/ c8an02257g.
[107] H.A. Kramers, The quantum theory of dispersion, Nature 114 (1924) 310-311, https://doi.org/10.1038/114310b0.
[108] R. de L. Kronig, On the theory of dispersion of X-rays, J. Opt. Soc. Am. 12 (1926) 547-557, https://doi.org/10.1364/JOSA.12.000547.
[109] A.B. Kuzmenko, Kramers-Kronig constrained variational analysis of optical spectra, Rev. Sci. Instrum. 76 (2005) 83108, https://doi.org/10.1063/1.1979470.
[110] E. Yablonovitch, Photonic band-gap structures, J. Opt. Soc. Am. B 10 (1993) 283-295, https://doi.org/10.1364/JOSAB.10.000283.

    • Corresponding author.
    E-mail address: pedro.moraisandrade@univ-lille.fr (P.H.M. Andrade).