تحليل متعدد الأنماط لشرائح حيوية مرتبطة بالعرق والفينيل ألانين بين الأفراد ومرتبط بالدم لتتبع عملية الأيض أثناء التمرين Interindividual- and blood-correlated sweat phenylalanine multimodal analytical biochips for tracking exercise metabolism

المجلة: Nature Communications، المجلد: 15، العدد: 1
DOI: https://doi.org/10.1038/s41467-024-44751-z
PMID: https://pubmed.ncbi.nlm.nih.gov/38245507
تاريخ النشر: 2024-01-20

تحليل متعدد الأنماط لشرائح حيوية مرتبطة بالعرق والفينيل ألانين بين الأفراد ومرتبط بالدم لتتبع عملية الأيض أثناء التمرين

تاريخ الاستلام: 18 أكتوبر 2023
تاريخ القبول: 3 يناير 2024
تاريخ النشر على الإنترنت: 20 يناير 2024

تحقق من التحديثات

باوان زونغ , شياوكين تشين , هاو , لينغتشين ليو , لينلين , زهيشين , ليمين كاو , زينغ لو © , جوشوا أ. جاكمان © , نام-جون تشو & ليلي وانغ (1)

الملخص

يمكن أن يوفر المراقبة في الموقع لفقدان الأحماض الأمينية الذاتية من خلال العرق رؤى فسيولوجية حول الصحة والأيض. ومع ذلك، فإن أجهزة استشعار الأحماض الأمينية الحالية غير قادرة على تقييم الحالة الأيضية بشكل كمي أثناء التمرين ونادراً ما تستخدم لتحديد العلاقات بين الدم والعرق لأنها تكتشف فقط مؤشر تركيز واحد وتتجاهل معدل العرق. هنا، نقدم شريحة حيوية متعددة الأنماط قابلة للارتداء مدمجة مع أقطاب كهربائية كيميائية متقدمة وقنوات ميكروفلويدية متعددة الأغراض تتيح القياس المتزامن لعدة مؤشرات عرق، بما في ذلك الفينيل ألانين والكلوريد، بالإضافة إلى معدل العرق. تكشف هذه الطريقة المجمعة للقياس عن علاقة سلبية بين مستويات الفينيل ألانين في العرق ومعدلات العرق بين الأفراد، مما يمكّن من تحديد الأفراد المعرضين لمخاطر أيضية عالية. من خلال تتبع تقلبات الفينيل ألانين الناتجة عن تناول البروتين أثناء التمرين وتطبيع مؤشر التركيز بواسطة معدلات العرق لتقليل التباين بين الأفراد، نوضح طريقة موثوقة لربط وتحليل مستويات الفينيل ألانين في العرق والدم لمراقبة الصحة الشخصية.

الأحماض الأمينية (AAs) هي اللبنات الأساسية للحياة وضرورية لتخليق البروتينات التي تلعب دورًا حيويًا في نمو الإنسان وصيانته ومناعته وتكاثره. . بالإضافة إلى الأشكال المرتبطة بالبروتين، فإن الأحماض الأمينية الحرة هي مواد تفاعلية ومنتجات أيضية تشارك في مجموعة من العمليات البيولوجية الحيوية للحفاظ على وظيفة الجسم والتوازن الداخلي، بما في ذلك التغذية والأيض والتنظيم الفسيولوجي. . توجد الأحماض الأمينية الحرة في جميع السوائل الحيوية وأنسجة الجسم، وترتبط مستوياتها بحالة الجسم، مثل التمرين والنظام الغذائي والعدوى والمرض وعلم النفس. . وبالتالي، فإن تحليل الأحماض الأمينية الحرة في السوائل الحيوية يحمل أهمية عملية لتقييم حالات الصحة. من بين مختلف السوائل الحيوية، حصلت فائدة مؤشرات الأحماض الأمينية في العرق على اهتمام أقل باستثناء
أمراض الجلد لأنها تنشأ من كل من فقدان البلازما الذاتي ووجود الأحماض الأمينية على سطح الجلد , والتي تُعرف بالعوامل المرطبة الطبيعية (NMF) (الشكل 1أ). لقد أثبت وجود وتلوث NMFs في العرق تحديًا حاسمًا في تطوير أجهزة استشعار العرق القابلة للارتداء لمراقبة الأحماض الأمينية. . لحسن الحظ، أظهرت الدراسات الأخيرة نتائج واعدة تشير إلى أن مساهمة الأحماض الأمينية التي تسربت من الجلد مثل NMFs إلى العرق تتناقص وقد تستنفد في النهاية مع زيادة مدة التمرين، خاصة بالنسبة للأحماض الأمينية ذات الانتشار المنخفض على الجلد (غير NMFs). . وبالتالي، يمكن أن تشير تركيزات الأحماض الأمينية في العرق المقاسة إلى مستوياتها في الدم وتعمل كعلامات حيوية موثوقة لتقييم الحالة الفسيولوجية، والتي
الشكل 1 | مخططات لشريحة حيوية متعددة الأنماط القابلة للارتداء لتقييم مخاطر الأيض أثناء التمرين وارتباط المصل من خلال تحليل العرق. أ مخطط للشريحة الحيوية على الجلد لاستشعار العرق متعدد الأنماط ومصدرين للعرق Phe، بما في ذلك سطح الجلد وتقسيم الدم. ب علاقة سلبية دالة بين تركيزات Phe في العرق ومعدلات العرق بين الأفراد، جنبًا إلى جنب مع طريقة حساب معدل إفراز Phe (مساحة المدخلات من ) وتقسيم مناطق مخاطر الأيض المختلفة. ج آلية قطب E-MIP لاكتشاف Phe من خلال الأكسدة الكهروكيميائية المباشرة والمحاكاة النظرية لنقل الشحنة بين قطب E-MIP وجزيء Phe تحت مجال كهربائي خارجي. السهم الأحمر يمثل اتجاه المجال الكهربائي. العمل
مبدأ وقطع عرضي لوحدة الميكروفلويدية مع هيكل مجمع عمودي. هـ مقارنة استجابات Phe DPV للنظام اللاسلكي المتكامل والأقطاب الكهربائية النقية. العلاقة بين معدلات العرق ومستويات Phe بين الأفراد في نفس نقطة زمنية للتمرين، جنبًا إلى جنب مع تقسيم معدلات إفراز Phe المختلفة. تشير البيانات المميزة إلى الموضوع الذي لديه أعلى معدل إفراز في هذه الدراسة. بيانات من 16 موضوعًا صحيًا. علاقات مستويات Phe في العرق والمصل في موضوعين. تمثل الخطوط المنقطة خطوط الاتجاه الملائمة خطيًا. ح مقارنة التقدمات الأخيرة في استشعار العرق. **: هذا العمل، تير تيروزين، BCAAs الأحماض الأمينية ذات السلسلة المتفرعة، CRP بروتين سي التفاعلي، HB -هيدروكسي بيوتيرات، UA حمض اليوريك، VC فيتامين C.
يوفر فرصًا جذابة لمراقبة الصحة غير الغازية والمريحة.
عمليًا، لا تزال أجهزة استشعار الأحماض الأمينية في العرق القابلة للارتداء في مرحلة مبكرة من التقدم، ولا يمكن لأجهزة الاستشعار الحالية إلا اكتشاف عدد محدود من الأحماض الأمينية في العرق. . لا يزال هناك العديد من الأحماض الأمينية في العرق التي لم يتم استكشافها ودراستها بواسطة أجهزة الاستشعار القابلة للارتداء وبالتالي تطبيقها في سيناريوهات الصحة العملية وفقًا لعلاقات الدم المحتملة التي لم يتم اكتشافها. الفينيل ألانين (Phe)، وهو حمض أميني أساسي، موجود في العرق ولكنه له وجود منخفض فقط على سطح الجلد (غير NMF) و
يُفترض أنه يتوزع في العرق عبر الانتشار بسبب حجمه الصغير وخصائص سلسلة الجانبية غير القطبية. تشير هذه الخصائص الفيزيائية والكيميائية إلى أن Phe سيكون مفيدًا كعلامة حيوية للعرق، خاصةً منذ أن تركيزه في العرق قد يكون مرتبطًا بمستويات Phe في الدم. من منظور الرعاية الصحية، يتم استخدام اختبار تركيز Phe لتقييم حالات التغذية والمرض المختلفة. بالنسبة لمرضى الفينيل كيتونوريا (PKU)، يعد اختبار Phe في الدم أداة مهمة للتشخيص المبكر في فحص حديثي الولادة والعلاج الغذائي المستمر طوال الحياة. ترتبط تقلبات تركيزات Phe أيضًا بـ
أيض بروتين العضلات أثناء التمرين , خلل الكبد في السمنة , وشدة العدوى الفيروسية. من المهم أن هناك علاقة قوية ومباشرة بين Phe ومستويات الأحماض الأمينية الإجمالية في العرق , مما يشير إلى إمكانية دمج قياسات فقدان العرق لتحديد فقدان الأحماض الأمينية في العرق لتقييم الحالة الأيضية أثناء التمرين. في هذا الصدد، يمكن أن يساعد تتبع الأيض أثناء التمرين وتقييم المخاطر من خلال مراقبة فقدان الأحماض الأمينية في العرق في تجنب توازن النيتروجين السلبي الصافي بسبب استنفاد موارد الأحماض الأمينية الحرة، مما يؤدي إلى التعب والألم أثناء التمرين. . بالإضافة إلى ذلك، يمكن استخدام القياس المتزامن لتركيز Phe ومعدل العرق لتحديد مصدر Phe في العرق (أي آلية الإفراز) في مراحل مختلفة من التعرق أثناء التمرين. من خلال تمكين مقارنة بين الأفراد مع عدة مواضيع بشرية، يمكن أيضًا استخدام العلاقة التي تم الحصول عليها بين هذين المؤشرين لدراسة آلية تقسيم Phe من الدم. . إن فهم آليات تقسيم Phe في العرق وإفرازه يمهد الطريق لنمذجة أكثر تعقيدًا لأخذ معدل العرق في الاعتبار , مما قد ينتج عنه علاقة أقوى بين مستويات Phe في العرق والدم بين الأفراد.
تستند الجهود الأخيرة في الكشف المحمول عن تركيزات Phe في الدم أو البول بشكل رئيسي إلى عناصر التعرف الجزيئي (مثل الأجسام المضادة والأبتاميرات)، والتي تواجه تحديات مثل التكلفة العالية، والاستقرار المنخفض، ومتطلبات الغسيل الواسعة، والقدرة البيولوجية المحتملة. . بالمقابل، تعتبر أجهزة الاستشعار الكهروكيميائية التي لا تعتمد على التفاعلات الحيوية أكثر ملاءمة لتلبية متطلبات تصميم الأجهزة القابلة للارتداء، خاصةً بالنظر إلى تكلفتها المنخفضة وسهولة تصنيعها. . نظرًا لأن Phe غير نشط كهربائيًا بالنسبة لمواد الأقطاب الكهربائية الشائعة مثل الذهب والكربون والجرافين، هناك طريقتان تم الإبلاغ عنهما لقياسات الكهروكيميائية القابلة للارتداء لاكتشاف Phe، بما في ذلك تحويل Phe النشط كهربائيًا والكشف غير المباشر باستخدام مجسات الأكسدة والاختزال. . يمكن أن تتيح الطريقة الأولى قياسات Phe لمرة واحدة فقط. ، مما يجعل من الصعب تكييفه للقياس القابل للارتداء المستمر وطويل الأمد. أما بالنسبة للأخير، فقد تم دمج مجسات الأكسدة والاختزال مع البوليمرات المطبوعة جزيئيًا (MIP) للكشف بشكل غير مباشر عن المواد غير النشطة كهربائيًا. لكن حساسية هذه الطريقة أقل نسبياً من الأكسدة المباشرة للمواد التحليلية بسبب العلاقة العكسية غير الخطية بين تركيزات الأحماض الأمينية والتغيرات في تيار الذروة. لذلك، لم يتم بعد إثبات وجود مستشعر قابل للارتداء للكشف عن الفينيل ألانين في العرق يعتمد على تحويل الإشارة المباشر (الجدول التكميلي 1). علاوة على ذلك، لم يتم إثبات القياس المتزامن لمستويات الأحماض الأمينية في العرق ومعدلات العرق، وكذلك تحليلها المشترك، وبالتالي تم تجاهلها حتى الآن في مجال استشعار العرق القابل للارتداء (الشكل 1h)، بسبب نقص نهج مريح وموثوق لقياس معدل العرق.
في هذه المقالة، نقدم شريحة حيوية متعددة الوسائط قابلة للارتداء لاستشعار مؤشرات متعددة، بما في ذلك تركيزات الفينيل ألانين والكلوريد في العرق، بالإضافة إلى معدل العرق، مما يمكن من التقييم الكمي للحالة الأيضية أثناء التمرين. تتضمن هذه الشريحة الحيوية ثلاثة وحدات وظيفية للكشف المتقدم عن العرق في الموقع (الشكل 1أ): (1) إلكترود كيميائي كهربائي معدل بواسطة MIP نشط كهرومحفز لتحديد الفينيل ألانين في العرق بشكل مباشر وانتقائي؛ (2) وحدة ميكروفلويدية متعددة الأغراض مصممة بشكل جيد تسمح بأخذ عينات سريعة من العرق، وتجديد التركيز، وتخفيف الحموضة لبيئة اختبار مستقرة، بالإضافة إلى تصور التدفق لقياس فقدان العرق؛ و(3) التكامل مع دائرة مرنة لاسلكية متطابقة وبرنامج موبايل. باستخدام هذا النهج الخاص بالشريحة الحيوية، قمنا بدراسة التغير في مستويات الفينيل ألانين بين مجموعتين من الأشخاص المختبرين ذوي قيم مؤشر كتلة الجسم (BMI) المختلفة، والتي يمكن أن تُعزى إلى الاختلاف في معدلات العرق. استفدنا من هذه العلاقة السلبية، وقمنا بتحليل الآلية المحتملة لتوزيع الفينيل ألانين في العرق. علاوة على ذلك، قمنا بتقييم الحالة الأيضية أثناء التمرين والمخاطر بين المتطوعين ذوي الخصائص الفسيولوجية المختلفة باستخدام مؤشر مركب، وهو معدل إفراز الفينيل ألانين. مستمد من تركيز العرق Phe ) ومعدل التعرق ( ) (الشكل 1ب). أخيرًا،
نحن نوضح وجود علاقات قوية ومشابهة بين مستويات الفينيل ألانين في العرق والمصل لدى متطوعين مختلفين قبل وبعد تناول البروتين من خلال تطبيع معدل العرق لتقليل التباين بين الأفراد. تكشف جميع هذه العروض عن الفائدة المحتملة لنظامنا القابل للارتداء متعدد الوسائط لإدارة التمارين الغذائية الشخصية المستندة إلى العرق.

النتائج

استراتيجية استشعار النظام المتكامل والتطبيقات

يمكن ربط الشريحة الحيوية التي تدمج عدة وحدات وظيفية بالجلد وتقوم بأخذ عينات من العرق المفرز على سطح الجلد من أجل الاستشعار المتعدد الأنماط، ومعالجة البيانات، والإرسال اللاسلكي (الشكل 1أ والشكل التكميلي 1). يمكن تحضير جميع وحدات الشريحة الحيوية على نطاق واسع من خلال تقنيات معالجة بسيطة، بما في ذلك التبخر الحراري ونقش الليزر (الأشكال التكميلية 2، 3).
لتحقيق حساسية عالية وكشف موثوق عن الفينيل ألانين في العرق، قمنا بتطوير بوليمر مطبوع على شكل الفينيل ألانين يحاكي وظائف الإنزيمات البيولوجية. على عكس البوليمرات المطبوعة العادية التي تعمل كـ ‘مرشحات جزيئية’ أو ‘أجسام مضادة صناعية’. يسمح ‘الإنزيم الاصطناعي’ القائم على MIP بأكسدة كهربائية مباشرة وانتقائية للفيينيل ألانين (Phe) على سطح القطب. تتيح هذه الطريقة التحديد الكهربائي المباشر لتركيز Phe في العرق باستخدام تقنية الفولتمترية النبضية التفاضلية (DPV). يمكن لمادة MIP المقلدة للإنزيم أن ترتبط بشكل انتقائي مع Phe المستهدف في العرق من خلال مواقع الربط المحددة، وأيضًا أن تقوم بأكسدة Phe مباشرة عبر مجموعات وظيفية نشطة كهربائيًا على السطح (الشكل 1c). تم تصنيع قطب MIP المطبوع بـ Phe عن طريق البوليمرة الكهربائية للبولي أنيلين (PANI)، الذي تم استخدامه للتعرف على الشيرال للأحماض الأمينية العطرية (التيروزين، التربتوفان، والفيينيل ألانين) بسبب نشاطه الكهربائي الخاص. .
تم التحقق من نجاح طباعة القوالب واستخراجها من مصفوفة PANI المترسبة كهربائيًا من خلال طرق توصيف متنوعة (AFM، SEM، وFTIR-ATR) ومحاكاة التفاعلات الجزيئية (الملاحظة التكميلية 1 والأشكال التكميلية 4-8). علاوة على ذلك، تدعم محاكاة تفاعلات الجزيئات المحسّنة المستندة إلى حسابات نظرية الكثافة الوظيفية (DFT) لدراسة السلوك الكهروكيميائي للفيينيل على سطح قطب MIP الظاهرة الكهروكيميائية لقطب PANI-MIP في الكشف عن الفييينيل في هذا النظام، والتي تتعلق بالكربونيل. ) مجموعات على حلقات الكينون لسلاسل البوليمر الناتجة عن التحلل الكهربائي لـ PANI (الشكل 1c والملاحظة التكميلية 2). بشكل محدد، تحت نفس المجال الكهربائي الخارجي، عدد أكبر من نقل الشحنة ( ) يتم حسابه بين قطب MIP المتحلل كهربائيًا (E-MIP) وجزيء Phe مقارنةً بحالات الأقطاب الأخرى (الشكل التكميلي 9).
للحصول على استجابات كهربائية كيميائية مستقرة وموثوقة لمادة الفينيل ألانين في عينات العرق المعقدة ذات ظروف pH وتركيز الكهارل المتغيرة، يدمج نظام الرقاقة الحيوية لدينا وحدة ميكروفلويديك مركبة عمودياً مع ورق فلتر يحتوي على محلول عازل pH محايد مدمج في غرفة الاستشعار (الشكل 1d). بينما يتدفق العرق عبر ورق الفلتر المحمّل بمحلول فوسفات جاف (PB، pH 7.5، 20×)، يحافظ هذا التصميم المدمج على بيئة المحلول عند مستوى pH ثابت وقوة أيونية عالية لتحقيق استجابات استشعار مستقرة لمادة الفينيل ألانين. ومن الجدير بالذكر، كما هو موضح في الشكل 1e، أن إدخال ورق الفلتر أمام الأقطاب الكهربائية كان له تأثيرات ضئيلة على استجابات DPV لنظام استشعار الفينيل ألانين المدمج ضمن نطاق التركيز الفسيولوجي الطبيعي مقارنةً بتلك الخاصة بالأقطاب الكهربائية النقية في PBS. بالإضافة إلى ذلك، من خلال دمج تصميم قناة تدفق متعرجة مع سطح علوي خشن، يسمح نظام الميكروفلويديك أيضًا برؤية تدفق العرق لتقدير فقدان العرق، بما في ذلك حجم العرق ومعدل التدفق (الملاحظة التكميلية 3).
استكشفنا جدوى دمج الإشارات الثنائية القياس (تركيز الفينيل ألانين في العرق ومعدل العرق) لتحليل آلية تقسيم الفينيل ألانين إلى العرق، وتقييم الحالة الأيضية أثناء التمرين، والتحقيق في العلاقة بين مستويات الفينيل ألانين في العرق والمصل (الشكل التكميلي 10). بالتفصيل، من خلال استخدام النظام القابل للارتداء لـ
جمع البيانات من عدة متطوعين بعد 20 دقيقة من التمرين، لاحظنا وجود علاقة سلبية متوسطة بين معدل التعرق وتركيز الفينيل ألانين (الشكل 1f)، مما يشير إلى أن آلية توزيع الفينيل ألانين في العرق تعتمد على الانتشار وقد يتأثر تركيزه بتخفيف العرق. من المRemarkably، كانت العلاقة في منطقة معدل التعرق المنخفض أقل من تلك في منطقة معدل التعرق العالي لأن محتوى الفينيل ألانين على سطح الجلد في العرق، الذي يتأثر باختلافات جودة الجلد الفردية، كان من الصعب استنفاده عن طريق التعرق عند معدلات التعرق المنخفضة. . علاوة على ذلك، قمنا أيضًا بتعريف مؤشر مثالي لتقييم حالة الأيض أثناء التمرين مع تقليل التباين بين الأفراد، أي معدل إفراز الفينيل ألانين في العرق. )، وحددنا فردًا قد يكون لديه خطر أيضي مرتفع أثناء التمرين، حيث كانت معدل إفرازه أكبر من باقي المتطوعين (الشكل 1f). هنا، قسمنا الشكل 1f إلى ثلاث مناطق خطر أيضي، حيث كانت أقل من أو أعلى من تم تعريفها على أنها منخفضة المخاطر أو عالية المخاطر، على التوالي، وبين القيمتين تم تعريفها على أنها مخاطر متوسطة. كانت التقسيمات تعتمد على مزيج من القيم المقاسة فعليًا من المشاركين في هذه الدراسة وأبحاث علوم الرياضة المماثلة. . أخيرًا، من خلال تطبيع تركيزات مؤشرات العرق حسب معدلات العرق لتقليل التباين بين الأفراد، لوحظت علاقات مشابهة بين مستويات الفينيل ألانين في العرق والمصل في شخصين مختلفين (الشكل 1g)، مما يشير إلى إمكانية قياس الفينيل ألانين في العرق لإدارة الرعاية الصحية الشخصية غير الغازية. بينما كانت هناك عدة تقدمات رائدة وهامة مؤخرًا في استشعار الأحماض الأمينية في العرق لم يتم بعد إجراء تحقيق شامل في آليات تقسيم الأحماض الأمينية بالتزامن مع اكتشاف معدل التعرق وتطبيعه بسبب نقص التحليل متعدد الأبعاد القائم على قياسات معدل التعرق الإضافية بالتوازي (الشكل 1h). علاوة على ذلك، فإن استخدام مؤشرات التعرق الأخرى التي يتم قياسها بشكل شائع وتحليلها بالاشتراك مع قياسات معدل التعرق لمراقبة الصحة كان أيضًا ناقصًا. .

التوصيف الكهروكيميائي لمستشعر E-MIP

أظهر القطب الكهربائي E-MIP أكسدة كهربائية تحفيزية متفوقة للفينيل ألانين (Phe) مقارنةً بالقطب الكهربائي غير المطبوعة E-NIP بسبب قلة مواقع الربط على القطب E-NIP التي يمكن للفينيل ألانين الوصول إليها (الشكل 2أ؛ انظر أيضًا الملاحظة التكميلية 1 والشكل التكميلية 11). بالإضافة إلى ذلك، كان للقطب الكهربائي الذهبي وقطب MIP القائم على البوليبيرول (PPY) استجابات ضئيلة للفينيل ألانين بسبب نقص المجموعات الوظيفية الفعالة. تشير هذه النتائج التجريبية إلى أن الأكسدة الكهربائية للفينيل ألانين تحدث بشكل أسهل على القطب E-MIP مقارنةً بالقطب الكهربائي الآخر الذي تم اختباره. تتفق هذه النتائج مع المحاكاة النظرية بين الجزيئات (DFT) المستخدمة لحساب عدد نقل الإلكترونات بين الأقطاب الكهربائية وجزيئات الفينيل ألانين تحت تأثير مجال كهربائي خارجي (الشكل 2ب، ج والشكل التكميلية 9). مكنت إضافة مواقع ربط محددة ومجموعات وظيفية نشطة داخل E-MIP من الأكسدة الكهربائية التحفيزية المباشرة والانتقائية والحساسة للفينيل ألانين (الجدول التكميلية 2).
يمكن الكشف عن زيادة محددة جيدًا في قراءات ذروة التيار من خلال مسح DPV في وجود تركيزات متزايدة من الفينيل ألانين من 10 إلى (الشكل 2د). تم تحديد علاقتين خطيتين: (ط) من 10 إلى التي كانت لديها حساسية قدرها وحدود الكشف (LOD) من ; و (ii) من 300 إلى التي كانت لديها حساسية من (الشكل 2e). كتحكم، أظهر تجربة مقارنة باستخدام قطب E-NIP استجابات أصغر بشكل ملحوظ لتركيزات Phe المماثلة (الشكل 2f). تم أيضًا تمييز هذا الاختلاف بين MIP و NIP في الحل بواسطة الفولتمترات الدورية (CV) وطيف الامتصاص الكهربائي (EIS) (الشكل 2g والشكل التكميلي 12). من الجدير بالذكر أن EIS تم قياسه في أكدت الفينول أن إلكترود E-MIP هو مادة أكثر ملاءمة للأكسدة الكهربائية للفينول لأن الميل المناسب (-0.88) المشار إليه في مقاومة واربورغ قريب من -1 (الشكل 2 ح والملاحظة التكميلية 1).
أظهر مستشعر الفينيل ألانين القائم على E-MIP تمييزًا انتقائيًا لهدف الفينيل ألانين، وتمييزًا فعالًا ضد الأحماض الأمينية الأخرى في العرق بتركيزات عالية ذات صلة فسيولوجيًا (الشكل 2i)، إلى جانب مجموعة متنوعة من المواد المداخلة الشائعة في العرق (الشكل 2j والشكل التكميلي 13). في الوقت نفسه، أظهر أيضًا انتقائية في التعرف على الشكل اللولبي L مقارنة بالشكل D بسبب استخدام L-Phe كقالب مطبوع (الشكل التكميلي 13). يمكن تشكيل طبقة MIP المعالجة كهربائيًا بشكل قابل للتوسع على أقطاب الذهب المتبخرة، مما أدى إلى تكرارية عالية من حيث اتساق الدفعة إلى الدفعة واستقرار القياسات المتتالية المستمرة (الشكل 2k والأشكال التكملية 14، 15). تم تقييم تأثير تغييرات الرقم الهيدروجيني على استجابات مستشعر الفينيل ألانين من الرقم الهيدروجيني 6 إلى الرقم الهيدروجيني 11، مما أشار إلى استجابة مستقرة نسبيًا بين الرقم الهيدروجيني 7.0 والرقم الهيدروجيني 9.5 (الشكل 2l، الشكل التكميلي 16، والملاحظة التكملية 1). ومع ذلك، فإن عرق الإنسان حمضي ضعيف (الرقم الهيدروجيني 5 إلى الرقم الهيدروجيني 7)، مما دفعنا إلى دمج طريقة ميكروفلويديك لتخفيف الرقم الهيدروجيني المحايد لقياس الفينيل ألانين في العرق بدقة في نظام الرقاقة الحيوية لدينا.

تصميم وتوصيف أداء الميكروفلويديات متعددة الأغراض

تم تصنيع الوحدة الدقيقة متعددة الأغراض للسوائل الدقيقة لأجهزة استشعار العرق Phe القابلة للارتداء عن طريق النقش بالليزر، والذي شمل تشكيل القنوات وأوراق الفلتر بالإضافة إلى تجعيد السطح (انظر الطرق للحصول على التفاصيل). تم دمج كل طبقة وظيفية من السوائل الدقيقة في اتجاه عمودي، مما أدى إلى هيكل ثلاثي الأبعاد دقيق (الشكل 3أ). كانت السوائل الدقيقة الناتجة قادرة على تحسين جمع العرق بدقة زمنية أعلى لاستشعار العرق، بالإضافة إلى خدمة الأغراض التالية: 1) تحسين المدخل والحجرة لجمع العرق بسرعة وتجديده؛ 2) قنوات تدفق مرئية ومتعرجة لتقييم حالة فقدان العرق في الموقع؛ و 3) الحفاظ على بيئة محلول محايد الحموضة وذات قوة أيونية عالية للكشف الدقيق عن Phe في العرق.
أولاً، أدى الجمع بين زيادة عدد الفتحات وتصميم فتحة بيضاوي بدلاً من الدائرية إلى زيادة مساحة العينة لجمع العرق. في الوقت نفسه، أدى وجود ورق الترشيح داخل غرفة الاستشعار أيضًا إلى تقليل حجم الغرفة التي تحتاج إلى أن تُملأ بالعرق الم collected (الملاحظة التكميلية 3 والشكل التكميلية 17). مع معدل العرق المقاس تجريبيًا ( كمدخل لمعدل تدفق السائل، حققت التآزر بين هذين التحسينين الهيكليين ملءً سريعًا لحجرة الاستشعار في حالة وجود اثني عشر مدخلًا (حوالي 8 دقائق من بدء التمرين) (الشكل 3ب). تُظهر تحليل العناصر المحدودة (FEA) لعملية ملء الماء/الهواء ذات الطورين (الشكل 3ج، الشكل التكميلي 18، والفيديو التكميلي 1) توافقًا مع الصور الزمنية التجريبية لملء العرق في متطوع أثناء التمرين. علاوة على ذلك، أظهرت المحاكاة العددية أيضًا أن تضمين ورق الفلتر يمكن أن يسرع وي homogenize عملية التجديد، والتي تُشير إلى الوقت المستغرق لتعديل تركيز المذاب القديم في الحجرة إلى تركيز جديد أثناء تدفق العرق (الشكل 3د، هـ، الشكل التكميلي 19، والفيديو التكميلي 2).
ثانياً، تم إدخال طبقة ثلاثية علوية في الهيكل الميكروفلويدي العمودي للحصول على حجم قناة تدفق كافٍ لقراءة فقدان العرق مع التحكم في المساحة الكلية للجهاز (الملاحظة التكميلية 3 والشكل التكميلية 20). باختصار، الانعكاسية/النفاذية التفاضلية للضوء المرئي عند -dots يؤدي إلى تغيير مرئي واضح في لون قناة التدفق الحلزونية (تعرج واحد يتوافق مع دقة الحجم من ) في الحالات الفارغة والمملوءة بالماء (الشكل 3f و g والأشكال التكميلية 21 و 22)، الذي يمكّن من قراءة تدفق مرئية لتقدير معدل/حجم العرق على الجلد. للتحقق من هذه القدرة، تم استخدام نطاق فسيولوجي من معدلات التدفق الثابتة (من 0.5 إلى تم حقن ) في الميكروفلويديات بواسطة مضخة حقن. تم تحويل مواقع ملء السائل القابلة للقراءة مع مرور الوقت إلى معدلات تدفق تم قياسها بالعين المجردة، مما يظهر تطابقًا بين معدلات التدفق المحقونة والمقاسة (الشكل 3h.
ب
إلكترود مع حقل كهربائي
باني-إمب 3.924 e
باني-إن-نيب 3.013 e
بي بي واي – إي – ني بي 2.861 e
أو 2.757 e


الشكل 2 | توصيفات مستشعر E-MIP لكشف الفينيل ألانين. أ مسح DPV لقطب E-MIP القائم على PANI (PANI-E-MIP)، وقطب E-NIP القائم على PANI (PANI-ENIP)، وقطب E-MIP القائم على PPY (PPY-E-MIP)، وقطب الذهب (Au) في PBS يحتوي على في. مقارنة عدد نقل الإلكترونات بين أقطاب مختلفة وجزيء الفينيل ألانين داخل مجال كهربائي خارجي. د، هـ مسح DPV لجهاز استشعار الفينيل ألانين القائم على E-MIP للكشف المباشر عن الفينيل ألانين بعد تصحيح الخط الأساسي (د) وقراءات التيار الذروي المقابلة (هـ). الإدراج، الأسطح الكهربائية الجزيئية للأقطاب E-MIP والفينيل ألانين. أشرطة الخطأ ( القياسات) تتوافق مع الانحراف المعياري (SD). مقارنة الاستجابة بين أقطاب E-MIP و E-NIP لتركيزات متساوية من الفينيل ألانين في PBS. مسح CV لأقطاب MIP المختلفة المستندة إلى PANI وقطب ذهب في محلول يحتوي على و استجابات EIS لـ E-MIP
إلكترود، إلكترود MIP، وإلكترود Au في محلول PBS يحتوي على ف. انتقائية مستشعر E-MIP ضد الأحماض الأمينية الأخرى. تمت إضافة المواد التالية بالتتابع: 1 مللي مول من الجلايسين (Gly)، 1 مللي مول من السيرين (Ser)، ألانين (ألا) الهيستيدين (His) تير تريبتوفان (Trp)، و اختيارية مستشعر E-MIP ضد المواد المداخلة الشائعة في العرق في وجود فهي. تم إضافة العوامل المداخلة التالية بالتتابع: الجلوكوز (Glu)، 5 مللي مول من اليوريا، 5 مللي مول من اللاكتات (LA)، و حمض الأسكوربيك (AS). تباين أداء مستشعر E-MIP من دفعة إلى أخرى في وجود بي. تشير أشرطة الخطأ إلى الانحراف المعياري ( أجهزة استشعار مستقلة). يمثل مركز أشرطة الخطأ القيمة المتوسطة. 1 تأثير تغييرات الرقم الهيدروجيني على تيارات الذروة والجهود المحتملة المقابلة. تشير المربع المتقطع إلى نطاق الرقم الهيدروجيني مع استجابات DPV المستقرة.
و الشكل التوضيحي الإضافي 23). بالإضافة إلى ذلك، تم استخدام خوارزمية رؤية الكمبيوتر لقراءة فقدان العرق تلقائيًا (الملاحظة التكميلية 3). بناءً على ذلك، تم قياس معدلات عرق التمرين لجزئين متماثلين من الجسم (الجبهة والساعد) لثمانية متطوعين لإظهار جدوى تصميم هذه التصوير (الشكل 3i، الشكل التوضيحي الإضافي 24، والجدول التوضيحي الإضافي 3)، والذي يمكن استخدامه لـ
التحقيق بشكل شامل في العلاقة بين فقدان الأحماض الأمينية وفقدان الماء أثناء التمرين.
ثالثًا، تم قطع ورق فلتر عازل pH محايد قابل للتخلص والاستبدال بالليزر ودمجه داخل غرفة الاستشعار في الميكروفلويديات. تم حقن تمت موازنة محلول حمض اللاكتيك (LA) (pH 5.0) باستمرار ليكون حول pH 7.0 (الشكل 3j)، مما يظهر
الشكل 3 | تصميم وخصائص الميكروفلويديات متعددة الأغراض لجمع العرق. أ عرض طبقة تلو الأخرى لتصميم جهاز الميكروفلويديات. تحفيز عددي للوقت المطلوب لملء الحجرة لأعداد وأشكال مختلفة من المداخل مع ورق الترشيح المدمج. ج مقارنة بين النتائج المحاكاة والتجريبية لعملية أخذ عينة العرق/الملء. تطور الزمن لتركيز الفينيل ألانين المتوسط لعملية التجديد في الحجرة بدون أو مع ورق الفلتر المدمج. التحليل العددي لعميات التجديد الميكروفلويدية بدون أو مع ورق الفلتر المدمج. المنطقة المميزة بالخط المتقطع تمثل منطقة شاذة يصعب تجديدها. صور للميكروفلويديات أثناء التمرين على الجلد (يمين) وميكروغراف بصري للعرق المتدفق في القناة الميكروسكوبية المرئية (يسار، عرض مكبر لجبهة العرق). شريط القياس، الانعكاسية البصرية لـ
قنوات فارغة مع أو بدون -نقاط وقنوات مملوءة بـ -نقاط. تم قياس معدلات التدفق بالعين المجردة عند مواضع ملء السوائل المختلفة تحت معدلات حقن المضخة لـ ، أو تم قياس معدلات التعرق بواسطة الخوارزمية من جزئين من الجسم لثمانية أشخاص أصحاء خلال 10 إلى 20 دقيقة من التمرين. قدرة التخفيف عند درجة حموضة محايدة لورق الفلتر المدمج في غرفة الميكروفلويديك. ملاحظة: لم تكن هناك أشرطة خطأ هنا، ولكن تم قياس نطاقات درجة الحموضة بواسطة أوراق اختبار درجة الحموضة الملونة. تغيرات استجابة المستشعر ) ومسحات DPV المقابلة ( ) ناتج عن حقن أحجام مختلفة من عينات العرق. في الزاوية، صورة للرقاقة الحيوية. مسح DPV لنظام الوايرلس المتكامل عند معدلات تدفق مختلفة (من 0.5 إلى ).
القدرة على تخزين العرق في ظروف pH محايدة لأكثر من 40 دقيقة أثناء التمرين الشديد مع معدل عرق مرتفع باستمرار . بعد دمج الميكروفلويديات متعددة الأغراض لأخذ عينات العرق والتخزين المؤقت، بالإضافة إلى دائرة مرنة متطابقة لقياس DPV القابلة للارتداء (الشكل 3k، الإطار)، تم التحقق من استشعار الفينيل ألانين اللاسلكي والمستمر بواسطة حقن حلول مستهدفة متتالية (عينات عرق خام) بمعدلات عرق فسيولوجية (الشكل 3k-m والشكل التكميلية 25). عند حقن عينات العرق بشكل مستمر، حافظ أداء المستشعر على استجابة مستقرة (أقل من تغيير) مع الأول حقن العرق (الشكل 3k، l)، والذي يتوافق مع القدرة على تخزين الرقم الهيدروجيني المحايد المذكورة سابقًا في الميكروفلويديات. أظهرت النتائج أن ورق الفلتر المدمج القابل لتخزين الرقم الهيدروجيني في الميكروفلويديات يمكن أن يخفف بشكل فعال من تأثير تغييرات الرقم الهيدروجيني وكذلك قوة الأيونات على
استجابة المستشعر ضمن توقعات التصميم. علاوة على ذلك، تم الحصول على استجابة مستقرة للمستشعر في نطاق درجة حرارة الجلد الفسيولوجية (الشكل التوضيحي 26). والأهم من ذلك، أن المستشعر المتكامل أظهر أيضًا قراءات DPV مستقرة لاستشعار الفينيل ألانين عند معدلات تدفق مختلفة من 0.5 إلى (الشكل 3م)، مما يكشف أن التغيرات في معدل التعرق كان لها تأثير ضئيل على استجابات المستشعر. كما قمنا بدمج جهاز استشعار انتقائي للأيونات مستشعر في هذا النظام متعدد الوسائط لمراقبة وإدارة التمارين بشكل أكثر شمولاً (الشكل التوضيحي الإضافي 27).

تقييم المستشعر لتقييم مخاطر التمثيل الغذائي أثناء التمرين

يمكن ارتداء جهاز استشعار العرق المتكامل متعدد الوسائط بشكل مناسب لقياس وعرض مستويات الفينيل ألانين والكلوريد وفقدان العرق أثناء التمرين (الشكل 4 أ-ج، الفيديو التكميلي 3، والفيديو 4).
الشكل 4 | تقييم الجسم للرقاقة الحيوية متعددة الوسائط القابلة للارتداء لتحليل العرق أثناء التمارين الديناميكية وتقييمه. أ صور لموضوع يرتدي الرقاقة الحيوية على الجبين وواجهة تطبيق الهاتف الذكي. لقطة شاشة لإطار من فيديو التحقق من المستشعر. ج عرض رقيق ومرن لأداء المستشعر. مقياس، 1 سم. د مخطط كتلة الأجهزة للدائرة المرنة لمستشعر العرق. هـ مراقبة مستمرة في الوقت الحقيقي لفقدان العرق (الزاوية العليا اليسرى)، كلوريد العرق (الزاوية السفلى اليسرى) وتركيزات الفينيل ألانين (اليمين) مع بيانات DPV المقابلة من 0.4 إلى 0.6 فولت لكل مسح تم الحصول عليها من جبهة الموضوع رقم 1. قياس العرق الديناميكي Phe (f) والرسم البياني الصندوقي والشعري المقابل في مجموعتين من الذكور: مجموعة النحيفين/العاديين ( المشاركين) ومجموعة الوزن الزائد ( الموضوعات). الفرق في مستويات الفينيل ألانين في العرق التي تم جمعها لاثنين
المجموعات ذات دلالة إحصائية (اختبار ويلكوكسون لرتب المجموعتين ذو الاتجاهين، ; تمثل نهايات الصندوق النسب المئوية 25 و75. الخط الأفقي في كل صندوق يمثل الوسيط. تمثل الشعيرات العليا والسفلى القيم القصوى والدنيا، على التوالي، والتي تشير إلى نطاق قيم البيانات غير الشاذة. معدلات إفراز الفينيل ألانين في العرق لثمانية أشخاص تم حسابها من خلال معدل العرق وتركيز الفينيل ألانين خلال 10 إلى 20 دقيقة من التمرين. هناك ارتباط إيجابي قوي بين الأحماض الأمينية في العرق ومستويات الفينيل ألانين للتحقق من معدل إفراز الفينيل ألانين في العرق كمؤشر يعكس فقدان الأحماض الأمينية في العرق لتقييم المخاطر الأيضية المرتبطة بالتمرين. البيانات مستندة إلى 28 عينة عرق تم جمعها من المجموعتين (عدم وجود بيانات عن الشخص رقم 3 بسبب انخفاض حجم العرق في جبهته). الخط الصلب يمثل خط الاتجاه الملائم خطيًا.
يمكن للدائرة المرنة المتطابقة تنفيذ جهد تحفيز DPV وقياس OCP التفاضلي بالإضافة إلى استرجاع ومعالجة ونقل الإشارات الحيوية متعددة الأنماط المقابلة (الشكل 4d). كعرض للتحقق من المستشعر (الفيديو التكميلي 3)، تم وضع المستشعر متعدد الأنماط على جبهة متطوع صحي (الموضوع رقم 1) خلال تجربة تمرين الدراجة عند شدة معتدلة.
حوالي معدل ضربات القلب الأقصى ] لمدة 40 دقيقة في غرفة ذات مناخ محكم (22 إلى إلى الرطوبة النسبية).
تم حساب معدل التعرق من حجم العرق الملتقط وبلغ مستوى أقصى خلال المرحلة الأولية من التعرق. ، ثم انخفض حتى الاستقرار (الشكل 4e). تنبع هذه الاتجاهات من تنظيم الحرارة، والتكيف، والتوازن لـ
استجابة الجسم لحمولة التمرين كما هو متوقع في الوقت نفسه، كان هناك اتجاه متزايد في تركيزات كلوريد العرق أثناء التمرين. والأهم من ذلك، أن قياس الفينيل ألانين في الوقت الحقيقي أظهر أيضًا اتجاهًا متناقصًا (الشكل 4e) لأن فقدان الفينيل ألانين الداخلي من البلازما يهيمن تدريجياً بينما يتناقص المساهمة من الأحماض الأمينية الجلدية. . لوحظت اتجاهات مماثلة كما ذُكر أعلاه في تمرين منخفض الشدة مثل الجري الخفيف (حوالي ) بمعدلات تعرق أقل (الشكل التوضيحي 28). إن القياس المتزامن لأنواع مؤشرات التعرق الثلاثة المذكورة أعلاه يُظهر قدرة شريحة البيو المتكاملة لدينا على استشعار التعرق متعدد الأنماط. من بينها، ساعد القياس المتزامن لتركيز الفينيل ألانين ومعدل التعرق في تقييم كمي لفقدان الأحماض الأمينية الناتج عن التمرين، وبالتالي يساعد في تحديد الأفراد الذين لديهم مخاطر أيضية مرتبطة بالتمرين، والذين لديهم معدل إفراز فينيل ألانين مرتفع نسبيًا (الشكل 4f). .
لإظهار التطبيق العملي، اخترنا ثمانية متطوعين ذكور ذوي خصائص فسيولوجية مختلفة من بين 16 موضوعًا تم تجنيدهم سابقًا لمراقبة مستويات Phe في العرق تحت نفس ظروف التجربة كما هو موضح أعلاه. لوحظ اتجاه انخفاض مماثل في جميع الموضوعات، بينما كانت تركيزات Phe في العرق أقل في الموضوعات ذوي الوزن الزائد ( ) مقارنة بالموضوعات النحيفة (BMI<25) وفقًا لتصنيف BMI (الشكل 4f والجدول التكميلي 3). تم إجراء تحليل غير معلمي للتباين (اختبار ويلكوكسون لمجموع الرتب) للمقارنة الإحصائية، مما كشف عن فرق كبير بين المجموعتين ( ; *** ) (الشكل 4g). يدعم هذا الفرق أن الأشخاص ذوي الوزن الزائد يميلون إلى أن تكون لديهم مستويات أقل من Phe في العرق مقارنة بالأشخاص النحيفين بسبب تأثير تخفيف التركيز الناتج عن حجم/معدل العرق المفرط . بالاقتران مع الارتباط السلبي السابق بين معدل العرق وتركيز Phe (الشكل 1b)، تشير هذه النتائج إلى أن آلية تقسيم Phe في العرق قد تعزى بشكل رئيسي إلى النقل السلبي من السائل بين الخلايا (ISF) أو الدم بالإضافة إلى من الجلد نفسه.
تم حساب معدلات إفراز Phe في العرق لجميع الموضوعات من خلال قياس وضرب معدلات العرق وتركيزات Phe (الشكل 4h)، وهو مؤشر مهم ومناسب لتقييم مستوى فقد الأحماض الأمينية أثناء التمرين دون تباين بين الأفراد وفقًا للتحليل الإحصائي (الشكل التكميلي 29). للتحقق من هذه الطريقة، حددنا تركيزات الأحماض الأمينية المقابلة لجميع عينات العرق من أجل تحليل العلاقة بين الأحماض الأمينية في العرق ومستويات Phe وحصلنا على معامل ارتباط بيرسون مرتفع قدره 0.862 (الشكل 4i). لذلك، كما هو متوقع، يمكن لمعدل إفراز Phe في العرق أن يشير بشكل موثوق إلى فقد الأحماض الأمينية المساعد بواسطة العرق أثناء التمرين، وهو مفيد لتقييم مخاطر التمثيل الغذائي أثناء التمرين ولتوجيه المكملات الغذائية المحتملة لمعالجة الفقد في العرق والحفاظ على توازن النيتروجين . نظرًا لمعدل إفراز Phe في العرق الذي كان أكبر بشكل ملحوظ مقارنة بالمتطوعين الآخرين (الشكل 4h)، تم تحديد الموضوع # 2 كفرد لديه فقد كبير من الأحماض الأمينية المساعد بواسطة العرق ومرشح لمكملات البروتين بعد التمرين.

تقييم مستشعر Phe في العرق لإدارة النظام الغذائي وارتباط المصل

كما تم التأكيد أعلاه وتم الإبلاغ عنه سابقًا , فإن مستويات الأحماض الأمينية في العرق تعزى بشكل رئيسي إلى تقسيم ISF أو الدم مع تقدم التعرق. وفقًا لذلك، بالإضافة إلى استخدامه العملي في إدارة التمرين، فإن مستشعر Phe في العرق له تطبيقات إضافية لفهم العلاقة بين مستويات Phe في العرق مقابل المصل مثل حالة إدارة النظام الغذائي (الشكل 5a). على الرغم من أنه تم الإبلاغ عن أن مستويات الأحماض الأمينية في العرق مرتبطة بمستويات الأحماض الأمينية في الدم ، إلا أن ارتباطها الأيضي أثناء التمرين لم يتم دراسته بشكل جيد، خاصة بالنسبة للأحماض الأمينية غير NMF.
لتقييم استخدام مستشعرات العرق لدينا لتقييم مستويات Phe في المصل بشكل غير تدخلي، تم إجراء دراسة تجريبية لمراقبة Phe في العرق بشكل مستمر وكمية Phe المقابلة في المصل على ممثلين (الموضوعات # 1 و 5) من مجموعتين BMI قبل وبعد تناول البروتين (الشكل 5b-f). في كل مرحلة لاحقة من التعرق أثناء التمرين
(الاستقرار بعد 30 دقيقة)، أدى تناول النظام الغذائي البروتيني إلى زيادة مستويات Phe في العرق في كلا الموضوعين، بينما تم قياس مستويات منخفضة بعد الراحة (الشكل 5b). علاوة على ذلك، يشير الانخفاض المتتالي لمستويات Phe في المرحلة الأولية من التعرق أثناء التمرين (10 دقائق) إلى استهلاك Phe من الجلد وتجديده غير المناسب (الشكل التكميلي 30). ومع ذلك، لم تظهر مستويات Phe المقاسة بعد 20 دقيقة هذا الاتجاه في التغيير. بالاقتران مع الظاهرتين المختلفتين المذكورتين أعلاه، يمكن استنتاج أن Phe في الجلد في العرق لم يعد سائدًا في هذا الوقت، بل تم استبداله بالمساهمة من الدم. من المهم أن كان هناك مدى أكبر من تقلب نسبة Phe (خاصة لتغيرات العرق) في الموضوع ذي الوزن الزائد مقارنة بالموضوع النحيف، وهو ما يُحتمل أن يكون بسبب ظروف الأيض المختلفة (الشكل التكميلي 31).
بالإضافة إلى ذلك، كان هناك أيضًا ارتباط إيجابي قوي بين Phe في العرق ومستويات الأحماض الأمينية (الشكل 5c)، مما يوضح إمكانية استخدام مستشعر العرق لدينا لإدارة النظام الغذائي من خلال تقييم كل من التغيرات في مستويات Phe في المصل وفقد الأحماض الأمينية في العرق. هنا، تم التحقق من دقة مستشعر Phe في العرق لاختبار عينات العرق البشرية من خلال اختبار المناعية المرتبطة بالإنزيم (ELISA) باستخدام مجموعات Phe التجارية (الشكل 5d). اعتبارًا من الاستقرار لمستوى Phe في العرق أثناء التمرين كمؤشر مقارن مع مستويات Phe المقابلة في المصل التي تم قياسها بواسطة الكروماتوغرافيا السائلة عالية الأداء مع مطياف الكتلة (LC-MS) (الشكل التكميلي 32)، لوحظ توافق جيد في تغيرات المستوى بين Phe في العرق والمصل قبل وبعد تناول البروتين (الشكل 5e). لوحظت معاملات ارتباط بيرسون عالية قدرها 0.878 (الموضوع #1) و0.947 (الموضوع #5) بين مستويات Phe في العرق والمصل (الشكل 5f، الأعلى). ومع ذلك، أشارت النتائج أيضًا إلى تباين بين الأفراد في الارتباط بين مستويات Phe في المصل والعرق بسبب الفرق الكبير في الخط الملائم. لتقليل التباين بين الأفراد، تم تطبيع تركيزات Phe في العرق لمعدل إفراز Phe في العرق من خلال الضرب بمعدل العرق المستقر الفردي أثناء التمرين. أظهر هذا المؤشر المطبع لمستوى Phe في العرق ارتباطًا قويًا مع مستويات Phe في المصل بينما كان له أيضًا ميل مشابه للخط الملائم بين الموضوعين (الشكل 5f، الأسفل). من المحتمل أن يكون الفرق في تقاطع الخط بسبب الفرق في الخصائص الفسيولوجية للموضوعات ومحتوى Phe على سطح الجلد. علاوة على ذلك، أصبح الارتباط الإيجابي بين Phe في العرق والمصل أقوى بعد تطبيع معدل العرق (الشكل التكميلي 33). باختصار، من خلال إدخال معدلات العرق لتقليل التباين بين الأفراد، تعتبر معدلات إفراز Phe في العرق مؤشرًا مناسبًا محتملاً للتحقيق في الارتباط بين Phe في المصل والعرق. على هذا النحو، فإن قدرة مستشعراتنا على اكتشاف كل من مستويات Phe في العرق ومعدلات العرق تعرض قدرة متفوقة لتقييم مستويات Phe في المصل مقارنة بخيارات المستشعر المتاحة الأخرى، وتدعم جدوى استكشاف الفينيل ألانين كعلامة حيوية في العرق.

التوافق الحيوي

نظرًا لأن الشريحة الحيوية قد تحتاج إلى ارتدائها لفترة طويلة في تطبيقات إدارة النظام الغذائي، فقد أجرينا أيضًا اختبار توافق حيوي للشريحة الحيوية. كخط خلوية جلدية تمثيلية، تم زراعة الكيراتينوسيتات البشرية الخالدة (HaCaT) على الشريحة الحيوية كمجموعة تجريبية، بينما تم زراعة HaCaT في وسط فارغ كمجموعة تحكم. كما هو موضح في الشكل 5g، تظهر صور المجهر الفلوري حالة بقاء خلايا HaCaT بعد 2 أو 4 أيام من الحضانة. لم يكن هناك انخفاض كبير في نسبة بقاء خلايا HaCaT على الشريحة الحيوية مقارنة بمجموعة التحكم (الشكل 5h)، مما يشير إلى أن الشريحة الحيوية آمنة للاستخدام لفترات طويلة ومناسبة للكشف المتعدد الأوضاع عن العرق في إدارة النظام الغذائي.

المناقشة

لقد قدمنا شريحة حيوية قابلة للارتداء متكاملة للكشف المتعدد الأوضاع عن تركيزات Phe والكلوريد في العرق بالإضافة إلى مستويات فقد العرق (الحجم والمعدل). تم الإبلاغ عن طريقة فريدة لاستشعار Phe تعتمد على MIP المقلد للإنزيمات المنقوشة بـ Phe التي تسمح بالأكسدة الكهروكيميائية المباشرة لـ Phe بحساسية عالية و
الشكل 5 | تحليل Phe في العرق في الموقع لتقييم مستويات المصل وتأثيرات تناول النظام الغذائي البروتيني. أ مسار التمثيل الغذائي لـ Phe جنبًا إلى جنب مع تقلبات Phe في المصل والعرق الناتجة عن تناول البروتين أثناء التمرين. التغيرات الديناميكية لمستويات Phe في العرق من موضوعين ذوي BMI مختلف في ثلاث فترات من التمرين، بما في ذلك قبل وبعد تناول النظام الغذائي البروتيني وكذلك بعد الراحة. بيانات DPV من 0.4 إلى 0.6 فولت. ج الارتباط بين الأحماض الأمينية في العرق ومستويات Phe في تجربة تناول التمرين من موضوعين مختلفين. د تركيزات Phe المقاسة بواسطة المستشعر في عينات العرق مقابل قراءات ELISA المقابلة. تم قياس البيانات من جميع العرق
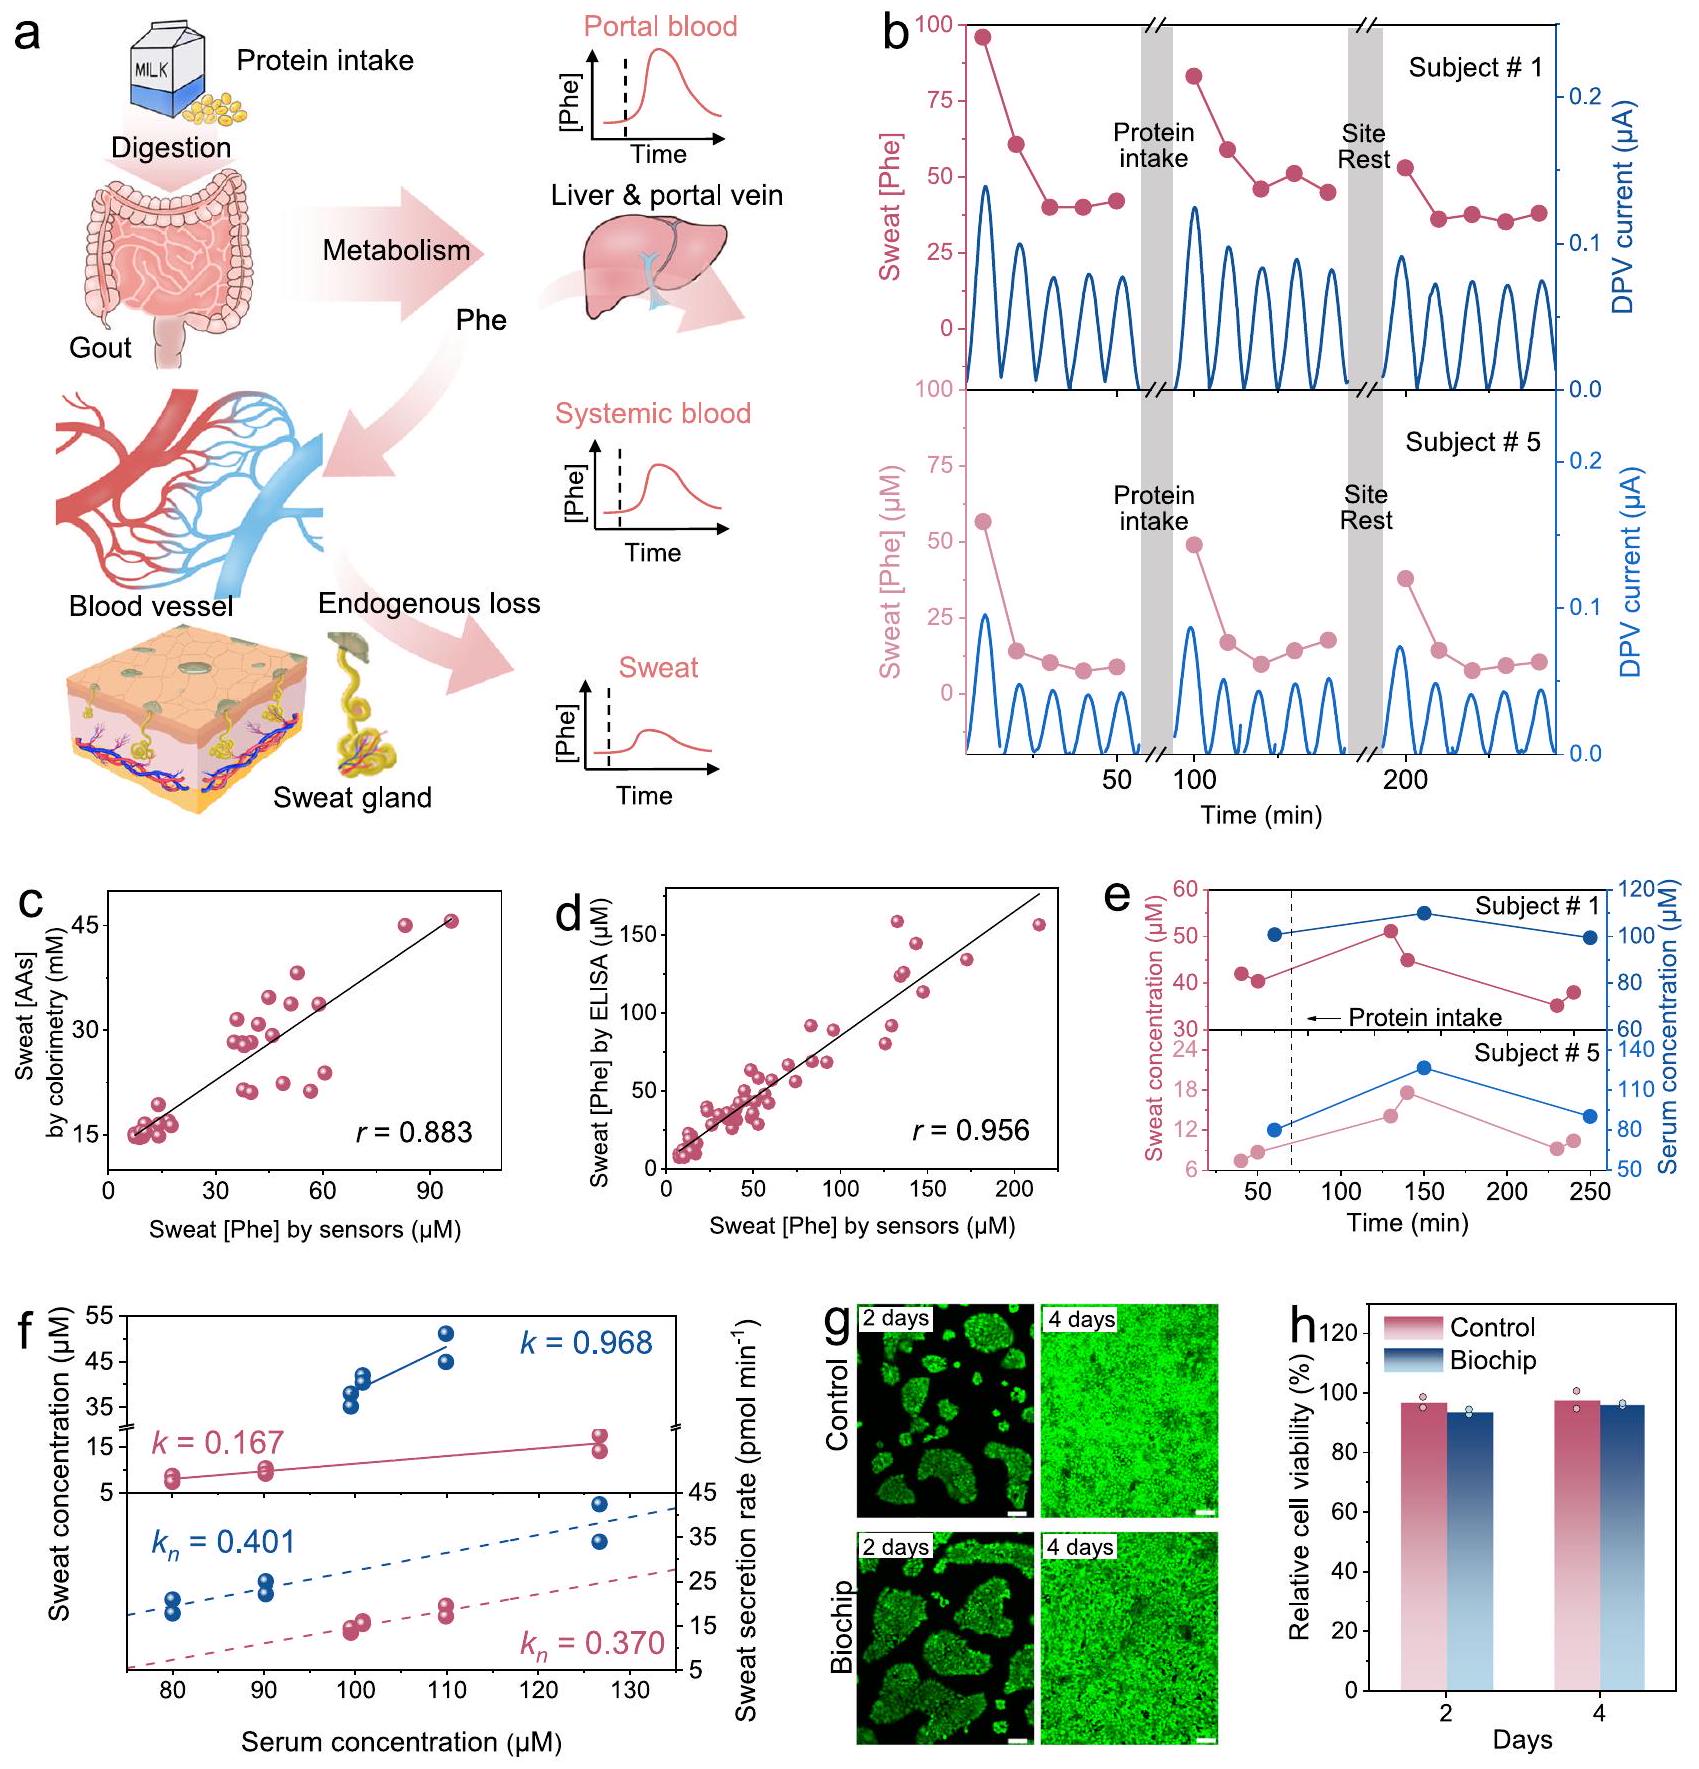
عينات تم جمعها في تجربة التقييم المذكورة أعلاه. الخط الصلب يمثل خط الاتجاه الملائم خطيًا. دراسة مقارنة لمستويات الفينيل ألانين في العرق والمصل في ثلاث فترات من التمرين من الموضوع #1 (الأعلى) والموضوع #5 (الأسفل).
العلاقات بين مستويات الفينيل ألانين في العرق والمصل قبل (الأعلى) وبعد (الأسفل) تطبيع معدل العرق من شخصين مختلفين. تمثل الخطوط خطوط الاتجاه الملائمة. صور المجهر الفلوري (g) ونسبة بقاء الخلايا النسبية (h) لخلايا HaCaT بعد 2 أو 4 أيام من الحضانة في اختبار التوافق الحيوي تجارب مستقلة). شريط القياس، .
اختيارية لمراقبة العرق. علاوة على ذلك، تم تصميم ميكروفلويديك متعدد الأغراض بشكل متقن من خلال تقنية النقش بالليزر القابلة للتوسع ومنخفضة التكلفة لتحقيق أهداف متعددة، بما في ذلك تخزين درجة الحموضة المحايدة للعرق للكشف المستقر عن الفينيل ألانين، وأخذ عينات سريعة من العرق وتجديدها لتحقيق دقة زمنية عالية، ورؤية تدفق العرق لفقدان العرق القابل للقراءة. من خلال دمج هذين النهجين المتكاملين والمفيدين بشكل متبادل، يتيح النظام القابل للارتداء الذي يتم ارتداؤه على سطح الجلد المراقبة المستمرة والموثوقة والسريعة.
كشف تركيزات الفينيل ألانين جنبًا إلى جنب مع القراءة المتاحة والمرئية لفقدان العرق أثناء التمرين. يمكن أن تركز التحسينات المحتملة في النظام على تطوير قراءات مستمرة لفقدان العرق من خلال الطرق الكهربائية لتطبيقات أكثر تنوعًا.
لإظهار القيمة العملية لشريحة البيو متعددة الأنماط المصممة بشكل جيد، استخدمنا نظامنا لتحديد علاقة سلبية بين مستويات الفينيل ألانين في العرق ومعدلات العرق بين الأفراد، و
لذا نقوم بتحليل الآلية المحتملة لتقسيم الفينيل ألانين. بالإضافة إلى ذلك، قمنا بدمج هذين المؤشرين كمؤشر جديد، وهو معدل إفراز الفينيل ألانين في العرق، لتقييم المخاطر الأيضية الناتجة عن التمارين الرياضية بشكل كمي لدى مجموعتين مختلفتين من حيث مؤشر كتلة الجسم. أخيرًا، أجرينا دراسة تجريبية لفهم العلاقة الأيضية لمحتوى الفينيل ألانين في العرق مقابل المصل قبل وأثناء وبعد تناول نظام غذائي غني بالبروتين أثناء ممارسة الرياضة، مما يكشف عن ارتباطات عالية ومشابهة بينهما في شخصين بعد تطبيع معدل العرق. جميع هذه النتائج توضح أن التحديد المتزامن لتركيز الأحماض الأمينية في العرق ومعدل العرق يمكن أن يوفر رؤى جديدة وقيمة في تقييم الحالة الأيضية ومستويات الدم المقابلة. للتغلب على محدودية بيانات المشاركين في الدراسة، ستتضمن الأعمال المستقبلية التحقيق في مزيد من المشاركين ذوي الحالات الأيضية المختلفة لتوسيع بيانات إثبات المفهوم هنا وبناء ارتباط أقوى بين مستويات الفينيل ألانين في العرق والمصل من خلال أخذ تأثير تخفيف العرق في الاعتبار. ستفتح مثل هذه الأساليب الطريق لمجموعة من سيناريوهات التطبيقات السريرية، مثل إدارة نظام غذائي منخفض الفينيل ألانين غير الغازي والشخصي لمرضى الفينيل كيتون يوريا. والأهم من ذلك، فإن اكتشافنا أن الأحماض الأمينية غير NMF في العرق تنبع أساسًا من فقدان الأحماض الأمينية في البلازما مع تقدم عملية التعرق يمكن أن يمتد إلى أنواع أخرى. يمكن استخدام هذه القدرات القياسية لدراسة المزيد من ارتباطات الأحماض الأمينية في العرق والمصل وآليات تقسيمها التفصيلية بمساعدة استشعار العرق متعدد الأنماط في الدراسات اللاحقة.

طرق

تصنيع وتحضير مستشعر العرق

تم تصميم قناع مكون من أربعة أقطاب مسبقًا وتم نقشها على ورق ملصقات PET مع خلفية لاصقة بواسطة قاطع ليزر ياقوت الألومنيوم (YAG) (سوتشو إنغو ليزر، الصين). تم لصق القناع المنقوش بالليزر على فيلم PET بسمك (هوانان شيانغتشينغ تكنولوجيا، الصين)، وطبقات تم ترسيب (20/50 نانومتر) على فيلم PET عبر التبخر الحراري. لتحضير مستشعر RE والكلوريد، تمت أولاً فرشوة الحبر (ALS، اليابان) بشكل موحد على مناطق مستشعر RE والكلوريد المحددة مسبقًا، ثم تم إزالة القناع المرفق على فيلم PET. بعد التجفيف طوال الليل في البيئة المحيطة، تم الحصول على النقي تم استخدامه كمادة حساسة لمستشعر الكلوريد. أما بالنسبة للـ RE الشائع، كوكتيل يحتوي على تم إسقاط 2 ملغ من بولي (فينيل بوتيرال) (PVB)، و2 ملغ من بولي (إيثيلين غليكول)-كتل-بولي (بروبيلين غليكول)-كتل-بولي (إيثيلين غليكول) (F127)، و0.2 ملغ من MWCNTs في 1 مل من الميثانول على في منطقة RE.
توضح عملية تحضير مستشعر PANI-MIP لاستشعار الفينيل ألانين في الشكل التوضيحي 4. قبل عملية البوليمرة، تم طلاء القطب الذهبي المتبخر حرارياً في منطقة WE بالتنقيط وتم تنظيفه بمحلول بيرانا. تمت عملية تخليق إلكترود E-MIP بالكامل في خلية تقليدية ذات ثلاثة أقطاب مزودة بمحطة عمل كهربائية CHI 760E (CH Instruments، الولايات المتحدة الأمريكية). تم إعداد محلول البوليمر عن طريق إذابة 10 مللي مول من L-Phe و10 مللي مول من الأنيلين في محلول ملحي مخفف بمؤشر فوسفات (PBS) بتركيز 0.01 م. ). ثم تم إجراء البوليمرة الكهربائية بواسطة الفولتمترية الدورية من -0.4 إلى 0.9 فولت مقابل القطب المرجعي القياسي (SCE) لعدد أربع دورات بمعدل مسح . بعد البلمرة، تم تحقيق الإلكتروإيليوشن من خلال خطوات متعددة الجهد (MPS) تم التبديل بينها أربعين مرة بالتناوب بين 0.9 و -0.9 فولت (كل مدة جهد ثابتة 100 ثانية) مقابل SCE، مما يؤدي إلى الأكسدة الزائدة/التحلل الكهربائي لمصفوفة MIP القائمة على PANI لاستخراج القوالب، وبالتالي ينتج عن ذلك قطب E-MIP مع مواقع ربط انتقائية ونشطة كهربائياً. بعد ذلك، تم غمر القطب الناتج في PBS (pH 7.0) لعمليات المسح المتكررة DPV (نفس المعايير المستخدمة في قياس Phe، انظر أدناه للتفاصيل) حتى تم الحصول على استجابة مستقرة. بالنسبة لتحضير أقطاب NIP و E-NIP، تم تطبيق نفس طريقة التحضير المستخدمة في MIP و E-MIP، باستثناء جزيء Phe كالقالب خلال خطوة البوليمرة الكهربائية.

توصيف مستشعر العرق

تمت جميع التوصيفات في المختبر للمستشعرات المحضرة باستخدام محطة عمل كهربائية CHI 760 E في ( الرقم الهيدروجيني 7.0 ). تم تحديد استجابة مستشعر الكلوريد من خلال قياسات الجهد المفتوح (OCP) مع تركيزات كلوريد متنوعة. تم إجراء تحليل DPV لمستشعر Phe القائم على E-MIP والأقطاب الأخرى المقابلة للمقارنة عند تركيزات Phe الفسيولوجية المتنوعة. كانت معلمات DPV: النطاق من 0.4 إلى 0.7 فولت؛ الجهد المتزايد 0.001 فولت؛ السعة 0.03 فولت؛ عرض النبضة 0.05 ثانية؛ عرض العينة 0.02 ثانية؛ فترة النبضة 0.1 ثانية؛ الحساسية لـ . قبل كل مسح DPV، تم تطبيق جهد ثابت قدره 0.4 فولت عبر WE و RE لمدة 2 ثانية لتعزيز ارتباط الفينيل ألانين المشحون سلبًا بالقطب الكهربائي وكبح المواد المتداخلة المحتملة وتراكم المنتجات. تم تفصيل قياس EIS والمعلمات في الملاحظة التكميلية 1. تم اختبار دراسة الانتقائية لمستشعر الفينيل ألانين من خلال إضافة المواد المتداخلة بشكل متتابع بتركيزات عالية ذات صلة فسيولوجيًا. تم دراسة اعتماد استجابة مستشعر الفينيل ألانين على الرقم الهيدروجيني من خلال مسحات DPV في تم ضبط PBS (pH 7.0) بمدى pH مختلف من 11 إلى 3 باستخدام هيدروكسيد الصوديوم أو حمض الهيدروكلوريك، وتم قياسه بواسطة مقياس pH دقيق (Sunne، الصين). تم تقديم جميع قراءات التيار الذروي لماسحات DPV بعد تصحيح خط الأساس المستقيم القياسي.
تمت دراسة شكل المادة باستخدام المجهر الإلكتروني الماسح فائق القوة (FSEM) (هيتاشي هاي-تك، اليابان) والمجهر الذري (AFM) (بروكير، الولايات المتحدة الأمريكية). تم قياس طيف الأشعة تحت الحمراء بواسطة تحويل فورييه (FTIR) باستخدام الانعكاس الكلي المخفف (ATR) في مطياف الأشعة تحت الحمراء (تيانجين غانغدونغ، الصين).

منهجية المحاكاة الحاسوبية للتفاعلات الجزيئية

تم إجراء جميع الحسابات الكيميائية الكمومية باستخدام حزمة برامج Gaussian 16. تم تحسين الهياكل الهندسية للهدف (Phe) ومعقدات ما قبل البلمرة باستخدام DFT مع الوظيفة الهجينة B3LYP وتصحيح التشتت من Grimme بإصدار D3 (تخفيف Becke-Johnson). انظر الملاحظة التكميلية 2 للحصول على التفاصيل.

تصنيع وتجميع وتوصيف الميكروفلويديات متعددة الأغراض

تم تصنيع الطبقات الخمس المجمعة عمودياً من الميكروفلويديات بالكامل بواسطة النقش بالليزر باستخدام قاطع الليزر YAG. تم تصميم جميع الأنماط التي تحتاج إلى النقش بالليزر مسبقًا باستخدام أوتوكاد. من الأعلى إلى الأسفل، تم استخدام طبقة الغطاء العلوي من فيلم PET الشفاف ( سم، يمكن استخدام سمك أقل) مع مستشعر العرق المعد مسبقًا وتمت معالجة سطحها بواسطة وضع النقش بالنقاط لإنتاج نقاط محفورة بمقياس ( نقاط). كانت هذه الطريقة في معالجة السطح بواسطة النقش بالليزر قابلة للتطبيق أيضًا على الركائز المرنة أو القابلة للتمدد (الشكل التكميلي 20). تم قطع شريط لاصق مزدوج الجانب أكثر سمكًا ( سم، 9495 LE، 3 M، الولايات المتحدة) كطبقة قناة التدفق مع نمط الحجرة وقناة ميكروية متعرجة ( عرض) لاستيعاب حجم لكل قناة متعرجة. تم قطع طبقة العزل من فيلم PI الداكن ( سم) من الحجرة لربط قنوات التدفق والدخول عموديًا عبر الحجرة وتوفير خلفية داكنة لتحسين الرؤية (الشكل التكميلي 21). ثم، تم قطع شريط لاصق مزدوج الجانب أقل سمكًا ( سم، 7982، Crown، الصين) كطبقة قناة الدخول مع فتحات بيضاوية ونمط الحجرة. أخيرًا، تم دمج وتقطيع ضمادة طبية لاصقة على الجلد (Tegaderm، 3 M، الولايات المتحدة) في عملية التجميع لتشكيل طبقة التفاعل مع الجلد مع فتحات بيضاوية. من خلال قطع علامات تقاطع على كل طبقة للتوافق والتوجيه، تم تكديس الطبقات ثنائية الأبعاد الأصلية عموديًا وتوجيهها سائلًا لتشكيل هياكل ثلاثية الأبعاد متعددة الطبقات وخالية من التسرب. هنا، تم تشكيل الحجرة لتخزين العرق واستشعاره بواسطة ثلاث طبقات (طبقة قناة التدفق، العزل، وطبقة قناة الدخول) جميعها تحتوي على نمط الحجرة. A
ورقة فلتر بنمط الحجرة (Whatman، الولايات المتحدة) تم تغطيسها وتجفيفها بواسطة محلول فوسفات (pH 7.5 إلى pH 7.8) تم تضمينه داخل الحجرة لتوفير عازلة pH محايدة.
لتوصيف الميكروفلويديات متعددة الأغراض، تم استخدام مضخة حقن (Longer، الصين) وتم توصيلها بمدخل متطابق الحجم للميكروفلويديات بواسطة إبرة فولاذية. تم تقييم قدرة ورقة الفلتر المدمجة على عزل pH المحايد من خلال قياس نطاق pH التقريبي لمحلول حمض اللاكتيك المحقون والمخزن الذي تم جمعه عند المخارج عبر أوراق اختبار pH (pH 5.4 إلى 7.0، Newstar، الصين). تم إجراء تجربة قياس معدل التدفق من خلال مقارنة معدلات الحقن الثابتة ( و و ) بمعدلات التدفق المحسوبة من خلال قسمة الحجم المملوء القابل للقراءة على الوقت المستغرق. علاوة على ذلك، تم استخدام إعداد مشابه في دراسة الطاولة لتقييم قدرة النظام القابل للارتداء الذي يدمج مستشعرات العرق والميكروفلويديات لاستشعار Phe بدقة واستقرار لاسلكي. تم نقل بيانات DPV المقاسة إلى جهاز كمبيوتر عبر Bluetooth لمزيد من تصحيح الخط الأساسي وتنعيم البيانات. لقياس الخصائص البصرية لتصميم قناة التدفق المرئي، تم استخدام مقياس الطيف UV/VIS (Shimadzu، اليابان) مع وحدة كرة متكاملة لتمكين قياسات النفاذية والانعكاسية للهياكل المشابهة للحجرة، بما في ذلك القنوات الفارغة مع أو بدون -نقاط وقنوات مملوءة بالماء مع

-نقاط (الشكل 3g والشكل التكميلي 22).

محاكاة عددية لديناميات العرق في الميكروفلويديات

تم إجراء جميع المحاكاة باستخدام COMSOL Multiphysics 6.0. للتحقق من سلوك التدفق تحت أخذ عينات العرق من الميكروفلويديات مع اثني عشر مدخلًا، تم استخدام وحدة ديناميكا السوائل الحسابية (تدفق ذو مرحلتين، واجهة مستوى المجموعة) لمحاكاة عملية ملء الماء مع/بدون ورقة الفلتر (مجال الوسائط المسامية) في الشكل التكميلي 18. علاوة على ذلك، كما هو موضح في الشكل التكميلي 19، تم أيضًا محاكاة عملية نقل الكتلة من خلال ربط واجهة نقل الأنواع المخففة وواجهات التدفق الطبقي لتحليل وقت التجديد للميكروفلويديات مع/بدون ورقة الفلتر (مجال الوسائط المسامية). انظر الملاحظة التكملية 3 للحصول على التفاصيل.

وحدة الدائرة المرنة اللاسلكية وتطبيق الهاتف الذكي
تقوم وحدة الدائرة المرنة اللاسلكية بتنفيذ شكل موجة جهد DPV التحفيزي وقياس OCP التفاضلي بالإضافة إلى استرجاع إشارات القراءة ومعالجتها ونقلها. كجوهر لوحدة الدائرة المرنة، تم برمجة متحكم دقيق ARM Cortex-M3 32 MHz ultra-lowpower STM32L15C8T6 (MCU) لتسهيل وظائف النظام. لعملية مسح DPV، تم تطبيق شكل موجة الجهد التحفيزي بنفس المعلمات السابقة عبر WE وRE من خلال محول رقمي إلى تماثلي (DAC) بدقة 12 بت مدمج في MCU. تم استخدام فلتر RC منخفض التمرير من الدرجة الثانية لتثبيت جهد RE بشكل أكبر. تم استخراج استجابة التيار من WE بواسطة مرحلة مضخم مقاومة النقل (TIA)، التي نقلت إشارة التيار إلى قراءة جهد ثم تم قراءتها بواسطة محول تماثلي إلى رقمي (ADC) بدقة 12 بت مدمج في MCU. تم تحقيق قياس OCP بعد مسح DPV بواسطة مضخم تفاضلي AD8227ARMZ لتنفيذ تكوين مضخم أدوات فعال. تم استخدام مفتاح تماثلي لتبديل وضع القياس للدائرة المرنة.

تم نقل البيانات الخام بعد ذلك لاسلكيًا عبر Bluetooth (E104BT5005A) وعرضها في الوقت الحقيقي في تطبيق مخصص تم تطويره للهاتف الذكي. قبل تحويلها إلى قيم التركيز المقدمة، تم تصحيح البيانات الخام لـ DPV، وتصفيتها، وتنعيمها على التطبيق للحصول على منحنيات تيار قمة DPV موثوقة. ثم، تم الحصول على قيم التركيز في الموقع وعرضها في واجهة المستخدم، مع تسجيل منحنى مستويات Phe على مر الزمن.

مصدر الطاقة
تم تشغيل النظام بالكامل بواسطة بطارية ليثيوم أيون بوليمر قابلة للشحن بجهد 3.7 فولت بسعة وحجم مرغوبين. تم استخدام منظم انخفاض منخفض (S-1206B33-M3T1G) لتحويل وإنتاج إمدادات طاقة رقمية وتماثلية مستقرة ومنفصلة لخدمة MCU والمكونات المحيطية التماثلية، على التوالي، مما ينشئ دوائر رقمية وتماثلية منفصلة لمنع الدوائر الرقمية من التأثير على الإشارات التماثلية.

تجنيد المشاركين البشريين

تم إجراء تجارب المشاركين البشريين وفقًا للمعايير الأخلاقية للجنة البحث المؤسسية و/أو الوطنية ومع إعلان هلسنكي لجمعية الطب العالمية. تمت الموافقة على هذه الدراسة من قبل اللجنة الأخلاقية لمستشفى جامعة تيانجين الطبية العامة، تيانجين، الصين (رقم الموافقة IRB2015-YX-009). تم الحصول على البيانات بموافقة مستنيرة من جميع المشاركين. تم دفع تعويض لكل مشارك يتراوح بين 100 إلى 300 يوان (اعتمادًا على وقت المشاركة) كتعويض عن الاختبار. يؤكد المؤلفون أن المشاركين في البحث البشري قدموا موافقة مستنيرة لنشر الصور في الشكل 4a وb، بالإضافة إلى الأفلام في مقاطع الفيديو التكملية 3 و4.
لتجنب الفروق الناتجة عن الجنس والعمر، تم تجنيد مشاركين ذكور أصحاء تتراوح أعمارهم بين 23 و27 عامًا من خلال تجنيد شفهي. تم الحصول على موافقات مستنيرة من جميع المشاركين في الدراسة قبل التسجيل في الدراسة. وفقًا لمؤشر كتلة الجسم (BMI) الخاص بهم، تم تصنيف المشاركين إلى مجموعتين تشمل مجموعة نحيفة بمؤشر كتلة جسم يتراوح بين 18.5 إلى ومجموعة زائدة الوزن بمؤشر كتلة جسم يتراوح بين 25 إلى .

اختبار النظام المتكامل على الجسم

لتحقيق التحقق من المستشعر القابل للارتداء متعدد الأنماط لتحليل العرق أثناء التمارين الديناميكية وتقييم الأيض، تم إجراء تمرين ركوب دراجة معتدل الشدة دون أي مخاطر إضافية على المشاركين البشريين على متطوعين تم تجنيدهم، بما في ذلك أربعة أشخاص نحيفين وأربعة أشخاص يعانون من زيادة الوزن (الجدول التكميلي 3). أبلغ جميع المشاركين عن حضورهم إلى المختبر بعد صيام ليلة كاملة. تم تنظيف جباههم بمسحات كحولية لإزالة الملوثات الجلدية (لا تقتصر على الأحماض الأمينية) قبل تثبيت المستشعرات على الجسم. أثناء ركوب الدراجة، تم استخدام كاميرا هاتف ذكي لالتقاط صور للمستشعر من أجل تحليل الصور الرقمية لاحقًا لحساب فقدان العرق تلقائيًا. علاوة على ذلك، تم إرسال البيانات من المستشعرات لاسلكيًا إلى واجهة المستخدم عبر البلوتوث. كل عشر دقائق، قمنا بالضغط على زر ‘DPV’ في تطبيق الهاتف الذكي لبدء مسح DPV وقياس OCP لتحديد كميات مستويات الفينيل ألانين والكلوريد على التوالي في عرق المشارك في تلك اللحظة. في الوقت نفسه، تم جمع عينات العرق أيضًا كل 10 دقائق من منطقة أخرى من جبين المشاركين باستخدام كيس بلاستيكي على شكل قمع. ثم تم تجميد عينات العرق في في أنابيب الطرد المركزي لمزيد من الاختبارات، مثل مجموعات الاختبار اللوني Phe و AAs للتحقق من صحة المستشعر.

اللونيمترية لتحليل عينات العرق

للتقدير القياسي لمستويات الفينيل ألانين، تم استخدام مجموعة ELISA ل L-Phenylalanine (Immusmol، فرنسا) لتحديد مستويات الفينيل ألانين في عينات العرق المجمعة وفقًا لتعليمات الشركة المصنعة. تم مراقبة التفاعل الكروموجيني عند 450 نانومتر باستخدام مقياس الطيف الضوئي للميكرو بلايت Multiskan SkyHigh (Thermo Fisher Scientific، الولايات المتحدة الأمريكية) وتم حساب التركيزات غير المعروفة للفينيل ألانين من خلال مقارنة امتصاصها مع منحنى مرجعي تم إعداده باستخدام معايير معروفة. للتقدير القياسي للأحماض الأمينية، تم استخدام مجموعة اختبار محتوى الأحماض الأمينية الدقيقة (Solarbio، الصين) لتحديد مستويات الأحماض الأمينية مباشرة في عينات العرق المجمعة باستخدام تحويل النينهدين، الذي يشكل مركب نينهدين-حمض أميني بنفسجي. بعد خلط جميع المواد الكيميائية والمعايير والعينات بشكل جيد، تم حضن الخلطات في حمام مائي مغلي لمدة 15 دقيقة ثم تبريدها في حمام مائي بارد لمدة 5 دقائق. تم قياس الامتصاص عند طول موجي 570 نانومتر باستخدام مقياس الطيف الضوئي للميكرو بلايت، واستخدمت لحساب تركيزات الأحماض الأمينية غير المعروفة وفقًا لـ
امتصاصية معيار الجلايسين (10 مللي مول). تم تخزين الكواشف غير المستخدمة المذكورة أعلاه في مجموعات الاختبار اللوني في ما لم يُستخدم بخلاف ذلك.

تحقق النظام مع تناول البروتين

لتقييم النظام لتقدير مستويات السيروم من الفينيل ألانين بشكل غير تدخلي، تم إجراء دراسة أولية على نظام غذائي غني بالبروتين على عينة تمثيلية من المشاركين من مجموعتين لمؤشر كتلة الجسم أثناء ممارسة الرياضة. حضر المشاركون إلى المختبر بعد صيام ليلي. عملية التجربة البشرية التفصيلية هي كما يلي: 1) تم إجراء تمرين ركوب دراجة ثابتة لمدة 50 دقيقة على المشاركين مع تحليل العرق بواسطة النظام من الجبهة كل 10 دقائق، وتم جمع عينات العرق بواسطة كيس بلاستيكي على شكل قمع لمزيد من تحليل ELISA. تم استخدام معدل العرق الذي تم قياسه في هذه المرحلة كمعامل لتطبيع مؤشر تركيز الفينيل ألانين في تحليل العرق المتعدد الوسائط اللاحق؛ 2) تم جمع عينات دم شعيرية طازجة على الفور باستخدام طريقة وخز الإصبع. بعد تنظيف طرف الإصبع بقطعة قماش كحولية وتجفيفه بالهواء، تم وخز طرف الإصبع بقلم جمع الدم المصنوع خصيصًا (Dunrse، الصين). تم جمع عينات الدم في أنابيب الطرد المركزي بعد مسح أول قطرة من الدم. تم ترك عينات الدم المجمعة في درجة حرارة الغرفة لمدة 60 دقيقة ثم تم طردها مركزيًا عند 2000 لمدة 15 دقيقة لفصل السيروم لتحليل LC-MS؛ 3) تم تقديم وجبة خفيفة غنية بالبروتين موحدة للمشاركين، بما في ذلك منتج الصويا وحليب خالص. بعد تناول الوجبة، طُلب منهم الجلوس والراحة لمدة 40 دقيقة لهضم المدخول بالكامل وامتصاص الأحماض الأمينية المتحللة؛ 4) مثلما في التمرين الأول، مارس المشاركون الرياضة لمدة 50 دقيقة بينما تم تحليل العرق بواسطة النظام القابل للارتداء وأخذ عينات لتحليل LC-MS. قبل استشعار العرق عبر الأنظمة المستخدمة سابقًا، تم استبدال ورق الفلتر المدمج في غرفة الميكروفلويديك بواحد جديد، وهو ما تم تحقيقه عن طريق تمزيق الطبقتين السفليتين القديمتين من الميكروفلويديك وإعادة تجميع الطبقتين الجديدتين. هذه العملية تجدد قدرة العازلة للـ pH للميكروفلويديك لضمان موثوقية قياس الفينيل ألانين في الفترة التالية دون الحاجة إلى مستشعر جديد؛ 5) بعد تمرين ركوب الدراجة الثاني، طُلب من المشاركين الجلوس والراحة لمدة 40 دقيقة للسماح للجسم بتنظيم ارتفاع مستويات الأحماض الأمينية الناتجة عن تناول البروتين؛ 6) مثل التمارين الأولى والثانية وكذلك عملية الاستبدال، قام المشاركون بأداء التمرين الثالث.

الكروماتوغرافيا السائلة المتصلة بمطياف الكتلة لتحليل المصل

تم تحديد تركيز الفينيل ألانين في عينات المصل باستخدام تقنية قياس الكتلة مع المراقبة المتعددة للتفاعلات (MRM)، والتي تستخدم زمن الاحتفاظ كمعامل رئيسي لتحديد المواد التحليلية. باختصار، تم تحقيق الفصل الكروماتوغرافي باستخدام نظام ACQUITY UPLC I-Class (واترز، الولايات المتحدة الأمريكية) وتم فصل الفينيل ألانين باستخدام عمود UPLC HSS T3 (واترز، الولايات المتحدة الأمريكية) بمعدل تدفق قدره تم الكشف عن الفينيل ألانين باستخدام مطياف الكتلة ثلاثي الرباعي XEVO TQ-S (واترز، الولايات المتحدة الأمريكية) المزود بواجهة تأين بالرش الكهربائي تعمل في وضع الأيونات الموجبة. تم قياس كمية الفينيل ألانين في المصل من خلال مساحة القمة باستخدام برنامج MassLynx وفقًا لمنحنى القياس المستمد من معايير الفينيل ألانين بتركيزات معروفة.

تقييم التوافق الحيوي في المختبر

تم تلقيح خلايا HaCaT (iCell Bioscience، الصين) على وسط خاص لخلايا HaCaT بكثافة خلايا لكل مسام، وزُرعت مع كل من مجموعة التحكم والرقاقة الحيوية المعقمة في حاضنة عند درجة حرارة ثابتة من تحت تم زراعة خلايا HaCaT في المختبر لمدة 48 ساعة (يومين) و 96 ساعة (4 أيام)، وغسلت مرة واحدة بمحلول PBS. تم صبغ نصفها بـ الكالسيتونين – صباحًا تم استخدام بوليميد لمدة 15 دقيقة لمراقبة عدد الخلايا الحية/الميتة، وتم حضانة النصف الآخر لمدة 4 ساعات إضافية بعد الإضافة. تم استخدام MTT (Solarbio، الصين) لمراقبة النشاط النسبي للخلايا بواسطة مقياس الطيف الضوئي المجهري.

التحليل الإحصائي

تم استخدام Origin 2018 لإجراء التناسب الخطي للبيانات المقابلة وحساب معامل ارتباط بيرسون. تم استخدام SPSS Statistics 24 لتقييم الدلالة الإحصائية. وفقًا لاختبارات شابيرو-ويلك واختبارات ليفين، كانت مجموعتا بيانات Phe من المجموعتين النحيفتين وذوي الوزن الزائد تتوافقان مع التوزيع الطبيعي وتباين التباين. لذلك، تم استخدام اختبار مجموع الرتب لويكوكسان (اختبار مان-ويتني) للمقارنة بين مجموعتي البيانات.

ملخص التقرير

معلومات إضافية حول تصميم البحث متاحة في ملخص تقارير مجموعة ناتشر المرتبط بهذه المقالة.

توفر البيانات

جميع البيانات التي تدعم نتائج هذه الدراسة متاحة ضمن المقالة وملفاتها التكميلية علىhttps://doi.org/10.6084/m9. figshare.24786486. يمكن توجيه أي طلبات إضافية للمعلومات إلى المؤلفين المقابلين، وسيتم تلبيتها من قبلهم. يتم توفير بيانات المصدر مع هذه الورقة.

توفر الشيفرة

الرموز المستخدمة في المحاكاة وقياس البيانات متاحة من المؤلف المقابل عند الطلب المعقول.

References

  1. Wu, G. Amino acids: metabolism, functions, and nutrition. Amino Acids 37, 1-17 (2009).
  2. Braverman E. R., Pfeiffer C. C., Blum K. & Smayda R. The healing nutrients within: facts, findings, and new research on amino acids. Basic Health Publications, Inc. (2003).
  3. Li, P., Yin, Y. L., Li, D., Kim, S. W. & Wu, G. Amino acids and immune function. Br. J. Nutr. 98, 237-252 (2007).
  4. Nie, C., He, T., Zhang, W., Zhang, G. & Ma, X. Branched chain amino acids: beyond nutrition metabolism. Int. J. Mol. Sci. 19, 954 (2018).
  5. Fernstrom, J. D. & Wurtman, R. J. Brain serotonin content: physiological regulation by plasma neutral amino acids. Science 178, 414-416 (1972).
  6. Hu, X. & Guo, F. Amino acid sensing in metabolic homeostasis and health. Endocr. Rev. 42, 56-76 (2021).
  7. Munro H. N. Mammalian protein metabolism. Elsevier (2012).
  8. Felig, P. Amino acid metabolism in man. Annu. Rev. Biochem. 44, 933-955 (1975).
  9. Wagenmakers, A. J. M. 11 muscle amino acid metabolism at rest and during exercise: role in human physiology and metabolism. Exerc. Sport Sci. Rev. 26, 287-314 (1998).
  10. Nasset, E. S., Heald, F. P., Calloway, D. H., Margen, S. & Schneeman, P. Amino acids in human blood plasma after single meals of meat, oil, sucrose and whiskey. J. Nutr. 109, 621-630 (1979).
  11. Atila, A. et al. The serum amino acid profile in COVID-19. Amino Acids 53, 1569-1588 (2021).
  12. Rao, T. S., Asha, M. R., Ramesh, B. N. & Rao, K. S. Understanding nutrition, depression and mental illnesses. Indian J. Psychiatry 50, 77-82 (2008).
  13. Cynober, L. A. Plasma amino acid levels with a note on membrane transport: characteristics, regulation, and metabolic significance. Nutrition 18, 761-766 (2002).
  14. Baker, L. B. & Wolfe, A. S. Physiological mechanisms determining eccrine sweat composition. Eur. J. Appl. Physiol. 120, 719-752 (2020).
  15. Baker, L. B. Physiology of sweat gland function: The roles of sweating and sweat composition in human health. Temperature 6, 211-259 (2019).
  16. Sylvestre, J. P., Bouissou, C. C., Guy, R. H. & Delgado-Charro, M. B. Extraction and quantification of amino acids in human stratum corneum in vivo. Br. J. Dermatol. 163, 458-465 (2010).
  17. Yang, D. S., Ghaffari, R. & Rogers, J. A. Sweat as a diagnostic biofluid. Science 379, 760-761 (2023).
  18. Bariya, M., Nyein, H. Y. Y. & Javey, A. Wearable sweat sensors. Nat. Electron. 1, 160-171 (2018).
  19. Luo, Y. et al. Technology roadmap for flexible sensors. ACS Nano 17, 5211-5295 (2023).
  20. Dunstan, R. H. et al. Sweat facilitated amino acid losses in male athletes during exercise at 32-34 degrees C. PLoS One 11, e0167844 (2016).
  21. Murphy, G. R. et al. Relationships between electrolyte and amino acid compositions in sweat during exercise suggest a role for amino acids and in reabsorption of and Cl – from sweat. PLoS One 14, e0223381 (2019).
  22. Jankovskaja, S. et al. Non-invasive, topical sampling of potential, low-molecular weight, skin cancer biomarkers: a study on healthy volunteers. Anal. Chem. 94, 5856-5865 (2022).
  23. Wang, M. et al. A wearable electrochemical biosensor for the monitoring of metabolites and nutrients. Nat. Biomed. Eng. 6, 1225-1235 (2022).
  24. Yang, Y. et al. A laser-engraved wearable sensor for sensitive detection of uric acid and tyrosine in sweat. Nat. Biotechnol. 38, 217-224 (2019).
  25. Pei, X. et al. A bifunctional fully integrated wearable tracker for epidermal sweat and wound exudate multiple biomarkers monitoring. Small 18, 2205061 (2022).
  26. Mukasa, D. et al. A computationally assisted approach for designing wearable biosensors toward non-invasive personalized molecular analysis. Adv. Mater. 35, e2212161 (2023).
  27. Souza, S. L., Graca, G. & Oliva, A. Characterization of sweat induced with pilocarpine, physical exercise, and collected passively by metabolomic analysis. Ski. Res. Technol. 24, 187-195 (2018).
  28. Harshman, S. W. et al. Metabolomic stability of exercise-induced sweat. J. Chromatogr. B: Anal. Technol. Biomed. Life Sci. 1126-1127, 121763 (2019).
  29. Heikenfeld, J. Non-invasive analyte access and sensing through eccrine sweat: challenges and outlook circa 2016. Electroanalysis 28, 1242-1249 (2016).
  30. Gitlitz, P. H., Sunderman, F. W. & Hohnadel, D. C. Ion-exchange chromatography of amino acids in sweat collected from healthy subjects during sauna bathing. Clin. Chem. 20, 1305-1312 (1974).
  31. Longo, N. et al. Noninvasive measurement of phenylalanine by iontophoretic extraction in patients with phenylketonuria. J. Inherit. Metab. Dis. 30, 910-915 (2007).
  32. van Spronsen, F. J. et al. Key European guidelines for the diagnosis and management of patients with phenylketonuria. Lancet Diabetes Endocrinol. 5, 743-756 (2017).
  33. Volpi, E., Kobayashi, H., Sheffield-Moore, M., Mittendorfer, B. & Wolfe, R. R. Essential amino acids are primarily responsible for the amino acid stimulation of muscle protein anabolism in healthy elderly adults. Am. J. Clin. Nutr. 78, 250-258 (2003).
  34. Swierczynski, J., Sledzinski, T., Slominska, E., Smolenski, R. & Sledzinski, Z. Serum phenylalanine concentration as a marker of liver function in obese patients before and after bariatric surgery. Obes. Surg. 19, 883-889 (2009).
  35. Dunstan, R. H. et al. Diverse characteristics of the urinary excretion of amino acids in humans and the use of amino acid supplementation to reduce fatigue and sub-health in adults. Nutr. J. 16, 19 (2017).
  36. Sonner, Z. et al. The microfluidics of the eccrine sweat gland, including biomarker partitioning, transport, and biosensing implications. Biomicrofluidics 9, 031301 (2015).
  37. Nyein, H. Y. Y. et al. Regional and correlative sweat analysis using high-throughput microfluidic sensing patches toward decoding sweat. Sci. Adv. 5, eaaw9906 (2019).
  38. Yu, Q. et al. Semisynthetic sensor proteins enable metabolic assays at the point of care. Science 361, 1122-1126 (2018).
  39. Wentland, L., Polaski, R. & Fu, E. Characterization methods in porous materials for the rational design of multi-step processing in the context of a paper microfluidic phenylalanine test. Anal. Methods 12, 768-780 (2020).
  40. Cheung, K. M. et al. Phenylalanine monitoring via aptamer-fieldeffect transistor sensors. ACS Sens 4, 3308-3317 (2019).
  41. Hsu, L.-W. et al. Simultaneous determination of l-Phenylalanine, Phenylethylamine, and Phenylacetic acid using three-color wholecell biosensors within a microchannel device. ACS Appl. Bio Mater. 3, 5120-5125 (2020).
  42. Ahmad, O. S., Bedwell, T. S., Esen, C., Garcia-Cruz, A. & Piletsky, S. A. Molecularly imprinted polymers in electrochemical and optical sensors. Trends Biotechnol. 37, 294-309 (2019).
  43. Parrilla, M., Vanhooydonck, A., Watts, R. & De Wael, K. Wearable wristband-based electrochemical sensor for the detection of phenylalanine in biofluids. Biosens. Bioelectron. 197, 113764 (2022).
  44. Sheridan, E. M. & Breslin, C. B. Enantioselective detection of D- and L-phenylalanine using optically active polyaniline. Electroanalysis 17, 532-537 (2005).
  45. He, S. et al. Electrochemical enantioselective sensor for effective recognition of tryptophan isomers based on chiral polyaniline twisted nanoribbon. Anal. Chim. Acta 1147, 155-164 (2021).
  46. Hu, Y. F., Zhang, Z. H., Zhang, H. B., Luo, L. J. & Yao, S. Z. Electrochemical determination of L-phenylalanine at polyaniline modified carbon electrode based on beta-cyclodextrin incorporated carbon nanotube composite material and imprinted sol-gel film. Talanta 84, 305-313 (2011).
  47. Zhong, B., Jiang, K., Wang, L. & Shen, G. Wearable sweat loss measuring devices: from the role of sweat loss to advanced mechanisms and designs. Adv. Sci. 9, e2103257 (2022).
  48. Sun, M. et al. A flexible and wearable epidermal ethanol biofuel cell for on-body and real-time bioenergy harvesting from human sweat. Nano Energy 86, 106061 (2021).
  49. Tu, J. et al. A wireless patch for the monitoring of C-reactive protein in sweat. Nat. Biomed. Eng. 7, 1293-1306 (2023).
  50. Torrente-Rodríguez, R. M. et al. Investigation of cortisol dynamics in human sweat using a graphene-based wireless mhealth system. Matter 2, 921-937 (2020).
  51. Zhang, X., Xia, Y., Liu, Y., Mugo, S. M. & Zhang, Q. Integrated wearable sensors for sensing physiological pressure signals and beta-hydroxybutyrate in physiological fluids. Anal. Chem. 94, 993-1002 (2021).
  52. Bi, Y. et al. Universal fully integrated wearable sensor arrays for the multiple electrolyte and metabolite monitoring in raw sweat, saliva, or urine. Anal. Chem. 95, 6690-6699 (2023).
  53. Zhao, J. et al. A wearable nutrition tracker. Adv. Mater. 33, e2006444 (2020).
  54. Sempionatto, J. R., Moon, J. M. & Wang, J. Touch-based fingertip blood-free reliable glucose monitoring: personalized data processing for predicting blood glucose concentrations. ACS Sens. 6, 1875-1883 (2021).
  55. Reeder, J. T. et al. Resettable skin interfaced microfluidic sweat collection devices with chemesthetic hydration feedback. Nat. Commun. 10, 5513 (2019).
  56. Lu Y. et al. Stretchable graphene-hydrogel interfaces for wearable and implantable bioelectronics. Nat. Electron. https://doi.org/10. 1038/s41928-023-01091-y (2023).
  57. Liu, Y. et al. Skin-interfaced superhydrophobic insensible sweat sensors for evaluating body thermoregulation and skin barrier functions. ACS Nano 17, 5588-5599 (2023).
  58. Nyein, H. Y. Y. et al. A wearable microfluidic sensing patch for dynamic sweat secretion analysis. ACS Sens. 3, 944-952 (2018).
  59. Eijsvogels, T. M. et al. The impact of obesity on physiological responses during prolonged exercise. Int. J. Obes. 35, 1404-1412 (2011).
  60. Harshman, S. W. et al. The impact of nutritional supplementation on sweat metabolomic content: a proof-of-concept study. Front. Chem. 9, 659583 (2021).

شكر وتقدير

يُعرب المؤلفون عن شكرهم العميق للدعم المالي من المؤسسة الوطنية للعلوم الطبيعية في الصين (رقم منحة NSFC 62174152، 62374159، و62022079) ومن جمعية تعزيز الابتكار للشباب في الأكاديمية الصينية للعلوم (رقم 2020115).

مساهمات المؤلفين

ب.ز.، ز.ل.، و ل.و.، صمموا البحث، ب.ز. و ل.و. كتبوا الورقة، ب.ز.، إكس.كيو.، هـ.إكس.، إل.سي.ل.، ل.ل.، ز.إكس.ل.، ز.ل.، و ل.و. أجروا التجارب، ب.ز.، ل.ل.، و ز.إكس.ل. أجروا حسابات وم simulations من المبادئ الأساسية. ب.ز.، إكس.كيو.، ج.أ.ج.، ن.-ج.سي.، ز.ل.، و ل.و. حللوا البيانات، ب.ز. و ل.سي. صمموا الدراسات البشرية. ج.أ.ج.، ن.-ج.سي.، ز.ل. و ل.و. راجعوا الورقة، ز.ل. و ل.و. أشرفوا على المشروع. جميع المؤلفين ساهموا بشكل كبير في البحث وراجعوا المخطوطة.

المصالح المتنافسة

يعلن المؤلفون عدم وجود مصالح متنافسة.

معلومات إضافية

المعلومات التكميلية النسخة على الإنترنت تحتوي على
المواد التكميلية المتاحة على
https://doi.org/10.1038/s41467-024-44751-z.
يجب توجيه المراسلات وطلبات المواد إلى ليلي وانغ.
معلومات مراجعة الأقران تشكر Nature Communications مينغ زو، هاوتيان تشين، والمراجعين الآخرين المجهولين على مساهمتهم في مراجعة الأقران لهذا العمل. يتوفر ملف مراجعة الأقران.
معلومات إعادة الطبع والتصاريح متاحة على
http://www.nature.com/reprints
ملاحظة الناشر تظل Springer Nature محايدة فيما يتعلق بالمطالبات القضائية في الخرائط المنشورة والانتماءات المؤسسية.
الوصول المفتوح هذه المقالة مرخصة بموجب رخصة المشاع الإبداعي للاستخدام والمشاركة والتكيف والتوزيع وإعادة الإنتاج في أي وسيلة أو تنسيق، طالما أنك تعطي الائتمان المناسب للمؤلفين الأصليين والمصدر، وتوفر رابطًا لرخصة المشاع الإبداعي، وتوضح ما إذا كانت هناك تغييرات قد أُجريت. الصور أو المواد الأخرى من طرف ثالث في هذه المقالة مشمولة في رخصة المشاع الإبداعي للمقالة، ما لم يُذكر خلاف ذلك في سطر الائتمان للمادة. إذا لم تكن المادة مشمولة في رخصة المشاع الإبداعي للمقالة وكان استخدامك المقصود غير مسموح به بموجب اللوائح القانونية أو يتجاوز الاستخدام المسموح به، ستحتاج إلى الحصول على إذن مباشرة من صاحب حقوق الطبع والنشر. لعرض نسخة من هذه الرخصة، قم بزيارةhttp://creativecommons.org/licenses/by/4.0/.
© المؤلفون 2024

  1. المختبر الوطني الرئيسي للهياكل الفائقة والميكروهياكل، معهد أشباه الموصلات، الأكاديمية الصينية للعلوم، بكين 100083، الصين. مركز علوم المواد والهندسة الضوئية، جامعة الأكاديمية الصينية للعلوم، بكين 100049، الصين. مختبر تيانجين الرئيسي لانتقال سرطان الرئة وبيئة الورم، معهد سرطان الرئة في تيانجين، مستشفى تيانجين الطبي العام، تيانجين 300052، الصين. مدرسة الهندسة الكيميائية ومركز أبحاث النانو الحيوية الانتقالية، جامعة سونغكيوكوان، سوون 16419، جمهورية كوريا. مدرسة علوم المواد والهندسة، جامعة نانيانغ التكنولوجية، 637553 سنغافورة، سنغافورة. البريد الإلكتروني:liliwang@semi.ac.cn

Journal: Nature Communications, Volume: 15, Issue: 1
DOI: https://doi.org/10.1038/s41467-024-44751-z
PMID: https://pubmed.ncbi.nlm.nih.gov/38245507
Publication Date: 2024-01-20

Interindividual- and blood-correlated sweat phenylalanine multimodal analytical biochips for tracking exercise metabolism

Received: 18 October 2023
Accepted: 3 January 2024
Published online: 20 January 2024

Check for updates

Bowen Zhong , Xiaokun Qin , Hao , Lingchen Liu , Linlin , Zhexin , Limin Cao , Zheng Lou © , Joshua A. Jackman © , Nam-Joon Cho & Lili Wang (1)

Abstract

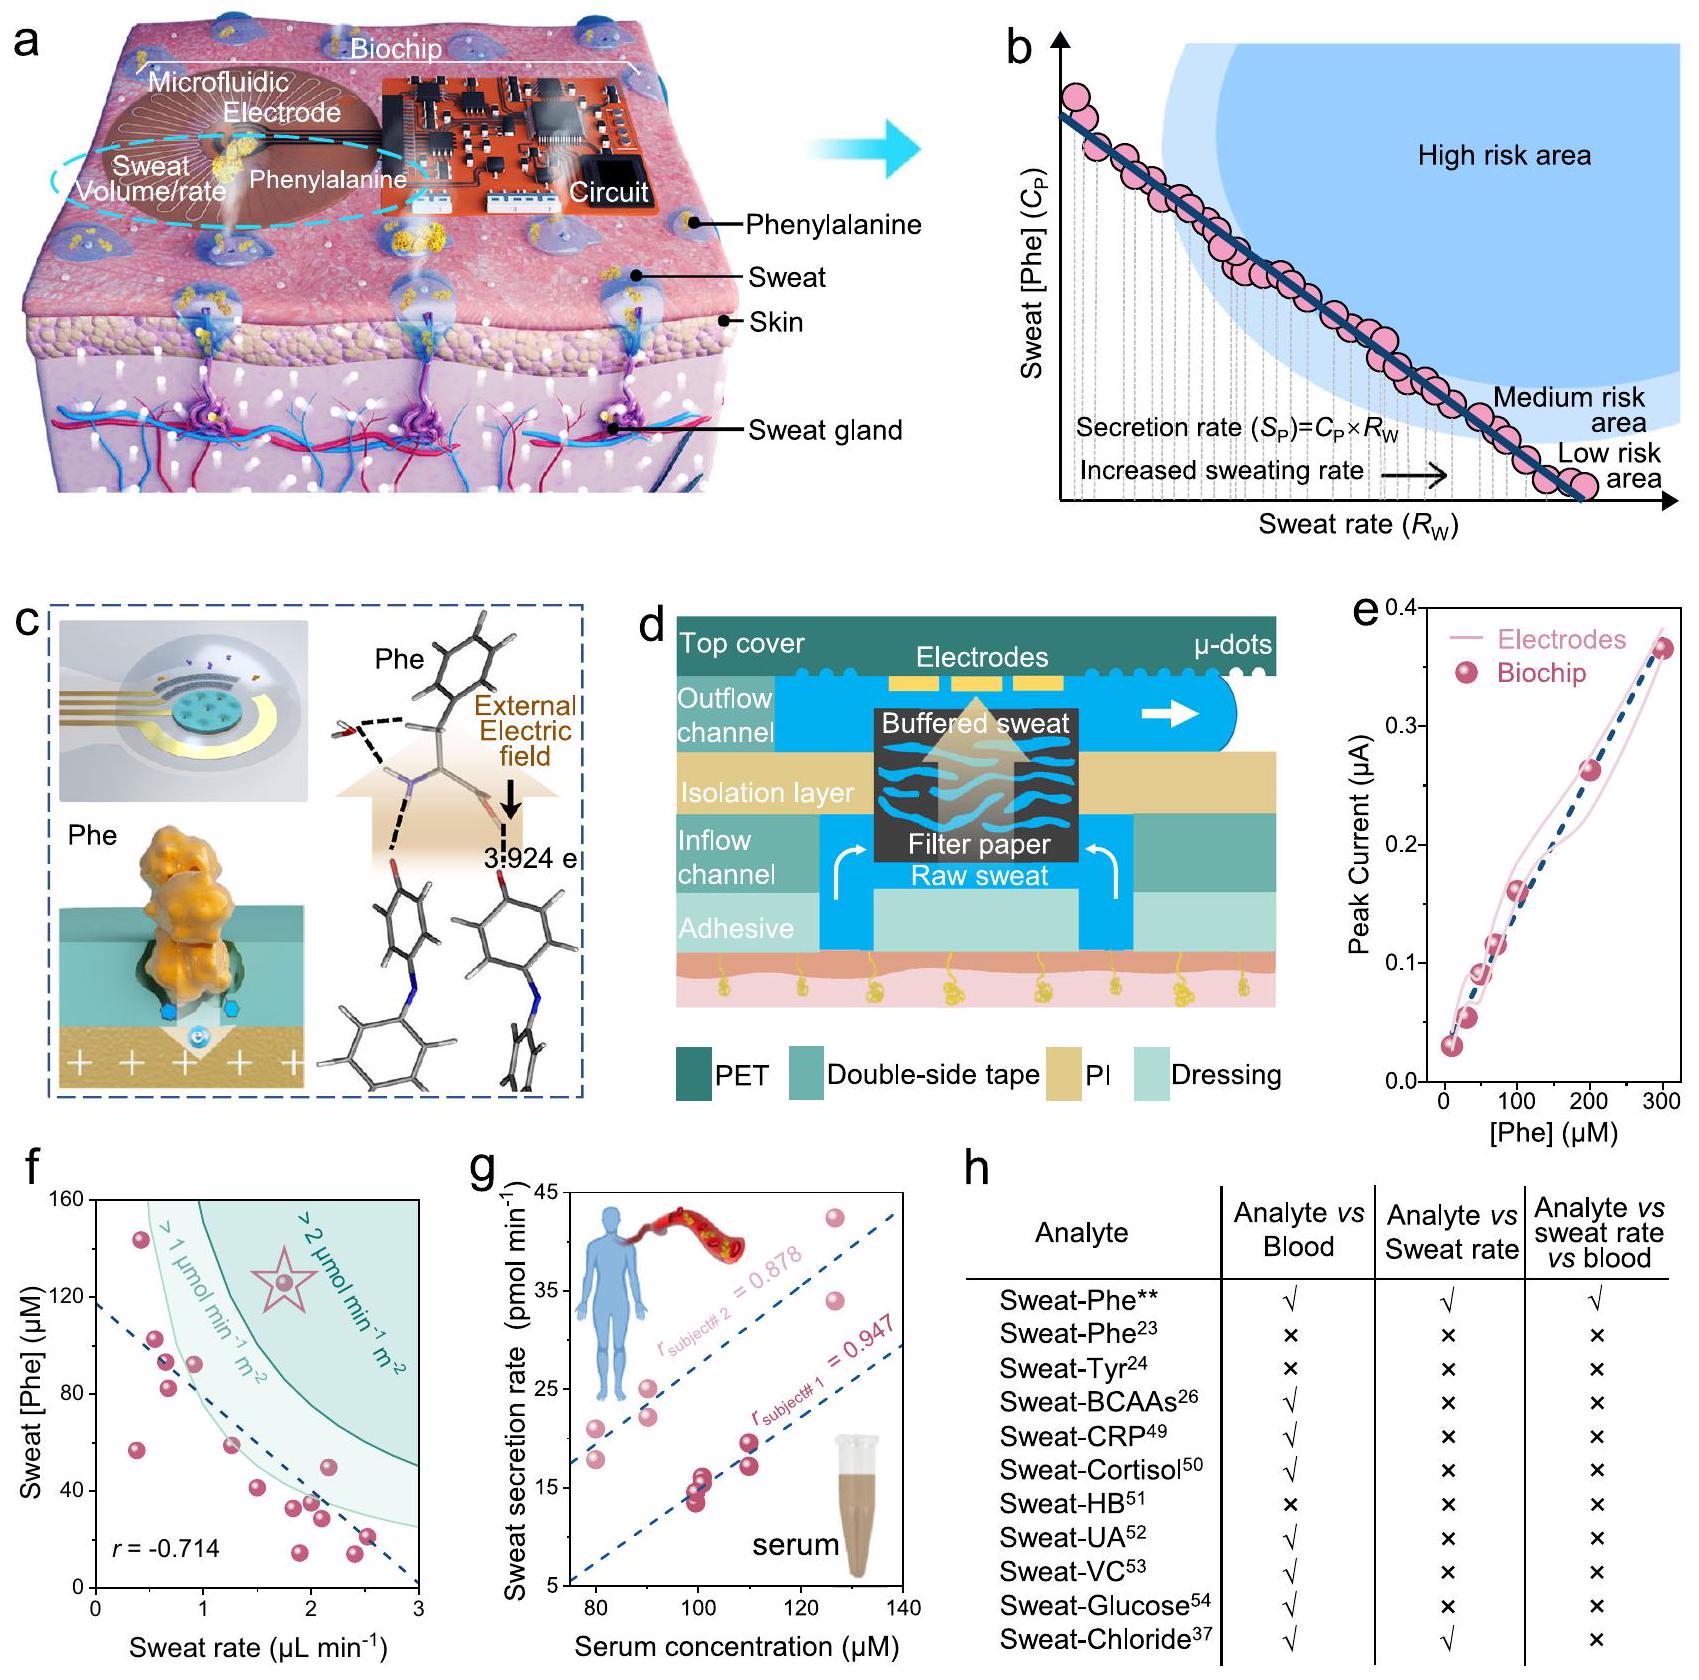
In situ monitoring of endogenous amino acid loss through sweat can provide physiological insights into health and metabolism. However, existing amino acid biosensors are unable to quantitatively assess metabolic status during exercise and are rarely used to establish blood-sweat correlations because they only detect a single concentration indicator and disregard sweat rate. Here, we present a wearable multimodal biochip integrated with advanced electrochemical electrodes and multipurpose microfluidic channels that enables simultaneous quantification of multiple sweat indicators, including phenylalanine and chloride, as well as sweat rate. This combined measurement approach reveals a negative correlation between sweat phenylalanine levels and sweat rates among individuals, which further enables identification of individuals at high metabolic risk. By tracking phenylalanine fluctuations induced by protein intake during exercise and normalizing the concentration indicator by sweat rates to reduce interindividual variability, we demonstrate a reliable method to correlate and analyze sweat-blood phenylalanine levels for personal health monitoring.

Amino acids (AAs) are the building blocks of life and essential for the synthesis of proteins that play a critical role in human growth, maintenance, immunity, and reproduction . In addition to proteinbound forms, free AAs are metabolic reactants and products that participate in a range of vital biological processes to maintain body function and homeostasis, including nutrition, metabolism, and physiological regulation . Free AAs are present in all biofluids and tissues of the body, and their levels are associated with body status, such as exercise, diet, infection, disease, and psychology . Thus, the analysis of free AAs in biofluids holds practical significance for assessing health conditions. Among various biofluids, the biomarker utility of sweat AAs has received less attention except for
skin diseases because they arise from both the endogenous loss of plasma and the presence of AAs on the skin surface , which are referred to as natural moisturizing factors (NMF) (Fig. 1a). The presence and contamination of NMFs in sweat has proven a critical challenge in the development of wearable sweat biosensors for AA monitoring . Fortunately, recent studies have shown promising results indicating that the contribution of skin-leached AAs like NMFs to sweat is diminished and may eventually be exhausted with prolonged exercise duration, especially for AAs with low skin prevalence (non-NMFs) . Consequently, measured sweat AA concentrations can be indicative of their blood levels and further serve as reliable biomarkers for assessing physiological status, which
Fig. 1 | Schematics of wearable multimodal biochip for assessing exercise metabolic risk and serum correlation through sweat analysis. a Schematic of the biochip on skin for multimodal sweat sensing and two sources of sweat Phe, including skin surface and blood partitioning. b Indicative negative correlation between sweat Phe concentrations and sweat rates among individuals, along with the calculation method of Phe secretion rate (inlets area of ) and the division of different metabolic risk areas. c Mechanism of the E-MIP electrode for detecting Phe by direct electrocatalytic oxidation and theoretical simulation of charge transfer between the E-MIP electrode and a Phe molecule under an external electric field. The red arrow represents the direction of the electric field. Working
principle and cross-section of the microfluidic module with vertically assembled structure. e Comparation of Phe DPV responses of the integrated wireless system and pristine electrodes. Correlation of sweat rates and Phe levels among individuals at the same exercise time point, along with division of different sweat Phe secretion rates. The starred data indicates the subject with the highest secretion rate in this study. Data from 16 healthy subjects. Correlations of sweat and serum Phe level in two subjects. The dashed lines represent linear-fitted trendlines. h Comparison of recent advances in sweat sensing. **: this work, Tyr tyrosine, BCAAs branched chain amino acids, CRP C-reactive protein, HB -hydroxybutyrate, UA uric acid, VC Vitamin C.
provides attractive opportunities for non-invasive and convenient health monitoring.
Practically, wearable sweat AA biosensors are still at an early stage of progress, and existing biosensors can only detect a limited number of AAs in sweat . There are still many AAs in sweat that remain to be explored and studied by wearable biosensors and hence applied to health practical scenarios according to their uncovered, potential blood correlations . Phenylalanine (Phe), an essential AA, is present in sweat but has only a low presence on the skin surface (non-NMF) and
is hypothesized to partition into sweat via diffusion due to its small size and nonpolar side chain properties . These physicochemical characteristics suggest that Phe would be useful as a sweat biomarker, especially since its sweat concentration could likely be correlated with blood Phe levels . From a healthcare perspective, Phe concentration testing is utilized to assess various nutrition and disease statuses. For Phenylketonuria (PKU) patients, blood Phe testing is an important tool for early diagnosis in neonatal screening and ongoing dietary therapy throughout life . Fluctuations in Phe concentrations are also linked to
muscle protein metabolism during exercise , liver dysfunction in obesity , and viral infection severity . Importantly, there is a strong and direct correlation between Phe and overall AA levels in sweat , suggesting the potential to further incorporate sweat loss measurements to quantify sweat AA loss to assess metabolic status during exercise. In this regard, tracking exercise metabolism and assessing risk by monitoring sweat AA losses can avoid a net negative nitrogen balance due to depletion of free AAs resources, which leads to fatigue and pain during exercise . Additionally, simultaneous measurement of Phe concentration and sweat rate can be used to determine the source of sweat Phe (i.e., secretion mechanism) at different stages of exercise sweating. By enabling an interindividual comparison with multiple human subjects, the obtained correlation between these two indicators can also be used to study the mechanism of sweat Phe partitioning from blood . Understanding the mechanisms of sweat Phe partitioning and secretion paves the way for more sophisticated modeling to account for the sweat rate , which may produce a stronger relationship between sweat and blood Phe levels among individuals.
Recent efforts in the portable detection of blood or urine Phe concentrations mainly rely on molecular recognition elements (e.g., antibodies and aptamers), which are faced with challenges such as high cost, low stability, extensive washing requirements, and potential bioreactivity . By contrast, electrochemical sensors that do not depend on bio-affinity interactions are widely considered more suitable to fulfill the design requirements of wearable devices, especially considering their low cost and ease of fabrication . Since Phe is nonelectroactive for common electrode materials such as gold, carbon, and graphene, there are two reported approaches for wearable electrochemical measurements to detect Phe, including electroactive derivatization of Phe and indirect detection using redox probes . The former approach can only enable one-time Phe measurements , making it hardly adaptable for continuous and long-term wearable measurement. As for the latter, redox probes have been combined with molecularly imprinted polymers (MIP) to indirectly detect nonelectroactive , but the sensitivity of this method is relatively lower than the direct oxidation of analytes due to a nonlinear inverse relation between AA concentrations and peak current changes. Therefore, a wearable sensor for sweat Phe detection based on direct signal transduction has not yet been demonstrated (Supplementary Table 1). Moreover, simultaneous measurement of sweat AA levels and sweat rates as well as their combined analysis have also not been demonstrated and thus far disregarded in the field of wearable sweat sensing (Fig. 1h), due to lack of a convenient and reliable approach for quantifying sweat rate.
In this article, we present a wearable multimodal biochip for sensing multiple indicators, including sweat Phe and chloride concentrations, as well as sweat rate, which can together enable quantitative assessment of metabolic status during exercise. This biochip incorporates three functional modules for advanced in situ sweat detection (Fig. 1a): (i) an electrochemical electrode modified by an electrocatalytically active MIP for direct and selective determination of sweat Phe; (ii) a well-designed multipurpose microfluidic module that allows rapid sweat sampling, concentration refreshing, and pH buffering for a stable testing environment, as well as flow visualization for sweat loss measurement; and (iii) integration with a matching wireless flexible circuit and mobile software. Using this biochip approach, we investigated the variation in Phe levels between two human test subject groups with different body mass index (BMI) values, which can be attributed to the difference in sweat rates . Leveraging this negative correlation, we analyzed the possible mechanism of Phe partitioning into sweat. Furthermore, we assessed exercise metabolic status and risk among volunteers with different physiological characteristics by using a composite indicator, the Phe secretion rate , derived from the sweat Phe concentration ( ) and sweat rate ( ) (Fig. 1b). Finally,
we demonstrate similar and strong correlations between sweat and serum Phe levels in different volunteers before and after protein intake via sweat rate normalization to reduce interindividual variability. All these demonstrations reveal the potential utility of our wearable multimodal system for sweat-based personalized exercise and diet management.

Results

Integrated system sensing strategy and applications

The biochip integrating multiple functional modules can be attached to the skin and samples the secreted sweat on the skin surface for multimodal sensing, data processing, and wireless transmission (Fig. 1a and Supplementary Fig. 1). All modules of the biochip can be prepared at a large scale through simple processing techniques, including thermal evaporation and laser engraving (Supplementary Figs. 2, 3).
To achieve high sensitivity and reliable detection of sweat Phe, we developed a Phe-imprinted MIP that mimics the functions of biological enzymes. Unlike regular MIPs that act as ‘molecular filters’ or ‘artificial antibodies , our MIP-based ‘artificial enzyme’ allows for direct and selective electrocatalytic oxidation of Phe on the electrode surface. This approach enables the direct electrochemical determination of sweat Phe concentration using differential pulse voltammetry (DPV). The enzyme-mimicking MIP can not only selectively bind with the target Phe in sweat through specific binding sites, but also directly electro-oxidize Phe via electrocatalytically active surface functional groups (Fig. 1c). The Phe-imprinted MIP electrode was synthesized by electropolymerizing polyaniline (PANI), which has been used for the chiral recognition of aromatic AAs (Tyr, Trp, and Phe) due to its own electrocatalytic activity .
Successful template imprinting and extraction from the electropolymerized PANI matrix were verified by various characterization methods (AFM, SEM, and FTIR-ATR) and molecular interaction simulations (Supplementary Note 1 and Supplementary Figs. 4-8). Furthermore, an improved theoretical intermolecular simulation based on density functional theory (DFT) calculations for studying the electrochemical behavior of Phe on the MIP electrode surface supports that the electrocatalytic phenomenon of the PANI-MIP electrode for detecting Phe in this system is related to the carbonyl ( ) groups on the quinone rings of the polymer chains generated by the electrodegradation of PANI (Fig. 1c and Supplementary Note 2). Specifically, under the same external electric field, a greater charge transfer number ( ) is calculated between the electro-degraded MIP electrode (E-MIP) and a Phe molecule compared to other electrode cases (Supplementary Fig. 9).
To obtain stable and reliable Phe electrochemical responses in complex sweat samples with variable pH and electrolyte concentration conditions, our biochip system integrates a vertically assembled microfluidic module with a neutral pH buffer filter paper embedded in the sensing chamber (Fig. 1d). As sweat flows through the filter paper loaded with dried phosphate buffer (PB, pH 7.5, 20×), this embedded design maintains the solution environment at a constant pH and high ionic strength level to achieve stable Phe sensing responses. Notably, as shown in Fig. 1e, the introduction of filter paper in front of the electrodes had negligible effects on the DPV responses of the integrated Phe sensing system within the normal physiological concentration range compared to that of pristine electrodes in PBS. In addition, by incorporating the design of a serpentine outflow channel with a rough upper surface, the microfluidic module also allows visualization of sweat flow for sweat loss quantification, including sweat volume and rate (Supplementary Note 3).
We explored the feasibility of combining the measured bimodal signals (sweat Phe concentration and sweat rate) to analyze the Phe partitioning mechanism into sweat, assess exercise metabolic status, and investigate the relationship between sweat and serum Phe levels (Supplementary Fig. 10). In detail, by using the wearable system to
collect data from multiple volunteers after 20 min of exercise, we observed a moderately negative correlation between sweat rate and Phe concentration (Fig. 1f), indicating that the mechanism of Phe partitioning into sweat relies on diffusion and its concentration may be affected by sweat dilution . Remarkably, the correlation in the low sweat rate region was poorer than that in the high sweat rate region because the skin surface Phe content in sweat, which is affected by individual skin quality differences, was difficult to be exhausted by perspiration at low sweat rates . Moreover, we also defined an ideal indicator for assessing exercise metabolic status with reduced interindividual variability, i.e., sweat Phe secretion rate ( ), and identified an individual with possible high metabolic risk during exercise whose secretion rate was greater than that of other volunteers (Fig. 1f). Here, we divided Fig. 1f into three metabolic risk areas, where lower than or higher than were defined as low risk or high risk, respectively, and between the two values was defined as medium risk. The division was based on a combination of actually measured values from subjects in this study and the similar sports science research . Finally, through normalizing sweat indicator concentrations by sweat rates to reduce interindividual variability, similar correlations between sweat and serum Phe levels were observed in two different subjects (Fig. 1g), indicating the potential of sweat Phe quantification for non-invasive personalized healthcare management. While there have been several recent pioneering and significant advances in sweat AA sensing , an in-depth investigation of AA partitioning mechanisms in conjunction with sweat rate detection and normalization has not yet been conducted due to the lack of multimodal analysis based on supplemental sweat rate measurements in parallel (Fig. 1h). Moreover, the use of other commonly measured sweat biomarkers and their analysis in combination with sweat rate measurements for health monitoring have also been lacking .

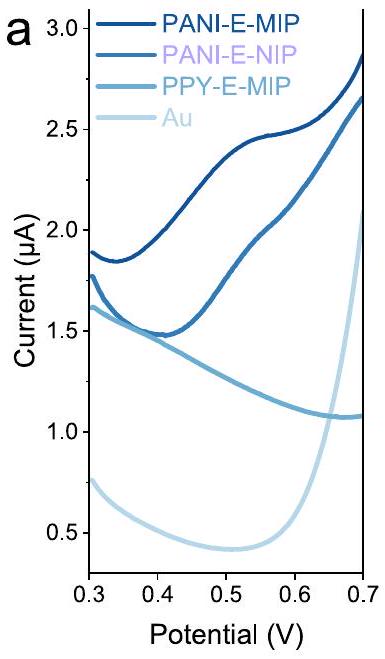
Electrochemical characterization of E-MIP sensor

The E-MIP electrode showed superior electrocatalytic oxidation for Phe over the electro-degraded non-imprinted PANI (E-NIP) electrode due to fewer binding sites on the E-NIP electrode for Phe to access (Fig. 2a; see also Supplementary Note 1 and Supplementary Fig. 11). In addition, the gold electrode and polypyrrole (PPY) based MIP electrode had negligible responses to Phe due to the lack of effective functional groups. These experimental results indicate that the electro-oxidation of Phe occurs more readily on the E-MIP electrode than other tested electrodes. These results agree with theoretical intermolecular simulations (DFT) used to calculate the electron transfer number between electrodes and Phe molecules under an external electric field (Fig. 2b, c and Supplementary Fig. 9). The incorporation of specific binding sites and active functional groups within the E-MIP enabled the direct, selective, and sensitive electrocatalytic oxidation of Phe (Supplementary Table 2).
A well-defined increase in peak current readouts could be detected by DPV scans in the presence of increasing Phe concentrations from 10 to (Fig. 2d). Two linear relationships were determined: (i) from 10 to , which had a sensitivity of and a limit of detection (LOD) of ; and (ii) from 300 to , which had a sensitivity of (Fig. 2e). As a control, a comparative experiment using the E-NIP electrode demonstrated appreciably smaller responses to similar Phe concentrations (Fig. 2f). This difference between MIP and NIP was also characterized in solution by cyclic voltammograms (CV) and electrochemical impedance spectroscopy (EIS) (Fig. 2g and Supplementary Fig. 12). Notably, EIS measured in Phe further confirmed that the E-MIP electrode is a more suitable material for electro-oxidizing Phe because the fitting slope ( -0.88 ) referring to Warburg impendence is close to -1 (Fig. 2 h and Supplementary Note 1).
The E-MIP-based Phe sensor showed selective recognition of the Phe target, and effective discrimination against other AAs in sweat at physiologically relevant high concentrations (Fig. 2i), along with a variety of common sweat interferents (Fig. 2j and Supplementary Fig. 13). Meanwhile, it also exhibited the chiral recognition selectivity for the L enantiomer (L-Phe) compared to the D enantiomer (D-Phe) due to the use of L-Phe as the imprinted template (Supplementary Fig. 13). The all electro-processed MIP layer could be formed scalably on evaporated gold electrodes, which resulted in high reproducibility in terms of batch-to-batch consistency and continuous successive measurement stability (Fig. 2k and Supplementary Figs. 14, 15). The effect of pH changes on the responses of the Phe sensor was evaluated from pH 6 to pH 11 , which indicated a relatively stable response between pH 7.0 and pH 9.5 (Fig. 2l, Supplementary Fig. 16, and Supplementary Note 1). However, human sweat is weakly acidic ( pH 5 to pH 7 ), which motivated us to incorporate a microfluidic method for neutral pH buffering to accurately measure sweat Phe in our biochip system.

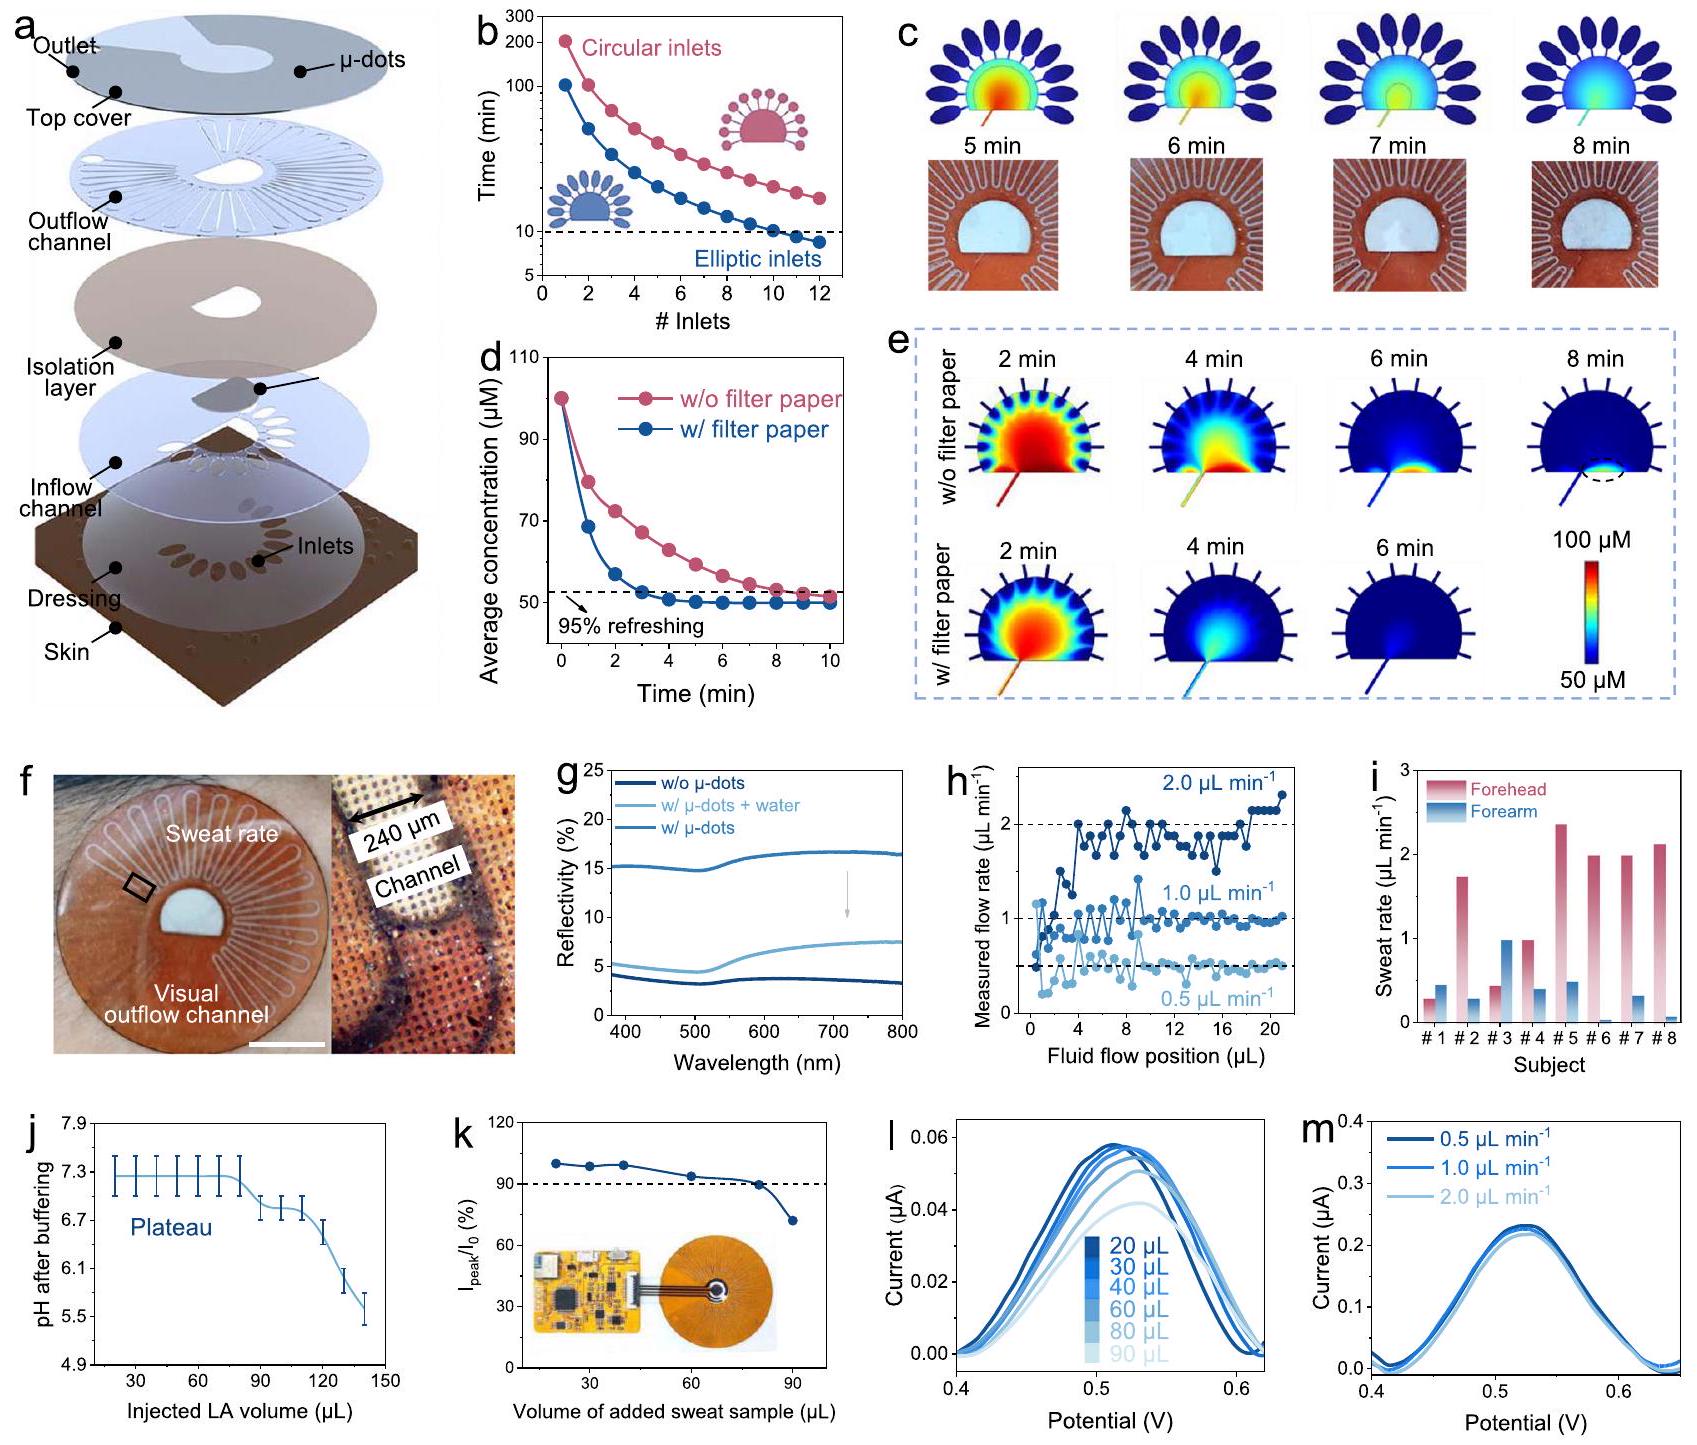
Design and performance characterization of multipurpose microfluidics

The multipurpose microfluidic module for wearable sweat Phe sensors was fabricated by laser-engraving, which involved the patterning of channels and filter papers as well as surface roughening (see Methods for details). Each functional layer of microfluidics was integrated in a vertical direction, rendering a delicate 3D structure (Fig. 3a). The resulting microfluidics were capable of not only improving sweat sampling with higher temporal resolution for sweat sensing, but also serving the following purposes: 1) inlet and chamber optimization for fast sweat collection and refreshing; 2) visualized and serpentine outflow channels for in situ assessment of sweat loss status; and 3) maintenance of a pH -neutral and high ionic strength solution environment for accurate sweat Phe detection.
First, the combination of an increased number of inlets and an elliptic inlet design instead of a circle one increased the sampling area to collect sweat. Simultaneously, the presence of filter paper within the sensing chamber also decreased the chamber volume that needed to be filled with collected sweat (Supplementary Note 3 and Supplementary Fig. 17). With an experimentally measured sweat rate ( ) as the inlet flow rate, the synergy of these two structural optimizations achieved rapid filling of the sensing chamber in the case of twelve inlets (around 8 min from starting exercise) (Fig. 3b). Finite element analysis (FEA) of the two-phase water/air filling process (Fig. 3c, Supplementary Fig. 18, and Supplementary Video 1) shows accordance with experimental time-lapse images of sweat filling in a volunteer during exercise. Furthermore, numerical simulations also showed that the embedding of filter paper can accelerate and homogenize the refreshing process, which is referred to as the refreshing time taken for the old solute concentration in the chamber to adjust to a new concentration during sweat inflow (Fig. 3d, e, Supplementary Fig. 19, and Supplementary Video 2).
Second, an upper three-layer was introduced into the vertical microfluidic structure to obtain adequate outflow channel volume for readable sweat loss while controlling the overall device footprint (Supplementary Note 3 and Supplementary Fig. 20). In brief, the differential reflectivity/transmittance to visible light at -dots leads to an apparent visual color change of the serpentine outflow channel (one meander corresponding to , volume resolution of ) in empty and water-filled states (Fig. 3f, g and Supplementary Figs. 21, 22), which enables visualized flow readouts for estimating sweat rate/ volume on the skin. To validate this capacity, a physiological range of constant flow rates (from 0.5 to ) was injected into the microfluidics by syringe pump. The readable fluid filling positions over time were converted to flow rates measured by the naked eye, showing correspondence between injected and measured flow rates (Fig. 3h
b
Electrode w/ an electric field
PANI-E-MIP 3.924 e
PANI-E-NIP 3.013 e
PPY-E-NIP 2.861 e
Au 2.757 e


Fig. 2 | Characterizations of E-MIP sensor for Phe detection. a DPV scans of a PANI-based E-MIP electrode (PANI-E-MIP), a PANI-based E-NIP electrode (PANI-ENIP), a PPY-based E-MIP electrode (PPY-E-MIP) electrode, and a gold electrode (Au) in a PBS containing Phe. Comparison of the electron transfer number between different electrodes and Phe molecule within an external electric field. d, e DPV scans of the E-MIP-based Phe sensor for direct Phe detection after baseline correction (d) and corresponding peak current readouts (e). Inset, the molecular electrostatic potential surfaces of the E-MIP electrode and Phe. The error bars ( measurements) correspond to the standard deviation (SD). Response comparison between E-MIP and E-NIP electrodes to equivalent Phe concentrations in PBS. g CV scans of different MIP electrodes based on PANI and an Au electrode in a solution containing and EIS responses of an E-MIP
electrode, a MIP electrode, and an Au electrode in a PBS containing Phe. i Selectivity of the E-MIP sensor against other AAs. The following substances were added in succession: 1 mM Glycine (Gly), 1 mM Serine (Ser), Alanine (Ala), Histidine (His), Tyr, tryptophan (Trp), and Phe. j Selectivity of the E-MIP sensor against common sweat interferents in presence of Phe. The following interferents were added in succession: glucose (Glu), 5 mM Urea, 5 mM lactate (LA), and ascorbic acid (AS). Batch-tobatch variation of the E-MIP sensor performance in the presence of Phe. The error bars correspond to the standard deviation ( independent sensors). The center for the error bars represents the mean value. 1 Influence of pH changes in peak currents and respective peak potentials. The dashed box indicates the pH range with stable DPV responses.
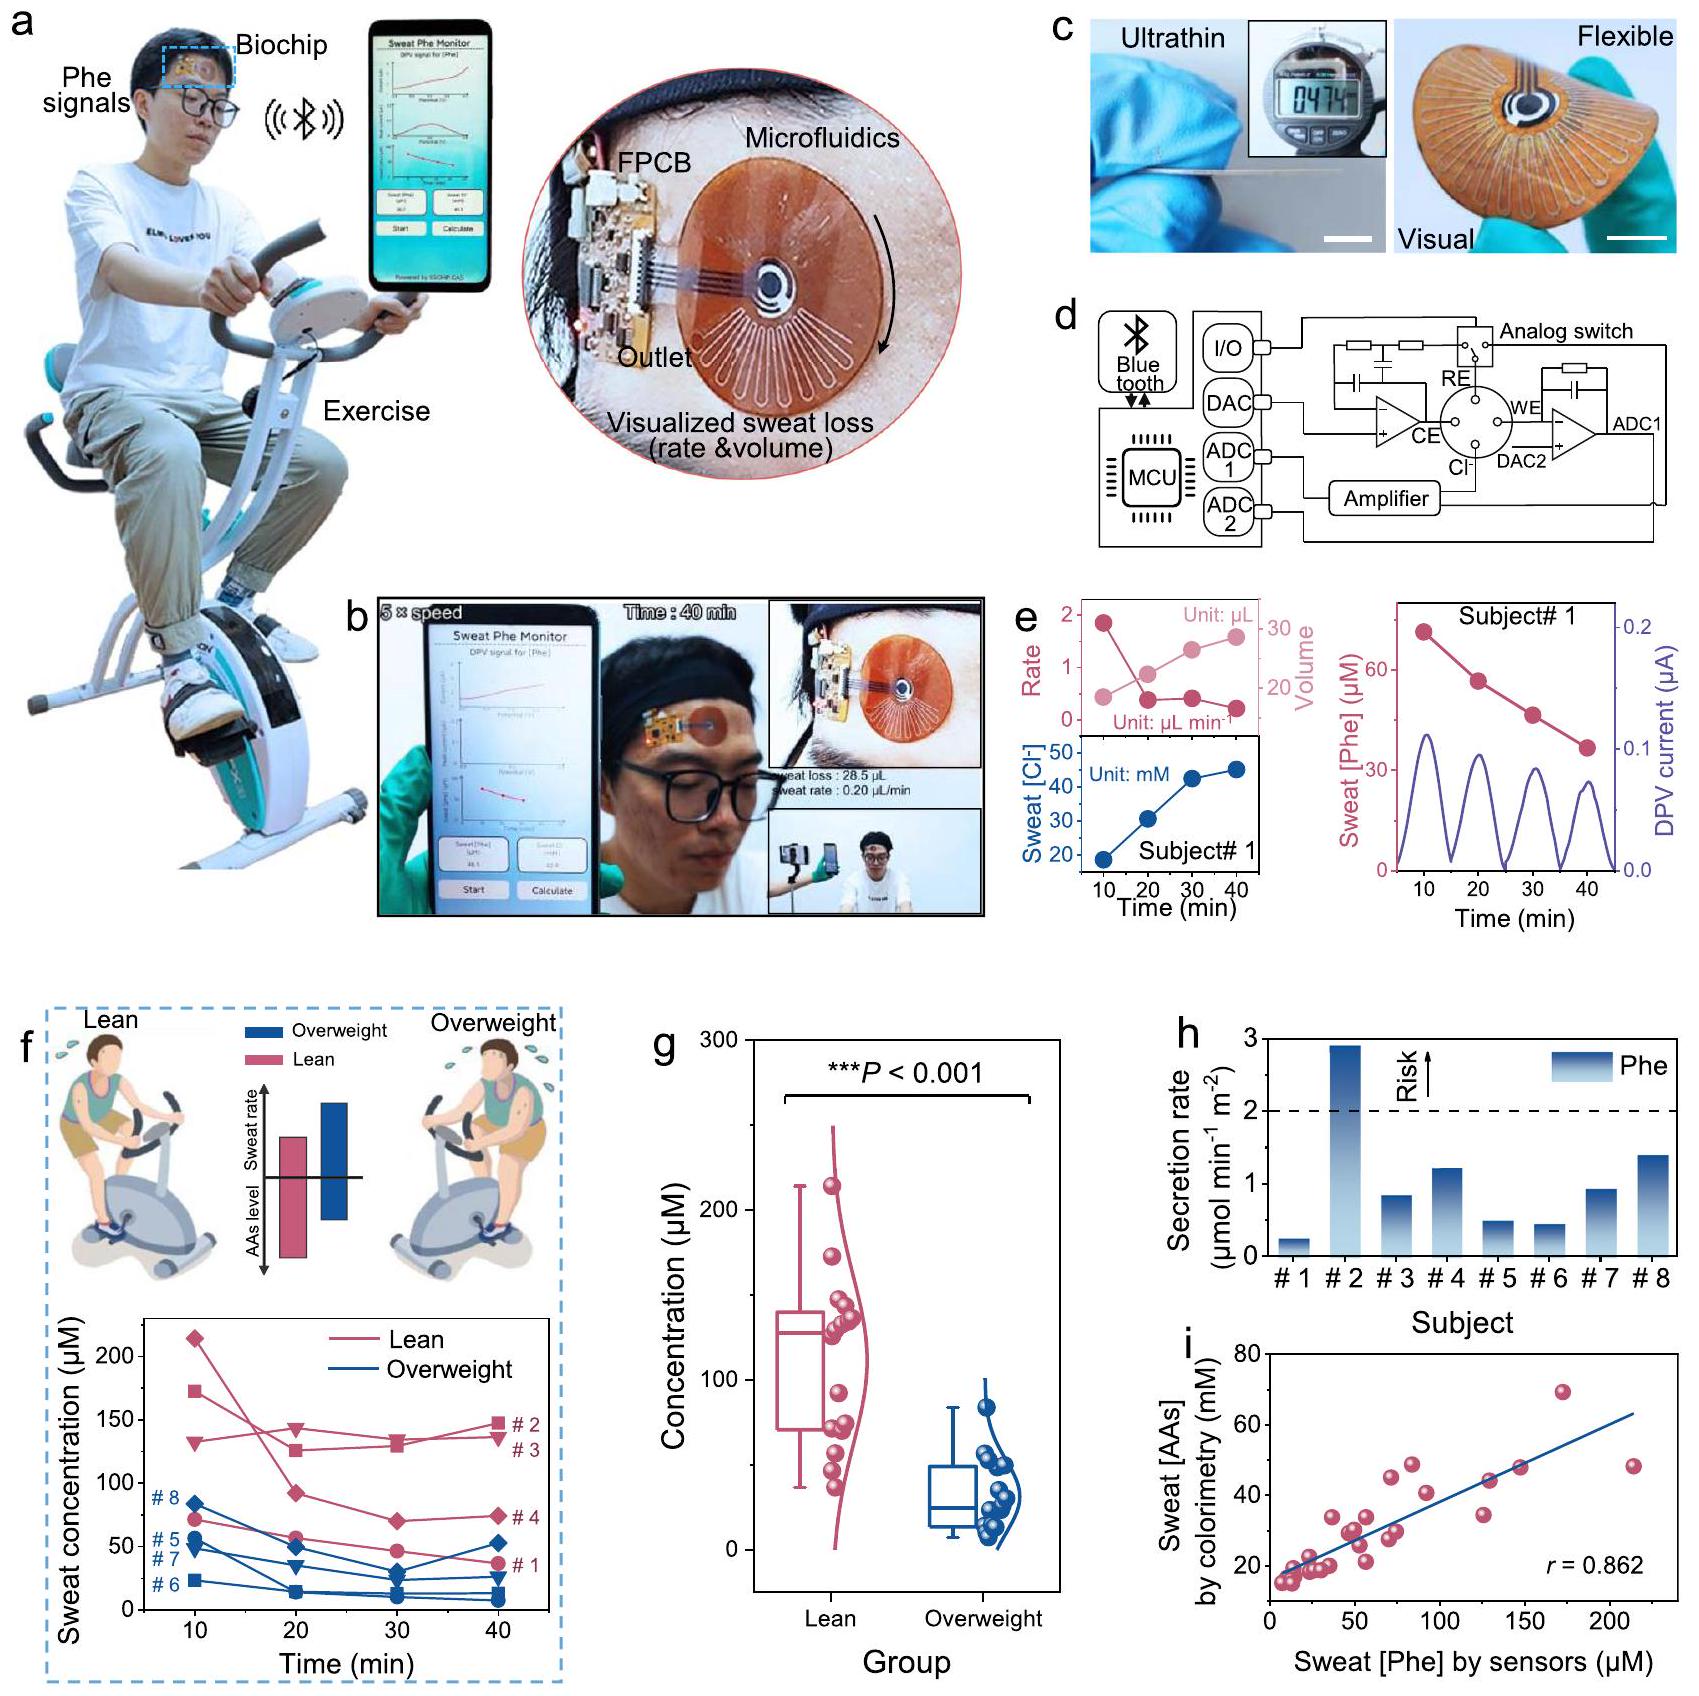
and Supplementary Fig. 23). Additionally, a computer vision algorithm was used for automatic sweat loss reading (Supplementary Note 3). Based on this, the exercise sweat rates of two identical body parts (forehead and forearm) of eight volunteers were measured to demonstrate the practicality of this visualization design (Fig. 3i, Supplementary Fig. 24, and Supplementary Table 3), which can be used to
comprehensively investigate the relationship between AA loss and water loss during exercise.
Third, a disposable and replaceable neutral pH -buffering filter paper was laser-cut and embedded within the sensing chamber of the microfluidics. The injected lactate acid (LA) solution ( pH 5.0 ) was continuously buffered to around pH 7.0 (Fig. 3j), showing the
Fig. 3 | Design and characterizations of multipurpose microfluidics for sweat sampling. a Layer-by-layer view of microfluidic device design. Numerical stimulation of time required to fill chamber for different numbers and shapes of inlets with embedded filter paper. c Comparison between simulated and experimental results of the sweat sampling/filling process. Time evolution of the average Phe concentration for refreshing process in the chamber without or with embedded filter paper. e FEA of microfluidic refreshing process without or with embedded filter paper. The area marked by the dashed line is represented as an anomalous hard-to-refreshing area. Photographs of the microfluidics during exercise on the skin (right) and optical micrograph of sweat flowing in the visualized microchannel (left, magnified view of the sweat front). Scale bar, Optical reflectivity of
empty channels with or without -dots and filled channels with -dots. Measured flow rates by naked eye at different fluid filling positions under pump injection rates of , or . i Sweat rates measured by the algorithm form two body parts of eight healthy subjects during 10 to 20 min of exercise. Neutral pH buffering capability of the embedded filter paper in the microfluidic chamber. Note: there were no error bars here, but the pH ranges measured by colorimetric pH test papers. , I Sensor response changes ( ) and corresponding DPV scans ( ) caused by injection of different sweat sample volumes. Inset, photograph of the biochip. m DPV scans of the integrated wireless system at different flow rates (from 0.5 to ).
ability to buffer sweat to neutral pH conditions for more than 40 min during intense exercise with a persistently high sweat rate of . After incorporating the multipurpose microfluidics for sweat sampling and buffering as well as a matching flexible circuit for wearable DPV measurement (Fig. 3k, inset), wireless and continuous Phe sensing of the multimodal sensors was validated via injection of successive target solutions (raw sweat samples) at physiological sweat rates (Fig. 3k-m and Supplementary Fig. 25). When continuously injecting sweat samples, the sensor performance maintained a stable response (less than variation) with the first of sweat injection (Fig. 3k, l), corresponding to the aforementioned neutral pH buffering capability of the microfluidics. The results shown that the embedded pH -buffering filter paper in microfluidics can effectively alleviate the influence of pH as well as ionic strength changes on the
sensor response within the design expectation. Furthermore, A stable response of the sensor was been obtained in the skin physiological temperature range (Supplementary Fig. 26). More importantly, the integrated sensor also exhibited stable DPV readouts for Phe sensing at different flow rates from 0.5 to (Fig. 3m), revealing that changes in sweat rate had a negligible effect on sensor responses. We also integrated an ion-selective sensor into this multimodal system for more comprehensive exercise monitoring and management (Supplementary Fig. 27).

Sensor evaluation for assessing exercise metabolic risk

The integrated multimodal sweat sensor could be suitably worn for in situ measurement and display of sweat Phe, chloride, and sweat loss levels during exercise (Fig. 4a-c, Supplementary Video 3, and Video 4).
Fig. 4 | On-body evaluation of wearable multimodal biochip for dynamic exercise sweat analysis and assessment. a Photographs of a subject wearing the biochip on forehead and a smartphone app interface. Screenshot of a frame of the sensor validation video. c Ultrathin and flexible demonstration of the sensor performance. Scale bar, 1 cm . d Hardware block diagram of the flexible circuit for the sweat sensor. e Real-time continuous monitoring of sweat loss (left top), sweat chloride (left bottom) and Phe concentrations (right) along with corresponding DPV data from 0.4 to 0.6 V per scan obtained from the forehead of subject #1. Dynamic sweat Phe measurement ( f ) and corresponding box-and-whisker plot in two groups of male subjects: lean/normal group ( subjects) and overweight group ( subjects). Difference in sweat Phe levels collected for two
groups is statistically significant (two-tailed Wilcoxon rank-sum test, ; ). The box ends represent the 25th and 75th percentiles. The horizontal line in each box represents the median. The upper and lower whiskers represent the maxima and minima, respectively, which refer to the range of non-outlier data values. Sweat Phe secretion rates of eight subjects calculated by sweat rate and Phe concentration during 10 to 20 min of exercise. i High-positive correlation of sweat AAs and Phe levels for the validation of sweat Phe secretion rate as an indicator to reflect sweat AA loss for exercise-related metabolic risk assessment. The data are based on 28 sweat samples collected from the two groups (lack of data on Subject #3 due to his low forehead sweat volume). The solid line represents the linear-fitted trendline.
The matching flexible circuit can implement excitation DPV potential and differential OCP measurement as well as corresponding multimodal bio-signal retrieval, processing, and transmission (Fig. 4d). As a demonstration of the sensor validation (Supplementary Video 3), the multimodal sensor was placed on the forehead of a healthy volunteer (subject # 1) during a cycling exercise trial at moderate intensity
[around maximal heart rate ] for 40 min in a climatecontrolled room ( 22 to to relative humidity).
The sweat rate was computed from the captured sweat volume and reached a maximum level during the initial stage of perspiration , and then decreased until stabilization (Fig. 4e). This trend stems from thermoregulation, adaption, and equilibration of the
body’s response to the exercise load as expected . Meanwhile, there was a rising trend in the sweat chloride concentrations during exercise. More importantly, the real-time Phe measurement also showed a decreasing trend (Fig. 4e) because the endogenous Phe loss from the plasma gradually dominates while the contribution from skin AAs diminishes . Similar trends as mentioned above were also observed in a low intensity exercise of jogging (around ) with lower sweat rates (Supplementary Fig. 28). The simultaneous measurement of the above three types of sweat indictors demonstrates the capability of our integrated biochip for multimodal sweat sensing. Among them, Simultaneous measurement of Phe concentration and sweat rate aided a quantitative assessment of exercise-induced AA loss and thereby helps to identify individuals with exercise-related metabolic risk, which have relatively high Phe secretion rate (Fig. 4f) .
To demonstrate practical application, we selected eight male volunteers with different physiological characteristics from the previously recruited 16 subjects for monitoring sweat Phe levels under the same trial conditions as described above. An analogous decrease trend was observed in all subjects, while there was lower sweat Phe concentrations in overweight subjects ( ) than in lean subjects (BMI<25) according to BMI classification (Fig. 4f and Supplementary Table 3). A non-parametric analysis of variance (Wilcoxon rank-sum test) was performed for statistical comparison, revealing a significant difference between the two groups ( ; *** ) (Fig. 4g). This difference supports that overweight people tend to have lower levels of sweat Phe than lean people due to the concentration dilution effect caused by excessive sweat volume/rate . Combined with the previous negative correlation between sweat rate and Phe concentration (Fig. 1b), these findings suggest that the partitioning mechanism of sweat Phe may mainly be attribute to passive transport from interstitial fluid (ISF) or blood in addition to from the skin itself.
Sweat Phe secretion rates of all subjects were calculating by measuring and multiplying sweat rates and Phe concentrations (Fig. 4h), which is an important and suitable indicator for assessing the level of AA loss during exercise without interindividual variability according to statistical analysis (Supplementary Fig. 29). In order to verify this approach, we determined the corresponding AA concentrations of all sweat samples in order to analyze the relation between sweat AA and Phe levels and obtained a high Pearson correlation coefficient of 0.862 (Fig. 4i). Therefore, as expected, the sweat Phe secretion rate can reliably indicate the sweat-facilitated loss of amino acids during exercise, which is useful for assessing exercise metabolic risk and for potentially guiding nutritional supplementation to address losses in sweat and to maintain nitrogen balance . Owing to an appreciably larger sweat Phe secretion rate compared to other volunteers (Fig. 4h), subject # 2 was identified as an individual with high sweat-facilitated loss of AAs and a candidate for protein supplementation after exercise.

Evaluation of sweat Phe sensor for diet management and serum correlation

As confirmed above and reported before , the levels of AAs in sweat is mainly attributed to ISF or blood partitioning as sweating progresses. Accordingly, beyond its practical use in exercise management, the sweat Phe sensor has additional potential applications to understand the correlation of Phe levels in sweat versus serum such as in the case of diet management (Fig. 5a). Although it has been reported that sweat AA levels are associated with blood AA levels , their metabolic correlation during exercise has not been well studied, especially for non-NMF AAs.
To evaluate the use of our sweat sensors for non-invasively assessing serum Phe levels, a pilot study was conducted for continuous sweat Phe monitoring and corresponding serum Phe quantification on representatives (Subjects# 1 and 5) of two BMI groups before and after protein intake (Fig. 5b-f). In each later stage of exercise sweating
(plateau after 30 min ), protein diet intake resulted in elevated sweat Phe levels in both subjects, while decreased levels were measured after rest (Fig. 5b). Moreover, the successive decrease of Phe levels in the initial stage of exercise sweating ( 10 min ) points to the consumption of skin Phe and its untimely replenishment (Supplementary Fig. 30). However, Phe levels measured after 20 min did not show this change trend. Combined with the above two different phenomena, it could be inferred that skin Phe in sweat is no longer dominant at this time, but is replaced by the contribution from blood. Importantly, there was a greater extent of Phe percentage fluctuation (especially for sweat changes) in the overweight subject than in the lean subject, which is likely due to different metabolic conditions (Supplementary Fig. 31).
In addition, there was also a strong positive correlation between sweat Phe and AA levels (Fig. 5c), demonstrating the potential of using our sweat sensor for diet management by assessing both changes in serum Phe levels and sweat AA loss. Here, the accuracy of the sweat Phe sensor for testing human sweat samples was validated by enzymelinked immunosorbent assay (ELISA) using commercial Phe kits (Fig. 5d). Taking the plateau of sweat Phe level in exercise as a comparative index with corresponding serum Phe levels quantified by ultra-performance liquid chromatography with mass spectrometry (LC-MS) (Supplementary Fig. 32), good agreement in the level changes between sweat and serum Phe before and after protein intake was observed (Fig. 5e). High Pearson correlation coefficients of 0.878 (Subject #1) and 0.947 (Subject #5) were observed between sweat and serum Phe levels (Fig. 5f, top). However, the findings also suggested interindividual variability in the correlation between serum and sweat Phe levels due to the large difference in the fitted line. To reduce the interindividual variability, sweat Phe concentrations were normalized to the sweat Phe secretion rate by multiplying by the individual stabilized sweat rate during exercise. This normalized sweat Phe indicator showed a strong correlation with serum Phe levels while also having a similar slope of the fitted line between the two subjects (Fig. 5f, bottom). The difference in the line intercept is likely due to the difference in the physiological properties of subjects and Phe content on the skin surface. Furthermore, the positive interindividual correlation between sweat and serum Phe levels became stronger after sweat rate normalization (Supplementary Fig. 33). In short, by introducing sweat rates to reduce interindividual variability, sweat Phe secretion rates are a potentially suitable indicator to investigate the correlation between serum and sweat Phe. As such, the ability of our sensors to detect both sweat Phe levels and sweat rates displays a superior capacity to assess serum Phe levels over other available sensor options, and supports the feasibility of exploring phenylalanine as a sweat biomarker.

Biocompatibility

Considering that the biochip may need to be worn for a long period of time in diet management applications, we also conducted a biocompatibility test of the biochip. As a representative skin cell line, human immortalized keratinocytes ( HaCaT ) were cultured on the biochip as the experimental group, whereas HaCaT was cultured in a blank medium as the control group. As shown in Fig. 5g, the fluorescence microscopy images show the survival status of the HaCaT cells after 2 or 4 days incubation. There was no significant reduction in relative cell viability of HaCaT cells on the biochip compared to the control group (Fig. 5h), indicating that the biochip is safe for prolonged wear and suitable for sweat multimodal detection in diet management.

Discussion

We have presented an integrated wearable biochip for the multimodal detection of sweat Phe and chloride concentrations as well as sweat loss levels (volume and rate). A unique Phe sensing method is reported based on the Phe-imprinted enzyme-mimicking MIP that allows for direct electrocatalytic oxidation of Phe with high sensitivity and
Fig. 5 | In situ sweat Phe analysis for assessing serum levels and protein diet intake effects. a Metabolic pathway of Phe along with serum and sweat Phe fluctuations caused by protein intake during exercise. Dynamic changes of sweat Phe levels from two subjects with different BMI in three periods of exercise, including before and after protein diet intake as well as after rest. DPV data from 0.4 to 0.6 V . c Correlation between sweat AAs and Phe levels in the intake-exercise experiment from two different subjects. d Sensor-measured Phe concentrations in sweat samples versus corresponding ELISA readouts. Data was measured from all sweat
samples collected in the above evaluation experiment. The solid line represents the linear-fitted trendline. e Comparative study of sweat and serum Phe levels in the three periods of exercise from subject #1 (top) and subject #5 (bottom).
Correlations between sweat and serum Phe levels before (top) and after (bottom) the sweat rate normalization from two different subjects. Lines represent the fitted trendlines. Fluorescence microscopy images (g) and relative cell viability (h) of HaCaT cells after 2 or 4 days incubation in biocompatibility test ( independent experiments). Scale bar, .
selectivity for sweat monitoring. Furthermore, an elaborate multipurpose microfluidics was designed via a scalable and low-cost laserengraving technique to achieve multiple goals, including sweat neutral pH buffering for stable Phe detection, rapid sweat sampling and refreshing for high temporal resolution, and sweat flow visualization for readable sweat loss. By integrating these two highly complementary and mutually beneficial approaches, the wearable system worn on the skin surface enables the continuous, reliable, and rapid
detection of Phe concentrations along with the accessible and visual readout of sweat loss during exercise. Potential improvements in the system could focus on the development of continuous sweat loss readings through electrical methods for more diverse application scenarios.
To demonstrate the practical value of our well-designed multimodal biochip, we have used our system to determine a negative correlation of sweat Phe levels and sweat rates among individuals, and
thus analyze the potential mechanism of Phe partitioning. Additionally, we have combined these two indicators as a new indicator, sweat Phe secretion rate, for quantitatively assessing the exercise metabolic risk of two populations with different BMI. Finally, we have conducted a pilot study to understand the metabolic correlation of Phe content in sweat versus serum before, during, and after protein diet intake at exercise, revealing their high and similar correlations in two subjects after sweat rate normalization. All these results demonstrate that simultaneous determination of sweat amino acid concentration and sweat rate can offer new and valuable insights into the assessment of metabolic status and corresponding blood levels. To overcome the limited subjects’ data in the study, future work will include the investigation of more subjects with different metabolic conditions to expand on the proof-of-concept data herein and to build a stronger correlation of sweat and serum Phe levels by considering the sweat dilution effect. Such approaches will pave the way for a range of clinical application scenarios, such as non-invasive and personalized low-Phe diet management for PKU patients. More importantly, our finding that non-NMF AAs in sweat mainly stem from the endogenous loss of plasma AAs as sweating progresses can be extended to other species. These measurement capabilities can be utilized to study more sweatserum AA correlations and their detailed partitioning mechanisms with the help of multimodal sweat sensing in follow-up studies.

Methods

Fabrication and preparation of the sweat sensor

A predesigned four-electrode array mask was patterned and engraved on the PET label paper with adhesive backing by an Yttrium Aluminum Garnet (YAG) laser cutter (Suzhou Inngu Laser, China). The laserpatterned mask was attached to a PET film with a thickness of (Huanan Xiangcheng Technology, China), and the layers of (20/ 50 nm ) was deposited on the PET film via thermal evaporation. To prepare the RE and the chloride sensor, ink (ALS, Japan) was first uniformly brushed onto the preset RE and chloride sensor zones, and then the mask attached on the PET film was stripped. After drying overnight in the ambient environment, the pure was used as the sensitive material of chloride sensor. As for the common RE, cocktail that contained polyvinyl butyral (PVB), 2 mg Poly (ethylene glycol)-block-poly(propylene glycol)-block-poly(ethylene glycol) (F127), and 0.2 mg MWCNTs in 1 mL methanol was drop-casted on at the RE zone.
The preparation process of the PANI-MIP sensor for sensing Phe is illustrated in Supplementary Fig. 4. Before the polymerization, the thermally evaporated gold electrode at the WE zone was drip-coated and cleaned with piranha solution . The whole synthesis of the E-MIP electrode was carried out in a conventional three-electrode cell equipped with an electrochemical workstation CHI 760E (CH Instruments, USA). The polymerization solution was prepared by dissolving 10 mM L -Phe and 10 mM aniline into 0.01 M phosphate buffered saline (PBS) ( ). Then, the electropolymerization was conducted by means of cyclic voltammetry from -0.4 to 0.9 V versus the standard calomel electrode (SCE) for four cycles at a scan rate of . After polymerization, the electroelution was accomplished by multi-potential steps (MPS) switched forty times alternately between 0.9 and -0.9 V (each potentiostatic duration of 100 s ) versus SCE, which over-oxidizes/electro-degrades the PANI-based MIP matrix to extract templates and thus results in the E-MIP electrode with selective and electrocatalytically active binding sites. Subsequently, the resulting electrode was immersed into PBS (pH 7.0) for repetitive DPV scans (same parameters as for Phe measurement, see below for details) until a stable response was obtained. For the preparation of NIP and E-NIP electrodes, the same preparation method was applied as MIP and E-MIP, excluding the Phe molecule as the template during the electro-polymerization step.

Characterization of the sweat sensor

All the in vitro characterizations of prepared sensors were performed using an electrochemical workstation CHI 760 E in ( pH 7.0 ). The response of the chloride sensor was characterized by open circuit potential (OCP) measurements with varied chloride concentrations. The DPV analysis was performed for the E-MIP-based Phe sensor and corresponding other electrodes for comparison at varied physiological Phe concentrations. The DPV parameters were: range from 0.4 to 0.7 V ; incremental potential of 0.001 V ; amplitude of 0.03 V ; pulse width of 0.05 s ; sampling width of 0.02 s ; pulse period of 0.1 s ; sensitivity of . Before each DPV scan, a constant potential of 0.4 V was applied across the WE and RE for 2 s to promote the binding of negatively charged Phe to the electrode and suppress potential interferants and product buildup. The EIS measurement and parameters are detailed in Supplementary Note 1. The selectivity study of the Phe sensor was tested by adding interferents successively at physiologically relevant high concentrations. The pH dependence of Phe sensor response was studied by DPV scans in PBS ( pH 7.0 ) with different pH range from 11 to 3 adjusted by sodium hydroxide or hydrochloric acid, and measured by a precision pH meter (Sunne, China). All peak current readouts of the DPV scans were presented after a standard straight-line baseline correction.
The material morphology was characterized by FSEM (Hitachi High-Tech, Japan) and AFM (Bruker, USA). The Fourier transform infrared (FTIR) spectra was measured by using attenuated total reflection (ATR) in the infrared spectrophotometer (Tianjin Gangdong, China).

Computational simulation methodology of molecular interactions

All quantum-chemical calculations were achieved using Gaussian 16 software package. Geometric structures of the target (Phe) and the pre-polymerization complexes were optimized by DFT using the B3LYP hybrid functional with Grimme’s dispersion correction of D3 version (Becke-Johnson damping). See Supplementary Note 2 for details.

Fabrication, assembly and characterization of the multipurpose microfluidics

The vertically assembled five layers of microfluidics were fully fabricated by laser engraving using the YAG laser cutter. All patterns needed to be laser-engraved were pre-designed using AutoCAD. From top to bottom, the top cover layer of transparent PET film ( thick, thinner is also feasible) with the prepared sweat sensor was surfaceroughened by the dot engraving mode to produce -scale etched dots ( -dots). This surface roughening method by laser engraving was also applicable to other flexible or stretchable substrates (Supplementary Fig. 20). A thicker double-side tape ( thick, 9495 LE , 3 M , USA) was cut as the outflow channel layer with the chamber pattern and serpentine microchannel ( width) to accommodate the volume of per meander channel. The isolation layer of dark PI film ( thick) was cut out the chamber to vertically interconnect the outflow and inflow microchannels through the chamber and provide a dark background for enhanced visualization (Supplementary Fig. 21). Then, a thinner double-side tape ( thick, 7982, Crown, China) was cut as the inflow channel layer with elliptic inlets and the chamber pattern. Finally, skin adhesive medical dressing (Tegaderm, 3 M , USA) was incorporated and cut in the assembly process to form the skin interfacing layer with elliptic inlets. By cutting cross marks on each layer for alignment and positioning, the original 2D layers were vertically stacked and fluidically routed to form leakage-free, multilayered, and 3D architectures. Here, the chamber for sweat reserving and sensing was formed by three layers (outflow channel, isolation, and inflow channel layers) all containing the chamber pattern. A
chamber-patterned filter paper (Whatman, USA) drip-coated and dried by phosphate buffer solution ( pH 7.5 to pH 7.8 ) was embedded within the chamber for neutral pH buffering.
For the characterization of multipurpose microfluidics, a syringe pump (Longer, China) was used and connected to a matching sized inlet of the microfluidics by a steel needle. The neutral pH buffering capability of embedded filter paper was evaluated by measuring the approximate pH range of the injected and buffered lactic acid solution collected at the outlets via pH test papers ( pH 5.4 to 7.0 , Newstar, China). Flow rate measurement experiment was performed by comparing the constant injecting rates ( , and ) to the calculated flow rates by dividing the readable filled volume to the time spent. Furthermore, a similar setup in the benchtop study was used to evaluate the ability of the wearable system integrating sweat sensors and microfluidics for accurate and stable wireless sensing of Phe. The measured DPV data was transmitted to a computer via Bluetooth for further baseline correction and data smoothing. To measure the optical property of visualized flow channel design, A UV/VIS spectrophotometer (Shimadzu, Japan) with an integrating sphere module enabled transmittance and reflectivity measurements of analogous chamber structures, including empty channels with or without -dots and water-filled channels with -dots (Fig. 3g and Supplementary Fig. 22).

Numerical simulations of sweat dynamics in microfluidics

All simulations were carried out using COMSOL Multiphysics 6.0. For the verification of flow behavior under sweat sampling of the microfluidics with twelve inlets, a computational fluid dynamics module (Two-Phase Flow, Level Set interface) was used to simulate the water filling process with/without the filter paper (Porous Media Domain) in Supplementary Fig. 18. Moreover, as illustrated in Supplementary Fig. 19, the mass transport process was also simulated by coupling Transport of Diluted Species interface and Laminar Flow interfaces for the refreshing time analysis of microfluidics with/without the filter paper (Porous Media Domain). See Supplementary Note 3 for details.

Wireless flexible circuit module and smartphone application

The wireless flexible circuit module implements excitation DPV potential waveform and differential OCP measurement as well as corresponding readout signals retrieval, processing, and transmission. As the core of the flexible circuit module, an STM32L15C8T6 ultra-lowpower ARM Cortex-M3 32 MHz microcontroller (MCU) was programmed to facilitate system-level functionalities. For a DPV scan, the excitation potential waveform with the same previous parameters was applied across the WE and RE through a 12 -bit digital-to-analog converter (DAC) built in MCU. A second-order low-pass RC filter further stabilized the potential of RE. The current response from the WE was extracted by a transfer impedance amplifier stage (TIA), which transferred the current signal to a voltage readout and then was read by a 12bit analog-to-digital converter (ADC) built in MCU. The OCP measurement following the DPV scan was achieved by an AD8227ARMZ differential amplifier to effectively implement an instrumentation amplifier configuration. An analog switch was used to alternate the measurement mode of the flexible circuit.
The raw data was then wirelessly transmitted via Bluetooth (E104BT5005A) and real-time displayed in a custom-developed smartphone APP. Before converting to presented concentration values, the raw DPV data was baseline-corrected, filtered, and smoothed on the APP to obtain reliable DPV peak current curves. Then, the in-situ concentration values were obtained and displayed in the user interface, along with recording the curve of Phe levels over time.

Power source

The entire system was powered by a rechargeable 3.7 V lithium-ion polymer battery with desired capacity and size. A low dropout
regulator (S-1206B33-M3T1G) was used to convert and produce a stable and separate 3.3 V digital and analog power supplies to serve the MCU and analog peripheral components, respectively, which creates separate digital and analog circuitry to prevent the digital circuitry from affecting analog signals.

Human subject recruitment

The human subject experiments were conducted in compliance with the ethical standards of the institutional and/or national research committee and with the Declaration of Helsinki of the World Medical Association. This study was approved by the Ethical Committee of Tianjin Medical University General Hospital, Tianjin, China (Approval No. IRB2015-YX-009). The data were obtained with the informed consent of all participants. Each participant has been paid from 100 to 300 RMB (depending on the participation time) as the compensation for the test. The authors affirm that human research participants provided informed consent for the publication of the images in Fig. 4a, b, as well as the movies in Supplementary Videos 3, 4.
To avoid differences caused by gender and age, healthy male subjects between the ages of 23 and 27 were recruited through verbal recruitments. Informed consents were obtained from all study subjects before enrollment in the study. According to their BMI, the participating subjects were classified into two groups including a lean group with a BMI of 18.5 to and an overweight group with a BMI of 25 to .

On-body integrated system test

To validate the wearable multimodal sensor for dynamic exercise sweat analysis and metabolic assessment, a constant moderateintensity cycling exercise with no additional human-participant risk was conducted on recruited volunteers, including four lean subjects and four overweight subjects (Supplementary Table 3). All subjects reported to the lab after overnight fasting. Their foreheads were cleaned with alcohol swabs removing skin contaminants (not limited to AAs) before the sensors were attached to the body. During cycling, a smartphone camera was used to take pictures of the sensor for subsequent analysis of the digital images for automatic sweat loss calculation. Moreover, the data from the sensors was wirelessly sent to the user interface via Bluetooth. Every ten minutes, we clicked the ‘DPV’ button in the smartphone APP to launch DPV scanning and OCP measurement for in situ quantification of Phe and chloride levels respectively in the subject’s sweat at that moment. Meanwhile, sweat samples were also collected every 10 min from another area of the forehead of subjects using a funnel-shaped plastic bag. The sweat samples were then frozen at in centrifuge tubes for further testing, such as the Phe and AAs colorimetric assay kits for sensor validation.

Colorimetry for sweat sample analysis

For Phe standardized quantification, the L-Phenylalanine ELISA kit (Immusmol, France) was used for the competitive determination of Phe levels on collected sweat samples according to the manufacturer’s instruction. The chromogenic reaction was monitored at 450 nm using a Multiskan SkyHigh microplate spectrophotometer (Thermo Fisher Scientific, USA) and the unknown concentrations of Phe was calculated by comparing their absorbance with a reference curve prepared with known standards. For AAs standardized quantification, the micro AA content assay kit (Solarbio, China) was used for the direct determination of AAs levels on collected sweat samples using ninhydrin derivatization, which forms a violet ninhydrin-amino acid complex. After mixing all reagents, standards, and samples thoroughly, the mixtures were incubated in a boiling water bath for 15 min and then cooled at a cold water bath for 5 min . The absorbance at a wavelength of 570 nm was measured using the microplate spectrophotometer, and utilized for the calculation of unknown AAs concentrations according to the
absorbance of a Glycine standard ( 10 mM ). The above unspent reagents in the colorimetric assay kits were stored at unless otherwise used.

System validation with protein diet intake

To evaluate the system for non-invasively assessing serum Phe levels, a preliminary protein diet study was conducted on representative subjects from two BMI groups during exercise. The subjects reported to the lab after overnight fasting. The detailed human trial process is as follows: 1) a 50 min constant-load cycling exercise was performed on the subjects with the sweat analysis by the system from the forehead every 10 min , and the sweat samples were collected by the funnel-shaped plastic bag for further ELISA analysis. The sweat rate measured at this stage was used as the parameter to normalize the Phe concentration indicator in the subsequent sweat multimodal analysis; 2) Fresh capillary blood samples were immediately collected using a finger-prick approach. After cleaning the fingertip with an alcohol wipe and air drying, the fingertip was punctured with a custom-made blood-collection pen (Dunrse, China). Blood samples were collected with centrifuge tubes after the first drop of blood was wiped off. The collected blood samples were left at room temperature for 60 min and then centrifuged at 2000 for 15 min to separate the serum for LC-MS analysis; 3) The subjects were provided a standardized protein-rich snack, including a soy product and a pure milk. After diet intake, they are asked to sit and rest for 40 min to fully digest the intake and absorb the decomposed AAs; 4) Same as the first cycling, the subjects exercised for 50 min while sweat was analyzed by the wearable system and sampled for LC-MS analysis. Before sweat sensing via the previously used systems, the filter paper embedded in the microfluidic chamber was replaced with a new one, which was achieved by tearing off the old lower two layers of microfluidics and reassembling the new two layers. This replacement operation refreshes the pH buffering capacity of microfluidics to ensure the reliability of the Phe measurement in the next period without the need of a new sensor; 5) After the second cycling exercise, the subjects are asked to sit and rest for 40 min allowing the body to regulate the elevation of AAs levels caused by protein intake; 6) Same as the first and second cycling exercises as well as the replacement operation, the subjects performed the third exercise.

LC-MS for serum analysis

The Phe concentration in the serum samples were determined by LCMS with a multiple reaction monitoring (MRM) technique, which uses retention time as the main parameter used to identify analytes. Briefly, chromatographic separation was achieved using an ACQUITY UPLC I-Class system (Waters, USA) and Phe was separated using a UPLC HSS T3 column (Waters, USA) at a flow rate of . Phe was detected using a triple quadrupole mass spectrometer XEVO TQ-S (Waters, USA) fitted with an electrospray ionization interface operated in positive ion mode. Serum Phe was quantified by the peak area using MassLynx according to the standard curve obtained from Phe standards at known concentrations.

In vitro biocompatibility assessment

HaCaT (iCell Bioscience, China) were inoculated on a special medium for HaCaT at a density of cells per pore, and cultured with both the control group and the sterilized biochip in an incubator at a constant temperature of under . The HaCaT were cultured in vitro for 48 h (2 days) and 96 h ( 4 days), washed one time with PBS. Half stained with calcitonin- AM and polyimide for 15 min , was used to observe the number of live/dead cells, and the other half incubated for another 4 h after adding MTT (Solarbio, China) was used to observe the relative cell activity by the microplate spectrophotometer.

Statistical analysis

Origin 2018 was used for the linear fitting of corresponding data and the calculation Pearson correlation coefficient. SPSS Statistics 24 was used to assess the statistical significance. According to Shapiro-Wilk tests and Levene’s tests respectively, the two sets of Phe data from the lean and overweight groups were conformed to normality and variance-heterogeneity. Therefore, Wilcoxon rank sum test (Mann-Whitney test) was used for comparison between two data groups.

Reporting summary

Further information on research design is available in the Nature Portfolio Reporting Summary linked to this article.

Data availability

All data supporting the findings of this study are available within the article and its supplementary files at https://doi.org/10.6084/m9. figshare.24786486. Any additional requests for information can be directed to, and will be fulfilled by, the corresponding authors. Source data are provided with this paper.

Code availability

The codes used for simulation and data measurement are available from the corresponding author with upon reasonable request.

References

  1. Wu, G. Amino acids: metabolism, functions, and nutrition. Amino Acids 37, 1-17 (2009).
  2. Braverman E. R., Pfeiffer C. C., Blum K. & Smayda R. The healing nutrients within: facts, findings, and new research on amino acids. Basic Health Publications, Inc. (2003).
  3. Li, P., Yin, Y. L., Li, D., Kim, S. W. & Wu, G. Amino acids and immune function. Br. J. Nutr. 98, 237-252 (2007).
  4. Nie, C., He, T., Zhang, W., Zhang, G. & Ma, X. Branched chain amino acids: beyond nutrition metabolism. Int. J. Mol. Sci. 19, 954 (2018).
  5. Fernstrom, J. D. & Wurtman, R. J. Brain serotonin content: physiological regulation by plasma neutral amino acids. Science 178, 414-416 (1972).
  6. Hu, X. & Guo, F. Amino acid sensing in metabolic homeostasis and health. Endocr. Rev. 42, 56-76 (2021).
  7. Munro H. N. Mammalian protein metabolism. Elsevier (2012).
  8. Felig, P. Amino acid metabolism in man. Annu. Rev. Biochem. 44, 933-955 (1975).
  9. Wagenmakers, A. J. M. 11 muscle amino acid metabolism at rest and during exercise: role in human physiology and metabolism. Exerc. Sport Sci. Rev. 26, 287-314 (1998).
  10. Nasset, E. S., Heald, F. P., Calloway, D. H., Margen, S. & Schneeman, P. Amino acids in human blood plasma after single meals of meat, oil, sucrose and whiskey. J. Nutr. 109, 621-630 (1979).
  11. Atila, A. et al. The serum amino acid profile in COVID-19. Amino Acids 53, 1569-1588 (2021).
  12. Rao, T. S., Asha, M. R., Ramesh, B. N. & Rao, K. S. Understanding nutrition, depression and mental illnesses. Indian J. Psychiatry 50, 77-82 (2008).
  13. Cynober, L. A. Plasma amino acid levels with a note on membrane transport: characteristics, regulation, and metabolic significance. Nutrition 18, 761-766 (2002).
  14. Baker, L. B. & Wolfe, A. S. Physiological mechanisms determining eccrine sweat composition. Eur. J. Appl. Physiol. 120, 719-752 (2020).
  15. Baker, L. B. Physiology of sweat gland function: The roles of sweating and sweat composition in human health. Temperature 6, 211-259 (2019).
  16. Sylvestre, J. P., Bouissou, C. C., Guy, R. H. & Delgado-Charro, M. B. Extraction and quantification of amino acids in human stratum corneum in vivo. Br. J. Dermatol. 163, 458-465 (2010).
  17. Yang, D. S., Ghaffari, R. & Rogers, J. A. Sweat as a diagnostic biofluid. Science 379, 760-761 (2023).
  18. Bariya, M., Nyein, H. Y. Y. & Javey, A. Wearable sweat sensors. Nat. Electron. 1, 160-171 (2018).
  19. Luo, Y. et al. Technology roadmap for flexible sensors. ACS Nano 17, 5211-5295 (2023).
  20. Dunstan, R. H. et al. Sweat facilitated amino acid losses in male athletes during exercise at 32-34 degrees C. PLoS One 11, e0167844 (2016).
  21. Murphy, G. R. et al. Relationships between electrolyte and amino acid compositions in sweat during exercise suggest a role for amino acids and in reabsorption of and Cl – from sweat. PLoS One 14, e0223381 (2019).
  22. Jankovskaja, S. et al. Non-invasive, topical sampling of potential, low-molecular weight, skin cancer biomarkers: a study on healthy volunteers. Anal. Chem. 94, 5856-5865 (2022).
  23. Wang, M. et al. A wearable electrochemical biosensor for the monitoring of metabolites and nutrients. Nat. Biomed. Eng. 6, 1225-1235 (2022).
  24. Yang, Y. et al. A laser-engraved wearable sensor for sensitive detection of uric acid and tyrosine in sweat. Nat. Biotechnol. 38, 217-224 (2019).
  25. Pei, X. et al. A bifunctional fully integrated wearable tracker for epidermal sweat and wound exudate multiple biomarkers monitoring. Small 18, 2205061 (2022).
  26. Mukasa, D. et al. A computationally assisted approach for designing wearable biosensors toward non-invasive personalized molecular analysis. Adv. Mater. 35, e2212161 (2023).
  27. Souza, S. L., Graca, G. & Oliva, A. Characterization of sweat induced with pilocarpine, physical exercise, and collected passively by metabolomic analysis. Ski. Res. Technol. 24, 187-195 (2018).
  28. Harshman, S. W. et al. Metabolomic stability of exercise-induced sweat. J. Chromatogr. B: Anal. Technol. Biomed. Life Sci. 1126-1127, 121763 (2019).
  29. Heikenfeld, J. Non-invasive analyte access and sensing through eccrine sweat: challenges and outlook circa 2016. Electroanalysis 28, 1242-1249 (2016).
  30. Gitlitz, P. H., Sunderman, F. W. & Hohnadel, D. C. Ion-exchange chromatography of amino acids in sweat collected from healthy subjects during sauna bathing. Clin. Chem. 20, 1305-1312 (1974).
  31. Longo, N. et al. Noninvasive measurement of phenylalanine by iontophoretic extraction in patients with phenylketonuria. J. Inherit. Metab. Dis. 30, 910-915 (2007).
  32. van Spronsen, F. J. et al. Key European guidelines for the diagnosis and management of patients with phenylketonuria. Lancet Diabetes Endocrinol. 5, 743-756 (2017).
  33. Volpi, E., Kobayashi, H., Sheffield-Moore, M., Mittendorfer, B. & Wolfe, R. R. Essential amino acids are primarily responsible for the amino acid stimulation of muscle protein anabolism in healthy elderly adults. Am. J. Clin. Nutr. 78, 250-258 (2003).
  34. Swierczynski, J., Sledzinski, T., Slominska, E., Smolenski, R. & Sledzinski, Z. Serum phenylalanine concentration as a marker of liver function in obese patients before and after bariatric surgery. Obes. Surg. 19, 883-889 (2009).
  35. Dunstan, R. H. et al. Diverse characteristics of the urinary excretion of amino acids in humans and the use of amino acid supplementation to reduce fatigue and sub-health in adults. Nutr. J. 16, 19 (2017).
  36. Sonner, Z. et al. The microfluidics of the eccrine sweat gland, including biomarker partitioning, transport, and biosensing implications. Biomicrofluidics 9, 031301 (2015).
  37. Nyein, H. Y. Y. et al. Regional and correlative sweat analysis using high-throughput microfluidic sensing patches toward decoding sweat. Sci. Adv. 5, eaaw9906 (2019).
  38. Yu, Q. et al. Semisynthetic sensor proteins enable metabolic assays at the point of care. Science 361, 1122-1126 (2018).
  39. Wentland, L., Polaski, R. & Fu, E. Characterization methods in porous materials for the rational design of multi-step processing in the context of a paper microfluidic phenylalanine test. Anal. Methods 12, 768-780 (2020).
  40. Cheung, K. M. et al. Phenylalanine monitoring via aptamer-fieldeffect transistor sensors. ACS Sens 4, 3308-3317 (2019).
  41. Hsu, L.-W. et al. Simultaneous determination of l-Phenylalanine, Phenylethylamine, and Phenylacetic acid using three-color wholecell biosensors within a microchannel device. ACS Appl. Bio Mater. 3, 5120-5125 (2020).
  42. Ahmad, O. S., Bedwell, T. S., Esen, C., Garcia-Cruz, A. & Piletsky, S. A. Molecularly imprinted polymers in electrochemical and optical sensors. Trends Biotechnol. 37, 294-309 (2019).
  43. Parrilla, M., Vanhooydonck, A., Watts, R. & De Wael, K. Wearable wristband-based electrochemical sensor for the detection of phenylalanine in biofluids. Biosens. Bioelectron. 197, 113764 (2022).
  44. Sheridan, E. M. & Breslin, C. B. Enantioselective detection of D- and L-phenylalanine using optically active polyaniline. Electroanalysis 17, 532-537 (2005).
  45. He, S. et al. Electrochemical enantioselective sensor for effective recognition of tryptophan isomers based on chiral polyaniline twisted nanoribbon. Anal. Chim. Acta 1147, 155-164 (2021).
  46. Hu, Y. F., Zhang, Z. H., Zhang, H. B., Luo, L. J. & Yao, S. Z. Electrochemical determination of L-phenylalanine at polyaniline modified carbon electrode based on beta-cyclodextrin incorporated carbon nanotube composite material and imprinted sol-gel film. Talanta 84, 305-313 (2011).
  47. Zhong, B., Jiang, K., Wang, L. & Shen, G. Wearable sweat loss measuring devices: from the role of sweat loss to advanced mechanisms and designs. Adv. Sci. 9, e2103257 (2022).
  48. Sun, M. et al. A flexible and wearable epidermal ethanol biofuel cell for on-body and real-time bioenergy harvesting from human sweat. Nano Energy 86, 106061 (2021).
  49. Tu, J. et al. A wireless patch for the monitoring of C-reactive protein in sweat. Nat. Biomed. Eng. 7, 1293-1306 (2023).
  50. Torrente-Rodríguez, R. M. et al. Investigation of cortisol dynamics in human sweat using a graphene-based wireless mhealth system. Matter 2, 921-937 (2020).
  51. Zhang, X., Xia, Y., Liu, Y., Mugo, S. M. & Zhang, Q. Integrated wearable sensors for sensing physiological pressure signals and beta-hydroxybutyrate in physiological fluids. Anal. Chem. 94, 993-1002 (2021).
  52. Bi, Y. et al. Universal fully integrated wearable sensor arrays for the multiple electrolyte and metabolite monitoring in raw sweat, saliva, or urine. Anal. Chem. 95, 6690-6699 (2023).
  53. Zhao, J. et al. A wearable nutrition tracker. Adv. Mater. 33, e2006444 (2020).
  54. Sempionatto, J. R., Moon, J. M. & Wang, J. Touch-based fingertip blood-free reliable glucose monitoring: personalized data processing for predicting blood glucose concentrations. ACS Sens. 6, 1875-1883 (2021).
  55. Reeder, J. T. et al. Resettable skin interfaced microfluidic sweat collection devices with chemesthetic hydration feedback. Nat. Commun. 10, 5513 (2019).
  56. Lu Y. et al. Stretchable graphene-hydrogel interfaces for wearable and implantable bioelectronics. Nat. Electron. https://doi.org/10. 1038/s41928-023-01091-y (2023).
  57. Liu, Y. et al. Skin-interfaced superhydrophobic insensible sweat sensors for evaluating body thermoregulation and skin barrier functions. ACS Nano 17, 5588-5599 (2023).
  58. Nyein, H. Y. Y. et al. A wearable microfluidic sensing patch for dynamic sweat secretion analysis. ACS Sens. 3, 944-952 (2018).
  59. Eijsvogels, T. M. et al. The impact of obesity on physiological responses during prolonged exercise. Int. J. Obes. 35, 1404-1412 (2011).
  60. Harshman, S. W. et al. The impact of nutritional supplementation on sweat metabolomic content: a proof-of-concept study. Front. Chem. 9, 659583 (2021).

Acknowledgements

The authors sincerely acknowledge financial support from the National Natural Science Foundation of China (NSFC Grant No. 62174152, 62374159, and 62022079) and from the Youth Innovation Promotion Association of Chinese Academy of Sciences (No. 2020115).

Author contributions

B.Z., Z.L., and L.W., designed the research, B.Z. and L.W. wrote the paper, B.Z., X.Q., H.X., LC.L., L.L., ZX.L., Z.L., and L.W. performed the experiments, B. Z., L.L., and ZX.L. performed the first-principles calculations and simulations. B.Z., X.Q., J.A.J., N.-J.C., Z.L., and L.W. analyzed the data, B.Z. and L.C. designed the human studies. J.A.J., N.-J.C., Z. L. and L.W. revised the paper, Z.L. and L.W supervised the project. All authors substantially contributed to research and reviewed the manuscript.

Competing interests

The authors declare no competing interests.

Additional information

Supplementary information The online version contains
supplementary material available at
https://doi.org/10.1038/s41467-024-44751-z.
Correspondence and requests for materials should be addressed to Lili Wang.
Peer review information Nature Communications thanks Ming Zhou, Haotian Chen, and the other, anonymous, reviewer(s) for their contribution to the peer review of this work. A peer review file is available.
Reprints and permissions information is available at
http://www.nature.com/reprints
Publisher’s note Springer Nature remains neutral with regard to jurisdictional claims in published maps and institutional affiliations.
Open Access This article is licensed under a Creative Commons Attribution 4.0 International License, which permits use, sharing, adaptation, distribution and reproduction in any medium or format, as long as you give appropriate credit to the original author(s) and the source, provide a link to the Creative Commons license, and indicate if changes were made. The images or other third party material in this article are included in the article’s Creative Commons license, unless indicated otherwise in a credit line to the material. If material is not included in the article’s Creative Commons license and your intended use is not permitted by statutory regulation or exceeds the permitted use, you will need to obtain permission directly from the copyright holder. To view a copy of this license, visit http://creativecommons.org/ licenses/by/4.0/.
© The Author(s) 2024

  1. State Key Laboratory for Superlattices and Microstructures, Institute of Semiconductors, Chinese Academy of Sciences, Beijing 100083, China. Center of Materials Science and Optoelectronic Engineering, University of Chinese Academy of Sciences, Beijing 100049, China. Tianjin Key Laboratory of Lung Cancer Metastasis and Tumor Microenvironment, Tianjin Lung Cancer Institute, Tianjin Medical University General Hospital, Tianjin 300052, China. School of Chemical Engineering and Translational Nanobioscience Research Center, Sungkyunkwan University, Suwon 16419, Republic of Korea. School of Materials Science and Engineering, Nanyang Technological University, 637553 Singapore, Singapore. e-mail: liliwang@semi.ac.cn