DOI: https://doi.org/10.1016/j.ijcard.2025.133443
PMID: https://pubmed.ncbi.nlm.nih.gov/40456317
تاريخ النشر: 2025-05-31
تحليل مقارن لنماذج تعلم الآلة في توقع مرض الشريان التاجي مع اختيار ميزات محسّن
معلومات المقال
الكلمات المفتاحية:
تعلم الآلة
اختيار الميزات
تحسين بحث النسر الأصلع
الغابة العشوائية
الملخص
الخلفية: مرض الشريان التاجي (CAD) هو سبب رئيسي للوفاة على مستوى العالم، مما يستلزم التنبؤ المبكر والدقيق من أجل إدارة أفضل. غالبًا ما تكون التشخيصات التقليدية تدخّلية ومكلفة وأقل وصولاً. تقدم تقنيات التعلم الآلي (ML) بديلاً غير تدخلي، ولكن البيانات عالية الأبعاد والازدواجية يمكن أن تعيق الأداء. تدمج هذه الدراسة تحسين بحث النسر الأصلع (BESO) لاختيار الميزات لتحسين تصنيف CAD باستخدام نماذج متعددة من التعلم الآلي. الطرق: مجموعتان بيانات متاحتان للجمهور، فرامينغهام (4200 حالة، 15 ميزة) و
1. المقدمة
الموت [2]. الكشف المبكر عن مرض الشريان التاجي أمر بالغ الأهمية لمنع تقدمه، وتحسين نتائج المرضى، وتقليل تكاليف الرعاية الصحية [3]. ومع ذلك، فإن الطرق التشخيصية التقليدية بما في ذلك تخطيط القلب الكهربائي (ECG)، وتصوير القلب بالموجات فوق الصوتية، وتصوير الأوعية، واختبارات الإجهاد غالبًا ما تكون تدخّلية، مكلفة، أو تعتمد على خبرة متخصصة [4]. وقد أدت هذه القيود إلى زيادة الاهتمام بتقنيات التعلم الآلي (ML) كبدائل غير تدخّلية تعتمد على البيانات للتنبؤ بمخاطر مرض الشريان التاجي باستخدام بيانات المرضى المتاحة بسهولة [5].
2. المنهجية
2.1. جمع البيانات
- مجموعة بيانات فرامينغهام: هذه المجموعة تأتي من دراسة فرامينغهام للقلب، وهي دراسة طويلة الأمد مستمرة عن مجموعة من سكان فرامينغهام، ماساتشوستس. تحتوي على 4200 حالة مع 15 ميزة تنبؤية تتعلق بالخصائص الديموغرافية، والتاريخ الطبي، وعوامل الخطر المرتبطة بـ CAD. تشمل مجموعة البيانات بيانات طولية تم جمعها على مدى عدة دورات فحص، مع فترة متابعة لمدة 10 سنوات للأحداث القلبية الوعائية.
-
-مجموعة بيانات علي زاده ساني: تم اختيار هذه المجموعة بشكل خاص كمجموعة بيانات مكملة لأنها تحتوي على قياسات سريرية أكثر تفصيلاً مقارنة بمجموعة بيانات فرامينغهام. تم نشرها بواسطة علي زاده ساني وآخرين (2013)، وتم جمعها من مركز شهيد رجائي للقلب والطب والبحث في طهران [7]. تحتوي على 304 حالات مع 55 ميزة تغطي عدة أنماط، بما في ذلك الخصائص الديموغرافية (العمر، الجنس)، الأعراض (ألم الصدر النموذجي، ألم الصدر غير النموذجي)، نتائج الفحص (ضغط الدم الانقباضي والانبساطي)، قراءات تخطيط القلب (ارتفاع ST، انخفاض ST)، اختبارات المختبر (سكر الدم الصائم، الكرياتينين، الدهون الثلاثية)، وقياسات تخطيط صدى القلب (كسر القذف). المتغير الرئيسي هو وجود CAD، المحدد كـ تضيق في واحد على الأقل من الشرايين التاجية الرئيسية، كما تحدده الأشعة التاجية، والتي تعتبر المعيار الذهبي لتشخيص CAD.
2.2. المعالجة المسبقة للبيانات
- التعامل مع القيم المفقودة: تم تعويض القيم المفقودة باستخدام تعويض الوسيط، وهو قوي ضد القيم الشاذة ويمنع انحراف البيانات.
- تطبيع الميزات: تم توحيد الميزات العددية باستخدام StandardScaler من Scikit-learn، الذي يطبع البيانات لتكون ذات متوسط صفر وانحراف معياري واحد.
- ترميز الفئات: تم تحويل المتغيرات الفئوية إلى قيم عددية باستخدام LabelEncoder من Scikit-learn، الذي يخصص لكل فئة عدد صحيح فريد.
- التعامل مع عدم توازن الفئات: تم استخدام تقنية الزيادة الاصطناعية للأقليات (SMOTE) لمعالجة عدم توازن الفئات من خلال توليد عينات اصطناعية للفئة الأقل بينما يتم الحفاظ على توزيع الفئة الأكثر. تم إجراء الزيادة بشكل منفصل على مجموعات التدريب والاختبار لمنع تسرب البيانات وتحسين تعميم النموذج.
2.3. اختيار الميزات باستخدام تحسين بحث النسر الأصلع
- تقليل الميزات: نظرًا لأن مجموعة بيانات فرامينغهام تحتوي على 15 ميزة و
-مجموعة بيانات علي زاده ساني تحتوي على 55 ميزة، كان من الضروري تقليل الأبعاد لتقليل التعقيد الحسابي وتحسين أداء النموذج. - آلية التحسين: اختار BESO بشكل تكراري الميزات الأكثر تنبؤًا مع تجنب الأمثل المحلية، مما يضمن أن المجموعة النهائية من الميزات تحتفظ بأكثر المعلومات صلة بتوقع CAD.
2.4. خوارزميات تعلم الآلة لتوقع
- K-أقرب الجيران (KNN): خوارزمية تعلم قائمة على الحالات وغير معلمية، تم اختيار KNN لبساطتها وفعاليتها في التقاط الأنماط المحلية. يمكنها نمذجة الحدود القرار المعقدة دون افتراضات حول توزيع البيانات الأساسي. لقد أظهرت KNN نجاحًا في تطبيقات تشخيص طبية حيث غالبًا ما تشترك مجموعات محلية من المرضى المتشابهين في التشخيصات [16]. اخترنا هذه الخوارزمية كخط أساس بسبب قابليتها للتفسير وقدرتها على التعامل مع العلاقات غير الخطية.
- الانحدار اللوجستي (LR): كنموذج خطي احتمالي، تم تضمين LR لقابليته للتفسير وتاريخه المثبت في توقع المخاطر الطبية. يوفر نسب الأرجحية للميزات الفردية، مما يسمح للأطباء بفهم مساهمة عوامل الخطر المحددة. يستخدم مقياس خطر فرامينغهام نفسه الانحدار اللوجستي،
BESO لاختيار الميزات.
Input:
    - dataset (features, target)
    - population size (N)
    - maximum iterations (MaxIter)
    - search space dimension (D, number of features)
    - fitness function (e.g., model performance with selected features)
    - parameters (alpha, beta, c1, c2, etc.)
    Output:
    - optimal feature subset
    1. Initialize population:
    - generate N random solutions (feature subsets) represented as binary vectors (0 or 1, where 1 indicates feature selection).
    2. Evaluate fitness:
    - for each solution in the population:
    Select features based on the solution's binary vector.
    Train a model using the selected features.
    Calculate the fitness (e.g., accuracy, F1-score) of the model.
    3. Iterative optimization (for iteration = 1 to MaxIter):
    - phase 1 (select space):
    - calculate the mean of the population.
    - update solutions based on the mean and random search.
    - phase 2 (search space):
    - calculate the best solution (eagle with the best fitness).
    - update solutions based on the best solution and random search.
    - phase 3 (swipe space):
    - update solutions based on the best solution, previous solution, and random search, simulating eagle's swoop.
    - evaluate fitness:
    - recalculate the fitness of each solution.
    - update best solution:
    - if a solution with better fitness is found, update the best solution.
    4. Return optimal feature subset:
    - return the feature subset corresponding to the best solution found during the optimization process.
- آلات الدعم الناقل (SVM): تم استخدام SVM مع ثلاث دوال نواة لتقييم كل من الأساليب الخطية وغير الخطية لتصنيف CAD:
- نواة خطية: استخدمت لتحديد ما إذا كانت البيانات قابلة للفصل خطيًا ولتكون نقطة مقارنة للنوى الأكثر تعقيدًا.
- نواة متعددة الحدود: تم تطبيقها لالتقاط العلاقات غير الخطية من الدرجة متعددة الحدود للحدود القرار الأكثر تعقيدًا، والتي قد تمثل بشكل أفضل التفاعل بين عوامل الخطر المتعددة.
- نواة دالة القاعدة الشعاعية (RBF): تم اختيارها لقدرتها على التعامل مع البيانات غير الخطية بشكل كبير من خلال رسم الميزات المدخلة إلى مساحة أعلى الأبعاد. لقد أظهرت نوى RBF أداءً متفوقًا في دراسات توقع CAD السابقة [18].
- الغابة العشوائية (RF): كطريقة تعلم جماعية، تم اختيار RF لقدرتها على التعامل مع البيانات عالية الأبعاد، ومقاومتها للتكيف الزائد، وتقدير أهمية الميزات الكامنة. لقد أظهرت الدراسات السابقة فعاليتها في توقع مخاطر القلب والأوعية الدموية [19]. تجمع RF بين عدة أشجار قرار من خلال التصويت بالأغلبية، مما يلتقط التفاعلات المعقدة بين الميزات مع الحفاظ على قابلية تفسير النموذج من خلال تصنيفات أهمية الميزات.
2.5. تقييم الأداء
2.5.1. نهج تقييم الاحتفاظ
2.5.2. تحسين المعلمات الفائقة التجريبية
- KNN: قمنا باختبار عدد الجيران (k) من 1 إلى 15، ومقاييس المسافة (إقليدي، مانهاتن، مينكوفسكي)، مع اختيار التكوينات التي حققت أقصى دقة على مجموعات التحقق.
- الانحدار اللوجستي: قمنا بضبط معامل الانتظام (C) تجريبيًا من 0.001 إلى 1000 على مقياس لوغاريتمي، واختبرنا كل من عقوبات L1 و L2، واختارنا التركيبة التي حققت أفضل أداء.
- آلية دعم المتجهات: بالنسبة لجميع النوى (خطية، متعددة الحدود، RBF)، قمنا بتحسينها تجريبيًا:
- معامل الانتظام (C) من 0.1 إلى 100
- للنواة الخطية: قمنا أيضًا باختبار قيم تحمل مختلفة
- للنواة متعددة الحدود: قمنا باختبار الدرجات من 2 إلى 5
- بالنسبة لنواة RBF: قمنا بضبط معامل غاما من 0.001 إلى 1
- الغابة العشوائية: قمنا بتحسين عدد الأشجار تجريبيًا (100-500)، والعمق الأقصى (5-20)، والحد الأدنى من عينات الانقسام (2-10)، والحد الأدنى من عينات الورقة (1-5).
2.5.3. اختبار الدلالة الإحصائية
2.5.4. مقاييس التقييم
- الدقة: تقيس الصحة العامة للنموذج في التنبؤ بمرض الشريان التاجي.
- الدقة: تقيم نسبة التنبؤات الإيجابية الصحيحة بين جميع التنبؤات الإيجابية.
- الاسترجاع (الحساسية): يقيس نسبة حالات مرض الشريان التاجي الفعلية التي تم تحديدها بشكل صحيح بواسطة النموذج.
- درجة F1: توفر توازنًا بين الدقة والاسترجاع، وهي مفيدة بشكل خاص في التعامل مع عدم توازن الفئات.
- المساحة تحت منحنى خصائص التشغيل المستقبلية (AUC-ROC): تقيم قدرة النموذج على التمييز بين الفئات الإيجابية والسلبية عبر إعدادات العتبة المختلفة.
2.6. الخط الأساسي
- لا اختيار للميزات: تم تدريب النماذج باستخدام جميع الميزات المتاحة في كل مجموعة بيانات لتحديد معايير الأداء دون أي تقليل للميزات.
- طرق اختيار الميزات التقليدية: قمنا بتنفيذ ومقارنة عدة تقنيات معروفة لاختيار الميزات:
- طرق التصفية: اختبار كاي-تربيع واكتساب المعلومات
- طرق التغليف: الإزالة التكرارية للميزات (RFE)
- طرق مضمنة: تنظيم LASSO
2.7. المقارنة مع درجات المخاطر السريرية
- درجة خطر فريمينغهام (FRS): قمنا بتنفيذ درجة FRS المحدثة، التي تتنبأ بخطر الأحداث القلبية الوعائية على مدى 10 سنوات، كأساس سريري للمقارنة.
- SCORE (تقييم المخاطر التاجية المنهجي): تم تنفيذ نظام تقييم المخاطر الأوروبي كنقطة مقارنة سريرية إضافية.
- حاسبة مخاطر ASCVD: تم أيضًا تنفيذ حاسبة المخاطر من الكلية الأمريكية لأمراض القلب / جمعية القلب الأمريكية.
2.8. تعريف هدف التنبؤ
- مجموعة بيانات فريمينغهام: الهدف من التنبؤ هو خطر الإصابة بمرض الشريان التاجي السريري خلال 10 سنوات (بما في ذلك احتشاء عضلة القلب، والقصور التاجي، والذبحة الصدرية) كما تحدده بروتوكولات المتابعة لدراسة قلب فريمينغهام.
- مجموعة بيانات ز-علي زاده ساني: الهدف من التنبؤ هو حالة CAD الحالية، المحددة على أنها وجود
تضيق في واحد على الأقل من الشرايين التاجية الرئيسية كما تحدده الأشعة التداخلية.
3. النتائج
3.1. النتائج التجريبية على مجموعة بيانات فريمينغهام
تقييم أداء نماذج التعلم الآلي على مجموعة بيانات فريمينغهام بعد اختيار الميزات باستخدام BESO.
| رقم التسلسل | خوارزمية | دقة | دقة | استدعاء | درجة F1 |
| 1 | KNN ( K-أقرب الجيران )
|
0.81 | 0.83 | 0.81 | 0.81 |
| 2 | الانحدار اللوجستي | 0.66 | 0.66 | 0.66 | 0.66 |
| ٣ | SVM (خطّي) | 0.66 | 0.66 | 0.66 | 0.66 |
| ٤ | SVM (rbf) | 0.73 | 0.73 | 0.73 | 0.73 |
| ٥ | SVM (متعدد الحدود) | 0.69 | 0.69 | 0.69 | 0.69 |
| ٦ | الغابة العشوائية | 0.90 | 0.90 | 0.90 | 0.90 |
بين النماذج، أظهر نموذج الغابة العشوائية (RF) أعلى أداء، محققًا أفضل النتائج عبر جميع مقاييس التقييم. لقد أظهر قدرة تنبؤية قوية بدقة عالية، وPrecision، وRecall، وF1-score، مما يدل على نموذج جيد التعميم مع أخطاء تصنيف قليلة. يمكن أن يُعزى هذا الأداء المتفوق إلى نهج التعلم الجماعي لـ RF، الذي يلتقط الأنماط المعقدة بفعالية مع تقليل الإفراط في التكيف.
3.2. النتائج التجريبية على مجموعة بيانات
النتائج التجريبية من مجموعة بيانات Z-Alizadeh Sani باستخدام ميزات BESO.
| رقم تسلسلي | الخوارزمية | الدقة | الدقة | الاسترجاع | درجة F1 |
| 1 | KNN (
|
0.87 | 0.88 | 0.88 | 0.87 |
| 2 | الانحدار اللوجستي | 0.90 | 0.90 | 0.90 | 0.90 |
| 3 | SVM (خطية) | 0.89 | 0.89 | 0.89 | 0.88 |
| 4 | SVM (RBF) | 0.89 | 0.89 | 0.89 | 0.89 |
| 5 | SVM (متعددة الحدود) | 0.82 | 0.82 | 0.82 | 0.81 |
| 6 | Random Forest | 0.92 | 0.92 | 0.92 | 0.92 |
3.3. التحليل الإحصائي لأداء النموذج
3.4. تأثير اختيار الميزات
مقارنة أداء النموذج مع أساليب اختيار ميزات مختلفة.
| مجموعة البيانات | النموذج | بدون اختيار ميزات | RFE | LASSO | BESO |
| Framingham | Random Forest |
|
|
|
|
| Framingham | الانحدار اللوجستي |
|
|
|
|
| Framingham | SVM (خطية) |
|
|
|
|
| Framingham | SVM (RBF) |
|
|
|
|
|
|
Random Forest |
|
|
|
|
| Z-Alizadeh Sani | الانحدار اللوجستي |
|
|
|
|
| Z-Alizadeh Sani | SVM (خطية) |
|
|
|
|
| Z-Alizadeh Sani | SVM (RBF) |
|
|
|
|
3.5. مقارنة مع درجات المخاطر السريرية
4. المناقشة
المقارنة مع درجات المخاطر السريرية.
| مجموعة بيانات | طريقة | دقة | منحنى الخصائص التشغيلية للمتلقي | حساسية | خصوصية |
| فرامنجهام | الغابة العشوائية + بيسو |
|
0.94 ± 0.02 |
|
|
| فريمينغهام | درجة خطر فريمينغهام |
|
0.76 ± 0.03 |
|
|
| فريمينغهام | حاسبة مخاطر ASCVD |
|
0.79 ± 0.03 |
|
|
|
|
الغابة العشوائية + بيسو |
|
0.95 ± 0.02 |
|
|
| زالیزاده سانی | نتيجة |
|
0.79 ± 0.04 |
|
|
التصنيف، مما يضمن التعرف الموثوق على كل من الحالات الإيجابية والسلبية. هذه النتيجة تتماشى مع عمل هانلي [42].
5. نقاط القوة والقيود في الدراسة
5.1. نقاط القوة
5.2. القيود
المنهجية لتطبيق بيانات المرضى في العالم الحقيقي لتقييم قابليتها السريرية.
6. الخاتمة
الإعدادات، تقييم الأثر على اتخاذ القرارات السريرية، وتطوير واجهات سهلة الاستخدام تسهل اعتمادها من قبل مقدمي الرعاية الصحية. بالإضافة إلى ذلك، يجب استكشاف تقنيات التفسير لمساعدة الأطباء على فهم الثقة في التنبؤات التي تولدها هذه النماذج، خاصة بالنسبة لأساليب التجميع المعقدة مثل الغابة العشوائية.
بيان مساهمة مؤلفي CRediT
References
[2] R. Ross, Atherosclerosis—an inflammatory disease, N. Engl. J. Med. 340 (2) (1999) 115-126.
[3] P. Greenland, J.S. Alpert, G.A. Beller, E.J. Benjamin, M.J. Budoff, Z.A. Fayad, et al., Coronary artery calcium score combined with Framingham score for risk prediction in asymptomatic individuals, JAMA 291 (2) (2004) 210-215.
[4] S.D. Fihn, J.M. Gardin, J. Abrams, K. Berra, J.C. Blankenship, A.P. Dallas, et al., 2014 ACC/AHA/AATS/PCNA/SCAI/STS focused update of the guideline for the diagnosis and management of patients with stable ischemic heart disease, Circulation 130 (19) (2014) 1749-1767.
[5] Z. Obermeyer, E.J. Emanuel, Predicting the future-big data, machine learning, and clinical medicine, N. Engl. J. Med. 375 (13) (2016) 1216-1219.
[6] A. Rajkomar, J. Dean, I. Kohane, Machine learning in medicine, N. Engl. J. Med. 380 (14) (2019) 1347-1358.
[7] R. Alizadehsani, M.J. Hosseini, A. Khosravi, F. Khozeimeh, M. Roshanzamir, N. Sarrafzadegan, et al., A data mining approach for diagnosis of coronary artery disease, Comput. Methods Prog. Biomed. 111 (1) (2013) 52-61.
[8] D. Dua, C. Graff, UCI Machine Learning Repository: Heart Disease Dataset, 2019.
[9] I. Guyon, A. Elisseeff, An introduction to variable and feature selection, J. Mach. Learn. Res. 3 (2003) 1157-1182.
[10] G. Chandrashekar, F. Sahin, A survey on feature selection methods, Comput. Electr. Eng. 40 (1) (2014) 16-28.
[11] I.T. Jolliffe, Principal Component Analysis, Springer, New York, 2002.
[12] Y. Saeys, I. Inza, P. Larrañaga, A review of feature selection techniques in bioinformatics, Bioinformatics 23 (19) (2007) 2507-2517.
[13] X.S. Yang, Nature-Inspired Metaheuristic Algorithms, Luniver Press, Beckington, 2010.
[14] H.A. Alsattar, A.A. Zaidan, B.B. Zaidan, Bald eagle search optimization algorithm: a new nature-inspired metaheuristic technique, Soft. Comput. 24 (12) (2020) 8723-8739.
[15] J. Kennedy, R. Eberhart, Particle swarm optimization, in: Proceedings of ICNN’95 International Conference on Neural Networks, IEEE, Perth, WA, Australia, 1995, pp. 1942-1948.
[16] S. Zhang, X. Li, M. Zong, X. Zhu, R. Wang, Efficient kNN classification with different numbers of nearest neighbors, IEEE Trans. Neural Netw. Learn. Syst. 29 (5) (2017 Apr 12) 1774-1785.
[17] R.B. D’Agostino Sr., R.S. Vasan, M.J. Pencina, P.A. Wolf, M. Cobain, J.M. Massaro, W.B. Kannel, General cardiovascular risk profile for use in primary care: the Framingham heart study, Circulation 117 (6) (2008 Feb 12) 743-753.
[18] R. Alizadehsani, M. Roshanzamir, M. Abdar, A. Beykikhoshk, M.H. Zangooei, A. Khosravi, S. Nahavandi, R.S. Tan, U.R. Acharya, Model uncertainty quantification for diagnosis of each main coronary artery stenosis, Soft. Comput. 24 (2020 Jul) 10149-10160.
[19] A.M. Alaa, T. Bolton, E. Di Angelantonio, J.H. Rudd, M. Van der Schaar, Cardiovascular disease risk prediction using automated machine learning: a prospective study of 423,604 UK biobank participants, PLoS One 14 (5) (2019 May 15) e0213653.
[20] L. Breiman, Random forests, Mach. Learn. 45 (1) (2001) 5-32.
[21] T. Hastie, R. Tibshirani, J. Friedman, The Elements of Statistical Learning: Data Mining, Inference, and Prediction, 2nd ed., Springer, New York, 2009.
[22] R. Shouval, O. Hadani, N. Shlomo, et al., Machine learning for prediction of 30-day mortality after ST elevation myocardial infarction, Int. J. Cardiol. 246 (2017) 7-13.
[23] L. Breiman, Bagging predictors, Mach. Learn. 24 (2) (1996) 123-140.
[24] T. Brown, R. Patel, Linear separability in high-dimensional medical data: implications for model performance, IEEE Trans. Biomed. Eng. 66 (3) (2019) 789-798.
[25] R. Alizadehsani, M. Abdar, M. Roshanzamir, et al., Machine learning-based coronary artery disease diagnosis: a comprehensive review, Comput. Biol. Med. 111 (2019) 103346.
[26] J. Smith, K. Lee, Binary elephant swarm optimization for feature selection in medical datasets, J. Mach. Learn. Res. 21 (45) (2020) 1-25.
[27] Y. Zhang, L. Wang, Nature-inspired optimization algorithms for feature selection: a review, IEEE Trans. Syst. Man Cybern. Syst. 49 (12) (2019) 2345-2356.
[28] V.N. Vapnik, The Nature of Statistical Learning Theory, Springer, New York, 1995.
[29] A. Johnson, et al., Machine learning for coronary artery disease prediction: a review, Artif. Intell. Med. 115 (2021) 102056.
[30] V.N. Vapnik, A.Y. Chervonenkis, Support-vector networks, Mach. Learn. 20 (3) (1995) 273-297.
[31] G. Biau, E. Scornet, A random forest guided tour, Test 25 (2) (2016) 197-227.
[32] E. Braunwald, et al., Clinical predictors of coronary artery disease: a review, J. Am. Coll. Cardiol. 74 (10) (2019) 1311-1323.
[33] P.W. Wilson, et al., Prediction of coronary heart disease using risk factor categories, Circulation 97 (18) (1998) 1837-1847.
[34] T.M. Cover, P.E. Hart, Nearest neighbor pattern classification, IEEE Trans. Inf. Theory 13 (1) (1967) 21-27.
[35] R.O. Duda, P.E. Hart, D.G. Stork, Pattern Classification, 2nd ed., Wiley, New York, 2001.
[36] R.O. Duda, P.E. Hart, Use of the Hough transformation to detect lines and curves in pictures, Commun. ACM 15 (1) (1972) 11-15.
[37] T.R. Dawber, G.F. Meadors, F.E. Moore Jr., Epidemiological approaches to heart disease: the Framingham study, Am. J. Public Health Nations Health 41 (3) (1951) 279-281.
[38] R. Alizadehsani, M.H. Zangooei, M.J. Hosseini, et al., Coronary Artery Disease Dataset: Z-Alizadeh Sani Dataset, UCI Machine Learning Repository, 2012.
[39] R. Kohavi, G.H. John, Wrappers for feature subset selection, Artif. Intell. 97 (1-2) (1997) 273-324.
[40] J.A. Hanley, B.J. McNeil, The meaning and use of the area under a receiver operating characteristic (ROC) curve, Radiology 143 (1) (1982) 29-36.
[41] E.J. Topol, High-performance medicine: the convergence of human and artificial intelligence, Nat. Med. 25 (1) (2019) 44-56.
[42] J.A. Hanley, B.J. McNeil, A method of comparing the areas under receiver operating characteristic curves derived from the same cases, Radiology 148 (3) (1983) 839-843.
- Corresponding author at: Department of Allied and Public Health, School of Health, Sport and Bioscience, University of East London, London, United Kingdom.
E-mail address: d.olawade@uel.ac.uk (D.B. Olawade).
DOI: https://doi.org/10.1016/j.ijcard.2025.133443
PMID: https://pubmed.ncbi.nlm.nih.gov/40456317
Publication Date: 2025-05-31
Comparative analysis of machine learning models for coronary artery disease prediction with optimized feature selection
ARTICLE INFO
Keywords:
Machine learning
Feature selection
Bald eagle search optimization
Random Forest
Abstract
Background: Coronary artery disease (CAD) is a major global cause of death, necessitating early, accurate prediction for better management. Traditional diagnostics are often invasive, costly, and less accessible. Machine learning (ML) offers a non-invasive alternative, but high-dimensional data and redundancy can hinder performance. This study integrates Bald Eagle Search Optimization (BESO) for feature selection to improve CAD classification using multiple ML models. Methods: Two publicly available datasets, Framingham ( 4200 instances, 15 features) and
1. Introduction
death [2]. Early detection of CAD is paramount to preventing its progression, improving patient outcomes, and reducing healthcare costs [3]. However, conventional diagnostic methods including electrocardiography (ECG), echocardiography, angiography, and stress testing are often invasive, costly, or reliant on specialized expertise [4]. These limitations have spurred growing interest in machine learning (ML) techniques as non-invasive, data-driven alternatives for predicting CAD risk using readily available patient data [5].
2. Methodology
2.1. Data acquisition
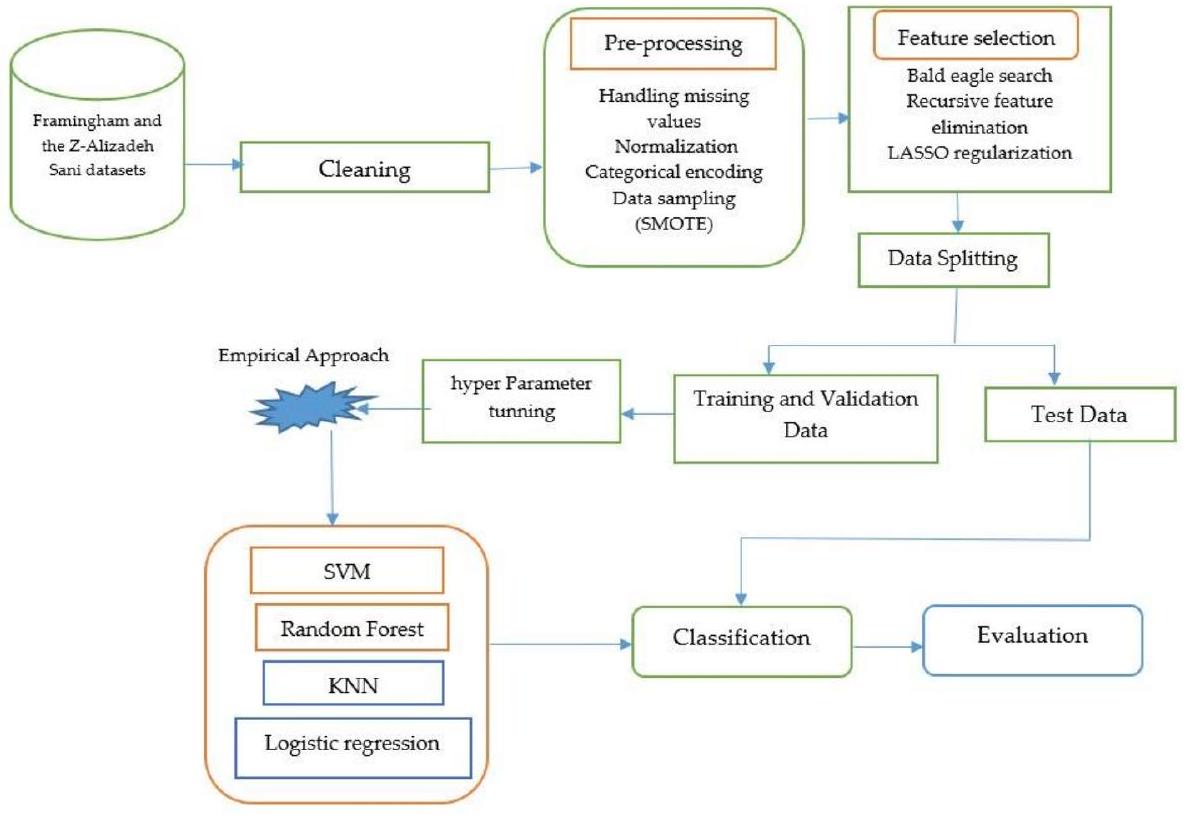
- Framingham Dataset: This dataset originates from the Framingham Heart Study, a long-term, ongoing cardiovascular cohort study of residents of Framingham, Massachusetts. It contains 4200 instances with 15 predictive features related to demographics, medical history, and risk factors associated with CAD. The dataset includes longitudinal data collected over multiple examination cycles, with a 10-year follow-up period for cardiovascular events.
-
-Alizadeh Sani Dataset: This dataset was specifically chosen as a complementary dataset because it contains more detailed clinical measurements compared to the Framingham dataset. Published by Alizadehsani et al. (2013), it was collected from Tehran’s Shaheed Rajaei Cardiovascular, Medical, and Research Center [7]. It contains 304 instances with 55 features spanning multiple modalities, including demographic attributes (age, sex), symptoms (typical chest pain, atypical chest pain), examination results (systolic and diastolic blood pressure), electrocardiogram (ECG) readings (ST elevation, ST depression), laboratory tests (fasting blood sugar, creatinine, triglycerides), and echocardiographic measurements (ejection fraction). The primary outcome variable is the presence of CAD, defined as stenosis in at least one major coronary artery, as determined by angiography, which serves as the gold standard for CAD diagnosis.
2.2. Data preprocessing
- Handling Missing Values: Missing values were imputed using median imputation, which is robust to outliers and prevents skewing of the data.
- Feature Normalization: Numerical features were standardized using Scikit-learn’s StandardScaler, which normalizes the data to have zero mean and unit standard deviation.
- Categorical Encoding: Categorical variables were converted into numerical values using Scikit-learn’s LabelEncoder, which assigns each category a unique integer.
- Class Imbalance Handling: The Synthetic Minority Over-sampling Technique (SMOTE) was used to address class imbalance by generating synthetic samples for the minority class while maintaining the distribution of the majority class. Over-sampling was performed separately on the training and testing sets to prevent data leakage and improve model generalization.
2.3. Feature selection using bald eagle search optimization
- Feature Reduction: Given that the Framingham dataset contained 15 features and the
-Alizadeh Sani dataset contained 55 features, dimensionality reduction was necessary to minimize computational complexity and improve model performance. - Optimization Mechanism: BESO iteratively selected the most predictive features while avoiding local optima, ensuring that the final subset of features retained the most relevant information for CAD prediction.
2.4. Machine learning algorithms for prediction of
- K-Nearest Neighbors (KNN): A non-parametric, instance-based learning algorithm, KNN was selected for its simplicity and effectiveness in capturing local patterns. It can model complex decision boundaries without making assumptions about the underlying data distribution. KNN has shown success in medical diagnosis applications where local clusters of similar patients often share diagnoses [16]. We selected this algorithm as a baseline due to its interpretability and ability to handle non-linear relationships.
- Logistic Regression (LR): As a probabilistic linear model, LR was included for its interpretability and established history in medical risk prediction. It provides odds ratios for individual features, allowing clinicians to understand the contribution of specific risk factors. The Framingham Risk Score itself uses logistic regression,
BESO for feature selection.
Input:
    - dataset (features, target)
    - population size (N)
    - maximum iterations (MaxIter)
    - search space dimension (D, number of features)
    - fitness function (e.g., model performance with selected features)
    - parameters (alpha, beta, c1, c2, etc.)
    Output:
    - optimal feature subset
    1. Initialize population:
    - generate N random solutions (feature subsets) represented as binary vectors (0 or 1, where 1 indicates feature selection).
    2. Evaluate fitness:
    - for each solution in the population:
    Select features based on the solution's binary vector.
    Train a model using the selected features.
    Calculate the fitness (e.g., accuracy, F1-score) of the model.
    3. Iterative optimization (for iteration = 1 to MaxIter):
    - phase 1 (select space):
    - calculate the mean of the population.
    - update solutions based on the mean and random search.
    - phase 2 (search space):
    - calculate the best solution (eagle with the best fitness).
    - update solutions based on the best solution and random search.
    - phase 3 (swipe space):
    - update solutions based on the best solution, previous solution, and random search, simulating eagle's swoop.
    - evaluate fitness:
    - recalculate the fitness of each solution.
    - update best solution:
    - if a solution with better fitness is found, update the best solution.
    4. Return optimal feature subset:
    - return the feature subset corresponding to the best solution found during the optimization process.
- Support Vector Machines (SVM): SVM was employed with three kernel functions to evaluate both linear and non-linear approaches to CAD classification:
- Linear Kernel: Used to establish whether the data is linearly separable and to serve as a comparison point for more complex kernels.
- Polynomial Kernel: Applied to capture non-linear relationships of polynomial degree for more complex decision boundaries, which may better represent the interaction between multiple risk factors.
- Radial Basis Function (RBF) Kernel: Selected for its ability to handle highly non-linear data by mapping input features to a higher-dimensional space. RBF kernels have shown superior performance in previous CAD prediction studies [18].
- Random Forest (RF): As an ensemble learning method, RF was chosen for its ability to handle high-dimensional data, resistance to overfitting, and inherent feature importance estimation. Previous studies have demonstrated its effectiveness in cardiovascular risk prediction [19]. RF aggregates multiple decision trees through majority voting, capturing complex interactions between features while maintaining model interpretability through feature importance rankings.
2.5. Performance evaluation
2.5.1. Holdout evaluation approach
2.5.2. Empirical hyperparameter optimization
- KNN: We empirically tested the number of neighbors (k) from 1 to 15, and distance metrics (Euclidean, Manhattan, Minkowski), selecting configurations that maximized accuracy on validation subsets.
- Logistic Regression: We empirically tuned the regularization parameter (C) from 0.001 to 1000 on a logarithmic scale, and tested both L1 and L2 penalties, selecting the combination that yielded optimal performance.
- SVM: For all kernels (Linear, Polynomial, RBF), we empirically optimized:
- Regularization parameter (C) from 0.1 to 100
- For Linear kernel: We additionally tested different tolerance values
- For Polynomial kernel: We tested degrees from 2 to 5
- For RBF kernel: We tuned the gamma parameter from 0.001 to 1
- Random Forest: We empirically optimized the number of trees (100-500), maximum depth (5-20), minimum samples split (2-10), and minimum samples leaf (1-5).
2.5.3. Statistical significance testing
2.5.4. Evaluation metrics
- Accuracy: Measures the overall correctness of the model in predicting CAD.
- Precision: Evaluates the proportion of true positive predictions among all positive predictions.
- Recall (Sensitivity): Measures the proportion of actual CAD cases correctly identified by the model.
- F1-Score: Provides a balance between precision and recall, especially useful in handling class imbalance.
- Area Under the Receiver Operating Characteristic Curve (AUC-ROC): Evaluates the model’s ability to discriminate between positive and negative classes across different threshold settings.
2.6. Baseline
- No Feature Selection: Models were trained using all available features in each dataset to establish performance baselines without any feature reduction.
- Traditional Feature Selection Methods: We implemented and compared several established feature selection techniques:
- Filter Methods: Chi-squared test and information gain
- Wrapper Methods: Recursive Feature Elimination (RFE)
- Embedded Methods: LASSO regularization
2.7. Comparison with clinical risk scores
- Framingham Risk Score (FRS): We implemented the updated FRS, which predicts 10-year risk of cardiovascular events, as a clinical baseline for comparison.
- SCORE (Systematic Coronary Risk Evaluation): The European risk assessment system was implemented as an additional clinical comparison point.
- ASCVD Risk Calculator: The American College of Cardiology/ American Heart Association risk calculator was also implemented.
2.8. Prediction target definition
- Framingham Dataset: The prediction target is the 10-year risk of developing clinical coronary artery disease (including myocardial infarction, coronary insufficiency, and angina pectoris) as determined by the Framingham Heart Study follow-up protocols.
- Z-Alizadeh Sani Dataset: The prediction target is the current CAD status, defined as the presence of
stenosis in at least one major coronary artery as determined by angiography.
3. Results
3.1. Experimental results on the Framingham dataset
Performance evaluation of machine learning models on the framingham dataset after feature selection using BESO.
| S/N | Algorithm | Accuracy | Precision | Recall | F1-score |
| 1 | KNN (
|
0.81 | 0.83 | 0.81 | 0.81 |
| 2 | Logistic regression | 0.66 | 0.66 | 0.66 | 0.66 |
| 3 | SVM (linear) | 0.66 | 0.66 | 0.66 | 0.66 |
| 4 | SVM (rbf) | 0.73 | 0.73 | 0.73 | 0.73 |
| 5 | SVM (poly) | 0.69 | 0.69 | 0.69 | 0.69 |
| 6 | Random Forest | 0.90 | 0.90 | 0.90 | 0.90 |
Among the models, Random Forest (RF) demonstrated the highest performance, achieving the best results across all evaluation metrics. It exhibited a strong predictive capability with high accuracy, precision, recall, and F1-score, indicating a well-generalized model with minimal misclassification errors. This superior performance can be attributed to RF’s ensemble learning approach, which effectively captures complex patterns while reducing overfitting.
3.2. Experimental results on the
Experimental results from the Z-Alizadeh Sani dataset using BESO features.
| S/N | Algorithm | Accuracy | Precision | Recall | F1-score |
| 1 | KNN (
|
0.87 | 0.88 | 0.88 | 0.87 |
| 2 | Logistic regression | 0.90 | 0.90 | 0.90 | 0.90 |
| 3 | SVM (linear) | 0.89 | 0.89 | 0.89 | 0.88 |
| 4 | SVM (rbf) | 0.89 | 0.89 | 0.89 | 0.89 |
| 5 | SVM (poly) | 0.82 | 0.82 | 0.82 | 0.81 |
| 6 | Random Forest | 0.92 | 0.92 | 0.92 | 0.92 |
3.3. Statistical analysis of model performance
3.4. Impact of feature selection
Comparison of model performance with different feature selection approaches.
| Dataset | Model | No feature selection | RFE | LASSO | BESO |
| Framingham | Random Forest |
|
|
|
|
| Framingham | Logistic regression |
|
|
|
|
| Framingham | SVM (linear) |
|
|
|
|
| Framingham | SVM (RBF) |
|
|
|
|
|
|
Random Forest |
|
|
|
|
| Z-Alizadeh Sani | Logistic regression |
|
|
|
|
| Z-Alizadeh Sani | SVM (linear) |
|
|
|
|
| Z-Alizadeh Sani | SVM (RBF) |
|
|
|
|
3.5. Comparison with clinical risk scores
4. Discussion
Comparison with clinical risk scores.
| Dataset | Method | Accuracy | AUCROC | Sensitivity | Specificity |
| Framingham | Random Forest + BESO |
|
0.94 ± 0.02 |
|
|
| Framingham | Framingham risk score |
|
0.76 ± 0.03 |
|
|
| Framingham | ASCVD risk calculator |
|
0.79 ± 0.03 |
|
|
|
|
Random Forest + BESO |
|
0.95 ± 0.02 |
|
|
| Z-Alizadeh Sani | SCORE |
|
0.79 ± 0.04 |
|
|
classification, ensuring reliable identification of both positive and negative cases. This finding is consistent with work by Hanley [42].
5. Strengths and limitations of the study
5.1. Strengths
5.2. Limitations
methodology to real-world patient data to assess its clinical applicability.
6. Conclusion
settings, assessment of impact on clinical decision-making, and development of user-friendly interfaces that facilitate adoption by healthcare providers. Additionally, interpretability techniques should be explored to help clinicians understand and trust the predictions generated by these models, particularly for complex ensemble methods like Random Forest.
CRediT authorship contribution statement
References
[2] R. Ross, Atherosclerosis—an inflammatory disease, N. Engl. J. Med. 340 (2) (1999) 115-126.
[3] P. Greenland, J.S. Alpert, G.A. Beller, E.J. Benjamin, M.J. Budoff, Z.A. Fayad, et al., Coronary artery calcium score combined with Framingham score for risk prediction in asymptomatic individuals, JAMA 291 (2) (2004) 210-215.
[4] S.D. Fihn, J.M. Gardin, J. Abrams, K. Berra, J.C. Blankenship, A.P. Dallas, et al., 2014 ACC/AHA/AATS/PCNA/SCAI/STS focused update of the guideline for the diagnosis and management of patients with stable ischemic heart disease, Circulation 130 (19) (2014) 1749-1767.
[5] Z. Obermeyer, E.J. Emanuel, Predicting the future-big data, machine learning, and clinical medicine, N. Engl. J. Med. 375 (13) (2016) 1216-1219.
[6] A. Rajkomar, J. Dean, I. Kohane, Machine learning in medicine, N. Engl. J. Med. 380 (14) (2019) 1347-1358.
[7] R. Alizadehsani, M.J. Hosseini, A. Khosravi, F. Khozeimeh, M. Roshanzamir, N. Sarrafzadegan, et al., A data mining approach for diagnosis of coronary artery disease, Comput. Methods Prog. Biomed. 111 (1) (2013) 52-61.
[8] D. Dua, C. Graff, UCI Machine Learning Repository: Heart Disease Dataset, 2019.
[9] I. Guyon, A. Elisseeff, An introduction to variable and feature selection, J. Mach. Learn. Res. 3 (2003) 1157-1182.
[10] G. Chandrashekar, F. Sahin, A survey on feature selection methods, Comput. Electr. Eng. 40 (1) (2014) 16-28.
[11] I.T. Jolliffe, Principal Component Analysis, Springer, New York, 2002.
[12] Y. Saeys, I. Inza, P. Larrañaga, A review of feature selection techniques in bioinformatics, Bioinformatics 23 (19) (2007) 2507-2517.
[13] X.S. Yang, Nature-Inspired Metaheuristic Algorithms, Luniver Press, Beckington, 2010.
[14] H.A. Alsattar, A.A. Zaidan, B.B. Zaidan, Bald eagle search optimization algorithm: a new nature-inspired metaheuristic technique, Soft. Comput. 24 (12) (2020) 8723-8739.
[15] J. Kennedy, R. Eberhart, Particle swarm optimization, in: Proceedings of ICNN’95 International Conference on Neural Networks, IEEE, Perth, WA, Australia, 1995, pp. 1942-1948.
[16] S. Zhang, X. Li, M. Zong, X. Zhu, R. Wang, Efficient kNN classification with different numbers of nearest neighbors, IEEE Trans. Neural Netw. Learn. Syst. 29 (5) (2017 Apr 12) 1774-1785.
[17] R.B. D’Agostino Sr., R.S. Vasan, M.J. Pencina, P.A. Wolf, M. Cobain, J.M. Massaro, W.B. Kannel, General cardiovascular risk profile for use in primary care: the Framingham heart study, Circulation 117 (6) (2008 Feb 12) 743-753.
[18] R. Alizadehsani, M. Roshanzamir, M. Abdar, A. Beykikhoshk, M.H. Zangooei, A. Khosravi, S. Nahavandi, R.S. Tan, U.R. Acharya, Model uncertainty quantification for diagnosis of each main coronary artery stenosis, Soft. Comput. 24 (2020 Jul) 10149-10160.
[19] A.M. Alaa, T. Bolton, E. Di Angelantonio, J.H. Rudd, M. Van der Schaar, Cardiovascular disease risk prediction using automated machine learning: a prospective study of 423,604 UK biobank participants, PLoS One 14 (5) (2019 May 15) e0213653.
[20] L. Breiman, Random forests, Mach. Learn. 45 (1) (2001) 5-32.
[21] T. Hastie, R. Tibshirani, J. Friedman, The Elements of Statistical Learning: Data Mining, Inference, and Prediction, 2nd ed., Springer, New York, 2009.
[22] R. Shouval, O. Hadani, N. Shlomo, et al., Machine learning for prediction of 30-day mortality after ST elevation myocardial infarction, Int. J. Cardiol. 246 (2017) 7-13.
[23] L. Breiman, Bagging predictors, Mach. Learn. 24 (2) (1996) 123-140.
[24] T. Brown, R. Patel, Linear separability in high-dimensional medical data: implications for model performance, IEEE Trans. Biomed. Eng. 66 (3) (2019) 789-798.
[25] R. Alizadehsani, M. Abdar, M. Roshanzamir, et al., Machine learning-based coronary artery disease diagnosis: a comprehensive review, Comput. Biol. Med. 111 (2019) 103346.
[26] J. Smith, K. Lee, Binary elephant swarm optimization for feature selection in medical datasets, J. Mach. Learn. Res. 21 (45) (2020) 1-25.
[27] Y. Zhang, L. Wang, Nature-inspired optimization algorithms for feature selection: a review, IEEE Trans. Syst. Man Cybern. Syst. 49 (12) (2019) 2345-2356.
[28] V.N. Vapnik, The Nature of Statistical Learning Theory, Springer, New York, 1995.
[29] A. Johnson, et al., Machine learning for coronary artery disease prediction: a review, Artif. Intell. Med. 115 (2021) 102056.
[30] V.N. Vapnik, A.Y. Chervonenkis, Support-vector networks, Mach. Learn. 20 (3) (1995) 273-297.
[31] G. Biau, E. Scornet, A random forest guided tour, Test 25 (2) (2016) 197-227.
[32] E. Braunwald, et al., Clinical predictors of coronary artery disease: a review, J. Am. Coll. Cardiol. 74 (10) (2019) 1311-1323.
[33] P.W. Wilson, et al., Prediction of coronary heart disease using risk factor categories, Circulation 97 (18) (1998) 1837-1847.
[34] T.M. Cover, P.E. Hart, Nearest neighbor pattern classification, IEEE Trans. Inf. Theory 13 (1) (1967) 21-27.
[35] R.O. Duda, P.E. Hart, D.G. Stork, Pattern Classification, 2nd ed., Wiley, New York, 2001.
[36] R.O. Duda, P.E. Hart, Use of the Hough transformation to detect lines and curves in pictures, Commun. ACM 15 (1) (1972) 11-15.
[37] T.R. Dawber, G.F. Meadors, F.E. Moore Jr., Epidemiological approaches to heart disease: the Framingham study, Am. J. Public Health Nations Health 41 (3) (1951) 279-281.
[38] R. Alizadehsani, M.H. Zangooei, M.J. Hosseini, et al., Coronary Artery Disease Dataset: Z-Alizadeh Sani Dataset, UCI Machine Learning Repository, 2012.
[39] R. Kohavi, G.H. John, Wrappers for feature subset selection, Artif. Intell. 97 (1-2) (1997) 273-324.
[40] J.A. Hanley, B.J. McNeil, The meaning and use of the area under a receiver operating characteristic (ROC) curve, Radiology 143 (1) (1982) 29-36.
[41] E.J. Topol, High-performance medicine: the convergence of human and artificial intelligence, Nat. Med. 25 (1) (2019) 44-56.
[42] J.A. Hanley, B.J. McNeil, A method of comparing the areas under receiver operating characteristic curves derived from the same cases, Radiology 148 (3) (1983) 839-843.
- Corresponding author at: Department of Allied and Public Health, School of Health, Sport and Bioscience, University of East London, London, United Kingdom.
E-mail address: d.olawade@uel.ac.uk (D.B. Olawade).