تخفيض الجينات بشكل دائم وفعال في الجسم الحي من خلال تحرير الإيبيجينوم بطريقة الضرب والركض Durable and efficient gene silencing in vivo by hit-and-run epigenome editing
الصمت الإبيجيني الدائم باستخدام محررات قابلة للبرمجة مزودة بمثبطات النسخ يحمل وعدًا كبيرًا لعلاج الأمراض البشرية.. ومع ذلك، من أجل فتح إمكانيته العلاجية الكاملة، هناك حاجة إلى تأكيد تجريبي على كبت جيني دائم بعد توصيل المحررين بشكل مؤقت في الجسم الحي. ولهذا الغرض، هنا استهدفناجين يتم التعبير عنه في خلايا الكبد ويشارك في توازن الكوليسترول. أظهرت الفحوصات المخبرية لتصاميم المحررات المختلفة أن بروتينات الأصابع الزنك كانت أفضل منصة لربط الحمض النووي من أجل كتم Pcsk9 في الفئران بشكل فعال. أدى إعطاء جرعة واحدة من جزيئات الدهون النانوية المحملة برنا المحررات إلى تقليل مستويات PCSK9 الدائرة تقريبًا إلى النصف لمدة تقارب السنة في الفئران. ومن الجدير بالذكر أن كتم Pcsk9 والعلامات القمعية الوبائية المصاحبة استمرت أيضًا بعد تجديد الكبد القسري، مما يعزز من وراثة الحالة الوبائية الجديدة المثبتة. أدت التحسينات في تصميم التركيب إلى تطوير تكوين شامل نسميه المثبط النسخي المهندَس المتطور (EvoETR). يتميز هذا التصميم بملف خاصية عالية، مما أدى إلى تقليل مستويات PCSK9 الدائرة في الفئران بكفاءة مقارنة بتلك التي تم الحصول عليها من خلال تحرير الجينات التقليدي، ولكن دون التسبب في كسر الحمض النووي. تضع دراستنا الأساس لتطوير العلاجات الحية المستندة إلى كتم الوبائيات.
يظهر تحرير الإيبيجينوم كاستراتيجية جديدة واعدة لكتم الجينات دون تغيير تسلسل الحمض النووي الأساسي لها.. في هذا السياق، يتم استهداف محررات المصممين التي تحتوي على مجال التأثير (ED) المشتق من مثبطات النسخ الطبيعية إلى موقع جيني محدد مسبقًا بواسطة مجال ربط الحمض النووي القابل للبرمجة (DBD)، مثل Cas9 غير النشط تحفيزيًا (dCas9) عوامل التأثير الشبيهة بالمنشط النسخي (TALEs)أو بروتينات الأصابع الزنك (ZFPs). من بين مختلف عوامل النسخ، تلك التي تنتمي إلى عائلة صناديق كروبيل المرتبطة (KRAB) من مثبطات النسختعتبر مثيرة للاهتمام بشكل خاص من أجل كتم التعبير الجيني (كتم التعبير الجيني). يمكن لمحررات المعتمدة على KRAB أن تحفز موجات قوية من كبت الجينات عبر أنواع خلايا مختلفة سواء في المختبر أو في الكائنات الحية من خلال آلية محفوظة جيدًا لتجنيد إنزيمات تعديل الهيستون، مما يجعلها أدوات جذابة للاختبار السريري.ومع ذلك، فإن علامات الهيستون المرتبطة بـ KRAB في الخلايا الجسدية تكون غير مستقرة ما لم يتم إيداعها باستمرار بواسطة مثبط مرتبط بالكروماتين.لذا، لدعم قمع الجينات المستهدف لفترة طويلة، تحتاج المحررات المعتمدة على KRAB إلى أن يتم التعبير عنها بشكل مستقر في الخلية، وهي مهمة يتم تحقيقها عادةً من خلال توصيل المحررات عبر ناقلات مشتقة من الفيروسات.. يثير هذا النهج مخاوف تتعلق بالسلامة للترجمة السريرية، حيث إن إدخال الناقلات إلى الجينوم المضيف يمكن أن يؤدي إلى الطفرات الجينية.بينما يمكن أن يعزز التعبير المطول عن المحررين نشاطهم غير المستهدف، كما تم إظهاره سابقًالـ CRISPR-Cas9. يمكن حل هذه القضايا من خلال اعتماد تركيبات من EDs التي تعمل بشكل تآزري على مسارات قمعية متعددة في علم الوراثة اللاجينية.. لهذا الغرض، استغللنا سابقًا المفاتيح الرئيسية من مجموعة قمعية تسكت الفيروسات الراجعة الذاتية بشكل دائم طوال التطور والحياة البالغة : KRAB، المجال الحفاز للميثيل ترانسفيراز الحمض النووي من النوع A (cdDNMT3A) وملحقه غير النشط DNMT3-like (DNMT3L). كانت عملية التسليم المؤقت لمجموعة المحررين المقابلة، التي تُسمى مثبطات النسخ المهندسة (ETRs)، مرتبطة بكفاءة واستدامة وخصوصية في إيقاف التعبير عن الجينات الذاتية في خطوط الخلايا وفي خلايا T البشرية الأولية.. تعمل الإبّي-صمت على منطقة المحفز-المعزز للجين المستهدف بواسطة ETR من خلال الإزالة والترسيب المتزامن للعلامات الهيستونية النشطة والكابحة، على التوالي. كما يصاحب ذلك زيادة محلية في مستويات الميثيلين DNA عند ثنائيات النوكليوتيد CpG، وهي علامة إبجينية كابحة يمكن وراثتها خلال انقسام الخلايا بواسطة نشاط الميثيل ترانسفيراز الداخلي DNMT1. هذه العملية الأخيرة هي أساس ديمومة الإبّي-صمت، مما يجعل تعبير ETR ضروريًا في المراحل الأولية من كبت الجين ثم غير ضروري لاستمراريته على المدى الطويل. وقد أكدت الدراسات هذه النتائج باستخدام محررات شاملة تحتوي، في جزيء واحد، على EDs المذكورة أعلاه وDBD.علاوة على ذلك، تم إظهار أن الغالبية العظمى من الجينات المشفرة للبروتين تستجيب للصمت الإيبي، وهو خطوة رئيسية نحو التطبيق السريري لتقنية الصمت الإيبي.. ومع ذلك، لا يزال غير معروف ما إذا كان التعبير المؤقت عن ETR يمكن أن يثبت كتم الجينات لفترة طويلة في الكائن الحي. هنا تناولنا هذا السؤال من خلال استهداف جين Pcsk9 في الفأر، الذي يتحكم منتجه البروتيني في مستويات الكوليسترول الدائرية من خلال تعزيز تحلل البروتين الدهني منخفض الكثافة.
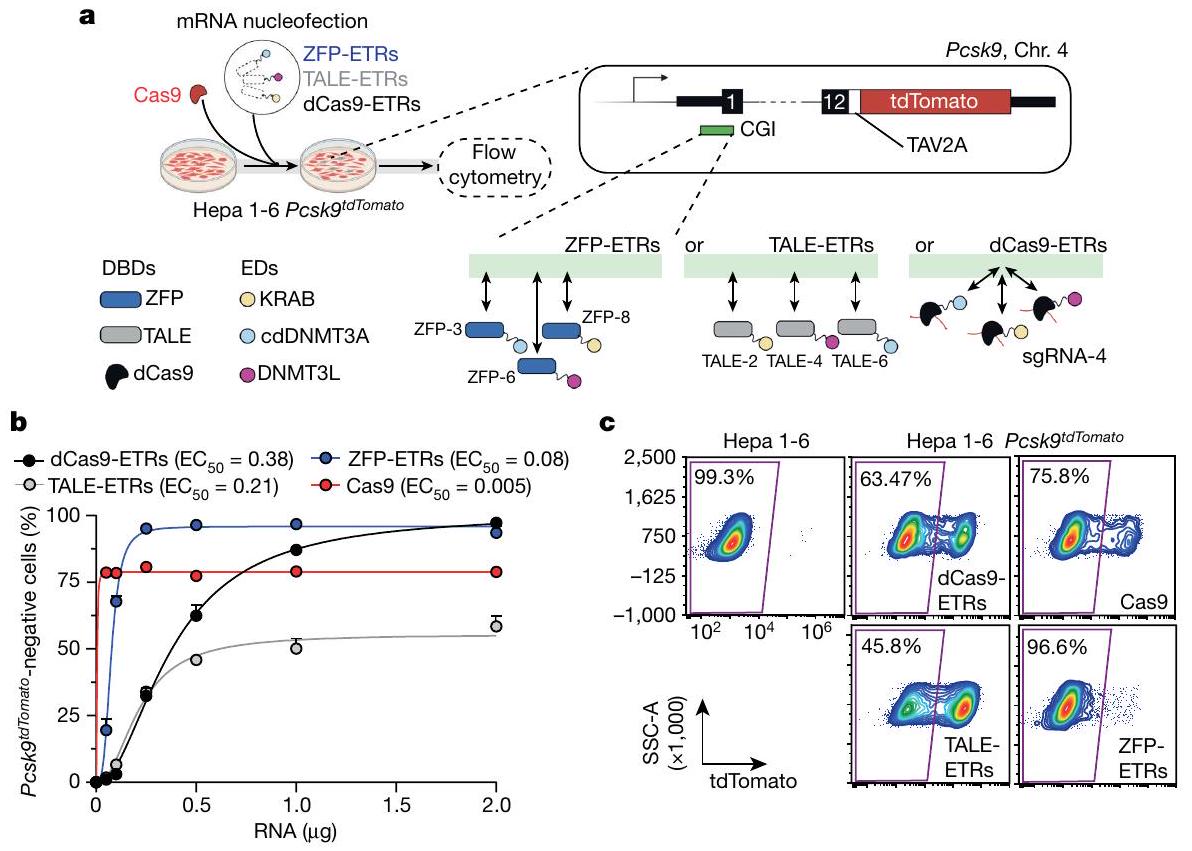
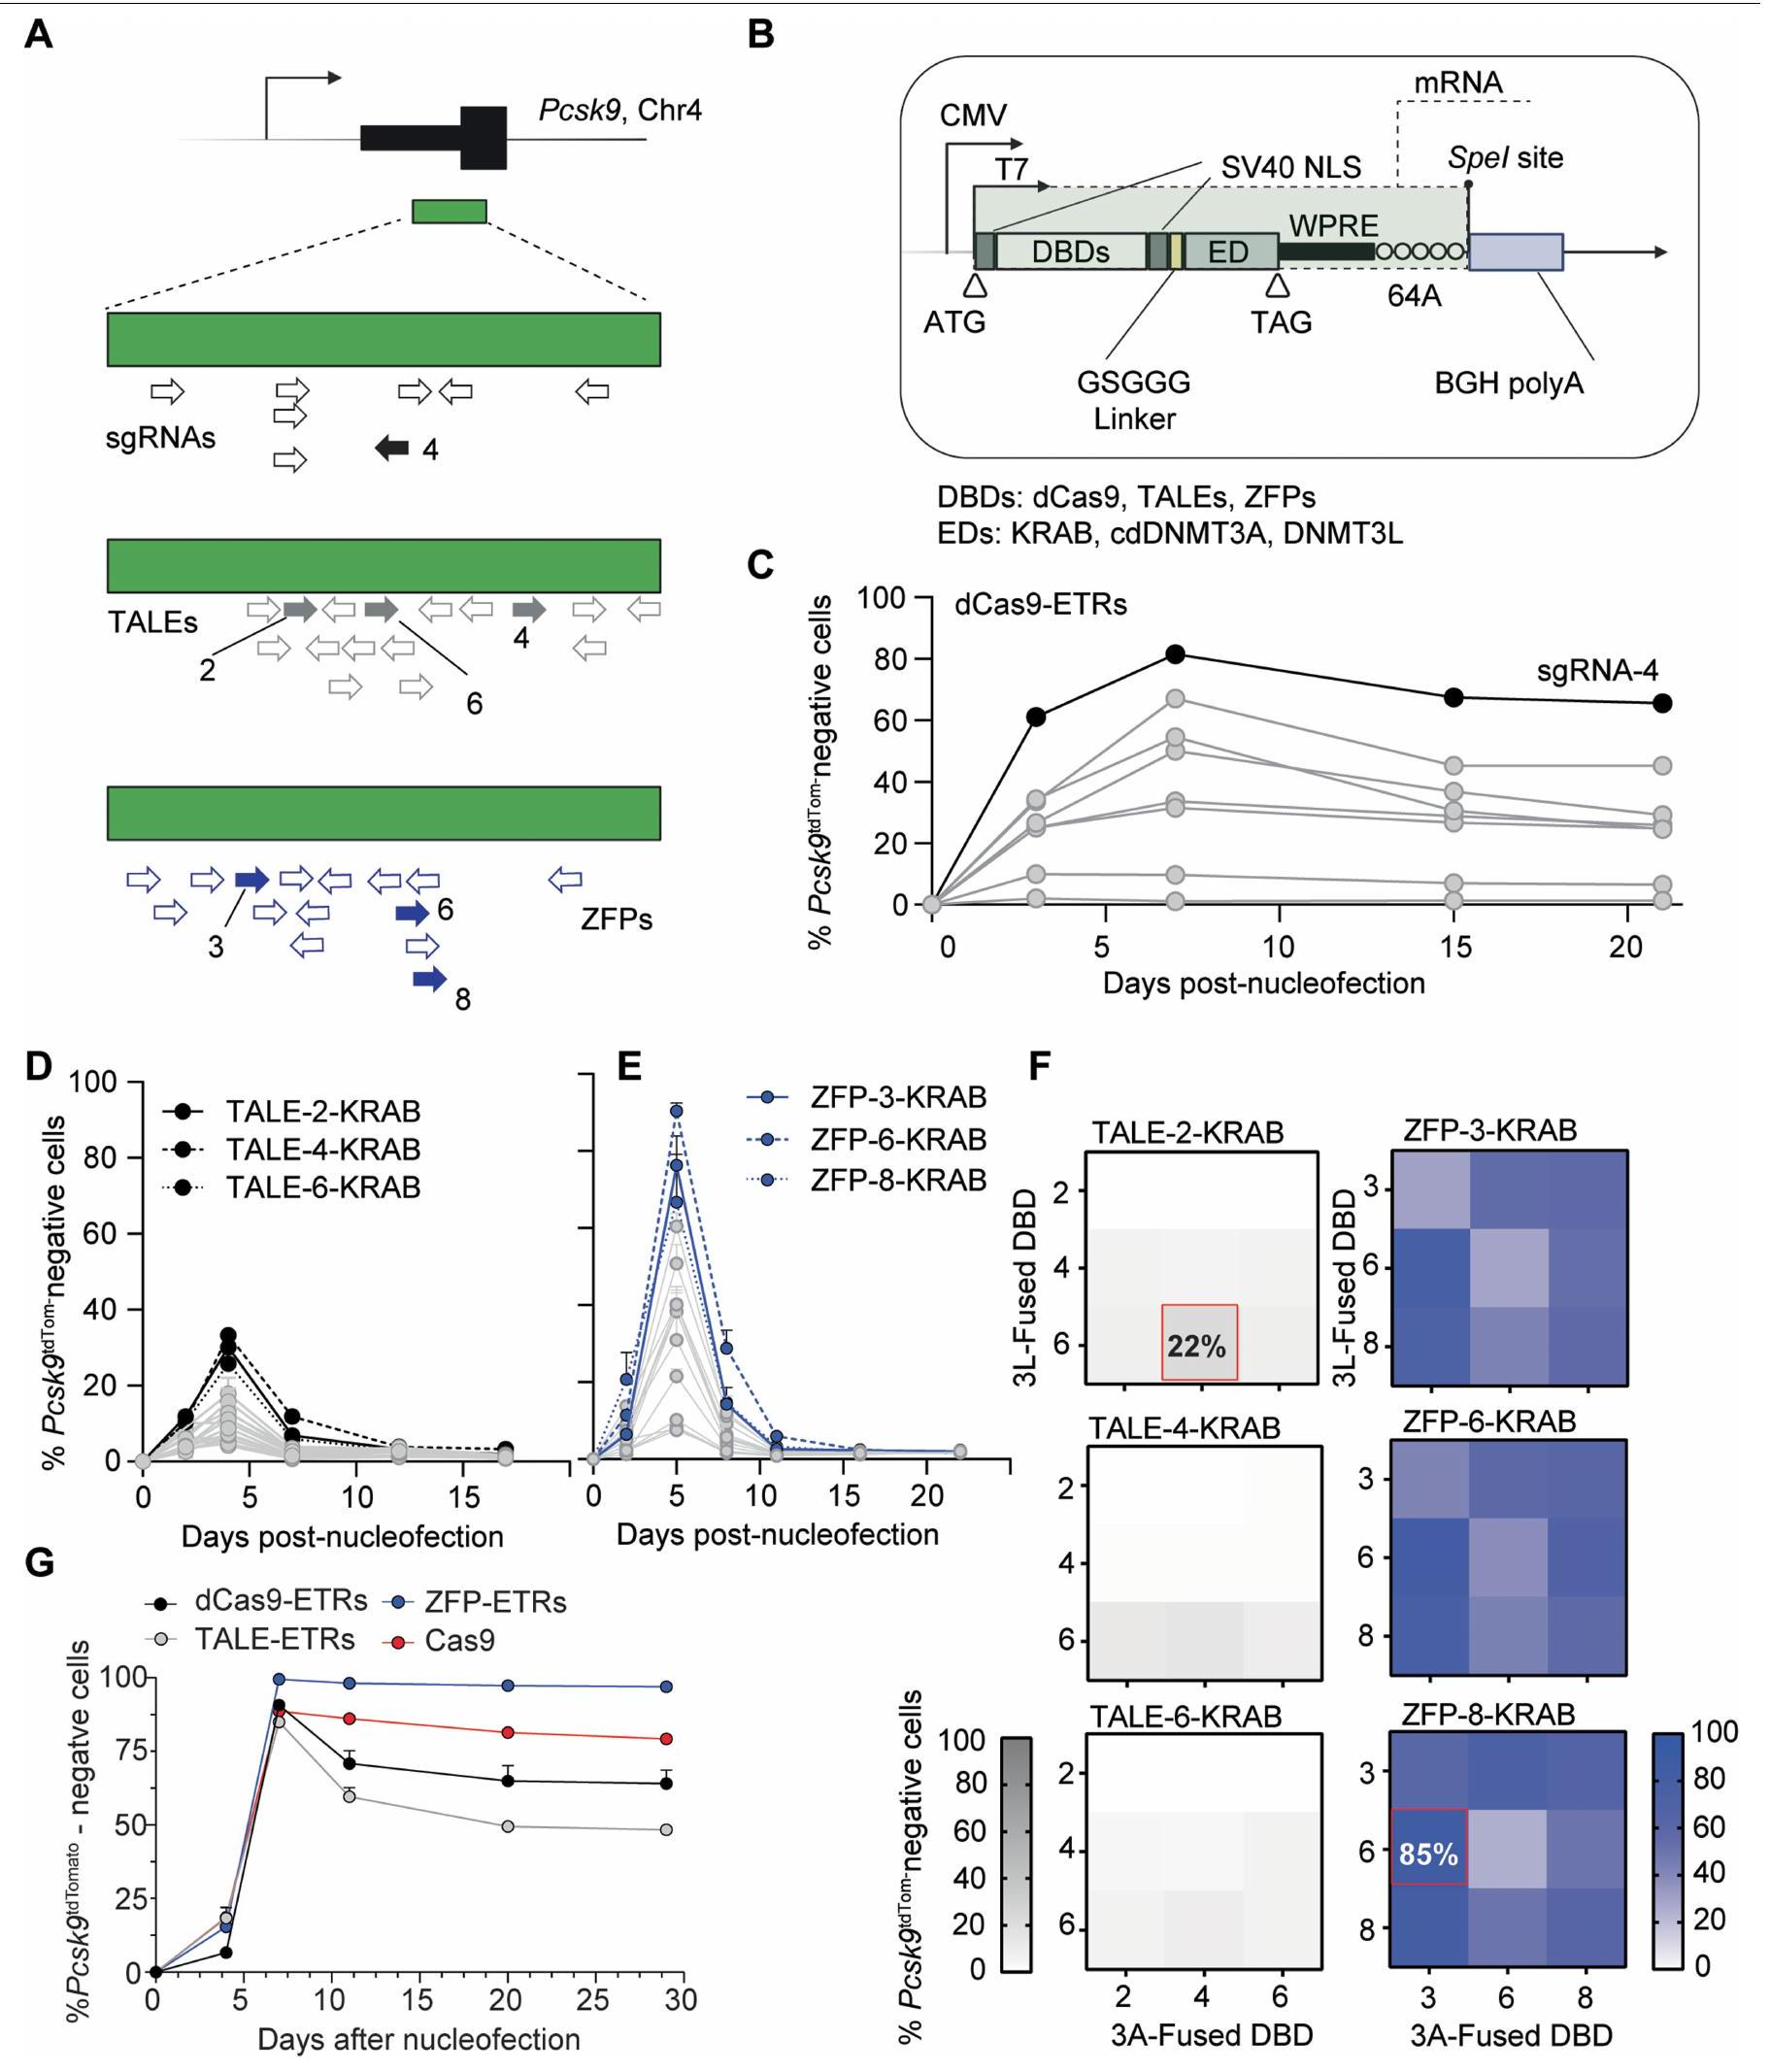
الشكل 1 | فحص في المختبر في Hepa 1-6 Pcskتحدد الخلايا أن ETRs المعتمدة على ZFP هي الأكثر فعالية في الصمت الإيبي لجين PcsK9. أ، أعلى اليسار، مخطط للإجراء التجريبي المستخدم لمقارنة كفاءة منصات ETR المختلفة في خلايا Hepa1-6 Pcsk9.خط الخلايا. تم استخدام نقل mRNA لإدخال ETRs إلى الخلايا. كتحكم في التحرير، تم نقل الخلايا معًا باستخدام mRNA الذي يشفر لـ Cas9 و agRNA المستهدف لل exon الأول من Pcsk9. في أعلى اليمين، تمثيل تخطيطي لـ Hepa 1-6Pcsk9خط الخلية، حيث تم استهداف كاسيت TAV2A-tdTomato في الإطار في الإكسون الأخير من Pcsk9. يشير TAV2A إلى ببتيد ذاتي الانقسام مشتق من فيروس Thosea asigna. في الأسفل على اليمين، مخطط للمنصات المختلفة لـ ETR يظهر ارتباطها النسبي بـ CGI لـ Pcsk9 الذي يشمل منطقة المحفز الخاصة به. تشير الأسهم ذات الرأسين إلى الارتباط الديناميكي لمختلف ETRs بـ
مواقع الأهداف الجينومية. ترتبط ETRs المعتمدة على dCas9 بنفس موقع الهدف، الذي تحدده sgRNA-4. أسفل اليسار، مفتاح للرموز المستخدمة في الرسم البياني في أعلى اليسار. تم إنشاؤه باستخدام BioRender.com. ب، تحليل الرسم النقطي الذي يظهر نسبة Pcsk-الخلايا السلبية في اليوم الثالث عشر بعد إعطاء جرعات تصاعدية من mRNAs التي تشفر لـ dCas9- و TALE- و ZFP- المعتمدة على ETRs، و Cas9. البيانات هي متوسطس.د.تركيز الفعالية نصف الأقصى ) لكل منصة تحرير يتم الإشارة إليها، كما تم حسابه من خلال ملاءمة نموذج لوجستي بأربعة معلمات ( لجميع العلاجات). ج، مخططات نقاط تدفق تمثيلية لخلية هيبا 1-6 وخلية هيبا 1-6 Pcskالخلايا، حيث تم تحليل الأخيرة في اليوم 29 بعد نقل RNA للنماذج المحددة. البيانات مأخوذة من الشكل الممتد 1g. SSC-A، منطقة التشتت الجانبي. مستقبل (LDL) على الغشاء البلازمي للخلايا الكبدية في الكبد. لهذا السبب، فإن تعطيل الـالجين ومنتجه قيد التحقيق المكثف لعلاج فرط كوليسترول الدم الوراثي والمكتسب.
الاختيار في المختبر لمستقبلات Pcsk9
لاختيار هياكل ETR بسرعة ضد Pcsk9، قمنا بتطوير خط خلايا كبد الفأر المهندسة الذي يُظهر النشاط النسخي لهذا الجين على مستوى الخلية الواحدة (المشار إليه فيما بعد بـ Hepa 1-6Pcsk).الخلايا؛ الشكل 1أ). باستخدام هذا الخط، اختبرنا بشكل منفصل وسمينا أكثر تركيبة ETR ثلاثية فعالية لكل من منصات DBD القابلة للبرمجة التالية التي تستهدف جزيرة CpG (CGI) التي تشمل منطقة المحفز لجين Pcsk9: dCas9، TALEs و ZFPs (الشكل 1أ والبيانات الموسعة الشكل 1أ، ب). على وجه التحديد، بالنسبة لتركيبات ETR المعتمدة على dCas9، قمنا بنقل ثمانية RNA دليل فردي (sgRNAs) معًا مع تركيبة ETR ثلاثية تم وصفها سابقًا.في Hepa1-6Pcsk9الخلايا والمحدد“، الذي يحفز أعلى مستويات كبت Pcsk9 (الشكل البياني الممتد 1a، c). بالنسبة لمستقبلات ETR المعتمدة على TALE، اتبعنا نهجًا متسلسلًا. أولاً، قمنا بدمج مجال KRAB مع 16 TALE وحددنا أفضل 3 أداءً من خلال قياس تثبيط Pcsk9 في ذروة نشاط KRAB المؤقت (الشكل البياني الممتد 1a، d). ثم قمنا ببناء ETRs تحتوي على KRAB، cdDNMT3A أو DNMT3L لكل من المصفوفات المختارة وقدمنا جميع التباديل الممكنة لهذه ETRs كتركيبات ثلاثية في Hepa1-6Pcsk9.الخلايا. باستخدام كفاءة كبح Pcsk9 كقراءة، اخترنا أخيرًا TALE-2 وTALE-4 وTALE-6 المدمجة مع KRAB وcdDNMT3A وDNMT3L، على التوالي (الشكل البياني الممتد 1f). تم استخدام استراتيجية اختيار مماثلة لـ ETRs المعتمدة على ZFP. مما أدى إلى دمج ZFP-3 و ZFP-6 و ZFP-8 مع cdDNMT3A و DNMT3L و KRAB، على التوالي (الشكل 1a,e,f من البيانات الموسعة). بناءً على هذه البيانات، أجرينا تجربة استجابة للجرعة في Hepa 1-6Pcskتم إدخال خلايا عن طريق نقل RNAs لمجموعات ETR الثلاثية المختارة المستندة إلى dCas9 و TALE و ZFP (الشكل 1b). كشفت هذه الدراسات عن اختلافات ملحوظة في الديناميكا الدوائية بين المنصات الثلاثة لـ ETR. على وجه التحديد، كانت ETRs المستندة إلى ZFP أكثر فعالية بمقدار 5.7 مرة و 2.8 مرة مقارنة بالهياكل المستندة إلى dCas9 و TALE، على التوالي، في كتم Pcsk9 (الشكل 1b). ومع ذلك، من حيث الفعالية القصوى، تفوقت كل من ETRs المستندة إلى ZFP و dCas9 على الهياكل المستندة إلى TALE، حيث وصلت إلى ما لا يقل عن 80% من كتم Pcsk9 (الشكل 1b). كانت هذه القيم الأخيرة قابلة للمقارنة مع – إن لم تكن أعلى من – تلك التي لوحظت بعد التفعيل الجيني لـ Pcsk9 باستخدام كميات متطابقة من RNA المشفر لـ CRISPR-Cas9 النشط تحفيزياً. أثبتت تعطيل الجين وكتم Pcsk9 أنهما مستقران حتى اليوم 28، وهو آخر نقطة زمنية تم تحليلها (الشكل 1c والشكل الممتد 1g). بناءً على هذه النتائج، اخترنا ETRs المستندة إلى ZFP المذكورة أعلاه لدراساتنا اللاحقة.
ملف الخصوصية لـETRs
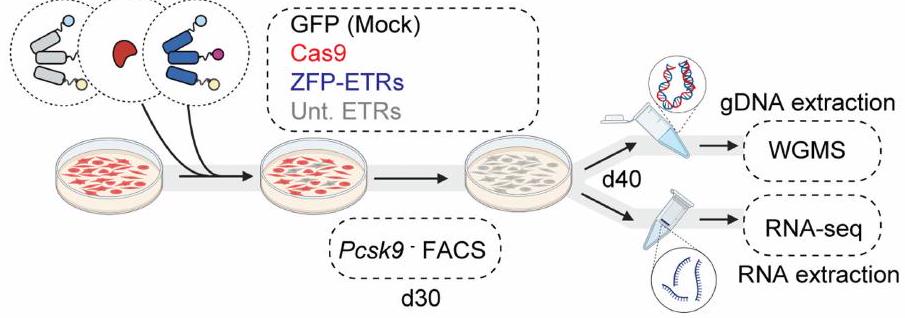
ثم قمنا بتقييم ملف الخصوصية لمستقبلات ZFP-ETRs من خلال تحليلات النسخ الجيني وميثيل الحمض النووي لعلاج ETR لخلايا Hepa 1-6 Pcsk.الخلايا باستخدام تسلسل RNA (RNA-seq) وتسلسل الميثيلوم الكامل للجينوم (WGMS) (الشكل 2a من البيانات الموسعة)، على التوالي. تم استخدام خلايا تم نقلها برسائل RNA تشفر لـ eGFP (المشار إليها فيما بعد بالتحكم) أو لـ CRISPR-Cas9 المستهدف لـ Pcsk9 للتحكم في التأثيرات المتعلقة بالعلاج و/أوتفعيل. بالإضافة إلى ذلك، تم نقل الخلايا باستخدام مجموعة ثلاثية من ETR مزودة بمصفوفة ZFP
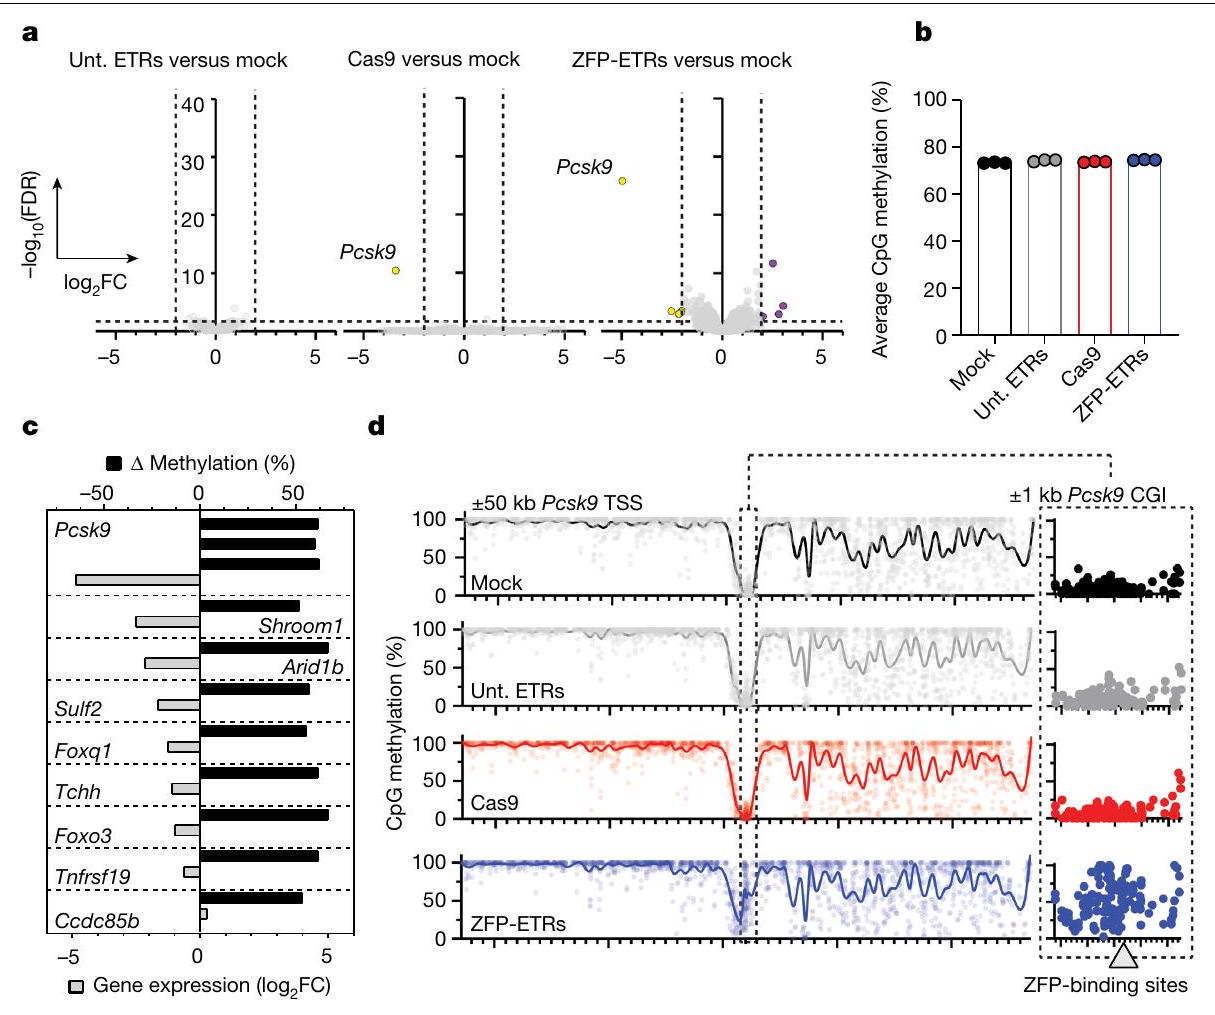
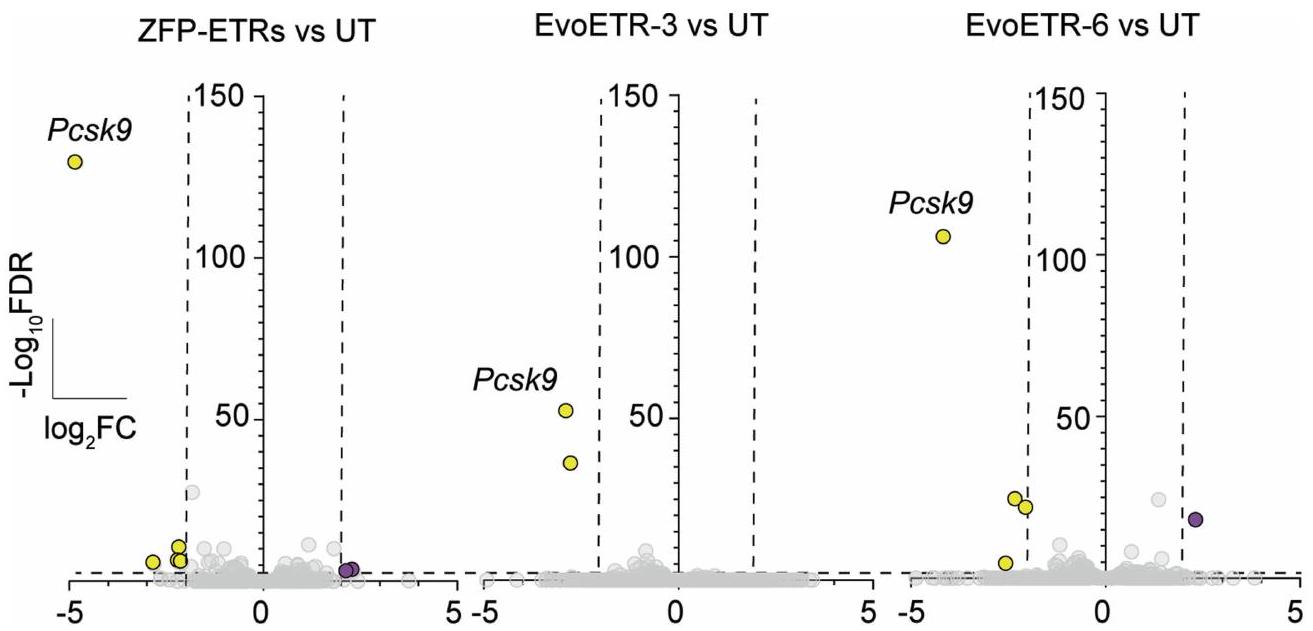
الشكل 2 | تقليل النسخ المستهدف بشكل خاص مع اضطرابات ضئيلة خارج الهدف بعد إيقاف Pcsk9 بواسطة ETRs المعتمدة على ZFP. أ، مخططات البركان من تحليلات RNA-seq تظهر التعبير الجيني المختلف بين الخلايا المعالجة بشكل وهمي والخلايا المعالجة بـ ETRs غير المستهدفة (ETRs غير المستهدفة؛ اليسار)، Cas9 (الوسط) أو ZFP-ETRs (اليمين) (لكل حالة تجريبية). تم تطبيق اختبار والد للتوزيعات الثنائية لتحليل التعبير الجيني التفاضلي وتم تصحيح القيم لاختبارات متعددة باستخدام نهج بنجاميني-هوشبرغ. الخط الأفقي المتقطع يشير إلى العتبة على القيم المعدلة.قيمة (FDR )، والخطوط العمودية المتقطعة تتوافق مع العتبة على الجينات التي تم تنظيمها لأعلى باللون الأرجواني والجينات التي تم تنظيمها لأسفل باللون الأصفر. الجينات باللون الرمادي ليست معبرة بشكل مختلف وفقًا للعتبات المطبقة. ب، رسم بياني عمودي يظهر مستويات الميثيل في CpG على مستوى الجينوم للعينات المحددة كما تم حسابها من
تحليلات WGMS (لكل حالة تجريبية). ج، رسم بياني عمودي يوضح العلاقة بين الميثلة التفاضلية وتغير التعبير الجيني لمقارنة ZFP-ETRs مقابل الشاهد. كانت مناطق الميثلة التفاضلية مرتبطة بجين معين عندما تقع فينافذة حول نظام TSS الخاص بها. تم رسم الجينات التي لهاويمكن حساب FDR من تحليل التعبير التفاضلي. تشير القضبان السوداء إلى التباين في نسبة ميثلة CpG للـ DMRs المحددة. د، اليسار، رسم مانهاتن من WGMS في ب يظهر ملفات ميثلة CpG للعينات المحددة في أ.منطقة جينومية مركزة على نقطة بدء النسخ (TSS) لجين Pcks9. تشير النقاط الفردية إلى متوسط الميثيلation لكل CpG. تم تعريف الخطوط المتصلة كمنحنى انسيابي مع 100 عقدة. على اليمين، عرض مكبر لـالمنطقة المتمركزة حول Pcsk9CGI. المنطقة الجينومية التي تحتوي على مواقع ارتباط ZFP (3 و6 و8) موضحة في الرسم البياني كمستطيل رمادي. استهداف تسلسل eGFP (المشار إليه فيما بعد بـ ETRs غير المستهدفة). عند مقارنتها بالخلايا المعالجة بشكل وهمي، لم يكن هناك أي جينات معبر عنها بشكل مختلف في الخلايا التي تم علاجها بـ ETRs غير المستهدفة، في حين أظهرت كل من الخلايا المثبطة إبيجينيتكياً والخلايا المعطلة لـ Pcsk9 انخفاضاً كبيراً (حوالي 30 ضعفاً) في مستويات التعبير عن Pcsk9 (الشكل 2أ والشكل التمديدي 2ب). على النقيض من خلايا Pcsk9 المعطلة، التي لم يكن هناك أي جين آخر معبر عنه بشكل مختلف، أدى العلاج بـ ZFP-ETRs إلى عدم تنظيم ثمانية جينات إضافية (أربعة منها تم تثبيطها وأربعة تم تنشيطها؛ الجدول التكميلي 1)، على الرغم من أنها كانت بمقدار أقل من Pcsk9. لم يكن أي من هذه الجينات قريباً من Pcsk9، ولم يظهر أي من الجينات الأربعين المجاورة لـ Pcsk9 عدم تنظيم ترنسكريبتوني كبير (الشكل التمديدي 2ج)، مما يشير إلى أن التثبيط الإبيجينيتكي لم ينتشر إلى الجينات القريبة. بما يتماشى مع بيانات الترنسكريبتوم، كانت مستويات ميثيل CpG على مستوى الجينوم متشابهة إلى حد كبير بين العينات، مع دلتا ميثيل أقل منبين خلايا ETR- والخلايا المعالجة بالوهم (الشكل 2b والشكل الإضافي 2d). هذه القيم قابلة للمقارنة مع تلك التي تم الإبلاغ عنها سابقًا لمنصات الإيبي-سيلينغ المماثلة.. من حيث المناطق الميثيلية المختلفة (DMRs؛ دلتا ميثيلايشن )، ما وراء ، والتي احتوت على 3 منها، تم العثور على 18 DMR أخرى في خلايا ETR مقارنة بالخلايا المعالجة بالعلاج الوهمي (الجدول التكميلي 2). أظهر تقاطع التحليلات النسخية وتحليلات الميثيل DNA أن ثمانية من بين تسعة جينات مرتبطة بـ DMR كانت أيضًا منخفضة التعبير (الشكل 2c و
الجدول التكميلي 2)، مع Pcsk9 و Shroom1 و Arid1b تحت قيم العتبة المختارة (-تغير الطي المحولمعدل الاكتشافات الخاطئةتحليل الموقع المحتوي على Pcsk9مركّز على موقع بدء النسخ (TSS) للجين) على مستوى دقة أحادية CpG أكد الإيداع الجديد لمثيلة الحمض النووي حصريًا حول موقع هدف ETR (الشكل 2d والشكل الممتد 2h). لفهم ما إذا كانت الاضطرابات الملحوظة ناتجة عن استهداف غير دقيق لـ EDs، قمنا بإجراء تسلسل RNA و WGMS لـ Hepa 1-6 Pcskالخلايا المعالجة بمزيج ETR القائم على dCas9 المستهدف لـ Pcsk9. بالمقارنة مع Pcsk9، الذي تم تقليله بشكل كبير وتمت ميثلة تسلسلاته التنظيمية في الخلايا المعالجة بـ dCas9-ETR، لم يتم deregulate أي جينات أخرى بشكل ملحوظ ولم يتم الكشف عن DMRs (الشكل 2a، b، d والشكل الممتد 2e-h)، وهو ما يتماشى مع البيانات التي تم الحصول عليها من ETRs غير المستهدفة (الشكل 2a، b، d). بشكل عام، تظهر هذه البيانات أن العلاج بـ ETRs القائمة على ZFP يفرض اضطرابات محدودة خارج جين Pcsk9، وأن هذه التغيرات من المحتمل أن تكون ناتجة عن ارتباط غير متطابق لمصفوفات ZFP في مواقع محتملة غير مستهدفة.
تخفيض مستدام لـفي الجسم الحي
بالتوازي مع هذه الدراسات، بدأنا في توصيل ZFP-ETRs إلى كبد الفئران. حيث تتطلب تقنية ETR استخدام
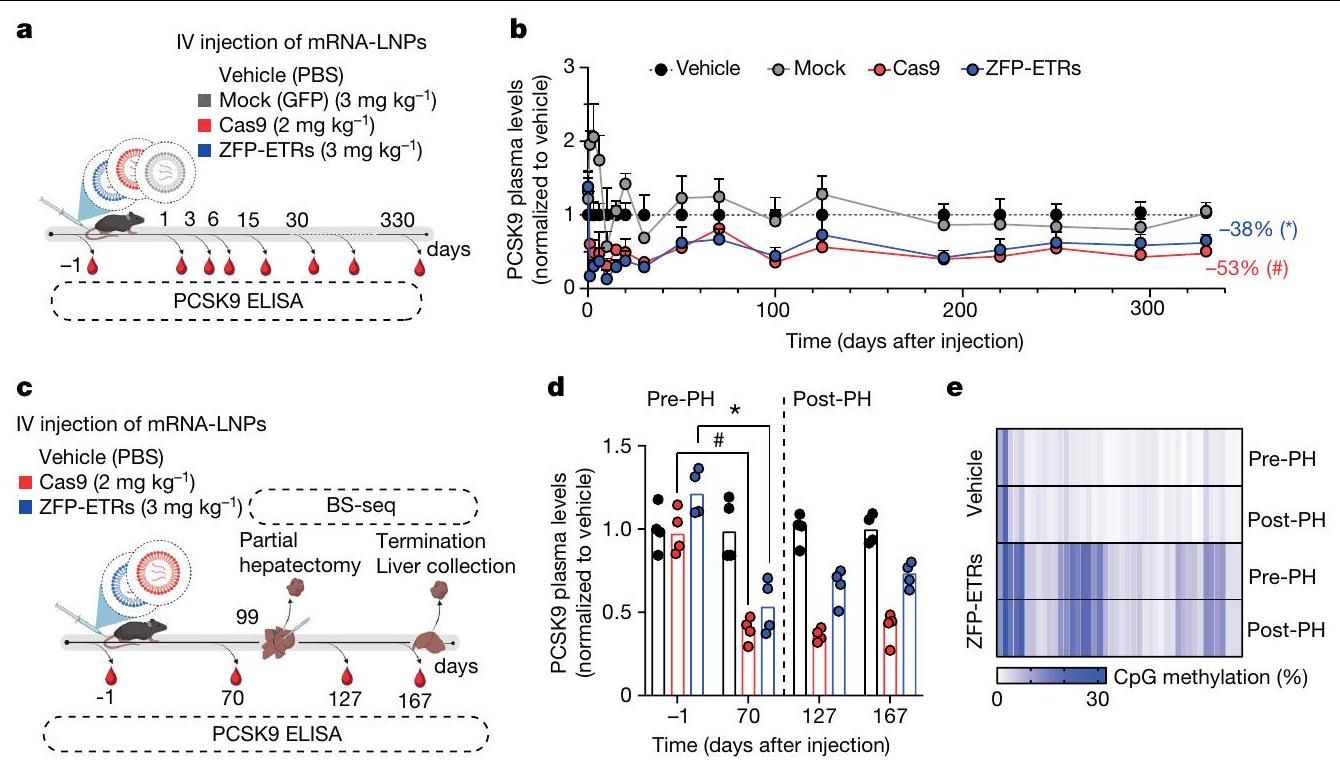
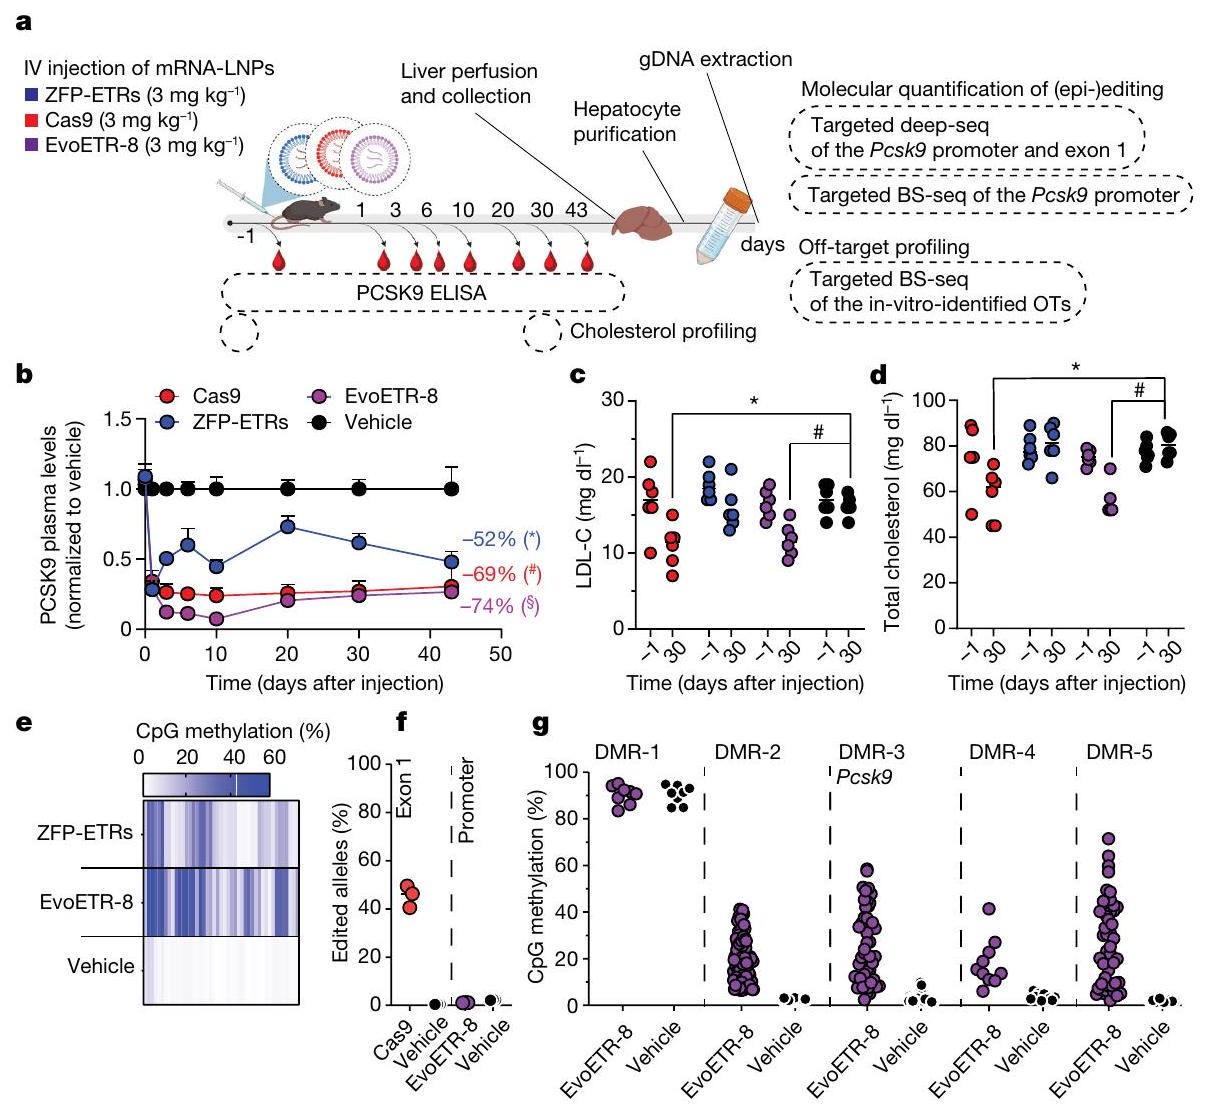
الشكل 3 | كتم دائم للإيبيجينيتك لجين Pcsk9 في كبد الفئران بعد توصيل ZFP-ETRs بواسطة LNP. أ، رسم توضيحي للإجراء التجريبي الذي تم استخدامه لتقييم فعالية واستدامة تحرير Pcsk9 في الجسم الحي. تم تحميل LNP D بـ mRNAs لـ ZFP-ETRs وCas9 أو eGFP وتم حقنه عن طريق الوريد (IV). قبل وبعد حقن LNP، تم جمع عينات الدم لقياس مستويات PCSK9 بواسطة ELISA. يتم الإشارة إلى جرعات LNP بالملليجرامات لكل كيلوغرام. المركبة، فئران تم علاجها بـ PBS. تم إنشاؤه باستخدام BioRender.com. ب، تحليل زمني لمستويات PCSK9 الدائرة لمدة تصل إلى 330 يومًا بعد حقن LNP. البيانات هي متوسط س.د. ( للفئران المعالجة بـ ZFP-ETR، 3 للفئران المعالجة بـ Cas9، 5 للفئران المعالجة بالتحكم و4 للفئران التي تم حقنها بالمركب. تم إجراء التحليل الإحصائي بواسطة تحليل التباين المتكرر ذو الاتجاهين (RM ANOVA) واختبار المقارنات المتعددة لدونيت بين المركب والحالات العلاجية الأخرى في أحدث نقطة زمنية للتحليل. و ). إذا لم يُذكر، فإن الفروقات لم تكن ذات دلالة إحصائية. ج، رسم التجربة
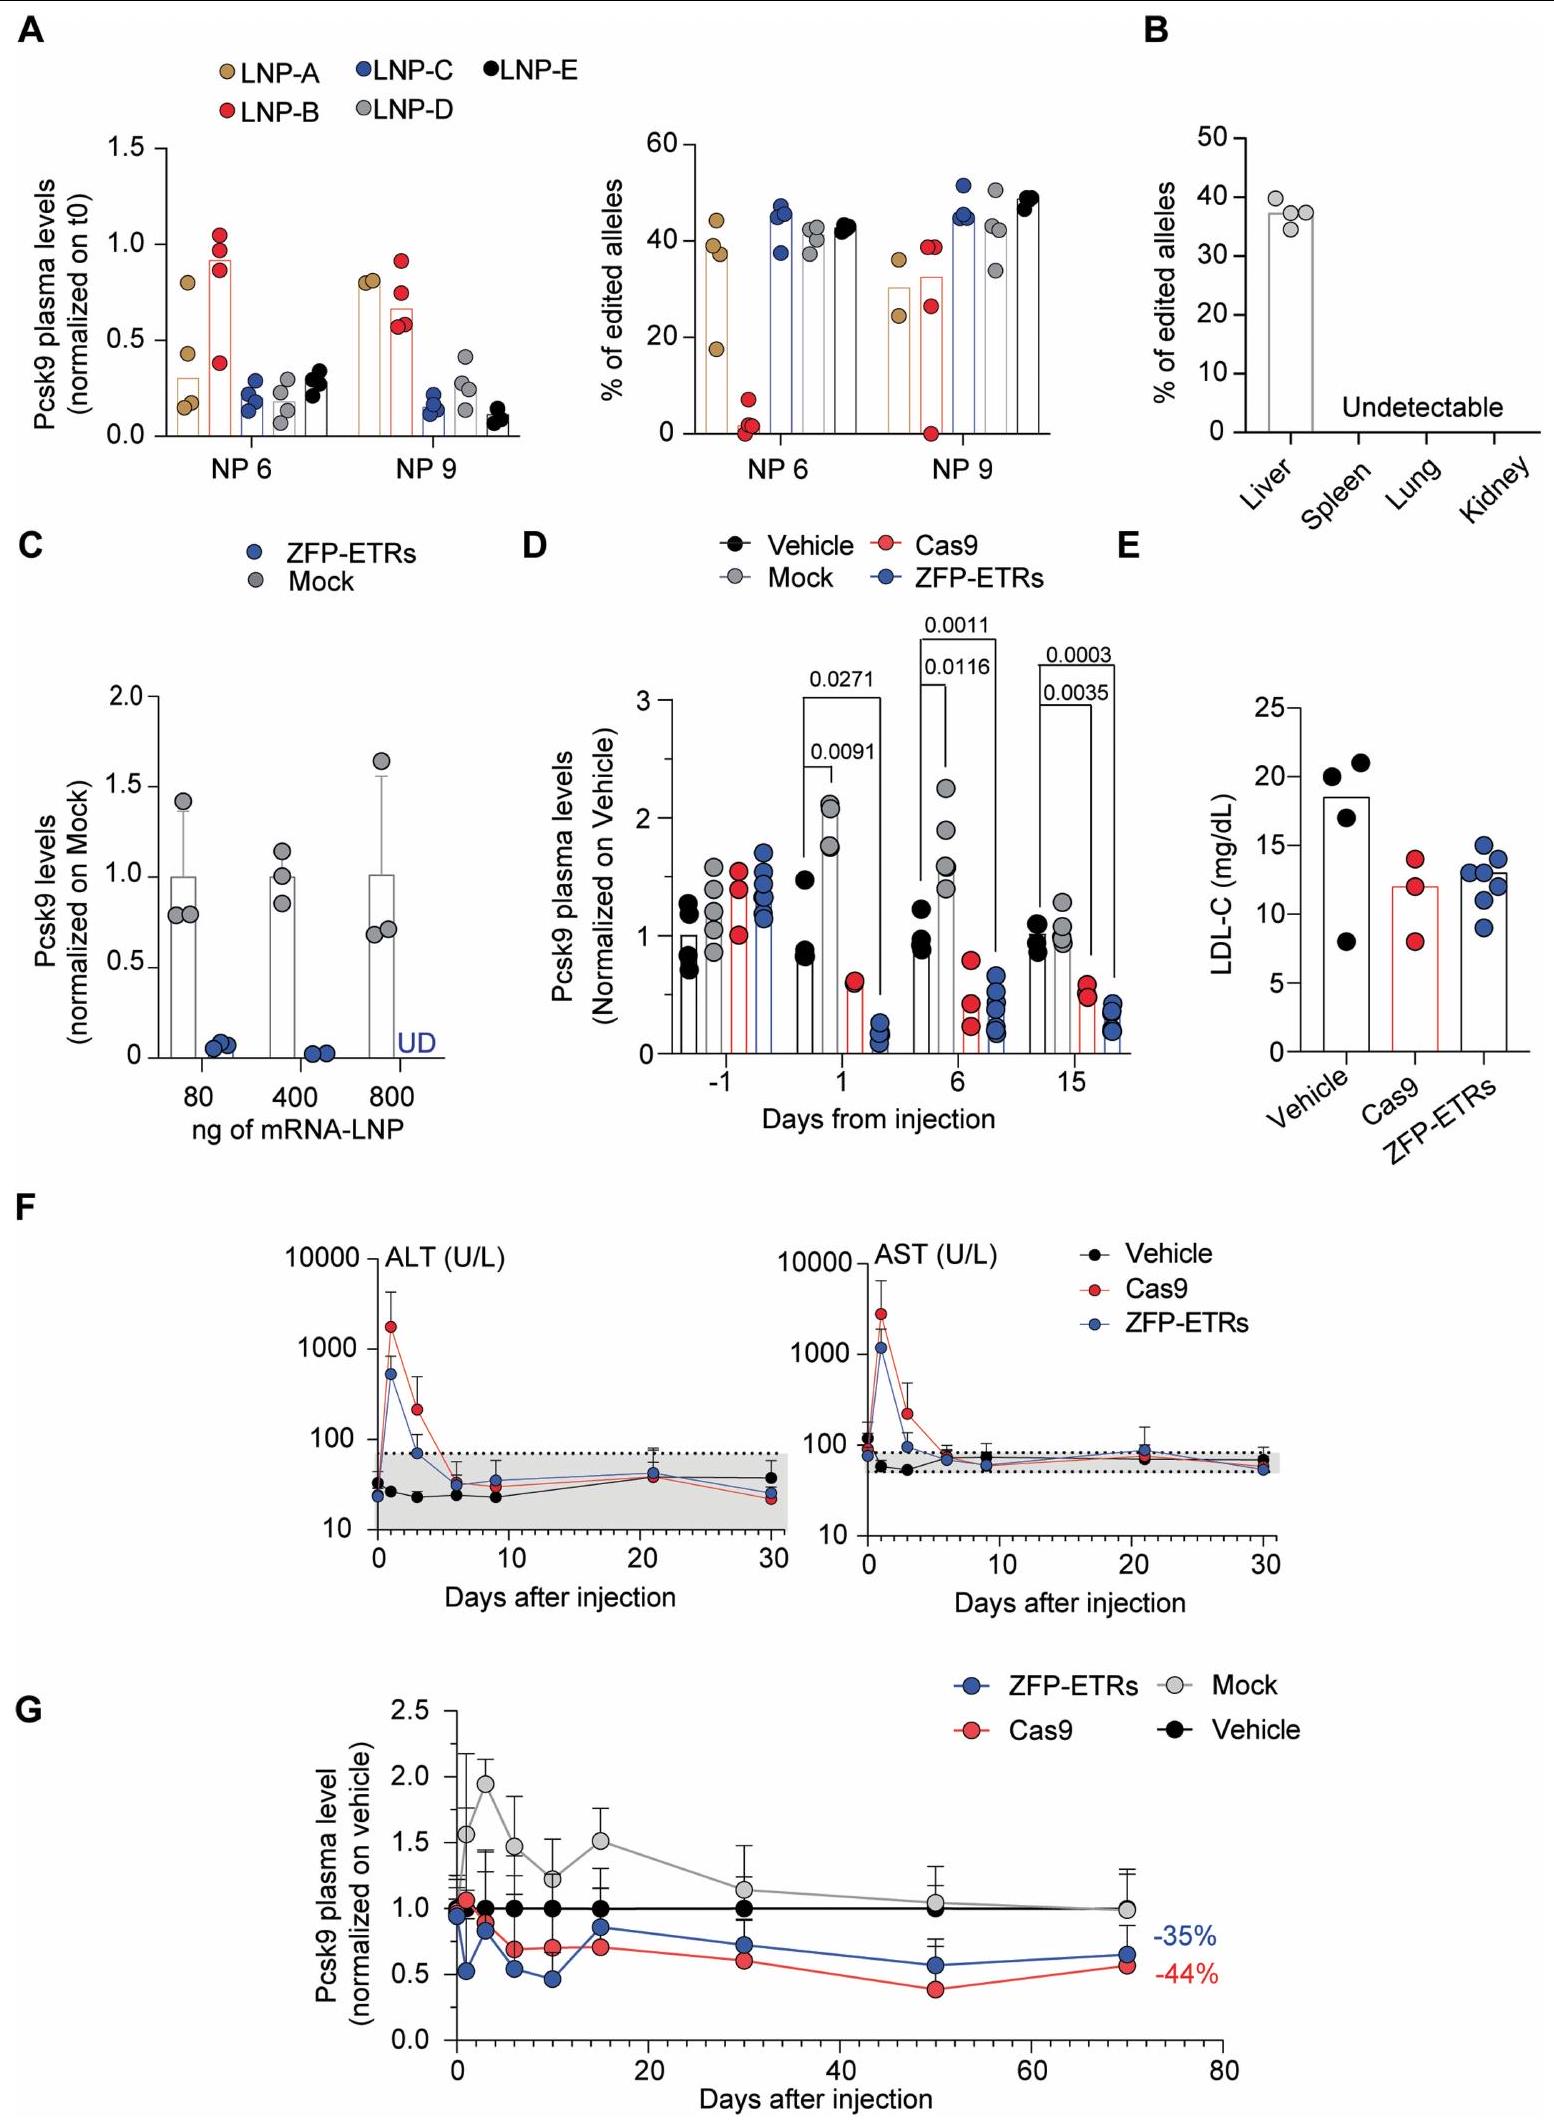
الإجراء الذي تم استخدامه لتقييم متانة التحرير بعد استئصال الكبد الجزئي. تسلسل البيسلفيت المستهدف، تسلسل BS.BioRender.com. د، رسم بياني عمودي يوضح مستويات PCSK9 قبل وبعد استئصال الكبد الجزئي (PH). تم تطبيع بيانات الفئران الفردية إلى متوسط الفئران المعالجة بالعلاج الوهمي (نقاط)؛ تشير الأعمدة إلى الوسيط (تم إجراء التحليل الإحصائي بواسطة تحليل التباين الثنائي الاتجاه RM ANOVA واختبار المقارنات المتعددة لدونيت بين العينات التي تنتمي إلى نفس المعاملة (وهمية، ZFP-ETRs وCas9) في أوقات مختلفة. و ). إذا لم يُذكر، فإن الفروقات لم تكن ذات دلالة إحصائية. e، خريطة حرارية تُظهر متوسط الميثيلation عند دقة CpG المفرد داخل CGI الخاص بـ Pcsk9 في العينات المعالجة (ZFP-ETRs) وعينات التحكم (المركبة) قبل وبعد استئصال الكبد الجزئي. تشير كثافة اللون إلى نسبة ميثيلation CpG (متوسط لكل مجموعة تجريبية). يمثل كل مستطيل CpG فردي في المنطقة الجينومية Chr. 4:106,463,706-106,464,363. طرق توصيل الجينات، قمنا بإجراء فحص داخل الجسم لتحديد الجسيمات النانوية الدهنية (LNPs)متوافق مع نقل آلية التحرير إلى الكبد. هنا، استخدمنا تعطيل Pcsk9 بواسطة CRISPR-Cas9 كقراءة بديلة لتوصيل RNAs المحررين بواسطة LNP. ومع ذلك، في مجال تحرير Pcsk9، تمثل CRISPR-Cas9 معيارًا للطرق الناشئة في التحرير. من بين عشرة LNPs تم اختبارها، سبعة منها أدت إلى تقليل قوي في مستويات PCSK9 الدائرة (أكثر من 60%) وتحرير جيني فعال (الشكل 3a من البيانات الموسعة). من بين هؤلاء السبعة، تم اختيار LNP D للدراسات الإضافية، نظرًا لملف توزيعها الحيوي السليم وملف السمية (الشكل 3b من البيانات الموسعة). ثم قمنا بإنتاج mRNAs التي تشفر الثلاثة ZFP-ETRs مع تعديلات متطورة تهدف إلى تعظيم ترجمة RNA واستقراره وتقليل الاستجابات المناعية الفطرية.. تم تعبئة هذه الرنا المرسال في تركيبة LNP المختارة لاختبار أولي في خلايا الكبد الأولية المستزرعة من الفئران، حيث لاحظنا فقدانًا شبه كامل لـ PCSK9 في سوائل الخلايا (الشكل التمديدي 3c). استنادًا إلى هذه النتائج، قمنا بإعطاء LNPs المحملة بـ ETR عن طريق الوريد لفئران C57BL/6 البالغة ورصدنا مستويات PCSK9 المتداولة لمدة تصل إلى 330 يومًا، عندما تم إنهاء التجربة (الشكل 3a). تم استخدام الفئران المعالجة بـ PBS (المركب هنا) أو التي تم حقنها بـ LNPs المحملة برنا mRNA eGFP (المزيف هنا) كضوابط. أظهرت التحليلات المبكرة للفئران المعالجة بـ ETR انخفاضًا سريعًا وعميقًا في PCSK9، والذي استقر بعد ذلك عند حوالي مستويات المركبات المعالجة حتى آخر نقطة زمنية تم تحليلها (الشكل 3d من البيانات الموسعة والشكل 3b). تماشيًا مع هذه البيانات، في اليوم 30 بعد حقن LNP، كانت مستويات الكوليسترول المرتبط بـ LDL (LDL-C) قد انخفضت في الفئران المعالجة بـ ETR (حوالي 35٪؛ الشكل 3e من البيانات الموسعة). تم ملاحظة كفاءات وسرعات مماثلة في تقليل PCSK9 وLDL-C في الفئران التي تم علاجها بـ LNPs المحملة بـ RNAs المستهدفة لـ Pcsk9 باستخدام تقنية CRISPR-Cas9. (الشكل 3ب والشكل الإضافي 3د، هـ). كانت السموم المرتبطة بالعلاج محصورة ذاتيًا، مع زيادات مؤقتة في إنزيمات الكبد الألانين ترانس أميناز (ALT) والأسبارتات ترانس أميناز (AST) بمستويات قابلة للمقارنة بين مجموعات المعالجة باستخدام CRISPR-Cas9 و ZFP-ETR (الشكل الإضافي 3و). نظرًا لأن دراسة سابقة لم تُظهر أي سمية كبدية كبيرة عند استخدام نفس مكونات CRISPR-Cas9 المستهدفة لـ Pcsk9 ولكن محملة في صيغة LNP مختلفة.، استنتجنا أن الزيادة في الإنزيمات التي لاحظناها هنا كانت على الأرجح نتيجة لصيغة LNP المستخدمة في هذه الدراسة. لتأكيد وتوسيع نتائجنا، عالجنا مجموعة ثانية من الفئران باستخدام LNPs المحملة بـ ETR (الشكل 3g من البيانات الموسعة) وبعد ثلاثة أشهر، خضع أربعة منها لعملية استئصال جزئي للكبد (الشكل 3c)، وهي إجراء جراحي يحفز موجات قوية من تكاثر خلايا الكبد لتجديد الفصوص الكبدية المستأصلة.من الجدير بالذكر أنه لم يتم العثور على اختلافات كبيرة في مستويات PCSK9 المتداولة بين الفئران قبل وبعد استئصال الكبد، مما يوفر دعمًا إضافيًا لاستقرار الإسكوتينج الإبي (epi-silencing) حتى بعد تكرار الخلايا النشط (الشكل 3d). تم الحصول على نتائج مماثلة في الفئران التي تم فيها تعطيل Pcsk9 وراثيًا. كما قمنا بمقارنة ملف الميثيلين CpG لمروج جين Pcsk9 في الفئران قبل استئصال الكبد المعالجة بـ ETRs أو المركب الوهمي ووجدنا زيادة صافية في ميثيل الحمض النووي في المجموعة الأولى (الشكل 3e). ظلت هذه المستويات مستقرة أيضًا بعد استئصال الكبد الجزئي (أكثر من شهرين)، مما يعزز من متانة الإسكوتينج الإبي من خلال تجديد الكبد.
تحسين كبت الإيبي بواسطة EvoETRs
أخيرًا، بهدف تقليل التعقيد الجزيئي لمنصة الإيبي-سيلينسنج، التي تتطلب إنتاج ثلاثة mRNAs مستقلة وتوصيلها معًا، قمنا بتحويل الـ
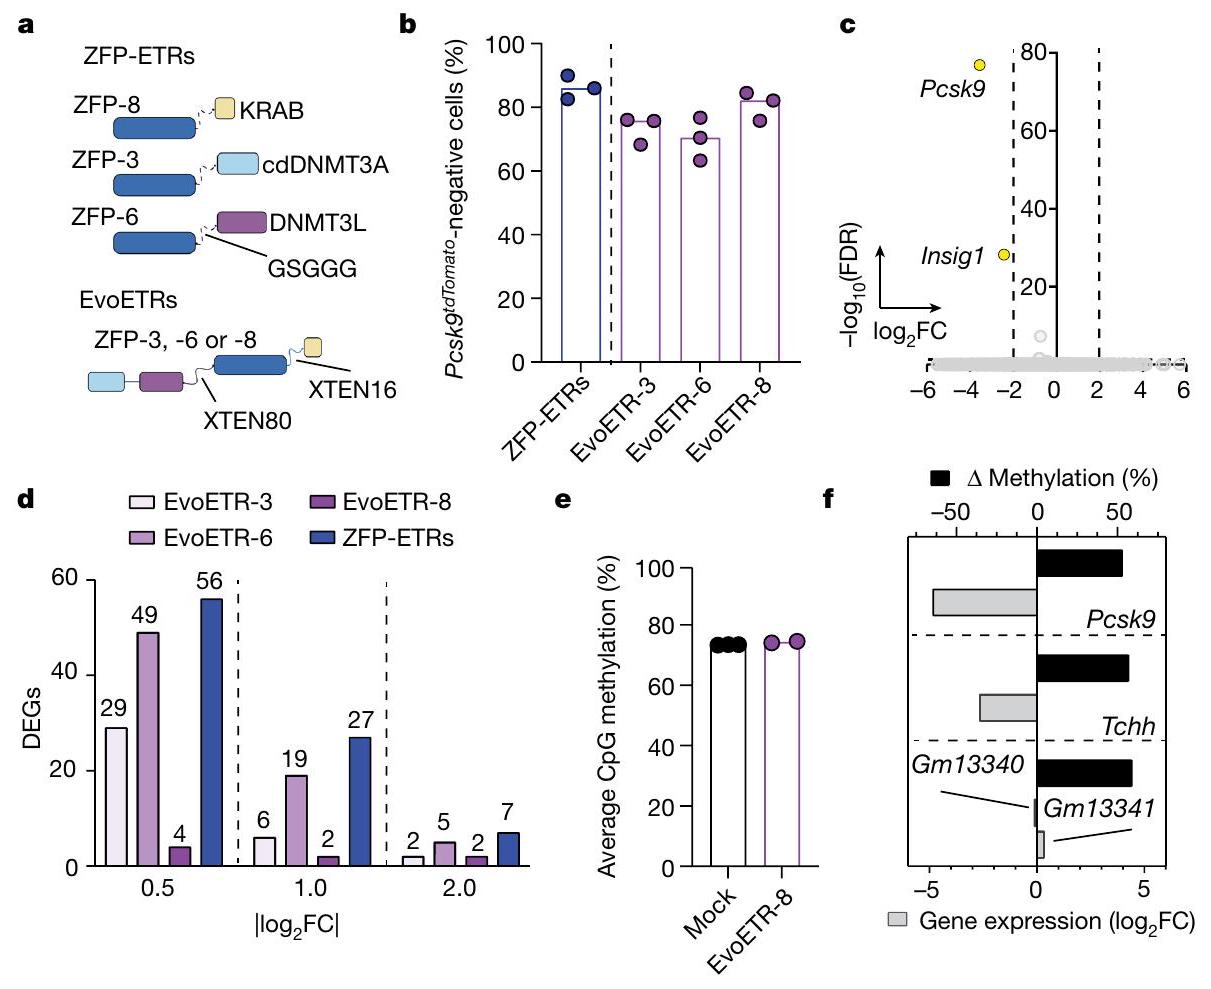
الشكل 4 | فعالية وخصوصية EvoETRs في المختبر. أ، تمثيل تخطيطي للهندسة الجزيئية لـ ZFP-ETRs وEvoETRs. تم إنشاؤه باستخدام BioRender.com. ب، رسم بياني عمودي يوضح نسبة الخلايا التي تم كتم Pcsk9 فيها في اليوم 40 بعد تسليم إما ZFP-ETRs (باللون الأزرق) أو EvoETRs (باللون الأرجواني). تمثل النقاط النسب الفردية؛ وتمثل القضبان الوسيط لكل علاج. ). ج, مخطط البركان من تحليلات RNA-seq يظهر التعبير الجيني المختلف بين الخلايا المعالجة بـ EvoETR-8 والخلايا غير المعالجة ( تم تطبيق اختبار والد للتوزيعات الثنائية لتحليل التعبير الجيني التفاضلي وتم تصحيح القيم لاختبارات متعددة باستخدام نهج بنجاميني-هوشبرغ. تشير الخطوط المتقطعة إلى العتبات على القيم المعدلة.القيم ( ) وتغير الطي ( الجينات المنخفضة التعبير باللون الأصفر. الجينات باللون الرمادي ليست معبرة بشكل مختلف وفقًا لما تم تطبيقه
العتبات.d، رسم بياني عمودي يوضح عدد الجينات المعبر عنها بشكل مختلف (DEGs) من العينات المحددة مقابل الخلايا غير المعالجة. تم إجراء هذه التحليلات في ثلاثة أوقات مختلفةعتبات و فيرسم بياني عمودي يوضح مستويات الميثيلation CpG على مستوى الجينوم للعينات المحددة كما تم حسابها من تحليلات WGMSللمعالجة الوهمية ولخلايا المعالجة بـ EvoETR-8).رسم بياني عمودي يوضح العلاقة بين الميثلة التفاضلية وتغير التعبير الجيني للمقارنة بين EvoETR-8 وmock. كانت مناطق الميثلة المختلفة مرتبطة بجين معين عندما تقع ضمننافذة حول نظام TSS الخاص بها. تم رسم الجينات التي لهايمكن حساب FDR من تحليل التعبير التفاضلي. تشير القضبان السوداء إلى التباين في مستويات الميثيلation المتوسطة لمناطق DMRs. دمج ثلاثي ETR في جزيء شامل (تصميم يُشار إليه بشكل جماعي باسم ETR المتطور؛ EvoETR). لتحقيق ذلك، أضفنا في الطرف N من ZFP DBD ثنائي هجين إلزامي بين cdDNMT3A وDNMT3L، وفي الطرف C، مجال KRAB (الشكل 4a)، وهو تصميم يذكر بالمحررات الجينية الوصفية سابقًا.لتقييم أي من الثلاثة مصفوفات ZFP المستخدمة في تركيبة الثلاثي-ETR (ZFP-3، ZFP-6 أو ZFP-8) كانت الأنسب لتكوين شامل، قمنا ببناء EvoETRs لكل من هذه المصفوفات وقيمنا كفاءتها في الإيبي-إسكات في Hepa 1-6 Pcsk.الخلايا. جميع التركيبات أنتجت مستويات عالية ودائمة منالصمت، الذي كان قابلاً للمقارنة مع تلك التي تم الحصول عليها مع مجموعة الثلاثي-ETR (الشكل 4ب). أظهر تحليل النسخ للخلايا التي تم صمت Pcsk9 من جميع ظروف العلاج أن EvoETR المزود بـ ZFP-8 (المشار إليه فيما بعد بـ EvoETR-8) كان الأكثر تحديدًا، وكان هذا صحيحًا عبر عتبات تغيير الطي المتزايد (من 0.5 إلى“; الشكل 4ج، د، الشكل البياني الممتد 4 والجدول التكميلي 3). لا يوجد أي من هذه الجينات المعبر عنها بشكل مختلف (DEGs؛ حتى أربعة عندتمت مشاركة ) مع مجموعة الثلاثة ETR، على عكس EvoETRs المجهزة بـ ZFP-6 و ZFP-3، التي شاركت ما يصل إلى عشرة وثلاثة DEGs – بما في ذلك Pcsk9 – مع مجموعة الثلاثة ETR، على التوالي (; الشكل 4 د والجداول التكميلية 3 و 4). كانت مستويات الميثيل في CpG على مستوى الجينوم متشابهة إلى حد كبير بين الخلايا المعالجة بالتحكم والخلايا المعالجة بـ EvoETR-8 (الشكل 4هـ). أظهرت الأخيرة خمسة مناطق ميثيلية مختلفة (DMRs)، ثلاثة منها تم توضيحها لأربعة جينات (الشكل 4و والجدول التكميلية 5)، بما في ذلك Pcsk9، الجين الوحيد إظهار تنظيم تنازلي ملحوظ (كانت هذه الأرقام أقل من تلك التي لوحظت مع مجموعة الثلاثي-ETR (الشكل 2c والجدول التكميلي 2). بشكل عام، تشير هذه البيانات إلى أن EvoETR-8 هو أفضل كاشف من حيث الأداء والخصوصية لتخفيض Pcsk9. علاوة على ذلك، تشير إلى أن الاضطرابات التي لوحظت مع مجموعة الثلاثي-ETR كانت على الأقل جزئيًا بسبب استهداف ZFP-3 وZFP-6 خارج الهدف، وكلاهما أظهر أيضًا ملف استهداف خارج الهدف بشكل فردي.
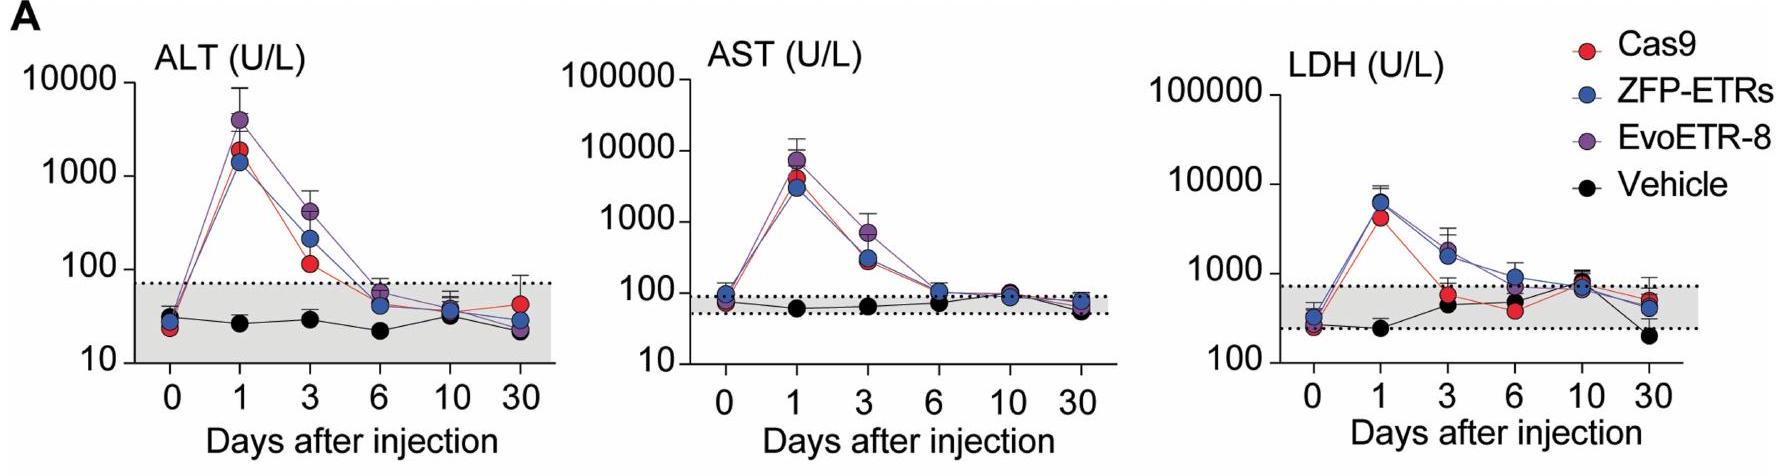
ثم قمنا بإيصال mRNA الخاص بـ EvoETR-8 إلى الفئران بواسطة LNPs ولاحظنا انخفاضًا بحواليفي مستويات PCSK9 المتداولة حتى اليوم 43 (الشكل 5 أ، ب). تم الحصول على نتائج مماثلة بعد حقن كميات متطابقة من LNPs المحملة بمكونات CRISPR-Cas9 المستهدفة لـ Pcsk9 (حوالي 70%)، في حين أن التثبيط الإضافي باستخدام مجموعة الثلاثي-ETR أدى إلىانخفاض في مستويات PCSK9 المتداولة (الشكل 5أ، ب). كانت مستويات ALT وAST وLDH مرتفعة بشكل مؤقت في جميع مجموعات المعالجة بـ LNP (الشكل التمديدي 5أ)، في حين تم تقليل LDL-C والكوليسترول الكلي بشكل ملحوظ في كل من الفئران المعالجة بـ EvoETR-8 (29 و26%، على التوالي) والفئران المعدلة جينياً (34 و، على التوالي؛ الشكل 5c، d). كانت مستويات الألبومين المفرز من الكبد متقاربة بين العلاجات (بيانات موسعة الشكل 5b)، مما يشير إلى أن النشاط المستهدف للمحررين المختلفين بدلاً من التأثيرات المرتبطة بالعلاج كان أساس الانخفاضات الملحوظة في PCSK9 عبر جميع التجارب الحية. بالنسبة لـ EvoETR-8، اختبرنا أيضًا LNP آخر، وما زلنا نحصل على تثبيط كبير لـ Pcsk9، مما يؤكد أن منصة الإيبي-صمت قابلة للنقل إلى
الشكل 5 | تحسين الإسكات الإبي لجين Pcsk9 في الجسم الحي بعد توصيل EvoETR-8 بواسطة LNP. أ، رسم تخطيطي للإجراءات التجريبية. تم تحميل LNPs بـ mRNAs التي تشفر ZFP-ETRs وCas9 أو EvoETR-8 وتم حقنها بشكل منفصل عن طريق الوريد في الفئران. المجموعة الضابطة، الفئران المعالجة بـ PBS. قبل وبعد حقن LNP، تم جمع عينات الدم لقياس مستويات PCSK9 والكوليسترول المتداولة. تم تحليل الحمض النووي الجيني (gDNA) من الكبديات المنقاة في اليوم 43 بعد الحقن لقياس كفاءة التحرير الجيني أو الإبي جيني لجين Pcsk9 بواسطة التسلسل العميق المستهدف (deep-seq) أو BS-seq، على التوالي. كما تم قياس مستويات ميثيل الحمض النووي بواسطة BS-seq المستهدف لـ DMRs التي تم تحديدها في المختبر. OTs: الأهداف الجانبية. تم إنشاؤه باستخدام BioRender.com. ب، مسار زمني لمستويات PCSK9 المتداولة حتى 43 يومًا بعد حقن LNP. البيانات هي متوسطس.د.تحليل إحصائي بواسطة تحليل التباين الثنائي الاتجاه RM ANOVA واختبار المقارنات المتعددة لدونيت بين المركب والعلاجات الأخرى في أحدث نقطة زمنية. و ). إذا لم يُذكر، فإن الفروقات لم تكن ذات دلالة إحصائية. ج، د، مخططات النقاط تُظهر مستويات LDL-C (ج) والكوليسترول الكلي (د) في الفئران بعد 30 يومًا من العلاجات ( ). تمثل النقاط الفئران الفردية؛ وتمثل الخطوط الوسيط لكل مجموعة. التحليل الإحصائي بواسطة تحليل التباين الثنائي الاتجاه RM ANOVA واختبار دانيه.
اختبار المقارنات المتعددة و لـ LDL-C؛ و #P<0.0001 لمستوى الكوليسترول الكلي). إذا لم يُذكر، فإن الفروقات لم تكن ذات دلالة إحصائية. e، خريطة حرارية تُظهر متوسط الميثيلation ل CpGs الفردية داخل CGI الخاص بـ Pcsk9 للفئران المعالجة (ZFP-ETRs و EvoETR-8) والفئران الضابطة (المركبة). تشير كثافة اللون إلى نسبة الميثيلation (كل مستطيل يمثل CpG فردي في المنطقة الجينومية Chr. 4:رسم نقطي يوضح نسبة الأليلات المعدلة. يتم الإبلاغ عن البيانات كنسب للفئران الفردية (نقاط) والوسائط (خطوط). تم قياس نسبة الأليلات المعدلة في إكسون 1 من Pcsk9 للفئران المعالجة بـ Cas9 والمركبة، وفي محفز Pcsk9 للفئران المعالجة بـ EvoETR-8 والمركبة. ). ج، مخططات النقاط تظهر نسبة الميثلة في الجسم الحي في الفئران المعالجة بـ EvoETR-8 والمركبة بواسطة تسلسل BS المستهدف. تم استجواب خمسة مواقع جينومية، تتوافق مع الخمسة DMRs التي تم تحديدها في المختبر من المقارنة بين EvoETR-8 وmock. تمثل كل نقطة CpG واحدة في DMR المشار إليه (متوسط ). الرسم البياني الذي يظهر DMR المرتبط بـ Pcsk9 (DMR-3) هو إعادة تحليل للبيانات في وتم تضمينه هنا كمرجع للميثيلation المستهدف. صيغ جزيئية أخرى (الشكل 5c من البيانات الموسعة). كان EvoETR-8 أيضًا أكثر كفاءة من مجموعة الثلاثي-ETR من حيث إيداع الميثيل في الحمض النووي عند محفز PcsK9 (زيادة بمقدار 1.9 مرة في معدل الميثيل المتوسط؛ الشكل 5e والشكل 6 من البيانات الموسعة). كانت هذه الزيادة مرتبطة بزيادة الميثيل في مواقع CpG التي كانت إما ضعيفة أو غير ميثلة في الفئران المعالجة بـ triple-ETR. من الجدير بالذكر أن ملفات تعريف ميثيل CpG عند Pcsk9 بعد العلاج بـ ZFP-ETRs أو EvoETR-8 كانت متطابقة بين الظروف الحية وفي المختبر (الشكل 6 من البيانات الموسعة). لم يتم الكشف عن أي اختلافات في مستويات ميثيل CpG عند محفز Pcsk9 في الرئة أو الطحال أو الكلى أو البنكرياس للفئران المعالجة بـ ETR مقارنة بالفئران المعالجة بشكل وهمي (الشكل 5d من البيانات الموسعة)، مما يؤكد مرة أخرى خصوصية الاستهداف لـ LNPs. أظهرت تحليلات جزيئية إضافية عدم وجود علامات على التغيرات الجينية عند محفز Pcsk9 للفئران المعالجة بـ EvoETR-8، في حين أن العبء الطفري الذي فرضه CRISPR-Cas9 عند موقع الهدف المقصود وصل إلى (الشكل 5f). أخيرًا، قمنا بفحص الأربعة DMRs غير المقصودة تم التعرف عليها في المختبر في خلايا الكبد المنقاة من الفئران المعالجة بـ EvoETR-8 وتم تأكيد ثلاثة منها؛ أما بالنسبة للواحدة المتبقية، فقد كانت CpGs المستجوبة ميثيلية بشكل كبير بالفعل في الفئران المعالجة بشكل وهمي (الشكل 5g). تماشيًا مع هذه البيانات، كانت أعلى ثلاثة DMRs التي تم التعرف عليها في المختبر من تركيبة الثلاثية ETR ميثيلية بشكل مفرط في الفئران المعالجة المقابلة (الشكل البياني الموسع 7). تؤكد هذه البيانات طبيعة المواقع غير المستهدفة وتدعم القيمة التنبؤية للدراسات في المختبر لتسمية المواقع غير المستهدفة.
نقاش
في هذه الدراسة، نوضح أن توصيل mRNAs التي تشفر ETRs بواسطة LNP إلى كبد الفئران يمكن أن يؤدي إلى كتم جيني دائم (تقريبًا لمدة عام من المتابعة) لجين Pcsk9. ومن الجدير بالذكر أن كتم الجينات أثبت استقراره أيضًا بعد استئصال جزئي للكبد، مما يؤكد الطبيعة الوراثية للعلامات الجينية المودعة بواسطة ETR. تشير التكنولوجيا إلى أن الخلايا الكبدية التي تم إخمادها بواسطة الإيبي لا تزال قادرة على تجديد الكبد. عند مقارنتها بـ RNAi، والتي تتطلب إدارات متعددة.نهجنا مُهيأ كعلاج يتم لمرة واحدة، وهي ميزة مشتركة فقط مع تقنيات تحرير الجينوم الأخرى. ومع ذلك، على عكس هذه الأساليب، فإن تقنية ETR لا تتطلب تحفيز انكسارات الحمض النووي المحتملة السامة للجينات لتعطيل الجين المرغوب فيه.. تمثل هذه الميزة ميزة أمان، خاصة عند استهداف الإيبي-صمت المتعدد، حيث يمكن أن يتسبب كل من تحرير الجينات، وإلى حد أقل، تحرير القواعد في حدوث انتقالات صبغية متبادلة.علاوة على ذلك، يختلف الإيبي-صمت عن تحرير الجينوم في أنه يمكن عكسه إما من خلال التدخل الدوائي أو العلاج مع المحررين المزودين بمنشط نسخي، كما تم إظهاره سابقًا في خطوط الخلايا.. وبالتالي، سيسمح الصمت الإيبي بتطبيق صمت مؤقت للجين المستهدف وعكس الآثار الجانبية المرتبطة بالعلاج. هنا، نوضح أيضًا أن تقنية ETR يمكن أن تؤسس مستويات كبيرة من الصمت الإيبي في الجسم الحي، عند قيم تتوافق بالفعل مع العديد من التطبيقات التجريبية والعلاجية. في إعداداتنا التجريبية، كان أداء الصمت الإيبي مماثلاً لأداء تحرير الجينات التقليدي (حتىمن تثبيط Pcsk9). من الجدير بالذكر أن نفس مكونات CRISPR-Cas9 المستخدمة في هذه الدراسة أظهرت أنها تلغي تمامًا تعبير Pcsk9 عند توصيلها بواسطة LNP آخر في الفئران.، مما يشير إلى أن استخدام منصات توصيل غير فيروسية أكثر كفاءة وتحمل يمكن أن يزيد من كفاءة إيقاف التعبير الجيني. بالإضافة إلى ذلك، يمكن للمرء اتباع نفس استراتيجيات التحسين الجزيئي المستخدمة لمحررات القواعد.التي، في أحدث إصداراتها، تعزز الإلغاء شبه الكامل للتعبير عن Pcsk9 في كل من الفئران والرئيسيات غير البشريةبالنسبة لتقنية الإيبي-سيلينسنج، يمكن أن تشمل هذه التحسينات مزيدًا من التنقيحات في الحمولة RNA و/أو تصميم ETR، وتحديد مواقع أهداف ETR التي تستجيب بشكل أفضل من مجموعة أكبر، واستخدام أنواع أخرى من DBD. في الواقع، لقد حسّن تحسيننا الجزيئي الأولي لهندسة ETR بالفعل كفاءة الإيبي-سيلينسنج في الجسم الحي. يمكن أن يُعزى الأداء الأقوى لـ EvoETR-8 مقارنةً بمزيج ETR الأصلي إلى الخصائص الجوهرية للبناء الموحد، والاختلافات في كفاءة تعبئة LNP و/أو هيكل أو استقرار mRNA. فيما يتعلق بدوام قمع Pcsk9 في الجسم الحي باستخدام EvoETR-8، فقد ثبت أنه مستقر حتى اليوم 43، وهو آخر نقطة زمنية تم تحليلها. من الممكن أن تحافظ الفئران المعالجة بـ EvoETR-8 على فترة القمع الطويلة التي لوحظت مع مزيج ETR الثلاثي، نظرًا لأن هذين النظامين يشتركان في نفس مجالات المؤثرات الجينية وأن مستويات الميثلة على الحمض النووي المستهدف كانت أعلى حتى في الفئران المعالجة بـ EvoETR-8. نظرًا لأن الزيادة الناتجة في النشاط المستهدف التي تم الحصول عليها من بعض هذه التحسينات قد تؤدي أيضًا إلى مستويات أعلى من الاستهداف غير المستهدف، يجب أن تترافق هذه الخطوات مع تقييم شامل للخصوصية من خلال مجموعات من التحليلات الجينية الواسعة النطاق والتحليلات الإيبيجينية. في هذا الصدد، وجدنا هنا أن العلاج باستخدام ETRs المعتمدة على ZFP يؤدي إلى اضطرابات محدودة في التعبير الجيني والإيبيجيني. بينما لا تزال الآليات الدقيقة وراء هذه الظاهرة غير معروفة، تشير عدة أدلة إلى الارتباط غير المقصود لمصفوفات ZFP في مواقع غير مستهدفة بدلاً من النشاط في المحلول لمجالات المؤثرات. في الواقع، لم نكتشف نحن وآخرون أي اضطرابات مع ETRs غير المستهدفة أو المحررات الإيبي-المعتمدة على dCas9.علاوة على ذلك، فإن أجهزة ETR ذات الجزيء الواحد المزودة بمصفوفات ZFP بديلة تحفز أعدادًا وأنواعًا متنوعة من الجينات المعبر عنها بشكل مختلف. ومن الجدير بالذكر أن اختبار ثلاثة مصفوفات ZFP مختلفة حدد واحدة محددة للغاية، مما يشير إلى أن الاختيار التجريبي لمناطق الربط من كتالوج أكبر قد يمكّن من تحديد أجهزة ETR ذات نشاط غير مستهدف غير قابل للاكتشاف. قد تشير التأكيدات الحية لمواقع غير مستهدفة تم ترشيحها في المختبر إلى أن نشاط ETR ثابت في هذين النظامين البيولوجيين، وهي فرضية تحتاج إلى مزيد من التأكيد من خلال تحليلات شاملة على مستوى الجينوم للبيانات الجينية والنسخية. تماشيًا مع التقارير السابقة، تظهر بياناتنا في المختبر أن تقنية ETR قابلة للتطبيق على منصات DBD مختلفة.، مع
تظهر أنظمة تحرير الجينات المعتمدة على ZFP كفاءة أكثر ملاءمة مقارنة بالهياكل المعتمدة على dCas9 وTALE. على الرغم من أن هذه النتيجة تتطلب تأكيدًا إضافيًا (على سبيل المثال، من خلال تقييم منهجي لمجموعة أكبر من DBDs والمواقع الجينومية)، فإن الميزات الجوهرية لمنصة ZFP تجعلها جذابة لتطبيقات تحرير الإيبيجينوم. تشمل هذه الميزات حجمها الجزيئي المنخفض واستقلالها عن gRNAs قصيرة العمر للنشاط، وهي خصائص من شأنها تسهيل كل من توصيل واستقرار معقد تحرير الإيبيجينوم. بدلاً من ذلك، يمكننا التكهن بأن أنظمة تحرير الجينات المعتمدة على ZFP قد تكون أكثر كفاءة من الهياكل المعتمدة على dCas9 أو TALE في ربط أو وضع EDs الإيبيجينية على الكروماتين، نظرًا لتشابهها الهيكلي مع مثبطات النسخ المعتمدة على ZFP التي تحدث بشكل طبيعي. في الختام، نثبت هنا إثبات مبدأ للتخفيض الإيبيجيني الدائم والفعال في الجسم الحي من خلال توصيل ETR المؤقت، مما يفتح آفاقًا مثيرة في مجال علاج الجينات.
المحتوى عبر الإنترنت
أي طرق، مراجع إضافية، ملخصات تقارير Nature Portfolio، بيانات المصدر، بيانات موسعة، معلومات إضافية، شكر وتقدير، معلومات مراجعة الأقران؛ تفاصيل مساهمات المؤلفين والمصالح المتنافسة؛ وبيانات توفر البيانات والرموز متاحة علىhttps://doi.org/10.1038/s41586-024-07087-8.
سغرو، أ. وبلانكافورت، ب. هندسة الإيبيجينوم: تقنيات جديدة للطب الدقيق. أبحاث الأحماض النووية. 48، 12453-12482 (2020).
أوييدا، ج.، يامازاكي، ت. وفوناكوشي، هـ. نحو تطوير العلاجات المعتمدة على تحرير الإيبيجينوم: الإمكانيات والتحديات. المجلة الدولية للعلوم الجزيئية 24، 4778 (2023).
جيلبرت، ل. أ. وآخرون. تنظيم النسخ الموجه بواسطة RNA باستخدام تقنية كريسبر في حقيقيات النوى. خلية 154، 442 (2013).
ثاكر، ب. آي. وآخرون. تحرير الإيبيجينوم بدقة عالية بواسطة مثبطات CRISPR-Cas9 لإسكات العناصر التنظيمية البعيدة. نات. ميثودز 12، 1143-1149 (2015).
مندنهال، إ. م. وآخرون. تحرير محدد للموقع لتعديلات الهيستون عند المعززات الذاتية. نات. بيولوجيا التكنولوجيا. 31، 1133-1136 (2013).
كونرمان، س. وآخرون. التحكم البصري في النسخ الداخلي والثوابت الوراثية في الثدييات. ناتشر 500، 472-476 (2013).
لي، ف. وآخرون. تستهدف الميثيل ترانسفيراز الحمض النووي الهجين الميثيل الحمض النووي إلى تسلسلات DNA محددة وتثبط تعبير الجينات المستهدفة. أبحاث الأحماض النووية. 35، 100-112 (2007).
ستولزنبرغ، س. وآخرون. استهداف كتم عامل النسخ المسرطن SOX2 في سرطان الثدي. أبحاث الأحماض النووية. 40، 6725-6740 (2012).
سيديك، أ. ن. وآخرون. استهداف الميثلة وكتم الجينات لـ VEGF-A في الخلايا البشرية باستخدام بروتين اندماج أحادي السلسلة مصمم من Dnmt3a-Dnmt3L مع زيادة في نشاط ميثلة الحمض النووي. ج. مول. بيول. 425، 479-491 (2013).
إيكو، ج.، إيمبيولت، م. وترونو، د. بروتينات إصبع الزنك KRAB. التنمية 144، 2719-2729 (2017).
ثاكور، ب. آي. وآخرون. كتم النسخ الموجه بواسطة RNA في الجسم الحي باستخدام مثبطات CRISPRCas9 من S. aureus. نات. كوميونيك. 9، 1674 (2018).
مورينو، أ. م. وآخرون. تخفيف الألم طويل الأمد من خلال قمع مستهدف في الموقع لـفي الفئران. ساي. ترانسل. ميد. 13، eaay9056 (2021).
أمابيلي، أ. وآخرون. كتم وراثي للجينات الذاتية بواسطة تحرير إبيجيني مستهدف بطريقة الضرب والركض. خلية 167، 219-232 (2016).
هاسين-بي-أبينا، س. وآخرون. حدث سلبي خطير بعد العلاج الجيني الناجح لعوز المناعة المشترك الشديد المرتبط بالكروموسوم X. نيو إنجلاند جورنال أوف ميديسين 348، 255-256 (2003).
تشاندلر، ر. ج. وآخرون. تؤثر تصميم الناقلات على السمية الجينية الكبدية بعد العلاج الجيني باستخدام فيروس مرتبط بالأدينوفيروس. ج. استثمار سريري. 125، 870-880 (2015).
دينيز، أ.، فروس، ج. م. وبرانكو، م. ر. تنظيم العناصر القابلة للنقل بواسطة تعديلات الحمض النووي. نات. ريف. جينيت. 20، 417-431 (2019).
ملامبو، ت. وآخرون. تعديلات مصممة على الإيبيجينوم تمكّن من كتم الجينات بشكل قوي ومستدام في خلايا بشرية ذات صلة سريرياً. أبحاث الأحماض النووية 46، 4456-4468 (2018).
نونيز، ج. ك. وآخرون. ذاكرة النسخ القابلة للبرمجة على مستوى الجينوم بواسطة تحرير الإيبيجينوم المعتمد على كريسبر. خلية 184، 2503-2519 (2021).
ين، هـ. وآخرون. التعديل الكيميائي الموجه بالهيكل للـ RNA الموجه يمكّن من تحرير الجينوم غير الفيروسي الفعال في الجسم الحي. نات. بيوتكنولوجي. 35، 1179-1187 (2017).
موسونورو، ك. وآخرون. تحرير قاعدة CRISPR في الجسم الحي لجين PCSK9 يقلل بشكل دائم من الكوليسترول في الرئيسيات. ناتشر 593، 429-434 (2021).
غالونسكا، سي. وآخرون. تتبع شامل لجينوم آثار دكاس9-ميثيل ترانسفيراز. نات. كوميونيك. 9، 597 (2018).
أو’جين، هـ. وآخرون. Ezh2-dCas9 و KRAB-dCas9 يمكّنان من هندسة الذاكرة الوراثية بطريقة تعتمد على السياق. علم الوراثة اللاجينية الكروماتينية 12، 26 (2019).
باونوفسكا، ك.، لوغري، د. و دالمين، ج. إي. أنظمة توصيل الأدوية للعلاجات القائمة على RNA. نات. ريف. جينت. 23، 265-280 (2022).
راي، ك. ك. وآخرون. تجربتان من المرحلة الثالثة لعقار إنكليسيران في المرضى الذين يعانون من ارتفاع مستوى الكوليسترول LDL. نيو إنجلاند جورنال أوف ميديسين 382، 1507-1519 (2020).
ليبوفيتش، م. ل. وآخرون. الكروموثريز كعاقبة مستهدفة لتعديل الجينوم باستخدام كريسبر-كاس9. نات. جينت. 53، 895-905 (2021).
تورشيانو، ج. وآخرون. التقييم الكمي لإعادة ترتيب الكروموسومات في خلايا جذعية بشرية معدلة جينياً بواسطة CAST-Seq. خلية الجذع 28، 1136-1147 (2021).
ناهيد، أ. د. وآخرون. تكرار الأنيوبلودية في خلايا T البشرية الأولية بعد قطع CRISPR-Cas9. نات. بيوتكنولوجي. 40، 1807-1813 (2022).
ستادماور، إ. أ. وآخرون. خلايا T المعدلة بواسطة كريسبر في مرضى السرطان المقاوم للعلاج. ساينس (80-). 367، eaba7365 (2020).
فيومارا، م. وآخرون. التأثيرات الجينية للتعديل الأساسي والتعديل الأولي في خلايا الدم الجذعية البشرية. نات. بيوتكنولوجي.https://doi.org/10.1038/s41587-023-01915-4 (2023).
كوبلان، ل. و. وآخرون. تحسين محررات القواعد السيتيدينية والأدينينية من خلال تحسين التعبير وإعادة بناء الأجداد. نات. بيولوجيا حيوية. 36، 843-848 (2018).
زافرا، م. ب. وآخرون. محررات القواعد المحسّنة تمكّن التحرير الفعّال في الخلايا والأعضاء المصغرة والفئران. نات. بيوتكنولوجي. 36، 888-896 (2018).
ملاحظة الناشر: تظل شركة سبرينغر ناتشر محايدة فيما يتعلق بالمطالبات القضائية في الخرائط المنشورة والانتماءات المؤسسية.
الوصول المفتوح هذه المقالة مرخصة بموجب رخصة المشاع الإبداعي النسب 4.0 الدولية، التي تسمح بالاستخدام والمشاركة والتكيف والتوزيع وإعادة الإنتاج بأي وسيلة أو صيغة، طالما أنك تعطي الائتمان المناسب للمؤلفين الأصليين والمصدر، وتوفر رابطًا لرخصة المشاع الإبداعي، وتوضح ما إذا تم إجراء تغييرات. الصور أو المواد الأخرى من طرف ثالث في هذه المقالة مشمولة في رخصة المشاع الإبداعي الخاصة بالمقالة، ما لم يُشار إلى خلاف ذلك في سطر الائتمان للمادة. إذا لم تكن المادة مشمولة في رخصة المشاع الإبداعي الخاصة بالمقالة وكان استخدامك المقصود غير مسموح به بموجب اللوائح القانونية أو يتجاوز الاستخدام المسموح به، فستحتاج إلى الحصول على إذن مباشرة من صاحب حقوق الطبع والنشر. لعرض نسخة من هذه الرخصة، قم بزيارةhttp://creativecommons.org/licenses/by/4.0/. (ج) المؤلفون 2024
طرق
الاستنساخ الجزيئي وإنتاج الرنا المرسال
تم توصيل ETRs بشكل مؤقت إما كحمض نووي بلازميدي (في خطوط الخلايا) أو كـ mRNA (في خطوط الخلايا، والخلايا الأولية وفي الجسم الحي). لتحقيق ذلك، تم استنساخ ETRs في متجه تعبير يحتوي على: (i) محفز CMV في الأعلى؛ (ii) محفز T7 في الأعلى لنسخ mRNA في المختبر (IVT)؛ (iii) إشارة WPRE في الأسفل؛ (iv) -امتداد نهائي مكون من 64 أدينين (64A)؛ و (v) موقع تسطيح بلازميد Spel لتخليق mRNA IVT (الشكل البياني الموسع 1b). تم وصف تسلسلات الترميز الخاصة بـ ETRs المعتمدة على dCas9 سابقًالتعبير gRNA المعتمد على البلازميد، تم استنساخ تسلسلات crRNA في ناقل التعبير الموصوف سابقًا والذي يحتوي على محفز U6 وتسلسل tRNA الخاص بـ Staphylococcus pyogenes Cas9.تم تصميم gRNAs المستهدفة لـ CGI لجين Pcsk9 في الفأر باستخدام Chop Chop” (https://chopchop.cbu.uib.no/) وتم اختيارها وفقًا لنشاط محاكي مرتفع وخصوصية عالية. تم تصميم وتخليق ZFPs وTALEs بواسطة Merck وThermo Fisher Scientific، على التوالي، وتم استنساخها في بلازميد التعبير الثديي بدلاً من تسلسل dCas9. تم إنتاج mRNAs بواسطة IVT باستخدام مجموعة T7 Megascript (Thermo Fisher Scientific، AMB1334-5) وفقًا لتعليمات الشركة المصنعة. بالنسبة للتجارب في المختبر، تم إنتاج mRNAs المعدلة جزئيًا بواسطة IVT، بما في ذلك التعديلات التالية على البروتوكول القياسي: (i) تضمين نظير الغلاف العكسي المضاد -O-Me-m7G( )ppp( )G (NEB, M0251) بتركيز نهائي قدره 8 مللي مولار؛ و (ii) تقليل تركيز GTP من 7.5 إلى 2.5 مللي مولار. بالنسبة للتجارب داخل الجسم، تم إنتاج mRNAs المعدلة بشكل كبير بواسطة IVT، بما في ذلك التعديلات التالية على البروتوكول القياسي: (i) تضمين CleanCap-AG (Trilink BioTechnologies، N-7113) بتركيز نهائي قدره 4 مللي مولار؛ و (ii) استبدال UTP بـ N1-Met--يوريدين (Trilink BioTechnologies، N-1081) بتركيز نهائي قدره 7.5 مللي مولار. ثم تم تنقية الرنا المرسال باستخدام مجموعة RNeasy Mini (Qiagen، 74134). تم تقييم جودة وسلامة الرنا المرسال باستخدام نظام 4200 TapeStation، وتم قياس الكميات بواسطة NanoDrop 8000. تم تصنيع sgRNAs بواسطة Axolab وفقًا لجدول تعديل النوكليوتيدات الموصوف سابقًا.للدراسات في المختبر أو في الكائنات الحية، تم نسخ mRNA الخاص بـ Cas9 في المختبر كما هو موضح أعلاه أو تم شراؤه من شركة Trilink BioTechnologies (L-7606)، على التوالي. تسلسلات ETRs و gRNAs المستخدمة في هذه الدراسة مدرجة في الجدول التكميلي 6. البلازميدات المستخدمة في هذه الدراسة متاحة عند توقيع اتفاقية نقل المواد.
زراعة الخلايا، العلاج والهندسة
تم زراعة خلايا هيبا 1-6 (CRL-1830، ATCC) في وسط ديلبيكو المعدل من إيجل (DMEM، كورنينج، 10-013-CV) معزز بـ 10% من مصل الجنين البقري (FBS؛ يوروكلون)، 1% من L-جلوتامين (يوروكلون، ECB3000D) و 1% من البنسلين-ستربتوميسين (يوروكلون، ECB3001D) فيفيالحاضنة المرطبة. هيبا 1-6 بي سي إس كتم إنشاء خط الخلايا عن طريق النوكليوفكشن خلايا تحتوي على: (i) بلازميد مانح HDR يحتوي على كاسيت 2A-tdTomato-polyA ضمن أذرع التماثل إلى الإكسون 12 من Pcsk9؛ (ii) بلازميد يعبر عن Cas9؛ و (iii) بلازميد يعبر عن agRNA يستهدف الإكسون الأخير من (المرجع 42). تم فرز الخلايا الإيجابية لـ tdTomato على مستوى الخلية الواحدة ثم تم تضخيمها. Hepa 1-6 Pcsk سلالة الخلايا متاحة عند توقيع اتفاقية نقل المواد. تم شراء الكبديات الأولية من الفئران الذكور من سلالة C57BL/6 من Biopredic International كطبقات ملتصقة على أطباق 96 بئر مغطاة بالكولاجين وتم الحفاظ عليها وفقًا لتعليمات الشركة المصنعة. تم جمع السائل الفائق للخلايا المعالجة والضابطة في نقاط زمنية مختلفة وتخزينه كعينات للاستخدام لمرة واحدة في.
إجراءات توصيل الجينات
للتجارب في المختبر في Hepa 1-6 Pcsk9 خلايا، تم نقل الجينات إلى الخلايا إما باستخدام RNAs أو plasmid DNAs باستخدام نظام 4D-Nucleofector X (لونزا) في محلول خط خلايا SF (لونزا، V4XC-2032) ومع برنامج النبض CM-137. من أجل الدراسات في المختبر و في تجارب in vivo مع LNPs A و B و C و D و E، تم صياغة هذه المواد الكيميائية البحثية بواسطة Precision NanoSystem (PNI) من خلال دمج مزيج من الدهون و RNA، حيث تم إذابة الأخير في محلول خاص من PNI. تتكون مزيجات الدهون من أربعة مكونات مختلفة مذابة في محلول قائم على الإيثانول: دهون قابلة للتأين، دهون مساعدة، كوليسترول و 1،2-ديمايرستويل-راك-غليسيرول-3-ميثوكسي بولي إيثيلين غليكول (PEG-DMG). تختلف الطبيعة الكيميائية للدهون المساعدة بين التركيبات: (i) 1،2-دي-(9Z-أوكتاديسينويل)-sn-غليسيرول-3-فوسفو إيثانول أمين (DOPE) لـ LNP A؛ (ii) 1،2-ديوكتاديسينويل-sn-غليسيرول-3-فوسفو إيثانول أمين (DSPC) لـ LNP B؛ (iii) 1،2-ديبالميتويل-sn-غليسيرول-3-فوسفو كولين (DPPC) لـ LNP C؛ و (iv) 1،2-دي-(9Z-أوكتاديسينويل)-sn-غليسيرول-3-فوسفو كولين (DOPC) لـ LNPs D و E. الدهون القابلة للتأين وكذلك النسبة المولية التي تم بها خلط المكونات الأربعة هي معلومات خاصة بـ PNI. تم خلط RNA والدهون في جهاز NanoAssemblr Ignite (PNI) باستخدام خراطيش ميكروفلويديك (Ignite NxGen Cartridge؛ PNI) بمعدل تدفق إجمالي (TFR) منونسبة معدل التدفق (FRR) من (ARNs:الدهون). تم استخدام نسب النيتروجين إلى الفوسفات (NP) 6 و 9 في تجارب الفحص الأولية لـ LNP، وتم تعيين هذه النسبة إلى 6 للتجارب الحية المتبقية. مزيج الدهون LNP D متاح عند الطلب من Precision NanoSystems (PNI) باستخدام الرمز iL00V77. يمكن شراء LNP D المصنوع مع RNA المطلوب مباشرة من PNI من خلال توقيع اتفاقية. الوقت المقدر للدوران هو أشهر. بدلاً من ذلك، يمكن شراء LNP D وجهاز الصياغة من PNI. في هذه الحالة، ستدعم PNI تقنيًا الباحث في إعداد بروتوكول الصياغة. تم إنتاج LNPs باستخدام كاشف GenVoy-ILM (NWW0042، 25 مليمول) وتمت صياغتها وفقًا لتعليمات الشركة المصنعة باستخدام جهاز NanoAssemblr Ignite (PNI) وباستخدام خراطيش ميكروفلويديك (خراطيش Ignite NxGen؛ PNI). تم تعيين معلمات الصياغة على النحو التالي: (ط) TFR من ؛ (ii) FRR من ؛ و (iii) نسبة NP من 4. تم تركيز جميع LNPs باستخدام فلتر طرد مركزي Amicon (MWCO30 kDa)، وتمت إزالة الإيثانول عن طريق تخفيف 3:1 في 1 PBS (– خالي) وتم تصفية LNPs أخيرًا يدويًا من خلال حقنة. تم تحليل أحجام الجسيمات ومؤشر توزيعها (PDI) باستخدام تشتت الضوء الديناميكي (DLS)، وتم تحديد كفاءة احتواء RNA والتركيزات باستخدام اختبار قائم على RiboGreen. تم الإبلاغ عن نتائج تحليلات DLS وكمية RNA لـ LNPs المستخدمة في هذه الدراسة في الجدول التكميلي 7.
تدفق السيتومتر وفرز الخلايا
تم إجراء تدفق السيتومتر باستخدام CytoFLEX (Beckman Coulter) وتم تحليل البيانات الخام باستخدام FCS Express v. 7 (DeNovo Software) لاستخراج نسبة خلايا Pcsk9 السلبية. عند الإشارة، تم فرز الخلايا الإيجابية أو السلبية لـ tdTomato باستخدام جهاز فرز الخلايا FACSAria Fusion (BD Biosciences) كأعداد جماعية أو على مستوى الخلية الفردية. تم الإبلاغ عن استراتيجية التصفية لكل من إجراءات تدفق السيتومتر وفرز الخلايا في الشكل التكميلي 1.
تسلسل RNA
تم استخراج RNA الكلي من خلايا Pcsk9 المثبطة باستخدام مجموعة RNeasy Mini Kit (Qiagen، 74134) وتم قياسه باستخدام اختبار Qubit 2.0 الفلوري (Thermo Fisher Scientific). تم إعداد المكتبات غير المتسلسلة باستخدام مجموعة NEBNext Ultra RNA Library Prep Kit لـ Illumina بعد إزالة rRNA، وتم إجراء التسلسل باستخدام منصة Illumina NovaSeq 6000 (برنامج NovaSeq Control v.1.7) للحصول على ما لا يقل عن 30 مليون قراءة مزدوجة الطرف بطول 150 نقطة لكل عينة. تم التحكم في جودة القراءة باستخدام Fastqc v.0.11.9 (https://www.bioinformatics.babraham.ac.uk/projects/fastqc/)، وتمت إزالة القراءات ذات الجودة المنخفضة والمحولات باستخدام Trim Galore v.0.6.6 (https://www. bioinformatics.babraham.ac.uk/projects/trim_galore/) وفقًا للمعلمات التالية: –quality 20، –length 25، –paired. تم محاذاة القراءات المتبقية عالية الجودة إلى الجينوم المرجعي للفأر GRCm38 باستخدام STAR v2.7.6a (ref. 43) مع المعلمات الافتراضية. تم قياس عدد الجينات باستخدام وظيفة featureCounts من حزمة Subread
v.2.0.1 (ref. 44) و Gencode M25 كنموذج للجين. تم تصحيح العد الخام للانحيازات الناتجة عن إعدادات المكتبة المختلفة، إذا كانت موجودة، باستخدام وظيفة ComBat_seq من حزمة R Bioconductor sva v.3.38.0 (ref. 45). تم تقدير توزيع القراءة باستخدام نموذج السجل العام السالب الثنائي المطبق في حزمة R Bioconductor DESeq2 v.1.30.0 (ref. 46). تم اختبار التعبير الجيني التفاضلي باستخدام وظيفة nbinomWaldTest وتم تصحيح القيم باستخدام نهج بنجاميني-هوشبرغ.
WGMS
تم استخراج الحمض النووي الجينومي من – خلايا مثبطة باستخدام مجموعة استخراج الخلايا المزروعة Maxwell RSC (AS1620) وتم قياسه باستخدام NanoDrop 8000. تم إعداد المكتبات باستخدام نهج إنزيمي لتحويل السيتوزين مع كواشف NEBNext DNA Ultra II وتم إجراء التسلسل باستخدام منصة Illumina HiSeq (برنامج HiSeq Control v.3.4) لإنتاج ما لا يقل عن 250 مليون قراءة مزدوجة الطرف بطول 150 نقطة لكل عينة. تم التحكم في جودة القراءة باستخدام Fastqc v.0.11.9، وتمت إزالة القراءات ذات الجودة المنخفضة والمحولات باستخدام Trim Galore v0.6.6. مع المعلمات التالية: –quality 20، –length 25، –paired، –clip_R25. تم تحليل القراءات المتبقية عالية الجودة باستخدام أداة Bismark read mapper methylation caller v.0.23.0. بالتفصيل، تم محاذاة القراءات إلى كل من الجينومات المحولة وغير المحولة (GRCm38) باستخدام Bismark v.0.23.0 مع المعلمات الافتراضية. ثم تمت إزالة النسخ المكررة باستخدام نص deduplicate_bismark وتم الحصول على حالة الميثيل باستخدام نص bismark_methylation_extractor. ثم تم تحميل استدعاء الميثيل إلى بيئة R ومعالجته باستخدام حزمة R Bioconductor MethylKit v.1.16.1. تم تصفية البيانات المستوردة باستخدام وظيفة filterByCoverage (تصفية العد المنخفض تساوي 1 والنسبة المئوية العالية تساوي 99.9) وتم تطبيعها باستخدام وظيفة normalizeCoverage. تم دمج المعلومات من العينات المختلفة باستخدام وظيفة unite مع مراعاة المواقع المغطاة في جميع النسخ. تم حساب نسبة الميثيل باستخدام وظيفة percMethylation وتم تحديد الارتباط بين العينات باستخدام وظيفة cor (طريقة بيرسون الافتراضية). تم إجراء تحليل الميثيل التفاضلي باستخدام حزم R Bioconductor bsseq v.1.26.0 (ref. 47) و DSS v.2.44.0 (ref. 48). أولاً، تم إنشاء الكائن باستخدام وظيفة makeBSseqData بدءًا من مخرجات Bismark. تم استخدام وظيفة DMLtest لخطوة التطبيع والتحليل التفاضلي مع المعلمات التالية: smoothing = TRUE و smoothing.span=500. ثم تم تطبيق وظيفة callDML لتحديد المواقع الميثيلية التفاضلية (DML) مع تعيين العتبات delta و p.threshold . لاستبعاد أي DMRs مربكة غير مرتبطة بالميثيل غير المستهدف، تم تعيين عتبة ميثيل دلتا عند 0.4؛ أي، القيمة الدنيا التي لا تستدعي أي DMR في خلايا المعالجة Cas9، وهو تحكم سلبي ليس له نشاط ميثيل مباشر. تم تعريف DMRs باستخدام وظيفة callDRM مع نفس العتبات. تم توضيح DMRs المحددة باستخدام وظيفة annotatePeakInBatch من حزمة R Bioconductor ChIPpeakAnno v.3.24.2 (ref. 49) باستخدام توضيح Gencode M25 والمعلمات التالية: PeakLocForDistance = “middle”، FeatureLocForDistance=”TSS”، output=”both” و multiple = TRUE. تم حساب DMRs لجميع العينات المعالجة باستخدام نفس الضوابط المعالجة الوهمية كمرجع.
التعامل مع الفئران والعلاجات
تم شراء فئران إناث من نوع C57BL/6N بعمر ثمانية أسابيع من مختبرات تشارلز ريفر. اتبعت الإجراءات المتعلقة بالتعامل مع الحيوانات ورعايتها القوانين والسياسات الوطنية والدولية وتمت الموافقة عليها من قبل لجنة رعاية واستخدام الحيوانات المؤسسية (أرقام التفويض 604/2020-PR و 233/2022-PR، المقدمة من وزارة الصحة الإيطالية). كانت درجة حرارة السكن والرطوبة النسبية هي و ، على التوالي. تم استخدام دورة ضوء 12 ساعة – 12 ساعة وتم بذل كل الجهود الممكنة لتقليل عدد الفئران المستخدمة ومعاناتها. من أجل الإدارة الحية إما لـ Cas9 أو
ETRs، تم تخفيف حلول mRNA-LNP في PBS بدون كالسيوم ومغنيسيوم (Corning، 21-031-CV). بعد ذلك، تم تعيين الفئران عشوائيًا إلى مجموعة علاج وتم تسخينها باستخدام مصباح الأشعة تحت الحمراء للحصول على توسع الأوعية. أخيرًا، تم حقن من محلول LNP أو PBS (المعرف هنا كوسيلة) عن طريق الوريد في الوريد الذيل. من أجل تحليلات البلازما (انظر القسم التالي)، تم جمع حوالي مل من الدم من الضفيرة خلف العين لكل فأر تجريبي باستخدام أنبوب شعري ميكرو-هيماتوكريت غير مملوء بالهيبارين (Kimble Chase، CSX40A502)، ثم تم نقله إلى أنبوب جمع الدم المرشوش بـ EDTA (Sarstedt، 20.1288.100). ثم تم طرد الدم لمدة 10 دقائق عند في درجة حرارة الغرفة. تم جمع البلازما المنقاة أخيرًا من الطور العلوي وتخزينها كعليقات للاستخدام مرة واحدة عند . من أجل إنهاء التجربة وجمع الأعضاء، تم قتل الفئران بواسطة تمت إزالة الأنسجة (الكبد، الطحال، الرئتين والكلية) وتجميدها بسرعة لإجراء تحليلات جزيئية إضافية. بالنسبة لاستئصال جزئي للكبد، تم تخدير الفئران بواسطةاستنشاق الإيزوفلوران المستمر. قبل استئصال الكبد، تم صيام الفئران لمدة 4 ساعات. تم إجراء الجراحة وفقًا لبروتوكول هيغينز. باختصار، تم حلاقة جلد البطن، وتم عمل شق بطول 2 سم في منتصف الجزء العلوي بدءًا من الزائدة. بعد فتح الصفاق، تم تحريك الكبد بلطف وكشفه. تم رفع الفص الجانبي الأيسر، وربطه وإعادة قطعه من خلال 3.0 غرز حرير (Ethicon، EH6823H) بعيدًا عن الرباطات المطبقة. تم إغلاق العضلات والجلد في طبقتين باستخدام 4.0 فيكرل (Ethicon، V994H) ونظام إغلاق الجروح الأوتوماتيكي، على التوالي. بالنسبة لتسكين الألم بعد الجراحة، تم استخدام الكاروبروفين (5 ملغ لكل كغ) عن طريق الحقن تحت الجلد في وسادة الدهون في الرقبة. تم جمع أنسجة الكبد والدم أثناء استئصال الكبد وعند التشريح من أجل التحليل الجزيئي وتحديد البلازما. لعزل الخلايا الكبدية، تم أولاً تخدير الفئران باستخدام الإيزوفلوران وتم كشف الكبد وتغذيته (32 مل في الدقيقة) عبر الوريد الأجوف السفلي باستخدام HBSS-HEPESالكولاجيناز IV (سيغما). تم جمع كبد الفأر المهضوم، وتم تمريره عبر مصفاة خلايا 100-م (BD Biosciences) ومعالجته إلى تعليق خلوى مفرد. تم تدوير الخلايا وغسلها ثلاث مرات باستخدام طرد مركزي متتابع بسرعات مختلفة (و20 جرام) لمدة 3 دقائق لكل منها في درجة حرارة الغرفة للحصول على الخلايا الكبدية.
تحليل البلازما
لتحديد PCSK9، تم إذابة البلازما من الفئران المعالجة والمستخلصات من الخلايا الكبدية الأولية للفئران وتم تخفيفها 1:200 و1:2، على التوالي. ثم تم تحميل التخفيفات على مجموعة ELISA تجارية مسبقة التثبيت وفقًا لتعليمات الشركة المصنعة (R&D Systems، MPC900). وبالمثل، تم استخدام اختبارات الامتصاص لتحديد مستويات LDL-C (P/N 00018256040، ويرفن)، ALT (P/N 00018257440، ويرفن)، AST (P/N 00018257540، ويرفن)، LDH (P/N 00018258240، ويرفن) والألبومين (P/N0018250040)، وفقًا لتعليمات الشركة المصنعة.
تحليلات جزيئية حية
تم استخراج الحمض النووي الجينومي من الأنسجة المجمدة بسرعة (حوالي 30 ملغ) باستخدام مجموعة تنقية الحمض النووي من الأنسجة Maxwell 48 Promega RSC (AS1610) وفقًا لتعليمات الشركة المصنعة. حيثما تم الإشارة، تم تحديد كفاءات التحرير والتحرير الإضافي من الخلايا الكبدية المنقاة (انظر ‘التعامل مع الفئران والعلاجات’). في هذه الحالات، تم استخراج الحمض النووي الجينومي باستخدام مجموعة تنقية الحمض النووي من الأنسجة Maxwell 48 RSC (AS1610) منالخلايا وفقًا لتعليمات الشركة المصنعة. تم تحديد كفاءات تحرير الجينات عند موضع Pcsk9 باستخدام اختبار T7 أو تسلسل عميق مستهدف. بالنسبة لاختبار T7، تم تضخيم منطقة جينومية بطول 765 نقطة أساسية تشمل موقع ارتباط CRISPR-Cas9 باستخدام البرايمرات المدرجة في الجدول التكميلي 8. ثم تمت معالجة PCRs باستخدام مجموعة اكتشاف تحرير الجينوم Alt-R (IDT، 1075932)، وتم تشغيلها على نظام Agilent ScreenTape، وتم تحديد نسبة التحرير وفقًا لتعليمات الشركة المصنعة. بالنسبة للتسلسل العميق المستهدف، تم تضخيم منطقة المحفز أو الإكسون 1 من Pcsk9 باستخدام البرايمرات المدرجة في الجدول التكميلي 8. ثم تم إعداد المكتبات باستخدام مجموعة NEBNext Ultra IIDNA Library Prep Kit for Illumina للمحفز Pcsk9 أو باستخدام
NEBNext Ultra DNA Library Prep Kit for Illumina للإكسون 1 من Pcsk9، وتم تسلسلها باستخدام منصة Illumina MiSeq (MiSeq Control Software v.2.6). تم تحليل بيانات التسلسل باستخدام CRISPResso2 v.2.8 (المرجع 51) لاكتشاف إدخالات النوكليوتيدات و/أو الحذف. تم محاذاة القراءات إلى تسلسل الحدود حول موقع القطع المحتمل (400 نقطة أساسية مركزة على موقع تكميلي sgRNA لعينات معالجة Cas9 أو 300 نقطة أساسية مركزة على موقع التعرف ZFP-8 لعينات معالجة EvoETR-8) باستخدام bowtie2 v.2.2.5 (المراجع 52،53) في وضع مزدوج ومعلمات افتراضية. بعد ذلك، تم تقسيم ملفات fastq الأصلية للاحتفاظ فقط بالقراءات التي تتطابق مع منطقة الاهتمام باستخدام وحدة filterbyname من BBMap aligner v.39.01 الموجودة في مجموعة BBTools (https://sourceforge.net/projects/bbmap/). تم تحليل القراءات المتبقية باستخدام CRISPResso2 في وضع مزدوج النهاية مع تعيين الخيارات لبرنامج Trimmomatic v.0.39 (المرجع 54؛ http://www.usadellab.org/cms/?page=trimmomatic) لإزالة المواقع ذات الجودة المنخفضة (score<30) ومهايئات Illumina (–trim_sequences–trimmomatic_commandtrim-momatic–trimmomatic_options_string’ILLUMINACLIP:TruSeq3-PE-2.fa:2:30:10 MINLEN:100′). ثم، تم دمج كل زوج من القراءات المزدوجة النهاية باستخدام FLASH v.1.2.11 (المرجع 55) لإنتاج contig واحد، والذي تم تعيينه إلى مرجع amplicon المدخل (منطقة المحفز أو الإكسون الأول، اعتمادًا على التجربة). تم توفير موقع sgRNA التكميلي وتسلسل الهدف ZFP-8 لتركيز التحليل على المنطقة المستهدفة، وتم تعيين نافذة التحديد إلى 20 نقطة أساسية لكل جانب حول موقع القطع (عينات Cas9) أو نقطة المنتصف ZFP-8 (عينات EvoETR-8). تم تحديد الأليلات من خلال قياس عدد القراءات ووفرتها النسبية بناءً على إجمالي عدد القراءات مع الأخذ في الاعتبار فقط الإدخالات والحذف. تم تحديد نسبة ميثيل CpG عندالمحفز أو عند DMRs المحددة في المختبر باستخدام تسلسل عميق مستهدف بالبيسلفيت (BS-seq المستهدف). على وجه التحديد، تم تحويل الحمض النووي الجينومي المنقى باستخدام مجموعة تحويل البيسلفيت السريعة EpiTect (Qiagen، 59104) وفقًا لتعليمات الشركة المصنعة. ثم، تم تضخيم منطقة المحفز من Pcsk9 وDMRs غير المقصودة باستخدام البرايمرات المدرجة في الجدول التكميلي 8. بالنسبة لمحفز Pcsk9، تم إعداد المكتبات باستخدام مجموعة NEBNext Ultra DNA Library Prep Kit for Illumina. بالنسبة لـ DMRs الأخرى، تم استخدام مجموعة NEBNext Ultra II DNA Library Prep Kit for Illumina. تم تسلسل المكتبات باستخدام منصة Illumina MiSeq في وضع مزدوج النهاية (MiSeq Control Software v.2.6). تم التحكم في جودة القراءة باستخدام Fastqc v.0.11.9، وتمت إزالة القراءات ذات الجودة المنخفضة والمهايئات باستخدام Trim_Galore v0.6.6. مع المعلمات التالية: –quality 20، –length 25، –paired، –rrbs. تم تحليل القراءات المتبقية عالية الجودة باستخدام أداة Bismark read mapper methylation caller v.0.23.0 (المرجع 56). بالتفصيل، تم محاذاة القراءات إلى كل من الجينومات غير المحولة والمحولة (GRCm38) باستخدام Bismark مع المعلمة –local وتم الحصول على حالة الميثيل باستخدام سكربت bismark_methylation_extractor. تم تحميل استدعاءات الميثيل إلى بيئة R ومعالجتها باستخدام حزمة R Bioconductor MethylKit v.1.16.1 (المرجع 57). تم تصفية البيانات المستوردة باستخدام وظيفة filterByCoverage (تصفية العدد المنخفض تساوي 10 والنسبة المئوية العالية تساوي 99.9) وتم تطبيعها باستخدام وظيفة normalizeCoverage. تم دمج البيانات من العينات المختلفة باستخدام وظيفة unite مع الأخذ في الاعتبار المواقع المغطاة في على الأقل تكرار واحد لكل حالة. تم حساب نسبة الميثيل عند كل CpG باستخدام وظيفة percMethylation.
الإحصائيات وإمكانية التكرار
تم رسم البيانات وتحليلها باستخدام GraphPad Prism v. 9 (GraphPad Software). عند الإشارة في أساطير الشكل، تم تقييم الأهمية الإحصائية باستخدام GraphPad Prism v. 9 (GraphPad Software) وتطبيق الاختبارات الموصوفة. تم إجراء جميع التجارب في المختبر مع تكرارات تقنية () والعدد الدقيق للتكرارات موضح في الأسطورة المعنية. تم تصميم التجارب الحية بما في ذلك عدة فئران (). العدد الدقيق للفئران المعالجة في أي مجموعة تجريبية لأي تجربة موضح في أسطورة الشكل.
ملخص التقرير
مزيد من المعلومات حول تصميم البحث متاحة في ملخص تقرير Nature Portfolio المرتبط بهذه المقالة.
توفر البيانات
جميع البيانات متاحة في المقالة أو في المعلومات التكميلية لها. تم إيداع بيانات RNA-seq و WGMS و BS-seq المستهدف وتسلسل الأمبليكون المستهدف في قاعدة بيانات جين إكسبريشن أومنيبوس (GEO) (رقم الوصول: GSE226209). تم تحليل بيانات RNA-seq و WGMS وتسلسل الاستهداف باستخدام الجينوم المرجعي للفأر GRCm38 وتوضيح Gencode M25 (https:// www.gencodegenes.org/mouse/release_M25.htmlتم توفير بيانات المصدر مع هذه الورقة. 39. تشين، ب. وآخرون. التصوير الديناميكي لمواقع الجينوم في خلايا الإنسان الحية بواسطة نظام CRISPR/Cas المحسن. خلية 155، 1479-1491 (2013). 40. لابون، ك. وآخرون. CHOPCHOP v3: توسيع مجموعة أدوات CRISPR لتتجاوز تحرير الجينوم. أبحاث الأحماض النووية. 47، W171-W174 (2019). 41. فين، ج. د. وآخرون. إدارة واحدة من جزيئات الدهون CRISPR/Cas9 تحقق تحرير الجينوم في الجسم الحي بشكل قوي ومستمر. تقرير الخلية. 22، 2227-2235 (2018). 42. لومباردو، أ. وآخرون. تحرير الجينات في خلايا جذعية بشرية باستخدام نوكليازات الأصابع الزنك وتوصيل ناقلات فيروسية لنتيجة غير فعالة. نات. بيولوجيا التكنولوجيا. 25، 1298-1306 (2007). 43. دوبين، أ. وآخرون. ستار: محاذي تسلسل RNA عالمي فائق السرعة. المعلوماتية الحيوية 29، 15-21 (2013). 44. لياو، ي.، سميث، ج. ك. وشي، و. FeatureCounts: برنامج عام فعال لتعيين قراءات التسلسل إلى الميزات الجينومية. المعلوماتية الحيوية 30، 923-930 (2014). 45. ليك، ج. ت.، جونسون، و. إ.، باركر، هـ. س.، جاف، أ. إ. & ستوري، ج. د. حزمة SVA لإزالة تأثيرات الدفعة وغيرها من التغيرات غير المرغوب فيها في التجارب عالية الإنتاجية. المعلوماتية الحيوية 28، 882-883 (2012). 46. لوف، م. آي.، هوبر، و. & أندرس، س. تقدير معتدل لتغير الطي والتشتت لبيانات RNA-seq باستخدام DESeq2. جينوم بيو. 15، 550 (2014). 47. هانسن، ك. د.، لانغ ميد، ب. وإيريزاري، ر. أ. بي سموذ: من قراءات تسلسل الجينوم الكامل باستخدام البيسولفايت إلى المناطق الميثيلية المختلفة. جينوم بيو. 13، R83 (2012). 48. فنغ، هـ.، كونيلي، ك. ن. وو، هـ. نموذج هرمي بايزي لاكتشاف المواقع الميثيلية المختلفة من بيانات تسلسل بدقة نوكليوتيد واحد. أبحاث الأحماض النووية 42، e69 (2014). 49. زو، ل. ج. وآخرون. ChIPpeakAnno: حزمة Bioconductor لتوضيح بيانات ChIP-seq وChIP-chip. BMC Bioinformatics. 11، 237 (2010). 50. بونينغهوف، ر. وآخرون. تأثير طرق استئصال الكبد المختلفة على تلف الكبد وعوامل التجديد VEGF و FGF-2 في الفئران. ج. جراحة كندية. 55، 389-393 (2012). 51. كليمنت، ك. وآخرون. CRISPResso2 يوفر تحليل دقيق وسريع لتحرير الجينوم. نات. بيوتكنولوجي. 37، 220-224 (2019). 52. لانغ ميد، ب.، ويلكس، ج.، أنتونيسكو، ف. وشارلز، ر. توسيع أدوات محاذاة القراءة لتصل إلى مئات الخيوط على المعالجات العامة. المعلوماتية الحيوية 35، 421-432 (2019). 53. لانغ ميد، ب. وسالزبرغ، س. ل. محاذاة القراءة المتقطعة السريعة باستخدام باوتي 2. نات. ميثودز 9، 357-359 (2012). 54. بولجر، أ. م.، لوهس، م. وأوسادل، ب. تريموماتيك: أداة تقليم مرنة لبيانات تسلسل إلومينا. المعلوماتية الحيوية 30، 2114-2120 (2014). 55. ماغوتش، ت. وسالزبرغ، س. ل. فلاش: تعديل سريع لطول القراءات القصيرة لتحسين تجميع الجينوم. المعلوماتية الحيوية 27، 2957-2963 (2011). 56. كروجر، ف. وأندروز، س. ر. بيسمارك: أداة محاذاة مرنة ومحدد ميثيل للتطبيقات المتعلقة بتسلسل البيسلفيت. المعلوماتية الحيوية 27، 1571-1572 (2011). 57. أكالين، أ. وآخرون. ميثيل كيت: حزمة شاملة بلغة R لتحليل ملفات الميثيلation على مستوى الجينوم. جينوم بيولوجي. 13، R87 (2012).
الشكر والتقدير نشكر P. Capasso و A. Coglot و D. Cipria و L. Albano و A. Follenzi على الدعم الفني؛ و P. Spinelli على المناقشات والمساعدة في إدارة المشروع؛ وجميع أعضاء مختبر A.L. و Chroma Medicine على المناقشات. قام M.A.C. بإجراء هذه الدراسة كجزء من متطلبات الحصول على درجة الدكتوراه. تم رسم الأشكال التخطيطية باستخدامبايو ريندر.كوم. تم دعم هذه الدراسة من قبل مؤسسة تيليثون (TIGET-F5؛ رقم المنحة TTALFO516TT)؛ برنامج الأبحاث والابتكار التابع للاتحاد الأوروبي Horizon 2020 (UPGRADE؛ رقم اتفاقية المنحة 825825)؛ وشركة كروما ميديسن (A.L.).
مساهمات المؤلفين: التصور: م.أ.ك. و أ.ل. تنسيق البيانات: م.أ.ك.، ف.م.ب.، س.ف. و إ.م. التحليل الرسمي: م.أ.ك.، ف.م.ب.، س.ف.، ب.ك. و إ.م. الحصول على التمويل: أ.ل. التحقيق: م.أ.ك. و ف.م.ب. المنهجية: م.أ.ك.، ف.م.ب.، س.ف.، ب.ك. و س.م. إدارة المشروع: م.أ.ك.، إ.م. و أ.ل. الموارد: ف.م.ب. و أ.ل. الإشراف: أ.ل. التحقق: م.أ.ك. و أ.ل. التصور: م.أ.ك. و س.ف. الكتابة (المسودة الأصلية): م.أ.ك.، ف.م.ب. و أ.ل. الكتابة (المراجعة والتحرير): م.أ.ك.، ف.م.ب.، س.ف.، ب.ك.، س.م.، إ.م. و أ.ل.
المصالح المتنافسة A.L. هو أحد مؤسسي شركة Chroma Medicine، ويمتلك حصة فيها ويعمل كمستشار لها، وهي شركة تهدف إلى تطوير تطبيقات تعديل الجينات. A.L. وM.A.C. هما مخترعان في براءات اختراع معلقة وصادرة تتعلق بالصمت الجيني المقدم من معهد سان رافاييل العلمي ومؤسسة تيليثون، أو Chroma Medicine. المؤلفون الآخرون يعلنون عدم وجود مصالح متنافسة.
معلومات إضافية
معلومات إضافية النسخة الإلكترونية تحتوي على مواد إضافية متاحة فيhttps://doi.org/10.1038/s41586-024-07087-8. يجب توجيه المراسلات والطلبات للحصول على المواد إلى أنجيلو لومباردو. تُعرب مجلة Nature عن شكرها لألبرت جيلتش والمراجعين الآخرين المجهولين على مساهمتهم في مراجعة الأقران لهذا العمل. معلومات إعادة الطباعة والتصاريح متاحة علىhttp://www.nature.com/reprints.
الشكل 1 من البيانات الموسعة | انظر الصفحة التالية للتعليق.
مقالة
الشكل البياني الموسع 1 | الاختيار في المختبر لأكثر ETRs فعالية في كتم Pcsk9. أ، رسم تخطيطي يظهر في الأعلى منطقة محفز Pcsk9 مع جزيرة CpG المعلنة (CGI) وفي الأسفل، تكبير على CGI يظهر مواقع الهدف لجميع RNA الموجهة المفردة (sgRNAs؛ الأسهم السوداء)، TALEs (الأسهم الرمادية)، وZFPs (الأسهم الزرقاء). الأسهم المملوءة تشير إلى sgRNA/DBDs الأكثر نشاطًا المستخدمة في التجارب اللاحقة. تم إنشاؤه باستخدام BioRender.com. ب، تمثيل تخطيطي للبلازميد المستخدم للتعبير عن ETR، إما بعد نقله مباشرة إلى الخلايا أو كقالب للتخليق الحيوي في المختبر (IVT) لـ mRNA الخاص بـ ETRs. CMV: معزز/محفز فيروس السيتوميجالو. T7: محفز لإنتاج mRNA. ATG: كودون البداية؛ DBDs: مجالات ربط الحمض النووي؛ SV40 NLS: إشارة التوطين النووي لفيروس السيميان 40؛ GSGGG: ببتيد رابط غني بالجلايسين؛ ED: مجال المؤثر، إما KRAB من بروتين ZNF10، cdDNMT3A أو DNMT3L؛ WPRE: عنصر تنظيمي بعد النسخ لفيروس التهاب الكبد الخشبي؛ 64A: سلسلة من 64 أدينين؛ Spel: موقع تقييد يستخدم لتسطيح البلازميد للتخليق الحيوي في المختبر؛ BGH polyA: إشارة البولي أدينيل من جين هرمون النمو البقري. تم إنشاؤه باستخدام BioRender.com. ج، رسم نقطي يظهر نسبة Pcsk9-الخلايا السلبية على مدى 22 يومًا بعد تسليم البلازميدات التي تشفر عن ETRs المعتمدة على dCas9 والـ 8 sgRNAs المختلفة. كانت sgRNA-4 الأكثر نشاطًا بين الأدلة المختبرة (النقاط السوداء والخط المتصل) وبالتالي تم استخدامها في التجارب اللاحقة. يتم الإبلاغ عن البيانات كمتوسط ( ). د، رسم نقطي يوضح النسبة المئوية لـ -خلايا سلبية على مدى 17 يومًا بعد تسليم البلازميدات التي تشفر لـ 16 نوعًا مختلفًا من وحدات ربط الحمض النووي TALE المدمجة مع مجال KRAB. كانت هذه التجربة تهدف إلى تحديد أكثر TALEs فعالية من بين تلك التي تم اختبارها، باستخدام الصمت الإيبي KRAB لـ Pcsk9 كبديل. قراءة لفعالية DBD. كانت TALE-2 و-4 و-6 الأكثر نشاطًا من بين تلك التي تم اختبارها (النقاط السوداء والخط المتصل) وبالتالي تم استخدامها في التجارب اللاحقة. يتم الإبلاغ عن البيانات كمتوسطس.د.. e، رسم نقطي يوضح نسبة Pcsk-الخلايا السلبية على مدى 22 يومًا بعد تسليم البلازميدات التي تشفر لـ 16 نوعًا مختلفًا من ZFP DBDs المدمجة مع مجال KRAB. كان الهدف من هذه التجربة هو تحديد أكثر ZFPs فعالية من بين تلك التي تم اختبارها، باستخدام الصمت الإيبي الناتج عن KRAB لـ Pcsk9 كقراءة بديلة لكفاءة DBD. كانت ZFP-3 و-6 و-8 هي الأكثر نشاطًا من بين تلك التي تم اختبارها (نقاط زرقاء وخط موصل) وبالتالي تم استخدامها في التجارب اللاحقة. يتم الإبلاغ عن البيانات كمتوسطس.د..ف، اليسار: خرائط الحرارة التي تظهر نسبة Pcsk-الخلايا السلبية في اليوم السابع بعد تسليم تركيبات من البلازميدات التي تشفر لـ KRAB- و DNMT3L و cDNMT3A المستندة إلى ETRs التي تحتوي على TALEs. تم بناء المصفوفات عن طريق نقل إما واحدة من TALE-KRABETRs من d مع جميع التركيبات الممكنة من أفضل ثلاثة DBDs لـ TALE (وهي 3 و 6 و 8) المدمجة مع DNMT3L.محور) أو cdDNMT3A ( المحور). نظرًا لأدائها العالي، تم اختيار تركيبة الثلاثي-ETR التي تحتوي على TALE-2KRAB وTALE-6-DNMT3L وTALE-4-cDNMT3A للدراسات الإضافية. تشير كثافة اللون إلى متوسط كفاءة التكميم ( ). اليمين: تجربة مشابهة لتلك الموجودة في اليسار ولكن تم تنفيذها باستخدام أفضل ثلاثة ZFPs من e. نظرًا لأعلى نشاط له، تم اختيار تركيبة الثلاثي-ETR التي تحتوي على ZFP-8KRAB وZFP-6-DNMT3L وZFP-3-cDNMT3A للدراسات الإضافية. تشير كثافة اللون إلى متوسط كفاءة التسكين ( ). يتم الإشارة إلى أفضل تركيبات ثلاثية أداءً من TALE- و ZFP-ETRs بمربع أحمر. تحليل مسار الزمن لـ-الخلايا السلبية من الـظروف معالجة RNA في الشكل 1ب من النص الرئيسي. يتم الإبلاغ عن البيانات كمتوسطس.د.
أ
نقل المرسال النووي
ب
ج
هـ
ج
ف
H
الشكل البياني الموسع 2 | انظر الصفحة التالية للتعليق.
مقالة
الشكل البياني الموسع 2 | تقييم الخصوصية لـ ETRs المعتمدة على ZFP و dCas9. أ، رسم تخطيطي يوضح الإجراءات التجريبية لملف الخصوصية في المختبر لـ ETRs. تم إنشاؤه باستخدام BioRender.com. ب، مخططات تشتت من تحليلات RNA-seq تقارن مستويات التعبير الجيني بين ETRs غير المستهدفة (Unt. ETRs؛ اليسار) و Cas9 (الوسط) أو خلايا معالجة ZFP-ETR (اليمين). تشير النقاط البنفسجية والصفراء إلى الجينات التي تم تنظيمها بشكل كبير لأعلى ولأسفل، على التوالي؛ بينما تشير النقاط الرمادية إلى الجينات التي تعتبر غير معبرة بشكل مختلف. تم تحديد العتبات عند و تُعبر البيانات عنعدد النسخ لكل مليون (TPM) من القراءات المرسومة. ج، تحليل التعبير الجيني التفاضلي لـ 20 جينًا إما أعلى أو أسفل Pcsk9 من تحليل RNA-seq. د، خريطة حرارية لارتباط بيرسون بين النسخ المكررة لـ WGMS تم حسابها باستخدام دالة cor بعد التصفية حسب التغطية، والتطبيع، وأخذ في الاعتبار المواقع المشتركة بين جميع النسخ المكررة في كل حالة. يتم الإبلاغ عن القيم لكل نسخة مكررة (1، 2 و 3) في كل حالة. هـ، مخطط بركاني (يمين) ومخطط مبعثر (يسار) من تحليلات RNAseq تظهر التعبير الجيني التفاضلي بين العينة الضابطة و dCas9-
الخلايا المعالجة بـ ETR (تُشير النقاط الصفراء إلى الجينات التي تم تقليل تعبيرها بشكل كبير؛ بينما تُشير النقاط الرمادية إلى الجينات التي تعتبر غير معبر عنها بشكل مختلف. تم تحديد العتبات عند و لرسم النقاط، يتم التعبير عن البيانات كـعدد النسخ لكل مليون (TPM) من القراءات المرسومة. رسم بياني عمودي يوضح مستويات الميثيل CpG على مستوى الجينوم للعينات المحددة كما تم حسابها من تحليلات WGMS.التكرارات الفنية). ج، رسم مانهاتن من WGMS يظهر ملفات ميثلة CpG للعينات المحددة فيمنطقة جينومية مركزة على نقطة بدء النسخ (TSS) لجين Pcks9. تشير النقاط الفردية إلى متوسط الميثيلation لكل CpG. تم تعريف الخطوط المتصلة كمنحنى انسيابي مع 100 عقدة. h، رسم مانهاتن من WGMS يظهر الميثيلation التفاضلي لـ CpGs فيالمنطقة الجينومية المتمركزة حول موقع بدء النسخ (TSS) لجين Pcks9 بين العينات المحددة والخلايا المعالجة بشكل وهمي. تظهر النقاط الفردية التغيرات في الميثيل بين العينات المحددة في كل موقع CpG. تم تعريف الخطوط المتصلة كمنحنى ناعم مع 100 عقدة.
مقالة
الشكل 3 من البيانات الموسعة | تعديل PcsK9 في الفئران. أ، مخططات شريطية تظهر مستويات Pcsk9 الدائرة (يسار) ونسبة الأليلات المعدلة (يمين) في اليوم السابع بعد حقن تركيبات LNP المحددة المحتوية على mRNA مشفر لـ Cas9 و sgRNA تستهدف الإكسون الأول من ( لكل مجموعة). أدت العلاجات باستخدام LNP A (نسبة NP 9) و LNP-E (نسبة NP 9) إلى حدوث حالتي وفاة و حالة وفاة واحدة، على التوالي. النقاط: بيانات من فئران فردية تم تطبيعها إلى مستويات ما قبل العلاج. الأعمدة: الوسيط لكل مجموعة. ب، رسم بياني عمودي يظهر نسبة الأليلات المعدلة من Pcsk9 من أعضاء مختلفة لفئران تم علاجها باستخدام LNPD (نسبة NP 6) محاطة بـ mRNA مشفر لـ Cas9 و sgRNA تستهدف الإكسون الأول من Pcsk9. النقاط: بيانات من فئران فردية. ). الأعمدة: الوسيط لكل مجموعة. رسم بياني بالأعمدة يوضح مستويات Pcsk9 في السوبرناتانتات لخلايا الكبد الفأرية بعد نقل ثلاث جرعات مختلفة من mRNAs التي تشفر إما ZFP-ETRs أو GFP (وهمية). تم تطبيع مستويات Pcsk9 لكل تكرار ولكل مجموعة إلى المتوسط الوهمي بنفس الجرعة. يتم الإبلاغ عن بيانات التكرارات الفردية كنقاط؛ تشير الأعمدة إلى القيم المتوسطة ( يعنيس.د.). UD: غير قابل للاكتشاف. د، رسم بياني عمودي يوضح مستويات Pcsk9 في بلازما الفئران المعالجة كما هو موضح في الشكل 3أ، ب من النص الرئيسي.
تم الإبلاغ عن بيانات الفئران الفردية (النقاط) كنسب إلى متوسط الفئران المعالجة بالمركب. تشير الأعمدة إلى الوسيط لأي ظروف. يتم الإبلاغ عن البيانات كمتوسط. س.د. ( لـ ZFP-ETR-، 3 لـ Casللفئران المعالجة بالدواء الوهمي 4 وللفئران المعالجة بالسيارة). تم إجراء التحليل الإحصائي بواسطة ANOVA ثنائي الاتجاه RM واختبار المقارنات المتعددة لدونيت بين الدواء الوهمي وظروف العلاج الأخرى في أحدث نقطة زمنية للتحليل؛تم الإبلاغ عن القيم في الشكل. إذا لم يُشار إليها، فإن الفروقات لم تكن ذات دلالة إحصائية. e، مخططات الأعمدة التي تظهر مستويات LDL-C الدائرة في الفئران بعد 30 يومًا من العلاجات المحددة (لـ ZFP-ETR-، 3 لـ Cas9-، 5 لـ mock- و 4 للفئران التي تم حقنها بالمركبة). النقاط: فئران فردية. الأعمدة: المستوى الوسيط لكل مجموعة.مسار الزمن للترانسامينازات (ALT و AST) حتى اليوم 30 بعد العلاج. يتم الإبلاغ عن البيانات كمتوسط الانحراف المعياري لوحدات لكل لتر من البلازما ( لأي مجموعات). المنطقة الرمادية تشير إلى المستويات الفسيولوجية. ج، مسار الوقت لمستويات Pcsk9 الدائرة حتى اليوم 70 بعد العلاج. يتم الإبلاغ عن البيانات كمتوسط. س.د. ومقارنة بمستويات PCSK9 في الفئران المعالجة بالمركبة ( لـ ETR-، 7 لـ Casللفئران التي تم حقنها بالدواء الوهمي 15.
الشكل 4 من البيانات الموسعة | توصيف في المختبر لتخصص EvoETRs. مخططات البركان من تحليلات RNA-seq تظهر التعبير الجيني المختلف بين العينات المعالجة بـ ETR والخلايا غير المعالجة. ). تشير النقاط البنفسجية والصفراء إلى الجينات التي تم رفعها بشكل كبير و تم تنظيمها بشكل منخفض، على التوالي؛ تشير النقاط الرمادية إلى الجينات التي تعتبر غير معبر عنها بشكل مختلف. تم تحديد العتبات عند و وتم الإشارة إليها في الرسوم البيانية كخطوط متقطعة.
مقالة
ب
ج
D
الشكل 5 من البيانات الموسعة | الفعالية، توزيع الأحياء السكانية وسمية الكبد لـ توصيل ETRs بواسطة LNP. أ، تحليل زمني لمستويات البلازما من ALT وAST وLDH بعد توصيل LNP لـ mRNAs التي تشفر إما Cas9 أو ZFP-ETRs أو EvoETR-8. يتم الإبلاغ عن البيانات كمتوسط س.د. ( ). ب، قياس الألبومين المتداول في آخر نقطة زمنية تم تحليلها. يتم الإبلاغ عن البيانات كقيم فردية (نقاط) ووسيطات (خطوط). اليسار: التجربة في الشكل 3ب، 330 يومًا بعد الحقن؛ الوسط: التجربة في الشكل الإضافي 3ج،
70 يومًا بعد الحقن؛ اليمين: تجربة في الشكل 5ب، 43 يومًا بعد الحقن. ج، مسار الزمن لمستويات Pcsk9 المتداولة حتى اليوم 44 بعد حقن GenVoy-LNPs التي تحتوي على mRNA لـ EvoETR-8. يتم الإبلاغ عن البيانات كمتوسط س.د. ومقارنة بمستويات PCSK9 في الفئران المعالجة بالمركبة ( لـ EvoETR-8- و 2 للفئران المعالجة بالسيارة). د، مخططات نقطية تظهر نسبة ميثلة CpG عند محفز Pcsk9 في الأعضاء المحددة من الفئران المعالجة بـ EvoETR-8- و المعالجة بالسيارة. كل نقطة تمثل CpG واحد (متوسط لـ ).
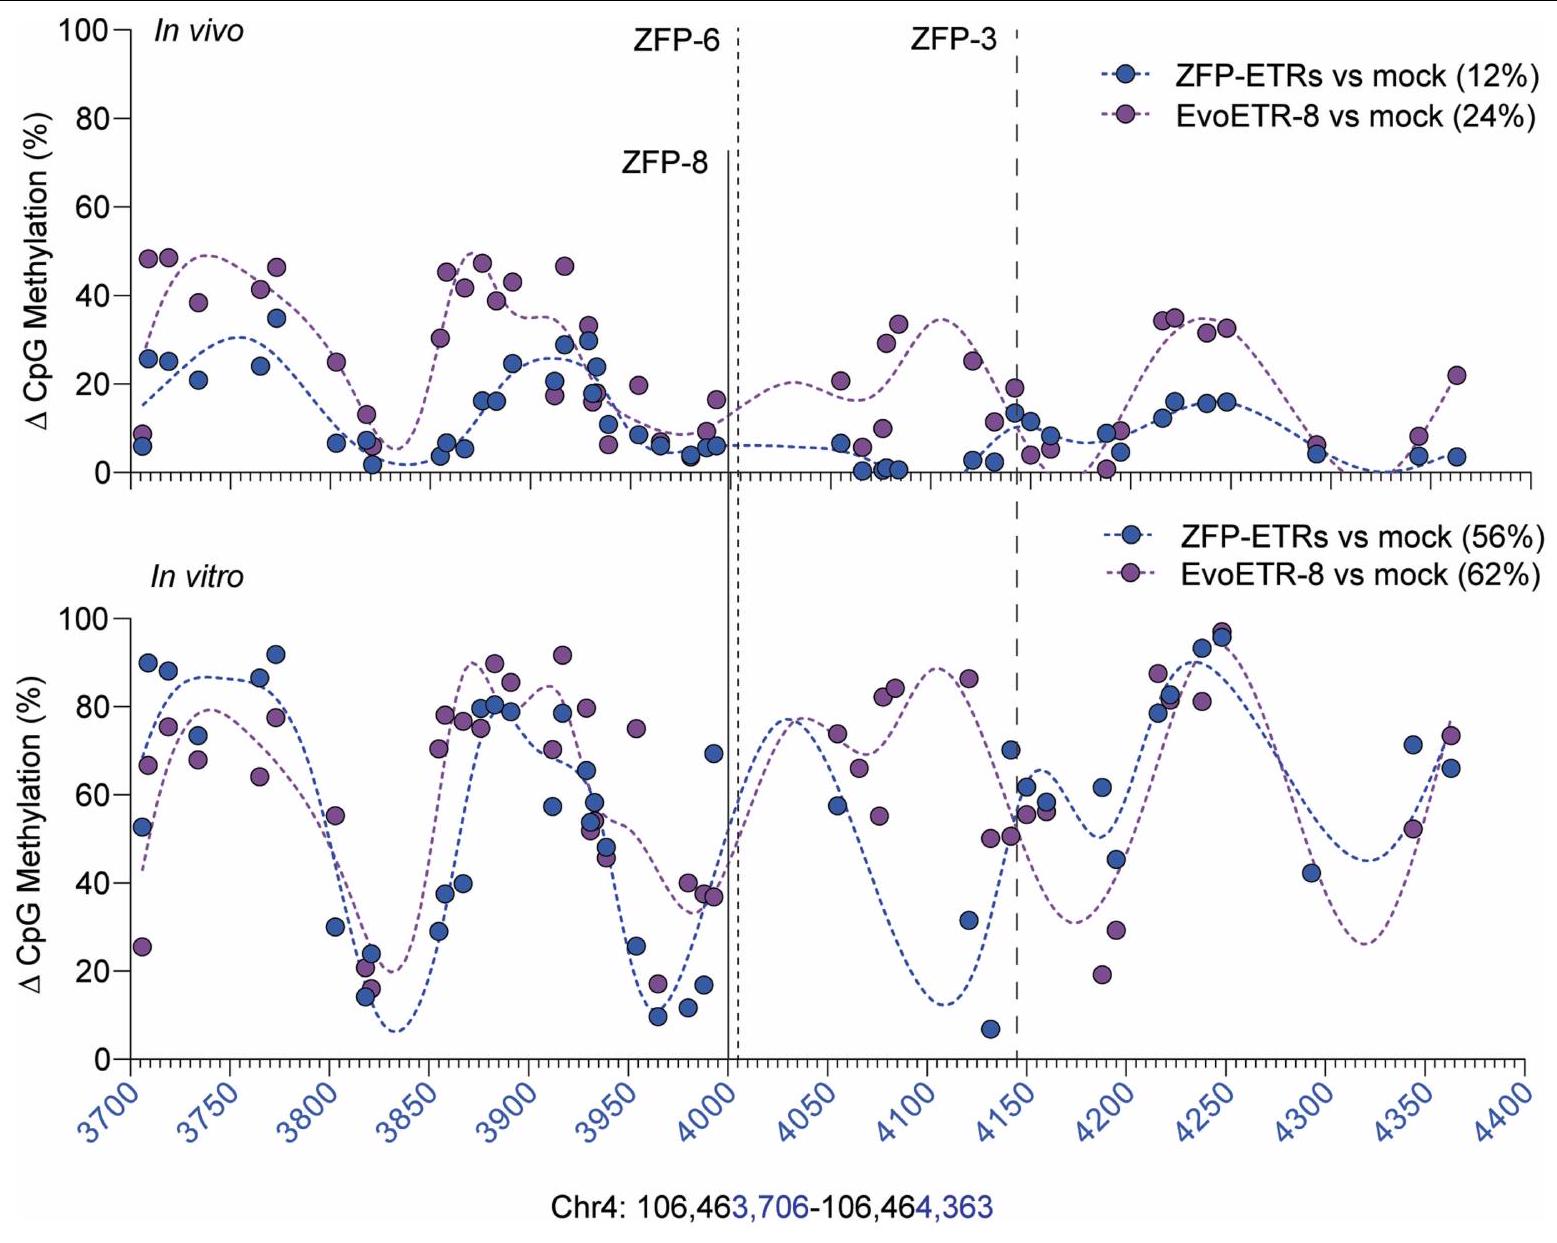
الشكل البياني الموسعملفات الميثيلفي الجسم الحي وفي المختبر. تمثيلات نقطية توضح الفرق في الميثلة بين العينات المعالجة بـ ZFP-ETR أو EvoETR8 مقابل الشهادات غير المعالجة. تشير النقاط الفردية إلى متوسط الفرق في الميثلة لكل CpG في المنطقة الجينومية Chr.4: تم تعريف الخطوط المتصلة على أنها منحنى ناعم
بسرعة 20 عقدة. يتم الإبلاغ عن متوسط الميثلة دلتا عبر النوافذ الكاملة لكل عينة بين قوسين. الأعلى: إعادة رسم بيانات BS-seq المستهدفة من الشكل 5e. الأسفل: إعادة رسم تحليل WGMS من الشكل 4e، f (لـ EvoETR-8) والشكل 2d لـ ZFP-ETRs. يتم الإشارة إلى مواقع مواقع ارتباط ZFP كخطوط مستمرة (ZFP-8) أو خطوط متقطعة (ZFP-6 و ZFP-3).
مقالة
DMR-3 + -4 + -5
دي إم آر -11
دي إم آر -14
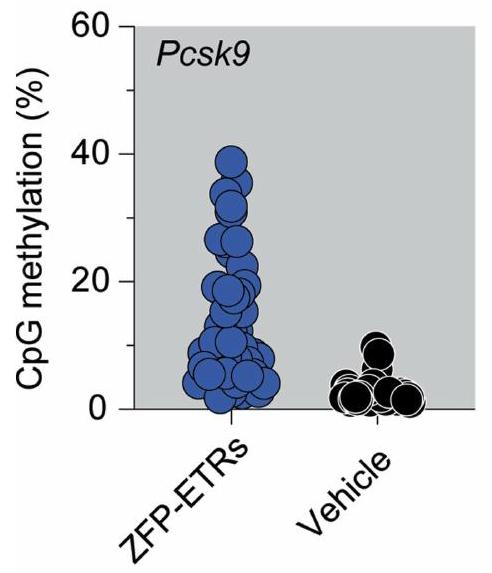
الشكل البياني الممتد 7 | ملف الميثلة في الجسم الحي لأعلى ثلاثة مواقع DMR تم تحديدها في المختبر من مقارنة ZFP-ETRs مع الشاهد. تمثل الرسوم النقطية النسبة المئوية للميثلة في الجسم الحي بدقة CpG مفردة في الفئران المعالجة بـ ZFP-ETR والمركبة. تم استجواب موقعين جينوميين يتوافقان مع أعلى موقعين DMR تم تحديدهما في المختبر من
مقارنة ZFP-ETRs مقابل الشاهد. تم تحديد DMR-3 و -4 و -5 في المختبر على أنها مرتبطة بمنطقة محفز Pcsk9. تم قياس مستويات الميثيل في الجسم الحي لهذه DMRs، مما أنتج تفاعل بوليميراز السلسلة (PCR) واحد يشمل جميع الثلاثة DMRs. كل نقطة تمثل CpG واحد في DMRs المحددة (متوسط لـلكل مجموعة تجريبية).
محفظة الطبيعة
المؤلف (المؤلفون) المراسلون: أنجيلو لومباردو، دكتوراه آخر تحديث من المؤلف(ين): 22 ديسمبر 2023
ملخص التقرير
تسعى Nature Portfolio إلى تحسين إمكانية تكرار العمل الذي ننشره. يوفر هذا النموذج هيكلًا للاتساق والشفافية في التقرير. لمزيد من المعلومات حول سياسات Nature Portfolio، يرجى الاطلاع على سياسات التحرير وقائمة مراجعة سياسة التحرير.
الإحصائيات
لجميع التحليلات الإحصائية، تأكد من أن العناصر التالية موجودة في أسطورة الشكل، أسطورة الجدول، النص الرئيسي، أو قسم الطرق.
مؤكد حجم العينة بالضبط ( لكل مجموعة/شرط تجريبي، معطاة كرقم منفصل ووحدة قياس
بيان حول ما إذا كانت القياسات قد أُخذت من عينات متميزة أو ما إذا كانت نفس العينة قد تم قياسها عدة مرات
اختبار(ات) الإحصاء المستخدمة وما إذا كانت أحادية الجانب أو ثنائية الجانب يجب أن تُوصف الاختبارات الشائعة فقط بالاسم؛ واصفًا التقنيات الأكثر تعقيدًا في قسم الطرق. وصف لجميع المتغيرات المرافقة التي تم اختبارها
وصف لأي افتراضات أو تصحيحات، مثل اختبارات الطبيعية والتعديل للمقارنات المتعددة
وصف كامل للمعلمات الإحصائية بما في ذلك الاتجاه المركزي (مثل المتوسطات) أو تقديرات أساسية أخرى (مثل معامل الانحدار) و التباين (مثل الانحراف المعياري) أو تقديرات مرتبطة بعدم اليقين (مثل فترات الثقة)
لاختبار الفرضية الصفرية، فإن إحصائية الاختبار (على سبيل المثال، ) مع فترات الثقة، أحجام التأثير، درجات الحرية وقيمة ملحوظة أعطِالقيم كقيم دقيقة كلما كان ذلك مناسبًا.
لتحليل بايزي، معلومات حول اختيار القيم الأولية وإعدادات سلسلة ماركوف مونت كارلو
بالنسبة للتصاميم الهرمية والمعقدة، تحديد المستوى المناسب للاختبارات والتقارير الكاملة عن النتائج تقديرات أحجام التأثير (مثل حجم تأثير كوهين)بيرسون )، مما يشير إلى كيفية حسابها تحتوي مجموعتنا على الإنترنت حول الإحصائيات لعلماء الأحياء على مقالات تتناول العديد من النقاط المذكورة أعلاه.
البرمجيات والشيفرة
معلومات السياسة حول توفر كود الكمبيوتر جمع البيانات برنامج CytExpert الإصدار 2.4 (بيكمان كولتر); برنامج التحكم MiSeq الإصدار 2.6 (إيلومينا); برنامج التحكم NovaSeq الإصدار 1.7 (إيلومينا); برنامج التحكم HiSeq الإصدار 3.4 (إيلومينا). تحليل البيانات
جنس GRCm38 المرجعي للفأر وتوضيح Gencode v M25 (https://www.gencodegenes.org/mouse/release_M25.html);
حزمة R sva الإصدار 3.38.0؛
حزمة R DESeq2 الإصدار 1.30.0؛
حزمة R bsseq الإصدار 1.26.0؛
حزمة R DSS v2.44.0؛
حزمة R ChIPpeakAnno v3.24.2;
GraphPad Prism v9 (برنامج GraphPad);
باوتاي 2 الإصدار 2.2.5؛
BBMap v39.01 (sourceforge.net/projects/bbmap/); تريموماتيك v0.39 (http://www.usadellab.org/cms/?page=trimmomatic); كريسبرسو 2 الإصدار 2.2.8؛ فلاش v1.2.11. بالنسبة للمخطوطات التي تستخدم خوارزميات أو برامج مخصصة تكون مركزية في البحث ولكن لم يتم وصفها بعد في الأدبيات المنشورة، يجب أن تكون البرمجيات متاحة للمحررين والمراجعين. نحن نشجع بشدة على إيداع الشيفرة في مستودع مجتمعي (مثل GitHub). راجع إرشادات مجموعة Nature لتقديم الشيفرة والبرمجيات لمزيد من المعلومات.
بيانات
معلومات السياسة حول توفر البيانات يجب أن تتضمن جميع المخطوطات بيانًا عن توفر البيانات. يجب أن يوفر هذا البيان المعلومات التالية، حيثما ينطبق:
رموز الانضمام، معرفات فريدة، أو روابط ويب لمجموعات البيانات المتاحة للجمهور
وصف لأي قيود على توفر البيانات
بالنسبة لمجموعات البيانات السريرية أو بيانات الطرف الثالث، يرجى التأكد من أن البيان يتماشى مع سياستنا
جميع البيانات متاحة في النص الرئيسي، البيانات الموسعة، أو المواد التكميلية. تم إيداع بيانات RNA-seq و WGMS وتسلسل البيسلفيت المستهدف في قاعدة بيانات جين إكسبريشن أومنيبوس (GEO) (رقم الوصول: GSE226209). تم تحليل بيانات RNA-seq و WGMS وتسلسل الأمبليكون المستهدف باستخدام الجينوم المرجعي الفأري GRCm38 وتوضيح Gencode v M25.https://www.gencodegenes.org/mouse/release_M25.html).
البحث الذي يتضمن مشاركين بشريين، بياناتهم، أو مواد بيولوجية
معلومات السياسة حول الدراسات التي تشمل مشاركين بشريين أو بيانات بشرية. انظر أيضًا معلومات السياسة حول الجنس، الهوية/التقديم الجنسي، والتوجه الجنسي والعرق، والاثنية والعنصرية.
التقارير عن الجنس والنوع الاجتماعي
غير قابل للتطبيق على هذه الدراسة
التقارير عن العرق أو الإثنية أو غيرها من التجمعات الاجتماعية ذات الصلة
غير قابل للتطبيق على هذه الدراسة
خصائص السكان
غير قابل للتطبيق على هذه الدراسة
التوظيف
غير قابل للتطبيق على هذه الدراسة
رقابة الأخلاقيات
غير قابل للتطبيق على هذه الدراسة
يرجى ملاحظة أنه يجب أيضًا تقديم معلومات كاملة حول الموافقة على بروتوكول الدراسة في المخطوطة.
التقارير المتخصصة في المجال
يرجى اختيار الخيار أدناه الذي يناسب بحثك بشكل أفضل. إذا لم تكن متأكدًا، اقرأ الأقسام المناسبة قبل اتخاذ قرارك. علوم الحياة العلوم السلوكية والاجتماعية العلوم البيئية والتطورية والبيئية لنسخة مرجعية من الوثيقة بجميع الأقسام، انظرnature.com/documents/nr-reporting-summary-flat.pdf
تصميم دراسة العلوم الحياتية
يجب على جميع الدراسات الإفصاح عن هذه النقاط حتى عندما يكون الإفصاح سلبياً.
حجم العينة
لم يتم إجراء حساب حجم العينة بشكل محدد. ومع ذلك، بالنسبة للدراسات الحية، قمنا بتخصيص من ثلاثة إلى سبعة حيوانات لكل مجموعة تجريبية بشكل تجريبي، لتحقيق القابلية المطلوبة للتكرار. ومن الجدير بالذكر هنا أن تجارب مختلفة بما في ذلك الظروف المتماثلة أنتجت نتائج متسقة، مما يدعم الفرضية بأن أحجام العينات كانت مناسبة بشكل عام.
استثناءات البيانات
لم يتم استبعاد أي بيانات من التحليلات.
التكرار
تم إجراء جميع التجارب في المختبر مع نسخ فنية. ) والعدد الدقيق للتكرارات موضح في الأساطير المعنية. تم تصميم التجارب الحية لتشمل عدة فئران ( يتم الإبلاغ عن العدد الدقيق للحيوانات المعالجة في أي مجموعة تجريبية لأي تجربة في أساطير الشكل. ومن الجدير بالذكر هنا أنه على الرغم من أننا لم نقم بإجراء تكرار تجريبي متطابق ومستقل، إلا أننا أجرينا تجارب متعددة باستخدام جرعات و/أو طرق توصيل مختلفة لنفس المحررين، مما يؤكد قابلية تكرار جميع النتائج المدرجة في هذا العمل.
التوزيع العشوائي
عند الوصول إلى بيت الحيوانات، تم تخصيص الفئران عشوائيًا إلى أقفاص مختلفة. علاوة على ذلك، بعد إعطاء LNPs، تم وضع الفئران من مجموعات تجريبية مختلفة في نفس الأقفاص لتقليل العوامل المربكة المحتملة.
عمى
لم يتم اعتماد استراتيجيات عمياء محددة في هذه الدراسة. ومع ذلك، تم تصنيف الفئران المعالجة وغير المعالجة باستخدام أرقام متسلسلة. أخيرًا، قام المشغلون بإعادة التحقق من العلاقة بين التصنيف والعلاجات بمجرد الانتهاء من تحليل البيانات. تم اعتماد استراتيجية مماثلة للدراسات في المختبر. علاوة على ذلك، غالبًا ما كانت جمع العينات ومعالجة البيانات وتحليلها تتم بواسطة مشغلين مختلفين، وبالتالي
التقارير عن مواد وأنظمة وطرق محددة
نحتاج إلى معلومات من المؤلفين حول بعض أنواع المواد والأنظمة التجريبية والأساليب المستخدمة في العديد من الدراسات. هنا، يرجى الإشارة إلى ما إذا كانت كل مادة أو نظام أو طريقة مدرجة ذات صلة بدراستك. إذا لم تكن متأكدًا مما إذا كان عنصر القائمة ينطبق على بحثك، يرجى قراءة القسم المناسب قبل اختيار رد.
المواد والأنظمة التجريبية
طرق
غير متوفر
مشارك في الدراسة
غير متوفر
مشارك في الدراسة
الأجسام المضادة
علم الحفريات وعلم الآثار
خطوط خلايا حقيقية النواة
معلومات السياسة حول خطوط الخلايا والجنس والنوع في البحث
مصدر(s) خط الخلايا
المصادقة
تلوث الميكوبلازما
الخطوط التي يتم التعرف عليها بشكل خاطئ بشكل شائع (انظر سجل ICLAC)
تم شراء Hepa 1-6 (CRL-1830) من ATCC؛ وتم شراء خلايا كبدية أولية من ذكور فئران C57BL/6 من Biopredic International.
تم شراء خلايا الكبد البشرية Hepa 1-6 وخلايا الكبد الفأرية الأولية واستخدامها فور وصولها. لم يتم إجراء أي مصادقات.
تم استخدام خط خلايا هيبا 1-6 ومشتقاته، بالإضافة إلى الخلايا الكبدية الأولية من الفئران، بعد اختبارها سلبياً لوجود تلوث بالميكوبلازما.
لم يتم استخدام أي خطوط تم تحديدها بشكل خاطئ في هذه الدراسة.
الحيوانات وغيرها من الكائنات البحثية
معلومات السياسة حول الدراسات التي تشمل الحيوانات؛ إرشادات ARRIVE الموصى بها للإبلاغ عن أبحاث الحيوانات، والجنس والنوع في البحث
الحيوانات المخبرية
تم شراء إناث الفئران من سلالة C57BL/6N التي تبلغ من العمر ثمانية أسابيع من مختبرات تشارلز ريفر (كالكو، إيطاليا)
الحيوانات البرية
لم يتم استخدام حيوانات برية في هذه الدراسة.
التقارير عن الجنس
لم يتم اعتبار الجنس في تصميم الدراسة.
عينات تم جمعها من الميدان
لم تتضمن الدراسة عينات تم جمعها من الميدان.
رقابة الأخلاقيات
الإجراءات المتعلقة بالتعامل مع الحيوانات ورعايتها اتبعت القوانين والسياسات الوطنية والدولية وتمت الموافقة عليها من قبل لجنة رعاية واستخدام الحيوانات المؤسسية (أرقام التفويض 604/2020-PR و 233/2022-PR، المقدمة من وزارة الصحة الإيطالية).
يرجى ملاحظة أنه يجب أيضًا تقديم معلومات كاملة حول الموافقة على بروتوكول الدراسة في المخطوطة.
النباتات
مخزونات البذور
غير قابل للتطبيق على هذه الدراسة
أنماط جينية نباتية جديدة
غير قابل للتطبيق على هذه الدراسة
المصادقة
غير قابل للتطبيق على هذه الدراسة
تدفق الخلايا
المؤامرات
أكد أن:
توضح تسميات المحاور العلامة والفلوكروم المستخدم (مثل CD4-FITC). المقاييس على المحاور واضحة تمامًا. قم بتضمين الأرقام على المحاور فقط للرسم البياني في الأسفل الأيسر من المجموعة (المجموعة هي تحليل للعلامات المتطابقة). جميع الرسوم البيانية هي رسوم بيانية متساوية الارتفاع مع نقاط شاذة أو رسوم بيانية بالألوان الزائفة. تم توفير قيمة عددية لعدد الخلايا أو النسبة المئوية (مع الإحصائيات).
المنهجية
تحضير العينة
تم فصل خلايا هيبا 1-6 باستخدام التربسين، وتم حجبها في وسط كامل، ثم تم الطرد المركزي وإعادة تعليقها في محلول PBS.
آلة
سايتو فليكس إس (بيكمان كولتر) وفاكس أريافرز خلايا الاندماج (بي دي بيوساينس).
برمجيات
تم إجراء تحليل تدفق الخلايا باستخدام CytoFLEX S (بيكمان كولتر) وتم تحليل البيانات الخام باستخدام FCS Express (DeNovo Software).
وفرة تجمع الخلايا
الخلايا المفروزة: >100.000 خلية؛ النقاء >95% حسب تحليل CytoFLEX S.
استراتيجية البوابة
تم استبعاد تجمعات الخلايا والحطام عن طريق تحديد الخلايا على القطر في مخطط FSC-H/FSC-A. ثم تم تعريف الخلايا القابلة للحياة على أنها مجموعة ذات FSC مرتفع وSSC منخفض. تم استخدام نوع البرية Hepa 1-6 لتحديد الحدود للخلايا السلبية لـ tdTomato.
قم بتحديد هذا المربع لتأكيد أنه تم تقديم رقم يوضح استراتيجية البوابة في المعلومات التكميلية.
الشكل البياني الممتد 3 | انظر الصفحة التالية للتعليق.
Martino Alfredo Cappelluti’, Valeria Mollica Poeta , Sara Valsoni’, Piergiuseppe Quarato’, Simone Merlin , Ivan Merelli & Angelo Lombardo
Abstract
Permanent epigenetic silencing using programmable editors equipped with transcriptional repressors holds great promise for the treatment of human diseases . However, to unlock its full therapeutic potential, an experimental confirmation of durable epigenetic silencing after the delivery of transient delivery of editors in vivo is needed. To this end, here we targeted , a gene expressed in hepatocytes that is involved in cholesterol homeostasis. In vitro screening of different editor designs indicated that zinc-finger proteins were the best-performing DNA-binding platform for efficient silencing of mouse Pcsk9. A single administration of lipid nanoparticles loaded with the editors’ mRNAs almost halved the circulating levels of PCSK9 for nearly one year in mice. Notably,Pcsk9 silencing and accompanying epigenetic repressive marks also persisted after forced liver regeneration, further corroborating the heritability of the newly installed epigenetic state. Improvements in construct design resulted in the development of an all-in-one configuration that we term evolved engineered transcriptional repressor (EvoETR). This design, which is characterized by a high specificity profile, further reduced the circulating levels of PCSK9 in mice with an efficiency comparable with that obtained through conventional gene editing, but without causing DNA breaks. Our study lays the foundation for the development of in vivo therapeutics that are based on epigenetic silencing.
Epigenome editing is emerging as a promising new strategy for silencing genes without altering their primary DNA sequence . In this context, designer editors containing an effector domain (ED) derived from naturally occurring transcriptional repressors are targeted to a pre-selected genomic site by a programmable DNA-binding domain (DBD), such as a catalytically deactivated Cas9 (dCas9) , transcription activator-like effectors (TALEs) or zinc-finger proteins (ZFPs) . Among the different EDs, those belonging to the Krüppel-associated box (KRAB) family of transcriptional repressors are of particular interest for epigenetic silencing (epi-silencing). KRAB-based editors can induce robust waves of gene repression across different cell types both in vitro and in vivo through a well-conserved mechanism of recruitment of histone-modifying enzymes, and this makes them attractive tools for clinical testing . In somatic cells, however, KRAB-associated histone marks are labile unless continuously deposed by a chromatin-bound repressor . Thus, to support prolonged target-gene repression, KRAB-based editors need to be stably expressed in a cell, a task that is usually accomplished by delivering the editors through viral-derived vectors . This approach poses safety concerns for clinical translation, as inserting vectors into the host genome can lead to mutagenesis whereas prolonged expression of editors could promote their off-targeting activity, as previously shown for CRISPR-Cas9. These issues can be solved by adopting combinations of EDs that synergistically act on multiple epigenetic repressive pathways . To this end, we previously took advantage of key EDs from a
repressive complex that permanently silences endogenous retroviruses throughout development and adult life : KRAB, the catalytic domain of the de novo DNA-methyltransferase A (cdDNMT3A) and its inactive cofactor DNMT3-like (DNMT3L). Transient delivery of the corresponding combination of editors, termed engineered transcriptional repressors (ETRs), was associated with efficient, durable and specific epi-silencing of endogenous genes in cell lines and in human primary T cells . Epi-silencing operates on the promoter-enhancer region of the ETR-targeted gene through the concerted removal and deposition of activating and repressive histone marks, respectively. It is also accompanied by a local increase in the levels of DNA methylation at CpG dinucleotides, a repressive epigenetic mark that can be inherited throughout cell mitosis by the activity of the endogenous methyltransferase DNMT1. This latter process is at the basis of the durability of epi-silencing, making ETR expression necessary in the initial phases of gene repression and then dispensable for its long-term propagation. Studies have confirmed these findings using all-in-one editors containing, in a single molecule, the above-mentioned EDs and a DBD . Moreover, it was shown that the vast majority of protein-coding genes are responsive to epi-silencing, a key step towards the clinical application of the epi-silencing technology . However, whether transient ETR expression can install long-lasting gene silencing in vivo remains unknown. Here we tackled this question by targeting the mouse Pcsk9 gene, the protein product of which controls circulating levels of cholesterol by promoting the degradation of the low-density lipoprotein
Fig. 1 | In vitro screen in Hepa 1-6 Pcsk cells identifies ZFP-based ETRs as the most effective platform for epi-silencing of PcsK9. a, Top left, diagram of the experimental procedure used to compare the efficiency of different ETR platforms in the Hepa1-6 Pcsk9 cell line. mRNA nucleofection was used to deliver the ETRs into the cells. As an editing control, cells were co-transfected with mRNA encoding for Cas9 and agRNA targeting the first exon of Pcsk9. Top right, schematic representation of the Hepa 1-6Pcsk9 cell line, in which a TAV2A-tdTomato cassette was targeted in-frame into the last exon of Pcsk9. TAV2A denotes a self-cleaving peptide derived from the Thosea asigna virus. Bottom right, schematic of the different ETR platforms showing their relative binding to the CGI of Pcsk9 encompassing its promoter region. Double-headed arrows indicate dynamic binding of the different ETRs to their
genomic target sites. The dCas9-based ETRs bind to the same target site, which is dictated by sgRNA- 4 . Bottom left, key for the pictograms used in the top left diagram. Created with BioRender.com.b, Dot plot analysis showing the percentage of Pcsk -negative cells at day 13 after the delivery of ascending doses of mRNAs encoding dCas9-, TALE- and ZFP-based ETRs, and Cas9. Data are mean s.d. . The half-maximum effective concentration ( ) for each editing platform is indicated, as calculated by fitting a four-parameter logistic model ( for all treatments). c, Representative flow cytometry dot plots of Hepa 1-6 and Hepa 1-6 Pcsk cells, the latter analysed at day 29 after RNA nucleofection of the indicated constructs. Data are from Extended Data Fig.1g. SSC-A, side scatter area.
(LDL) receptor on the plasma membrane of hepatocytes in the liver . For this reason, inactivation of the gene and its product are under intense investigation for the treatment of genetic and acquired hypercholesterolaemia .
In vitro selection of Pcsk9 ETRs
To rapidly select for ETR architectures against Pcsk9, we developed an engineered mouse hepatoma cell line that reports for the transcriptional activity of this gene at the single-cell level (hereafter Hepa 1-6Pcsk cells; Fig. 1a). Using this line, we separately tested and nominated the most effective triple-ETR combination for each of the following programmable DBD platforms targeting the CpG island (CGI) encompassing the promoter region of Pcsk9: dCas9, TALEs and ZFPs (Fig. 1a and Extended Data Fig. 1a,b). Specifically, for dCas9-based ETRs, we individually transfected eight single guide RNAs (sgRNAs) together with a previously described triple-ETR combination in Hepa1-6Pcsk9 cells and selected , the one inducing the highest levels of Pcsk9 repression (Extended Data Fig. 1a,c). For TALE-based ETRs, we followed a sequential approach. First, we fused the KRAB domain to 16 TALEs and identified the top 3 performing ones by measuring Pcsk9inhibition at the peak of transient KRAB activity (Extended Data Fig. 1a,d). Then we built ETRs containing KRAB, cdDNMT3A or DNMT3L for each of the selected arrays and delivered all possible permutations of these ETRs as triple combinations in Hepa1-6Pcsk9 cells. Using efficiency of Pcsk9 repression as readout, we finally selected TALE-2, TALE-4 and TALE-6 fused to KRAB, cdDNMT3A and DNMT3L, respectively (Extended Data Fig. 1f). A similar selection strategy was used for ZFP-based ETRs,
resulting in ZFP-3, ZFP-6 and ZFP-8 fused to cdDNMT3A, DNMT3L and KRAB, respectively (Extended Data Fig. 1a,e,f). On the basis of these data, we conducted a dose-response experiment in the Hepa 1-6Pcsk cells by transfecting the RNAs of the selected dCas9-, TALE- and ZFP-based triple-ETR combinations (Fig. 1b). These studies revealed notable pharmacodynamic differences among the three ETR platforms. Specifically, ZFP-based ETRs were 5.7 times and 2.8 times more potent than were dCas9- and TALE-based architectures, respectively, in silencing Pcsk9 (Fig. 1b). In terms of maximal efficacy, however, both ZFP- and dCas9-based ETRs outperformed TALE-based architectures, reaching at least 80% of Pcsk9 silencing (Fig.1b). These latter values were comparable with-if not higher than-those observed after genetic inactivation of Pcsk9 using matched amounts of RNA encoding for catalytically active CRISPR-Cas9. Gene disruption and epi-silencing of Pcsk9 proved to be stable until day 28, the last time point analysed (Fig. 1c and Extended Data Fig. 1g). On the basis of these results, we selected the aforementioned ZFP-based ETRs for our subsequent studies.
Specificity profile of ETRs
We then assessed the specificity profile of the ZFP-ETRs by transcriptomic and DNA methylation analyses of ETR-treated Hepa 1-6 Pcsk cells using RNA sequencing (RNA-seq) and whole-genome methylation sequencing (WGMS) (Extended Data Fig. 2a), respectively. Cells transfected with mRNAs encoding for eGFP (hereafter, mock) or for Pcsk9-targeted CRISPR-Cas9 were used to control for effects related to treatment and/or inactivation. In addition, cells were transfected with a triple-ETR combination equipped with a ZFP array
Fig. 2 | Target-specific transcriptional downregulation with minimal off-target perturbations after epi-silencing of Pcsk9 by ZFP-based ETRs. a, Volcano plots from RNA-seq analyses showing differential gene expression between mock-treated cells and cells treated with untargeted ETRs (unt. ETRs; left), Cas9 (middle) or ZFP-ETRs (right) ( for each experimental condition). The Wald test for binomial distributions was applied for differential geneexpression analysis and values were corrected for multiple testing using the Benjamini-Hochberg approach. The horizontal dashed line indicates the threshold on the adjusted value (FDR ), and the vertical dashed lines correspond to the threshold on . Upregulated genes are in purple and downregulated ones are in yellow. Genes in grey are not differentially expressed according to the applied thresholds.b, Bar plot showing the genomewide levels of CpG methylation of the indicated samples as calculated from the
WGMS analyses ( for each experimental condition). c, Bar plot showing the correlation between differential methylation and variation in gene expression for the comparison of ZFP-ETRs versus mock. DMRs were associated with a given gene when falling into window around its own TSS. Plotted are genes for which the and FDR can be computed from the differential expression analysis. Black bars indicate the variation in the percentage of CpG methylation of the indicated DMRs. d, Left, Manhattan plot from the WGMS in b showing the CpG methylation profiles of the indicated samples in a genomic region centred on the TSS of Pcks9. Individual dots indicate the average methylation of each CpG . Connecting lines were defined as smoothing spline with 100 knots. Right, magnified view of a region centred on the Pcsk9CGI. The genomic region containing the ZFP-binding sites ( 3,6 and 8 ) is indicated in the graph as a grey rectangle.
targeting the eGFP sequence (hereafter, untargeted ETRs). When compared to mock-treated cells, no genes were differentially expressed in cells that were treated with untargeted ETRs, whereas both epigenetically silenced and Pcsk9-disrupted cells showed a significant reduction (around 30-fold) in the expression levels of Pcsk9 (Fig. 2a and Extended Data Fig. 2b). In contrast with Pcsk9-disrupted cells, in which no other gene was differentially expressed, treatment with ZFP-ETRs caused the deregulation of eight additional genes (four downregulated and four upregulated; Supplementary Table1), albeit at a lower magnitude than for Pcsk9. None of these genes was in the proximity of Pcsk9, and none of the 40 genes adjacent to Pcsk9 showed significant transcriptional deregulation (Extended Data Fig. 2c), indicating that epi-silencing did not spread to nearby genes. In line with the transcriptomic data, the genome-wide levels of CpG methylation were largely superimposable among samples, with a delta methylation of less than between ETR- and mock-treated cells (Fig. 2b and Extended Data Fig. 2d). These values are comparable with those previously reported for similar epi-silencing platforms . In terms of differentially methylated regions (DMRs; delta methylation ), beyond , which contained 3 of them, 18 other DMRs were found in ETR- versus mock-treated cells (Supplementary Table 2). Intersection of transcriptomic and DNA methylation analyses showed that eight out of the nine genes associated with a DMR were also downregulated (Fig. 2c and
Supplementary Table 2), with Pcsk9, Shroom1 and Arid1b under the selected threshold values ( -transformed fold change ; false discovery rate . Analysis of the Pcsk9-containing locus ( centred on the transcription start site (TSS) of the gene) at the single-CpG-resolution level confirmed de novo deposition of DNA methylation exclusively around the ETR target site (Fig. 2d and Extended Data Fig. 2h). To understand whether the observed perturbations were due to off-targeting of the EDs, we performed RNA-seq and WGMS of Hepa 1-6 Pcsk cells treated with the triple dCas9-based ETR combination targeting Pcsk9. In contrast with Pcsk9, which was robustly downregulated and whose regulatory sequences were de novo methylated in dCas9-ETR-treated cells, no other genes were significantly deregulated and no DMRs were detected (Fig. 2a,b,d and Extended Data Fig. 2e-h), consistent with the data obtained with untargeted ETRs (Fig. 2a,b,d). Overall, these data show that treatment with ZFP-based ETRs imposes limited perturbations outside of the Pcsk9 gene, and that these variations are likely to be due to mismatched binding of the ZFP arrays at potential off-target sites.
Durable epi-silencing of in vivo
In parallel with these studies, we set out to deliver the ZFP-ETRs to the liver of mice. As the ETR technology entails the use of transient
Fig. 3 | Durable epigenetic silencing of Pcsk9 in mouse liver after LNP-mediated delivery of ZFP-ETRs. a, Drawing of the experimental procedure that was used to assess the efficacy and durability of Pcsk9 editing in vivo. LNP D was loaded with mRNAs of ZFP-ETRs, Cas9 or eGFP and injected intravenously (IV). Before and after LNP injection, blood samples were collected to measure the levels of PCSK9 by ELISA. LNP doses are indicated as milligrams per kilogram. Vehicle, PBS-treated mice. Created with BioRender. com.b, Time-course analysis of circulating PCSK9 levels for up to 330 days after LNP injection. Data are mean s.d. ( for ZFP-ETR-treated, 3 for Cas9-treated, 5 for mock-treated and 4 for vehicle-injected mice). Statistical analysis by two-way repeated-measures (RM) ANOVA and Dunnett’s multiple comparisons test between vehicle and the other treatment conditions at the latest time point of analysis ( and ). If not indicated, differences were not statistically significant.c, Drawing of the experimental
procedure that was used to assess editing durability after partial hepatectomy. BS-seq, targeted bisulfite sequencing. Created with BioRender.com. d, Bar plot showing the levels of PCSK9 before and after partial hepatectomy (PH). Data for individual mice are normalized to the mean of vehicle-treated mice (dots); bars indicate the median ( for each experimental group). Statistical analysis by two-way RM ANOVA and Dunnett’s multiple comparisons test was performed among samples belonging to the same treatment (mock, ZFP-ETRs and Cas9) at different times ( and ). If not indicated, differences were not statistically significant. e, Heat map showing the average methylation at single-CpG resolution within the Pcsk9 CGI in treated (ZFP-ETRs) and control (vehicle) samples before and after the partial hepatectomy. Colour intensity refers to the percentage of CpG methylation (mean of for each experimental group). Each rectangle represents an individual CpG in the genomic region Chr. 4:106,463,706-106,464,363.
gene-delivery modalities, we performed an in vivo screen to identify lipid nanoparticles (LNPs) compatible with the transfer of editing machinery to the liver. Here, we used CRISPR-Cas9-mediated inactivation of Pcsk9 as a surrogate readout for LNP-mediated delivery of editors’ RNAs. Yet, in the Pcsk9 editing field, CRISPR-Cas9 represents a benchmark for emerging editing modalities. Among the ten LNPs tested, seven induced a robust reduction in the circulating levels of PCSK9 (more than 60%) and efficient gene editing (Extended Data Fig. 3a). Of these seven candidates, LNP D was selected for further studies, given its favourable biodistribution and toxicity profiles (Extended Data Fig. 3b). We then produced the mRNAs that encode for the three ZFP-ETRs with state-of-the-art modifications intended to maximize RNA translation and stability and minimize innate immune responses . These mRNAs were packaged into the selected LNP formulation for an initial test in cultured primary mouse hepatocytes, in which we observed a near-complete loss of PCSK9 in the cells’ supernatant (Extended Data Fig. 3c). On the basis of these results, we administered intravenously the ETR-loaded LNPs to adult C57BL/6 mice and monitored circulating levels of PCSK9 for up to 330 days, when the experiment was terminated (Fig. 3a). Mice treated with PBS (hereafter, vehicle) or injected with LNPs loaded with an eGFP mRNA (hereafter, mock) were used as controls. Early analyses of ETR-treated mice showed a rapid and profound reduction in PCSK9, which then stabilized at around of vehicle-treated levels until the last time point analysed (Extended Data Fig. 3d and Fig. 3b). In line with these data, at day 30 after LNP injection, the levels of LDL-associated cholesterol (LDL-C) were reduced in ETR-treated mice (around 35%; Extended Data Fig. 3e). Comparable efficiencies and kinetics of PCSK9 and LDL-C reduction were observed in mice that were treated with LNPs loaded with Pcsk9-targeted CRISPR-Cas9 RNAs
(Fig. 3b and Extended Data Fig. 3d,e). Treatment-related toxicities were self-contained, with transient increases in the liver enzymes alanine transaminase (ALT) and aspartate aminotransferase (AST) at levels comparable between CRISPR-Cas9- and ZFP-ETR-treated groups (Extended Data Fig. 3f). Because a previous study did not show any significant liver toxicity when using the same Pcsk9-targeting CRISPR-Cas9 components but loaded in a different LNP formulation , we concluded that the enzyme increases we observed here were probably a result of the LNP formulation used in this study. To confirm and extend our findings, we treated a second cohort of mice with ETR-loaded LNPs (Extended Data Fig. 3g) and, three months later, subjected four of them to partial hepatectomy (Fig. 3c), a surgical procedure that induces robust waves of hepatocyte proliferation to regenerate the resected liver lobules . Notably, no major differences in the circulating levels of PCSK9 were found between pre- and post-hepatectomized mice, providing further support for the stability of epi-silencing even after active cell replication (Fig. 3d). Similar results were obtained in mice in which Pcsk9 was genetically inactivated. We also compared the CpG methylation profile of the Pcsk9 gene promoter in pre-hepatectomized mice treated with ETRs or vehicle and found a net increase in DNA methylation in the former group (Fig. 3e). These levels remained stable also after partial hepatectomy (more than two months), further corroborating the durability of epigenetic silencing through liver regeneration.
Improved epi-silencing by EvoETRs
Finally, with the aim of reducing the molecular complexity of the epi-silencing platform, the application of which requires three independent mRNAs to be produced and co-delivered, we converted the
Fig. 4 | In vitro efficacy and specificity profiling of EvoETRs. a, Schematic representation of the molecular architecture of ZFP-ETRs and EvoETRs. Created with BioRender.com.b, Bar plot showing the percentage of Pcsk9-silenced cells at day 40 after the delivery of either ZFP-ETRs (blue) or EvoETRs (purple). Dots represent individual percentages; bars represent the median for each treatment ( ). c, Volcano plot from RNA-seq analyses showing differential gene expression between EvoETR-8-treated and untreated cells ( ). The Wald test for binomial distributions was applied for differential gene expression analysis and values were corrected for multiple testing using the BenjaminiHochberg approach. Dashed lines indicate the thresholds on adjusted values ( ) and fold change ( ). Downregulated genes are in yellow. Genes in grey are not differentially expressed according to the applied
thresholds.d, Bar plot showing the number of DEGs from the indicated samples versus untreated cells. These analyses were performed at three different thresholds and at . e, Bar plot showing the genome-wide levels of CpG methylation of the indicated samples as calculated from the WGMS analyses ( for mock-treated and for EvoETR-8-treated cells). , Bar plot showing the correlation between differential methylation and variation in gene expression for the comparison EvoETR-8 versus mock. DMRs were associated with a given gene when falling into window around its own TSS. Plotted are genes for which the and FDR can be computed from the differential expression analysis. Black bars indicate the variation in the average methylation levels of the DMRs.
triple-ETR combination into an all-in-one molecule (a design collectively referred to as evolved ETR; EvoETR). To this end, we appended at the N terminus of the ZFP DBD an obligate heterodimer between cdDNMT3A and DNMT3L and, at the C terminus, the KRAB domain (Fig. 4a), a design reminiscent of previously described epigenetic editors . To assess which of the three ZFP arrays used in the triple-ETR combination (ZFP-3, ZFP-6 or ZFP-8) was best-suited for an all-in-one configuration, we built EvoETRs for each of these arrays and assessed their epi-silencing efficiency in the Hepa 1-6 Pcsk cells. All constructs produced high and durable levels of silencing, which were comparable with those obtained with the triple-ETR combination (Fig. 4b). Transcriptional profiling of Pcsk9-silenced cells from all treatment conditions showed that the EvoETR equipped with ZFP-8 (hereafter, EvoETR-8) was the most specific one, and this was true across ascending fold-change thresholds (from 0.5 to ; Fig. 4c,d, Extended Data Fig. 4 and Supplementary Table 3). None of these differentially expressed genes (DEGs; up to four at ) were shared with the triple-ETR combination, in contrast with the EvoETRs equipped with ZFP-6 and ZFP-3, which shared up to ten and three DEGs-including Pcsk9-with the triple-ETR combination, respectively ( ; Fig. 4 d and Supplementary Tables 3 and 4). The genome-wide levels of CpG methylation were largely superimposable between mock- and EvoETR-8-treated cells (Fig. 4e). The latter exhibited five DMRs, three of which annotated to four genes (Fig. 4f and Supplementary Table 5), including Pcsk9, the only gene
showing significant downregulation ( ). These numbers were lower than those observed with the triple-ETR combination (Fig. 2c and Supplementary Table 2). Altogether, these data point to EvoETR-8 as the best-performing and specific reagent for Pcsk9 silencing. Furthermore, they indicate that the perturbations observed with the triple-ETR combination were at least in part due to the off-targeting of ZFP-3 and ZFP-6, both of which also showed an individual off-targeting profile.
We then delivered the mRNA of EvoETR-8 into mice by LNPs and observed a reduction of around in the circulating levels of PCSK9 until day 43 (Fig. 5a,b). Similar results were obtained after the injection of matched amounts of LNPs loaded with the Pcsk9-targeting CRISPR-Cas9 components (around 70%), whereas epi-silencing with the triple-ETR combination led to a reduction in the levels of circulating PCSK9 (Fig. 5a,b). ALT, AST and lactate dehydrogenase (LDH) were transiently increased in all LNP-treated groups (Extended Data Fig. 5a), whereas LDL-C and total cholesterol were significantly reduced in both EvoETR-8-treated mice (29 and 26%, respectively) and gene-edited mice ( 34 and , respectively; Fig. 5c,d). The levels of liver-secreted albumin were comparable among treatments (Extended Data Fig. 5b), indicating that targeted activity of the different editorsrather than treatment-related effects-was the basis of the observed reductions in PCSK9 across all in vivo experiments. For EvoETR-8, we also tested another LNP, and still obtained a significant inhibition of Pcsk9, confirming that the epi-silencing platform is transferrable to
Fig.5|Improved epi-silencing of Pcsk9 in vivo after LNP-mediated delivery of EvoETR-8. a, Schematic drawing of the experimental procedures. LNPs were loaded with mRNAs encoding ZFP-ETRs, Cas9 or EvoETR-8 and separately injected intravenously into mice. Vehicle, PBS-treated mice. Before and after LNP injection, blood samples were collected to measure the circulating levels of PCSK9 and cholesterol. Genomic DNA (gDNA) from purified hepatocytes at day 43 after injection was analysed to measure the efficiency of genetic or epigenetic editing at Pcsk9 by targeted deep sequencing (deep-seq) or BS-seq, respectively. DNA methylation levels were also quantified by targeted BS-seq of in-vitro-identified DMRs. OTs: off targets. Created with BioRender.com. b, Time course of the levels of circulating PCSK9 up to 43 days aftr LNP injection. Data are mean s.d. . Statistical analysis by two-way RM ANOVA and Dunnett’s multiple comparisons test between vehicle and the other treatment conditions at the latest time point ( and ). If not indicated, differences were not statistically significant. c, d, Dot plots showing the levels of LDL-C (c) and total cholesterol (d) in mice 30 days after the treatments ( ). Dots represent individual mice; lines represent the median for each group. Statistical analysis by two-way RM ANOVA and Dunnett’s
multiple comparisons test and for LDL-C; and #P<0.0001 for total cholesterol). If not indicated, differences were not statistically significant. e, Heat map showing the average methylation of single CpGs within the Pcsk9 CGI of treated (ZFP-ETRs and EvoETR-8) and control (vehicle) mice. Colour intensity refers to the percentage of methylation ( ). Each rectangle represents an individual CpG in the genomic region Chr. 4: , Dot plot showing the percentage of edited alleles. Data are reported as percentages of individual mice (dots) and medians (lines). The percentage of edited alleles was measured in Pcsk9 exon1 for Cas9- and vehicle-treated mice, and in the Pcsk9 promoter for EvoETR-8- and vehicle-treated mice ( ). g, Dot plots showing the percentage of in vivo methylation in EvoETR-8- and vehicle-treated mice by targeted BS-seq. Five genomic sites were interrogated, corresponding to the five DMRs that were identified in vitro from the comparison EvoETR-8 versus mock. Each dot represents a single CpG in the indicated DMR (mean of ). The plot showing the Pcsk9-associated DMR (DMR-3) is a reanalysis of the data in and was included here as reference for on-target methylation.
other particle formulations (Extended Data Fig. 5c). EvoETR-8 was also more efficient than the triple-ETR combination in terms of deposing DNA methylation at the PcsK9 promoter (1.9-fold increase in mean methylation rate; Fig. 5e and Extended Data Fig. 6). This increase was associated with increased methylation at CpG sites that were either poorly or not methylated in triple-ETR-treated mice. Of note, the CpG methylation profiles at Pcsk9 after treatment with ZFP-ETRs or EvoETR-8 were superimposable between the in vivo and the in vitro conditions (Extended Data Fig. 6). No differences in the levels of CpG methylation at the Pcsk9 promoter were detected in the lung, spleen, kidney or pancreas of ETR-treated mice versus mock-treated mice (Extended Data Fig. 5d), further confirming the targeting specificity of the LNPs. Additional molecular analyses showed no signs of genetic alterations at the Pcsk9 promoter of mice treated with EvoETR-8, whereas the mutational burden imposed by CRISPR-Cas9 at its intended target site reached (Fig. 5f). Finally, we inspected the four unintended DMRs
identified in vitro in purified hepatocytes from EvoETR-8-treated mice and confirmed three of them; for the remaining one, the interrogated CpGs were already highly methylated in mock-treated mice (Fig. 5g). In line with these data, the top three DMRs identified in vitro from the triple-ETR combination were hypermethylated in the corresponding treated mice (Extended Data Fig. 7). These data confirm the off-target nature of these sites and support the predictive value of the in vitro studies for off-target nomination.
Discussion
In this study, we show that LNP-mediated delivery of mRNAs encoding ETRs to the liver of mice can lead to durable (nearly one year of follow-up) epigenetic silencing of Pcsk9. Notably, epi-silencing proved to be stable also after partial hepatectomy, further confirming the heritable nature of the epigenetic marks deposited by the ETR
technology and indicating that epi-silenced hepatocytes remained competent for liver regeneration. When compared with RNAi, for which multiple administrations are required , our approach is configured as a one-and-done treatment, a feature shared only with other genome-editing technologies. Unlike the latter approaches, however, the ETR technology does not require the induction of potentially genotoxic DNA breaks to inactivate the desired gene . This feature represents a safety advantage, especially when aiming at multiplex epi-silencing, as both gene editing, and to a lesser extent, base editing can cause reciprocal chromosomal translocations . Moreover, epi-silencing differs from genome editing in that it can be reverted by either pharmacological intervention or treatment with editors equipped with a transcriptional activator, as previously shown in cell lines . As such, epi-silencing would allow for temporally controlled silencing of the targeted gene and the reversal of treatment-related adverse effects. Here, we also show that the ETR technology can establish substantial levels of epi-silencing in vivo, at values that are already compatible with several experimental and therapeutic applications. In our experimental settings, epi-silencing performed as well as conventional gene editing (up to of Pcsk9 inhibition). Of note, the same CRISPR-Cas9 components used in this study were shown to completely abrogate Pcsk9 expression when delivered by another LNP in mice , which suggests that using more efficient and tolerated non-viral delivery platforms could further increase epi-silencing efficiency. In addition, one might follow the same molecular optimization strategies used for base editors that, in their latest versions, promote near-complete abrogation of Pcsk9 expression in both mice and non-human primates . For the epi-silencing technology, these optimizations could include further refinements in the RNA payload and/or the ETR design, the identification of better-responding ETR target sites from a larger repertoire and the use of other types of DBD. Indeed, our initial molecular optimization of ETR architecture already improved the epi-silencing efficiency in vivo. The stronger performance of EvoETR-8 as compared with the parental ETR combination could be attributed to intrinsic characteristics of the all-in-one fusion construct, differences in the LNP packaging efficiencies and/or the mRNA structure or stability. With regard to the in vivo durability of Pcsk9 repression with EvoETR-8, this proved to be stable until day 43, the last time point analysed. It is conceivable that mice treated with EvoETR-8 will maintain the many-month-long silencing observed with the triple-ETR combination, given that these two platforms share the same epigenetic effector domains and that the levels of on-target DNA methylation were even higher in EvoETR-8-treated mice. Because the resulting increase in on-target activity obtained from some of these optimizations might also result in higher levels of off-targeting, these steps should be paralleled by a thorough specificity assessment through combinations of transcriptional and genome-wide epigenetic analyses. In this regard, we found here that treatment with the ZFP-based ETRs results in limited transcriptional and epigenetic perturbations. Whereas the exact mechanisms behind this phenomenon are still unknown, multiple lines of evidence point to unintended docking of the ZFP arrays at off-target sites rather than in-solution activity of the effector domains. Indeed, we and others did not detect any perturbations with untargeted ETRs or dCas9-based epi-editors . Moreover, single-molecule ETRs equipped with alternative ZFP arrays induce diverse numbers and types of differentially expressed genes. Of note, testing of three different ZFP arrays identified a highly specific one, suggesting that empiric selection of DBDs from a larger catalogue might enable the identification of ETRs with undetectable off-target activity. In vivo confirmation of in-vitro-nominated off-target sites might indicate that ETR activity is invariant in these two biological systems, a hypothesis that needs further confirmation with comprehensive genome-wide epigenetic and transcriptomic analyses. In line with previous reports, our in vitro data show that the ETR technology is applicable to different DBD platforms , with
ZFP-based ETRs showing a more favourable efficiency profile than do dCas9- and TALE-based architectures. Although this finding requires further confirmation (for example, through a systematic evaluation of a larger panel of DBDs and genomic loci), intrinsic features of the ZFP platform make it appealing for epigenome editing applications. These include their reduced molecular size and independence from short-lived gRNAs for activity, characteristics that would facilitate both the delivery and the stability of the epigenome editing complex. Alternatively, we can speculate that ZFP-based ETRs could be more proficient than are dCas9- or TALE-based architectures in tethering or placing the epigenetic EDs onto chromatin, given their structural similarities with naturally occurring ZFP-based transcriptional repressors. In conclusion, we establish here a proof-of-principle of durable and efficient epigenetic silencing in vivo by transient ETR delivery, opening exciting possibilities in the field of gene therapy.
Online content
Any methods, additional references, Nature Portfolio reporting summaries, source data, extended data, supplementary information, acknowledgements, peer review information; details of author contributions and competing interests; and statements of data and code availability are available at https://doi.org/10.1038/s41586-024-07087-8.
Sgro, A. & Blancafort, P. Epigenome engineering: new technologies for precision medicine. Nucleic Acids Res. 48, 12453-12482 (2020).
Ueda, J., Yamazaki, T. & Funakoshi, H. Toward the development of epigenome editing-based therapeutics: potentials and challenges. Int. J. Mol. Sci. 24, 4778 (2023).
Kungulovski, G. & Jeltsch, A. Epigenome editing: state of the art, concepts, and perspectives. Trends Genet. 32, 101-113 (2016).
Nakamura, M., Gao, Y., Dominguez, A. A. & Qi, L. S. CRISPR technologies for precise epigenome editing. Nat. Cell Biol. 23, 11-22 (2021).
Gilbert, L. A. et al. CRISPR-mediated modular RNA-guided regulation of transcription in eukaryotes. Cell 154, 442 (2013).
Thakore, P. I. et al. Highly specific epigenome editing by CRISPR-Cas9 repressors for silencing of distal regulatory elements. Nat. Methods 12, 1143-1149 (2015).
Mendenhall, E. M. et al. Locus-specific editing of histone modifications at endogenous enhancers. Nat. Biotechnol. 31, 1133-1136 (2013).
Konermann, S. et al. Optical control of mammalian endogenous transcription and epigenetic states. Nature 500, 472-476 (2013).
Li, F. et al. Chimeric DNA methyltransferases target DNA methylation to specific DNA sequences and repress expression of target genes. Nucleic Acids Res. 35, 100-112 (2007).
Stolzenburg, S. et al. Targeted silencing of the oncogenic transcription factor SOX2 in breast cancer. Nucleic Acids Res. 40, 6725-6740 (2012).
Siddique, A. N. et al. Targeted methylation and gene silencing of VEGF-A in human cells by using a designed Dnmt3a-Dnmt3L single-chain fusion protein with increased DNA methylation activity. J. Mol. Biol. 425, 479-491 (2013).
Ecco, G., Imbeault, M. & Trono, D. KRAB zinc finger proteins. Development 144, 2719-2729 (2017).
Thakore, P. I. et al. RNA-guided transcriptional silencing in vivo with S. aureus CRISPRCas9 repressors. Nat. Commun. 9, 1674 (2018).
Moreno, A. M. et al. Long-lasting analgesia via targeted in situ repression of in mice. Sci. Transl. Med. 13, eaay9056 (2021).
Amabile, A. et al. Inheritable silencing of endogenous genes by hit-and-run targeted epigenetic editing. Cell 167, 219-232 (2016).
Zeitler, B. et al. Allele-selective transcriptional repression of mutant HTT for the treatment of Huntington’s disease. Nat. Med. 25, 1131-1142 (2019).
Hacein-Bey-Abina, S. et al. A serious adverse event after successful gene therapy for X-linked severe combined immunodeficiency. N. Engl. J. Med. 348, 255-256 (2003).
Chandler, R. J. et al. Vector design influences hepatic genotoxicity after adeno-associated virus gene therapy. J. Clin. Invest. 125, 870-880 (2015).
Cao, J. et al. An easy and efficient inducible CRISPR/Cas9 platform with improved specificity for multiple gene targeting. Nucleic Acids Res. 44, e149 (2016).
Deniz, Ö., Frost, J. M. & Branco, M. R. Regulation of transposable elements by DNA modifications. Nat. Rev. Genet. 20, 417-431 (2019).
Mlambo, T. et al. Designer epigenome modifiers enable robust and sustained gene silencing in clinically relevant human cells. Nucleic Acids Res. 46, 4456-4468 (2018).
Nuñez, J. K. et al. Genome-wide programmable transcriptional memory by CRISPR-based epigenome editing. Cell 184, 2503-2519 (2021).
Sabatine, M. S. PCSK9 inhibitors: clinical evidence and implementation. Nat. Rev. Cardiol. 16, 155-165 (2019).
Yin, H. et al. Structure-guided chemical modification of guide RNA enables potent non-viral in vivo genome editing. Nat. Biotechnol. 35, 1179-1187 (2017).
Musunuru, K. et al. In vivo CRISPR base editing of PCSK9 durably lowers cholesterol in primates. Nature 593, 429-434 (2021).
Galonska, C. et al. Genome-wide tracking of dCas9-methyltransferase footprints. Nat. Commun. 9, 597 (2018).
O’Geen, H. et al. Ezh2-dCas9 and KRAB-dCas9 enable engineering of epigenetic memory in a context-dependent manner. Epigenetics Chromatin 12, 26 (2019).
Paunovska, K., Loughrey, D. & Dahlman, J. E. Drug delivery systems for RNA therapeutics. Nat. Rev. Genet. 23, 265-280 (2022).
Rohner, E., Yang, R., Foo, K. S., Goedel, A. & Chien, K. R. Unlocking the promise of mRNA therapeutics. Nat. Biotechnol. 40, 1586-1600 (2022).
Nevzorova, Y., Tolba, R., Trautwein, C. & Liedtke, C. Partial hepatectomy in mice. Lab. Anim. 49, 81-88 (2015).
Ray, K. K. et al. Two phase 3 trials of inclisiran in patients with elevated LDL cholesterol. N. Engl. J. Med. 382, 1507-1519 (2020).
Leibowitz, M. L. et al. Chromothripsis as an on-target consequence of CRISPR-Cas9 genome editing. Nat. Genet. 53, 895-905 (2021).
Turchiano, G. et al. Quantitative evaluation of chromosomal rearrangements in gene-edited human stem cells by CAST-Seq. Cell Stem Cell 28, 1136-1147 (2021).
Nahmad, A. D. et al. Frequent aneuploidy in primary human T cells after CRISPR-Cas9 cleavage. Nat. Biotechnol. 40, 1807-1813 (2022).
Stadtmauer, E. A. et al. CRISPR-engineered T cells in patients with refractory cancer. Science (80-.). 367, eaba7365 (2020).
Koblan, L. W. et al. Improving cytidine and adenine base editors by expression optimization and ancestral reconstruction. Nat. Biotechnol. 36, 843-848 (2018).
Zafra, M. P. et al. Optimized base editors enable efficient editing in cells, organoids and mice. Nat. Biotechnol. 36, 888-896 (2018).
Publisher’s note Springer Nature remains neutral with regard to jurisdictional claims in published maps and institutional affiliations.
Open Access This article is licensed under a Creative Commons Attribution 4.0 International License, which permits use, sharing, adaptation, distribution and reproduction in any medium or format, as long as you give appropriate credit to the original author(s) and the source, provide a link to the Creative Commons licence, and indicate if changes were made. The images or other third party material in this article are included in the article’s Creative Commons licence, unless indicated otherwise in a credit line to the material. If material is not included in the article’s Creative Commons licence and your intended use is not permitted by statutory regulation or exceeds the permitted use, you will need to obtain permission directly from the copyright holder. To view a copy of this licence, visit http://creativecommons.org/licenses/by/4.0/.
(c) The Author(s) 2024
Methods
Molecular cloning and mRNA production
ETRs were transiently delivered as either plasmid DNA (in cell lines) or mRNA (in cell lines, primary cells and in vivo). To this end, ETRs were cloned in an expression vector containing: (i) an upstream CMV promoter; (ii) an upstream T7 promoter for mRNA in vitro transcription (IVT); (iii) a downstream WPRE signal; (iv) a -terminal stretch of 64 adenines (64A); and (v) a Spel plasmid linearization site for mRNA IVT (Extended Data Fig. 1b). The coding sequences of the dCas9-based ETRs were previously described . For plasmid-mediated gRNA expression, the crRNA sequences were cloned into a previously described expression vector containing a U6 promoter and the sequence of the Staphylococcus pyogenes Cas9 trRNA . gRNAs targeting the CGI of the mouse Pcsk9 were designed using Chop Chop (https://chopchop.cbu.uib.no/) and selected according to high simulated activity and specificity. ZFPs and TALEs were designed and synthesized by Merck and Thermo Fisher Scientific, respectively, and subcloned into the mammalian expression plasmid in place of the dCas9 sequence. mRNAs were produced by IVT using the T7 Megascript Kit (Thermo Fisher Scientific, AMB1334-5) according to the manufacturer’s instructions. For the in vitro experiments, partially modified mRNAs were produced by IVT, including the following modifications to the standard protocol: (i) inclusion of the anti-reverse cap analogue -O-Me-m7G( )ppp( )G (NEB, M0251) at a final concentration of 8 mM ; and (ii) reduction of the GTP concentration from 7.5 to 2.5 mM . For the in vivo experiments, heavily modified mRNAs were produced by IVT, including the following modifications to the standard protocol: (i) inclusion of CleanCap-AG (Trilink BioTechnologies, N-7113) at a final concentration of 4 mM ; and (ii) substitution of UTP with N1-Met- -Uridine (Trilink BioTechnologies, N-1081) at a final concentration of 7.5 mM . mRNAs were then purified using the RNeasy Mini Kit (Qiagen, 74134). The quality and integrity of the mRNAs were assessed with a 4200 TapeStation System, and quantities were measured by a NanoDrop 8000. sgRNAs were synthetized by Axolab according to the a previously described nucleotide-modification scheme . For in vitro or in vivo studies, the Cas9 mRNA was in vitro transcribed as described above or purchased from Trilink BioTechnologies (L-7606), respectively. Sequences of the ETRs and gRNAs used in this study are listed in Supplementary Table 6. The plasmids used in this study are available upon signing of a material transfer agreement.
Cell culture, treatment and engineering
Hepa 1-6 cells (CRL-1830, ATCC) were cultured in Dulbecco’s modified Eagle’s medium (DMEM, Corning, 10-013-CV) supplemented with 10% fetal bovine serum (FBS; EuroClone), 1% l-glutamine (EuroClone, ECB3000D) and 1% penicillin-streptomycin (Euroclone, ECB3001D) at in a humidified incubator. The Hepa 1-6 Pcsk cell line was generated by nucleofecting cells with: (i) an HDR donor plasmid containing the 2A-tdTomato-polyA cassette within homology arms to exon 12 of Pcsk9; (ii) a Cas9-expression plasmid; and (iii) a plasmid expressing agRNA targeting the last exon of (ref. 42). tdTomato-positive cells were than sorted at single-cell level and amplified. The Hepa 1-6 Pcsk cell line is available upon signing of a material transfer agreement. Primary mouse hepatocytes from C57BL/6 male mice were purchased from Biopredic International as adherent monolayers on collagen-coated 96-well plates and maintained according to the manufacturer’s instructions. Supernatants of treated and control cells were collected at different time points and stored as one-time-use aliquots at .
Gene-delivery procedures
For the in vitro experiments in the Hepa 1-6 Pcsk9 cells, cells were transfected with either RNAs or plasmid DNAs using the 4D-Nucleofector X System (Lonza) in SF Cell Line solution (Lonza, V4XC-2032) and with the CM-137 pulse program. For the in vitro and
in vivo experiments with LNPs A, B, C, D and E, these research-grade reagents were formulated by Precision NanoSystem (PNI) combining lipid mixes and RNA, the latter dissolved in a PNI proprietary formulation buffer. The lipid mixes are made of four different components dissolved in ethanol-based solution: an ionizable lipid, a helper lipid, cholesterol and 1,2-dimyristoyl-rac-glycero-3-m ethoxypolyethylene glycol (PEG-DMG). The chemical nature of the helper lipid differs among the formulations: (i) 1,2-di-(9Z-octadecenoyl)-sn-glycero-3-phosphoethanolamine (DOPE) for LNP A; (ii) 1,2-dioctadecanoyl-sn-glycero-3-phosphoethanolamine (DSPC) for LNPB; (iii) 1,2-dipalmitoyl-sn-glycero-3-phosphocholine (DPPC) for LNPC; and (iv) 1,2-di-(9Z-octadecenoyl)-sn-glycero-3-phosphocholin (DOPC) for LNPs D and E. The ionizable lipid as well as the molar ratio at which the four components were mixed are proprietary information of PNI. RNAs and lipids were mixed into the NanoAssemblr Ignite instrument (PNI) using microfluidic cartridges (Ignite NxGen Cartridge; PNI) with a total flow rate (TFR) of and a flow rate ratio (FRR) of (RNAs:lipids). Nitrogen-to-phosphate (NP) ratios of 6 and 9 were used in the initial LNP screening experiments, and this ratio was set to 6 for the remaining in vivo experiments. The lipid mix LNP D is available upon request from Precision NanoSystems (PNI) using the code iL00V77. LNP D formulated with the desired RNA can be directly purchased from PNI by signing an agreement. The estimated turnaround time is months. Alternatively, the LNP D and the formulation device can be purchased from PNI. In this case, PNI will technically support the investigator in the setting of the formulation protocol. LNPs produced with the GenVoy-ILM reagent (NWW0042, 25 mM ) were formulated following the manufacturer’s instructions with the NanoAssemblr Ignite instrument (PNI) and using microfluidic cartridges (Ignite NxGen Cartridge; PNI). Formulation parameters were set as follows: (i) TFR of ; (ii) FRR of ; and (iii) NP ratio of 4 . All LNPs were concentrated using an Amicon Centrifugal Filter (MWCO30 kDa), the ethanol was removed by a3:1 dilution in1 PBS ( – free) and LNPs were finally filtered manually through a syringe. Particle sizes and their polydispersity index (PDI) were analysed using dynamic light scattering (DLS), and the RNA encapsulation efficiency and concentrations were determined using a RiboGreen plate-based assay. The results of the DLS analyses and RNA quantification of the LNPs used in this study are reported in Supplementary Table 7.
Flow cytometry and cell sorting
Flow cytometry was performed using CytoFLEX (Beckman Coulter) and raw data were analysed using FCS Express v. 7 (DeNovo Software) to extract the percentage of Pcsk9 negative cells. When indicated, tdTomato-positive or -negative cells were sorted with a FACSAria Fusion Cell Sorter (BD Biosciences) as either bulk populations or at the single-cell level. The gating strategy for both the flow cytometry and the cell sorting procedures is reported in Supplementary Fig. 1.
RNA sequencing
Total RNA was extracted from Pcsk9-silenced cells using the RNeasy Mini Kit (Qiagen, 74134) and quantified using the Qubit 2.0 Fluorimetric Assay (Thermo Fisher Scientific). Unstranded libraries were prepared with the NEBNext Ultra RNA Library Prep Kit for Illumina after rRNA depletion, and sequencing was performed using an Illumina NovaSeq 6000 platform (NovaSeq Control Software v.1.7) to obtain at least 30 million of 150 bp -long paired-end reads per sample. Read quality was controlled with Fastqc v.0.11.9 (https://www.bioinformatics.babraham.ac.uk/projects/fastqc/), and low-quality reads and the adapters were removed using Trim Galore v.0.6.6 (https://www. bioinformatics.babraham.ac.uk/projects/trim_galore/) according to the following parameters:–quality 20,–length 25,–paired. High-quality remaining reads were aligned to the mouse reference genome GRCm38 using STAR v2.7.6a (ref. 43) with default parameters. Gene counts were quantified using the featureCounts function from the Subread package
v.2.0.1 (ref. 44) and Gencode M25 as the gene model. Raw counts were corrected for biases due to different library preparations, if present, using the ComBat_seq function from the R Bioconductor package sva v.3.38.0 (ref. 45). Read distribution was estimated using the negative binomial generalized log-linear model implemented in the R Bioconductor package DESeq2 v.1.30.0 (ref. 46). Differential gene expression was tested using the nbinomWaldTest function and values were corrected using the Benjamini-Hochberg approach.
WGMS
Genomic DNA was extracted from -silenced cells using the Maxwell RSC Cultured Cell extraction kit (AS1620) and quantified using a NanoDrop 8000. Libraries were prepared using an enzymatic approach for cytosine conversion with NEBNext DNA Ultra II Reagents and sequencing was performed using an Illumina HiSeq (HiSeq Control Software v.3.4) platform to produce at least 250 million 150-bp-long paired-end reads per sample. Read quality was controlled with Fastqc v.0.11.9, and low-quality reads and the adapters were removed using Trim Galore v0.6.6. with the following parameters: –quality 20, –length 25, –paired, –clip_R25. High-quality remaining reads were analysed using the Bismark read mapper methylation caller tool v.0.23.0. In detail, reads were aligned to both the converted and the unconverted genomes (GRCm38) using Bismark v.0.23.0 with default parameters. Duplicates were then removed using the deduplicate_bismark script and the methylation status was obtained using the bismark_methylation_extractor script. Then, the methylation call was loaded into the R environment and processed using the R Bioconductor package MethylKit v.1.16.1. Imported data were filtered using the filterByCoverage function (low count filter equal to 1 and high percentile equal to 99.9) and normalized using the normalizeCoverage function. Information from the different samples was merged using the unite function considering the positions covered in all replicates. The percentage of methylation was calculated with the percMethylation function and the correlation among the samples was determined applying the cor function (default Pearson method). Differential methylation analysis was performed using the R Bioconductor packages bsseq v.1.26.0 (ref. 47) and DSS v.2.44.0 (ref. 48). First, the object was created using the makeBSseqData function starting from the Bismark output. The DMLtest function was used for the normalization step and the differential analysis with the following parameters: smoothing = TRUE and smoothing.span=500. Then, the callDML function was applied to determine the differential methylated loci (DML) setting as thresholds delta and p.threshold . To exclude any confounding DMRs not associated with off-target methylation, the delta methylation threshold was set at 0.4 ; that is, the minimal value not calling any DMR in Cas9-treated cells, a negative control having no direct methylation activity. The DMRs were defined applying the callDRM function with the same thresholds. The DMRs identified were annotated using the annotatePeakInBatch function from the R Bioconductor package ChIPpeakAnno v.3.24.2 (ref. 49) using the Gencode M25 annotation and the following parameters: PeakLocForDistance = “middle”,FeatureLocForDistance=”TSS”,output=”both” and multiple = TRUE. DMRs of all treated samples were computed using as reference the same mock-treated controls.
Mouse handling and treatments
Eight-week-old C57BL/6N female mice were purchased from Charles River Laboratories. Procedures involving animal handling and care followed national and international law and policies and were approved by the Institutional Animal Care and Use Committee (authorization numbers 604/2020-PR and 233/2022-PR, provided by the Italian Ministry of Health). Housing temperature and relative humidity were and , respectively. A 12 – h light- 12 – h light cycle was used and all possible efforts were made to minimize the number of mice used and their suffering. For in vivo administration of either Cas9 or
ETRs, mRNA-LNP solutions were diluted in PBS without calcium and magnesium (Corning, 21-031-CV). Subsequently, mice were randomly assigned to a treatment group and heated with an infrared lamp to obtain vasodilatation. Finally, of LNP solution or PBS (herein defined as vehicle) were intravenously injected into the tail vein. For plasma analyses (see next section), around l of blood was collected from the retro-orbital plexus of each experimental mouse by using a non-heparinized micro-haematocrit capillary tube (Kimble Chase, CSX40A502), and then moved into an EDTA-sprayed blood collection tube (Sarstedt, 20.1288.100). Blood was then centrifuged for 10 min at at room temperature. Purified plasma was finally collected from the supernatant and stored as one-time-use aliquots at . For experiment termination and organ collection, mice were euthanized by inhalation and tissues (liver, spleen, lungs and kidney) were removed and snap-frozen for further molecular analyses. For partial hepatectomy, mice were anaesthetized by isoflurane continuous inhalation. Before hepatectomy, mice were fasted for 4 h. Surgery was performed according to the Higgins protocol . In brief, the abdominal skin was shaved, and a 2 -cm upper midline incision was made beginning from the xyphoid. After opening the peritoneum, the liver was gently mobilized and exposed. The left lateral lobe was lifted, tied up and resected through 3.0 silk sutures (Ethicon, EH6823H) distal to the applied ligatures. Muscle and skin were closed in two layers with 4.0 Vicryl (Ethicon, V994H) and an autoclip wound-closing system, respectively. For postoperative analgesia, carprofene ( 5 mg per kg ) was used by subcutaneous injection into the neck fat pad. Liver tissue and blood were collected during hepatectomy and at necropsy for molecular analysis and plasma quantification. For isolation of hepatocytes, mice were first anaesthetized with isoflurane and the liver was exposed and perfused ( 32 ml per min ) through the inferior vena cava with HBSS-HEPES collagenase IV (Sigma). The digested mouse liver was collected, passed through a 100- m cell strainer (BD Biosciences) and processed into a single-cell suspension. Cells were spun down and washed three times with successive centrifugations at different speeds ( and 20 g ) for 3 min each at room temperature to obtain hepatocytes.
Plasma analysis
To quantify PCSK9, plasma from treated mice and supernatants from primary mouse hepatocytes were thawed and diluted 1:200 and 1:2, respectively. Dilutions were then loaded on a commercial pre-spotted ELISA kit according to the manufacturer’s instructions (R&D Systems, MPC900).Similarly, absorbance assays were used to quantify the levels of LDL-C (P/N 00018256040, Werfen), ALT (P/N 00018257440, Werfen), AST (P/N 00018257540, Werfen), LDH (P/N 00018258240, Werfen) and albumin (P/N0018250040), following the manufacturer’s instructions.
In vivo molecular analyses
Genomic DNA was extracted from snap-frozen tissues (around 30 mg ) using the Maxwell 48 Promega RSC Tissue DNA Purification Kit (AS1610) according to the manufacturer’s instructions. Where indicated, editing and epi-editing efficiencies were quantified from purified hepatocytes (see ‘Mouse handling and treatments’). In these cases, genomic DNA was extracted using the Maxwell 48 RSC Tissue DNA Purification Kit (AS1610) from cells according to the manufacturer’s instructions. Gene-editing efficiencies at the Pcsk9 locus were quantified using the T7 assay or targeted deep sequencing. For the T7 assay, a 765-bp genomic region encompassing the CRISPR-Cas9 binding site was PCR-amplified using the primers listed in Supplementary Table 8. PCRs were then processed using the Alt-R Genome Editing Detection Kit (IDT, 1075932), run on the Agilent ScreenTape System, and the percentage of editing was quantified according to the manufacturer’s instructions. For targeted deep sequencing, the promoter region or exon 1 of Pcsk9 were PCR-amplified using the primers listed in Supplementary Table 8. Libraries were then prepared using the NEBNext Ultra IIDNA Library Prep Kit for Illumina for the Pcsk9 promoter or using the
NEBNext Ultra DNA Library Prep Kit for Illumina for Pcsk9 exon 1, and sequenced using the Illumina MiSeq platform (MiSeq Control Software v.2.6). Sequencing data were analysed with CRISPResso2 v.2.8 (ref. 51) to detect nucleotide insertions and/or deletions. Reads were aligned to the boundary sequence around the putative cutting site (400 bp centred on the sgRNA complementary site for Cas9-treated samples or 300 bp centred on the ZFP-8 recognition site for EvoETR-8-treated samples) using bowtie2 v.2.2.5(refs. 52,53) in paired mode and default parameters. After that, original fastq files were subset to retain only the reads mapping to the region of interest using the filterbyname module of the BBMap aligner v.39.01 contained in the BBTools suite (https://sourceforge.net/projects/bbmap/). The remaining reads were analysed with CRISPResso2 in paired-end mode setting the options for Trimmomatic software v.0.39 (ref. 54; http://www.usadellab.org/ cms/?page=trimmomatic) to remove low-quality positions (score<30) and Illumina adapters(–trim_sequences–trimmomatic_commandtrim-momatic–trimmomatic_options_string’ILLUMINACLIP:TruSeq3-PE-2. fa:2:30:10 MINLEN:100′). Then, each couple of paired-end reads was merged using FLASH v.1.2.11 (ref. 55) to produce a single contig, which was mapped to the input amplicon reference (promoter region or first exon, depending on the experiment). The sgRNA complementary site and the ZFP-8 target sequence were provided to focus the analysis on the target region, and the quantification window was set to 20 bp per side around the cut site (Cas9 samples) or the ZFP-8 middle point (EvoETR-8 samples). Identified alleles were quantified by measuring the number of reads and their relative abundance on the basis of total read counts considering only insertions and deletions. The percentage of CpG methylation at the promoter or at the in-vitro-identified DMRs was quantified using targeted bisulfite deep sequencing (targeted BS-seq).Specifically, purified genomic DNA was converted with the EpiTect Fast Bisulfite Conversion Kit (Qiagen, 59104) according to the manufacturer’s instructions. Then, the promoter region of Pcsk9 and unintended DMRs were PCR-amplified using the primers listed in Supplementary Table 8. For the Pcsk9 promoter, libraries were prepared using the NEBNext Ultra DNA Library Prep Kit for Illumina. For the other DMRs, the NEBNext Ultra II DNA Library Prep Kit for Illumina was used. Libraries were sequenced using an Illumina MiSeq platform in paired-end mode (MiSeq Control Software v.2.6). Read quality was controlled with Fastqc v.0.11.9, and low-quality reads and adapters were removed using Trim_Galore v0.6.6. with the following parameters: –quality 20, –length 25, –paired, –rrbs. High-quality remaining reads were analysed using the Bismark read mapper methylation caller tool v.0.23.0 (ref. 56). In detail, reads were aligned to both unconverted and converted genomes (GRCm38) using Bismark with the –local parameter and the methylation status was obtained using bismark_methylation_extractor script. The methylation calls were loaded into the R environment and processed using the R Bioconductor package MethylKit v.1.16.1(ref.57). Imported data were filtered using the filterByCoverage function (low count filter equal to 10 and high percentile equal to 99.9) and normalized using the normalizeCoverage function. The data from the different samples were merged using the unite function considering the positions covered in at least one replicate per condition. The percentage of methylation at each CpG was calculated using the percMethylation function.
Statistics and reproducibility
Data were plotted and analysed using GraphPad Prism v. 9 (GraphPad Software). When indicated in the figure legends, statistical significance was evaluated by using GraphPad Prism v. 9 (GraphPad Software) and applying the described tests. All of the in vitro experiments were conducted with technical replicates ( ) and the exact number of replicates is indicated in the respective legend. In vivo experiments were designed including multiple mice ( ). The exact number of treated mice in any experimental group for any experiment is indicated in the figure legend.
Reporting summary
Further information on research design is available in the Nature Portfolio Reporting Summary linked to this article.
Data availability
All data are available in the Article or in its Supplementary Information. Data from RNA-seq, WGMS, targeted BS-seq and targeted amplicon sequencing have been deposited in the Gene Expression Omnibus (GEO) database (accession number: GSE226209). Data from RNA-seq, WGMS and targeting sequencing were analysed using the GRCm38 mouse reference genome and the Gencode M25 annotation (https:// www.gencodegenes.org/mouse/release_M25.html). Source data are provided with this paper.
39. Chen, B. et al. Dynamic imaging of genomic loci in living human cells by an optimized CRISPR/Cas system. Cell 155, 1479-1491 (2013).
40. Labun, K. et al. CHOPCHOP v3: expanding the CRISPR web toolbox beyond genome editing. Nucleic Acids Res. 47, W171-W174 (2019).
41. Finn, J. D. et al. A single administration of CRISPR/Cas9 lipid nanoparticles achieves robust and persistent in vivo genome editing. Cell Rep. 22, 2227-2235 (2018).
42. Lombardo, A. et al. Gene editing in human stem cells using zinc finger nucleases and integrase-defective lentiviral vector delivery. Nat. Biotechnol. 25, 1298-1306 (2007).
43. Dobin, A. et al. STAR: ultrafast universal RNA-seq aligner. Bioinformatics 29, 15-21 (2013).
44. Liao, Y., Smyth, G. K. & Shi, W. FeatureCounts: an efficient general purpose program for assigning sequence reads to genomic features. Bioinformatics 30, 923-930 (2014).
45. Leek, J. T., Johnson, W. E., Parker, H. S., Jaffe, A. E. & Storey, J. D. The SVA package for removing batch effects and other unwanted variation in high-throughput experiments. Bioinformatics 28, 882-883 (2012).
46. Love, M. I., Huber, W. & Anders, S. Moderated estimation of fold change and dispersion for RNA-seq data with DESeq2. Genome Biol. 15, 550 (2014).
47. Hansen, K. D., Langmead, B. & Irizarry, R. A. BSmooth: from whole genome bisulfite sequencing reads to differentially methylated regions. Genome Biol. 13, R83 (2012).
48. Feng, H., Conneely, K. N. & Wu, H. A Bayesian hierarchical model to detect differentially methylated loci from single nucleotide resolution sequencing data. Nucleic Acids Res. 42, e69 (2014).
49. Zhu, L. J. et al. ChIPpeakAnno: a Bioconductor package to annotate ChIP-seq and ChIP-chip data. BMC Bioinform. 11, 237 (2010).
50. Bönninghoff, R. et al. Effect of different liver resection methods on liver damage and regeneration factors VEGF and FGF-2 in mice. Can. J. Surg. 55, 389-393 (2012).
51. Clement, K. et al. CRISPResso2 provides accurate and rapof genome editing analysis. Nat. Biotechnol. 37, 220-224 (2019).
52. Langmead, B., Wilks, C., Antonescu, V. & Charles, R. Scaling read aligners to hundreds of threads on general-purpose processors. Bioinformatics 35, 421-432 (2019).
53. Langmead, B. & Salzberg, S. L. Fast gapped-read alignment with Bowtie 2. Nat. Methods 9, 357-359 (2012).
54. Bolger, A. M., Lohse, M. & Usadel, B. Trimmomatic: a flexible trimmer for Illumina sequence data. Bioinformatics 30, 2114-2120 (2014).
55. Magoč, T. & Salzberg, S. L. FLASH: fast length adjustment of short reads to improve genome assemblies. Bioinformatics 27, 2957-2963 (2011).
56. Krueger, F. & Andrews, S. R. Bismark: a flexible aligner and methylation caller for Bisulfite-Seq applications. Bioinformatics 27, 1571-1572 (2011).
57. Akalin, A. et al. MethylKit: a comprehensive R package for the analysis of genome-wide DNA methylation profiles. Genome Biol. 13, R87 (2012).
Acknowledgements We thank P. Capasso, A. Coglot, D. Cipria, L. Albano and A. Follenzi for technical support; P. Spinelli for discussions and help in project management; and all members of the A.L. laboratory and Chroma Medicine for discussions. M.A.C. conducted this study as partial fulfillment of his PhD. Schematic figures were drawn using BioRender.com. This study was supported by the Telethon Foundation (TIGET-F5; grant no. TTALFO516TT); the European Union’s Horizon 2020 research and innovation programme (UPGRADE; grant agreement no. 825825); and Chroma Medicine (A.L.).
Author contributions Conceptualization: M.A.C. and A.L. Data curation: M.A.C., V.M.P., S.V. and I.M. Formal analysis: M.A.C., V.M.P., S.V., P.Q. and I.M. Funding acquisition: A.L. Investigation: M.A.C. and V.M.P. Methodology: M.A.C., V.M.P., S.V., P.Q. and S.M. Project administration: M.A.C., I.M. and A.L. Resources: V.M.P. and A.L. Supervision: A.L. Validation: M.A.C. and A.L. Visualization: M.A.C. and S.V. Writing (original draft): M.A.C., V.M.P. and A.L. Writing (review and editing): M.A.C., V.M.P., S.V., P.Q., S.M., I.M. and A.L.
Competing interests A.L. is a co-founder of, quota holder of and consultant for Chroma Medicine, a company aiming to develop epi-editing applications. A.L. and M.A.C. are inventors on pending and issued patents related to epi-silencing filed by the San Raffaele Scientific Institute and Telethon Foundation, or Chroma Medicine. The remaining authors declare no competing interests.
Additional information
Supplementary information The online version contains supplementary material available at https://doi.org/10.1038/s41586-024-07087-8.
Correspondence and requests for materials should be addressed to Angelo Lombardo.
Peer review information Nature thanks Albert Jeltsch and the other, anonymous, reviewer(s) for their contribution to the peer review of this work.
Reprints and permissions information is available at http://www.nature.com/reprints.
Extended Data Fig.1|See next page for caption.
Article
Extended Data Fig. 1 | In vitro selection of the most effective ETRs for Pcsk9 silencing. a, Schematic drawing showing on top the Pcsk9 promoter region with the annotated CpG Island (CGI) and, on the bottom, a zoom on the CGI showing the target sites of all the tested single guide RNAs (sgRNAs; black arrows), TALEs (grey arrows), and ZFPs (blue arrows). Filled arrows indicate the most active sgRNA/DBDs used for subsequent experiments. Created with BioRender.com.b, Schematic representation of the plasmid used for ETR expression, either after its direct transfection into cells or as a template for In Vitro Transcription (IVT) of the ETRs’ mRNA. CMV: enhancer/promoter of the Cytomegalovirus. T7: promoter for mRNA production. ATG: start codon; DBDs: DNA-binding domains; SV40 NLS: nuclear localization signal of the simian virus 40; GSGGG: glycine-rich liker peptide; ED: effector domain, either KRAB from the ZNF10 protein, cdDNMT3A or DNMT3L; WPRE: woodchuck hepatitis virus post-transcriptional regulatory element; 64A: stretch of 64 adenines; Spel: restriction site used to linearize the plasmid for IVT; BGH polyA: polyadenylation signal from the bovine growth hormone gene. Created with BioRender.com.c, Dot plot showing the percentage of Pcsk9 -negative cells over a period of 22 days post-delivery of plasmids encoding for the indicated dCas9-based ETRs and 8 different sgRNAs. sgRNA- 4 was the most active among the tested guides (black dots and connecting line) and thus used for subsequent experiments. Data are reported as mean ( ). d, Dot plot showing the percentage of -negative cells over a period of 17 days post-delivery of plasmids encoding for 16 different TALE DBDs fused to the KRAB domain. This experiment was meant to identify the most effective TALEs among those tested, using KRAB-mediated epi-silencing of Pcsk9 as a surrogate
readout for DBD efficiency. TALE-2, -4 and -6 were the most active ones among those tested (black dots and connecting line) and thus used for subsequent experiments. Data are reported as mean s.d. . e, Dot plot showing the percentage of Pcsk -negative cells over a period of 22 days post-delivery of plasmids encoding for 16 different ZFP DBDs fused to the KRAB domain. This experiment was meant to identify the most effective ZFPs among those tested, using KRAB-mediated epi-silencing of Pcsk9 as a surrogate readout for DBD efficiency. ZFP-3, -6 and -8 were the most active ones among those tested (blue dots and connecting line) and thus used for subsequent experiments. Data are reported as mean s.d. .f, Left: heat maps showing the percentage of Pcsk -negative cells at day 7 post-delivery of combinations of plasmids encoding for KRAB-, DNMT3L and cDNMT3A-based ETRs containing TALEs. The matrixes were built by transfecting either one of the TALE-KRABETRs from d with all possible combinations of the three best-performing TALE DBDs (namely, 3,6 and 8 ) fused to either DNMT3L ( axis) or cdDNMT3A ( axis). Given its highest performance, the triple-ETR combination containing TALE-2KRAB, TALE-6-DNMT3L, and TALE-4-cDNMT3A was chosen for further studies. Colour intensity refers to average silencing efficiency ( ). Right: similar experiment as in left but performed with the three best-performing ZFPs from e. Given its highest activity, the triple-ETR combination containing ZFP-8KRAB, ZFP-6-DNMT3L and ZFP-3-cDNMT3A was chosen for further studies. Colour intensity refers to average silencing efficiency ( ). Best-performing triple combinations of TALE- and ZFP-ETRs are indicated with a red square. , Time-course analysis of -negative cells from the RNA treatment conditions in Fig. 1b of the main text. Data are reported as mean s.d.
A
mRNA nucleofection
B
c
E
G
F
H
Extended Data Fig. 2 | See next page for caption.
Article
Extended Data Fig. 2 | Specificity assessment of ZFP-and dCas9-based ETRs.a, Schematic drawing showing experimental procedures for in vitro specificity profile of ETRs. Created with BioRender.com.b, Scatter plots from RNA-seq analyses comparing the gene expression levels between mock and either untargeted ETRs (Unt. ETRs; left), Cas9 (middle) or ZFP-ETR (right) treated cells. Purple and yellow dots indicate genes significantly up- and downregulated, respectively; grey dots indicate genes considered not differentially expressed. Thresholds were set at and . Data are expressed as of transcript count per million (TPM) of mapped reads. c, Differential gene expression analysis of 20 genes either up- or downstream of Pcsk9 from RNA-seq analysis. d, Heat map of Pearson’s correlation among WGMS replicates calculated using the cor function after filtering by the coverage, normalizing and considering the positions shared by all the replicates in each condition. Values are reported for each replicate ( 1,2 and 3) in each condition. e, Volcano plot (right) and scatter plot (left) from RNAseq analyses showing differential gene expression between mock and dCas9-
ETR-treated cells ( ). Yellow dots indicate genes significantly downregulated; grey dots indicate genes considered not differentially expressed. Thresholds were set at and . For the scatter plot, data are expressed as of transcript count per million (TPM) of mapped reads.f, Bar plot showing the genome-wide levels of CpG methylation of the indicated samples as calculated from the WGMS analyses ( technical replicates). g, Manhattan plot from WGMS showing the CpG methylation profiles of the indicated samples in a genomic region centred on the TSS of Pcks9. Individual dots indicate the average methylation of each CpG. Connecting lines were defined as smoothing spline with 100 knots. h, Manhattan plot from WGMS showing differential methylation of CpGs in a genomic region centred on the TSS of Pcks9 between the indicated samples and mock-treated cells. Individual dots show the differential methylation between the indicated samples at each CpG site. Connecting lines were defined as smoothing spline with 100 knots.
Article
Extended Data Fig. 3 | Editing of PcsK9 in mice. a, Bar plots showing the circulating levels of Pcsk9 (left) and percentage of edited alleles (right) at day 7 post-injection of the indicated LNP formulations encapsulated with Cas9encoding mRNA and a sgRNA targeting the first exon of ( for each group). Treatments with LNP A (NP ratio 9) and LNP-E (NP ratio 9) resulted in 2 and 1 death, respectively. Dots: data from individual mice normalized to pretreatment levels. Bars: median for each group.b, Bar plot showing the percentage of Pcsk9 edited alleles from different organs of mice treated with LNPD (NP ratio 6) encapsulated with Cas9-encoding mRNA and a sgRNA targeting the first exon of Pcsk9. Dots: data from individual mice ( ). Bars: median for each group.c c, Bar plot showing levels of Pcsk9 in the supernatants of mouse hepatocytes after transfection of three different doses of mRNAs encoding for either ZFP-ETRs or GFP (mock). Pcsk9 levels for each replicate and each group were normalized to the mean of the mock at the same dose. Data from individual replicates are reported as dots; bars indicate average values ( , mean s.d.). UD: undetectable. d, Bar plot showing the levels of Pcsk9 in the plasma of mice treated as indicated in Fig. 3a,b of the main text.
Data for individual mice (dots) are reported as normalized to the mean of vehicle-treated mice. Bars indicate the median for any conditions. Data are reported as mean s.d. ( for ZFP-ETR-, 3 for Cas for mock- and 4 for vehicle-injected mice).Statistical analysis by two-way RM ANOVA and Dunnett’s multiple comparisons test between vehicle and the other treatment conditions at the lates time point of analysis; values are reported in the figure. If not indicated, differences were not statistically significant. e, Bar plots showing the circulating levels of LDL-C in mice 30 days after the indicated treatments ( for ZFP-ETR-, 3 for Cas9-, 5 for mock- and 4 for vehicle-injected mice). Dots: individual mice. Bars: median level for each group. , Time course of transaminases (ALT and AST) until day 30 post-treatment. Data are reported as the mean s.d. of U/L of plasma ( for any groups). Grey area indicates physiological levels. g, Time course of circulating Pcsk9 until day 70 posttreatment. Data are reported as the mean s.d. and normalized to PCSK9 levels in vehicle-treated mice ( for ETR-, 7 for Cas for mock- and 15 for vehicle-injected mice).
Extended Data Fig. 4 | In vitro characterization of the specificity of EvoETRs. Volcano plots from RNA-seq analyses showing differential gene expression between the indicated ETR-treated samples and untreated cells ( ). Purple and yellow dots indicate genes significantly up- and
downregulated, respectively; grey dots indicate genes considered not differentially expressed. Thresholds were set at and and are indicated in the graphs as dashed lines.
Article
B
C
D
Extended Data Fig. 5 | Efficacy, biodistribution and liver toxicity of
LNP-mediated delivery of ETRs. a, Time-course analysis of plasma levels of ALT, AST and LDH after LNP-mediated delivery of mRNAs encoding for either Cas9, ZFP-ETRs, or EvoETR-8. Data are reported as mean s.d. ( ). b, Quantification of circulating albumin at the last time point analysed. Data are reported as individual values (dots) and medians (lines). Left: experiment in Fig.3b, 330 days post-injection; centre: experiment in Extended Data Fig.3g,
70 days post-injection; right: experiment in Fig. 5b, 43 days post-injection. c, Time course of circulating Pcsk9 until day 44 post-injection of GenVoy-LNPs encapsulating the mRNA of EvoETR-8. Data are reported as mean s.d. and normalized to the PCSK9 levels of vehicle-treated mice ( for EvoETR-8- and 2 for vehicle-injected mice). d, Dot plots showing the percentage of CpG methylation at the Pcsk9 promoter in the indicated organs from EvoETR-8- and vehicle-treated mice. Each dot represents a single CpG (mean of ).
Extended Data Fig. methylation profiles at in vivo and in vitro. Dot plots reporting the delta methylation between either ZFP-ETR- or EvoETR8 -treated samples versus untreated controls. Individual dots indicate the average delta methylation of each CpG in the genomic region Chr.4: . Connecting lines were defined as smoothing spline
with 20 knots. Mean delta methylation throughout the entire windows for each sample are reported in brackets. Top: replotting of the targeted BS-seq data of Fig. 5e. Bottom: replotting of the WGMS analysis of Fig. 4e,f (for EvoETR-8) and Fig. 2d for ZFP-ETRs. Positions of ZFP-binding sites are indicated as continuous (ZFP-8) or dashed (ZFP-6 and ZFP-3) lines.
Article
DMR-3 + -4 + -5
DMR -11
DMR -14
Extended Data Fig. 7 | In vivo methylation profile of the top three DMRs identified in vitro from the ZFP-ETRs versus mock comparison. Dot plots reporting the percentage of in vivo methylation at single-CpG resolution in ZFP-ETR- and vehicle-treated mice by targeted BS-seq. Two genomic sites were interrogated corresponding to the top two DMRs identified in vitro from the
ZFP-ETRs versus mock comparison. DMR-3, -4 and -5 were identified in vitro as associated with the Pcsk9 promoter region. The in vivo methylation levels of these DMRs were quantified producing a single PCR including all the three DMRs. Each dot represents a single CpG in the indicated DMRs (mean of for each experimental group).
natureportfolio
Corresponding author(s): Angelo Lombardo, PhD
Last updated by author(s): Dec 22, 2023
Reporting Summary
Nature Portfolio wishes to improve the reproducibility of the work that we publish. This form provides structure for consistency and transparency in reporting. For further information on Nature Portfolio policies, see our Editorial Policies and the Editorial Policy Checklist.
Statistics
For all statistical analyses, confirm that the following items are present in the figure legend, table legend, main text, or Methods section.
Confirmed
The exact sample size ( ) for each experimental group/condition, given as a discrete number and unit of measurement
A statement on whether measurements were taken from distinct samples or whether the same sample was measured repeatedly
The statistical test(s) used AND whether they are one- or two-sided
Only common tests should be described solely by name; describe more complex techniques in the Methods section.
X A description of all covariates tested
A description of any assumptions or corrections, such as tests of normality and adjustment for multiple comparisons
A full description of the statistical parameters including central tendency (e.g. means) or other basic estimates (e.g. regression coefficient) AND variation (e.g. standard deviation) or associated estimates of uncertainty (e.g. confidence intervals)
For null hypothesis testing, the test statistic (e.g. ) with confidence intervals, effect sizes, degrees of freedom and value noted Give values as exact values whenever suitable.
For Bayesian analysis, information on the choice of priors and Markov chain Monte Carlo settings
For hierarchical and complex designs, identification of the appropriate level for tests and full reporting of outcomes
X Estimates of effect sizes (e.g. Cohen’s , Pearson’s ), indicating how they were calculated
Our web collection on statistics for biologists contains articles on many of the points above.
Software and code
Policy information about availability of computer code
Data collection
CytExpert Software v2.4 (Beckman Coulter);
MiSeq Control Software v2.6 (Illumina);
NovaSeq Control Software v1.7 (Illumina);
HiSeq Control Software v3.4 (Illumina).
Data analysis
GRCm38 murine reference genome and Gencode v M25 annotation (https://www.gencodegenes.org/mouse/release_M25.html);
R package sva v3.38.0;
R package DESeq2 v1.30.0;
R package bsseq v1.26.0;
R package DSS v2.44.0;
R package ChIPpeakAnno v3.24.2;
GraphPad Prism v9 (GraphPad Software);
bowtie2 v2.2.5;
BBMap v39.01 (sourceforge.net/projects/bbmap/);
Trimmomatic v0.39 (http://www.usadellab.org/cms/?page=trimmomatic);
CRISPResso2 v2.2.8;
FLASH v1.2.11.
For manuscripts utilizing custom algorithms or software that are central to the research but not yet described in published literature, software must be made available to editors and reviewers. We strongly encourage code deposition in a community repository (e.g. GitHub). See the Nature Portfolio guidelines for submitting code & software for further information.
Data
Policy information about availability of data
All manuscripts must include a data availability statement. This statement should provide the following information, where applicable:
Accession codes, unique identifiers, or web links for publicly available datasets
A description of any restrictions on data availability
For clinical datasets or third party data, please ensure that the statement adheres to our policy
All data are available in the main text, extended data, or supplementary materials. Data from RNA-seq, WGMS, and targeted bisulfite sequencing have been deposited on the Gene Expression Omnibus (GEO) database (accession number: GSE226209). Data from RNA-seq, WGMS, and targeted amplicon sequencing have been analyzed using GRCm38 murine reference genome and Gencode v M25 annotation (https://www.gencodegenes.org/mouse/release_M25.html).
Research involving human participants, their data, or biological material
Policy information about studies with human participants or human data. See also policy information about sex, gender (identity/presentation), and sexual orientation and race, ethnicity and racism.
Reporting on sex and gender
Not applicable to this study
Reporting on race, ethnicity, or other socially relevant groupings
Not applicable to this study
Population characteristics
Not applicable to this study
Recruitment
Not applicable to this study
Ethics oversight
Not applicable to this study
Note that full information on the approval of the study protocol must also be provided in the manuscript.
Field-specific reporting
Please select the one below that is the best fit for your research. If you are not sure, read the appropriate sections before making your selection.
Life sciences
Behavioural & social sciences
Ecological, evolutionary & environmental sciences
For a reference copy of the document with all sections, see nature.com/documents/nr-reporting-summary-flat.pdf
Life sciences study design
All studies must disclose on these points even when the disclosure is negative.
Sample size
No specific sample-size calculation was performed. However, for in vivo studies, we have empirically allocated for each experimental group three to seven animals, to achieve the needed reproducibility. It is worth mentioning here that different experiments including identical conditions produced consistent results, further corroborating the hypothesis that the sample sizes was generally appropriate.
Data exclusions
No data were excluded from the analyses.
Replication
All the in vitro experiments were conducted with technical replicates ( ) and the exact number of replicates is indicated in the respective legends. In vivo experiments were designed including multiple mice ( ). The exact number of treated animals in any experimental group for any experiment is reported in the figure legends. It is worth mentioning here that, although we did not conduct exact identical and independent experimental replication, we performed multiple experiments using different doses and/or delivery modalities of the very same editors, confirming the reproducibility of all the results included in this work.
Randomization
Upon arrival at the animal house, mice were randomly allocated to different cages. Moreover, after the administration of LNPs, mice from different experimental groups were located in the same cages to minimize eventual confounding factors.
Blinding
No specific blinding strategies were adopted in this study. However, treated and un-treated mice were labelled using progressive numbers. Finally, the operators re-checked the association between label and treatments once the data analysis was completed. A similar strategy was adopted for in vitro studies. Moreover, sample collection, data processing and analysis were often conducted by different operators, thus
Reporting for specific materials, systems and methods
We require information from authors about some types of materials, experimental systems and methods used in many studies. Here, indicate whether each material, system or method listed is relevant to your study. If you are not sure if a list item applies to your research, read the appropriate section before selecting a response.
Materials & experimental systems
Methods
n/a
Involved in the study
n/a
Involved in the study
Antibodies
Palaeontology and archaeology
Eukaryotic cell lines
Policy information about cell lines and Sex and Gender in Research
Cell line source(s)
Authentication
Mycoplasma contamination
Commonly misidentified lines (See ICLAC register)
Hepa 1-6 (CRL-1830) were purchased from ATCC; primary murine hepatocytes from C57BL/6 male mice were purchased from Biopredic International.
The Hepa 1-6 and the primary murine hepatocytes were purchased and used just upon arrival. No authentications were performed.
The Hepa 1-6 cell line and its deirivative, as well as the primary murine hepatocytes, were used upon testing negative for Mycoplasma contamination.
No misidentfied lines were used in this study.
Animals and other research organisms
Policy information about studies involving animals; ARRIVE guidelines recommended for reporting animal research, and Sex and Gender in Research
Laboratory animals
Eighth week-old C57BL/6N female mice were purchased from Charles River Laboratories (Calco, Italy)
Wild animals
No wild animals were used in this study.
Reporting on sex
Sex was not considered in the study design.
Field-collected samples
The study did not involve samples collected from the filed.
Ethics oversight
Procedures involving animal handling and care followed national and international law and policies and were approved by the Institutional Animal Care and Use Committee (Authorization nos. 604/2020-PR and 233/2022-PR, provided by the Italian Ministry of Health).
Note that full information on the approval of the study protocol must also be provided in the manuscript.
Plants
Seed stocks
Not applicable to this study
Novel plant genotypes
Not applicable to this study
Authentication
Not applicable to this study
Flow Cytometry
Plots
Confirm that:
The axis labels state the marker and fluorochrome used (e.g. CD4-FITC).
The axis scales are clearly visible. Include numbers along axes only for bottom left plot of group (a ‘group’ is an analysis of identical markers).
All plots are contour plots with outliers or pseudocolor plots.
A numerical value for number of cells or percentage (with statistics) is provided.
Methodology
Sample preparation
Hepa 1-6 were detached using trypsin, blocked in full medium, centrinfuged and resuspended in PBS.
Instrument
CytoFLEX S (Beckman Coulter) and FACSAria Fusion Cell Sorter (BD Biosciences).
Software
Flow cytometry was performed using CytoFLEX S (Beckman Coulter) and raw data were analyzed using FCS express (DeNovo Software).
Cell population abundance
Sorted cells: >100.000 cells; purity >95% by CytoFLEX S analysis.
Gating strategy
Cell aggregates and debries were excluded by gaiting cells on the diagonal of FSC-H/FSC-A plot. Then, viable cells were defined as FSC-high and SSC-low population. Wild-type Hepa 1-6 was used to set gates for tdTomato-negative cells.
Tick this box to confirm that a figure exemplifying the gating strategy is provided in the Supplementary Information.