تلوث البلاستيك في المجال البحري منتشر على نطاق واسع، حيث تم توجيه معظم الاهتمام العلمي إلى البلاستيك الكبير والبلاستيك الدقيق.. بالمقابل، النانو بلاستيك في المحيطات (تظل غير محددة إلى حد كبير، مما يترك فجوات في فهمنا لميزانية الكتلة لهذه الفئة من البلاستيك. هنا نقيس تركيزات النانو بلاستيك على نطاق حوض المحيط على طول مقطع عرضي يعبر شمال المحيط الأطلسي من الدوامة شبه الاستوائية إلى الرف الأوروبي الشمالي. نجد تقريبًا من جزيئات البلاستيك النانوية من البولي إيثيلين تيريفثاليت (PET) والبولي ستيرين (PS) والبولي فينيل كلوريد (PVC) في عمود الماء بأكمله. في المتوسط، نلاحظ تركيزًا أعلى بمقدار 1.4 مرة من الجزيئات البلاستيكية النانوية في الطبقة المختلطة مقارنةً بعمق المياه المتوسطة، مع أعلى تركيزات للجزيئات البلاستيكية النانوية في الطبقة المختلطة بالقرب من القارة الأوروبية. تركيزات الجزيئات البلاستيكية النانوية في عمق المياه المتوسطة أعلى بمقدار 1.8 مرة في الدوامة شبه الاستوائية مقارنةً بالمحيط الأطلسي المفتوح خارج الدوامة. أدنى تركيزات للجزيئات البلاستيكية النانوية، بحواليفي المتوسط، وتتكون بشكل أساسي من PET، توجد في المياه القاعية. بالنسبة للطبقة المختلطة من شمال المحيط الأطلسي المعتدل إلى شبه الاستوائي، نقدر أن كتلة النانو بلاستيك قد تصل إلى 27 مليون طن. هذا في نفس النطاق أو يتجاوز التقديرات السابقة لميزانية البلاستيك الكبير/البلاستيك الصغير لكامل المحيط الأطلسي.أو المحيط العالميتشير نتائجنا إلى أن النانو بلاستيك يشكل النسبة السائدة من تلوث البلاستيك البحري.
تمت إثارة المخاوف بشأن البلاستيك في البيئة بالفعل في الستينيات (المرجع 9). وبحلول الآن، أصبح واحدًا من أكبر المخاطر البيئية المعاصرة.، مع تراكم البلاستيك في كل موطن طبيعي معروفنسبة كبيرة من الإنتاج العالمي السنوي من البلاستيك تنتهي في المحيطعلى سبيل المثال، من خلال النقل النهريترسيب جويوالتخلص المباشر من النفايات على السواحل أو من السفنيعتمد مصير الحطام البلاستيكي في المحيط على عدة عوامل، بما في ذلك كثافة العناصر البلاستيكية ونقلها على سطح المحيط.تشمل نقاط تراكم البلاستيك العائم الخلجان ومناطق التقارب، مثل دوامات المحيطات شبه الاستوائية.وأن جزءًا كبيرًا من النفايات البلاستيكية البحرية يُعاد ترسيبه على طول السواحليمكن أن تتدهور البلاستيك أيضًا: تؤثر حركة الأمواج على الإجهاد القصي، وتسبب الأشعة فوق البنفسجية الشمسية الأكسدة الضوئية، ويمكن أن تضعف الميكروبات أيضًا السلامة الهيكلية للبلاستيك بحيث تصبح العناصر الكبيرة من البلاستيك (الحجم: ) شظية إلى جزيئات بلاستيكية دقيقة (الحجم: إلى 5 مم) والميكروبلاستيك (الحجم:على وجه الخصوص، تم مناقشة التحلل الضوئي كعملية رئيسية في تكسير النفايات البلاستيكية العائمة على سطح البحر، ومن المحتمل أنه يوفر مصدرًا مستمرًا لجزيئات النانو بلاستيك إلى المحيط.مع آثار سلبية محتملة على الحياة البحريةعلى عكس البلاستيكات الكبيرة والبلاستيكات الدقيقة، فإن انتشار البلاستيكات النانوية لا تحكمه خصائص الطفو. مع انخفاض حجم الجسيمات، تتحكم التصريف بشكل أكبر في تصادم النانو بلاستيك مع جزيئات الماء والحركة البراونية..
توجد جزيئات البولي إيثيلين (PE) والبولي ستيرين (PS) والبولي فينيل كلوريد (PVC) والبولي إيثيلين تيريفثاليت (PET) كنانوبلاستيك في المحيط.لكن توزيع وتركيز النانو بلاستيك، سواء من الناحية الجغرافية أو على عمق معين، غير معروف تقريبًا. هذه الفجوة المعرفية موجودة لأن من الصعب أخذ عينات وتحليل النانو بلاستيك عند تركيزات ذات صلة بيئيًا.. لذلك، لا تُدرج النانو بلاستيك في أي تقديرات ميزانية البلاستيك في المحيطات . هذا يعيق فهمنا الشامل للتأثير البيئي المحتمل والمخاطر الصحية لتلوث البلاستيك البحري. توزيع حجم البلاستيك في المحيط المنحرف نحو أقطار الجسيمات الأصغرومع ذلك، تشير إلى أن النانو بلاستيك قد يكون ملوثًا مهمًا على مستوى العالم.
خلال رحلة بحثية مع السفينة RV Pelagia في عام 2020، قمنا بأخذ عينات من عمود الماء من سطح البحر إلى القاع عبر شمال المحيط الأطلسي من الدوامة شبه الاستوائية إلى الرف الأوروبي الشمالي (الشكل 1) وقمنا بقياس النانو بلاستيك باستخدام مطيافية الكتلة بتفاعل نقل البروتون بالحرارة (TD-PTR-MS). تتيح هذه الطريقة تحديد العمود الفقري للبلاستيك بالإضافة إلى قياس جزيئات النانو بلاستيك في مياه البحر باستخدام خوارزميات التعرف..
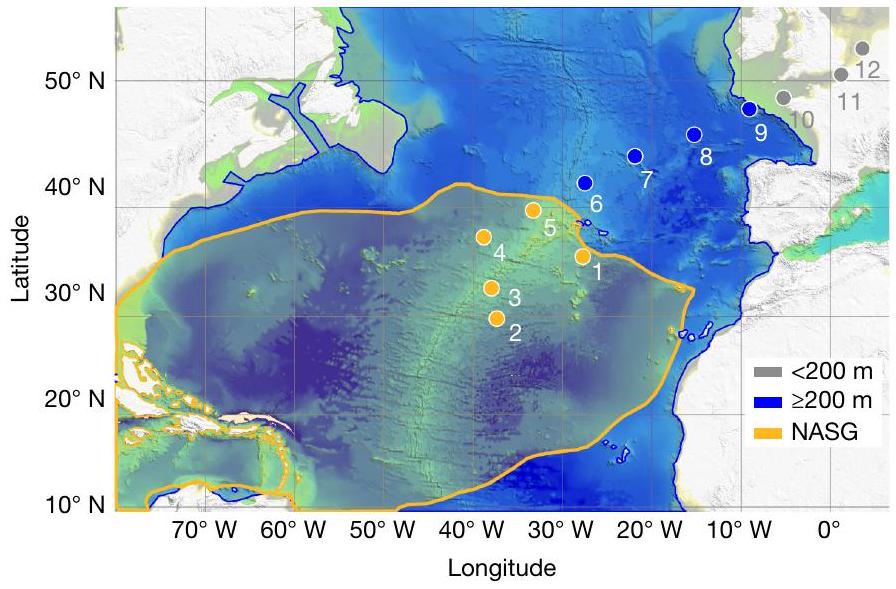
الشكل 1|خريطة لمحطات الهيدروكاست الاثني عشر على طول مقطع عرضي يعبر شمال المحيط الأطلسي من الدوامة شبه الاستوائية إلى الرف الأوروبي الشمالي. تقع المحطات 1-5 في الدوامة الشمالية الأطلسية (‘الدوامة’)، والمحطات 6-9 في المحيط المفتوح (أي، عمق الماء; ‘الدوامة الخارجية’) بين الرف و NASG والمحطات 10-12 تقع على الرف الأوروبي (عمق المياه أقل من 200 م؛ ‘ساحلي’). يتم تمييز مدى NASG (البيانات الموسعة الأشكال 5 و 6) باللون البرتقالي والجزء المتبقي من المحيط المفتوح شبه الاستوائي إلى المعتدل في شمال الأطلسي (إلى ) مميز باللون الأزرق. تم تجميع بيانات الأعماق من قواعد البيانات المتاحة مجانًا من GEBCO (https://www.gebco.net/) و EMODnet (https://emodnet.ec.europa.eu/en) وتم إنشاء الخريطة باستخدام حزمة برامج Global Mapper.
الوجود الشامل للنانوبلاستيك
تم استرداد عينات لتحليل النانو بلاستيك من 12 محطة هيدروكاست، حيث كانت المحطات 1-5 تقع في دوامة شمال الأطلسي شبه الاستوائية (NASG؛ ‘دوامة’)، وكانت المحطات 6-9 في المحيط المفتوح ولكن خارج الدوامة (‘خارج الدوامة’)، وكانت المحطات 10-12 على الرف الأوروبي (‘ساحلي’) (الشكل 1).
تم أخذ عينات من الطبقة المختلطة للمحيط على عمق 10 أمتار (انظر الشكل 5c في البيانات الموسعة لمدى عمق الطبقة المختلطة في المحطات). تتكون النانو بلاستيك في هذه الطبقة من PVC و PET و PS فينطاق عند جميع محطات الهيدروكاست الاثني عشر (الشكل 2أ)، مما يصل إلى تركيز إجمالي للنانوبلاستيك (PVC + PET + PS) يبلغ حوالي (المتوسط ± الخطأ المعياري). في عينة واحدة (المحطة 8؛ الطبقة المختلطة)، تم الكشف عن البولي بروبيلين (PP) وكربونات البولي بروبيلين (PPC) أيضًا (24.27 وعلى التوالي؛ البيانات غير معروضة). نظرًا لأن هذه العينة كانت شاذة مقارنة بجميع النتائج الأخرى، لا يمكننا استبعاد احتمال أن تكون PP وPPC نتيجة للتلوث، وبالتالي، استبعدنا هذه النتائج من التحليلات اللاحقة. وجدنا أن تركيزات النانو بلاستيك الكلية كانتأعلى بمقدار -fold في المحطات ‘الساحلية’ ( عند مقارنتها بمناطق المحيط المفتوح (الشكل 2د). كانت الاختلافات في تركيزات النانو بلاستيك ناتجة بشكل رئيسي عن أعلى بمقدار -fold PS وتركيزات PET أعلى بمقدار -fold عند مقارنة محطات ‘الساحل’ بمحطات المحيط المفتوح (الشكل البياني الممتد 1). كانت تركيزات PVC، من ناحية أخرى، أعلى قليلاً فقط.-ضعف). أظهرت محطات ‘الدوامة’ تركيزًا متوسطًا أقل من إجمالي النانو بلاستيك. ( ) عند مقارنتها بمحطات ‘الدوامة الخارجية’ ( )، لكن هذا لم يكن ذا دلالة (الشكل 2d). لم يتم العثور على اختلافات ملحوظة للبوليمرات الفردية عند مقارنة محطات ‘الدوامة’ و ‘خارج الدوامة’.
مماثلًا للطبقة المختلطة، وجدنا نانو بلاستيك PVC و PET و PS في الطبقة المتوسطة عندعمق الماء (المحطات 1-9؛ الشكل 2ب) مما يعادل تركيز نانو بلاستيك متوسط قدرهعمق المياه في جميع المحطات ‘الساحلية’ كان، مما يقيّد مقارنة طبقة المياه المتوسطة بمحطات “الدوران” و”خارج الدوران”. أظهرت العمق المتوسط في محطات “الدوران” تركيزًا أعلى بمقدار 1.8 مرة من متوسط تركيز النانو بلاستيك الكلي ( ) مقارنة بمحطات ‘الدوران الخارجي’ ( ; الشكل 2e).
على عكس الوجود الشامل لجميع أنواع البوليمرات في الطبقة المختلطة، لم نتمكن من ملاحظة وجود PS وPVC وPET عبر المحطات بشكل متسق. كانت تركيزات نانو بلاستيك PET أعلى بمقدار 2.5 مرة في ‘الدوامة’ مقارنة بمحطات ‘خارج الدوامة’. كانت تركيزات PVC وPS في محطات ‘الدوامة’ و’خارج الدوامة’ متشابهة (الشكل البياني الممتد 1).
احتوت مياه قاع المحيط (المأخوذة من 30 م فوق قاع البحر) على كميات كبيرة من PET، بينما كانت PVC و PS، باستثناء محطة واحدة، تحت حد الكشف (الشكل 2c). كان متوسط تركيز النانو بلاستيك في مياه القاع هو على طول المقطع من المحطات 1 إلى 9. بسبب عمق المياه الضحل في المحطات 10-12، تم أخذ عينات من مياه القاع في هذه المحطات على ارتفاع حوالي فوق قاع البحر (وليس 30 م فوق قاع البحر) وبالتالي تم استبعادها من المقارنة الإحصائية. تم ملاحظة أعلى تركيز إجمالي للنانو بلاستيك في المحطة 8، والتي تتكون حصريًا من PET (الشكل 2c). لم يتم العثور على اختلافات كبيرة في تركيزات النانو بلاستيك الإجمالية عند مقارنة مياه القاع من محطات ‘الدوامة’ و ‘خارج الدوامة’ (الشكل 2f).
قمنا بتقييم التوزيع العمودي للنانو بلاستيك في عمود مياه شمال المحيط الأطلسي من خلال حساب متوسط تركيزات النانو بلاستيك الإجمالية على طول قسم المحيط المفتوح من المقطع (المحطات 1-9) لكل فترة عمق (الشكل 2g). انخفض متوسط تركيز النانو بلاستيك الإجمالي بمقدار 1.4 مرة، من طبقة مختلطة إلى مياه متوسطة، وبشكل رئيسي بمقدار 2.0 مرة من المياه المتوسطة إلى مياه القاع (الشكل 2h). بدا أن الانخفاض في PVC و PS، بمقدار 2.6 مرة و 2.0 مرة، على التوالي، من الطبقة المختلطة إلى المياه المتوسطة و 12.1 مرة و 13.3 مرة من المياه المتوسطة إلى مياه القاع كان ثابتًا بشكل مقارن (الشكل 1 من البيانات الموسعة). من ناحية أخرى، ظلت تركيزات PET مرتفعة نسبيًا في جميع أنحاء عمود المياه.
التحكم في توزيع النانو بلاستيك
تشير تركيزات النقاط الساخنة في الطبقة المختلطة بالقرب من القارة الأوروبية (الشكل 2d) وإلى حد أقل، في المياه المتوسطة في NASG (الشكل 2e) إلى مصدرين للنانو بلاستيك. قد تدخل النانو بلاستيك إلى المحيط عبر نفس الطرق التي تدخل بها البلاستيكات الكبيرة والصغيرة، أي عن طريق الأنهار وجريان مياه السطح (الشكل 2i). أيضًا، يمكن أن تصبح النانو بلاستيك من اليابسة في الهواء وتنتقل كأيروسولات نانو بلاستيك، مما يدخل المحيط في النهاية من خلال الترسيب الرطب والجاف . ثم يتم إدخال مياه الطبقة المختلطة ذات تركيزات النانو بلاستيك العالية نسبيًا مع مياه بعيدة أقل تلوثًا (الشكل 2d)، مما يفسر اكتشافنا لانخفاض تركيزات النانو بلاستيك بعيدًا عن الساحل. على الرغم من أن الترسيب الجوي للبلاستيكات الصغيرة والنانو بلاستيك إلى سطح المحيط ليس مقيدًا في دراستنا، يبدو من المحتمل أن هذا ينخفض في عرض البحر تمامًا كما هو الحال بالنسبة لمصادر الأيروسول الأخرى المستندة إلى اليابسة . ومع ذلك، تتجمع البلاستيكات الكبيرة والصغيرة العائمة عمومًا في الدوامات شبه الاستوائية ومن المحتمل أن تطلق نانو بلاستيك ثانوية، ناتجة عن استمرار تفتت البلاستيك العائم من خلال إجهاد القص (الموجات) والتحلل الضوئي (الضوء فوق البنفسجي الشمسي) . وبالتالي، تشير الفروق المعتدلة في تركيزات النانو بلاستيك بين محطات ‘الدوامة’ و ‘خارج الدوامة’ (الشكل 2d) إلى أن تركيزات النانو بلاستيك في الطبقة المختلطة قد تكون متجانسة أفقيًا نتيجة لتشتت القص والخلط المضطرب الناتج عن الرياح . أيضًا، قد يتم إعادة توزيع النانو بلاستيك من خلال تفاعلات الهواء والبحر. يمكن أن يتم إطلاق الجسيمات إلى الغلاف الجوي من خلال طرد فقاعات الهواء وتبخير الرذاذ ، بعد ذلك يمكن نقلها لمسافات طويلة تصل إلى مئات الكيلومترات في الغلاف الجوي قبل إعادة ترسيبها في المحيط .
التوزيع العمودي للنانو بلاستيك
مقارنةً بالطبقة المختلطة، يظهر نمط توزيع مختلف للنانو بلاستيك عند عمق المياه، مع وجود حد أقصى أكثر وضوحًا في تركيزات النانو بلاستيك عند محطات ‘الدوامة’ (الشكل 2d,e). هنا، تعكس الفروق في تركيزات النانو بلاستيك الفروق النسبية
الشكل 2 | التوزيع الأفقي والعمودي للنانو بلاستيك في عمود المياه في شمال المحيط الأطلسي. أ-ج، متوسط تركيزات النانو بلاستيك من PVC و PET و PS في 12 محطة على طول مقطع من NASG (‘الدوامة’; المحطات 1-5)، المحيط المفتوح بين الرف والدوامة (‘خارج الدوامة’; المحطات 6-9) وعند كسر الرف أو على الرف الأوروبي (‘الساحلي’; المحطات 10-12). تم قياس تركيزات النانو بلاستيك عند ثلاثة أعماق مائية من الطبقة المختلطة (10 م تحت مستوى سطح البحر، mbsl) (أ)، الطبقة المتوسطة (; فقط المحطات البحرية 1-9) (ب) وطبقة القاع (30 م فوق قاع البحر عند المحطات البحرية 1-9 و 5-10 م فوق قاع البحر عند المحطات الساحلية 10-12) (ج). تمثل أشرطة الخطأ الانحراف المعياري للقياسات المأخوذة في كل محطة. د-و، إجمالي (PS + PET + PVC) تركيزات النانو بلاستيك للمجموعات الثلاث ‘الدوامة’، ‘خارج الدوامة’ و ‘الساحلي’ في الطبقة المختلطة (د)، الطبقة المتوسطة (هـ) وطبقة القاع (و) موضحة كرسوم بيانية صندوقية. ز، ح، بالنسبة للمحيط المفتوح (المحطات 1-9)،
تم عرض متوسط التركيزات على العمق لتركيزات النانو بلاستيك الفردية (ز) أو الإجمالية (ح). في ز، تمثل أشرطة الخطأ الانحراف المعياري لتركيزات النانو بلاستيك في كل فئة عمق. تشير جميع الرسوم البيانية الصندوقية إلى النسب المئوية للوسيط، مع امتداد الشوارب إلى نقاط البيانات التي تقع ضمن 1.5 من الربع. يتم الإشارة إلى نقاط البيانات التي تقع خارج هذا النطاق بواسطة ماسة. يتم الإشارة إلى القيمة المتوسطة بالنقطة البيضاء. تم تحليل الفروق بين المجموعات باستخدام اختبار ANOVA أحادي الاتجاه و -اختبار لمقارنة المتوسطات. تم الإشارة إلى مستويات الأهمية مع و ) .نظرة عامة على متوسط تركيزات النانو بلاستيك والخطأ القياسي (بالـ ) في مناطق ‘الدوامة’ و ‘خارج الدوامة’ و ‘الساحلي’. تم تسليط الضوء على الأصول المحتملة للنانو بلاستيك وعمليات النقل.
في تركيزات البلاستيكات الكبيرة والصغيرة العائمة والغاطسة . يشير هذا إلى فصل العمليات التي تحدد التوزيع الأفقي للنانو بلاستيك في الطبقة المختلطة مقابل الطبقات المائية الأعمق. في الواقع، تفصل الطبقات المائية هذه (الشكل 2 من البيانات الموسعة) وبالتالي تقلل بشكل كبير من تبادل المذاب بين الكتلتين المائيتين. ومع ذلك، يمكن أن تعبر الجسيمات والكتل (على سبيل المثال، الثلج البحري) عن خط الفصل . وبالتالي، بالإضافة إلى أنماط الدوران المتغيرة والتصنيف، قد تؤثر الفروق في الإنتاجية عبر مقاطعات المحيط أيضًا على توزيع النانو بلاستيك. ومع ذلك، فإن عتبة الترشيح تستبعد الثلج البحري، مما يمنعنا من حساب معظم النانو بلاستيك المجمع. تم العثور على PVC و PS و، الأهم من ذلك، PET تساهم بشكل كبير في تجمع البلاستيكات الكبيرة والصغيرة الغاطسة مباشرة تحت الطبقة المختلطة (حوالي 100-300 م عمق المياه) في كل من مناطق ‘الدوامة’ و ‘خارج الدوامة’ في شمال المحيط الأطلسي . علاوة على ذلك، تم إثبات وجود نانو بلاستيك PET عند أعماق مياه مؤخرًا . إن غرق البلاستيكات الكبيرة والصغيرة واستمرار تفتت الجسيمات الغاطسة والغارقة هي بالتالي عامل مهم على ما يبدو في تحديد تركيز النانو بلاستيك وتوزيعه في الطبقة المائية المتوسطة. تم العثور على وفرة من الجسيمات البلاستيكية، تتكون بشكل أكبر من البوليستر، على وفي رواسب أعماق البحار . لذا فإن إنتاج النانو بلاستيك من الجسيمات الدقيقة والغليظة الغارقة هو أقل تفسير اقتصادي لوجود النانو بلاستيك في مياه القاع، بالإضافة إلى غرق كتل النانو بلاستيك. عند هذه الأعماق تحت منطقة الإبيبالاجيك، سيكون قد انخفضت عملية الأكسدة الضوئية، على الرغم من أن التفتت المستمر يمكن أن يكون نتيجة للتحلل الضوئي السابق . يمكن أن تكون هناك آليات أخرى محتملة تساهم في إنتاج النانو بلاستيك مثل الإجهاد الميكانيكي ، على الرغم من أن ذلك بدرجة أقل من الطبقة المختلطة، والتحلل البيولوجي، بما في ذلك التحلل الميكروبي للبلاستيكات الكبيرة والصغيرة ، بالإضافة إلى ابتلاع أو هضم البلاستيكات الصغيرة بواسطة الكائنات الكبيرة . تراكم النانو بلاستيك في طبقة نيفلوييد – والتي، في بعض المناطق في شمال المحيط الأطلسي، يمكن أن تمتد حتى 800 م فوق قاع البحر بالإضافة إلى إعادة تعليق الرواسب وإعادة تحريك النانو بلاستيك المحتمل ترسبه، قد تسهم هذه العوامل بشكل أكبر في زيادة تركيزات النانو بلاستيك في المياه القاعية. بدأت إنتاج الكتلة البلاستيكية في الخمسينيات، لكن عمر مياه القاع في المحيط الأطلسي شبه الاستوائي يزيد عن 400 عام (مرجع 54). وبالتالي، يبدو أن تشكيل الكتلة المائية في الأعماق والتموج الحراري الملحي غير مرجح أن يفسر وجود النانو بلاستيك في المياه القاعية.
ميزانية كتلة النانو بلاستيك في الطبقة المختلطة
في الطبقة المختلطة داخل ‘الدوران’ (المحطات 1-5)، قمنا بقياس متوسط تركيزات النانو بلاستيك لـ، ). تتناقض هذه البيانات مع التقارير السابقة التي تقيس تركيزات البلاستيك الكبير والبلاستيك الدقيق بشكل مباشر. في نفس المحطات التي تم قياسها هنا، كانت كتلة البلاستيك الكبير والبلاستيك الدقيق ( ; التي تتكون أساسًا من البولي إيثيلين والبولي بروبيلين) وُجد أنها تبلغ حوالي على سطح البحر و (يتكون أساسًا من PET) على عمق في الطبقة المختلطةميكروبلاستيك أعلىتركيزات الكتلة حوالي (تتكون أساسًا من البولي بروبيلين والبولي إيثيلين) على سطح البحر و (يتكون أساسًا من PE و PP و PS) عند العمق تم العثور عليها في محطتين أخريين في الطبقة المختلطة من NASG. أيضًا، تم نمذجة التركيزات مؤخرًا لتصل إلىمن البلاستيكات الكبيرة العائمة والميكروبلاستيك، بشكل أساسي PE و PP و PS) على سطح البحر في NASGأقل من تركيزات النانو بلاستيك التي قمنا بقياسها.
لتقدير ميزانية كتلة النانو بلاستيك في الطبقة المختلطة، أخذنا في الاعتبار عمق الطبقة المختلطة المناخي المتوسط لشهر نوفمبر (المشار إليه بالخطوط في الشكل الإضافي 5c) ومنطقة شمال الأطلسي المعتدل إلى شبه الاستوائي. وهذه المنطقة محاطة بالدوران الفرعي شمالوبالامتداد الجنوبي لـ NASG عند (البيانات الموسعة الأشكال 5 و 6). كان حجم طبقة الخلط المناخيةلـ NASG وللمحيط الأطلسي الشمالي المعتدل إلى شبه الاستوائي المتبقي (الشكل 5c من البيانات الموسعة). حيث إن قياسات تركيز البلاستيك الكلي عرضة بطبيعتها للتحيز المنهجي.، يوفر ما يلي تقييم ميزانية محدد للبوليمر. فيما يتعلق بقياساتنا في الطبقة المختلطة في ‘الدوامة’ (المحطات 1-5)، فإن إجمالي كتلة النانو بلاستيك يصل إلىبالنسبة للطبقة المختلطة في منطقة ‘الدوامة الخارجية’ (المحطات 6-9)، أسفرت تقديراتنا عن إجمالي كتلة النانو بلاستيكبلاستيكملاحظة،PVC). هذا أعلى بكثير من الكتلة المودلة حديثًا للماكرو بلاستيك والميكرو بلاستيك من البلاستيك العائم في الطبقة المختلطة، والتي تبلغ 0.31 مليون طن للـ ‘دوامة’ و0.05 مليون طن لبقية شمال الأطلسي المعتدل إلى شبه الاستوائي..
نظرًا لقدرة النانو بلاستيك على عبور الحواجز البيولوجيةنقلتراكم حيويوتتفاعل كيميائيًا بمعدلات سريعةقد تمثل النانو بلاستيك الحجم البلاستيكي الأكثر إشكالية لحياة المحيطات. ومن الجدير بالذكر أن معظم الدراسات التي تقيم تأثيرات وسمية النانو بلاستيك تستخدم تركيزات أساسية من النانو بلاستيك غير مدعومة بقياسات بيئية قوية. على الرغم من أنه تم إظهار الآليات التي تساهم في إنشاء نانو بلاستيك ثانوي من البلاستيكات الكبيرة والميكرو بلاستيك في المحيط.فقط ثلاث دراسات كانت قادرة على اكتشاف هذه المركبات في عمود مياه المحيط. توفر هذه الدراسة، حسب علمنا، أول دليل كمي على الوجود الشامل لجزيئات النانو من PET وPVC وPS من الطبقة المختلطة إلى قاع البحر العميق عبر شمال الأطلسي المعتدل إلى شبه الاستوائي. تشير قياساتنا المستندة إلى التوزيع المكاني بقوة إلى أن جزيئات النانو تمثل أكبر نسبة من ميزانية الكتلة البلاستيكية البحرية. وهذا يعني أن الكتلة الإجمالية للبلاستيك في المحيط أعلى مما كان يُعتقد سابقًا، لأن جزيئات النانو لم تُؤخذ في الاعتبار في تقييمات ميزانية البلاستيك البحرية.تؤكد نتائجنا على الحاجة إلى تحديد أصل وتكوين ونقل النانو بلاستيك، بالإضافة إلى مصيرها المستقبلي في المحيط.
المحتوى عبر الإنترنت
أي طرق، مراجع إضافية، ملخصات تقارير Nature Portfolio، بيانات المصدر، بيانات موسعة، معلومات تكميلية، شكر وتقدير، معلومات مراجعة الأقران؛ تفاصيل مساهمات المؤلفين والمصالح المتنافسة؛ وبيانات توفر البيانات والرموز متاحة علىhttps://doi.org/10.1038/s41586-025-09218-1.
14. ماتيريتش، د. وآخرون. قياسات النانو بلاستيك في الجليد القطبي الشمالي والجنوبي. البحث البيئي 208، 112741 (2022). 15. جامبيك، ج. ر. وآخرون. مدخلات نفايات البلاستيك من اليابسة إلى المحيط. ساينس 347، 768-771 (2015). 16. ليبرتون، ل. س. م. وآخرون. انبعاثات البلاستيك من الأنهار إلى محيطات العالم. نات. كوميون. 8، 15611 (2017). 17. ميجر، ل. ج.، فان إيمريك، ت.، فان دير إنت، ر.، شميت، ج. ولبريتون، ل. أكثر من 1000 نهر تمثلانبعاثات البلاستيك النهرية العالمية إلى المحيط. Sci. Adv. 7، eaaz5803 (2021). 18. إيفانجيليو، ن. وآخرون. النقل الجوي هو مسار رئيسي للميكروبلاستيك إلى المناطق النائية. نات. كوميونيك. 11، 3381 (2020). 19. ويليس، ك.، دينيس هاردستي، ب.، كريووكين، ل. و ويلكوكس، ج. تمييز بين إلقاء النفايات، جريان المياه الحضرية والنقل البحري كمصادر للحطام البحري في البيئات الساحلية والمصبات. Sci. Rep. 7، 44479 (2017). 20. أونيك، ف.، يونغيديك، س. إ.، هوفمان، م. ج.، فان سيبيل، إ. ولوافكوتير، س. محاكاة عالمية لنقل البلاستيك البحري تظهر احتجاز البلاستيك في المناطق الساحلية. رسائل البحث البيئي 16، 064053 (2021). 21. جيغو، ج. وآخرون. الرأي الحالي: ما هو النانو بلاستيك؟ التلوث البيئي 235، 1030-1034 (2018). 22. لامبرت، س. وواجنر، م. تشكيل جزيئات مجهرية أثناء تحلل بوليمرات مختلفة. كيموسفير 161، 510-517 (2016). 23. تر هالي، أ. وآخرون. إلى أي مدى تتعرض الجزيئات البلاستيكية الدقيقة من المحيط المفتوح للتآكل؟ تلوث البيئة 227، 167-174 (2017). 24. ديلري، أ. وآخرون. التحلل الضوئي للبلاستيك تحت ظروف بحرية محاكاة. مجلة تلوث البحر. 187، 114544 (2023). 25. ما، ي. وآخرون. تأثيرات النانو بلاستيك والميكرو بلاستيك على السمية، التراكم الحيوي، والمصير البيئي للفينانثرين في المياه العذبة. تلوث البيئة. 219، 166-173 (2016). 26. زكي، م. ر. م. وأريس، أ. ز. نظرة عامة على آثار النانو بلاستيك على الكائنات البحرية. العلوم. البيئة الكاملة 831، 154757 (2022). 27. صن، هـ.، جياو، ر. ووانغ، د. الفرق في آلية التجميع بين الميكروبلاستيك والنانو بلاستيك: دور الحركة البراونية وقوة الطبقة الهيكلية. تلوث البيئة 268، 115942 (2021). 28. تير هالي، أ. وآخرون. النانو بلاستيك في دوامة شمال الأطلسي شبه الاستوائية. علوم البيئة والتكنولوجيا 51، 13689-13697 (2017). 29. شوافرتس، سي.، نيسنر، ر.، إلسنر، م. وإيفليفا، ن. ب. طرق تحليل جزيئات البلاستيك تحت الميكرومتر والنانو في البيئة. اتجاهات الكيمياء التحليلية 112، 52-65 (2019). 30. فيليميروفيتش، م.، تيريز، ك.، فوسبويلز، س. وفانهايكي، ف. التطورات الأخيرة في مطيافية الكتلة لتوصيف الحطام البلاستيكي على المقياس الميكروي والنانوي في البيئة. تحليل. الكيمياء التحليلية 413، 7-15 (2021). 31. لورينز، سي. وآخرون. التوزيع المكاني للميكروبلاستيك في الرواسب والمياه السطحية من بحر الشمال الجنوبي. التلوث البيئي 252، 1719-1729 (2019). 32. بولان، م. وآخرون. الجزيئات البلاستيكية الصغيرة كمساهم رئيسي في توازن الكتلة البلاستيكية في دوامة شمال الأطلسي شبه الاستوائية. علوم البيئة والتكنولوجيا 53، 1157-1164 (2018). 33. Materić، D. وآخرون. الميكرو والبلاستيك النانوي في ثلوج الألب: طريقة جديدة للتحديد الكيميائي و(نصف) الكمية في نطاق النانوغرام. علوم البيئة والتكنولوجيا 54، 2353-2359 (2020). 34. سوليفان، ج. ل. وآخرون. الكشف عن جزيئات البلاستيك النانوية (تحت الميكرون) في عينات المياه باستخدام التحليل الحراري-الكروماتوغرافيا الغازية مع قياس الطيف الكتلي بتقنية زمن الرحلة (PY-GCToF). كيموسفير 249، 126179 (2020). 35. كاو، د. وآخرون. تركيزات الميكرو بلاستيك والنانو بلاستيك الدقيقة في عينات المواد الجزيئية من الموقع العالي الألبي سونبليك، النمسا. كيموسفير 352، 141410 (2024). 36. ألين، د. وآخرون. الميكروبلاستيك والنانو بلاستيك في بيئة المحيط-الجو. مراجعة الطبيعة: الأرض والبيئة 3، 393-405 (2022). 37. يو، هـ. وآخرون. تقديرات ترسيب الغبار الأفريقي على طول العبور عبر المحيط الأطلسي باستخدام السجل الذي يمتد لعقد من الزمن لقياسات الهباء الجوي من CALIOP وMODIS وMISR وIASI. مجلة أبحاث الجيوفيزياء: الغلاف الجوي 124، 7975-7996 (2019). 38. لو، ك. ل. وآخرون. تراكم البلاستيك في الدوامة شبه الاستوائية في شمال الأطلسي. ساينس 329، 1185-1188 (2010). 39. لامبرت، س. وواجنر، م. توصيف النانو بلاستيك أثناء تحلل البوليسترين. كيموسفير 145، 265-268 (2016). 40. فاغنر، س. وريمستما، ت. الأشياء التي نعرفها ولا نعرفها عن النانو بلاستيك في البيئة. نات. نانو تكنولوجي. 14، 300-301 (2019). 41. ليانغ، ج.-هـ.، وان، إكس.، روز، ك. أ.، سوليفان، ب. ب. ومكويليامز، ج. سي. التشتت الأفقي للمواد العائمة في طبقة الحدود السطحية للمحيط. مجلة الفيزياء المحيطية 48، 2103-2125 (2018). 42. كوكولكا، ت.، بروسكوروسكي، ج.، موريه-فيرغسون، س.، ماير، د. و. & لو، ك. ل. تأثير خلط الرياح على التوزيع العمودي للحطام البلاستيكي العائم. رسائل أبحاث الجيوفيزياء 39، L07601 (2012). 43. مصري، م. وآخرون. دليل تجريبي على انتقال الجسيمات البلاستيكية عند واجهة الماء-الهواء من خلال انفجار الفقاعات. تلوث البيئة. 280، 116949 (2021). 44. ترينيك، م. وآخرون. جزيئات البلاستيك الدقيقة المحمولة جواً تم اكتشافها في الغلاف الجوي البحري النائي. اتصالات. الأرض والبيئة 1، 64 (2020). 45. بويd، ب. و.، كلستري، هـ.، ليفي، م.، سيجل، د. أ. وويبر، ت. مضخات الجسيمات متعددة الأوجه تدفع احتجاز الكربون في المحيط. ناتشر 568، 327-335 (2019). 46. إيرني-كاسولا، ج.، زادجيلوفيتش، ف.، جيبسون، م. آي. وكريستي-أوليزا، ج. أ. توزيع أنواع البوليمرات البلاستيكية في البيئة البحرية؛ تحليل ميتا. مجلة المواد الخطرة 369، 691-698 (2019). 47. وودال، ل. س. وآخرون. البحر العميق هو مصب رئيسي لحطام الميكروبلاستيك. ر. سوس. أوبن ساي. 1، 140317 (2014). 48. جيويرت، ب.، بلاسمان، م. م. وماكلود، م. مسارات تحلل البوليمرات البلاستيكية العائمة في البيئة البحرية. العلوم البيئية: العمليات. التأثيرات 17، 1513-1521 (2015). 49. إنفرين، م. وآخرون. إطلاق ملوثات نانوية خطرة بسبب تفتت البلاستيكات الدقيقة تحت تأثير قوى القص. مجلة المواد الخطرة 384، 121393 (2020). 50. Lv، س. وآخرون. التوليد المستمر وإطلاق الميكروبلاستيك والنانو بلاستيك من البوليسترين بواسطة بكتيريا بحرية قادرة على تحلل البلاستيك. مجلة المواد الخطرة 465، 133339 (2024). 51. داوسون، أ. ل. وآخرون. تحويل الميكروبلاستيك إلى نانو بلاستيك من خلال التفتت الهضمي بواسطة الكريل الأنتاركتيكي. نات. كوميون. 9، 1001 (2018). 52. زهاو، ج. وآخرون. تفتت الميكروبلاستيك بواسطة الدوارات في النظم البيئية المائية يساهم في تلوث النانو بلاستيك العالمي. نات. نانو تكنولوج. 19، 406-414 (2024). 53. غاردنر، و. د.، ريتشاردسون، م. ج.، ميشونوف، أ. ف. وبيسكاى، ب. إ. مقارنة عالمية للطبقات النيفلودية القاعية استنادًا إلى 52 عامًا من قياسات النيفيلومتر وقياسات الناقل الضوئي. تقدم في علم المحيطات 168، 100-111 (2018). 54. مatsu مoto، ك. عمر الدورة المعتمد على الكربون المشع للمحيطات العالمية. مجلة أبحاث الجيوفيزياء. المحيطات 112، C09004 (2007). 55. زهاو، ج. و ستينزل، م. هـ. دخول الجسيمات النانوية إلى الخلايا: أهمية خصائص الجسيمات النانوية. كيمياء البوليمرات 9، 259-272 (2018). 56. السد-شيخ، م. وآخرون. امتصاص وتوزيع الجسم بالكامل وإزالة النانو بلاستيك بواسطة المحار بكتين ماكسموس عند تركيزات بيئية واقعية. علوم البيئة والتكنولوجيا 52، 14480-14486 (2018). 57. مياو، ل. وآخرون. التأثيرات الحادة للنانوبلاستيك والميكروبلاستيك على الأغشية الحيوية المحيطية اعتمادًا على حجم الجسيمات والتركيز وتعديل السطح. تلوث البيئة 255، 113300 (2019).
ملاحظة الناشر: تظل شركة سبرينجر ناتشر محايدة فيما يتعلق بالمطالبات القضائية في الخرائط المنشورة والانتماءات المؤسسية.
الوصول المفتوح هذه المقالة مرخصة بموجب رخصة المشاع الإبداعي النسب 4.0 الدولية، التي تسمح بالاستخدام والمشاركة والتكيف والتوزيع وإعادة الإنتاج بأي وسيلة أو صيغة، طالما أنك تعطي الائتمان المناسب للمؤلفين الأصليين والمصدر، وتوفر رابطًا لرخصة المشاع الإبداعي، وتوضح ما إذا تم إجراء تغييرات. الصور أو المواد الأخرى من طرف ثالث في هذه المقالة مشمولة في رخصة المشاع الإبداعي الخاصة بالمقالة، ما لم يُشار إلى خلاف ذلك في سطر الائتمان للمواد. إذا لم تكن المادة مشمولة في رخصة المشاع الإبداعي الخاصة بالمقالة وكان استخدامك المقصود غير مسموح به بموجب اللوائح القانونية أو يتجاوز الاستخدام المسموح به، فستحتاج إلى الحصول على إذن مباشرة من صاحب حقوق الطبع والنشر. لعرض نسخة من هذه الرخصة، قم بزيارةhttp://creativecommons.org/licenses/by/4.0/. (ج) المؤلف(ون) 2025
طرق
أخذ العينات
تم جمع العينات على متن السفينة RV Pelagia خلال الرحلة 64PE480 في نوفمبر 2020. تم أخذ العينات من تسع محطات على طول مقطع عرضي عبر شمال الأطلسي المعتدل إلى شبه الاستوائي وثلاث محطات تقع على الرف القاري الأوروبي (الشكل 1). لتمكين المقارنة بين المحطات المختلفة، تم أخذ عينات من ثلاثة أعماق (10 م وتم أخذ عينات من أعماق المياه و30 مترًا فوق قاع البحر في كل محطة عميقة في المحيط (المحطات 1-9). وبالتالي، كانت العمق الفعلي تحت سطح البحر لأعمق نقطة أخذ عينات يختلف حسب عمق المياه المحلي. تم استخدام جهاز استشعار الموصلية ودرجة الحرارة والعمق (CTD) مع عينة روزيت تتكون من مجموعة من 24 زجاجة نيسكين مصنوعة من بولي تترافلوروإيثيلين (PTFE) ومبطنة بـ PVC بحجم 121 لتوصيف خصائص المياه واستعادة عينات مياه منفصلة. خلال عملية الهيدروكاست، تم إبقاء زجاجات نيسكين مفتوحة بحيث يتم غسلها بالمياه المحلية أثناء النزول والصعود حتى الإغلاق عند العمق المطلوب. بمجرد وضع جهاز استشعار CTD على السطح، تم غسل صنبور الزجاجة والأنابيب المستخدمة لشفط مياه البحر جيدًا بمياه العينة قبل أخذ العينات. ثم، تم شطف زجاجات سعة 2-1 لتر (Fisherbrand, FB8002000) ثلاث مرات بمياه من نظام المياه المقطرة النظيف على السفينة، وبعد ذلك تم شطفها مسبقًا (ثلاث مرات) بمياه العينة من زجاجة نيسكين. أخيرًا، تم سحب عينة سعة 2 لتر من زجاجة نيسكين إلى الزجاجة الزجاجية وتم إغلاقها على الفور بالسدادة. تم تخزين العينات في بيئة مظلمة وباردة حتى يتم تحليلها في مختبراتنا المنزلية. لحماية أنفسنا من مخاوف التلوث، قمنا بإجراء سلسلة من العينات الفارغة في الميدان (انظر قسم ‘ضمان الجودة والسيطرة’).
تحليل TD-PTR-MS
تمت معالجة عينات المياه في مختبر PTR-MS في معهد الأبحاث البحرية والغلاف الجوي في أوترخت. خلال فترة التحليل، تم تنظيف المختبر بشكل شامل وإزالة الغبار أسبوعيًا. عادةً، كان يوجد شخص واحد فقط في المختبر أثناء التحليل لتقليل خطر التلوث المحتمل. تم تضمين العينات الفارغة مع كل دفعة من العينات لحساب خطر التلوث الهوائي. بالنسبة للأعمال المستقبلية، يجب النظر في معالجة العينات في غرفة نظيفة، على الرغم من أن فعالية المختبرات النظيفة في القضاء على تلوث البلاستيك على النانو مقياس غير مؤكدة في الوقت الحالي. تم تجانس عينات 2-I عن طريق هز الزجاجة قبل أخذ عينة فرعية. بعد ذلك مباشرة، تم أخذ عينة مقدارها 10 مل من زجاجة 2-I الزجاجية وتخزينها في قنينة كروماتوغرافيا زجاجية مسبقة الاحتراق (VWR). لفصل النانو بلاستيك عن الميكرو بلاستيك، تم تصفية العينة البالغة 10 مل من خلالفلتر حقنة PTFE. لأغراض التحليل الإضافي، تم إعداد عينات فرعية في ثلاث نسخ، حيث تم نقل 1.5 مل من العينة إلى قنينة زجاجية كروماتوغرافية جديدة تم حرقها مسبقًا. تم إزالة مصفوفة الماء باستخدام نظام تبخر/تسامي.تم إدخال العينات المجففة إلى وحدة PTR-MS من خلال نظام إزالة الحرارة، باستخدام بروتوكول تسخين محدد كما يلي: درجة الحرارة الابتدائية لـ، تليها زيادة سريعة في إلىثم زيادة في درجة الحرارة إلىبمعدلوأخيرًا، تم زيادة درجة الحرارة إلىبمعدل. كانت مدة الإقامة النهائية دقيقة واحدة عند تم نقل المركبات التي تم إزالة حرارتها بواسطة تيار ثابت من الهواء الخالي عند 50 SCCM إلى جهاز PTR-ToF-MS (PTR-TOF 8000، أيونيكون أناليتك). تم ضبط درجة حرارة المدخل علىوتم ضبط معلمات تشغيل أنبوب الانجراف على و ، مما أدى إلى حوالي 120 Td.
تحديد كمية النانو بلاستيك
تم استخدام برنامج PTRwid لاستخراج طيف الكتلة. لتقليل البيانات، تم حساب متوسط طيف الكتلة على مدى فترة زمنية قدرها 5 دقائق بمجرد أن وصلت وحدة التسخين الحراري إلى درجة حرارة أي أننا اعتبرنا فقط نافذة الوقت من إلى ، خلال
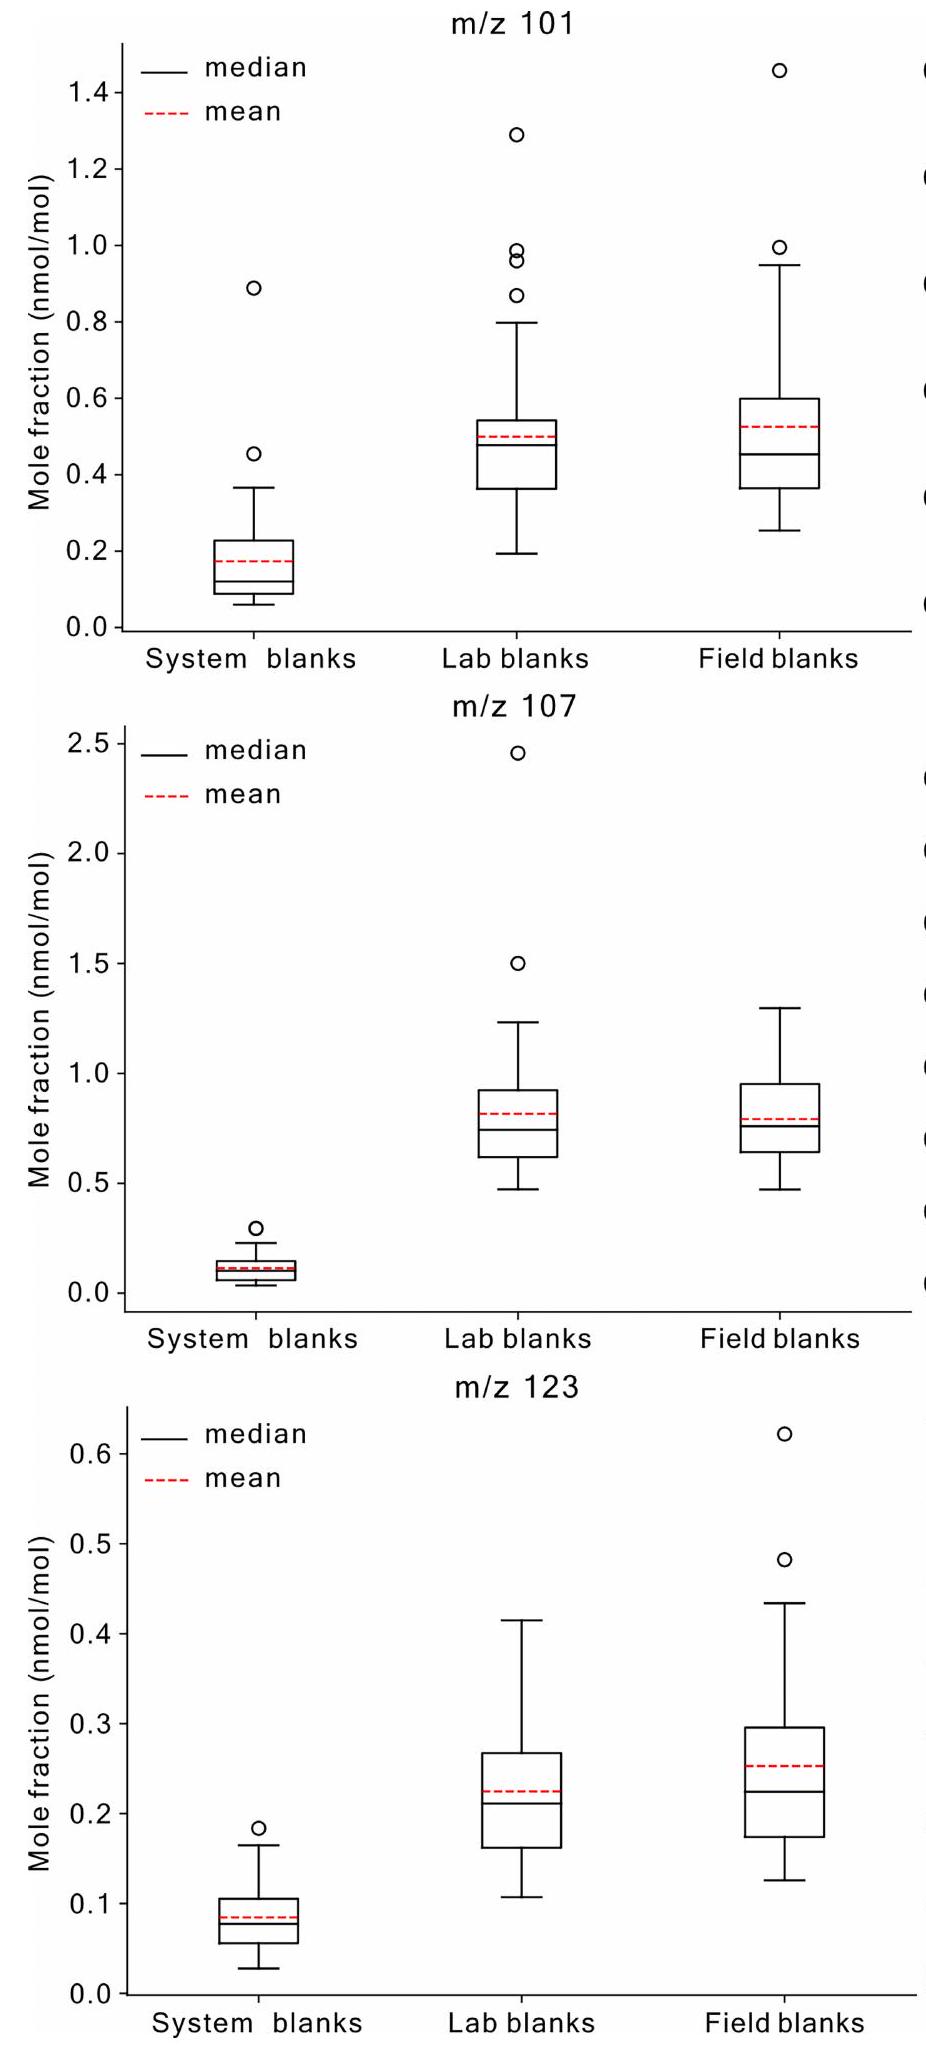
التي يتم فيها تسخين معظم البلاستيك. وبالتالي، تم استبعاد الكثير من مصفوفة المادة العضوية من التحليل، حيث أن العديد من المونومرات ومعظم المركبات المتطايرة عادة ما تتبخر عند درجات حرارة أقل من (المراجع. ). تم دمج البيانات لدرجات حرارة الفرن من إلى ليس فقط لاستبعاد المركبات المتطايرة ولكن أيضًا لتجنب التحلل الحراري والتحلل الحراري الواسع لمصفوفة العينة. وبالتالي، تقيس طريقتنا بشكل جماعي النانو بلاستيك الحر والنانو بلاستيك المرتبط بشكل فضفاض بالمادة العضوية أو المتجمع، شريطة أن تمر التجمعات عبر مسام الفلتر ( ) خلال عملية التصفية المسبقة. لأخذ التلوث الخلفي في الاعتبار، تم طرح متوسط الكتلة المحددة للفراغات المختبرية من دفعة العينة المقابلة من الكتل النانوية البلاستيكية المتوسطة في العينات. بعد الطرح، تم تطبيق فلتر لحد الكشف، حيث تم ضبط الإشارة المحددة للكتلة على الصفر عندما لم تتجاوز ثلاثة أضعاف الانحراف المعياري للفراغات المختبرية. كانت الفراغات المختبرية تتكون من ماء HPLC (VWR، تم تصفيته باستخدام فلتر، رقم CAS 7732-18-5) وتم إخضاعها لإعداد وتحليل مماثل لما تم إجراؤه للعينات العادية. بهذه الطريقة، قمنا بتصحيح الضوضاء الخلفية والتلوث الإجرائي المحتمل في العينات. تم استخدام البيانات المعالجة مسبقًا لاحقًا لتحديد بصمة النانو بلاستيك مقابل البلاستيك غير المعدل كيميائيًا (طيف الكتلة المكتبي) كما هو موضح بالتفصيل في الأعمال السابقة . تقارن خوارزمية البصمة الطيف ضد مكتبة تضم سبعة بوليمرات الأكثر شيوعًا: PE وPET وPS وPP وPPC وPVC وارتداء الإطارات. تم اعتبار درجة المطابقة -درجة ، ، (توزيع ذي طرف واحد) بصمة إيجابية. قد تزيد المادة العضوية الطحلبية قليلاً من اكتشاف PS الإيجابي الكاذب (انظر قسم ‘ضمان الجودة والتحكم’ وتجربة Sargassum في الجدول 1 من البيانات الموسعة). لتقليل هذا الخطر من التعليقات الإيجابية الكاذبة، اعتبرنا فقط -درجة 4 أو أعلى كمطابقة بصمة إيجابية لـ PS. يتم الإشارة إلى درجات المطابقة بـ * ( -درجة > 2 )، ** ( -درجة ) و -درجة
، حيث تشير درجة المطابقة الأعلى إلى توافق أفضل مع طيف الكتلة المكتبي. أجرينا تحليل مونت كارلو لتقييم التداخل المحتمل للمادة العضوية مع بصمة البلاستيك. أظهر التحليل أن تقدير البلاستيك لم يتجاوز 31% قبل أن تفشل المطابقة (الشكل 7 من البيانات الموسعة). تم تحويل عدد الأيونات إلى كسر مول باستخدام:حيث أن هو معامل معدل التفاعل، و هو زمن الإقامة للأيونات الأولية في أنبوب الانجراف، [ ] هو المحلل المؤين و[ ] هو مانح البروتون، الهيدونيوم. و تمثلان دوال النقل للهيدونيوم والمحلل المؤين. ثم تم تحويل كسور المول إلى تركيزات البلاستيك ( ) عن طريق تصحيح حمل العينة وعامل التخفيف. تتوفر قياسات مكررة بدلاً من ثلاثية لمحطة 9 في الطبقة المختلطة، والمحطتين 5 و8 عند عمق مياه ومحطة 5 في طبقة المياه القاعية بسبب مشاكل فساد الملفات. التركيزات المقدمة من النانو بلاستيك هي شبه كمية حيث أن جميع المواد البلاستيكية لا تتحول في النهاية إلى أيونات قابلة للكشف. وذلك بسبب (1) عدم كفاءة التسخين الحراري بشكل مثالي و(2) أجزاء من المحلل تنتهي كأيونات غير قابلة للتحليل. وبالتالي، تمثل التركيزات المبلغ عنها الحد الأدنى من تركيزات النانو بلاستيك. تم إجراء تجارب التطفل والاسترداد لـ PS. تم تحميل معلقات متجانسة من 100 أو 200 نانوغرام من PS في زجاجة مع 1.5 مل من عينة مياه البحر. كانت بصمة هذه العينات المضافة تعطي باستمرار مطابقة إيجابية لـ PS مع درجات -4 أو أعلى. بالمقابل، فقط من عينات الطبقة المختلطة غير المضافة مع PS أظهرت درجات -4 أو أعلى. تم إجراء تجارب التطفل في ثلاث نسخ للحصول على معدل استرداد موثوق (الجدول 2 من البيانات الموسعة). كشفت تجربة التطفل عن معدل كفاءة الاسترداد/التحليل يبلغ حوالي ، وهو ما يتفق مع أعمالنا السابقة . وهذا يعني أن التركيزات الفعلية لـ PS في العينات قد تكون أعلى بـ 14 مرة. بسبب الصعوبات في تحميل كميات دقيقة من البلاستيك
في نطاق النانوغرام، لم يتم إجراء تجارب التطفل والاسترداد بعد لـ PVC أو PET. في دراسة سابقة، تم الإبلاغ عن عامل تصحيح خطي قدره لـ PS وعامل تصحيح غير خطي بين لـ 59 نانوغرام من تحميل PET و لـ 177 نانوغرام من تحميل PET
. تم تطبيق تصحيح عبر المكتبات لتركيزات PS وPVC، حيث أن طيف الكتلة لهذه البوليمرات يتداخل جزئيًا، مما يؤدي إلى تركيزات PS أعلى بشكل مصطنع عند وجود PVC والعكس صحيح. تم حساب هذه التصحيحات عبر المكتبات على أساس مزيج 1:1 من 1,000 نانوغرام PS و1,000 نانوغرام PVC تم إنشاؤه من طيف الكتلة المكتبي الذي تم بصمته لاحقًا.
علاوة على ذلك، وُجد أن محتويات PS العالية تقلل من درجة المطابقة لـ PVC، مما قد يؤدي إلى إيجابيات كاذبة في اكتشاف PVC. من المحتمل أن يؤثر هذا على العينات السطحية في المحطة 12، حيث تم ملاحظة كميات كبيرة من PS ولكن كميات منخفضة من PVC. وُجد أن تركيزات PET لم تتأثر بوجود بوليمرات أخرى، بسبب طيف الكتلة المميز جدًا له.
ضمان الجودة والتحكمتم إجراء عدة فراغات ميدانية لمراقبة التلوث المحتمل بالبلاستيك أثناء أخذ العينات. قمنا بإجراء فراغات ميدانية في ثلاث نسخ في بداية ونهاية الرحلة، مما أدى إلى تسع فراغات ميدانية في المجموع. تم شطف زجاجات نيسكين مرتين باستخدام ماء ميلي-كيو وتم شطفها مرة أخرى بماء HPLC. ثم، تم صب 2.5 ل من ماء HPLC في زجاجات نيسكين وتركها لمدة ساعة في زجاجة نيسكين لمحاكاة الوقت اللازم لوصول مستشعر CTD إلى سطح المحيط بعد إغلاق زجاجة نيسكين في العمق. ثم تم أخذ عينة من زجاجة نيسكين التي تحتوي على ماء HPLC بطريقة مشابهة لتلك المستخدمة في عينات مياه البحر العادية. تم تحليل الفراغات الميدانية في نفس دفعات العينات العادية. على الرغم من أننا وجدنا إشارة خلفية منخفضة من النانو بلاستيك في الفراغات المختبرية ( متوسط عبر جميع البوليمرات وجميع الفراغات المختبرية)، إلا أن الفراغات الميدانية لم تحتوي على تلوث نانو بلاستيك إضافي كبير (الأشكال 3 و4 من البيانات الموسعة)؛ وبالتالي، استنتجنا أن التركيزات المنخفضة من النانو بلاستيك الخلفية نشأت من التحضير والإجراءات في مختبرنا وليس من إجراء أخذ العينات. كان متوسط تركيز النانو بلاستيك الخلفي منخفضًا مقارنة بمتوسطات المقطع العرضي لـ للطبقة المختلطة، و لعمق و
للطبقة السفلية.لتقييم الإيجابيات الكاذبة المحتملة من المادة العضوية، قمنا بتحليل عينات الكتلة الحيوية من Sargassum كبديل للمواد العضوية المعقدة. Sargassum وفير في بحر سارجاسو وينتشر إلى أجزاء أخرى من المحيط الأطلسي، بما في ذلك الشمال الشرقي . حوالي من الكتلة الحيوية لـ Sargassum التي تم جمعها خلال حملتنا السابقة والمخزنة في الفريزر تم تجفيفها في فرن عند
لمدة ساعتين قبل تحليل TD-PTR-MS. لم تظهر عينات الكتلة الحيوية من Sargassum (دون تطبيق الهضم) أي مطابقة إيجابية لـ PE أو PP أو PET أو PVC أو جزيئات ارتداء الإطارات، وكانت هناك مطابقة ضئيلة فقط لـ PS، والتي تتميز بكمية نهائية منخفضة من PS ودرجة مطابقة خوارزمية منخفضة (انظر الجدول 1 من البيانات الموسعة). للحفاظ على نهج محافظ، اعتبرنا هذه المطابقة لـ PS كإيجابية كاذبة محتملة في عينات المياه لدينا، وبالتالي، قمنا بزيادة عتبة المطابقة لـ PS للقضاء على مثل هذه الإيجابيات الكاذبة عبر جميع العينات.
مفارقة النانو بلاستيك المفقود و
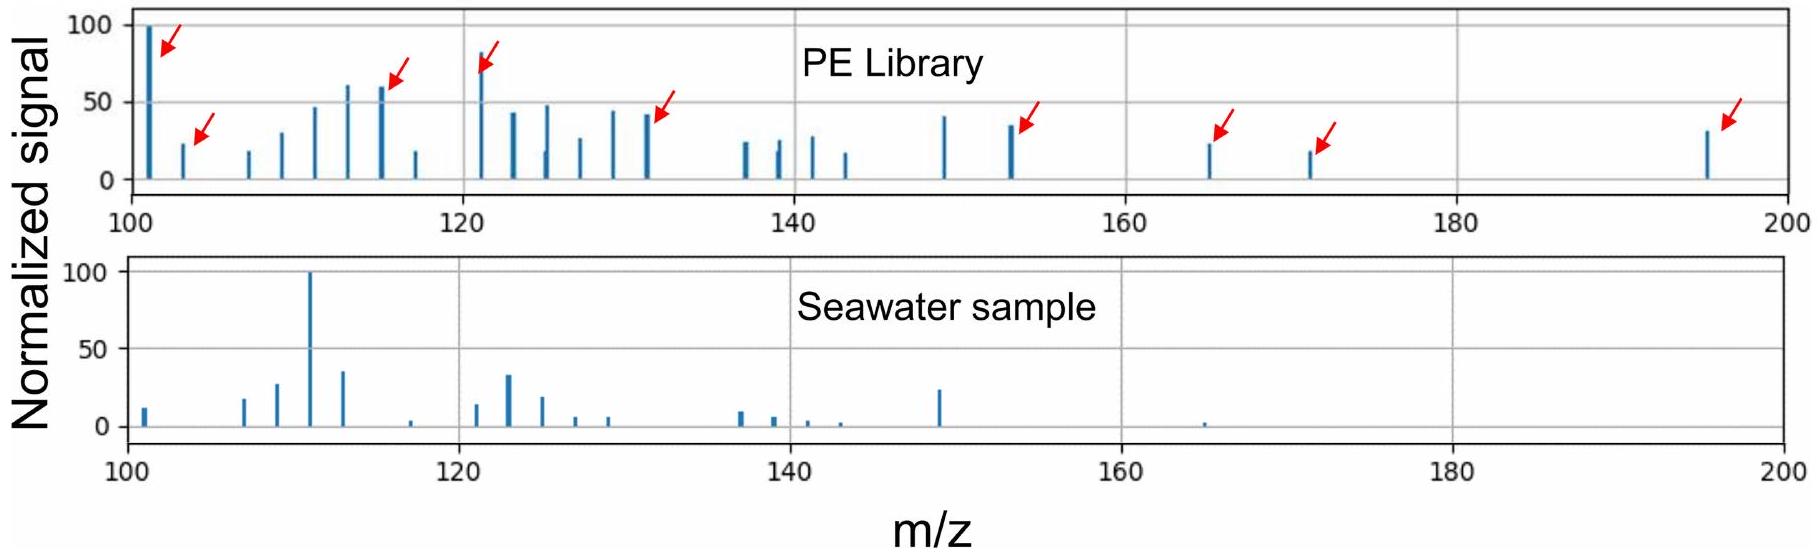
لم نتمكن من اكتشاف نانو بلاستيك PE وPP في هذه الدراسة (الشكل 8 من البيانات الموسعة). الدراسة الوحيدة الأخرى التي تحقق في النانو بلاستيك في المياه السطحية لـ NASG (باستخدام التحلل الحراري-الكروماتوغرافيا الغازية-التحليل الطيفي الكتلي) لم تتمكن أيضًا من العثور على إشارة PE واضحة تتطابق مع بصمة التحلل الحراري لمعيار PE الخاص بهم. لم يتم الإبلاغ عن نانو بلاستيك PE أو PP على طول السواحل الأطلسية أو الهادئة . هذا مفاجئ بالنظر إلى أن البولي إيثيلين والبولي بروبيلين يمثلان حوالي نصف الإنتاج العالمي من البلاستيك وقد وُجد أنهما أكثر أنواع البوليمرات العائمة وفرة في المحيط، بما في ذلك NASG. لا يمكننا تفسير ذلك بالكامل في الوقت الحالي حيث أثبتت طريقتنا أنها مناسبة لقياس البولي إيثيلين والبولي بروبيلين بشرط أن تظل التركيبة الكيميائية غير متغيرة في عينات المياه العذبة والهواء والبيانات البحرية، حيث كان هو البوليمر السائد.
وبالتالي، فإن التفسيرات المحتملة هي كما يلي: (1) يتم تعديل النانو بلاستيك كيميائيًا في مياه البحر مقارنة بالبوليمرات غير المتغيرة بحيث لا يمكن لتقنية بصمة الكتلة الكشف عن البولي إيثيلين/البولي بروبيلين المعدل؛ (2) كانت تركيزات نانو بلاستيك البولي إيثيلين والبولي بروبيلين أقل من حد الكشف لدينا؛ أو (3) يتم إخفاء التركيبة الكيميائية للبولي إيثيلين أو البولي بروبيلين بواسطة الخلفية العضوية في مياه المحيط. لا يمكننا استبعاد أي من هذه التفسيرات. ومع ذلك، من خلال تحليل مونت كارلو (الشكل البياني الممتد 7)، يمكننا بالفعل أن نوضح أن تحديد البولي إيثيلين كان الأكثر حساسية لتأثير المادة العضوية المضافة عشوائيًا. يبدو أيضًا من المحتمل جدًا أن التحلل الضوئي لا يؤدي فقط إلى إنتاج نانو بلاستيك ثانوي من البلاستيكات الكبيرة/البلاستيكات الدقيقة ولكن أيضًا أن نانو بلاستيك البولي إيثيلين والبولي بروبيلين الثانوي قد خضع أيضًا لبعض التغيير الكيميائي (على سبيل المثال، إدخال مجموعات الكربونيل ). قد يؤدي ذلك إلى تفاوت مع بصمة التشخيص وسيشرح لماذا لم يتم الكشف عن الأيونات المرتبطة عادةً بالبولي إيثيلين أو البولي بروبيلين.
حساب حجم الطبقة المختلطة
تم استخدام خطوط كونتور شذوذ الارتفاع الديناميكي (DHA) لـ كما هو محدد في القسم 3.27 من المرجع 64 لتحديد NASG:
هنا هو معامل كوريوليس هو السرعة الجيستروفية ( ) بالنسبة لبعض ضغط المرجع و هو السرعة المرجعية عند. تم أخذ تدرج DHA عند ضغط ثابت كما هو. لهذا الدراسة اخترنا. تم دمج ذلك مع سرعات التدفق المستمدة من عوامات أرجو عند مستوى الانتظار تم تعريفه على أنه DHA النسبي، محددًا بالنسبة لـ. تم تعريفه على أنه DHA المرجعي، بحيث يكون المجموع
يساوي DHA. هنا يمكن الحصول عليه مباشرة من توازن الرياح الحرارية.
لحساب، استخدمنا متوسط بيانات الأطلس العالمي للمحيطات 2018 المناخية الموزعة كمدخلات لدرجة الحرارة في الموقع والملوحة العملية. ثم تم تحويل ذلك إلى درجة حرارة محافظة (CT) وملوحة مطلقة (SA) باستخدام مجموعة أدوات برنامج Gibbs Seawater. تم استخدام كل من CT وSA كمدخلات لوظيفة gsw_toolbox ‘gsw_geo_strf_dyn_height’ لحساب بالنسبة لـ (الشكل البياني الممتد 5ب). للحصول على، قمنا بإنشاء تقدير عكسي (الشكل البياني الممتد 6) يعادل كما يلي:
هنا تمثل خطوط الطول و تمثل خطوط العرض، وكلاهما محدود بحوض المحيط الأطلسي الشمالي. و هي المسافات ذات الصلة و و هي السرعات شرقًا وشمالًا، على التوالي. يمكن تضمين كل في ما يصل إلى أربع معادلات، والتي يمكن كتابتها على النحو التالي:. هنا هي دوال التدفق المجهولة، هي القيم المعروفة للجانب الأيمن من المعادلات (4) و(5) و هي مصفوفة تحتوي على -1 أو 1 تضرب القيم المجهولة. يتم حل هذه المجموعة من المعادلات باستخدام آلة تقليل المربعات الأقل في MATLAB المقدمة بواسطة، مما يعطي DHA المرجعي (الشكل البياني الممتد 5أ).
لتحديد NASG، اعتبرنا أولاً أن الدوامة تتركز في الغالب في الـ 400 متر العليا (الشكل 1 في المرجع 68). بناءً على أحجام الشبكة الرأسية للأطلس العالمي للمحيطات، قمنا بمتوسط فوق الـ 410 متر العليا. تتوافق خطوط التدفق الناتجة عن DHA (الشكل البياني الممتد 6) بشكل جيد مع المسارات اللاغرنجية المستندة إلى النموذج (الأشكال 1د و3 في المرجع 68) ودالة التدفق (الشكل 1 في المرجع 69). هذا يدعم أن
خطوط التدفق المستندة إلى الملاحظة لـ DHA المحسوبة هنا هي مؤشر دقيق لحقل التدفق.
لتعريف الدوامة بشكل أكبر، اخترنا آخر خط تدفق الذي يدور من الجزء الشمالي من NASG إلى الجزء الجنوبي دون عبور الساحل (الشكل البياني الممتد 6). استخدمنا حد أدنى لخط العرض قدره، حيث يتوافق ذلك مع أقصى امتداد غربي لـ خط الكونتور. تم تعيين الحد الشمالي لمنطقة دراستنا عند، حيث يفصل المنطقة تحت القطبية عن المنطقة المعتدلة إلى شبه الاستوائية التي أخذنا منها العينات. ثم يتم تحديد NASG بواسطة خط الكونتور (نقاط سوداء في الشكل البياني الممتد 5ج)، بينما يتم تعريف المنطقة المتبقية المحددة نحو اليابسة بواسطة خط الإيزوباث على أنه ‘خارج الدوامة’ (زائد أحمر في الشكل البياني الممتد 5ج).
تم حساب عمق الطبقة المختلطة المناخية باستخدام بيانات الأطلس العالمي للمحيطات لشهر نوفمبر (الشكل البياني الممتد 5ج). تم حساب أعماق الطبقة المختلطة للمحطة من قياسات مستشعر CTD من هذه الدراسة (الشكل البياني الممتد 5ج). على الرغم من أن مستشعر CTD قد قاس أحيانًا أعماق طبقة مختلطة فورية أعمق من المتوسط المناخي، إلا أنها ضمن التوقعات. لذلك، استخدمنا قيم عمق الطبقة المختلطة المناخية من الأطلس العالمي للمحيطات كتقدير أولي لتحديد حجم الطبقة المختلطة داخل وخارج الدوامة. لحساب كتلة البلاستيك الكبير/البلاستيك الدقيق داخل وخارج NASG، استخرجنا قيم التركيز المودلة من المرجع 1 وطبقناها على نقاط شبكة الأطلس العالمي للمحيطات. سمح لنا ذلك بإجراء مقارنة مباشرة مع بيانات النانو بلاستيك لدينا.
تحليل الحساسية لخوارزمية بصمة البلاستيك
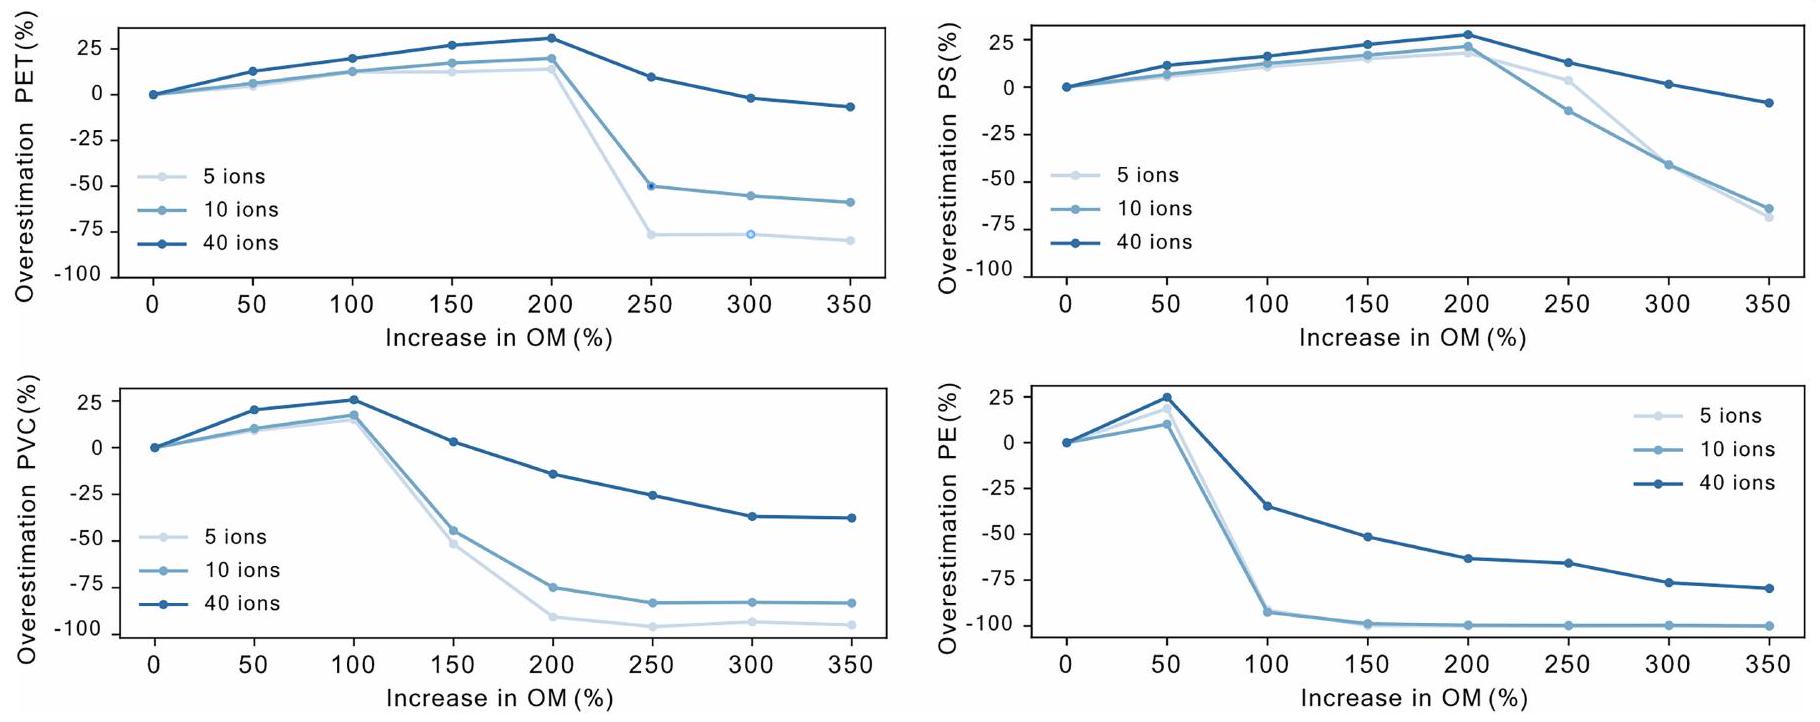
لتقييم عدم اليقين في التقدير المحتمل المفرط لنهج تحديد البلاستيك لدينا (على سبيل المثال، بسبب وجود مادة عضوية طبيعية)، قمنا بإجراء تقييم مونت كارلو. قمنا بمحاكاة إضافة مادة عضوية إلى طيف الكتلة لمكتبة البلاستيك الخاصة بنا وقيمنا أداء التعرف والتقدير. أضفنا بشكل منهجي 50-350% (زيادة قدرها 50%) من الإشارة الموزعة عشوائيًا على ما يصل إلى 5 و10 و40 أيون من مكتبتنا المستخدمة لتحديد النانو بلاستيك. تم إجراء كل تسلسل من التشغيل في 1,000 نسخة.
أظهر تحليل مونت كارلو لدينا أن تحديد PET وPS كان الأقل تأثرًا بإضافة المادة العضوية المحاكية. تمكنا من إضافة 200% من المادة العضوية بالنسبة لإشارة البوليمر دون التأثير على تحديد هذين البلاستيكين. تأثر تحديد بلاستيك PVC بشكل أقوى؛ حيث إن إضافة أكثر من 100% قللت تدريجيًا من تحديد البلاستيك لخوارزميات بصمة البلاستيك. كان تحديد البولي إيثيلين الأكثر تأثرًا بوجود المادة العضوية، حيث تأثر التعرف على البوليمر بشكل كبير بالفعل عندما تم إضافة حوالي من المادة العضوية.
من ناحية أخرى، أظهر تحليل مونت كارلو أن التقدير المفرط في جميع السيناريوهات (مستويات مختلفة من الشوائب العضوية الموزعة على أعداد مختلفة من الأيونات) لجميع البوليمرات البلاستيكية لم يتجاوز. على سبيل المثال، بالنسبة لـ PET، عند زيادة الخلفية العضوية بمقدار أو من إشارة البوليمر، كان التقدير المفرط حوالي، حوالي (ذروة) وحوالي، على التوالي (الشكل البياني الممتد 7). بعبارة أخرى، إذا كانت العينة تحتوي على كمية كبيرة من المادة العضوية الطبيعية، فمن المحتمل أن يفشل التعرف على البلاستيك (مطابقة بصمة) قبل أن يتم تقدير كمية النانو بلاستيك بشكل مفرط بـ. وبالتالي، نعتبر نتائجنا محافظة، مع تقدير مفرط محتمل يبلغ حوالي بسبب تأثيرات المصفوفة العضوية.
توفر البيانات
يمكن تنزيل جميع البيانات (بما في ذلك جميع مراحل معالجة البيانات) من مستودع DAS الدائم:https://doi.org/10.25850/ nioz/7b.b.kj. استخدمت هذه الدراسة مجموعة بيانات YoMaHa’07 (المرجع 57) من السرعات المستمدة من مسارات عوامات أرجو المقدمة من APDRC/IPRC.
يمكن العثور على الكود المستخدم لحجم الطبقة المختلطة للدوامة على https://doi.org/10.25850/nioz/7b.b.kj. تم نشر أكواد بصمة البلاستيك ومتاحة علىhttps://doi.org/10.24416/UU01-HKNCGC. مجموعة أدوات GSW متاحة علىhttp://www.teos-10.org/software.htm. 58. ماتيريتش، د. وآخرون. توصيف المكون شبه المتطاير من المادة العضوية المذابة بواسطة التحليل الحراري-تفاعل نقل البروتون-مطيافية الكتلة. Sci. Rep. 7، 15936 (2017). 59. هولزينجر، ر. PTRwid: أداة جديدة لمعالجة بيانات PTR-TOF-MS. تقنيات قياس الغلاف الجوي 8، 3903-3922 (2015). 60. جونسون، د. ر.، فرانكس، ج. س.، أوكسانفورد، هـ. أ. وكوكس، س. أ. ل. توقعات السارجاسوم العائم والاتصال البحري في المحيط الأطلسي الاستوائي. أبحاث الخليج والكاريبي 31، GCFI20-GCFI30 (2020). 61. جايير، ر.، يامبيك، ج. ر. و لو، ك. ل. إنتاج واستخدام ومصير جميع البلاستيكات التي تم إنتاجها على الإطلاق. ساينس أدفانس 3، e1700782 (2017). 62. Materić، د. وآخرون. وجود النانو بلاستيك في المياه السطحية الريفية والنائية. رسائل البحث البيئي 17، 054036 (2022). 63. فرايسينيت، س.، دي بينيديتو، ج.، ماليتستا، ك.، هولزينجر، ر. وماتيريك، د. توزيع حجم الميكروبلاستيك والنانو بلاستيك في أنسجة المحار المزروع. اتصالات الأرض والبيئة 5، 128 (2024). 64. اللجنة الدولية لعلوم المحيطات، SCOR و IAPSO. المعادلة الديناميكية الحرارية للمياه البحرية -2010: حساب واستخدام الخصائص الديناميكية الحرارية. اللجنة الحكومية الدولية لعلوم المحيطات، الكتيبات والإرشادات رقم 56.https://www.teos-10.org/pubs/TEOS-10_الدليل.pdf (2010). 65. ليبيديف، ك. ف.، يوشيناري هـ.، ماكسيمينكو ن. أ. وهاكر ب. و. يوماها’O7: بيانات السرعة المقدرة من مسارات عوامات أرجو عند مستوى الانتظار وعلى سطح البحر. مذكرة تقنية من IPRC رقم 4(2).http://apdrc.soest.hawaii.edu/projects/yomaha/yomahaO7/YoMaHaO7O612small.pdf (2007). 66. بوير، ت. ب. وآخرون. أطلس المحيطات العالمي 2018. مجموعة البيانات: درجة الحرارة والملوحة في الموقع. مراكز المعلومات البيئية الوطنية NOAA.https://accession.nodc.noaa.gov/ NCEI-WOA18 (2018). 67. مكدوغال، ت. ج. وباكر، ب. م. البدء في استخدام TEOS-10 وأداة جيبس لمياه البحر (GSW) في علم المحيطات. SCOR/IAPSO WG127.https://www.teos-10.org/pubs/Getting_Started.pdf (2011). 68. بيرغلوند، س. وآخرون. الطبيعة المتدهورة للدوران الفرعي شمال الأطلسي. نات. كوم. 13، 2000 (2022). 69. بيرغلوند، س.، دوس، ك.، غرويسكامب، س. ومكدوجال، ت. دوران المحيط الأطلسي الشمالي وتبادل الحرارة والملح المرتبط بين كتل المياه. رسائل أبحاث الجيوفيزياء 50، e2022GL100989 (2023). 70. دي بوييه مونتيغوت، سي.، مادك، ج.، فيشر، أ. س.، لازار، أ. ولوديكُون، د. عمق الطبقة المختلطة في المحيط العالمي: دراسة بيانات الملف ومناخ قائم على الملف. مجلة أبحاث الجيوفيزياء: المحيطات 109، C12003 (2004). 71. تومسون، ك. م.، بورماستر، د. إ. وكراوتش، إ. أ. سي. تقنيات مونت كارلو للتحليل الكمي لعدم اليقين في تقييمات مخاطر الصحة العامة. تحليل المخاطر. 12، 53-63 (1992).
الشكر والتقدير نشكر طاقم و قائد السفينة RV Pelagia والفريق العلمي على متن السفينة على مساعدتهم في البحر. لقد تم دعم هذا العمل من قبل مجلس البحث الهولندي (أرقام المنح: OCENW.XS2.018 و OCENW.XS21.2.042) ومجلس البحث الأوروبي (منحة ERC-CoG رقم 772923، مشروع VORTEX).
مساهمات المؤلفين: قام H.N. وD.M. بوضع المشروع، مع الحصول على التمويل من قبل H.N. وD.M. تم تطوير المنهجية الرئيسية بواسطة D.M. وتم إجراء العمل الميداني وأخذ العينات بواسطة S.t.H. وH.N. تم إجراء التحليل الرسمي وأعمال المختبر بواسطة S.t.H. في مختبر R.H.، تحت إشراف D.M. وR.H. تم إجراء تحليل البيانات وتفسيرها بواسطة S.t.H. وD.M. تم تحديد مدى الدوامة وحجم الطبقة المختلطة بواسطة S.G. ساهم جميع المؤلفين في كتابة الورقة.
تمويل تمويل الوصول المفتوح المقدم من مركز هلمهولتز لأبحاث البيئة GmbH – UFZ.
المصالح المتنافسة يعلن المؤلفون عدم وجود مصالح متنافسة.
معلومات إضافية
معلومات إضافية النسخة الإلكترونية تحتوي على مواد إضافية متاحة فيhttps://doi.org/10.1038/s41586-025-09218-1. يجب توجيه المراسلات والطلبات للحصول على المواد إلى دوشان ماتيريć. تشكر مجلة Nature آرون ستوبينز والمراجعين الآخرين المجهولين على مساهمتهم في مراجعة الأقران لهذا العمل. تقارير مراجعي الأقران متاحة. معلومات إعادة الطبع والتصاريح متاحة علىhttp://www.nature.com/reprints.
الشكل 1 من البيانات الموسعة | انظر الصفحة التالية للتعليق.
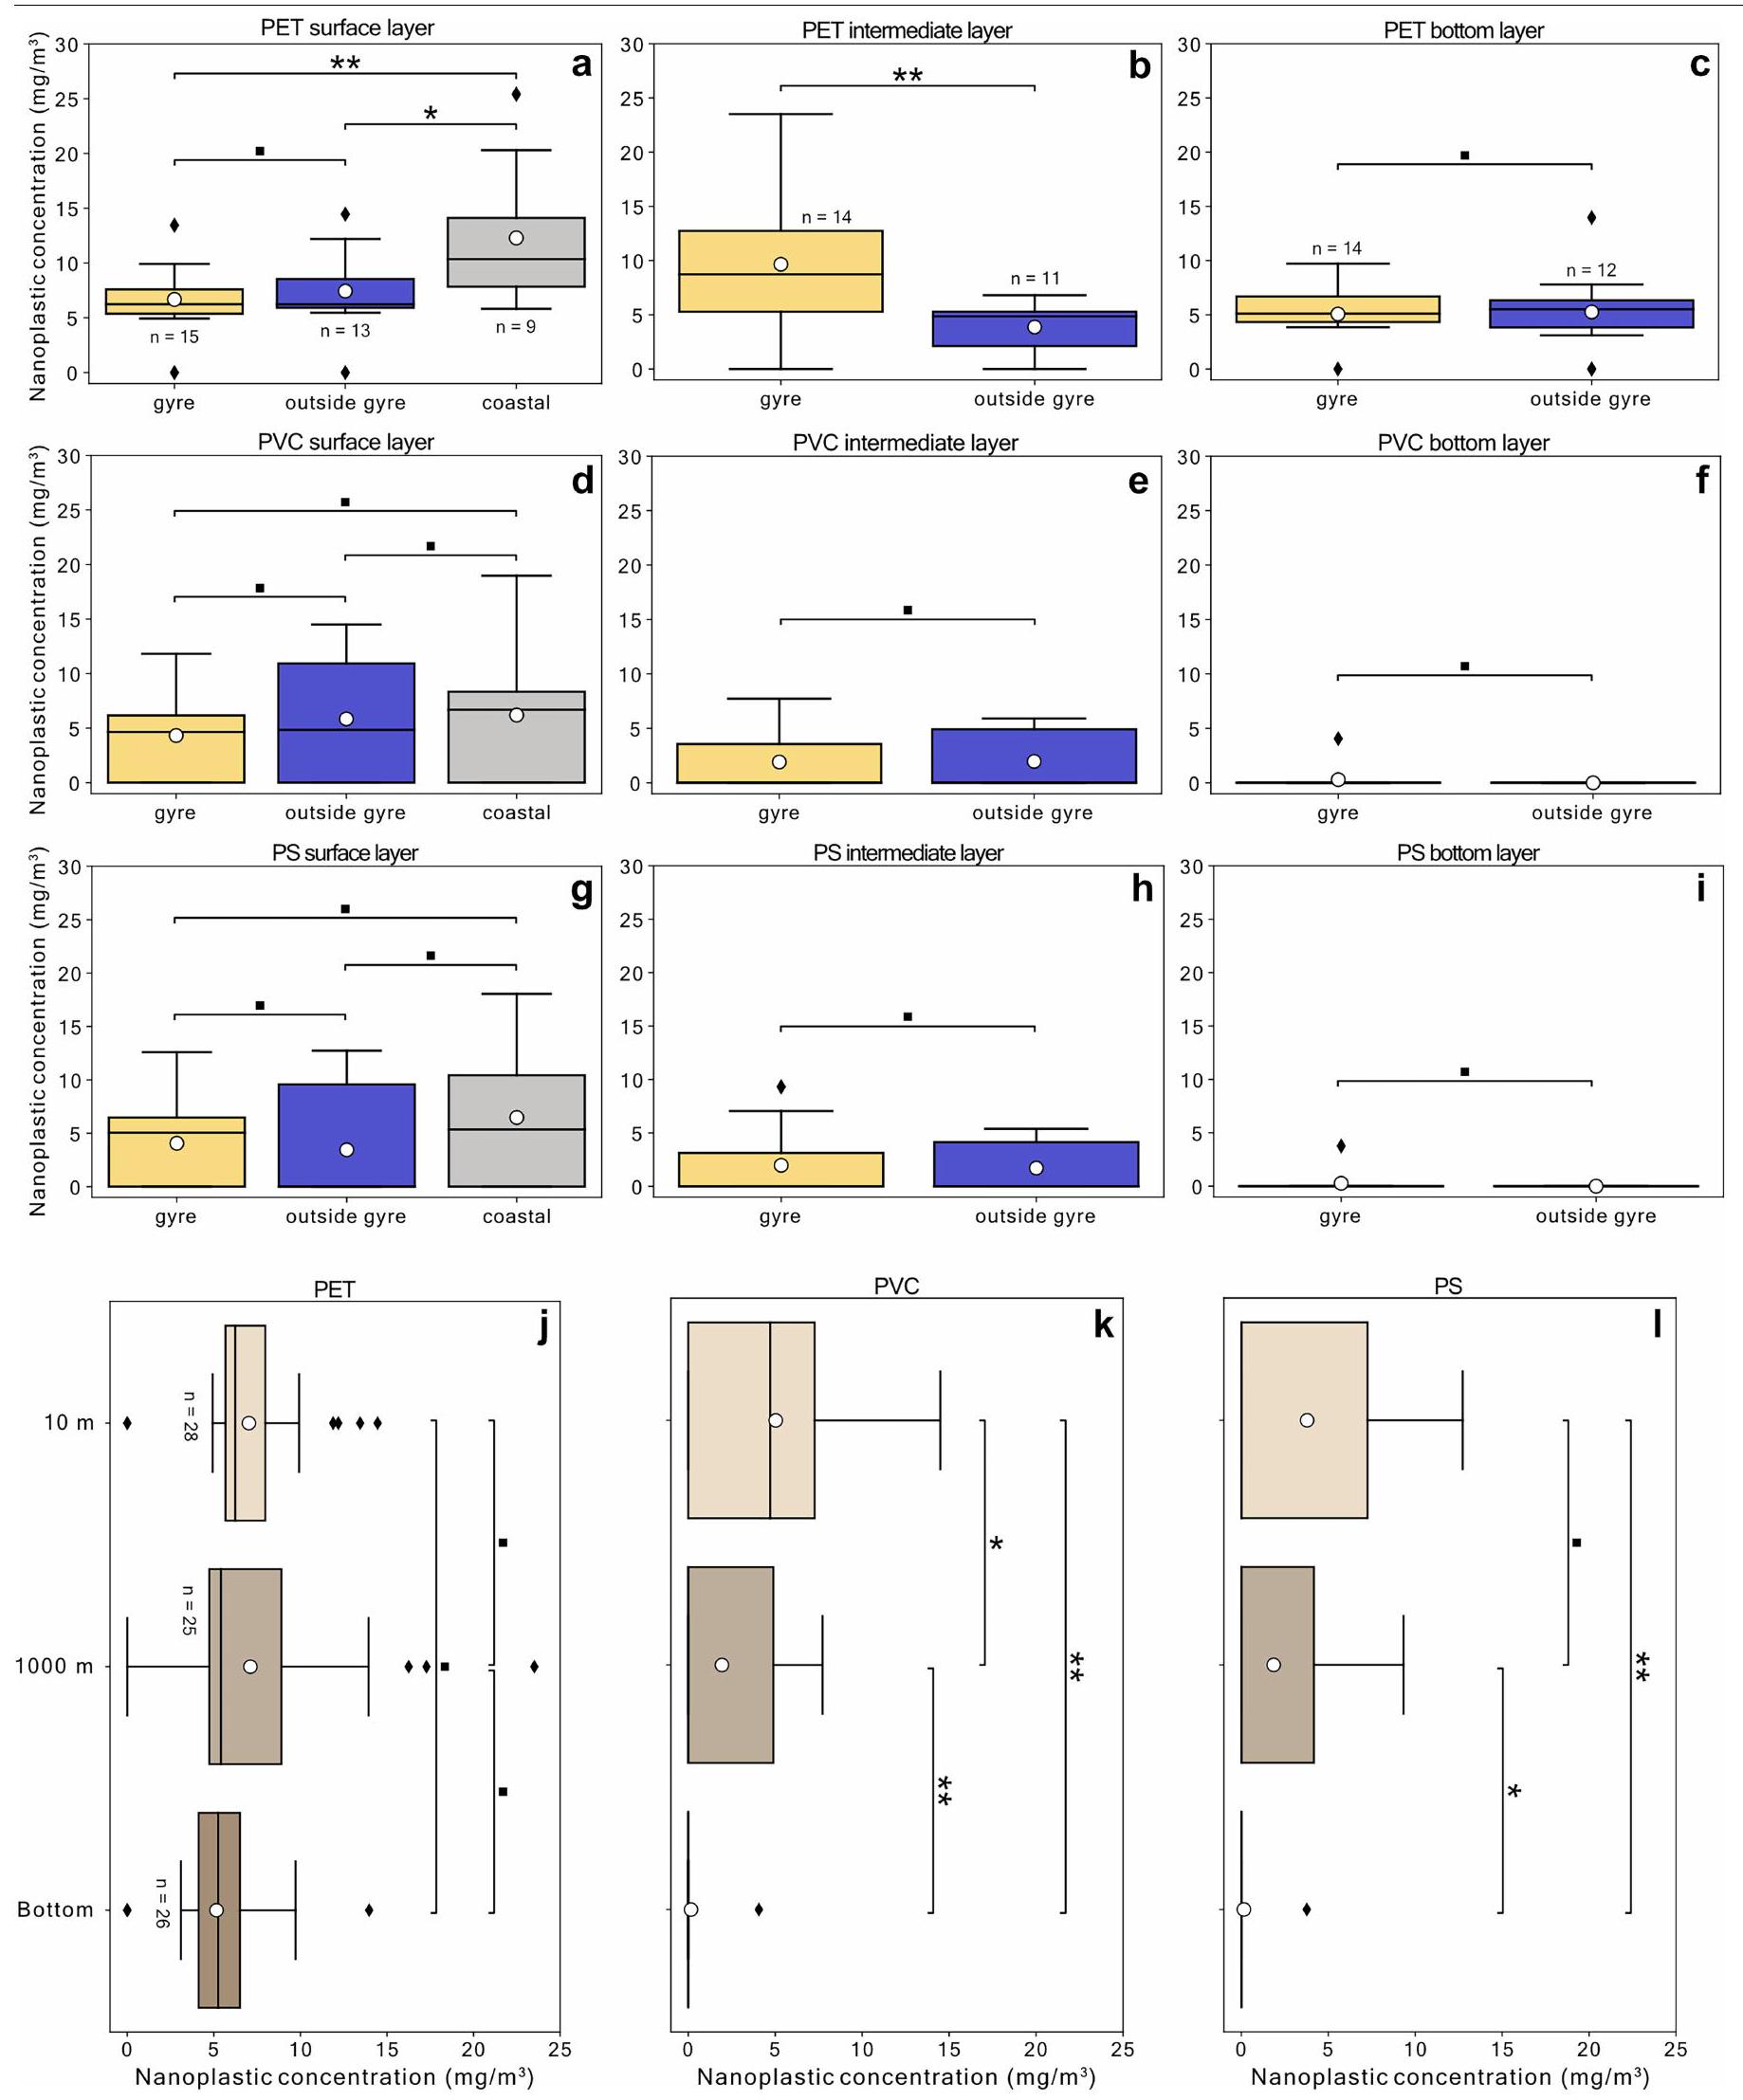
الشكل البياني الممتد 1| مخططات الصندوق لتوزيع البوليمرات النانوية البلاستيكية في عمود الماء في شمال المحيط الأطلسي. متوسط تركيزات النانو بلاستيك من PVC و PET و PS للمجموعات (‘دوامة’; المحطات 1-5)، المحيط المفتوح بين الرف والدوامة (‘خارج الدوامة’; المحطات 6-9) وعند كسر الرف أو على الرف الأوروبي (‘ساحلي’; المحطات 10-12) (أ-ي) وللطبقة المختلطةطبقة وسيطةوالطبقة السفليةفوق قاع البحر) لمحطات المياه العميقة (المحطات 1-9) (ج-1). تشير الصناديق إلى النسب المئوية للوسيط، مع امتداد الشعيرات إلى نقاط البيانات التي تقع ضمن 1.5 من الربعيات. نقاط البيانات التي تقع خارج هذا النطاق يتم الإشارة إليها بشكل ماسي. القيمة المتوسطة يتم الإشارة إليها بالنقطة البيضاء. تم تحليل الفروق بين المجموعات باستخدام اختبار ANOVA أحادي الاتجاه و-اختبار لمقارنة المتوسطات. مستويات الدلالة مع-قيم (**), -قيمة و -قيمةمُشار إليها.
مقالة
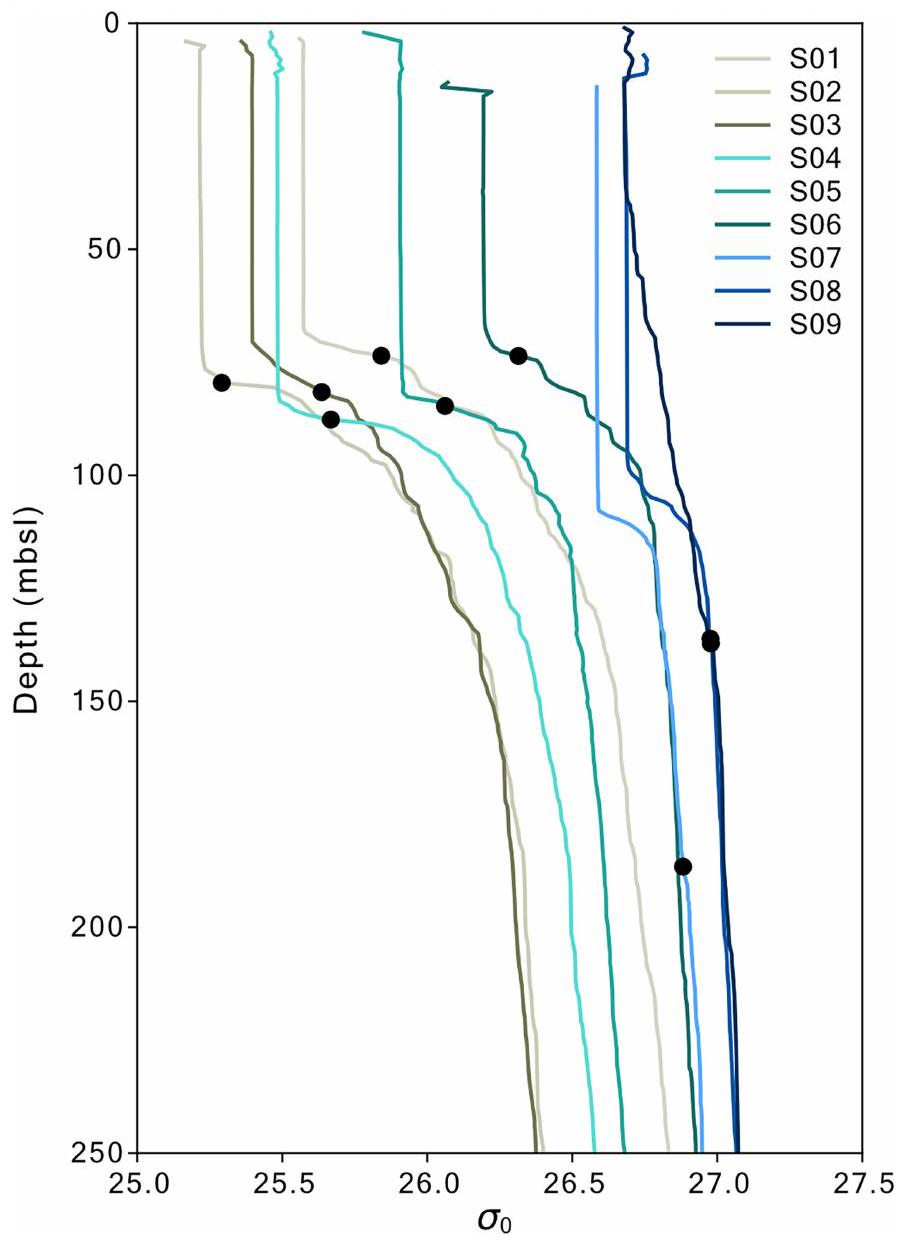
الشكل البياني الممتد 2 | ملفات كثافة الجهد المرجعية السطحية للـ 250 مترًا العليا في المحطات البحرية (المحطات 1-9). تم الإشارة إلى عمق الطبقة المختلطة لكل محطة بحرية بنقطة سوداء. تم الحصول على البيانات باستخدام مستشعر CTD.
الشكل البياني الممتد 3 | كسور المول للنظام، والفراغات المخبرية والميدانية لستة كتل مرتبطة بوجود البلاستيك. تشير الصناديق إلىالنسب المئوية للوسيط، مع امتداد الخطوط إلى نقاط البيانات التي تقع ضمن 1.5 من الربعيات. نقاط البيانات التي تقع خارج هذا النطاق يتم الإشارة إليها بدائرة. القيمة المتوسطة يتم الإشارة إليها باللون الأحمر.
خط متقطع. أعداد مرتفعة علىترتبط بوجود PE و PP و PPC،مع PS و PET،مع PS و PVC،مع PVC و PE،مع PET و PP و PPC ولم يتم الكشف عن أي نانو بلاستيك في العينات الميدانية مقارنة بالعينات المخبرية، مما يستبعد التلوث الناتج عن زجاجات التخزين وزجاجات نيسكين.
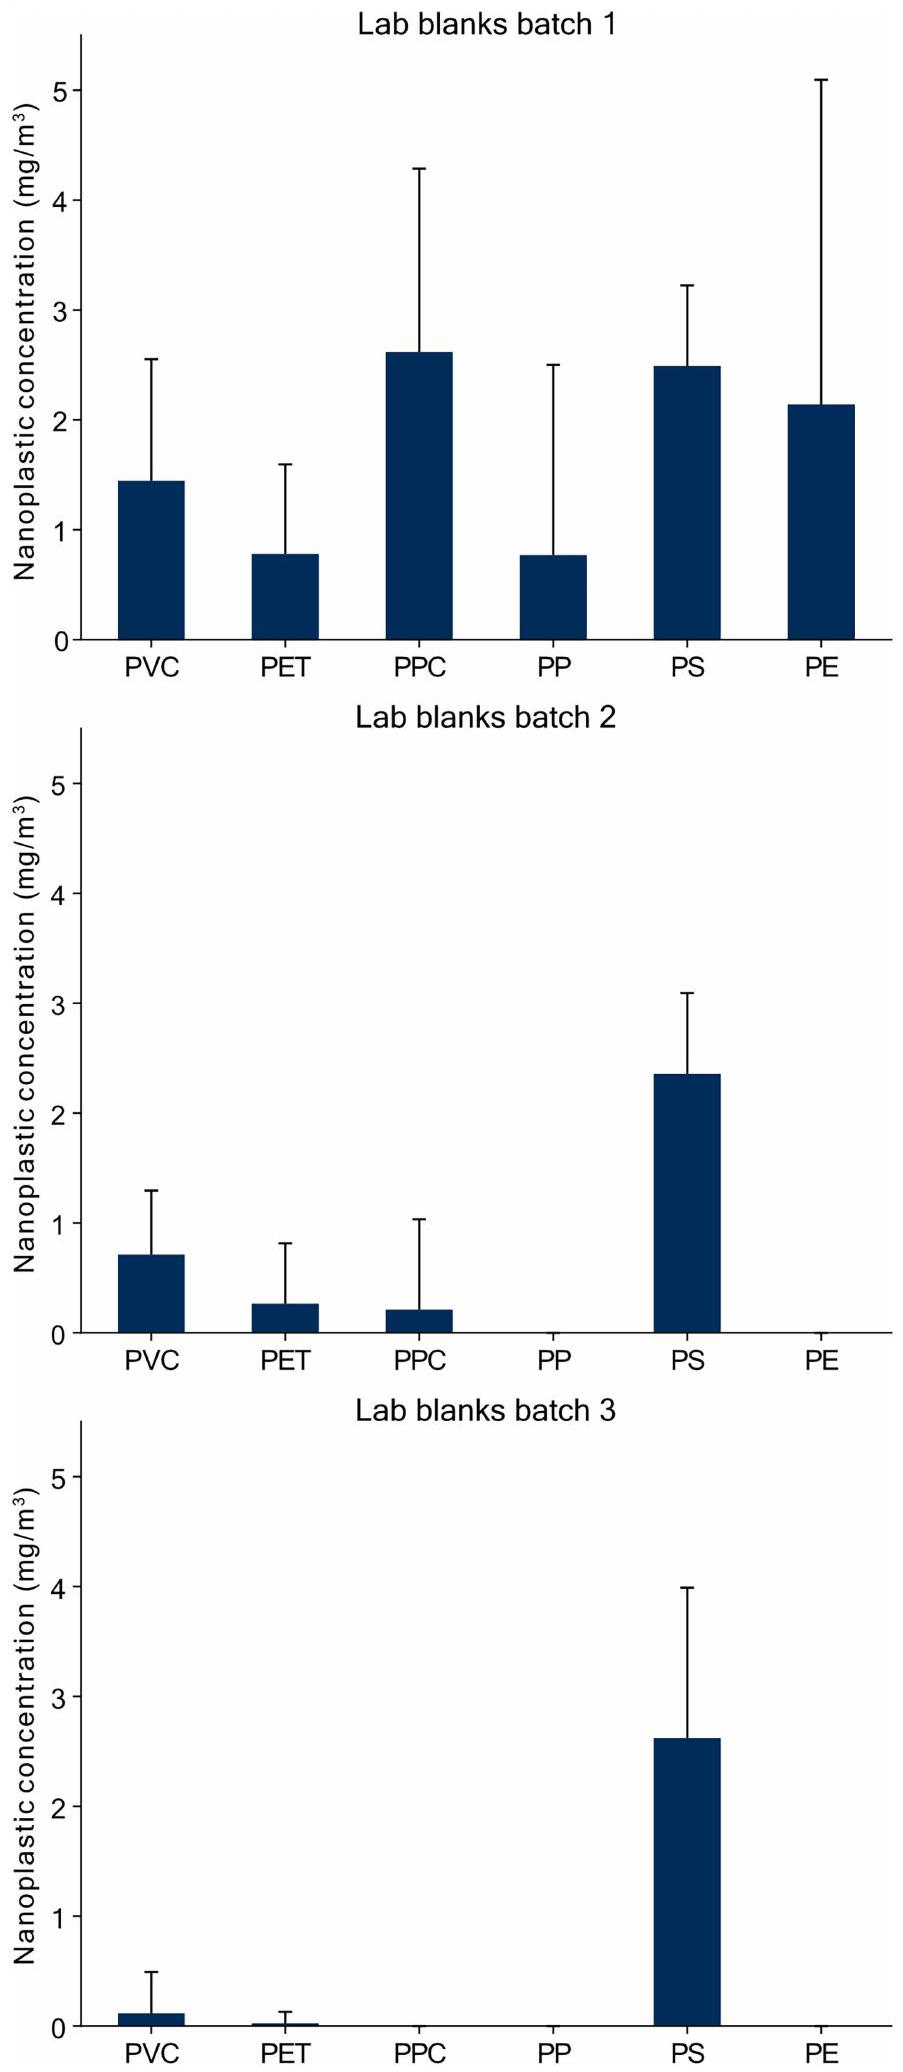
الشكل 4 من البيانات الموسعة | متوسط التلوث البلاستيكي المكتشف في المختبر
الفراغات. تمثل أشرطة الخطأ الانحراف المعياري للفراغات في كل دفعة. وُجد أن جميع دفعات الفراغات في المختبر كانت تحتوي على تركيزات منخفضة بشكل متسق من PE وPET وPPC وPP وPS وPE نانو بلاستيك.بعد طرح الخلفية، المكونة من متوسط العينات الفارغة من المختبر للدفعة المعنية، لا يزال يمكن اكتشاف كميات كبيرة من النانو بلاستيك في عينات مياه المحيط. ومع ذلك، نقر بأن وجود النانو بلاستيك الخلفي، على الرغم من كمياته القليلة، يؤدي إلى مزيد من عدم اليقين في تركيزات النانو بلاستيك. تم اكتشاف كميات ضئيلة من PET في العينات الفارغة التي تم إجراؤها خلال قياسات عينات المياه القاعية (انظر ‘الدفعة 3’)، مما يعني أن الكميات الكبيرة من نانو بلاستيك PET التي تم اكتشافها على عمق عدة كيلومترات ليست نتيجة للتلوث الإجرائي. ومع ذلك، حتىتم ملاحظة وجود PS في بعض العينات الفارغة في المختبر.
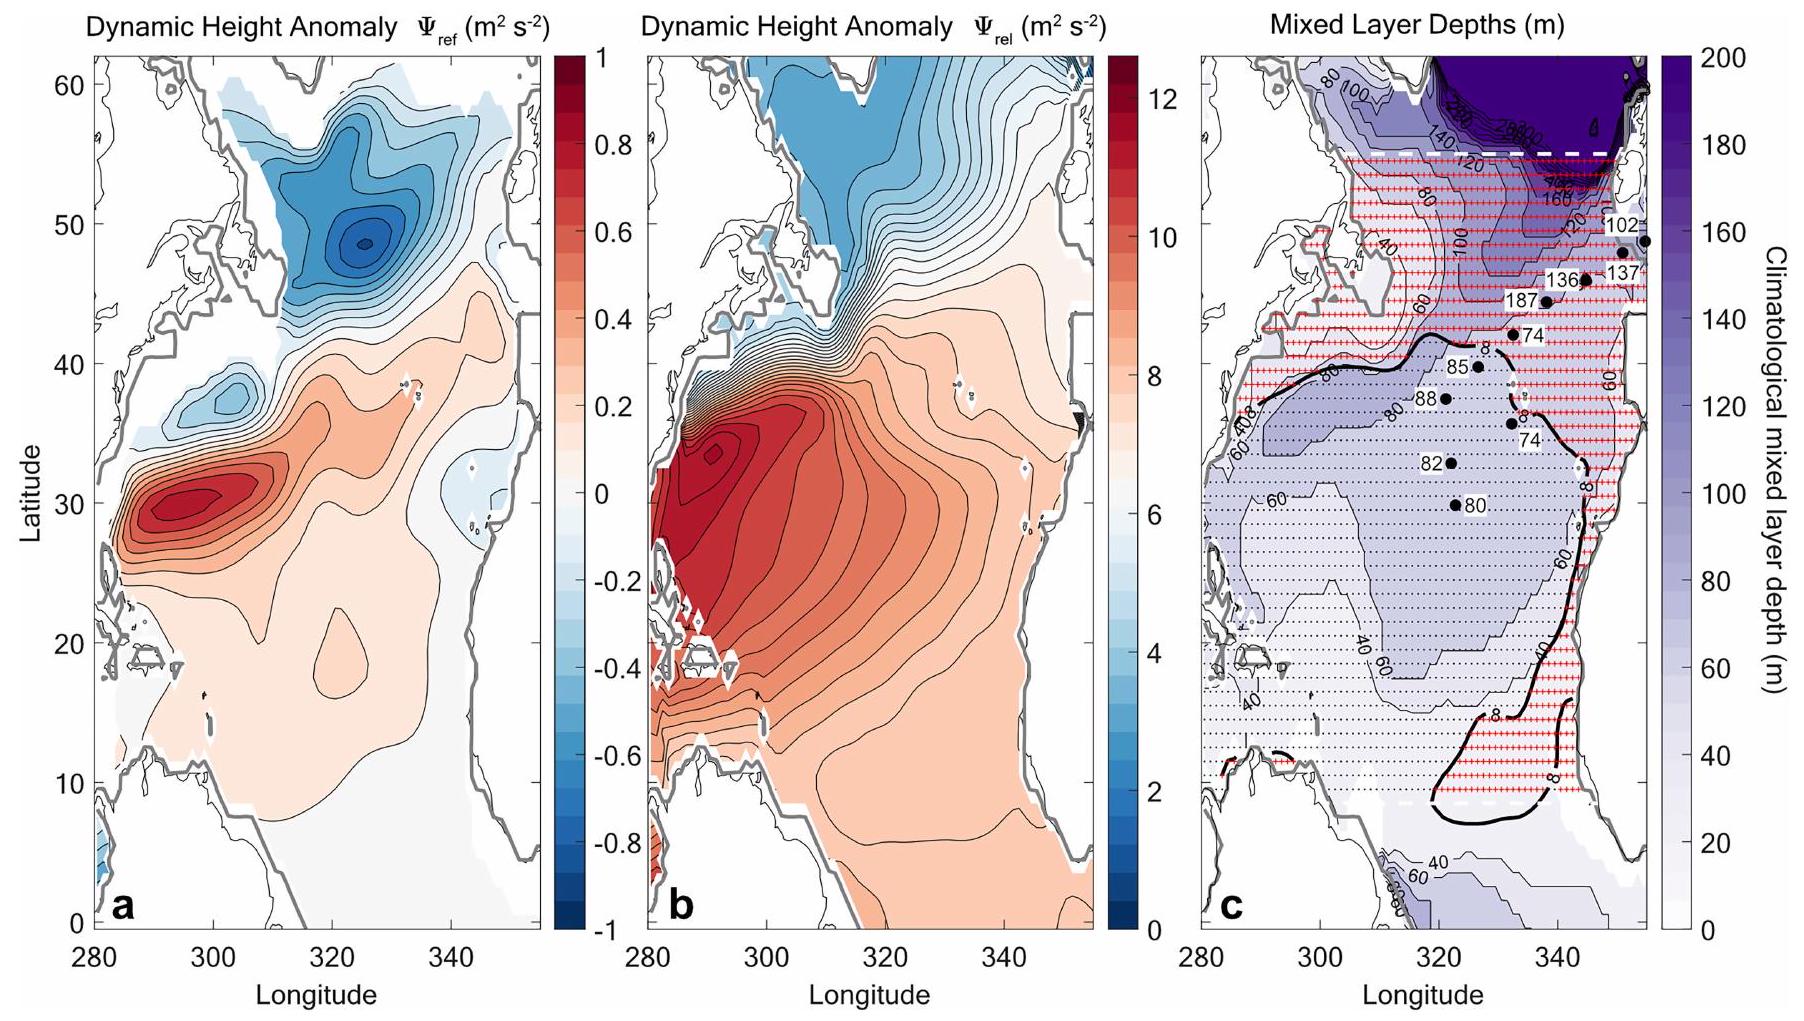
الشكل البياني الموسعتجاويف DHAمنعند عمق 1000 متر (أ)، المتوسط المرجح بالعمقفوقعمق (ب) وعمق طبقة الخلط المناخية والمحطة في نوفمبر (ج). لاحظ المقاييس المختلفة لخرائط الألوان للوحة و لوحةيظهر عمق الطبقة المختلطة المناخية من المناخ الشبكي لشهر نوفمبر (الألوان الأرجوانية) الذي تم استخدامه لحساب ميزانية الكتلة في شمال المحيط الأطلسي، والتي هي جيدة
الاتفاق مع أعماق الطبقات المختلطة في المحطة المستمدة من قياسات مستشعر CTD (الصناديق البيضاء) في المحطات (النقاط السوداء الكبيرة). تشير النقاط السوداء الصغيرة إلى نقاط الشبكة ‘داخل الدوامة’، بينما تشير الإشارات الحمراء إلى نقاط الشبكة ‘خارج الدوامة’، وكلاهما محصور ضمن نطاق خط العرض. الخط الأسود الرقيق هو خط الساحل والخط الرمادي يحدد خط الإيزوباث
مقالة
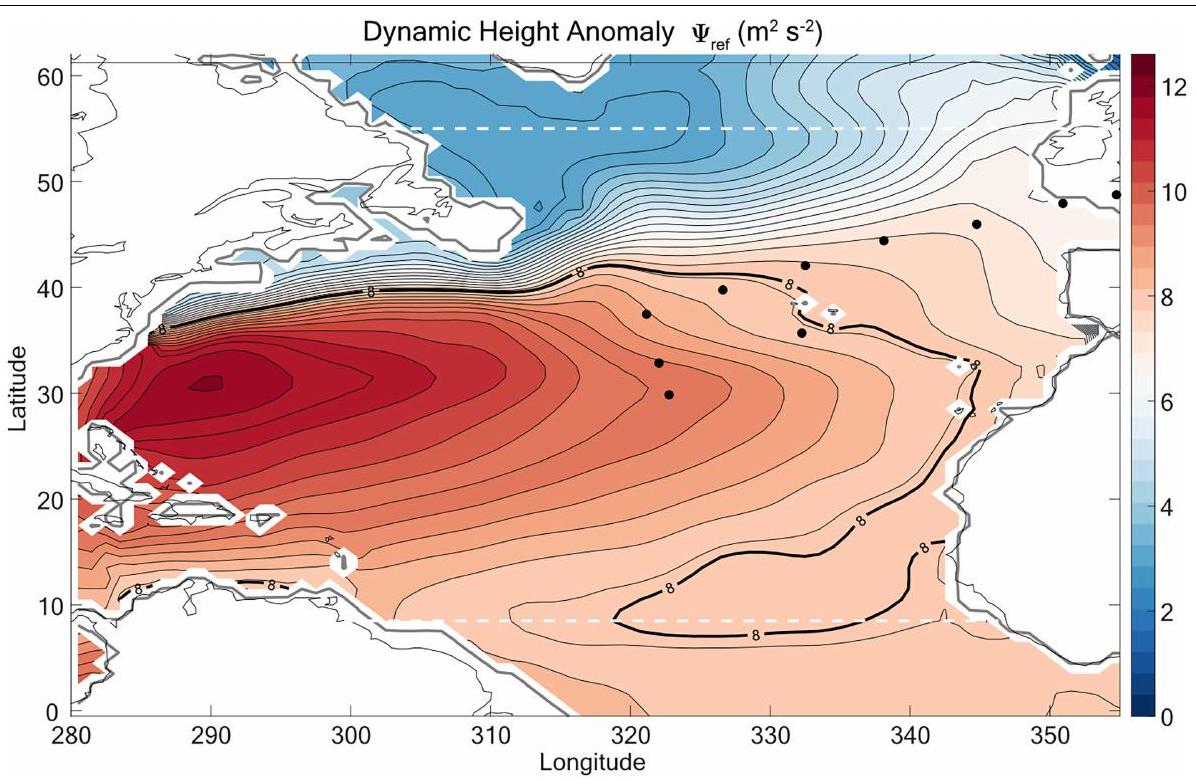
الشكل 6 من البيانات الموسعة | خطوط DHA ، المعادلة (2)). الخط الأسود السميك ( ) تحدد الحافة الخارجية للدوران. الخطوط البيضاء المتقطعة هي الجزء العلويوأدنىحدود خطوط العرض للنطاق الذي قمنا بتحليله.
النقاط السوداء هي محطات الرحلات البحرية. الخط الأسود الرقيق هو خط الساحل والخط الرمادي يحددالإيزوباث. الـ DHA هو نتيجة المتوسط على عمق 410 متر العلوي.
الشكل 7 من البيانات الموسعة | تحليل مونت كارلو لمحاكاة إضافة المادة العضوية وتأثيرها اللاحق على بصمة PET و PS و PVC و PE. تم توزيع الإضافة الاصطناعية العشوائية للمادة العضوية (OM) على 5 أو 10 أو 40 أيون تُستخدم لبصمة النانو بلاستيك.
الشكل البياني الممتد 8 | غياب بعض الأيونات المرتبطة عادةً بـ PE في عينات مياه البحر. العديد من علامات الأيونات التي تُلاحظ عادةً في طيف الكتلة لـ PE غائبة تمامًا عن عيناتنا (كما هو موضح بالأسهم الحمراء). نتيجة لذلك، لا يمكننا تحديد ما إذا كان الخلفية
المادة العضوية تعيق إشارة PE أو ما إذا كان غياب الأيونات التشخيصية يشير إلى أن مصفوفة PE الأصلية قد تم تغييرها (على سبيل المثال، من خلال التأكسد الضوئي). على أي حال، يجب أن نستنتج أن PE غير المعدل كيميائيًا، إذا كان موجودًا، يبقى تحت حد الكشف لدينا في عينات مياه البحر.
البيانات الموسعة الجدول 1 | نتائج تجربة بصمة السارجاسوم
عينة
ALG1
ALG3
الكتلة
بي إس_سبايك_1-4
93.99 نانوغرام
بي إس_سبايك_2-5
28.01 نغ
بي إس_سبايك_3-6
89.83 نانوغرام
نسيج السارجاسوم_1-7
–
2.41 نانوغرام
نسيج السارجاسوم_2-11
–
8.84 نانوغرام
نسيج السارجاسوم_3-15
–
2.82 نانوغرام
فقط بالنسبة لـ PS، تسبب السارجاسوم في بصمة إيجابية خاطئة حصريًا مع الخوارزمية (ALG) 3. بالنسبة لجميع البوليمرات الأخرى، لم يكن بالإمكان توليد بصمة إيجابية باستخدام الكتلة الحيوية للسارجاسوم وحدها.
مقالة
البيانات الموسعة الجدول 2 | نتائج تجارب الارتفاع والانتعاش لـ PS
عينة
تحميل PS (نانوغرام)
تم استرجاعه (نانوجرام)
الاسترداد/الأيونization
معدل الكفاءة (%)
S4 D11
100
S4 D11
٢٠٠
س12 د1
٢٠٠
المبلغ المسترجع هو المتوسط المحسوب للتكرارات الثلاثة، مع عرض الانحراف المعياري لها.
معهد الأبحاث البحرية والجوية في أوترخت (IMAU)، جامعة أوترخت، أوترخت، هولندا.قسم الكيمياء التحليلية البيئية (EAC)، مركز هيلمهولتز للبحوث البيئية – UFZ، لايبزيغ، ألمانيا.معهد نيلز الملكي الهولندي لأبحاث البحر، ‘ت هورنتي (تكسل)، هولندا.قسم علوم الأرض، جامعة أوترخت، أوترخت، هولندا.العنوان الحالي: قسم علوم الأرض، جامعة ستوكهولم، ستوكهولم، السويد.ساهم هؤلاء المؤلفون بالتساوي: صوفي تن هيتبرينك، دوشان ماتيريć.البريد الإلكتروني: دوسان.ماتيريك@ufz.de
كاندورب، م. ل. أ.، لوبيلي، د.، كيل، س.، ديكسترا، هـ. أ. وفان سيبيل، إ. الكتلة العالمية من البلاستيك البحري العائم تهيمن عليها الحطام الكبير طويل الأمد. نات. جيوساي. 16، 689-694 (2023).
تشاو، س. وآخرون. توزيع الميكروبلاستيك تحت السطح في المحيط. ناتشر 641، 51-61 (2025).
ويمان، سي. ونييمان، إتش. مصير البلاستيك في البيئة البحرية – مراجعة مختصرة. العلوم البيئية: العمليات. التأثيرات 23، 198-212 (2021).
Materić، د.، هولزينجر، ر. ونيمان، هـ. النانوبلاستيك والميكروبلاستيك الفائق الدقة في بحر وادن الهولندي – الحطام البلاستيكي المخفي؟ Sci. Total Environ. 846، 157371 (2022).
مون، س. وآخرون. الملاحظة المباشرة والتعرف على النانو بلاستيك في مياه المحيط. ساينس. أدف. 10، eadh1675 (2024).
بابورتسافا، ك. ولامبيتي، ر. س. تركيزات عالية من البلاستيك مخفية تحت سطح المحيط الأطلسي. نات. كوم. 11، 4073 (2020).
إيجر، م. وآخرون. التوزيع العائم للقمامة البلاستيكية ) والأنظمة البحرية في الطبقة العليا من المحيط الأطلسي الشمالي. Sci. Rep. 12، 13465 (2022).
فان سيبيل، إ. وآخرون. جرد عالمي للقطع البلاستيكية الصغيرة العائمة. رسائل البحث البيئي 10، 124006 (2015).
كينون، ك. و كرايدلر، إ. طيور الألباتروس ليتل تبتلع مواد غير قابلة للهضم. الأوك 86، 339-343 (1969).
ماكلويد، م.، أarp، هـ. ب. هـ.، تيكمان، م. ب. وجاهنكي، أ. التهديد العالمي من تلوث البلاستيك. ساينس 373، 61-65 (2021).
برغمان، م. وآخرون. تلوث البلاستيك في القطب الشمالي. مراجعة الطبيعة: الأرض والبيئة 3، 323-337 (2022).
بينغ، إكس. وآخرون. الميكروبلاستيك تلوث أعمق جزء من محيط العالم. رسائل وجهات نظر الجيوكيمياء 9، 1-5 (2018).
نابر، إ. إ. وآخرون. الوصول إلى آفاق جديدة في تلوث البلاستيك – النتائج الأولية للميكروبلاستيك على قمة إيفرست. وان إيرث 3، 621-630 (2020).
Sophie ten Hietbrink , Dušan Materić , Rupert Holzinger , Sjoerd Groeskamp & Helge Niemann
Plastic pollution of the marine realm is widespread, with most scientific attention given to macroplastics and microplastics . By contrast, ocean nanoplastics ( ) remain largely unquantified, leaving gaps in our understanding of the mass budget of this plastic size class . Here we measure nanoplastic concentrations on an oceanbasin scale along a transect crossing the North Atlantic from the subtropical gyre to the northern European shelf. We find approximately of polyethylene terephthalate (PET), polystyrene (PS) and polyvinyl chloride (PVC) nanoplastics throughout the entire water column. On average, we observe a 1.4 -fold higher concentration of nanoplastics in the mixed layer when compared with intermediate water depth, with highest mixed-layer nanoplastic concentrations near the European continent. Nanoplastic concentrations at intermediate water depth are 1.8 -fold higher in the subtropical gyre compared with the open North Atlantic outside the gyre. The lowest nanoplastic concentrations, with about on average and predominantly composed of PET, are present in bottom waters. For the mixed layer of the temperate to subtropical North Atlantic, we estimate that the mass of nanoplastic may amount to 27 million tonnes (Mt). This is in the same range or exceeding previous budget estimates of macroplastics/microplastics for the entire Atlantic or the global ocean . Our findings suggest that nanoplastics comprise the dominant fraction of marine plastic pollution.
Concerns about plastic in the environment had already been raised in the 1960s (ref. 9). By now, it has become one of the largest contemporary environmental hazards , with plastic accumulating in every known natural habitat . A substantial fraction of the global annual plastic production ends up in the ocean , for example, through riverine transport , atmospheric deposition and direct coastal or ship-based littering . The further fate of plastic debris in the ocean depends on several factors, including the density of the plastic items and their transport at the ocean surface . Accumulation hotspots of floating plastics include bays and convergence zones, such as the subtropical ocean gyres , and a considerable fraction of marine plastic litter is redeposited along shorelines . Plastic may also degrade: wave action exerts shear stress, solar ultraviolet radiation induces photooxidation and microbes can further weaken the structural integrity of the polymer so that macroplastic items (size: ) fragment into microplastics (size: to 5 mm ) and nanoplastics (size: . In particular, photodegradation has been discussed as a key process in the breakdown of floating plastic litter at the sea surface it probably provides a constant source of nanoplastic particles to the ocean , with potentially negative effects on marine life . In contrast to macroplastics and microplastics, the dispersion of nanoplastics is not governed by buoyancy properties. With decreasing particle size,
dispersion is more dominantly controlled by the collision of nanoplastics with water molecules and Brownian motion .
Polythene (PE), PS, PVC and PET particles are indeed found as nanoplastics in the ocean , but the distribution and concentrations of nanoplastics, both geographically and over depth, are virtually unknown. This knowledge gap exists because it is challenging to sample and analyse nanoplastics at environmentally relevant concentrations . Hence, nanoplastics are not included in any ocean plastic budget estimates . This hinders our comprehensive understanding of the potential environmental impact and health hazards of marine plastic pollution. A skewed ocean plastic size distribution towards smaller particle diameters , however, suggests that nanoplastics could be a globally important contaminant .
During a research cruise with RV Pelagia in 2020, we sampled the water column from the sea surface to the bottom across the North Atlantic Ocean from the subtropical gyre to the northern European shelf (Fig. 1) and measured nanoplastics with thermal-desorption proton-transfer-reaction mass spectrometry (TD-PTR-MS). This method allows identification of the polymer backbone as well as quantification of nanoplastic particles in seawater using fingerprinting algorithms .
Fig. 1|Map of the 12 hydrocast stations along a transect crossing the North Atlantic from the subtropical gyre to the northern European shelf. Stations 1-5 are located in the NASG (‘gyre’), stations 6-9 are in the open ocean (that is, water depth ; ‘outside gyre’) between the shelf and the NASG and stations 10-12 are on the European shelf (water depth below 200 m ;’coastal’). The extent of the NASG (Extended Data Figs. 5 and 6) is highlighted in orange and the remaining part of the open subtropical to temperate North Atlantic ( to ) is highlighted in blue. Bathymetry data were compiled from the freely available databases of GEBCO (https://www.gebco.net/) and EMODnet (https://emodnet.ec.europa.eu/en) and the map was created with the Global Mapper software package.
Ubiquitous presence of nanoplastics
Samples for nanoplastic analysis were recovered from 12 hydrocast stations, of which stations 1-5 were located in the North Atlantic subtropical gyre (NASG;’gyre’), stations 6-9 were in the open ocean but outside the gyre (‘outside gyre’) and stations 10-12 were on the European shelf (‘coastal’) (Fig. 1).
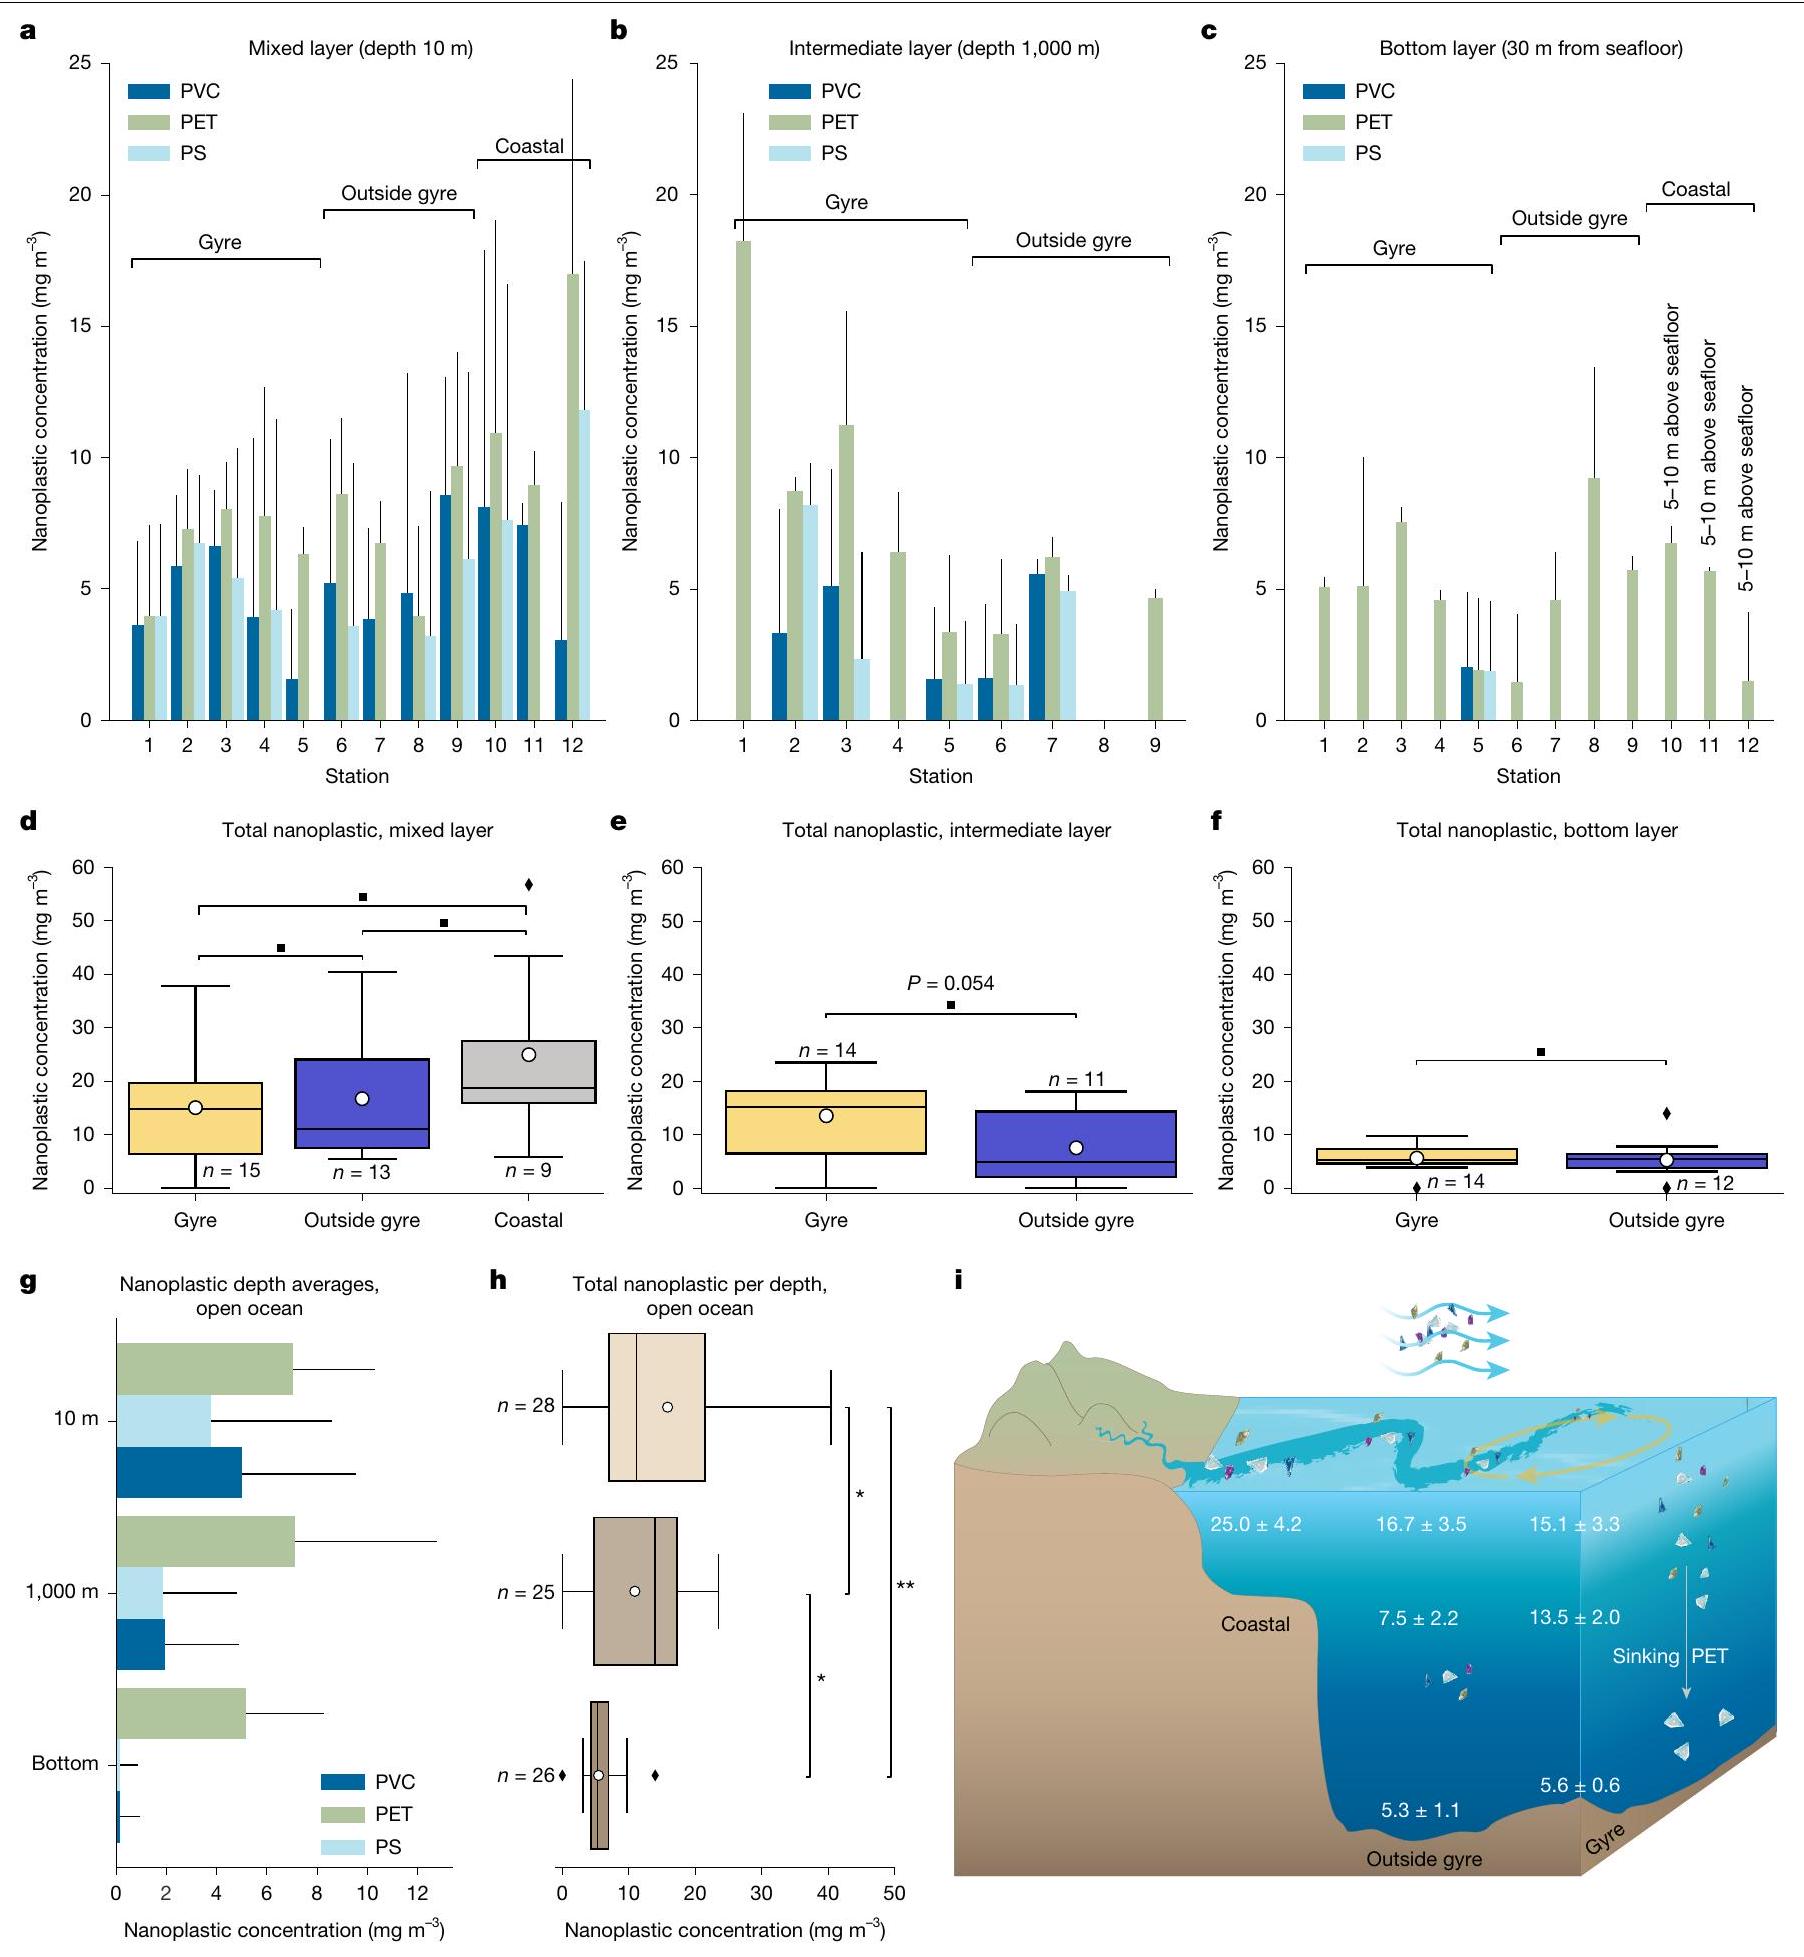
The mixed layer of the ocean was sampled at 10 m water depth (see Extended Data Fig.5c for mixed-layer depth ranges of the stations). Nanoplastics in this layer comprise PVC, PET and PS in the range at all 12 hydrocast stations (Fig. 2a), amounting to a total nanoplastic concentration (PVC + PET + PS) of about (average ± standard error). In one sample (station 8; mixed layer), polypropylene (PP) and polypropylene carbonate (PPC) were also detected ( 24.27 and , respectively; data not shown). Because this sample was anomalous compared with all of the other results, we cannot rule out the possibility that the PP and PPC are a result of contamination and, hence, we excluded these results from successive analyses. We found that total nanoplastic concentrations were -fold higher at the ‘coastal’ stations ( ) when compared with the open-ocean regions (Fig. 2d). Differences in nanoplastic concentrations were mainly caused by -fold higher PS and -fold higher PET concentrations when comparing the ‘coastal’ with the open-ocean stations (Extended Data Fig. 1). PVC concentrations were, on the other hand, only slightly higher( -fold). The ‘gyre’ stations showed a lower average concentration of total nanoplastics ( ) when compared with the ‘outside gyre’ stations ( ), but this was not significant (Fig. 2d). No notable differences were found for single polymers when comparing ‘gyre’ and ‘outside gyre’ stations.
Similar to the mixed layer, we found PVC, PET and PS nanoplastics in the intermediate layer at water depth (stations 1-9;Fig. 2b) amounting to an average nanoplastic concentration of . The water depth at all ‘coastal’ stations was , restricting comparison of the intermediate water layer to the ‘gyre’ and ‘outside gyre’ stations. The intermediate depth at the ‘gyre’ stations showed a 1.8 -fold higher average concentration of total nanoplastics ( ) compared with the ‘outside gyre’ stations ( ; Fig. 2e).
Unlike the ubiquitous presence of all polymer types in the mixed layer, we could not observe PS, PVC and PET across stations consistently. PET nanoplastic concentrations were 2.5 -fold higher in the ‘gyre’ compared with the ‘outside gyre’ stations. PVC and PS concentrations in the ‘gyre’ and ‘outside gyre’ stations were similar (Extended Data Fig. 1).
Ocean-bottom waters (sampled 30 m above the seafloor) contained considerable amounts of PET, whereas PVC and PS were, with the exception of one station, below detection limit (Fig. 2c). The average total nanoplastic bottom-water concentration was along the transect from stations 1 to 9 . Because of the shallow water depth at stations 10-12, bottom waters at these stations were sampled at approximately above the seafloor (and not 30 m above seafloor) and thus excluded from statistical comparison. The highest total nanoplastic concentration was observed at station 8 , exclusively consisting of PET (Fig. 2c). No significant differences in total nanoplastic concentrations were found when comparing bottom waters from the ‘gyre’ and ‘outside gyre’ stations (Fig. 2f).
We assessed the vertical distribution of nanoplastics in the North Atlantic water column by averaging total nanoplastic concentrations along the open-ocean section of the transect (stations 1-9) for every depth interval (Fig. 2g). Average total nanoplastic concentrations decreased 1.4 -fold, from mixed-layer to intermediate waters, and foremost by 2.0 -fold from intermediate to bottom waters (Fig. 2h). The decrease in PVC and PS, 2.6-fold and 2.0-fold, respectively, from mixed-layer to intermediate waters and 12.1 -fold and 13.3 -fold from intermediate to bottom waters seemed comparably steady (Extended Data Fig.1). PET concentrations, on the other hand, remained relatively high throughout the water column.
Controls on nanoplastic distribution
The hotspot concentrations in the mixed layer close to the European continent (Fig. 2d) and, to a lesser extent, in intermediate waters in the NASG (Fig. 2e) indicate two sources of nanoplastics. At the shelf, nanoplastics may enter the ocean through the same routes as macroplastics and microplastics, that is, by means of rivers and surface water runoff (Fig. 2i). Also, nanoplastic from land can become airborne and transported as nanoplastic aerosols, eventually entering the ocean through wet and dry deposition . Shelf mixed-layer waters with comparably high nanoplastic concentrations are then entrained with less polluted offshore waters (Fig. 2d), which explains our finding of decreased nanoplastic concentrations further away from the coast. Although atmospheric deposition of microplastics and nanoplastics to the surface ocean is not constrained in our study, it seems likely that this decreases offshore just as for other land-based aerosol sources . However, floating macroplastics and microplastics generally accumulate in the subtropical gyres and probably release secondary nanoplastics, originating from continuing fragmentation of the floating plastic through shear stress (waves) and photodegradation (solar ultraviolet light) . The moderate difference in nanoplastic concentrations between ‘gyre’ and ‘outside gyre’ stations (Fig. 2d) thus indicates that nanoplastic concentrations in the mixed layer might be horizontally homogenized as a result of shear dispersion and wind-induced turbulent mixing . Also, nanoplastics might be redistributed through air-sea interactions. Particles can be released to the atmosphere by means of bubble burst ejection and aerolization of spray , after which they can be transported over long distances of hundreds of kilometres in the atmosphere before being redeposited into the ocean .
Vertical distribution of nanoplastics
Compared with the mixed layer, a different nanoplastic distribution pattern emerges at water depth, with a more distinct maximum in nanoplastic concentrations at ‘gyre’ stations (Fig. 2d,e). Here, differences in nanoplastic concentrations reflect relative differences
Fig. 2 | Horizontal and vertical distribution of nanoplastics in the water column of the North Atlantic. a-c, Average nanoplastic concentrations of PVC, PET and PS at 12 stations along a transect from the NASG (‘Gyre’; stations 1-5), the open ocean between the shelf and the gyre (‘Outside gyre’; stations 6-9) and at the shelf break or on the European shelf (‘Coastal’; stations 10-12). Nanoplastic concentrations were measured at three water depths from the mixed layer ( 10 m below sea level, mbsl ) (a), intermediate layer ( ; only offshore stations 1-9) (b) and bottom layer (30 m above the seafloor at the offshore stations 1-9 and 5-10 m above the seafloor at coastal stations 10-12) (c). The error bars represent the s.d. of the measurements taken at each station. d-f, Total (PS + PET + PVC) nanoplastic concentrations for the three groups ‘Gyre’, ‘Outside gyre’ and ‘Coastal’ in the mixed layer (d), intermediate layer (e) and bottom layer (f) shown as box plots.g,h, For the open ocean (stations 1-9),
average concentrations over depth are shown for individual (g) or total (h) nanoplastic concentrations. Ing, the error bars represent the s.d. of the nanoplastic concentrations in each depth category. All box plots indicate the percentiles of the median, with the whiskers extending to the data points that fall within the 1.5 interquartiles. Data points that fall outside this range are indicated by a diamond. The mean value is indicated with the white dot. Differences between groups were analysed using a one-way ANOVA test and a -test for means comparison. Significance levels with and ) are indicated. , Overview of the average nanoplastic concentrations and standard error (in ) in the ‘Gyre’, ‘Outside gyre’ and ‘Coastal’ regions. Putative origins of nanoplastics and transport processes are highlighted.
in floating and submerged macroplastic and microplastic concentrations . This suggests a decoupling of processes determining the horizontal distribution of nanoplastics in the mixed layer versus deeper-water layers. Indeed, stratification separates these water layers (Extended Data Fig. 2) and thus strongly reduces solute exchange between the two water masses. However, sinking particles and aggregates (for example, marine snow) can cross the pycnocline .Hence, as well as varying circulation patterns and stratification, differences in productivity across ocean provinces may also influence the distribution of nanoplastics. However, the filtration threshold excludes marine snow, preventing us from accounting for most aggregated nanoplastics. PVC, PS and, most importantly, PET were found to largely contribute to the submerged macroplastics and microplastics pool just below the mixed layer (approximately 100-300 m water depth) at both ‘gyre’ and ‘outside gyre’ regions of the North Atlantic . Moreover, the presence of PET nanoplastic at water depths of was recently demonstrated . Sinking of macroplastics and microplastics and continuing fragmentation of the submerged and sinking particles are hence a seemingly important factor in determining nanoplastic concentration and distribution in the intermediate water layer. An abundance of plastic particles, more dominantly composed of polyesters, was found on and in deep-sea sediments .Nanoplastic production from sinking microparticles and macroparticles is hence the least parsimonious explanation for the presence of nanoplastics in bottom waters, as well as sinking of nanoplastic aggregates. At these depths below the epipelagic zone, continuing photooxidation will have diminished, although continuing fragmentation can be a result of antecedent photodegradation . Other possible mechanisms contributing to nanoplastic production could be mechanical stress , although to a lesser extent than for the mixed layer, and biodegradation, including microbial degradation of macroplastics and microplastics , as well ingestion or digestion of microplastics by macrofauna . Accumulation of nanoplastics in a nepheloid layer-which, in some areas in the North Atlantic, can extend up to 800 m above the seabed -as well as resuspension of sediments and the remobilization of potentially deposited nanoplastics may further contribute to elevated nanoplastic concentrations in bottom waters. Plastic mass production began in the 1950s, but the age of subtropical Atlantic bottom waters is >400 years (ref. 54). Deep-water-mass formation and thermohaline convection thus seem unlikely to account for the presence of nanoplastics in bottom waters.
A mixed-layer nanoplastic mass budget
In the mixed layer within the ‘gyre’ (stations 1-5), we measured average nanoplastic concentrations of , ). These data contrast with previous reports of directly measured macroplastic and microplastic concentrations. At the same stations as measured here, the mass of macroplastic and microplastic ( ; consisting primarily of PE and PP) was found to amount to about at the sea surface and to (consisting primarily of PET) at depth in the mixed layer . Higher microplastic mass concentrations of about (consisting primarily of PP and PE) at the sea surface and (consisting primarily of PE, PP and PS) at depth were found at two other stations in the mixed layer of the NASG . Also, recently modelled concentrations of up to of buoyant macroplastics and microplastics , primarily PE, PP and PS) at the sea surface of the NASG are lower than our measured nanoplastic concentrations.
To estimate a mixed-layer nanoplastic mass budget, we considered an average climatological mixed-layer depth for November (indicated by the contours in Extended Data Fig. 5c) and the region of the temperate to subtropical North Atlantic. This is bounded by the subpolar gyre north of and by the southern extent of the NASG at
(Extended Data Figs. 5 and 6). The volume of the climatological mixed layer was for the NASG and for the remaining temperate to subtropical North Atlantic (Extended Data Fig. 5c). As bulk plastic concentration measurements are inherently prone to methodological bias , the following provides a polymer-specific budget assessment. With respect to our measurements in the mixed layer in the ‘gyre’ (stations 1-5), the total nanoplastic mass amounts to . For the mixed layer in the ‘outside gyre’ region (stations 6-9), our extrapolation yielded a total nanoplastic mass of PET, PS, PVC). This is substantially higher than the recently modelled macroplastic and microplastic mass of buoyant plastic in the mixed layer, amounting to 0.31 Mt for the ‘gyre’ and to 0.05 Mt for the remaining temperate to subtropical North Atlantic .
Owing to the ability of nanoplastic to traverse biological barriers , translocate , bioaccumulate and interact chemically at rapid rates , nanoplastics may represent the most problematic plastic size fraction for ocean life. Notably, most studies assessing the impacts and toxicity of nanoplastics use baseline nanoplastic concentrations that are unsupported by robust environmental measurements. Although mechanisms that contribute to the creation of secondary nanoplastics from parent ocean macroplastics and microplastics have been shown , only three studies were able to detect these compounds in the ocean water column . This study provides, to our knowledge, the first quantitative evidence of the ubiquitous presence of PET, PVC and PS nanoplastics from the mixed-layer to deep-sea bottom waters across the temperate to subtropical North Atlantic. Spatially extrapolated, our measurements strongly suggest that nanoplastics are the largest fraction of the marine plastic mass budget. This implies that the total mass of plastic in the ocean is higher than previously thought, because nanoplastics were not accounted for in marine plastic budget assessments . Our finding underscores the need to determine the origin, formation and transport of nanoplastics, as well as their further fate in the ocean.
Online content
Any methods, additional references, Nature Portfolio reporting summaries, source data, extended data, supplementary information, acknowledgements, peer review information; details of author contributions and competing interests; and statements of data and code availability are available at https://doi.org/10.1038/s41586-025-09218-1.
14. Materić, D. et al. Nanoplastics measurements in Northern and Southern polar ice. Environ. Res. 208, 112741 (2022).
15. Jambeck, J. R. et al. Plastic waste inputs from land into the ocean. Science 347, 768-771 (2015).
16. Lebreton, L. C. M. et al. River plastic emissions to the world’s oceans. Nat. Commun. 8, 15611 (2017).
17. Meijer, L. J., Van Emmerik, T., Van Der Ent, R., Schmidt, C. & Lebreton, L. More than 1000 rivers account for of global riverine plastic emissions into the ocean. Sci. Adv. 7, eaaz5803 (2021).
18. Evangeliou, N. et al. Atmospheric transport is a major pathway of microplastics to remote regions. Nat. Commun. 11, 3381 (2020).
19. Willis, K., Denise Hardesty, B., Kriwoken, L. & Wilcox, C. Differentiating littering, urban runoff and marine transport as sources of marine debris in coastal and estuarine environments. Sci. Rep. 7, 44479 (2017).
20. Onink, V., Jongedijk, C. E., Hoffman, M. J., van Sebille, E. & Laufkötter, C. Global simulations of marine plastic transport show plastic trapping in coastal zones. Environ. Res. Lett. 16, 064053 (2021).
21. Gigault, J. et al. Current opinion: what is a nanoplastic? Environ. Pollut. 235, 1030-1034 (2018).
22. Lambert, S. & Wagner, M. Formation of microscopic particles during the degradation of different polymers. Chemosphere 161, 510-517 (2016).
23. Ter Halle, A. et al. To what extent are microplastics from the open ocean weathered? Environ. Pollut. 227, 167-174 (2017).
24. Delre, A. et al. Plastic photodegradation under simulated marine conditions. Mar. Pollut. Bull. 187, 114544 (2023).
25. Ma, Y. et al. Effects of nanoplastics and microplastics on toxicity, bioaccumulation, and environmental fate of phenanthrene in fresh water. Environ. Pollut. 219, 166-173 (2016).
26. Zaki, M. R. M. & Aris, A. Z. An overview of the effects of nanoplastics on marine organisms. Sci. Total Environ. 831, 154757 (2022).
27. Sun, H., Jiao, R. & Wang, D. The difference of aggregation mechanism between microplastics and nanoplastics: role of Brownian motion and structural layer force. Environ. Pollut. 268, 115942 (2021).
28. Ter Halle, A. et al. Nanoplastic in the North Atlantic subtropical gyre. Environ. Sci. Technol. 51, 13689-13697 (2017).
29. Schwaferts, C., Niessner, R., Elsner, M. & Ivleva, N. P. Methods for the analysis of submicrometer- and nanoplastic particles in the environment. Trends Anal. Chem. 112, 52-65 (2019).
30. Velimirovic, M., Tirez, K., Voorspoels, S. & Vanhaecke, F. Recent developments in mass spectrometry for the characterization of micro- and nanoscale plastic debris in the environment. Anal. Bioanal. Chem. 413, 7-15 (2021).
31. Lorenz, C. et al. Spatial distribution of microplastics in sediments and surface waters of the southern North Sea. Environ. Pollut. 252, 1719-1729 (2019).
32. Poulain, M. et al. Small microplastics as a main contributor to plastic mass balance in the North Atlantic subtropical gyre. Environ. Sci. Technol. 53, 1157-1164 (2018).
33. Materić, D. et al. Micro- and nanoplastics in alpine snow: a new method for chemical identification and (semi)quantification in the nanogram range. Environ. Sci. Technol. 54, 2353-2359 (2020).
34. Sullivan, G. L. et al. Detection of trace sub-micron (nano) plastics in water samples using pyrolysis-gas chromatography time of flight mass spectrometry (PY-GCToF). Chemosphere 249, 126179 (2020).
35. Kau, D. et al. Fine micro- and nanoplastics concentrations in particulate matter samples from the high alpine site Sonnblick, Austria. Chemosphere 352, 141410 (2024).
36. Allen, D. et al. Microplastics and nanoplastics in the marine-atmosphere environment. Nat. Rev. Earth Environ. 3, 393-405 (2022).
37. Yu, H. et al. Estimates of African dust deposition along the trans-Atlantic transit using the decadelong record of aerosol measurements from CALIOP, MODIS, MISR, and IASI. J. Geophys. Res. Atmos. 124, 7975-7996 (2019).
38. Law, K. L. et al. Plastic accumulation in the North Atlantic subtropical gyre. Science 329, 1185-1188 (2010).
39. Lambert, S. & Wagner, M. Characterisation of nanoplastics during the degradation of polystyrene. Chemosphere 145, 265-268 (2016).
40. Wagner, S. & Reemtsma, T. Things we know and don’t know about nanoplastic in the environment. Nat. Nanotechnol. 14, 300-301 (2019).
41. Liang, J.-H., Wan, X., Rose, K. A., Sullivan, P. P. & McWilliams, J. C. Horizontal dispersion of buoyant materials in the ocean surface boundary layer. J. Phys. Oceanogr. 48, 2103-2125 (2018).
42. Kukulka, T., Proskurowski, G., Morét-Ferguson, S., Meyer, D. W. & Law, K. L. The effect of wind mixing on the vertical distribution of buoyant plastic debris. Geophys. Res. Lett. 39, L07601 (2012).
43. Masry, M. et al. Experimental evidence of plastic particles transfer at the water-air interface through bubble bursting. Environ. Pollut. 280, 116949 (2021).
44. Trainic, M. et al. Airborne microplastic particles detected in the remote marine atmosphere. Commun. Earth Environ. 1, 64 (2020).
45. Boyd, P. W., Claustre, H., Levy, M., Siegel, D. A. & Weber, T. Multi-faceted particle pumps drive carbon sequestration in the ocean. Nature 568, 327-335 (2019).
46. Erni-Cassola, G., Zadjelovic, V., Gibson, M. I. & Christie-Oleza, J. A. Distribution of plastic polymer types in the marine environment; a meta-analysis. J. Hazard. Mater. 369, 691-698 (2019).
47. Woodall, L. C. et al. The deep sea is a major sink for microplastic debris. R. Soc. Open Sci. 1, 140317 (2014).
48. Gewert, B., Plassmann, M. M. & MacLeod, M. Pathways for degradation of plastic polymers floating in the marine environment. Environ. Sci.: Process. Impacts 17, 1513-1521 (2015).
49. Enfrin, M. et al. Release of hazardous nanoplastic contaminants due to microplastics fragmentation under shear stress forces. J. Hazard. Mater. 384, 121393 (2020).
50. Lv, S. et al. Continuous generation and release of microplastics and nanoplastics from polystyrene by plastic-degrading marine bacteria. J. Hazard. Mater. 465, 133339 (2024).
51. Dawson, A. L. et al. Turning microplastics into nanoplastics through digestive fragmentation by Antarctic krill. Nat. Commun. 9, 1001 (2018).
52. Zhao, J. et al. Microplastic fragmentation by rotifers in aquatic ecosystems contributes to global nanoplastic pollution. Nat. Nanotechnol. 19, 406-414 (2024).
53. Gardner, W. D., Richardson, M. J., Mishonov, A. V. & Biscaye, P. E. Global comparison of benthic nepheloid layers based on 52 years of nephelometer and transmissometer measurements. Prog. Oceanogr. 168, 100-111 (2018).
54. Matsumoto, K. Radiocarbon-based circulation age of the world oceans. J. Geophys. Res. Oceans 112, C09004 (2007).
55. Zhao, J. & Stenzel, M. H. Entry of nanoparticles into cells: the importance of nanoparticle properties. Polym. Chem. 9, 259-272 (2018).
56. Al-Sid-Cheikh, M. et al. Uptake, whole-body distribution, and depuration of nanoplastics by the scallop Pecten maximus at environmentally realistic concentrations. Environ. Sci. Technol. 52, 14480-14486 (2018).
57. Miao, L. et al. Acute effects of nanoplastics and microplastics on periphytic biofilms depending on particle size, concentration and surface modification. Environ. Pollut. 255, 113300 (2019).
Publisher’s note Springer Nature remains neutral with regard to jurisdictional claims in published maps and institutional affiliations.
Open Access This article is licensed under a Creative Commons Attribution 4.0 International License, which permits use, sharing, adaptation, distribution and reproduction in any medium or format, as long as you give appropriate credit to the original author(s) and the source, provide a link to the Creative Commons licence, and indicate if changes were made. The images or other third party material in this article are included in the article’s Creative Commons licence, unless indicated otherwise in a credit line to the material. If material is not included in the article’s Creative Commons licence and your intended use is not permitted by statutory regulation or exceeds the permitted use, you will need to obtain permission directly from the copyright holder. To view a copy of this licence, visit http://creativecommons.org/licenses/by/4.0/.
(c) The Author(s) 2025
Methods
Sampling
The samples were collected aboard RV Pelagia during cruise 64PE480 in November 2020. Samples were taken at nine stations along a transect through the temperate to subtropical North Atlantic and at three stations positioned on the European continental shelf (Fig. 1). To enable cross-comparison between different stations, three depths ( 10 m and water depths and 30 m above the seafloor) were sampled at every deep-ocean station (stations 1-9). Consequently, the actual depth below the sea surface of the deepest sampling point varied as a function of the local water depth. A conductivity, temperature and depth (CTD) sensor phalanx with a rosette sampler comprising an array of 24 polytetrafluoroethylene (PTFE)-lined, PVC Niskin bottles with a volume of 121 was used for profiling water properties and recovering discrete water samples. During the hydrocast, the Niskin bottles were kept open so that they were flushed with local water during descent and ascent until closure at the desired water depth. Once the CTD sensor was placed on deck, the bottle faucet and tubing used for tapping seawater were thoroughly flushed with sample water before sampling. Then, 2-1 glass bottles (Fisherbrand, FB8002000) with PTFE stoppers were rinsed three times with water from the clean deionized water system of the ship and subsequently pre-rinsed (three times) with sample water from the Niskin bottle. Finally, a 2-I aliquot was tapped from the Niskin bottle into the glass bottle and immediately sealed with the stopper. The samples were stored in a dark and cool environment until further analysis in our home laboratories. To safeguard against contamination concerns, we performed a series of field blanks (see the ‘Quality assurance and control’ section).
TD-PTR-MS analysis
The water samples were processed in the PTR-MS lab at the Institute for Marine and Atmospheric Research Utrecht. During the time of analysis, the lab was thoroughly cleaned and dedusted on a weekly basis. Typically, only one person was present in the lab during analysis to minimize potential contamination. Blanks were included with every sample batch to account for the risk of airborne contamination. For future work, processing samples in a cleanroom should be considered, although the effectiveness of clean labs in eliminating plastic contamination at the nanoscale is at present uncertain. The 2-I samples were homogenized by shaking the bottle before subsampling. Immediately afterwards, an aliquot of 10 ml was taken from the 2-I glass bottle and stored in a pre-combusted glass chromatography vial (VWR). To separate nanoplastics from microplastics, the 10 -ml aliquot was filtered through a PTFE syringe filter. For further analysis, subsamples were prepared in triplicate, for which 1.5 ml of sample was pipetted into a new pre-combusted glass chromatography vial. The water matrix was removed using an evaporation/sublimation system . The dried samples were introduced to the PTR-MS unit through a thermal desorption system, using a heating protocol defined as follows: starting temperature of , followed by a quick increase at to , then a temperature increase to at a rate of and, finally, the temperature was increased to at a rate of . The final dwell time was 1 min at . The thermally desorbed compounds were carried by a constant stream of zero air at 50 SCCM to the PTR-ToF-MS instrument (PTR-TOF 8000, Ionicon Analytik). The inlet temperature was set to and the drift tube operation parameters were set to and , resulting in an of approximately 120 Td .
Nanoplastic quantification
The software PTRwid was used to extract the mass spectra . For data reduction, the mass spectra were averaged over a time period of 5 min once the thermal desorption unit reached a temperature of , that is, we only considered the time window from to , during
which most of the plastic thermally desorbs. Hence, much of the organic matter matrix was excluded from analysis, as many monomers and most volatile compounds typically desorb at temperatures below (refs. ). Data integration for oven temperatures from to not only excludes volatile compounds but also avoids pyrolysis and extensive thermolysis of the sample matrix. Consequently, our method measures collectively free nanoplastics and nanoplastics that are loosely associated to organic matter or that are aggregated, provided that the aggregates pass filter pores ( ) during prefiltration. To account for background contamination, the mass-specific average of the lab blanks from the corresponding sample batch was subtracted from the averaged nanoplastic masses in the samples. After subtraction, a limit of detection filter was applied, for which the mass-specific signal was set to zero when it did not exceed three times the standard deviation of the lab blanks. The lab blanks consisting of HPLC water (VWR, filtered with filter, CAS number 7732-18-5) were subjected to similar preparation and analysis as performed for the normal samples. In this manner, we corrected for background noise and possible procedural contamination in the samples. The pre-processed data were subsequently used for nanoplastic fingerprinting against chemically unaltered plastics (the library mass spectra) as described in detail in previous works . The fingerprint algorithm compares the spectra against a library comprising the seven most prevalent polymers: PE, PET, PS, PP, PPC, PVC and tyre wear. A matching score of -score , , one-tail distribution) was considered a positive fingerprint. Algal organic matter may slightly increase false-positive PS detection (see the ‘Quality assurance and control’ section and Sargassum experiment in Extended Data Table 1). To minimize this risk of false-positive annotations, we only considered a -score of 4 or higher as a positive fingerprint match for PS. Matching scores are indicated with* ( -score > 2 ), ** ( -score ) and -score , for which a higher matching score indicates a better fit with the library mass spectra. We conducted a Monte Carlo analysis to assess the potential interference of organic matter with plastic fingerprinting. The analysis showed that plastic overestimation did not exceed 31% before the match fails (Extended Data Fig. 7). Ion counts were converted to mole fraction using:
in which is the reaction rate coefficient, the residence time of the primary ions in the drift tube, [ ] the protonated analyte and [ ] the proton donor, hydronium. and represent the transmission functions of the hydronium and protonated analyte. The mole fractions were then converted to plastic concentrations ( ) by correcting for the sample load and dilution factor. Duplicate measurements instead of triplicate are available for station 9 in the mixed layer, stations 5 and 8 at water depth and station 5 in the bottom-water layer owing to file-corruption issues. Presented nanoplastic concentrations are semiquantitative as not all of the plastic material is eventually converted into detectable ions. This is because of (1) thermal desorption not being perfectly efficient and (2) fractions of the analyte ending up as non-analysable ions. Hence, the reported concentrations represent the lower limit of nanoplastic concentrations. Spike-and-recovery experiments were carried out for PS. Homogenized suspensions of 100 or 200 ng of PS was loaded into a vial along with 1.5 ml of seawater sample. Fingerprinting these spiked samples consistently yielded positive matches for PS with -scores of 4 or higher. By contrast, only of the unspiked mixed-layer samples with PS showed -scores of 4 or above. Spiking experiments were performed in triplicate to obtain a reliable recovery rate (Extended Data Table 2). The spiking experiment revealed a recovery/ionization efficiency rate of roughly , which agrees with our previous works . This entails that the actual PS concentrations in the samples might be 14 times higher. Because of the difficulties in loading precise amounts of plastic
in the nanogram range, spike-and-recovery experiments have not yet been performed for PVC or PET. In a previous study, a linear correction factor of for PS and a nonlinear correction factor between for 59 ng PET load and for 177 ng PET load have been reported . A cross-library correction was applied for PS and PVC concentrations, as these polymer mass spectra partially overlap, resulting in artificially higher PS concentrations when PVC is present and vice versa. These cross-library corrections were calculated on the basis of a 1:1 mixture of 1,000 ng PS and 1,000 ng PVC constructed from library mass spectra which were subsequently fingerprinted.
Moreover, high PS contents were found to lower the PVC matching score, potentially leading to false negatives in PVC detection. This probably affected the surface samples at station 12, at which high amounts of PS but low amounts of PVC were observed. Concentrations of PET were found to be unaffected by the presence of other polymers, owing to its very distinctive mass spectrum.
Quality assurance and control
Several field blanks were carried out to monitor potential plastic contamination during sampling. We performed field blanks in triplicate at the beginning, middle and end of the cruise, amounting to nine field blanks in total. The Niskin bottles were flushed twice using Milli-Q water and rinsed once more with HPLC water. Then, 2.5 lof HPLC water was poured into the Niskin bottles and left for 1 h in the Niskin bottle to simulate the time that is needed for the CTD sensor to reach the surface of the ocean after closing a Niskin bottle at depth. The Niskin bottle with HPLC water was then sampled in a similar manner as for the normal seawater samples. Field blanks were analysed in the same batches as normal samples. Although we found a low background signal of nanoplastics in the lab blanks ( averaged over all polymers and all lab blanks), the field blanks did not contain substantial further nanoplastic contamination (Extended Data Figs. 3 and 4);hence, we concluded that the low concentrations of background nanoplastics originated from the preparation and procedures in our laboratory and not from the sampling procedure. The average nanoplastic background concentration of is low compared with the transect averages of for the mixed layer, for depth and for the bottom layer.
To assess potential false positives from organic matter, we analysed Sargassum biomass samples as a proxy for complex organic material. Sargassum is abundant in the Sargasso Sea and disperses to other parts of the Atlantic, including the northeast .Approximately of Sargassum biomass-collected during our previous campaign and stored frozen-was dried in an oven at for 2 h before TD-PTR-MS analysis. The Sargassum biomass samples (no digestion applied) showed no positive matches for PE, PP, PET, PVC, or tyre wear particles and only a negligible match for PS, characterized by a low final PS quantity and a low algorithm matching score (see Extended Data Table 1). To maintain a conservative approach, we considered this PS match as a potential false positive in our water samples and, accordingly, increased the PS matching threshold to eliminate such false positives across all samples.
The missing and nanoplastic paradox
We could not detect PE and PP nanoplastics in this study (Extended Data Fig. 8). The only other study investigating nanoplastics in surface waters of the NASG (using pyrolysis-gas chromatography-mass spectrometry) could also not find a clear PE signal matching the pyrolytic fingerprint of their PE standard. Neither PE nor PP nanoplastics were reported along Atlantic or Pacific coastlines . This is surprising considering that PE and PP account for about half of the global plastic production and have been found as the most abundant floating polymer types in the ocean, including the NASG . We cannot fully explain this at present as our method has proved suitable to measure PE and PP-provided the chemical composition remains unaltered-in freshwater, air and marine biota samples , in which it was the dominant polymer.
Consequently, possible explanations are the following: (1) the nanoplastics are chemically modified in seawater compared with unaltered polymers so that mass spectrometric fingerprinting cannot detect the modified PE/PP; (2) the concentration of PE and PP nanoplastics were below our detection limit; or (3) the chemical composition of PE or PP is masked by the organic background in ocean water. We cannot rule out any of these explanations. However, through a Monte Carlo analysis (Extended Data Fig. 7), we could indeed show that PE identification was most sensitive to the effect of randomly added organic matter. It also seems very likely that photodegradation not only leads to the production of secondary nanoplastics from parent macroplastics/ microplastics but that the secondary PE and PP nanoplastics have also undergone some chemical alteration (for example, photooxidation introduces carbonyl groups ). This might result in a disparity with the diagnostic fingerprint and would explain why the ions typically associated with PE or PP were not detected.
Calculation of the mixed-layer volume
The dynamic height anomaly (DHA) contours of as defined in Section 3.27 of ref. 64 were used to define the NASG:
Here is the Coriolis parameter is the geostrophic velocity ( ) with respect to some reference pressure and is the reference velocity at . The gradient of the DHA was taken at constant pressure as . For this study we choose . This was combined with flow velocities derived from Argo floats at parking level was defined as the relative DHA, set relative to . was defined as the reference DHA, such that the sum
equals the DHA. Here can be directly obtained from the thermal wind balance.
To calculate , we used the annual mean World Ocean Atlas 2018 gridded climatology as input for in situ temperature and practical salinity. This was then converted into conservative temperature (CT) and absolute salinity (SA) using the Gibbs Seawater software toolbox . Both CT and SA were used as input for the gsw_toolbox function ‘gsw_geo_strf_dyn_height’ to calculate with respect to (Extended Data Fig. 5b). To obtain , we constructed an inverse estimate (Extended Data Fig. 6) equated as follows:
Here represent longitudes and represents latitudes, both limited to the North Atlantic basin. and are the related distances and and are the eastward and northward velocities, respectively. Each can be included in up to four equations, which can be written as . Here are the unknown stream functions, is the known right-hand side values of equations (4) and (5) and is a matrix containing -1 or 1 that multiplies the unknown values. This set of equations is solved using MATLAB least-squares minimization machinery given by , giving the reference DHA (Extended Data Fig. 5a).
To define the NASG, we first considered that the gyre is mostly concentrated in the upper 400 m (Fig. 1 in ref. 68). On the basis of the World Ocean Atlas vertical grid sizes, we averaged over the upper 410 m . The resulting streamlines of the DHA (Extended Data Fig. 6) correspond well to model-based Lagrangian trajectories (Figs. 1d and 3 in ref. 68) and stream function (Fig. 1 in ref. 69). This supports that
the observation-based DHA streamlines calculated here are an accurate indication of the flow field.
To further define the gyre, we selected the last streamline that loops from the northern part of the NASG to the southern part without crossing the coast (Extended Data Fig. 6). We used a lower bound latitude cut-off of , as this corresponds with the most western extent of the contour line. The northern bound of our study region was set at , as that separates the subpolar area from the temperate to subtropical region in which we sampled. The NASG is then bounded by the contour (black dots in Extended Data Fig. 5c), whereas the residual area bounded landwards by a isobath is defined as ‘outside gyre’ (red plusses in Extended Data Fig. 5c).
The climatological mixed-layer depth was calculated using World Ocean Atlas November mean data (Extended Data Fig. 5c). The station mixed-layer depths were calculated from the CTD sensor measurements from this study (Extended Data Fig. 5c). Although the CTD sensor occasionally measured deeper instantaneous mixed-layer depths than the climatological mean, they are within expectations. Therefore, we used the World Ocean Atlas climatological mixed-layer depth values as a first-order estimate to determine the mixed-layer volume both inside and outside the gyre. For the calculation of the macroplastic/ microplastic mass inside and outside the NASG, we extracted the modelled concentration values from ref. 1 and overlaid these onto the World Ocean Atlas grid points. This allowed us to make a direct comparison with our nanoplastic data.
Sensitivity analysis of the fingerprinting algorithm
To evaluate the uncertainty in potential overestimation of our plastic identification approach (for example, owing to the presence of natural organic matter), we performed a Monte Carlo assessment . We simulated the addition of organic matter to the mass spectra of our plastic library and assessed identification and quantification performance. We systematically added 50-350% (increment of 50%) of signal randomly spread over up to 5, 10 and 40 ions of our library used for the identification of nanoplastics. Each sequence of the run was done in 1,000 replicas.
Our Monte Carlo analysis showed that the identification of PET and PS was least affected by the simulated addition of organic matter. We could add 200% of the organic matter in relation to the polymer signal without compromising identification of these two plastics. PVC plastic identification was affected more strongly; addition of more than 100% progressively reduced the plastic identification of the fingerprinting algorithms. PE identification was mostly affected by organic matter presence, for which the recognition of the polymer was greatly affected already when about organic matter was added.
On the other hand, the Monte Carlo analysis showed that the overestimation in all scenarios (different levels of organic matter impurity spread over different numbers of ions) for all plastic polymers did not exceed . For PET, for example, increasing the organic matter background by or of the polymer signal, the overestimation was only about , about (peak) and about , respectively (Extended Data Fig. 7). In other words, if a sample contains a high amount of natural organic matter, the plastic recognition (fingerprint match) is likely to fail before the nanoplastic amount is overestimated by . Thus, we consider our results conservative, with a possible overestimation of roughly owing to the organic matrix effects.
Data availability
All data (including all stages of data processing) can be downloaded from DAS permanent repository: https://doi.org/10.25850/ nioz/7b.b.kj. This study used the YoMaHa’07 (ref. 57) dataset of velocities derived from Argo float trajectories provided by APDRC/IPRC.
The code used for the gyre mixed-layer volume can be found at https:// doi.org/10.25850/nioz/7b.b.kj. The fingerprint codes are published and available at https://doi.org/10.24416/UU01-HKNCGC. The GSW toolbox is available at http://www.teos-10.org/software.htm.
58. Materić, D. et al. Characterisation of the semi-volatile component of dissolved organic matter by thermal desorption-proton transfer reaction-mass spectrometry. Sci. Rep. 7, 15936 (2017).
59. Holzinger, R. PTRwid: a new widget tool for processing PTR-TOF-MS data. Atmos. Meas. Tech. 8, 3903-3922 (2015).
60. Johnson, D. R., Franks, J. S., Oxenford, H. A. & Cox, S. A. L. Pelagic Sargassum prediction and marine connectivity in the tropical Atlantic. Gulf Caribb. Res. 31, GCFI20-GCFI30 (2020).
61. Geyer, R., Jambeck, J. R. & Law, K. L. Production, use, and fate of all plastics ever made. Sci. Adv. 3, e1700782 (2017).
62. Materić, D. et al. Presence of nanoplastics in rural and remote surface waters. Environ. Res. Lett. 17, 054036 (2022).
63. Fraissinet, S., De Benedetto, G., Malitesta, C., Holzinger, R. & Materic, D. Microplastics and nanoplastics size distribution in farmed mussel tissues. Commun Earth Environ 5, 128 (2024).
64. IOC, SCOR and IAPSO. The international thermodynamic equation of seawater -2010 : calculation and use of thermodynamic properties. Intergovernmental Oceanographic Commission, Manuals and Guides No. 56. https://www.teos-10.org/pubs/TEOS-10_ Manual.pdf (2010).
65. Lebedev, K. V., Yoshinari H., Maximenko N. A. & Hacker P. W. YoMaHa’O7: velocity data assessed from trajectories of Argo floats at parking level and at the sea surface. IPRC Technical Note No. 4(2). http://apdrc.soest.hawaii.edu/projects/yomaha/yomahaO7/ YoMaHaO7O612small.pdf (2007).
66. Boyer, T. P. et al. World Ocean Atlas 2018. Dataset: In-situ temperature and salinity. NOAA National Centers for Environmental Information. https://accession.nodc.noaa.gov/ NCEI-WOA18 (2018).
67. McDougall, T. J. & Barker P. M. Getting started with TEOS-10 and the Gibbs Seawater (GSW) Oceanographic Toolbox. SCOR/IAPSO WG127. https://www.teos-10.org/pubs/ Getting_Started.pdf (2011).
68. Berglund, S. et al. The downward spiralling nature of the North Atlantic Subtropical Gyre. Nat. Commun. 13, 2000 (2022).
69. Berglund, S., Döös, K., Groeskamp, S. & McDougall, T. North Atlantic Ocean circulation and related exchange of heat and salt between water masses. Geophys. Res. Lett. 50, e2022GL100989 (2023).
70. de Boyer Montégut, C., Madec, G., Fischer, A. S., Lazar, A. & ludicone, D. Mixed layer depth over the global ocean: an examination of profile data and a profile-based climatology. J. Geophys. Res. Oceans 109, C12003 (2004).
71. Thompson, K. M., Burmaster, D. E. & Crouch, E. A. C. Monte Carlo techniques for quantitative uncertainty analysis in public health risk assessments. Risk Anal. 12, 53-63 (1992).
Acknowledgements We thank the crew and captain of RV Pelagia and the shipboard scientific party for their help at sea. This work has been supported by the Dutch Research Council (grant nos. OCENW.XS2.018 and OCENW.XS21.2.042) and the European Research Council (ERC-CoG grant no. 772923, project VORTEX).
Author contributions H.N. and D.M. devised the project, with funding acquired by H.N. and D.M. The principal methodology was developed by D.M. Fieldwork and sampling was done by S.t.H. and H.N. Formal analysis and lab work was performed by S.t.H. in the laboratory of R.H., under the supervision of D.M. and R.H. Data analysis and interpretation was done by S.t.H. and D.M. Determination of the gyre extent and mixed-layer volume was done by S.G. All authors contributed to writing of the paper.
Funding Open access funding provided by Helmholtz-Zentrum für Umweltforschung GmbH – UFZ.
Competing interests The authors declare no competing interests.
Additional information
Supplementary information The online version contains supplementary material available at https://doi.org/10.1038/s41586-025-09218-1.
Correspondence and requests for materials should be addressed to Dušan Materić. Peer review information Nature thanks Aron Stubbins and the other, anonymous, reviewer(s) for their contribution to the peer review of this work. Peer reviewer reports are available. Reprints and permissions information is available at http://www.nature.com/reprints.
Extended Data Fig.1|See next page for caption.
Extended Data Fig. 1| Box plots of nanoplastic polymer distribution in the water column of the North Atlantic. Average nanoplastic concentrations of PVC, PET and PS for the groups (‘gyre’; stations 1-5), the open ocean between the shelf and the gyre (‘outside gyre’; stations 6-9) and at the shelf break or on the European shelf (‘coastal’; stations 10-12) (a-i) and for the mixed layer , intermediate layer and bottom layer above the seafloor) for the offshore stations (stations 1-9) (j-1). The boxes indicate the percentiles of the median, with the whiskers extending to the data points that fall within the 1.5 interquartiles. Data points that fall outside this range are indicated by a diamond. The mean value is indicated with the white dot. Differences between groups were analysed using a one-way ANOVA test and a -test for means comparison. Significance levels with -values (**), -value and -value are indicated.
Article
Extended Data Fig. 2 | Surface-referenced potential density profiles of the upper 250 m at the offshore stations (stations 1-9). Calculated mixed-layer depth for each offshore station is indicated with a black dot. Data were obtained with a CTD sensor.
Extended Data Fig. 3 | Mole fractions of the system, lab and field blanks for six masses that are associated with the presence of plastics. The boxes indicate the percentiles of the median, with the whiskers extending to the data points that fall within the 1.5 interquartiles. Data points that fall outside this range are indicated by a circle. The mean value is indicated with the red
dashed line. Elevated counts on are associated with the presence of PE, PP and PPC, with PS and PET, with PS and PVC, with PVC and PE, with PET, PP and PPC and with PET and PVC. No more nanoplastic in the field blanks could be detected compared with the lab blanks, ruling out contamination originating from the storage bottles and Niskin bottles.
Extended Data Fig. 4 | Averaged plastic contamination detected in the lab
blanks. The error bars represent the s.d. of the blanks in each batch. All lab blank batches were found to have consistently low average PE, PET, PPC, PP, PS and PE nanoplastic concentrations . After background subtraction, composed of the mean of the lab blanks of the corresponding batch, still considerable amounts of nanoplastic could be detected in the ocean-water samples. We acknowledge, nonetheless, that the presence of background nanoplastic, although in low amounts, results in further uncertainty of nanoplastic concentrations. Negligible amounts of PET were detected in the lab blanks performed during the measurements of the bottom-water samples (see ‘batch 3’), implying that the considerable amounts of PET nanoplastic detected at several kilometres depth are not a result of procedural contamination. However, up to of PS has been observed in some of the lab blanks.
Extended Data Fig. DHA contours of at 1,000 m depth (a), the depth-weighted average over m depth (b) and the November climatological and station mixed-layer depths (c). Note the different scales of the colour maps for panels and . Panel shows the climatological mixedlayer depth from November gridded climatology (purple colours) that was used for the North Atlantic mass-budget calculations, which are in good
agreement with the station mixed-layer depths derived from CTD sensor measurements (white boxes) at the stations (large black dots). The small black dots indicate the grid points ‘inside the gyre’, whereas the red plusses indicate the grid points ‘outside the gyre’, both bounded by the latitude domain. The thin black contour is the coastline and the grey contour marks the isobath.
Article
Extended Data Fig. 6 | DHA contours , equation (2)). The thick black contour ( ) marks the outer edge of the gyre. The dashed white lines are the upper and lower latitude bounds of the domain we analysed.
The black dots are the cruise stations. The thin black contour is the coastline and the grey contour marks the isobath. The DHA is a result of averaging over the upper 410 m depth.
Extended Data Fig. 7| Monte Carlo analysis of the simulation of the addition of organic matter and its subsequent influence on the fingerprinting of PET, PS, PVC and PE. The randomized artificial addition of organic matter (OM) was spread out over 5,10 or 40 ions that are used for nanoplastic fingerprinting.
Extended Data Fig. 8 | The absence of certain ions typically associated with PE in the seawater samples. Many ion markers typically observed in the mass spectra of PE are completely absent from our samples (indicated by the red arrows). As a result, we cannot definitively determine whether background
organic matter is obscuring the PE signal or whether the absence of diagnostic ions indicates that the original PE matrix has been altered (for example, through photooxidation). Regardless, we must conclude that chemically unaltered PE, if present, remains below our detection limit in seawater samples.
Extended Data Table 1 | Results of the Sargassum fingerprinting experiment
Sample
ALG1
ALG3
Mass
PS_Spike_1-4
93.99 ng
PS_Spike_2-5
28.01 ng
PS_Spike_3-6
89.83 ng
Sargassum Tissue_1-7
–
2.41 ng
Sargassum Tissue_2-11
–
8.84 ng
Sargassum Tissue_3-15
–
2.82 ng
Only for PS, Sargassum induced a false-positive fingerprint exclusively with algorithm (ALG) 3. For all other polymers, no positive fingerprint could be generated using Sargassum biomass alone.
Article
Extended Data Table 2 | Results of the PS spike-and-recovery experiments
Sample
PS load (ng)
Retrieved (ng)
Recovery/ionization
efficiency rate (%)
S4 D11
100
S4 D11
200
S12 D1
200
Retrieved amount is the calculated average of the triplicates, shown with their standard deviation.
Institute for Marine and Atmospheric Research Utrecht (IMAU), Utrecht University, Utrecht, The Netherlands. Department of Environmental Analytical Chemistry (EAC), Helmholtz Centre for Environmental Research – UFZ, Leipzig, Germany. NIOZ Royal Netherlands Institute for Sea Research, ‘t Horntje (Texel), The Netherlands. Department of Earth Sciences, Utrecht University, Utrecht, The Netherlands. Present address: Department of Geological Sciences, Stockholm University, Stockholm, Sweden. These authors contributed equally: Sophie ten Hietbrink, Dušan Materić. e-mail: dusan.materic@ufz.de
Kaandorp, M. L. A., Lobelle, D., Kehl, C., Dijkstra, H. A. & van Sebille, E. Global mass of buoyant marine plastics dominated by large long-lived debris. Nat. Geosci. 16, 689-694 (2023).
Zhao, S. et al. The distribution of subsurface microplastics in the ocean. Nature 641, 51-61 (2025).
Wayman, C. & Niemann, H. The fate of plastic in the ocean environment-a minireview. Environ. Sci.: Process. Impacts 23, 198-212 (2021).
Materić, D., Holzinger, R. & Niemann, H. Nanoplastics and ultrafine microplastic in the Dutch Wadden Sea – the hidden plastics debris? Sci. Total Environ. 846, 157371 (2022).
Moon, S. et al. Direct observation and identification of nanoplastics in ocean water. Sci. Adv. 10, eadh1675 (2024).
Pabortsava, K. & Lampitt, R. S. High concentrations of plastic hidden beneath the surface of the Atlantic Ocean. Nat. Commun. 11, 4073 (2020).
Egger, M. et al. Pelagic distribution of plastic debris ( ) and marine organisms in the upper layer of the North Atlantic Ocean. Sci. Rep. 12, 13465 (2022).
van Sebille, E. et al. A global inventory of small floating plastic debris. Environ. Res. Lett. 10, 124006 (2015).
Kenyon, K. W. & Kridler, E. Laysan albatrosses swallow indigestible matter. The Auk 86, 339-343 (1969).
MacLeod, M., Arp, H. P. H., Tekman, M. B. & Jahnke, A. The global threat from plastic pollution. Science 373, 61-65 (2021).
Bergmann, M. et al. Plastic pollution in the Arctic. Nat. Rev. Earth Environ. 3, 323-337 (2022).
Peng, X. et al. Microplastics contaminate the deepest part of the world’s ocean. Geochem. Perspect. Lett. 9, 1-5 (2018).
Napper, I. E. et al. Reaching new heights in plastic pollution-preliminary findings of microplastics on Mount Everest. One Earth 3, 621-630 (2020).