داء السكري من النوع 2 هو عامل خطر رئيسي لسرطان الكبد الخلوي (HCC). تساهم التغيرات في ميكانيكا المصفوفة خارج الخلوية (ECM) في تطور السرطان.وزيادة الصلابة معروفة بأنها تعزز تقدم سرطان الكبد hepatocellular carcinoma (HCC) في الظروف التليفية.يتميز داء السكري من النوع 2 بتراكم المنتجات النهائية المتقدمة للجليكوزيل (AGEs) في المصفوفة خارج الخلوية (ECM)؛ ومع ذلك، فإن كيفية تأثير ذلك على سرطان الكبد (HCC) في الظروف غير التليفية غير واضحة. هنا نجد أنه، في المرضى ونماذج الحيوانات، تعزز AGEs التغيرات في بنية الكولاجين وتزيد من لزوجة المصفوفة خارج الخلوية، مع زيادة في التشتت اللزج واسترخاء الضغط بشكل أسرع، ولكن دون تغييرات في الصلابة. AGEs العالية واللزوجة معًا مع العوامل المسرطنة-إشارات الكاتينين تعزز تحفيز سرطان الكبد (HCC)، بينما يمنع تثبيط إنتاج AGE، وإعادة تكوين مستقبل إزالة AGE AGER1 أو كسر الروابط المتقاطعة للكولاجين المعتمدة على AGE من زيادة اللزوجة والزيادة في نمو HCC. تُظهر تحليلات المصفوفة والنمذجة الحاسوبية أن انخفاض الترابط في مصفوفة الكولاجين المجمعة بـ AGE، المميزة بطول ألياف أقصر وتنوع أكبر، يعزز اللزوجة. من الناحية الميكانيكية، تُظهر الدراسات الحيوانية وزراعة الخلايا ثلاثية الأبعاد أن زيادة اللزوجة تعزز تكاثر خلايا HCC وغزوها من خلال إنترغرين--مسار نقل الإشارات الميكانيكية -تنسين-1- يوضح أن التغيرات الهيكلية الناتجة عن AGE تعزز من لزوجة ومرونة مصفوفة extracellular (ECM)، وأن هذه المرونة يمكن أن تعزز تقدم السرطان في الجسم الحي، بغض النظر عن الصلابة.
يُعتبر داء السكري من النوع 2 (T2DM) والسمنة من المخاطر المهمة لتشمع الكبد (HCC)، ويُقدّر أن ما يصل إلى 30% من حالات تشمع الكبد في التهاب الكبد الدهني غير الكحولي (NASH) تحدث في مرحلة ما قبل التليف عندما لا تزال صلابة المصفوفة منخفضة، وغالبًا ما يعاني هؤلاء المرضى من ضعف في التحكم في مستوى السكر في الدم.تنتج منتجات نهاية glycation المتقدمة (AGEs) من الجليكاسيون غير الإنزيمي لبروتينات المصل أو الأنسجة خلال مرض السكري من النوع الثاني، أو يمكن تناولها من خلال استهلاك الطعام المحضر في درجات حرارة مرتفعة.مع مرور الوقت، تتراكم منتجات نهاية glycation المتقدمة (AGEs) في المصفوفة بسبب انخفاض الإزالة والتمثيل الغذائي.ويمكنها تعديل الكولاجين وبروتينات المصفوفة خارج الخلية كيميائيًاعلى الرغم من أن المنتجات النهائية للجليكاسيون المتقدمة (AGEs) في التهاب الكبد الدهني غير الكحولي (NASH) لا تبدو أنها تزيد من الصلابة بشكل كبير، إلا أنها قد تؤثر على اللزوجة المرنة لمصفوفة extracellular (ECM). الأنسجة ومصفوفات ECM عمومًا لزجة مرنة، حيث تظهر تشتت الطاقة اللزجة استجابةً للاختلالات الميكانيكية واستجابة ميكانيكية تعتمد على الزمن، مثل استرخاء الإجهاد استجابةً للتشوه.أظهرت الأبحاث الحديثة أن التغيرات في لزوجة ومرونة مصفوفة المادة خارج الخلوية، بغض النظر عن الصلابة، قد أثرت على الخلايا السلوكيات، بما في ذلك انتشار وهجرة خلايا سرطان الثدييمكن أن تؤثر اللزوجة المرنة على ديناميات نمو الأنسجة، والتناسق، ونمو خلايا السرطان.. هنا قمنا بالتحقيق في دور التغيرات التي يسببها AGE في الخصائص الميكانيكية للـ ECM على تقدم NASH و HCC.
تزيد AGEs من لزوجة الكبد
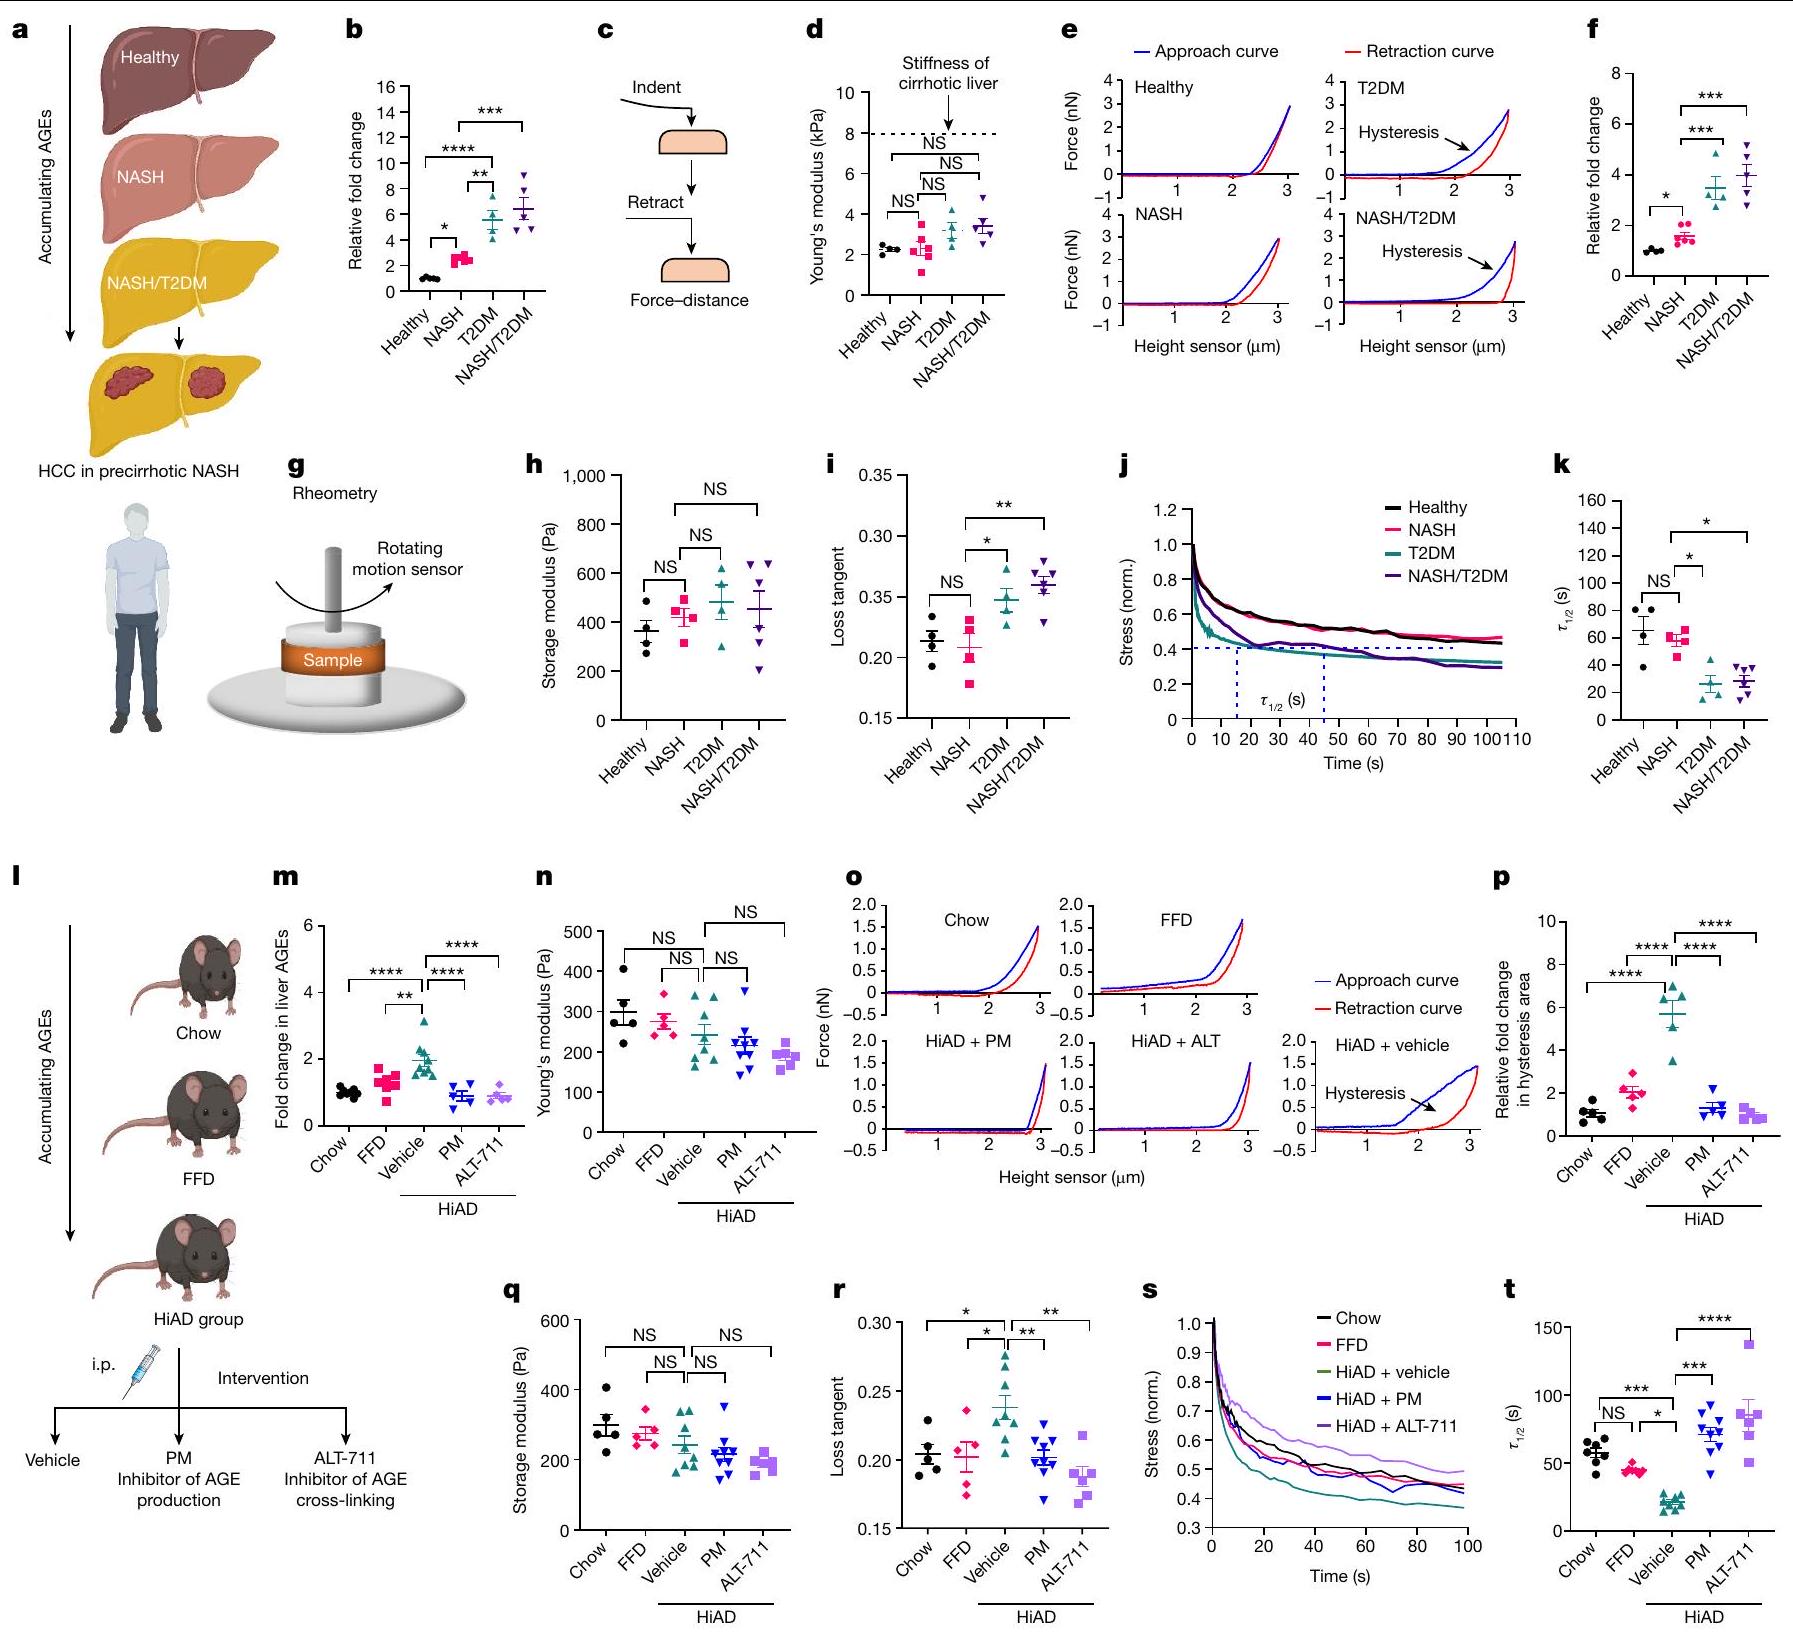
لتقييم الدور المحتمل للتغيرات التي تتوسطها منتجات نهاية الجليكوزيل (AGE) على المصفوفة خارج الخلية (ECM)، درسنا الخصائص الميكانيكية لعينات الكبد من مرضى السكري من النوع الثاني (T2DM)، ومن الأفراد الذين يعانون من التهاب الكبد الدهني غير الكحولي (NASH) مع أو بدون السكري من النوع الثاني (متوسط درجة نشاط المرض، 4؛ مرحلة التليف، 0-1؛ الشكل 1a). كانت مستويات AGE في الكبد أعلى بشكل ملحوظ في المرضى الذين يعانون من السكري من النوع الثاني، أو الذين يعانون من NASH والسكري من النوع الثاني مقارنةً بأولئك الذين لا يعانون من السكري من النوع الثاني (الشكل 1b). باستخدام المجهر الذري (AFM)، وجدنا أن المرضى الذين يعانون من السكري من النوع الثاني
الشكل 1 | تزداد اللزوجة المرنة في كبد الأفراد الذين يعانون من NASH وT2DM وفي الفئران التي تتبع نظام HiAD. أ، مخطط لزيادة AGE في NASH/T2DM. ب-ف.ب، قياس AGEs في الكبد. ج، مخطط لتحليل AFM. تم استخدام طريقة الضغط والسحب لإنشاء منحنيات القوة-المسافة. د-ف، تم تقييم الصلابة (د؛ معامل يونغ)، منحنيات القوة-المسافة التمثيلية (هـ) وقياس منطقة الهسترسيس (و، اللزوجة المرنة) باستخدام AFM. يتم الإشارة إلى متوسط صلابة كبد الإنسان المصاب بالتشمع بخط متقطع. (المجموعة الضابطة الصحية)، (المرضى الذين يعانون من NASH)، (داء السكري من النوع الثاني) و الأفراد الذين يعانون من (NASH + T2DM).تحليل الريومترية لأنسجة الكبد الطازجة. ج، مخطط تحليل الريومترية لأنسجة الكبد الطازجة. ح، تحليل الريومترية لمعامل التخزين في أكباد ما قبل التليف. ط، زاوية الفقد (اللزوجة المرنة) في أكباد المشاركين الأصحاء، والأفراد الذين يعانون من التهاب الكبد الدهني غير الكحولي، والسكري من النوع الثاني أو التهاب الكبد الدهني غير الكحولي/ السكري من النوع الثاني. ي، منحنيات استرخاء الإجهاد في عينات الكبد من مجموعات المرضى المختلفة. نورم، مُعَدل. ك، تم تعديل الإجهاد إلى الإجهاد الأولي وتم تصويره كـ (الإطار الزمني الذي يتم فيه تخفيف الضغط إلى نصف قيمته الأصلية
قيمة). (المجموعة الضابطة الصحية)، (المرضى الذين يعانون من NASH)، (داء السكري من النوع الثاني) و (NASH + T2DM) الأفراد. 1-p، تم وضع الفئران على نظام غذائي عادي أو نظام غذائي عالي الدهون، أو نظام غذائي عالي الدهون مع علاج يومي للسيارة، مثبط AGE (PM) أو مثبط الربط المتقاطع لـ AGE (الألاجبروم، ALT-711) 1، مخطط التجربة. i.p.، داخل الصفاق. م، قياس AGEs في الكبد (من اليسار إلى اليمين، و 5). صلابة الكبد (من اليسار إلى اليمين،و 6 فئران) واللزوجة المرنة (منحنيات استرخاء الإجهاد (o) ومساحة الهسترسيس (p)؛تم تقييم (الفئران في كل مجموعة) باستخدام AFM.الصلابة ( ) واللزوجة المرنة تم تقييمها باستخدام الرهومية. من اليسار إلى اليمين، و 6 ( و ) و و 6 (ت) فئران. الرسوم البيانية في و تم إنشاؤها باستخدام BioRender. البيانات هي متوسطس.م.تشير القيم إلى الفئران الفردية. تم إجراء التحليل الإحصائي باستخدام تحليل التباين الأحادي (ANOVA) تلاه اختبار المقارنات المتعددة توكي. و ) واختبار الطالب غير المتزاوج ذو الجانبين -اختبارات (، ف و ). غير ذي دلالة؛ ، . كان لديها صلابة مشابهة (الشكل 1c,d) ولكن مناطق هسيتريس أعلى تحت دورات التحميل والتفريغ، مما يتوافق مع فقدان أو تشتت الطاقة اللزجة، مما يشير إلى لزوجة أعلى (الشكل 1e,f). علاوة على ذلك، باستخدام الروماتومتر، أكدنا أن كبد المرضى الذين يعانون من التهاب الكبد الدهني غير الكحولي ومرض السكري من النوع الثاني بدون تليف كان لديهم معاملات تخزين مشابهة ولكن فقدان أعلى. التوتر السريع والاسترخاء تحت تشوه ثابت (الشكل 1g-k).
لدراسة العلاقة بين المنتجات النهائية للجليكشن (AGEs) واللزوجة المرنة، قمنا بدراسة نموذج فأر تم تغذيته بنظام غذائي عالي المحتوى من AGEs (HiAD). تظهر هذه الفئران تدهور الدهون، وتورم خلايا الكبد، ومقاومة الأنسولين، ومستويات أعلى من AGEs في الكبد. مقارنةً مع أولئك الذين يتبعون نظامًا غذائيًا عاديًا (تشاو) أو نظامًا غذائيًا للوجبات السريعة (FFD) (الشكل 11، م). استنادًا إلى تحليلات AFM (الشكل 1ن-ب) والريومترية (الشكل 1ق-ط)، كانت الصلابة مشابهة (الشكل 1ن، ق)، لكن اللزوجة المرنة زادت (الشكل 1ع، ب، ر-ط)، في الفئران التي تناولت نظام غذائي عالي الدهون مقارنة بتلك التي تناولت طعامًا عاديًا أو نظام غذائي غني بالدهون. من الجدير بالذكر أن تثبيط إنتاج AGEs باستخدام البيريدوكسامين (PM) أو منع تكوين روابط AGE-collagen المتقاطعة باستخدام الألاجبرين (ALT-711) عكس التغيرات في اللزوجة المرنة (الشكل 1ع، ب، ر-ط). معًا، تشير هذه البيانات إلى أن AGEs في ECM ما قبل التليف تسبب زيادة في اللزوجة المرنة.
اللدونة المرنة تخلق بيئة سرطانية
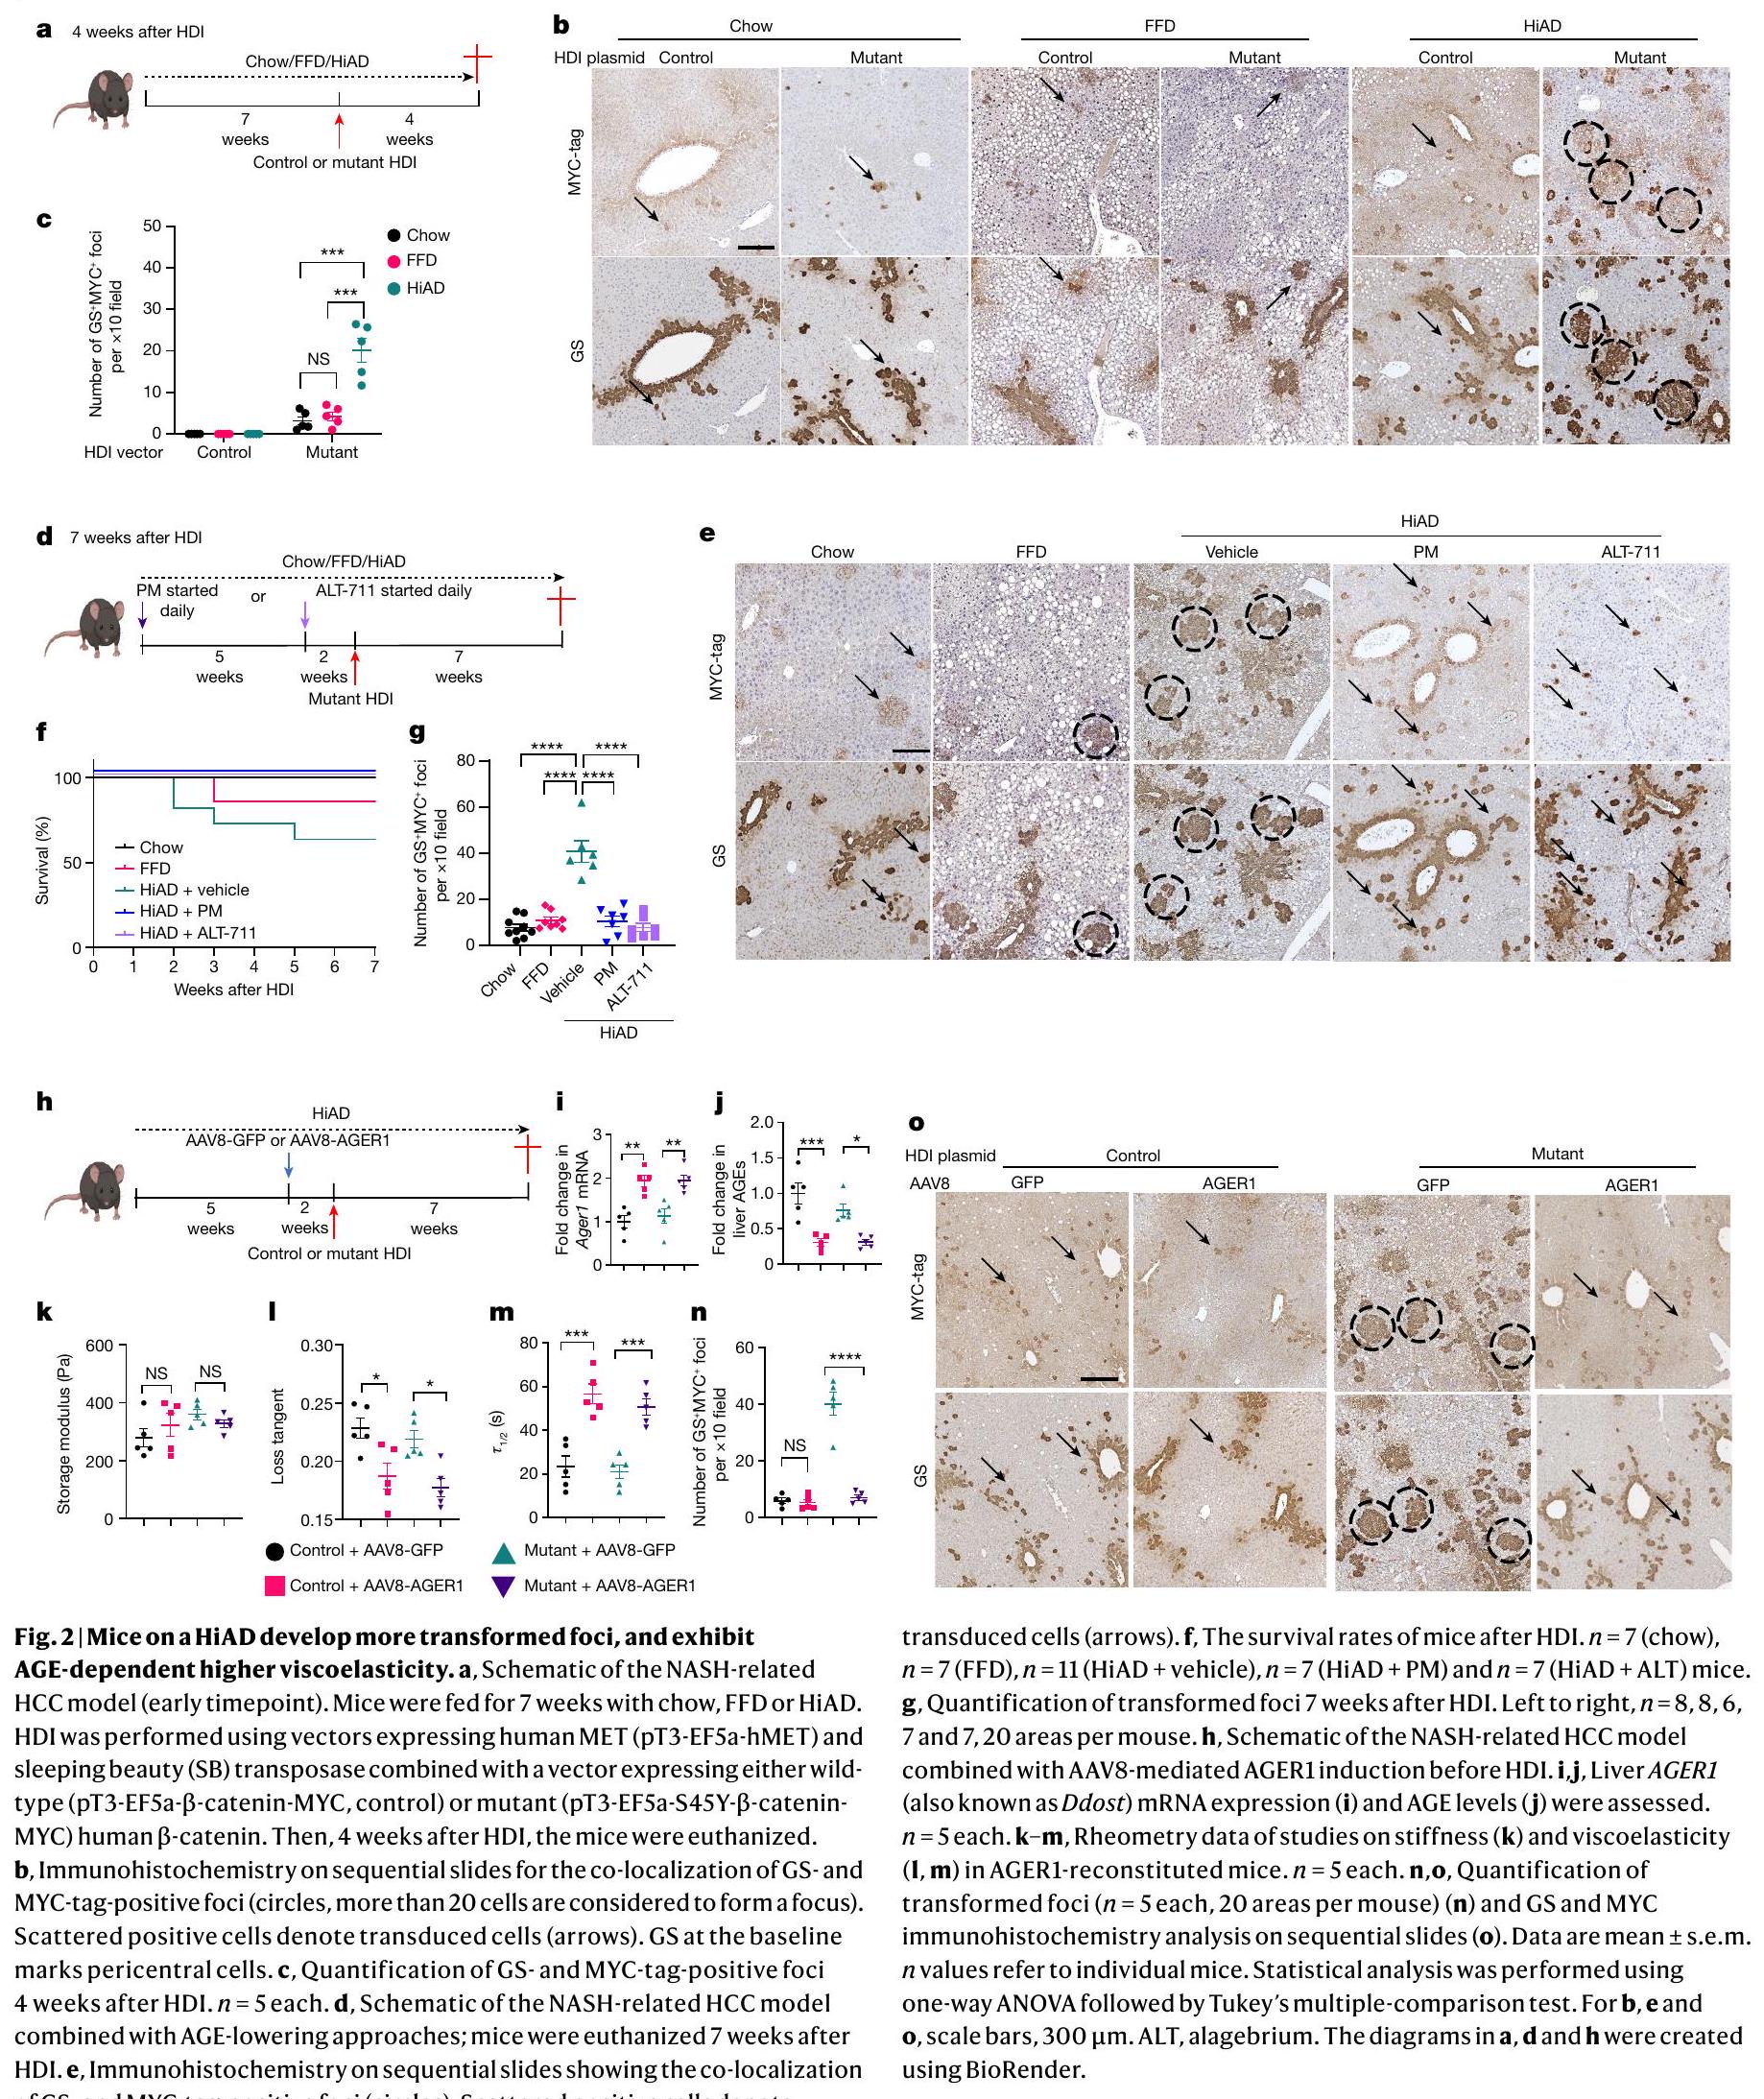
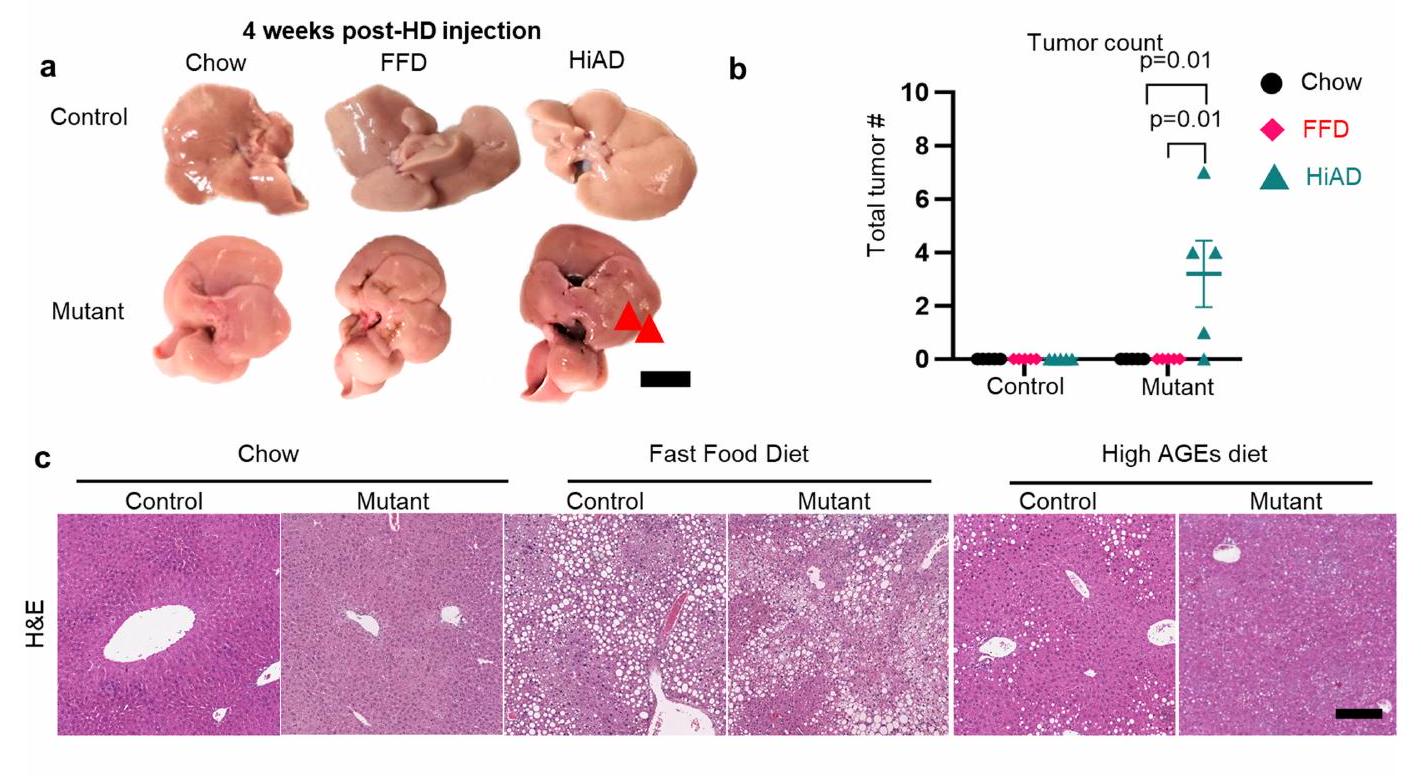
النتائج المذكورة أعلاه دفعتنا للتحقيق في الروابط السببية المحتملة بين لزوجة ECM وتقدم سرطان الكبد hepatocellular carcinoma (HCC). الدراسات المتعلقة بسرطان الكبد المرتبط بـ NASH عادة ما استخدمت نظامًا غذائيًا عالي الدهون مع مادة مسرطنة مثل ثنائي إيثيل نيتروسامين، أو نماذج معدلة وراثيًا، أو نظام غذائي CDAA.. ومع ذلك، من المهم اتباع المسار المرضي النموذجي الذي يتميز بإصابة الخلايا والالتهاب الذي يسبق. لتقليد الظروف تجريبيًا مع زيادة استرخاء إجهاد ECM قبل ظهور HCC، استخدمنا نموذجًا أكثر ملاءمة لتعديل البيئة الأيضية/المصفوفة قبل زراعة الورم. قمنا بتوصيل MET البشري (hMET) هيدروديناميكيًا مع الطفرة-كاتينأو التحكم في المتجهات لتغذية الفئران على نظام الشو-، FFD- أو HiAD. لوحظ ظهور مبكر ونمو أسرع للبؤر المتحولة (الغلوتامين سينثيتاز (GS) وإيجابية علامة MYC) في الفئران التي تغذت على HiAD مقارنة بالفئران التي كانت على نظام الشو أو FFD (الشكل 2a-c والشكل الممتد 1a-c). من المهم أن نمو الورم تراجع، ومعدل البقاء تحسن بعد تثبيط AGE باستخدام PM أو بعد كسر روابط الكولاجين-AGE باستخدام ALT (الشكل 2d-g والشكل الممتد 1d-f).
بعد ذلك قمنا بتعديل مستقبلات AGE باستخدام نهجين إضافيين. أولاً، تناولنا AGER1، مستقبل الإزالة. حيث أن الأفراد الذين يعانون من T2DM بالإضافة إلى NASH والفئران التي تتغذى على HiAD قد تم تقليلها بشكل كبير (المعروف أيضًا باسم DDOST) ، سعينا لعكس ذلك من خلال توصيل AGER1 بواسطة AAV8 قبل الحقن الهيدروديناميكي (HDI) (الشكل 2h). كانت مستويات AGER1 في الفئران المعاد تكوينها أعلى (الشكل 2i) ومستويات مستقبلات AGE أقل (الشكل 2j) بسبب تحسين الامتصاص، صلابة مماثلة (الشكل 2k) ولكن استرخاء إجهاد أقل (الشكل 2l,m والشكل الممتد 2a)، ونمو متقلص للبؤر المتحولة (الشكل 2n,o والشكل الممتد 2b)، مقارنة بالفئران التي تم حقنها بتركيب AAV8 التحكم.
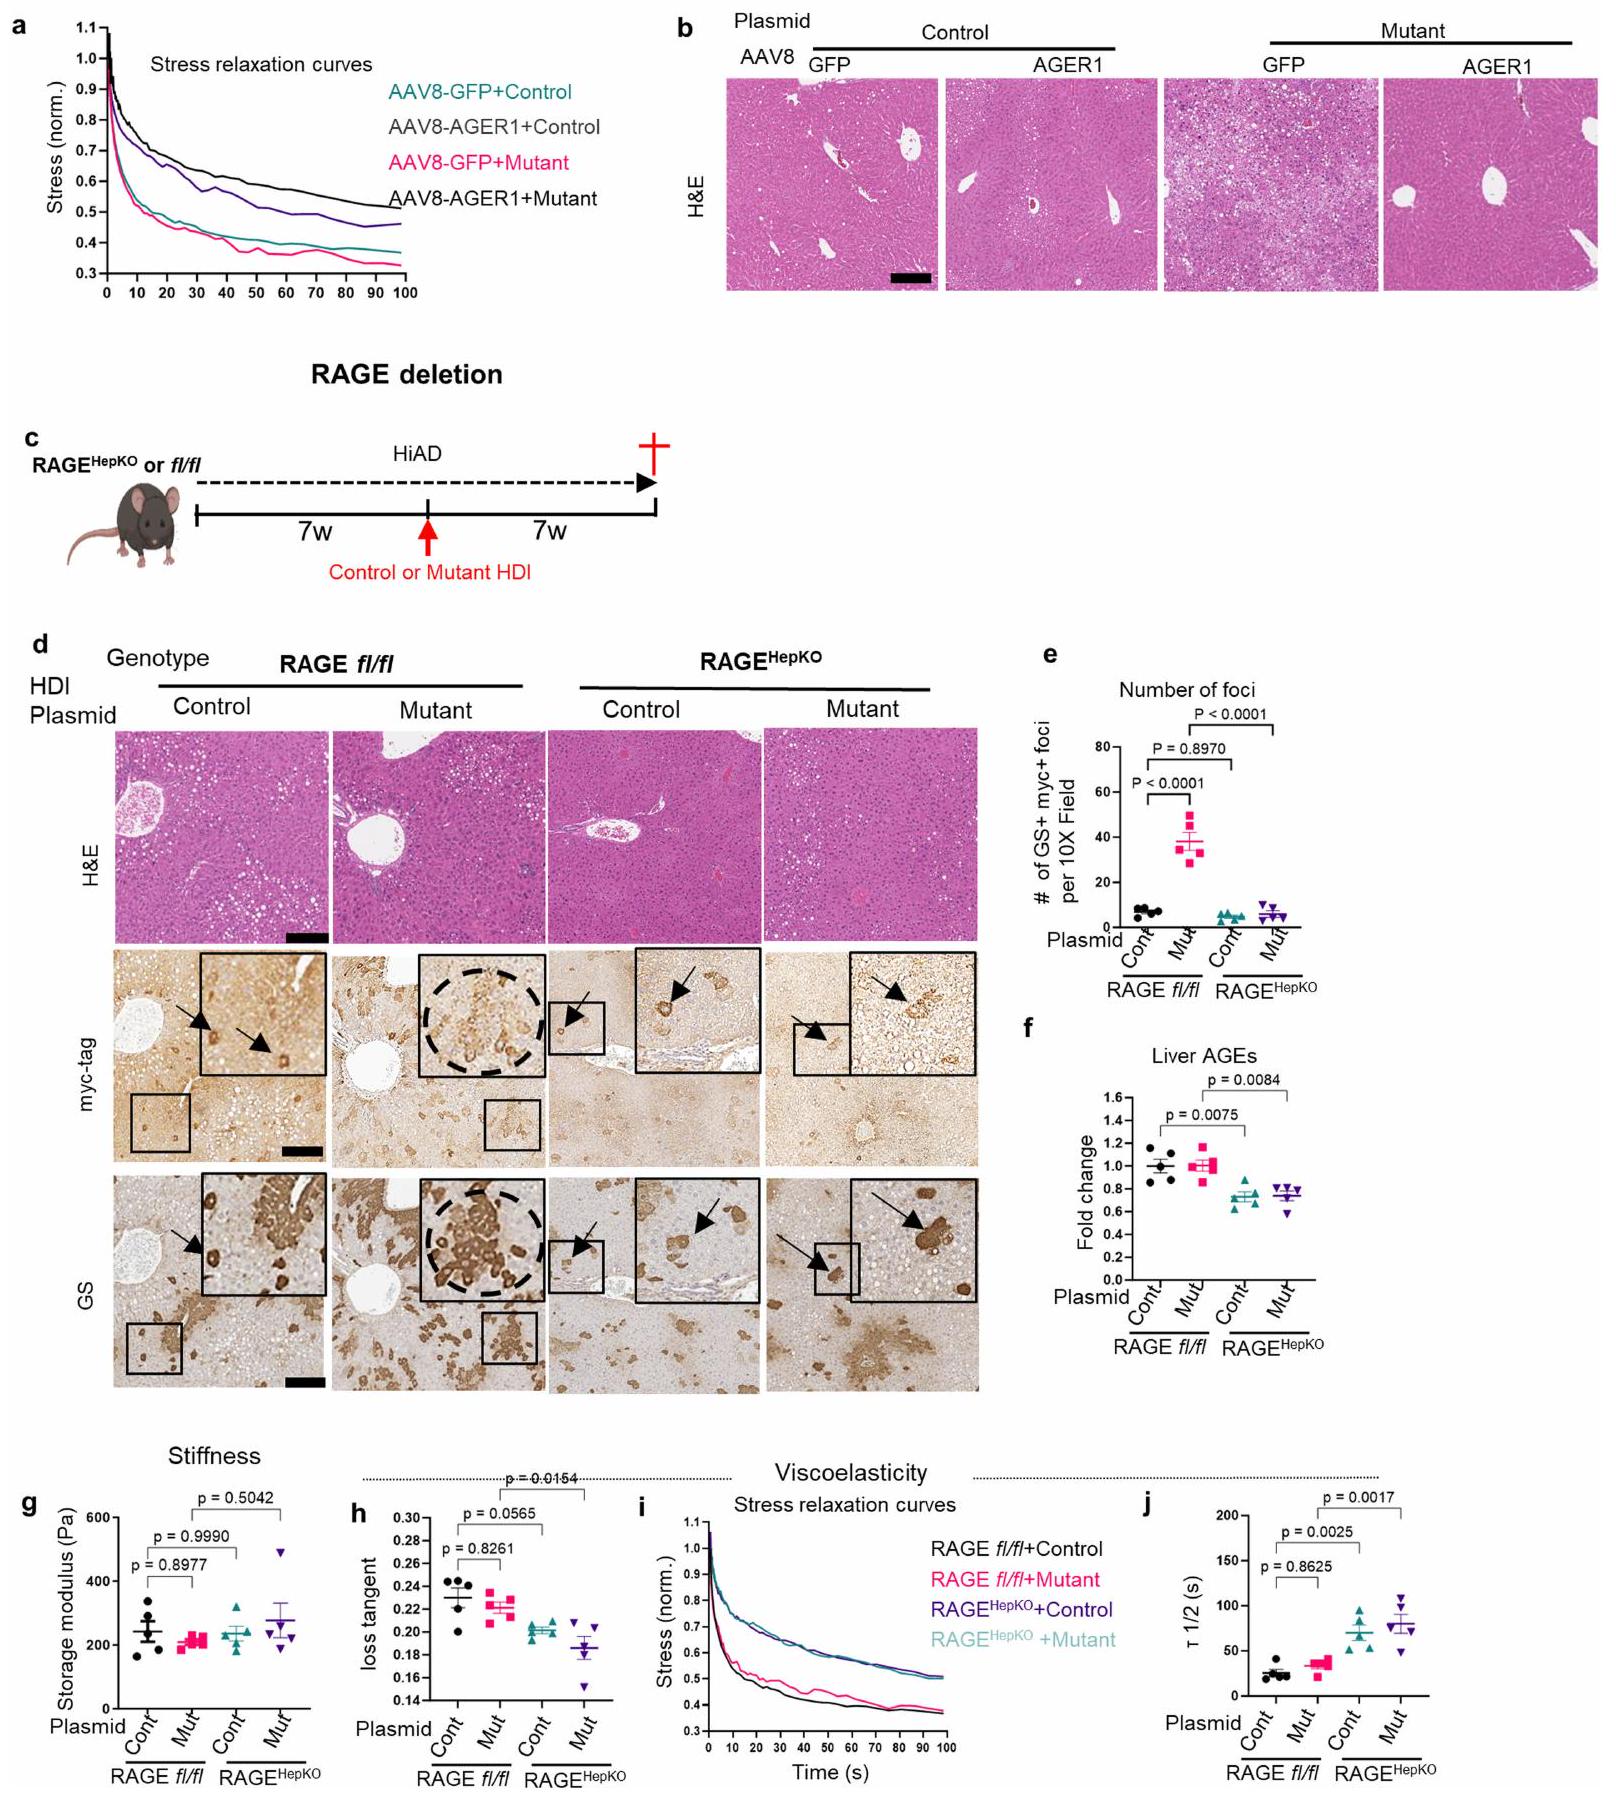
ثانيًا، درسنا الفئران التي تم حذف RAGE بشكل محدد في الكبد (المعروف أيضًا باسم Ager؛ مستقبل AGE المسبب للالتهابات؛ ) التي تم تغذيتها على HiAD، وقمنا بحقن هذه الفئران هيدروديناميكيًا بـ hMET مع طفرات -كاتينين (الشكل الممتد 2c). كانت هذه الفئران لديها نمو متقلص لبؤر الورم (الشكل الممتد 2d,e)، وانخفاض في AGEs الكبدية (الشكل الممتد 2f)، وصلابة مماثلة (الشكل الممتد 2g) وانخفاض في اللزوجة (الشكل الممتد 2h-j) مقارنة بفئران RAGE التي تغذت على HiAD.
معًا، تتقارب هذه الدراسات مع أربعة نماذج حيوانية على الاستنتاج بأن AGEs في ECM تخلق بيئة أكثر لزوجة وتسبب الأورام التي تعزز HCC.
الاتصال الشبكي واللزوجة
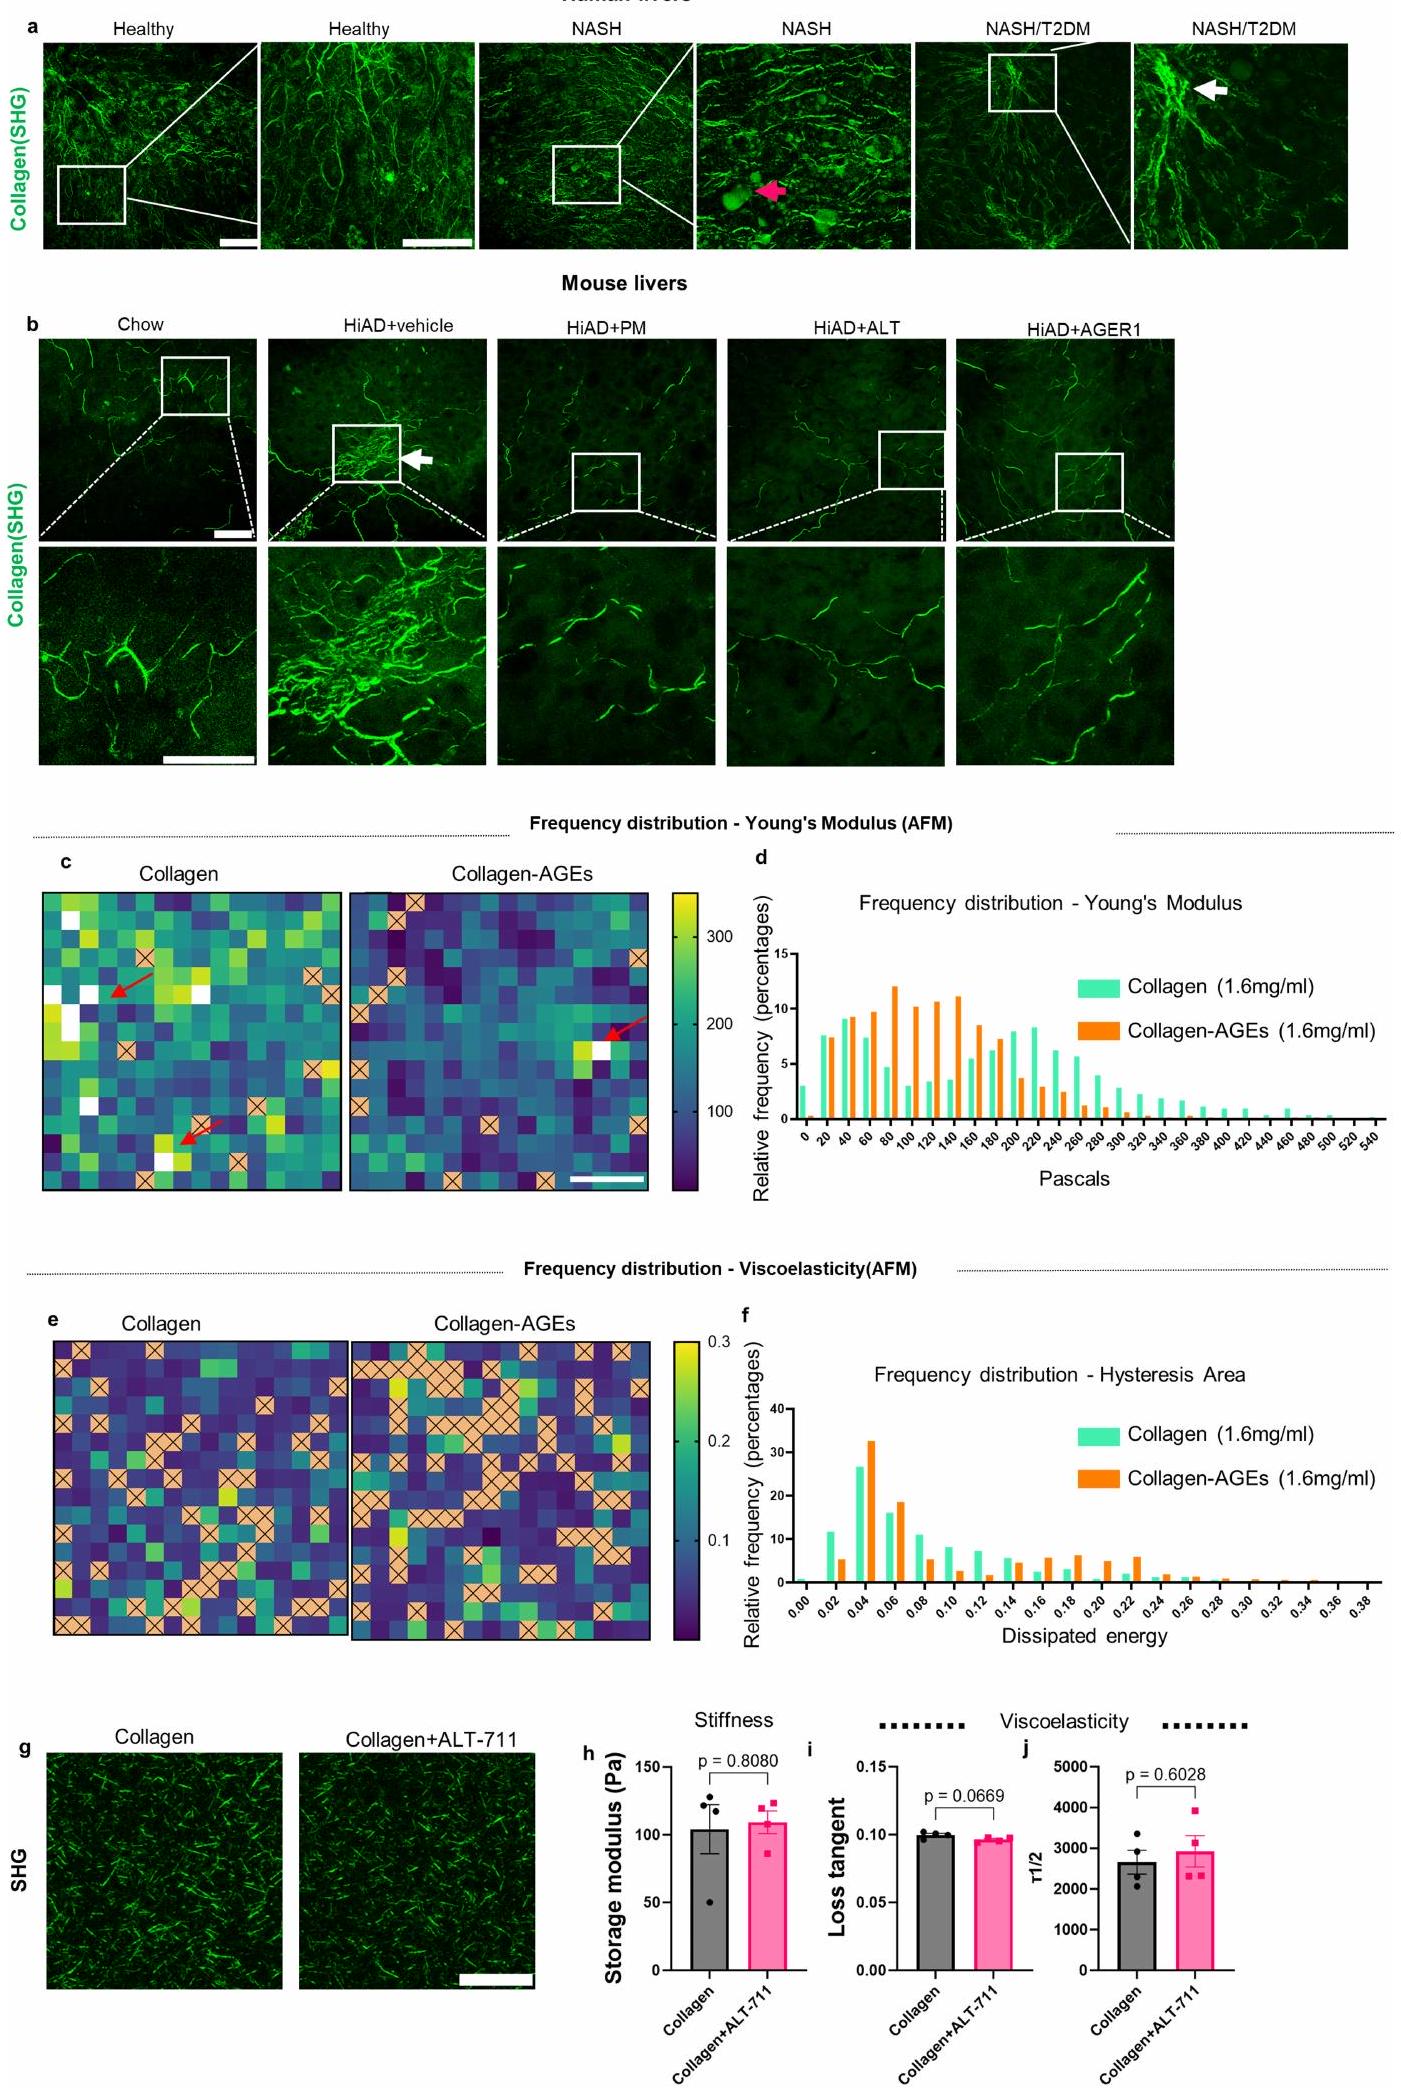
تشير البيانات المقدمة حتى الآن إلى أن تراكم AGE أمر حاسم لزيادة لزوجة ECM وتقدم HCC. بعد ذلك سعينا لتوضيح كيفية تعديل لزوجة ECM. يُعتقد أن شبكات الكولاجين من النوع 1 هي منظمين حاسمين لميكانيكا الأنسجة . يمكن أن تتداخل AGEs مباشرة مع الكولاجين وتؤثر على ميكانيكا المصفوفة عن طريق تغيير هيكلها الحلزوني . تم تصوير شبكات الكولاجين باستخدام توليد التوافقيات الثانية (SHG) مع مجهر الفوتون المزدوج في عينات كبدية من البشر (تحكم صحي، NASH، NASH + T2DM؛ الشكل الممتد 3a)، وكذلك في الفئران (الشو، HiAD، HiAD + PM، HiAD + ALT-711 وفي أكباد الفئران التي تم حقنها بـ AAV8-AGER1؛ الشكل الممتد 3b). أظهرت شبكة الكولاجين تجميعًا في المرضى الذين يعانون من T2DM + NASH وفي الفئران
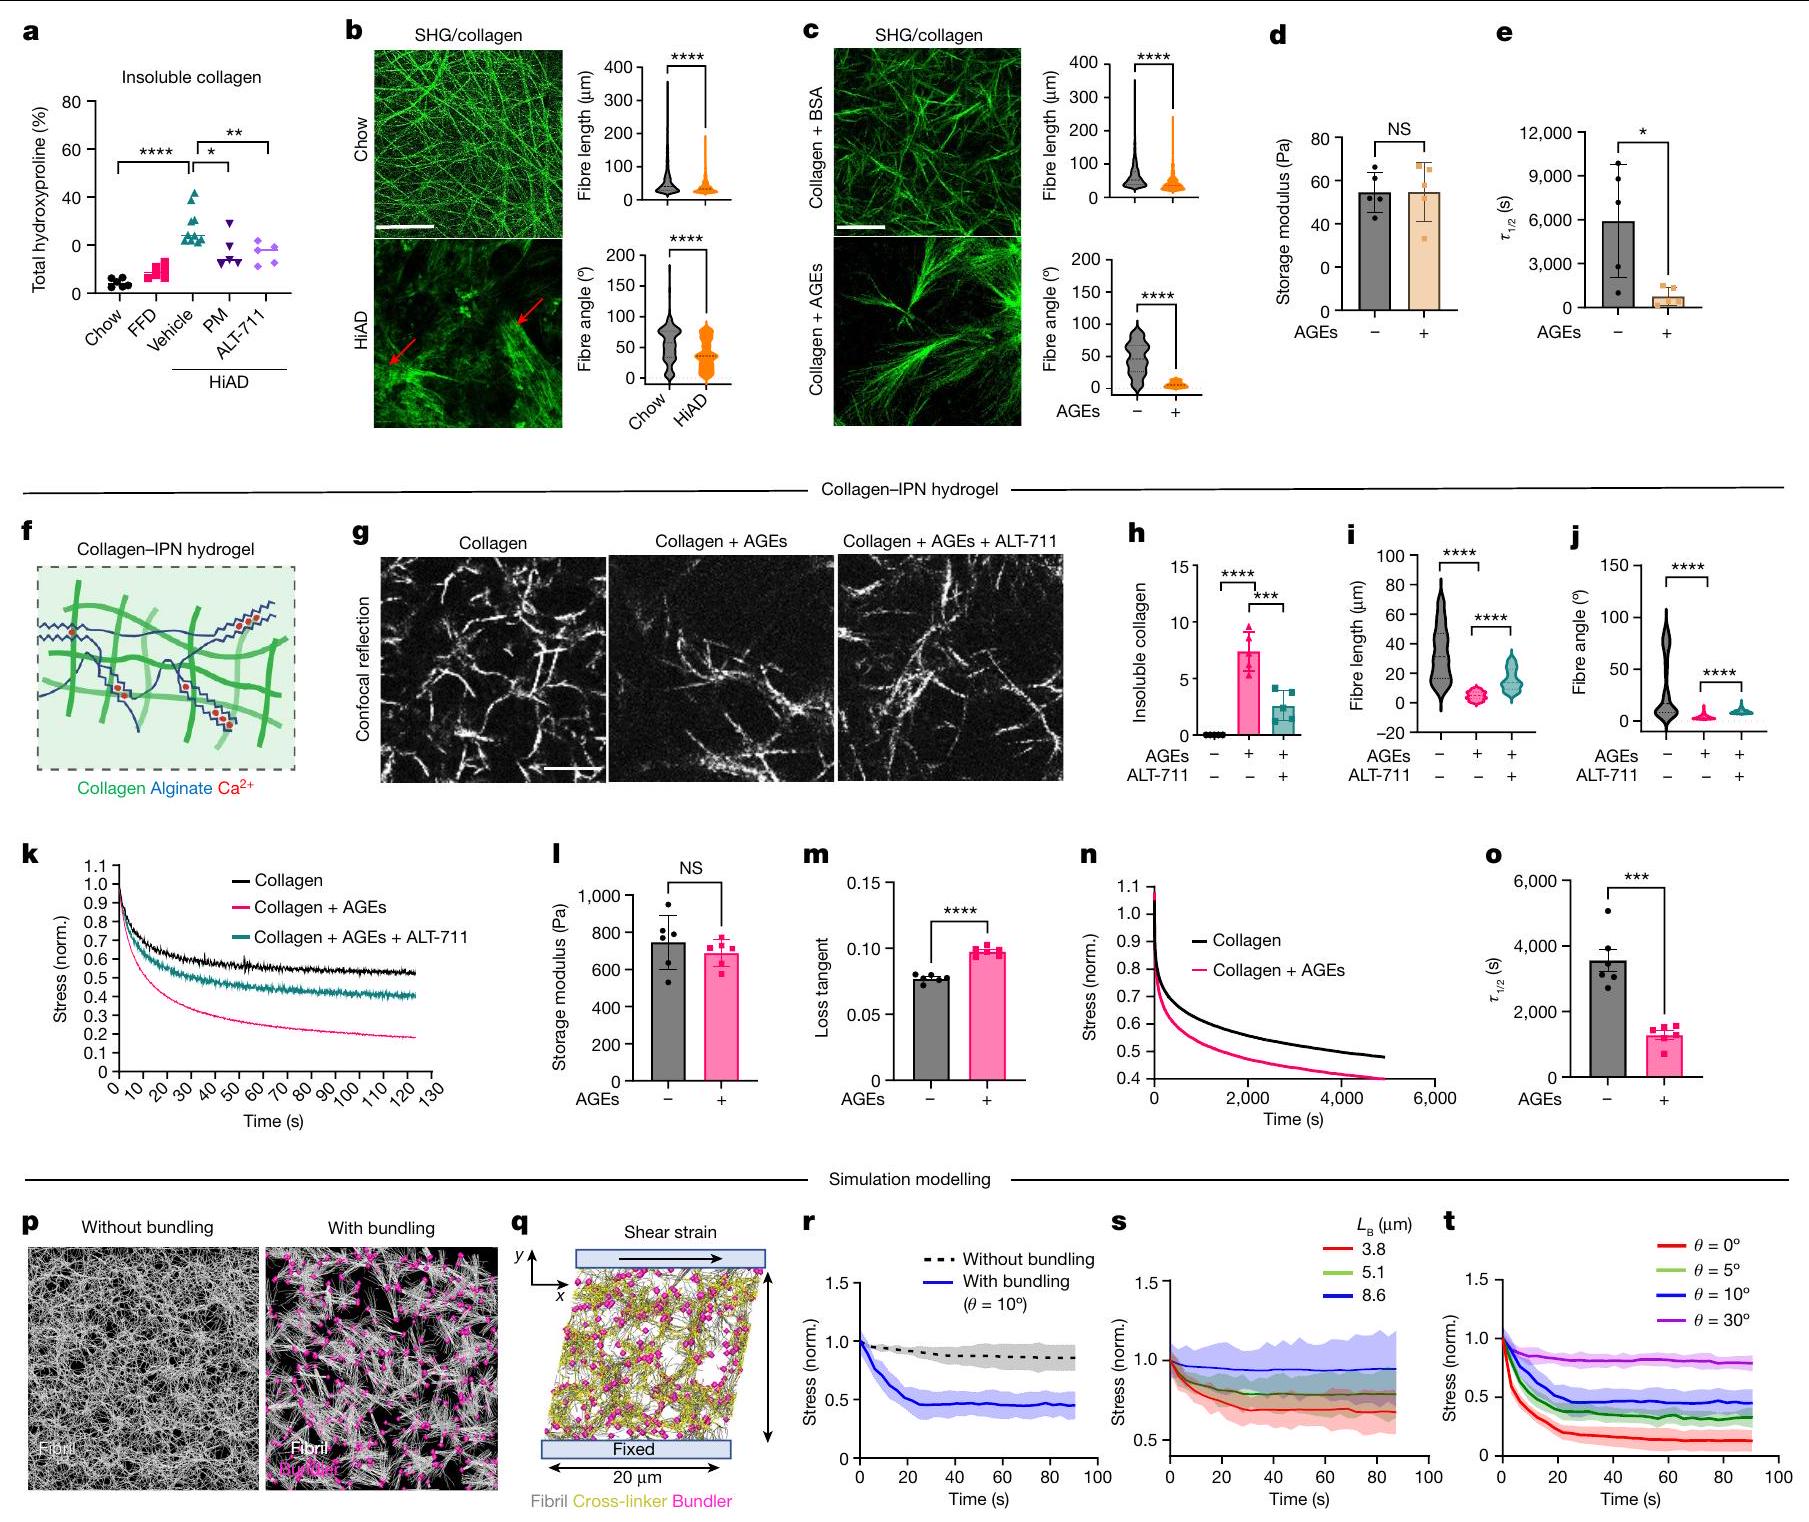
على HiAD، بينما بدت الشبكة أكثر تنظيمًا مع ألياف أرق في البشر الأصحاء، وفي الفئران التي تتبع نظام الشو أو HiAD بعد علاج PM وALT أو إعادة تكوين AGER1. أدى تثبيط إنتاج AGE أو كسر روابط AGE-كولاجين إلى تقليل كمية الكولاجين غير القابل للذوبان المرتبط بشكل كبير (الشكل 3a). قمنا بتحليل ECM الأصلي غير الخلوي من الفئران التي تتغذى على الشو أو HiAD باستخدام SHG لتقييم طول ألياف الكولاجين، الاتجاه المكاني والترابط. مقارنة بالشبكة المنظمة جيدًا في الفئران التي تتبع نظام الشو، أظهرت الفئران التي تتغذى على HiAD، الشبكة أقل ترابطًا وكان لديها حزم كولاجين بألياف أقصر وزوايا ألياف أقل (الشكل 3b). تم رؤية هياكل مماثلة بألياف أقصر وزوايا في هيدروجيل الكولاجين المعاد تكوينه المحايد مع AGEs (الشكل 3c). يمكن أن تتداخل التفاعلات بين AGEs وبقايا ليسين تيلوببتيد الكولاجين مع إطالة الألياف وتشكيل شبكة كولاجين متماسكة هيكليًا . لتقييم خصائص هيدروجيل الكولاجين المرتبط بـ AGE والعلاقة بين الشبكات ذات الاتصال المنخفض وخصائص المصفوفة، قمنا بإجراء قياسات ريوولوجية. كانت هيدروجيل الكولاجين المرتبط بـ AGE لها صلابة مماثلة (الشكل 3d) ولكن استرخاء إجهاد أسرع مقارنة بالكولاجين غير المرتبط (الشكل 3e). بعد ذلك قمنا بقياس توزيع معاملات يونغ بواسطة رسم خرائط AFM للهيدروجيل. رأينا أنه، بينما كان هناك تباين في معاملات محلية في كلا الهيدروجيل، كانت نطاقات معاملات المرونة أعلى قليلاً في حالة الكولاجين فقط (الشكل الممتد 3c,d). أظهر توزيع مناطق الهسترسيس (اللزوجة) ترددات أعلى في هيدروجيل الكولاجين المرتبط بـ AGE (الشكل الممتد 3e,f). لدراسة المصفوفة الغنية بالكولاجين بمستوى صلابة قابل للمقارنة مع الكبد، تم اختبار هيدروجيل ثلاثي الأبعاد (IPN) مصنوع من كولاجين معدل بـ AGE والجيلاتين (الشكل 3f). تم رؤية تغييرات مماثلة في الهيكلية والترابط بعد التعرض لـ AGE (الشكل 3g). أدى كسر روابط AGE-كولاجين باستخدام ALT-711 إلى تقليل كمية الكولاجين غير القابل للذوبان (الشكل 3h) وزيادة طول الألياف، وزوايا الألياف (الشكل 3i,j) وترابط الشبكة. لم يغير ALT-711 نفسه مصفوفة الكولاجين (الشكل الممتد 3g) أو خصائصه الميكانيكية (الشكل الممتد 3h-j). أظهرت اختبارات الضغط استعادة اللزوجة بعد استخدام ALT-711 (الشكل 3k). كانت هيدروجيل IPN المختلطة مع كولاجين معدل بـ AGE تظهر صلابة مماثلة (الشكل 31)، ولكن استرخاء إجهاد أسرع مقارنة بالكولاجين غير المعدل (الشكل 3m-o) بناءً على القياسات الريوولوجية.
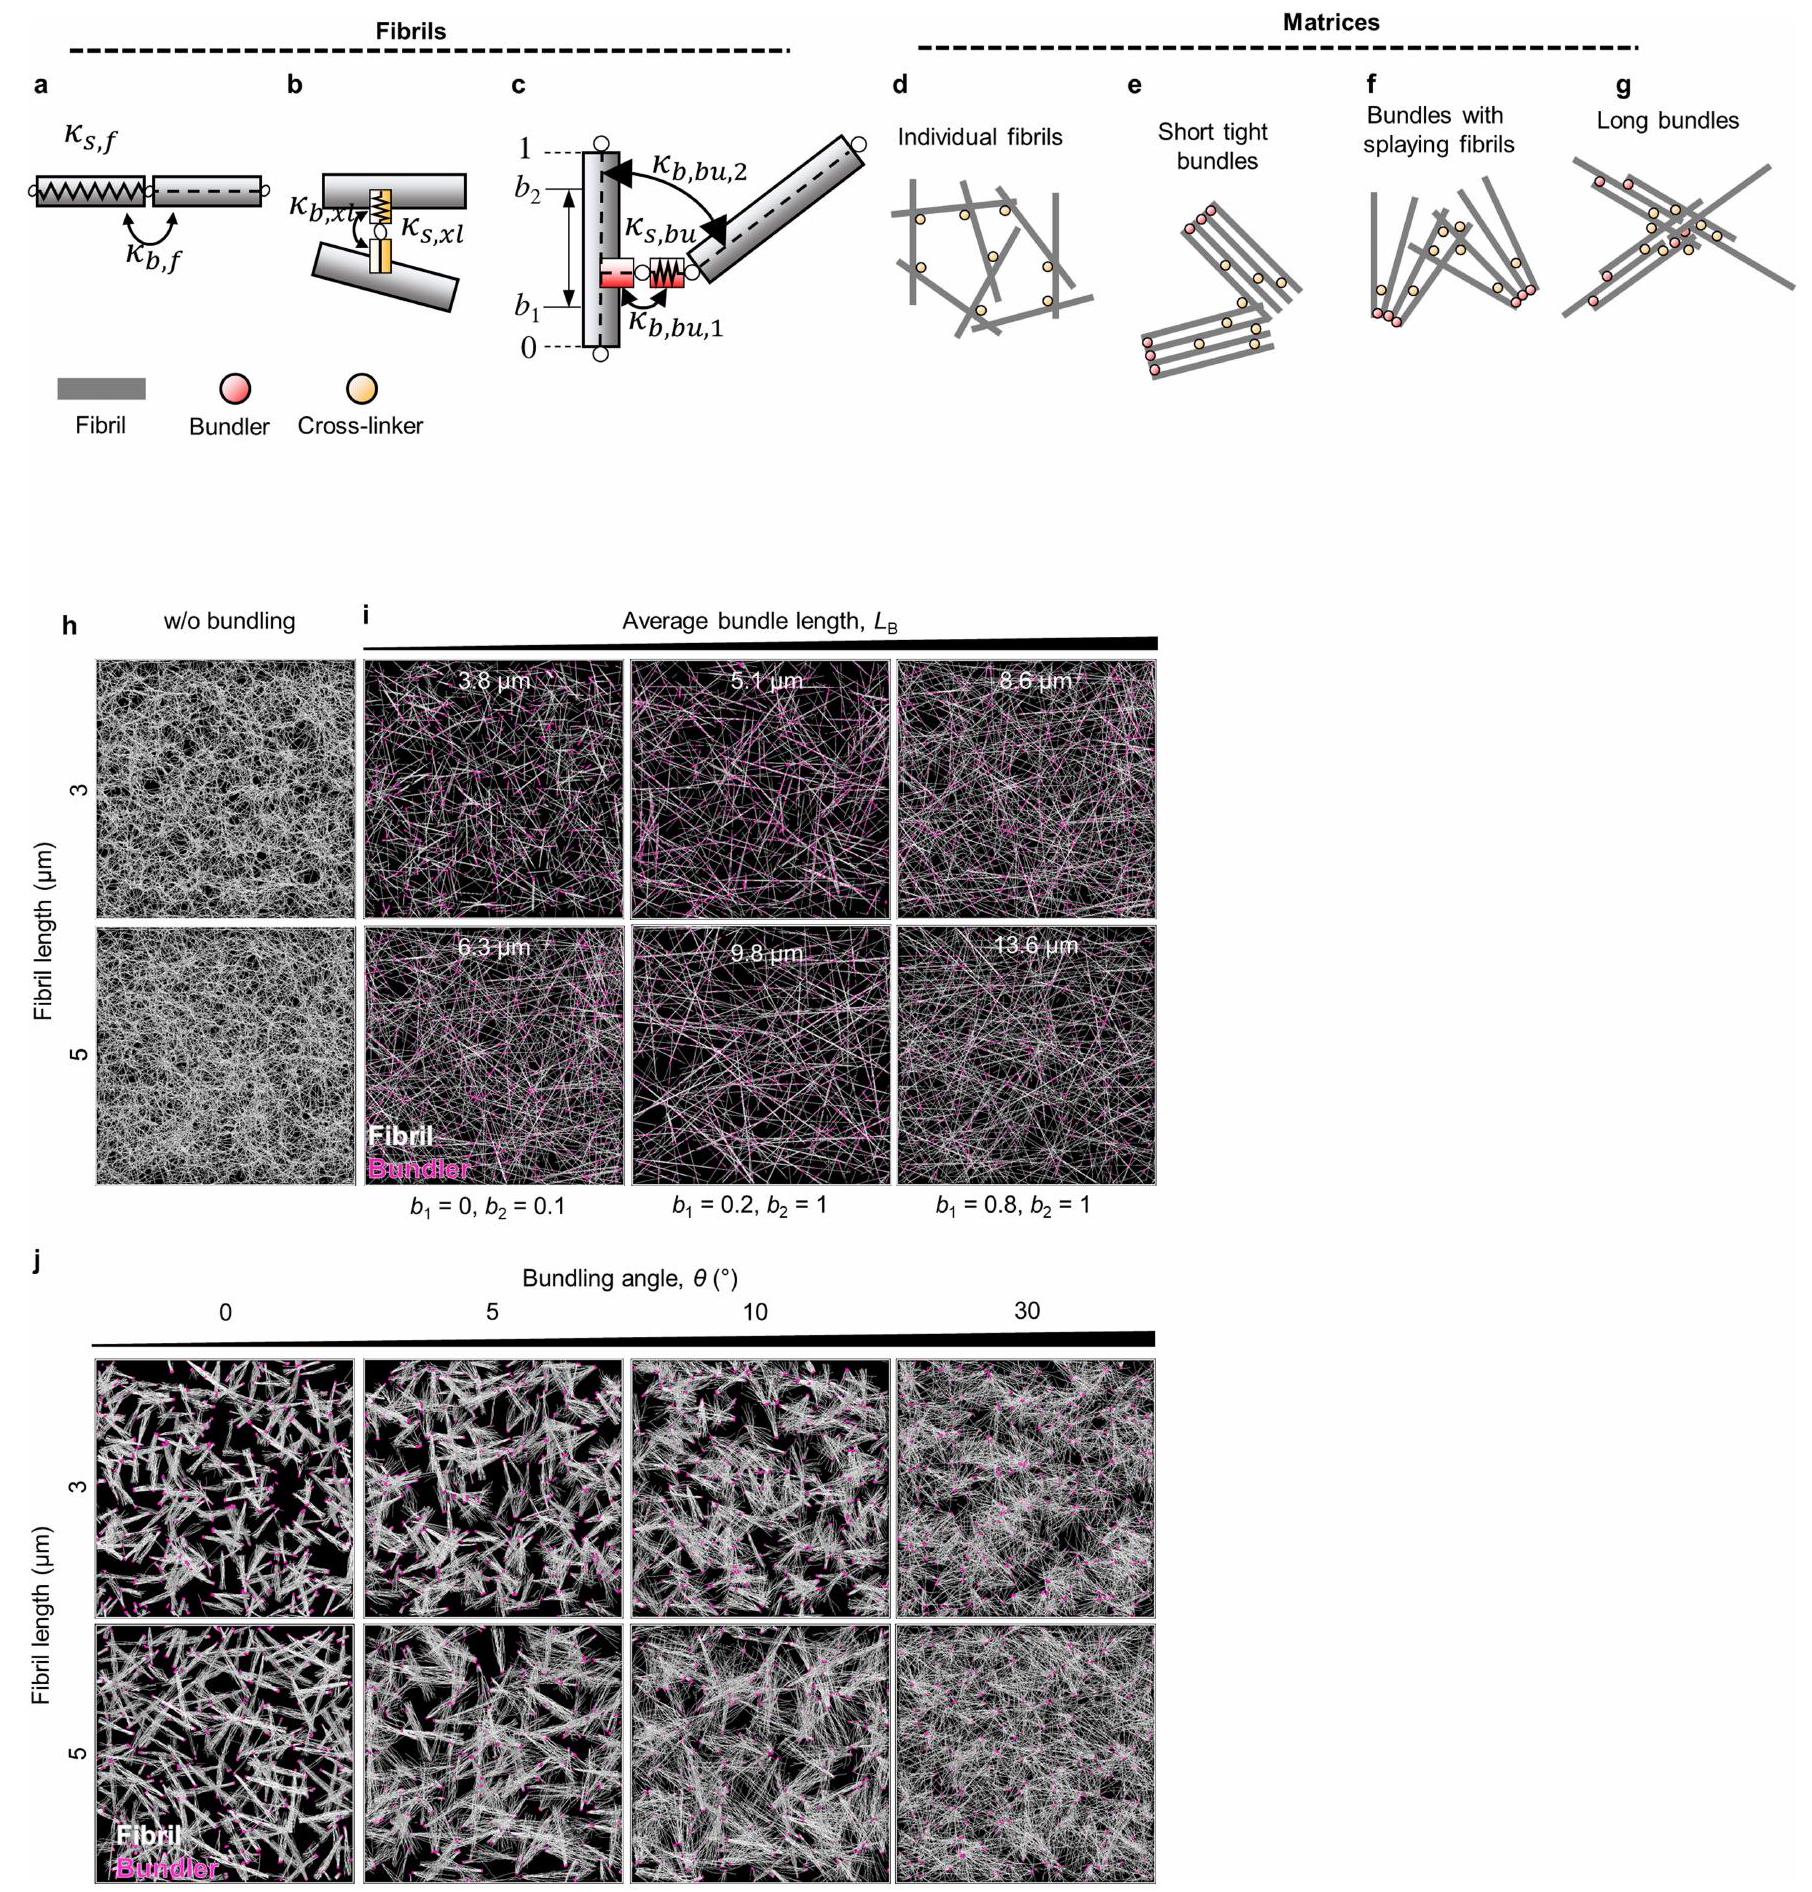
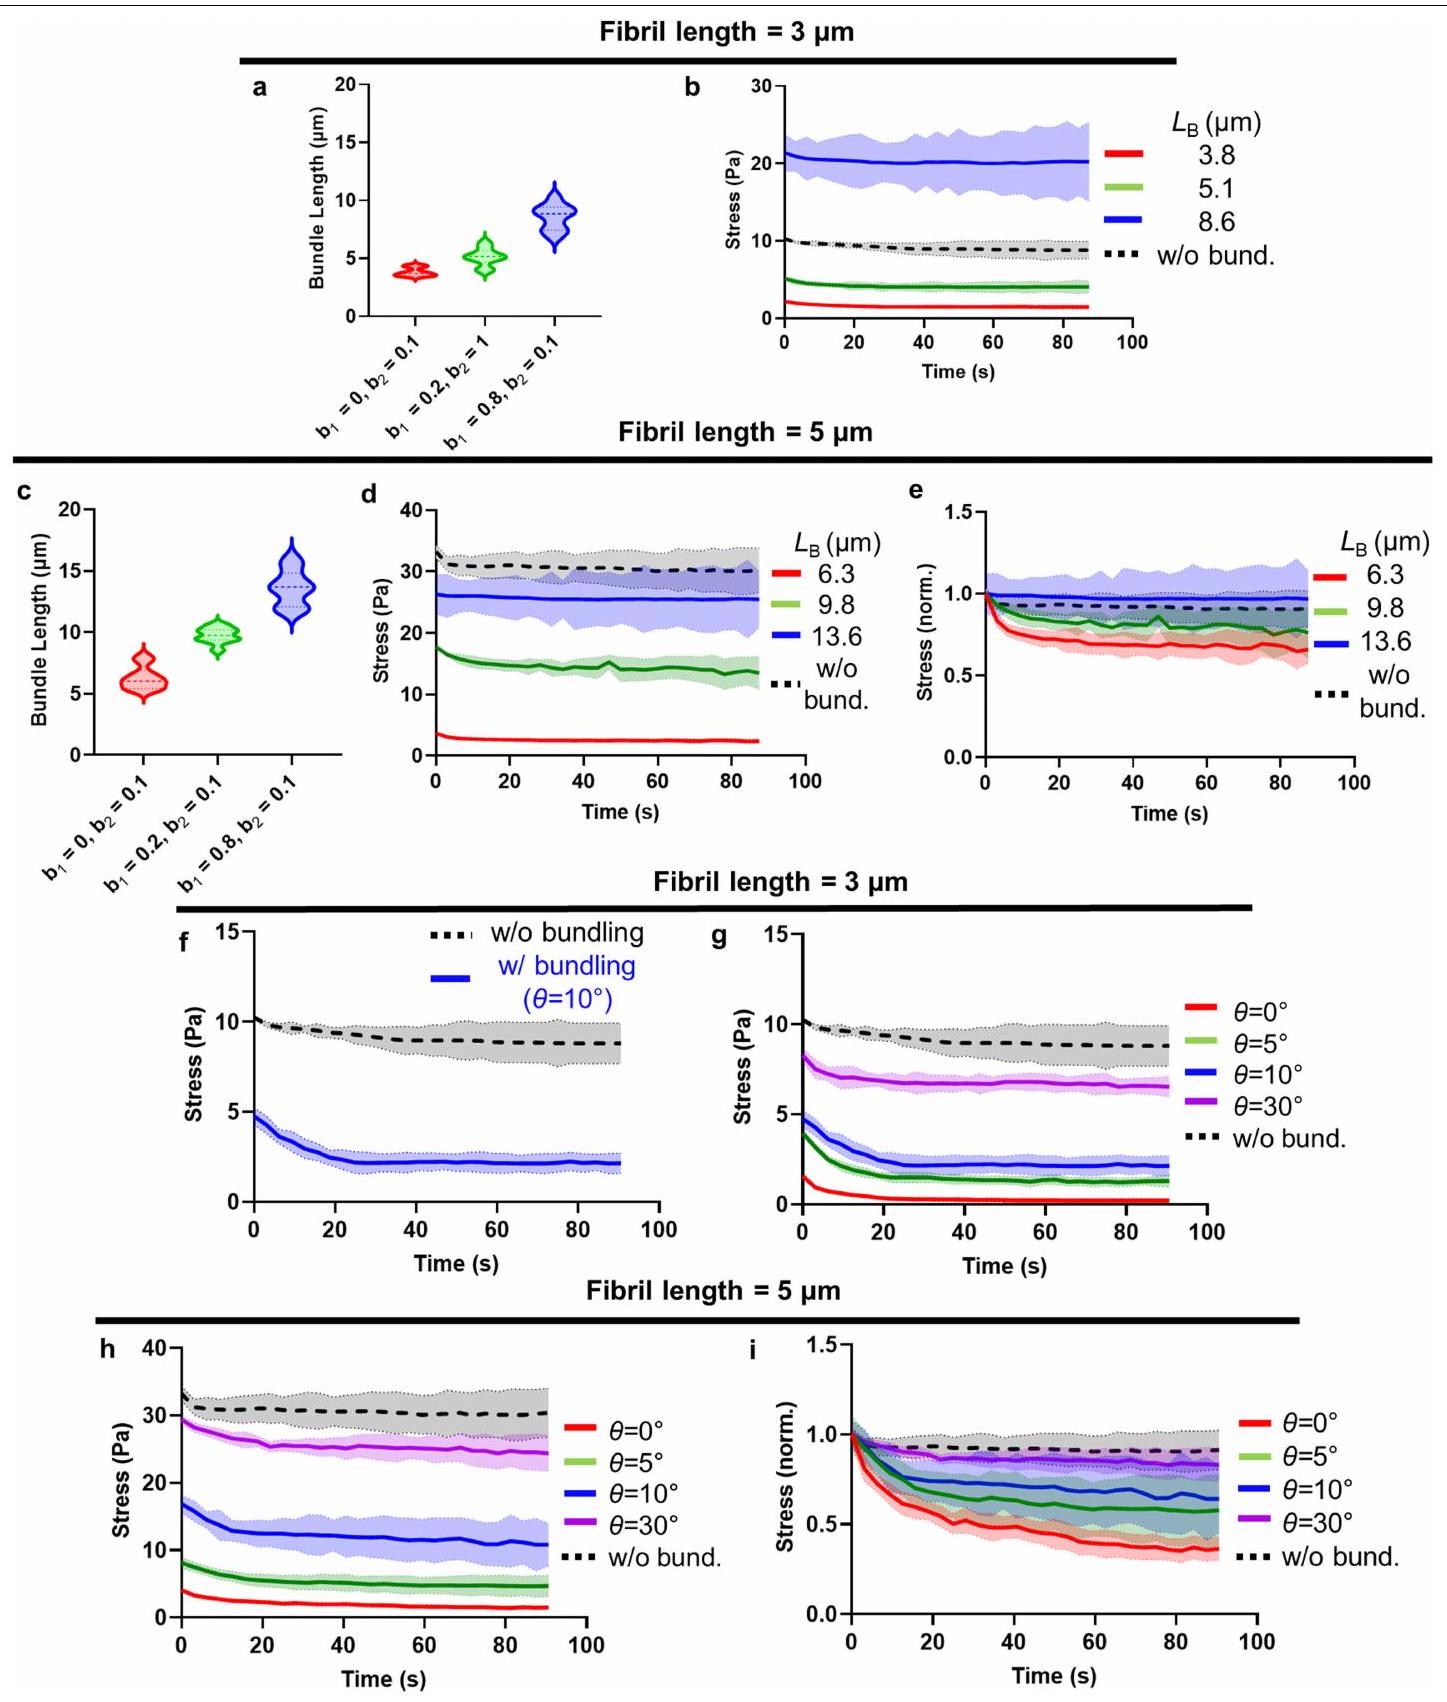
لدراسة كيفية تأثير هيكل المصفوفة على اللزوجة، قمنا بمحاكاة مصفوفات الكولاجين مع تباين في معلمين هيكليين لنمذجة نشاط AGEs: متوسط طول حزمة ألياف الكولاجين وزاوية التجميع، كبديل للتباين (الشكل 3p,q). تتصل مصفوفات الكولاجين من خلال مجموعة من الروابط الضعيفة، المعروفة بأنها تعمل داخل وبين ألياف الكولاجين (الشكل الممتد 4a-g) ويمكن أن تكون أساس استرخاء الإجهاد واللزوجة في مصفوفات الكولاجين من النوع 1، والروابط الناتجة عن (الشكل الممتد 4h,j). الشبكات المجمعة أكثر تباينًا وتظهر استرخاء إجهاد أسرع مقارنة بالشبكات غير المجمعة (الشكل 3r). يؤدي تقليل طول الألياف (الشكل 3s والشكل الممتد 5a-e) أو زاوية الحزمة (الشكل 3t والشكل الممتد 5f-i) إلى زيادة تباين الشبكة مما يؤدي إلى استرخاء إجهاد أسرع.
معًا، تظهر هذه النتائج الحاسوبية أن التغييرات في الهيكلية التي لاحظناها بسبب نشاط AGE في الجسم وفي المختبر، أي زيادة التباين وطول الألياف الأقصر، من المتوقع أن تؤدي إلى استرخاء إجهاد أسرع وزيادة اللزوجة.
تفعيل اللزوجة في المصفوفة لـ YAP من خلال TNS1
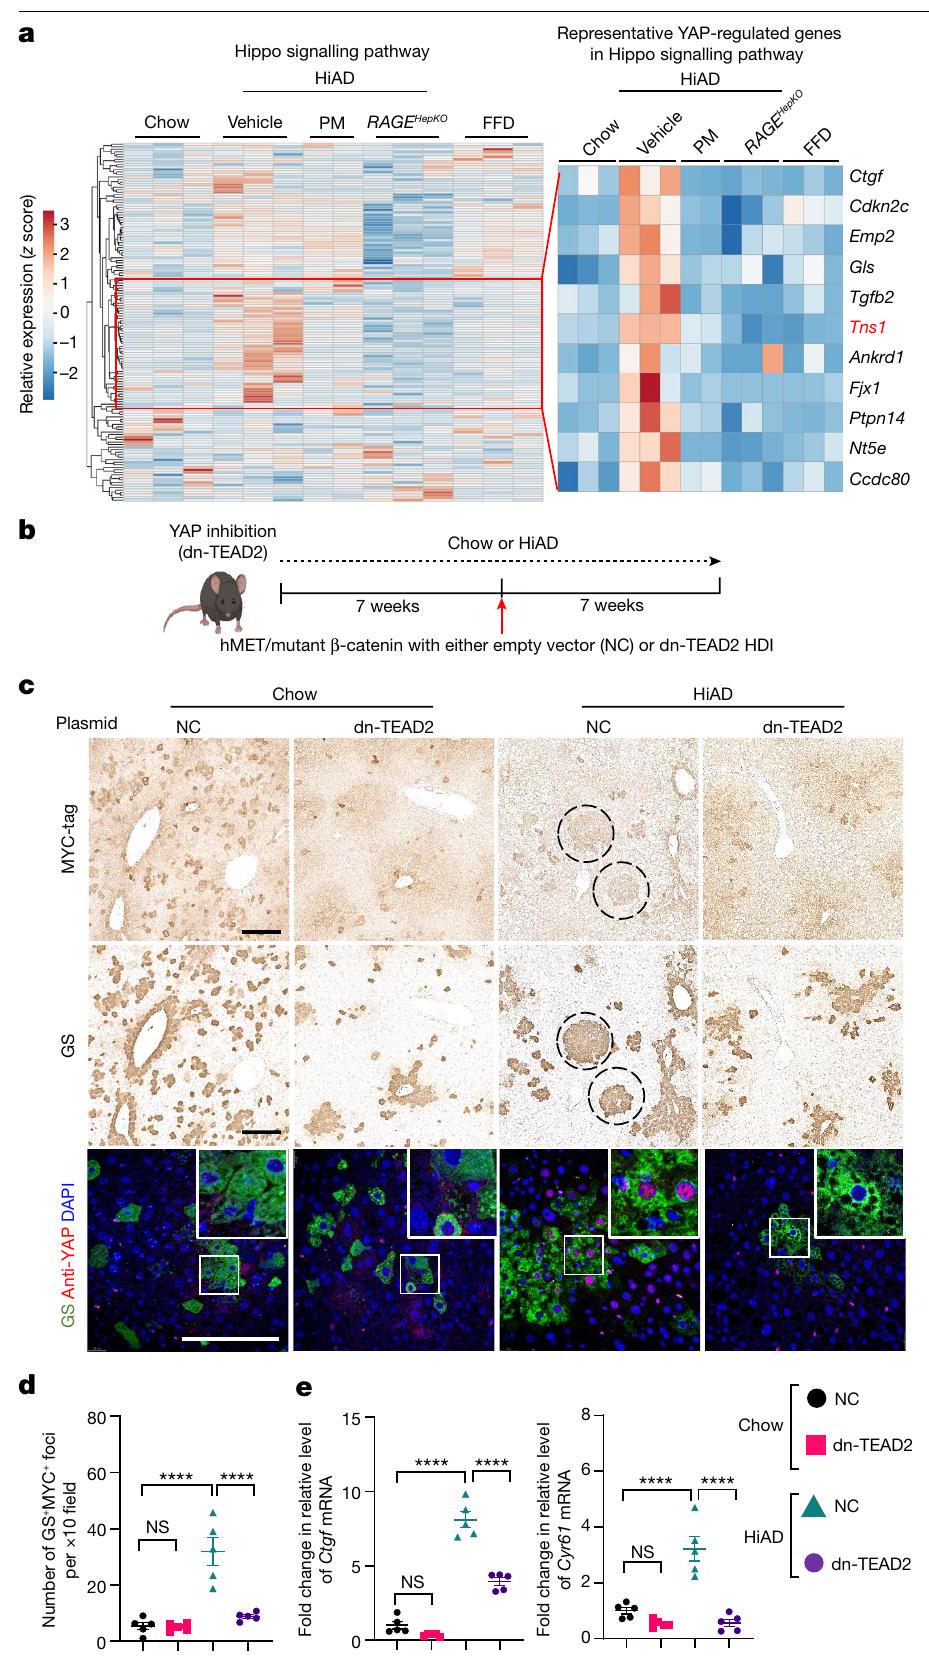
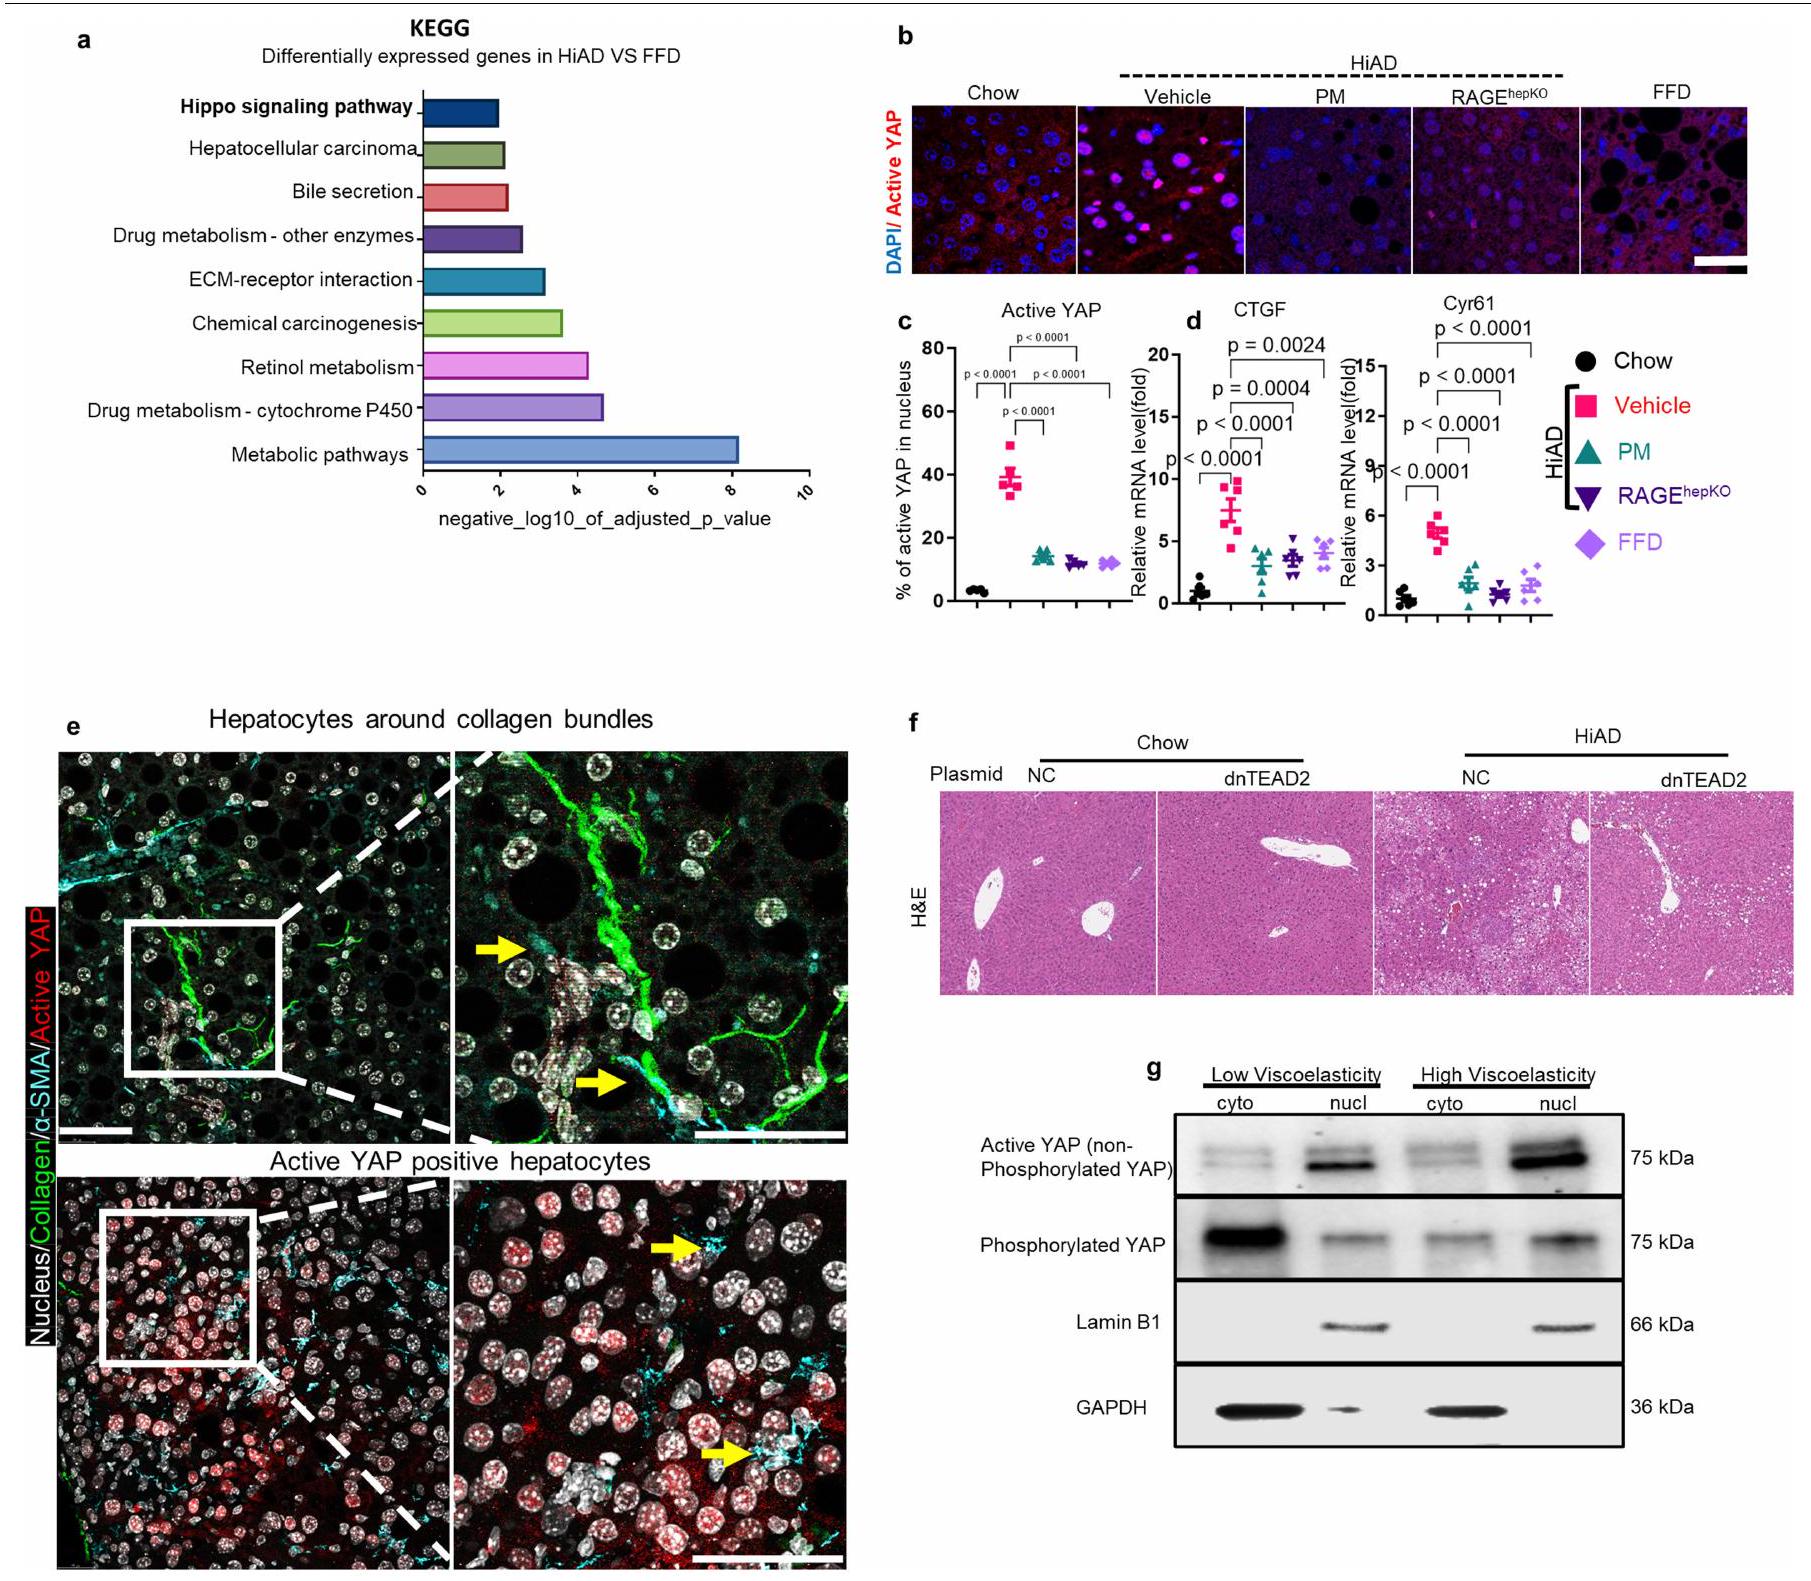
ركزنا بعد ذلك على المسارات الميكانيكية التي تؤدي إلى نمو الورم والغزو من خلال استرخاء الإجهاد الأسرع. تم إجراء تسلسل RNA (RNA-seq) وتحليلات المعلومات الحيوية على عينات كبد الفئران (في الشو، FFD، HiAD، HiAD + PM ومجموعات RAGE )، لتحديد المسارات المحتملة. تم إجراء تحليلات Kyoto Encyclopedia of Genes and Genomes (KEGG) على الجينات المعبر عنها بشكل مختلف لبؤر GS- و MYC-tag الإيجابية (دوائر). تشير الخلايا الإيجابية المتناثرة إلى بين مجموعتي HiAD و FFD لتصنيف التصنيف الوظيفي الغني (الشكل 4a والشكل الممتد 6a). في مجموعة مسار إشارة هيبو، كانت الجينات المنظمة بواسطة YAP/TAZ غنية في الفئران التي تغذت على HiAD وانخفضت بعد علاج PM وفي الفئران RAGE
الفئران (الشكل 4a). تم ملاحظة تنشيط YAP، كما يتضح من إشارة نووية لـ YAP النشط غير الفسفوري (الشكل الممتد 6b,c,g) وتحفيز الأهداف CTGF (المعروف أيضًا باسم CCN2) و CYR61 (CCN1)، في الفئران التي تتبع نظام HiAD، ولكن انخفضت بعد علاج PM أو في
الشكل 3 | AGEs تعدل هيكل الكولاجين وترابط الشبكة، مما يؤدي إلى زيادة اللزوجة في الكبد وهيدروجيل ثلاثي الأبعاد. أ، قياس الكولاجين غير القابل للذوبان (من اليسار إلى اليمين، و 5). ب، ج، صور مجهرية لـ SHG لهيكل ECM للكبد غير الخلوي (ب) (حزم، سهام حمراء) وهلام الكولاجين (ج). تم تقييم أطوال الألياف (CT-Fire) وزوايا الألياف (ImageJ) (ثلاثة فئران أو هلام لكل مجموعة، خمس صور لكل فأر أو هلام). د، هـ، تم تقييم هلام الكولاجين من ج باستخدام الرهومية لقياس الصلابة (د) واللزوجة المرنة (هـ)، معبرًا عنها كـ (الإطار الزمني الذي يتم فيه تخفيف الضغط إلى نصف قيمته الأصلية). مخطط هيدروجيل الكولاجين/IPN. تم تعديل الرسم البياني من المرجع 16، بموجب ترخيص المشاع الإبداعي CCBY 4.0. ج، مجهر الانعكاس التناسبي للألياف الكولاجينية بعد AGEتعرض ALT-711.الكولاجين غير القابل للذوبان )، أطوال الألياف ( ; CT-Fire) وزوايا (j; ImageJ) في هلامات IPN. البيانات مأخوذة من ثلاث صور لكل هلام، وثلاث هلامات لكل مجموعة. k، منحنيات الاسترخاء التمثيلية من هلامات IPN.
1-o. قياس اللزوجة لجيل IPN اختبار الصلابة (l; معامل التخزين) واللزوجة المرنة ( )، موضحًا معامل الفقد ( ) واسترخاء الإجهاد (منحنيات استرخاء الإجهاد (ن) و ) تظهر. . ب، نمذجة المحاكاة. هيكل مصفوفي يتكون من ألياف فردية (الطول) بدون (يسار) أو مع (يمين) المجمعات التي تربط نهايات الألياف عند. بعد تجميع المصفوفة، يتم تشويهها بواسطةتشوه القص. يتم قياس استرخاء الإجهاد باستخدام المصفوفتين الموضحتين في p.s.t، تم دراسة استرخاء الإجهاد باستخدام مصفوفات ذات أطوال حزم مختلفة.معأو زاوية تجميع مختلفةمعالبيانات هي متوسطس.م.تشير القيم إلى تجارب مستقلة. تم إجراء التحليل الإحصائي باستخدام اختبارات ويلكوكسون لمجموع الرتب (ب وج)، غير المقترنة ذات الذيلين.-اختبارات (، واختبارات كروسكال-واليس مع اختبار دُن (i و j) وتحليل التباين الأحادي (ANOVA) متبوعًا باختبار المقارنات المتعددة توكي. لالبيانات تعني س.د. ( كل واحدة). لـ و أشرطة القياس،. الالفئران على HiAD (الشكل 6d من البيانات الموسعة). لم تُلاحظ خلايا الكبد الإيجابية لـ YAP بالقرب من حزم الكولاجين في مجموعة HiAD (الشكل 6e من البيانات الموسعة). لدعم أن سرطان الكبد في ECM الذي يتمتع بخصائص استرخاء الضغط بشكل أسرع تم تعزيزه بواسطة YAP وTAZ، قمنا بحقن عامل النسخ السالب المهيمن TEA domain transcription factor 2 (dn-TEAD2) أو بلازميدات التحكم بواسطة HDI مع hMET والطافرة.-كاتين (الشكل 4ب). تعتبر عائلة عوامل النسخ TEAD شركاء ارتباط مهمين لـ YAP وTAZ، وقد ارتبط TEAD2 بشكل خاص بتقدم سرطان الكبد hepatocellular carcinoma (HCC).وجدنا أن عدد الخلايا الموجبة المزدوجة لـ GS/MYC تقلصت البؤر بشكل ملحوظ بعد حقن dn-TEAD2/HDI المشترك مقارنة بالفئران التي تم حقنها بالبلازميد الضابط (الشكل 4c، d والشكل التمديدي 6f (صور الهيماتوكسيلين والإيوزين))، وكانت هذه البؤر سلبية بالنسبة لـ YAP النشط، النووي (الشكل 4c (الأسفل، الإطار)). في الفئران المعالجة بـتم التحكم في حقن المتجهات المشتركة، وتم تحديد YAP النشط في نوى الخلايا الإيجابية لـ GS. تم تقليل الأهداف اللاحقة CTGF و CYR61 بعد الحقن بـ dn-TEAD2 (الشكل 4e). معًا، تشير هذه البيانات إلى أن سرطان الكبد في ECM الذي يتمتع بخصائص استرخاء أسرع تم تعزيزه بواسطة YAP..
الشكل 4 | يشارك YAP في نمو HCC الذي تعززه اللزوجة العالية. أ، تحليلات بيانات تسلسل RNA الكمي من الفئران التي تم تغذيتها بنظام غذائي عادي أو نظام غذائي عالي الدهون أو نظام غذائي عالي البروتين مع علاج المركب.كل منها)، الفئران التي تم تغذيتها بنظام غذائي عالي الدهون مع علاج PM ) و الفئران التي تم إطعامها HiADتظهر خريطة الحرارة زيادة في عدة جينات مستهدفة لـ YAP/TAZ في مجموعة HiAD مقارنة بالمجموعات الأخرى. Tensin1 (Tns1، باللون الأحمر) هو الهدف الذي يهمنا. ب، مخطط لنموذج HCC المرتبط بـ NASH مع تثبيط YAP. تم إنشاء الرسم باستخدام BioRender. ج، صبغة مناعية GS/MYC على الشرائح اللاحقة تظهر بؤر متحولة (دوائر، أعلى ووسط). YAP غير الفسفوري النشط (باللون الأحمر) موجود في نوى خلايا GS الإيجابية (باللون الأخضر) في الفئران التي تم حقنها بالمتجه الضابط (لـ dn-TEAD2) والتي تم تغذيتها بنظام HiAD (أسفل). مقياس الأشرطة، (الأعلى والوسط) و (أسفل). NC، متجه فارغ. د، قياس GSالبؤر في ج.تم تقليل استهداف YAP لـ Ctgf و Cyr61 في الفئران المعالجة بـ dn-TEAD2.البيانات هي متوسطس.م.تشير القيم إلى الفئران الفردية. تم إجراء التحليل الإحصائي باستخدام تحليل التباين الأحادي متبوعًا باختبار المقارنات المتعددة توكي.
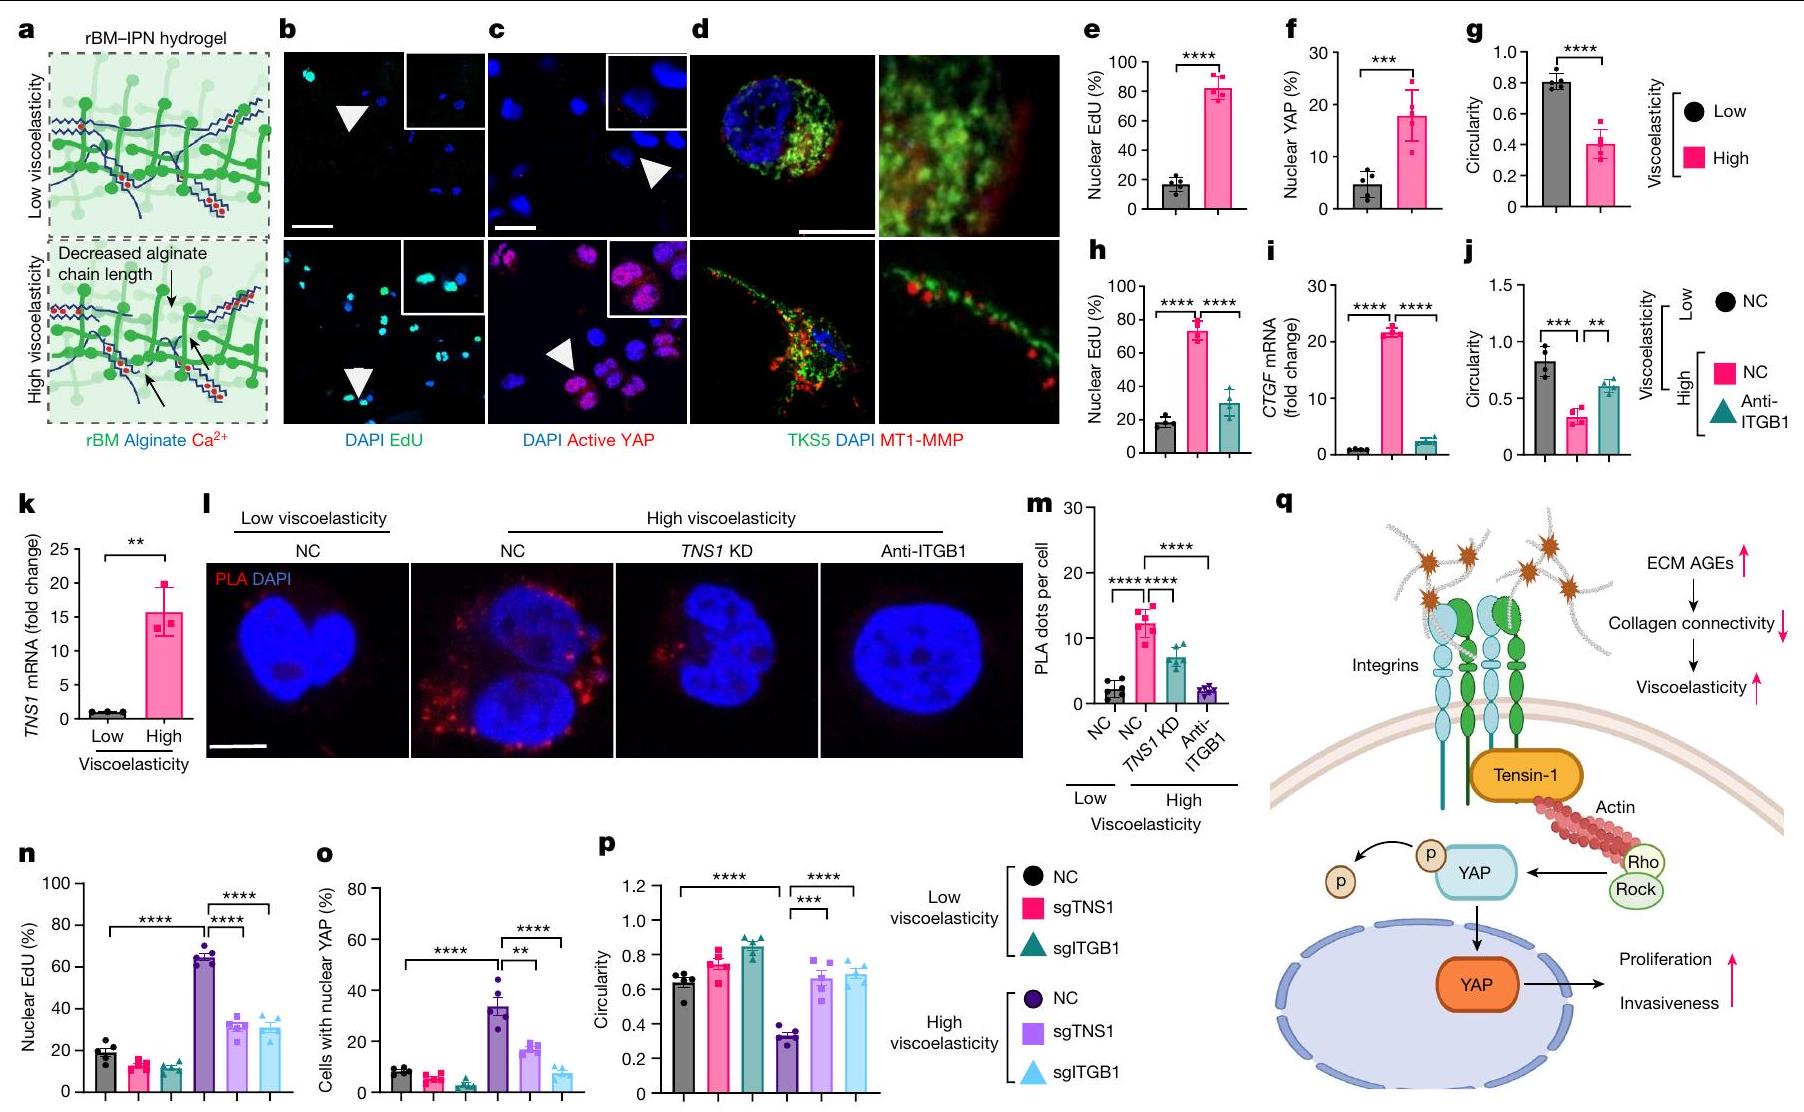
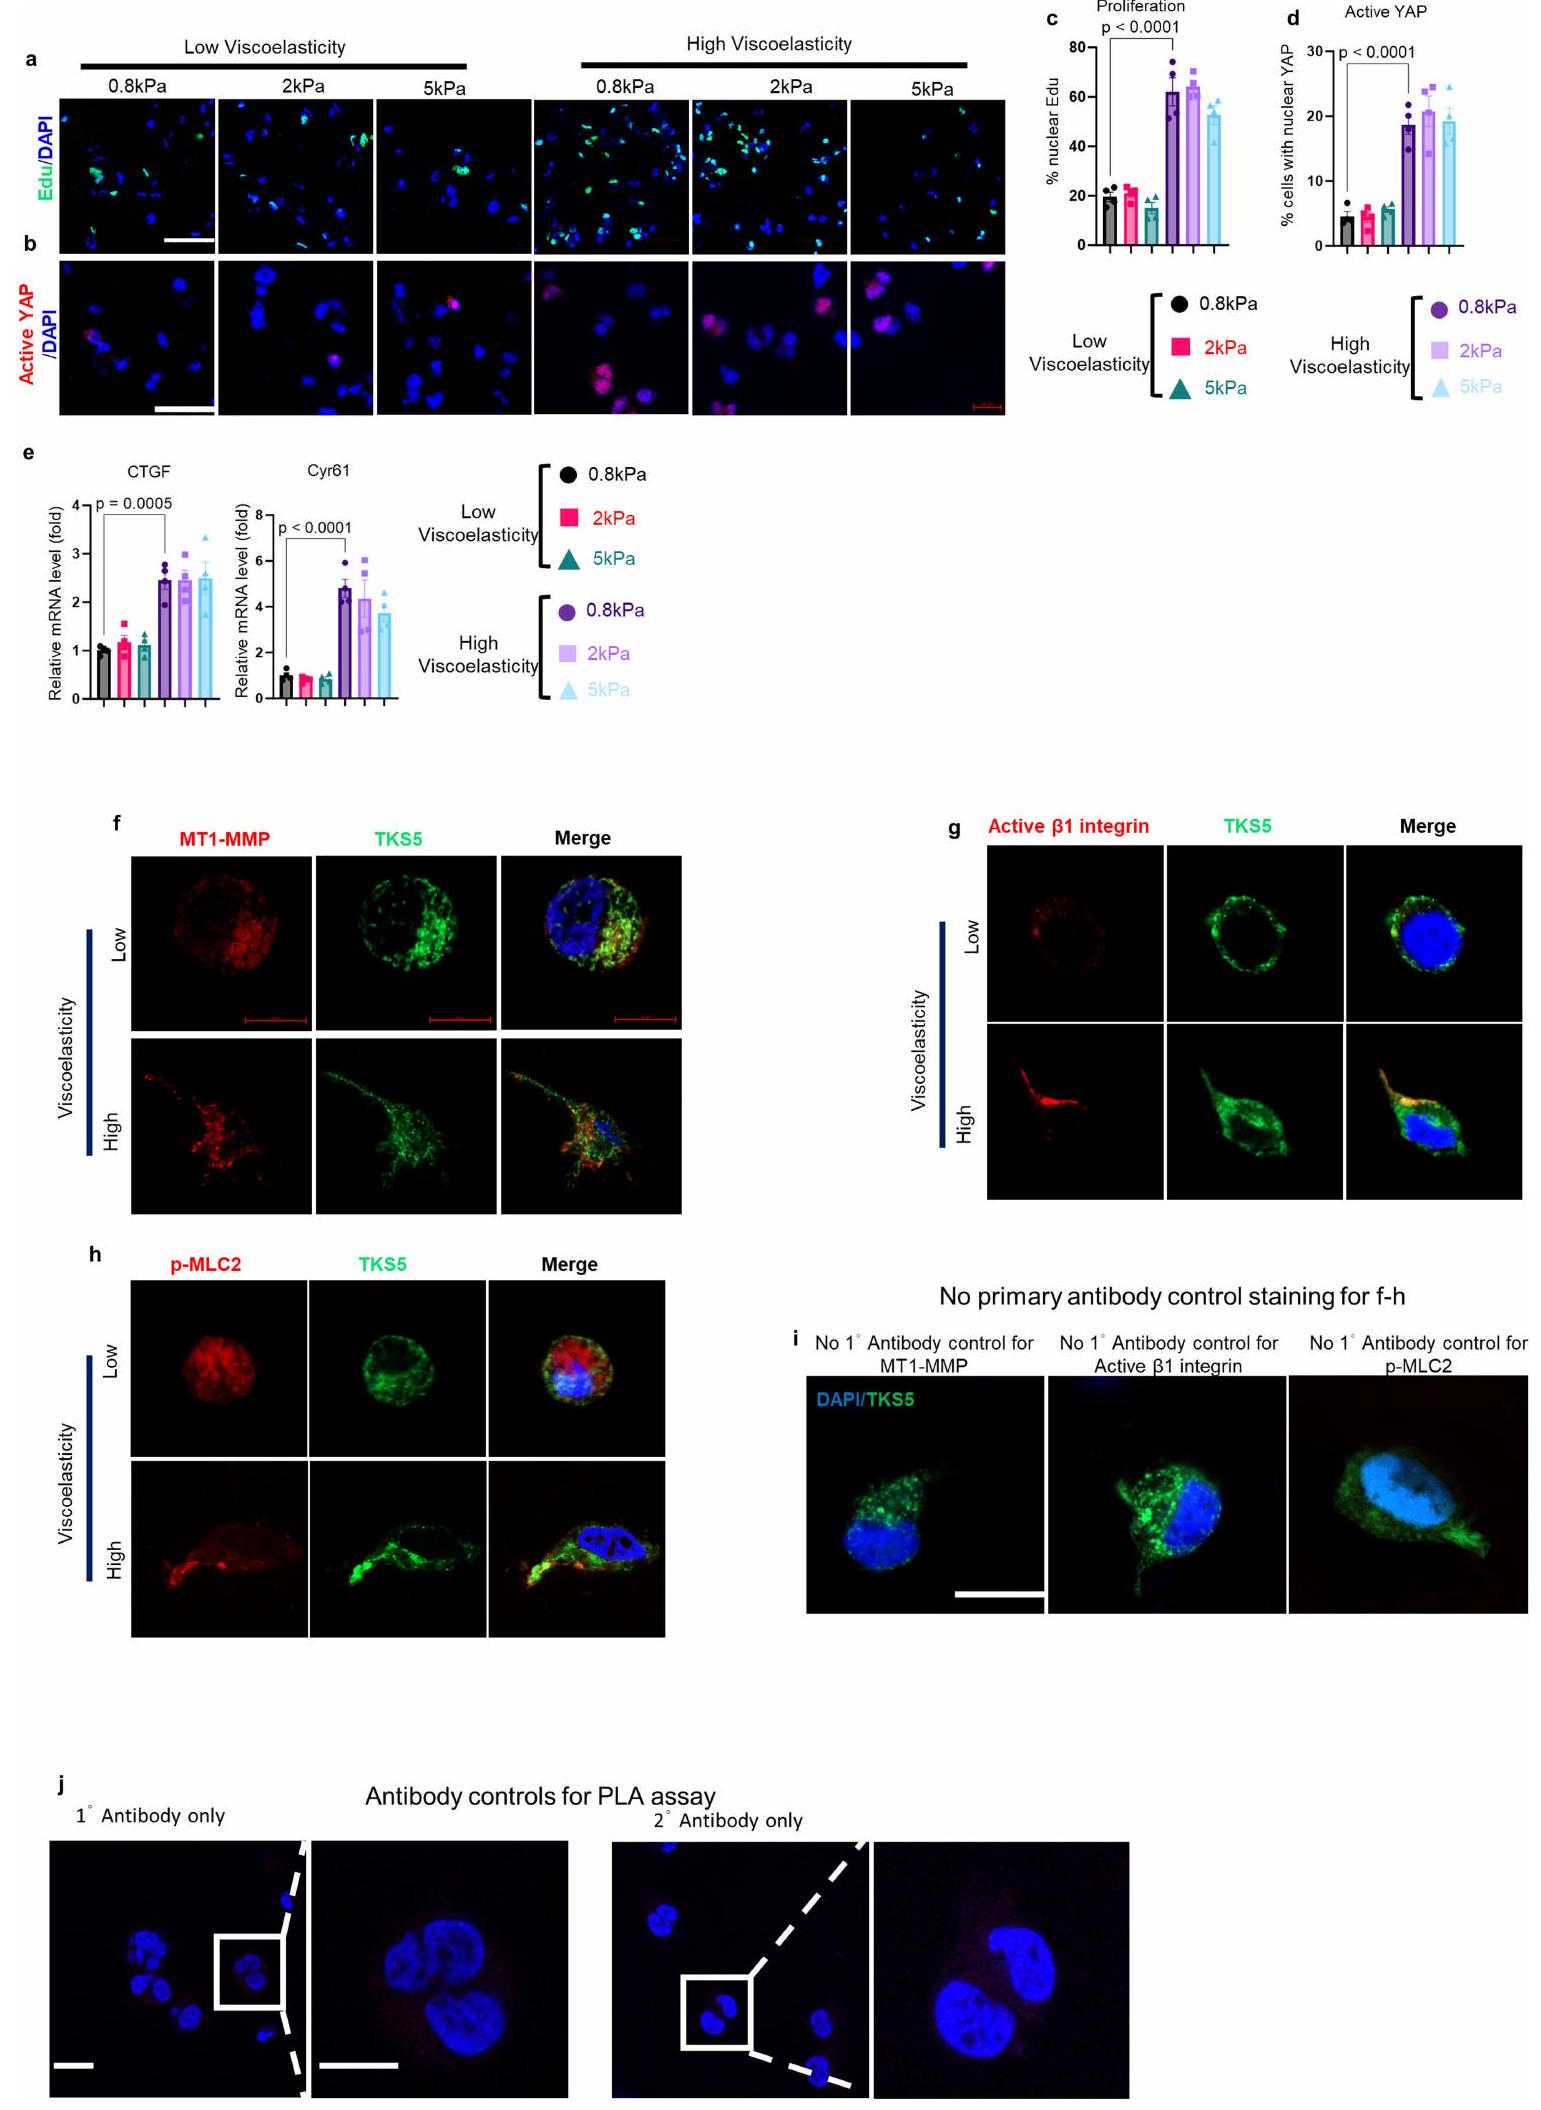
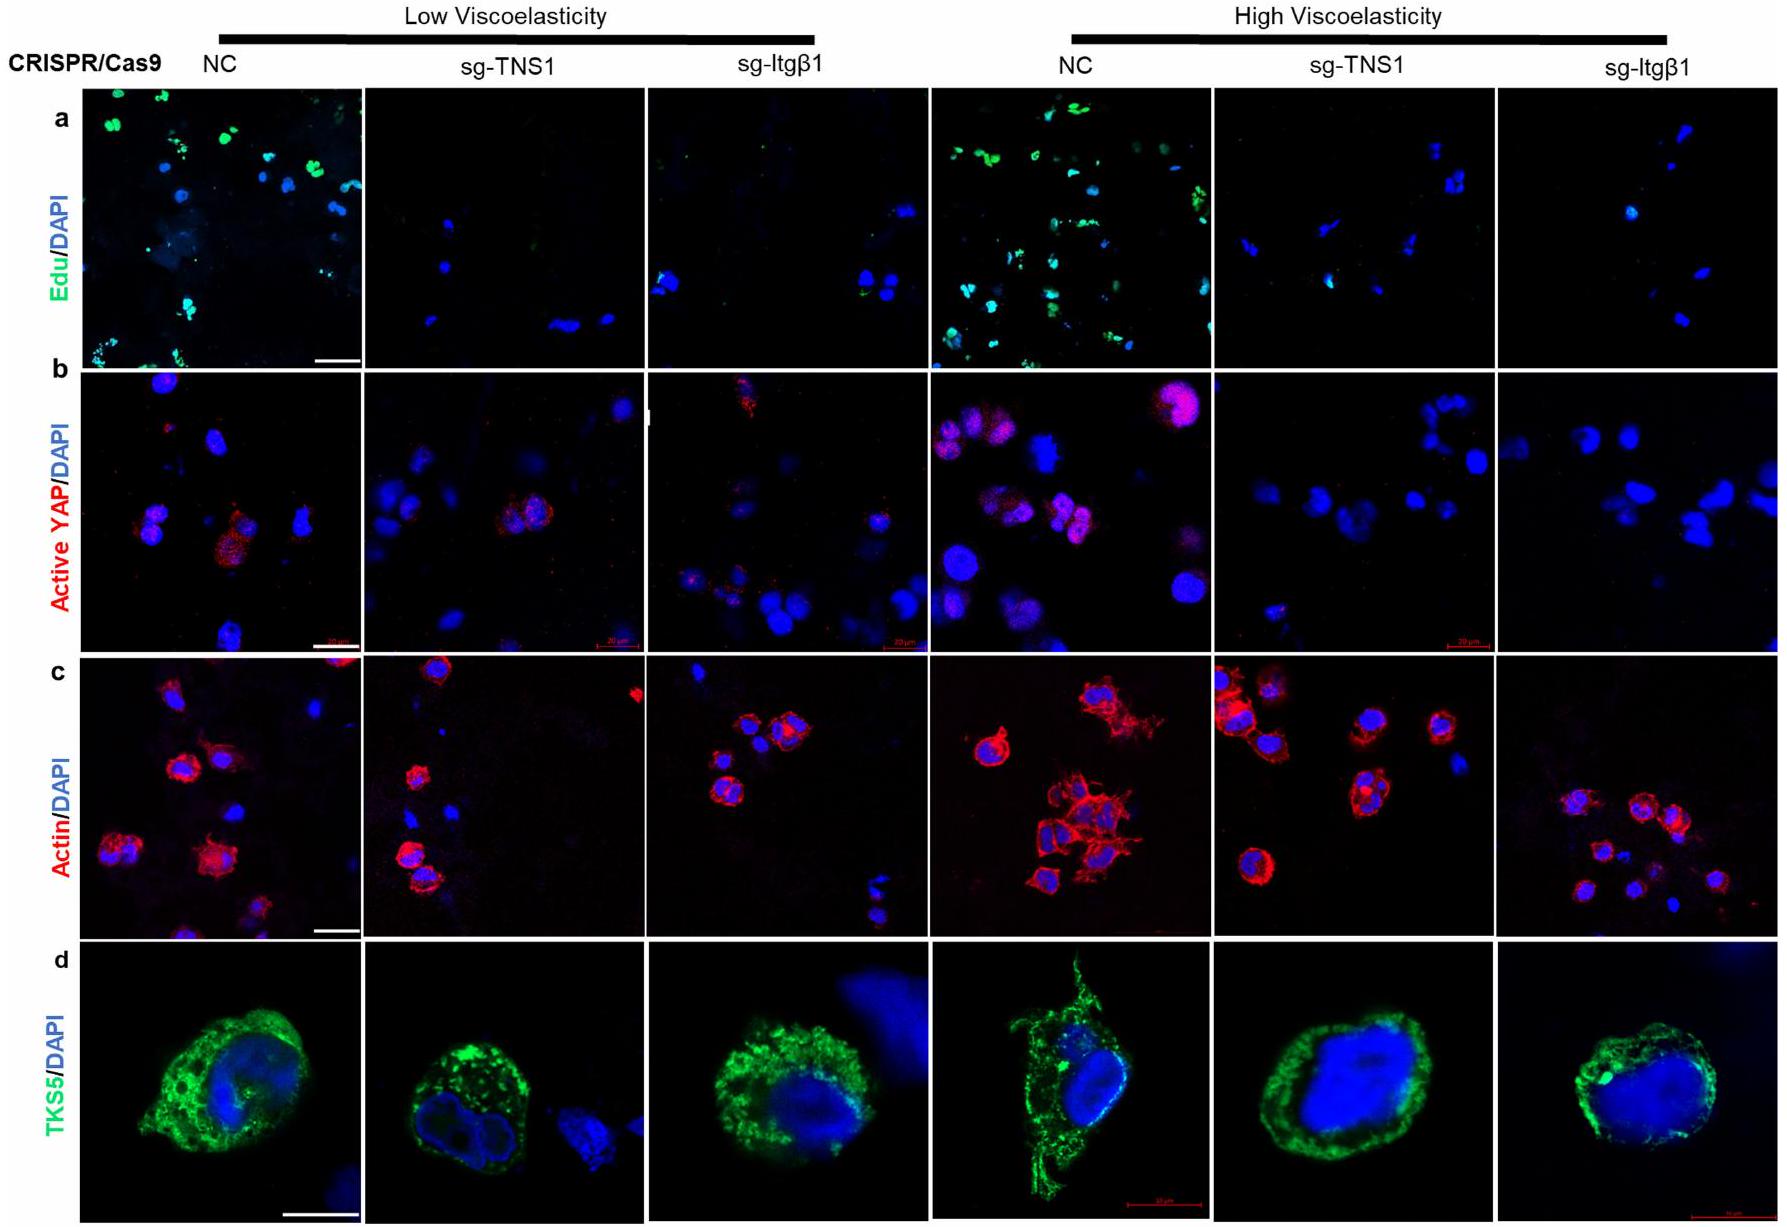
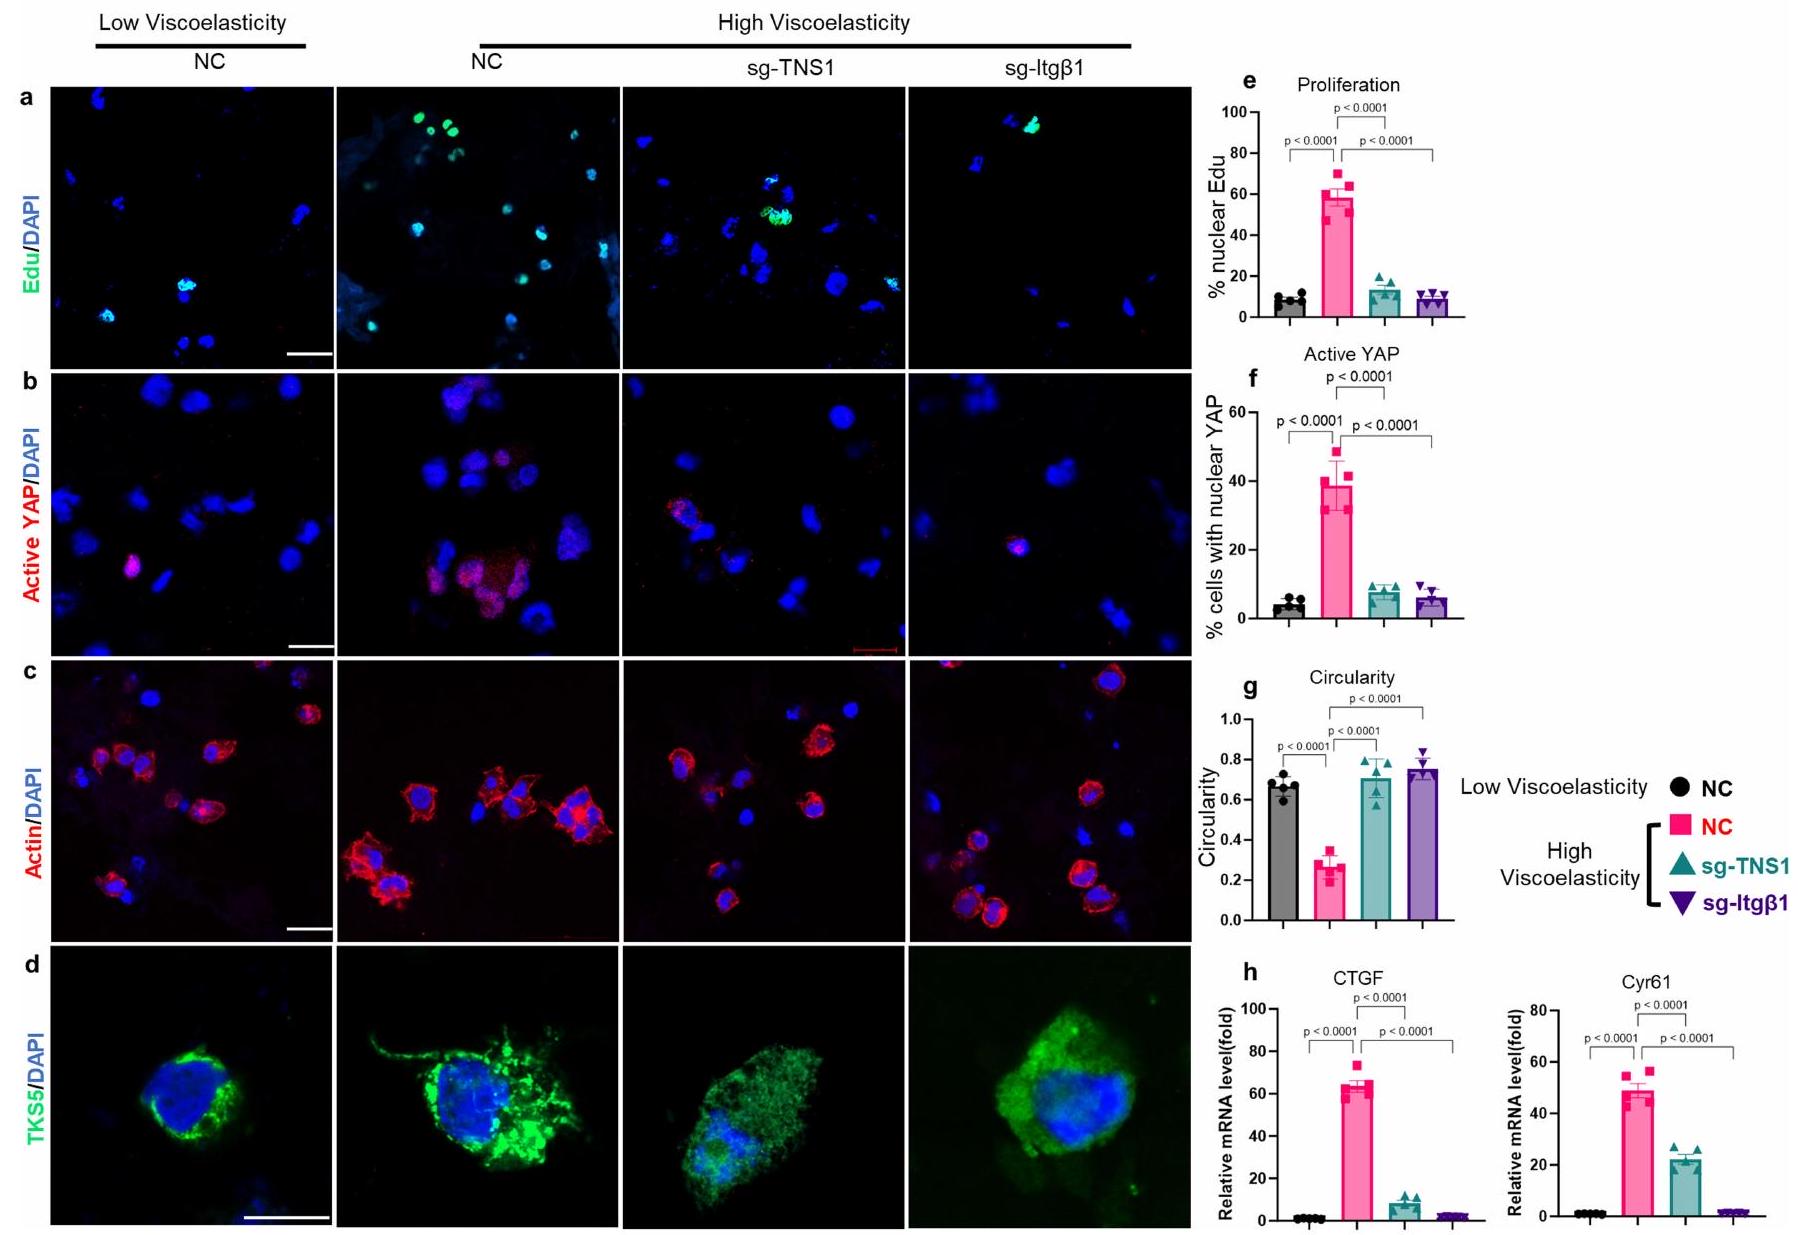
بالنظر إلى هذه النتائج، كان سؤالنا التالي هو كيف تنقل ECM اللزج المرن إشارات التكاثر والغزو. لاختبار تأثيرات اللزوجة مباشرة، قمنا بإنشاء شبكات بوليمرية متشابكة من هيدروجيل الألجينات وطبقة القاعدة المعاد تكوينها (rBM) للزراعة ثلاثية الأبعاد. تم احتواء خلايا HCC (الشكل 5 والشكل الإضافي 7a-e) في هيدروجيلات rBM-IPN. بنفس الصلابة (معامل يونغ، 2 كيلو باسكال) ولكن بمستويات مختلفة من اللزوجة المرنة (الشكل 5أ). في الجل عالي اللزوجة المرنة، أظهرت الخلايا زيادة في التكاثر (الشكل 5ب، هـ)، وتنشيط YAP (الشكل 5ج، و) وتكوين هياكل شبيهة بالانفادوبوديا إيجابية لـ TKS5 (المعروفة أيضًا باسم SH3PXD2A) وإيجابية لـ MT1-MMP بالإضافة إلى شكل أكثر استطالة (الشكل 5د، ز). عندما تم زيادة معامل يونغ تدريجيًا إلى 5 كيلو باسكال، لم نلاحظ زيادة في تكاثر الخلايا، أو تنشيط YAP، أو تحفيز جيناته المستهدفة (الشكل التمديدي 7أ-هـ). الانفادوبوديا هي بروزات رفيعة خطية مرتبطة بغزو الخلايا السرطانية وهجرتها. في الجل عالي اللزوجة المرنة، اكتشفنا علامات نموذجية مثل TKS5 وMT1-MMP (الشكل 5د والشكل التمديدي 7ف) بالإضافة إلى الإنتغرين النشط.و سلسلة الميوسين الخفيفة الفسفورية MLC ) (الشكل 7g,h في البيانات الموسعة، على التوالي). يتم عرض ضوابط الأجسام المضادة في الشكل 7i في البيانات الموسعة. كما أن الإنتغرين-تم الإبلاغ عن تفاعلات المصفوفة التي تعدل نقل الآليات الميكانيكية في خلايا سرطان الثدي في الهلام عالي اللزوجة.، استخدمنا الإنتجرين-الأجسام المضادة الموجهة بشكل محدد (الشكل 5h-j). وقد أدت هذه إلى تقليل التكاثر (الشكل 5h) وهدف YAP CTGF (الشكل 5i) وزيادة دائرية الخلايا (الشكل 5j).
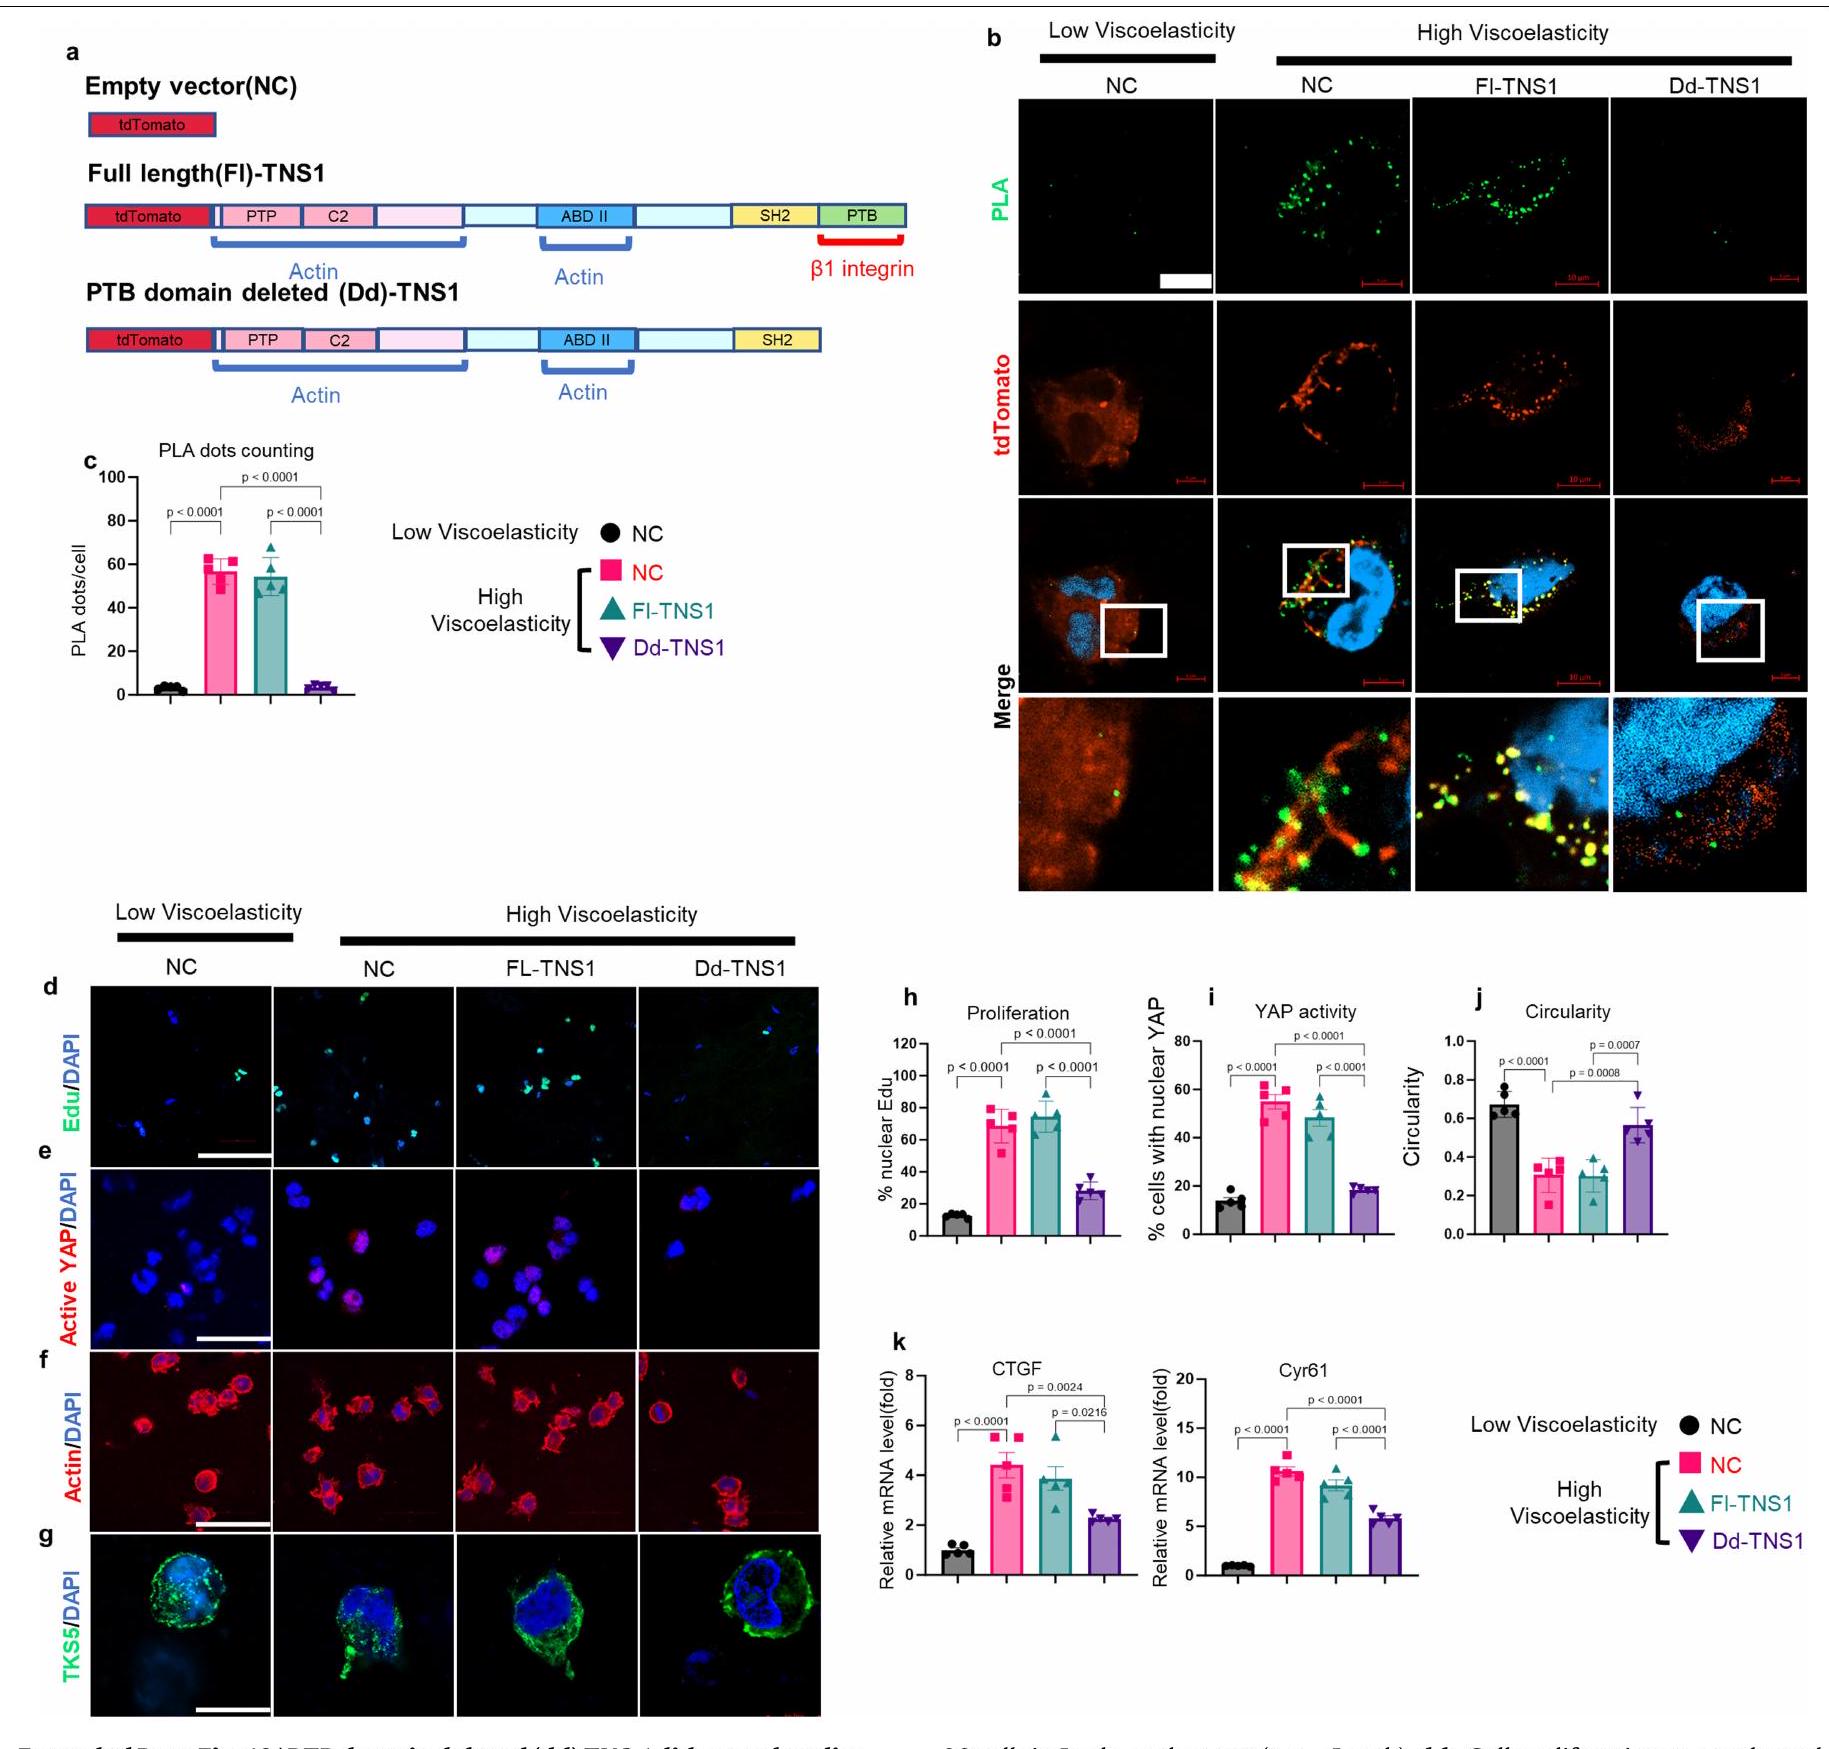
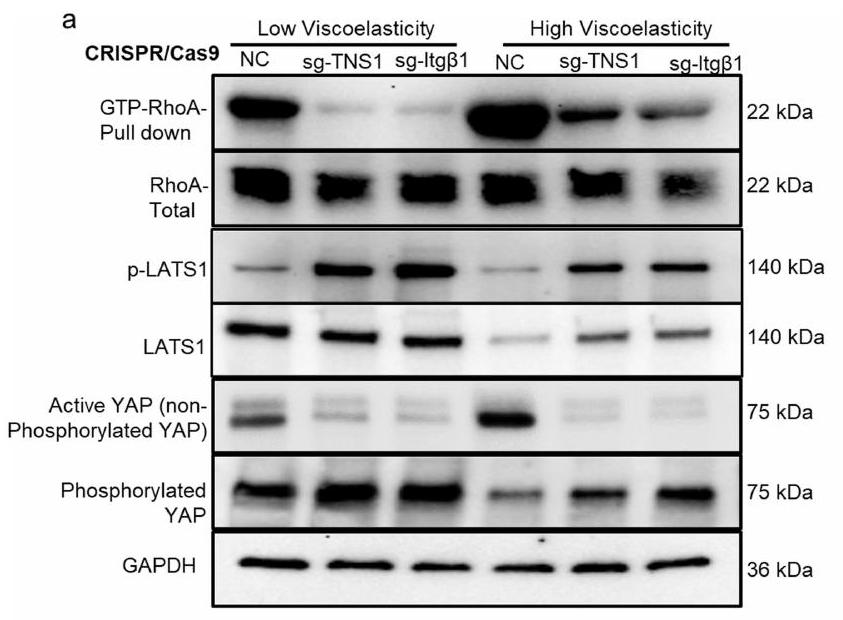
من الجدير بالذكر أنه استنادًا إلى بيانات تسلسل RNA لدينا، تم تحفيز TNS1 بشكل كبير بطريقة تعتمد على AGE واللزوجة المرنة (الأشكال 4a و5k). تم وصف TNS1 كجزء من قفل جزيئي يوسط الربط الميكانيكي بين الإنتغرينات المرتبطة بمصفوفة ECM والهيكل الخلوي الأكتين-مايوسين لتوليد قوة الجر.لدراسة الدور في إشارات الميكانيكا، تم إجراء اختبارات الربط القريب (PLA) في خلايا HCC في هيدروجيل منخفض ومرتفع اللزوجة لالتقاط التفاعل المحتمل بين TNS1 والإنتجرين.. ظروف اللزوجة العالية عززت تفاعلهم (الشكل 51، م والشكل البياني الموسع 7j (ضوابط الأجسام المضادة)). بعد ذلك، درسنا تأثيرات TNS1 أو الإنتغرينخفض (CRISPR-Cas9؛ الشكل 5n-p). وقد أدى ذلك إلى تقليل تكاثر الخلايا (الشكل 5n والشكل الإضافي 8a) بالإضافة إلى تنشيط YAP والجينات المستهدفة (الشكل 50 والشكل الإضافي 8b,e) في ECM عالي اللزوجة. تم تقليل تشكيل الغزوات، وزادت دائرية الخلايا بعد TNS1 أو الإنتغرين.إسقاط (الشكل 5p والشكل الإضافي 8c، d). أظهرت خلايا Hep3B نتائج مشابهة (الشكل الإضافي 9). لتحليل أهمية TNS1-الإنتجرين بشكل أكبرالتفاعل في تشكيل الانفادوبوديا والتكاثر، قمنا بنقل خلايا باستخدام متجه يحتوي على طفرات في TNS1 (مع حذف منطقة PTB التي تمنع ارتباطه بالإنترجرين، فيما بعد، dd-TNS1) أو TNS1 كامل الطول (الشكل التوضيحي الممتد 10a) وقمنا بإدماجها في هيدروجيلات ذات لزوجة منخفضة أو عالية. قمنا بتقييم ما إذا كان dd-TNS1 قادرًا على الارتباط بالإنتيجرين باستخدام PLA. في خلايا dd-TNS1 المعدلة، كانت إشارة PLA منخفضة جداً، بينما في خلايا full-TNS1-tdTomato الإيجابية، كانت الإشارات متزامنة (الشكل التمديدي 10b، c). كانت خلايا dd-TNS1 المعدلة في الهلامات عالية اللزوجة لديها تكاثر أقل (الشكل التمديدي 10d، h)، وانخفضت مستويات YAP النشطة وجيناته المستهدفة (الشكل التمديدي 10e، i، k)، بينما زادت دائريتها (الشكل التمديدي 10f، j) ولم تشكل بروزات (الشكل التمديدي 10g). بما أن RhoA يشارك في تنظيم شكل الخلية والهجرة، وقد وُصف أنه يتم تعديله بواسطة TNS1.، درسنا بعد ذلك نشاطه. أظهرت الخلايا في الهلاميات عالية اللزوجة زيادة في نشاط RhoA-GTPase في وجود TNS1 واندماج.-اعتمادًا على (الشكل البياني الممتد 11 أ، ب). LATS1انخفضت النشاطات وكان YAP أكثر نشاطًا في الخلايا في الجل عالي اللزوجة، في حين لوحظ العكس بعد TNS1 أو الإنتجرين.تثبيط. أدى تثبيط ROCK-GTPase والميوسين 2 إلى زيادة في دائرية الخلايا، وانخفاض في معدل التكاثر، وتقليل تعبير أهداف YAP (الشكل 11c-e من البيانات الموسعة).
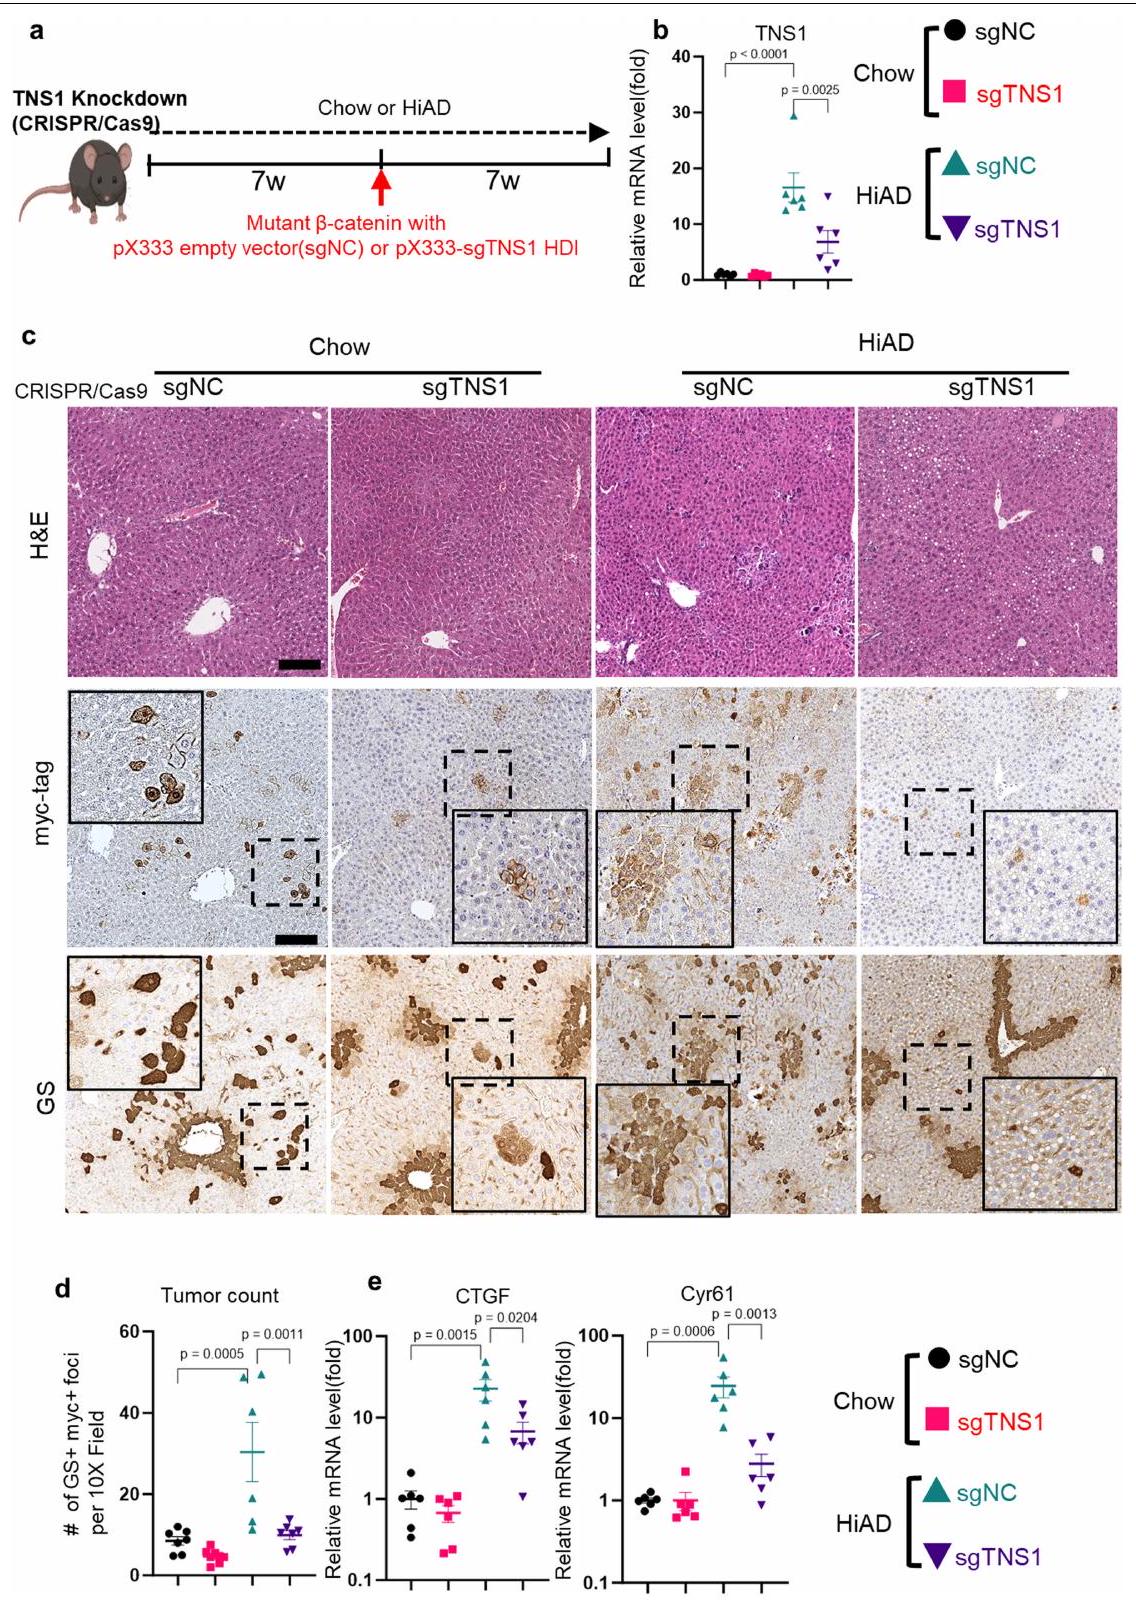
لدراسة الدور داخل الجسم لـ TNS1، استخدمنا نهجًا موجهًا بواسطة CRISPR-Cas9 حيث تم استهداف TNS1 في وقت HDI. تم حقن الفئران التي تتغذى على نظام غذائي عادي أو نظام غذائي HiAD هيدروديناميكيًا كما في السابق، بما في ذلك إما RNA دليل فردي لـ Tns1 (sgTNS1) أو بلازميدات sgRNA التحكم، وتم euthanized بعد 7 أسابيع من الحقن (الشكل البياني الممتد 12a). في الفئران المعالجة بـ sgTNS1، تم قياس تعبير Tns1 و
الشكل 5|الإنتغرين--محور TNS1-YAP يتوسط مسارات ميكانيكية خلوية محددة للزخرفة اللزجة لغزو خلايا HCC. أ، مخططات للزخرفة اللزجة القابلة للتعديل من IPNs من الألجينات (أزرق) ومصفوفة القاعدة المعاد تكوينها (أخضر) من هيدروجيل ثلاثي الأبعاد. تقليل الكتلة الجزيئية للألجينات المتقاطعة بواسطة الكالسيوم (أحمر) يقلل من ترابط الشبكة (الأسهم) لزيادة الزخرفة اللزجة. تم تعديل الرسم من المرجع 16، بموجب ترخيص المشاع الإبداعي CC BY 4.0. ب-ز، تم تحليل تكاثر الخلايا في هيدروجيلات ذات لزوجة منخفضة أو عالية باستخدام اختبارات EdU (التصوير (ب) والتquantification (هـ)). ج، ف، تم تحليل تنشيط YAP باستخدام أجسام مضادة ضد YAP النشط (التصوير (ج) والتquantification (ف)؛ تشير رؤوس الأسهم إلى المناطق المتضخمة). د، تشكيل هياكل شبيهة بالانفادوبوديا بعد التحويل (Clontech-N1، يحتوي على TKS5-mNeonGreen البشري)، وتحليل المناعة الفلورية لـ MT1-MMP (أحمر) باستخدام مجهر Airyscan. ز، تحليلات دائريّة الخلايا (ImageJ؛ قضبان القياس، و تم تحضين خلايا Huh7 في هيدروجيل منخفض أو عالي اللزوجة مع التحكم
إي جي جي أو إنتغرينأجسام مضادة تمنع (ITGB1). تكاثر الخلايا (ساعة؛ EdU)، هدف YAPودائرية الخلية ( ) تم تحليلها. التعبير في الخلايا في الهلاميات المائية ذات اللزوجة المنخفضة أو العالية.تظهر PLAs ارتباطًا مباشرًا بين TNS1 والإنتجرين (ITGB1) في الهلاميات المائية عالية اللزوجة المرنة (; شريط القياس، تم تحليل إشارة PLA (30 خلية في 5 هلامات لكل مجموعة،، كل منها). تم نقل خلايا Huh7-Cas9 باستخدام بلازميدات تحتوي على RNA توجيهي CRISPR لـ TNS1 (sgTNS1)، إنتغرين (sgITGB1) أو sgRNA التحكم (NC) ومدمجة في هيدروجيل منخفض أو عالي اللزوجة. تم تحليل التكاثر (n) وتفعيل YAP (o) ودائرية الخلايا (p).كل. q، مخطط TNS1، الذي يعمل كعنصر رئيسي في مجمع مستشعر ميكانيكي ECM من خلال الارتباط بالإنتيجرين. في ECM عالي اللزوجة المرنة. تم إنشاء الرسم البياني باستخدام BioRender. البيانات هي متوسط س.م.تشير القيم إلى تجارب مستقلة. تم إجراء التحليل الإحصائي باستخدام اختبار غير متزاوج ذو طرفين.-اختبارات ( و ) واختبار ANOVA أحادي الاتجاه يليه اختبار المقارنات المتعددة لتوكاي ( و ). عدد المحولاتانخفضت البؤر مقارنة بالفئران التي تم حقنها بـ sgRNA الضابطة (الشكل 12b-d من البيانات الموسعة، على التوالي)، وكان التعبير عن أهداف YAP Ctgf (المعروف أيضًا باسم Ccn2) وCyr61 (Ccn1) أقل (الشكل 12e من البيانات الموسعة). معًا، تشير هذه البيانات إلى أن TNS1 هو جزء من ق clutch جزيئي يربط بين الإنتغرينات المرتبطة بـ ECM والهيكل الخلوي الأكتين-مايوسين استجابةً لللزوجة العالية (الشكل 5q).
نقاش
هنا نوضح أن المنتجات النهائية للجليكوزيل (AGEs) في مصفوفة الكبد خارج الخلية تخلق بيئة لزجة مريحة أسرع تؤدي إلى تنشيط الإشارات الميكانيكية التي تعزز سرطان الكبد (HCC). على الرغم من أن صلابة المصفوفة في التليف المتقدم/تشمع الكبد وتأثيراتها على تقدم السرطان قد تم دراستها بشكل موسع، فإن بياناتنا هي الأولى، حسب علمنا، التي توضح كيف تؤثر التغيرات في اللزوجة المرنة، بغض النظر عن الصلابة، على نمو سرطان الكبد. هذا ذو صلة سريرية كبيرة حيث إن زيادة اللزوجة المرنة قد تكون عامل خطر يتنبأ بميزات أكثر غزوًا لسرطان الكبد في حالات التهاب الكبد الدهني غير الكحولي/داء السكري من النوع الثاني. تستبعد الإرشادات الحالية المرضى ما قبل التشمع من فحص سرطان الكبد. paradigms؛ لذلك، ستحتاج طرق التصوير الجديدة المعتمدة على اللزوجة المرنة إلى أن تُطور لتحديد الفئة المعرضة للخطر. يُعتبر داء السكري من النوع الثاني عامل خطر رئيسي ليس فقط لتقدم سرطان الكبد ولكن أيضًا في سرطان الثدي، نقطتانوسرطان البنكرياسوقد يشير هذا إلى الدور الحاسم لمصفوفة أكثر لزوجة في المرضى الذين يعانون من السكري.
يُعتقد أن ربط الكولاجين الذي يتم بوساطة AGEs يساهم في زيادة الصلابة بشكل مشابه لـ LOXI2 أو TTG، مما يعدل الهيكل الحلزوني للكولاجين.. ومع ذلك، حددت دراساتنا أنه في سياقات معينة، يؤدي زيادة ترابط الكولاجين إلى ألياف أقصر مرتبطة بشكل ضعيف مع تواصل أقل، مما يعزز بدوره بيئة لزجة مرنة. وهذا بدوره يسهل التغيرات في شكل الخلايا، وإعادة تنظيم الهيكل الخلوي، وتكوين هياكل شبيهة بالانفادوبوديا.قد يكون هذا ذا صلة ليس فقط بمصفوفة الكبد المحيطة بالورم، ولكن أيضًا بسرطانات أخرى حيث تم ملاحظة تغييرات في اللزوجة المرنة، ولكن لم يتم بعد ربطها وظيفيًا بالتقدم..
كما حددنا الدور الرئيسي لبروتين TNS1-الإنتجرين-مسار نقل الإشارات RhoA-YAP استجابةً لزيادة اللزوجة المرنة. بينما يُعرف دور تنشيط YAP في أنواع مختلفة من السرطان، كما هو الحال مع دور في الاستجابة للمرونة اللزجة في المختبركان الدور داخل الجسم لـ YAP كمحفز لتقدم السرطان استجابةً لتغيرات اللزوجة غير واضح سابقًا. علاوة على ذلك، يتعلق عنصر آخر من الاهتمام بدور TNS1 كمستشعر ميكانيكي رئيسي في مسار الإشارات بين الإنتغرين وYAP. قد يكون تنظيم TNS1 واستدامته لنشاط القابض الجزيئي أمرًا أساسيًا لتكوين البروز والنشاط الهجري للخلايا.ويمكن استكشاف هذه الأمور بشكل أعمق في الدراسات المستقبلية.
في الختام، حددنا الدور المركزي لزيادة اللزوجة المرنة في بيئة ورم الكبد. تعد المسارات الميكانيكية المفعلة باللزوجة المرنة واعدة كمجالات تشخيصية و/أو علاجية في سرطان الكبد المرتبط بـ NASH/ T2DM وما بعده.
المحتوى عبر الإنترنت
أي طرق، مراجع إضافية، ملخصات تقارير Nature Portfolio، بيانات المصدر، بيانات موسعة، معلومات تكميلية، شكر وتقدير، معلومات مراجعة الأقران؛ تفاصيل مساهمات المؤلفين والمصالح المتنافسة؛ وبيانات توفر البيانات والرموز متاحة علىhttps://doi.org/10.1038/s41586-023-06991-9.
بيرسما، ب.، هايوارد، م. ك. وويفر، ف. م. التليف والسرطان: علاقة متوترة. بيوكيمي. بيوفيز. أكتا ريف. سرطان 1873، 188356 (2020).
شرايدر، ج. وآخرون. صلابة المصفوفة تعدل التكاثر، استجابة العلاج الكيميائي، والسبات في خلايا سرطان الكبد hepatocellular carcinoma. علم الكبد 53، 1192-1205 (2011).
مكغيلين، ك. أ.، بيترِك، ج. ل. وإل-سيراج، ح. ب. علم وبائيات سرطان الكبد. علم الكبد 73، 4-13 (2021).
نيغرو، ف. التاريخ الطبيعي لالتهاب الكبد الدهني غير الكحولي وسرطان الكبد. ليفر إنت. 40، 72-76 (2020).
كرايمر، ج. ر. وآخرون. تأثير أدوية السكري والتحكم في نسبة السكر في الدم على خطر الإصابة بسرطان الكبد الخلوي في المرضى الذين يعانون من مرض الكبد الدهني غير الكحولي. علم الكبد 75، 1420-1428 (2022).
هينينغ، سي.، سمودا، م.، جيرندت، م.، أولريش، سي. وغلومب، م. أساس جزيئي لتكوين منتجات نهاية الجليكاسيون المتقدمة (AGE) من أميد ميلارد في الجسم الحي. مجلة الكيمياء الحيوية 286، 44350-44356 (2011).
ماكفيكار، سي. إم. وآخرون. دور مستقبل المنتجات النهائية للجليكاسيون المتقدمة (RAGE) في علم الأمراض الوعائي التنكسي الشبكي خلال مرض السكري في الفئران. ديابيتولوجيا 58، 1129-1137 (2015).
كولهون، هـ. م. وآخرون. مستقبلات الجليكشن المتقدمة القابلة للذوبان والداخلية كعلامات حيوية تنبؤية لمخاطر مرض الشريان التاجي لدى مرضى السكري من النوع 2: تحليل من تجربة CARDS. داء السكري 60، 2379-2385 (2011).
دهناد، أ. وآخرون. انخفاض تنظيم AGER1 يرتبط بالتليف في التهاب الكبد الدهني غير الكحولي ومرض السكري من النوع 2. ج. استثمار سريري. 130، 4320-4330 (2020).
أندريوتيس، أو. جي. وآخرون. الترطيب والتغيرات النانوية الميكانيكية في ألياف الكولاجين الحاملة لمنتجات الجليكشن المتقدمة. التعبير عن البصريات الحيوية 10، 1841-1855 (2019).
تشودري، أ.، كوبر-وايت، ج.، جانمي، ب. أ.، موني، د. ج. وشينوي، ف. ب. تأثيرات لزوجة مصفوفة الخلايا خارج الخلوية على سلوك الخلايا. ناتشر 584، 535-546 (2020).
أديبوال، ك. وآخرون. تعزيز استرخاء إجهاد الركيزة يعزز هجرة الخلايا المعتمدة على الفيلوبوديا. نات. ماتير. 20، 1290-1299 (2021).
شارير، إ. إ.، بوجودا، ك.، ويلز، ر. ج. وجانمي، ب. أ. التحكم في شكل الخلايا والتمايز بواسطة الركائز ذات المرونة والتشتت اللزج القابلة للتعديل بشكل مستقل. نات. كوميونيك. 9، 449 (2018).
نام، س. وآخرون. تقدم دورة الخلية في البيئات المقيّدة يتم تنظيمه بواسطة TRPV4-PI3K/Akt-p27 المستجيب للنمومحور الإشارة. Sci. Adv. 5، eaaw6171 (2019).
ويزدم، ك. م. وآخرون. البلاستيك الميكانيكي للمصفوفة ينظم هجرة خلايا السرطان من خلال بيئات ميكروية محصورة. نات. كوميونيك. 9، 4144 (2018).
إلوسيغوي-أرتولا، أ. وآخرون. اللزوجة المرنة للمصفوفة تتحكم في تنظيم الأنسجة الزماني المكاني. نات. ماتير. 22، 117-127 (2023).
فاريل، ج. وآخرون. نماذج الفئران لالتهاب الكبد الدهني غير الكحولي: نحو تحسين ملاءمتها لالتهاب الكبد الدهني غير الكحولي البشري. علم الكبد 69، 2241-2257 (2019).
فبراير، م. أ. وآخرون. نماذج ما قبل السريرية لدراسة سرطان الكبد الناتج عن التهاب الكبد الدهني غير الكحولي: ما مدى فائدتها؟ ميتابوليزم الخلايا. 29، 18-26 (2019).
تاو، ج. وآخرون. نمذجة مجموعة فرعية من سرطان الكبد الخلوي البشري في الفئران من خلال التعبير المشترك عن جين المت وطفرة النقطة.-كاتين. علم الكبد 64، 1587-1605 (2016).
نعومي، ر.، ريدزوان، ب. م. وبهاري، ح. رؤى حالية حول الكولاجين من النوع الأول. البوليمرات 13، 2642 (2021).
غوتييري، أ. وآخرون. المنتجات النهائية المتقدمة للجليكاسيون: ميكانيكيات الكولاجين المتقدم من الجزيء إلى النسيج. بيولوجيا المصفوفة. 59، 95-108 (2017).
دانديا، هـ.، ماكاد، ك. وتاياليا، ب. الكولاجين الجليكوزي – نظام مصفوفة ثلاثية الأبعاد لدراسة سلوك الخلايا المرضية. علوم المواد الحيوية. 7، 3480-3488 (2019).
هادسون، د. م.، آرتشر، م.، كينغ، ك. ب. وإير، د. ر. جليكاسيون الكولاجين من النوع الأول تستهدف بشكل انتقائي نفس مواقع ليسين المجال الحلزوني كما في الربط المتقاطع الذي تسببه أكسيداز الليزين. ج. كيمياء حيوية. 293، 15620-15627 (2018).
بان، إ. وآخرون. آليات التشوه البلاستيكي في شبكات الكولاجين الناتجة عن القوى الخلوية. مجلة الفيزياء الحيوية 114، 450-461 (2018).
مونستر، س. وآخرون. اعتماد تاريخ الإجهاد على الاستجابة غير الخطية للإجهاد لشبكات الفيبرين والكولاجين. وقائع الأكاديمية الوطنية للعلوم 110، 12197-12202 (2013).
نام، س.، هو، ك. هـ.، بوت، م. ج. & تشودري، أ. تأثير الاسترخاء المعزز بالضغط على المرونة غير الخطية في هلام الكولاجين. وقائع الأكاديمية الوطنية للعلوم في الولايات المتحدة الأمريكية 113، 5492-5497 (2016).
جوه، ج. س. وآخرون. TEAD2 كعامل تنبؤي جديد لسرطان الكبد الخلوي. تقارير الأورام 43، 1785-1796 (2020).
بلانجي، أ. التنسينات هي منظمات متعددة الاستخدامات لإشارات Rho GTPase والتصاق الخلايا. بيولوجيا. خلية 109، 115-126 (2017).
ليفنتال، ك. ر. وآخرون. ربط المصفوفة يعزز تقدم الورم من خلال تعزيز إشارات الإنتجرين. خلية 139، 891-906 (2009).
جونز، م. ج. وآخرون. التنظيم غير السليم على النانو لمكونات الكولاجين ي disrupt التوازن الميكانيكي ويمهد الطريق لتليف الرئة. eLife 7، e36354 (2018).
ليو، سي. وآخرون. المنتجات النهائية المتقدمة للجليكاسيون كوسائط للتشابك الشاذ لمصفوفة خارج الخلية في نسيج الكبد المتندب. نات. بيو. ميد. إنج. 7، 1437-1454 (2023).
سينكوس، ر. وآخرون. الخصائص القصية اللزجة للآفات الثديية في الجسم الحي المقاسة بواسطة تصوير الرنين المغناطيسي المرن. تصوير الرنين المغناطيسي 23، 159-165 (2005).
لي، هـ. ب.، ستوورز، ر. و تشودري، أ. توسيع الحجم وتنشيط TRPV4 ينظمان مصير الخلايا الجذعية في بيئات ميكروية ثلاثية الأبعاد. نات. كوميونيك. 10، 529 (2019).
تشودري، أ. وآخرون. الهلاميات الهيدروجينية ذات الاسترخاء القابل للتعديل تنظم مصير الخلايا الجذعية ونشاطها. نات. ماتير. 15، 326-334 (2016).
ملاحظة الناشر: تظل شركة سبرينغر ناتشر محايدة فيما يتعلق بالمطالبات القضائية في الخرائط المنشورة والانتماءات المؤسسية.
تم إزالة الهوية من جميع العينات البشرية وتم إعفاؤها (الإعفاء 4). تم الحصول على عينات الكبد البشري من مركز أبحاث السكري في ستانفورد (SDRC)، شبكة المتبرعين الغربية (DNW)، بنك الأنسجة في ستانفورد ومركز معالجة وتخزين العينات السريرية (CBRPC) من مركز أبحاث الكبد في بيتسبرغ (PLRC). تم الموافقة على ذلك من قبل مجلس مراجعة المؤسسات في جامعة ستانفورد (IRB، 67378) ومجلس مراجعة مركز أبحاث الكبد في بيتسبرغ. تم تقييم علم الأنسجة للالتهاب النخري، وتضخم الخلايا الكبدية، ورد الفعل القنوي والتليف بواسطة أخصائي أمراض الكبد بطريقة معمية، وتم تقديم درجات نشاط مرض الكبد الدهني غير الكحولي (NAS). تم تلخيص المعلومات التفصيلية عن المتبرعين، بما في ذلك الجنس، العمر، التشخيص ودرجة NAS، في الجدول التكميلي 1.
دراسات الحيوانات
تم إجراء جميع التجارب على الحيوانات وفقًا للإجراءات التجريبية المعتمدة من قبل لجنة رعاية واستخدام الحيوانات المؤسسية في جامعة ستانفورد ومركز بالو ألتو الطبي. تم الحفاظ على الفئران في درجات حرارة ونطاقات رطوبة تتراوح بين 20 إلى و إلى 70%، على التوالي. تم وضع الفئران في أقفاص قياسية تحتدورات الضوء/الظلام مع الوصول الحر إلى الماء والطعام ما لم يُذكر خلاف ذلك. تم وضع الفئران على علف التحكم أو نظام غذائي عالي الدهون (FFD)بروتينسمين والكربوهيدرات، AIN-76A) مكمل بشراب الذرة عالي الفركتوز في مياه الشرب بتركيز نهائي منلمدة تصل إلى 14 أسبوعًا، أو HiAD (المعدة عن طريق طهي FFD عندلمدة 20 دقيقة) كما تم وصفه سابقًامكمل بماء عالي الفركتوز. تم شراء ذكور الفئران من نوع C57BL/6J (التي تتراوح أعمارها بين 8 إلى 10 أسابيع) من مختبر جاكسون. RAGEتم إهداء الفئران على خلفية C57B6 من قبل ب. أرنولد. RAGEتم إنتاج الفئران عن طريق التهجينفئران مع فئران ألبومين-كري (مختبر جاكسون) لعدة أجيال. ذكرفئران وتم استخدام الفئران التي تتراوح أعمارها بين 8 إلى 10 أسابيع. لتوليد فئران ترانسجينية من خلايا الكبد AGER1 (Ddost)، تم حقن الفئران البرية بفيروس مرتبط بالأدينوفيروس 8 (AAV8) – بروتين فلوري أخضر (AAV8-control) أو AAV8-غلوبولين ربط الثيروكسين-AGER1 (AAV8-AGER1).نسخ الجينوم، Vector BioLabs) في نهاية الأسبوع الخامس من التغذية (تم الإبلاغ عن مبررات الاستهداف المحدد في الخلايا الكبدية سابقًا)لدراسة تثبيط تكوين AGE أو الربط المتقاطع للبروتينات AGE، تم حقن الفئران البرية التي تغذت على HiAD يوميًا عن طريق البطن بمادة هيدروكلوريد البيريدوكساين (سيغما-ألدريتش) (60 ملغ لكل كغ، يوميًا).الاجبريوم (ALT-711) (سيغما-ألدريتش، 1 ملغ لكلأو المركبة (Tris-HCl)، بدءًا من الأسبوع الخامس من التغذية. في وقت القتل الرحيم، تم التقاط صور للكبد، وتم تسجيل عدد وحجم الآفات على السطح.
حقن الوريد الذيل الهيدروديناميكي وتحضير البلازميد
تم توصيل البلازميدات المسرطنة إلى كبد الفأر عن طريق حقن الوريد الذيل الهيدرو ديناميكي كما تم وصفه سابقًا.. باختصار، pT3-EF1-h-hMET، pT3-EF1 h-WT- -كاتينين-مايك-علامة، pT3-EF1-ه-S45Y-طافح--كاتينين-مايك-تاج و pCMV/SB ترانسفوزاز كانت من مختبر S. P. S. Monga. تم تنقية البلازميدات المستخدمة في التجارب الحية باستخدام مجموعة التحضير ماكسي الخالية من الإندوتوكسين من إنفيتروجين (سيغما-ألدريش). مجموعة منمن pT3-EF5-hMET ومن pT3-EF5-WT--كاتينين-مايك أو pT3-EF5-S45Y--كاتينين-مايك، جنبًا إلى جنب معمنتم تخفيفه في 1 مل من محلول ملحي خالٍ من الإندوتوكسين (AdipoGen)، وتم تصفيته من خلال فلتر 0.22 مم (Millipore)، وتم حقنه في الوريد الذيل للفئران في 5 إلى 7 ثوانٍ في نهاية الأسبوع السابع من تغذية العلف، FFD أو HiAD. لتثبيط نشاط YAP، تم حقن الفئران بـ dn-TEAD2 (pT3-EF1-dnTEAD2، ) أو متجه التحكم السلبي (pT3-EF1 الفارغ) )، (من مختبر S. P. S. Monga) عن طريق حقن الوريد الذيل الهيدروديناميكي في نهاية الأسبوع السابع من تغذية الشوفان أو HiAD مع hMET، الطفرة S45Y--كاتينين و SB. لتقليل التعبير
تم حقن الفئران بمتجه يعتمد على CRISPR-Cas9 يربط بين اثنين من sgRNAs المستهدفة لإكسون 1 وإكسون 7 من Tns1 (pX333-TNS1، ) أو متجه التحكم السلبي (pX333 الفارغ، عن طريق حقن الوريد الذيل الهيدروديناميكي في نهاية الأسبوع السابع من تغذية الشوفان أو HiAD في نفس الوقت مع hMET، S45Y-mutant-تم توفير تسلسلات sgRNAs المستخدمة في هذه الدراسة في الجدول التكميلي 2.
تمت مراقبة الفئران ثلاث مرات في الأسبوع لأي علامة على الألم أو الضيق، وتم تقييم وزن الجسم ودرجة حالة الجسم بعد حقن الوريد الذيل الهيدروديناميكي. وتم euthanize الفئران على الفور إذا فقدت أكثر منمن وزن أجسامهم أو إذا كان لديهم درجة حالة جسمية تبلغ 2 أو أقل خلال تلك الفترة. لم يصل حجم الورم (المرئي) أبداً إلى أكثر من 3 مم.
علم الأنسجة، الكيمياء المناعية وقياس التركيز المبكر
تم قطع عينات الأنسجة المدمجة بالشمع إلىالأقسام، تم إزالة البارافين وإعادة ترطيبها. لاسترجاع المستضد، تم غلي الشرائح في محلول سترات ( ) باستخدام فرن ميكروويف على قوة عالية لمدة 5 دقائق ثم تبريده إلى درجة حرارة الغرفة. بعد الحضانة في مائيلإخماد البيروكسيداز الداخلي، تم غسل المقاطع في PBST (PBS مع توين-20 محلول الغسيل، محجوز مع 5% مصل الماعز (EMD Millipore) مخفف في PBST في درجة حرارة الغرفة لمدة ساعة واحدة وتم حضنه مع الأجسام المضادة الأولية المخففة فيمصل الماعز في PBST عندبين عشية وضحاها.
للتلوين المناعي النسيجي، تم تحضين الشرائح مع الأجسام المضادة الثانوية البيوتينية المناسبة (الجدول التكميلي 3) لمدة ساعة واحدة، ثم تمت معالجتها وفقًا لمجموعة صبغ البيروكسيداز القياسية ABC (ثيرمو فيشر ساينتيفيك) لمدة 30 دقيقة. تم صبغ الشرائح بـ 3،3′-ديامينوبنزيدين (أبكام) لمدة تتراوح بين 5 ثوانٍ إلى 5 دقائق وتمت صبغها المضاد بالهيماتوكسيلين (ثيرمو فيشر ساينتيفيك) لمدة 45 ثانية. تم مسح الصور باستخدام نظام لايكا أبيريو AT2 في مركز خدمات علم الأمراض/علم الأنسجة البشرية في ستانفورد. تم تحضين مقاطع متسلسلة مع الأجسام المضادة الأولية GS و MYC-tag، وتم عد مجموعة من الخلايا (على الأقل 20 خلية) إيجابية لكل من GS و MYC-tag كتركيزات مبكرة. الأجسام المضادة المستخدمة في هذه الدراسة موضحة في الجدول التكميلي 3.
قياس محتوى AGE
تم قياس AGEs باستخدام مجموعة OxiSelect Advanced Glycation End Product Competitive ELISA (Cell Biolabs) في المصل وخلط الكبد وفقًا لتعليمات الشركة المصنعة. باختصار، تم تجانس عينات الكبد بوزن 10 ملغ في PBS. بعد قياس تركيز البروتين،تم إضافة البروتين إلى لوحة ELISA ذات 96 بئرًا وتم حضنها لمدة ساعة واحدة في درجة حرارة الغرفة. بعد الحضانة مع الأجسام المضادة الثانوية المرتبطة بـ HRP المضادة لـ AGE، تم إيقاف التفاعل باستخدام محلول الإيقاف، وتم قراءة الألواح عند 450 نانومتر.
استخراج RNA، النسخ العكسي و RT-qPCR
وفقًا لتوصيات الشركة المصنعة، تم استخراج RNA الكلي من أنسجة الكبد والخلايا المجمدة بسرعة باستخدام مجموعة RNeasy الصغيرة (Qiagen). تم إنشاء cDNA التكميلي من كمية متطابقة من RNA باستخدام مجموعة تخليق cDNA iScript (Bio-Rad). تم استخدام مجموعة PowerUp SYBR Green PCR Master Mix (Applied Biosystems) لإجراء PCR الكمي مع النسخ العكسي (RT-qPCR) على جهاز 7900 HT (Applied Biosystems)، وتم تقييم البيانات باستخدامالتقنية. تم استخدام Arbp (المعروف أيضًا باسم RplpO) و GAPDH كتحكم داخلي لتوحيد البيانات في الفأر والإنسان، على التوالي. قائمة بتسلسلات البرايمر المستخدمة في هذه الدراسة موضحة في الجدول التكميلي 4.
AFM
تم إجراء القياسات على أنسجة الكبد المجمدة على أكباد مدفونة في مركب OCT (ساكورا)، وتم تجميدها بسرعة عن طريق الغمر المباشر في النيتروجين السائل وقطعها إلىأقسام على جهاز التبريد ليكا CM1900-13. تم الاحتفاظ بالعينات في خليط مثبطات البروتياز أثناء تحليلات AFM (روش دياغنوستيك). من أجل رسم الخرائط الهيدروجيل تم تحييد الكولاجين أو الكولاجين المعدل بواسطة AGE بـدي إم إي إم وتم الاحتفاظ بالهيدروجيل طوال الليل على تم استخدام نظام Bruker Resolve BioAFM لأخذ القياسات (Bruker). بالنسبة للضغط، تم تعديل الكانتيلاتور المصنوع من نيتريد السيليكون بواسطة Novascan Tech. ) مع طرف كروي من زجاج البورسليكات (قطر 10 و على التوالي) تم استخدامها.
تمت معايرة الأذرع المتدلية لكل جلسة باستخدام طريقة الاهتزاز الحراري. تم إجراء خرائط القوة باستخدام AFM علىالحقول. شملت كل مجموعة تجريبية ما لا يقل عن أربعة عينات مختلفة من البشر أو الفئران، مع قسمين من كل منها، وثلاث مناطق مختلفة تم إنشاؤها لكل قسم. بالنسبة لرسم الخرائط الهلامية، شملت كل مجموعة ما لا يقل عن أربعة هلامات مختلفة، وخمس مناطق مختلفة تم إنشاؤها لكل هلام. تم إجراء تحليلات البيانات باستخدام نموذج هيرتز في NanoScope Analysis v.1.9 و Mountains SPIP v.9.
تحليل الريومترية لكبد الإنسان والفأر
تم تحسين القياسات لتقييم معامل التخزين، معامل الفقد، زاوية الفقد واسترخاء الإجهاد استنادًا إلى الطرق الموصوفة سابقًا.باختصار، تم إعداد عينات الكبد باستخدام مثقاب بقطر 8 مم (إنتيغرا ميلتكس). تراوحت ارتفاعات الشرائح من 3 إلى 5 مم في الحالة غير المضغوطة. تم الحفاظ على رطوبة العينات خلال جميع التجارب باستخدام DMEM. تم إجراء قياسات اللزوجة باستخدام جهاز قياس اللزوجة ARES-G2 (أجهزة TA) في درجة حرارة الغرفة باستخدام برنامج TA TRIOS الإصدار 5.1.1 (أجهزة TA). بالنسبة لجميع القياسات، تم خفض اللوح العلوي في البداية ليلامس العينة، وتم تطبيق قوة ابتدائية اسمية قدرها 0.01 نيوتن. ) تم تطبيقه لضمان الاتصال اللاصق للعينة مع الألواح. تم أخذ القياسات أولاً باستخدام اختبار مسح زمني ديناميكي ( إجهاد ثابت، تردد التذبذب 1 راديان، تم أخذ القياسات لمدة 600 ثانية)، ثم استرخاء الإجهاد (الجهد الأولي، القياسات التي تم أخذها لمدة 600 ثانية).
قياس الكولاجين الكلي وغير القابل للذوبان
تم إجراء اختبار الهيدروكسي برولين لإجمالي كولاجين الكبد كما تم وصفه سابقًاباختصار، تم تجانس عينات الكبد وتفكيكها في 6 N HCl. ثم تم تجفيف العينات المحللة وغسلها ثلاث مرات بالماء المنزوع الأيونات، تلا ذلك حضانة في محلول أكسدة الكلورامين T بتركيز 50 مM لمدة 20 دقيقة في درجة حرارة الغرفة. تم حضانة العينات مع حمض البيركلوريك بتركيز 3.15 M (سيغما-ألدريتش) لمدة 5 دقائق، ثم مع-ثنائي ميثيل أمين بنزالدهيد (سيغما-ألدريتش). تم قياس امتصاص كل عينة.
للكولاجين غير القابل للذوبان، تم أولاً هرس الكبد أو هلام الكولاجين في حمض الأسيتيك 0.5 م بنسبة 1:4 (على سبيل المثال،لـ 200 ملغ من الكبد) لصنعخلاصة الكبد. بعد ذلك،منتم إضافة مستحلب الكبد إلى 1 مل من حمض الأسيتيك 0.5 م وتم تدوير الأنابيب عندبين عشية وضحاها. تم طرد العينات في جهاز الطرد المركزي عندلمدة 30 دقيقة لجمع الحبيبات، مع إعادة تعليقها في البيبسينفي 0.5 م من حمض الأسيتيك) وتم حضنه فيبين عشية وضحاها. في اليوم التالي، تم طرد العينات مركزيًا وجُمعت الكريات. ثم تم تحليل العينات باستخدام اختبار الهيدروكسي برولين، كما تم وصفه سابقًا..
تحضير AGE-BSA
تم تحضير AGE-BSA كما تم وصفه سابقًا.باختصار، تم إذابة الجليكوالدهيد (سيغما-ألدريتش) في BSA/PBS إلى تركيز نهائي قدره 33 مللي مول. تم حضن المحاليل في لمدة 72 ساعة، تليها غسيل كلى ضد PBS. تم تعقيم المحاليل التي تم غسيلها.الفلاتر، والعيّنات تم تخزينها في.
تحضير الكولاجين المعدل بواسطة AGE والهلام
الكولاجين من النوع الأول (تيلوببتيد سليم، كورنينج، 354236، كولاجين I من كورنينج، ذيل الجرذ، تم استخدامه في جميع التجارب) تم حضنه معفي AGE-BSAحمض الأسيتيك (ميرك) للحصول علىمحلول الكولاجين فيلمدة 4 أسابيع. تم خلط BSA مع الكولاجين كعينة تحكم. كلوريد الألجيبريوم (ALT-711، ) تم إضافته كمثبط لربط AGE. تم بوليمرة هلام الكولاجين عن طريق الخلط محلول الكولاجين المعدل أو غير المعدل بـ AGE
PBS وتم تحييده بـ (ميرك) وتم حضنه في لمدة 90 دقيقة مما يؤدي إلى تشكيل الهلام. بالنسبة لمعظم الهلام،تم استخدام الكولاجين.
تحضير الألجينات
وفقًا للشركة المصنعة، فإن ألجينات الصوديوم النقية للغاية ذات الكتلة الجزيئية المنخفضة (Provona UP VLVG، NovaMatrix) بكتلة جزيئية تبلغتم استخدامه للركائز السريعة الاسترخاء. بالنسبة للركائز البطيئة الاسترخاء، تم استخدام ألجينات الصوديوم (عالي الوزن الجزيئي) (FMC Biopolymer، Protanal LF 20/40، عالي الوزن الجزيئي، 280 كيلودالتون). تم معالجة الألجينات بالفحم النشط، وتم غسيلها ضد الماء المنزوع الأيونات لـأيام (حد قطع الكتلة الجزيئية، )، تم تصفيته بالترشيح المعقم، مجفف بالتجميد ثم أعيد تكوينه إلى في DMEM خالي من المصل (جيبكو). أدى استخدام الألجينات ذات الوزن الجزيئي المنخفض/المرتفع إلى لزوجة مرنة عالية/منخفضة في الشبكات البوليمرية المتشابكة.
تصوير ألياف الكولاجين
تم إزالة الخلايا من كبد الفئران في الموقع باستخدام المنظفات (w/v)، صوديوم ديكسيكولات، 250 مل لكل فأر) وماء (50 مل لكل فأر) حقن بسرعة مضخة بعد عملية التروية النهائية، تم إزالة الكبد وغسله طوال الليل في PBS. بالنسبة لهلام الكولاجين المعدل بـ AGE، تم إعداد العينات كما هو موصوف سابقًا. تم تصوير الهلام بعد يوم واحد من التكوين.
للتصوير باستخدام SHG، تم تصوير جميع العينات باستخدام ميكروسكوب لايكا TCS SP5 متعدد الفوتونات أو ميكروسكوب لايكا ستيلاريس 8 DIVE العمودي. تم ضبط طول موجة الإثارة على 840 نانومتر، وتم استخدام انبعاث نطاق ضيق يتم التحكم فيه بواسطة شق للكشف عن إشارة التوليد الثانوي (SHG) للكولاجين. تم تسجيل الصور باستخدام ميكروسكوب ليزر ماسح مقلوب (Leica TCSSP8) مزود بـعدسة غمر الماء للتصوير الانعكاسي المجهري.تم استخدام ليزر بطول موجي 488 نانومتر لإضاءة العينة، وتم الكشف عن الضوء المنعكس باستخدام كواشف أنبوب الضوئيات المتعددة (PMT). كانت المسحات عند 1,024بكسلات، وجميع الصور تم التقاطهافي العينات. تم إجراء قياسات الكولاجين باستخدام برنامج CT-Fire (الإصدار 2.0 بيتا) (https://loci.wisc.edu/البرمجيات/ctfire) و ImageJ الإصدار 1.53t (https://imagej-nih-gov.stanford. idm.oclc.org/ij/).
تكوين هيدروجيل IPN ثلاثي الأبعاد
تم نقل الألجينات إلى أنبوب إيبندورف سعة 1.5 مل (أنبوب بوليمر) وتم الاحتفاظ به على الثلج لكل هلام لزج مرن. بالنسبة لـ rBM-IPNs، تم خلط الألجينات 30 مرة قبل إضافة rBM (كورنينغ) عندتم إنشاء شبكات الكولاجين المتشابكة عن طريق تخفيف وتحييد هلام الكولاجين المعدل بـ AGE أو غير المعدل بـ AGE معدي إم إي إم و 1 م NaOH (ميرك) عند. كانت جميع الركائز بتركيز نهائي من الألجينات rBM أو الكولاجين بعد إضافة DMEM إضافي. تم خلطه باستخدام الماصة، وتم الاحتفاظ بالمزيج الناتج على الثلج. تم إضافة كبريتات الكالسيوم إلى محاقن لور لوك سعة 1 مل (كول-بارمر) وتم تخزينها على الثلج للحفاظ على ثوابت يونغ المستمرة للركائز ذات اللزوجة العالية والمنخفضة. تم تقسيم خلطات البوليمر إلى محاقن لور لوك فردية سعة 1 مل (محاقن البوليمر) وتم وضعها أيضًا على الثلج. تم ربط محقنة البوليمر بمحقنة كبريتات الكالسيوم لإنشاء هلام. تم دمج المحلولين بسرعة باستخدام 30 ضخة على مقبض المحقنة، وتم وضع المزيج الناتج في بئر من صفيحة Lab-Tek ذات الثمانية آبار (ثيرمو فيشر ساينتيفيك) التي تم تغليفها مسبقًا بـ rBM. بعد نقل طبق Lab-Tek إلى تم السماح للجيل بالتشكل لمدة ساعة واحدة قبل إضافة وسط كامل.
التوصيف الميكانيكي للبوليمرات المتشابكة
تم إجراء تجارب الريولوجيا باستخدام ريو متر AR2000EX (TA Instruments) الذي يتحكم في الإجهاد. تم إيداع الشبكات البوليمرية المتشابكة مباشرة على اللوحة السفلية من بيلتييه لاختبار الريولوجيا. ثم تم الاتصال بالهلام ببطء بواسطة لوحة مسطحة بقطر 25 مم، مما أدى إلى إنشاء هلام على شكل قرص بقطر 25 مم. لوقف الجفاف، تم تطبيق زيت معدني (سيغما-ألدريتش) على الهلام. الحواف. كانت معاملات التخزين والفقد قد توازنت بحلول الوقت الذي انتهى فيه مسح الزمن، والذي كان عند و ضغط.
للتجارب المتعلقة بتخفيف الإجهاد، بعد مسح الزمن، تم تطبيق إجهاد ثابت قدرهتم تطبيقه على الجل فيوتم تسجيل الضغط الناتج على مدار 4 ساعات.
زراعة الخلايا، النقل الجيني ووساطة CRISPR-Cas9 لـ TNS1 والإنتغرينإسقاط
تم زراعة خطوط خلايا سرطان الكبد البشرية Huh7 (هدية من P. Sarnow) وHep3B (مشتراة من ATCC) في وسط DMEM عالي الجلوكوز (Gibco) مع 10% مصل بقري جنيني (FBS، Gibco) و1% بنسلين-ستربتوميسين (Life Technologies). تم زراعة جميع الخلايا فيفي.
تم تقليل TNS1 في خلايا Huh7 و Hep3B باستخدام sgRNAs لـ TNS1 أو الإنتغرين sgRNAs. تم استخدام تسلسل sgRNA كتحكم سلبي. تم استنساخ sgRNAs في pMCB306 (بلازميد Addgen 89360، ناقل تعبير sgRNA مع GFP ومقاومة للبومايسين)، ثم تم نقلها معًا إلى الخلايا مع lentiCas9-Blast (بلازميد Addgen 52962، يعبر عن بروتين Cas9 من Streptococcus pyogenes المحسن للشفرة البشرية ومقاومة للبلستيسيدين من محفز EFS). تم اختيار الخلايا المنقولة بواسطة البومايسين واختبارها لـ TNS1 أو الإنتغرين.التعبير بعد يومين من النقل الجيني. قائمة بتسلسلات sgRNAs المستخدمة في هذه الدراسة موجودة في الجدول التكميلي 2.
بالنسبة لاختبارات TNS1 المحذوفة من مجال PTB (dd-TNS1)، تم استنساخ dd-TNS1 أو TNS1 الكامل الطول في متجه tdTomato-N1 (هدية من S.-H. Lo). تم نقل خلايا Huh7 بهذه البلازميدات وزراعتها لمدة 24 ساعة قبل التضمين في هيدروجيلات IPNs.
تم نقل خلايا Huh7 أو Hep3B باستخدام بلازميدات تحتوي على TKS5 البشري (المعروف أيضًا باسم SH3PXD2A) مع علامة mNeonGreen أو mScarlet (هدية من L. Hodgson) لجميع تحليلات الغزوات.
تغليف الخلايا ثلاثي الأبعاد في الشبكات البوليمرية المتداخلة
لتحليل تنشيط YAP، وتكوين الانفادوبوديا، والتكاثر، تم تجويع خلايا Huh7 من السيروم طوال الليل وتغليفها في IPNs. باختصار، تم غسل الخلايا بمحلول PBS، وتم تحللها باستخدام 0.05% تريبسين/EDTA، وغسلت مرة واحدة، ثم تم الطرد المركزي وإعادة تعليقها في وسط خالٍ من السيروم. تم تحديد تركيز الخلايا باستخدام جهاز عد الخلايا Vi-Cell Coulter (بيكمان كولتر). بعد خلط ماتريجيل مع الألجينات، تمت إضافة الخلايا إلى هذا المزيج البوليمري وتم إيداعها في حقنة مبردة. ثم تم خلط المحلول بعنف مع محلول يحتوي علىوتم إيداعه في آبار زجاج غطاء مقسم (LabTek). كانت التركيز النهائي لماتريجيل والألجينات و ، على التوالي. و 50 مللي مول تم استخدامها لتوليد صلابة متنوعة من IPNs معو 5 كيلو باسكال، على التوالي. كانت التركيز النهائي للخلايا هوخلايا لكل مل من IPN. تم تجليد الهلام المحمل بالخلايا في حاضنة عندولمدة 60 دقيقة ثم تم زراعتها في وسط DMEM يحتوي على 10% FBS. بعد يوم واحد، تم جمع الخلايا لتحليل RT-qPCR، وWestern blotting، وتحليل التلوين المناعي.
المثبطات
تم استخدام المثبطات في زراعة الخلايا ثلاثية الأبعاد بالتركيزات التالية:Y-27632 لتثبيط ROCK (Abcam);blebbistatin (Abcam) لتثبيط الميوسين II; والأجسام المضادة الأحادية النسيلة المثبطة لـ– (Abcam، P5D2). كانت ضوابط المركبات وحدها لهذه المثبطات كما يلي: DMSO لـ blebbistatin، وlatrunculin-a؛ ماء منزوع الأيونات لـ Y-27632؛ وIgG غير المحدد (Sigma-Aldrich، I5381) للأجسام المضادة المثبطة لـ-. تم إضافة Y-27632 وblebbistatin مباشرة إلى وسط الزراعة. تم حاضنة الجسم المضاد المثبط لـ– مع خلايا Huh7 على الثلج لمدة ساعة واحدة قبل التضمين في IPNs وتم إضافته مباشرة إلى وسط الزراعة.
RNA-seq، المعلوماتية الحيوية وتحليلات KEGG
تم تغذية فئران RAGE (النوع البري) بالطعام، FFD أو HiAD لمدة 14 أسبوعًا. تم حقن مجموعة من الفئران التي تغذت على HiAD يوميًا داخل البطن بـ PM. تم وضع مجموعة من الفئران على HiAD لمدة 14 أسبوعًا كما
تم وصفه سابقًا. تم إعداد RNA من 2-3 فئران لكل مجموعة، وتم إجراء RNA-seq في Novogene مع قراءات مزدوجة النهاية 150 نقطة أساس (نظام تسلسل NovaSeq 6000، Illumina). تم الحصول على تعليقات جين Gencode النسخة M18 ونسخة الجينوم المرجعي للفأر GRCm38 منhttps://www.gencodegenes.org/. تم استخدام أدوات Dropseq v.1.1249 لرسم بيانات التسلسل الخام إلى الجينوم المرجعي. تم استيراد مصفوفة العد المفلترة UMI الناتجة إلى R v.3.4.4. قبل تحليل التعبير التفاضلي باستخدام Limma v.3.40.650، تم تقدير الأوزان الخاصة بالعينة واستخدامها كمعاملات جنبًا إلى جنب مع المجموعات التجريبية كمتغير مشترك أثناء ملاءمة النموذج باستخدام Voom.– تم استخدام الاختبارات لتحديد الجينات المنظمة بشكل مختلف () بين جميع المجموعات التجريبية الممكنة. تم إجراء GSEA باستخدام طريقة GSEA المسبقة الترتيب ضمن قواعد بيانات KEGG باستخدام الأداة عبر الإنترنت g:Profiler (https://biit.cs.ut.ee/gprofiler/gost). تم إجراء خرائط حرارة RNA-seq والتجميع الهرمي غير المراقب باستخدام g:Profiler. بيانات RNA-seq متاحة تحت رقم الوصول إلى Gene Expression Omnibus GSE245016.
استخراج البروتين وWestern blotting
تم غسل الخلايا بمحلول PBS وتم تحللها باستخدام محلول RIPA. تم طرد المزيج، وتم جمع الطور العلوي. تم تحديد تركيزات البروتين باستخدام مجموعة اختبار بروتين BCA من Pierce (Thermo Fisher Scientific). تم إضافة مثبط البروتياز (Roche) ومثبط الفوسفاتاز (Roche) إلى جميع إجراءات التحلل المذكورة أعلاه، ومن عينات البروتين تم تحميلها على هلام SDS-polyacrylamide. تم نقل البروتينات إلى غشاء بولي فينيليدين فلوريد أو غشاء نيتروسليلوز، والذي تم حظره باستخدام 5% BSA في TBST ثم تم حضانته مع الأجسام المضادة الأولية عندطوال الليل. تم غسل البقع باستخدام TBST وتم حضانتها مرة أخرى مع الأجسام المضادة الثانوية المرتبطة بالبيروكسيداز. تم الكشف عن الإشارة عن طريق إضافة ركيزة كيميائية مضيئة معززة (Advansta) أو ركيزة كيميائية مضيئة SuperSignal West Pico PLUS (Thermo Fisher Scientific) وتم تصويرها باستخدام الفيلم أو نظام تصوير iBright CL1500 (Thermo Fisher Scientific). تم معالجة الصور وتحليلها باستخدام NIH ImageJ (v.1.53t) وبرنامج تحليل iBright v.5.2.1 (Thermo Fisher Scientific). تم عرض الأجسام المضادة المستخدمة في هذه الدراسة في الجدول التكميلي 3.
التلوين المناعي بالفلور وميكروسكوب
تم غسل مقاطع الكبد المجمدة أو الخلايا المدمجة في الجل مرتين بمحلول PBS وتم تثبيتها باستخدامبارافورمالدهيد عندطوال الليل. تم اختراق المقاطع في PBS مع 0.4% (v/v) Triton X-100 لمدة 10 دقائق. بعد الحظر باستخدام 5% مصل الماعز في PBST في درجة حرارة الغرفة لمدة ساعة واحدة، تم حضانة الخلايا مع الأجسام المضادة الأولية (الجدول التكميلي 3) المخففة فيمصل الماعز في PBST عندطوال الليل. تم غسل الشرائح ثم تم حضانتها مع الأجسام المضادة الثانوية في درجة حرارة الغرفة لمدة ساعة واحدة. تم غسل الأغطية بمحلول PBST بين الحضانة وتم تثبيتها باستخدام وسط تثبيت مضاد للتلاشي مع DAPI. تم التقاط صور الفلورسنت باستخدام أنظمة Leica TCS SP8، وLeica Stellaris 8 DIVE، وZeiss Airyscan2 LSM980. تم معالجة الصور باستخدام NIH ImageJ (v.1.53t). لتحديد دائري الخلايا ومساحة الخلايا، تم تحليل صور الخلايا المأخوذة بواسطة الميكروسكوب في ImageJ v.1.53t (https://imagej-nih-gov.stanford.idm.oclc.org/ij/). تم حساب الدائرية رياضيًا كـمساحة، تتراوح من 0 إلى 1، مع قيمة 1 كونها دائرة مثالية.
PLA
تم استخدام مجموعة اختبار الاقتران القريب Duolink (Sigma-Aldrich) لتحديد التفاعل بين TNS1 وintegrinفي خلايا Huh7. تم استخدام المواد الكيميائية وفقًا لتعليمات الشركة المصنعة، وتم تحسين الخطوات. باختصار، تم استخدام الأجسام المضادة المضادة لـ TSN1 وintegrinكأجسام مضادة أولية. ارتبطت الأجسام المضادة الأولية مع زوج من الأجسام المضادة الثانوية المعلمة بالأوليغونيوكليوتيد (PLA probes)، وانضمت أوليغو الموصلات الهجينة إلى PLA probes إذا كانت قريبة
من خلال وخلق الليغاز قالب DNA المطلوب لتكبير الدائرة المتدحرجة (RCA). ارتبطت أوليغو المعلمة بالتسلسلات التكميلية في الأمبليكون وأنتجت إشارات فلورية حمراء منفصلة يمكن رؤيتها بواسطة الميكروسكوب الفلوري (Leica Microsystems). تم استخدام برنامج NIH Image J (v.1.53t) لعد الإشارة، وتم استخدام المتوسطات للرسوم البيانية.
نمذجة المحاكاة
في هذه الدراسة، استخدمنا نموذج قائم على الوكلاء لمحاكاة الهيكل المنفصل لمصفوفات الكولاجين. تم توفير تفاصيل النموذج وجميع قيم المعلمات المستخدمة في النموذج في الطرق التكميلية والجدول التكميلي 5. المجال الحسابي مستطيل معفي الاتجاهاتو. يوجد شرط حدود دوري فقط في الاتجاهينو z. في المحاكاة، يتم تحديث حركات العناصر الأسطوانية في كل خطوة زمنية من خلال معادلة لانجفين ونظام تكامل أويلر. تم استخدام ثلاثة أنواع من المصفوفات في هذه الدراسة: مصفوفة ليفية؛ مصفوفة طويلة، ضيقة؛ ومصفوفة قصيرة، فضفاضة. يبدأ تجميع الألياف من خلال نواة الألياف البذور من خلال ظهور قطعة أسطوانية واحدة في مواقع عشوائية، تليها الإطالة حتىأومن خلال إضافة قطع دون اعتبار للتحلل. تم حساب تركيز الكولاجين الفعال باستخدام الحجم المحدد للكولاجين () هو. تم بناء المصفوفة الليفية مع روابط متقاطعة في غياب المجمعات (الشكل الممتد 4d، h). خلال تجميع المصفوفة الليفية، يتم ربط الألياف الفردية بواسطة روابط متقاطعة حيث يرتبط موقعان ربط بأي جزء من الألياف. لا يوجد تفضيل لزاوية الربط المتقاطع في هذه العملية. يتم تجميع مصفوفة الحزمة الضيقة الطويلة مع روابط متقاطعة في وجود المجمعات التي تربط الألياف الفردية بطريقة متوازية ومتداخلة في حزم ضيقة (الشكل الممتد 4g، i). تربط الروابط المتقاطعة الألياف داخل كل حزمة أو الألياف التي تنتمي إلى حزم مختلفة. يتم إنشاء مصفوفة الحزمة الفضفاضة القصيرة بواسطة المجمعات التي تربط الألياف في نهاياتها بزاوية محددة (الشكل الممتد 4e، f، j). بينما تكون المجمعات مرتبطة بشكل دائم بالألياف، يمكن أن تنفصل الروابط المتقاطعة عن الألياف بمعدل يزيد بشكل أسي مع زيادة القوة، وفقًا لقانون بيل. ترتبط الألياف بشكل دائم بحدود عمودية على الاتجاه(أي،الحدود الموجودة عندوالحدود الموجودة عند). بعد الانتهاء من تجميع المصفوفة، يتم تطبيقالضغط على الحدودفي الاتجاهبينما يتم تثبيت الحدود. بعد الوصول إلىالضغط، يتم الاحتفاظ بالضغط عند مستوى ثابت لقياس استرخاء الإجهاد.
التحليلات الإحصائية
تم إجراء ثلاثة تكرارات بيولوجية على الأقل لجميع التجارب الحية، وتم تكرار التجارب المخبرية على الأقل ثلاث مرات. تُعرض البيانات كمتوسط.تم إجراء التحليلات الإحصائية باستخدام برنامج GraphPad Prism الإصدار 10.0.3 (برنامج GraphPad). تم تقييم توزيع الطبيعية باستخدام اختبار كولموغوروف-سميرنوف. تم استخدام اختبار غير متزاوج ذو طرفين.تم استخدام اختبارات -tests وتحليل التباين الأحادي (ANOVA) مع اختبارات Tukey لتحليل البيانات ذات التوزيع الطبيعي. تم تحليل البيانات ذات التوزيع غير الطبيعي باستخدام اختبارات Wilcoxon rank-sum واختبارات Kruskal-Wallis مع اختبار Dunn.كان يُعتبر ذا دلالة إحصائية.
ملخص التقرير
معلومات إضافية حول تصميم البحث متاحة في ملخص تقارير مجموعة نيتشر المرتبط بهذه المقالة.
توفر البيانات
تم إيداع البيانات في قواعد البيانات العامة. بيانات تسلسل RNA متاحة تحت رقم الوصول GSE245016. مرجع الفأر الإصدار الرئيسي من الجينوم GRCm38 متاح على الإنترنت (https://www.gencodegenes.org/تم توفير بيانات المصدر مع هذه الورقة.
توفر الشيفرة
الرموز المستخدمة في الدراسة متاحة على GitHub (https://github.com/ ktyman2/liverCancer.git). 49. باتيل، ر. وآخرون. تأثير المنتجات النهائية المتقدمة للجليكاسيون الغذائية على كبد الفأر. PLoS ONE 7، e35143 (2012). 50. يان، ز.، يان، هـ. وأو، هـ. المحفز لبروتين ربط الثيروكسين البشري (TBG) يوجه تعبير الجين المنقول بكفاءة واستدامة في نمط محدد للكبد. جين 506، 289-294 (2012). 51. مويلينباخ، إ. أ. وآخرون. تفاعلات مثبط منتج الجليكاسيون المتقدم بيريدوكسامين ومضاد الأكسدةحمض -ليبوئيك على مقاومة الأنسولين في جرذ زوكير السمين. ميتاب. كلينيك. إكسب. 57، 1465-1472 (2008). 52. زيمان، س. ج. وآخرون. كاسر روابط المنتجات النهائية المتقدمة للجليكاسيون (ألاجبروم) يحسن وظيفة البطانة في المرضى الذين يعانون من ارتفاع ضغط الدم الانقباضي المعزول. مجلة ارتفاع ضغط الدم 25، 577-583 (2007). 53. أولريش، ب. وزانغ، إكس. التراجع الدوائي عن ربط البروتينات الناتج عن المنتجات النهائية المتقدمة للجليكوزيل. ديابيتولوجيا 40، S157-159 (1997). 54. زانغ، ج. وآخرون. عامل النسخ من نطاق TEA 4 هو الوسيط الرئيسي لنشاط البروتين المرتبط بـ yes في الأورام الكبدية في الفئران والبشر. المجلة الأمريكية لعلم الأمراض 189، 1077-1090 (2019). 55. بيريبليوك، م. وآخرون. تظهر كبد الفئران الطبيعي والليفية تليين الشد وتصلب الضغط: نموذج لميكانيكا الأنسجة الرخوة. PLoS ONE 11، e0146588 (2016). 56. بتايب، أ. وآخرون. إنزيم أكسيداز نيكوتيناميد أدينين ثنائي النوكليوتيد الفوسفات 4 في الخلايا الكبدية ينظم إشارات الإجهاد، والتليف، وحساسية الأنسولين خلال تطور التهاب الكبد الدهني في الفئران. جراحة الجهاز الهضمي 149، 468-480 (2015). 57. أونو، ي. وآخرون. ألبومين مصل البقر المعدل بالجليكوالدهيد يقلل من تعبير اللبتين في الخلايا الدهنية للفئران عبر مسار يعتمد على CD36. آن. ن. ي. أكاد. ساي. 1043، 696-701 (2005). 58. غيمارايش، إ. ل.، إمبسن، س.، جيرتس، أ. وفان غرانسفن، ل. أ. المنتجات النهائية المتقدمة للجليكاسيون تحفز إنتاج أنواع الأكسجين التفاعلية عبر تنشيط أكسيد NADPH في خلايا النجمة الكبدية الفأرية. ج. كبد. 52، 389-397 (2010).
الشكر والتقدير تم الحصول على عينات المرضى باستخدام خدمات مركز ستانفورد لأبحاث السكري، المدعوم من المعهد الوطني للسكري وأمراض الجهاز الهضمي والكلى التابع للمعاهد الوطنية للصحة تحت رقم الجائزة P30DK116074. نشكر أعضاء شبكة المتبرعين الغربية على تعاونهم وجميع المتبرعين بالأعضاء والأنسجة وعائلاتهم على منحهم هدية الحياة وهدية المعرفة من خلال تبرعهم. تم الحصول على عينات المرضى باستخدام خدمات مستودع ومعالجة العينات البيولوجية السريرية لمركز أبحاث الكبد في بيتسبرغ (PLRC)، المدعوم من منحة PLRC رقم P30 DK120531. نشكر S. Pneh و J. Zhang و R. Reguram و H. Park و P. Buiga على دعمهم الفني؛ و M. Walkiewicz على AFM؛ و J. Mulholland و K. Lee و G. X. Wang على المساعدة في التصوير. تم تنفيذ جزء من هذا العمل في مرافق ستانفورد المشتركة للنانو (SNSF)، المدعومة من مؤسسة العلوم الوطنية تحت الجائزة ECCS-2026822. تم تنفيذ جزء من هذا العمل في مرفق تصوير علوم الخلايا في ستانفورد (CSIF، RRID:SCR_017787)، المدعوم من أرقام الجوائز 1S10OD010580-01A1 و S1ORR02557401 و 1S10OD032300-01 من المركز الوطني لموارد البحث (NCRR). المحتويات هي مسؤولية المؤلفين فقط ولا تمثل بالضرورة الآراء الرسمية لـ NCRR أو المعاهد الوطنية للصحة. تم دعم هذا البحث من خلال تمويل منح NIH R01DK083283 و RO1CA277710 و 1RO1AG060726 (إلى N.J.T.)، ومنحة SPARK (جامعة ستانفورد إلى N.J.T.)، VA IO1 BX002418 (إلى N.J.T.) و NCI R37 CA214136 (إلى O.C.). تم تمويل الدراسة أيضًا جزئيًا من خلال منح NIH 1R01CA251155 و 1R01CA204586 إلى S.P.M. و R35GM136226 إلى L.H. و 1R01GM126256 إلى O.C. و T.K.
مساهمات المؤلفين: قام و.ف. و ن.ج.ت. بتصميم الدراسة. قام و.ف. بإجراء معظم التجارب. قام و.ف. و ك.أ. بإنشاء وقياس هيدروجيل الكولاجين-AGEs-IPN ونظام زراعة الخلايا ثلاثي الأبعاد IPN. قام و.ف. و ل.ف. بإجراء القياسات الميكانيكية لعينات بشرية وجرذان وهيدروجيل. قام و.ف.، ل.ف.، يوان لي، ك.ك.، د.س.، ج.م. و ي.و. بإجراء التجارب على الجرذان. قام م.ف.ر. و ت.ك. بابتكار وإجراء المحاكاة الحاسوبية. ساعد د.ك.-س.ج.، ج.ت. و إ.ج.إ. في إنشاء بلازميد CRISPR-Cas9 ونظام توصيل HDI. قام و.ف.، ن.أ.، ر.د.، أ.س.، د.ج.، ج.و.س.، س.ب.م. و ن.ج.ت. بجمع عينات الكبد البشري والتشخيص المرضي. قدم س.هـ.ل. بلازميدات TNS1 وتعليقات نقدية. قدم ل.هـ. بلازميدات TKS5 وتعليقات نقدية. ساعد ف.س. في التحليلات الإحصائية. قام و.ف.، ل.ف. و يوان لي بإنشاء الأشكال. كتب و.ف. و ن.ج.ت. المخطوطة بمشاركة من ت.ك.، أ.س.، ر.ج.و. و ر.ل.ب. تم الحصول على التمويل من س.ب.م.، ت.ك.، أ.س. و ن.ج.ت. قدم جميع المؤلفين المشورة، وقرأوا ووافقوا على المخطوطة النهائية.
تُدرج المصالح المتنافسة W.F. وN.J.T. وO.C. كمخترعين في براءة اختراع (WO/2023/102546) تتعلق بهذا البحث. يعلن المؤلفون الآخرون عدم وجود مصالح متنافسة.
معلومات إضافية
معلومات إضافية النسخة الإلكترونية تحتوي على مواد إضافية متاحة فيhttps://doi.org/10.1038/s41586-023-06991-9. يجب توجيه المراسلات والطلبات للحصول على المواد إلى ناتالي ج. توروك. تُعرب مجلة نيتشر عن شكرها لكونستانتينوس كونستانتوبولوس والآخرين على مراجعة الأقران. المراجعين المجهولين، لمساهمتهم في مراجعة الأقران لهذا العمل. تقارير مراجعي الأقران متاحة. معلومات إعادة الطباعة والتصاريح متاحة علىhttp://www.nature.com/reprints.
بيانات موسعة تتعلق بالشكل الرئيسي 2d-g
الشكل البياني الممتد 1 | تطور الفئران على نظام HiAD بؤر متحولة في وقت مبكر وبأعداد أكبر بعد الحقن الهيدرو ديناميكي، وتظهر لزوجة أعلى تعتمد على AGEs (متعلقة بالشكل الرئيسي 2). أ-ج. بيانات إضافية لنقطة الوقت المبكرة (4 أسابيع بعد HDI) نموذج NASH/HCC. تم إطعام الفئران لمدة 7 أسابيع إما طعام عادي، أو FFD أو HiAD. تم إجراء الحقن الهيدرو ديناميكي (HDI) باستخدام ناقلات تعبر عن جين MET البشري. ) وناقل الترانسبوزاز الجميلة النائمة (SB) معًا مع ناقل يعبر عن إما النوع البري البشري-كاتينين ( pT 3 -EF5a--كاتينين-مايك، مجموعة التحكم) أو الطفرة pT 3 -EF5a-S45Y--كاتينين-مايك، مجموعة الطفرات). بعد أربعة أسابيع من HDI، تم التضحية بالفئران. أ. كبد الفئران التي تغذت على العلف العادي، FFD و HiAD بعد HDI. الأسهم، آفات صغيرة. مقياس الرسم، 1 سم. ب. قياس الآفات الكبدية المرئية بعد 4 أسابيع من HDI ( ). ج. الهيماتوكسيلين والإيوزين (H&E) على شرائح متتالية تتوافق مع الشكل الرئيسي 2ب. مقياس الرسم، . د-ف. بيانات إضافية عن النموذج بعد 7 أسابيع من حقن HD. صور تمثيلية (د) وقياس (هـ) للآفات الكبدية المرئية (على التوالي). رؤوس الأسهم، آفات. مقياس الرسم،صور، تتوافق مع صور GS/myc في الشكل الرئيسي 2e. شريط القياس،تمثل أشرطة الخطأ المتوسطتشير الأرقام s.e.m. n إلى الفئران الفردية. تم استخدام تحليل التباين الأحادي (ANOVA) تليه اختبار المقارنات المتعددة لتوكاي.
تحفيز AGER1: بيانات موسعة تتعلق بالشكل الرئيسي 2h-o
الشكل البياني الممتد 2 | تحفيز AGER1 أو حذف RAGE في الخلايا الكبدية يعكس الاسترخاء السريع للتوتر، وظهور بؤر متحولة. أ-ب. بيانات إضافية لنموذج HCC المرتبط بـ NASH مع تحفيز AAV8mediated AGER1. منحنيات الاسترخاء التوتري التمثيلية (أ) مع أو بدون تحفيز AGER1. صور H&E (ب)، تتوافق مع صور GS/myc-tag في الشكل الرئيسي 2o. مقياس الرسم،. ج-ج. بيانات إضافية لنموذج HCC المرتبط بـ NASH في خلايا الكبد التي تم حذف RAGE بشكل محدد (RAGE ) الفئران. مخططات الـ HDI باستخدام إنزيم النقل hMet/SB مع النوع البري (التحكم) أو الطفرة-كاتينين في RAGE أو تم إجراء صبغة H&E و GS/myc المناعية على شرائح متتالية، الدوائر تمثل تظهر الأسهم الخلايا التي تم نقلها. شريط القياس،تحديد كمية البؤركل منها، 20 منطقة لكل فأر). كانت مستويات AGEs في الكبد أقل في RAGEفي الفئران (كل منها). دراسات الريومترية،صلابة الكبد ) و تم تقييم اللزوجة المرنة (h-j) ( يمثل الأطر الزمنية التي يتم فيها تخفيف الضغط إلى نصف قيمته الأصلية؛ زيادة في يدل على لزوجة مرنة أقل، لم يكن هناك فرق كبير في الصلابة، ولكن تم تحسين اللزوجة المرنة في RAGEفئران (كل منها). تمثل أشرطة الخطأ المتوسط s.e.m. n تشير إلى الفئران الفردية. تم استخدام تحليل التباين الأحادي (ANOVA) تليه اختبار المقارنات المتعددة لتوكاي.
الشكل البياني الممتد 3 | انظر الصفحة التالية للتعليق.
مقالة
الشكل البياني الممتد 3 | شبكات الكولاجين في المرضى، نماذج الفئران والهيدروجيل ثلاثي الأبعاد. أ. تم تحليل ألياف الكولاجين في عينات كبد الإنسان (صحي، NASH، NASH+T2DM) بواسطة مجهر توليد التوافقيات الثانية (SHG). المناطق التي تحتوي على تجميع موضحة في مجموعة NASH + T2DM (السهم الأبيض). السهم الأحمر يشير إلى قطرات الدهون. عرض أقصى للشدّة لمجموعة Z لسمك القسم من (صور تمثيلية من ثلاثة مواضيع فردية. شريط القياس، ). ب. في صور كبد الفئران، تظهر شبكة الكولاجين مظهرًا أكثر تكتلاً (السهم الأبيض) في مجموعة HiAD+vehicle، بينما تظهر الألياف بشكل أكثر تنظيمًا بعد علاج PM وALT أو بعد إعادة تكوين AGER1. أقصى شدة لمجموعة Z-stack لسمك القسم من (صور تمثيلية من ثلاثة فئران فردية. شريط القياس، يمكن ملاحظة رقع محلية ذات معاملات يونغ أعلى في الكولاجين الهيدروجيل (الأسهم الحمراء). د. تم تصوير نطاقات معامل المرونة في هيدروجيل الكولاجين أو الكولاجين + AGEs. هـ. رسم وتوزيع مناطق الهسترسيس (المرونة اللزجة). و. ترددات أعلى لزيادة المرونة اللزجة في هيدروجيل الكولاجين + AGEs. ن=5 هيدروجيل/كل مجموعة، 3 مناطق تمثيلية/كل هيدروجيل. بالنسبة لجميع الخرائط، تشير العلامات x إلى المناطق التي لم يكن من الممكن تحليل منحنيات ضغط AFM بشكل موثوق. شريط القياس،لتحليل التأثير المحتمل لـ ALT على المصفوفة، تم دراسة هلام الكولاجين +/- ALT-711 بواسطة SHG (ج، شريط القياس، ). جل من تم تحميلها للاختبار اللزج لتقييم الصلابةمعامل التخزين) واللزوجة المرنة (i، زاوية الفقد؛ j، ) ، ( كل منها). تمثل أشرطة الخطأ المتوسطتشير الأرقام s.e.m. n إلى تجارب مستقلة. تم استخدام اختبار t ثنائي الطرف وغير المقترن للتحليل الإحصائي. ns، غير دال.
الشكل البياني الممتد 4 | انظر الصفحة التالية للتعليق.
مقالة
الشكل البياني الممتد 4 | نموذج حسابي قائم على الوكلاء لمصفوفة ليفية. أ-ج. يتم تبسيط الألياف (رمادي، “f”)، والروابط المتقاطعة (أصفر، “xl”)، والمجمعات (أحمر، “bu”) بواسطة مقاطع أسطوانية في النموذج. تربط الروابط المتقاطعة أزواج الألياف دون تفضيل لزاوية الربط عن طريق مواقع الربط في أي جزء من الألياف. بالمقابل، تربط المجمعات أزواج الألياف بزاوية محددة ثم تحافظ على الزاوية. يقع موقع الربط الأول للمجمعات دائمًا في نهاية الألياف، ويقع موقع الربط الثاني في جزء محدد من الألياف. يتم تعريف الجزء المحدد المتاح للربط بواسطة حدين، و ، بين 0 و 1. انحناءات متنوعة ( ) وامتدادي تحافظ الصلابة على الزوايا والأطوال بالقرب من قيم التوازن الخاصة بها، على التوالي. يتم سرد الصلابة والأطوال والزوايا التوازنية في الجدول التكميلي 5.d-g. أنواع مختلفة من المصفوفات. بدون روابط، تتكون المصفوفة من ألياف فردية مرتبطة ببعضها البعض، مما يؤدي إلى حجم شبكة صغير (d). مع الروابط التي ترتبط فقط بنهايات الألياف، تتكون المصفوفة من حزم قصيرة. اعتمادًا على الزاوية بين الألياف المتصلة بالروابط، يتغير شكل الحزم القصيرة (e,f). مع الروابط التي ترتبط بنهاية ألياف واحدة ومنتصف ألياف أخرى، تتكون المصفوفة يتكون من حزم أطول (g). يمكن للروابط المتقاطعة ربط الألياف داخل كل حزمة أو الألياف التي تنتمي إلى حزم مختلفة.-ج: لقطات لمصفوفات مستخدمة في القياسات الريولوجية. طول الألياف المستخدمة لإنشاء المصفوفات هو إما (الصف العلوي) أو (الصف السفلي). (الصور المعروضة تمثل 4 محاكاة مستقلة). هـ. هياكل المصفوفة ذات شبكة متجانسة دقيقة، والتي تم إنشاؤها بدون مجمعات كما هو موضح في د. أنا. هياكل المصفوفة تتكون من حزم طويلة ومشدودة بأطوال مختلفة. الألياف متصلة بشكل متوازي بواسطة المجمعات كما هو موضح في ج. يمكن تغيير طول الحزم عن طريق التغيير في و . إذا كان موقع الربط الثاني يمكنه الارتباط فقط بجزء قريب من أحد طرفي الألياف (على سبيل المثال، )، متوسط طول الحزم يصبح كبيرًا. بالمقابل، إذا كان الربط يمكن أن يحدث فقط بالقرب من الطرف الآخر من الألياف (على سبيل المثال، ) ، أطول قليلاً من طول الألياف الفردية. هياكل المصفوفة تتكون من حزم قصيرة وفضفاضة بزاويا تجميع مختلفة،. في هذه الحالات، يرتبط كلا موقعَي الربط للموحدات بنهاية الألياف (أي، ) كما هو موضح في و يتم تغيير شكل الحزمة عن طريق تغيير.
الشكل 5 من البيانات الموسعة | استرخاء الإجهاد في المصفوفات ذات الحزم المختلفة
من خلال تغيير في الحدودين اللذين يحددان مواقع الربط الثانية للمجمعات، و . عندما تكون هذه الألياف متصلة بالتوازي ( ) بواسطة المجمعات، يقومون بإنشاء حزم طويلة كثيفة التعبئة. طول هذه الحزم ( ) يتحدد من خلال نقطة الارتباط المحددة بين المجمعات والألياف. في الحالات التي ترتبط فيها المجمعات حصريًا بنهايات الألياف، يتكون المصفوفة الناتجة من حزم قصيرة. هذه الحزم المعبأة بشكل فضفاض لها طول يساوي طول الألياف ( ). شكل هذه الحزم القصيرة المرتبة بشكل غير محكم يختلف حسب الزاوية ( ) بين الألياف المتصلة. تمثل نطاقات الخطأ المتوسطالبيانات المعروضة تمثل 4 محاكيات مستقلة.
الشكل 6 من البيانات الموسعة | يتم تحفيز مسارات YAP بواسطة اللزوجة المرنة للمصفوفة. أ. تحليلات بيانات تسلسل RNA الضخم من الفئران التي تم تغذيتها بنظام غذائي عادي، ونظام غذائي عالي الدهون، ونظام غذائي عالي الدهون مع إضافة الكربوهيدرات. تم معالجة الفئران التي تغذت على نظام غذائي عالي الدهون بواسطة PM أو المركب، ومجموعة من الفئران التي تعاني من نقص خلايا الكبد RAGE (RAGEتمت دراسة ( ). تم اعتبار الجينات بين مجموعتي FFD و HiAD ذات تغيير لوجاريتمي (Log2FC) وقيمة p أقل من 0.05 (اختبار فيشر الدقيق) معبرة بشكل مختلف. تظهر تحليلات KEGG من الجينات المعبرة بشكل مختلف غنى في مسار إشارة هيبو. لم يتم إجراء حقن HD في هذه التجارب. ب، ج. صور تمثيلية (ب) وقياس (ج) لإشارة YAP النووية النشطة في كبد الفئران، باستخدام جسم مضاد ضد YAP النشط غير الفسفوري.فئران/مجموعة، 4 عشوائيالحقول/العينة؛ يتم تقديم البيانات كنسبة مئوية من YAP النشط/ المساحة/تم تحفيز أهداف YAP CTGF وCyr61 في الفئران على HiAD. لكن ليس بعد رئيس الوزراء أو في الغضبعلى HiAD. RT-qPCR،كل. هـ. تم تصوير الكولاجين باستخدام SHG (أخضر)، YAP النشط (أحمر) و– خلايا نجمية إيجابية لـ SMA (باللون الأزرق، الأسهم) بواسطة التألق المناعي. لم يتم ملاحظة أي خلايا كبدية تحتوي على YAP نشط في القرب من حزم الكولاجين (باستخدام جسم مضاد ضد YAP النشط غير الفسفوري). مقياس الرسم. ف. الصور المتعلقة بالشرائح المتسلسلة مع تلوين المناعية باستخدام علامة myc/GS في الشكل الرئيسي 4c. ج. تم تقييم YAP النووي والسيتوبلازمي باستخدام أجسام مضادة ضد YAP النشط وغير الفسفوري والفسفوري غير النشط في التحليلات الغربية (الكسور السيتوبلازمية والنووية)، في هيدروجيل ذات لزوجة منخفضة وعالية (تمثيل لثلاث تجارب مختلفة). تمثل أشرطة الخطأ المتوسط.تشير الأرقام s.e.m. n إلى الفئران الفردية. تم استخدام تحليل التباين الأحادي (ANOVA) تليه اختبار المقارنات المتعددة لتوكاي.
الشكل 7 من البيانات الموسعة | انظر الصفحة التالية للتعليق.
مقالة
الشكل الإضافي 7| لا تتأثر التكاثر وتنشيط YAP بزيادة الصلابة في الهلامات الهيدروجيل ذات اللزوجة المنخفضة أو العالية (بيانات إضافية للشكل الرئيسي 5). أ-هـ. تم احتواء خلايا Huh7 في هلامات هيدروجيل IPN ذات اللزوجة المنخفضة أو العالية مع صلابة متغيرة. ). تم تقييم تكاثر الخلايا ونشاط YAP بواسطة إشارة نووية Edu (أ، شريط القياس، ) وفلوريسنس المناعي النشط YAP (ب، شريط القياس، )، والتكميم ( وتعبير mRNA لجينات الهدف YAP CTGF وCyr6.لـ c-e، تمثل أشرطة الخطأ المتوسطتشير الأرقام s.e.m. n إلى تجارب مستقلة. تم استخدام تحليل التباين الأحادي مع اختبارات توكي لتصحيح تم نقل خلايا Huh7 باستخدام Tks5-mNeonGreen، وتم إجراء مجهرية المناعة الفلورية باستخدام جسم مضاد ضد MT1-MMP (f)، واندماج نشط.، و p-MLC2 (h). i. الضوابط بدون جسم مضاد أساسي لـتم تصوير الخلايا بواسطة مجهر Airyscan عالي الدقة (LSM980، زيس). صور تمثيلية، شريط مقياس،. ج. ضوابط اختبار PLA في الشكل الرئيسي 51 (مضاد الجسم فقط،مضاد الجسم فقط). مقياس الرسم،تمثل أشرطة الخطأ المتوسطتشير الأرقام s.e.m. n إلى تجارب مستقلة. تم استخدام تحليل التباين الأحادي (ANOVA) تليه اختبار المقارنات المتعددة لتوكاي.
خلايا Huh7
الشكل البياني الممتد 8 | TNS1 والاندماجتقلل الضربات من التكاثر، YAP النووي النشط وتكوين هياكل شبيهة بالانغماس.
باستخدام جسم مضاد ضد YAP النشط (ب، شريط القياس،تم تحليل دائريّة الخلايا بواسطة F-actin، وتحليلات ImageJ (ج، شريط القياس،.)، وتم تقييم تشكيل هياكل شبيهة بالإنفادوبوديا بواسطة إشارة TKS5 (د، مقياس بار، ). تعبير mRNA لجينات الهدف المنظمة بواسطة YAP، CTGF و Cyr61 ( ). تمثل أشرطة الخطأ المتوسط تشير الأرقام s.e.m. n إلى تجارب مستقلة. تم استخدام اختبار ANOVA أحادي الاتجاه تلاه مقارنة متعددة باستخدام Tukey.
مقالة
خلايا هep3B
الشكل البياني الموسع 9 | TNS1 والإنتجرينتقلل الضربات من التكاثر، وتنشيط YAP وتكوين هياكل شبيهة بالانفاذية في Hep3B تم نقل خلايا Hep3B باستخدام بلازميدات CRISPR/Cas9 لتقليل تعبير TNS1 (sg-TNS1) أوإنتجرين (مفرد – إيتج) ). تم استخدام sgRNA غير المستهدف كعنصر تحكم (NC). بعد 48 ساعة في زراعة ثلاثية الأبعاد في هيدروجيل منخفض أو عالي اللزوجة، تم تقييم تكاثر الخلايا بواسطة Edu (أ، مقياس الرسم، ) وقياس الإشارة (e). تم تحليل نشاط YAP باستخدام جسم مضاد YAP النشط (ب، شريط القياس، )، التكميم (ف)، وتعبير mRNA عن الأهداف المنظمة بواسطة YAP (ح). تم تقييم دائريّة الخلايا من خلال إشارة F-actin (ج، مقياس الشريط، ) وتحليلات ImageJ ( تم تحليل تشكيل هياكل شبيهة بالانفادوبوديا بواسطة إشارة TKS5 (د، مقياس بار، ). كل منتمثل أشرطة الخطأ المتوسطتشير الأرقام s.e.m. n إلى تجارب مستقلة. تم استخدام اختبار ANOVA أحادي الاتجاه تلاه مقارنة متعددة باستخدام Tukey.
الشكل 10 من البيانات الموسعة |تم حذف مجال (dd) TNS-1 ولم يتواجد مع الإنتجرين، وأظهرت الخلايا انخفاضًا في التكاثر، ونشاط YAP، وتقليل تكوين هياكل شبيهة بالانفادوبوديا في الهلاميات عالية اللزوجة. أ. مخططات لبناء TNS1 المحذوف منه المجال (dd). يمنع حذف هذا المجال الارتباط بالإنتجرينات، ومع ذلك يبقى مجال ارتباط الأكتين سليمًا. ب، ج. اختبارات الربط القريب (ب) لتقييم الإنتجرينوربط TNS1 (إشارة خضراء) في ناقل فارغ (NC)، TNS1 كامل الطول، وخلايا تم نقلها بـ dd-TNS1 (أحمر، tdTomato). في TNS1 كامل الطول، كانت إشارات PLA متداخلة بينما لم يُلاحظ أي تداخل في خلايا تم نقلها بـ dd-TNS1 أو في مصفوفة ذات لزوجة منخفضة. تم قياس النقاط الإيجابية لـ PLA من
30 خلية في 5 هلامات، كل مجموعة (كل واحدة). د-ك. تم تقييم تكاثر الخلايا بواسطة إدو (د، مقياس الشريط، ) وقياس (h). تم تحليل نشاط YAP باستخدام التألق المناعي لـ YAP النشط (e، مقياس الشريط، .)، التكميم (i)، وتعبير mRNA لجين الهدف المنظم بواسطة YAP (k). تم تقييم دائريّة الخلايا بواسطة إشارة F-actin (f، مقياس بار، ، و) وقياس (ج، ImageJ). تم تحليل تشكيل هياكل شبيهة بالانفادوبوديا بواسطة إشارة TKS5 (مقياسكل. تمثل أشرطة الخطأ المتوسطتشير الأرقام s.e.m. n إلى تجارب مستقلة. تم استخدام اختبار ANOVA أحادي الاتجاه تلاه مقارنة متعددة باستخدام Tukey.
مقالة
ب
جين Tow المنظم بواسطة YAP
د
الشكل البياني الممتد 11 | الإنتغرينو Tensin 1 تتوسط مسارات ميكانيكية خلوية محددة تعتمد على اللزوجة المرنة تتضمن تنشيط YAP (بيانات إضافية إلى الشكل الرئيسي 5). أ. تم نقل خلايا Huh7-Cas9 باستخدام بلازميدات تحتوي على RNA دليلي CRISPR لـ TNS1 (sg-TNS1)، أو Integrin (sg-Itg ) أو sgRNA التحكم (NC)، وتم تضمين الخلايا بعد 24 ساعة في هيدروجيل منخفض أو عالي اللزوجة. نشاط RhoA GTPase في ظروف اللزوجة المنخفضة/العالية وبعد TNS-1 أو Integrinتم اختبار KDs بواسطة اختبارات السحب. تم استخدام الأجسام المضادة لـ YAP النشط (غير الفوسفوريل) و YAP غير النشط (المفوسفور) بالإضافة إلى LATS1 المفوسف و LATS1 الكلي، وتم تحليلها بواسطة التحليل المناعي. صور تمثيلية لـ 3 تجارب مستقلة.
e
ب. قياس مستويات بروتين GTP-RhoA/GAPDH منكل منها). تم احتجاز خلايا Huh7 في هلامات IPN ذات اللزوجة المرنة المنخفضة أو العالية وتم تحضينها مع ROCK (Y-27632، أبكام، ) أو مثبطات الميوسين II (بليبيستاتين، أبكام، تم تحليل نشاط YAP من خلال اختبار تعبير mRNA لجين الهدف المنظم بواسطة YAP CTGF (ج). تم تحليل دائرية الخلايا بواسطة Image J (د)، وتم تقييم تكاثر الخلايا من خلال تعبير mRNA لـ Ki67 (هـ).كل منها). تمثل أشرطة الخطأ المتوسطتشير الأرقام s.e.m. n إلى تجارب مستقلة. تم استخدام اختبار ANOVA أحادي الاتجاه تلاه مقارنة متعددة باستخدام Tukey.
الشكل 12 من البيانات الموسعة | تقليل تثبيط TNS-1 من تكوين البؤر المتحولة في الفئران على نظام غذائي عالي الدهون (HiAD) بعد الحقن الهيدرو ديناميكي (HDI). أ. عرض تخطيطي لاستهداف TNS1 في الجسم الحي بواسطة CRISPR/Cas9 بالتزامن مع الحقن الهيدرو ديناميكي (HDI). تم إطعام الفئران طعامًا عاديًا أو HiAD لمدة 7 أسابيع، ثم تم حقنها هيدرو ديناميكيًا بـ pT3-EF5a-hMet و pT3-354 EF5a-S45Y--كاتينين-مايك (طافرة-كاتينين)، مع ناقل الترانسبوزاز (SB) الجميل النائم، بالإضافة إلى ناقل قائم على CRISPR-Cas9 إما مع sgRNAs تستهدف TNS1 الفأري (pX 333 sgTNS1) أو ناقل فارغ (sgNC). تم التضحية بالفئران بعد 7 أسابيع من
تم تحليل تعبير TNS1 في الكبد بواسطة RT-qPCRكل منها). ج، د. صور H&E، وصبغة GS/myc المناعية على شرائح متتالية تظهر التوضع المشترك (ج). قياس (د) بؤر إيجابية لـ GS/myc. مقياس الرسم، ( تم تحليل تعبير أهداف YAP CTGF وCyr 61 بواسطة RT-qPCR (كل منها). تمثل أشرطة الخطأ المتوسطتشير الأرقام s.e.m. n إلى الفئران الفردية. تم استخدام اختبار ANOVA أحادي الاتجاه تلاه مقارنة توكي المتعددة.
محفظة الطبيعة
المؤلف(المؤلفون) المراسلون: ناتالي توروك آخر تحديث من المؤلف(ين): 18 أكتوبر 2023
ملخص التقرير
تتمنى Nature Portfolio تحسين قابلية تكرار الأعمال التي ننشرها. يوفر هذا النموذج هيكلًا للاتساق والشفافية في التقرير. لمزيد من المعلومات حول سياسات Nature Portfolio، يرجى الاطلاع على سياسات التحرير وقائمة مراجعة سياسة التحرير.
الإحصائيات
لجميع التحليلات الإحصائية، تأكد من أن العناصر التالية موجودة في أسطورة الشكل، أسطورة الجدول، النص الرئيسي، أو قسم الطرق.
مؤكد
حجم العينة بالضبطلكل مجموعة/شرط تجريبي، معطاة كرقم منفصل ووحدة قياس
بيان حول ما إذا كانت القياسات قد أُخذت من عينات متميزة أو ما إذا كانت نفس العينة قد تم قياسها عدة مرات
اختبار(ات) الإحصاء المستخدمة وما إذا كانت أحادية الجانب أو ثنائية الجانب
يجب وصف الاختبارات الشائعة فقط بالاسم؛ وصف تقنيات أكثر تعقيدًا في قسم الطرق.
وصف لجميع المتغيرات التي تم اختبارها
وصف لأي افتراضات أو تصحيحات، مثل اختبارات الطبيعية والتعديل للمقارنات المتعددة
وصف كامل للمعلمات الإحصائية بما في ذلك الاتجاه المركزي (مثل المتوسطات) أو تقديرات أساسية أخرى (مثل معامل الانحدار) و AND التباين (مثل الانحراف المعياري) أو تقديرات عدم اليقين المرتبطة (مثل فترات الثقة)
لاختبار الفرضية الصفرية، إحصائية الاختبار (مثل ) مع فترات الثقة، أحجام التأثير، درجات الحرية و القيمة المذكورة أعطِ القيم كقيم دقيقة كلما كان ذلك مناسبًا.
لتحليل بايزي، معلومات حول اختيار الأوليات وإعدادات سلسلة ماركوف مونت كارلو
للتصاميم الهرمية والمعقدة، تحديد المستوى المناسب للاختبارات والتقارير الكاملة عن النتائج
تقديرات أحجام التأثير (مثل حجم تأثير كوهين،، حجم تأثير بيرسون،)، مشيرًا إلى كيفية حسابها
تحتوي مجموعتنا على الإنترنت حول الإحصائيات لعلماء الأحياء على مقالات حول العديد من النقاط المذكورة أعلاه.
البرمجيات والرموز
معلومات السياسة حول توفر رمز الكمبيوتر
جمع البيانات
تم مسح صور علم الأنسجة وعلم المناعة باستخدام نظام لايكا أبريرو AT2.
تم الحصول على صور IFC عالية الدقة بواسطة مجهر ZEISS Airyscan2 LSM980.
تم إجراء تحليلات بيانات AFM باستخدام نموذج هيرتز في NanoScope Analysis V1.9، و Mountains SPIP v.9.
تم إجراء قياسات اللزوجة على مقياس لزوجة ARES-G2 (أدوات TA) باستخدام برنامج TA TRIOS V5.1.1 (أدوات TA).
تم الحصول على صور توليد التوافقيات الثانية وصور الفلورسنت باستخدام لايكا TCS SP8، لايكا ستيلاريس 8 DIVE العمودي متعدد الفوتونات، و ZEISS Airyscan2 LSM980.
تم جمع صور المناعية باستخدام أنظمة التصوير iBright من إنفيتروجين (ثيرمو فيشر العلمية – الولايات المتحدة).
تم جمع بيانات RNA-seq على جهاز تسلسل Illumina NovaSeq 6000 مع قراءات مزدوجة النهاية 150bp.
تحليل البيانات
تم تحليل بيانات AFM وصور توليد التوافقيات الثانية باستخدام Mountains SPIP v.9، برنامج CT Fire (V2.0 beta)، وبرنامج NIH Image J (الإصدار 1.53t).
تم تحليل صور المناعية باستخدام برنامج تحليل iBright (الإصدار 5.2.1).
تم إجراء التحليلات الإحصائية باستخدام Graphpad Prism (برنامج GraphPad، الإصدار 10).
لتحليل RNA-seq، تم استخدام تعليقات جين Gencode الإصدار M18، GRCm38 (https://www.gencodegenes.org/)، أدوات Dropseq v1.1249، R v3.4.4، Limma v3.40.650.
تم إجراء GSEA باستخدام طريقة GSEA المسبقة الترتيب ضمن قواعد بيانات KEGG باستخدام الأداة عبر الإنترنت g:Profiler (https://biit.cs.ut.ee/gprofiler/gost). تم إجراء خرائط حرارة RNA-seq والتجميع الهرمي غير المراقب باستخدام g:Profiler (https://biit.cs.ut.ee/gprofiler/gost).
بالنسبة للمخطوطات التي تستخدم خوارزميات أو برمجيات مخصصة تكون مركزية للبحث ولكن لم يتم وصفها بعد في الأدبيات المنشورة، يجب أن تكون البرمجيات متاحة للمحررين والمراجعين. نشجع بشدة على إيداع الرموز في مستودع مجتمعي (مثل GitHub). انظر إرشادات Nature Portfolio لتقديم الرموز والبرمجيات لمزيد من المعلومات.
البيانات
معلومات السياسة حول توفر البيانات
يجب أن تتضمن جميع المخطوطات بيان توفر البيانات. يجب أن يوفر هذا البيان المعلومات التالية، حيثما كان ذلك مناسبًا:
رموز الوصول، معرفات فريدة، أو روابط ويب لمجموعات البيانات المتاحة للجمهور
وصف لأي قيود على توفر البيانات
بالنسبة لمجموعات البيانات السريرية أو بيانات الطرف الثالث، يرجى التأكد من أن البيان يتماشى مع سياستنا
ليس لدينا أي قيود على توفر البيانات. جميع البيانات التي تم إنشاؤها خلال هذه الدراسة، مدرجة في المقالة وملفات المعلومات التكميلية. الجينوم المرجعي للفأر الإصدار الرئيسي GRCm38 متاح من https://www.gencodegenes.org/.
بيانات RNA-seq متاحة تحت رقم الوصول GSE245016. الرموز المستخدمة في الدراسة متاحة على https://github.com/ktyman2/liverCancer.git
المشاركون في البحث البشري
معلومات السياسة حول الدراسات التي تشمل المشاركين في البحث البشري والجنس والنوع في البحث.
التقارير حول الجنس والنوع
لقد حصلنا على عينات كبد غير محددة ودرسناها من 9 إناث و 11 ذكراً من المرضى البالغين. تم الحصول عليها وفقًا لإرشادات BRISQ، وتم دراسة عينات استئصال الكبد التي تم تخزينها عند -80 درجة مئوية أو المتاحة طازجة (لتحليلات اللزوجة).
خصائص السكان
مرضى MASH (تتراوح أعمارهم بين 30 إلى 80) بدون عدوى HBV/HCV/HIV وبدون تاريخ من شرب الكحول بكثرة. تم تقييم علم الأنسجة للالتهاب النخري، وتضخم الخلايا الكبدية، ورد الفعل القنوي، والتليف بواسطة أخصائي أمراض الكبد بشكل أعمى، وتم تقديم درجات NAS.
التوظيف
تم الحصول على عينات كبد بشرية من مركز أبحاث السكري في ستانفورد (SDRC)، شبكة المتبرعين الغربية (DNW)، بنك الأنسجة في ستانفورد، ومركز معالجة وتخزين العينات السريرية (CBRPC) من مركز أبحاث الكبد في بيتسبرغ (PLRC). لم تكن هناك معلومات تعريفية متاحة.
الإشراف الأخلاقي
تم إلغاء تحديد جميع العينات البشرية وتم إعفاؤها (الإعفاء 4). تمت الموافقة على ذلك من قبل مجلس مراجعة المؤسسات بجامعة ستانفورد (IRB، #67378) ومجلس مراجعة مركز أبحاث الكبد في بيتسبرغ.
يرجى ملاحظة أنه يجب أيضًا تقديم معلومات كاملة حول الموافقة على بروتوكول الدراسة في المخطوطة.
التقارير الخاصة بالمجال
يرجى اختيار الخيار أدناه الذي يناسب بحثك بشكل أفضل. إذا لم تكن متأكدًا، اقرأ الأقسام المناسبة قبل اتخاذ قرارك.
علوم الحياة العلوم السلوكية والاجتماعية العلوم البيئية والتطورية والبيئية
لنسخة مرجعية من الوثيقة مع جميع الأقسام، انظر nature.com/documents/nr-reporting-summary-flat.pdf
تصميم دراسة علوم الحياة
يجب على جميع الدراسات الإفصاح عن هذه النقاط حتى عندما يكون الإفصاح سلبيًا.
حجم العينة
تم تحديد حجم العينة من خلال التجارب الأولية وتوفر الموارد.
استبعاد البيانات
لم نقم بأي استبعاد للبيانات.
التكرار
تم تكرار جميع النتائج بأكثر من 3 تكرارات بيولوجية، والأساليب. تم التحقق من النتائج الرئيسية بشكل مستقل من قبل أفراد آخرين.
العشوائية
كانت الفئران في كل تجربة مستقلة، وكذلك المجموعات التجريبية متطابقة في العمر. تم توزيع الفئران عشوائيًا في كل مجموعة لضمان عمر ووزن جسم مشابه في كل مجموعة. بالنسبة للتجارب في المختبر، تم تجميع الخلايا والهلامات الهيدروجيل بشكل عشوائي للعلاج أو الاختبار.
التعمية
تم استخدام التعمية على نطاق واسع في الدراسة. تم تقييم الصور من قبل شخصين على الأقل كانوا غير مدركين لمعلومات المجموعة. تم تأكيد قياسات البؤر المتحولة من قبل شخص ثانٍ كان أيضًا غير مدرك لمعلومات المجموعة التجريبية. كان الباحثون غير مدركين للتخصيص أثناء التجارب وتقييم النتائج، وتم جمع البيانات وتحليلها بشكل أعمى.
التقارير عن مواد وأنظمة وأساليب محددة
نطلب معلومات من المؤلفين حول بعض أنواع المواد والأنظمة التجريبية والأساليب المستخدمة في العديد من الدراسات. هنا، حدد ما إذا كانت كل مادة أو نظام أو طريقة مدرجة ذات صلة بدراستك. إذا لم تكن متأكدًا مما إذا كان عنصر القائمة ينطبق على بحثك، اقرأ القسم المناسب قبل اختيار رد.
المواد والأنظمة التجريبية
الأساليب
غير متاح
مشاركة في الدراسة
غير متاح
مشاركة في الدراسة
X الأجسام المضادة
خطوط الخلايا حقيقية النواة
تدفق السيتومتر
علم الحفريات وعلم الآثار
البيانات السريرية
البحث ذو الاستخدام المزدوج
الأجسام المضادة
الأجسام المضادة المستخدمة
Myc Santa Cruz ، #sc-40 IHC، 1:200
Glutamine Synthetase (GS) Santa Cruz، #sc-74430 IHC، 1:200
معلومات السياسة حول خطوط الخلايا والجنس والنوع في البحث
مصدر(s) خط الخلية
تم الحصول على خط خلايا Huh7 من مختبر سارنوف (ستانفورد)، وتم شراء خلايا Hep3B من ATCC.
المصادقة
تمت عملية التحقق من الصحة من خلال تحليل STR باستخدام خدمة مصادقة الخلايا من ATCC (ASN-0002-2022).
تلوث الميكوبلازما
تم إجراء اختبار روتيني للكائنات الدقيقة بواسطة مجموعات كشف الميكوبلازما MycoAlertTM (لونزا، 75870-454). جميع الخلايا التي تم اختبارها كانت سلبية لوجود الميكوبلازما.
الخطوط التي يتم التعرف عليها بشكل خاطئ بشكل شائع (انظر سجل ICLAC)
لم يتم استخدام خطوط خلوية يتم التعرف عليها بشكل خاطئ بشكل شائع.
الحيوانات وغيرها من الكائنات البحثية
معلومات السياسة حول الدراسات التي تشمل الحيوانات؛ توجيهات ARRIVE الموصى بها للإبلاغ عن أبحاث الحيوانات، والجنس والنوع في بحث
الحيوانات المخبرية
تمت الموافقة على جميع الدراسات من قبل APLAC في جامعة ستانفورد أو VA في بالو ألتو، وكانت تتبع بدقة إرشادات ARRIVE. تم شراء ذكور الفئران من نوع C57BL/6J (WT) الذين تتراوح أعمارهم بين 8 إلى 10 أسابيع من مختبر جاكسون. تم إهداء فئران Ragefl/fl على خلفية C57B6 من قبل الدكتور ب. أرنولد من مركز أبحاث السرطان الألماني، هايدلبرغ، ألمانيا. تم إنتاج فئران RageHepKO عن طريق تزاوج فئران Ragefl/fl مع فئران Albumin-cre (مختبر جاكسون) لعدة أجيال. تم استخدام ذكور فئران Ragefl/fl و RageHepKO الذين تتراوح أعمارهم بين 8 إلى 10 أسابيع. لتوليد فئران AGER1 المتحولة وراثياً من الخلايا الكبدية، تم حقن الفئران WT بفيروس مرتبط بالأدينوفيروس 8 (AAV8)-بروتين فلوري أخضر (AAV8-control) أو AAV8-غلوبولين ربط الثيروكسين-AGER1 (AAV8-AGER1).نسخ الجينوم، مختبرات فيكتور بيو) في الأسبوع السادس من التغذية.
لإسقاط TNS1، تم حقن الفئران بمتجه يعتمد على CRISPR/Cas9 يربط بين اثنين من sgRNAs تستهدف الإكسون 1 والإكسون 7 من TNS1.تي إن إس 1 ) أو متجه التحكم السلبي (فارغ )، عن طريق حقن الوريد الذيل الهيدروديناميكي في بداية الأسبوع الثامن من تغذية الشوفان أو HiAD في نفس الوقت مع hMet، s45y-mutant--كاتينين، وSB كانت جميع الفئران المستخدمة من نفس الخلفية وتم الاحتفاظ بها في نفس المنشأة. تم الحفاظ على الفئران في نطاقات درجة الحرارة والرطوبة الماكروبيئية من 17.8 إلى و إلىتم وضع الفئران في أقفاص قياسية معدورات الضوء/الظلام لمدة ساعة والوصول الحر إلى الماء والطعام ما لم يُذكر خلاف ذلك.
الحيوانات البرية
لم تتضمن هذه الدراسة حيوانات برية.
التقارير عن الجنس
تم استخدام ذكور الفئران فقط.
عينات تم جمعها من الميدان
لم تتضمن هذه الدراسة عينات تم جمعها من الميدان.
رقابة الأخلاقيات
تم إجراء جميع التجارب على الحيوانات وفقًا للإجراءات التجريبية المعتمدة من قبل لجنة رعاية واستخدام الحيوانات المؤسسية في جامعة ستانفورد ومركز بالو ألتو الطبي. (APLAC #33374)
يرجى ملاحظة أنه يجب أيضًا تقديم معلومات كاملة حول الموافقة على بروتوكول الدراسة في المخطوطة.
أمراض الجهاز الهضمي والكبد، جامعة ستانفورد، ستانفورد، كاليفورنيا، الولايات المتحدة الأمريكية.VA، بالو ألتو، كاليفورنيا، الولايات المتحدة الأمريكية.قسم الهندسة الكيميائية، جامعة ستانفورد، ستانفورد، كاليفورنيا، الولايات المتحدة الأمريكية. الكيمياء والهندسة والطب لصحة الإنسان (ChEM-H)، جامعة ستانفورد، ستانفورد، كاليفورنيا، الولايات المتحدة الأمريكية.مدرسة ويلدون للهندسة الطبية الحيوية، جامعة بوردو، ويست لافاييت، إنديانا، الولايات المتحدة الأمريكية. قسم علم الأمراض، جامعة ستانفورد، ستانفورد، كاليفورنيا، الولايات المتحدة الأمريكية.قسم المناعة، جامعة ستانفورد، ستانفورد، كاليفورنيا، الولايات المتحدة الأمريكية.قسم الأتمتة، جامعة تسينغhua، بكين، الصين.مركز أبحاث الكبد في بيتسبرغ، جامعة بيتسبرغ ومركز بيتسبرغ الطبي، بيتسبرغ، بنسلفانيا، الولايات المتحدة الأمريكية.قسم الأشعة، جامعة ستانفورد، ستانفورد، كاليفورنيا، الولايات المتحدة الأمريكية.قسم الكيمياء الحيوية والطب الجزيئي، جامعة كاليفورنيا في ديفيس، ساكرامنتو، كاليفورنيا، الولايات المتحدة الأمريكية.قسم الصيدلة الجزيئية، كلية ألبرت أينشتاين للطب، نيويورك، نيويورك، الولايات المتحدة الأمريكية.وحدة العلوم الكمية، قسم الطب، كلية الطب بجامعة ستانفورد، ستانفورد، كاليفورنيا، الولايات المتحدة الأمريكية.كلية العلوم والتكنولوجيا، جامعة كيو، يوكوهاما، اليابان.أقسام الطب والهندسة الحيوية، جامعة بنسلفانيا، فيلادلفيا، بنسلفانيا، الولايات المتحدة الأمريكية.قسم الهندسة الميكانيكية، جامعة ستانفورد، ستانفورد، كاليفورنيا، الولايات المتحدة الأمريكية.ساهم هؤلاء المؤلفون بالتساوي: كولادي أديبواله، لوراند فانتزا.البريد الإلكتروني: ntorok@stanford.edu
Weiguo Fan , Kolade Adebowale , Lóránd Váncza , Yuan , Md Foysal Rabbi , Koshi Kunimoto , Dongning Chen , Gergely Mozes , David Kung-Chun Chiu , Yisi Li , Junyan Tao , Yi Wei , Nia Adeniji , Ryan L. Brunsing , Renumathy Dhanasekaran , Aatur Singhi , David Geller , Su Hao Lo , Louis Hodgson , Edgar G. Engleman , Gregory W. Charville , Vivek Charu , Satdarshan P. Monga , Taeyoon Kim , Rebecca G. Wells , Ovijit Chaudhuri & Natalie J. Török
Abstract
Type 2 diabetes mellitus is a major risk factor for hepatocellular carcinoma (HCC). Changes in extracellular matrix (ECM) mechanics contribute to cancer development , and increased stiffness is known to promote HCC progression in cirrhotic conditions . Type 2 diabetes mellitus is characterized by an accumulation of advanced glycation end-products (AGEs) in the ECM; however, how this affects HCC in non-cirrhotic conditions is unclear. Here we find that, in patients and animal models, AGEs promote changes in collagen architecture and enhance ECM viscoelasticity, with greater viscous dissipation and faster stress relaxation, but not changes in stiffness. High AGEs and viscoelasticity combined with oncogenic -catenin signalling promote HCC induction, whereas inhibiting AGE production, reconstituting the AGE clearance receptor AGER1 or breaking AGE-mediated collagen cross-links reduces viscoelasticity and HCC growth. Matrix analysis and computational modelling demonstrate that lower interconnectivity of AGE-bundled collagen matrix, marked by shorter fibre length and greater heterogeneity, enhances viscoelasticity. Mechanistically, animal studies and 3D cell cultures show that enhanced viscoelasticity promotes HCC cell proliferation and invasion through an integrin- -tensin-1-YAP mechanotransductive pathway. These results reveal that AGE-mediated structural changes enhance ECM viscoelasticity, and that viscoelasticity can promote cancer progression in vivo, independent of stiffness.
Type 2 diabetes mellitus (T2DM) and obesity are important risks for HCC, and it is estimated that up to 30% of HCCs in non-alcoholic steatohepatitis (NASH) occur at a precirrhotic stage when matrix stiffness is still low, and these patients often have poor glycaemic control . AGEs are produced by the non-enzymatic glycation of serum or tissue proteins during T2DM or can be ingested through the consumption of food prepared at high temperatures . Over time, AGEs accumulate in the matrix due to decreased clearance and metabolism and can biochemically modify collagen and ECM proteins . Although AGEs in NASH do not appear to increase stiffness greatly, they could affect ECM viscoelasticity. Tissues and ECMs are generally viscoelastic, exhibiting viscous energy dissipation in response to mechanical perturbations and a time-dependent mechanical response, such as stress relaxation in response to deformation . Recent research has shown that changes in ECM viscoelasticity, independent of stiffness, have impacted cell
behaviours, including proliferation and migration of breast cancer cells . Viscoelasticity can modulate tissue growth dynamics, symmetry and the growth of cancer cells . Here we investigated the role of AGE-mediated changes in ECM mechanical properties on NASH and HCC progression.
AGEs enhance liver viscoelasticity
To evaluate the potential role of AGE-mediated changes on the ECM, we studied the mechanical properties of liver samples from patients with T2DM, and in individuals with NASH with or without T2DM (average disease activity score, 4; fibrosis stage, 0-1; Fig. 1a). Liver AGEs were significantly higher in patients with T2DM, or with NASH and T2DM compared with those without T2DM (Fig. 1b). Using atomic-force microscopy (AFM), we found that patients with T2DM
Fig.1 | Viscoelasticity is increased in the livers of individuals with NASH and T2DM and in mice on a HiAD. a, Schematic of AGE increase in NASH/T2DM. b-f.b, Quantification of AGEs in the liver. c, Schematic of the AFM analysis. Indent-retract was used to generate force-distance curves.d-f, The stiffness (d; Young’s modulus), representative force-distance curves (e) and quantification of hysteresis area (f, viscoelasticity) were assessed using AFM. The average stiffness of the human cirrhotic liver is indicated by a dashed line. (healthy controls), (patients with NASH), (T2DM) and (NASH + T2DM) individuals. , Rheometry analysis of fresh liver tissues. g, Schematic of rheometry analysis of fresh liver tissues.h, Rheometry analysis of the storage modulus in precirrhotic livers. i, The loss tangent (viscoelasticity) in the livers of healthy participants, and individuals with NASH, T2DM or NASH/ T2DM. j, Stress relaxation curves in liver samples from the different patient groups. Norm., normalized. k, Stress was normalized to the initial stress and depicted as (the timescale at which the stress is relaxed to half its original
value). (healthy controls), (patients with NASH), (T2DM) and (NASH + T2DM) individuals. 1-p, Mice were placed onto a chow or FFD diet, or a HiAD diet with daily vehicle, AGE inhibitor (PM) or AGE-cross-linking inhibitor (alagebrium, ALT-711) treatment.1, Schematic of the experiment.i.p., intraperitoneal. m, Quantification of liver AGEs (from left to right, and 5). , Liver stiffness ( ; from left to right, and 6 mice) and viscoelasticity (stress relaxation curves (o) and hysteresis area (p); mice in each group) were assessed using AFM. , Stiffness ( ) and viscoelasticity were assessed using rheometry. From left to right, and 6 ( and ) and and 6 (t) mice. The diagrams in and were created using BioRender. Data are mean s.e.m. values refer to individual mice. Statistical analysis was performed using one-way analysis of variance (ANOVA) followed by Tukey’s multiple-comparison test ( and ) and two-sided Student’s unpaired -tests ( , f and ). NS, not significant; , .
had similar stiffness (Fig. 1c,d) but higher hysteresis areas under load-ing-unloading cycles, corresponding to viscous energy dissipation or loss, indicating higher viscoelasticity (Fig. 1e,f). Furthermore, using rheometry, we confirmed that the livers of patients with NASH and T2DM without cirrhosis had similar storage moduli but a higher loss
tangent and faster stress relaxation under a constant deformation (Fig.1g-k).
To investigate the link between AGEs and viscoelasticity, we studied a mouse model fed high-AGE diet (HiAD). These mice exhibit steatosis, hepatocyte ballooning, insulin resistance and higher liver AGEs
compared with those on regular (chow) or fast-food (FFD) diets (Fig. 11,m). On the basis of AFM (Fig. 1n-p) and rheometry (Fig. 1q-t) analyses, the stiffness was similar (Fig. 1n, q), but the viscoelasticity increased (Fig. 1o,p,r-t), in mice fed a HiAD compared with those fed chow or FFD. Notably, inhibiting AGE production with pyridoxamine (PM) or preventing the formation of AGE-collagen cross-links with alagebrium (ALT-711) reversed the changes in viscoelasticity (Fig. 1o,p,r-t). Together, these data indicate that AGEs in the precirrhotic ECM cause increased viscoelasticity.
Viscoelasticity creates a tumorigenic niche
The above results prompted us to investigate the potential causal connections between ECM viscoelasticity and HCC progression. Studies on NASH-related HCC commonly used a high-fat diet combined with the carcinogen diethylnitrosamine, genetically modified models or a CDAA diet . However, it is important to follow the typical pathogenesis characterized by cell injury and inflammation preceding . To experimentally imitate the conditions with increasing ECM stress relaxation before HCC onset, we used a more relevant model to modulate the metabolic/matrix milieu before tumour seeding. We hydrodynamically delivered human MET (hMET) with mutant -catenin or control vectors to chow-, FFD- or HiAD-fed mice. Earlier appearance and faster growth of transformed foci (glutamine synthetase (GS) and MYC-tag positive) were observed in HiAD-fed mice compared with in mice on the chow or FFD diet (Fig. 2a-c and Extended Data Fig. 1a-c). Importantly, tumour growth diminished, and the survival rate improved after AGE inhibition with PM or after breaking collagen-AGE cross-links with ALT (Fig. 2d-g and Extended Data Fig. 1d-f).
We next modulated AGE receptors using two additional approaches. We first addressed AGER1, the clearance receptor. As individuals with T2DM plus NASH and mice on a HiAD have significantly downregulated (also known as DDOST) , we sought to reverse this by AAV8-mediated AGER1 delivery before the hydrodynamic injection (HDI) (Fig. 2h). AGER1-reconstituted mice had higher levels of AGER1 (Fig. 2i) and lower levels of AGE receptors (Fig. 2j) owing to improved uptake, similar stiffness (Fig. 2k) but lower stress relaxation (Fig. 2l,m and Extended Data Fig. 2a), and reduced growth of transformed foci (Fig. 2n,o and Extended Data Fig. 2b), compared with mice that were injected with the control AAV8 construct.
Second, we studied mice with hepatocyte-specific deletion of RAGE (also known as Ager; proinflammatory AGE receptor; ) that were fed a HiAD, and hydrodynamically injected these mice with hMET with mutant -catenin (Extended Data Fig. 2c). These mice had reduced growth of tumour foci (Extended Data Fig. 2d,e), decreased liver AGEs (Extended Data Fig. 2f), similar stiffness (Extended Data Fig. 2g) and reduced viscoelasticity (Extended Data Fig. 2h-j) compared with RAGE mice fed the HiAD.
Together, these studies with four animal models all converge on the conclusion that AGEs in the ECM create a more viscoelastic and tumorigenic environment that promotes HCC .
Network connectivity and viscoelasticity
The data presented so far suggest that AGE accumulation is critical to increased ECM viscoelasticity and HCC progression. We next sought to elucidate how ECM viscoelasticity is modulated. Type-1 collagen networks are thought to be critical regulators of tissue mechanics . AGEs can directly cross-link collagen and affect matrix mechanics by altering its helical structure . Collagen networks were imaged using second harmonic generation (SHG) with two-photon microscopy in liver samples from humans (healthy control, NASH, NASH + T2DM; Extended Data Fig. 3a), as well as in mice (chow, HiAD, HiAD + PM, HiAD + ALT-711 and in AAV8-AGER1-injected livers; Extended Data Fig. 3b). The collagen network exhibited bundling in patients with T2DM + NASH and in mice
on the HiAD, whereas the network appeared to be more organized with thinner fibres in healthy humans, and in mice on the chow or HiAD diets after PM and ALT treatment or AGER1 reconstitution. Inhibiting AGE production or disrupting AGE-collagen cross-links decreased the amount of highly cross-linked insoluble collagen (Fig. 3a). We analysed decellularized native ECM from chow- or HiAD-fed mice using SHG to evaluate collagen fibre length, spatial orientation and interconnectivity. Compared with the well-organized collagen network in mice on the chow diet, in HiAD-fed mice, the network exhibited less connectivity and had collagen bundles with shorter fibres and lower fibre-fibre angles (Fig. 3b). Similar structures with shorter fibres and angles were seen in neutralized reconstituted collagen hydrogels with AGEs (Fig. 3c). The interactions between AGEs and collagen telopeptide lysine residues can interfere with fibre elongation and the formation of a structurally cohesive collagen network . To evaluate the properties of AGE-cross-linked collagen hydrogels and the relationship between low-connectivity networks and matrix characteristics, we performed rheological measurements. AGE-cross-linked collagen hydrogels had similar stiffness (Fig. 3d) but faster stress relaxation compared with non-cross-linked collagen (Fig. 3e). We next measured the distribution of Young’s moduli by AFM mapping of hydrogels. We saw that, while there was heterogeneity in local moduli in both gels, the ranges of elastic moduli were slightly higher in the collagen-only case (Extended Data Fig. 3c,d). The distribution of hysteresis areas (viscoelasticity) demonstrated higher frequencies in AGE-cross-linked collagen hydrogels (Extended Data Fig. 3e,f). To further study the collagen-rich matrix with stiffness comparable to that of the liver, interpenetrating polymer network (IPN) 3D hydrogels made from AGE-modified collagen and alginate were tested (Fig. 3f). Similar changes in architecture and connectivity were seen after AGE exposure (Fig. 3g). Breaking the AGE-collagen cross-links with ALT-711 decreased the amount of insoluble collagen (Fig. 3h) and increased the fibre length, fibre-fibre angles (Fig. 3i,j) and network connectivity. ALT-711 itself did not change the collagen matrix (Extended Data Fig. 3g) or its mechanical properties (Extended Data Fig. 3h-j). Indentation tests showed restored viscoelasticity after using ALT-711 (Fig. 3k). IPN hydrogels mixed with AGE-modified collagen exhibited similar stiffness (Fig. 31), but faster stress relaxation compared with non-modified collagen (Fig. 3m-o) based on rheological measurements.
To further study how the matrix architecture impacts viscoelasticity, we simulated collagen matrices with a variation in two structural parameters to model the activity of AGEs: average collagen fibre bundle length and bundling angle, as a proxy for heterogeneity (Fig. 3p,q). The collagen matrices are connected by a combination of weak bonds, known to act within and between collagen fibres (Extended Data Fig. 4a-g) and could underlie stress relaxation and viscoelasticity in type-1 collagen matrices, and cross-links due to (Extended Data Fig. 4h,j). Bundled networks are more heterogeneous and exhibit faster stress relaxation compared with unbundled networks (Fig. 3r). Reducing the fibre length (Fig. 3s and Extended Data Fig. 5a-e) or bundle angle (Fig. 3t and Extended Data Fig. 5f-i) increases the heterogeneity of the network leading to faster stress relaxation.
Together, these computational results show that the changes in architecture that we observed due to AGE activity in vivo and in vitro, namely enhanced heterogeneity and shorter fibre length, are predicted to lead to faster stress relaxation and enhanced viscoelasticity.
Matrix viscoelasticity activates YAP through TNS1
We next focused on mechanotransductive pathways leading to tumour growth and invasion by faster stress relaxation. RNA-sequencing (RNA-seq) and bioinformatics analyses were performed on mouse liver samples (in the chow, FFD, HiAD, HiAD + PM and RAGE groups), to identify potential pathways. Kyoto Encyclopedia of Genes and Genomes (KEGG) analyses were performed on differentially expressed genes
of GS- and MYC-tag-positive foci (circles). Scattered positive cells denote
between the HiAD and FFD groups to categorize the enriched functional classification (Fig. 4a and Extended Data Fig. 6a). In the Hippo signalling pathway group, YAP/TAZ-regulated genes were enriched in HiAD-fed mice and decreased after PM treatment and in RAGE
mice (Fig. 4a). YAP activation, as indicated by a nuclear signal of active non-phosphorylated YAP (Extended Data Fig. 6b,c,g) and the induction of targets CTGF (also known as CCN2) and CYR61 (CCN1), was observed in mice on the HiAD, but decreased after PM treatment or in
Fig. 3 | AGEs modulate collagen architecture and network connectivity, leading to enhanced viscoelasticity in livers and 3D hydrogels.
a, Quantification of insoluble collagen (from left to right, and 5). b,c, SHG microscopy images of decellularized liver ECMs (b) (bundles, red arrows) and collagen hydrogels (c). Fibre lengths (CT-Fire) and fibre-fibre angles (ImageJ) were assessed (three mice or gels per group, five images per mouse or gel). d,e, Collagen hydrogels from c were assessed using rheometry for stiffness (d) and viscoelasticity (e), expressed as (the timescale at which stress is relaxed to half its original value). , Schematic of the collagen/IPN hydrogel. The diagram was adapted from ref.16, under a Creative Commons licence CCBY 4.0.g, Confocal reflectance microscopy of collagen fibres after AGE ALT-711 exposure. , Insoluble collagen ( ), fibre lengths ( ; CT-Fire) and angles (j; ImageJ) in the IPN gels. Data are from three images per gel, three gels per group. k, Representative stress relaxation curves from IPN gels.
1-o. Rheometry of IPN gels testing stiffness (l; storage modulus) and viscoelasticity ( ), showing the loss tangent ( ) and stress relaxation (stress relaxation curves (n) and ) are shown. . p, Simulation modelling. A matrix structure consisting of individual fibrils ( length) without (left) or with (right) bundlers connecting the ends of fibrils at . , After a matrix is assembled, it is deformed by shear strain. r, Stress relaxation is measured using the two matrices shown in p.s.t, Stress relaxation was studied using matrices with different bundle length with or different bundling angle with . Data are mean s.e.m. values refer to independent experiments. Statistical analysis was performed using Wilcoxon’s rank-sum tests (b and c), two-tailed unpaired -tests ( , e and l-o), Kruskal-Wallis tests with Dunn’s test (i and j) and one-way ANOVA followed by Tukey’s multiple-comparison test . For , data are mean s.d. ( each). For and , scale bars, .
the mice on the HiAD (Extended Data Fig. 6d). YAP-positive hepatocytes were not observed in close proximity to collagen bundles in the HiAD group (Extended Data Fig. 6e). To substantiate that HCC in faster-stress-relaxing ECM was promoted by YAP and TAZ, we co-injected dominant-negative TEA domain transcription factor 2 (dn-TEAD2) or control plasmids by HDI with hMET and mutant -catenin (Fig. 4b). The TEAD family of transcription factors are important binding partners for YAP and TAZ, and TEAD2 in particular was linked to HCC progression . We found that the number of GS/MYC double-positive
foci significantly decreased after dn-TEAD2/HDI co-injection compared with in mice that were injected with the control plasmid (Fig.4c,d and Extended Data Fig. 6f (haematoxylin and eosin images)), and these foci were negative for active, nuclear YAP (Fig. 4c (bottom, inset)). In mice treated with control vector co-injection, active YAP localized to the nuclei of GS-positive cells. Downstream targets CTGF and CYR61 were downregulated after injection with dn-TEAD2 (Fig. 4e). Together, these data indicate that HCC in faster-stress-relaxing ECM was promoted by YAP .
Fig. 4 | YAP is involved in HCC growth promoted by high viscoelasticity. a, Analyses of bulk RNA-seq data from mice fed a chow or FFD diet or a HiAD diet with vehicle treatment ( each), mice fed a HiAD with PM treatment ( ) and mice fed a HiAD ( ). The heat map shows enrichment in several YAP/TAZ target genes in the HiAD group compared with in the other groups. Tensin1 (Tns1, red) target of interest. b, Schematic of the NASH-related HCC model combined with YAP inhibition. The diagram was created using BioRender.c, GS/MYC-tag immunohistochemistry on subsequent slides showing transformed foci (circles, top and middle). Active non-phosphorylated YAP (red) localized to the nuclei of GS positive cells (green) in control-vectorinjected (for dn-TEAD2) mice fed a HiAD (bottom). Scale bars, (top and middle) and (bottom). NC, empty vector. d, Quantification of GS foci in c. . e, YAP targets Ctgf and Cyr61 were downregulated in dn-TEAD2treated mice. . Data are mean s.e.m. values refer to individual mice. Statistical analysis was performed using one-way ANOVA followed by Tukey’s multiple-comparison test.
Given these results, our next question was how the viscoelastic ECM conveys proliferative and invasive signals. To directly test the effects of viscoelasticity, we constructed IPNs of alginate and reconstituted basement membrane (rBM) matrix hydrogels for 3D culture
studies (rBM-IPNs). HCC cells (Fig. 5 and Extended Data Fig. 7a-e) were encapsulated in rBM-IPN hydrogels with the same stiffness (Young’s modulus, 2 kPa ) but different levels of viscoelasticity (Fig. 5a). In high-viscoelasticity gels, cells exhibited increased proliferation (Fig. 5b,e), YAP activation (Fig. 5c,f) and the formation of TKS5-positive (also known as SH3PXD2A) and MT1-MMP-positive invadopodialike structures as well as a more elongated shape (Fig. 5d,g). When the Young’s modulus was gradually increased to 5 kPa , we did not observe an increase in cell proliferation, YAP activation or induction of its target genes (Extended Data Fig. 7a-e). Invadopodia are thin linear protrusions that are linked to cancer cell invasion and migration. In high-viscoelasticity gels, we detected canonical markers such as TKS5 and MT1-MMP (Fig. 5d and Extended Data Fig. 7f) as well as active integrin , and phosphorylated myosin light chain ( MLC ) (Extended Data Fig. 7g,h, respectively). Antibody controls are shown in Extended Data Fig. 7i. As integrin- -matrix interactions modulating mechanotransduction were reported in breast cancer cells in high-viscoelasticity gels , we used integrin- -specific blocking antibodies (Fig. 5h-j). These reduced proliferation (Fig. 5h) and YAP target CTGF (Fig. 5i) and increased cell circularity (Fig. 5j).
Notably, on the basis of our RNA-seq data, TNS1 was significantly induced in an AGE- and viscoelasticity-dependent manner (Figs. 4a and 5k). TNS1 was described as part of a molecular clutch that mediates the mechanical linkage between ECM-bound integrins and the actomyosin cytoskeleton to generate traction force . To study the role in mechanosignalling, proximity ligation assays (PLA) were performed in HCC cells in low- versus high-viscoelasticity hydrogels to capture the potential interaction between TNS1 and integrin . High-viscoelasticity conditions promoted their interaction (Fig. 51,m and Extended Data Fig. 7j (antibody controls)). We next studied the effects of TNS1 or integrin knockdown (CRISPR-Cas9; Fig. 5n-p). This reduced cell proliferation (Fig. 5n and Extended Data Fig. 8a) as well as the activation of YAP and target genes (Fig. 50 and Extended Data Fig. 8b,e) in high-viscoelasticity ECM. Invadopodia formation was reduced, and cell circularity increased after TNS1 or integrin knockdown (Fig. 5p and Extended Data Fig. 8c,d). Hep3B cells exhibited similar results (Extended Data Fig. 9). To further analyse the importance of the TNS1-integrin interaction in invadopodia formation and proliferation, we transfected cells with a vector containing a mutant TNS1 (with a deletion of the PTB domain preventing its binding to integrin , hereafter, dd-TNS1) or full-length TNS1 (Extended Data Fig.10a) and embedded them in low- or high-viscoelasticity hydrogels. We assessed whether dd-TNS1 is capable of binding to integrin using a PLA. In dd-TNS1-transfected cells, the PLA signal was very low, whereas, in the full-TNS1-tdTomato-positive cells, the signals co-localized (Extended Data Fig.10b,c). dd-TNS1-transfected cells in high-viscoelasticity hydrogels had lower proliferation (Extended Data Fig. 10d,h), and reduced active YAP and its target genes (Extended Data Fig.10e,i,k), while their circularity increased (Extended Data Fig. 10f,j) and they did not form protrusions (Extended Data Fig.10g). As RhoA is involved in regulating cell shape and migration, and it was described to be modulated by TNS1 , we next studied its activity. Cells in high-viscoelasticity hydrogels exhibited increased RhoA-GTPase activity in a TNS1- and integrin- -dependent manner (Extended Data Fig. 11a,b). LATS1 activity decreased and YAP was more active in cells in high-viscoelasticity gels, whereas the reverse was seen after TNS1 or integrin knockdown. Pharmacological inhibition of ROCK-GTPase and myosin 2 resulted in an increase in cell circularity, a lower proliferation rate and reduced expression of YAP targets (Extended Data Fig. 11c-e).
To study the in vivo role of TNS1, we used a CRISPR-Cas9-directed approach whereby TNS1 was targeted at the time of HDI. Mice on chow or HiAD diets were hydrodynamically injected as before, including either single-guide RNA for Tns1 (sgTNS1) or control sgRNA plasmids, and were euthanized 7 weeks after the injections (Extended Data Fig. 12a). In the sgTNS1-treated mice, Tns1 expression and the
Fig. 5|The integrin- -TNS1-YAP axis mediates viscoelasticity-specific mechanocellular pathways for HCC cell invasion. a, Schematics of the tuneable viscoelasticity IPNs of alginate (blue) and reconstituted basement membrane matrix (green) 3D hydrogels. Lowering the molecular mass of alginate cross-linked by calcium (red) decreases the network connectivity (arrows) to increase viscoelasticity. The diagram was adapted from ref.16, under a Creative Commons licence CC BY 4.0.b-g, Cell proliferation in low- or high-viscoelasticity hydrogels was analysed using EdU assays (imaging (b) and quantification (e)). c,f, YAP activation was analysed using antibodies against active YAP (imaging (c) and quantification (f); the arrowheads denote enlarged areas). d, The formation of invadopodia-like structures after transfection (Clontech-N1, containing human TKS5-mNeonGreen), and immunofluorescence analysis of MT1-MMP (red) using Airyscan microscopy. g, Cell circularity analyses (ImageJ; gels). Scale bars, and . Huh7 cells in low- or high-viscoelasticity hydrogels were incubated with control
IgG or integrin (ITGB1) blocking antibodies. Cell proliferation (h; EdU), YAP target and cell circularity ( ) were analysed. expression in cells in low- or high-viscoelasticity hydrogels. , PLAs depict direct binding between TNS1 and integrin (ITGB1) in high-viscoelasticity hydrogels ( ; scale bar, ). m, The PLA signal was analysed ( 30 cells in 5 gels per group, , each). , Huh7-Cas9 cells were transfected with plasmids containing CRISPR guide RNA for TNS1 (sgTNS1), integrin (sgITGB1) or control sgRNA (NC) and embedded in low- or high-viscoelasticity hydrogels. The proliferation (n), YAP activation (o) and cell circularity (p) were analysed. each. q, Schematic of TNS1, which functions as a key component of the ECM mechanosensor complex by binding to integrin in high-viscoelasticity ECM. The diagram was created using BioRender. Data are mean s.e.m. values refer to independent experiments. Statistical analysis was performed using two-tailed unpaired -tests ( and ) and one-way ANOVA followed by Tukey’s multiple-comparison test ( and ).
number of transformed foci decreased compared with in the control-sgRNA-injected mice (Extended Data Fig. 12b-d, respectively), and YAP targets Ctgf (also known as Ccn2) and Cyr61 (Ccn1) had lower expression (Extended Data Fig.12e). Together, these data suggest that TNS1 is part of a molecular clutch that mediates the mechanical linkage between ECM-bound integrins and the actomyosin cytoskeleton responding to high viscoelasticity (Fig. 5q).
Discussion
Here we show that AGEs in the liver ECM create a faster stress-relaxing viscoelastic niche leading to the activation of mechanosignalling promoting HCC. Although matrix stiffness in advanced fibrosis/cirrhosis and its effects on cancer progression have been extensively studied, our data are the first, to our knowledge, to demonstrate how changes in matrix viscoelasticity, independent of stiffness, affect HCC growth. This is clinically very relevant as increasing viscoelasticity could be a risk factor foretelling more invasive features of HCC in NASH/T2DM. Current guidelines exclude precirrhotic patients from HCC screening
paradigms; therefore, new viscoelasticity-based imaging approaches will need to be developed to identify the population at risk. T2DM is a major risk factor not only for liver cancer progression but also in breast , colon and pancreatic cancer , and this may point to the crucial role of a more viscoelastic matrix in patients with diabetes.
Collagen cross-linking mediated by AGEs has been thought to contribute to increasing stiffness similarly to LOXI2 or TTG, modifying the helical structure of collagen . However, our studies identified that, in certain contexts, increased collagen cross-linking leads to weakly bound shorter fibres with lower interconnectivity, together promoting a viscoelastic niche. This in turn facilitates changes in cellular shape, cytoskeletal reorganization and the formation of invadopodia-like structures . This could be relevant to not only the liver peritumoral matrix, but also other cancers in which changes in viscoelasticity have been observed, but are not yet implicated functionally for progression .
We also identified the major role of the TNS1-integrin -RhoA-YAP mechanotransduction pathway responding to increasing viscoelasticity. While the role of YAP activation in various cancers is known, as is its
role in responding to viscoelasticity in vitro , the in vivo role of YAP as an inducer of cancer progression in response to viscoelasticity changes was previously unclear. Furthermore, another element of interest relates to the role of TNS1 as a key mechanosensory in this integrin-YAP signalling pathway. TNS1 regulating and sustaining the activity of the molecular clutch could be essential for protrusion formation and migratory activity of cells , and these can be further explored in future studies.
In conclusion, we identified the central role of increasing viscoelasticity in the liver tumour niche. Viscoelasticity-activated mechanocellular pathways promise to be a diagnostic and/or therapeutic areas in NASH/ T2DM-related HCC and beyond.
Online content
Any methods, additional references, Nature Portfolio reporting summaries, source data, extended data, supplementary information, acknowledgements, peer review information; details of author contributions and competing interests; and statements of data and code availability are available at https://doi.org/10.1038/s41586-023-06991-9.
Cox, T. R. The matrix in cancer. Nat. Rev. Cancer 21, 217-238 (2021).
Piersma, B., Hayward, M. K. & Weaver, V. M. Fibrosis and cancer: a strained relationship. Biochim. Biophys. Acta Rev. Cancer 1873, 188356 (2020).
Schrader, J. et al. Matrix stiffness modulates proliferation, chemotherapeutic response, and dormancy in hepatocellular carcinoma cells. Hepatology 53, 1192-1205 (2011).
McGlynn, K. A., Petrick, J. L. & El-Serag, H. B. Epidemiology of hepatocellular carcinoma. Hepatology 73, 4-13 (2021).
Negro, F. Natural history of NASH and HCC. Liver Int. 40, 72-76 (2020).
Kramer, J. R. et al. Effect of diabetes medications and glycemic control on risk of hepatocellular cancer in patients with nonalcoholic fatty liver disease. Hepatology 75, 1420-1428 (2022).
Henning, C., Smuda, M., Girndt, M., Ulrich, C. & Glomb, M. A. Molecular basis of maillard amide-advanced glycation end product (AGE) formation in vivo. J. Biol. Chem. 286, 44350-44356 (2011).
McVicar, C. M. et al. Role of the receptor for advanced glycation endproducts (RAGE) in retinal vasodegenerative pathology during diabetes in mice. Diabetologia 58, 1129-1137 (2015).
Colhoun, H. M. et al. Total soluble and endogenous secretory receptor for advanced glycation end products as predictive biomarkers of coronary heart disease risk in patients with type 2 diabetes: an analysis from the CARDS trial. Diabetes 60, 2379-2385 (2011).
Dehnad, A. et al. AGER1 downregulation associates with fibrosis in nonalcoholic steatohepatitis and type 2 diabetes. J. Clin. Invest. 130, 4320-4330 (2020).
Andriotis, O. G. et al. Hydration and nanomechanical changes in collagen fibrils bearing advanced glycation end-products. Biomed. Opt. Express 10, 1841-1855 (2019).
Chaudhuri, O., Cooper-White, J., Janmey, P. A., Mooney, D. J. & Shenoy, V. B. Effects of extracellular matrix viscoelasticity on cellular behaviour. Nature 584, 535-546 (2020).
Adebowale, K. et al. Enhanced substrate stress relaxation promotes filopodia-mediated cell migration. Nat. Mater. 20, 1290-1299 (2021).
Charrier, E. E., Pogoda, K., Wells, R. G. & Janmey, P. A. Control of cell morphology and differentiation by substrates with independently tunable elasticity and viscous dissipation. Nat. Commun. 9, 449 (2018).
Nam, S. et al. Cell cycle progression in confining microenvironments is regulated by a growth-responsive TRPV4-PI3K/Akt-p27 signaling axis. Sci. Adv. 5, eaaw6171 (2019).
Wisdom, K. M. et al. Matrix mechanical plasticity regulates cancer cell migration through confining microenvironments. Nat. Commun. 9, 4144 (2018).
Elosegui-Artola, A. et al. Matrix viscoelasticity controls spatiotemporal tissue organization. Nat. Mater. 22, 117-127 (2023).
Farrell, G. et al. Mouse Models of nonalcoholic steatohepatitis: toward optimization of their relevance to human nonalcoholic steatohepatitis. Hepatology 69, 2241-2257 (2019).
Febbraio, M. A. et al. Preclinical models for studying NASH-driven HCC: how useful are they? Cell Metab. 29, 18-26 (2019).
Tao, J. et al. Modeling a human hepatocellular carcinoma subset in mice through coexpression of met and point-mutant -catenin. Hepatology 64, 1587-1605 (2016).
Naomi, R., Ridzuan, P. M. & Bahari, H. Current insights into collagen type I. Polymers 13, 2642 (2021).
Gautieri, A. et al. Advanced glycation end-products: mechanics of aged collagen from molecule to tissue. Matrix Biol. 59, 95-108 (2017).
Dandia, H., Makkad, K. & Tayalia, P. Glycated collagen-a 3D matrix system to study pathological cell behavior. Biomater. Sci. 7, 3480-3488 (2019).
Hudson, D. M., Archer, M., King, K. B. & Eyre, D. R. Glycation of type I collagen selectively targets the same helical domain lysine sites as lysyl oxidase-mediated cross-linking. J. Biol. Chem. 293, 15620-15627 (2018).
Ban, E. et al. Mechanisms of plastic deformation in collagen networks induced by cellular forces. Biophys. J. 114, 450-461 (2018).
Munster, S. et al. Strain history dependence of the nonlinear stress response of fibrin and collagen networks. Proc. Natl Acad. Sci. 110, 12197-12202 (2013).
Nam, S., Hu, K. H., Butte, M. J. & Chaudhuri, O. Strain-enhanced stress relaxation impacts nonlinear elasticity in collagen gels. Proc. Natl Acad. Sci. USA 113, 5492-5497 (2016).
Joo, J. S. et al. TEAD2 as a novel prognostic factor for hepatocellular carcinoma. Oncol. Rep. 43, 1785-1796 (2020).
Blangy, A. Tensins are versatile regulators of Rho GTPase signalling and cell adhesion. Biol. Cell 109, 115-126 (2017).
Haynie, D. T. Molecular physiology of the tensin brotherhood of integrin adaptor proteins. Proteins 82, 1113-1127 (2014).
Hall, E. H., Daugherty, A. E., Choi, C. K., Horwitz, A. F. & Brautigan, D. L. Tensin1 requires protein phosphatase-1alpha in addition to RhoGAP DLC-1 to control cell polarization, migration, and invasion. J. Biol. Chem. 284, 34713-34722 (2009).
Elosegui-Artola, A. et al. Mechanical regulation of a molecular clutch defines force transmission and transduction in response to matrix rigidity. Nat. Cell Biol. 18, 540-548 (2016).
Engler, A. J., Humbert, P. O., Wehrle-Haller, B. & Weaver, V. M. Multiscale modeling of form and function. Science 324, 208-212 (2009).
Shih, Y. P., Sun, P., Wang, A. & Lo, S. H. Tensin1 positively regulates RhoA activity through its interaction with DLC1. Biochim. Biophys. Acta 1853, 3258-3265 (2015).
Furth, N. & Aylon, Y. The LATS1 and LATS2 tumor suppressors: beyond the Hippo pathway. Cell Death Differ. 24, 1488-1501 (2017).
Escala-Garcia, M. et al. Breast cancer risk factors and their effects on survival: a Mendelian randomisation study. BMC Med. 18, 327 (2020).
Soltani, G. et al. Obesity, diabetes and the risk of colorectal adenoma and cancer. BMC Endocr. Disord. 19, 113 (2019).
Tsilidis, K. K., Kasimis, J. C., Lopez, D. S., Ntzani, E. E. & Ioannidis, J. P. Type 2 diabetes and cancer: umbrella review of meta-analyses of observational studies. Brit. Med. J. 350, g7607 (2015).
Wojciechowska, J., Krajewski, W., Bolanowski, M., Krecicki, T. & Zatonski, T. Diabetes and cancer: a review of current knowledge. Exp. Clin. Endocrinol. Diabetes 124, 263-275 (2016).
Andersen, D. K. et al. Diabetes, pancreatogenic diabetes, and pancreatic cancer. Diabetes 66, 1103-1110 (2017).
Yamauchi, M., Barker, T. H., Gibbons, D. L. & Kurie, J. M. The fibrotic tumor stroma. J. Clin. Invest. 128, 16-25 (2018).
Levental, K. R. et al. Matrix crosslinking forces tumor progression by enhancing integrin signaling. Cell 139, 891-906 (2009).
Jones, M. G. et al. Nanoscale dysregulation of collagen structure-function disrupts mechano-homeostasis and mediates pulmonary fibrosis. eLife 7, e36354 (2018).
Lyu, C. et al. Advanced glycation end-products as mediators of the aberrant crosslinking of extracellular matrix in scarred liver tissue. Nat. Biomed. Eng. 7, 1437-1454 (2023).
Rubiano, A. et al. Viscoelastic properties of human pancreatic tumors and in vitro constructs to mimic mechanical properties. Acta Biomater. 67, 331-340 (2018).
Sinkus, R. et al. Viscoelastic shear properties of in vivo breast lesions measured by MR elastography. Magn. Reson. Imaging 23, 159-165 (2005).
Lee, H. P., Stowers, R. & Chaudhuri, O. Volume expansion and TRPV4 activation regulate stem cell fate in three-dimensional microenvironments. Nat. Commun. 10, 529 (2019).
Chaudhuri, O. et al. Hydrogels with tunable stress relaxation regulate stem cell fate and activity. Nat. Mater. 15, 326-334 (2016).
Publisher’s note Springer Nature remains neutral with regard to jurisdictional claims in published maps and institutional affiliations.
All human samples were de-identified and exempted (exemption 4). Human liver samples were obtained from the Stanford Diabetes Research Center (SDRC), Donor Network West (DNW), Stanford Tissue Bank and Clinical Biospecimen Repository and Processing Core (CBRPC) of the Pittsburgh Liver Research Center (PLRC). This was approved by Stanford University Institutional Review Board (IRB, 67378) and the Pittsburgh Liver Research Center Review Board. Histology was evaluated for necroinflammation, hepatocellular ballooning, ductular reaction and fibrosis by a hepatopathologist in a blinded manner, and non-alcoholic fatty liver disease activity score (NAS) scores were provided. Detailed information about the donors, including sex, age, diagnosis and NAS score, are summarized in Supplementary Table 1.
Animal studies
All animal experiments were conducted according to the experimental procedures approved by the Institutional Animal Care and Use Committee at Stanford University and Palo Alto VA. Mice were maintained at temperatures and humidity ranges of 20 to and to 70%, respectively. Mice were housed in standard cages under light/dark cycles with ad libitum access to water and food unless otherwise indicated. Mice were placed on control chow or a FFD ( protein, fat and carbohydrate, AIN-76A) supplemented with high-fructose corn syrup in the drinking water at a final concentration of for up to 14 weeks, or HiAD (prepared by cooking FFD at for 20 min ) as previously described supplemented with high-fructose water. Wild-type C57BL/6J male mice (aged 8 to 10 weeks) were purchased from the Jackson Laboratory. RAGE mice on the C57B6 background were gifted by B. Arnold. RAGE mice were generated by crossing mice with Albumin-cre mice (Jackson Laboratory) for several generations. Male mice and mice aged 8 to 10 weeks were used. To generate hepatocyte transgenic AGER1 (Ddost) mice, wild-type mice were injected with adeno-associated virus 8 (AAV8)-control green fluorescent protein (AAV8-control) or AAV8-thyroxine-binding globulin-AGER1 recombinase (AAV8-AGER1) ( genome copies, Vector BioLabs) at the end of week 5 of feeding (the rationale of the specific targeting in hepatocyte has been previously reported) . To study the inhibition of AGE formation or AGE-protein cross-linking, wild-type mice fed with HiAD were injected intraperitoneally daily with pyridoxamine hydrochloride (Sigma-Aldrich) ( 60 mg per kg, daily) , alagebrium (ALT-711) (Sigma-Aldrich, 1 mg per or vehicle (Tris-HCl), from the fifth week of feeding. At the time of euthanasia, photographs of the livers were taken, and the number and the size of lesions on the surface were recorded.
Hydrodynamic tail vein injection and plasmid preparation
Oncogenic plasmids were delivered to the mouse liver by hydrodynamic tail vein injection as previously described . In brief, pT3-EF1 -h-hMET, pT3-EF1 h-WT- -catenin-MYC-tag, pT3-EF1 -h-S45Y-mutant- -catenin-MYC-tag and pCMV/SB transposase were from S. P. S. Monga’s laboratory. Plasmids used for in vivo experiments were purified using the Invitrogen Endotoxin-free Maxi prep kit (Sigma-Aldrich). A combination of of pT3-EF5-hMET and of pT3-EF5 -WT- -catenin-MYC or pT3-EF5 -S45Y- -catenin-MYC, along with of was diluted in 1 ml of endotoxin-free saline (AdipoGen), filtered through 0.22 mm filter (Millipore), and injected into the tail vein of mice in 5 to 7 s at the at the end of week 7 of chow, FFD or HiAD feeding. To inhibit YAP activity, the mice were injected with dn-TEAD2 (pT3-EF1 -dnTEAD2, ) or negative control vector (empty pT3-EF1 ), (from S. P. S. Monga’s laboratory) by hydrodynamic tail vein injection at the end of week 7 of chow or HiAD feeding with hMET, S45Y-mutant- -catenin and SB. To knockdown
TNS1, mice were injected with a CRISPR-Cas9-based vector linking two sgRNAs targeting Tns1 exon 1 and exon 7 (pX333-TNS1, ) or negative control vector (empty pX333, ) by hydrodynamic tail vein injection at the end of seventh week of chow or HiAD feeding at the same time as with hMET, S45Y-mutant- -catenin and SB. The sequences of the sgRNAs used in this study are provided in Supplementary Table 2.
Mice were monitored 3 days per week for any sign of pain or distress, and the body weight and body condition score were evaluated after hydrodynamic tail vein injection. The mice were immediately euthanized if they lost more than of their body weight or if they had a body condition score of 2 or less during that time. The tumour size (macroscopic) never reached more than 3 mm .
Histology, immunohistochemistry and early focus quantification
Paraffin-embedded tissue samples were cut into sections, deparaffinized and rehydrated. For antigen retrieval, slides were boiled in citrate buffer ( ) using a microwave oven on high power for 5 min and cooled down to room temperature. After incubation in aqueous to quench the endogenous peroxidase, the sections were washed in PBST (PBS with Tween-20, ) washing buffer, blocked with 5% goat serum (EMD Millipore) diluted in PBST at room temperature for 1 h and incubated with primary antibodies diluted in goat serum in PBST at overnight.
For immunohistochemistry, slides were incubated with appropriate biotinylated secondary antibodies (Supplementary Table3) for1 h, and then processed according to the ABC Peroxidase Standard Staining Kit (Thermo Fisher Scientific) for 30 min . The slides were stained with 3,3′-diaminobenzidine (Abcam) for 5 s to 5 min and counterstained with haematoxylin (Thermo Fisher Scientific) for 45 s . The images were scanned using the Leica Aperio AT2 system at Stanford Human Pathology/Histology Service Center. Serial sections were incubated with GS and MYC-tag primary antibodies, and a cluster of cells (at least 20 cells) positive both for GS and MYC-tag were counted as early foci. The antibodies used in this study are shown in Supplementary Table 3.
Measurement of AGE content
AGEs were measured using the OxiSelect Advanced Glycation End Product Competitive ELISA Kit (Cell Biolabs) in the serum and the liver homogenate according to the manufacturer’s instructions. In brief, 10 mg liver samples were homogenized in PBS. After measuring the protein concentration, protein was added to a 96-well ELISA plate and incubated for 1 h at room temperature. After incubation with the secondary HRP-conjugated anti-AGE antibodies, the reaction was halted with a stop solution, and the plates were read at 450 nm .
RNA extraction, reverse transcription and RT-qPCR
According to the manufacturer’s recommendations, total RNA was extracted from snap-frozen liver tissues and cells using the RNeasy mini kit (Qiagen). Complementary cDNA was created from an identical amount of RNA using the iScript cDNA synthesis kit (Bio-Rad). The PowerUp SYBR Green PCR Master Mix (Applied Biosystems) was used for quantitative PCR with reverse transcription (RT-qPCR) on the 7900 HT machine (Applied Biosystems), and the data were evaluated using the technique. As an endogenous control, Arbp (also known as RplpO) and GAPDH were used to standardize the data in mouse and human, respectively. A list of the primer sequences used in this study is provided in Supplementary Table 4.
AFM
Measurements on frozen liver tissues were performed on livers embedded in OCT compound (Sakura), snap frozen by direct immersion into liquid nitrogen and cut into sections on the Leica CM1900-13 cryostat. The samples were kept in a protease inhibitor cocktail during the AFM analyses (Roche Diagnostic). For the hydrogel mapping
collagen or AGE-modified collagen was neutralized with DMEM and and the hydrogels were kept overnight on . The Bruker Resolve BioAFM system was used to take measurements (Bruker). For the indentation, Novascan Tech modified silicon nitride cantilevers ( ) with a borosilicate glass spherical tip (diameter 10 and , respectively) were used.
For each session, cantilevers were calibrated using the thermal oscillation method. AFM force maps were performed on fields. Each experimental group included at least four different human or mouse samples, with two sections from each, and three different areas generated per section. For hydrogel mapping, each group included at least four different gels, and five different areas generated per gel. Data analyses were performed using the Hertz model in NanoScope Analysis v.1.9. and Mountains SPIP v.9.
Rheometry analysis of the human and mouse livers
Measurements were optimized to assess storage modulus, loss modulus, loss tangent and stress relaxation based on methods previously described . In brief, liver samples were prepared using an 8 mm diameter punch (Integra Miltex). The height of the slices ranged from 3 to 5 mm in the uncompressed state. The samples were kept hydrated during all of the experiments with DMEM. Parallel plate shear rheometry was performed on the ARES-G2 rheometer (TA instruments) at room temperature using TA TRIOS software v.5.1.1 (TA instruments). For all of the measurements, the upper plate was initially lowered to touch the sample, and 0.01 N of nominal initial force ( ) was applied to ensure adhesive contact of the sample with the plates. Measurements were taken first with a dynamic time sweep test ( constant strain, oscillation frequency 1 radian , measurements taken for 600 s ), then stress relaxation ( initial strain, measurements taken for 600 s ).
Measurement of total and insoluble collagen
The hydroxyproline assay for total liver collagen was performed as previously described . In brief, liver samples were homogenized and denatured in 6 N HCl . Hydrolysed samples were then dried and washed three times with deionized water, followed by incubation in 50 mM chloramine T oxidation buffer for 20 min at room temperature. The samples were incubated with 3.15 M perchloric acid (Sigma-Aldrich) for 5 min , then with -dimethylaminobenzaldehyde (Sigma-Aldrich). The absorbance of each sample was measured.
For insoluble collagen, the liver or collagen gel was first homogenized in 0.5 M acetic acid at a 1:4 ratio (for example, for 200 mg liver) to make liver homogenate. Next, of liver homogenate was added onto 1 ml of 0.5 M acetic acid and the tubes rotated at overnight. The samples were centrifuged at for 30 min to collect the pellet, resuspended in pepsin ( in 0.5 M acetic acid) and incubated at overnight. The next day, the samples were centrifuged and the pellets were collected. The samples were then analysed using the hydroxyproline assay, described previously .
Preparation of AGE-BSA
AGE-BSA was prepared as previously described . In brief, glycolaldehyde (Sigma-Aldrich) was dissolved in BSA/PBS to a final concentration of 33 mM . The solutions were incubated at for 72 h , followed by dialysis against PBS. The dialysed solutions were sterilized with filters, and aliquots were stored at .
Preparation of AGE-modified collagen and gels
Collagen type I (telopeptide intact, Corning, 354236, Corning collagen I, rat tail, used in all experiments) was incubated with in AGE-BSA acetic acid (Merck) to obtain collagen solution at for 4 weeks. BSA was mixed with collagen as the control. Alagebrium chloride (ALT-711, ) was added as the AGE cross-linking inhibitor. Collagen gels were polymerized by mixing AGE-modified or non-modified collagen solution with
PBS and neutralized with (Merck) and incubated at for 90 min leading to the formation of gels. For most gels, collagen was used.
Alginate preparation
According to the manufacturer, low-molecular-mass, ultrapure sodium alginate (Provona UP VLVG, NovaMatrix) with a molecular mass of was used for fast-relaxing substrates. For slow-relaxing substrates, sodium alginate (high molecular mass) was used (FMC Biopolymer, Protanal LF 20/40, high molecular mass, 280 kDa). Alginate was treated with activated charcoal, dialysed against deionized water for days (molecular mass cut-off, ), sterile-filtered, lyophilized and then reconstituted to in serum-free DMEM (Gibco). The use of low/high-molecular-mass alginate resulted in high/low viscoelasticity IPNs.
Imaging of collagen fibrils
Mouse livers were decellularized in situ by detergent ( (w/v), sodium deoxycholate, 250 ml per mouse) and water ( 50 ml per mouse) perfusion at a pump speed of . After the final perfusion, the livers were removed and washed overnight in PBS. For AGE-modified collagen gels, the samples were prepared as previously described. Gels were imaged 1 day after formation.
For SHG imaging, all of the samples were imaged using the Leica TCS SP5 multiphoton confocal microscope or the Leica Stellaris 8 DIVE upright confocal microscope. The excitation wavelength was tuned to 840 nm , and a narrow band-pass emission controlled by a slit was used for detecting the SHG signal of collagen. The images were recorded using an inverted confocal laser-scanning microscope (Leica TCSSP8) equipped with a water-immersion objective for confocal reflection imaging. An laser at 488 nm was used to illuminate the sample, and the reflected light was detected with photomultiplier tube (PMT) detectors. Scans were at 1,024 pixels, and all of the images were taken into the samples. Collagen measurements were performed using CT-Fire software (v.2.0 beta) (https://loci.wisc.edu/ software/ctfire) and ImageJ v.1.53t (https://imagej-nih-gov.stanford. idm.oclc.org/ij/).
IPN 3D hydrogel formation
Alginate was transferred to a 1.5 ml Eppendorf tube (a polymer tube) and kept on ice for each viscoelastic gel. For rBM-IPNs, alginate was mixed 30 times before adding rBM (Corning) at . Collagen-IPNs were created by diluting and neutralizing AGE-modified or AGE-unmodified collagen gels with DMEM and 1 M NaOH (Merck) at . All substrates had a final concentration of alginate, rBM or collagen after additional DMEM was added. This was pipette-mixed, and the resulting mixture was kept on ice. Calcium sulfate was added to 1 ml Luer lock syringes (Cole-Parmer) and stored on ice to maintain the constant Young’s moduli of the substrates with high and low viscoelasticity. The polymer mixes were divided into individual 1 ml Luer lock syringes (polymer syringes) and placed onto ice as well. The polymer syringe was linked to the calcium sulfate syringe to create gels. The two solutions were quickly combined using 30 pumps on the syringe handles, and the resulting mixture was placed into a well of an eight-well Lab-Tek plate (Thermo Fisher Scientific) that had been precoated with rBM. After moving the Lab-Tek dish to a incubator, the gel was allowed to form for 1 h before a full medium was added.
Mechanical characterization of IPNs
Rheology experiments were performed using a stress controlled AR2000EX rheometer (TA Instruments). IPNs were directly deposited onto the lower Peltier plate for rheology testing. The gel was then slowly contacted by a 25 mm flat plate, creating a 25 mm disk gel. To stop dehydration, mineral oil (Sigma-Aldrich) was applied to the gel’s
edges. The storage and loss moduli had equilibrated by the time the time sweep was done, which was at and strain.
For the stress relaxation experiments, after the time sweep, a constant strain of was applied to the gel at , and the resulting stress was recorded over the course of 4 h .
Cell culture, transfection and CRISPR-Cas9-mediated TNS1 and integrin knockdown
Human HCC cell lines Huh7 (gift from P. Sarnow) and Hep3B (purchased from ATCC) were cultured in high-glucose DMEM (Gibco) with 10% fetal bovine serum (FBS, Gibco) with 1% penicillin-streptomycin (Life Technologies). All cells were cultured at in .
TNS1 was knocked down in Huh7 and Hep3B cells using TNS1 sgRNAs or integrin sgRNAs. A control sgRNA sequence was used as the negative control. sgRNAs were cloned into pMCB306 (Addgen plasmid 89360, sgRNA expression vector with GFP, puromycin resistance), then co-transfected into cells with lentiCas9-Blast (Addgen plasmid 52962, expresses human codon-optimized Streptococcus pyogenes Cas9 protein and blasticidin resistance from the EFS promoter). Transfected cells were selected by puromycin and tested for TNS1 or integrin expression 2 days after transfection. A list of the sequences of the sgRNAs used in this study is provided in Supplementary Table 2.
For PTB-domain-deleted TNS1 (dd-TNS1) assays, dd-TNS1 or a full-length TNS1 was cloned into a tdTomato-N1 vector (gift from S.-H. Lo). Huh7 cells were transfected with these plasmids and cultured for 24 h before encapsulation in IPNs hydrogels.
Huh7 or Hep3B cells were transfected with plasmids containing the human TKS5 (also known as SH3PXD2A) with either mNeonGreen or mScarlet tag (gift from L. Hodgson) for all invadopodia analyses.
3D cell encapsulation in IPNs
For analyses of YAP activation, invadopodia formation and proliferation, Huh7 cells were serum-starved overnight and encapsulated in IPNs. In brief, cells were washed with PBS, trypsinized using 0.05% trypsin/EDTA, washed once, centrifuged and resuspended in serum-free medium. The concentration of cells was determined using the Vi-Cell Coulter counter (Beckman Coulter). After Matrigel was mixed with the alginate, cells were added to this polymer mixture and deposited into a cooled syringe. The solution was then vigorously mixed with a solution containing and deposited into wells of a chambered cover glass (LabTek). The final concentration of Matrigel and alginate was and , respectively. and 50 mM were used to generate varied stiffness of IPNs with and 5 kPa , respectively. The final concentration of cells was cells per ml of IPN. The cell-laden hydrogels were gelled in an incubator at and for 60 min and then were cultured in a DMEM medium containing 10% FBS. After 1 day, cells were collected for RT-qPCR, western blotting and immunostaining analysis.
Inhibitors
Inhibitors in the 3D cell culture were used at the following concentrations: Y-27632 to inhibit ROCK (Abcam); blebbistatin (Abcam) to inhibit myosin II; and monoclonal integrin- -blocking antibody (Abcam, P5D2). Vehicle-alone controls for these inhibitors were as follows: DMSO for blebbistatin, and latrunculin-a; deionized water for Y-27632; and IgG nonspecific antibody (Sigma-Aldrich, I5381) for integrin- -blocking antibody. Y-27632 and blebbistatin were added to the culture medium directly. Integrin -blocking antibody was incubated with Huh7 cells on ice for 1 h before encapsulation in IPNs and added to the culture medium directly.
RNA-seq, bioinformatics and KEGG analyses
RAGE (wild-type) mice were fed chow, FFD or HiAD for 14 weeks. A group of HiAD-fed mice was injected intraperitoneally daily with PM. A cohort of mice was placed on a HiAD for 14 weeks as
described previously . RNA was prepared from 2-3 mice per group, and RNA-seq was performed at Novogene with paired-end 150 bp reads (NovaSeq 6000 Sequencing System, Illumina). Gencode gene annotations version M18 and the mouse reference genome major release GRCm38 was derived from https://www.gencodegenes.org/. Dropseq tools v.1.1249 were used for mapping the raw sequencing data to the reference genome. The resulting UMI-filtered count matrix was imported into R v.3.4.4. Before differential expression analysis using Limma v.3.40.650, sample-specific weights were estimated and used as coefficients alongside the experimental groups as a covariate during model fitting with Voom. -tests were used for determining differentially ( ) regulated genes between all possible experimental groups. GSEA was conducted using the preranked GSEA method within the KEGG databases with the online tool g:Profiler (https:// biit.cs.ut.ee/gprofiler/gost). RNA-seq heat maps and unsupervised hierarchical clustering was performed with g:Profiler. RNA-seq data are available under Gene Expression Omnibus accession number GSE245016.
Protein extraction and western blotting
Cells were washed with PBS and lysed with RIPA buffer. The homogenate was centrifuged, and the supernatant was collected. Protein concentrations were determined using the Pierce BCA Protein Assay Kit (Thermo Fisher Scientific). Protease inhibitor (Roche) and phosphatase inhibitor (Roche) were added to all the lysis procedures mentioned above, and of the protein samples were loaded onto the SDS-polyacrylamide gel. The proteins were transferred to a polyvinylidene difluoride membrane or nitrocellulose membrane, which was blocked with 5% BSA in TBST and then incubated with primary antibodies at overnight. The blots were washed with TBST and further incubated with horseradish-peroxidase-conjugated secondary antibodies. The signal was detected by adding Western-Bright enhanced chemiluminescence substrate (Advansta) or SuperSignal West Pico PLUS Chemiluminescent Substrate (Thermo Fisher Scientific) and imaged with film or the iBright CL1500 imaging system (Thermo Fisher Scientific). The images were processed and analysed using NIH ImageJ (v.1.53t) and iBright Analysis software v.5.2.1 (Thermo Fisher Scientific). The antibodies used in this study were shown in Supplementary Table 3.
Fluorescence immunostaining and microscopy
Frozen sections of livers or gel-embedded cells were washed twice with PBS and fixed with paraformaldehyde at overnight. Sections were permeabilized in PBS with 0.4% (v/v) Triton X-100 for 10 min . After blocking with 5% goat serum in PBST at room temperature for 1 h , cells were incubated with primary antibodies (Supplementary Table 3) diluted in goat serum in PBST at overnight. The slides were washed and then incubated with secondary antibodies at room temperature for 1 h . Coverslips were washed with PBST between incubations and mounted with an anti-fade mounting medium with DAPI. Fluorescence images were taken using the Leica TCS SP8, multi-photon Leica Stellaris 8 DIVE upright Confocal, and Zeiss Airyscan2 LSM980 systems. Images were processed using NIH ImageJ (v.1.53t). To quantify cell circularity and cell area, the confocal images of cells were analysed in ImageJ v.1.53t (https://imagej-nih-gov.stanford.idm.oclc.org/ij/). Circularity, mathematically calculated as area , ranges from 0 to 1 , with a value of 1 being a perfect circle.
PLA
The Duolink proximity ligation assay kit (Sigma-Aldrich) was used to determine the interaction between TNS1 and integrin in Huh7 cells. Reagents were used according to the manufacturer’s instructions, and the steps were optimized. In brief, anti-TSN1 and anti-integrin were used as the primary antibodies. The primary antibodies bound to a pair of oligonucleotide-labelled secondary antibodies (PLA probes), the hybridizing connector oligos joined the PLA probes if they were close
by and the ligase created the DNA template needed for rolling-circle amplification (RCA). Labelled oligos hybridized to the complementary sequences in the amplicon and produced discrete red fluorescent signals that could be seen by confocal microscopy (Leica Microsystems). NIH Image J (v.1.53t) software was used to count the signal, and the average counts were used for the plot.
Simulation modelling
In this study, we used an agent-based model for simulating the discrete structure of collagen matrices. Details of the model and all of the parameter values used in the model are provided in the Supplementary Methods and Supplementary Table 5. The computational domain is rectangular with in the and directions. A periodic boundary condition exists only in the and z directions. In simulations, the motions of the cylindrical elements are updated at each time step through the Langevin equation and the Euler integration scheme. Three types of matrices were used in this study: fibrillar matrix; long, tight-bundle matrix; and short, loose-bundle matrix. Fibril assembly is initiated by the nucleation of seed fibrils through the appearance of one cylindrical segment in random positions, followed by elongation up to either or through the addition of segments without consideration of depolymerization. Effective collagen concentration calculated using the specific volume of collagen ( ) is . The fibrillar matrix is constructed with cross-linkers in the absence of bundlers (Extended Data Fig. 4d,h). During the assembly of the fibrillar matrix, individual fibrils are interconnected by cross-linkers of which two binding sites bind to any part of two fibrils. There is no preference for a cross-linking angle in this process. The long, tight bundle matrix is assembled with cross-linkers in the presence of bundlers that connect individual fibrils in a parallel, staggering manner into tight bundles (Extended Data Fig. 4g,i). Cross-linkers connect fibrils within each bundle or fibrils belonging to different bundles. The short, loose-bundle matrix is created by bundlers that connect fibrils at their ends with a specific angle (Extended Data Fig. 4e,f,j). While the bundlers are permanently bound to fibrils, the cross-linkers can unbind from fibrils at a rate that exponentially increases with an increasing force, following Bell’s law. Fibrils are permanently bound to two boundaries normal to the direction (that is, boundary located at and boundary located at ). After completion of matrix assembly, strain is applied to the boundary in the direction, whereas the boundary is fixed. After reaching the strain, the strain is held at a constant level to measure stress relaxation.
Statistical analyses
At least three biological replicates were performed for all in vivo experiments, and in vitro experiments were repeated at least three times. Data are presented as mean s.e.m. Statistical analyses were performed using GraphPad Prism v.10.0.3 (GraphPad Software). Normality distribution was assessed using the Kolmogorov-Smirnov test. Two-tailed unpaired -tests and one-way ANOVA with Tukey tests were used to analyse data with a normal distribution. Data with a non-normal distribution were analysed using Wilcoxon rank-sum tests and KruskalWallis tests with Dunn’s test. was considered to be statistically significant.
Reporting summary
Further information on research design is available in the Nature Portfolio Reporting Summary linked to this article.
Data availability
Data have been deposited in public databases. RNA-seq data are available under the accession number GSE245016. The mouse reference
genome major release GRCm38 is available online (https://www.gencodegenes.org/). Source data are provided with this paper.
Code availability
Codes used in the study are available at GitHub (https://github.com/ ktyman2/liverCancer.git).
49. Patel, R. et al. Effect of dietary advanced glycation end products on mouse liver. PLoS ONE 7, e35143 (2012).
50. Yan, Z., Yan, H. & Ou, H. Human thyroxine binding globulin (TBG) promoter directs efficient and sustaining transgene expression in liver-specific pattern. Gene 506, 289-294 (2012).
51. Muellenbach, E. A. et al. Interactions of the advanced glycation end product inhibitor pyridoxamine and the antioxidant -lipoic acid on insulin resistance in the obese Zucker rat. Metab. Clin. Exp. 57, 1465-1472 (2008).
52. Zieman, S. J. et al. Advanced glycation endproduct crosslink breaker (alagebrium) improves endothelial function in patients with isolated systolic hypertension. J. Hypertens. 25, 577-583 (2007).
53. Ulrich, P. & Zhang, X. Pharmacological reversal of advanced glycation end-productmediated protein crosslinking. Diabetologia 40, S157-159 (1997).
54. Zhang, J. et al. TEA domain transcription factor 4 Is the major mediator of yes-associated protein oncogenic activity in mouse and human hepatoblastoma. Am. J. Pathol. 189, 1077-1090 (2019).
55. Perepelyuk, M. et al. Normal and fibrotic rat livers demonstrate shear strain softening and compression stiffening: a model for soft tissue mechanics. PLoS ONE 11, e0146588 (2016).
56. Bettaieb, A. et al. Hepatocyte nicotinamide adenine dinucleotide phosphate reduced oxidase 4 regulates stress signaling, fibrosis, and insulin sensitivity during development of steatohepatitis in mice. Gastroenterology 149, 468-480 (2015).
57. Unno, Y. et al. Glycolaldehyde-modified bovine serum albumin downregulates leptin expression in mouse adipocytes via a CD36-mediated pathway. Ann. N. Y. Acad. Sci. 1043, 696-701 (2005).
58. Guimaraes, E. L., Empsen, C., Geerts, A. & van Grunsven, L. A. Advanced glycation end products induce production of reactive oxygen species via the activation of NADPH oxidase in murine hepatic stellate cells. J. Hepatol. 52, 389-397 (2010).
Acknowledgements Patient samples were obtained using the services of the Diabetes Clinical and Translational Core facility of the Stanford Diabetes Research Center, which is supported by the National Institute of Diabetes and Digestive and Kidney Diseases of the National Institutes of Health under Award Number P30DK116074. We thank the members of the Donor Network West for their cooperation and all of the organ and tissue donors and their families for giving the gift of life and the gift of knowledge through their donation. Patient samples were obtained using the services of the Clinical Biospecimen Repository and Processing Core of the Pittsburgh Liver Research Center (PLRC), which is supported by PLRC grant number P30 DK120531. We thank S. Pneh, J. Zhang, R. Reguram, H. Park and P. Buiga for their technical support; M. Walkiewicz for the AFM; and J. Mulholland, K. Lee and G. X. Wang for assistance with imaging. Part of this work was performed at the Stanford Nano Shared Facilities (SNSF), supported by the National Science Foundation under award ECCS-2026822. Part of this work was performed at Stanford Cell Sciences Imaging Facility (CSIF, RRID:SCR_017787), supported by award numbers 1S10OD010580-01A1, S1ORR02557401 and 1S10OD032300-01 from the National Center for Research Resources (NCRR). Its contents are solely the responsibility of the authors and do not necessarily represent the official views of the NCRR or the National Institutes of Health. This research was supported by funding NIH grants R01DK083283, RO1CA277710 and 1RO1AG060726 (to N.J.T.), SPARK Award (Stanford University to N.J.T.), VA IO1 BX002418 (to N.J.T.) and NCI R37 CA214136 (to O.C.). The study was also funded in part by NIH grants 1R01CA251155 and 1R01CA204586 to S.P.M. R35GM136226 to L.H. and by 1R01GM126256 to O.C. and T.K.
Author contributions W.F. and N.J.T. conceived and designed the study. W.F. performed most of the experiments. W.F. and K.A. established and measured collagen-AGEs-IPN hydrogel and IPN 3D cell culture system. W.F. and L.V. performed mechanical measurements of human, mouse and hydrogel samples. W.F., L.V., Yuan Li., K.K., D.C., G.M. and Y.W. performed the mouse experiments. M.F.R. and T.K. invented and performed the computer simulations. D.K.-C.C., J.T. and E.G.E. helped to establish the CRISPR-Cas9 plasmid and HDI delivery system. W.F., N.A., R.D., A.S., D.G., G.W.C., S.P.M. and N.J.T. performed the human liver sample collection and pathological diagnosis. S.H.L. provided the TNS1 plasmids and critical comments. L.H. provided TKS5 plasmids and critical comments. V.C. helped with the statistical analyses. W.F., L.V. and Yuan Li created the figures. W.F. and N.J.T. wrote the manuscript with input from T.K., O.C., R.G.W. and R.L.B. Funding was acquired by S.P.M., T.K., O.C. and N.J.T. All of the authors provided advice, and read and approved the final manuscript.
Competing interests W.F., N.J.T. and O.C. are listed as inventors on a patent (WO/2023/102546) related to this this research. The other authors declare no competing interests.
Additional information
Supplementary information The online version contains supplementary material available at https://doi.org/10.1038/s41586-023-06991-9.
Correspondence and requests for materials should be addressed to Natalie J. Török.
Peer review information Nature thanks Konstantinos Konstantopoulos and the other,
anonymous, reviewer(s) for their contribution to the peer review of this work. Peer reviewer reports are available.
Reprints and permissions information is available at http://www.nature.com/reprints.
Extended data related to main Fig.2d-g
Extended Data Fig.1 | Mice on HiAD develop earlier and more numerous transformed foci following hydrodynamic injection, and exhibit AGEsdependent higher viscoelasticity (related to the main Fig. 2). a-c. Additional data of the early time point ( 4 w . post-HDI) NASH/HCC model. Mice were fed for 7 weeks either chow, FFD or HiAD. Hydrodynamic injection (HDI) was performed using vectors expressing human MET gene ( ) and the sleeping beauty (SB) transposase combined with a vector expressing either wild-type human -catenin ( pT 3 -EF5a- -catenin-myc, control group) or mutant pT 3 -EF5a-S45Y- -catenin-myc, mutant group). Four weeks after HDI, mice were sacrificed. a. Livers from chow, FFD and HiAD-fed mice after HDI. Arrowheads,
small lesions. Scale bar, 1 cm. b. Quantification of visible liver lesions 4 weeks after HDI ( ). c. Hematoxylin and eosin (H&E) on sequential slides corresponding to the main Fig. 2b. Scale bar, . d-f. Additional data on the model 7 weeks post-HD injection. Representative images (d) and quantification (e) of visible liver lesions ( respectively). Arrowheads, lesions. Scale bar, images, corresponding to the GS/myc images in the main Fig. 2e. Scale bar, . Error bars represent mean s.e.m. n numbers refer to individual mice. One-way ANOVA was used followed by Tukey’s multiple comparison test.
AGER1 induction: Extended data related to main Fig.2h-o
Extended Data Fig. 2 | AGER1 induction or RAGE deletion in hepatocytes reverses fast stress relaxation, and the appearance of transformed foci. a-b. Additional data of NASH-related HCC model combined with AAV8mediated AGER1 induction. Representative stress relaxation curves (a) with or without AGER1 induction. H&E images (b), corresponding to the GS/myc-tag images in the main Fig. 2o. Scale bar, . c-j. Additional data of the NASH-related HCC model in the hepatocyte-specific RAGE deleted (RAGE ) mice. Schematics of the HDI using hMet/SB transposase with wild-type (control) or mutant -catenin in RAGE or mice (c).d. H&E and GS/myc immunohistochemistry were performed on sequential slides, circles represent
foci, arrows indicate transduced cells. Scale bar, m. e. Quantification of foci ( each, 20 areas/per mouse). f. Liver AGEs were lower in RAGE in mice ( each). Rheometry studies, . Liver stiffness ( ) and viscoelasticity (h-j) were assessed ( represents timescales at which the stress is relaxed to half its original value; increase in denotes lower viscoelasticity, ). There was no significant difference in stiffness, but improved viscoelasticity in RAGE mice ( each). Error bars represent mean s.e.m. n refers to individual mice. One-way ANOVA was used followed by Tukey’s multiple comparison test.
Extended Data Fig. 3 | See next page for caption.
Article
Extended Data Fig. 3 | Collagen networks in patients, mouse models and 3D hydrogels. a. Collagen fibres in human liver samples (healthy, NASH, NASH+T2DM) were analysed by second harmonic generation (SHG) microscopy. Areas with bundling is depicted in the NASH + T2DM group (white arrow). Red arrow points to lipid droplets. Maximum intensity projection Z-stack for section thickness of (Representative images from three individual subjects. Scale bar, ). b. In mouse livers images depict a more bundled appearance of collagen network (white arrow) in the HiAD+vehicle group whereas more organized fibres following PM, ALT treatment or after AGER1 reconstitution. Maximum intensity projection Z-stack for section thickness of (Representative images from three individual mice. Scale bar, ). c. Local patches with higher Young’s moduli could be observed in collagen
hydrogels (red arrows). d. The ranges of elastic moduli is depicted in collagen or collagen+AGEs hydrogels. e. Mapping and distribution of hysteresis areas (viscoelasticity).f. Higher frequencies of increased viscoelasticity in collagen+AGEs gels.n=5 gels/each group, 3 representative areas/each gel. For all maps, x’s indicate regions where AFM indentation curves could not be reliably analysed. Scale bar, . To analyse the potential effect of ALT on the matrix, collagen gels +/- ALT-711 were studied by SHG (g, Scale bar, ). Gels from were loaded for rheometry to assess stiffness ( , storage modulus) and viscoelasticity (i, loss tangent; j, ), ( each). Error bars represent mean s.e.m. n numbers refer to independent experiments. Two-tailed, unpaired t-tests for statistical analysis. ns, not significant.
Extended Data Fig. 4 | See next page for caption.
Article
Extended Data Fig. 4 | Agent-based computational model for a fibrillar matrix.a-c. Fibrils (grey, “f”), cross-linkers (yellow, “xl”), and bundlers (red, “bu”) are simplified by cylindrical segments in the model. Cross-linkers connect pairs of fibrils without preference of a cross-linking angle by binding-to-binding sites in any part of two fibrils. By contrast, bundlers connect pairs of fibrils with a specific angle and then maintain the angle. The first binding site of bundlers is always located at the end of fibrils, and the second binding site is located at specified part of fibrils. The specific part available for binding is defined by two boundaries, and , between 0 and 1 . Various bending ( ) and extensional stiffnesses maintain angles and lengths near their equilibrium values, respectively. Stiffnesses, equilibrium lengths, and equilibrium angles are listed in the Supplementary Table 5.d-g. Different types of matrices. Without bundlers, a matrix is comprised of individual fibrils cross-linked to each other, resulting in small mesh size (d). With bundlers which bind only to the ends of fibrils, a matrix consists of short bundles. Depending on the angle between fibrils connected by bundlers, the shape of short bundles varies (e,f). With bundlers that bind to the end of one fibril and the mid of another fibril, a matrix
consists of longer bundles (g). Cross-linkers can connect fibrils within each bundle or fibrils that belong to different bundles. -j:Snapshots of matrices employed for rheological measurements. The length of fibrils used for creating matrices is either (top row) or (bottom row). (Images displayed are representatives of 4 independent simulations).h. Matrix structures with a homogeneous, fine mesh, which is created without bundlers as shown in d.i. Matrix structures consisting of long, tight bundles with different lengths. Fibrils are connected in parallel by bundlers as shown ing. The length of bundles can be changed by varying and . If the second binding site can bind only to part near one end of fibrils (e.g., ), the average length of bundles becomes large. By contrast, if the binding can take place only near the other end of fibrils (e.g., ), is slightly longer than the length of individual fibrils.j. Matrix structures consisting of short, loose bundles with different bundling angles, . In these cases, both binding sites of bundlers bind to the end of fibrils (i.e., ) as shown in and . The shape of the bundle is varied by changing .
Extended Data Fig. 5|Stress relaxation in matrices with different bundle
by a variation in the two boundaries defining the second binding sites for bundlers, and . When these fibrils are connected in parallel ( ) by bundlers, they create long densely packed bundles. The length of these bundles ( ) is determined by the specific point of attachment between the bundler and the fibrils. In cases where bundlers exclusively attach to the fibril ends, the resulting matrix consists of short bundles. These loosely packed bundles have a length equal to that of the fibrils ( ). The shape of these short, loosely arranged bundles varies depending on the angle ( ) between the connected fibrils. Error bands represent mean s.d. Data displayed are representatives of 4 independent simulations.
Extended Data Fig. 6 | YAP pathways are induced by matrix viscoelasticity.
a. Analyses of bulk RNA-seq data from mice fed chow, FFD, and HiAD diets. HiAD-fed mice were treated by PM or vehicle, and a group of mice with RAGE hepatocyte depletion (RAGE ) were studied. Genes between FFD and HiAD groups with Log2 fold change (Log2FC) and p-value less than 0.05 (Fisher’s exact test) were considered differentially expressed. KEGG analyses from differentially expressed genes show enrichment in Hippo signalling pathway. No HD injection was done in these experiments. b, c. Representative images (b) and quantification (c) of active nuclear YAP signal in mouse livers, using an antibody against the active, non-phosphorylated YAP. ( mice/group, 4 random fields/sample; data are presented as the percentage of active YAP/ area/ field). d. YAP targets CTGF and Cyr61 were induced in mice on HiAD,
but not after PM or in RAGE on HiAD. RT-qPCR, each. e. Collagen was imaged using SHG (green), active YAP (red) and -SMA positive stellate cells (blue, arrows) by immunofluorescence. There were no hepatocytes with active YAP observed in the close proximity of collagen bundles (using an antibody against the non-phosphorylated active YAP). Scale bar . f. HE images corresponding to sequential slides with myc-tag/GS immunohistochemistry in the main Fig. 4c. g. Nuclear and cytoplasmic YAP was assessed using antibodies against active, non-phosphorylated and inactive phosphorylated YAP in western blots (cytoplasmic and nuclear fractions), in low and high viscoelasticity hydrogels (representative of 3 different experiments). Error bars represent mean s.e.m. n numbers refer to individual mice. One-way ANOVA was used followed by Tukey’s multiple comparison test.
Extended Data Fig.7 | See next page for caption.
Article
Extended Data Fig. 7| Proliferation and YAP activation are not affected by increasing stiffness in low or high viscoelasticity hydrogels (Additional data to the main Fig. 5). a-e. Huh7 cells were encapsulated in low or high viscoelasticity IPN hydrogels with varying stiffness. ( ). Cell proliferation and YAP activity were evaluated by Edu nuclear signal (a, scale bar, ) and active YAP immunofluorescence (b, scale bar, ), and quantification ( and d). e. mRNA expression of YAP target genes CTGF and Cyr6. ( , for c-e, Error bars represent mean s.e.m. n numbers refer to independent experiments. One-way ANOVA with Tukey tests was used for correction of
multiple comparisons.f-h. Huh7 cells were transfected with Tks5-mNeonGreen, and immunofluorescence microscopy was performed using an antibody against MT1-MMP (f), active integrin , and p-MLC2 (h). i. Controls with no primary antibody for . Cells were imaged by high resolution Airyscan microscopy (LSM980, Zeiss). Representative images, scale bar, . j. Controls for the PLA assay in the main Fig. 51 ( antibody only, antibody only). Scale bar, . Error bars represent mean s.e.m. n numbers refer to independent experiments. One-way ANOVA was used followed by Tukey’s multiple comparison test.
Huh7 cells
Extended Data Fig. 8 | TNS1 and integrin knockdowns reduce proliferation, active nuclear YAP and formation of invadopodia-like
using an antibody against active YAP (b, Scale bar, ). Cell circularity was analysed by F-actin, and ImageJ analyses (c, Scale bar, .), and the formation of invadopodia-like structures was assessed by the TKS5 signal (d, Scale bar, ). e. mRNA expression of YAP-regulated target genes, CTGF and Cyr61 ( ). Error bars represent mean s.e.m. n numbers refer to independent experiments. One-way ANOVA test was used followed by Tukey’s multiple comparison.
Article
Hep3B cells
Extended Data Fig. 9 | TNS1 and Integrin knockdowns reduce proliferation, activation of YAP and formation invadopodia-like structures in Hep3B
cells. Hep3B cells were transfected with CRISPR/Cas9 plasmids to knockdown TNS1 (sg-TNS1) or integrin ( sg -Itg ). A control, not targeted sgRNA was used as control (NC). After 48 h in 3D culture in low or high viscoelasticity hydrogels, cell proliferation was evaluated by Edu (a, Scale bar, ) and quantification of the signal (e). YAP activity was analysed by using active YAP antibody
(b, Scale bar, ), quantification (f), and mRNA expression of YAP-regulated targets (h). Cell circularity was evaluated by the F-actin signal (c, Scale bar, ) and ImageJ analyses ( ). Formation of invadopodia-like structures was analysed by the TKS5 signal (d, Scale bar, ). each for . Error bars represent mean s.e.m. n numbers refer to independent experiments. One-way ANOVA test was used followed by Tukey’s multiple comparison.
Extended Data Fig. 10 | domain deleted (dd) TNS-1 did not colocalize with integrin, and cells exhibited lower proliferation, YAP activity, and reduced formation of invadopodia-like structures in high viscoelasticity hydrogels. a. Schematics of the PTB domain deleted (dd) TNS1 construct. Deleting this domain prevents binding to integrins however the actin-binding domain remains intact. b, c. Proximity ligation assays (b) to assess integrin and TNS1 binding (green signal) in empty vector (NC), full length TNS1, and dd-TNS1 transfected cells (red, tdTomato). In full length TNS1 tomato, PLA signals colocalized whereas no colocalization was seen in dd-TNS1 transfected cells or in low viscoelasticity matrix. PLA positive dots were quantified from
30 cells in 5 gels, each group ( each). d-k. Cell proliferation was evaluated by Edu (d, Scale bar, ) and quantification (h). YAP activity was analysed by using active YAP immunofluorescence (e, Scale bar, .), quantification (i), and YAP-regulated target gene mRNA expression (k). Cell circularity was evaluated by F-actin signal (f, Scale bar, , and) and quantification (j, ImageJ). Formation of invadopodia-like structures was analysed by the TKS5 signal ( , Scale bar, each. Error bars represent mean s.e.m. n numbers refer to independent experiments. One-way ANOVA test was used followed by Tukey’s multiple comparison.
Article
b
c YAP-regulated gene Tow
d
Extended Data Fig. 11 | Integrin and Tensin 1 mediate viscoelasticityspecific mechano-cellular pathways involving YAP activation (Additional data to main Fig. 5). a. Huh7-Cas9 cells were transfected with plasmids containing CRISPR guide RNA for TNS1 (sg-TNS1), or Integrin (sg-Itg ) or control sgRNA (NC), and cells after 24 h were embedded in low or high viscoelasticity hydrogels. RhoA GTPase activity in low/high viscoelasticity conditions and after TNS-1 or Integrin KDs was tested by pull-down assays. Antibodies to active (non-phosphorylated), inactive YAP (phosphorylated), as well as to phosphorylated and total LATS1, were used, and analysed by immunoblotting. Representative images of 3 independent experiments.
e
b. Quantification of GTP-RhoA/GAPDH protein levels from each). c-e. Huh7 cells encapsulated in low or high viscoelasticity IPN hydrogels were incubated with ROCK (Y-27632, Abcam, ) or Myosin II inhibitors (Blebbistatin, Abcam, ). YAP activity was analysed by testing YAPregulated target gene CTGF mRNA expression (c). Cell circularity was analysed by Image J (d), and cell proliferation was evaluated by Ki67 mRNA expression (e) ( each). Error bars represent mean s.e.m. n numbers refer to independent experiments. One-way ANOVA test was used followed by Tukey’s multiple comparison.
Extended Data Fig. 12 | TNS-1 knockdown decreases the formation of transformed foci in mice on HiAD, after HDI. a. Schematic presentation of the in vivo targeting of TNS1 by CRISPR/Cas9 in conjunction with hydrodynamic injection (HDI). Mice were fed chow or HiAD for 7w, then hydrodynamically injected with pT3-EF5a-hMet and the pT3-354 EF5a-S45Y- -catenin-myc (mutant -catenin), with the sleeping beauty (SB) transposase, as well as the CRISPR-Cas9-based vector either with sgRNAs targeting mouse TNS1 ( pX 333 sgTNS1) or empty vector (sgNC). Mice were sacrificed 7 weeks following
injection.b. TNS1 expression in the liver was analysed by RT-qPCR ( each). c, d. H&E images, GS/myc immunohistochemistry on consecutive slides depict colocalization (c). Quantification (d) of GS/myc positive foci. Scale bar, ( each). e. The expression of YAP targets CTGF and Cyr 61 was analysed by RT-qPCR ( each). Error bars represent mean s.e.m. n numbers refer to individual mice. One-way ANOVA test was used followed by Tukey’s multiple comparison.
natureportfolio
Corresponding author(s): Natalie Torok
Last updated by author(s): Oct 18, 2023
Reporting Summary
Nature Portfolio wishes to improve the reproducibility of the work that we publish. This form provides structure for consistency and transparency in reporting. For further information on Nature Portfolio policies, see our Editorial Policies and the Editorial Policy Checklist.
Statistics
For all statistical analyses, confirm that the following items are present in the figure legend, table legend, main text, or Methods section.
Confirmed
The exact sample size for each experimental group/condition, given as a discrete number and unit of measurement
A statement on whether measurements were taken from distinct samples or whether the same sample was measured repeatedly
The statistical test(s) used AND whether they are one- or two-sided
Only common tests should be described solely by name; describe more complex techniques in the Methods section.
A description of all covariates tested
A description of any assumptions or corrections, such as tests of normality and adjustment for multiple comparisons
A full description of the statistical parameters including central tendency (e.g. means) or other basic estimates (e.g. regression coefficient) AND variation (e.g. standard deviation) or associated estimates of uncertainty (e.g. confidence intervals)
For null hypothesis testing, the test statistic (e.g. ) with confidence intervals, effect sizes, degrees of freedom and value noted Give values as exact values whenever suitable.
For Bayesian analysis, information on the choice of priors and Markov chain Monte Carlo settings
For hierarchical and complex designs, identification of the appropriate level for tests and full reporting of outcomes
Estimates of effect sizes (e.g. Cohen’s , Pearson’s ), indicating how they were calculated
Our web collection on statistics for biologists contains articles on many of the points above.
Software and code
Policy information about availability of computer code
Data collection
Histology and Immunohistochemistry Images were scanned with Leica Aperio AT2 System.
High resolution IFC images were obtained by the ZEISS Airyscan2 LSM980 microscope.
AFM Data analyses were performed using the Hertz model in NanoScope Analysis V1.9, and Mountains SPIP v.9.
Rheometry was carried out on an ARES-G2 rheometer (TA instruments) by using TA TRIOS software V5.1.1 (TA instruments).
Second Harmonic Generation images and fluorescent images were obtained using Leica TCS SP8, multi-photon Leica Stellaris 8 DIVE upright Confocal, and ZEISS Airyscan2 LSM980.
Immunoblotting images were collected using the Invitrogen iBright Imaging Systems (Thermo Fisher Scientific – US).
RNA-seq data were collected on an Illumina NovaSeq 6000 Sequencing with paired-end 150bp reads.
Data analysis
The AFM data and Second Harmonic Generation images were analyzed using Mountains SPIP v.9, CT Fire software (V2.0 beta), and NIH Image J software (Version 1.53t).
Immunoblotting images were analyzed using iBright Analysis Software (Version 5.2.1).
Statistical analyses were performed using Graphpad Prism (GraphPad Software, version 10).
For RNA-seq analysis, Gencode gene annotations version M18, GRCm38 (https://www.gencodegenes.org/), Dropseq tools v1.1249, R v3.4.4., Limma v3.40.650 were used.
GSEA was conducted with the pre-ranked GSEA method within the KEGG databases with the online tool g:Profiler (https://biit.cs.ut.ee/ gprofiler/gost). RNA-seq Heatmaps and unsupervised hierarchical clustering was performed with g:Profiler (https://biit.cs.ut.ee/gprofiler/ gost).
For manuscripts utilizing custom algorithms or software that are central to the research but not yet described in published literature, software must be made available to editors and reviewers. We strongly encourage code deposition in a community repository (e.g. GitHub). See the Nature Portfolio guidelines for submitting code & software for further information.
Data
Policy information about availability of data
All manuscripts must include a data availability statement. This statement should provide the following information, where applicable:
Accession codes, unique identifiers, or web links for publicly available datasets
A description of any restrictions on data availability
For clinical datasets or third party data, please ensure that the statement adheres to our policy
We do not have any restrictions on data availability. All data generated during this study, are included in the article and the supplementary information files. The mouse reference genome major release GRCm38 are available from https://www.gencodegenes.org/.
RNA-seq data are available under the accession number GSE245016. Codes used in the study are available at https://github.com/ktyman2/liverCancer.git
Human research participants
Policy information about studies involving human research participants and Sex and Gender in Research.
Reporting on sex and gender
We have obtained de-identified liver samples and studied them from 9 female and 11 male adult patients. Acquisition was according to the BRISQ Guidelines, and liver resection specimens that were stored at -80C or available fresh (for rheometry analyses) were studied.
Population characteristics
MASH patients (age between 30 to 80) with no HBV/HCV/HIV infection and no history of heavy alcohol drinking. Histology was evaluated for necroinflammation, hepatocellular ballooning, ductular reaction, and fibrosis by a hepato-pathologist in a blinded fashion, and NAS scores were provided.
Recruitment
Human liver samples were obtained from Stanford Diabetes Research Center (SDRC), Donor Network West (DNW), Stanford Tissue Bank, and the Clinical Biospecimen Repository and Processing Core (CBRPC) of the Pittsburgh Liver Research Center (PLRC). No identifying information was available.
Ethics oversight
All human samples were de-identified and exempted (Exemption 4). This was approved by Stanford University Institutional Review Board (IRB, #67378) and Pittsburgh Liver Research Center Review Board.
Note that full information on the approval of the study protocol must also be provided in the manuscript.
Field-specific reporting
Please select the one below that is the best fit for your research. If you are not sure, read the appropriate sections before making your selection.
Life sciences Behavioural & social sciences Ecological, evolutionary & environmental sciences
For a reference copy of the document with all sections, see nature.com/documents/nr-reporting-summary-flat.pdf
Life sciences study design
All studies must disclose on these points even when the disclosure is negative.
Sample size
Sample size was determined by pilot experiments and resource availability.
Data exclusions
We have not performed any data exclusion.
Replication
All findings have been replicated with more than 3 biological repeats, and methods. The key findings were verified independently by other individuals.
Randomization
Mice in each independent experiment, as well as the experimental groups were age-matched. Mice were randomly distributed into each group ensuring similar age and body weight in each group. For in vitro experiments, cells and hydrogels were grouped randomly for treatment or test.
Blinding
Blinding was widely used in the study. The images were scored by at least two individuals who were blinded for the group information. Measurements of transformed foci were confirmed by a second person who was also blinded for the information on the experimental group. Investigators were blinded to allocation during experiments and outcome assessments, and data was collected and analyzed in a blinded fashion.
Reporting for specific materials, systems and methods
We require information from authors about some types of materials, experimental systems and methods used in many studies. Here, indicate whether each material, system or method listed is relevant to your study. If you are not sure if a list item applies to your research, read the appropriate section before selecting a response.
Materials & experimental systems
Methods
n/a
Involved in the study
n/a
Involved in the study
X Antibodies
Eukaryotic cell lines
Flow cytometry
Palaeontology and archaeology
Clinical data
Dual use research of concern
Antibodies
Antibodies used
Myc Santa Cruz , #sc-40 IHC, 1:200
Glutamine Synthetase (GS) Santa Cruz, #sc-74430 IHC, 1:200
Active Integrin (12G10) https://www.abcam.com/products/primary-antibodies/integrin-beta-1-antibody-12g10-ab30394.html Active (non-phosphorylated) Yap https://www.abcam.com/products/primary-antibodies/active-yap1-antibody-epr19812ab205270.html
Policy information about cell lines and Sex and Gender in Research
Cell line source(s)
Huh7 cell line was from the Sarnow lab (Stanford), and Hep3B cells were purchased from ATCC.
Authentication
Validation was performed by STR profiling using ATCC cell authentication service (ASN-0002-2022).
Mycoplasma contamination
Routine testing for mycoplasma was conducted by MycoAlertTM Mycoplasma Detection Kits (Lonza, 75870-454). All cells tested negative for mycoplasma.
Commonly misidentified lines (See ICLAC register)
No commonly misidentified cell lines were used.
Animals and other research organisms
Policy information about studies involving animals; ARRIVE guidelines recommended for reporting animal research, and Sex and Gender in
Research
Laboratory animals
All studies were approved by the Stanford APLAC or Palo Alto VA, and were strictly following the ARRIVE Guidelines. Wild type C57BL/6J (WT) 8- to 10-week-old male mice were purchased from the Jackson Laboratory. Ragefl/fl mice on a C57B6 background were gifted by Dr. B. Arnold from German Cancer Research Center, Heidelberg, Germany. RageHepKO mice were generated by crossing Ragefl/fl mice with Albumin-cre mice (the Jackson Laboratory) for several generations. Eight- to 10-week-old male Ragefl/fl mice and RageHepKO mice were used. To generate hepatocyte transgenic AGER1 mice, WT mice were injected with adeno-associated virus 8 (AAV8)-control green fluorescent protein (AAV8-control) or AAV8-thyroxine-binding globulin-AGER1 recombinase (AAV8-AGER1) ( genome copies, Vector BioLabs) at week 6th of feeding.
To knockdown TNS1, mice were injected with CRISPR/Cas9-based vector linking two sgRNAs targeting TNS1 exon 1 and exon 7 ( TNS1, ) or negative control vector (empty ), by hydrodynamic tail vein injection at the beginning of the 8th week of chow or HiAD feeding at the same time as with hMet, s45y-mutant- -catenin, and SB All mice used were on the same background and kept in the same facility. Mice were maintained at macroenvironmental temperature and humidity ranges of 17.8 to and to . Mice were housed in standard cages with hour light/dark cycles and ad libitum access to water and food unless otherwise indicated.
Wild animals
This study did not involve wild animals.
Reporting on sex
Only male mice were used.
Field-collected samples
This study did not involve samples collected in the field.
Ethics oversight
All animal experiments were conducted according to the experimental procedures approved by the Institutional Animal Care and Use Committee at Stanford University and Palo Alto VA. (APLAC #33374)
Note that full information on the approval of the study protocol must also be provided in the manuscript.
Gastroenterology and Hepatology, Stanford University, Stanford, CA, USA. VA, Palo Alto, CA, USA. Department of Chemical Engineering, Stanford University, Stanford, CA, USA. Chemistry, Engineering and Medicine for Human Health (ChEM-H), Stanford University, Stanford, CA, USA. Weldon School of Biomedical Engineering, Purdue University, West Lafayette, IN, USA. Department of Pathology, Stanford University, Stanford, CA, USA. Division of Immunology, Stanford University, Stanford, CA, USA. Department of Automation, Tsinghua University, Beijing, China. Pittsburgh Liver Research Center, University of Pittsburgh and University of Pittsburgh Medical Center, Pittsburgh, PA, USA. Department of Radiology, Stanford University, Stanford, CA, USA. Department of Biochemistry and Molecular Medicine, University of California at Davis, Sacramento, CA, USA. Department of Molecular Pharmacology, Albert Einstein College of Medicine, New York, NY, USA. Quantitative Sciences Unit, Department of Medicine, Stanford University School of Medicine, Stanford, CA, USA. Faculty of Science and Technology, Keio University, Yokohama, Japan. Departments of Medicine and Bioengineering, University of Pennsylvania, Philadelphia, PA, USA. Department of Mechanical Engineering, Stanford University, Stanford, CA, USA. These authors contributed equally: Kolade Adebowale, Lóránd Váncza. e-mail: ntorok@stanford.edu