تساهم خلايا T CD8+ التي تعبر عن GZMK في تعزيز الأمراض الالتهابية المتكررة في مجرى الهواء GZMK-expressing CD8+ T cells promote recurrent airway inflammatory diseases
الأمراض الالتهابية غالبًا ما تكون مزمنة ومتكررة، والعلاجات الحالية لا تزيل عادةً العوامل المسببة للمرض الأساسية.تشارك خلايا T في مجموعة واسعة من الأمراض الالتهابية مثل الصدفيةمرض كرونالتهاب المريءالتصلب المتعدد، وقد تساهم خلايا T المستنسخة المحددة لمستضدات في مزمنة المرض وعودته، جزئيًا من خلال تشكيل ذاكرة مرضية مستمرة. التهاب الجيوب الأنفية المزمن والربو هما أمراض التهابية في مجرى الهواء غالبًا ما تظهر كحالات مصاحبة.التهاب الجيوب الأنفية المزمن يؤثر على أكثر منمن السكان العامينمن بين هؤلاء المرضى،سوف تتطور الأورام الأنفية، التي غالبًا ما تتطلب عمليات استئصال جراحية متكررة بسبب ارتفاع معدل التكرار.بينما تت infiltrate خلايا T الوفيرة أنسجة الزوائد الأنفيةإن مجموعات خلايا الدم البيضاء التي تؤدي إلى مرض الباثولوجيا وتعزز تكرار المرض ليست مفهومة تمامًا. من خلال مقارنة مجموعات خلايا T في أنسجة الزوائد الأنفية المأخوذة من عمليات جراحية متتالية، نبلغ هنا عن وجود CD8 المستمر.تتواجد نسخ خلايا T التي تحمل ميزات تشبه الذاكرة الفعالة في الأنسجة المخاطية خلال تكرار المرض، وتتميز هذه الخلايا بالتعبير عن التربتاز Granzyme K (GZMK). نجد أن GZMK يقوم بتقطيع العديد من مكونات المكمل، بما في ذلك C2 وC3 وC4 وC5، التي تساهم مجتمعة في تنشيط سلسلة المكمل. خلايا CD8 التي تعبر عن GZMKتشارك الخلايا في هياكل لمفاوية ثانوية منظمة، وتنبئ مستويات GZMK في الأنسجة بشدة المرض والاعتلالات المصاحبة بشكل أفضل من المؤشرات الحيوية المعروفة مثل اليوزينوفيلية والإنترلوكين-5 في الأنسجة. باستخدام نموذج ربو الفئران، نظهر أيضًا أن التعبير عن GZMKتزيد الخلايا من حدة المرض بطريقة تعتمد على النشاط البروتيني لـ GZMK والمكملات. إن الإزالة الجينية أو التثبيط الدوائي لـ GZMK بعد ظهور المرض تخفف بشكل ملحوظ من علم الأمراض النسيجية وتستعيد وظيفة الرئة. عملنا يحدد مجموعة خلايا الذاكرة T التي تعزز التهاب الأنسجة وأمراض الشعب الهوائية المتكررة بواسطة الجزيء الفعال GZMK وتقترح GZMK كهدف علاجي محتمل.
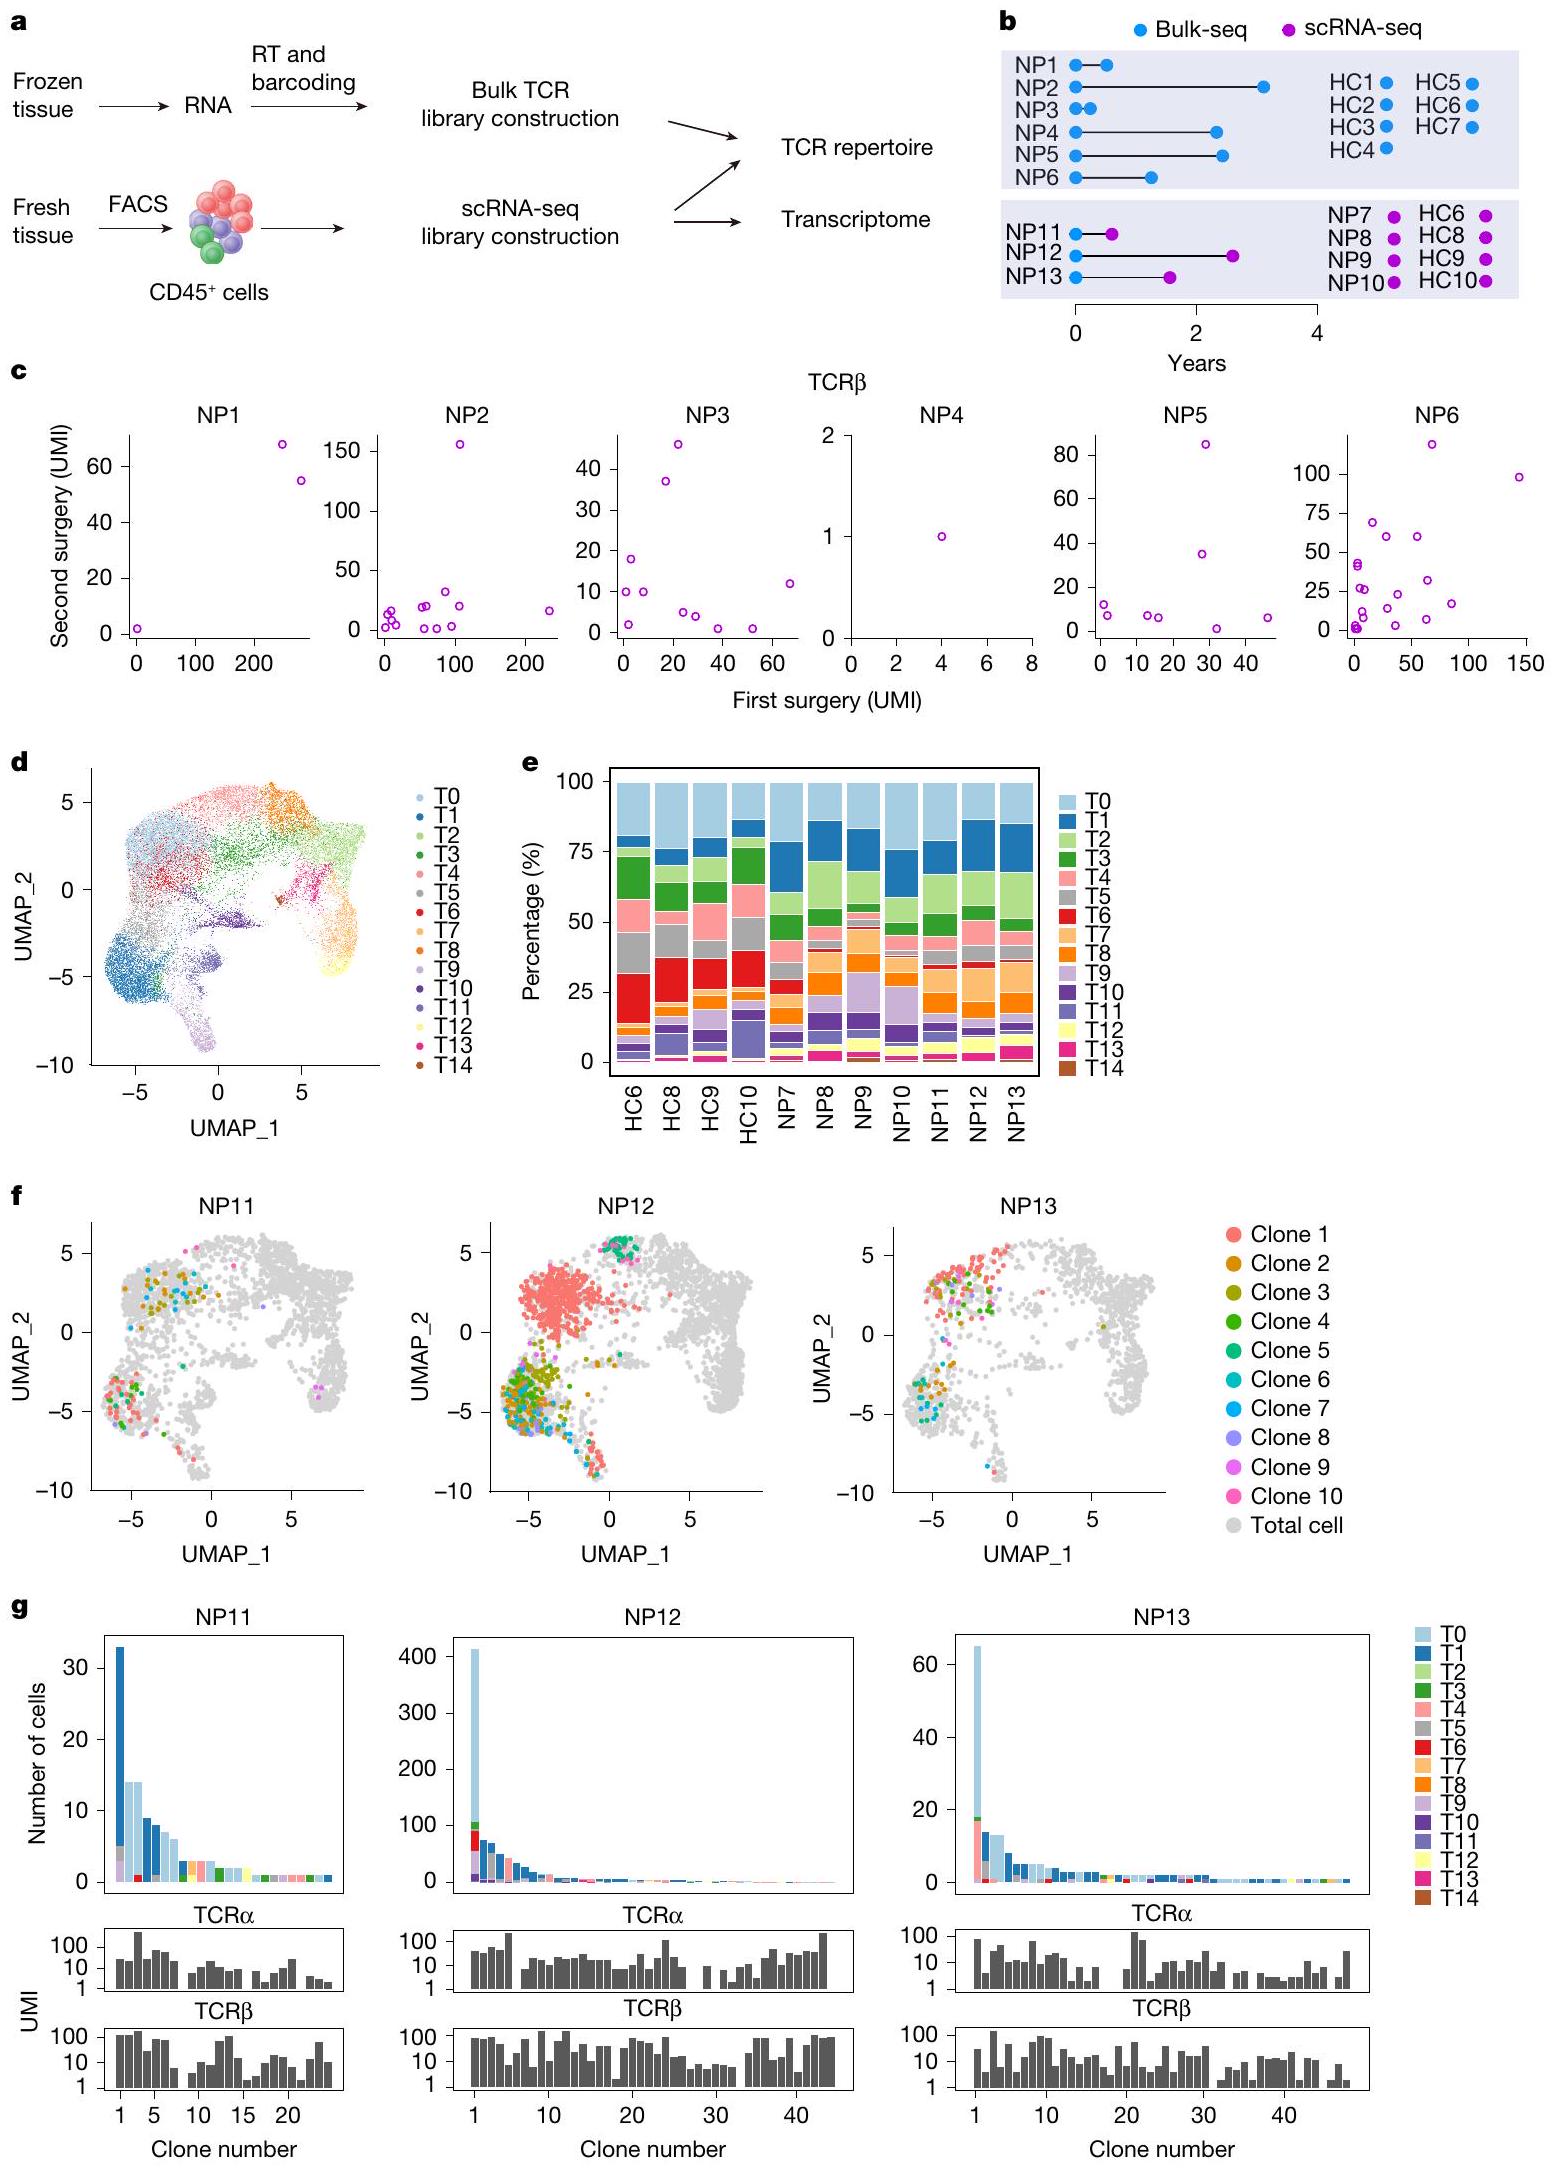
لتحديد ما إذا كانت ذاكرة خلايا T متورطة في تكرار الزوائد الأنفية (NPs)، بحثنا أولاً عن نسخ خلايا T المشتركة في عينات تم الحصول عليها من عمليات جراحية متكررة (الشكل 1a، b). تم إجراء تحليلات مجموعة خلايا T باستخدام عينات مجمدة مزدوجة من ستة مرضى (NP1-6)، مع فترات بين عمليتين جراحيتين تتراوح من 0.2 إلى 3.1 سنوات. تم تضمين أنسجة أنفية من سبعة مرضى خضعوا لجراحة تصحيح الحاجز الأنفي كضوابط صحية (HC1-7) (الشكل 1b والجدول التكميلي 1). تم الحصول على نسخ فردية من مستقبلات خلايا T (TCRs) و تم ترميزها بالباركود وتسلسلها، وتم تجميع المناطق المتغيرة بطول كامل وتعيينها إلى سلالات مختلفة (الشكل 1أ والشكل التوضيحي 2أ، ب). كما كما هو متوقع، كانت مجموعات خلايا T مميزة بين الأفراد، حيث كان هناك 5 فقط من 1,585 TCRα و1 من 3,888 TCR.سلاسل تُشارك بين مرضى مختلفين (الشكل التوضيحي 2c). على العكس، حددنا باستمرار TCRα وTCR الشائعة.سلاسل في أنسجة NP التي تم الحصول عليها من الجراحتين لنفس المريض (الشكل 1c والشكل التكميلي 2d)، مما يشير إلى أن خلايا من نفس السلالات المستنسخة أعادت استعمار أنسجة NP خلال تكرار المرض. علاوة على ذلك، كانت بعض المستنسخات المستمرة من بين الأكثر هيمنة في كلا العينتين الجراحيتين (الشكل 1c والشكل التكميلي 2)، مما يشير إلى التكاثر المحلي والتوسع.
الشكل 1 | استمرارية نسخ خلايا T في التهاب الأنف المتكرر. أ، سير العمل لتحليل الأنسجة الأنفية التي تمت إزالتها جراحيًا. RT، النسخ العكسي. ب، نظرة عامة على الفترات الجراحية للعينات المزدوجة. انظر الجدول 1 في البيانات الموسعة لمزيد من معلومات المرضى. ج، النسخ المستمرة، التي تم تحديدها بواسطة TCR المتطابق.تسلسلات، تم العثور عليها في عينات جراحية مزدوجة من خلال تحليلات التسلسل الكمي. كل رمز يمثل مستنسخًا واحدًا. UMI، معرف جزيئي فريد. د، هـ، تصور UMAP لـتجمعات خلايا T (T0-T14) الموجودة في أنسجة NP (د) ووفرتها النسبية في كل فرد (e). f، g، نسخ خلايا T المستمرة في المرضى NP11-13. f، النسخ التي تحتوي على كل من TCRα وتم تراكب السلاسل المحددة في العينات المزدوجة على UMAP لخلايا T الكلية من نفس المريض. يتم عرض أفضل عشرة مستنسخات فقط. ج، وفرة وتركيب الكتل للمستنسخات الفردية المستمرة التي تم اكتشافها في تحليل scRNA-seq لآخر استئصال للأنف (الأعلى) وتحليل bulk-seq للاستئصال السابق (الأسفل). يتم تصنيف المستنسخات وترقيمها حسب وفرتها في بيانات scRNA-seq.
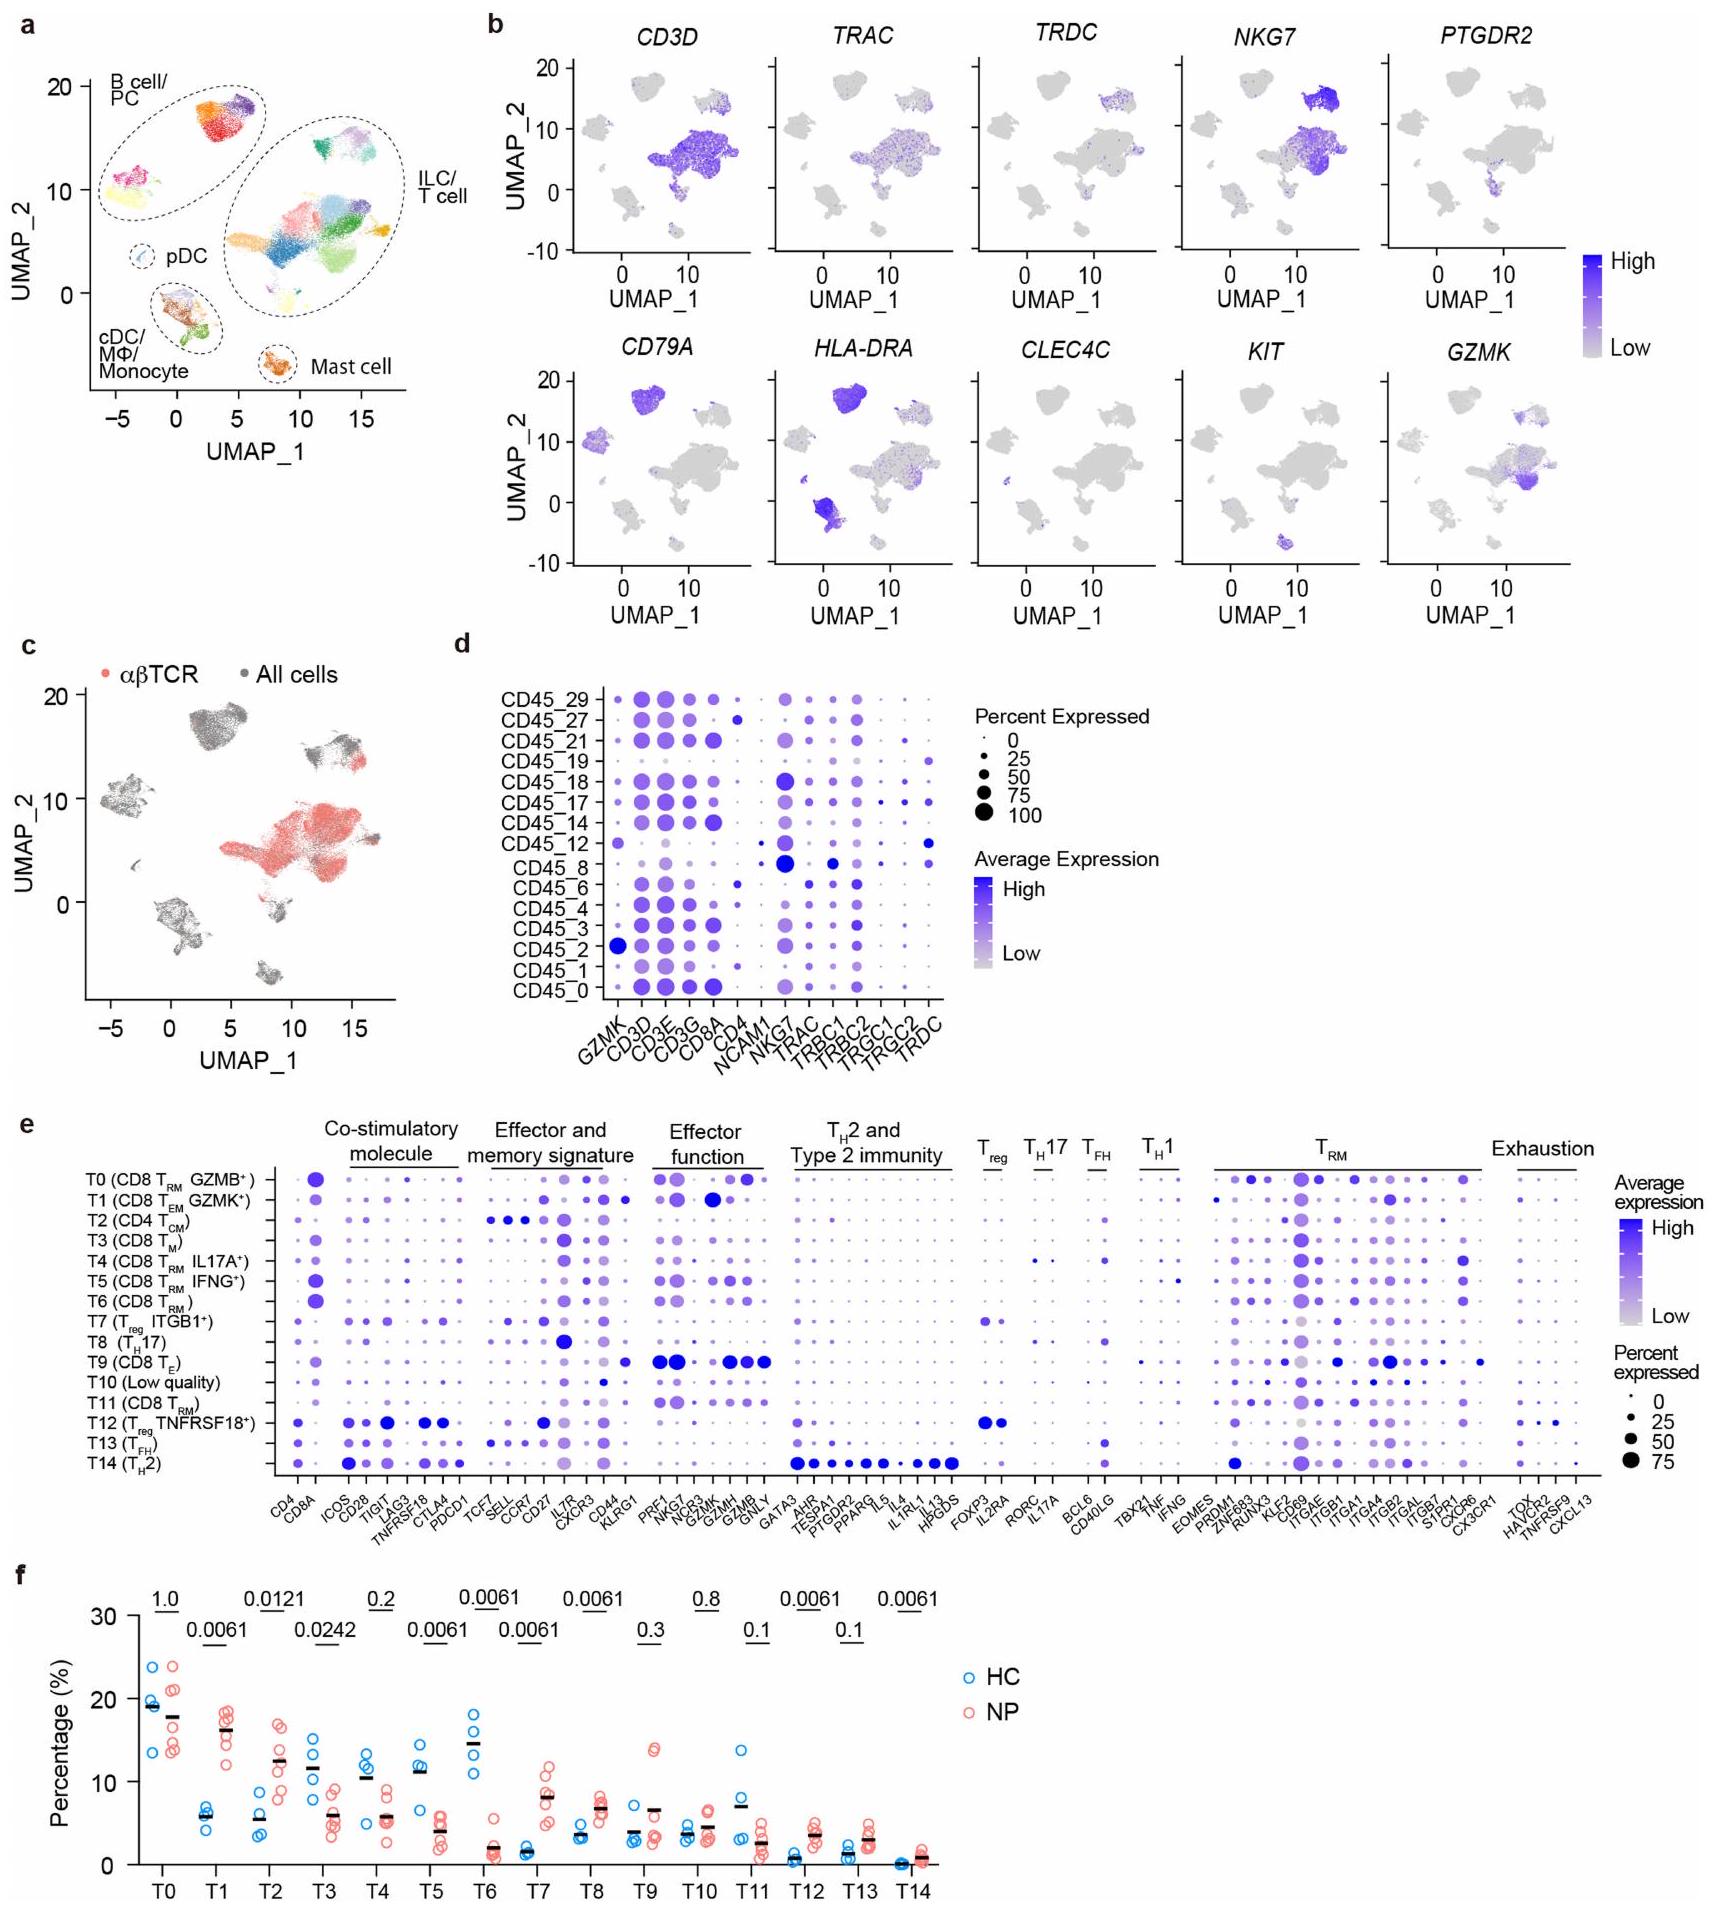
لاستكشاف إمكانية أن تساهم تجمعات خلايا T المستنسخة في علم الأمراض والانتكاس، قمنا بإجراء تسلسل RNA الرسول على مستوى الخلية الواحدة (scRNA-seq) لعدد إجمالي من CD45خلايا من سبع عينات جراحية من NP (NP7-13) وأربع عينات جراحية من HC (HC6 و8 و9 و10) (الشكل 1a وb والجدول التكميلي 1). خضع ثلاثة من مرضى NP السبعة (NP11-NP13) لعملية جراحية ثانية لعلاج انتكاسة NP الخاصة بهم في وقت الدراسة، وتم حفظ خزعات NP السابقة من العملية الجراحية الأولى بالتبريد (كريو). من خلال مقارنة تسلسلات TCR من خزعتين NP لكل من هؤلاء المرضى الثلاثة، يمكننا تحديد النسخ الشائعة من خلايا T (الشكل 1b). تم تضمين ما مجموعه 42,466 خلية مناعية في التحليل وتم تجميعها وفقًا لتراكيبها الجينية؛ وتم تحديد مجموعات فرعية من اللمفاويات، والخلايا الشجرية، والوحيدات، وخلايا الماست من خلال تعبير الجينات المميزة الخاصة بها (الشكل التكميلي 1a وb). بعد المناطق المتغيرة الكاملة للطول منتم تجميع مستقبلات TCR (الشكل التوضيحي الممتد 1c)، وتمكن خلايا T الحاملة لمستقبلات وظيفية من التكتل في مجموعات متنوعة في كل من أنسجة HC و NP (الشكل 1d، e، الشكل التوضيحي الممتد 1d، e والجدول التكميلي 2). كما هو متوقع، كانت وفرة خلايا T المساعدة 2 (تم زيادة مجموعة (T14)، وهي محرك مرض معروف، بشكل ملحوظ في المرضى الذين يعانون من NP مقارنة بمجموعة HC. (الشكل 1f من البيانات الموسعة). بالإضافة إلى ذلك، واحد مجموعة فرعية (T1) وأربعةكانت مجموعات خلايا T (T2 و T7 و T8 و T12) أكثر وفرة أيضًا في أنسجة NP مقارنةً بأنسجة HC (الشكل 1f من البيانات الموسعة).
حددنا 24 و44 و48 من نسخ خلايا T المشتركة في المرضى NP11-NP13، على التوالي. تم تحديد معظم تلك النسخ المشتركة في T0 وT1، اثنان منمجموعات فرعية من الخلايا، بدلاً منالخلايا (الأشكال 1f، g و2a). وبالتالي، يبدو أن تكرار NP مصحوب باستعمار الأنسجة بواسطة CD8توجد نسخ من خلايا T بالفعل في حلقة المرض السابقة. نظرًا لأن الجراحتين كانتا تفصل بينهما على الأقل 7 أشهر، فمن المحتمل أن تكون تلك الخلايا T مستمدة من ذاكرة مرتبطة بالمرض.الخلايا. من أجل البساطة، نطلق على هذه النسخ المشتركة اسم النسخ المستمرة.
تركيبة الخلايا ترتبط بشدة المرض
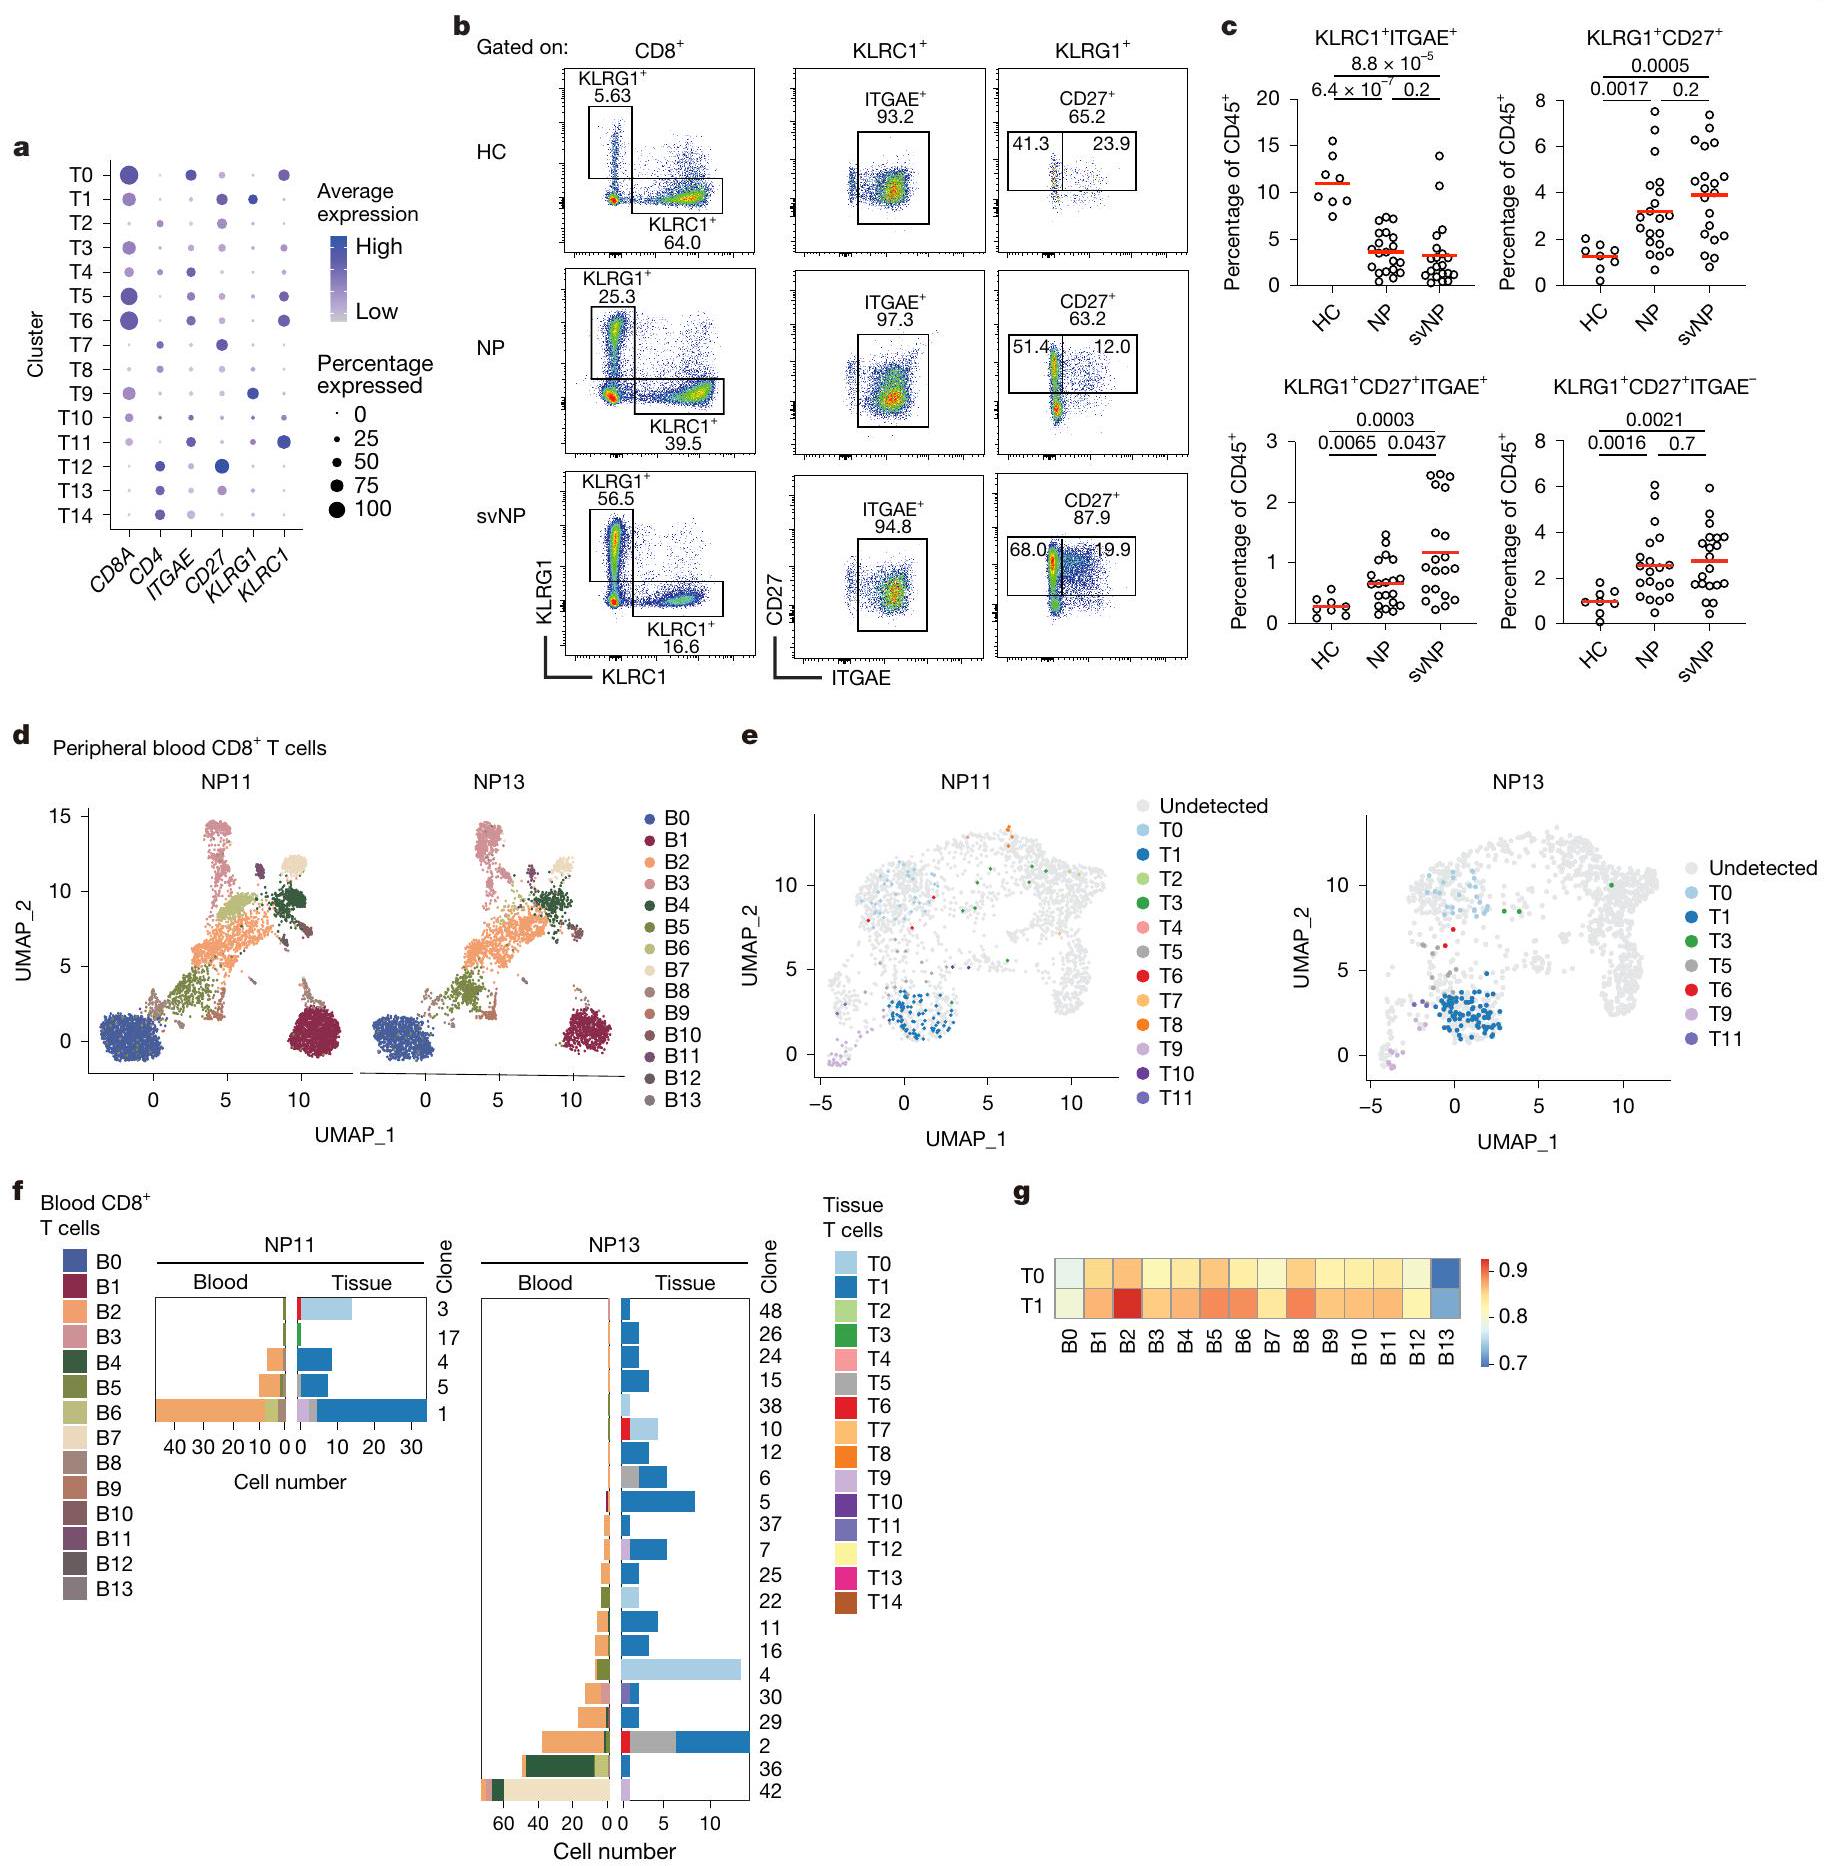
قمنا أيضًا بتوصيفتحت مجموعات خلايا T التي تحتوي على تلك النسخ المستمرة. أظهرت خلايا TO ذاكرة T المقيمة التقليدية ( ) نمط الخلية، يعبر عن جينات أساسية للإقامة في الأنسجة، مثل ITGAE و CD69 و PRDM1 و ZNF683 و RUNX3 (المرجع 12). احتوى مجموعة T1 على عدد قليل نسبيًا من الخلايا ولكن العديد منها تعبر عن خلايا الذاكرة الفعالة Tتشمل العلامات KLRG1 و CD27 (الشكل 2أ والشكل البياني الممتد 1هـ). من ناحية أخرى، لم تعبر هذه الخلايا بشكل كبير عن الجينات المرتبطة بالوظائف الفعالة، مثل TBX21 و CX3CR1. كما أن خلايا T1 عبرت عن مستوى نسبي مرتفع من EOMES، وهو عامل نسخ مرتبط بالاستمرارية على المدى الطويل. (الشكل البياني الموسع 1e). تشير هذه البيانات إلى أن النسخ المستمرة هي في الغالب وخلايا شبيهة بـ.
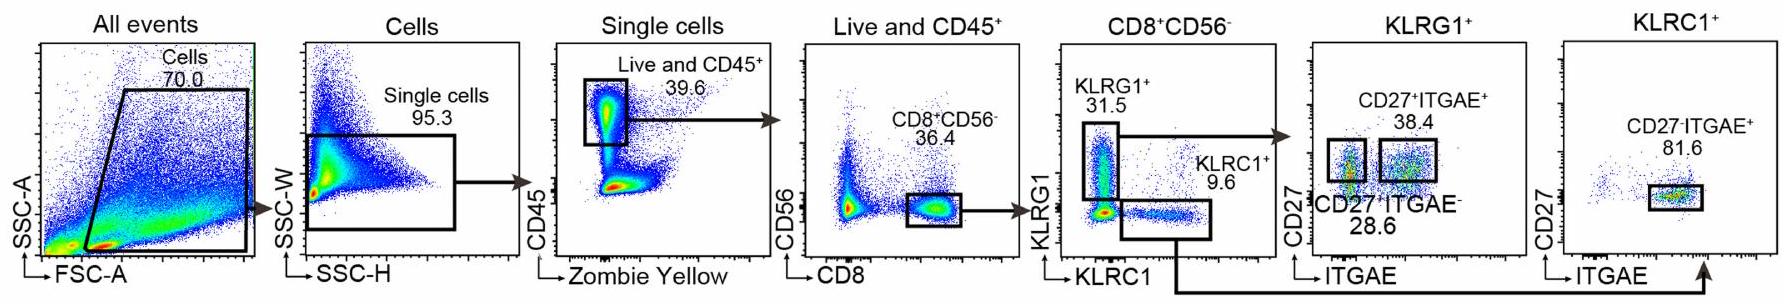
للتحقق مما إذا كانت هذه العلامات السطحية المرتبطة بالإقامة والفعالية لـ TO و T1 يمكن استخدامها لتمييزهما بواسطة تحليل تدفق الخلايا، قمنا بتنقية فرز مختلفةتم فرز مجموعات خلايا T من أنسجة NP (NP14) وأُجريت تحليلات scRNA-seq (الشكل البياني الموسع 2a). عند رسمها على مجموعة البيانات المرجعية (الشكل 1d)، تم فرزكانت السكانية تحتوي بشكل رئيسي على خلايا TO، في حين أنوتمت خريطة الخلايا بشكل رئيسي إلى مجموعة T1 (الشكل 2b,c في البيانات الموسعة).
بعد ذلك، قمنا بمقارنة الوفرة النسبية لـ KLRC1 المرتبطة بـ TO.ITGAEالخلايا، T 1 -المقابلةITGAEو T1 المقابل-مثل الخلايا في أنسجة HC و NP. قمنا أيضًا بتصنيف أنسجة NP حسب شدة المرض، حيث تم تعريف حالات NP المتكررة أو الربو المصاحب على أنها NP الشديدة (svNP). وجدنا وفرة الـITGAEانخفضت مجموعة فرعية بشكل ملحوظ في المرضى الذين يعانون من NP، في حين زادت وفرة KLRG1 المرتبطة بـ T1 بشكل عامزادت الخلايا. نسبة T1 المقيمة، تلك ITGAEالخلايا، التي زادت تدريجياً مع شدة المرض، كانت أكثر وفرة في svNP مقارنة بـ NP (الشكل 2ب-ج).
في محاولة للتنبؤ بمستضدات محتملة تتعرف عليها خلايا T1، قمنا بدمج 37,483 من TCRs المعلّمة من قواعد البيانات العامة.مع تحديد 1,311 T1 TCRs في مجموعة البيانات الخاصة بنا، وأجرينا شبكة تحليلات باستخدام خوارزمية GLIPH2حددت نتائجنا 36 مجموعة رئيسية من مستقبلات الخلايا التائية، من بينها 27 تتضمن مستقبلات مع مستضدات معروفة، بما في ذلك البروتينات الفيروسية، والمستضدات الذاتية، والجليادين، وهو مادة مسببة للحساسية تُعرف بشكل متكرر لدى البشر. (الشكل التوضيحي 3).
خلايا الأنسجة T1 والحيز المتداول
معظم خلايا T1 هي ITGAEلاختبار العلاقة بين T1 وخلايا T في الدورة الدموية، قمنا بفرز خلايا CD8 من الدم المحيطيتم جمع خلايا T من المرضى NP11 و NP13 لإجراء تحليل تسلسل RNA أحادي الخلية وتحليل TCR (الشكل البياني الممتد 2d). إجمالي 10,897 خلايا CD8 في الدمتم تحليل خلايا T وتصنيفها إلى 14 مجموعة فرعية مختلفة بناءً على ميزات النسخ الجيني (BO-B13؛ الشكل 2d والجدول التكميلي 3)، مما يكشف عن نمط عام لتجمع الخلايا مشابه جدًا بين المريضين. بناءً على تسلسلات TCR، وجدنا عدة نسخ في الدم تتطابق مع النسخ التي تشغل خلايا T1 في الأنسجة لدى كلا المريضين (الشكل 2e والشكل التكميلي 4a). كانت معظم هذه الخلايا الدموية في المجموعة الفرعية B2، مع وجود عدد قليل في B4 وB6 أيضًا (الشكل التكميلي 4b). بعض هذه النسخ المشتركة بين الدم وأنسجة NP كانت نسخًا مستمرة تم رؤيتها بالفعل في أنسجة NP المحفوظة من الجراحة الأولى (الشكل 2f). من بين جميع الدمالخلايا، كانت مجموعة B 2 هي الأكثر تشابهًا مع خلايا الأنسجة T1 (الشكل 2g والشكل التكميلي 4c)، ومع ذلك، كانت تفتقر إلى تعبيرتوقيعات وأظهرت مستويات أعلى من الجينات المرتبطة بخصائص خلايا T الجذعية، مثل TCF7 وIL7R وSELL (الشكل التوضيحي التكميلي 4d). لذلك، من المحتمل أن تكون خلايا T1 في أنسجة NP مشتقة من خلايا B2 الدموية، وهو نموذج تدعمه أيضًا تحليلات الزمن الزائف (الشكل التوضيحي التكميلي 5a,b).
مجتمعة، تدعم بياناتنا فكرة أن النسخ المستمرة من خزان ذاكرة خلايا T يمكن أن تُستخدم باستمرار في الأنسجة، مما قد يعزز من مرضية المرض وعودته.
نسيجالخلايا تعبر عن GZMK بشكل كبير
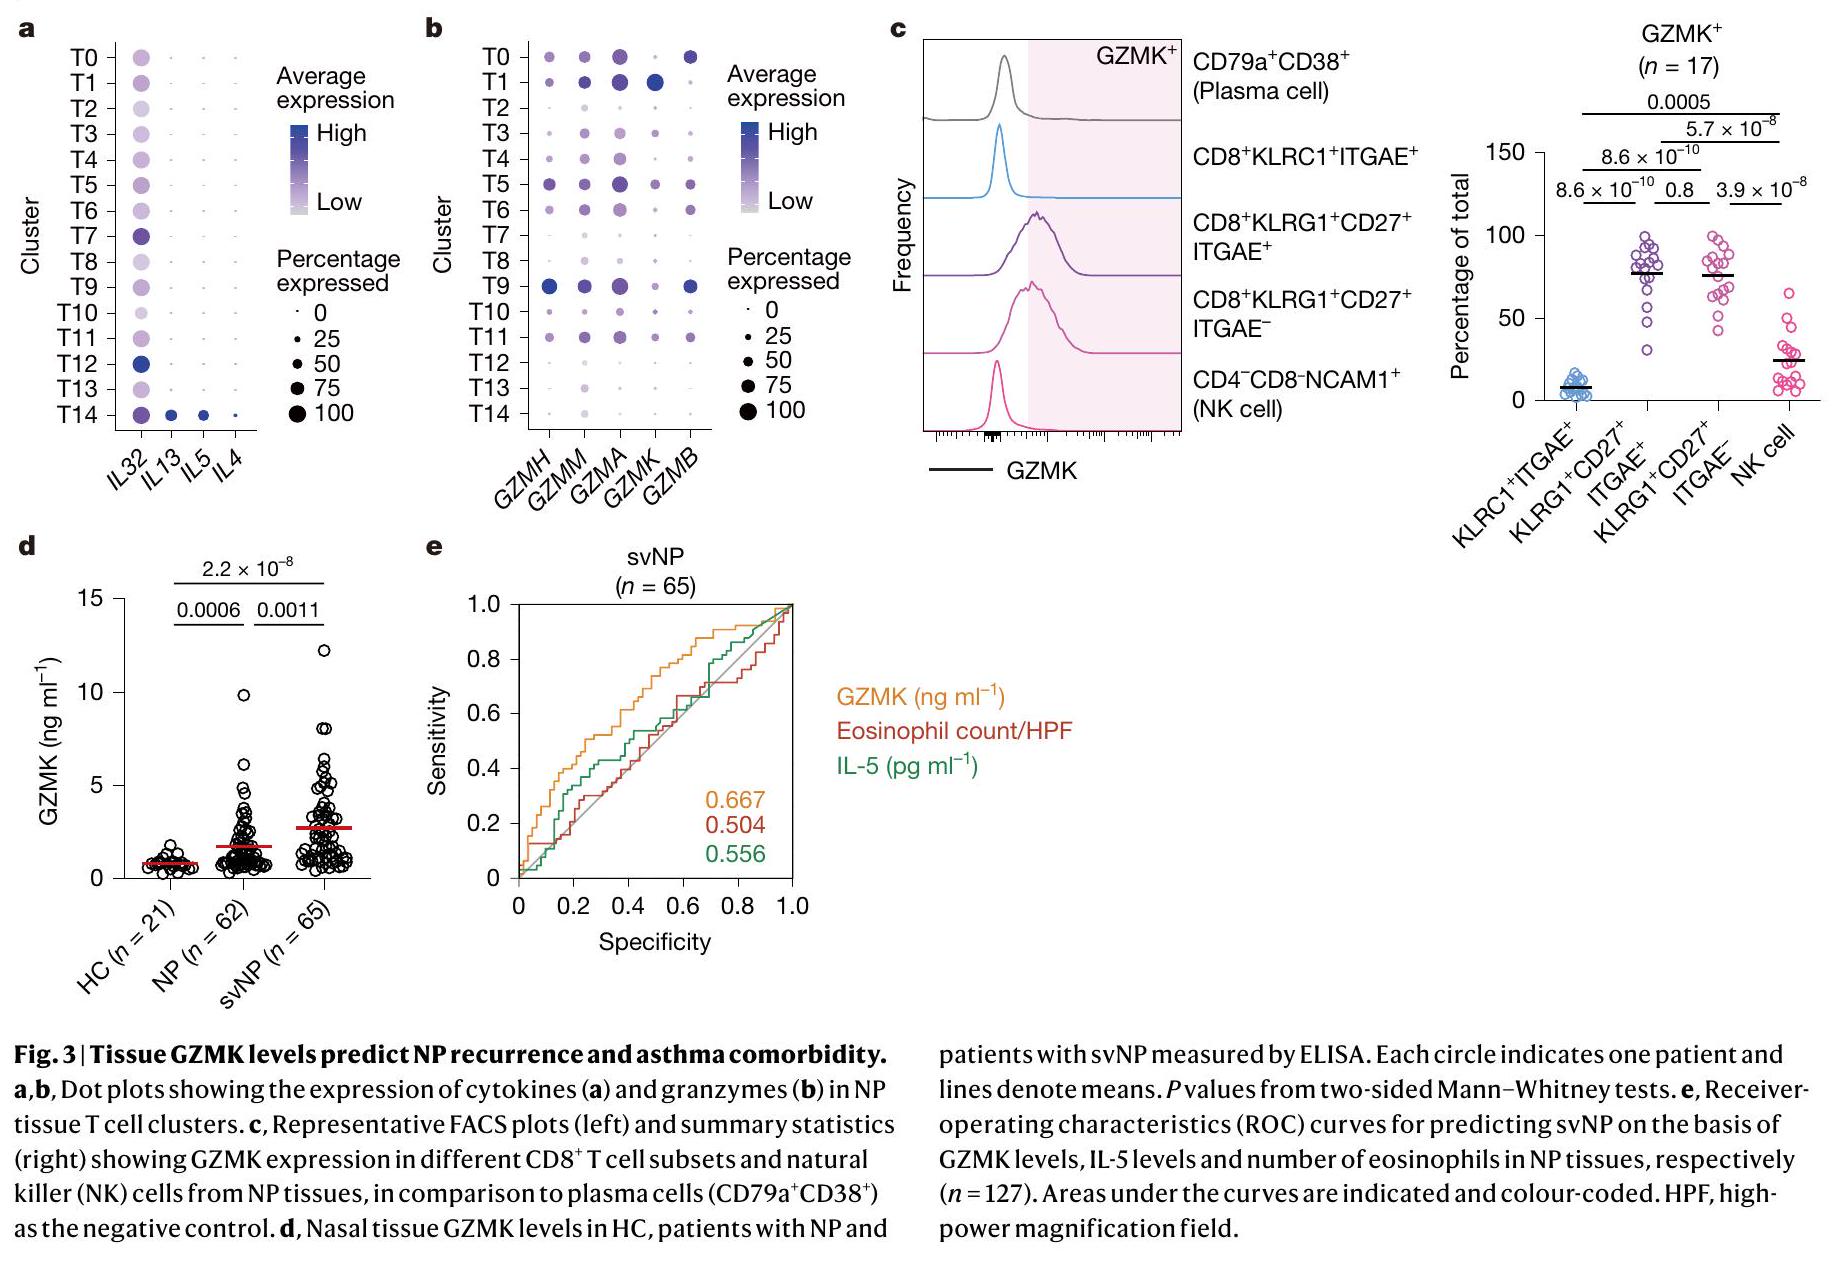
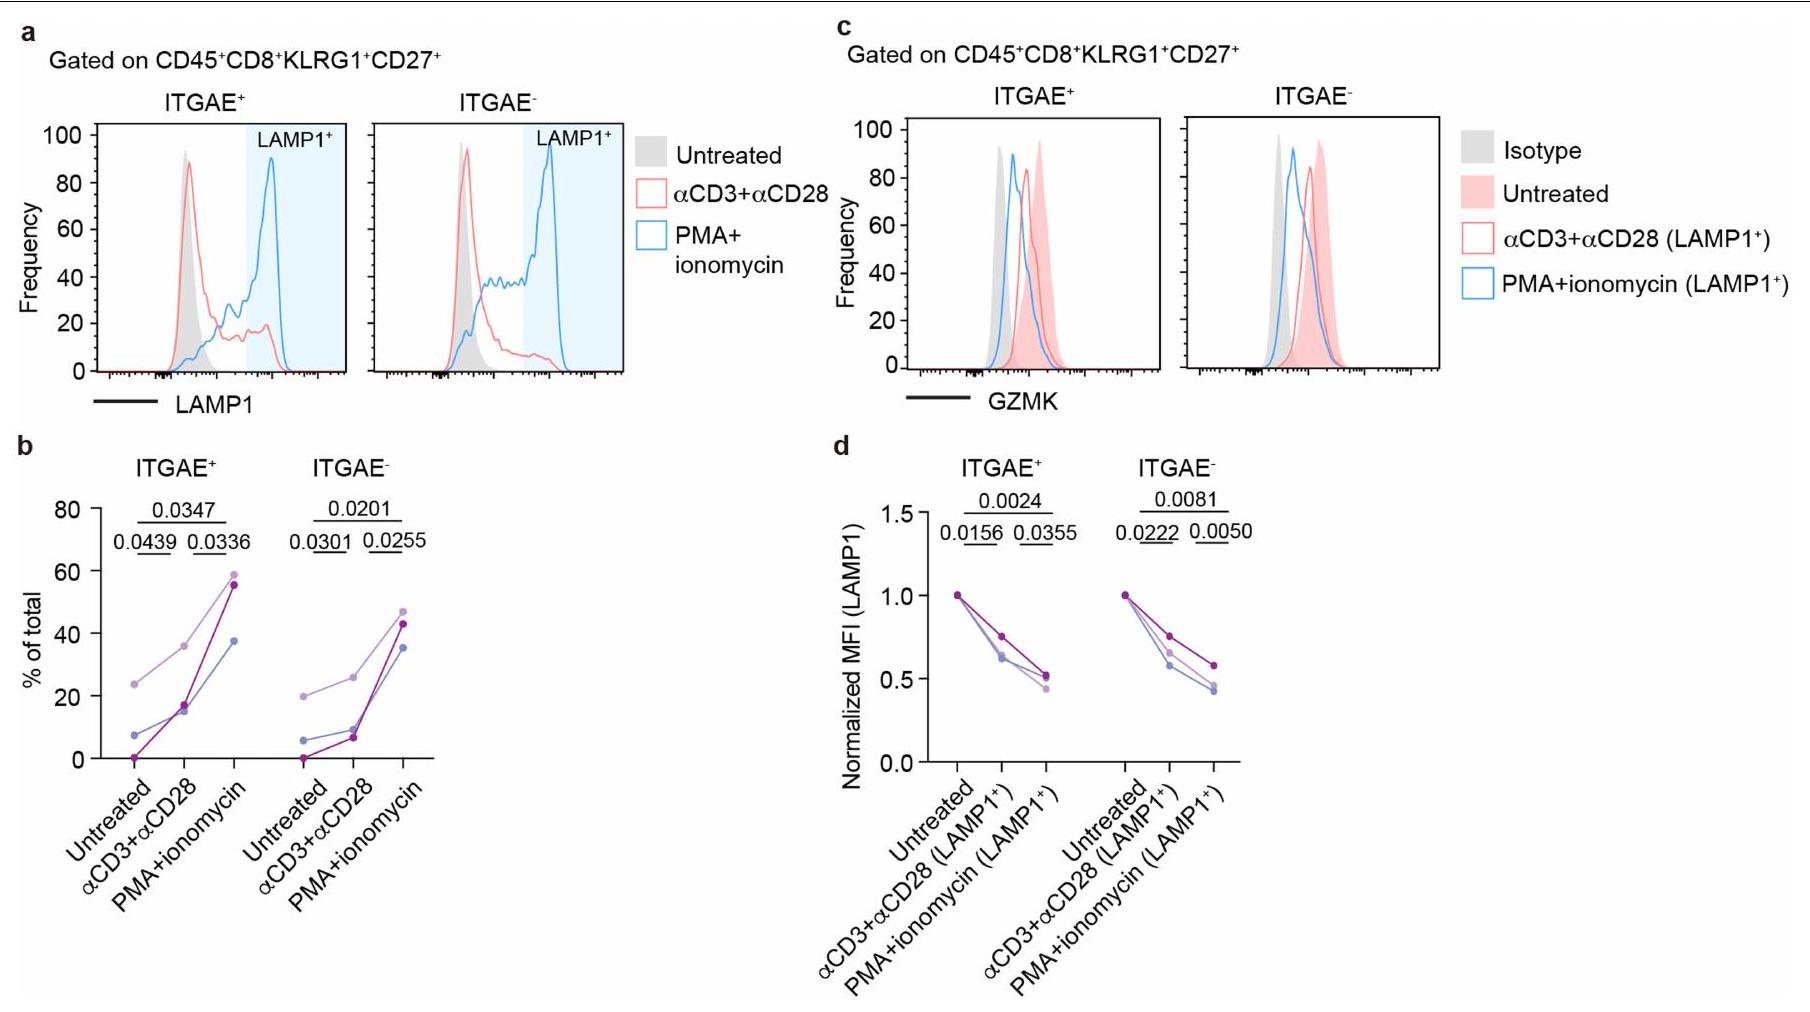
بعد ذلك، بحثنا بعناية عن جزيئات التأثير التي قد تستخدمها خلايا T1 في عملية المرض. تعزز السيتوكينات من النوع 2 (مثل IL-4 و IL-5 و IL-13) تجنيد الحمضات، وإعادة تشكيل الأنسجة، وتنشيط خلايا B في مجرى الهواء، مما يمثل المحركات الأكثر رسوخًا لالتهاب الجيوب الأنفية المزمن ومرض الأنسجة الربوي.. ومع ذلك، لم تعبر خلايا T1 عن أي mRNA تقريبًا لسيتوكينات النوع 2 (الشكل 3أ). تعتبر الجرانزيمات جزيئات فعالة مهمة تعبر عنها خلايا CD8الخلايا. من بين جميعالخلايا في أنسجة NP، كانت خلايا T1 تعبر بشكل فريد عن مستوى عالٍ من نسخ Granzyme K (GZMK) (الشكل 3ب). وقد وُجدت خلايا T التي تعبر عن GZMK في الالتهابات المرتبطة بالشيخوخة ومجموعة متنوعة من الأمراض الالتهابية.من خلال صبغ الخلايا داخلية، كان GZMK معبرًا عنه بشكل كبير في كل من ITGAEو ITGAEنسب من خلايا T1 ولكن ليس فيتم إفراز GZMK بواسطة هذه الخلايا عند تحفيز TCR (الشكل 3c). بالإضافة إلى خلايا T، تم التعبير عن GZMK أيضًا بواسطة مجموعة صغيرة من خلايا القاتل الطبيعي (الشكل 1b، d والشكل 3c) التي زادت بشكل ملحوظ في المرضى الذين يعانون من svNP، على الرغم من أن هذه الخلايا كانت أقل وفرة مقارنة بخلايا T1 التي تعبر عن GZMK (الشكل 2e، f والشكل 3c). لاستكشاف الدور المحتمل لـ GZMK في مسببات NP، قمنا بتحليل الأنسجة الأنفية من مجموعة من 148 مريضًا (21 HC، 62 NP و65 svNP) مع تمثيل متوازن للعمر والجنس (الشكل التكميلية 6a-d)، ووجدنا أن مستويات بروتين GZMK في الأنسجة ولكن ليس في المصل كانت مرتفعة في NP وأيضًا في svNP (الشكل 3d والشكل التكميلية 6e). مثلت مستويات GZMK في الأنسجة عامل خطر لـ svNP كما تم التنبؤ به بواسطة نموذج انحدار خطي متعدد تم تعديله للجنس والعمر ومؤشر كتلة الجسم (الجدول التكميلية 2). في الواقع، كانت مستويات GZMK في الأنسجة علامة بيولوجية تنبؤية أفضل لـ svNP من مستويات الإيوزينوفيل في الأنسجة وIL-5، وهما عاملان خطر معروفان جيدًا لـ svNP. (الشكل 3e). بالإضافة إلى ذلك، كانت مستويات GZMK مرتبطة إيجابيًا بوفرة الإيوزينوفيلات النسيجية في المرضى الذين يعانون من svNP (الشكل التوضيحي 2a). مجتمعة، تدعم هذه البيانات إمكانية أن يمكن أن تؤدي الخلايا إلى تفاقم التهاب المسالك الهوائية وتعزز الأمراض الهوائية المتكررة من خلال الإنزيم الفعال GZMK.
الشكل 2 | CD8مجموعات خلايا T المرتبطة بعودة NP. أ، مخططات النقاط تظهر تعبير علامات السطح المختارة بواسطة مجموعات خلايا T المختلفة. حجم النقاط وكثافة اللون تشير إلى النسبة ومستوى التعبير، على التوالي. ب، ج، مخططات FACS التمثيلية (ب) وإحصائيات ملخصة (ج) للمؤشرات.مجموعات خلايا T الموجودة في HC ) ، المرضى الذين يعانون من NP ( ) والمرضى الذين يعانون من svNP . القيم بواسطة اختبارات مان-ويتني ثنائية الجانب. د، UMAP عرض 14 عينة من الدم المحيطيتجمعات الخلايا (B0-13). يتم عرض الخلايا المعزولة من NP11 و NP13، على التوالي. e، النسخ الموجودة عادة في الأنسجة والدمخلايا T، تم إسقاطها على إجمالي خلايا T النسيجية من نفس الفرد. ف، وفرة وتركيب الكتل من النسخ الموجودة في الدم وعينات الجراحة المقابلة. يتم ترقيم النسخ كما في الشكل 1g. ج، خرائط حرارية تظهر معامل ارتباط سبيرمان بين T0 وT1 وCD8 في الدم.تجمعات الخلايا.
يقوم GZMK بتفكيك C3 لإطلاق الأنفيلاكتوكسين
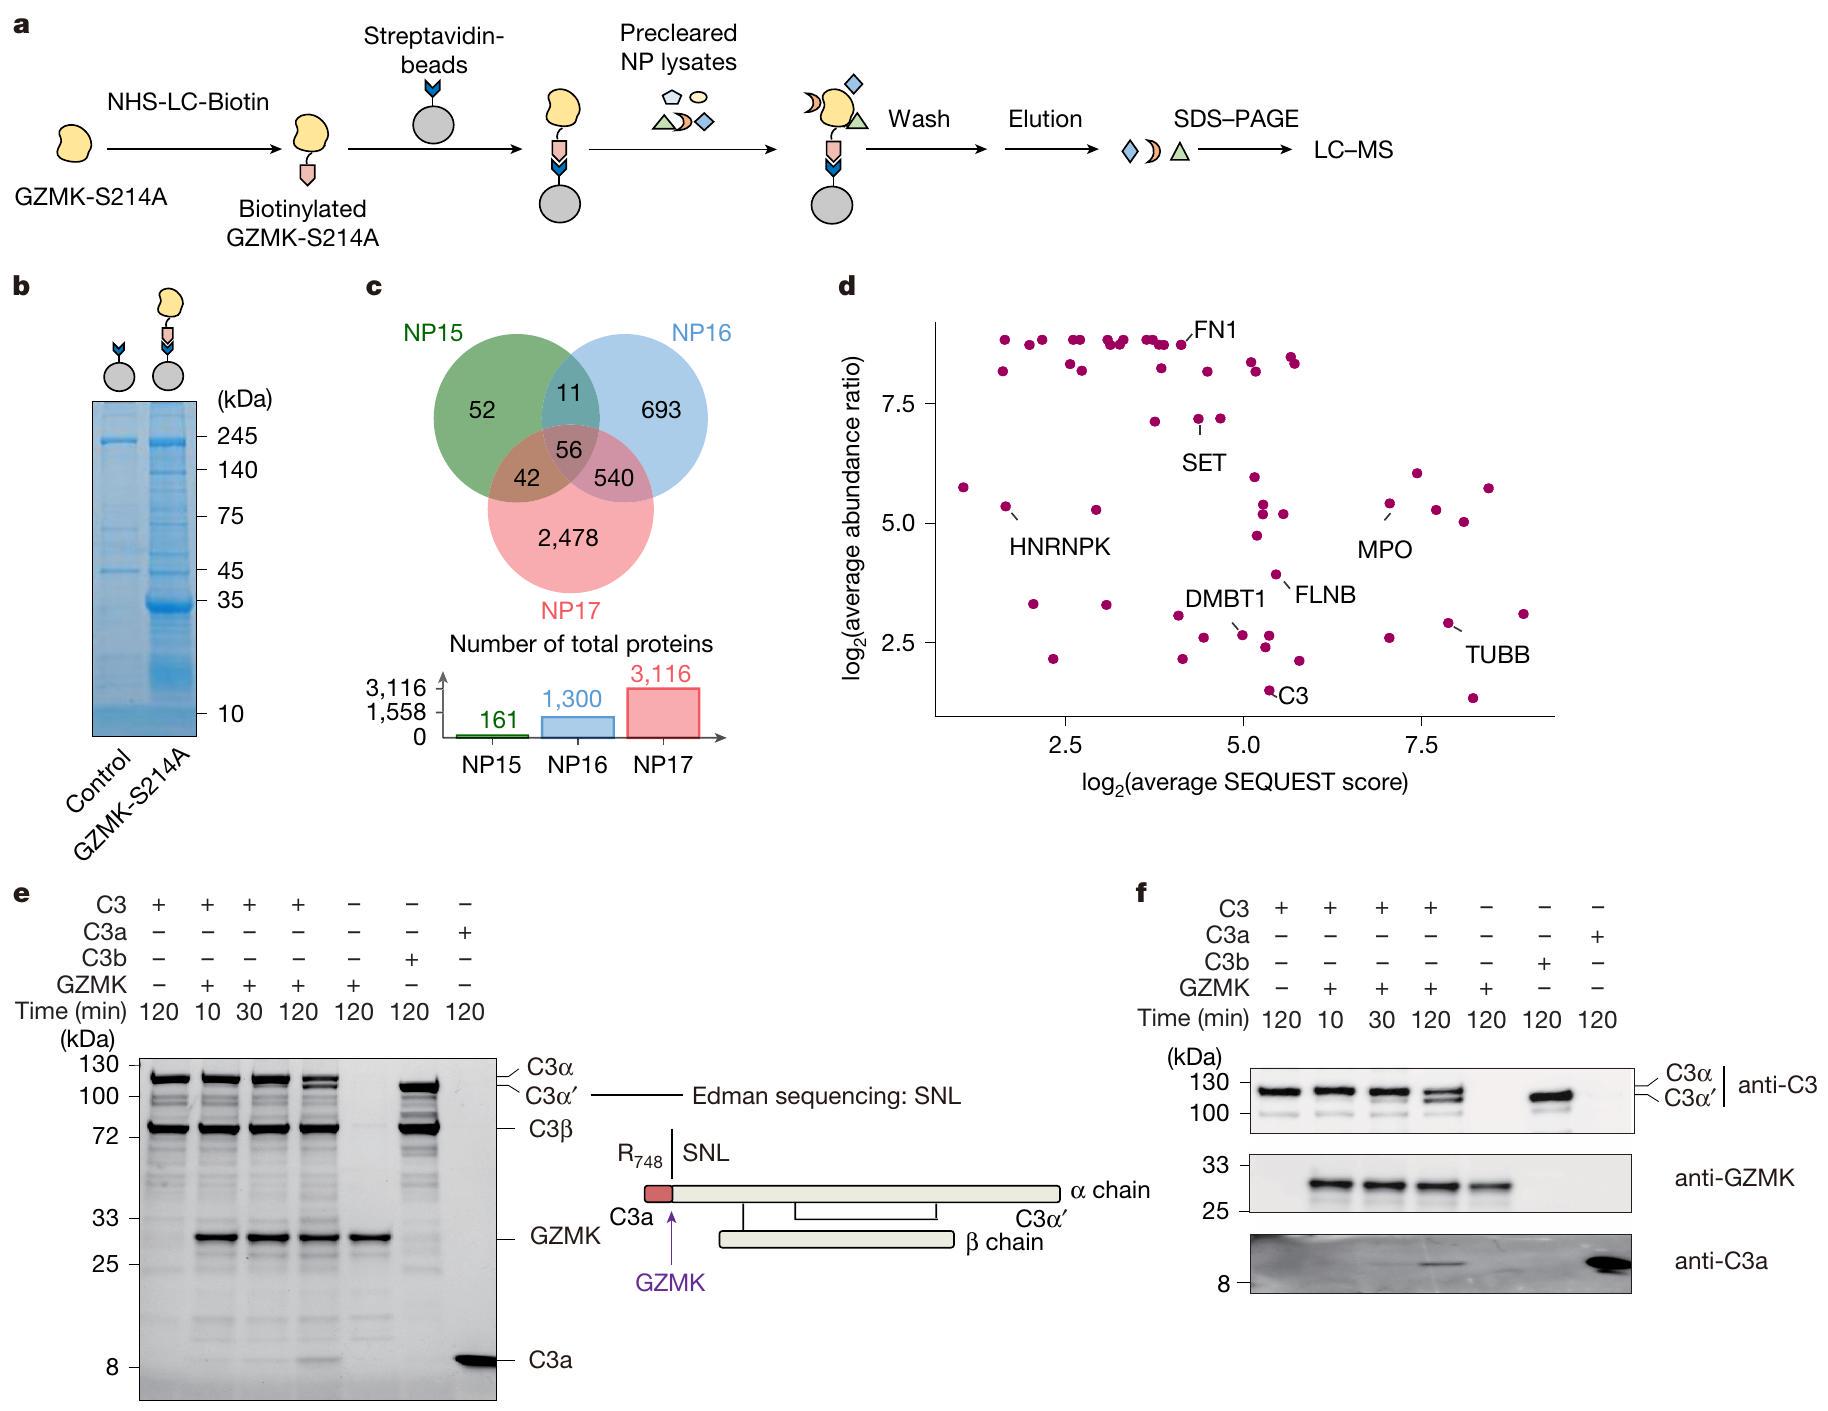
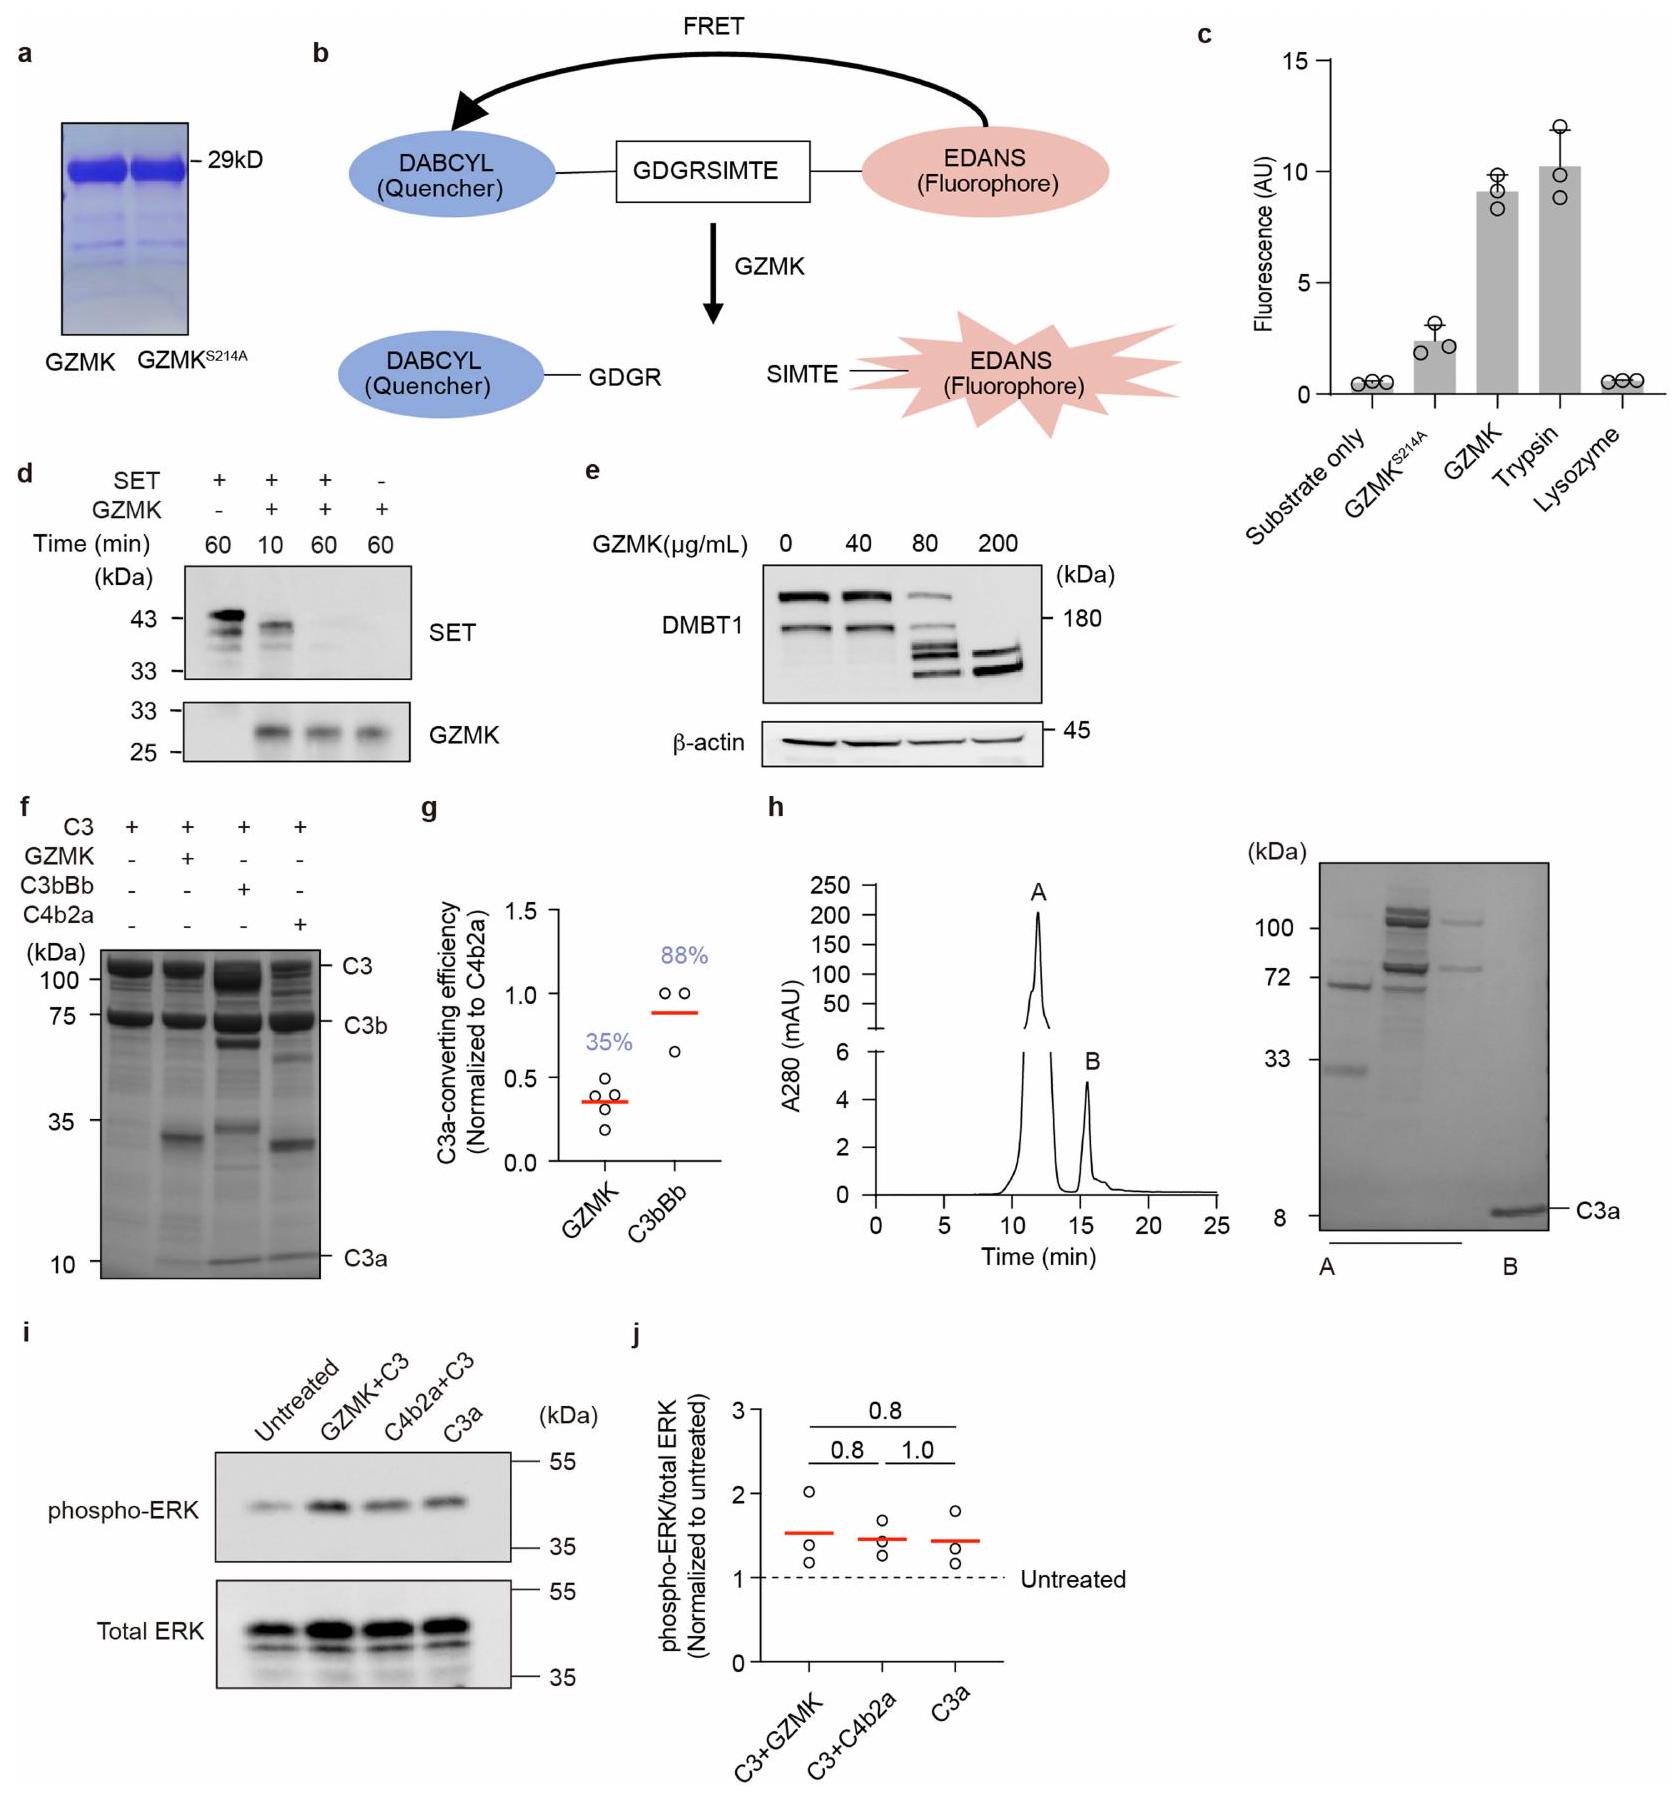
للتحقيق فيما إذا كان وكيف يمكن أن يعزز GZMK الالتهاب، قمنا بتوصيف الركائز المحتملة له في أنسجة NP. لهذا الغرض، قمنا بتعبير GZMK البشري المعاد تركيبه من النوع البري وغير النشط سير.طفرة -to-Ala (GZMK-S214A) في خلايا 293-F (الشكل 4a من البيانات الموسعة). تم تأكيد نشاطهم الإنزيمي وعدم نشاطهم في المختبر. باستخدام الركائز البديلة (الشكل التمديدي 4ب، ج). بعد ذلك، قمنا بترسيب الأجسام المضادة المحتملة للركائز GZMK عن طريق حاضنات مرتبطة بـ GZMK-S214A مع مستخلصات أنسجة NP المأخوذة من ثلاثة مرضى خضعوا لإزالة NP جراحياً. من خلال تحليل البروتينات المسحوبة باستخدام الكروماتوغرافيا السائلة-مطياف الكتلة (الشكل 4أ، ب)، حددنا 161 و1,300 و3,116 بروتينات مرتبطة بـ GZMK من هؤلاء المرضى الثلاثة (NP15-17)، على التوالي (الشكل 4ج و
الجداول التكميلية 1 و 4). من بين تلك 56 بروتينًا التي تشترك فيها جميع المرضى، كانت هناك ركائز معروفة لـ GZMK، بما في ذلك SET و HNRNPK و TUBB. (الشكل 4ج، د). أكدنا انقسام SET من خلال إجراء اختبار هضم في المختبر باستخدام GZMK من النوع البري (الشكل التمديدي 4د). علاوة على ذلك، أكدنا انقسام ركيزة جديدة تم تحديدها، DMBT1، والتي أظهرت أنها تقلل الالتهاب في نموذج التهاب الأنف لدى الفئران. (الشكل 4e من البيانات الموسعة).
كان المكمل C3 من بين الركائز الجديدة التي تم تحديدها. نظرًا لموقعه المركزي في سلسلة المكملات ودوره البارز في تعزيز الالتهاب، قمنا بتوصيف تنشيطه بواسطة GZMK بالتفصيل. باستخدام C3 المنقى من المصل كركيزة اختبار، وجدنا أن GZMK قام بقطع C3 بسهولة (الشكل 4e، f)، مما يظهر كفاءة تحويل C3 بنسبة 35% من C3 المحول الكلاسيكي C4b2a (الشكل التمديدي 4f، g). من خلال تسلسل إدمان والاختبارات المناعية، أكدنا أن موقع القطع كان عندفيسلسلة C 3، التي تؤدي إلى إطلاق C 3 a (الشكل 4e، f)، وهو وسيط قوي للالتهابات تم ربطه بأمراض مجرى الهواء الالتهابية.لقد تحققنا أيضًا من أن C3a المحول بواسطة GZMK أدى إلى مستويات مماثلة من فسفرة ERK في خلايا THP1 كما فعل C3a المنقى من المصل أو C3a المحول بواسطة C4b2a (الشكل 4h-j من البيانات الموسعة). مجتمعة، تؤكد هذه البيانات أن GZMK يمكن أن يعمل كإنزيم بروتيني منشط لـ C3 لإنتاج C3a النشط القادر على تعزيز الالتهاب.
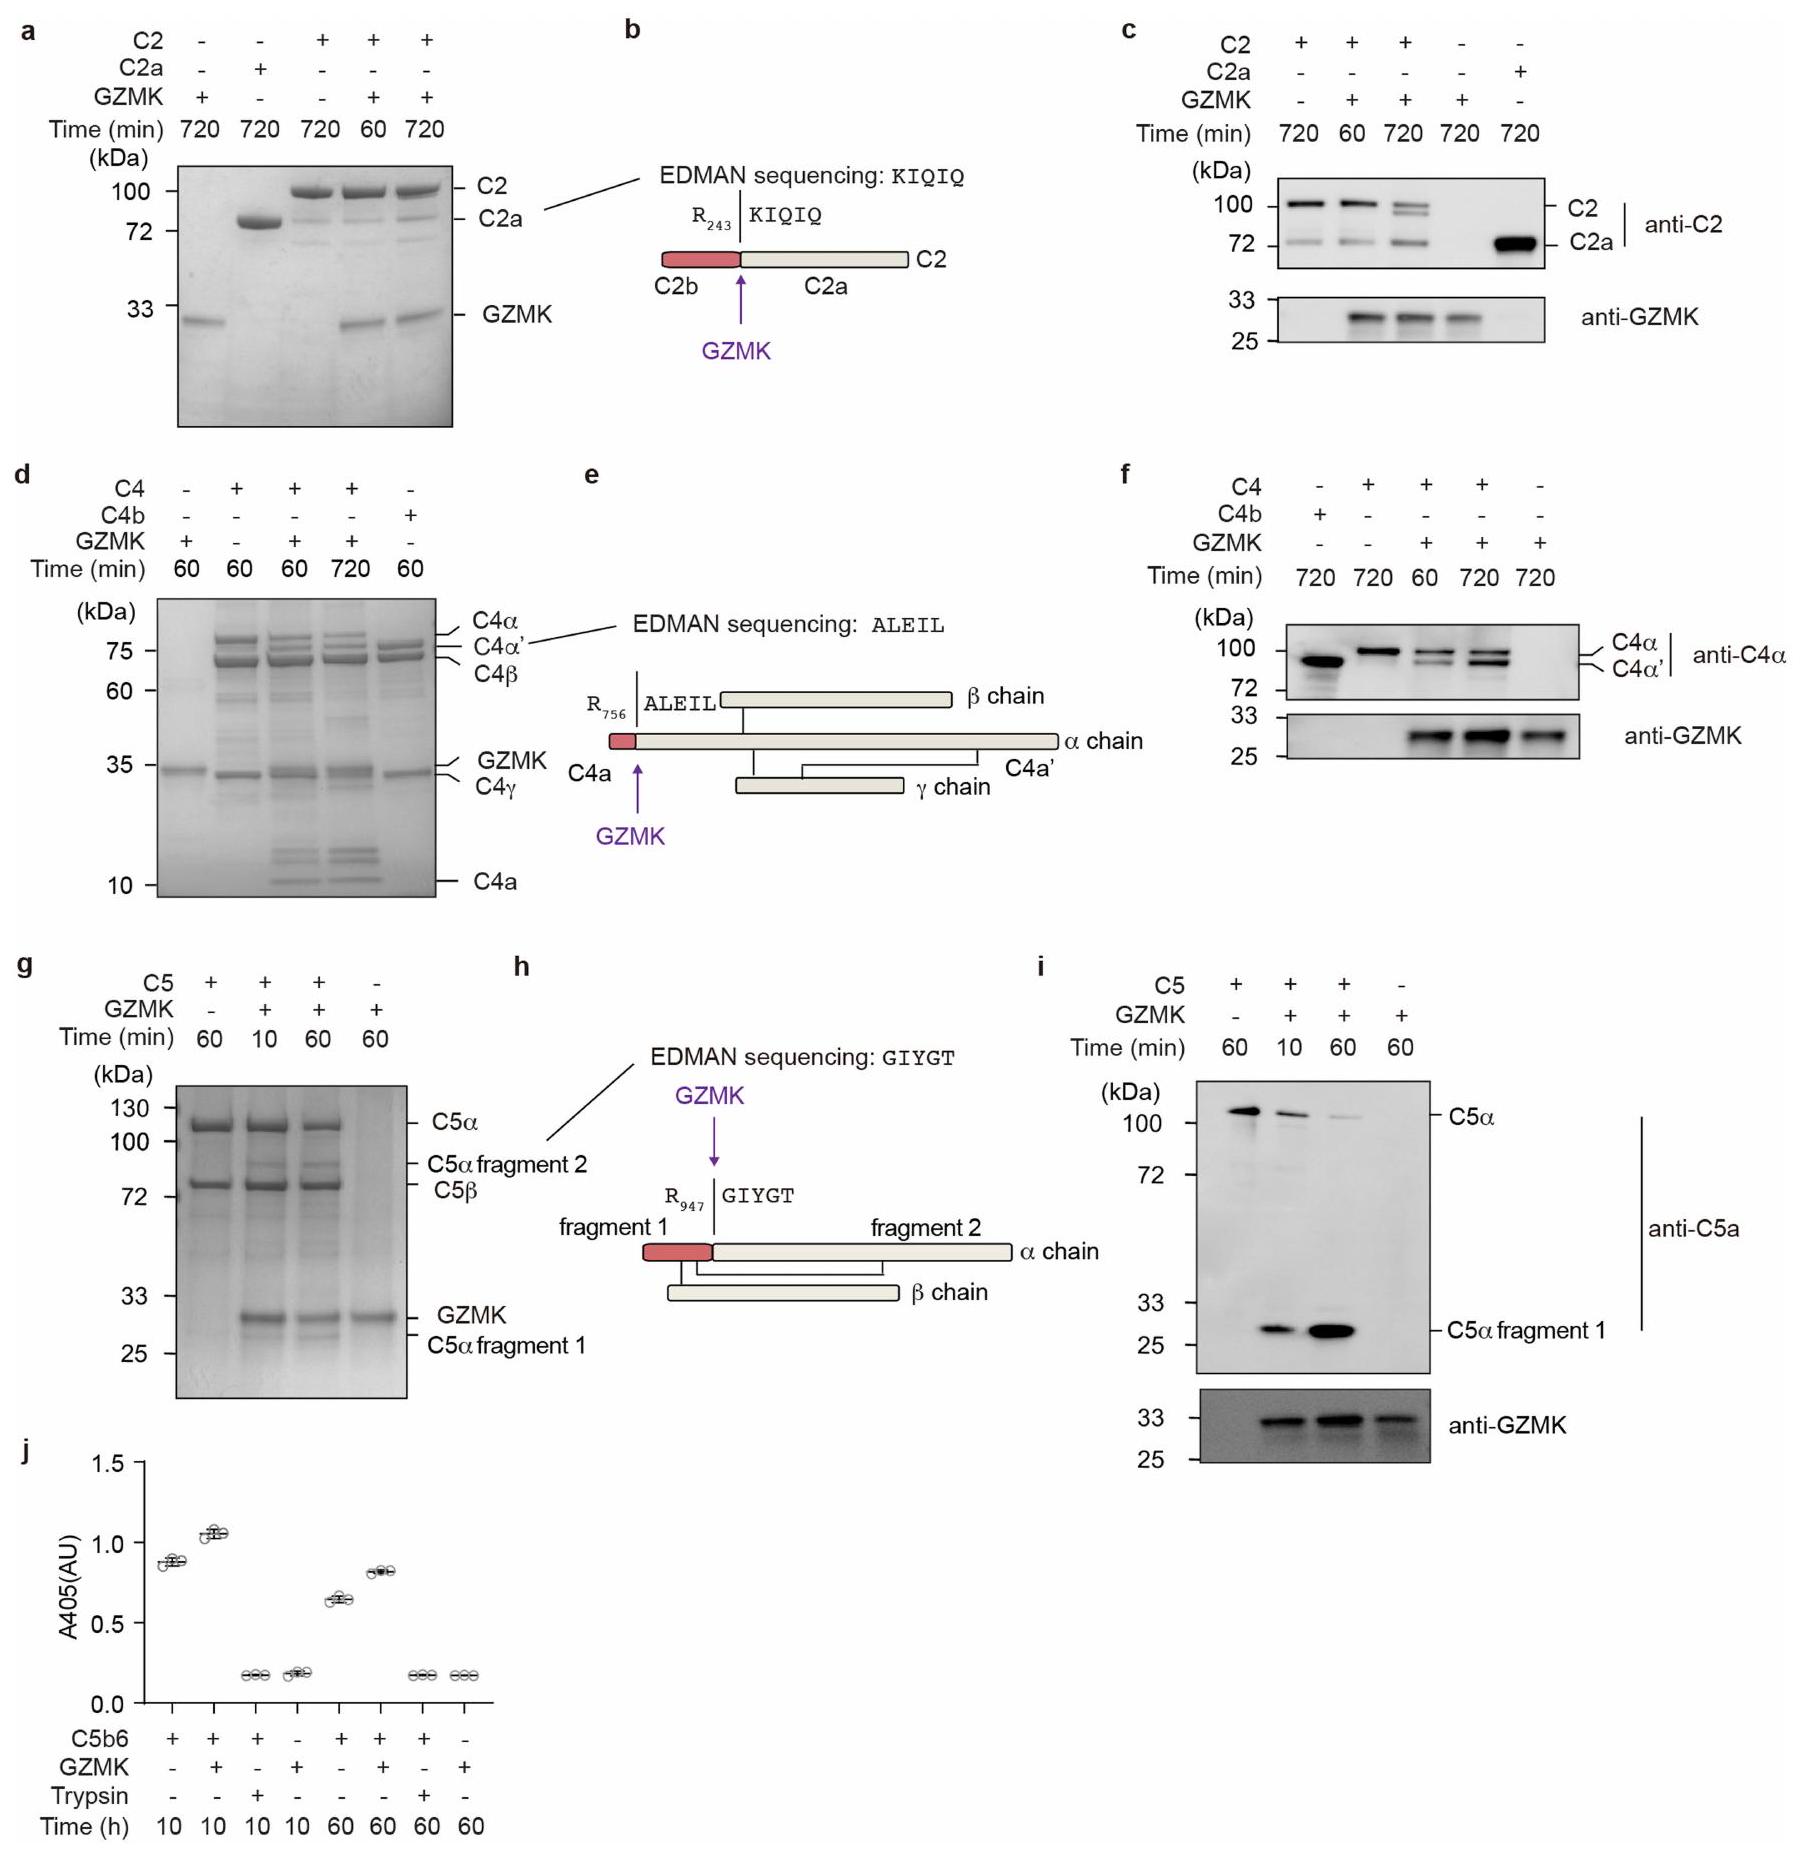
نظرًا لأن عدة بروتينات مكملة تم تحديدها كركائز محتملة في تفاعل GZMK-S214A (الجدول التكميلي 4)، قمنا باختبار ما إذا كان GZMK يمكن أن يستهدف عدة خطوات في سلسلة المكملات. باستخدام بروتينات مكملة نقية من المصل كركائز، وجدنا أن GZMK كان قادرًا على قطع C2 إلى C2a وC2b (الشكل البياني الموسع 5a-c)، وC4 إلى C4a وC4b (الشكل البياني الموسع 5d-f). لذلك، يمكن أيضًا من حيث المبدأ أن يعزز GZMK تشكيل المحول الكلاسيكي C3 C4b2a. علاوة على ذلك، GZMK يمكن أن يقطع C5 (الشكل 5g-i من البيانات الموسعة) بطريقة غير تقليديةلزيادة نشاط معقد هجوم الغشاء (الشكل 5j من البيانات الموسعة). لذلك، يعتبر GZMK جزيءًا فعالًا مؤيدًا للالتهابات يمكن أن يعمل من خلال تنشيط سلسلة المكملات.
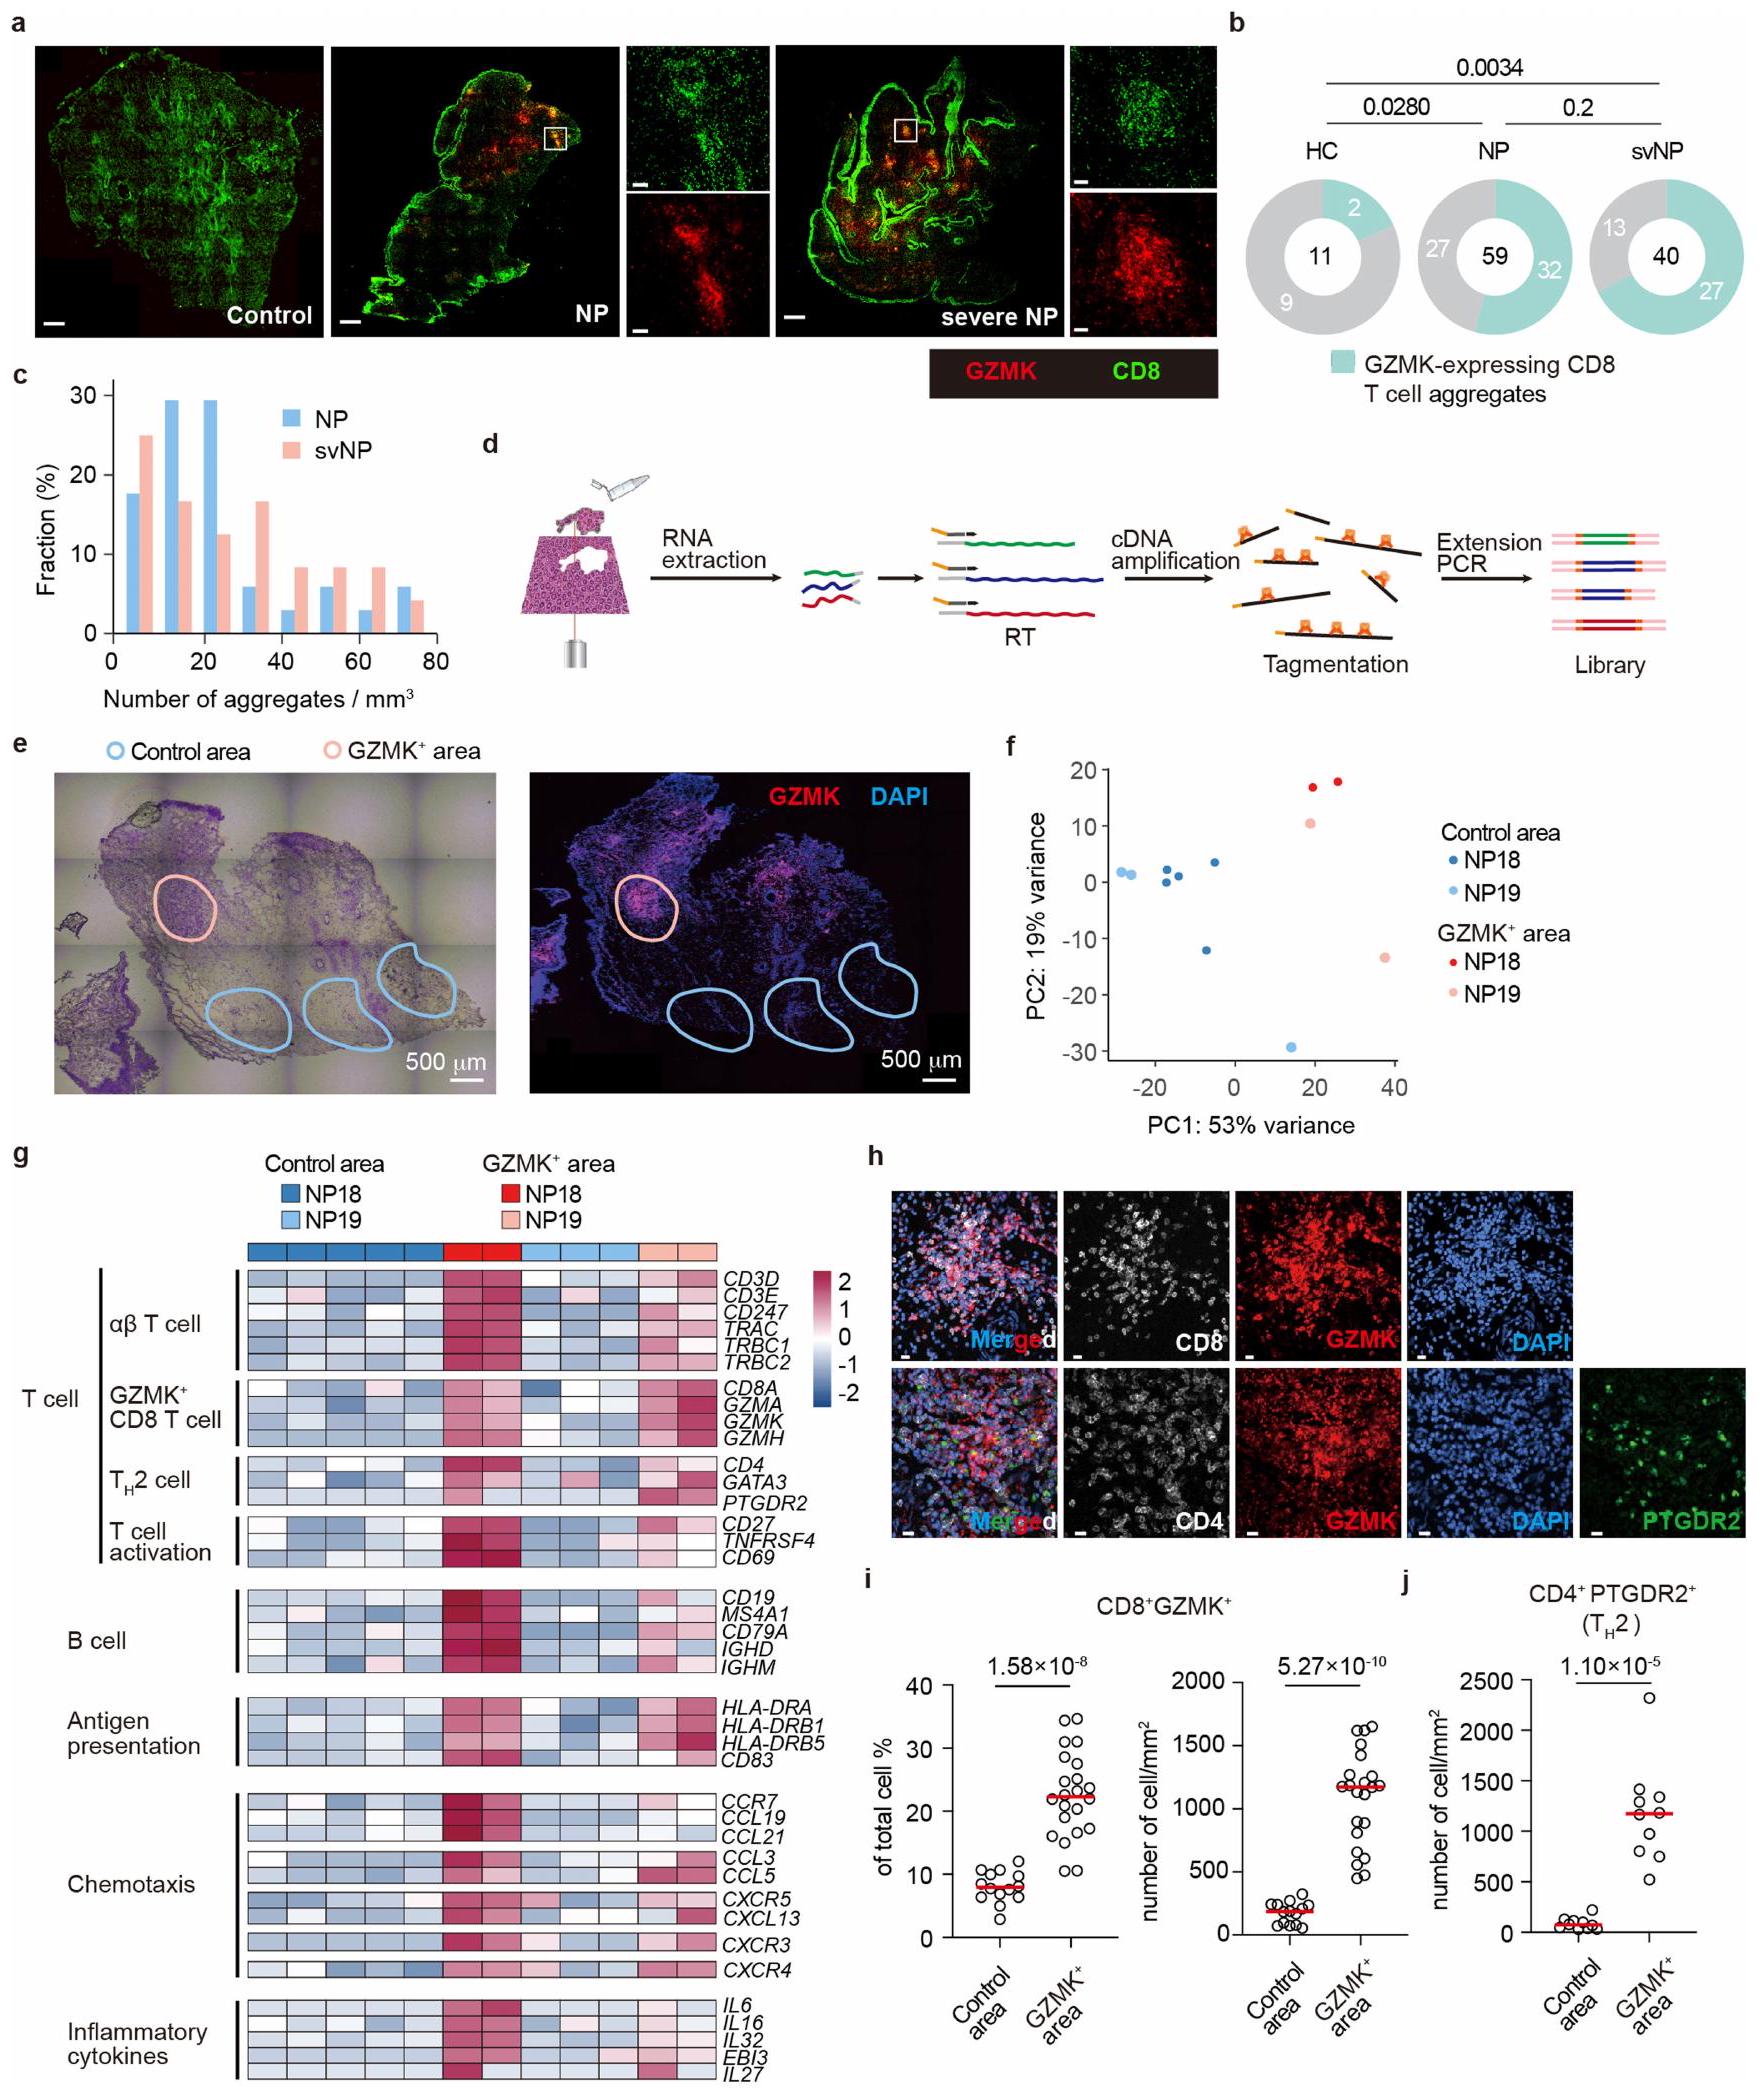
جي زيد إم كيهتترافق خلايا T مع تجمعات التهابية
قمنا بعد ذلك بإجراء تحليل المناعة النسيجية للأنسجة الأنفية من الأصحاء والمرضى الذين يعانون من التهاب الأنف. بينما كان هناك عدد قليل جداً من CD8تم العثور على خلايا T في HC، بأعداد كبيرة منتم العثور على خلايا، بما في ذلك تلك التي تعبر عن GZMK، في أنسجة NP، وخاصة من المرضى الذين يعانون من أمراض أكثر شدة؛ حيث شكلت العديد من تلك الخلايا تجمعات حول الأوعية الدموية، مما يذكر بالهياكل اللمفاوية الثلاثية (الشكل التوضيحي الممتد 6a-c). بالإضافة إلى ذلك، كان C3 موجودًا بكثرة في GZMK.مناطق تجمع الخلايا (الشكل التكميلي 7a، b)، تشير إلى تحويل C3 في الموقع بواسطة GZMK. لتوصيف المحتويات الالتهابية في هذه التجمعات من CD8 المعبر عن GZMKالخلايا، قمنا باستئصال الأنسجة المحتوية على التجمعات بواسطة الميكروتشريح بالليزر وأجرينا تسلسل RNA الكمي (الشكل 6d-f من البيانات الموسعة). كما هو متوقع، كانت المستويات الأعلى من و تم العثور عليها فيالمناطق أكثر من المناطق النسيجية التي تحتوي على القليلالخلايا (الشكل الإضافي 6g والشكل التكميلية 7c، d). المناطق الغنية بالتعبير عن GZMKكما احتوت الخلايا على مستويات أعلى من النسخ المرتبطة بـالخلايا، خلايا B والخلايا النخاعية (الشكل التوضيحي الممتد 6 ج والجدول التكميلية 5)، ولكن ليسوخلايا T التنظيمية (الشكل التوضيحي 7e). كما احتوت مناطق تجمع الخلايا على مستويات أعلى من الكيموكينات ومستقبلات الكيموكينات المهمة لاستقطاب الخلايا الالتهابية (على سبيل المثال، CXCR3، CXCR4، CCL4 وCCL5) ولتنظيم الهياكل اللمفاوية الثلاثية (على سبيل المثال، CCR7، CXCR5 ورابطة كل منهما).مستويات أعلى من السيتوكينات الالتهابية
الشكل 4 | تحديد ركائز GZMK. أ، سير العمل لاختبار سحب GZMK. ب، جيل ممثل ملون بصبغة كوماتسي زرقاء يظهر البروتينات التي تم سحبها بواسطة GZMK-S214A غير النشط إنزيميًا. البيانات تمثل ثلاث تجارب مستقلة باستخدام عينات مختلفة من المرضى. ج، البروتينات الفريدة والمتداخلة التي تتفاعل مع GZMK والتي تم تحديدها في المرضى NP15-17. د، مخططات النقاط تظهر وفرة البروتينات المشتركة الـ 56 المتفاعلة مع GZMK الموجودة في جميع المرضى ودرجات SEQUEST. انظر الطرق لمزيد من التفاصيل. تقطيع C3 المنقى من المصل بواسطة GZMK. يتم عرض هلام ملون بصبغة كوماتسي زرقاء (يسار) والرسم التخطيطي الذي يوضح موقع التقطيع (يمين)، كما تم تحديده بواسطة تسلسل إدمان. S، سيرين؛ N، أسباراجين؛ L، ليوسين. f، صور مناعية تظهر تقطيع GZMK لـ C3 المنقى من المصل. البيانات تمثل على الأقل ثلاث تجارب مستقلة (e و f). الصور المصدرية للهلام والصور المناعية مقدمة في الشكل التكميلية 1. (على سبيل المثال، IL6 و IL16 و IL32 و IL27) تم رؤيتها أيضًا في هذه التجمعات (الشكل التوضيحي الممتد 6g والجدول التكميلية 5).
بشكل عام، شكلت الخلايا التي تعبر عن GZMK حواليإجمالي الخلايا في هذه التجمعات (الشكل 6g-i من البيانات الموسعة)، حيثالخلايا موجودة أيضًا بكثرة (الشكل 6h,j من البيانات الموسعة)، مما يشير إلى أن مثل هذه الهياكل قد تعزز التواصل بين هذين المسارين لتعزيز نشوء المرض. التحليلات الإحصائية باستخدام CellPhoneDBلم يتوقع تفاعلات قوية بينخلايا T والخلايا (الشكل التكميلي 8أ). ومع ذلك، فإن خلايا T 1 تعبر بشكل كبير عن الكيميائيات CCL5 وCCL4 (الشكل التكميلي 8ب)، مما قد يساعد في جذب خلايا المناعة من النوع 2 التي تعبر عن CCR1 أو CCR3 أو CCR5. ووفقًا لهذه الفكرة، توقعت تحليلاتنا أن GZMKتتفاعل الخلايا بشكل واسع مع الخلايا الميلويدية المؤيدة للالتهابات، مثلالبلاعم (المرجع 10) (الشكل التوضيحي التكميلي 8c-f)، حيث أن هذه الخلايا تعبر عن أزواج متطابقة من مستقبلات الكيموكين (الشكل التوضيحي التكميلي 8g). بالإضافة إلى ذلك، يمكن أن يعمل C3a الذي يتم إنتاجه محليًا بواسطة GZMK كعامل جذب للخلايا الفعالة من النوع 2 التي تعبر عن C3AR، بما في ذلك الحمضات والخلايا البدينة. (الشكل التوضيحي 8h)، والذي بدوره سيقوم بإفراز السيتوكينات والوسائط الالتهابية لتعزيز تلف الأنسجة والمناعة من النوع 2.
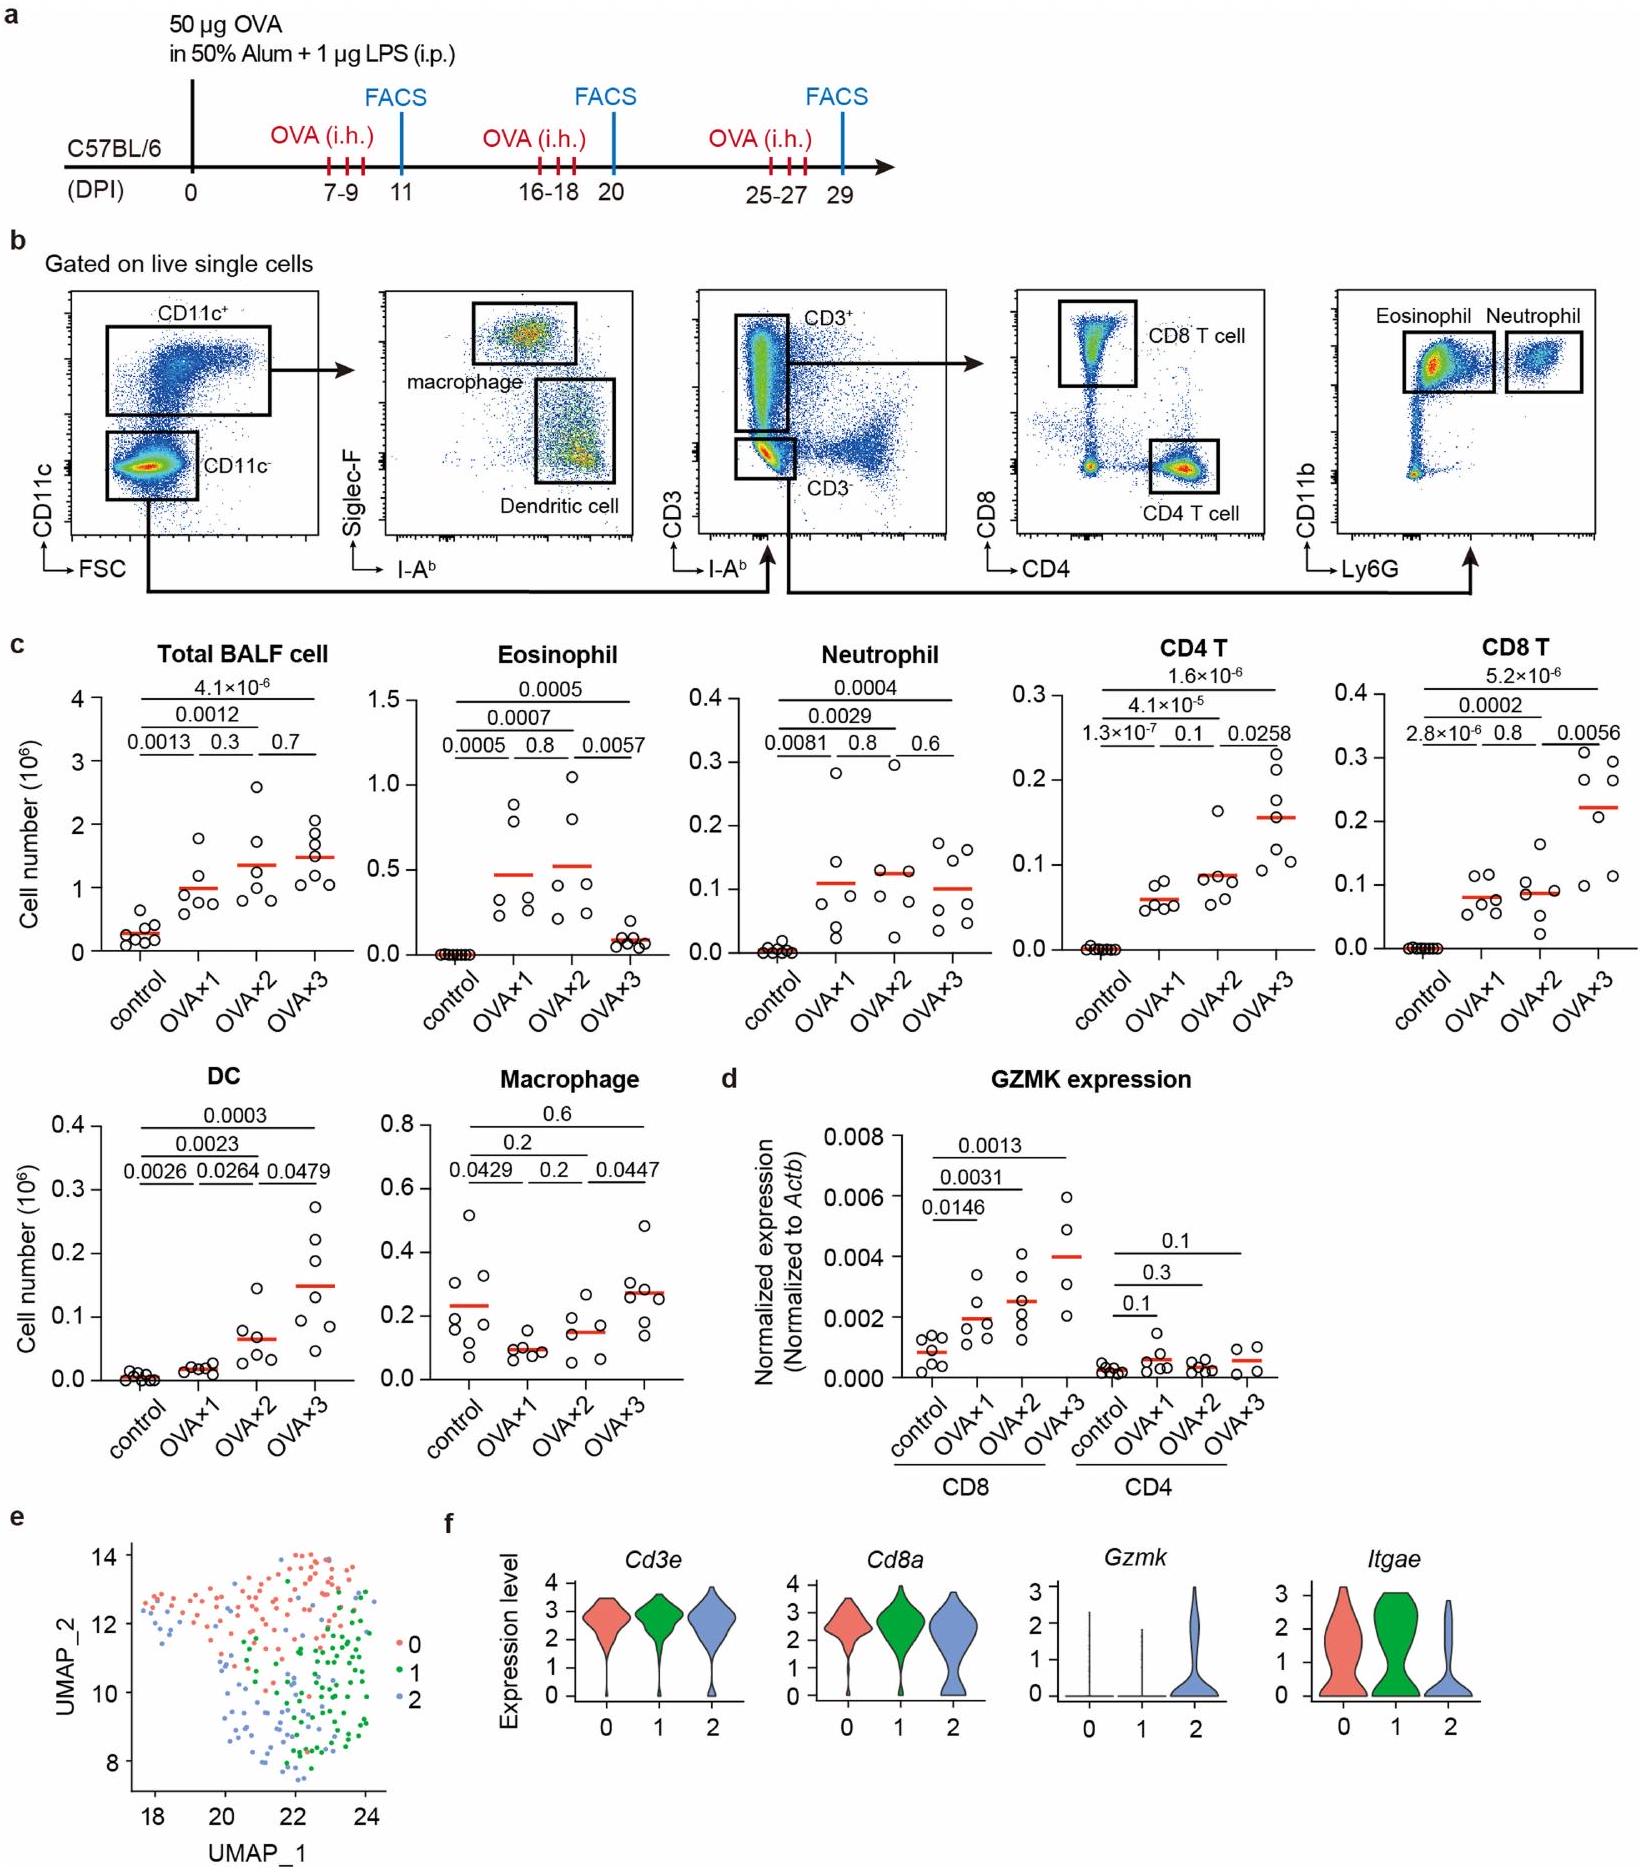
آثار GZMK المستمدة من خلايا T التي تعزز الأمراض
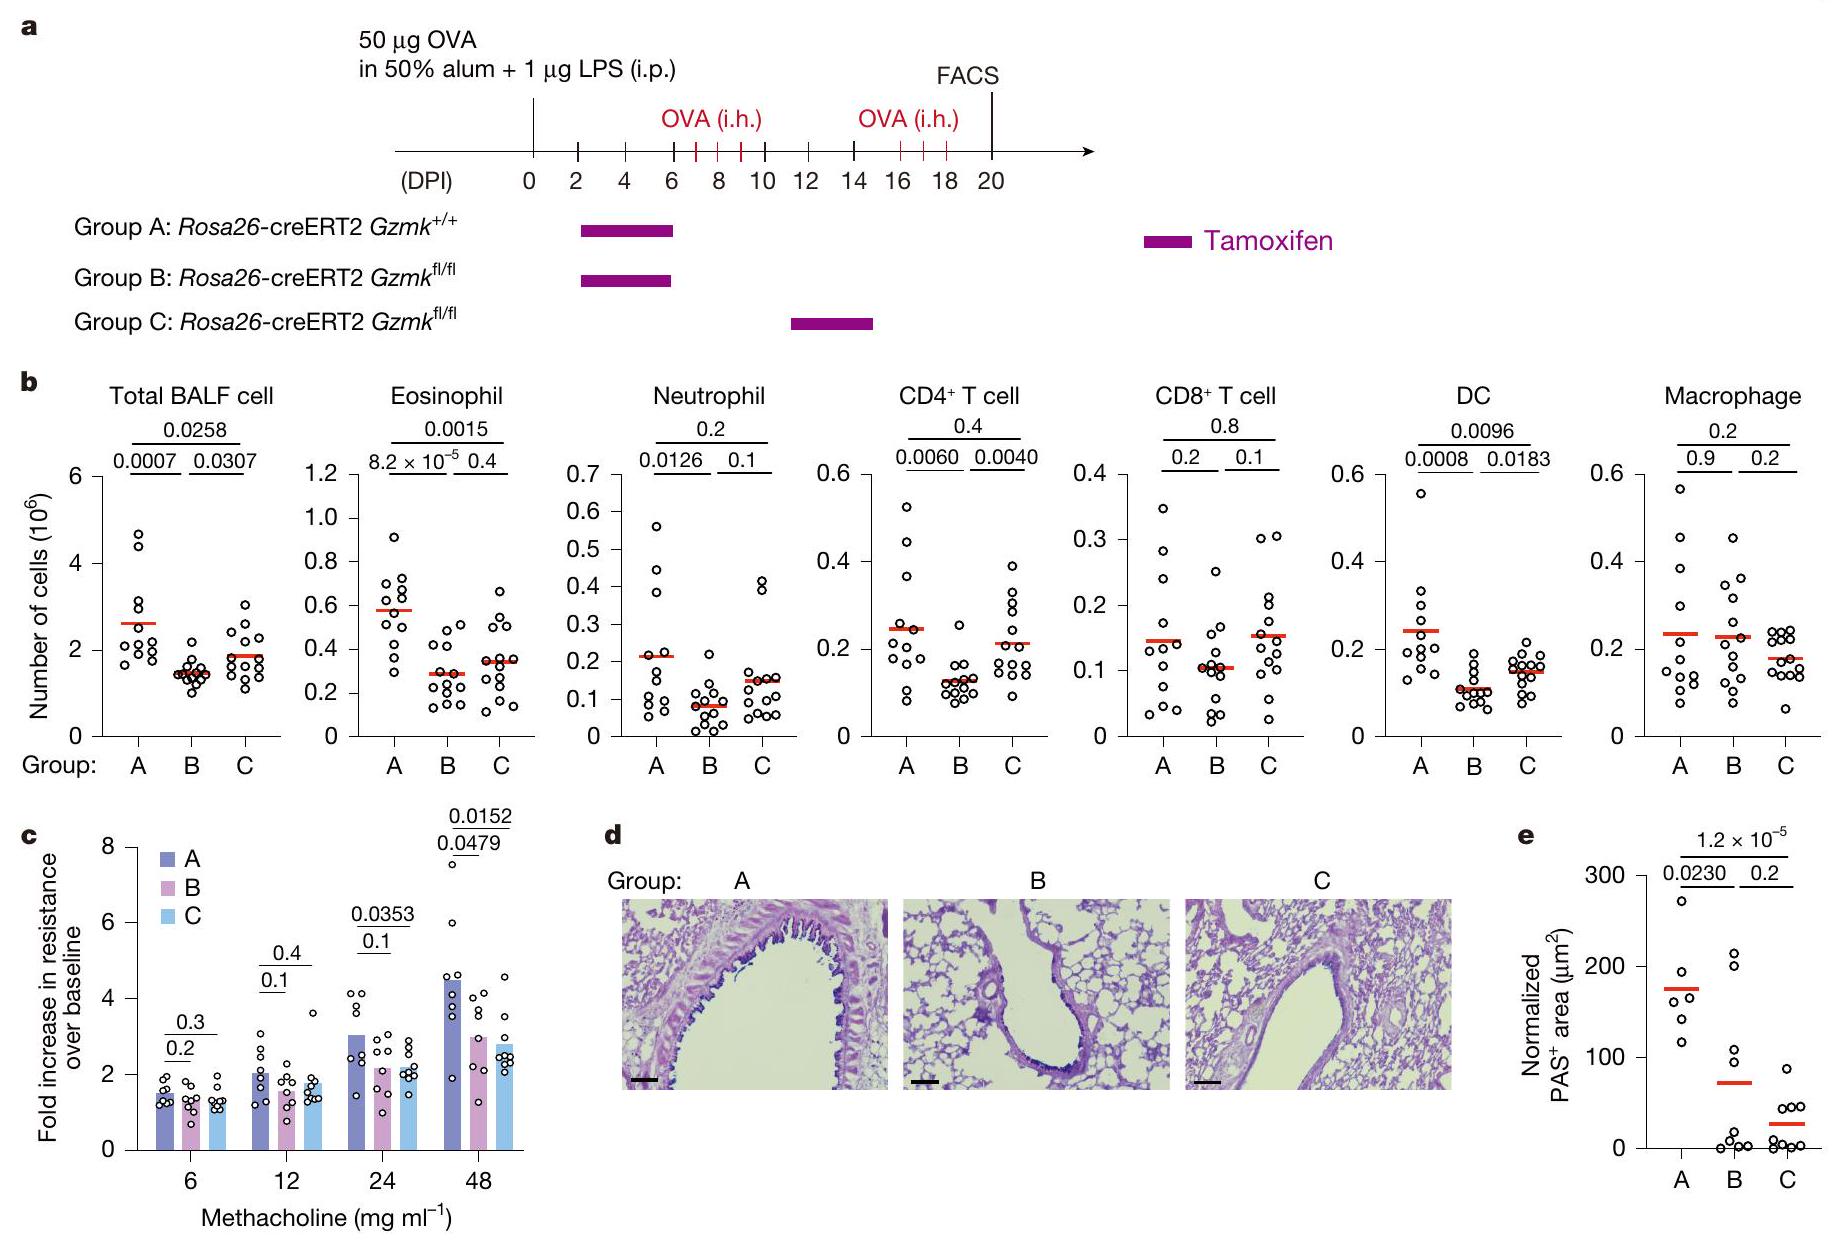
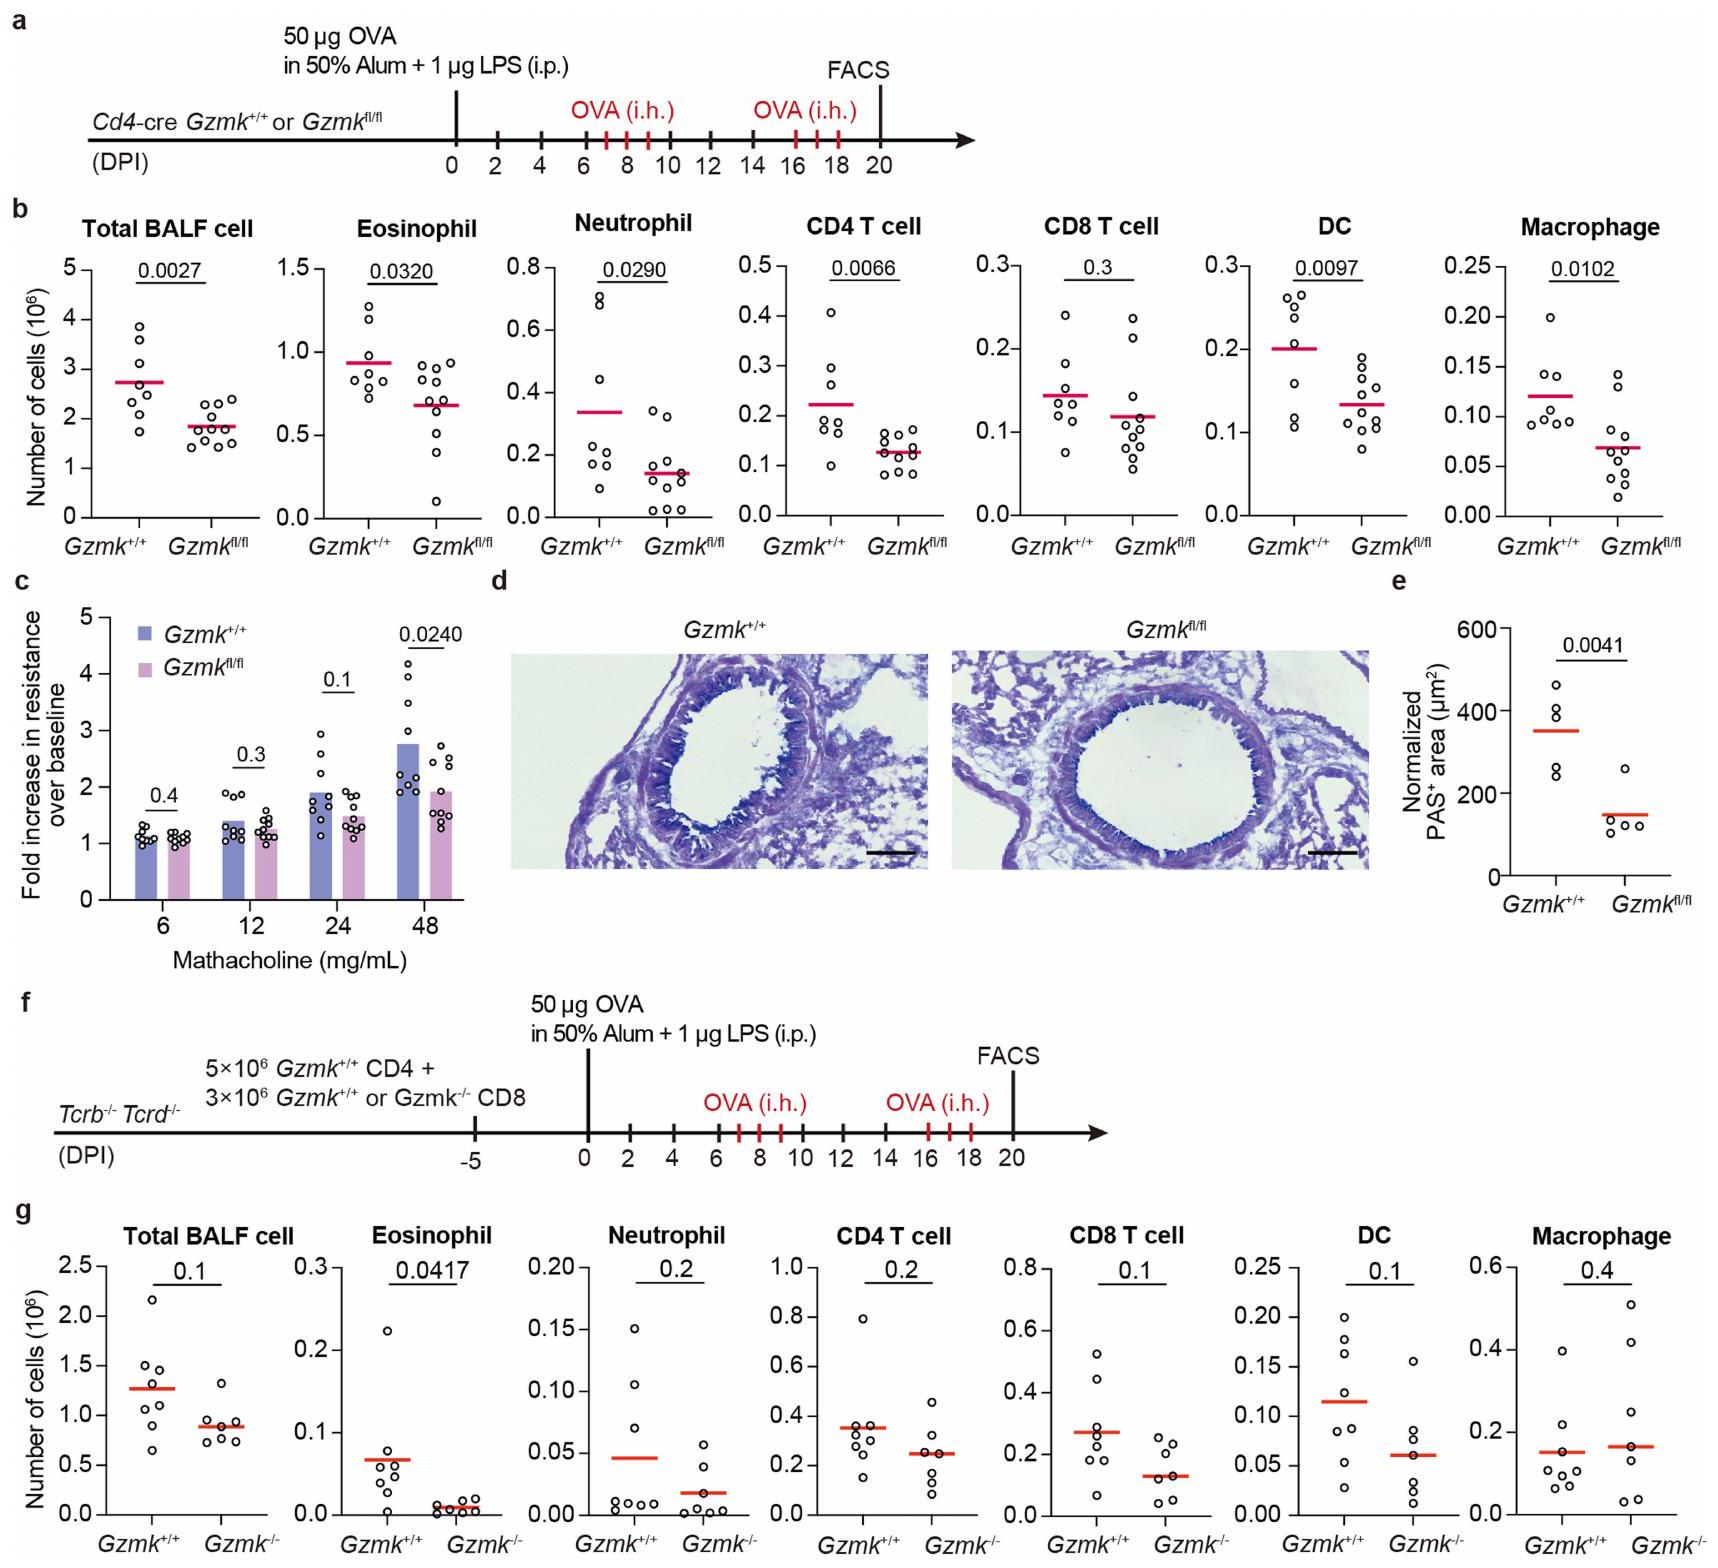
لاختبار مباشرة ما إذا كان GZMK من CD8تعمل خلايا T على تعزيز مرض الالتهاب في مجرى الهواء، وقد أنشأنا نموذج ربو في الفئران باستخدام الألبومين البيضوي (OVA) كمستضد. تم تحصين فئران C57BL/6 أولاً باستخدام OVA الممزوج في 50% من الألومنيوم والليبوبوليسكاريد (LPS)، ثم تم تحديها عن طريق استنشاق OVA المتناثر بعد أسبوع. تم تكرار استنشاق OVA مرتين لمحاكاة تكرار المرض، وتم إجراء تحليلات فرز الخلايا المعتمدة على الفلورية (FACS) لخلايا سائل غسل القصبات الهوائية (BALF) بعد يومين من كل تحدٍ (الشكل البياني الموسع 7a، b). تم استقطاب مجموعات متنوعة من خلايا المناعة إلى مجرى الهواء عند تحدي OVA، بما في ذلك الحمضات، العدلات، خلايا، تم تقييد تعبير Gzmk بشكل كبير إلى CD8الخلايا ولكنها شبه غير قابلة للاكتشاف في CD4الخلايا التائية، وزادت بشكل تدريجي مع التحديات المتكررة لـ OVA (الشكل البياني الموسع 7d). من خلال تحليلات تسلسل RNA أحادي الخلية (scRNA-seq) أكدنا تعبير Gzmk في مجموعة فرعية من CD8 في سائل غسيل الشعب الهوائية (BALF).خلايا T، وبعض من هذه الخلايا T التي تعبر عن Gzmk زادت أيضًا من تعبير Itgae (الشكل البياني الممتد 7e، f)، مشابهة جدًا لخلايا T1 في أنسجة NP البشرية.
بعد ذلك، اتبعنا نهج فقدان الوظيفة لفحص تطور التهاب المسالك الهوائية في CD4-cre;Gzmkالفئران، التي تفتقر إلى Gzmk في خلايا T (الشكل التوضيحي الممتد 8a). مقارنةً بـ CD4-cre؛Gzmkتحكم، CD4-cre؛ Gzmkكانت الحيوانات تحمل أعدادًا منخفضة بشكل ملحوظ من الإيوزينوفيلات، العدلات، CD4تعمل خلايا T، والخلايا الشجرية، والبلعميات في سائل غسيل القصبات الهوائية (الشكل 8b من البيانات الموسعة). تحسنت وظيفة الرئة لدى هذه الفئران الأخيرة، حيث أظهرت تحملًا أفضل تجاه تضيق مجرى الهواء المستحث وانخفاض فرط تنسج خلايا الكأس (الشكل 8c-e من البيانات الموسعة). لذلك، فإن GZMK المستمد من خلايا T يعزز الالتهاب في مجرى الهواء.
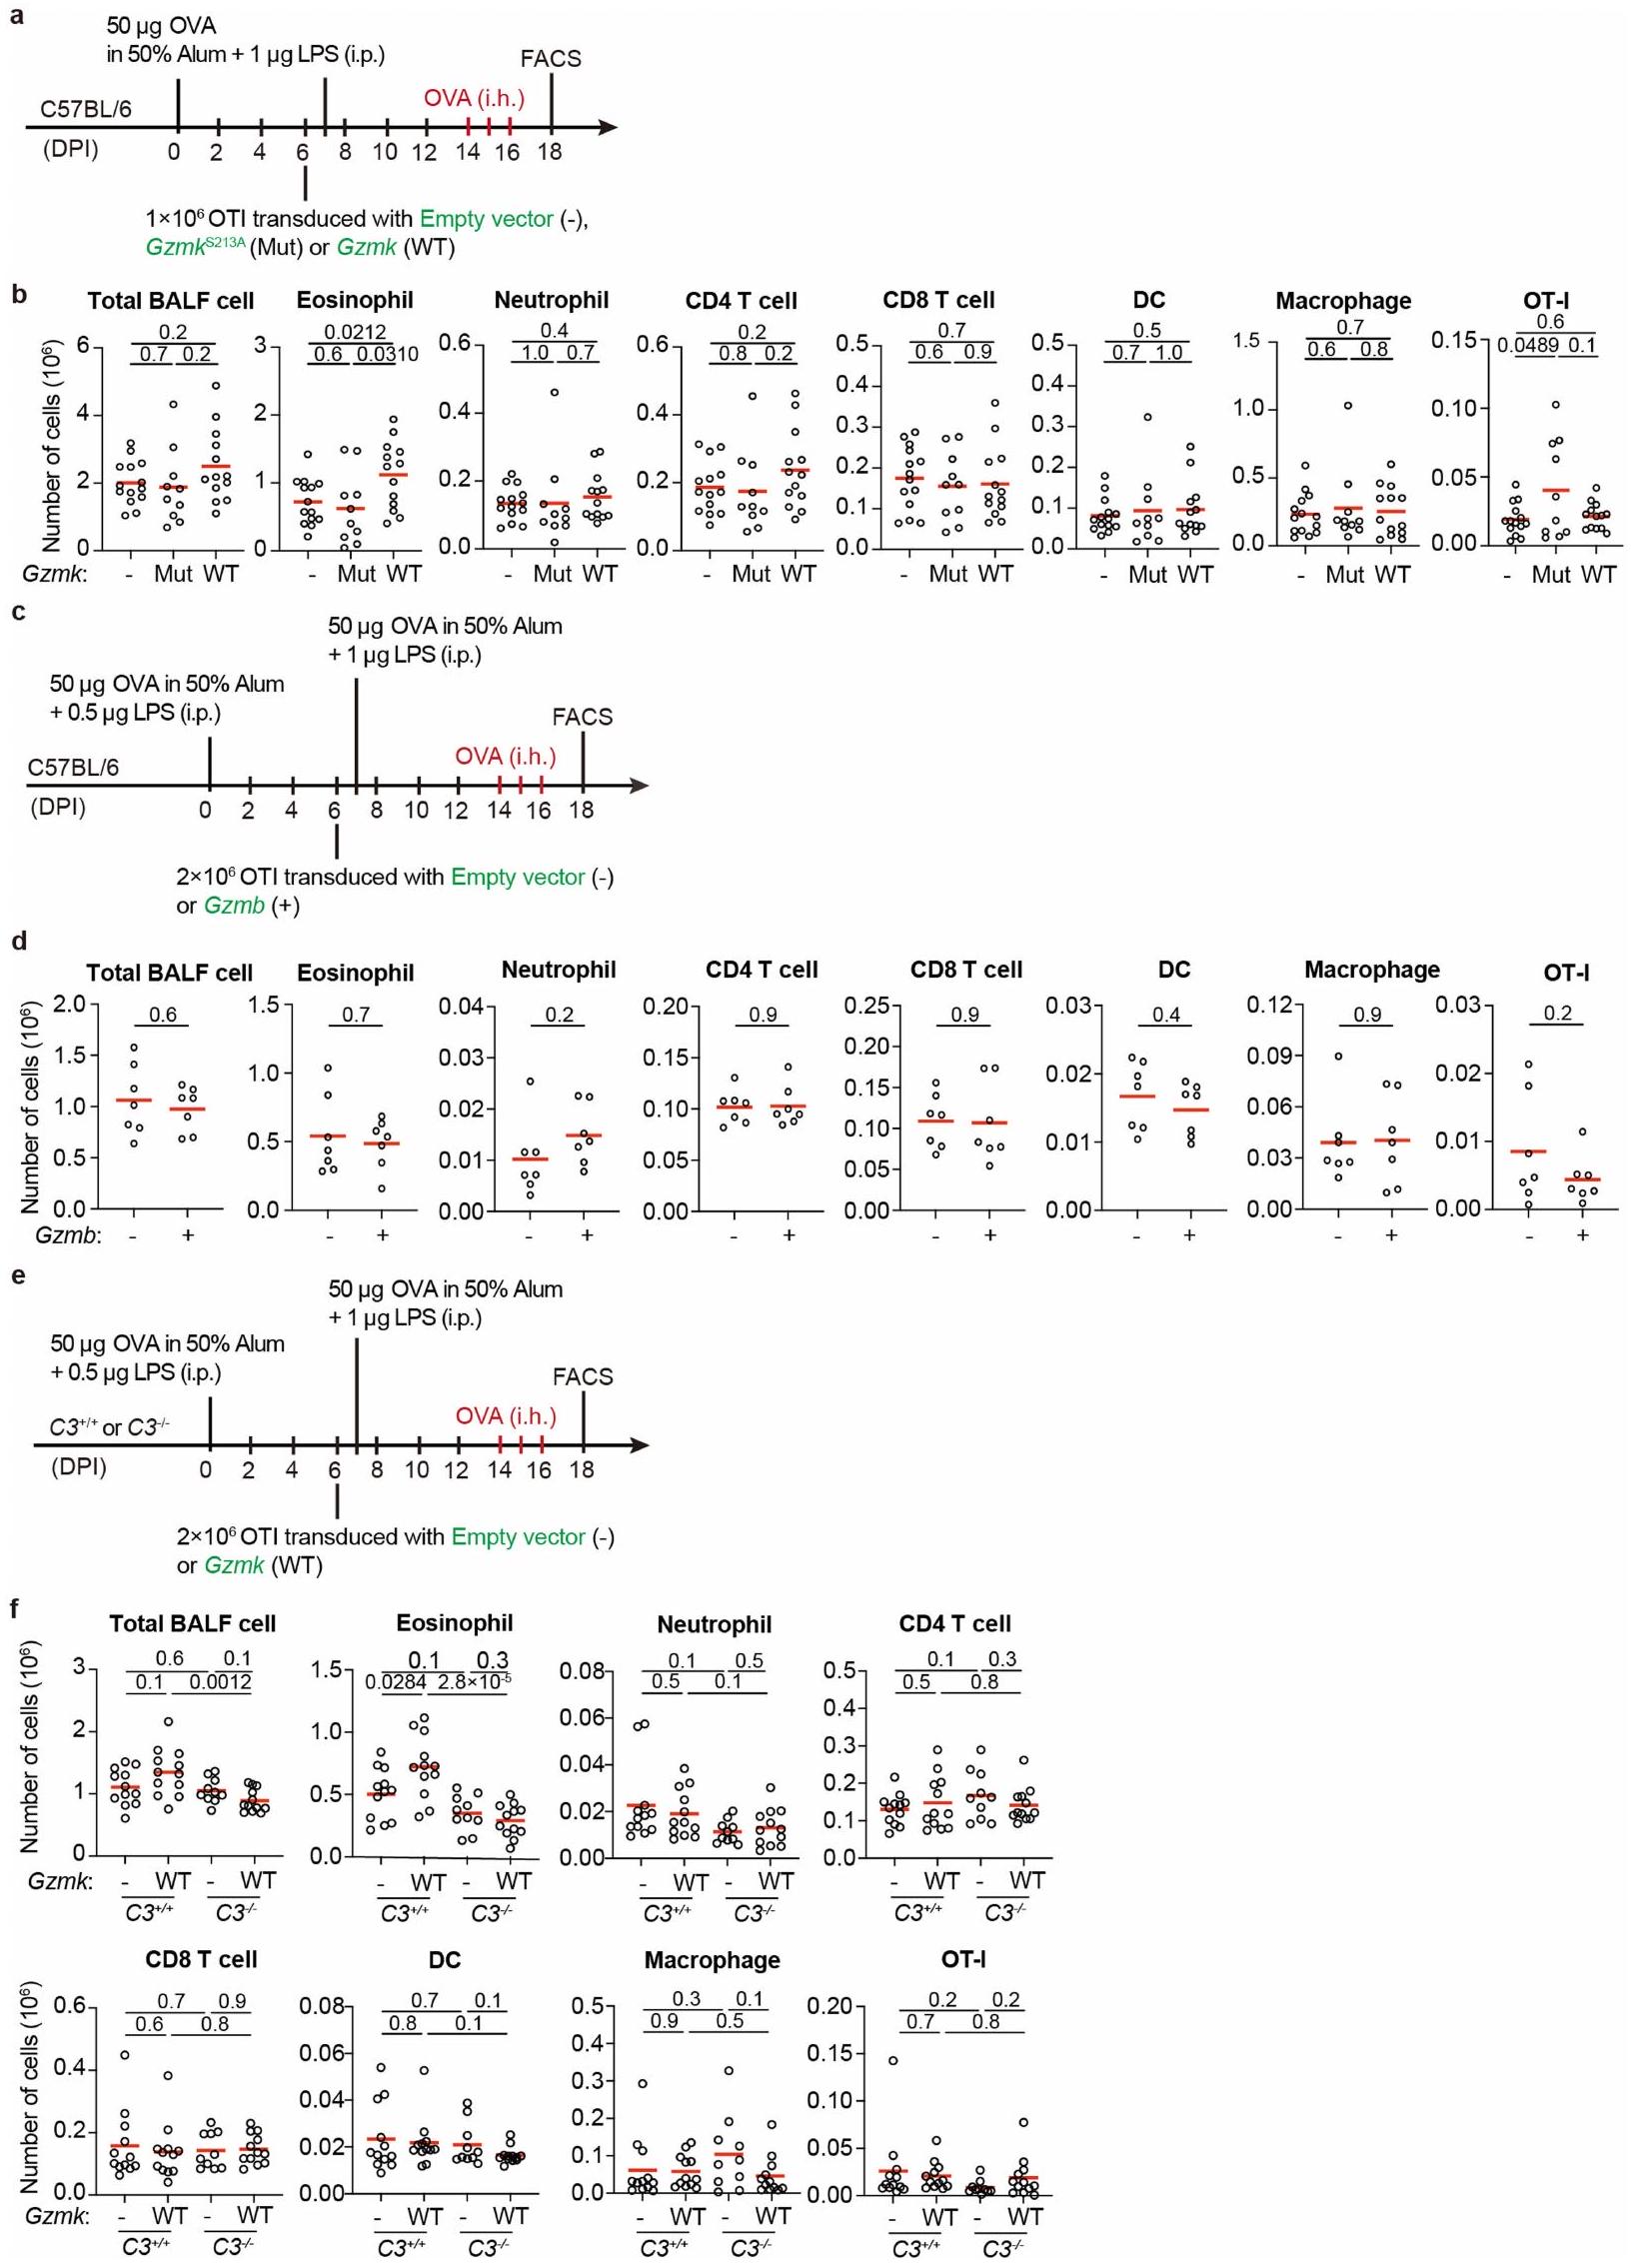
لتقييم دورتم أخذ GZMK المشتق من خلايا T، حيث اتبعنا نهجين متكاملين. في المجموعة الأولى من التجارب، قمنا بنقلالخلايا معًا معأوخلايا T إلى Trrbتكرادالفئران المستقبلة التي تفتقر إلى خلايا T (الشكل 8f من البيانات الموسعة). بعد تحفيز الربو، تم إعادة تكوين تلك الفئران بـكانت الخلايا تحتوي على أعداد أقل بشكل ملحوظ من الحمضات في سائل غسيل القصبات الهوائية (الشكل 8g من البيانات الموسعة). في المجموعة الثانية من التجارب، قمنا بنقل CD45.1 بشكل تفاعلي.تم نقل خلايا OT-I الخاصة بـ OVA والتي تعبر عن GZMK بشكل مفرط، أو الطفرة غير النشطة GZMK-S213A، أو GZMB إلى مضيفين متجانسين CD45.2 وتم تحفيز الربو الحاد باستخدام OVA (الشكل التمديدي 9a، c). بعد جرعة واحدة من تحدي OVA المستنشقة، وُجدت زيادة في تسرب الخلايا الحمضية إلى مجرى الهواء في المتلقين لخلايا OT-I التي تعبر عن GZMK بشكل مفرط، بينما لم تُحدث خلايا OT-I التي تعبر عن GZMK-S213A غير النشطة أو GZMB أي فرق (الشكل التمديدي 9b، d). لم تتأثر توسع أو تراكم خلايا OT-I T بالتعبير المفرط عن GZMB أو GZMK (الشكل التمديدي 9b، d)، مما يشير إلى أن تنشيط وتكوين الذاكرة لهذه الخلايا لم يتغير بشكل كبير. عندما تم نقلها بالتبني إلىالفئران، كانت خلايا OT-I التي تعبر عن GZMK بشكل مفرط لم تعد قادرة على تعزيز تسرب الحمضات إلى مجرى الهواء (الشكل 9e، f من البيانات الموسعة)، مما يشير إلى أن C3 ضروري في هذه العملية، على الرغم من العيوب المناعية في هذه الحيوانات.منعنا من التحقيق في المزيد من الآثار طويلة الأمد. مجتمعة، تشير نتائجنا إلى أن CD8المستخلص من خلايا T GZMK يعزز تسرب الإيوزينوفيل إلى مجرى الهواء عن طريق تنشيط C3.
تخفيف التهاب مجرى الهواء من خلال استهداف GZMK
لفحص ما إذا كان استهداف GZMK قد يوفر فوائد علاجية، قمنا بتربية الـسلالة مع سلالة Rosa26-CreERT2، التي تمكن من تحفيز التاموكسيفينالاستئصال. كما هو موضح في الشكل 5أ، روزا26-كريERT2؛Gzmkتم معالجة الفئران بالتاموكسيفين بعد التطعيم الأولي بـ OVA ولكن قبل أول تحدي استنشاق (المجموعة B) أو بعد الأول ولكن قبل الثاني (المجموعة C). التحكم Rosa26-creERT2;Gzmkتمت معالجة الحيوانات أيضًا بالتاموكسيفين (المجموعة A). بدون علاج التاموكسيفين، روزا26-creERT2؛Gzmkوروزا26-creERT2؛Gzmkتطورت الفئران التهاب مجرى الهواء المقارن (الشكل التوضيحي 9). عندما تم تحفيز حذف Gzmk قبل أي تحدي استنشاق، كان هناك عدد أقل بكثير من الحمضات والعدلات،تم العثور على الخلايا والخلايا الشجرية في سائل غسيل الشعب الهوائية (الشكل 5ب، مقارنة المجموعة ب مع أ). عندما تم تحفيز حذف Gzmk بعد التحدي الأول بالاستنشاق ولكن قبل حدوث نوبة جديدة من نوبة الربو، وُجد عدد أقل بكثير من الحمضات والخلايا الشجرية في خلايا سائل غسيل الشعب الهوائية (الشكل 5ب، مقارنة المجموعة ج مع أ). لتحديد ما إذا كان حذف Gzmk سيؤدي إلى استعادة وظيفة الرئة، قمنا بقياس أحجام الزفير القسري في هذه المجموعات الثلاث من الفئران خلال تحدي الميثاكولين. مقارنة بالمجموعة أ، كانت وظائف الرئة في كل من المجموعة ب والمجموعة ج محسّنة بشكل كبير (الشكل 5ج) وانخفضت فرط تنسج خلايا الكأس (الشكل 5د، هـ).
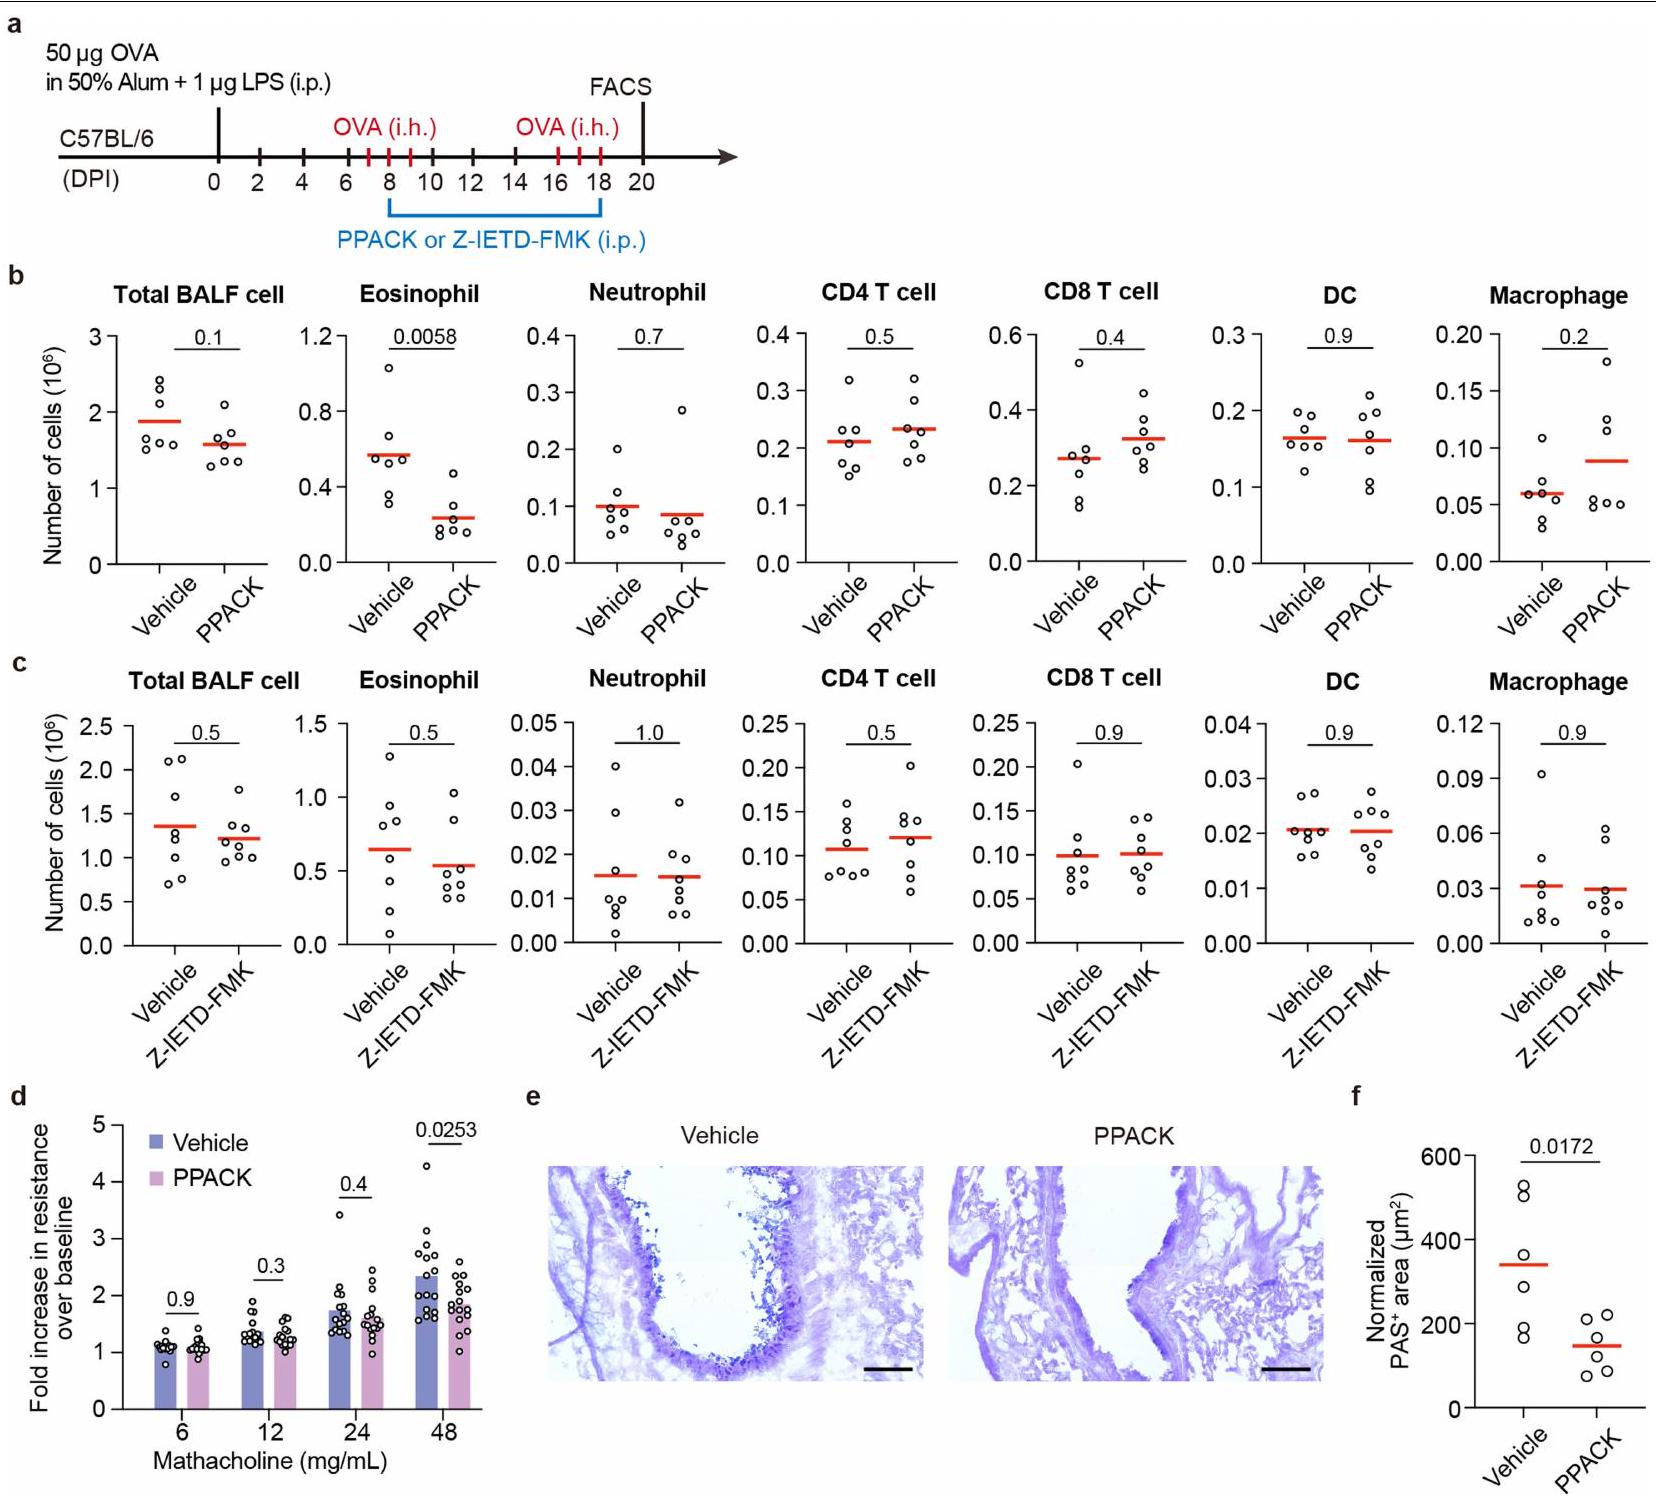
علاوة على ذلك، اختبرنا أيضًا ما إذا كان تثبيط GZMK عن طريق الأدوية يمكن أن يخفف من الربو في الفئران. بعد تحفيز الربو، تم علاج هذه الفئران كل يومين باستخدام مركب صناعي دواء يثبط بقوة نشاط GZMK لكل من الإنسان والفأر، D-Phe-Pro-Arg-chloromethylketone (PPACK)، ولكن ليس مثبط GZMB كاربوبنزوكسي-إيل-غلوتاميك-ثريونين-أسبارتيك-فلوروميثيل كيتون (Z-IETD-FMK)قلل بشكل كبير من تسلل الإيوزينوفيل إلى مجرى الهواء (الشكل التوضيحي الممتد 10a-c). كما قلل PPACK بشكل كبير من فرط تنسج خلايا الجُبَيْبَات وحسن وظيفة الرئة في الربو لدى الفئران (الشكل التوضيحي الممتد 10d-f). مجتمعة، تدعم بياناتنا أن GZMK الناتج عنتعتبر خلايا GZMK محركًا مهمًا لالتهاب مجرى الهواء وتقدم المرض، وأن إزالة أو تثبيط GZMK يمكن أن تكون استراتيجية علاجية مفيدة.
نقاش
في هذه الدراسة، حددنا مجموعة فرعية من الأنسجة المزروعة،مثلخلايا T التي تعزز التهاب المسالك الهوائية من خلال جزيئها الفعال المميز GZMK. خلايا CD8 التي تعبر عن GZMKتم العثور على خلايا في الأوراموأنسجة الأمراض للعديد من الاضطرابات المناعية الذاتية مثل التهاب المفاصل الروماتويدي والتهاب الكلى الذئبي. ومع ذلك، لم يتم تحديد الأهمية الوظيفية لهذه الخلايا في علم الأمراض المرتبط بالأمراض. من خلال استخدام أساليب فقدان الوظيفة واكتساب الوظيفة في نماذج الربو لدى الفئران، تُظهر دراستنا دورًا محوريًا لخلايا CD8 التي تعبر عن GZMK.الخلايا التائية في تعزيز التهاب المسالك الهوائية. من المعروف أن الخلايا تلعب أدوارًا تعزز الأمراض أو تنظيمها في الاضطرابات الالتهابية، بشكل أساسي من خلال قتل الخلايا المستهدفة بواسطة GZMB. على سبيل المثال، CD8 التي تعبر عن GZMBتساهم خلايا T في مسببات مرض السكري من النوع الأول من خلال قتل خلايا بيتا.. من ناحية أخرى، مجموعة فرعية من GZMB المعبر عنهاتقوم خلايا T بتثبيط المناعة الذاتية من خلال القضاء على خلايا CD4 التفاعلية ذاتيًا خلايا لا يُعرف GZMK كإنزيم سيتوتوكسي رئيسي فيقتل الخلايا التائية. يحدد عملنا GZMK كإنزيم بروتيني جديد ينشط سلسلة مكملات، وهو اكتشاف تدعمه أيضًا ورقة بحثية حديثة.لقد حددت الأبحاث السابقة دور المكمل في بقاء خلايا T في حالة التوازن.والتحفيز المساعد. ومع ذلك، تُظهر أعمالنا جزيءًا فعالًا من خلايا T لم يُقدَّر سابقًا في تنشيط نظام المكمل، مما سيساعد في تنسيق تنشيط المناعة التكيفية والفطرية. بالإضافة إلى ذلك، من المحتمل أن تُستخدم GZMK أيضًا بواسطة خلايا مناعية أخرى، مثل خلايا اللمفوية الفطرية، كآلية عامة لتعزيز تنشيط المكمل والاستجابات الالتهابية.
لا يقوم GZMK فقط بتقسيم C3 إلى C3a وC3b، بل يستهدف أيضًا كل من C2 وC4 لتعزيز إنتاج المحول الكلاسيكي C3 C4b2a. بهذه الطرق، يساعد GZMK في إنتاج العامل C3a المؤيد للالتهابات، وهو مادة كيميائية جذابة قوية لخلايا المناعة التي تعبر عن C3AR.في نماذج الحيوانات، نوضح أن GZMK يساهم في التوظيف المبكر للحمضات في المسالك الهوائية بطريقة تعتمد على C3. الحمضات هي عوامل مرضية مهمة يمكن أن تعزز لاحقًا الالتهاب، وتلف الأنسجة، وإعادة تشكيلها من خلال إفراز السيتوكينات والبروتينات الكاتيونية.. بالإضافة إلى ذلك، يمكن أن تشير C3a و C3b في خلايا مناعية مختلفة، بما في ذلك مجموعات فرعية من الخلايا النخاعية والألياف، لتحفيز الاستجابات الالتهابية.من خلال قطع C2 وC4 وC5، يمكن أن يعزز GZMK أيضًا تشكيل معقد الهجوم الغشائي النهائي، مما يؤدي إلى مزيد من تلف الأنسجة والالتهاب.من ناحية أخرى، من المهم أن نلاحظ أن الركائز الأخرى لـ GZMK بما في ذلك DMBT1، وهو منظم سلبي لالتهاب الأنف في الفئرانمن المحتمل أن تساهم أيضًا في التأثير العام الذي يؤدي إلى تفاقم المرض الناتج عن GZMK.
يبدو أن الفصل بين خلايا TO التي تعبر عن GZMB وخلايا T1 التي تعبر عن GZMK في نسيج NP يعكس انقسام خلايا المساعدة من النوع 1 والنوع 2، والذي يعتمد على تعبير سيتوكينات مميزة. هذه المجموعتان الفرعيتان لديهما تداخل كلوني ضئيل ولكن مرتبطتان بأنواع مختلفة من الدم.المجموعات الفرعية في مجموعة المرضى التي قمنا بتحليلها. نفترض أن هناك اختيارًا لسلالة بين مسارات التأثير GZMB وGZMK قد يتم اتخاذه في وقت مبكر خلال الاستجابة. اقترحت الدراسات الحديثة أن التقليد الجزيئي قد يكون وراء تنشيط الخلايا التائية الشاذة ومرض المناعة الذاتية في الأمراض الالتهابية مثل التصلب المتعدد والتهاب الفقار المقسط.ستشكل خلايا T التي تتعرف على كل من الببتيدات الغريبة والذاتية ذاكرة مناعية نتيجة العدوى.
الشكل 5 | إزالة GZMK تقلل الالتهاب وتستعيد وظيفة الرئة في الربو. أ، إعداد التجربة. ب، أعداد خلايا المناعة المشار إليها في سائل غسيل القصبات الهوائية. كل رمز يشير إلى فأر واحد، والخطوط تمثل المتوسطات. DC، خلية دندريتية. ج، وظيفة الرئة وفرط حساسية المجاري الهوائية استجابةً لجرعات متزايدة من الميثاكولين، تم قياسها بواسطة تقنية التذبذب القسري (انظر الطرق لمزيد من التفاصيل). كل رمز يشير إلى فأر واحد والأشرطة تمثل يعني. د، علم الأنسجة الرئوية. د، صبغة AB-PAS التمثيلية لشرائح أنسجة الرئة. هـ،المناطق في مجرى الهواء (انظر الطرق لمزيد من التفاصيل). كل رمز يشير إلى فأر واحد، والخطوط تمثل المتوسطات. تم تجميع البيانات من ثلاث تجارب مستقلة، مع تضمين ما لا يقل عن حيوانين في كل مجموعة.القيم بواسطة غير متطابقة ذات جانبين-اختبارات. قضبان القياس،. i.p.، داخل الصفاق؛ i.h.، استنشاق؛ DPI، أيام بعد التحصين. وأن تصبح ذاتية التفاعل في وقت لاحق من الحياة. تشمل خلايا T1 تلك التي يُتوقع أن تتعرف على المواد المسببة للحساسية، والفيروسات، والبروتينات الذاتية بواسطة GLIPH2، مما يقدم تفسيرًا محتملاً لتوسعها النسلي في نسيج الأنف.
ملاحظتنا أن خلايا T التي تعبر عن GZMK تميل إلى التجمع داخل الهياكل اللمفاوية الثلاثية حيثالخلايا تشير إلى إمكانية أن هذين المسارين قد يتعاونان لتعزيز المرض. الكريات البيض الحمضية والخلايا البدينة التي تم تجنيدها بواسطة C3a الناتج عن GZMK هي مصادر لـ IL-4 و IL-13 (المرجع 47)، والتي تعزز تمايز خلايا المناعة من النوع 2. بالإضافة إلى ذلك، فإن C3a والكيماكينات التي تفرزها GZMKقد تساهم خلايا T بشكل جماعي في استقطاب خلايا المايلويد المسببة للالتهابات، مما يغذي بدوره تنشيط المؤثرات من النوع 2. من ناحية أخرى، وجدنا أيضًا مستويات عالية من GZMK في مجموعة فرعية من المرضى الذين يعانون من svNP دون وجود الإيوزينوفيلية النسيجية وتوقيعات النوع 2، بما في ذلك المريض NP12 الذي قمنا بتحليله بعمق، مما يشير إلى أن GZMK قد يعزز أيضًا الالتهاب في مجرى الهواء بشكل مستقل في هؤلاء المرضى. تدعم هذه الفكرة أيضًا نتائجنا التي تشير إلى أن GZMK النسيجي يتنبأ بشدة المرض بشكل أفضل من توقيعات النوع 2 المعروفة، وتقترح أن العلاجات المستهدفة لـ GZMK قد توفر فوائد إضافية للمرضى الذين يعانون من أمراض غير من النوع 2.
حقيقة أن CD8 الذي يعبر عن GZMKيمكن أن تدور الخلايا، كما هو موثق هنا وفي أماكن أخرىسيوضح لماذا قد لا تكون استئصال الأورام غير المحددة علاجًا شافيًا ويقترح أن الحذف المستهدف لهذه الخلايا يمكن أن يقلل من تكرار المرض. في الواقع، من خلال تحليل مجموعة فريدة من العينات المتطابقة المجمعة من مرضى يعانون من أمراض متكررة، دراستنا توثق استمرار وإعادة زراعة الخلايا التي تعبر عن GZMKالنسخ في الأنسجة المريضة، مما يوفر دليلاً قوياً على الذاكرة المناعية التكيفية في دفع تكرار الأمراض الالتهابية لدى البشر. تسلط النتائج من دراسات الإزالة الجينية والدراسات المثبطة دوائياً في نماذج حيوانية الضوء على استمرار عمل المسارات المعتمدة على GZMK في تقدم المرض وتوفر مبرراً لتطوير علاجات مستهدفة لـ GZMK في السيطرة على الأمراض الالتهابية.
المحتوى عبر الإنترنت
أي طرق، مراجع إضافية، ملخصات تقارير Nature Portfolio، بيانات المصدر، بيانات موسعة، معلومات إضافية، شكر وتقدير، معلومات مراجعة الأقران؛ تفاصيل مساهمات المؤلفين والمصالح المتنافسة؛ وبيانات توفر البيانات والرموز متاحة علىhttps://doi.org/10.1038/s41586-024-08395-9.
5. سكولينا، سي. وآخرون. التصلب المتعدد: خلايا CD8+T المتسللة إلى الدماغ تستمر كامتدادات متطابقة في السائل الدماغي الشوكي والدم. إجراءات الأكاديمية الوطنية للعلوم في الولايات المتحدة الأمريكية 101، 2428-2433 (2004). 6. بابي، هـ. وآخرون. التوسع النسلي لخلايا T من نوع CD8(+) يهيمن على تسلل خلايا T في آفات التصلب المتعدد النشطة كما هو موضح من خلال الميكروتلاعب وتفاعل البوليميراز المتسلسل على مستوى الخلية الواحدة. ج. تجريبي. ميد. 192، 393-404 (2000). 7. جارفيز، د. وآخرون. الربو لدى البالغين وارتباطه بالتهاب الجيوب الأنفية المزمن: مسح GA2LEN في أوروبا. الحساسية 67، 91-98 (2012). 8. باخرت، سي. وآخرون. التهاب الجيوب الأنفية المزمن لدى البالغين. مراجعات الطبيعة. المبادئ التوجيهية للأمراض 6، 86 (2020). 9. شلايمر، ر. ب. المناعة المرضية لالتهاب الجيوب الأنفية المزمن والسلائل الأنفية. مراجعة سنوية في علم الأمراض 12، 331-357 (2017). 10. وانغ، و. وآخرون. تحديد ملف تعريف الخلايا الفردية لآليات التباين الالتهابي في التهاب الجيوب الأنفية المزمن. نات. مناعة. 23، 1484-1494 (2022). 11. ما، ج. وآخرون. تحليل الخلايا الفردية يحدد مجموعات متميزة من خلايا T السامة CD4(+) ومجموعة خلايا TH2 IL-10(+)CD109(+) في الزوائد الأنفية. علوم المناعة.https://doi.org/10.1126/sciimmunol.abg6356 (2021). 12. بوجرت، م.، برايس، د. أ.، ماكاي، ل. ك. وبيتي، م. ر. خلايا الذاكرة CD8+ T البشرية المتداولة والمقيمة في الأنسجة. نات. إيمونول. 24، 1076-1086 (2023). 13. باجايف، د. ف. وآخرون. VDJdb في 2019: توسيع قاعدة البيانات، بنية تحليل جديدة ومجموعة من أنماط مستقبلات الخلايا التائية. أبحاث الأحماض النووية. 48، D1057-D1062 (2020). 14. فيتا، ر. وآخرون. قاعدة بيانات الإيبيتوبي المناعي (IEDB): تحديث 2018. أبحاث الأحماض النووية. 47، D339-D343 (2019). 15. هوانغ، هـ.، وانغ، ج.، روبيلت، ف.، سكرابا، ت. ج. وديفيس، م. م. تحليل استجابة المناعة لجرثومة السل عن طريق تجميع مستقبلات الخلايا التائية باستخدام GLIPH2 وفحص المستضدات على مستوى الجينوم. نات. بيوتكنولوجي. 38، 1194-1202 (2020). 16. يانغ، ف. وآخرون. معدل إيجابية مسببات الحساسية للقمح في السكان المصابين بالحساسية في الصين: مراجعة منهجية وتحليل تلوي. تقارير العلوم 13، 10579 (2023). 17. غاندي، ن. أ. وآخرون. استهداف المحركات القريبة الرئيسية للالتهاب من النوع 2 في المرض. نات. ريف. دراج ديسكوف. 15، 35-50 (2016). 18.. وآخرون. يكشف تحليل الخلايا الفردية عن الدور المسبب للأمراض ومسار التمايز للجرانزيمخلايا T في متلازمة سجوجرن الأولية. رؤية JCIhttps://doi.org/10.1172/jci.insight. 167490 (2023). 19. جونسون، أ. هـ. وآخرون. خلايا T CD8 الإيجابية للجرانزيم K تشكل مجموعة أساسية في الأنسجة البشرية الملتهبة. علوم. ترانسلات. ميد. 14، eabo0686 (2022). 20. موغيلينكو، د. أ. وآخرون. التوصيف الشامل لجهاز المناعة المتقدم في السن يكشف عن خلايا T CD8(+) GZMK(+) المستنسخة كعلامة مميزة محفوظة للالتهاب المرتبط بالشيخوخة. المناعة 54، 99-115 e112 (2021). 21. باي، ج. وآخرون. عوامل التنبؤ بعودة الزوائد الأنفية في التهاب الجيوب الأنفية المزمن مع الزوائد الأنفية. مجلة الحساسية والمناعة السريرية 150، 352-361 e357 (2022). 22. لي، ف. وآخرون. عوامل الخطر المرتبطة بالربو المصاحب لدى المرضى الذين يعانون من التهاب الجيوب الأنفية المزمن مع زوائد أنفية: دراسة مقطعية. BMC طب الرئة 22، 338 (2022). 23. بومان، أ. س.، فان دالين، ك. ر.، كرنك، س.، تن بروك، ت. وبوفنشن، ن. الأدوار داخل الخلوية وخارج الخلوية للجرانزيم ك. فرونت. إيمونول. 12، 677707 (2021). 24. تشاو، ي.، تاو، ق.، وو، ج. وليو، هـ. DMBT1 له تأثير وقائي على التهاب الأنف التحسسي. الأدوية الحيوية. 121، 109675 (2020). 25. ويرنر، يو. وآخرون. ربط المكمل C3 وخلايا B في التهاب الأنف التحسسي. مجلة أبحاث المناعة. 2020، 4832189 (2020). 26. هومبلز، أ. أ. وآخرون. دور لمستقبل الأنفيلاكتوكين C3a في مرحلة الفاعل من الربو. ناتشر 406، 998-1001 (2000). 27. ناكانو، ي. وآخرون. ارتفاع مستوى المكمل C3a في بلازما المرضى الذين يعانون من الربو الحاد الشديد. مجلة الحساسية والمناعة السريرية 112، 525-530 (2003). 28. كريسينجر، م. ج. وآخرون. الثرومبين ينتج منتجات C5 غير المعروفة سابقًا التي تدعم مسار تنشيط المكمل النهائي. بلود 120، 1717-1725 (2012). 29. ساتو، ي.، سيلينا، ك.، فان دن بروك، م.، هيراهارا، ك. وياناجيتا، م. أدوار الهياكل اللمفاوية الثلاثية في الأمراض المزمنة. نات. ريف. نيفرول.https://doi.org/10.1038/s41581-023-00706-z (2023). 30. إفريموفا، م.، فينتو-تورمو، م.، تيشمان، س. أ. & فينتو-تورمو، ر. CellPhoneDB: استنتاج التواصل بين الخلايا من التعبير المشترك لمجمعات الليغاند-المستقبلات متعددة الوحدات. نات. بروتوك. 15، 1484-1506 (2020). 31. زارانتيونيلو، أ.، ريفيل، م.، جرونينوالد، أ. ورومينينا، ل. الوظائف الفعالة المعتمدة على C3 في المكمل. مراجعة المناعة 313، 120-138 (2023). 32. ويلهرم، إ. وآخرون. إنتاج جرانزيم ك النشط تحفيزياً من أجسام إدراج الإشريكية القولونية وتحديد مثبطات جرانزيم ك الفعالة في بلازما الإنسان. مجلة الكيمياء الحيوية. 274، 27331-27337 (1999). 33. ويلهرم، إ.، تشوب، ج. وجين، د. إ. الأنشطة البيولوجية للجرانزيم كيه محفوظة في الفأر وتفسر النشاط المتبقي Z-Lys-SBzl في الفئران التي تفتقر إلى الجرانزيم أ. FEBS Lett. 459، 139-142 (1999). 34. ثورنبرري، ن. أ. وآخرون. نهج تركيبي يحدد خصوصيات أعضاء عائلة الكاسبيز والجرانزيم ب. العلاقات الوظيفية التي تم تأسيسها للوسائط الرئيسية في عملية الموت الخلوي المبرمج. مجلة الكيمياء الحيوية. 272، 17907-17911 (1997). 35. تيبرتي، س. وآخرون. خلايا الذاكرة التائية الفعالة CD8(+) ذات التعبير العالي عن GZMK مرتبطة بوفرة العدلات ذات التعبير العالي عن CD15 في الأورام القولونية غير النقيليّة وتنبئ بنتيجة سريرية سيئة. نات. كوم. 13، 6752 (2022). 36. وانغ، أ. ز. وآخرون. خلايا CD8+T المتسللة إلى الورم الدبقي هي في الغالب مجموعة فعالة موسعة بشكل كلوني من GZMK+. اكتشاف السرطان.https://doi.org/10.1158/2159-8290. CD-23-0913 (2024). 37. كوجا، ر. وآخرون. خلايا T السامة التي تعبر عن غرانزيم K وأمفيريجولين وخلايا B المنشطة خارج الجريبات هي محركات محتملة لمرض IgG4. مجلة الحساسية والمناعة السريرية 153، 1095-1112 (2024). 38. عرازي، أ. وآخرون. مشهد خلايا المناعة في كلى مرضى التهاب الكلية الذئبي. نات. إيمونول. 20، 902-914 (2019). 39. بوتويس، هـ. وآخرون. تعبر تعبيرات KLRG1 و CD103 عن مجموعات فرعية متميزة من خلايا الذاكرة CD8 T المقيمة في الأنسجة المعوية والتي تتأثر بمرض كرون. فرونت. إيمونول. 11، 896 (2020). 40. سكويرا، أ. وآخرون. تستهدف خلايا CTLs قتل خلايا بيتا في مرضى السكري من النوع 1 من خلال التعرف على إبيتوبي ما قبل الإنسولين المنظم بواسطة الجلوكوز. ج. استثمار سريري. 118، 3390-3402 (2008). 41. بينكسي، ج. ج. وآخرون. خلايا T ذاتية التفاعل من نوع CD8 مرتبطة بتدمير خلايا بيتا في داء السكري من النوع 1. وقائع الأكاديمية الوطنية للعلوم في الولايات المتحدة الأمريكية 102، 18425-18430 (2005). 42. جيرتي، س. ف. وآخرون. مجموعة من خلايا T CD8 الشبيهة بالخلايا الجذعية المناعية تحفز مرض السكري من النوع 1. ناتشر 602، 156-161 (2022). 43. لي، ج. وآخرون. خلايا T CD8(+) KIR(+) تثبط خلايا T المسببة للأمراض وتكون نشطة في الأمراض المناعية الذاتية وCOVID-19. ساينس 376، eabi9591 (2022). 44. دونادو، سي. أ. وآخرون. إن إنزيم غرانزيم ك يقود مسارًا جديدًا تم تحديده حديثًا لتنشيط المكمل. مسودة مسبقة على bioRxivhttps://doi.org/10.1101/2024.05.22.595315 (2024). 45. ليشيفسكي، م. ك. وآخرون. تنشيط المكمل داخل الخلايا يحافظ على توازن خلايا T ويساهم في تمايز الفاعلين. المناعة 39، 1143-1157 (2013). 46. أربور، ج. وآخرون. مستقبل المكمل CD46 يعزز وظيفة الخلايا التائية الفعالة البشرية CD8(+) بشكل مثالي عبر استقلاب الأحماض الدهنية. نات. كوميونيك. 9، 4186 (2018). 47. أرنولد، آي. سي. ومونيتز، أ. التكيف المكاني للخلايا الحمضية وأدوارها الناشئة في التوازن الداخلي، العدوى والمرض. مراجعة الطبيعة للمناعة.https://doi.org/10.1038/s41577-024-01048-y (2024). 48. ماستيلوس، د. س.، هاجيشينغاليز، ج. ولامبريس، ج. د. دليل لبيولوجيا المكملات، علم الأمراض والفرص العلاجية. نات. ريف. إيمونول. 24، 118-141 (2024). 49. يانغ، إكس. وآخرون. مستقبلات خلايا T المرتبطة بالذاتيّة المناعية تتعرف على الببتيدات المرتبطة بـ HLA-B*27. ناتشر 612، 771-777 (2022). 50. وانغ، ج. وآخرون. جزيئات HLA-DR15 تشكل معًا مجموعة من خلايا T الذاتية التفاعل في التصلب المتعدد. خلية 183، 1264-1281 e1220 (2020).
ملاحظة الناشر: تظل شركة سبرينجر ناتشر محايدة فيما يتعلق بالمطالبات القضائية في الخرائط المنشورة والانتماءات المؤسسية.
الوصول المفتوح هذه المقالة مرخصة بموجب رخصة المشاع الإبداعي النسبية-غير التجارية-بدون اشتقاقات 4.0 الدولية، التي تسمح بأي استخدام غير تجاري، ومشاركة، وتوزيع، وإعادة إنتاج في أي وسيلة أو صيغة، طالما أنك تعطي الائتمان المناسب للمؤلفين الأصليين والمصدر، وتوفر رابطًا لرخصة المشاع الإبداعي، وتوضح إذا قمت بتعديل المادة المرخصة. ليس لديك إذن بموجب هذه الرخصة لمشاركة المواد المعدلة المشتقة من هذه المقالة أو أجزاء منها. الصور أو المواد الأخرى من طرف ثالث في هذه المقالة مشمولة في رخصة المشاع الإبداعي الخاصة بالمقالة، ما لم يُشار إلى خلاف ذلك في سطر الائتمان للمادة. إذا لم تكن المادة مشمولة في رخصة المشاع الإبداعي الخاصة بالمقالة وكان استخدامك المقصود غير مسموح به بموجب اللوائح القانونية أو يتجاوز الاستخدام المسموح به، فستحتاج إلى الحصول على إذن مباشرة من صاحب حقوق الطبع والنشر. لعرض نسخة من هذه الرخصة، قم بزيارة http:// creativecommons.org/licenses/by-nc-nd/4.0/. (ج) المؤلف(ون) 2025، نشر مصحح 2025
تجنيد المرضى
تم تجنيد ما مجموعه 206 مشاركًا خضعوا لجراحة أنف بين عامي 2011 و2024 من قسم الأنف والحساسية في مستشفى بكين تونغ رين (البيانات الموسعة الجدول 2). من بينهم، تم تشخيص 172 بحالات التهاب الأنف المزمن (NP) و34 بحالات انحراف الحاجز الأنفي (الذين يعتبرون كأشخاص أصحاء في الدراسة الحالية). تم استبعاد المرضى الذين يعانون من نقص المناعة، الحمل، التهاب الجيوب الأنفية المزمن بدون التهاب الأنف المزمن، التهاب الجيوب الأنفية الفطرية التحسسية، التليف الكيسي أو الذين تناولوا الكورتيكوستيرويدات الفموية قبل 4 أسابيع من الجراحة من الدراسة. انظر البيانات الموسعة الجدول 1 لتفاصيل المرضى. تمت الموافقة على الدراسة من قبل لجنة الأخلاقيات الطبية في مستشفى بكين تونغ رين (TREC200927، TRECKY2019-027 وTREC2022-KY127). قدم جميع المشاركين موافقة خطية مستنيرة.
تم تشخيص التهاب الأنف غير التحسسي استنادًا إلى إرشادات ورقة الموقف الأوروبية حول التهاب الجيوب الأنفية والزوائد الأنفية (EPOS) لعام 2007.تم تأكيد تشخيص الربو المصاحب من قبل أطباء الرئة وفقًا للعرض السريري ونتائج اختبارات وظائف الرئة، وذلك وفقًا لإرشادات الاستراتيجية العالمية للربو 2008.لأغراض البحث، تم تقسيم المرضى الذين يعانون من NP بشكل إضافي بناءً على شدة مرضهم، حيث تم وضع أولئك في مجموعة svNP الذين يعانون من تكرار المرض أو الربو المصاحب حتى عام واحد بعد الجراحة، أو كليهما.
معالجة أنسجة المرضى
تم جمع أنسجة الزوائد من المرضى الذين يعانون من الزوائد الأنفية وأنسجة الزوائد من المرضى الذين يعانون من انحراف الحاجز خلال جراحة الجيوب الأنفية بالمنظار. تم هضم جزء من الأنسجة على الفور إلى تعليق خلايا مفردة لتحليل تسلسل RNA الخلوي الفردي وتحليل تدفق الخلايا. تم تثبيت جزء آخر من الأنسجة إما في 4% من الفورمالدهيد لأغراض علم الأنسجة أو تجميده بسرعة في النيتروجين السائل للتخزين على المدى الطويل فيلإجراء تحليل المناعي المرتبط بالإنزيم (ELISA) وتحليل التسلسل الجماعي لاحقًا.
تحضير تعليق الخلايا المفردة من الأنسجة الأنفية البشرية
تم تقطيع أنسجة أنف بشرية طازجة أولاً إلى قطع صغيرة في وسط معهد روسويل بارك التذكاري (RPMI) المدعوم (إنفيتروجن) الذي يحتوي على 2% من مصل فتي (إنفيتروجن) و2 مللي مول من L-جلوتامين (إنفيتروجن)،البنسلين وستربتوميسين (إنفيتروجن). تم جمع الأنسجة الأنفية بعد ذلك عن طريق الطرد المركزي وتفتيتها بواسطة جهاز التفكيك gentleMACS (ميلتينيي بيوتيك) وفقًا لتعليمات الشركة المصنعة. بعد ذلك، تم جمع الأنسجة الأنفية مرة أخرى عن طريق الطرد المركزي وتم هضمها بشكل إضافي معكولاجيناز (وورثينغتون) و DNases I (روش) في وسط RPMI المدعوم لمدة 40 دقيقة في تم إعادة تعليق الخلايا المفرج عنها وتصفيتها من خلالمنخل الخلايا (BD Bioscience). تم تحلل كريات الدم الحمراء باستخدام فيرساليز (Beckman Coulter).
عزل خلايا الدم المحيطية
تم جمع الدم الكامل خلال زيارات المتابعة المنتظمة، وتم عزل الخلايا اللمفاوية المحيطية أحادية النواة (PBMCs) بواسطة الطرد المركزي بتدرج الكثافة باستخدام وسط فصل اللمفاويات البشرية من Biosci (Dakewe) وفقًا لتعليمات الشركة المصنعة.
تحفيز خلايا T
لإجراء اختبارات التفريغ، تم أولاً إثراء اللمفاويات من خلايا الأنف البشرية عن طريق الطرد المركزي الكثافي. باختصار، تم إعادة تعليق الخلايا في 40% بيركول (GE)، وتم وضعها فوق 70% بيركول ثم تم الطرد المركزي عندلمدة 15 دقيقة. بعد ذلك، تم تحفيز الخلايا بواسطة مضاد CD3 المرتبط بالطبق.، استنساخ OKT3) و مضاد CD28 (أجسام مضادة مثل CD28.2) أو PMA ( ) وأيونوميلمدة 4 ساعات في وجود الأجسام المضادة FITC-anti-LAMP1 (النسخة H4A3، BioLegend)، وموننسين ( ) أُضيف بعد ساعة واحدة.
فئران
C57BL/6J (Jax 664)، Rosa26-creERT2 (Jax 8463)، CD45.1 (Jax 2014)، OT-I (Jax 3831)، Cd4-cre (Jax 22071) و Tcrbتكراد(Jax 2122) الفئران كانت في الأصل من مختبر جاكسون. Gzmkالفئران و Gzmkتم الحصول على الفئران (المبنية على خلفية C57BL/6J) من GemPharmatech و Cyagen، على التوالي. تم الحفاظ على جميع الحيوانات في مرافق خالية من مسببات الأمراض المحددة في جامعة تسينغhua (THU)، مع هواء مُرشح، وطعام حبيبي معقم، ونظام مياه مُحمض ودورة ضوء/ظلام 12 ساعة. تم الحفاظ على درجة الحرارة عندورطوبة عندتم إجراء التجارب وفقًا للإرشادات الحكومية والمؤسسية لرعاية الحيوانات وتمت الموافقة عليها من قبل لجنة رعاية واستخدام الحيوانات المؤسسية في THU.
لكل تجربة، تم تضمين ما لا يقل عن حيوانين في كل مجموعة، وتم تجميع البيانات من 2-4 تجارب مستقلة. تم تعيين حيوانات متطابقة في الجنس والعمر من الأنماط الجينية المحددة عشوائيًا إلى مجموعات مختلفة في كل تجربة. تم إجراء اختبارات وظيفة رئة الفئران بواسطة باحثين غير عالمين بتخصيص المجموعات. بالنسبة للتحليلات الأخرى التي كانت تعتمد على قياسات آلية ذات طابع شخصي، لم يتم إجراء التعمية.
بناء نموذج مرض التهاب مجرى الهواء في الفئران
تم بناء نماذج مرض التهاب مجرى الهواء في الفئران باستخدام طريقتين. في الطريقة الأولى، تم تحفيز الفئران أولاً عن طريق التحصين داخل البطن بـ من OVA (سيغما-ألدريتش) المستحلب في الألوم (إنفيتروجن) معمن LPS (سيغما-ألدريتش). ثم تم تحدي الفئران بواسطةأيروسول OVA ) في غرفة تعرض للجسم بالكامل (Yiyankeji) لمدة 30 دقيقة يوميًا لمدة ثلاثة أيام متتالية بدءًا من أسبوع واحد بعد التطعيم. تم تكرار العملية مرة أو مرتين بفاصل 7 أيام، وتم إجراء التحليلات في الوقت المحدد. من أجل تحفيز حذف Gzmk، تم استخدام Rosa26-creERT2 وتم إعطاء الفئران يوميًا 2 ملغ من التاموكسيفين (ApexBio) المذاب فيزيت بذور عباد الشمس (JSENB) لمدة خمسة أيام متتالية في الوقت المحدد. في بعض التجارب،تم استخدام الفئران لتحفيز الربو. تم نقل هذه الفئران بالتبني معCD4 الطحاليخلايا T وCD8 الطحاليخلايا T منأوفئران، تم تنقيتها بواسطة كرات مغناطيسية (Miltenyi Biotec)، قبل 5 أيام من التحصين داخل الصفاق بمستضد OVA. تم تحضير PPACK (MedChemExpress) و Z-IETD-FMK (Selleck) في PBS يحتوي على 3% DMSO بتركيزلتثبيط نشاط GZMK و GZMB، على التوالي. تم حقن كل فأر داخل الصفاق بـمثبط كل يومين من 8 إلى 18 يومًا بعد التطعيم كما هو موضح.
بدلاً من ذلك، تم تحفيز التهاب المسالك الهوائية في الحيوانات التي تم نقل خلايا OT-I T إليها. باختصار، تم تحفيز فئران B6 عن طريق التطعيم داخل الصفاق بمستضد OVA كما هو موصوف أعلاه. ثمتم نقل خلايا OT-I إلى الفئران المهيأة بعد 6 أيام من التحصين، والتي تم تعزيزها بـ OVA عن طريق الحقن داخل الصفاق في اليوم التالي. تم تحدي الفئران باستنشاق OVA لمدة ثلاثة أيام متتالية بعد أسبوع، وتم إجراء التحليلات في الوقت المحدد. بالنسبة للتجارب التي تتضمنوحيوانات التحكم المتطابقة،تم استخدام LPS في أول تطعيم OVA وتم نقل خلايا OT-I.
زراعة الخلايا وإدخال الفيروسات الراجعة
CD8 الطحاليتم عزل خلايا T من فئران OT-I باستخدام كريات ميكروبي CD8a (Miltenyi)، وتم توسيعها في المختبر بواسطة الأجسام المضادة المرتبطة باللوحة المضادة لـ CD3 و CD28 (bioXcell) في وسط RPMI الكامل (Invitrogen) المضاف إليه FBS، 2 مللي مول من L-جلوتامين، البنسلينستربتوميسين وIL-2 المؤتلف (Peprotech). بعد ذلك، تم نقل هذه الخلايا OT-I باستخدام فيروس رجعي يشفر فقط بروتين الفلورسنت الأخضر (GFP)، أو GFP مع Gzmk أو Gzmk.أو GFP مع Gzmb. GFPتم فرز خلايا OT-I باستخدام جهاز فرز Arialll (BD) وزراعتها في المختبر لمدة يومين إضافيين قبل نقلها بالتبني إلى الفئران المستقبلة.
جمع سائل القصبات الهوائية
تم تخدير الفئران عن طريق الحقن داخل البطن بـأفيرتين (سيغما-ألدريتش) بجرعة منتم إدخال القنيات في القصبات الهوائية وغسلها ثلاث مرات، في كل مرة معمن PBS بارد. تم طرد BALF المجمعة عند 300 جرام لمدة 3 دقائق، وتم إخضاع كريات الخلايا لتحليلات FACS.
تدفق الخلايا
تم غسل خلايا الإنسان المعزولة من الأنسجة الأنفية والدم المحيطي مرة واحدة بمحلول PBS، وتم حجبها بواسطة مواد حجب TruStain البشرية (BioLegend) وتم صبغها بأجسام مضادة سطحية مختلفة في محلول FACS (PBS مع 1% FBS و لمدة 30 دقيقة على الثلج. لتلوين الخلايا داخل الخلايا، تم تثبيت الخلايا وتمريرها باستخدام مجموعة CytoFix/Perm (BD)، وتم تلوينها بأجسام مضادة ضد المستضدات داخل الخلايا لمدة 30 دقيقة على الثلج. تشمل مواد التلوين الزومبي الأصفر، PerCP-Cy5.5-anti-CD45 (النسخة HI30)، PE-anti-CD8 (النسخة HIT8a)، BV711-anti-CD8 (النسخة HIT8a)، APC-Cy7-anti-NCAM (النسخة HCD56)، PE-cy7-anti-KLRG1 (النسخة SA231A2)؛ PE-Cy5-anti-KLRC1 (النسخة S19004C)، FITC-anti-ITGAE (النسخة Ber-ACT8)، PE-Dazzle594-anti-ITGAE (النسخة Ber-ACT8)، BV421-anti-CD27 (النسخة O323)، PE-anti-GZMK (النسخة GM26E7) وAPC-anti-GZMB (النسخة GB11) من BioLegend، APC-H7-anti-CD19 (النسخة SJ25C1) من BD Biosciences. بالنسبة لنماذج الفئران، تم أولاً حجب خلايا BALF بـالأجسام المضادة (BioXCell)، وتم صبغها بأجسام مضادة مختلفة في محلول FACS على الثلج لمدة 30 دقيقة. تشمل مواد الصبغ AF700-مضاد-CD11c (نسخة HL3، BD)، eFluor660-مضاد-CD3 (نسخة 17A2، eBioscience)، APC-مضاد-I-A (النسخة AF6-120.1، BioLegend)، FITC-مضاد-Ly6G (النسخة IA8، BD)، PE-Cy7-مضاد-CD11b (النسخة M1/70، BD)، PE-مضاد-Siglec-F (النسخة E50-2440، BD)، APC-Cy7-مضاد-CD8 (النسخة 53-6.7، BioLegend)، Percp-Cy5.5-مضاد-CD4 (النسخة RM4-5، BD) و zombie yellow (BioLegend). تم جمع البيانات على جهاز قياس الطيف الكامل Aurora (Cytek). تم تحليل جميع بيانات FACS باستخدام برنامج FlowJo (Treestar).
لتحليلات تسلسل الخلايا المفردة، تم فرز 10,000-20,000 خلية إلىمن PBS يحتوي على 1% FBS في أنابيب دقيقة باستخدام جهاز فرز Aria xsIII. بالنسبة لخلايا أنسجة NP البشرية،تم فرز الخلايا كما هو موضح في الشكل 3a من البيانات الموسعة. الخلايا المحيطية البشريةتم إثراء خلايا T أولاً من إجمالي PBMCs، وتم فرزها كما هو موضح في الشكل 3d من البيانات الموسعة. باختصار، تم حضانة PBMCs مع جسم مضاد مضاد للبشر CD8a (نسخة OKT8، إنفيتروجين) على الثلج لمدة 30 دقيقة، وتم عزل الخلايا المرتبطة بالأجسام المضادة باستخدام كريات ميكروبيود المرتبطة بالستربتافيدين (ميلتينيي) وفقًا لتعليمات الشركة المصنعة. من أجل تحليلات CD8 في BALF الفئرانخلايا Tتم فرز الخلايا مع استبعاد الحمضات والعدلات كما هو موضح في الشكل 5b من البيانات الموسعة.
تحليلات المناعية النسيجية
تم تثبيت الأنسجة الأنفية فيالفورمالديهايد لمدة 4 ساعات، مجفف في السكروز عند بين عشية وضحاها ومجمدة في مركب Tissue-Tek O.C.T. (ساكورا فينيتيك). مقاطع كريو منتم تحضيرها باستخدام ميكروتوم (لايكا). تم إعادة ترطيب الشرائح في محلول الصبغة (Tween 20 في 0.1 م Tris- HCl)، وتم حظره باستخدام محلول حجب المناعية (CST) لمدة 30 دقيقة. بعد التلوين بأجسام مضادة مختلفة في محلول التلوين فيتم تحضين الأقسام بين عشية وضحاها مع 4′-6-diamidino-2-phenylindole dihydrochloride (DAPI،تمت معالجة الأنسجة باستخدام محلول التثبيت (Sigma-Aldrich) لمدة 10 دقائق كما هو موضح، وتم تركيبها باستخدام وسط التركيب المائي الفلوري (Sigma-Aldrich). تم التقاط صور لشرائح الأنسجة السليمة باستخدام ماسح الشرائح Zeiss Axio Scan Z1 (Zeiss)؛ بدلاً من ذلك، تم التقاط صور مكبرة لتجمعات خلايا T التي تعبر عن GZMK باستخدام المجهر الضوئي التداخلي LSM 710 (Zeiss). تشمل مواد التلوين PE-anti-GZMK (نسخة GM26E7، BioLegend)، APC-anti-CD8 (نسخة HIT8a، BD)، FITC-anti-KLRG1 (نسخة 2F1/KLRG1، BioLegend)، APC-anti-CD4 (نسخة OKT4، BioLegend)، FITC-anti-PTGDR2 (نسخة BM16، BioLegend) وFITC-anti-complement C3b/iC3b (3E7/C3b، BioLegend).
تم قياس مناطق تجمع خلايا T التي تعبر عن GZMK من صور الأنسجة الممسوحة بشكل مستقل من قبل الباحثين الذين كانوا غير مطلعين على معلومات المرضى باستخدام ZEN (Zeiss). تم قياس أعداد مجموعات الخلايا المختلفة من الصور المجسمة بواسطة Imaris (Bitplane) بناءً على تعبير الجينات المميزة المختلفة.
التقييم النسيجي لمجموعات خلايا المناعة في NP
تم تضمين أنسجة NP الثابتة في البارافين وتم صبغها بالهيماتوكسيلين والإيوزين. تم قياس الأعداد المطلقة للخلايا الحمضية في ثلاثة مجالات مختارة عشوائيًا بتكبير عالي.بواسطة طبيبين أمراض.
تسلسل TCR بالجملة
تم استخراج الـ RNAs الكلية من الأنسجة الأنفية باستخدام مجموعة HiPure Total RNA Mini Kit (Magen). تم إجراء النسخ العكسي لـتم إجراء إدخال RNA وفقًا لبروتوكول Smart-seq2 القياسي، مع التعديلات التالية: تم استبدال بادئ النسخ العكسي polyT ببادئ T30VN (تم استبدال TSO الأصلي الذي يحتوي على oligo بتبديل القالب (TTT TTTTTTTTTTTTTTTTTTTTTTTTTTVN-3′) بـ TSO يحتوي على معرف جزيئي فريد (UMI) مكون من 26 نيوكليوتيد (5́-CTACACGACGCTCTTCCGATCTN NNNNNNNNNNNNNNNNNNNNNNNNNNTTTCTTATATrGrGrG-3’، حيث يمثل rG ريبوجوانوزين). تم إزالة TSO عن طريق إضافة من Exol (NEB) إلى كل تفاعل النسخ العكسي واحتضان في لمدة 15 دقيقة، والتي تم تعطيلها لاحقًا عن طريق الحضانة عند لمدة 5 دقائق. تم إجراء إثراء TCR على مرحلتين. تم أولاً خلط منتج النسخ العكسي مع منكابا هاي فاي هوت ستارت ريدي ميكس (كابا بيوسيستمز)ب/ت غنية بمقدمة F1“-AATGATACGGCGACCACCGAGATCTACACTCTTTCC CTACACGACGCTC-3′; سانغون بيوتيك”،من كل برايمر خارجي لـ TCR (TCRα،-TGAAGGCGTTTGCACATGCA-3′; TCR، -TCAGGCAGTATCTGGAGTCATTGAG-3′; سانغون بيوتيك) إلى حجم إجمالي من، وتمت عملية التضخيم باستخدام البرنامج التاليدورات منتم تنقية منتجات PCR بعد ذلك باستخدام كرات VAHTS لتنظيف الحمض النووي (Vazyme) بنسبة 0.8 إلى 1 (كرات إلى عينة) وفقًا لتعليمات الشركة المصنعة. بعد ذلك، تم تنفيذ الخطوة الثانية من إثراء TCR عن طريق خلط المنتجات المنقاة معمنكابا هاي فاي هوت ستارت ريدي ميكس،ب/ت غنية بمقدمة F2 (-AATGATACGGCGACCACCGA-3′ ; سانغون بيوتيك)،من كل بادئات TCR الداخلية (TCR-AGTCTCTCAGCTGGTACACG-3′; TCR, 5′-TCTGATGGCTCAAACACAGC-3′; سانغون بيوتيك) إلى حجم إجمالي من وزيادة من خلال البرنامج التالي ( ثماني دورات منتم إجراء اختيار الحجم المزدوج الجوانب للمنتجات بواسطة كرات VAHTS DNA Clean، بنسب 0.5 إلى 1 و 0.3 إلى 1 (الكرات إلى العينة) على التوالي. بعد ذلك، تم تاغمنت 1 نانوغرام من المنتجات المنقاة بواسطة إنزيم Tn 5 (Vazyme) فيمن محلول تفاعل TD (10 مللي مول من تريس-كلوريد pH 7.6، ) في لمدة 10 دقائق. تم خلط التفاعل معمن SDS وتم حضنه عند لمدة 20 دقيقة لتعطيل الترانسبوزاز. تم إجراء تفاعل البوليميراز المتسلسل (PCR) الفهرسي عن طريق خلط منتج التاجمنت مع منمؤشرات مزدوجة فريدة ومن Q5 عالية الدقةماستر ميكس (NEB)، وتم تضخيمه بالبرنامج التالي (دورات من ). تم تنقية منتجات PCR باستخدام كرات VAHTS لتنظيف الحمض النووي بنسبة 0.8 إلى 1 (كرات إلى عينة). تم تسلسل المكتبات المُنشأة على نظام Novaseq 6000 (Illumina) في وضع النهاية المزدوجة.
تسلسل scRNA و scTCR
لأنسجة الإنسانالخلايا والأنسجةتم إعداد مكتبات الخلايا الفرعية، scRNA و scTCR باستخدام مجموعات كواشف الخلايا الفردية V(D)J من كروميو (10X Genomics). وكروميو نكست جيم للخلايا الفرديةتم استخدام مجموعة كيت v2 (10X Genomics) لبناء المكتبات للبشر عينات الدم المحيطي وخلايا سائل الشُعب الهوائية من الفئران. تم إجراء تسلسل المكتبة على نظام NovaSeq 6000.
تحليل الميكروتشريح الملتقط بالليزر وتسلسل RNA بالجملة
تسلسل RNA لجين GZMKتم إجراء تجميع مناطق الأنسجة الخلوية وفقًا لبروتوكول Geo-seqباختصار، تم تضمين أنسجة NP في مركب Tissue-Tek O.C.T، وتم تجميدها بسرعة بواسطة النيتروجين السائل وقُطعت إلىشرائح متتالية. الـ GZMKتم تأكيد المناطق المجمعة للخلايا أولاً بواسطة صبغة المناعية النسيجية باستخدام DAPI والأجسام المضادة PE-anti-GZMK، ثم تم لصق شريحة مجاورة على شريحة PEN MembraneSlide (رقم الكتالوج 11505151، لايكا) وصبغها بالأرجواني البلوري. تم مطابقة GZMKتم استئصال مناطق الأنسجة المجمعة والخاضعة للرقابة وإضافتها إلىمن ثيوسيانات الجوانيدين، وتم حضنه فيلمدة 15 دقيقة. ثم تم ترسيب RNA عن طريق خلط العينات معمن الماء المنزوع الأيوناتمن الإيثانول اللامائي،1.5 م من خلات الصوديوم (رقم هيدروجيني 6.5) والجليكوجينتم وضع الخلطات فيلمدة 30 دقيقة وتم الطرد المركزي عند لمدة 30 دقيقة عند . بعد الغسل بواسطة الإيثانول، تم إعادة تعليق الـ RNAs المتساقطة فيلبناء المكتبة باستخدام بروتوكول Smart-seq2.
تمت معالجة بيانات التسلسل ورسمها كميًا بواسطة سالمنعينات بمعدلات رسم خرائط أقل منتم استبعادها من التحليلات. تم إجراء تحليلات التعبير التفاضلي بواسطة DESeq2 (المرجع 56)، وتم إجراء تحليل المكونات الرئيسية باستخدام دالة ‘plotPCA’ بعد تحويل استقرار التباين.
تحليلات تسلسل RNA أحادي الخلية
تم استخدام CellRanger (الإصدار 3.0) لإنشاء مصفوفة تعبير الجينات لكل خلية، والتي تمت معالجتها لاحقًا بواسطة Seurat (الإصدار 3.0.2).لدمج البيانات، وتقليل الأبعاد، والتجميع، وتحليل التعبير الجيني التفاضلي. لنسج الإنسان CD45الخلايا، تم دمج بيانات من عينات مختلفة أولاً باستخدام وظيفة ‘دمج’. تحتوي المجموعات الفرعية علىتم تحديد الخلايا والخلايا النخاعية، وتم إزالة تأثيرات الدفعة بواسطة وظيفة ‘IntegrateData’. بالنسبة لتحليلات الأنسجة البشريةتم دمج بيانات العينات المختلفة أولاً باستخدام وظيفة ‘merge’، ثم تم استخدام وظائف ‘FindTransferAnchors’ و ‘TransferData’ و ‘MapQuery’ و ‘IntegrateEmbeddings’ في Seurat v.4.3.0.1 لتوقع التجمعات وإسقاط الاستعلام على هيكل تقريب و إسقاط متعدد الأشكال المرجعي (UMAP) بناءً على الأنسجة الكلية.مجموعة بيانات الخلايا. لتحليلات ارتباط النسخ في الشكل 2g، قمنا أولاً بحساب متوسط تعبير الجين في الأنسجة البشريةخلايا ودمتجمعات الخلايا، وتم تصنيف الجينات حسب انحرافاتها المعيارية عبر تجمعات مختلفة. ثم تم استخدام أعلى 2000 جين لتشكيل مصفوفة التعبير المتوسطة، والتي استخدمت لحساب معامل ارتباط رتبة سبيرمان. بالنسبة للمقارنة بين خلايا T1 و B2 الموضحة في البيانات الموسعة الأشكال 5 و 6، قمنا أولاً بتجميع خلايا T1 و CD8 في الدم.الخلايا من NP11 و NP13 بواسطة وظيفة ‘دمج’ في Seurat. ثم تم رسم متوسط UMI لكل جين في المجموعتين وتم حساب معامل ارتباط سبيرمان. بالنسبة لتحليلات المسار، تم أخذ عينات فرعية من النسخ المتطابقة بين الأنسجة والدم واستخدامها لتقليل الأبعاد باستخدام UMAP، وتم حساب الزمن الزائف لهذه الخلايا باستخدام Monocle3 (المرجع 58) (الإصدار 1.3.1). بالنسبة لتحليلات تفاعل الخلايا الموصوفة في الشكل التوضيحي الإضافي 8، تم تقليل كل مجموعة فرعية من خلايا المناعة المشار إليها إلىالخلايا للتحليلات اللاحقة باستخدام دالة ‘subset’ في Seurat. تم إدخال مصفوفة التعبير الجيني في CellphoneDB (v.3) لحساب تفاعلات المستقبلات والليغاندات. تم رسم مخططات الشبكة بواسطة Cytoscape (v.3.10.1) وتم رسم مخططات الفقاعات بواسطة حزمة gglot2.
بالنسبة لخلايا BALF للفئران، قمنا بدمج البيانات من نسختين بيولوجيتين باستخدام وظيفة ‘IntegrateData’ وأجرينا تقليل الأبعاد باستخدام UMAP بالإضافة إلى التجميع. ثمتم إجراء جولة أخرى من تقليل الأبعاد والتجميع للخلايا من أجل مزيد من التحليلات.
تحليلات مجموعة مستقبلات الخلايا التائية
بالنسبة لمجموعة بيانات TCR-seq الكبيرة، تمت إزالة الموصلات أولاً بواسطة Cutadapt، ثم تم تجميع تسلسلات TCR بواسطة TRUST4 (المرجع 61)، الذي حدد أول N16 من N26 داخل أوليغو TSO كـ UMI وأسفر عن ملفات contig مصفاة تحتوي على contigs TCR مجمعة عالية الجودة لكل UMI. تم استبعاد UMIs التي تحتوي على أكثر من contig TCR من التحليلات. بالنسبة لمجموعات بيانات scTCR-seq، تم استخدام CellRanger لتجميع TCRs للخلايا المفردة. تم توضيح contigs TCR باستخدام Igblast. (الإصدار 1.16.0)، وتم استخدام فقط قطع TCR المنتجة التي تحتوي على مناطق VDJ كاملة للتحليل اللاحق. بالإضافة إلى ذلك، تم استخدام خلايا تحتوي على العديد من TCRα أو TCR المنتجة.تمت إزالة الكتل من مجموعة بيانات scTCR. تم تحديد النسخ الشائعة من TCR بين مجموعات البيانات المختلفة من خلال تسلسلات الأحماض النووية CDR3 المشتركة واستخدام V(D)J الجيني الشائع. في حالة بيانات scTCR-seq، كلاهما و تم اعتبار السلاسل. تم رسم مخططات السيرك باستخدام حزمة circlize، وتم تصور بقية الرسوم البيانية باستخدام ggplot2 و Seurat.
لتوقع خصوصية TCR،تم جمع أزواج TCR مع المستضدات المعروفة المعلّمة من قاعدة بيانات VDJdbوقاعدة بيانات الإيبيتوپ المناعيوتم دمجه مع 1,311 T1 TCRs من مجموعة بيانات scTCR-seq الخاصة بنا. تم تحليل قائمة TCR الناتجة باستخدام بوابة الويب GLIPH2 (المرجع 15) (http://50.255.35.37:8080“). تم تجميع TCRs بناءً على كل من التشابه المحلي والعالمي، وتم تصفية المجموعات وفقًا للمعايير التالية: Fisher_score و vb_score تم رسم جميع المجموعات التي تحتوي على TCRs لخلايا T1 باستخدام Cytoscape (الإصدار 3.10.1).
اختبار ELISA واختبار Luminex
تم وزن الأنسجة الأنفية وخلطها ميكانيكياً باستخدام مطحنة كرات TissueLyser LT (Qiagen). تم إضافة محلول RIPA الذي يحتوي على مجموعة كاملة من مثبطات البروتياز (Roche) إلى المستحلبات.تم تجميد المستخلصات وإذابتها مرتين، ثم تم الطرد المركزي عند لمدة 5 دقائق عند تم استخدام السائل العلوي لقياسات GZMK بواسطة ELISA (ريد دوت بيوتيك) وقياسات IL-5 بواسطة اختبار Luminex xMAP (ثيرمو فيشر) على نظام Bio-Plex 200 (بايو راد). تم إجراء جميع التحليلات وفقًا لتعليمات الشركة المصنعة.
اختبار وظيفة الرئة
تم تقييم استجابة مجرى الهواء لدى الفئران باستخدام نظام FlexiVent (SCIREQ) وفقًا لتعليمات الشركة المصنعة. تم إجراء عملية فتح القصبة الهوائية والت intubation الرغامي بعد تخدير الفئران بـبنتوباربيتال الصوديوم (سيغما-ألدريتش). تم قياس مقاومة مجرى الهواء والامتثال عند التعرض المتسلسل لجرعات متزايدة من الميثاكولين (سيغما-ألدريتش) المذاب في محلول ملحي معقم. و ).
صبغة AB-PAS
تم تثبيت رئتي الفأر الأيسر فيالفورمالديهايد لمدة 4 ساعات، تم تجفيفه في 30% سكروز لمدة يومين في درجة حرارة الغرفة وتم تجميده في مركب Tissue-Tek O.C.T.تم تقطيع كتل الأنسجة بالتبريد إلىشرائح، وتم إجراء صبغ ألكيان الأزرق – حمض البيريوكسيد شيف (AB-PAS) باستخدام مجموعة محلول AB-PAS (Servicebio) وفقًا لتعليمات الشركة المصنعة. تم الحصول على صور بانورامية لقسم رئة كامل لكل حيوان باستخدام ماسح الشرائح Zeiss Axio Scan Z1، وتم الحصول على مشاهد مكبرة بواسطة ميكروسكوب نيكون إكليبس Ts2R (نيكون). PASتم قياس المساحات في كل ممر هوائي باستخدام برنامج ImageJ (NIH) بنفس العتبة وتم تطبيعها على محيط الممر الهوائي. تم حساب القيمة المتوسطة من الأربعة ممرات الهوائية ذات أعلى قيمة مطبقة.المساحة لكل قسم، والمخصصة للحيوان المعني.
تفاعل البوليميراز المتسلسل الكمي
تم استخراج RNA من خلايا الفئران المفروزة باستخدام التريزول وتم تحويله عكسيًا إلى DNA مكمل (cDNA) بواسطةماستر ميكس الشامل (abm). تم إجراء PCR الكمي باستخدام بلاستاككمي
خليط PCR (abm) على نظام CFX Connect للوقت الحقيقي (BioRad). تم إدراج البرايمرات المستخدمة كما يلي: Actb-F 5′-CCTAAGAGGAGGATGGTCGC، Actb-R 5′-CTCAAGTCAGTGTACAGGCCA؛ Gzmk-F 5′-TGTCCAACTGCTTCACCTGGG و Gzmk-R 5′-GCCACCAGAGTCACCCTTGCA. تم تطبيع مستوى Gzmk إلى المستوى.
تعبير وتنقية GZMK البشري المؤتلف
تم إنتاج وتنقية GZMK البشري المؤتلف كما هو موصوف سابقًاباختصار، تم استنساخ cDNA لجين GZMK البشري في متجه pHL. تم إجراء طفرات PCR لإنتاج الطفرة غير النشطة إنزيميًا GZMK-S214A. تم زراعة خلايا 293-F (المستمدة من Thermo Fisher؛ تم التحقق منها من قبل المزود؛ سلبية الميكوبلازما) في وسط 293-TII (Sino Biological) بتركيزتم زرع خلايا بمعدل 2 × 10^6 خلية لكل مل في الليلة السابقة للتحويل. بعد ذلك، تم خلط البلازميدات مع بولي إيثيلين أمين خطي (وزن جزيئي 40,000، من شركة ياسين للتكنولوجيا الحيوية) بنسبة 1:3، وتم تحويلها إلى خلايا 293-F. تم جمع السوبرناتانت بعد 3 أيام، وتم التقاط الجرانزيمات التي تحتوي على علامة هيستيدين في الطرف C على عمود تقارب النيكل (من شركة ياسين للتكنولوجيا الحيوية). تم هضم البروتينات المستخلصة (التي تحتوي على موقع إنتروميناز مهندَس في الطرف N) بواسطة الإنتروميناز (من شركة بييوتيم للتكنولوجيا الحيوية)، وتم إجراء كروماتوغرافيا تبادل الكاتيونات باستخدام عمود Resource S (من شركة سايتيفا) على نظام AKTA Purifier 10 (من شركة GE) لتنقية البروتين بشكل أكبر.
اختبار نشاط البروتياز للـ GZMK المعاد تركيبه
تم قياس نشاط البروتياز لـ GZMK بواسطة اختبار قائم على FRET (الشكل 4b من البيانات الموسعة) باستخدام ركيزة ببتيد فلوروجينيك اصطناعية، DABCYL-GDGRSIMTE-EDANS (سانغون للتكنولوجيا الحيوية). تم إجراء التفاعلات في 20 مليمول من HEPES، pH 7.0 عندمعبروتيازركيزة الببتيد. بعد 15 دقيقة، تم مراقبة الفلورية عند 490 نانومتر باستخدام طول موجي للإثارة يبلغ 340 نانومتر باستخدام قارئ Varioskan Flash (ثيرمو فيشر) في لوحة ميكرو 96 بئر. تم استخدام التربسين (بروماجا) كتحكم إيجابي، وتم استخدام الليزوزيم (سيغما-ألدريش) كتحكم سلبي.
اختبار سحب GZMK
تمت بيولوجية GZMK-S214A المنقاة أولاً عن طريق التفاعل مع EZ-Link NHS-LC-Biotin (ثيرمو فيشر) وفقًا لتعليمات الشركة المصنعة، وتم ربطها بخرز الدينابيدين M-280 ستربتافيدين (ثيرمو فيشر). للقيام بذلك،تم موازنة Dynabeads في PBS وتم تحضينها معبيوتينيلated GZMK-S214A لمدة 30 دقيقة عندتم إعداد مستخلصات NP كما هو موضح باستثناء استخدام محلول تفكيك مختلف (20 مللي مول من تريس،ترايتون X-100) مدعوم بمثبطات البروتياز والفوسفاتاز (بيوتايم للتكنولوجيا الحيوية). بعد ذلك،تمت إزالة الشوائب من المستخلصات من كل عينة بواسطةمن دينابيدز فيلمدة 4 ساعات، ثم تم تحضين المستخلصات المسبقة التنقية مع كرات دينابيدز البيوتينيل GZMK-S214A طوال الليل عندتم غسل الكريات الديناميكية باستخدام محلول التحلل، وتم استرجاع البروتينات المرتبطة باستخدام 0.1 م جلايسين (رقم هيدروجيني 2.5) وتم تحييدها باستخدام 1 م تريس (رقم هيدروجيني 7.5).
مطيافية الكتلة وتحليل البيانات
تم فصل البروتينات التي تم سحبها بواسطة GZMK-S214A-Dynabeads أو Dynabeads فقط بواسطةتم إجراء SDS-PAGE وتمت رؤيته بواسطة صبغة كوماتسي الزرقاء اللامعة. تم قطع شرائط البروتين وخضعت لهضم داخل الجل. تم غسل قطع الجل فيوتم إزالة الصبغة فيفيثم تم حضن البروتينات مع 10 مللي مول من DTT (سيغما-ألدريتش) لمدة 60 دقيقة فيتبع ذلك 20 مليمول من MIAA (سيغما-ألدريتش) لمدة 30 دقيقة في الظلام عند درجة حرارة الغرفة. تم إضافة التربسين (بروماجا) بنسبة 1:50 (وزن/وزن)، وتم تحضين المزيج طوال الليل فيأخيرًا، تم تنظيف العينات على خرطوشة C18 (شركة وواترز) وكانت جاهزة لتحليلات LC-MS. تم إجراء LC-MS باستخدام نظام UltiMate 3000 UHPLC (ثيرمو فيشر) المتصل بمطياف الكتلة Fusion Lumos Tribrid (ثيرمو فيشر). تم تحليل بيانات مطيافية الكتلة. باستخدام محرك البحث SEQUEST HT ضد قاعدة بيانات UniProt Swiss-Prot مع برنامج Proteome Discoverer v.2.3 (ثيرمو فيشر). من بين البروتينات المتفاعلة مع GZMK التي تم تحديدها، ظهر 56 في جميع العينات التي تم تحليلها. تم تصنيف هذه البروتينات حسب درجات SEQUEST ونسبة الوفرة (العينةتحكمتم إجراء تحليل تفاعل البروتينات للبروتينات المتفاعلة مع GZMK باستخدام Cytoscape. (الإصدار 3.9.1).
تسلسل إدمان
تم فصل الأحماض الأمينية من نوع فينيلثيوهيدانتوين في وضع الطور العكسي من الكروماتوغرافيا السائلة عالية الأداء باستخدام الفروق بين أوقات الاحتفاظ للأحماض الأمينية المختلفة، وتم الكشف عن كمية امتصاص الأشعة فوق البنفسجية عند أطوال موجية محددة. تم نقل العينات إلى غشاء بولي فينيل ديفلورايد وتم ضبط خمس دورات. تم تحديد تسلسلات الأحماض الأمينية لكل عينة من الكروماتوغرامات التي تم الحصول عليها في كل تقييم دورة من خلال مقارنة الكروماتوغرامات مع تلك في الدورات السابقة واللاحقة وتحديد أحماض فينيلثيوهيدانتوين الأمينية التي كانت لديها أكبر زيادة في الوفرة.
اختبار انقسام GZMK
بروتين SET المؤتلف (Solarbio) ومكملات C2 وC3 وC4 وC5 المنقاة من المصل (Complement Technology) بتركيزتم حضنها مع GZMK المؤتلف في PBS عند للفترة الزمنية المحددة. لاختبار انقسام DMBT1، تم تحضين مستخلصات أنسجة NP مع جرعات متزايدة من GZMK المؤتلف عندلمدة ساعة واحدة. تم إيقاف التفاعلات بإضافةتم تحميل عازلة SDS (مخفضة، TransGen)، ثم تم غلي العينات لمدة 15 دقيقة وحلها بواسطة SDS-PAGE. تم تحميل C3a وC3b وC2a وC4b المنقاة من المصل (Complement Technology) وGZMK المؤتلف بشكل منفصل كضوابط. تم تصور البروتينات المستهدفة إما بواسطة صبغة كوماتسي الزرقاء اللامعة أو تم الكشف عنها بواسطة التحليل المناعي باستخدام أجسام مضادة مختلفة. تشمل الأجسام المضادة المستخدمة مضاد SET (نسخة EPR12973، Abcam)، مضاد GZMK (نسخة EPR24601-164، Abcam)، مضاد C2 (نسخة EPR17979، Abcam)، مضاد C3 (نسخة EPR19394، Abcam)، مضاد C3a/C3a-desArg (نسخة 2991، Hycultbiotech)، مضاد C4. (النسخة C-2، سانتا كروز)، مضاد-C5a/C5a-desArg (النسخة C17/5، أبكام)، مضاد-DMBT1 (النسخة G-4، سانتا كروز)، مضاد-ACTB (النسخة C4، سانتا كروز)، HRP-ماعز-مضاد-فأر IgG ( ) (بيوتايم للتكنولوجيا الحيوية) و HRP-ماعز-مضاد-أرنب IgG (H+L) (بيوتايم للتكنولوجيا الحيوية). تم تطوير المناعية بواسطة كاشف الكشف سوبر ECL (ياسين للتكنولوجيا الحيوية).
للمقارنة بين GZMK ومختلف محولات C3، تم استخدام C3 البشري المنقى من المصل (تكنولوجيا المكملات، ) تم حضنها مع GZMK أو غيرها من المحولات C3 (C3bBb أو C4b2a؛ ) لمدة 20 دقيقة في تم تشكيل C3bBb عن طريق خلط C3b (تكنولوجيا المكملات، ، فيسبوك (تكنولوجيا التكامل، ) و FD (تكنولوجيا التكامل، 500 نانومتر) في محلول HBS-Mg (20 مللي مولار هيبيس، ) لمدة دقيقتين عند وانتهت التفاعل بإضافة 5 مليمول من EDTA. تم تشكيل C4b2a عن طريق حضانة C4b (تكنولوجيا المكملات، )، C1s (تكنولوجيا المكملات، ) و C2 (تكنولوجيا التكامل، ) في PBS مع 2 مللي مول من MgCl2 و 40 مللي مول من NaCl لمدة 5 دقائق عندوانتهت التفاعل بإضافة 2 مللي مول من EDTA. تم قياس كمية C3a المعروضة على الجل الملون بصبغة كوماتسي الزرقاء باستخدام برنامج ImageJ، وتم تطبيع البيانات إلى مجموعة C4b2a.
تنقية C3a وقياس نشاط C3a
تم تنقية C3a المحول بواسطة محولات C3 مختلفة عن طريق كروماتوغرافيا الفصل حسب الحجم (SEC). على وجه التحديد، تم فصل منتجات التقطيع بواسطة عمود SEC (Acclaim SEC-1000،، نظام HPLC من فانكويش (Thermo Fisher) مع جهاز الكشف UV مضبوط للكشف عن الامتصاص عند 280 نانومتر. تم استخدام محلول PBS (pH 7.4) كمرحلة متحركة فيمعدل التدفق للاستخلاص.
تم جمع كسور SEC تلقائيًا وتركيزها بشكل إضافي بواسطة وحدة الطرد المركزي Amicon ultra (بحد قطع وزن جزيئي 3 كيلودالتون، ميلليبور). تم تأكيد نقاء C3a بواسطة SDS-PAGE. ) وصبغة كوماتسي الزرقاء اللامعة.
تم الحفاظ على خلايا THP1 (المستخرجة من البنية التحتية الوطنية لموارد خطوط الخلايا، الصين؛ تم التحقق منها من قبل المزود؛ سلبية الميكوبلازما) في وسط RPMI-1640 (FBS، 1% بنسلين وستربتوميسين) واستخدمت لقياس أنشطة C3a. باختصار، تم تجويع الخلايا من المصل طوال الليل، وتم تحضينها معمن المصادر المشار إليها فيلمدة 5 دقائق، وتم تحللها باستخدام محلول RIPA الذي يحتوي على مثبطات البروتياز (روش) ومثبطات الفوسفاتاز (ثيرمو ساينتيفيك). تم إجراء التحليل المناعي باستخدام الأجسام المضادة المضادة للفوسفور-إيرك1/2 (تكنولوجيا الإشارة الخلوية) والأجسام المضادة المضادة لإيرك1/2 (نسخة 137F5، تكنولوجيا الإشارة الخلوية). تم قياس البيانات باستخدام ImageJ وتم تطبيعها بالنسبة للتحكم غير المعالج.
اختبار انحلال الدم
تمت مزج C5b6 البشري المنقى بالمصل (600 pM) أولاً مع GZMK المعاد تركيبه أو التربسين (600 pM) عندللفترة الزمنية المحددة. ثم أضيف مزيج التفاعل إلى كريات الدم الحمراء للدجاج ( لكل مل، Sbjbio) معلق في محلول ملحي مخفف في فيرونال (pH 7.4)، وتم حضنه في لمدة 5 دقائق. بعد ذلك، تم إضافة C7 المنقى من المصل (15 نانومول) إلى كريات الدم الحمراء وتم تحضين المزيج فيلمدة 15 دقيقة. أخيرًا، مزيج من المصل المنقى و C 9 تمت إضافتها إلى الخلايا، وتمت الحضانة لاحقًا عندلمدة 30 دقيقة. تم إزالة كريات الدم الحمراء السليمة المتبقية عن طريق الطرد المركزي عندلمدة دقيقتين، وتم تحديد انحلال الدم عن طريق قياس الامتصاص عند 405 نانومتر.
التحليلات الإحصائية
تم إجراء التحليلات الإحصائية بواسطة Prism v. 9 (GraphPad). مان ويتنيتم استخدام الاختبارات لحسابقيم من البيانات البشرية، واختبار ستودنت ذو الجانبينتم استخدام اختبارات – لتحليل بيانات الفئران. تم تحليل المتغيرات الفئوية باستخدام اختبار كاي-تربيع. كما تم إجراء تحليل خصائص التشغيل المستقبلية في R (الإصدار 4.3.3) باستخدام حزمة pROC للتنبؤ بعودة الزوائد أو الربو المصاحب. تم إجراء تحليلات الانحدار الخطي المتعدد باستخدام حزمة emmeans في (الإصدار 4.3.3).
ملخص التقرير
معلومات إضافية حول تصميم البحث متاحة في ملخص تقارير مجموعة نيتشر المرتبط بهذه المقالة.
توفر البيانات
تم إيداع بيانات التسلسل الخام في أرشيف تسلسل الجينوم (GSA) في مركز البيانات الضخمة، معهد بكين للجينوم، الأكاديمية الصينية للعلوم،http://gsa.big.ac.cn) تحت رقم القيد HRA005529 للبيانات البشرية وCRA012671 لبيانات الفئران. بالنسبة لتحليلات GLIPH2، تم الحصول على تسلسلات TCR المعلّمة من VDJdb (https://vdjdb.cdr3.net) وقاعدة بيانات الإيبيتوبي المناعي (https://www.iedb.org).
توفر الشيفرة
تم إيداع الشيفرة الأصلية لتحليل بيانات التسلسل في زينودو (https://doi.org/10.5281/zenodo.14030622) . 51. فوكينز، و.، لوند، ف.، مولول، ج. ورقة الموقف الأوروبية حول التهاب الجيوب الأنفية والسلائل الأنفية 2007. رينول. ملحق. 20، 1-136 (2007). 52. باتمان، إ. د. وآخرون. الاستراتيجية العالمية لإدارة الربو والوقاية منه: ملخص تنفيذي لجينا. المجلة الأوروبية للتنفس 31، 143-178 (2008). 53. بيشيلي، س. وآخرون. تسلسل RNA الكامل من خلايا مفردة باستخدام Smart-seq2. نات. بروتوك. 9، 171-181 (2014). 54. تشين، ج. وآخرون. تحليل النسخ الجيني المكاني لعينات الأنسجة المقطوعة بالتبريد باستخدام Geo-seq. بروتوكولات الطبيعة 12، 566-580 (2017). 55. باترو، ر.، دوغال، ج.، لوف، م. آي.، إيريزاري، ر. أ. وكينغسفورد، ج. السلمون يوفر قياسًا سريعًا وواعيًا للتحيز لتعبير النسخ. نات. ميثودز 14، 417-419 (2017). 56. لوف، م. آي.، هوبر، و. & أندرس، س. تقدير معتدل لتغير الطي والتشتت لبيانات RNA-seq باستخدام DESeq2. جينوم بيو. 15، 550 (2014). 57. ستيوارت، ت. وآخرون. التكامل الشامل لبيانات الخلية الواحدة. خلية 177، 1888-1902 e1821 (2019). 58. كاو، ج. وآخرون. المشهد النسخي على مستوى الخلية الواحدة لتكوين الأعضاء في الثدييات. ناتشر 566، 496-502 (2019). 59. شانون، ب. وآخرون. سايتوسيب: بيئة برمجية لنماذج متكاملة لشبكات تفاعل الجزيئات الحيوية. أبحاث الجينوم. 13، 2498-2504 (2003). 60. مارتن، م. كوتادابت يزيل تسلسلات الموصلات من قراءات التسلسل عالي الإنتاجية. EMBnet.Jhttps://doi.org/10.14806/ej.17.1.200 (2011). 61. سونغ، ل. وآخرون. TRUST4: إعادة بناء مجموعة المناعة من بيانات تسلسل RNA من الخلايا الكثيفة والفردية. نات. ميثودز 18، 627-630 (2021). 62. يي، ج.، ما، ن.، مادن، ت. ل. وأوستيل، ج. م. IgBLAST: أداة تحليل تسلسل مجال المتغير للأجسام المضادة. أبحاث الأحماض النووية 41، W34-W40 (2013). 63. دوتي والا، ف. وآخرون. نظام تعبير عالي العائد وفعال من حيث التكلفة للجرانزيمات البشرية في خلايا الثدييات. ج. فيس. إكسب.https://doi.org/10.3791/52911 (2015). 64. جيزهو، ل. وآخرون. الكود الأصلي لتحليل بيانات التسلسل في البحث العلمي ‘خلايا T CD8 التي تعبر عن جرanzيم K تعزز الأمراض الالتهابية الهوائية المتكررة’. زينودوhttps://doi.org/10.5281/zenodo. 14030622 (2024).
الشكر والتقدير نشكر Y. Li في مستشفى تونغرن وB. Li في مستشفى الصداقة الصينية اليابانية على مساعدتهما في اختبارات وظائف الرئة لدى الفئران. نشكر J. Xiao في جامعة بكين على مساعدته في اختبار التحلل الدموي. تم تمويل هذا العمل جزئيًا من قبل البرنامج الوطني الرئيسي للبحث والتطوير في الصين (وزارة العلوم والتكنولوجيا، رقم المنحة 2022 YFC2504100 لـ L.Z.)، والمشروع الوطني للعلوم والتكنولوجيا الكبرى (اللجنة الوطنية للصحة في الصين، أرقام المنح 2023 ZD0519900 لـ J.W. و2023ZD0520300 لـ H.Q.)، وبرنامج البحث العلمي الابتكاري في جامعة تسينغhua (جامعة تسينغhua، H.Q.)، ومؤسسة العلوم الطبيعية الوطنية في الصين (أرقام المنح T2225005 و21927802 لـ J.W.، 32130037 لـ H.Q.، 32422028 لـ X.L.، و81970851 و82271140 لـ F.L.)، ومركز الابتكار التعاوني SXMU-Tsinghua للطب الحدودي (H.Q.)، وبرنامج علماء تشانغجيانغ وفريق البحث الابتكاري (رقم المنحة IRT13082 لـ L.Z.). H.Q. هو باحث جديد في حجر الزاوية.
مساهمات المؤلفين: بدأ H.Q. و L.Z. التعاون وقادا المشروع. قام X.L. و H.Q. بتصميم وتصوّر الدراسة. قام S.D. و X.W. و C.W. بتجنيد المرضى وجمع العينات السريرية تحت إشراف L.Z. أجرى F.L. و J.L. و Y.S. تجارب تتعلق بالعينات البشرية تحت إشراف H.Q. و X.L. أجرى J.L. تحليلات المعلومات الحيوية تحت إشراف J.W. و J.Y. أجرى W.M. تجارب على الفئران تحت إشراف X.L. و H.Q. أجرى F.S. تجارب تحديد الركيزة تحت إشراف J.W. و J.Y. قدم L.Z. أكبر دعم مالي لتمويل الدراسة. قام X.L. و H.Q. بتفسير البيانات وكتابة الورقة بمشاركة جميع المؤلفين.
المصالح المتنافسة: H.Q. هو أحد المؤسسين المشاركين لشركة إيمرجنت بيو ميد سوليوشنز، المحدودة.
معلومات إضافية
معلومات إضافية النسخة الإلكترونية تحتوي على مواد إضافية متاحة علىhttps://doi.org/10.1038/s41586-024-08395-9. يجب توجيه المراسلات والطلبات للحصول على المواد إلى شين ليو، جيانبين وانغ، لوو تشانغ أو هاي تشي. تُعرب مجلة Nature عن شكرها لكلوديا كيمبر والمراجعين الآخرين المجهولين على مساهمتهم في مراجعة الأقران لهذا العمل. معلومات إعادة الطباعة والتصاريح متاحة علىhttp://www.nature.com/reprints.
الشكل التوضيحي الممتد 1 | تسلسل RNA أحادي الخلية والتوصيف لـخلايا T في الأنسجة الأنفية. أ، تصور UMAP لإجمالي CD45الخلايا في الأنسجة الأنفية من جميع المرضى الأصحاء ومرضى التهاب الأنف التحسسي الذين تم تحليلهم (متعلق بالشكل 1ب). ب، مستويات التعبير عن CD3D، TRAC، TRDC، NKG7، PTGDR2، CD79A، HLA-DRA، CLEC4C، KIT و GZMK. ج، خلايا مع TCR مكتمل التجميع. و السلاسل مكدسة على إجمالي CD45الخلايا، تم تصورها بواسطة UMAP. د، مخططات النقاط تظهر تعبير الجينات المحددة في خلايا اللمفوية الفطرية (ILCs)/خلايا T. النسبة ومستوى التعبير يتم عرضها من خلال حجم النقاط وشدة اللون، على التوالي. e، مخططات النقاط التي تظهر تعبير جينات توقيع خلايا T الفعالة والذاكرة، بناءً على ذلكتم توضيح مجموعات الخلايا الفرعية. يتم الإشارة إلى النسبة ومستوى التعبير من خلال حجم النقاط والألوان، على التوالي. ف، إحصائيات تلخص الوفرة النسبية لمختلفمجموعات الخلايا في الأنسجة الأنفية من و NP ( ) المرضى. كل رمز يدل على مريض واحد، والخطوط تشير إلى المتوسطات. HC، مجموعة التحكم الصحية؛ NP، بوليب الأنف.القيم بواسطة اختبارات مان-ويتني. ن
استراتيجية فرز خلايا CD8 T من نسيج NP
e
ف
الشكل البياني الموسع 2 | تحليلات خلايا CD8 T وخلايا NK من أنسجة NP والدم المحيطي. أ، استراتيجيات التصفية لفرز مجموعات خلايا CD8 T من أنسجة NP. ب-ج، التحقق من مجموعات خلايا CD8 T المختلفة من أنسجة NP بواسطة scRNA-seq. ب، تجميع الخلايا المصفاة الكلية (يسار) أو المجموعات الفردية (يمين). تم مطابقة البيانات مع مجموعة البيانات المرجعية في الشكل 1d. ج، تركيبة كل مجموعة مصفاة. استراتيجية الفرز لخلايا CD8 T في الدم. e، استراتيجيات الفرز لخلايا NK في أنسجة NP. f، إحصائيات تلخص وفرة خلايا NK في الأنسجة الأنفية في HC ( )، NP ( ) و svNP ( ) المرضى. كل رمز يدل على مريض واحد، والخطوط تشير إلى المتوسطات.القيم بواسطة اختبارات مان-ويتني.
الشكل 3 من البيانات الموسعة | إفراز GZMK بواسطةالخلايا. أ-ب، مخططات FACS التمثيلية (أ) وإحصائيات ملخصة (ب) تظهر التعبير السطحي لـ LAMP1 في مجموعات الخلايا المحددة عند التحفيز.مستويات GZMK داخل الخلايا في LAMP1الخلايا داخل كل مجموعة فرعية.
تظهر مخططات FACS التمثيلية (ج) وإحصائيات ملخصة (د). PMA، فوسفات 12-ميريستات 13-أسيتات؛ MFI، شدة الفلورة المتوسطة. البيانات تمثل ( و ) أو مجمعة من ( وثلاثة مرضى. القيم بواسطة اختبارات t المزدوجة.
الشكل البياني الممتد 4 | توصيف ركائز GZMK والمقارنة بين GZMK وغيرها من المحولات C3. أ، جيل ممثل ملون بصبغة كوماتسي الزرقاء يظهر GZMK المنقى وGZMK.ب، مخطط لاختبار إنزيم البروتياز القائم على نقل الطاقة بالفلوريسنس (FRET) لتحديد نشاط GZMK. ج، قياسات نشاط GZMK باستخدام الاختبار في (ب). تم تضمين الليزوزيم والتربسين كضوابط سلبية وإيجابية، على التوالي. كل رمز يدل على تكرار تقني. )، وتُعرض البيانات كمتوسط ± الانحراف المعياري. AU، وحدة عشوائية. د، صور تمثيلية لعملية التحليل المناعي تُظهر انقسام SET بواسطة GZMK. هـ، صور تمثيلية لعملية التحليل المناعي تُظهر انقسام DMBT1 النسيجي بواسطة جرعات مختلفة من GZMK، مع -أكتين كعينة للتحكم في معالجة العينات. البيانات تمثل (أ-هـ) على الأقل تجربتين مستقلتين. و، صورة تمثيلية لجيل ملون بصبغة كوماتسي زرقاء تظهر الانقسام of C3 المنقى من المصل بواسطة GZMK و C3bBb و C4b2a.g، إحصائيات تلخص مستوى C3a المحول بواسطة GZMK و C3bBb، كما تم تطبيعه على C4b2a. كل رمز يدل على تجربة واحدة، والخطوط تدل على المتوسطات. h، تتبع HPLC التمثيلي (يسار) وهلام ملون بصبغة كومياسي الأزرق (يمين) يظهر عزل C3a. تم حضن C3 المنقى من المصل مع GZMK البشري المعاد تركيبه أو C4b2a الم assembled من مكونات منقاة من المصل. mAU، وحدة الامتصاص الملي. i-j، بلوتات المناعة (i) وإحصائيات ملخصة (j) تظهر تنشيط ERK في خلايا THP1 بواسطة C3a من مصادر مختلفة. البيانات تمثل ( و (i) أو مجمعة (g و j) من ثلاثة تجارب مستقلة. كل رمز يدل على تجربة واحدة، والخطوط تدل على المتوسطات.تمت مقارنة القيم باستخدام اختبار t غير المقترن ذو الجانبين. تُعرض الصور المصدر للهلامات واللطخات في الشكل التكميلية 1.
مقالة
الشكل 5 من البيانات الموسعة | انقسام GZMK لمكونات مكملة إضافية.
الجيلات الملونة بصبغة كواماسي الزرقاء التي تمثل انقسام GZMK لبروتينات C2 (أ)، C4 (د) وC5 (ز)، كما تم تأكيده بواسطة تسلسل إدمان (ب، هـ و ح) والاختبارات المناعية. و ). يتم الإشارة إلى أوقات الحضانة. اختبارات التحلل لقياس نشاط C5b6 المنقى من المصل مع أو بدون انقسام GZMK (انظر الطرق لمزيد من التفاصيل). تم تحلل كريات الدم الحمراء للدجاج نتج عن إضافة C5b6 وكمية زائدة من C7 وC8 وC9 المنقاة من المصل. AU، وحدة عشوائية. تشير أشرطة الخطأ إلى المتوسطات ± الانحراف المعياري. كل رمز يدل على تكرار تقني. )، والخطوط تشير إلى المتوسطات. البيانات تمثل على الأقل تجربتين مستقلتين. الصور المصدرية للهلامات واللطخات مقدمة في الشكل التكميلية 1.
الشكل البياني الممتد 6 | انظر الصفحة التالية للتعليق.
مقالة
الشكل البياني الممتد 6 | خلايا CD8 T التي تعبر عن GZMK تتوضع في الهياكل اللمفاوية الثلاثية. أ-ج، تحليلات IHC لخلايا CD8 T التي تعبر عن GZMK في الأنسجة الأنفية التي تمت إزالتها جراحيًا من الأصحاء أو مجموعات مختلفة من مرضى NP. أ، صور تمثيلية لتلوين GZMK و CD8. المربعات البيضاء تشير إلى المناطق التي تحتوي على تجمعات خلايا CD8 T التي تعبر عن GZMK؛ عرض مكبر لمناطق المربعات البيضاء موفر كإدخالات. مقياس الرسم،للنظرة العامة ولرسوم البيانية الدائرية التي تصنف الأفراد في كل مجموعة إلى أولئك الذين احتوت أنسجتهم المستأصلة جراحياً على تجمعات خلايا CD8 T التي تعبر عن GZMK أو لم تحتوي عليها. يتم الإشارة إلى أعداد الأفراد. كثافات تجمعات خلايا CD8 T التي تعبر عن GZMK في مرضى NP و svNP، مقدمة كتوزيعات نسبية. تحليل التعبير عن المناطق النسيجية التي تحتوي على GZMK وتجمعات الخلايا من خلال تحليل تسلسل RNA الكمي. إعداد التجربة. صورة حقل مضيء لقطاع نسيجي واحد من NP. (يسار، ملون بصبغة الكريستال البنفسجي) وصورة فلورية لقسم مجاور (يمين، ملون بـ DAPI وأجسام مضادة لـ GZMK) ، مع دوائر وردية وزرقاء تشير إلىتجمعات الخلايا والمناطق الضابطة المستأصلة بواسطة تشريح الميكرو بالليزر. مقياس الرسم،.ف، تحليل المكونات الرئيسية. كل رمز يشير إلى منطقة نسيج واحدة. ج، الجينات المعبر عنها بشكل مختلف المختارة في المجموعة الضابطة و GZMKالمناطق.تلوين IHC للعلامات المحددة (h) وإحصائيات ملخصة لوفرة أنواع الخلايا المحددة في المجموعة الضابطة ( ) و GZMK المناطق ( ) يتم عرضها ( و ). شريط القياس، . كل رمز يشير إلى منطقة مختارة واحدة، والخطوط تدل على المتوسطات. تم تضمين مقاطع الأنسجة من ثلاثة (ج) أو أربعة (ط) مرضى في التحليل، وعلى الأقل ثلاثة من الضوابط وGZMKتم اختيار مناطق لكل مريض.القيم بواسطة اختبارات مان-ويتني.
الشكل البياني الموسع 7 | نموذج الربو الفأري. أ، إعداد التجربة. ب، استراتيجيات التصفية لمجموعات الخلايا المناعية المختلفة في سائل غسيل القصبات الهوائية. ج، إحصائيات ملخصة تظهر قياسات مجموعات خلايا سائل غسيل القصبات الهوائية. د، تعبير عنفي خلايا T CD8 و CD4 المعزولة من نسيج الرئة بواسطة RT-PCR الكمي. تم تطبيع البيانات على تعبير Atcb. تم تجميع البيانات من تجربتين مستقلتين، مع تضمين ما لا يقل عن حيوانين في كل مجموعة في تجربة واحدة.القيم بواسطة غير متطابقة ذات جانبيناختبارات. e-f، تحليلات تسلسل RNA المرسال لخلية CD8 T من سائل غسيل القصبات الهوائية (BALF) المجمعة من فئران C57BL/6 بعد التحديات الثانية مع OVA كما هو موضح في a.e، تصور UMAP لثلاثة مجموعات فرعية من خلايا CD8 T في BALF. f، مخططات الكمان تظهر تعبير Cd3e، Cd8a، Gzmk، Itgae. تم دمج البيانات من نسختين بيولوجيتين، كل منهما تحتوي على خلايا BALF مجمعة من 3 فئران.
الشكل 8 من البيانات الموسعة | وظائف GZMK المشتق من خلايا T CD8. أ-هـ، تحفيز التهاب المسالك الهوائية في-كريوالفئران. أ، تصميم التجربة. ب، أعداد خلايا المناعة المشار إليها. ج، وظيفة الرئة للفئران المشار إليها كما تم قياسها بواسطة فرط الحساسية في مجرى الهواء استجابةً لجرعة متزايدة من الميثاكولين باستخدام تقنية التذبذب القسري. كل رمز يشير إلى فأر واحد، والأشرطة تمثل المتوسطات. د، صور تمثيلية لصبغة ألكيان الأزرق مع حمض البيريويد (AB-PAS) لشرائح أنسجة الرئة. مقياس الرسم،. تحديدات PASالمناطق في مجرى الهواء. ف-ج، الدور الداخلي لخلايا T CD8 لـ GZMK. ف، إعداد التجربة. ج، إحصائيات تلخص عدد الخلايا المناعية المكتشفة في سائل الشطف القصبي. i.p.، داخل الصفاق؛ i.h.، استنشاق؛ DPI، أيام بعد التحصين. كل رمز يشير إلى فأر واحد، والخطوط تمثل المتوسطات. تم تجميع البيانات من تجربتين (د-هـ) أو ثلاث تجارب (ب، ج وج) مستقلة، مع تضمين ما لا يقل عن حيوانين في كل مجموعة.القيم بواسطة غير متطابقة ذات جانبيناختبارات.
الشكل البياني الممتد 9 | انظر الصفحة التالية للتعليق.
مقالة
الشكل 9 من البيانات الموسعة | GZMK المستمد من خلايا CD8 T يعزز تجنيد الحمضات الهوائية من خلال C3.a-d، تحفيز الالتهاب الهوائي استنادًا إلى النقل التبني لخلايا OT-I T التي تعبر عن Gzmk بشكل مفرط، Gzmk و ب) و و د). و الإعداد التجريبي.و د، أعداد مجموعات الخلايا المناعية المحددة في سائل الشطف القصبي. هـ-و، تحفيز الربو فيالحيوانات. د، تجريبي جدول. إحصائيات تلخص عدد أنواع مختلفة من خلايا المناعة في سائل الغسيل الشعبي. كل رمز يشير إلى فأر واحد، والخطوط تمثل المتوسطات. تم تجميع البيانات من تجربتين (د و ف) أو أربع تجارب (ب) مستقلة، مع تضمين ما لا يقل عن حيوانين في كل مجموعة.القيم بواسطة غير متطابقة ذات جانبيناختبارات.
الشكل البياني الممتد 10 | تأثير مثبطات الجرanzيم. أ، الجدول الزمني التجريبي. تم إعطاء PPACK أو Z-IETD-FMK عن طريق الحقن داخل الصفاق كل يومين خلال الفترة الزمنية المحددة. و إحصائيات ملخصة تظهر عدد أنواع مختلفة من خلايا المناعة في سائل غسيل القصبات الهوائية (BALF) للفئران المعالجة بـ PPACK (ب) أو Z-IETD-FMK (ج). كل رمز يشير إلى فأر واحد، والخطوط تمثل المتوسطات. د، فرط حساسية مجرى الهواء للفئران المعالجة بالسيارة أو PPACK تم قياسها باستخدام تقنية التذبذب القسري. كل رمز يشير إلى فأر واحد، والشرائط تشير إلى ما يعنيه. e، تمثيل AB-PAS لشرائح أنسجة الرئة للفئران المعالجة بالسيارة أو PPACK. مقياس الرسم،.ف، إحصائيات تلخص المناطق في مجرى الهواء للفئران المشار إليها. كل رمز يشير إلى فأر واحد، والخطوط تمثل المتوسطات. تم تجميع البيانات من تجربتين (ب، ج، هـ و و) أو أربع تجارب (د)، مع تضمين ما لا يقل عن حيوانين في كل مجموعة.القيم بواسطة غير متطابقة ذات جانبيناختبارات.
مقالة
البيانات الموسعة الجدول 1 | الخصائص السكانية للمرضى
تحكم ( )
NP ( )
svNP ( )
الجنس (ذكر/أنثى)
19/15
50/32
٥٤/٣٦
العمر (سنوات)، الوسيط (المدى interquartile)
41.0 (32.8، 49.8)
٤٥.٠ (٣٦.٣، ٥٦.٠)
٤٨.٥ (٣٦.٣، ٦٠.٠)
مؤشر كتلة الجسم، الوسيط (المدى interquartile)
٢٥.١ (٢١.٧، ٢٩.١)
٢٤.٢ (٢١.٨، ٢٦.٧)
٢٤.٩ (٢٣.٠، ٢٧.٨)
التدخين الحالي العدد (%)
7 (20.6%)
22 (26.8%)
20 (22.2%)
الحساسية رقم (%)
5 (14.7%)
33 (40.2%)
٣٦ (٤٠٫٠٪)
الربو رقم (%)
0 (0%)
0 (0%)
62 (68.9%)
تكرار البوليب رقم (%)
–
0 (0%)
63 (70.0%)
درجة لوند-ماكاي في التصوير المقطعي المحوسب، الوسيط (المدى interquartile)
نسبة الإيوزينوفيلات في الدم المحيطي (%)، الوسيط (IQR)
البيانات الموسعة الجدول 2 | تحليلات الانحدار الخطي المتعدد
تحكم ( )
NP ( )
svNP ( )
NP مقابل التحكم
svNP مقابل التحكم
svNP مقابل NP
فرق المتوسط المعدل (95% فترة الثقة)
قيمة P
فرق المتوسط المعدل (95% فترة الثقة)
قيمة P
فرق المتوسط المعدل (95% فترة الثقة)
قيمة P
جي زد إم كيه (نانوغرام/مل)
0.793 (0.353)
1.720 (1.580)
2.690 (2.190)
0.939 (0.042 إلى 1.836)
0.042
1.855 (0.953 إلى 2.758)
0.917 (0.293 إلى 1.541)
0.005
درجة التصوير المقطعي
3.29 (3.77)
15.6 (5.32)
18.2 (4.54)
12 (9.6 إلى 14.4)
14.6 (12.2 إلى 17)
2.6 (0.9 إلى 4.2)
0.003
دخان*
3 (14.3%)
15 (24.2%)
3 (14.3%)
0.1(0 إلى 0.3)
0.13
0.1(-0.1 إلى 0.3)
0.325
0 (-0.2 إلى 0.1)
0.45
*غير مدخن = 0؛ مدخن = 1.
محفظة الطبيعة
المؤلف(المؤلفون) المراسلون: هاي تشي، لو زانغ، جيانبين وانغ، شين ليو
آخر تحديث من المؤلف(ين): 6 نوفمبر 2024
ملخص التقرير
تسعى Nature Portfolio إلى تحسين إمكانية تكرار العمل الذي ننشره. يوفر هذا النموذج هيكلًا للاتساق والشفافية في التقرير. لمزيد من المعلومات حول سياسات Nature Portfolio، يرجى الاطلاع على سياسات التحرير وقائمة مراجعة سياسة التحرير.
الإحصائيات
لجميع التحليلات الإحصائية، تأكد من أن العناصر التالية موجودة في أسطورة الشكل، أسطورة الجدول، النص الرئيسي، أو قسم الطرق. غير متوفر □ □ □ □ □ □ □
إكس
إكس
وصف لجميع المتغيرات المشتركة التي تم اختبارها □ وصف لأي افتراضات أو تصحيحات، مثل اختبارات الطبيعية والتعديل للمقارنات المتعددة
وصف كامل للمعلمات الإحصائية بما في ذلك الاتجاه المركزي (مثل المتوسطات) أو تقديرات أساسية أخرى (مثل معامل الانحدار) و التباين (مثل الانحراف المعياري) أو تقديرات مرتبطة بعدم اليقين (مثل فترات الثقة)
لاختبار الفرضية الصفرية، يتم استخدام إحصائية الاختبار (مثل F، t، r) مع فترات الثقة، أحجام التأثير، درجات الحرية وقيمة ملحوظة أعطِالقيم كقيم دقيقة كلما كان ذلك مناسبًا. □ لتحليل بايزي، معلومات حول اختيار القيم الأولية وإعدادات سلسلة ماركوف مونت كارلو □ لتصميمات هرمية ومعقدة، تحديد المستوى المناسب للاختبارات والتقارير الكاملة عن النتائج تم التأكيد حجم العينة بالضبطلكل مجموعة/شرط تجريبي، معطاة كرقم منفصل ووحدة قياس بيان حول ما إذا كانت القياسات قد أُخذت من عينات متميزة أو ما إذا كانت نفس العينة قد تم قياسها عدة مرات اختبار(ات) الإحصاء المستخدمة وما إذا كانت أحادية الجانب أو ثنائية الجانب يجب أن تُوصف الاختبارات الشائعة فقط بالاسم؛ واصفًا التقنيات الأكثر تعقيدًا في قسم الطرق.
تقديرات أحجام التأثير (مثل حجم تأثير كوهين)بيرسون )، مما يشير إلى كيفية حسابها تحتوي مجموعتنا على الإنترنت حول الإحصائيات لعلماء الأحياء على مقالات تتناول العديد من النقاط المذكورة أعلاه.
البرمجيات والشيفرة
معلومات السياسة حول توفر كود الكمبيوتر
جمع البيانات
تحليل البيانات
تم جمع بيانات البروتيوميات في الدراسة باستخدام أجهزة تيرمو ساينتيفيك التجارية.إكسكاليبورالبرمجيات (الإصدار 4.2). تم جمع بيانات تحليل التدفق باستخدام BD FACSDIVA (الإصدار 8.0.1). تم جمع بيانات التصوير باستخدام Zen (الإصدار 2.3). تم تحليل مجموعة بيانات TCR-seq الكبيرة بواسطة Cutadapt (الإصدار 1.18) وTRUST4 (الإصدار 1.0.2) وIgblast (الإصدار 1.16.0) وR (الإصدار 3.5.1) مع حزمة ggplot2 (الإصدار 3.3.3) وcirclize (الإصدار 0.4.15).
تم إجراء تحليلات بيانات تسلسل الخلايا المفردة باستخدام CellRanger (الإصدار 3.0)، Igblast (الإصدار 1.16.0)، cellphoneDB (الإصدار 3)، Monocle3 (الإصدار 1.3.1)، Cytoscape (الإصدار 3.10.1)، R (الإصدار 3.5.1) مع حزمة Seurat (الإصدار 3.0.2) و ggplot2 (الإصدار 3.3.3) و R (الإصدار 4.0.3) مع حزمة Seurat (الإصدار 4.3.0.1). تم إجراء توقع خصوصية TCR باستخدام بوابة GLIPH2 على الويب.http://50.255.35.37:8080) وتم رسم النتائج باستخدام Cytoscape (الإصدار 3.10.1).
تم تحليل بيانات LCM-seq بواسطة Salmon (الإصدار 0.8.2) و R (الإصدار 3.5.1) مع حزمة DESeq2 (الإصدار 1.22.2). تم إجراء البحث في قاعدة البيانات عن بيانات الكتلة الطيفية الخام باستخدام برنامج ثيرمو فيشر بروتين ديسكفري (الإصدار 2.3). تم إجراء تحليلات تفاعل البروتينات باستخدام سايتوسايت (الإصدار 3.9.1).
تم إجراء تحليل ROC في R (الإصدار 4.3.3) باستخدام حزمة pROC. تم إجراء تحليلات الانحدار الخطي المتعدد باستخدام حزمة emmeans في (الإصدار 4.3.3).
تم معالجة وتحليل بيانات تدفق الخلايا باستخدام FlowJo V10.
تمت معالجة وتحليل بيانات التصوير باستخدام Imaris V7.6.5 و Zen 2.3. تم إجراء التحليلات الإحصائية بواسطة Prism 9 (GraphPad) بالنسبة للمخطوطات التي تستخدم خوارزميات أو برامج مخصصة تكون مركزية في البحث ولكن لم يتم وصفها بعد في الأدبيات المنشورة، يجب أن تكون البرمجيات متاحة للمحررين والمراجعين. نحن نشجع بشدة على إيداع الشيفرة في مستودع مجتمعي (مثل GitHub). راجع إرشادات مجموعة Nature لتقديم الشيفرة والبرمجيات لمزيد من المعلومات.
بيانات
معلومات السياسة حول توفر البيانات
يجب أن تتضمن جميع المخطوطات بيانًا حول توفر البيانات. يجب أن يتضمن هذا البيان المعلومات التالية، حيثما ينطبق:
رموز الانضمام، معرفات فريدة، أو روابط ويب لمجموعات البيانات المتاحة للجمهور
وصف لأي قيود على توفر البيانات
بالنسبة لمجموعات البيانات السريرية أو بيانات الطرف الثالث، يرجى التأكد من أن البيان يتماشى مع سياستنا.
البحث الذي يتضمن مشاركين بشريين، بياناتهم، أو مواد بيولوجية
معلومات السياسة حول الدراسات التي تشمل مشاركين بشريين أو بيانات بشرية. انظر أيضًا معلومات السياسة حول الجنس، الهوية/التقديم الجنسي، والتوجه الجنسي والعرق، والعرقية والعنصرية.
التقارير عن الجنس والنوع الاجتماعي
تم تجنيد المرضى دون اعتبار للجنس، وتم تضمين الملفات الديموغرافية في الجدول البياني الممتد 1 والشكل التوضيحي التكميلي 6.
التقارير عن العرق أو الإثنية أو غيرها من المجموعات الاجتماعية ذات الصلة
تم تجنيد المرضى دون اعتبار للعرق أو الإثنية.
خصائص السكان
تم تلخيص الخصائص السكانية التفصيلية في الجدول الإضافي 1.
التوظيف
تم تجنيد ما مجموعه 206 موضوعًا (172 تم تشخيصهم بالتهاب الجيوب الأنفية المزمن مع وجود زوائد أنفية و34 مع انحراف الحاجز الأنفي) من قسم الأنف والأذن والحنجرة والحساسية في مستشفى بكين تونغ رين من عام 2011 إلى 2024. تم استبعاد المرضى الذين يعانون من نقص المناعة، أو الحمل، أو التهاب الجيوب الأنفية المزمن بدون زوائد أنفية، أو التهاب الجيوب الأنفية الفطري التحسسي، أو التليف الكيسي، أو الذين تناولوا الكورتيكوستيرويدات الفموية قبل 4 أسابيع من الجراحة من الدراسة. تم تجنيد المرضى عشوائيًا من العيادة مع معايير شاملة واستبعاد متسقة لتقليل انحياز الاختيار الذاتي.
رقابة الأخلاقيات
تمت الموافقة على الدراسة من قبل لجنة الأخلاقيات الطبية في مستشفى بكين تونغ رين (TREC2009-27 و TRECKY2019-027 و TREC2022-KY127). قدم جميع المشاركين موافقة خطية مستنيرة.
يرجى ملاحظة أنه يجب أيضًا تقديم معلومات كاملة حول الموافقة على بروتوكول الدراسة في المخطوطة.
التقارير المتخصصة في المجال
يرجى اختيار الخيار أدناه الذي يناسب بحثك بشكل أفضل. إذا لم تكن متأكدًا، اقرأ الأقسام المناسبة قبل اتخاذ قرارك. علوم الحياة □ العلوم السلوكية والاجتماعية □ العلوم البيئية والتطورية والبيئية لنسخة مرجعية من الوثيقة بجميع الأقسام، انظرnature.com/documents/nr-reporting-summary-flat.pdf
تصميم دراسة العلوم الحياتية
يجب على جميع الدراسات الإفصاح عن هذه النقاط حتى عندما يكون الإفصاح سلبياً.
حجم العينة
تم تجميع البيانات من 2-4 تجارب مستقلة. لكل تجربة، تم تضمين ما لا يقل عن حيوانين في كل مجموعة. تم اختيار حجم العينة تجريبيًا لتوفير مستوى كافٍ من القوة الإحصائية لاكتشاف التأثيرات البيولوجية المشار إليها. لم تُستخدم أي طرق إحصائية لتحديد حجم العينة مسبقًا.
استثناءات البيانات
في تحليلات الخلايا الفردية، تعبر تجمعات الخلايا التي تعبر عن نسبة متوسطة تزيد عنتم استبعاد الجينات الميتوكوندرية. تم إزالة الجينات المرتبطة بـ TCR من مصفوفة تعبير الجينات في الأنسجة.مجموعات الخلايا.
التكرار
تم تكرار جميع التجارب على الأقل مرتين، وكانت النتائج التجريبية قابلة للتكرار عبر التجارب المستقلة المتكررة كما هو موضح.
العشوائية
للتجارب في الشكل 8 من البيانات الموسعة والشكل 9 من الملحق، تم تخصيص الحيوانات المتطابقة في الجنس والعمر لمجموعات تجريبية مختلفة بناءً على جينها. للتجارب في الشكل 5، الشكل 7a-d من البيانات الموسعة، 9، 10، كانت الحيوانات من النوع المحدد
مُعَمي تم إجراء تحليلات لبيانات الكيمياء المناعية لأنسجة الأنف البشرية بواسطة باحثين غير مطلعين على معلومات المرضى. تم إجراء اختبارات وظائف الرئة في الفئران بواسطة باحثين غير مطلعين على تخصيص المجموعات. بالنسبة للتحليلات الأخرى التي كانت تعتمد على قياسات آلية ذات طابع شخصي، لم يتم تنفيذ التعمية.
التقارير عن مواد وأنظمة وطرق محددة
نحتاج إلى معلومات من المؤلفين حول بعض أنواع المواد والأنظمة التجريبية والأساليب المستخدمة في العديد من الدراسات. هنا، يرجى الإشارة إلى ما إذا كانت كل مادة أو نظام أو طريقة مدرجة ذات صلة بدراستك. إذا لم تكن متأكدًا مما إذا كان عنصر القائمة ينطبق على بحثك، يرجى قراءة القسم المناسب قبل اختيار رد.
المواد والأنظمة التجريبية
طرق
غير متوفر
مشارك في الدراسة □ ChIP-seq □ □ تحليل تدفق الخلايا
تصوير الأعصاب القائم على الرنين المغناطيسي X □
الأجسام المضادة
الأجسام المضادة المستخدمة
مضاد-C3 (Abcam، النسخة EPR19394، رقم الكاتالوج ab200999، رقم الدفعة 1071557-4؛ تخفيف 1:2000); مضاد C3a/C3a-desArg (Hycultbiotech، النسخة 2991، الرقم المرجعي HM2074؛ تخفيف 1:50); مضاد DMBT1 (سانتا كروز، النسخة G-4، رقم الكاتالوج sc-514566، رقم الدفعة H0417؛ تخفيف 1:1000); مضاد ACTB (سانتا كروز، النسخة C-4، رقم الكاتالوج sc-47778؛ تخفيف 1:1000); جلوبيولين المناعي من الماعز المضاد للفأر IgG (H+L) الموسوم بـ HRP (بيوتايم للتكنولوجيا الحيوية، رقم الكاتالوج A0216؛ تخفيف 1:1000); الأجسام المضادة الموجهة ضد الأرانب IgG (H+L) المعلمة بـ HRP (بيوتايم للتكنولوجيا الحيوية، رقم الكاتالوج A0208؛ تخفيف 1:1000); زومبي أصفر (بايو ليجند، رقم الكاتالوج# 423103، رقم الدفعة# B353069؛ تخفيف 1:200); PerCP-Cy5.5-مضاد-CD45 (BioLegend، النسخة HI30، رقم الكاتالوج 304028، رقم الدفعة B372674؛ تخفيف 1:100); PE-مضاد-CD8 (BioLegend، النسخة HIT8a، الرقم المرجعي# 300908، الدفعة#B295356؛ تخفيف 1:100); APC-Cy7-مضاد-CD56 (BioLegend، النسخة HCD56، رقم الكاتالوج 318332، رقم الدفعة B345905؛ تخفيف 1:100); PE-cy7-مضاد-KLRG1 (BioLegend، النسخة SA231A2، رقم الكاتالوج 367720، رقم الدفعة B350957؛ تخفيف 1:100); PE-Cy5-مضاد-KLRC1 (BioLegend، النسخة S19004C، رقم الكاتالوج 375112، رقم الدفعة B361184؛ تخفيف 1:100); FITC-مضاد-ITGAE (BioLegend، النسخة Ber-ACT8، الرقم المرجعي# 350204، الدفعة#B285459؛ تخفيف 1:100); BV421-مضاد-CD27 (BioLegend، النسخة O323، الرقم المرجعي# 302824، الدفعة# B357638؛ تخفيف 1:100); AF647-مضاد-GZMB (BioLegend، النسخة GB11، الرقم المرجعي# 515406؛ الدفعة#B367007؛ تخفيف 1:100 لـ FACS، 1:50 لـ IHC); AF700-مضاد-CD11c (BD، النسخة HL3، الرقم المرجعي# 560583، الدفعة# 1351655؛ تخفيف 1:200); eFluor660-anti-CD3 (eBioscience، النسخة 17A2، رقم الكاتالوج 50-0032-82، رقم الدفعة 2151974؛ تخفيف 1:200); APC-مضاد-I-Ab (Biolegend، النسخة AF6-120.1، رقم الكاتالوج 116417، رقم الدفعة B278593؛ تخفيف 1:200); FITC-مضاد-Ly6G (BD، النسخة IA8، رقم الكاتالوج 551460، رقم الدفعة 3152809؛ تخفيف 1:200); PE-Cy7-مضاد-CD11b (BD، النسخة M1/70، رقم الكاتالوج 552850، رقم الدفعة 0279638؛ تخفيف 1:200); PE-مضاد-Siglec-F (BD، النسخة E50-2440، رقم الكاتالوج 552176، رقم الدفعة 1243777؛ تخفيف 1:200); APC-Cy7-مضاد-CD8 (Biolegend، النسخة 53-6.7، رقم الكاتالوج 100714؛ تخفيف 1:200); Percp-Cy5.5-anti-CD4 (BD، النسخة RM4-5، رقم الكاتالوج 550954، رقم الدفعة 7221859؛ تخفيف 1:200); PE-مضاد-GZMK (BioLegend، النسخة GM26E7، الرقم المرجعي# 370512؛ الدفعة#B350689؛ تخفيف 1:100 لـ FACS، 1:50 لـ IHC); APC-مضاد-CD8 (eBioscience، OKT8؛ رقم الكاتالوج#17008642؛ رقم الدفعة#E12279-1634؛ تخفيف 1:50 للتلوين المناعي النسيجي); FITC-مضاد-KLRG1 (BioLegend، النسخة 2F1/KLRG1، رقم الكاتالوج 138410؛ رقم الدفعة B335443؛ تخفيف 1:50 للتلوين المناعي النسيجي); APC-مضاد-CD4 (BioLegend، النسخة OKT4، الرقم المرجعي# 317415، الدفعة# B323079؛ تخفيف 1:50 للتلوين المناعي النسيجي); FITC-مضاد-PTGDR2 (BioLegend، النسخة BM16، الرقم المرجعي# 350108؛ الدفعة#B340164؛ تخفيف 1:50 للتلوين المناعي النسيجي); FITC-مضاد-CD107a (LAMP-1) (Biolegend، النسخة H4A3، الرقم المرجعي# 328605؛ الدفعة#B367979؛ تخفيف 1:100 لفحص FACS); FITC-مضاد المكمل C3b/iC3b (Biolegend، النسخة 3E7/C3b، رقم الكاتالوج 846108؛ رقم الدفعة B368703؛ تخفيف 1:50 للتلوين المناعي النسيجي); مضاد CD3 (Bioxcell، النسخة OKT-3، الرقم المرجعي BE0001-2، الدفعة رقم 809022M2؛ تخفيف 1:1000 للتحفيز); مضاد CD28 (Bioxcell، النسخة 9.3، الرقم المرجعي BE0248، الدفعة رقم 808322S1؛ تخفيف 1:1000 للتحفيز); مضاد فوسفو-p44/42 MAPK (Erk1/2) (Thr202/Tyr204) (تكنولوجيا إشارات الخلايا، الرقم المرجعي 9101؛ تخفيف 1:1000 للاستخدام في WB); مضاد p44/42 MAPK (Erk1/2) (تكنولوجيا إشارات الخلايا، النسخة 137F5، رقم الكاتالوج 4695؛ تخفيف 1:1000 للاستخدام في WB); مضاد SET (Abcam، النسخة EPR12973، رقم الكاتالوج ab181990، رقم الدفعة 1011929-13؛ تخفيف 1:10000); مضاد GZMK (Abcam، النسخة EPR24601-164، رقم الكاتالوج ab282703، رقم الدفعة GR3398831-6؛ تخفيف 1:10000); مضاد C2 (Abcam، النسخة EPR17979، رقم الكاتالوج ab209900، رقم الدفعة GR260627-5؛ 1:2000); مضاد C4α (سانتا كروز، النسخة C-2، الرقم المرجعي sc-271181، الدفعة L2718؛ تخفيف 1:2000); مضاد C5a/C5a-desArg (Abcam، النسخة C17/5، رقم الكاتالوج ab303662، رقم الدفعة 1025363-2؛ تخفيف 1:1000); APC-H7-مضاد-CD19 (BD، النسخة SJ25C1، رقم الكاتالوج 560177، رقم الدفعة 7142860؛ تخفيف 1:100); BV711-مضاد-CD8 (BD، النسخة RPA-T8، الرقم المرجعي#563677، الدفعة#9129574؛ تخفيف 1:100).
معلومات السياسة حول خطوط الخلايا والجنس والنوع في البحث
مصدر(s) خط الخلايا
المصادقة
تلوث الميكوبلازما الخطوط التي يتم التعرف عليها بشكل خاطئ بشكل شائع (انظر سجل ICLAC)
تم الحصول على خلايا 293-F من شركة ثيرمو فيشر؛ وتم الحصول على خلايا THP-1 من البنية التحتية الوطنية لموارد خطوط الخلايا في الصين. تم التحقق من خطوط الخلايا واختبارها سلبية لتلوث الميكوبلازما من قبل المزودين.
لم يتم اتخاذ أي إجراء محدد للتحقق من هوية خط الخلايا. تم اختبار خط الخلايا سلبياً لوجود تلوث بالميكوبلازما.
سلالة الخلايا المستخدمة في هذه الدراسة ليست عادةً مُعرّفة بشكل خاطئ.
الحيوانات وغيرها من الكائنات البحثية
معلومات السياسة حول الدراسات التي تشمل الحيوانات؛ إرشادات ARRIVE الموصى بها للإبلاغ عن أبحاث الحيوانات، والجنس والنوع في البحث
الحيوانات المخبرية
الحيوانات البرية
الفئران المستخدمة في هذه الدراسة تنتمي إلى خلفية C57BL/6J. تم تربية جميع الحيوانات في مجموعات من 4 إلى 6 أفراد لكل قفص وتحت ظروف خالية من مسببات الأمراض المحددة. تم تربية الفئران في هواء مُرشح، وطعام حبيبي معقم، ونظام مياه مُحمض، ونظام إضاءة لمدة 12 ساعة.دورة مظلمة. تم الحفاظ على درجة الحرارة عندورطوبة عندتمت الموافقة على جميع تجارب الحيوانات من قبل لجنة رعاية واستخدام الحيوانات المؤسسية وفقًا للإرشادات الحكومية وإرشادات جامعة تسينغوا لرعاية الحيوانات. تم استخدام الحيوانات من نفس القمامة والحيوانات التي تعيش معًا بين 6 و 12 أسبوعًا من العمر في التجارب.
لم تتضمن الدراسة حيوانات برية.
التقارير عن الجنس بشكل عام، تم تضمين كل من الحيوانات الأنثوية والذكورية في الدراسة دون تحيز في الاختيار. في اختبارات وظيفة الرئة، تم تجميع البيانات من ذكور الفئران فقط بسبب الاختلافات القائمة على الجنس في المعايير ذات الصلة.
عينات تم جمعها من الميدان لم تتضمن الدراسة عينات تم جمعها من الميدان.
رقابة الأخلاقيات تمت الموافقة على جميع التجارب من قبل لجنة رعاية واستخدام الحيوانات في جامعة تسينغhua. يرجى ملاحظة أنه يجب أيضًا تقديم معلومات كاملة حول الموافقة على بروتوكول الدراسة في المخطوطة.
تدفق الخلايا
المؤامرات
أكد أن: توضح تسميات المحاور العلامة والفلوركروم المستخدم (مثل CD4-FITC). المقاييس على المحاور واضحة تمامًا. قم بتضمين الأرقام على المحاور فقط للرسم البياني في أسفل اليسار من المجموعة (المجموعة هي تحليل للعلامات المتطابقة). جميع الرسوم البيانية هي رسوم بيانية متساوية الارتفاع مع نقاط شاذة أو رسوم بيانية بالألوان الزائفة. تم توفير قيمة عددية لعدد الخلايا أو النسبة المئوية (مع الإحصائيات).
المنهجية
تحضير العينة
لتحليل العينات البشرية، تم إعداد تعليقات خلوية مفردة من الأنسجة الأنفية، وتم حجبها باستخدام مواد TruStain البشرية (Biolegend) في محلول FACS (PBS مع 1% من FBS و5 مليمول EDTA) وتم صبغها بأجسام مضادة سطحية ومواد أخرى كما هو موضح. بالنسبة لبعض التحليلات، تم تثبيت الخلايا وتمريرها باستخدام مجموعة Cytofix/Perm (BD) وتم صبغها بأجسام مضادة تستهدف المستضدات داخل الخلوية. بالنسبة للدراسة الفأرية، تم أولاً حضانة الخلايا من سائل غسل القصبات الهوائية مع أجسام مضادة 2.4 G 2 في محلول FACS، وتم صبغها بالمواد كما هو موضح.
تم الحصول على البيانات باستخدام جهاز قياس الخلايا Aurora (Cytek) أو جهاز FACSAria III (BD Biosciences).
تمت معالجة وتحليل جميع بيانات تحليل تدفق الخلايا باستخدام FlowJo (الإصدار 10، TreeStar).
تم الحصول على ما لا يقل عن 10,000 حدث للخلايا في البوابات المحددة.
تم استخدام بوابات FSC-A/ SSC-A لتحديد الخلايا القابلة للحياة في جميع التجارب. تم تحديد الخلايا الفردية باستخدام بوابات FSC-H/ FSC-W. تم استخدام ضوابط النوع لتفريق بين الأحداث الخلفية والأحداث الإيجابية للعلامة.
قم بتحديد هذا المربع لتأكيد أنه تم تقديم رقم يوضح استراتيجية البوابة في المعلومات التكميلية.
آلة
برمجيات
وفرة تجمع الخلايا
استراتيجية البوابة
قسم الأنف والأذن والحنجرة وجراحة الرأس والعنق، مستشفى بكين تونغ رن، جامعة الطب الرأسمالي، بكين، الصين.مختبر بكين الرئيسي لأمراض الأنف، معهد بكين لأمراض الأنف والأذن والحنجرة، بكين، الصين.مختبر المناعة الديناميكية الحيوية، معهد المناعة، جامعة تسينغhua، بكين، الصين.مركز تسينغhua-بكين لعلوم الحياة، بكين، الصين. مدرسة علوم الحياة، جامعة تسينغhua، بكين، الصين.كلية العلوم الطبية الأساسية، طب تسينغhua، جامعة تسينغhua، بكين، الصين.قسم الحساسية، مستشفى بكين تونغ رن، جامعة الطب الرأسمالي، بكين، الصين.مختبر تشانغبينغ، بكين، الصين.مختبر العلوم الجديد في زاوية الحجر، كلية الطب بجامعة تسينغhua، بكين، الصين. مركز بكين للبحوث المتقدمة في الهيكل البيولوجي، جامعة تسينغhua، بكين، الصين.مختبر بكين الرئيسي للبحوث المناعية حول الأمراض المزمنة، جامعة تسينغhua، بكين، الصين.مركز الابتكار التعاوني للطب الحدودي SXMU-جامعة تسينغhua، جامعة شاني الطبية، تاييوان، الصين.ساهم هؤلاء المؤلفون بالتساوي: فنغ لان، جيزهو لي، وينشوان مياو، في سون.البريد الإلكتروني: xil2020@tsinghua.edu.cn; jianbinwang@tsinghua.edu.cn; dr.luozhang@139.com; qihai@tsinghua.edu.cn
ماتوس، تي. آر. وآخرون. الآفات الصدفية التي تم حلها سريرياً تحتوي على نسخ من خلايا T ألفا بيتا المنتجة لـ IL-17 الخاصة بالصدفية. ج. كلين. إنفست. 127، 4031-4041 (2017).
كاموس، م. وآخرون. التوسع الأوليغوكلاوني لخلايا T المخاطية في مرض كرون يهيمن على خلايا CD4 T التي تعبر عن NKG2D. مناعة مخاطية. 7، 325-334 (2014).
مورغان، دي. إم. وآخرون. خلايا TH2 الفعالة المسببة للأمراض التي تعبر عن GPR15 والمتوسعة بشكل نسلي مرتبطة بالمريء اليوزيني. ساينس. إيمونول.https://doi.org/10.1126/ sciimmunol.abi5586 (2021).
مؤشر كتلة الجسم؛ CT، التصوير المقطعي المحوسب؛ HPF، مجال التكبير العالي؛ IQR، النطاق الربعي.
Feng Lan , Jizhou , Wenxuan Miao , Fei Sun , Su Duan , Yabing Song , Jiacheng Yao , Xiangdong Wang , Chengshuo Wang , Xin Liu , Jianbin Wang , Luo Zhang & Hai Qi
Inflammatory diseases are often chronic and recurrent, and current treatments do not typically remove underlying disease drivers . T cells participate in a wide range of inflammatory diseases such as psoriasis , Crohn’s disease , oesophagitis and multiple sclerosis , and clonally expanded antigen-specific T cells may contribute to disease chronicity and recurrence, in part by forming persistent pathogenic memory. Chronic rhinosinusitis and asthma are inflammatory airway diseases that often present as comorbidities . Chronic rhinosinusitis affects more than of the general population . Among these patients, would develop nasal polyps, which often require repeated surgical resections owing to a high incidence of recurrence . Whereas abundant T cells infiltrate the nasal polyps tissue cell subsets that drive the disease pathology and promote recurrence are not fully understood. By comparing T cell repertoires in nasal polyp tissues obtained from consecutive surgeries, here we report that persistent CD8 T cell clones carrying effector memory-like features colonize the mucosal tissue during disease recurrence, and these cells characteristically express the tryptase Granzyme K (GZMK). We find that GZMK cleaves many complement components, including C2, C3, C4 and C5, that collectively contribute to the activation of the complement cascade. GZMK-expressing CD8 cells participate in organized tertiary lymphoid structures, and tissue GZMK levels predict the disease severity and comorbidities better than well-established biomarkers such as eosinophilia and tissue interleukin-5. Using a mouse asthma model, we further show that GZMK-expressing cells exacerbate the disease in a manner dependent on the proteolytic activity of GZMK and complements. Genetic ablation or pharmacological inhibition of GZMK after the disease onset markedly alleviates tissue pathology and restores lung function. Our work identifies a pathogenic memory T cell subset that promotes tissue inflammation and recurrent airway diseases by the effector molecule GZMK and suggests GZMK as a potential therapeutic target.
To determine whether T cell memory is involved in the recurrence of nasal polyps (NPs), we first searched for shared T cell clones in samples obtained from repeated surgeries (Fig.1a,b). T cell repertoire analyses were performed using paired frozen samples from six patients (NP1-6), with intervals between two surgeries ranging from 0.2 to 3.1 years. Nasal tissues from seven patients undergoing septoplasty were included as healthy controls (HC1-7) (Fig. 1b and Supplementary Table 1). Single transcripts of T cell receptors (TCRs) and were barcoded and sequenced, and the full-length variable regions were assembled and assigned to different clones (Fig. 1a and Supplementary Fig. 2a,b). As
expected, T cell repertoires were distinct among individuals, with only 5 out of 1,585 TCRα and 1 out of 3,888 of TCR chains being shared between different patients (Supplementary Fig. 2c). On the contrary, we consistently identified common TCRα and TCR chains in NP tissues obtained from the two surgeries on the same patient (Fig. 1c and Supplementary Fig. 2d), suggesting that cells of the same clonal lineages recolonized the NP tissue during disease recurrence. Moreover, some of the persisting clones were among the most dominant ones in both surgical samples (Fig. 1c and Supplementary Fig. 2), suggesting local proliferation and expansion.
Fig. 1 | Persisting T cell clones in recurrent NP. a, Workflow for analysis of surgically removed nasal tissues.RT, reverse transcription.b, Overview of surgical intervals for paired samples. See Extended Data Table 1 for more patient information.c, Persistent clones, identified by matched TCR sequences, found in paired surgical samples by bulk sequencing analyses. Each symbol represents a single clone. UMI, unique molecular identifier.d,e, UMAP visualization of T cell clusters (T0-T14) found in NP tissues (d) and their relative abundances in
each individual (e). f,g, Persistent T cell clones in patients NP11-13. f, Clones with both TCRα and chains identified in paired samples are superimposed on the UMAP of total T cells from the same patient. Only the top ten clones are shown.g, Abundance and cluster composition of individual persistent clones detected in the scRNA-seq analysis of the most recent NP resection (top) and bulk-seq analysis of the previous resection (bottom). Clones are ranked and numbered by their abundance in the scRNA-seq data.
To explore the possibility that clonal T cell populations might contribute to disease pathology and recurrence, we conducted single-cell messenger RNA sequencing (scRNA-seq) of total CD45 cells from seven NP (NP7-13) and four HC surgical samples (HC6, 8, 9 and 10) (Fig. 1a,b and Supplementary Table 1). Three of the seven NP patients (NP11-NP13) underwent the second surgery to treat their NP relapse at the time of the study, and their previous NP biopsies from the first surgery were cryogenically (cryo)-preserved. By comparing TCR sequences from the two NP biopsies for each of these three patients, we can identify common clones of T cells (Fig. 1b). A total of 42,466 immune cells were included in the analysis and clustered according to their transcriptomes; subsets of lymphocytes, dendritic cells, monocytes and mast cells were identified by respective signature gene expression (Extended Data Fig. 1a,b). After full-length variable regions of TCRs were assembled (Extended Data Fig. 1c), T cells bearing functional receptors could be clustered into diverse subsets in both HC and NP tissues (Fig. 1d,e, Extended Data Fig. 1d,e and Supplementary Table 2). As expected, the abundance of the T helper 2 cell ( ) (T14) subset, a known disease driver, was significantly increased in patients with NP compared to the HC group (Extended Data Fig. 1f). In addition, one subset (T1) and four T cell subsets (T2, T7, T8 and T12) were also more abundant in NP than in HC tissues (Extended Data Fig. 1f).
We identified 24,44 and 48 shared T cell clones in patients NP11-NP13, respectively. Most of those shared clones were mapped to T0 and T1, two cell subsets, instead of cells (Figs. 1f,g and 2a). Thus, NP recurrence seems to be accompanied by tissue colonization of CD8 T cell clones already present in the previous disease episode. Given that the two surgeries were at least 7 months apart, those T cells are probably derived from disease-associated memory cells. For simplicity, we call these shared clones persistent clones.
cell subset correlates with disease severity
We further profiled T cell subsets containing those persistent clones. TO cells showed a conventional resident memory T ( ) cell phenotype, expressing genes essential for tissue residency, such as ITGAE, CD69, PRDM1, ZNF683 and RUNX3 (ref. 12). The T1 subset contained relatively few cells but many expressing effector memory T cell ( ) markers including KLRG1 and CD27 (Fig. 2a and Extended Data Fig.1e). On the other hand, these cells did not highly express genes associated with effector functions, such as TBX21 and CX3CR1. T1 cells also expressed a relatively high level of EOMES, a transcription factor associated with long-term persistence (Extended Data Fig.1e). These data indicate that persistent clones are mostly and -like cells.
To validate whether these residence- and effector-associated surface markers of TO and T1 could be used for distinguishing them by flow cytometry, we sort-purified different T cell subsets from NP tissues (NP14) and performed scRNA-seq analyses (Extended Data Fig. 2a). When mapped onto the reference dataset (Fig.1d), the sorted population mainly contained TO cells, whereas and cells were mainly mapped to the T1 cluster (Extended Data Fig. 2b,c).
Next, we compared relative abundance of TO-corresponding KLRC1 ITGAE cells, T 1 -corresponding ITGAE and T1-corresponding -like cells in HC and NP tissues. We further stratified NP tissues by disease severity, with cases of recurrent NP or comorbid asthma defined as severe NP (svNP). We found the abundance of the ITGAE subset significantly decreased in patients with NP, whereas the abundance of total T1-corresponding KLRG1 cells increased. The resident T1 fraction, those ITGAE cells, progressively increased with disease severity, being more abundant in svNP than in NP (Fig. 2b-c).
In an attempt to predict potential antigens recognized by T1 cells, we integrated 37,483 annotated TCRs from public databases with 1,311 T1 TCRs identified in our own dataset, and performed network
analyses using the GLIPH2 algorithm . Our results identified 36 major TCR clusters, among which 27 involved TCRs with known antigens, including viral proteins, self-antigens and gliadin, a frequently identified allergen in humans (Supplementary Fig. 3).
Tissue T1 cells and the circulating compartment
Most T1 cells are ITGAE . To test the relationship of T1 to T cells in circulation, we sorted peripheral blood CD8 T cells from patients NP11 and NP13 to perform scRNA-seq and TCR analyses (Extended Data Fig. 2d). A total of 10,897 blood CD8 T cells were analysed and clustered into 14 different subsets on the basis of transcriptomic features (BO-B13; Fig. 2d and Supplementary Table 3), revealing a general pattern of cell clustering very similar between the two patients. On the basis of TCR sequences, we found several clones in the blood matching clones populating tissue T1 cells in both patients (Fig. 2e and Supplementary Fig. 4a). Most such blood cells were in the B2 subset, with a few found in B4 and B6 as well (Supplementary Fig. 4b). Some of these clones shared between the blood and NP tissues were persistent clones already seen in NP tissues preserved from the first surgery (Fig. 2f). Among all blood cells, the B 2 cluster was the one most similar to tissue T1 cells (Fig. 2g and Supplementary Fig. 4c), however, they lacked the expression of signatures and expressed higher levels of genes associated with T cell stemness, such as TCF7, IL7R and SELL (Supplementary Fig. 4d). Therefore, T1 cells in NP tissues are probably derived from blood B2 cells, a model also supported by pseudotime analyses (Supplementary Fig. 5a,b).
Taken together, our data support the idea that persistent clones from a T cell memory reservoir can be continuously deployed into the tissue, potentially promoting disease pathology and recurrence.
Tissue cells highly express GZMK
Next, we carefully searched for effector molecules that may be used by those T1 cells in the disease process. Type 2 cytokines (for example, IL-4, IL-5 and IL-13) promote eosinophil recruitment, tissue remodelling and B cell activation in the airway, representing the most well-established drivers of chronic rhinosinusitis and asthmatic tissue pathology . However, T1 cells expressed almost no mRNA for type 2 cytokines (Fig. 3a). Granzymes are important effector molecules expressed by CD8 cells. Among all cells in NP tissues, T1 cells uniquely expressed a high level of Granzyme K (GZMK) transcripts (Fig. 3b). GZMK-expressing T cells have been found in ageing-related inflammation and various inflammatory diseases . By intracellular staining, GZMK was highly expressed in both ITGAE and ITGAE fractions of T1 cells but not in TO cells (Fig. 3c). GZMK were secreted by these cells on TCR stimulation (Extended Data Fig. 3). Besides T cells, GZMK was also expressed by a small subset of natural killer cells (Extended Data Fig.1b,d and Fig. 3c) that were significantly increased in patients with svNP, although these cells were less abundant compared to GZMK-expressing T1 cells (Extended Data Fig. 2e,f and Fig. 3c). To explore the potential role of GZMK in NP pathogenesis, we analysed the nasal tissues from a cohort of 148 patients ( 21 HC, 62 NP and 65 svNP) with balanced age and sex representation (Supplementary Fig. 6a-d), and found that tissue but not serum GZMK protein levels were elevated in NP and furthermore in svNP (Fig. 3d and Supplementary Fig. 6e). Tissue GZMK levels represented a risk factor for svNP as predicted by a multiple linear regression model adjusted for sex, age and body mass index (Extended Data Table 2). In fact, tissue GZMK levels were a better predictive biomarker for svNP than tissue eosinophilia and IL-5 levels, two well-established risk factors for svNP (Fig. 3e). In addition, the levels of GZMK positively correlated with the abundance of tissue eosinophils in patients with svNP (Supplementary Fig. 2a). Taken together, these data support the possibility that cells may exacerbate airway inflammation and promotes recurrent airway diseases by the effector enzyme GZMK.
Fig. 2 | CD8 T cell subsets in association with NP recurrence. a, Dot plots showing the expression of selected surface markers by different T cell clusters. Dot size and colour intensity indicate the percentage and the level of expression, respectively. b,c, Representative FACS plots (b) and summary statistics (c) of indicated T cell subsets found in HC ( ), patients with NP ( ) and patients with svNP . values by two-sided Mann-Whitney tests. d, UMAP
showing 14 peripheral blood cells clusters (B0-13). Cells isolated from NP11 and NP13 are shown, respectively. e, Clones commonly found in tissue and blood T cells, projected onto total tissue T cells from the same individual. f, Abundance and cluster composition of clones found in the blood and paired surgical samples. Clones are numbered as in Fig. 1g.g, Heat maps showing Spearman’s correlation coefficient between T0,T1 and blood CD8 cell clusters.
GZMK cleaves C3 to release anaphylatoxin
To investigate whether and how GZMK might promote inflammation, we profiled its potential substrates in NP tissues. To this end, we expressed recombinant wild-type human GZMK and its inactive Ser -to-Ala mutant (GZMK-S214A) in 293-F cells (Extended Data Fig. 4a). Their respective enzymatic activity and inactivity were confirmed in vitro
using surrogate substrates (Extended Data Fig. 4b,c). Subsequently, we immunoprecipitated potential GZMK substrates by incubating GZMK-S214A-bound beads with NP tissue lysates obtained from three patients who underwent surgical NP removal. Through analysis of pulled-down proteins by liquid chromatography-mass spectrometry (Fig. 4a,b), we identified 161, 1,300 and 3,116 GZMK-associated proteins from those three patients (NP15-17), respectively (Fig. 4c and
Supplementary Tables 1 and 4). Among those 56 proteins shared by all patients, known substrates of GZMK were present, including SET, HNRNPK and TUBB (Fig. 4c,d). We confirmed the cleavage of SET by performing an in vitro digestion assay using the wild-type GZMK (Extended Data Fig. 4d). Furthermore, we confirmed the cleavage of a newly identified substrate, DMBT1, which was shown to reduce inflammation in a mouse rhinitis model (Extended Data Fig. 4e).
Complement C3 was among new substrates identified. Given its central position in the complement cascade and prominent role in promoting inflammation, we characterized its activation by GZMK in detail. Using serum-purified C3 as the testing substrate, we found that GZMK readily cleaved C3 (Fig. 4e,f), showing a C3-converting efficiency at 35% of the classical C3 convertase C4b2a (Extended Data Fig. 4f,g). By Edman sequencing and immunoblots, we confirmed that the cleavage site was at in the chain of C 3 , leading to the release of C 3 a (Fig. 4e,f), a potent inflammation mediator that has been implicated in inflammatory airway diseases . We further verified that GZMK-converted C3a induced comparable levels of ERK phosphorylation in THP1 cells as did serum-purified C3a or C4b2a-converted C3a (Extended Data Fig. 4h-j). Combined, these data establish that GZMK can function as a C3-activating protease to generate active C3a capable of promoting inflammation.
Because several complement proteins were identified as potential substrates in the GZMK-S214A-interactome (Supplementary Table 4), we further tested whether GZMK could target several steps in the complement cascade. By using serum-purified complement proteins as substrates, we found that GZMK was able to cleave C2 into C2a and C2b (Extended Data Fig. 5a-c), and C4 into C4a and C4b (Extended Data Fig. 5d-f). Therefore, GZMK can also in principle promote the formation of the classical C3 convertase C4b2a. Furthermore, GZMK
can cleave C5 (Extended Data Fig. 5g-i) in an unconventional way to enhance the activity of the membrane attack complex (Extended Data Fig. 5j). Therefore, GZMK is a pro-inflammatory effector molecule that can function by activating the complement cascade.
GZMK T cells associate with inflammatory aggregates
We next performed immunohistochemistry analysis of nasal tissues from HC and patients with NP. Whereas very few CD8 T cells were found in HC , large numbers of cells, including those expressing GZMK, were found in NP tissues, particularly from patients suffering from more severe diseases; many of those cells formed aggregates around blood vessels, reminiscent of tertiary lymphoid structures (Extended Data Fig. 6a-c). In addition, C3 was more abundantly present in GZMK cell aggregate areas (Supplementary Fig. 7a,b), suggestive of in situ C3 conversion by GZMK. To characterize inflammatory contents in these aggregates of GZMK-expressing CD8 cells, we excised aggregate-containing tissues by laser-capture microdissection and performed bulk mRNA sequencing (Extended Data Fig. 6d-f). As expected, higher levels of and were found in areas than in tissue areas that contained few cells (Extended Data Fig. 6g and Supplementary Fig. 7c,d). Areas rich in GZMK-expressing cells also contained higher levels of transcripts associated with cells, B cells and myeloid cells (Extended Data Fig. 6 g and Supplementary Table 5), but not and regulatory T cells (Supplementary Fig. 7e). Cell aggregate regions also contained higher levels of chemokines and chemokine receptors important for inflammatory cell recruitment (for example, CXCR3, CXCR4, CCL4 and CCL5) and for organization of tertiary lymphoid structures (for example, CCR7, CXCR5 and their respective ligands) ; higher levels of inflammatory cytokines
Fig. 4 | Identification of GZMK substrates. a, Workflow for the GZMK pull-down assay.b, Representative Coomassie Blue-stained gel showing proteins pulled down by enzymatically inactive GZMK-S214A. Data are representative of three independent experiments using different samples from patients.c, Unique and overlapping GZMK-interacting proteins identified in patients NP15-17. d, Dot plots showing the normalized abundance and SEQUEST scores of the 56 common GZMK-interacting proteins found in all patients. See Methods for more details.
e, Cleavage of serum-purified C3 by GZMK. A Coomassie Blue-stained gel (left) and the schematic graph showing the cleavage site (right), as determined by Edman sequencing, are shown.S, serine;N, asparagine; L,leucine.f, Immunoblots showing GZMK cleavage of serum-purified C3. Data are representative of at least three independent experiments (e and f). Source images for gels and blots are presented in Supplementary Fig.1.
(for example, IL6, IL16,IL32 and IL27) were also seen in these aggregates (Extended Data Fig. 6g and Supplementary Table 5).
Overall, GZMK-expressing cells accounted for roughly of total cells in these aggregates (Extended Data Fig. 6g-i), where cells are also abundantly present (Extended Data Fig. 6h,j), suggesting that such structures might promote the crosstalk between these two pathways to promote disease pathogenesis. Statistical analyses using CellPhoneDB did not predict strong interactions between T cells and cells (Supplementary Fig. 8a). However, T 1 cells highly expressed the chemokine CCL5 and CCL4 (Supplementary Fig. 8b), which might help draw type 2 immune cells expressing CCR1, CCR3 or CCR5. Consistent with this notion, our analyses predicted that GZMK cells interact extensively with pro-inflammatory myeloid cells, such as macrophages and (ref.10) (Supplementary Fig. 8c-f), as these cells expressed matching pairs of chemokinechemokine receptors (Supplementary Fig. 8g). In addition, the C3a locally produced by GZMK could serve as a chemoattractant to type 2 effector cells expressing C3AR, including eosinophils and mast cells
(Supplementary Fig. 8h), which will in turn secrete cytokines and inflammatory mediators to promote tissue damage and type 2 immunity .
Disease-promoting effects of T cell-derived GZMK
To directly test whether GZMK from CD8 T cells promotes the airway inflammatory disease, we established a mouse asthma model using ovalbumin (OVA) as antigen. C57BL/6 mice were first immunized with OVA emulsified in 50% alum and lipopolysaccharide (LPS), and then challenged by inhalation of aerosolized OVA 1 week later. OVA inhalation was repeated twice to mimic disease recurrence, and fluorescence-activated cell sorting (FACS) analyses of bronchoalveolar lavage fluid (BALF) cells were performed 2 days after each challenge (Extended Data Fig. 7a,b). Diverse immune cell populations were recruited to the airway on OVA challenge, including eosinophils, neutrophils, cells, T cells and dendritic cells (Extended Data Fig. 7c). Gzmk expression was largely restricted to CD8 cells but almost undetectable in CD4 T cells, and was progressively increased with repeated OVA challenges
(Extended Data Fig. 7d). By scRNA-seq analyses we confirmed Gzmk expression in a subset of BALF CD8 T cells, and some of these Gzmk-expressing T cells also upregulated Itgae (Extended Data Fig. 7e,f), very similar to human NP tissue T1 cells.
Next, we took a loss-of-function approach to examine the development of airway inflammation in CD4-cre;Gzmk mice, which lack Gzmk in T cells (Extended Data Fig. 8a). Compared to the CD4-cre;Gzmk control, CD4-cre;Gzmk animals harboured significantly decreased numbers of eosinophils, neutrophils, CD4 T cells, dendritic cells and macrophages in BALF (Extended Data Fig. 8b). Lung function of these latter mice was improved, showing better tolerance towards induced airway constriction and reduced goblet cell hyperplasia (Extended Data Fig. 8c-e). Therefore, T cell-derived GZMK promotes inflammation in the airway.
To more directly evaluate the role of T cell-derived GZMK, we took two complimentary approaches. In the first set of experiments, we transferred cells together with or T cells into Trrb Tcrd recipient mice that lack T cells (Extended Data Fig. 8f). Following asthma induction, those mice reconstituted with cells had significantly lower numbers of eosinophils in the BALF (Extended Data Fig. 8g). In the second set of experiments, we adoptively transferred CD45.1 OVA-specific OT-I cells overexpressing GZMK, its inactive GZMK-S213A mutant or GZMB into congenic CD45.2 hosts and acutely induced asthma with OVA (Extended Data Fig. 9a,c). After a single dose of aerosolized OVA challenge, more eosinophil infiltration into the airway was found in recipients of GZMK-overexpressing OT-I cells, whereas OT-I cells overexpressing the inactive GZMK-S213A or GZMB failed to make a difference (Extended Data Fig. 9b,d). The expansion or accumulation of OT-I T cells were not affected by the overexpression of GZMB or GZMK (Extended Data Fig. 9b,d), indicating that activation and memory formation of these cells were not grossly altered. When adoptively transferred into mice, OT-I cells overexpressing GZMK could no longer promote eosinophil infiltration to the airway (Extended Data Fig. 9e,f), indicating that C3 is essential in the process, although immune deficiencies in these animals prevented us from investigation of more long-term effects. Taken together, our results indicate that CD8 T cell-derived GZMK promotes eosinophil infiltration to the airway by activating C3.
Alleviation of airway inflammation by targeting GZMK
To examine whether targeting GZMK may provide therapeutic benefits, we bred the strain with the Rosa26-CreERT2 strain, which enables tamoxifen-induced ablation. As shown in Fig. 5a, Rosa26-CreERT2;Gzmk mice were treated with tamoxifen after the priming immunization with OVA but before the first inhalation challenge (group B) or after the first but before the second inhalation challenge (group C). Control Rosa26-creERT2;Gzmk animals were also treated with tamoxifen (group A). Without tamoxifen treatment, Rosa26-creERT2;Gzmk and Rosa26-creERT2;Gzmk mice developed comparable airway inflammation (Supplementary Fig. 9). When Gzmk deletion was induced before any inhalation challenge, significantly fewer eosinophils, neutrophils, cells and dendritic cells were found in the BALF (Fig. 5b, comparing group B to A). When Gzmk deletion was induced after the first inhalation challenge but before a new episode of asthmatic attack, significantly fewer eosinophils and dendritic cells were found in BALF cells (Fig. 5b, comparing group C to A). To determine whether Gzmk deletion would lead to restoration of lung function, we measured forced expiration volumes in these three groups of mice on methacholine challenge. Compared to group A, both group B and group C mice had much improved lung functions (Fig. 5c) and reduced goblet cell hyperplasia (Fig. 5d,e).
Furthermore, we also tested whether pharmacological inhibition of GZMK could alleviate mouse asthma. Following asthma induction, treatment of these mice every 2 days with a synthetic
drug that potently inhibits both human and mouse GZMK activity, D-Phe-Pro-Arg-chloromethylketone (PPACK) , but not the GZMB inhibitor carbobenzoxy-Ile-Glu-Thr-Asp-fluoromethylketone (Z-IETD-FMK) significantly decreased eosinophil infiltration to the airway (Extended Data Fig. 10a-c). PPACK also significantly reduced goblet cell hyperplasia and improved lung function in mouse asthma (Extended Data Fig. 10d-f). Taken together, our data support that GZMK produced by cells is an important driver of airway inflammation and disease progression and that GZMK removal or inhibition could be a useful therapeutic strategy.
Discussion
In this study, we identified a subset of tissue-engrafted, like T cells that promote airway inflammation through its characteristic effector molecule GZMK. GZMK-expressing CD8 cells have been found in tumours and disease tissues of many autoimmune disorders such as rheumatoid arthritis and lupus nephritis . However, functional importance of these cells in disease pathology has not been defined. By both loss- and gain-of-function approaches in mouse asthma models, our study demonstrates a pivotal role for GZMK-expressing CD8 T cells in promoting airway inflammation. cells are known to play disease-promoting or regulatory roles in inflammatory disorders, primarily by GZMB-mediated killing of target cells. For example, GZMB-expressing CD8 T cells contribute to pathogenesis of type I diabetes by killing beta cells . On the other hand, a subset of GZMB-expressing T cells suppress autoimmunity by eliminating autoreactive CD4 cells . GZMK is not known as a major cytotoxic granzyme in T cell-mediated killing. Our work defines GZMK as a new complement cascade-activating protease, a finding that is also supported by a recent preprint . Previous research has identified the role of complement in T cell homeostatic survival and costimulation . Yet our work shows a previously unappreciated T cell effector molecule in activating the complement system, which would help coordinate the activation of adaptive and innate immunity. In addition, GZMK is probably also used by other immune cells, such as innate lymphoid cells, as a general mechanism to promote complement activation and inflammatory responses.
GZMK not only cleaves C3 into C3a and C3b, but also targets both C2 and C4 to promote the generation of the classical C3 convertase C4b2a. In these ways, GZMK helps generate the pro-inflammatory C3a factor, a potent chemoattractant to C3AR-expressing immune cells . In animal models, we show that GZMK contributes to early airway recruitment of eosinophils in a C3-dependent manner. Eosinophils are important pathogenic effectors that could subsequently promote inflammation, tissue damage and remodelling by the release of cytokines and cationic proteins . In addition, C3a and C3b can signal in different immune cells, including subsets of myeloid cells and fibroblasts, to induce inflammatory responses . By cleaving C2, C4 and C5, GZMK could also promote the formation of the terminal membrane attack complex, leading to further tissue damage and inflammation .On the other hand, it is important to note that other GZMK substrates including DMBT1, a negative regulator for mouse rhinitis , would probably also contribute to the overall disease-exacerbating effect of GZMK.
The separation between GZMB-expressing TO and GZMK-expressing T1 cells in the NP tissue seems to mirror the bifurcation of type 1 and type 2 helper cells, which is based on expression of distinct cytokines. These two subsets have minimal clonal overlap but are connected to different blood subsets in the patient cohort we analysed. We speculate a lineage choice between GZMB and GZMK effector pathways might be made early during the response. Recent studies suggested that molecular mimicry might underly aberrant T cell activation and autoimmunity in inflammatory diseases such as multiple sclerosis and ankylosing spondylitis . T cells recognizing both foreign- and self-peptides would form immune memory as a result of infection,
Fig.5|GZMK removal reduces inflammation and restores lung function in asthma.a, Experimental setup.b, Numbers of indicated immune cells in the BALF. Each symbol indicates one mouse, and lines denote means. DC, dendritic cell. c, Lung function and airway hypersensitivity in response to increasing doses of methacholine, measured by the forced oscillation technique (see Methods for more details). Each symbol indicates one mouse and bars denote
means.d,e, Lung histology. d, Representative AB-PAS staining of lung tissue sections. e, areas in the airway (see Methods for more details). Each symbol indicates one mouse, and lines denote means. Data were pooled from three independent experiments, with at least two animals included in each group. values by two-sided unpaired -tests. Scale bars, . i.p., intraperitoneal; i.h., inhalation; DPI, days postimmunization.
and become autoreactive later in life. T1 cells include those predicted to recognize allergens, viral and self-proteins by GLIPH2, offering a potential explanation for their clonal expansion in the NP tissue.
Our observation that the GZMK-expressing T cells tend to aggregate within tertiary lymphoid structures where cells are hints at the possibility that these two pathways might collaborate to promote the disease. Eosinophils and mast cells recruited by GZMK-generated C3a are sources of IL-4 and IL-13 (ref. 47), which promote type 2 immune cell differentiation. In addition, C3a and chemokines secreted by GZMK T cells might collectively contribute to the recruitment of pro-inflammatory myeloid cells, which in turn fuels the activation of type 2 effectors. On the other hand, we also found high GZMK levels in a subset of patients with svNP without tissue eosinophilia and type 2 signatures, including patient NP12 who we analysed in-depth, suggesting that GZMK might also promote airway inflammation independently in these patients. This notion is further supported by our findings that tissue GZMK better predicts disease severity than established type 2 signatures, and suggest that treatments targeting GZMK might provide additional benefits for patients with non-type 2 diseases.
The fact that GZMK-expressing CD8 cells can circulate, as documented here and elsewhere , would explain why NP resection may not be curative and suggest that targeted deletion of these cells could reduce disease recurrence. In fact, by analysing a unique set of matching samples collected from patients with recurring diseases, our study
documents the persistence and re-engraftment of GZMK-expressing clones in disease tissues, providing strong evidence for adaptive immune memory in driving the recurrence of inflammatory diseases in human. Results from genetic ablation and pharmacological inhibition studies in animal models highlight the continuing operation of GZMK-dependent pathways in disease progression and provide a rationale for developing GZMK-targeted therapies in controlling inflammatory diseases.
Online content
Any methods, additional references, Nature Portfolio reporting summaries, source data, extended data, supplementary information, acknowledgements, peer review information; details of author contributions and competing interests; and statements of data and code availability are available at https://doi.org/10.1038/s41586-024-08395-9.
5. Skulina, C. et al. Multiple sclerosis: brain-infiltrating CD8+T cells persist as clonal expansions in the cerebrospinal fluid and blood. Proc. Natl Acad. Sci. USA 101, 2428-2433 (2004).
6. Babbe, H. et al. Clonal expansions of CD8(+) T cells dominate the T cell infiltrate in active multiple sclerosis lesions as shown by micromanipulation and single cell polymerase chain reaction. J. Exp. Med. 192, 393-404 (2000).
7. Jarvis, D. et al. Asthma in adults and its association with chronic rhinosinusitis: the GA2LEN survey in Europe. Allergy 67, 91-98 (2012).
8. Bachert, C. et al. Adult chronic rhinosinusitis. Nat. Rev. Dis. Primers 6, 86 (2020).
9. Schleimer, R. P. Immunopathogenesis of chronic rhinosinusitis and nasal polyposis. Annu. Rev. Pathol. 12, 331-357 (2017).
10. Wang, W. et al. Single-cell profiling identifies mechanisms of inflammatory heterogeneity in chronic rhinosinusitis. Nat. Immunol. 23, 1484-1494 (2022).
11. Ma, J. et al. Single-cell analysis pinpoints distinct populations of cytotoxic CD4(+) T cells and an IL-10(+)CD109(+) TH2 cell population in nasal polyps. Sci. Immunol. https://doi.org/ 10.1126/sciimmunol.abg6356 (2021).
12. Buggert, M., Price, D. A., Mackay, L. K. & Betts, M. R. Human circulating and tissue-resident memory CD8+ T cells. Nat. Immunol. 24, 1076-1086 (2023).
13. Bagaev, D. V. et al. VDJdb in 2019: database extension, new analysis infrastructure and a T-cell receptor motif compendium. Nucleic Acids Res. 48, D1057-D1062 (2020).
14. Vita, R. et al. The Immune Epitope Database (IEDB): 2018 update. Nucleic Acids Res. 47, D339-D343 (2019).
15. Huang, H., Wang, C., Rubelt, F., Scriba, T. J. & Davis, M. M. Analyzing the Mycobacterium tuberculosis immune response by T-cell receptor clustering with GLIPH2 and genome-wide antigen screening. Nat. Biotechnol. 38, 1194-1202 (2020).
16. Yang, F. et al. Positive rate of wheat allergens in the Chinese allergic population: a systematic review and meta-analysis. Sci. Rep. 13, 10579 (2023).
17. Gandhi, N. A. et al. Targeting key proximal drivers of type 2 inflammation in disease. Nat. Rev. Drug Discov. 15, 35-50 (2016).
18. . et al. Single-cell profiling reveals pathogenic role and differentiation trajectory of Granzyme T cells in primary Sjogren’s syndrome. JCI Insight https://doi.org/10.1172/ jci.insight. 167490 (2023).
19. Jonsson, A. H. et al. Granzyme K(+) CD8 T cells form a core population in inflamed human tissue. Sci. Transl. Med. 14, eabo0686 (2022).
20. Mogilenko, D. A. et al. Comprehensive profiling of an aging immune system reveals clonal GZMK(+) CD8(+) T cells as conserved hallmark of inflammaging. Immunity 54, 99-115 e112 (2021).
21. Bai, J. et al. Prognostic factors for polyp recurrence in chronic rhinosinusitis with nasal polyps. J. Allergy Clin. Immunol. 150, 352-361 e357 (2022).
22. Li, F. et al. Risk factors associated with comorbid asthma in patients with chronic rhinosinusitis with nasal polyps: a cross-sectional study. BMC Pulm. Med. 22, 338 (2022).
23. Bouwman, A. C., van Daalen, K. R., Crnko, S., Ten Broeke, T. & Bovenschen, N. Intracellular and extracellular roles of Granzyme K. Front. Immunol. 12, 677707 (2021).
24. Zhao, Y., Tao, Q., Wu, J. & Liu, H. DMBT1 has a protective effect on allergic rhinitis. Biomed. Pharmacother. 121, 109675 (2020).
25. Werner, U. et al. Linking complement C3 and B cells in nasal polyposis. J. Immunol. Res. 2020, 4832189 (2020).
26. Humbles, A. A. et al. A role for the C3a anaphylatoxin receptor in the effector phase of asthma. Nature 406, 998-1001 (2000).
27. Nakano, Y. et al. Elevated complement C3a in plasma from patients with severe acute asthma. J. Allergy Clin. Immunol. 112, 525-530 (2003).
28. Krisinger, M. J. et al. Thrombin generates previously unidentified C5 products that support the terminal complement activation pathway. Blood 120, 1717-1725 (2012).
29. Sato, Y., Silina, K., van den Broek, M., Hirahara, K. & Yanagita, M. The roles of tertiary lymphoid structures in chronic diseases. Nat. Rev. Nephrol. https://doi.org/10.1038/s41581-023-00706-z (2023).
30. Efremova, M., Vento-Tormo, M., Teichmann, S. A. & Vento-Tormo, R. CellPhoneDB: inferring cell-cell communication from combined expression of multi-subunit ligand-receptor complexes. Nat. Protoc. 15, 1484-1506 (2020).
31. Zarantonello, A., Revel, M., Grunenwald, A. & Roumenina, L. T. C3-dependent effector functions of complement. Immunol. Rev. 313, 120-138 (2023).
32. Wilharm, E. et al. Generation of catalytically active Granzyme K from Escherichia coli inclusion bodies and identification of efficient Granzyme K inhibitors in human plasma. J. Biol. Chem. 274, 27331-27337 (1999).
33. Wilharm, E., Tschopp, J. & Jenne, D. E. Biological activities of Granzyme K are conserved in the mouse and account for residual Z-Lys-SBzl activity in Granzyme A-deficient mice. FEBS Lett. 459, 139-142 (1999).
34. Thornberry, N. A. et al. A combinatorial approach defines specificities of members of the caspase family and granzyme B. Functional relationships established for key mediators of apoptosis. J. Biol. Chem. 272, 17907-17911 (1997).
35. Tiberti, S. et al. GZMK(high) CD8(+) T effector memory cells are associated with CD15(high) neutrophil abundance in non-metastatic colorectal tumors and predict poor clinical outcome. Nat. Commun. 13, 6752 (2022).
36. Wang, A. Z. et al. Glioblastoma-infiltrating CD8+T cells are predominantly a clonally expanded GZMK+ effector population. Cancer Discov. https://doi.org/10.1158/2159-8290. CD-23-0913 (2024).
37. Koga, R. et al. Granzyme K- and amphiregulin-expressing cytotoxic T cells and activated extrafollicular B cells are potential drivers of IgG4-related disease. J. Allergy Clin. Immunol. 153, 1095-1112 (2024).
38. Arazi, A. et al. The immune cell landscape in kidneys of patients with lupus nephritis. Nat. Immunol. 20, 902-914 (2019).
39. Bottois, H. et al. KLRG1 and CD103 expressions define distinct intestinal tissue-resident memory CD8 T cell subsets modulated in Crohn’s disease. Front. Immunol. 11, 896 (2020).
40. Skowera, A. et al. CTLs are targeted to kill beta cells in patients with type 1 diabetes through recognition of a glucose-regulated preproinsulin epitope. J. Clin. Invest. 118, 3390-3402 (2008).
41. Pinkse, G. G. et al. Autoreactive CD8 T cells associated with beta cell destruction in type 1 diabetes. Proc. Natl Acad. Sci. USA 102, 18425-18430 (2005).
42. Gearty, S. V. et al. An autoimmune stem-like CD8 T cell population drives type 1 diabetes. Nature 602, 156-161 (2022).
43. Li, J. et al. KIR(+)CD8(+) T cells suppress pathogenic T cells and are active in autoimmune diseases and COVID-19. Science 376, eabi9591 (2022).
44. Donado, C. A. et al. Granzyme K drives a newly-intentified pathway of complement activation. Preprint at bioRxiv https://doi.org/10.1101/2024.05.22.595315 (2024).
45. Liszewski, M. K. et al. Intracellular complement activation sustains T cell homeostasis and mediates effector differentiation. Immunity 39, 1143-1157 (2013).
46. Arbore, G. et al. Complement receptor CD46 co-stimulates optimal human CD8(+) T cell effector function via fatty acid metabolism. Nat. Commun. 9, 4186 (2018).
47. Arnold, I. C. & Munitz, A. Spatial adaptation of eosinophils and their emerging roles in homeostasis, infection and disease. Nat. Rev. Immunol. https://doi.org/10.1038/s41577-024-01048-y (2024).
48. Mastellos, D. C., Hajishengallis, G. & Lambris, J. D. A guide to complement biology, pathology and therapeutic opportunity. Nat. Rev. Immunol. 24, 118-141 (2024).
49. Yang, X. et al. Autoimmunity-associated T cell receptors recognize HLA-B*27-bound peptides. Nature 612, 771-777 (2022).
50. Wang, J. et al. HLA-DR15 molecules jointly shape an autoreactive T cell repertoire in multiple sclerosis. Cell 183, 1264-1281 e1220 (2020).
Publisher’s note Springer Nature remains neutral with regard to jurisdictional claims in published maps and institutional affiliations.
Open Access This article is licensed under a Creative Commons Attribution-NonCommercial-NoDerivatives 4.0 International License, which permits any non-commercial use, sharing, distribution and reproduction in any medium or format, as long as you give appropriate credit to the original author(s) and the source, provide a link to the Creative Commons licence, and indicate if you modified the licensed material. You do not have permission under this licence to share adapted material derived from this article or parts of it. The images or other third party material in this article are included in the article’s Creative Commons licence, unless indicated otherwise in a credit line to the material. If material is not included in the article’s Creative Commons licence and your intended use is not permitted by statutory regulation or exceeds the permitted use, you will need to obtain permission directly from the copyright holder. To view a copy of this licence, visit http:// creativecommons.org/licenses/by-nc-nd/4.0/.
(c) The Author(s) 2025, corrected publication 2025
Patient recruitment
A total of 206 participants undergoing nasal surgery were recruited between 2011 and 2024 from the Department of Rhinology and Allergy, Beijing TongRen Hospital (Extended Data Table 2). Among them, 172 were diagnosed with NP and 34 diagnosed with septal deviation (considered to be HCs in the current study). Patients who had immunodeficiency, pregnancy, chronic rhinosinusitis without NPs, allergic fungal sinusitis, cystic fibrosis or had taken oral corticosteroids 4 weeks before the surgery were excluded from the study. See Extended Data Table 1 for patient details. The study was approved by the Medical Ethics Committee of Beijing TongRen Hospital (TREC200927, TRECKY2019-027 and TREC2022-KY127). All participants provided written informed consent.
The diagnosis of NP was based on the European Position Paper on Rhinosinusitis and Nasal Polyps (EPOS) 2007 guidelines . The comorbid asthma diagnosis was confirmed by pulmonologists according to the clinical presentation and results from the pulmonary function tests, following the Global Strategy for Asthma 2008 guidelines . For research purposes, patients with NP were further grouped on the basis of their disease severity, with those placed in the svNP group having disease recurrence or comorbid asthma up to 1 year after surgery, or both.
Patient tissue processing
Polyps tissues from patients with NP and uncinate tissues from patients with septal deviation were collected during endoscopic sinus surgery. One part of the tissue was immediately digested into single-cell suspension for scRNA-seq and flow cytometry analyses. Another part of the tissue was either fixed in the 4% paraformaldehyde for histology or snap-frozen in liquid nitrogen for long-term storage at for subsequent enzyme-linked immunosorbent assay (ELISA) and bulk sequencing analyses.
Preparation of single-cell suspension from human nasal tissues
Fresh human nasal tissues were first sliced into small pieces in supplemented Roswell Park Memorial Institute (RPMI) medium (Invitrogen) containing 2% FBS (Invitrogen), 2 mM l -Glutamine (Invitrogen), penicillin and streptomycin (Invitrogen). The nasal tissues were then collected by centrifugation and fragmented by the gentleMACS dissociator (Miltenyi Biotec) according to the manufacturer’s instructions. Next, nasal tissues were again collected by centrifugation and further digested with collagenase (Worthington) and DNases I (Roche) in supplemented RPMI medium for 40 min at . The released cells were resuspended and filtered through a cell strainer (BD Bioscience). Red blood cells were lysed by using Versalyse (Beckman Coulter).
PBMC isolation
Whole blood was collected during regular follow-up visits, and peripheral blood mononuclear cells (PBMCs) were isolated by density gradient centrifugation using the Biosci human lymphocyte separation medium (Dakewe) following the manufacturer’s instructions.
T cell stimulation
For degranulation assays, lymphocytes were first enriched from human nasal cells by density centrifugation. Briefly, cells were resuspended in 40% Percoll (GE), layered on top of 70% Percoll and centrifuged at for 15 min . Subsequently, the cells were stimulated by either plate-bound anti-CD3 , clone OKT3) and anti-CD28 ( , clone CD28.2) antibodies or PMA ( ) and ionomy for 4 h in the presence of the FITC-anti-LAMP1 antibodies (clone H4A3, BioLegend), and monensin ( ) was added after 1 h .
Mice
C57BL/6J (Jax 664),Rosa26-creERT2 (Jax 8463), CD45.1 (Jax 2014), OT-I (Jax 3831), Cd4-cre (Jax 22071) and Tcrb Tcrd (Jax 2122) mice were originally from the Jackson Laboratory. Gzmk mice and Gzmk mice (constructed on C57BL/6J background) were from GemPharmatech and Cyagen, respectively. All animals were maintained in specific pathogen-free facilities at Tsinghua University (THU), with filtered air, sterile pellet food, an acidified watering system and a light/12-h dark cycle. The temperature was kept at and humidity at . Experiments were performed according to the governmental and institutional guidelines for animal welfare and approved by the Institutional Animal Care and Use Committee at THU.
For each experiment, at least two animals were included in each group, and data were pooled from 2-4 independent experiments. Sexand age-matched animals of the indicated genotypes were randomly assigned to different groups in each experiment. The mouse lung function assays were run by researchers blinded to group allocations. For other analyses that were based on subjective instrumental measurements, blinding was not performed.
Mouse airway inflammatory disease model construction
Mouse airway inflammatory disease models were built by two approaches. In the first approach, mice were first primed by intraperitoneal immunization with of OVA (Sigma-Aldrich) emulsified in alum (Invitrogen) with of LPS (Sigma-Aldrich). The mice were then challenged by aerosolized OVA ( ) in a whole-body exposure chamber (Yiyankeji) for 30 min per day for three consecutive days starting from 1 week postimmunization. The process was repeated one or twice at a 7 day interval, and analyses were performed at the time indicated. For the induction of Gzmk deletion, the Rosa26-creERT2 and mice were gavaged daily with 2 mg of tamoxifen (ApexBio) dissolved in of sunflower seed oil (JSENB) for five consecutive days at the indicated time. In some experiments, mice were used for asthma induction. These mice were adoptively transferred with splenic CD4 T cells and splenic CD8 T cells from the or mice, purified by magnetic beads (Miltenyi Biotec), 5 days before the intraperitoneal OVA immunization. PPACK (MedChemExpress) and Z-IETD-FMK (Selleck) was prepared in PBS containing 3% DMSO at a concentration of for the inhibition of GZMK and GZMB activity, respectively. Each mouse was injected intraperitoneally with inhibitor every 2 days from 8 to 18 days postimmunization as indicated.
Alternatively, airway inflammation was in induced in animals adoptively transferred with OT-I T cells. Briefly, B6 mice were primed by intraperitoneal immunization of OVA as described above. Then OT-I cells were transferred into the primed mice 6 days postimmunization, which were boosted with OVA intraperitoneally the following day. The mice were challenge with OVA inhalation for three consecutive days 1 week later, and the analyses were performed at the indicated time. For experiments involving and matched control animals, of LPS were used in the first OVA immunization and OT-I cells were transferred.
Cell culture and retroviral transduction
Splenic CD8 T cells were isolated from OT-I mice by CD8a Microbeads (Miltenyi), and expanded in vitro by plate-bound anti-CD3 and anti-CD28 antibodies (bioXcell) in complete RPMI medium (Invitrogen) supplemented with FBS, 2 mM l-glutamine, penicillin, streptomycin and recombinant IL-2 (Peprotech). Subsequently, these OT-I cells were transduced with retrovirus encoding only green fluorescent protein (GFP), GFP with either Gzmk or Gzmk or GFP with Gzmb. GFP OT-I cells were sorted on a Arialll sorter (BD) and cultured in vitro for two more days before being adoptively transferred into recipient mice.
Bronchoalveolar fluid collection
The mice were anaesthetized by intraperitoneal injection of avertin (Sigma-Aldrich) at a dose of . The tracheas were cannulated and lavaged three times, each time with of cold PBS. The collected BALF was centrifuged at 300 g for 3 min , and the cell pellets were subjected to FACS analyses.
Flow cytometry
Human cells isolated from nasal tissues and peripheral blood were washed once with PBS, blocked by the human TruStain blocking reagents (BioLegend) and stained with different surface antibodies in FACS buffer (PBS with 1% FBS and for 30 min on ice. For intracellular staining, the cells were fixed and permeabilized by the CytoFix/Perm kit (BD), and stained with antibodies against intracellular antigens for 30 min on ice. Staining reagents include zombie yellow, PerCP-Cy5.5-anti-CD45 (clone HI30), PE-anti-CD8 (clone HIT8a), BV711-anti-CD8 (clone HIT8a), APC-Cy7-anti-NCAM (clone HCD56), PE-cy7-anti-KLRG1 (clone SA231A2); PE-Cy5-anti-KLRC1 (clone S19004C), FITC-anti-ITGAE (clone Ber-ACT8), PE-Dazzle594-anti-ITGAE (clone Ber-ACT8), BV421-anti-CD27 (clone O323), PE-anti-GZMK (clone GM26E7) and APC-anti-GZMB (clone GB11) from BioLegend, APC-H7-anti-CD19 (clone SJ25C1) from BD Biosciences. For mouse models, BALF cells were first blocked with antibodies (BioXCell), and stained with different antibodies in FACS buffer on ice for 30 min . Staining reagents include AF700-anti-CD11c (clone HL3, BD), eFluor660-anti-CD3 (clone 17A2, eBioscience), APC-anti-I-A (clone AF6-120.1, BioLegend), FITC-anti-Ly6G (clone IA8, BD), PE-Cy7-anti-CD11b (clone M1/70, BD), PE-anti-Siglec-F (clone E50-2440, BD), APC-Cy7-anti-CD8 (clone 53-6.7, BioLegend), Percp-Cy5.5-anti-CD4 (clone RM4-5, BD) and zombie yellow (BioLegend). Data were acquired on the Aurora full-spectrum cytometer (Cytek). All FACS data were analysed with the FlowJo software (Treestar).
For single-cell sequencing analyses, 10,000-20,000 cells were sorted into of PBS containing 1% FBS in microtubes using an Aria xsIII sorter. For human NP tissue cells, cells were sorted as indicated in Extended Data Fig. 3a. Human peripheral T cells were first enriched from total PBMCs, and sorted as shown in Extended Data Fig. 3d. Briefly, PBMCs were incubated with anti-human CD8a antibody (clone OKT8, Invitrogen) on ice for 30 min , and antibody-bound cells were isolated by using the streptavidin-coupled microbeads (Miltenyi) following the manufacturer’s instructions. For the analyses of mouse BALF CD8 T cells, cells were sorted with the exclusion of eosinophils and neutrophils as indicated in Extended Data Fig. 5b.
Immunohistochemistry analyses
Nasal tissues were fixed in formaldehyde for 4 h , dehydrated in sucrose at overnight and frozen in the Tissue-Tek O.C.T. Compound (Sakura Finetek). Cryo-sections of were prepared using a microtome (Leica). The sections were rehydrated in staining buffer ( Tween 20 in 0.1 M Tris- HCl ), and blocked with the immunofluorescence blocking buffer (CST) for 30 min . After staining with different antibodies in staining buffer at overnight, the sections were incubated with 4′-6-diamidino-2-phenylindole dihydrochloride (DAPI, , Sigma-Aldrich) for 10 min as indicated, and mounted with the fluoromount aqueous mounting medium (Sigma-Aldrich). Images of intact tissue sections were acquired using the Zeiss Axio Scan Z1 slide scanner (Zeiss); alternatively, zoom images of the GZMK-expressing T cell aggregates were acquired using the LSM 710 confocal microscope (Zeiss). Staining reagents include PE-anti-GZMK (clone GM26E7, BioLegend), APC-anti-CD8 (clone HIT8a, BD), FITC-anti-KLRG1 (clone 2F1/KLRG1, BioLegend), APC-anti-CD4 (clone OKT4, BioLegend), FITC-anti-PTGDR2 (clone BM16, BioLegend) and FITC-anti-complement C3b/iC3b (3E7/C3b, BioLegend).
Areas of GZMK-expressing T cell aggregation from whole tissue scanned images were quantified independently by investigators blinded to the patient information using ZEN (Zeiss). The numbers of different cell subsets were quantified from confocal images by Imaris (Bitplane) on the basis of expression of different marker genes.
Histologic evaluation of NP immune cell subsets
Fixed NP tissues were embedded in paraffin and stained with haematoxylin and eosin. The absolute numbers of eosinophils were quantified in three randomly selected high-power magnification fields by two pathologists.
Bulk TCR sequencing
Total RNAs were extracted from the nasal tissues by using the HiPure Total RNA Mini Kit (Magen). Reverse transcription of input RNA was performed following the standard Smart-seq2 protocol , with the following modifications: The polyT reverse transcription primer was replaced by the T30VN oligo ( TTT TTTTTTTTTTTTTTTTTTTTTTTTTTVN-3′) and the original template switch oligo (TSO) was replaced by a 26 N unique molecular identifier (UMI)-containing TSO (5́-CTACACGACGCTCTTCCGATCTN NNNNNNNNNNNNNNNNNNNNNNNNNNTTTCTTATATrGrGrG-3′, rG represents riboguanosines). TSO was removed by addition of of Exol (NEB) to each reverse transcription reaction and incubation at for 15 min , which was subsequently inactivated by incubation at for 5 min . TCR enrichment was done in two steps. The reverse transcription product was first mixed with of KAPA HiFi HotStart ReadyMix (KAPA Biosystems), B/T enrich F1 primer ( -AATGATACGGCGACCACCGAGATCTACACTCTTTCC CTACACGACGCTC-3′; Sangon Biotech), of each TCR outer primers (TCRα, -TGAAGGCGTTTGCACATGCA-3′; TCR , -TCAGGCAGTATCTGGAGTCATTGAG-3′; Sangon Biotech) to a total volume of , and amplification was done with the following program cycles of 1 min ). The PCR products was then purified by VAHTS DNA Clean Beads (Vazyme) at a 0.8 to 1 (beads to sample) ratio according to the manufacturer’s instructions. Afterwards, the second step of TCR enrichment was performed by mixing the purified products with of KAPA HiFi HotStart ReadyMix, B/T enrich F2 primer ( -AATGATACGGCGACCACCGA-3′ ; Sangon Biotec), of each TCR inner primers (TCR -AGTCTCTCAGCTGGTACACG-3′; TCR , 5′-TCTGATGGCTCAAACACAGC-3′; Sangon Biotec) to a total volume of and amplified by the following program ( , eight cycles of . The products were put through a double-sided size selection by the VAHTS DNA Clean Beads, at 0.5 to 1 and 0.3 to 1 (bead to sample) ratios, respectively. Subsequently, 1 ng of the purified products was tagmented by Tn 5 transposase (Vazyme) in of TD reaction buffer ( 10 mM Tris-Cl pH 7.6, ) at for 10 min . The reaction was mixed with of SDS and incubated at for 20 min for transposase inactivation. Index PCR was performed by mixing the tagmentation product with of unique dual index primers and of Q5 High-Fidelity Master Mix (NEB), and amplified with the following program ( cycles of ). The PCR products were then purified with VAHTS DNA Clean Beads at a ratio of 0.8 to 1 (bead to sample). The constructed libraries were sequenced on Novaseq 6000 System (Illumina) in a paired-end mode.
scRNA and scTCR sequencing
For human tissue cells and tissue cell subsets, the scRNA and scTCR libraries were prepared using the Chromium Single Cell V(D)J Reagent Kits (10X Genomics). And the Chromium Next GEM Single Cell Kit v2 (10X Genomics) were used to construct libraries for human
peripheral blood samples and mouse BALF cells. The library sequencing was performed on an NovaSeq 6000 System.
Laser-captured microdissection and bulk RNA sequencing analyses
RNA sequencing of the GZMK cell aggregated tissue areas was performed following the Geo-seq protocol . Briefly, NP tissues were embedded in the Tissue-Tek O.C.T. compound, snap-frozen by liquid nitrogen and sectioned into consecutive slices. The GZMK cell aggregated areas were first confirmed by immunohistochemistry staining with DAPI and PE-anti-GZMK antibodies, then an adjacent slice was attached to the PEN MembraneSlide (catalogue no. 11505151, Leica) and stained with crystal violet. The matched GZMK cell aggregated and control tissue areas were excised and added to of guanidine thiocyanate, and incubated at for 15 min . The RNA was then precipitated by mixing the samples with of deionized of anhydrous ethanol, of 1.5 M sodium acetate ( pH 6.5 ) and of glycogen . The mixtures were placed at for 30 min and centrifuged at for 30 min at . After washed by ethanol, the precipitated RNAs were resuspended in for library construction using the Smart-seq2 protocol .
The sequencing data were mapped and quantified by Salmon .Samples with mapping rates lower than was excluded from the analyses. Differential expression analyses were performed by DESeq2 (ref. 56), and principal component analyses was done by using the ‘plotPCA’ function after variance-stabilizing transformation.
scRNA-seq analyses
CellRanger (v.3.0) was used to generate gene expression matrix for each cell, which was further processed by Seurat (v.3.0.2) for data combination, dimension reduction, clustering and gene differential expression analysis. For human tissue CD45 cells, data from different samples were first pooled by the ‘merge’ function. Subsets containing cells and myeloid cells were identified, and batch effects were removed by the ‘IntegrateData’ function. For the analyses of human tissue cell subsets, data from different samples were first pooled by the ‘merge’ function, then the ‘FindTransferAnchors’, ‘TransferData’, ‘MapQuery’ and ‘IntegrateEmbeddings’ functions in Seurat v.4.3.0.1 were used for cluster prediction and projection of the query onto the reference uniform manifold approximation and projection (UMAP) structure on the basis of the total tissue cell dataset. For transcriptome association analyses in Fig. 2g, we first calculated the average gene expression in human tissue cell and blood cell clusters, and ranked the genes by their standard deviations across different clusters. Then the top 2,000 genes were used to form the average expression matrix, which was used to calculate the Spearman’s rank correlation coefficient. For the comparison between T1 and B2 cells described in Extended Data Figs. 5 and 6, we first pooled the T1 and blood CD8 cells from NP11 and NP13 by the ‘merge’ function in Seurat. The average UMI for each gene in the two subsets were then graphed and the Spearman correlation coefficient was calculated. For trajectory analyses, clones shared between tissue and blood were subsampled and used for UMAP dimensional reduction, and the pseudotime for these cells was calculated by using Monocle3 (ref. 58) (v.1.3.1). For cell-cell interaction analyses described in Supplementary Fig. 8, each indicated immune cell subset was downsampled to cells for downstream analyses by using the ‘subset’ function in Seurat. The gene expression matrix was input into CellphoneDB (v.3) to calculate the receptor-ligand interactions. Network diagrams were graphed by Cytoscape (v.3.10.1) and bubble plots were graphed by gglot2 package.
For mouse BALF cells, we integrated data from two biological replicates with the ‘IntegrateData’ function and performed UMAP dimension reduction as well as clustering. Then the cells were put through another round of dimension reduction and clustering for further analyses.
TCR repertoire analyses
For the bulk TCR-seq dataset, adaptors were first removed by Cutadapt , then the TCR sequences were assembled by TRUST4 (ref. 61), which identified the first N16 of N26 within the TSO oligos as UMI and resulted in filtered contig files containing high-quality assembled TCR contigs for each UMI. UMIs with more than one TCR contigs were excluded from the analyses. For the scTCR-seq datasets, CellRanger was used to assemble TCRs for single cells. TCR contigs were annotated using Igblast (v.1.16.0), and only productive TCR contigs with complete VDJ regions were used for downstream analysis. In addition, cells with many productive TCRα or TCR contigs were removed from the scTCR dataset. Common TCR clones between different datasets were identified by the shared CDR3 nucleic acid sequences and common V(D) J. germline usage. In the case of scTCR-seq data, both and chains were considered. The circus plots were graphed by using the circlize package, and the rest of the graphs were visualized using ggplot2 and Seurat.
For TCR specificity prediction, TCR pairs with annotated cognate antigens were collected from VDJdb database and the Immune Epitope Database and integrated with 1,311 T1 TCRs from our own scTCR-seq dataset. The resulted TCR list was analysed using the GLIPH2 (ref. 15) web portal (http://50.255.35.37:8080). TCRs were clustered on the basis of both local and global similarity, and the clusters were filtered by the following criteria: Fisher_score and vb_score . All clusters containing T1 cell TCRs were graphed using Cytoscape (v.3.10.1).
ELISA and Luminex assay
Nasal tissues were weighed and homogenized mechanically using the TissueLyser LT bead mill (Qiagen). RIPA buffer containing the complete protease inhibitor cocktail (Roche) was added to the homogenates ( ). The lysates were frozen and thawed twice, centrifuged at for 5 min at and the supernatants were used for GZMK measurements by ELISA (Reddot Biotech) and IL-5 measurements by Luminex xMAP assay (Thermo Fisher) on a Bio-Plex 200 system (BioRad). All analyses were done following the manufacturer’s instructions.
Lung function assay
Airway responsiveness of mice was assessed using the FlexiVent system (SCIREQ) following the manufacturer’s instructions. Tracheotomy and endotracheal intubation were performed after anaesthetizing the mice with pentobarbital sodium (Sigma-Aldrich). Airways resistance and compliance were measured on sequential exposure to increasing doses of methacholine (Sigma-Aldrich) dissolved in sterile normal saline ( and ).
AB-PAS staining
The left mouse lungs were fixed in formaldehyde for 4 h , dehydrated in 30% sucrose for 2 days at room temperature and frozen in Tissue-Tek O.C.T. Compound at . The tissue blocks were cryo-sectioned into slices, and Alcian Blue-Periodic acid Schiff (AB-PAS) staining was performed using the AB-PAS solution set (Servicebio) according to the manufacturer’s instructions. The panoramic images of a whole lung section were acquired for each animal using the Zeiss Axio Scan Z1 slide scanner, and zoom-in views were acquired by a Nikon eclipse Ts2R microscope (Nikon). PAS areas in each airway were quantified using ImageJ (NIH) with the same threshold and normalized to the perimeter of the airway. The mean value was calculated from the four airways with the highest normalized area for each section, and assigned to the corresponding animal.
Quantitative PCR
RNA was extracted from sorted mouse cells by trizol and reverse transcribed into complementary DNA (cDNA) by All-In-One MasterMix (abm). Quantitative PCR were performed with Blastaq quantitative
PCR Mix (abm) on the CFX Connect Real-Time System (BioRad). Primers used were listed as follows: Actb-F 5′-CCTAAGAGGAGGATGGTCGC, Actb-R 5′-CTCAAGTCAGTGTACAGGCCA; Gzmk-F 5′-TGTCCAACTGC TTCACCTGGG and Gzmk-R 5′-GCCACCAGAGTCACCCTTGCA. Gzmk level was normalized to the level .
Expression and purification of recombinant human GZMK
Recombinant human GZMK were produced and purified as described previously . Briefly, the cDNA for human GZMK was cloned into the pHL vector. PCR mutagenesis was performed to produce the enzymatic inactive GZMK-S214A mutant. 293-F cells (obtained from Thermo Fisher;validated by the provider; mycoplasma negative) were seeded in 293-TII medium (Sino Biological) at a concentration of cells per ml one night before the transfection. Subsequently, the plasmids were mixed with linear polyethylenimine (molecular weight 40,000 , Yeasen Biotechnology) at a ratio of 1:3, and transfected into 293-F cells. The supernatants were harvested after 3 days, and the granzymes containing a C-terminal His-tag were captured onto a nickel affinity column (Yeasen Biotechnology). The eluted proteins (containing an engineered enterokinase site at the N terminus) were digested by the enterokinase (Beyotime Biotechnology), and cation exchange chromatography was carried out using the Resource S column (Cytiva) on the AKTA Purifier 10 system (GE) to further purify the protein.
Protease activity assay of recombinant GZMK
The protease activity of GZMK was measured by a FRET-based assay (Extended Data Fig. 4b) using a synthetic fluorogenic peptide substrate, DABCYL-GDGRSIMTE-EDANS (Sangon Biotechnology). The reactions were performed in 20 mM HEPES, pH 7.0 at with protease and peptide substrate. After 15 min , the fluorescence was monitored at 490 nm with an excitation wavelength of 340 nm using Varioskan Flash reader (Thermo Fisher) in a 96-well microplate. Trypsin (Promega) was used as a positive control, and lysozyme (Sigma-Aldrich) was used as a negative control.
GZMK pull-down assay
Purified GZMK-S214A was first biotinylated by reacting with the EZ-Link NHS-LC-Biotin (Thermo Fisher) according to the manufacturer’s instructions, and coupled to the M-280 Streptavidin Dynabeads (Thermo Fisher). To do that, of Dynabeads were equilibrated in PBS and incubated with biotinylated GZMK-S214A for 30 min at . NP lysates were prepared as described except with a different lysis buffer ( 20 mM Tris, Triton X-100) supplemented with protease and phosphatase inhibitors (Beyotime Biotechnology). Subsequently, of the lysates from each sample were precleared by of Dynabeads at for 4 h , then the precleared lysates were incubated with the biotinylated GZMK-S214A-Dynabeads overnight at . The Dynabeads were washed with the lysis buffer, and the associated proteins were eluted with 0.1 M Glycine ( pH 2.5 ) and neutralized with 1 M Tris ( pH 7.5 ).
Mass spectrometry and data analysis
Proteins pulled down by GZMK-S214A-Dynabeads or Dynabeads only were resolved by SDS-PAGE and visualized by Coomassie brilliant blue staining. The protein bands were excised and subjected to in-gel digestion. Gel pieces were washed in and destained in in . The proteins were then incubated with 10 mM DTT (Sigma-Aldrich) for 60 min at followed by 20 mMIAA (Sigma-Aldrich) for 30 min in the dark at room temperature. Trypsin (Promega) was added at 1:50 ratio (w/w), and the mixture was incubated overnight at . Finally, the samples were cleaned on a C18 cartridge (Waters Corporation) and ready for LC-MS analyses. LC-MS was carried out using an UltiMate 3000 UHPLC System (Thermo Fisher) connected to a Fusion Lumos Tribrid mass spectrometer (Thermo Fisher). Mass spectrometry data were analysed
using the SEQUEST HT search engine against a UniProt Swiss-Prot database with Proteome Discoverer v.2.3 (Thermo Fisher). Among the identified GZMK-interacting proteins, 56 appeared in all samples analysed. These proteins were ranked by SEQUEST scores and the abundance ratio (sample control ). The proteinprotein interaction analysis of GZMK-interacting proteins was done with Cytoscape (v.3.9.1).
Edman sequencing
The phenylthiohydantoin amino acid was separated in the reversedphase mode of high-performance liquid chromatography using the differences between the retention times of different amino acids, and the amount of UV (ultraviolet light) absorbance at specific wavelengths was detected. The samples were transferred to the polyvinyl difluoride membrane and five cycles were set. The amino acid sequences of each sample were determined from the chromatograms obtained in each cycle evaluation performed by comparing chromatograms with those in the previous and subsequent cycles and identifying the phenylthiohydantoin amino acids that had the greatest increase in abundance.
GZMK cleavage assay
The recombinant SET protein (Solarbio) and serum-purified complement C2, C3, C4 and C5 (Complement Technology) at a concentration of were incubated with recombinant GZMK in PBS at for the indicated period of time. To test the cleavage of DMBT1, NP tissue lysates were incubated with increasing dose of recombinant GZMK at for 1 h . The reactions were stopped by the addition of SDS loading buffer (reducing, TransGen), and the samples were then boiled for 15 min and resolved by SDS-PAGE. Serum-purified C3a, C3b, C2a, C4b (Complement Technology) and recombinant GZMK were separately loaded as controls. Target proteins were either visualized by Coomassie brilliant blue staining or detected by immunoblotting with different antibodies. The antibodies used include anti-SET (clone EPR12973, Abcam), anti-GZMK (clone EPR24601-164, Abcam), anti-C2 (clone EPR17979, Abcam), anti-C3 (clone EPR19394, Abcam), anti-C3a/C3a-desArg (clone 2991, Hycultbiotech), anti-C4 (clone C-2, Santa Cruz), anti-C5a/C5a-desArg (clone C17/5, Abcam), anti-DMBT1 (clone G-4, Santa Cruz), anti-ACTB (clone C4, Santa Cruz), HRP-Goat-anti-Mouse IgG ( ) (Beyotime Biotechnology) and HRP-Goat-anti-Rabbit IgG (H+L) (Beyotime Biotechnology). Immunoblots were developed by the Super ECL Detection Reagent (Yeasen Biotechnology).
For the comparison between GZMK and different C3 convertases, serum-purified human C3 (Complement Technology, ) were incubated with GZMK or other C3 convertases (C3bBb or C4b2a; ) for 20 min at . C3bBb was formed by mixing C3b (Complement Technology, ), FB (Complement Technology, ) and FD (Complement Technology, 500 nM ) in HBS-Mg buffer ( 20 mM HEPES, ) for 2 min at and the reaction was terminated by 5 mMEDTA . C4b2a was formed by incubation of C4b (Complement Technology, ), C1s (Complement Technology, ) and C2 (Complement Technology, ) in PBS with , 2 mM MgCl 2 and 40 mM NaCl for 5 min at , and the reaction was terminated by 2 mM EDTA. The amount of C3a shown on the Coomassie brilliant blue-stained gels were quantified by using ImageJ, and the data were normalized to the C4b2a group.
Purification of C3a and measurement of C3a activity
C3a converted by different C3 convertases were purified by sizeexclusion chromatography (SEC). Specifically, the cleavage products were separated by an SEC column (Acclaim SEC-1000, , Thermo Fisher) on a Vanquish HPLC system (Thermo Fisher) with the UV detector set to detect absorbance at 280 nm . PBS buffer ( pH 7.4 ) was used as the mobile phase at a flow rate for elution.
SEC fractions were collected automatically and further concentrated by the Amicon ultra centrifugal unit ( 3 kDa molecular weight cutoff, Millipore). The purity of C3a was confirmed by SDS-PAGE ( ) and Coomassie brilliant blue staining.
THP1 cells (obtained from the National Infrastructure of Cell Line Resource, China; validated by the provider; mycoplasma negative) were maintained in RPMI-1640 medium ( FBS, 1% penicillin and streptomycin) and used to measure C3a activities. Briefly, the cells were serum-starved overnight, incubated with from the indicated sources at for 5 min , and lysed with RIPA buffer containing protease inhibitors (Roche) and phosphatase inhibitors (Thermo Scientific). Immunoblotting was performed using anti-phospho-Erk1/2 (Cell Signaling Technology) and anti-Erk1/2 (clone 137F5, Cell Signaling Technology) antibodies. Data were quantified by ImageJ and normalized to the untreated control.
Haemolytic assay
Serum-purified human C5b6 ( 600 pM ) was first incubated with recombinant GZMK or Trypsin ( 600 pM) at for the indicated time. The reaction mix was then added to chicken erythrocytes ( per ml , Sbjbio) suspended in the Veronal Buffered Saline (pH 7.4), and incubated at for 5 min . Subsequently, serum-purified C7 was added ( 15 nM ) to the erythrocytes and the mixture was incubated at for 15 min . Finally, a mix of serum-purified and C 9 were add to the cells, and further incubated at for 30 min . The remaining intact erythrocytes were removed by centrifugation at for 2 min , and haemolysis was determined by absorbance measurement at 405 nm .
Statistical analyses
Statistical analyses were performed by Prism v. 9 (GraphPad). MannWhitney -tests were used to calculate values from the human data, and two-sided Student’s -tests were used for mouse data analyses. Categorical variables were analysed using the Chi-square test. Receiver-operating characteristics analysis was also performed in R (v.4.3.3) with the pROC package for prediction of polyp recurrence or comorbid asthma. The multiple linear regression analyses were performed using the emmeans package in (v.4.3.3).
Reporting summary
Further information on research design is available in the Nature Portfolio Reporting Summary linked to this article.
Data availability
The raw sequencing data have been deposited in the GSA (Genome Sequence Archive in BIG Data Center, Beijing Institute of Genomics, Chinese Academy of Sciences, http://gsa.big.ac.cn) under the accession number HRA005529 for the human data and CRA012671 for the mouse data. For GLIPH2 analyses, annotated TCR sequences were obtained from VDJdb (https://vdjdb.cdr3.net) and Immune Epitope Database (https://www.iedb.org).
Code availability
The original code for sequencing data analyses has been deposited at Zenodo (https://doi.org/10.5281/zenodo.14030622) .
51. Fokkens, W., Lund, V., Mullol, J. European position paper on rhinosinusitis and nasal polyps 2007. Rhinol. Suppl. 20, 1-136 (2007).
52. Bateman, E. D. et al. Global strategy for asthma management and prevention: GINA executive summary. Eur. Respir. J. 31, 143-178 (2008).
53. Picelli, S. et al. Full-length RNA-seq from single cells using Smart-seq2. Nat. Protoc. 9, 171-181 (2014).
54. Chen, J. et al. Spatial transcriptomic analysis of cryosectioned tissue samples with Geo-seq. Nat. Protoc. 12, 566-580 (2017).
55. Patro, R., Duggal, G., Love, M. I., Irizarry, R. A. & Kingsford, C. Salmon provides fast and bias-aware quantification of transcript expression. Nat. Methods 14, 417-419 (2017).
56. Love, M. I., Huber, W. & Anders, S. Moderated estimation of fold change and dispersion for RNA-seq data with DESeq2. Genome Biol. 15, 550 (2014).
57. Stuart, T. et al. Comprehensive integration of single-cell data. Cell 177, 1888-1902 e1821 (2019).
58. Cao, J. et al. The single-cell transcriptional landscape of mammalian organogenesis. Nature 566, 496-502 (2019).
59. Shannon, P. et al. Cytoscape: a software environment for integrated models of biomolecular interaction networks. Genome Res. 13, 2498-2504 (2003).
60. Martin, M. Cutadapt removes adapter sequences from high-throughput sequencing reads. EMBnet.J https://doi.org/10.14806/ej.17.1.200 (2011).
61. Song, L. et al. TRUST4: immune repertoire reconstruction from bulk and single-cell RNA-seq data. Nat. Methods 18, 627-630 (2021).
62. Ye, J., Ma, N., Madden, T. L. & Ostell, J. M. IgBLAST: an immunoglobulin variable domain sequence analysis tool. Nucleic Acids Res. 41, W34-W40 (2013).
63. Dotiwala, F. et al. A high yield and cost-efficient expression system of human granzymes in mammalian cells. J. Vis. Exp. https://doi.org/10.3791/52911 (2015).
64. Jizhou, L. et al. The original code for sequencing data analyses in the research paper ‘Granzyme K-expressing CD8 T cells promote recurrent airway inflammatory diseases’. Zenodo https://doi.org/10.5281/zenodo. 14030622 (2024).
Acknowledgements We thank Y. Li at the Tongren Hospital and B. Li at the China-Japan Friendship Hospital for assisting with the mouse lung function assays. We thank J. Xiao at Peking University for assisting with the haemolytic assay. This work was funded in part by the National Key R&D Program of China (Ministry of Science and Technology, grant no. 2022 YFC2504100 to L.Z.), the National Science and Technology Major Project (National Health Commission of China, grant nos. 2023 ZD0519900 to J.W. and 2023ZD0520300 to H.Q.), the Tsinghua University Initiative Scientific Research Program (Tsinghua University, H.Q.), the National Natural Science Foudation of China (grant nos. T2225005 and 21927802 to J.W., 32130037 to H.Q., 32422028 to X.L., and 81970851 and 82271140 to F.L.), SXMU-Tsinghua Collaborative Innovation Center for Frontier Medicine (H.Q.), the Program for Changjiang Scholars and Innovative Research Team (grant no. IRT13082 to L.Z.). H.Q. is a New Cornerstone Investigator.
Author contributions H.Q. and L.Z. initiated and codirected the collaboration. X.L. and H.Q. conceptualized and designed the study. S.D., X.W. and C.W. recruited patients and collected clinical samples under the guidance of L.Z. F.L., J.L. and Y.S. conducted experiments involving human samples under the supervision of H.Q. and X.L. J.L. conducted bioinformatic analyses under the supervision of J.W. and J.Y. W.M. conducted mouse experiments under the supervision of X.L. and H.Q. F.S. conducted substrate identification experiments under the supervision of J.W. and J.Y. L.Z. raised the most financial support to fund the study. X.L. and H.Q. interpreted the data and wrote the paper with inputs from all authors.
Competing interests H.Q. is a cofounder of Emergent Biomed Solutions, Ltd.
Additional information
Supplementary information The online version contains supplementary material available at https://doi.org/10.1038/s41586-024-08395-9.
Correspondence and requests for materials should be addressed to Xin Liu, Jianbin Wang, Luo Zhang or Hai Qi.
Peer review information Nature thanks Claudia Kemper and the other, anonymous, reviewer(s) for their contribution to the peer review of this work.
Reprints and permissions information is available at http://www.nature.com/reprints.
Extended Data Fig. 1 | The sc-RNAseq and Profiling of T cells in nasal tissues. a, UMAP visualization of total CD45 cells in nasal tissues from all HCs and NP patients analyzed (related to Fig. 1b). b, Expression levels of CD3D, TRAC, TRDC, NKG7, PTGDR2, CD79A, HLA-DRA, CLEC4C, KIT and GZMK. c, Cells with fully assembled TCR and chains are superimposed on total CD45 cells, visualized by UMAP. d, Dot plots showing expression of the indicated genes in innate lymphoid cells (ILCs)/T cells. The percentage and the level of expression
are shown by the dot size and color intensity, respectively. e, Dot plots showing the expression of effector and memory T cell signature genes, based on which the cell subsets were annotated. The percentage and level of expression are indicated by dot size and colors, respectively. f, Statistics summarizing the relative abundance of different cell subsets in the nasal tissue from and NP ( ) patients. Each symbol indicates one patient, and lines denotes means. HC, healthy control; NP, nasal polyp. values by Mann-Whitney tests.
a
Sorting strategy for NP tissue CD8 T cells
e
f
Extended Data Fig. 2 |Analyses of CD8 T cells and NK cells from NP tissue and peripheral blood. a, Gating strategies for sorting CD8 T cell subsets from NP tissues.b-c, Validation of different NP tissue CD8 T cells subsets by scRNA-seq. b, Clustering of total sorted cells (left) or individual subsets (right). Data were matched to the reference dataset in Fig. 1d. c, Composition of each sorted subset.
d, Sorting strategy for blood CD8 T cells. e, Gating strategies for NP tissue NK cells.f, Statistics summarizing the abundances of NK cells in the nasal tissue in HC ( ), NP ( ) and svNP ( ) patients. Each symbol indicates one patient, and lines denote means. values by Mann-Whitney tests.
Extended Data Fig. 3 | Secretion of GZMK by cells. a-b, Representative FACS plots (a) and summary statistics (b) showing the surface expression of LAMP1 in the indicated cell subsets upon stimulation. , Intracellular levels of GZMK in the LAMP1 cells within each subset.
Representative FACS plots (c) and summary statistics are shown (d). PMA, phorbol 12-myristate 13-acetate; MFI, mean fluorescence intensity. Data are representative of ( and ) or pooled from ( and d) three patients. values by paired t-tests.
Extended Data Fig. 4 | Characterization of GZMK substrates and Comparison between GZMK and other C3 convertases. a, A representative Coomassie blue-stained gel showing the purified GZMK and GZMK .b, Schematic of a fluorescence resonance energy transfer (FRET)-based protease assay for determining GZMK activity. c, Measurements of GZMK activity using the assay in (b). Lysozyme and Trypsin were included as negative and positive controls, respectively. Each symbol denotes a technical replicate ( ), and data are presented as mean ± S.D. AU, arbitrary unit. d, Representative immunoblots showing cleavage of SET by GZMK. e, Representative immunoblots showing cleavage of tissue DMBT1 by different doses of GZMK, with -actin as a sample processing control. Data are representative (a-e) of at least two independent experiments.f, Representative Coomassie Blue-stained gel showing the cleavage
of serum-purified C3 by GZMK, C3bBb and C4b2a.g, Statistics summarizing the level of C3a converted by GZMK and C3bBb, as normalized to C4b2a. Each symbol denotes one experiment, and lines denote means.h, Representative HPLC trace (left) and commassie blue-stained gels (right) showing the isolation of C3a. Serum-purified C3 was incubated with recombinant human GZMK or C4b2a assembled from serum-purified components. mAU, milli-absorbance unit. i-j, Immunoblots (i) and summary statistics (j) showing the activation of ERK in THP1 cells by C3a from different sources. Data are representative ( and i ) or pooled ( g and j ) from three independent experiments. Each symbol denotes one experiment, and lines denote means. values by two-sided unpaired t tests. Source images for gels and blots are presented in Supplementary Fig.1.
Article
Extended Data Fig. 5|GZMK cleavage of additional complement components.
Representative Coomassie Blue-stained gels showing GZMK cleavage of serumpurified C2(a), C4(d) and C5(g), as confirmed by Edman sequencing (b, e and h) and immunoblots ( and ). The incubation times are indicated. , Hemolytic assays to measure the activity of serum-purified C5b6 with or without GZMK cleavage (See Methods for more details). Lysis of chicken erythrocytes were
induced by the addition of C5b6 and an excess amount of serum-purified C7, C8 and C9. AU, arbitrary unit. Error bars indicate means ± S.D. Each symbol denotes a technical replicate ( ), and lines denote means. Data are representative of at least two independent experiments. Source images for gels and blots are presented in Supplementary Fig.1.
Extended Data Fig. 6 | See next page for caption.
Article
Extended Data Fig. 6 | GZMK-expressing CD8 T cells localize to tertiary lymphoid structures. a-c, IHC analyses of GZMK-expressing CD8 T cells in nasal tissues surgically removed from HCs or different groups of NP patients. a, Representative images of GZMK and CD8 staining. White squares indicate areas containing GZMK-expressing CD8 T cell aggregates; magnified display of the white-square areas provided as insets. Scale bar, for the overall view and for insets.b, Pie charts classifying individuals in each group into those who’s surgically removed tissues did or did not contain GZMKexpressing CD8 T cell aggregates. Numbers of individuals are indicated. c, Densities of GZMK-expressing CD8 T cell aggregate in NP and svNP patients, presented as fractional distributions.d-g, Expression profiling of tissue areas containing GZMK and cell aggregates by bulk mRNA sequencing analysis. d, Experimental setup. e, A brightfield image of one NP tissue section
(Left, crystal violet-stained) and a fluorescent image of an adjacent section (Right, stained with DAPI and an anti-GZMK antibody) section, with pink and cyan circles indicating cell aggregates and control areas excised by laser-capture microdissection. Scale bar, .f, Principal component analysis. Each symbol indicates one tissue area.g, Selected differentially expressed genes in the control and GZMK areas. , IHC staining of indicated markers (h) and summary statistics of abundance of indicated cell types in control ( ) and GZMK areas ( ) are shown ( and ). Scale bar, . Each symbol indicates one selected area, and lines denote means. Tissue sections from three (j) or four (i) patients were included in the analysis, and at least three control and GZMK areas were selected for each patient. values by Mann-Whitney tests.
Extended Data Fig. 7 | The murine asthma model. a, Experimental setup. b, Gating strategies for different immune cell populations in BALF. c, Summary statistics showing the quantifications of BALF cell subsets. d, Expression of in CD8 and CD4 T cells sorted from the lung tissue by quantitative RT-PCR. Data were normalized to the expression of Atcb. Data were pooled from two independent experiments, with at least 2 animals included in each group in a
single experiment. values by two-sided unpaired tests. e-f, sc-RNA sequencing analyses of BALF CD8 T cells collected from C57BL/6 mice after the second OVA challenges as shown in a.e, UMAP visualization of 3 BALF CD8 T cell subsets. f, Violin plots showing the expression of Cd3e, Cd8a, Gzmk, Itgae. Data were combined from two biological replicates, each contains BALF cells pooled from 3 mice.
Extended Data Fig. 8 | Functions of CD8 T cell-derived GZMK. a-e, Induction of airway inflammation in -cre and mice. a, Experimental design.b, Numbers of indicated immune cells.c, Lung function of the indicated mice as measured by airway hypersensitivity in response to an increasing dose of methacholine using the forced oscillation technique. Each symbol indicates one mouse, and bars denote means. d, Representative images of Alcian BluePeriodic acid Schiff (AB-PAS) staining of lung tissue sections. Scale bar, .
e, Quantifications of PAS areas in the airway. f-g, CD8 T cell intrinsic role of GZMK.f, Experimental setup.g, Statistics summarizing the number of immune cells detected in BALF. i.p., intraperitoneal; i.h., inhalation; DPI, days post immunization. Each symbol indicates one mouse, and lines denote means. Data were pooled from two (d-e) or three (b,c andg) independent experiments, with at least two animals included in each group. values by two-sided unpaired tests.
Extended Data Fig. 9 | See next page for caption.
Article
Extended Data Fig. 9 | CD8 T cell-derived GZMK promotes airway eosinophil recruitment through C3.a-d, Induction of airway inflammation based on adoptive transfer of OT-I T cells over-expressing Gzmk, Gzmk and b) and and d). and , Experimental setup. and d, Numbers of indicated immune cell subsets in BALF. e-f, Asthma induction in animals. d, Experimental
schedule. e, Statistics summarizing the number of different immune cells in the BALF. Each symbol indicates one mouse, and lines denote means. Data were pooled from two (d and f) or four (b) independent experiments, with at least two animals included in each group. values by two-sided unpaired tests.
Extended Data Fig. 10 |Effect of granzyme inhibitors. a, Experimental schedule. PPACK or Z-IETD-FMK was administered intraperitoneally every two days during the indicated period of time. and , Summary statistics showing the number of different immune cells in the BALF of PPACK (b) or Z-IETD-FMK (c) treated mice. Each symbol indicates one mouse, and lines denote means. d, Airway hypersensitivity of the vehicle or PPACK treated mice measured using the forced oscillation technique. Each symbol indicates one mouse, and bars
denote means. e, Representative AB-PAS staining of lung tissue sections of vehicle or PPACK treated mice. Scale bar, .f, Statistics summarizing the areas in the airway of indicated mice. Each symbol indicates one mouse, and lines denote means. Data were pooled from two (b, c, e and f) or four (d) independent experiments, with at least two animals included in each group. values by two-sided unpaired tests.
Article
Extended Data Table 1 | Patient demographics
Control ( )
NP ( )
svNP ( )
Sex (male/female)
19/15
50/32
54/36
Age (years), median (IQR)
41.0 (32.8, 49.8)
45.0 (36.3, 56.0)
48.5 (36.3, 60.0)
BMI, median (IQR)
25.1 (21.7, 29.1)
24.2 (21.8, 26.7)
24.9 (23.0, 27.8)
Present smoking No. (%)
7 (20.6%)
22 (26.8%)
20 (22.2%)
Allergy No. (%)
5 (14.7%)
33 (40.2%)
36 (40.0%)
Asthma No. (%)
0 (0%)
0 (0%)
62 (68.9%)
Polyp recurrence No. (%)
–
0 (0%)
63 (70.0%)
Lund-Mackay CT score, median (IQR)
Peripheral Blood Eosinophil Percentage (%), median (IQR)
2.0 (0.5, 3.3)
4.7 (2.5, 6.2)
4.85 (2.8, 7.4)
Tissue Eosinophils (/HPF), median (IQR)
–
Tisuee IL-5 (pg/mL), median (IQR)
–
Extended Data Table 2 | Multiple linear regression analyses
Control ( )
NP ( )
svNP ( )
NP vs. Control
svNP vs. Control
svNP vs. NP
Adjusted mean difference (95% CI)
P value
Adjusted mean difference (95% CI)
P value
Adjusted mean difference (95% CI)
P value
GZMK (ng/mL)
0.793 (0.353)
1.720 (1.580)
2.690 (2.190)
0.939 (0.042 to 1.836)
0.042
1.855 (0.953 to 2.758)
0.917 (0.293 to 1.541)
0.005
CT score
3.29 (3.77)
15.6 (5.32)
18.2 (4.54)
12 (9.6 to 14.4)
14.6 (12.2 to 17)
2.6 (0.9 to 4.2)
0.003
Smoke*
3 (14.3%)
15 (24.2%)
3 (14.3%)
0.1(0 to 0.3)
0.13
0.1(-0.1 to 0.3)
0.325
0 (-0.2 to 0.1)
0.45
*Non-smoke = 0; Smoke = 1.
natureportfolio
Corresponding author(s): Hai Qi, Luo Zhang, Jianbin Wang, Xin Liu
Last updated by author(s): Nov 6, 2024
Reporting Summary
Nature Portfolio wishes to improve the reproducibility of the work that we publish. This form provides structure for consistency and transparency in reporting. For further information on Nature Portfolio policies, see our Editorial Policies and the Editorial Policy Checklist.
Statistics
For all statistical analyses, confirm that the following items are present in the figure legend, table legend, main text, or Methods section.
n/a
□
□
□
□
□
□
□
X
X
A description of all covariates tested
□ A description of any assumptions or corrections, such as tests of normality and adjustment for multiple comparisons
A full description of the statistical parameters including central tendency (e.g. means) or other basic estimates (e.g. regression coefficient) AND variation (e.g. standard deviation) or associated estimates of uncertainty (e.g. confidence intervals)
For null hypothesis testing, the test statistic (e.g. F, t, r) with confidence intervals, effect sizes, degrees of freedom and value noted Give values as exact values whenever suitable.
□ For Bayesian analysis, information on the choice of priors and Markov chain Monte Carlo settings
□ For hierarchical and complex designs, identification of the appropriate level for tests and full reporting of outcomes
Confirmed
The exact sample size for each experimental group/condition, given as a discrete number and unit of measurement
A statement on whether measurements were taken from distinct samples or whether the same sample was measured repeatedly
The statistical test(s) used AND whether they are one- or two-sided
Only common tests should be described solely by name; describe more complex techniques in the Methods section.
Estimates of effect sizes (e.g. Cohen’s , Pearson’s ), indicating how they were calculated
Our web collection on statistics for biologists contains articles on many of the points above.
Software and code
Policy information about availability of computer code
Data collection
Data analysis
The proteomics data were collected in the study using commercial Thermo Scientific Xcalibur Software (version 4.2).
Flowcytometry data were collected using BD FACSDIVA (version 8.0.1.)
Imaging data were collected using Zen (version 2.3).
The bulk TCR-seq dataset were analyzed by Cutadapt (version 1.18), TRUST4 (version 1.0.2), Igblast (version 1.16.0), R (version 3.5.1) with package ggplot2 (version 3.3.3) and circlize (version 0.4.15).
The single cell sequencing data analyses were performed using CellRanger (version 3.0), Igblast (version 1.16.0), cellphoneDB (version 3), Monocle3 (version 1.3.1), Cytoscape (version 3.10.1), R (version 3.5.1) with package Seurat (version 3.0.2) and ggplot2 (version 3.3.3) and R (version 4.0.3) with package Seurat (version 4.3.0.1). TCR specificity prediction was done by using GLIPH2 web portal (http://50.255.35.37:8080) and the results were graphed using Cytoscape (version 3.10.1).
The LCM-seq data was analyzed by Salmon (version 0.8.2) and R (version 3.5.1) with package DESeq2 (version 1.22.2).
Database searching for the raw mass-spectrometric data were performed using the Thermo Fisher Proteome Discoverer (version 2.3). The Protein-protein interaction analyses were performed using Cytoscape (version 3.9.1.).
ROC analysis was performed in R (version 4.3.3) with the pROC package. The multiple linear regression analyses were performed using the emmeans package in (version 4.3.3).
Flow cytometry data were processed and analyzed using FlowJo V10.
Imaging data were processed and analyzed using Imaris V7.6.5 and Zen 2.3 .
Statistical analyses were performed by Prism 9 (GraphPad)
For manuscripts utilizing custom algorithms or software that are central to the research but not yet described in published literature, software must be made available to editors and reviewers. We strongly encourage code deposition in a community repository (e.g. GitHub). See the Nature Portfolio guidelines for submitting code & software for further information.
Data
Policy information about availability of data
All manuscripts must include a data availability statement. This statement should provide the following information, where applicable:
Accession codes, unique identifiers, or web links for publicly available datasets
A description of any restrictions on data availability
For clinical datasets or third party data, please ensure that the statement adheres to our policy
Research involving human participants, their data, or biological material
Policy information about studies with human participants or human data. See also policy information about sex, gender (identity/presentation), and sexual orientation and race, ethnicity and racism.
Reporting on sex and gender
Patients were recruited without sex considerations, and the demographic profiles were included in Extended Data Table 1 and Supplementary Figure 6.
Reporting on race, ethnicity, or other socially relevant groupings
Patients were recruited without race or ethnicity considerations.
Population characteristics
Detailed population characteristics are summarized in Extended Data Table 1.
Recruitment
A total of 206 subjects ( 172 diagnosed with chronic rhinosinusitis with nasal polyp and 34 with septal deviation) were recruited from the Department of Rhinology and Allergy in Beijing Tongren Hospital from 2011 to 2024. Patients who had immunodeficiency, pregnancy, chronic rhinosinusitis without nasal polyps, allergic fungal sinusitis, cystic fibrosis or had taken oral corticosteroids 4 weeks prior to the surgery were excluded from the study. Patients were randomly recruited from the clinic with consistent inclusion and exclusion criteria to minimize self-selection bias.
Ethics oversight
The study was approved by the Medical Ethics Committee of Beijing Tongren Hospital (TREC2009-27, TRECKY2019-027 and TREC2022-KY127). All participants provided written informed consent.
Note that full information on the approval of the study protocol must also be provided in the manuscript.
Field-specific reporting
Please select the one below that is the best fit for your research. If you are not sure, read the appropriate sections before making your selection.
Life sciences □ Behavioural & social sciences □ Ecological, evolutionary & environmental sciences
For a reference copy of the document with all sections, see nature.com/documents/nr-reporting-summary-flat.pdf
Life sciences study design
All studies must disclose on these points even when the disclosure is negative.
Sample size
Data were pooled from 2-4 independent experiments. For each experiment, at least two animals were included in each group. The sample size was chosen empirically to provide a sufficient level of statistical power for detecting indicated biological effects. No statistical methods were used to pre-determine the sample size.
Data exclusions
In the single cell analyses, the cell clusters expressing a mean percentage of more than mitochondrial genes were excluded. TCR-related genes were removed from the gene expression matrix in tissue cell subsets.
Replication
All experiments were repeated at least twice, and experimental findings were reproducible across independently repeated experiments as indicated.
Randomization
For experiments in Extended Data Figure 8 and Supplementary Figure 9, sex- and age- matched animals were assigned to different experimental groups based on their genotype. For experiments in Figure 5, Extended Data Figure 7a-d, 9, 10, animals of the indicated
Blinding
Analyses for the immunohistochemistry data of human nasal tissues were conducted by researchers blinded to the patient information. The murine lung function assays were run by researchers blinded to group allocations. For other analyses that were based on subjective instrumental measurements, blinding was not performed.
Reporting for specific materials, systems and methods
We require information from authors about some types of materials, experimental systems and methods used in many studies. Here, indicate whether each material, system or method listed is relevant to your study. If you are not sure if a list item applies to your research, read the appropriate section before selecting a response.
Materials & experimental systems
Methods
n/a
Involved in the study □ ChIP-seq □ □ Flow cytometry
Policy information about cell lines and Sex and Gender in Research
Cell line source(s)
Authentication
Mycoplasma contamination
Commonly misidentified lines
(See ICLAC register)
293-F cells were obtained from Thermo Fisher; THP-1 cells were obtained from the National Infrastructure of Cell Line Resource of China. Cell lines were validated and tested negative for mycoplasma contamination by the providers.
No specific procedure was taken to authenticate the cell line identity.
The cell line has been tested negative for mycoplasma contamination.
The cell line used in this study is not commonly misidentified.
Animals and other research organisms
Policy information about studies involving animals; ARRIVE guidelines recommended for reporting animal research, and Sex and Gender in Research
Laboratory animals
Wild animals
Mice used in this study are in the C57BL/6J background. All animals were housed as groups of 4 to 6 individuals per cage and under specific-pathogen free condition. Mice were housed with filtered air, sterile pellet food, an acidified watering system and a 12-h light/ dark cycle. The temperature was kept at and humidity at . All animal experiments were approved by the Institutional Animal Care and Use Committee in accordance of governmental and Tsinghua guidelines for animal welfare. Littermates and co-housed animals between 6 and 12 weeks of age were used for experiments.
The study did not involve wild animals.
Reporting on sex
Generally both female and male animals were included in the study without selection bias. In the lung function assays, only data from the male mice were pooled due to sex-based differences in relevant parameters.
Field-collected samples
The study did not involve samples collected from the field.
Ethics oversight
All experiments were approved by the Tsinghua University Institutional Animal Care and Usage Committee.
Note that full information on the approval of the study protocol must also be provided in the manuscript.
Flow Cytometry
Plots
Confirm that:
The axis labels state the marker and fluorochrome used (e.g. CD4-FITC).
The axis scales are clearly visible. Include numbers along axes only for bottom left plot of group (a ‘group’ is an analysis of identical markers).
All plots are contour plots with outliers or pseudocolor plots.
A numerical value for number of cells or percentage (with statistics) is provided.
Methodology
Sample preparation
For the analyses of the human samples, single cell suspensions were prepared from the nasal tissues, blocked with the human TruStain reagents (Biolegend) in FACS buffer (PBS with 1% of FBS and 5 mM EDTA) and stained with surface antibodies and other reagents as indicated. For some of the analyses, cells were further fixed and permeabilized by the Cytofix/Perm kit (BD) and stained with antibodies targeting intracellular antigens. For the murine study, cells from the bronchoalveolar lavage fluid were first incubated with the 2.4 G 2 antibodies in FACS buffer, and stained with reagents as indicated.
Data were acquired on an Aurora (Cytek) or an FACSAria III cytometer (BD Biosciences).
All flow cytometry data were processed and analyzed using FlowJo (version 10, TreeStar).
At least 10,000 events were acquired for cells in the defined gates.
For all experiments, FSC-A/ SSC-A gates of the starting cell population were used to identify viable cells. Singlet cells were identified using FSC-H/ FSC-W gating. Isotype controls were used to distinguish between background and marker-positive events.
Tick this box to confirm that a figure exemplifying the gating strategy is provided in the Supplementary Information.
Instrument
Software
Cell population abundance
Gating strategy
Department of Otolaryngology Head and Neck Surgery, Beijing TongRen Hospital, Capital Medical University, Beijing, China. Beijing Key Laboratory of Nasal Disease, Beijing Institute of Otolaryngology, Beijing, China. Laboratory of Dynamic Immunobiology, Institute for Immunology, Tsinghua University, Beijing, China. Tsinghua-Peking Center for Life Sciences, Beijing, China. School of Life Sciences, Tsinghua University, Beijing, China. School of Basic Medical Sciences, Tsinghua Medicine, Tsinghua University, Beijing, China. Department of Allergy, Beijing TongRen Hospital, Capital Medical University, Beijing, China. Changping Laboratory, Beijing, China. New Cornerstone Science Laboratory, Tsinghua Medicine, Tsinghua University, Beijing, China. Beijing Frontier Research Center for Biological Structure, Tsinghua University, Beijing, China. Beijing Key Laboratory for Immunological Research on Chronic Diseases, Tsinghua University, Beijing, China. SXMU-Tsinghua Collaborative Innovation Center for Frontier Medicine, Shanxi Medical University, Taiyuan, China. These authors contributed equally: Feng Lan, Jizhou Li, Wenxuan Miao, Fei Sun. e-mail: xil2020@tsinghua.edu.cn; jianbinwang@tsinghua.edu.cn; dr.luozhang@139.com; qihai@tsinghua.edu.cn
McInnes, I. B. & Gravallese, E. M. Immune-mediated inflammatory disease therapeutics: past, present and future. Nat. Rev. Immunol. 21, 680-686 (2021).
Matos, T. R. et al. Clinically resolved psoriatic lesions contain psoriasis-specific IL-17-producing alphabeta T cell clones. J. Clin. Invest. 127, 4031-4041 (2017).
Camus, M. et al. Oligoclonal expansions of mucosal T cells in Crohn’s disease predominate in NKG2D-expressing CD4 T cells. Mucosal Immunol. 7, 325-334 (2014).
Morgan, D. M. et al. Clonally expanded, GPR15-expressing pathogenic effector TH2 cells are associated with eosinophilic esophagitis. Sci. Immunol. https://doi.org/10.1126/ sciimmunol.abi5586 (2021).
BMI, body mass index; CT, computed tomography; HPF, high-power magnification field; IQR, Interquartile range.