تسليط الضوء على طيف رامان أثناء التشغيل يكشف أن الهيدروكسيد وأنواع CO تعزز انتقائية الإيثانول خلال اختزال CO2 الكهربائي النبضي Operando Raman spectroscopy uncovers hydroxide and CO species enhance ethanol selectivity during pulsed CO2 electroreduction
نبضيالاختزال الكهربائي ) قد ظهرت مؤخرًا كطريقة سهلة لضبط انتقائية المنتج في الموقع، لا سيما نحو الإيثانول، دون إعادة تصميم النظام الحفاز. ومع ذلك، يتطلب الفهم الميكانيكي العميق دراسات شاملة في الوقت الحقيقي لتحديد الحركيات والديناميات لواجهة التحفيز الكهربائي. هنا، نتتبع المواد الماصة وحالة الحفاز المعالجة مسبقًا نانوكubes ) أثناء النبض باستخدام مطيافية رامان العملية ذات الدقة الزمنية دون الثانية. من خلال فحص مجموعة متنوعة من ظروف طول نبضات توجيه المنتج، نكشف عن الدور الحاسم لـ OH و CO المترسبين معًا على سطح النحاس بجوار التكوين الأكسيدي لـ أو الأنواع، مما يؤثر على حركية امتصاص ثاني أكسيد الكربون ويعزز انتقائية الإيثانول. ومع ذلك، فإن مستوى منخفض جداًالتغطية بعد تشكيل كتلة مشابهةيؤدي إلى زيادة كبيرة فيالانتقائية، بينما تكون مرتفعة جداًالتغطية تسمم السطح لـ الاقتران. وبالتالي، نكشف عن أهمية OH المترسبة معًا في تكوين الكحول تحت الظروف وبالتالي تمهيد الطريق لتصميم المحفزات المحسن وظروف التشغيل.
في إطار تقليل العالميةالانبعاثات للحد من تغير المناخ، وقد حظيت تقنيات صافي الكربون الصفري باهتمام كبير. واحدة من التقنيات الواعدة هي، الذي يغلق دورة الكربون من خلال استخدام الطاقات المتجددة لتحويلإلى مواد كيميائية ووقود مفيدة مرة أخرىمن بين المعادن المدروسة، تتمتع الأقطاب النحاسية فقط بالقدرة الفريدة على إنتاج الكحوليات والهيدروكربونات ذات الكثافة الطاقية المطلوبة مثل الإيثانول والإيثيلين بكميات كبيرة.. ومع ذلك، من أجل المزيد من الترويج التجاري في الإلكتروليزر عالي التيار، لا تزال المحفزات القائمة على النحاس تعاني من توزيع واسع للاختيارية، وانخفاض النشاط، وانخفاض الاستقرار خلال التشغيل على المدى الطويل.
تم تطوير عدة استراتيجيات لمعالجة هذه القضايا وزيادة توزيع المنتج نحوالمنتجات، التي تشمل ضبط هيكل المحفز وتركيبهوتعديل الإلكتروليتبالإضافة إلى ذلك، يلعب حالة الأكسدة (الأولية) للنحاس دورًا رئيسيًا، حيث أظهرت أنواع النحاس المؤكسدة ومواد النحاس المستمدة من الأكسيد تحسينًا كبيرًا في الانتقائية والثباتية للعوامل الحفازة.وبالتالي، فإن طريقة بسيطة لتجديد حالة الأكسدة المرغوبة للنحاس في الموقع هي من خلال استخدام الجهد النبضي.، حيث يتناوب جهد التحفيز الكهربائي بين الأكسدة وإمكاناتوبهذا، فإن المعلمات الرئيسية للنبض هي
تم تطبيق الجهد الكاثودي والجهد الأنودي، شكل النبضة بالإضافة إلى طول النبضة.
من خلال تغيير طول النبضات الكاثودية والأنودية فقط، مع الحفاظ على ثوابت نبضات أخرى، يمكن تحسين الخصائص التحفيزية لأقطاب النحاس.. بهذه الطريقة، فإن الكمية، بالإضافة إلى نوع أنواع أكسيد النحاس ( ) تشكلت على سطح المحفز، تم التحكم فيها بشكل خاص، غير متبلور مشوّهتشكلت المجالات عند نبضات أنودية قصيرة (أقل من 2 ثانية) كما يتضح من طيف الامتصاص بالأشعة السينية أثناء التشغيل (XAS) وحيود الأشعة السينية (XRD)، والتي ارتبطت بزيادة في تكوين الإيثانول.التناوب الديناميكي للتأثيرات المحتملة أيضًا إعادة هيكلة (تشكيل الوجوه والعيوب) وت roughening المحفز عند أطوال نبض أنودي أطول (أكثر من 1 ثانية)، والتي لوحظ أنها تعزز انتقائية إما الميثان أو الإيثيلين.. ومع ذلك، فإن الديناميات المستحثة على تغطية السطح للهيدروجين ( ) ، هيدروكسيد ( ) وأول أكسيد الكربون ( ) ضرورية لفهم المبدأ الأساسي لتغيرات الانتقائية عبر النبضات أظهرت عدة دراسات أن تطبيق النبضة الأنودية يؤدي إلى تغطية أعلى من OH، بينماتم إزالته بسبب الاستقطاب الإيجابي للأقطاب الكهربائية. تم اقتراح أن التغطية الأعلى لـ OH الناتجة ستساعد في استقرار النشاطمقارنةً بالغير نشطنوع، مما يعزز بعد ذلك انتقائية الإيثانول. كما تم ربط التأثير الإيجابي لتغطية OH الأعلى وارتفاع الرقم الهيدروجيني المحلي الناتج بتغيير في طاقة امتصاص CO بالإضافة إلى انخفاض حاجز الاقتران. بينما تم تتبع تكوين ارتباط CO سابقًا باستخدام مطيافية الامتصاص بالأشعة تحت الحمراء المعززة على السطح (SEIRAS) حتى الآن، لا توجد أدلة تجريبية على التغيرات المفترضة في تغطيات OH و CO، ودور OH الممتص في تحديد الانتقائية خارج تفاعل ثنائي أكسيد الكربون لا يزال غير واضح. علاوة على ذلك، يبقى من الصعب تحديد الوجود المحتمل لأكاسيد النحاس على السطح بسبب نقص التوصيفات التشغيلية الحساسة للسطح.. وبالتالي، هذه الأدوات ضرورية للحصول على فهم آلي أفضل للنبضات.
في هذه الدراسة، قمنا، لذلك، بتطبيق مطيافية رامان المعززة على السطح ذات الزمن الزمني المحسوب تحت الثانية (SERS)، وهي طريقة مثالية لتتبع التغيرات في حالة الأكسدة السطحية للنحاس والتغيرات في و المواد الممتصة على السطح وكذلك تغطيتها السطحية. بهذه الطريقة، تابعنا تأثير طول النبضات الأنودية أو الكاثودية المطبقة خلال النبضات.. وبالتالي، تم التناوب بين نبضات الجهد المربعة الكهربائية عند جهد كاثودي كهربائي.عند -1.0 فولت وإمكان أكسدة أنوديةعند +0.6 فولت مقابل القطب الهيدروجيني القابل للعكس (RHE). تم تقليلها مسبقًاالنانو مكعبات (NCs) عملت كعوامل حفازة، والتي تظهر انتقائيات قابلة للتعديل للقيم.منتجات مثل الإيثانول أومنتجات مثل الميثان، اعتمادًا على طول النبضة المختار. على وجه الخصوص، قمنا بربط تعزيز الإيثانول الملحوظ بزيادة في ضد التغطية وتشكيل و أنواع تحت نبضات مختارةالظروف. هنا، نوضح تأثير المواد الممتصة وأنواع السطح على الاتجاهات الانتقائية التي تم الحصول عليها اعتمادًا على أطوال النبضات المطبقة للحصول على رؤى ميكانيكية جديدة بطريقة زمنية دقيقة دون الثانية.
النتائج
التطور الزمني المعتمد على SERS
الشكل 1أ يظهر صورة مجهر إلكتروني مس扫描 (SEM) لـ ( في الحجم) تم وضع المحفزات المسبقة على قطب كربون زجاجي. تم تقليل المحفز المسبق أولاً في إعداد خلية تدفق رامان الكهروكيميائية (الملاحظة التكميلية 1، الأشكال التكميلية 1، 2)، مما أدى إلى فقدان الشكل المكعب الأولي ونمو الجسيمات (حوالي 30 نانومتر في الحجم، الشكل 1ب). بعد ذلك، تم استخدام النبضاتمع طول نبضة كاثودية محددوطول النبضة الأنوديةتم تطبيقه (الجدول التكميلي 1). بالنسبة لجميع النبضاتالقياسات في هذه الدراسة، و (مقابل RHE، لجميع المعروض) الاحتمالات في هذه الدراسة)، ويتكون الإلكتروليت منبيكربونات البوتاسيوم المشبعة ) إذا لم يُذكر خلاف ذلك. نلاحظ أن شكل الجسيمات قد تغير إلى هياكل أكبر بعد النبضكما هو ملاحظ في صورة SEM في الشكل 1c. الشكل 1d يعرض الجهد المطبق والتيار المقاس (الأعلى) خلال النبضات المتماثلة معوشدة إشارات SERS المعيارية المقابلة على مدى تحول رامان (أسفل) كدالة للوقت. بالنسبة لتطبيع طيف SERS، تم تعديل قيم الشدة إلى متوسط 0 وتباين 1. نلاحظ أن الخصائص البصرية للمحفز العامل تتغير تحت ظروف نبض الجهد كما تم تقليلها.تتحول النانومكعبات إلى هياكل نانوية خشنة ومسامية. لذلك، من أجل حساب تعزيز SERS المختلف في ظروف طول النبضة المختلفة، تمت مقارنة نطاقات SERS في هذه الدراسة فقط مع بعضها البعض ضمن نفس الطيف للحصول على نسب الشدة (الملاحظة التكميلية 2). تم ملاءمة الاستجابات الدورية لنطاقات SERS المميزة في هذه المنطقة الطيفية في الشكل 1e (مع أمثلة الملاءمة في الشكل التكميلية 3). النطاقات المميزة المختارة هنا هي: (أنا) الـ الاهتزازات على النحاس، وهي دورانوالتمدد ( ) الاهتزازات عند 280 و حيث يُعتبر أن CO مُمتص على Cu كما هو موضح بواسطة طرق تشخيص السطحتظهر نطاقات CO خلال كل نبضة كاثودية كـالمتوسطات وتختفي خلال النبضات الأنودية . نسبة تغطية سطح CO ( يمكن الحصول عليها من نسبة شدة النطاقين CO الاثنين كـشدةشدة. تم اشتقاق هذه العلاقة بالتفصيل في دراستنا السابقة من خلال قياسات أوبيراندو في وجود تركيزات مختلفة من CO ومن خلال تحليل الاهتزازات باستخدام DFT لتغطيات مختلفة من CO على أسطح. ومع ذلك، فإن الاختلافات الهيكلية والشكلية بين الـالعلاقة المستمدة من أكسيد النحاس المستخدم في هذا العمل لا تسمح بمقارنة مباشرة للنسب وتغطية ثاني أكسيد الكربون: (II) الـاهتزاز على أو بالقرب من النحاس، والذي يمكن أن يظهر أثناء النبضة الكاثودية فيوأثناء النبضة الأنودية التي تم إزاحتها نحو الأحمر عندإذا تم امتصاص OH أو كان قريبًا من سطح النحاس عبر تفاعلات ثنائية القطب. : (III) الفرق المتعلقة بـعلى السطح في (عملية متعددة الفونونات)، (مسموح به رامانالوضع)، و (مسموح به من قبل IRالوضع)، الذي يظهر خلال كل نبضة أنودية بسبب أكسدة النحاس ويختفي مرة أخرى خلال كل نبضة كاثودية بسبب اختزاله . وجود CuO الإضافي أو لا يمكن استبعادها كعنصر ثانوي بسبب مواقع النطاقات المتشابهة. بينما تعيين و مباشر، تعيينلا يزال قيد النقاش، وقد قامت بعض المجموعات أيضًا بتعيين الفرقة فيإلى و نوع. ومع ذلك، فقد أجريت تجارب في عدة دراسات سابقة مع أظهر تحولًا في موضع الشريط، مما يدعم هذا التخصيص للامتصاص الكيميائي.على. علاوة على ذلك، الفرق في و قابل للاكتشاف أثناء الأكسدة الكهروكيميائية لـوتم ربط أسطح النحاس متعددة البلورات من قبل مجموعات أخرى بأنواع OH السطحية من خلالالتجارب وحسابات DFT. تقترح حساباتهم باستخدام نظرية الكثافة أن الفرقة تتوافق مع وضع اهتزاز OH في الموقع العلوي، مما قد يتماشى مع سيناريوهاتنا. على النقيض،تم نسب النطاق إلى وضع الانحناء الحروضع النطاق الذي قد يكون غائبًا في حالتنا بسبب الامتزاز المشترك مع CO.
بالإضافة إلى ذلك، يوجد نطاق كربونات ضعيف عندتم ملاحظته في بعض طيف SERS خلال أول 20 ثانية، كما هو موضح في الشكل التكميلي..
تطور يعتمد على طول النبضة في SERS
من أجل متابعة تأثير مدة النبض الكاثودي والأنودي المطبق على هيكل المحفز والمواد الممتصة، قمنا بمتوسط طيف SERS العامل المنظم للظروف النبضية المختارة و
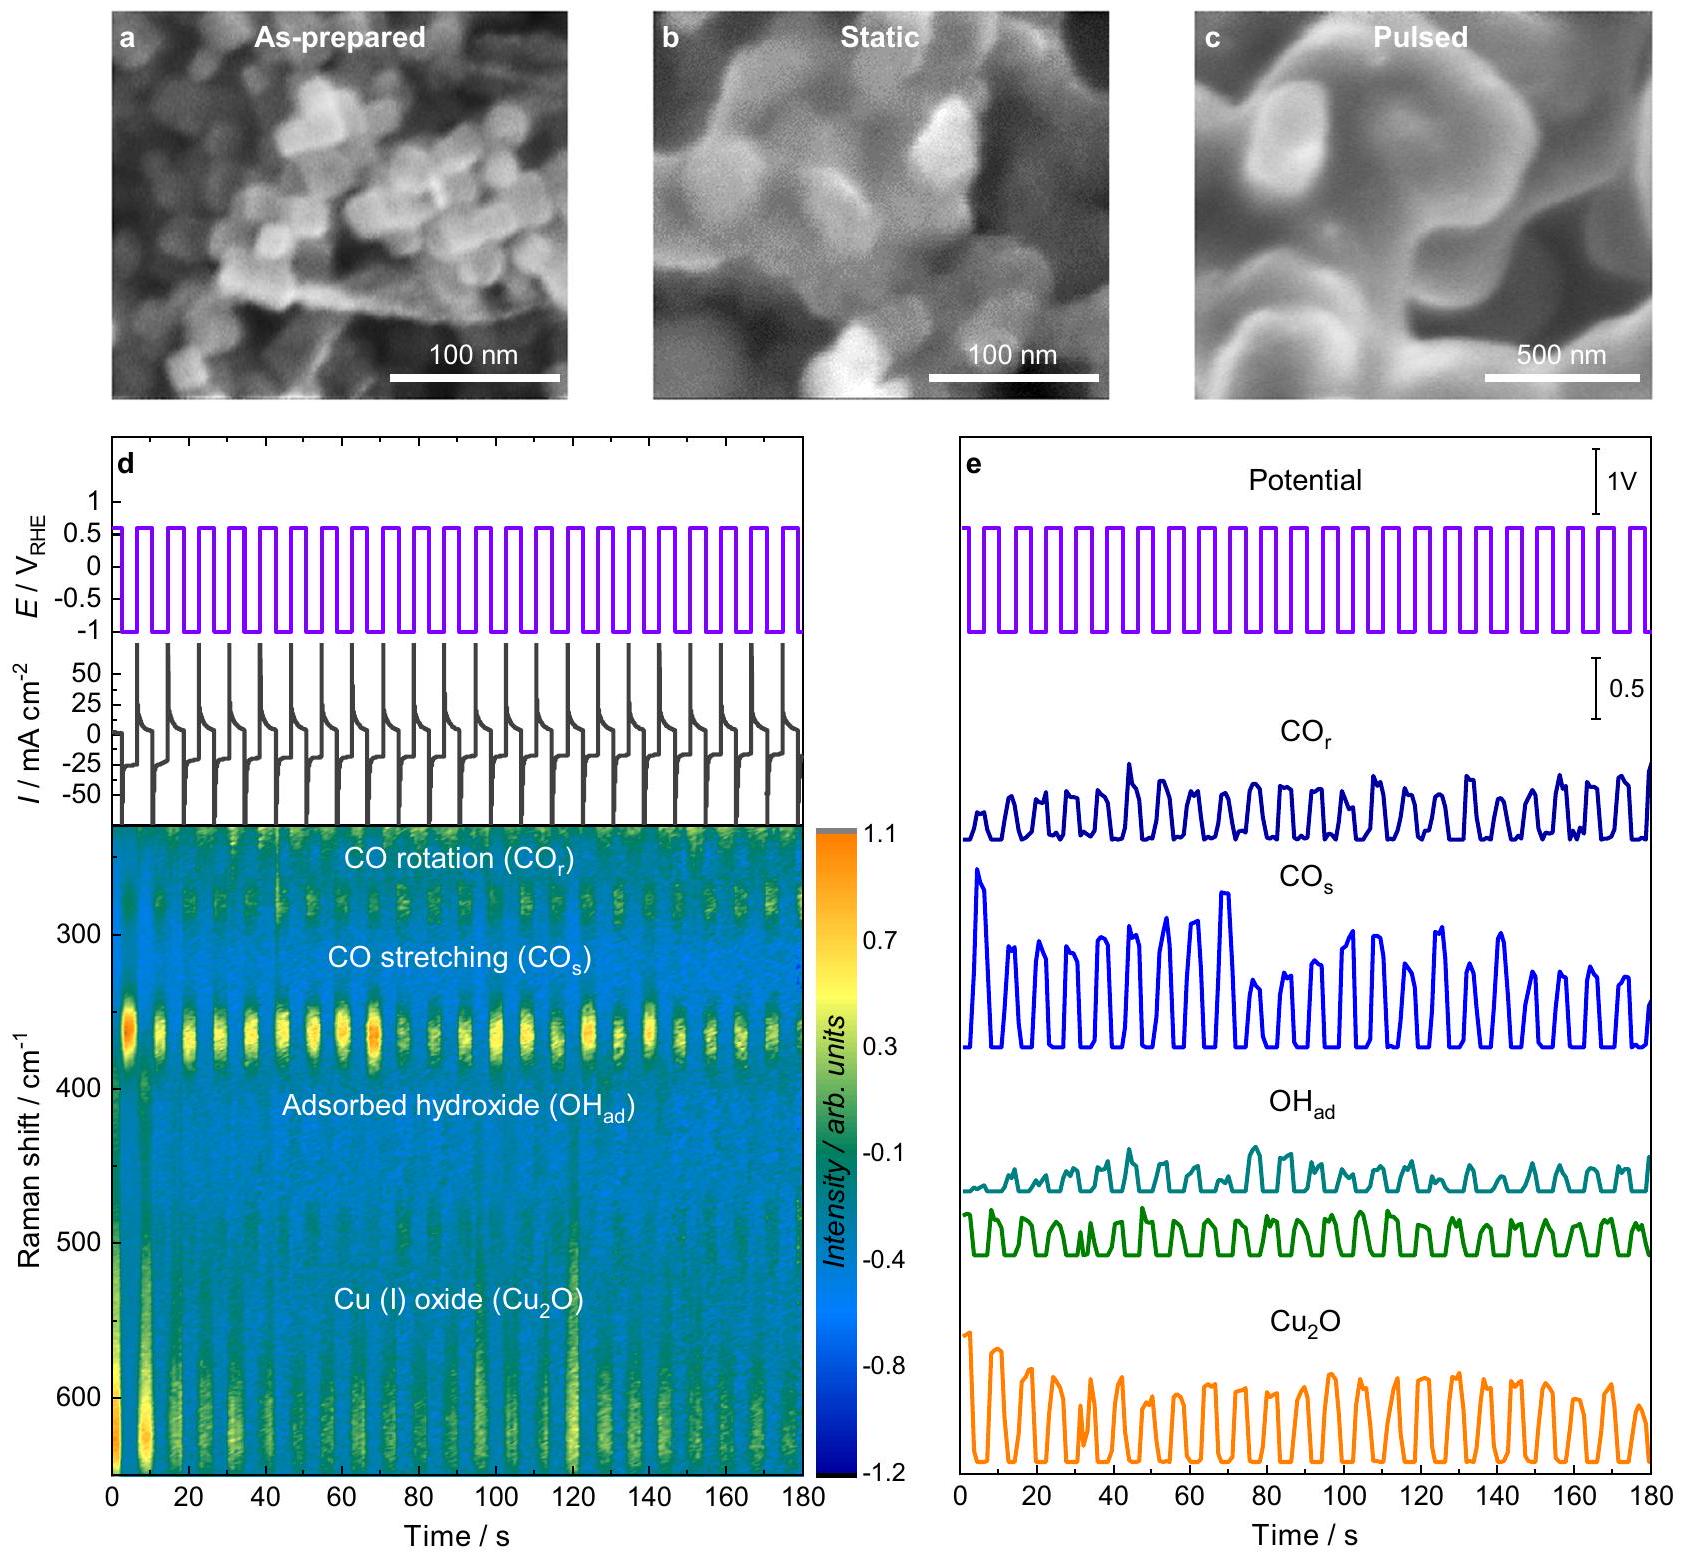
الشكل 1 | الشكل والمظهر الزمني لتطور شدة SERS خلال النبضصور SEM خارج الموقع للأقطاب الكهربائية المحضرة حديثًا،بعد الجهد الثابتعند -1.0 فولت لمدة ساعة واحدة، وبعد النبضفي و معلـ الجهد المطبق وكثافة التيار مع مرور الوقت مع (الأعلى) والتطور الزمني المقابل لشدة إشارة SERS مع علامات رامان المميزة (أسفل). تم تطبيق الجهد على مر الزمن وكثافات التوافق للعلامات رامان المميزة المختارة، وهيدوران (“أزرق داكن”،تمديد“أزرق فاتح”، عند -1.0 فولت باللون التركوازي و عند +0.6 فولت باللون الأخضر) وأكسيد النحاس (I) (مجموع 530 ومقسومًا على اثنين، برتقالي) أشرطة. تم تركيب الحزم المميزة على مدى تسلسل نبضي واحد، كما هو موضح في الشكل 2. يتم التركيز على ثلاثة أنظمة نبضية تعتبر نموذجية لأعلى مستوى من الإيثانول (نظام الإيثانول، الشكل 2a، d)، الإيثيلين/الأسيتالديهيد ( النظام، الشكل 2ب، هـ)، و انتقائية المنتج النظام، الشكل 2c، f). يتميز نظام الإيثانول (EtOH) بنبضات أنودية قصيرة ( ) ، الـ نظام بواسطة نبضات أنودية متوسطة )، وفي كلا الحالتين، فإن النبضات الكاثودية لها طول متوسط قدره 4 ثوانٍ. بالمقابل، فإن النبضات الأنودية الطويلة ( ) مقترنًا مع نبضات كاثودية قصيرة ( ) تمثل الـ نظام. وبالتالي، شدة الـ مقارنة بـ انخفض النطاق مع الأقصروهو الأصغر في نظام الإيثانول.الفرقة أكثر كثافة خلال الفترات القصيرةفينظام، بينما لاأشرطة النحاس الأكسيد، ولكن أشرطة النحاس الأكسيد أقوى خلال فترة طويلةوالقصير اللاحقيمكن اكتشافه في النظام. يتم التأكيد على هذه الملاحظات من خلال بيانات SERS إضافية عند أطوال نبض مختلفة (الأشكال التكميلية 5، 6). خلال النبضات الأنودية، زادت شدة الحزمة مع مدة النبضة الأنودية، وكانت ضعيفة بالمقارنة عندفي نظام الإيثانول. ومن المثير للاهتمام، أن هناك أيضًا مساهمة منمرئي في منطقةخلال النبضة الأنودية في نظام الإيثانول للنبضات الأنودية التي تقل عن 2 ثانية (الشكل التوضيحي 5 أ، ب)تحت هذه الظروف، أيضًا مكثففرق وأشرطة إضافية في و تم اكتشافها، والتي يمكن أن تُعزى إلى الاضطرابنوع. علاوة على ذلك، فإن نطاق الكربونات فيتمت ملاحظته بشكل رئيسي عند بداية كل من النبضات الأنودية والكاثودية، وربما يكون مرتبطًا بالتغيرات الديناميكية في الطبقة الكهربائية المزدوجة. ومع ذلك، نظرًا لانخفاض شدة النطاقات تحت هذه الظروف، فإنه من الصعب تحليل خصائصه بشكل شامل (الأشكال التكميلية 5-7). للتحقق من قابلية تكرار البيانات، تم تكرار تجارب أنظمة المنتجات الرئيسية على أقطاب تم تحضيرها حديثًا، مما أظهر طيفًا واتجاهات مشابهة (الشكل التكميلية 9).
الشكل 2 | تطور طيف SERS المعتمد على طول النبضة والأطياف المميزة. أ-ج أطياف SERS المعيارية من الأسفل إلى الأعلى (كما هو موضح بالأسهم) مع تسليط الضوء على الأطياف المميزة لـ SERS خلال النبض.مع أطوال نبضات متغيرة في و و شدة أطياف النطاقات المميزة لـ SERS المتوسطة على مدى تسلسل نبض واحد عند نبضة مختارة أطوال. جميع أطياف SERS المتوسطة لـمبين في الشكل التكميلية 8. نقاط البيانات فيتمثل ملاءمات الشدة لـأزرق داكن“أزرق فاتح”، عند -1.0 فولت باللون التركوازي و عند +0.6 فولت باللون الأخضر)، (مجموع 530 و مقسوم على اثنين، برتقالي)توضح الخطوط الحمراء التناسبات الأسية وتعمل كدلائل للعين.
للحصول على رؤى إضافية حول متوسط تغطية السطح للأنواع المميزة وسرعات الامتزاز/إزالة الامتزاز والأكسدة/الاختزال المقابلة، قمنا بإجراء ملاءمات أسية لشدة أطياف رامان خلال ملفات النبض المتوسطة (الشكل 2d-f، الشكل التكميلي 10، الجداول التكملية 2-4). على وجه الخصوص، تغيرت حركيات الامتزاز وإزالة الامتزاز لثاني أكسيد الكربون على النحاس مع أطوال النبض المطبقة (الجدول التكميلي 3). على سبيل المثال، في نظام الإيثانول،زادت شدة الشريط مرتين أسرع خلال النبضة الكاثودية مقارنةً بتناقصها خلال النبضة الأنودية. بالإضافة إلى ذلك،نسبة شدة الحزمة، التي تعكس تغطية سطح CO، تصاعدت تدريجياً وباستمرار طوال نبضة الكاثود (الشكل التكميلي 11). تشير هذه النتائج إلى تغيير في
تكوين ارتباط CO خلال النبضة الكاثودية، والذي من المتوقع أن يكون له آثار على الوظيفة التحفيزية.
يمكن تقييم الاختلافات في تكوين ارتباط أول أكسيد الكربون من حيث مواقع امتصاص أول أكسيد الكربون بشكل أكبر من خلال اهتزاز تمدد C-O عند أرقام موجية أعلى.، الأشكال التكميلية 12، 13). بشكل خاص، تظهر طيف SERS مساهمة الجسرفيواثنان في الأعلىنطاقات، وهي النطاقات المنخفضة التردد الخطيةفيوترددات عاليةفيالأشرطة، كما هو موصوف في الأدبياتمساهمةالمواقع، التي عادة ما تكون مرتبطة بـاقترانأكثر بروزًا في الإيثانول والأنظمة (الشكل التكميلي 13). بدلاً من ذلك، مساهمة المواقع، التي تعتبر عادة غير نشطة لتفاعل الربط C-C، زادت بشكل كبير في النظام. ومع ذلك، وجدنا عدم يقين عالٍ خلال عدة تسلسلات نبض بسبب التفاعلات السطحية المتطورة باستمرار التي تؤدي إلى الطبيعة الديناميكية لـاهتزازات الشد عند انزياحات رامان العالية.
لـالأنواع، بدورها، ليس من السهل استخراج سلوك الامتصاص والإزالة لأن الأطياف قد انتقلت أيضًا عند تغيير الجهد وتداخلت جزئيًا مع التطورات.الأشرطة خلال النبضة الأنودية (الشكل 2أ، ب). من المحتمل أن يكون تحول الأشرطة ناتجًا عن تأثير ستارك بسبب التغير في المجال الكهربائي، مع معدل ضبط ستارك معقول منبدلاً من تغيير في تكوين الروابط لـكما تم مناقشته أيضًا في الأدبيات حيث تم تغيير الجهد فقط بواسطة. علاوة على ذلك، من المحتمل أنهو وسيط لـتشكيل خلال النبضة الأنودية.
امتصاص الأكسجين على سطح النحاس والأكسدة إلىكان زمن الاستجابة فوق النبضة الأنودية، تحت جميع ظروف النبض المطبقة، أبطأ من عملية الإزالة/الاختزال المقابلة عند تطبيق النبضة الكاثودية (الجدول التكميلي 4). في الـالنظام، كمية السطح زادت باستمرار بأسرع وتيرة، مما يشير إلى نمو مستمر لطبقة الأكسيد على مدار النبضة الأنودية. علاوة على ذلك، فإن الأوزان الطيفية للثلاثة المفككة تغيرت الأشرطة عند أطوال نبض مطبقة مختلفة (الجدول التكميلي 5). المساهمة النسبية لشدة الشريط عندأقوى خلال نبضات الكاثود الأطول، والتي قد تكون تأثرت بالنسبة الأعلى منمن ناحية أخرى،
الشكل 3 | خرائط الانتقائيات والمواد الممتصة المعتمدة على طول النبضة. التغيرات في انتقائيات المنتج خلال النبضاتمعبالنسبة لطول النبضات الأنودية والكاثودية بعد طرح القيم المقابلة تحت الحالة الثابتةالظروف عند -1.0 فولت (المشار إليها بـ ). تغيير ( ) من
شدة 530 وتساهم الأشرطة بشكل أقوى في النبضات الكاثودية الأقصر. تحليل التطور الزمني لهذه الأشرطة فيالنظام (الشكل التوضيحي التكميلي 14) كشف أن شدة النطاق النسبي عندكان الأعلى في الثانية الأولى من النبضة الأنودية، وزادت وزنه الطيفي قليلاً فقط في ما يلي. أيضًا، تطور شدة الـتشير الفرقة إلى حد أقصى مؤقت في المرحلة الأولية من النبضة الأنودية. على النقيض من ذلك، فإن شدة الـزاد النطاق بشكل أحادي على مدار نبضة الأكسدة. قد تمثل هذه التغييرات تشكيل/تبلور الـطبقة تنهي مجالات النحاس. في عملنا السابق، أظهرنا باستخدام الأشعة السينية في الموقع أنه خلال فترة نبضة جهد أنودي، تتبلوركانت المجالات بحجم يصل إلى 3 نانومتر موجودة في نهاية نبضة أنودية مدتها 10 ثوانٍ. بالإضافة إلى ذلك، كشفت تقنية XAS أثناء التشغيل عن مساهمة طفيفة لمراحل أخرى من النحاس (مثل مركبات النحاس (II) مثلفي المرحلة الأولية من الأكسدة الكهروكيميائية، والتي من المحتمل أن تكون غير مرتبة بشكل كبير وبالتالي غائبة في بيانات حيود الأشعة السينية. ومع ذلك، لا يمكن ربطها مباشرة بنوع معين من الأنواع الكاتيونية للنحاس (على السطح) بناءً على مطيافية رامان المعززة.
ارتباطات الانتقائية، الهيكل، والحركيات
لاستخراج الرابط بين المواد الماصة على السطح والوظيفة التحفيزية، يوضح الشكل 3 التغير في شدة نطاقات SERS (الجدول التكميلي 2) وفي الكفاءات فارادايك.خلال النبض بالمقارنة مع الثابت الظروف عند -1.0 فولت التي تم الحصول عليها من مجموعة متنوعة من أطوال النبضات الأنودية والكاثودية مجموع كفاءات فاراداي ( ) من الرئيسية المنتجات (CO و ). توزيع شدة SERS لـ التغطية على النحاس. من الإيثانول (EtOH). توزيع شدة SERS العادية تم أخذ بيانات الانتقائية من المحفزات المتماثلة المدرجة في منشورنا السابق.
الشكل 4 | تغيير الانتقائية المرتبط بـالعلاقات بين تغيير الانتقائيةمن المنتجات المختارة (أول أكسيد الكربون، الإيثيلين، الأسيتالديهيد، والإيثانول) وتحت النبضالشروط بعد طرح القيم المقابلة تحت الثابت الظروف عند -1.0 فولت. تمثل النجمة الخضراء تغيير انتقائية الإيثانول خلال النبضاتحتى إمكانيات غير مؤكسدة عند. الشروط. نحن صورنا الـبدلاً من الكثافات الحالية الجزئية للمنتجات للمقارنة مع التغيرات النوعية في الوزن الطيفي النسبي للشرائط المتعلقة بالمواد الممتصة من SERS. توضح الشكل 3b التغيرات في خلال الجزء الكاثودي من النبض، الذي يمكن تحديده من خلال نسبة الـ و كثافات النطاقاتلقد تم إظهار أن تغطية سطح CO مهمة سابقًا لخطوة اقتران C-C، ويمكن ربط تغطية CO الأعلى بزيادةالمنتجاتتحت النبضالتغطية المحددة لثاني أكسيد الكربون تكاد تكون غير متغيرة فيالنظام ولكن انخفض في نظام الإيثانول، بينما زاد فيالنظام مقارنة بالثابتلذا، لا يبدو أن تغطية أول أكسيد الكربون هي المعلمة الحاسمة الوحيدة التي تحدد انتقائية المنتج تحت الظروف النبضية.
لذلك، قمنا بمزيد من التحقيق في دورحيث كانت تأثيراته المفيدة حتى الآن مجرد فرضيات أو مقترحات من دراسات (نظرية) و/أو لم يتم قياسها.الشكل 3د يعرض تغيير القيم المعنويةالكثافات خلال النبضة الكاثودية (الملاحظة التكميلية 2). تُبرز هذه الخريطة الزيادةشدة عند أطوال نبضات أنودية أقصر ( ) بالمقارنة مع الثابت الشروط، بينما انخفضت الشدات عند أطوال نبض الأنود الأطول. هذا يتناسب مع تغيير الـالمنتجات (الشكل 3أ) لخفض OH بالإضافة إلى زيادة انتقائية EtOH عند أطوال نبض أنودي أقصر لشدات OH أعلى (أي، التغطية) (الشكل 3ج).
بالإضافة إلى متوسط كثافات الحزم، من المتوقع أيضًا أن تؤثر حركيات تكوين الوسطاء بشكل كبير على توليد المنتجات المرصودة بسبب التغيرات المدخلة من خلال نبض الجهود. لذلك، فإن الخرائط المقابلة للامتصاص/إزالة الامتصاص لـ و ، بالإضافة إلى الأكسدة والاختزال لـاعتمادًا على حالة أطوال النبضات، يمكن إنشاؤه باستخدام الثابت الزمني للتناسبات الأسية من الشكل 2 (الأشكال التكميلية 15-17، الجداول التكميلية 3، 4). في نظام الإيثانول، و تطورت الاهتزازات بشكل أسرع من اختفائها (الشكل التكميلي 15)؛ وبالتالي، كان أول أكسيد الكربون متاحًا بسرعة لتكوين الإيثانول في هذه الأطوال النبضية. علاوة على ذلك، فإن حركيات الامتزاز وإزالة الامتزاز لـ ضد (الشكل التوضيحي 16)، الذي يؤثر مباشرة على تغطية سطح CO، يشير إلى حركيات أسرع لـ مقارنةً بـ . هذا يعني أن ثاني أكسيد الكربون المتاح بسرعة من السطح يأتي أولاً بشكل رئيسي من الذي تم ربطه بـاقترانفي الأدبيات.
علاوة على ذلك، على الرغم من أننا لم نتمكن من قياس شدة الأطياف المتعلقة بأكاسيد النحاس بسبب حساسيتها القوية لتقنية SERS وغياب معلمة التطبيع، إلا أنه يمكننا متابعة التطور الحركي لـعند أطوال نبضات أنودية قصيرة والسطحفي أطوال نبضات أنودية طويلة (الشكل التوضيحي 17). على وجه الخصوص، يُظهر هذا أنتم امتصاصها بشكل أسرع حركيًا في نظام الإيثانول مقارنةً بالسطحفيالنظام، الذي قد يكون حاسمًا لتوافر أنواع الأكسجين بسرعة لتكوين الإيثانول.
نسبة هيدروكسيد إلى أول أكسيد الكربون تحدد المنتجات
لتحويل التركيز من أطوال النبضات المطبقة، يرسم الشكل 4 مباشرةمن المنتجات المختارة مثلالأسيتالديهيد والإيثانول ضد المواد الممتصة الأساسية التي تم تحديدها سابقًا، و CO ، والتي تنعكس هنا من خلال تغيير نسبتها. تم حساب التغييرات بالنسبة لظروف التفاعل الثابتة. يمكن العثور على الرسوم البيانية المقابلة التي تظهر جميع المنتجات الأخرى في الشكل التكميلية 18. يوضح الشكل 4 أن كفاءة التحويل (FEs) لـ و تحت النبضكانت أقل، بغض النظر عن تركيبة المادة الماصة على السطح، بينما كانت التفضيلات تجاه CO، والأسيتالديهيد، والإيثانول (في الغالب) مرتفعة. في الواقع، يمكن تقسيم الشكل 4 إلى أربع مناطق منتج مختلفة اعتمادًا علىنسبة. الأدنىنسبة ( -1 ، حيث لايمتص) يتميز بأقصى المنتجات، مثل CO وزيادةالنسب (1-7.3) تؤدي إلى زيادة تكوينمنتجات مثل والأسيتالديهيد. زيادة أخرى في النسب (7.3-11.6) تتوافق مع الأعلى من الإيثانول، مع بعض الكحوليات الثانوية الأخرى، بينما من، وانخفض الأسيتالديهيد، مما يبرز التأثير المفيد لزيادة تغطية OH في تكوين الإيثانول. ومن المثير للاهتمام أن تحسين لا يُرى ذلك فقط في الكفاءة الكهربائية للإيثانول، ولكن أيضًا تزداد كثافة التيار الجزئي عند نسبة مثالية من CO وOH المترسبين معًا خلال (الشكل التوضيحي 19). ومع ذلك، عند نسب أعلى حتىبدأت كفاءة التحويل لـ EtOH والإيثيلين في الانخفاض، بينما كانت كفاءات و منتجات مثل CO و(الشكل التكميلي 18a) زادت. عند هذه النسب العالية، كانت انتقائية الإيثانول والأسيتالديهيد لا تزال محسّنة قليلاً مقارنةً بالوضع الثابت.الشروط.
نلاحظ أن انخفاض معامل تحويل الإيثيلين قد يكون مرتبطًا بشكل أساسي بتغيرات غير قابلة للعكس (شكلية) في المحفز.
الشكل 5 | مخطط لتطور الممتزات والانتقائية خلال النبضاتتصوير العمليات التي تم ملاحظتها خلال النبضمع، من مسبق التخفيضاعتمادًا على أطوال النبضات الأنودية والكاثودية.، و تم تسليط الضوء على التغطية، والأكسدة تشير حالة النحاس إلى أن كلاهما يساهم في تفضيلات المنتج المختلفة خلال النبضة الكاثودية. ثابت المعدلتم تحديد عمليات الامتزاز والإزالة لثاني أكسيد الكربون، بالإضافة إلى اختزال النحاس وأكسدته، بشكل تخطيطي بواسطة أطوال الأسهم بالنسبة لبعضها البعض، حيث يرتبط السهم الأطول بعملية أسرع. خلال ظروف العمل القاسية، كما هو موضح في عملنا السابق وسيتم مناقشته بشكل أعمق لاحقًا.
من أجل التحقق من اعتماد انتقائية الإيثانول علىتركيز أكثر، نبضحتى غير مؤكسدفيتم قياسه أيضًا (الشكل التكميلي 20، الجدول التكميلي 6). يتماشى التحسن الطفيف في الإيثانول مقارنةً بالظروف الثابتة مع تحسن طفيف في ضد كما هو موضح أيضًا في الشكل 4 (النجم الأخضر)، ويدعم التأثير المفيد لـلإنتاج الإيثانول. تسلط هذه النتائج الضوء على الدور الحاسم لـ و CO في تشكيل EtOH.
نقاش
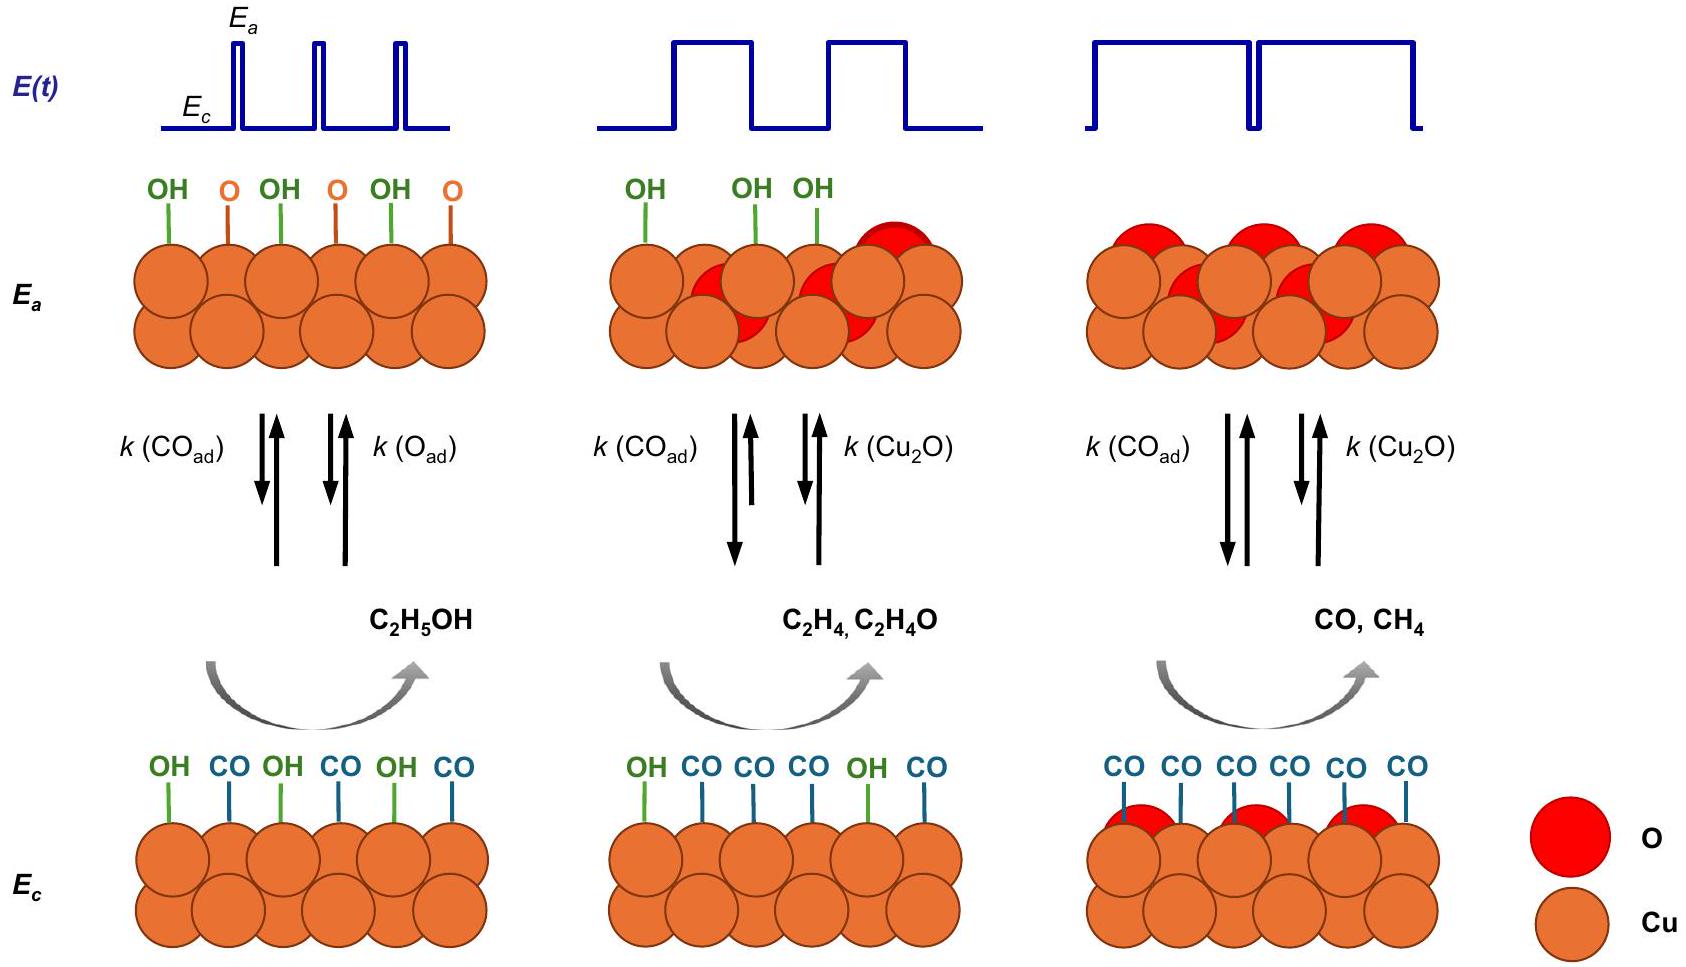
من النتائج التي تم مناقشتها، تشير الشكل 5 إلى الآلية للتدفق النبضي، حيث يمكن أن يؤدي التبديل الدوري للجهد المطبق إلى تغيير حالة أكسدة النحاس وتعديل تغطية الممتزات من OH و CO بسلوك حركي مميز. تم تشكيل الأنواع المرتبطة بأكسيد النحاس فقط خلال النبضة الأنودية وتم تقليلها بسرعة مرة أخرى بمجرد تطبيق النبضة الكاثودية. عند الأنود القصير ( ) و الكاثودي الوسيط ( أطوال النبضات، الاهتزازات و/أو تم الكشف عن الأنواع، التي تتوافق أيضًا بشكل جيد مع ملاحظة Cu (II) عند نبضات أنودية قصيرة من بيانات XAS التشغيلية في دراستنا السابقة.. هذه قد تكون الأنواع ضرورية لزيادة انتقائية الإيثانول ويتم أكسدها مباشرة منإلى Cu (II) خلال النبضة الأنودية حيث لا توجد خصائص مميزةيمكن اكتشاف الفرق. بدلاً من ذلك، عند الجهد الأنودي الأطول ( ) و نبضات كاثودية أقصر ( ) ، نموذجي ظهرت الفرق وعكست نمو وتبلورعلى مدار نبضة الأنود. كميات أكبر من المواد الشبيهة بالكتل، التي كانت لا تزال موجودة في بداية النبضة الكاثودية، أدت بعد ذلك إلى تعزيز في انتقائية الميثان المرتبطة بتغيرات الشكل، كما لوحظ سابقًا مع XAS/XRD.
الأهم من ذلك، يبدو أن انتقالات أكسدة-اختزال النحاس، وتغطية سطح الهيدروكسيل، ودرجة الحموضة المحلية مترابطة. بشكل عام، تركيزمن المتوقع أن يزداد القرب من السطح الحفاز وامتصاصه خلال النبضات عند -1.0 فولت. هناك، تنتج الأنواع من تقليلخلال النبضة الكاثودية ولكن يتم الاحتفاظ بها بالقرب من سطح المحفز بسبب الاستقطاب الإيجابي لقطب النحاس خلال النبضة الأنودية. من المتوقع أن يزيد هذا من الرقم الهيدروجيني المحلي خلال النبضات.مقارنةً بالثابت. الوقت المحدود في القصيرالقيم تمنع تشكيل نظام مرتبالمرحلة وتفضل تشكيل المكتشفو/أوالأنواع. في النبضات المؤكسدة الأطول، من المحتمل أن تكون قيم تغطية OH المنخفضة ناتجة عنالاستهلاك لـتشكيل، مما يؤدي إلى انخفاض في الرقم الهيدروجيني المحلي خلال الذي يُعرف بأنه يفضل إنتاج الميثان وثاني أكسيد الكربون. ومع ذلك، فإن التغطيات العالية جدًا لـيبدأ في حجب مواقع امتصاص أول أكسيد الكربون ويمنع اقتران الكربون-كربون، مما يؤدي إلى زيادة فيالمنتجات و.
من المهم أن نلاحظ أن انخفاض الإيثيلين وزيادة نسبة الميثان مرتبطة بتغيرات غير قابلة للعكس (شكلية) في المحفز ناتجة عن ظروف التفاعل النبضي (انظر صور SEM خارج الموقع في الشكل التكميلية 21)، والتي تكون بارزة بشكل خاص في فترات طول النبض الأنودي الأطول كما هو موضح أيضًا في عملنا السابق.. هنا، يمكن أن يؤدي الاتفاق النوعي على الخشونة العالية جداً و/أو ذوبان النحاس من جسيمات النحاس النانوية إلى زيادة عدد المواقع ذات التنسيق المنخفض، والتي تكون انتقائية للهيدروجين.على سبيل المثال، تم ملاحظة تجمعات النحاس دون النانومتر، التي من المحتمل أن تكون قد تشكلت تحت هذه الدورات الحمراء المستمرة القاسية، أنها انتقائية لتكوين الميثان.“. هذا يفسر أنه تحت ظروف النبض، فإن أعلى تغطية لـ CO (دون وجود مواد مشتركة)تم التعرف على أنه يعزز انتقائية الميثان، بينما تحت ظروف ثابتة أقل قسوة، كانت أعلى تغطية لثاني أكسيد الكربون (عادةً مع وجود مواد مشتركة)نُسب إلى الأعلىعائد المنتج. وهذا يشير إلى أنه تحت هذه الظروف التفاعلية النبضية، فإن اقتران C -C يتعرض لعائق كبير، مما يؤدي إلى تقليل CO الممتص إلى الميثان. لتسهيل تكوين الإيثانول، يجب أن يكون هناك توازن بين تغطية CO و OH خلال نبضيلزيادة بروتنة الـالوسطاء و/أو تعيق إزالة الأكسجينعلى سبيل المثال، من خلال تغطية كافية من OH تمنع مواقع الامتصاص المجاورة. تغطيات أقل من OH أو تغطيات أعلى من CO، وبالتالي، ظروف أكثر تشابهًا كما هو الحال تحت الظروف الثابتة.نقل الانتقائية نحو البروتوناتمنتجات مثل الإيثيلين والأسيتالدهيد. لذلك، نفترض أن زيادة توفر مواقع القاعدة (OH) على الواجهة تحت الظروف (الحامضية)قد تؤدي الظروف إلى زيادة تكوين الإيثانول بشكل أكبر.
في نظام الإيثانول، وجدنا حركيات أسرع لتكوين مادة CO الماصة، والتي من المتوقع أن تسهلتكوين الديمر، وبالتالي، تقليلتكوين المنتج. قد تكون الحركيات السريعة لتغطية CO في نظام الإيثانول مفيدة أيضًا للتثبيت السريع لـمنذلقد تم إثبات أنه ي stabilizes بالفعلمن خلال حسابات DFT. علاوة على ذلك، فإن الحركيات السريعة لـفي نظام الإيثانول مقارنة بتكوين السطحفينظام خلال النبضة الأنودية يظهر التوافر السريع لعينات الأكسجين مع فترات نبضة أنودية قصيرة اللازمة لتكوين الإيثانول.
في الختام، كشفت هذه الدراسة عن العلاقة بين التغيرات في هيكل وتركيب المادة الممتزة والوظيفة الحفازة للنانوكاتاليستات النحاسية المستمدة من أكسيد خلال النبضات.من خلال استخدام تقنية SERS العملية ذات الدقة الزمنية. من خلال تنفيذ دقة زمنية دون الثانية، يمكن تتبع تطور المواد الماصة المميزة مثل OH و CO خلال كل نبضة فردية. بهذه الطريقة، يمكن أن يُعزى تعزيز الإيثانول الملحوظ إلى تغطية سطحية مثالية لـ OH و CO، والتي وُجد أنها تحدد الانتقائية تجاه الكحوليات مقارنة بالهيدروكربونات. علاوة على ذلك، كانت تركيزات هذه الأنواع من OH أقل بكثير خلال الحالة الثابتة.ولم تكن موجودة بكميات ملحوظة على-المحفزات العاملة المشتقة. وبالتالي، فإن التكوين المتقطع لسطح نحاسي مغطى بـ OH/O هو الذي يحفز التجديد المستمر لـمحفز النحاس المغطى أثناء. علاوة على ذلك، وُجد أن حركيات الامتزاز/الامتزاز العكسي المفضلة لثاني أكسيد الكربون تساهم في زيادة إنتاج الإيثانول. على العكس، تم العثور عليه محولًا إلى شكل ضخمالأنواع، التي أدت أيضًا إلى انخفاض درجة الحموضة بالقرب من السطح وتكوين ظروف غير ملائمةالمنتجات، مثل الميثان وثاني أكسيد الكربون، بالإضافة إلى آليات الاختزال المختلفة بشكل كبير، وعدم القدرة على استقرار الأنواع OH. بشكل عام، تؤكد هذه الدراسة على ضرورة استخدام تقنيات حساسة للسطح معزولة زمنياً مثل SERS أثناء التشغيل لفهم آلية التفاعل للنبضات.من أجل تفضيل انتقائيات المنتج المرغوب. علاوة على ذلك، أكدنا أخيرًا تجريبيًا أهمية مواقع القاعدة السطحية (OH) ضمنإطار ميكانيكي سيفتح الطريق لإجراء تحقيقات معمقة وطرق تصميم جديدة للمحفزات.
طرق
تحضير المحفز
تم تخليق NCs بطريقة خالية من الرابطة، كما هو موضح في دراستنا السابقة.تم شراء المواد الكيميائية من سيغما ألدريتش بدرجة ACS واستخدمت دون مزيد من التنقية. 5 مل منتم إضافة 15 مل من محلول NaOH (0.2 م) إلى 200 مل من الماء النقي للغاية (0.1 م).عند درجة حرارة الغرفة، وتم تحريك المحلول لمدة 5 دقائق. ثم، أضيف 10 مل من محلول حمض الأسكوربيك (0.1 م) إلى الخليط، وتم تحريك المحلول لمدة ساعة إضافية. تم طرد المحلول مركزيًا وغسله ثلاث مرات، مرتين بمزيج من الإيثانول والماء (1:1) ومرة واحدة بالإيثانول النقي. تم تجفيف المنتج في فراغ طوال الليل، وتم تخزين المسحوق الناتج في صندوق القفازات.
لتحضير الأقطاب، تم توزيع 1 ملغ من مسحوق المحفز في 0.5 مل من الإيثانول النقي وتم استخدام الموجات فوق الصوتية لمدة 15 دقيقة للوصول إلى تركيزمن. لقياسات رامان أثناء التشغيل، تم إسقاط المشتت على جانب واحد من قطب الكربون الزجاجي المصقولكربون زجاجي
سيجرادورHTW) وجفف في لمدة 5 دقائق للحصول على تحميل الكتلة من.
تحضير الإلكتروليت
(ألفا أيسر، 99.7-100.5%) تم تنقيته باستخدام راتنج تبادل الكاتيونات (راتنج تشيليكس 100، بايو راد) وتم تشبعه بـ ( لمدة 15 دقيقة على الأقل حتى تم الوصول إلى درجة حموضة 6.8.
الطيف الكتلي المعزز بالرنين السطحي أثناء التشغيل
تم إجراء SERS أثناء التشغيل باستخدام مطياف رامان (رينشاو، إنفيا ريفليكس) متصل بمجهري بصري (لايكا ميكروسستمز، DM2500M) مع منصة مؤتمتة لتتبع العينات (رينشاو، MS300). تم إجراء معايرة النظام باستخدام wafer ( ). ليزر قريب من الأشعة تحت الحمراء (رينشاو، RL785، تجهيز 1200 و 1800 خط )، بالإضافة إلى ليزر هيليوم نيون (رينيشو، RL633، ، ، طحن 1800 سطر )، تم استخدامها كمصادر تحفيز. تم تصفية الضوء المرتد باستخدام فلتر رايلي وتوجيهه إلى كاشف CCD (رينشاو، سنتروس). بالنسبة للقياسات أثناء التشغيل، تم تركيز مصدر التحفيز على سطح العينة، وتم جمع إشارات تشتت رامان باستخدام عدسة غمر مائي (لايكا للأنظمة الدقيقة، تم حماية العدسة من الإلكتروليت بواسطة فيلم من التفلون (FEP) (Goodfellow، سمك الفيلم 0.0125 مم)، الذي تم لفه حول العدسة.
تم إجراء القياسات الكهروكيميائية في درجة حرارة الغرفة في خلية تدفق طيفية كهروكيميائية مصنوعة يدويًا من مادة PEEK ومتحكم بها بواسطة جهاز قياس الجهد Biologic SP240 (الشكل التوضيحي التكميلي 1). كانت الخلية مزودة بنظام خالي من التسربإلكترود المرجع (LF-1-63، 1 مم OD، Innovative Instruments, Inc.) موضوعة بالقرب من العينة وإلكترود مضاد من البلاتين في مخرج التدفق. تم تثبيت الإلكترود العامل مع المحفز المطبوع على الكربون الزجاجي من أسفل الخلية، وكانت مساحة المحفز المكشوف هيالمحلول الكهربائي ) كان -مشبع ( ) في خزانها ( خارج نظام رامان ومن هناك، تم ضخه عبر الخلية باستخدام مضخة بيرستالتية (PLP 380، بيهر لابور-تكنيك).
تم تحويل جميع الإمكانيات في هذه المخطوطة إلى مقياس RHE (مقابل RHE) مقابل وتم تصحيحه لـ انخفاض كما تحدده مطيافية الامتزاز الكهروكيميائية.
يعتمد وقت جمع كل طيف على البروتوكول الكهروكيميائي المطبق. بالنسبة للبروتوكول النبضيالتجارب عند الجهد الكاثوديو الجهد الأنوديتم استخدام أوقات الاستحواذ بين 0.1 و 0.8 ثانية، اعتمادًا على أطوال النبضات الكاثودية والأنودية. و ، على التوالي، للحصول على ثلاث نقاط بيانات على الأقل لكل نبضة. يتم تقديم الدقة الزمنية الدقيقة لمنطقة الانزياح رامان المنخفضة في الجدول التكميلي 1. للحصول على دقة زمنية عالية، عادةً (إذا لم يُذكر خلاف ذلك)، يتم استخدام وضع رامان الثابت في المنطقة من تم تطبيقه مع ليزر 785 نانومتر و1200 خطصوت صرير. في منطقةليزر 633 نانومتر و1800 خطتم استخدام الشبكات. تم معالجة بيانات رامان أولاً باستخدام برنامج Renishaw WiRE 5.2 لتطبيع البيانات وإزالة الأشعة الكونية. أوكتافتم كتابة نصوص لدمج بيانات رامان والبيانات الكهروكيميائية، لتناسب الأطياف المميزة لرامان، ولتوسيع متوسط أطياف رامان. تم الحصول على أطياف رامان المتوسطة من خلال حساب متوسط نقاط بيانات رامان المجمعة في نفس الأوقات بعد بدء كل دورة نبض.
المجهر الإلكتروني الماسح خارج الموقع
تم قياس صور SEM خارج الموقع للعينات قبل وبعد ظروف التحفيز الكهربائي المختلفة باستخدام SEM (Apreo SEM، Thermo Fisher Scientific) مع كاشف إلكتروني ثانوي داخل العدسة. تم ترسيب العينات على الكربون الزجاجي وشطفها مباشرة بـ ماء نقي للغاية ) بعد كل تفاعل كهربائي تحفيزي قياس لتجنب تلوث عينة الملح الكهربائي.
قياسات الانتقائية
تم نشر الجزء الرئيسي من قياسات الانتقائية بالفعل في عملنا السابقباستثناء القياسات الجديدة التي تم الحصول عليها في (مقابل RHE و تم تصحيح السقوط)، و لمدة إجمالية قدرها 4000 ثانية. تم إجراء القياسات في خلية من نوع H مزودة بغشاء لتبادل الأنيونات (Selemion AMV، AGC) يفصل بين حجرة الكاثود وحجرة الأنود ويتم التحكم بها بواسطة جهاز قياس الجهد (أوتولاب، ميتروهم). خالية من التسربتم استخدام قطب مرجعي (LF-1، Alvatek) كقطب مرجعي، وقطب شبكة من البلاتين (MaTecK، 3600 شبكة) ) كقطب مضاد، و تم إيداعه على ورق الكربون كالكاثود العامل. كان المحلول الكهربائيمشبعتم الكشف عن منتجات الغاز وقياسها كل 15 دقيقة بواسطة كروماتوغرافيا الغاز على الإنترنت (GC، Agilent 7890B)، المجهزة بكاشف موصلية حرارية وكاشف تأين لهب. تم تحليل المنتجات السائلة بعد كل قياس باستخدام كروماتوغرافيا السائل عالية الأداء (Shimadzu Prominence)، المجهزة بعمود NUCLEOGEL SUGAR 810 وكاشف مؤشر الانكسار، وكروماتوغرافيا الغاز السائلة (Shimadzu 2010 plus)، المجهزة بعمود كابيلاري من السيليكا المنصهرة وكاشف تأين لهب. تم حساب الكفاءات فاراداي من خلال أخذ الجزء الكاثودي فقط في الاعتبار حيث لا توجد نشاط تحفيزي خلال النبضة الأنودية. على وجه التحديد، لحساب الكفاءات فاراداي لمنتجات الغاز، تم وزن التيار الكاثودي بواسطة المصطلح لتصحيح الوقت الفعّال تحتبينما بالنسبة لكفاءات فاراداي للمنتجات السائلة، تم أخذ الشحنة الكاثودية فقط في الاعتبار.
توفر البيانات
بيانات SERS إضافية، معلمات الملاءمة، ثوابت الزمن و إضافيةتُقدم البيانات في المعلومات التكميلية. تتوفر بيانات SERS الخام (التي تتطلب برامج متخصصة لمعالجتها) من المؤلفين المقابلين عند الطلب.
References
Nitopi, S. et al. Progress and perspectives of electrochemical reduction on copper in aqueous electrolyte. Chem. Rev. 119, 7610-7672 (2019).
Hori, Y.; Electrochemical CO2 Reduction on Metal Electrodes 89-189 (Springer, New York, 2008).
Mistry, H., Varela, A. S., Kühl, S., Strasser, P. & Roldan Cuenya, B. Nanostructured electrocatalysts with tunable activity and selectivity. Nat. Rev. Mater. 1, 16009-16022 (2016).
Jeon, H. S., Kunze, S., Scholten, F. & Roldan Cuenya, B. Prismshaped Cu nanocatalysts for electrochemical reduction to ethylene. ACS Catal. 8, 531-535 (2018).
Jeon, H. S. et al. Operando insight into the correlation between the structure and composition of CuZn nanoparticles and their selectivity for the electrochemical reduction. J. Am. Chem. Soc. 141, 19879-19887 (2019).
Herzog, A. et al. Operando investigation of Ag -decorated nanocube catalysts with enhanced electroreduction toward liquid products. Angew. Chem. Int. Ed. 60, 7426-7435 (2021).
Rüscher, M. et al. Tracking heterogeneous structural motifs and the redox behaviour of copper-zinc nanocatalysts for the electrocatalytic reduction using operando time resolved spectroscopy and machine learning. Catal. Sci. Technol. 12, 3028-3043 (2022).
Lum, Y., Yue, B., Lobaccaro, P., Bell, A. T. & Ager, J. W. Optimizing C-C coupling on oxide-derived copper catalysts for electrochemical reduction. J. Phys. Chem. C 121, 14191-14203 (2017).
Gao, D., Scholten, F. & Roldan Cuenya, B. Improved electroreduction performance on plasma-activated Cu catalysts via electrolyte design: halide effect. ACS Catal. 7, 5112-5120 (2017).
Singh, M. R., Kwon, Y., Lum, Y., Ager, J. W. & Bell, A. T. Hydrolysis of electrolyte cations enhances the electrochemical reduction of over Ag and Cu. J. Am. Chem. Soc. 138, 13006-13012 (2016).
Zhou, Y. et al. Stabilization of Cu+ via strong electronic interaction for selective and stable electroreduction. Angew. Chem. Int. Ed. 61, e202205832 (2022).
Mistry, H. et al. Highly selective plasma-activated copper catalysts for carbon dioxide reduction to ethylene. Nat. Commun. 7, 12123-12130 (2016).
Ren, D. et al. Selective electrochemical reduction of carbon dioxide to ethylene and ethanol on copper(I) oxide catalysts. ACS Catal. 5, 2814-2821 (2015).
De Luna, P. et al. Catalyst electro-redeposition controls morphology and oxidation state for selective carbon dioxide reduction. Nat. Catal. 1, 103-110 (2018).
Velasco-Vélez, J.-J. et al. The role of the copper oxidation state in the electrocatalytic reduction of into valuable hydrocarbons. ACS Sustain. Chem. Eng. 7, 1485-1492 (2019).
Dattila, F., García-Muelas, R. & López, N. Active and selective ensembles in oxide-derived copper catalysts for reduction. ACS Energy Lett. 5, 3176-3184 (2020).
Casebolt, R., Levine, K., Suntivich, J. & Hanrath, T. Pulse check: potential opportunities in pulsed electrochemical reduction. Joule 5, 1987-2026 (2021).
Timoshenko, J. et al. Steering the structure and selectivity of electroreduction catalysts by potential pulses. Nat. Catal. 5, 259-267 (2022).
Kimura, K. W. et al. Controlled selectivity of reduction on copper by pulsing the electrochemical potential. ChemSusChem 11, 1781-1786 (2018).
Engelbrecht, A. et al. On the electrochemical reduction at copper sheet electrodes with enhanced long-term stability by pulsed electrolysis. J. Electrochem. Soc. 165, J3059-J3068 (2018).
Shiratsuchi, R. & Nogami, G. Pulsed electroreduction of on silver electrodes. J. Electrochem. Soc. 143, 582-586 (1996).
Jeon, H. S. et al. Selectivity control of Cu nanocrystals in a gas-fed flow cell through pulsed electroreduction. J. Am. Chem. Soc. 143, 7578-7587 (2021).
Le Duff, C. S., Lawrence, M. J. & Rodriguez, P. Role of the adsorbed oxygen species in the selective electrochemical reduction of to alcohols and carbonyls on copper electrodes. Angew. Chem. Int. Ed. 56, 12919-12924 (2017).
Kimura, K. W. et al. Selective electrochemical reduction during pulsed potential stems from dynamic interface. ACS Catal. 10, 8632-8639 (2020).
Kim, C., Weng, L.-C. & Bell, A. T. Impact of pulsed electrochemical reduction of on the formation of products over Cu . Catal. 10, 12403-12413 (2020).
Arán-Ais, R. M., Scholten, F., Kunze, S., Rizo, R. & Roldan Cuenya, B. The role of in situ generated morphological motifs and species in C2+ product selectivity during pulsed electroreduction. Nat. Energy 5, 317-325 (2020).
Chou, T.-C. et al. Controlling the oxidation state of the Cu electrode and reaction intermediates for electrochemical reduction to ethylene. J. Am. Chem. Soc. 142, 2857-2867 (2020).
Iijima, G., Inomata, T., Yamaguchi, H., Ito, M. & Masuda, H. Role of a hydroxide layer on Cu electrodes in electrochemical reduction. ACS Catal. 9, 6305-6319 (2019).
Gunathunge, C. M., Ovalle, V. J., Li, Y., Janik, M. J. & Waegele, M. M. Existence of an electrochemically inert CO population on Cu electrodes in alkaline pH. ACS Catal. 8, 7507-7516 (2018).
Dinh, C.-T. et al. electroreduction to ethylene via hydroxidemediated copper catalysis at an abrupt interface. Science 360, 783-787 (2018).
Roiaz, M. et al. Roughening of copper (100) at elevated CO pressure: Cu adatom and cluster formation enable CO fissociation. J. Phys. Chem. C 123, 8112-8121 (2019).
Gameel, K. M., Sharafeldin, I. M., Abourayya, A. U., Biby, A. H. & Allam, N. K. Unveiling CO adsorption on Cu surfaces: new insights from molecular orbital principles. Phys. Chem. Chem. Phys. 20, 25892-25900 (2018).
Zhan, C. et al. Revealing the CO coverage-driven C-C coupling mechanism for electrochemical reduction on nanocubes via operando Raman spectroscopy. ACS Catal. 11, 7694-7701 (2021).
De Ruiter, J. et al. Probing the dynamics of low-overpotential -to-CO activation on copper electrodes with time-resolved Raman spectroscopy. J. Am. Chem. Soc. 144, 15047-15058 (2022).
Moradzaman, M. & Mul, G. In situ Raman study of potentialdependent surface adsorbed carbonate, , and C species on Cu electrodes during electrochemical reduction of . ChemElectroChem 8, 1478-1485 (2021).
Niaura, G. Surface-enhanced Raman spectroscopic observation of two kinds of adsorbed OH- ions at copper electrode. Electrochim. Acta 45, 3507-3519 (2000).
Singhal, A. et al. Copper(I) oxide nanocrystals-one step synthesis, characterization, formation mechanism, and photocatalytic properties. Eur. J. Inorg. Chem. 2013, 2640-2651 (2013).
Deng, Y., Handoko, A. D., Du, Y., Xi, S. & Yeo, B. S. In situ Raman spectroscopy of copper and copper oxide surfaces during electrochemical oxygen evolution reaction: identification of Culll oxides as catalytically active species. ACS Catal. 6, 2473-2481 (2016).
Li, J. et al. Electrokinetic and in situ spectroscopic investigations of CO electrochemical reduction on copper. Nat. Commun. 12, 3264-3274 (2021).
Zhao, Y. et al. Speciation of Cu surfaces during the electrochemical CO reduction reaction. J. Am. Chem. Soc. 142, 9735-9743 (2020).
Chan, H. Y. H., Takoudis, C. G. & Weaver, M. J. Oxide film formation and oxygen adsorption on copper in aqueous media as probed by surface-enhanced Raman spectroscopy. J. Phys. Chem. B 103, 357-365 (1999).
Bodappa, N. et al. Early stages of electrochemical oxidation of Cu(111) and polycrystalline Cu surfaces revealed by in situ Raman spectroscopy. J. Am. Chem. Soc. 141, 12192-12196 (2019).
Jiang, S., Klingan, K., Pasquini, C. & Dau, H. New aspects of operando Raman spectroscopy applied to electrochemical reduction on Cu foams. J. Chem. Phys. 150, 041718-041729 (2019).
An, H. et al. Sub-second time-resolved surface-enhanced Raman spectroscopy reveals dynamic CO intermediates during electrochemical reduction on copper. Angew. Chem. Int. Ed. 60, 16576-16584 (2021).
Chang, . et al. Determining intrinsic stark tuning rates of adsorbed CO on copper surfaces. Catal. Sci. Technol. 11, 6825-6831 (2021).
Cao, Y. et al. Surface hydroxide promotes electrolysis to ethylene in acidic conditions. Nat. Commun. 14, 2387 (2023).
Sun, M., Staykov, A. & Yamauchi, M. Understanding the roles of hydroxide in electroreduction on a Cu electrode for achieving variable selectivity. ACS Catal. 12, 14856-14863 (2022).
Zhang, Q. et al. Regulated CO adsorption by the electrode with repulsive property for enhancing C-C coupling. GreenChE 4, 331-337 (2023).
Reske, R., Mistry, H., Behafarid, F., Roldan Cuenya, B. & Strasser, P. Particle size effects in the catalytic electroreduction of on Cu nanoparticles. J. Am. Chem. Soc. 136, 6978-6986 (2014).
Jiang, K. et al. Effects of surface roughness on the electrochemical reduction of over Cu . ACS Energy Lett. 5, 1206-1214 (2020).
Akemann, W. & Otto, A. Vibrational modes of CO adsorbed on disordered copper films. J. Raman Spectrosc. 22, 797-803 (1991).
Hori, Y., Takahashi, R., Yoshinami, Y. & Murata, A. Electrochemical reduction of CO at a copper electrode. J. Phys. Chem. B 101, 7075-7081 (1997).
شكر وتقدير
تم تمويل هذا العمل من قبل الجمعية الألمانية للبحث العلمي (DFG، مؤسسة البحث الألمانية)، رقم المشروع 327886311-SPP 2080. كما تم تقدير الدعم المالي الإضافي من المجلس الأوروبي للبحث بموجب منحة ERC-OPERANDOCAT (ERC-725915). يقر كل من A.H. و C.R. بالدعم المقدم من IMPRS للعمليات الأساسية في الكيمياء الفيزيائية. نشكر أيضًا بتريك بيشوف على مساعدته في تصميم وتصنيع خلية التدفق التشغيلية. نشكر الدكتور تشاو زهان (FHI) على المناقشات المفيدة. تم توفير تمويل الوصول المفتوح من قبل جمعية ماكس بلانك.
مساهمات المؤلفين
ساهم A.H. و A.B. و B.R.C. في كتابة المخطوطة. أشرف A.B. و B.R.C. على الدراسة. صمم A.H. و خطط و حلل جميع تجارب SERS أثناء التشغيل. صمم A.H. و M.L.L. إعداد خلية SERS أثناء التشغيل. أعد A.H. و H.S.J. عينات. قام A.H. و C.R. بأداء التحفيز الكهربائيقياسات الانتقائية. قام P.G. بإجراء قياسات SEM.
تمويل
تم تمويل الوصول المفتوح وتنظيمه بواسطة مشروع DEAL.
يجب توجيه المراسلات والطلبات للحصول على المواد إلى أرنو بيرغمان أو بياتريز رولدان كوينيا.
معلومات مراجعة الأقران تشكر مجلة Nature Communications خوان فيكتور بيراليس-روندون والمراجعين الآخرين المجهولين على مساهمتهم في مراجعة هذا العمل. يتوفر ملف مراجعة الأقران.
¹قسم علوم الواجهة، معهد فريتز هابر التابع لجمعية ماكس بلانك، 14195 برلين، ألمانيا. العنوان الحالي: معهد ماساتشوستس للتكنولوجيا، مختبر أبحاث الإلكترونيات، 77 شارع ماساتشوستس، كامبريدج، MA 02139، الولايات المتحدة الأمريكية. العنوان الحالي: قسم العلوم الكيميائية، مختبر لورانس بيركلي الوطني، بيركلي، CA 94720، الولايات المتحدة الأمريكية. العنوان الحالي: معهد كوريا للعلوم والتكنولوجيا، 5 شارع هورانغ-رو 14-غيل، وولغوك 2(ي)-دونغ، سيونغبوك-غو، سيول، كوريا الجنوبية. البريد الإلكتروني: abergmann@fhi-berlin.mpg.de; roldan@fhi-berlin.mpg.de
Pulsed electroreduction ( ) has recently emerged as a facile way to in situ tune the product selectivity, in particular toward ethanol, without redesigning the catalytic system. However, in-depth mechanistic understanding requires comprehensive operando time-resolved studies to identify the kinetics and dynamics of the electrocatalytic interface. Here, we track the adsorbates and the catalyst state of pre-reduced nanocubes ( ) during pulsed using sub-second time-resolved operando Raman spectroscopy. By screening a variety of product-steering pulse length conditions, we unravel the critical role of co-adsorbed OH and CO on the Cu surface next to the oxidative formation of or species, impacting the kinetics of CO adsorption and boosting the ethanol selectivity. However, a too low coverage following the formation of bulk-like induces a significant increase in the selectivity, while a too high coverage poisons the surface for coupling. Thus, we unveil the importance of coadsorbed OH on the alcohol formation under conditions and thereby, pave the way for improved catalyst design and operating conditions.
Within the scope of reducing global emissions to limit climate change, carbon net-zero technologies have gained enormous interest. One promising technology is the , which closes the carbon cycle by using renewable energies to transform back into useful chemicals and fuels . Among the metals studied, only copper electrodes have the unique ability to produce the desired energy-dense alcohols and hydrocarbons such as ethanol and ethylene in significant amounts . However, for further commercialization in high-current electrolyzers, Cu-based catalysts still suffer from a broad selectivity distribution, low activity, and low stability during long-term operation.
Several strategies have been developed to address these issues and to increase the product distribution toward products, which include tuning the catalyst structure and composition and modifying the electrolyte . Additionally, the (initial) oxidation state of Cu plays a major role, particularly oxidized Cu species and oxide-derived Cu materials showed a major improvement in the selectivity and stability of the catalysts . Thus, a simple way to regenerate the desired oxidation state of Cu in situ is by means of pulsed potential , where an electrocatalytic potential alternates between an oxidizing and a potential . Hereby, the key pulse parameters are the
applied cathodic and anodic potential, the pulse shape as well as the pulse length .
By varying only the cathodic and anodic pulse lengths, while keeping the other pulse parameters constant, the catalytic properties of Cu electrodes could be enhanced . In this way, the amount, as well as the type of Cu oxide species ( ) formed on the catalyst surface, was controlled . In particular, distorted non-crystalline domains were formed at short anodic pulses (below 2 s ) as evidenced by operando X-ray absorption spectroscopy (XAS) and X-ray diffraction (XRD), which had been associated with an enhanced ethanol formation . The dynamic alternation of the potential impacts also the restructuring (faceting and defects) and the roughening of the catalyst at longer anodic pulse lengths (above 1 s ), which were observed to enhance the selectivity of either methane or ethylene . However, the induced dynamics on the surface coverage of hydrogen ( ), hydroxide ( ), and carbon monoxide ( ) are crucial to fully understand the underlying principle of selectivity changes via pulsed . Several studies suggested that the application of the anodic pulse leads to higher OH coverage, while is removed due to the positive polarization of the electrodes . The resulting higher OH coverage was proposed to stabilize the active compared to the inactive species , which then enhances the ethanol selectivity. The beneficial effect of a higher OH coverage and the resulting higher local pH was also linked to a change in the CO adsorption energy as well as a lower coupling barrier . While the CO binding configuration was previously tracked with operando surface-enhanced infrared absorption spectroscopy (SEIRAS) , there is to date no experimental evidence for the postulated changes in the OH and CO coverages, and the selectivitydetermining role of the adsorbed OH beyond CO dimerization stays unclear. Moreover, it remains challenging to determine the possible presence of surface Cu oxides due to the lack of surface-sensitive operando characterizations . Thus, these tools are needed to gain a better mechanistic comprehension of pulsed .
In this study, we, therefore, applied operando sub-second timeresolved surface-enhanced Raman spectroscopy (SERS), which is an ideal method to simultaneously track the changes in the surface oxidation state of Cu and the changes in the and surface adsorbates as well as their surface coverage. In this way, we followed the impact of the applied anodic or cathodic pulse lengths during pulsed . Thus, square-wave potential pulses were alternated between an electrocatalytic cathodic potential at -1.0 V and an oxidizing anodic potential at +0.6 V versus the reversible hydrogen electrode (RHE). Pre-reduced nanocubes (NCs) served as catalysts, which exhibit tunable selectivities for valuable products such as ethanol or products such as methane, depending on the selected pulse length . In particular, we correlated the enhancement of ethanol observed to an increase of the versus coverage and the formation of and species under selected pulsed conditions. Here, we demonstrate the impact of the adsorbates and surface species on the obtained selectivity trends in dependence on the applied pulse lengths to gain novel mechanistic insights in a sub-second time-resolved way.
Results
Time-dependent evolution of SERS
Figure 1a shows a scanning electron microscopy (SEM) image of the ( in size) pre-catalysts deposited on a glassy carbon electrode. The pre-catalyst was first pre-reduced in an electrochemical operando Raman flow cell setup (Supplementary Note 1, Supplementary Figs. 1, 2), resulting in loss of the initial cubic shape and the growth of the particles ( -30 nm in size, Fig. 1b). Subsequently, pulsed with a selected cathodic pulse length and anodic pulse length was applied (Supplementary Table 1). For all pulsed measurements in this study, and (vs. RHE, for all shown
potentials in this study), and the electrolyte consists of saturated potassium bicarbonate ( ) if not stated differently. We note that the morphology of the particles changed to larger structures after pulsed , as observed in the SEM image in Fig. 1c. Figure 1d presents the applied potential and the measured current (top) during the symmetric pulses with and the corresponding normalized SERS signal intensities over the Raman shift (bottom) as a function of the time. For the normalization of the SERS spectra, the intensity values were modified to a mean of 0 and a variance of 1 . We note that the optical properties of the working catalyst are changing under potential pulse conditions as the reduced nanocubes transform into rough, porous nanostructures. Therefore, to account for different SERS enhancement at different pulse length conditions, the SERS bands in this study were only compared to each other within the same spectra to obtain intensity ratios (Supplementary Note 2). The periodic responses of the characteristic SERS bands in this spectroscopic region were fitted in Fig. 1e (with fit examples in Supplementary Fig. 3). The selected characteristic bands here are:
(I) the vibrations on Cu , namely the rotation and stretching ( ) vibrations at 280 and , where CO is considered to be adsorbed on Cu as shown with surface characterization methods . The CO bands appear during each cathodic pulse as intermediates and disappear during the anodic pulses . The relative CO surface coverage ( ) can be obtained by the intensity ratio of the two CO bands as Intensity Intensity . This relationship was derived in detail in our previous study through operando measurements in the presence of different CO concentrations and through DFT vibrational analysis for different CO coverages on surfaces . However, the structural and morphological differences between the derived relationship to the oxide-derived Cu used in this work do not allow a direct comparison of the ratios and the CO coverage:
(II) the vibration on or close to Cu , which can appear during the cathodic pulse at and during the anodic pulse redshifted at if OH is adsorbed or close to the Cu surface via dipoledipole interactions :
(III) the bands related to on the surface at (multiphonon process), (Raman-allowed mode), and (IR-allowed mode), which appear during each anodic pulse due to the oxidation of Cu and disappear again during each cathodic pulse due to its reduction . The additional presence of CuO or as a minor component cannot be excluded due to similar band positions .
While the assignment of and is straightforward, the assignment of is still under debate, and some groups also assigned the band at to and species . However, experiments in several previous studies with showed a shift of the band position, which supports this assignment to chemisorbed on . Furthermore, bands at and , detectable during the electrochemical oxidation of and polycrystalline Cu surfaces, were linked by other groups to surface OH species through experiments and DFT calculations . Their DFT calculations propose that the band corresponds to a top-site OH stretching mode, possibly aligning with our scenario. In contrast, the band was attributed to the bending mode of free , a band mode that may be absent in our case due to co-adsorption with CO .
Additionally, a weak carbonate band at was observed in some of the SERS spectra during the first 20 s , as shown in Supplementary Fig. .
Pulse length-dependent evolution of SERS
In order to follow the impact of the applied cathodic and anodic pulse duration on the catalyst structure and the adsorbates, we averaged the normalized operando SERS spectra of selected pulse conditions and
Fig. 1 | Morphology and temporal evolution of the SERS intensity during pulsed . a Ex situ SEM images of the as-prepared electrodes, after potentiostatic at -1.0 V for 1 h , and after pulsed at and with for Applied potential and current density over time with (top) and corresponding temporal evolution of the SERS signal intensity with
marked Raman bands (bottom). e Applied potential over time and intensities of fits of selected characteristic Raman bands, namely the rotation ( , dark blue), stretching ( , light blue), at -1.0 V in turquoise and at +0.6 V in green) and the copper(I) oxide ( , sum of 530 and divided by two, orange) bands.
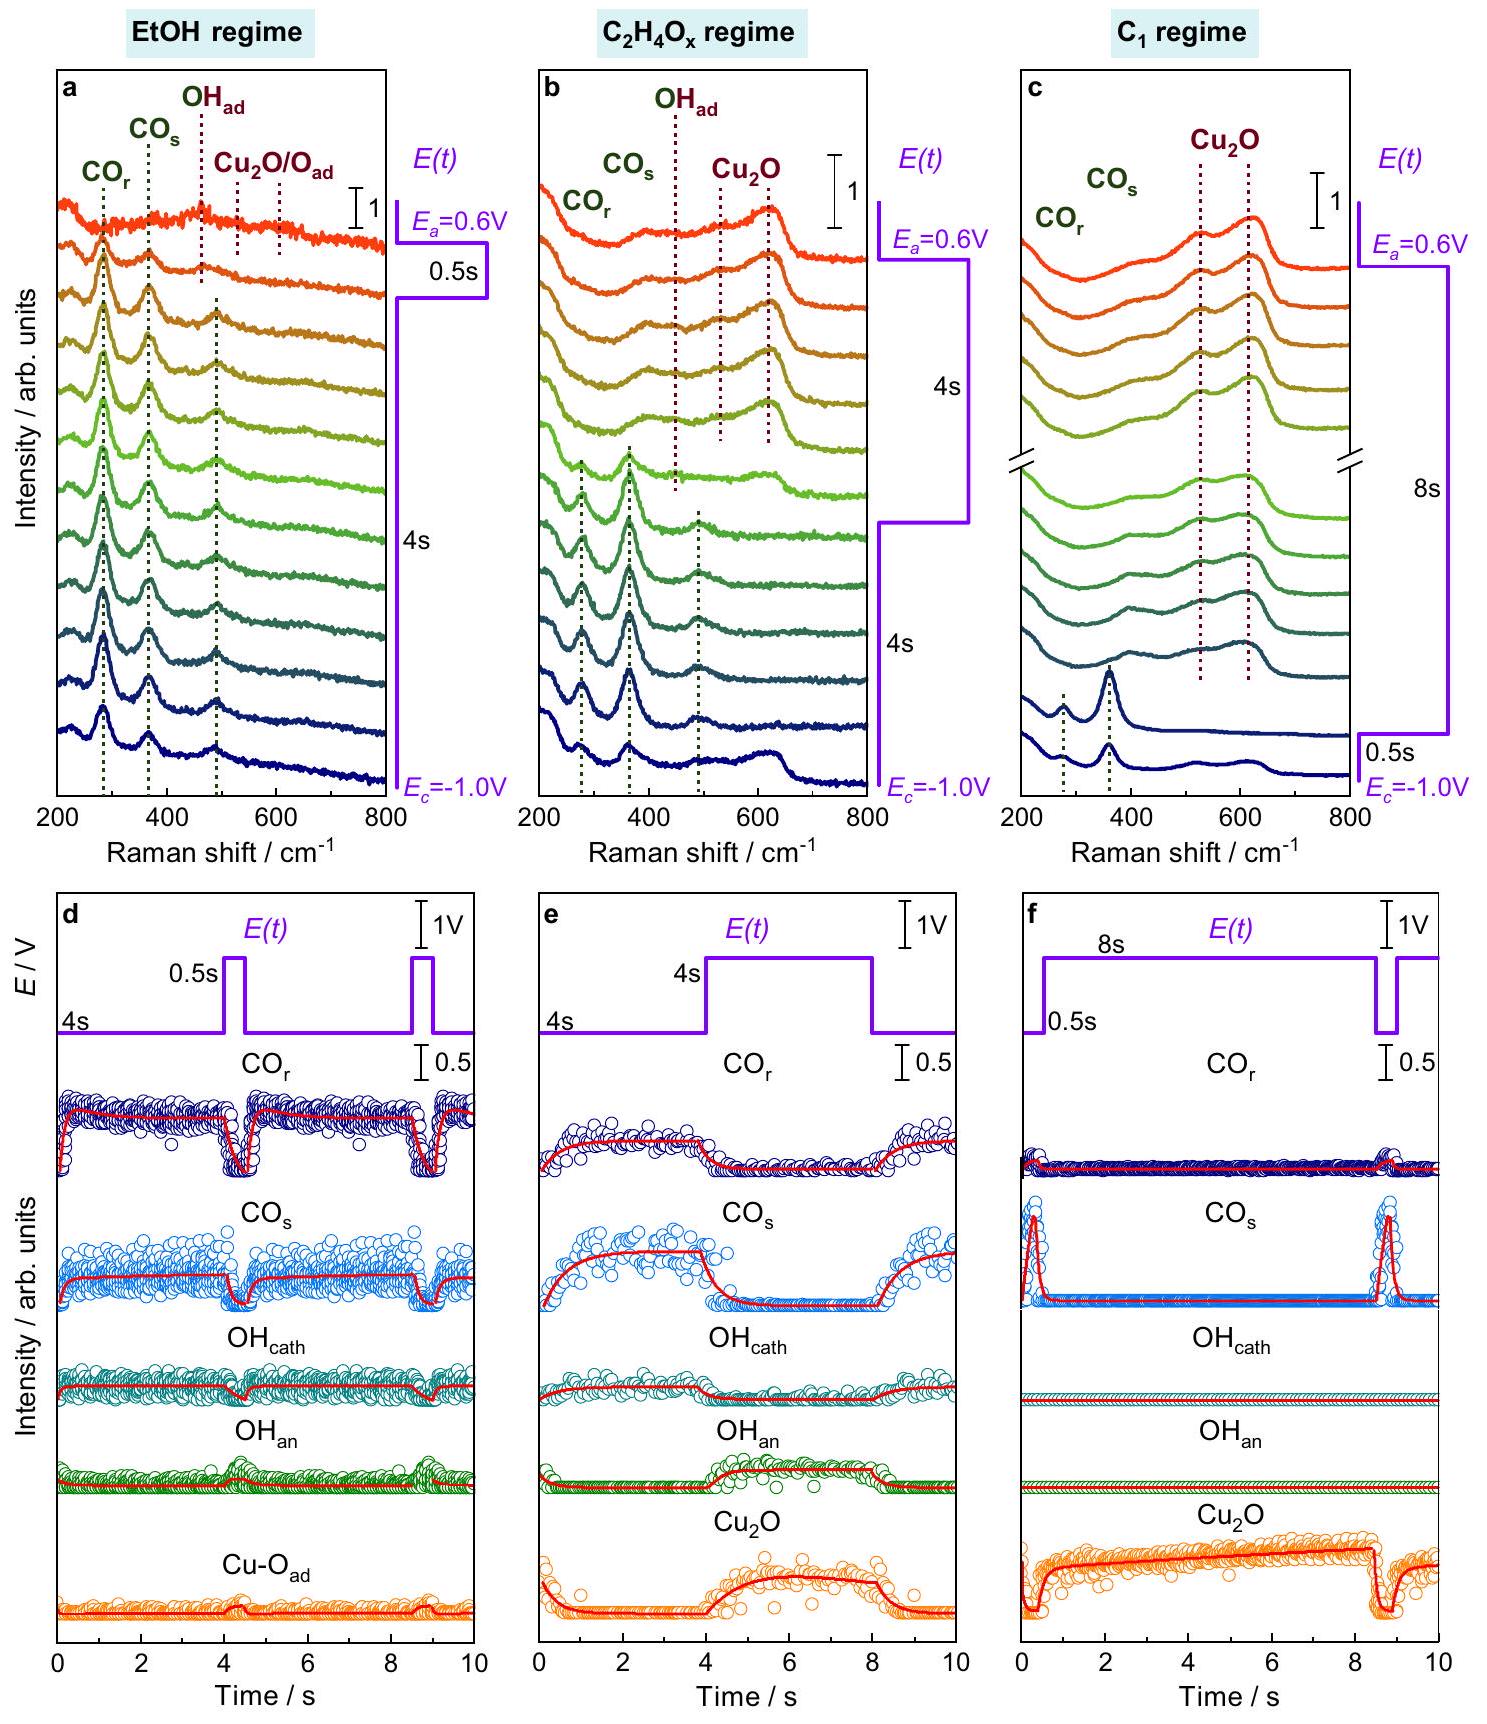
fitted the characteristic bands over one pulse sequence, as shown in Fig. 2. The emphasis is placed on three pulse regimes that are typical for the highest ethanol ( EtOH regime, Fig. 2a, d), ethylene/acetaldehyde ( regime, Fig. 2b, e), and product selectivity ( regime, Fig. 2c, f). The EtOH regime is characterized by short anodic pulses ( ), the regime by intermediate anodic pulses ( ), and in both cases, the cathodic pulses have an intermediate length of 4 s . In contrast, long anodic pulses ( ) combined with short cathodic pulses ( ) represent the regime . Thereby, the intensity of the compared to the band decreased with shorter and is the smallest in the EtOH regime. The band is more intense during shorter in the regime, while no bands, but stronger Cu oxide bands during long and subsequent short could be detected in the regime. These observations are underlined by additional SERS data at different pulse lengths (Supplementary Figs. 5, 6). During the anodic pulses, the
band intensities increased with the duration of the anodic pulse, being comparably weak at in the EtOH regime. Interestingly, there is also a contribution of visible in the region of during the anodic pulse in the EtOH regime for anodic pulses shorter than 2 s (Supplementary Fig. 5a, b) . Under these conditions, also intense bands and additional bands at and were detected, which can be attributed to disordered species . Moreover, the carbonate band at was predominantly observed at the onset of both the anodic and cathodic pulses, possibly linked to dynamic alterations of the electrical double layer. However, due to the low band intensities under these conditions, it is challenging to thoroughly analyze its characteristics further (Supplementary Figs. 5-7). To verify the reproducibility of the data the experiments of the main product regimes were repeated on freshly prepared electrodes showing similar spectra and trends (Supplementary Fig. 9).
Fig. 2 | Pulse length-dependent evolution of SERS spectra and characteristic bands. a-c Normalized SERS spectra from bottom to top (as indicated with arrows) with highlighted characteristic SERS bands during pulsed with varying pulse lengths at and and intensities of fits of characteristic SERS bands averaged over one pulse sequence at selected pulse
lengths. All averaged SERS spectra of are shown in Supplementary Fig. 8. The data points in represent the intensity fits of , dark blue , light blue), at -1.0 V in turquoise and at +0.6 V in green), (sum of 530 and divided by two, orange) and , orange) bands. The red lines denote the exponential fits and serve as guides for the eye.
To obtain additional insights into the average surface coverage of the characteristic species and their corresponding adsorption/desorption and oxidation/reduction kinetics, we performed exponential fits of the Raman band intensities during the averaged pulse profiles (Fig. 2d-f, Supplementary Fig. 10, Supplementary Tables 2-4). In particular, the kinetics of the ad- and desorption of CO on Cu altered with the applied pulse lengths (Supplementary Table 3). For example, in the EtOH regime, the band intensity increased twice as fast during the cathodic pulse as it decreased during the anodic pulse. Additionally, the band intensity ratio, which reflects the CO surface coverage, gradually and persistently escalated throughout the cathodic pulse (Supplementary Fig. 11). These findings suggest a change in the
CO binding configuration during the cathodic pulse, which is expected to have implications for the catalytic function.
The differences in the CO binding configuration in terms of CO adsorption sites can be further evaluated by the C-O stretching vibration at higher wavenumbers ( , Supplementary Figs. 12, 13). Particularly, the SERS spectra show the contribution of bridge at and two atop bands, namely the linear low-frequency at and highfrequency at bands, as described in the literature . The contribution of sites, which are usually related to coupling , is more prominent in the EtOH and regimes (Supplementary Fig. 13). Instead, the contribution of
sites, which are usually considered inactive for C-C coupling , increased significantly in the regime. Nevertheless, we found high uncertainties during several pulse sequences owing to the constantly evolving surface reactions that lead to the dynamic nature of the stretching vibrations at high Raman shifts .
For the species, in turn, it is not easy to extract the ad- and desorption behavior since the bands additionally shifted upon the potential switch and partially overlapped with the evolving bands during the anodic pulse (Fig. 2a, b). The shift of the bands probably resulted from the Stark effect due to the change in the electric field, with a reasonable Stark tuning rate of , rather than from a change in the bonding configuration of , as also discussed in the literature where the potential was only changed by . Furthermore, it is likely that is an intermediate of the formation during the anodic pulse.
The adsorption of oxygen on the Cu surface and the oxidation to over the anodic pulse was, under all applied pulse conditions, slower than the corresponding desorption/reduction upon the application of the cathodic pulse (Supplementary Table 4). In the regime, the amount of surface continuously increased the fastest, which indicates a continuous growth of the oxide layer over the course of the anodic pulse. Moreover, the spectroscopic weights of the three deconvoluted bands changed at different applied pulse lengths (Supplementary Table 5). The relative intensity contribution of the band at is stronger during longer cathodic pulses, which may have been influenced by the higher ratio of . On the other hand,
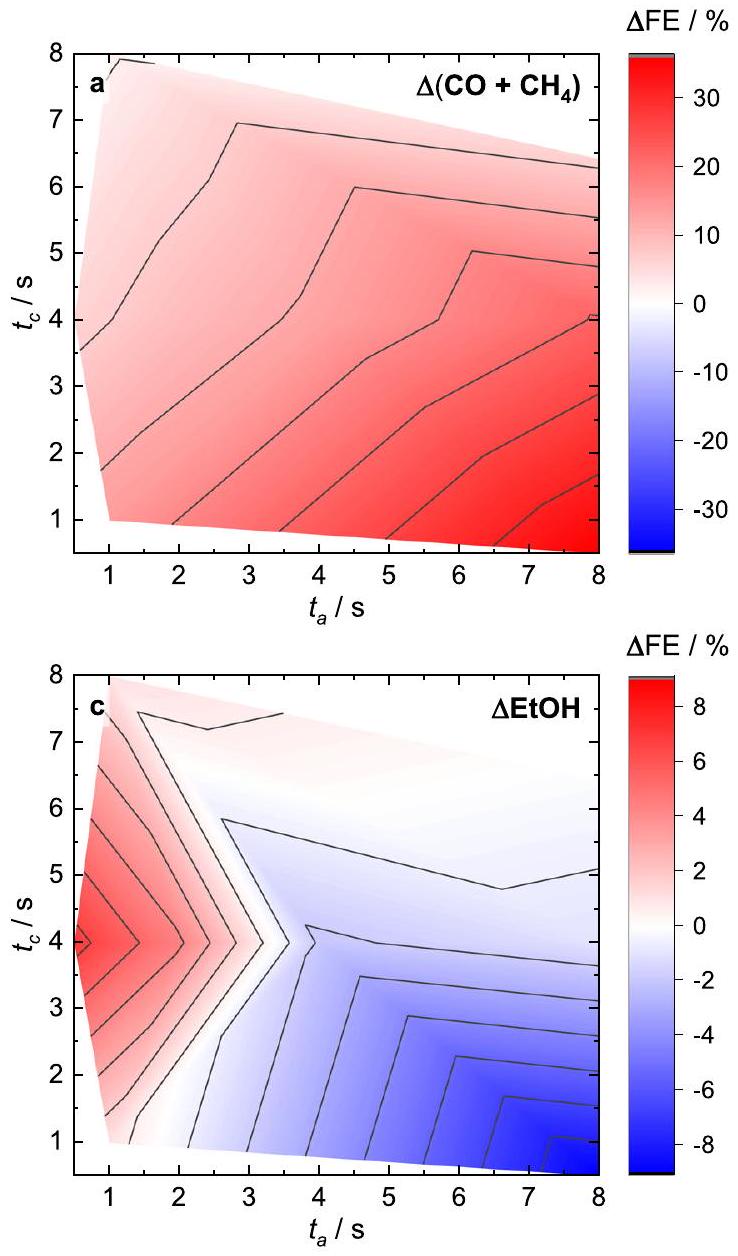
Fig. 3 | Pulse length-dependent selectivities and adsorbates maps. Changes in product selectivities during pulsed with with respect to the anodic and cathodic pulse lengths after subtraction of the corresponding values under static conditions at -1.0 V (indicated with ). a Change ( ) of
the intensity of the 530 and bands contributes stronger for shorter cathodic pulses. Analyzing the time-dependent evolution of these bands in the regime (Supplementary Fig. 14) revealed that the relative intensity of the band at was the highest in the first second of the anodic pulse, and its spectroscopic weight increased only slightly in the following. Also, the evolution of the intensity of the band suggests a temporary maximum in the initial phase of the anodic pulse. In contrast, the intensity of the band increased monotonously over the course of the anodic pulse. These changes might represent the formation/crystallization of the layer terminating the Cu domains. In our previous work, we showed with operando XRD that over the course of an anodic potential pulse, crystalline domains with a size of up to 3 nm were present at the end of a 10 s anodic pulse . Additionally, operando XAS revealed a minor contribution of other Cu phases (e.g., Cu (II) compounds such as ) in the initial phase of the electrochemical oxidation, which are likely highly disordered and thus absent in the XRD data. However, they cannot be directly correlated to a specific cationic Cu (surface) species based on SERS.
Correlations of selectivity, structure, and kinetics
To extract the link between the surface adsorbates and the catalytic function, Fig. 3 shows the change in the SERS band intensities (Supplementary Table 2) and in the Faradaic efficiencies ( ) during pulsed in comparison to static conditions at -1.0 V obtained from a variety of anodic and cathodic pulse lengths
the sum of Faradaic efficiencies ( ) of the main products ( CO and ). b SERS intensity distribution of coverage on Cu . of ethanol (EtOH). d Normalized SERS intensity distribution of . The selectivity data were taken from identical catalysts included in our previous publication .
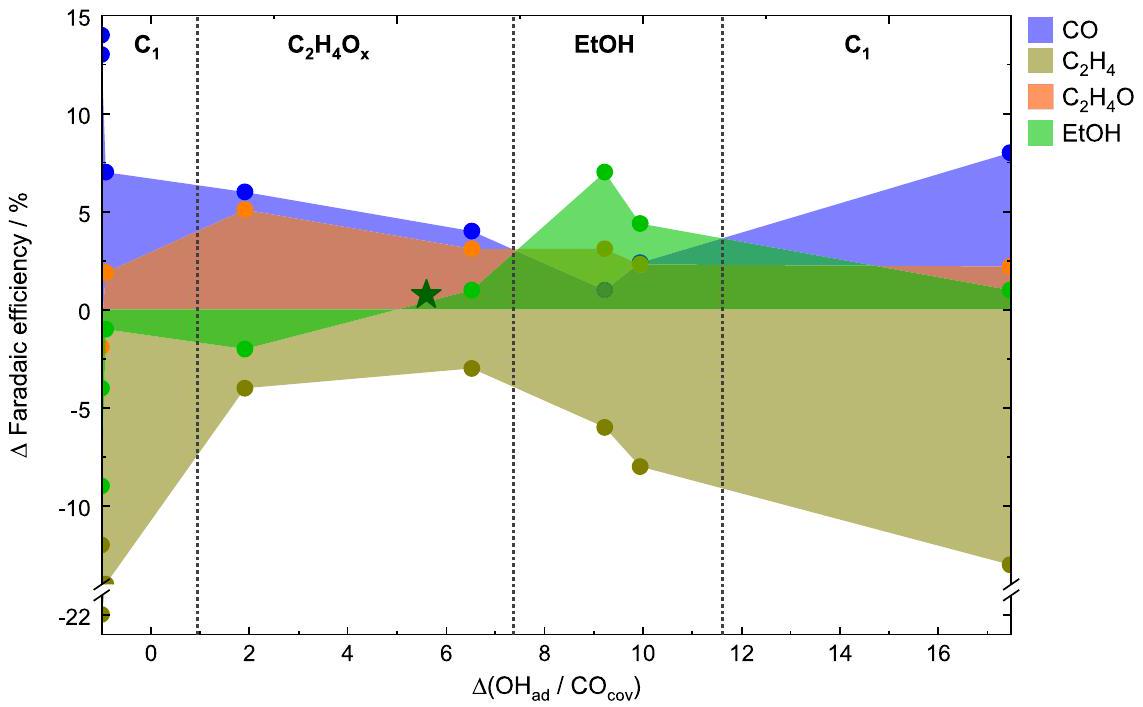
Fig. 4 | Selectivity change correlated with . Correlations between the selectivity change of selected products ( CO , ethylene, acetaldehyde, and ethanol) and the under pulsed conditions
after subtracting the corresponding values under static conditions at -1.0 V . The green star represents the change of the ethanol selectivity during pulsed up to non-oxidizing potentials at .
conditions . We depicted the rather than the partial current densities of the products to compare with the qualitative changes in the relative spectroscopic weight of adsorbate-related bands from SERS. Figure 3b depicts the changes in the during the cathodic part of pulsed , which could be determined by the ratio of the and band intensities . The CO surface coverage has been previously shown to be important for the C-C coupling step, and a higher CO coverage could be linked to the increase of products . Under pulsed , the determined CO coverage is almost unchanged in the regime but decreased in the EtOH regime, while it increased in the regime compared to static conditions (Fig. 3a, b). Thus, the CO coverage does not seem to be the only crucial parameter determining the product selectivity under pulsed conditions.
Therefore, we further investigated the role of , where its beneficial effect was so far only hypothesized or suggested from (theoretical) studies and/or not quantified . Fig. 3d presents the change of the normalized intensities during the cathodic pulse (Supplementary Note 2). This map highlights the increased intensities at shorter anodic pulse lengths ( ) in comparison to static conditions, while the intensities decreased at longer anodic pulse lengths. This fits to the change of the products (Fig. 3a) for lower OH as well as to the enhanced EtOH selectivity at shorter anodic pulse lengths for higher OH intensities (i.e., coverage) (Fig. 3c).
In addition to the average band intensities, the kinetics of the intermediate formation are also expected to significantly influence the observed product generation due to the introduced variations by pulsing the potentials. Therefore, corresponding maps of the ad-/ desorption of and , as well as the oxidation and reduction of depending on the pulse lengths condition, could be created by the use of the time constant of the exponential fits from Fig. 2 (Supplementary Figs. 15-17, Supplementary Tables 3, 4). In the EtOH regime, and vibrations developed faster than they vanished (Supplementary Fig. 15); thus, CO was rapidly available to form EtOH at these pulse lengths. Furthermore, the kinetics of the ad- and desorption of versus (Supplementary Fig. 16), which directly impacts the surface CO coverage, indicate faster kinetics of as compared to . This means that the rapidly available surface CO stems first mainly from , which has been related to the coupling in the literature .
Moreover, even though we could not quantify the intensity of bands related to Cu oxides due their strong SERS sensitivity and missing normalization parameter, we can still follow the kinetic evolution of at short anodic pulse lengths and surface at long anodic pulse lengths (Supplementary Fig. 17). In particular, this demonstrates that adsorbed kinetically quicker in the EtOH regime compared to the surface in the regime, which could be crucial for the rapid availability of oxygen species to form EtOH.
Hydroxide to carbon monoxide coverage ratio determines the products
To shift the focus from the applied pulse lengths, Fig. 4 directly plots the of selected products such as , acetaldehyde and EtOH against the essential adsorbates previously identified, and CO , which are reflected here by the change of their ratio. The changes were calculated with respect to stationary reaction conditions. The corresponding plots showing all the other products can be found in Supplementary Fig. 18. Figure 4 shows that the FEs of and under pulsed were lower, irrespective of the surface adsorbate composition, while the selectivities toward CO, acetaldehyde, and EtOH were (mostly) increased. In fact, Fig. 4 can be divided into four different product regions depending on the ratio. The lowest ratio ( -1 , where no is adsorbed) is characterized by the maximum of products, such as CO and . Increasing ratios (1-7.3) lead to the increased formation of products such as and acetaldehyde. A further increase of the ratios (7.3-11.6) correlates with the highest of EtOH , together with other minor alcohols, while the of , and acetaldehyde decreased, highlighting the beneficial effect of enhanced OH coverage for the ethanol formation. Interestingly, the improvement of the is not only seen in the FE of ethanol but also the partial current density increases at an optimal ratio of co-adsorbed CO and OH during (Supplementary Fig. 19). However, at even higher ratios of the FE of EtOH and ethylene started to decrease, while the FEs of and products such as CO and (Supplementary Fig. 18a) increased. At these high ratios, the selectivities of EtOH and acetaldehyde were still slightly enhanced as compared to static conditions .
We note that the decrease of the ethylene FE may be predominantly linked to irreversible (morphological) catalyst changes
Fig. 5 | Scheme of adsorbate and selectivity evolution during pulsed . Depiction of the processes observed during pulsed with , of pre-reduced in dependence of the anodic and cathodic pulse lengths. , and coverage are highlighted, and the oxidation
state of Cu is indicated, which both contribute to different product selectivities during the cathodic pulse. The rate constant of the CO ad- and desorption, as well as the Cu reduction and oxidation, are schematically specified by the lengths of the arrows to each other, where a longer arrow is correlated to a faster process.
during the harsh working conditions, as shown in our previous work and will be further discussed later .
In order to verify the dependence of the EtOH selectivity on the concentration further, pulsed up to non-oxidizing at was also measured (Supplementary Fig. 20, Supplementary Table 6). The slight enhancement of EtOH compared to the static conditions goes along with a slight enhancement in versus , as also indicated in Fig. 4 (green star), and supports the beneficial effect of for the EtOH production. These findings highlight the crucial role of and CO in the formation of EtOH .
Discussion
From the results discussed, Fig. 5 suggests the mechanism for pulsed , where the periodic switching of the applied potential can change the Cu oxidation state and modify the adsorbate coverage of OH and CO with distinct kinetic behavior. Cu oxide-related species only formed during the anodic pulse and rapidly reduced again once the cathodic pulse was applied. At short anodic ( ) and intermediate cathodic ( ) pulse lengths, vibrations and/or species were detected, which also correlate well with the observation of Cu (II) at short anodic pulses from operando XAS data in our prior study . These species might be essential for the enhanced EtOH selectivity and are directly oxidized from to Cu (II) during the anodic pulse as no characteristic bands could be detected. Instead, at longer anodic ( ) and shorter cathodic pulses ( ), typical bands appeared and reflected the growth and crystallization of over the course of the anodic pulse. Larger amounts of bulk-like , which were still present at the beginning of the cathodic pulse, led then to an enhancement in the methane selectivity linked to morphology changes, as also seen previously with XAS/XRD .
Most importantly, the Cu redox transitions, the OH surface coverage, and the local pH seem to be intertwined. In general, the
concentration of close to and adsorbed on the catalyst surface is expected to increase during pulsed at -1.0 V . Therein, species are produced by the reduction of during the cathodic pulse but are kept close to the catalyst surface due to the positive polarization of the Cu electrode during the anodic pulse. This is expected to increase the local pH during pulsed compared to static . The limited time at short values prevents the formation of an ordered phase and favors the formation of the detected and/or species. At longer oxidizing pulses, the low OH coverage values likely result from consumption for the formation , leading to a decrease in the local pH during , which is known to favor methane and CO production . However, too high coverages of start to block CO adsorption sites and prevent C-C coupling, which leads to an increase in products and .
It is important to note that the decrease of the ethylene and increase of the methane FE is linked to irreversible (morphological) catalyst changes caused by the pulsed reaction conditions (see ex-situ SEM images in Supplementary Fig. 21), which are especially prominent at longer anodic pulse length durations as also shown in our previous work . Here, qualitative agreement to very high roughness and/or Cu dissolution of the Cu NCs could also lead to an increased population of low-coordinated sites, which are selective for hydrogen . For example, sub-nanometer Cu clusters, likely formed under these continuous harsh redox cycles, were observed to be selective for methane formation . This explains that under pulsed conditions, the highest CO coverage (without co-adsorbed ) was identified to enhance methane selectivities, while under less harsh stationary conditions, the highest CO coverage (usually with co-adsorbed ) was attributed to the highest product yield . This suggests that under these pulsed reaction conditions, the C -C coupling is significantly hampered, leading to the reduction of the adsorbed CO to methane. To facilitate EtOH formation, the CO and OH coverage have to be balanced during
pulsed to enhance the protonation of the intermediates and/or hamper its O removal , e.g., by a sufficient OH coverage blocking adjacent adsorption sites. Lower OH or higher CO coverages and, thus, more similar conditions as under static shift the selectivity toward protonated products such as ethylene and acetaldehyde. Therefore, we hypothesize that increasing the interfacial availability of base ( OH ) sites under (acidic) conditions might lead to even higher EtOH formation.
In the EtOH regime, we found faster kinetics of CO adsorbate formation, which are expected to facilitate dimerization and, thus, decrease product formation. The fast kinetics of the CO coverage in the EtOH regime might also be beneficial for the fast stabilization of since has already been demonstrated to stabilize by DFT calculations . Furthermore, the fast kinetics of in the EtOH regime compared to the formation of surface in the regime during the anodic pulse demonstrate the rapid availability of oxygen species with short anodic pulse durations that are needed for ethanol formation.
In conclusion, this study revealed the link between the changes in the adsorbate structure and composition and the catalytic function of oxide-derived Cu nanocatalysts during pulsed by utilizing timeresolved operando SERS. By the implementation of sub-second time resolution, the development of characteristic adsorbates such as OH and CO could be tracked during each individual pulse. In this way, the observed ethanol enhancement could be attributed to an optimal OH and CO surface coverage, which was found to be selectivitydetermining towards alcohols over hydrocarbons. Furthermore, these OH species had a significantly lower concentration during stationary and were not present in noticeable amounts on -derived working catalysts. Thus, only the intermittent formation of an OH/O-covered Cu surface triggers the continuous regeneration of the -covered Cu catalyst during . Furthermore, the preferable CO ad-/desorption kinetics were found to contribute to higher ethanol yields. On the contrary, was found to be converted into bulk-like species, which also led to the decrease of the near-surface pH and the formation of unfavorable products, such as methane and CO , as well as tremendously different reduction mechanisms, not being able to stabilize the OH species. All in all, this study underlines the urgency of time-resolved surface-sensitive techniques such as operando SERS to understand the reaction mechanism of pulsed in order to favor the desired product selectivities. Furthermore, we finally confirmed experimentally the importance of surface base ( OH ) sites within the mechanistic framework which will pave the road for in-depth investigations and novel catalyst design approaches.
Methods
Catalyst preparation
NCs were synthesized by a ligand-free method, as described in our previous study . The reagents were purchased from Sigma Aldrich in ACS grade and used without further purification. 5 mL of a solution ( 0.1 M ) and 15 mL of a NaOH solution ( 0.2 M ) were added to 200 mL of ultrapure water ( ) at room temperature, and the solution was stirred for 5 min . Then, 10 mL of an l-ascorbic acid solution ( 0.1 M ) was added to the mixture, and the solution was further stirred for 1 h . The solution was centrifuged and washed three times, twice with an ethanol-water mixture (1:1) and once with pure ethanol. The product was dried in a vacuum overnight, and the obtained powder was stored in the glove box.
To prepare the electrodes, 1 mg of the catalyst powder was dispersed in 0.5 mL of pure ethanol and ultrasonicated for 15 min to reach a concentration of of . For the operando Raman measurements, of the dispersion were drop-casted on one side of a polished glassy carbon electrode ( , Glassy Carbon
SIGRADUR , HTW) and dried at for 5 min to obtain a mass-loading of .
Electrolyte preparation
(Alfa Aesar, 99.7-100.5%) was purified with a cationexchange resin (Chelex 100 Resin, Bio-Rad) and saturated with ( ) for at least 15 min until a pH of 6.8 was reached.
Operando surface-enhanced Raman spectroscopy
Operando SERS was performed with a Raman spectrometer (Renishaw, InVia Reflex) coupled with an optical microscope (Leica Microsystems, DM2500M) together with a motorized stage for sample tracking (Renishaw, MS300 encoded stage). Calibration of the system was carried out by using a wafer ( ). A near-infrared laser (Renishaw, RL785, , grating 1200 and 1800 lines ), as well as a HeNe laser (Renishaw, RL633, , , grating 1800 lines ), were used as excitation sources. The backscattered light was Rayleigh-filtered and directed to a CCD detector (Renishaw, Centrus). For the operando measurements, the excitation source was focused on the surface of the sample, and Raman scattering signals were collected with a water immersion objective (Leica microsystems, , numerical aperture of 0.9 ). The objective was protected from the electrolyte by a Teflon (FEP) film (Goodfellow, film thickness of 0.0125 mm ), which was wrapped around the objective.
The electrochemical measurements were conducted at room temperature in a home-built spectro-electrochemical flow cell made of PEEK and controlled by a Biologic SP240 potentiostat (Supplementary Fig. 1). The cell was equipped with a leak-free reference electrode (LF-1-63, 1 mm OD, Innovative Instruments, Inc.) positioned close to the sample and a Pt counter electrode in the outlet of the flow. The working electrode with the catalyst drop-casted on glassy carbon was mounted from the bottom of the cell, and the area of the exposed catalyst was . The electrolyte ( ) was -saturated ( ) in its reservoir ( ) outside of the Raman system and, from there, pumped through the cell with a peristaltic pump (PLP 380, Behr Labor-Technik).
The potentials in this manuscript were all converted to the RHE scale ( (vs. RHE) vs. and corrected for drop as determined by electrochemical impedance spectroscopy.
The collection time of each spectrum depends on the applied electrochemical protocol. For the pulsed experiments at the cathodic potential and the anodic potential , acquisition times between 0.1 and 0.8 s were used, depending on the cathodic and anodic pulse lengths and , respectively, to obtain at least three data points per pulse. The exact temporal resolutions for the low Raman shift region are given in Supplementary Table 1. To obtain a high time resolution, usually (if not stated differently), the static Raman mode in the region of was applied together with the 785 nm laser and the 1200 lines grating. In the region of , the 633 nm laser and the 1800 lines grating were used. The Raman data were first processed using the Renishaw WiRE 5.2 software to normalize the data and remove cosmic rays. Octave scripts were written to combine the Raman and the electrochemical data, to fit characteristic Raman bands, and to average the Raman spectra. Averaged Raman spectra were obtained by averaging the Raman data points collected at the same times after the onset of each pulse cycle.
Ex situ scanning electron microscopy
Ex situ SEM images of the samples prior to and after the different electrocatalytic conditions were measured using an SEM (Apreo SEM, Thermo Fisher Scientific) with an in-lens secondary electron detector. The samples were deposited on glassy carbon and directly rinsed with
ultrapure water ( ) after each electrocatalytic measurement to avoid electrolyte salt contamination on the sample.
Selectivity measurements
The main part of the selectivity measurements was already published in our previous work except for the new measurements acquired at (versus RHE and drop corrected) and , and for a total duration of 4000 s . The measurements were carried out in an H-type cell equipped with an anion-exchange membrane (Selemion AMV, AGC) separating the cathodic and the anodic compartments and controlled by an Autolab (Metrohm) potentiostat. A leak-free reference electrode (LF-1, Alvatek) served as the reference electrode, a platinum gauze electrode (MaTecK, 3600 mesh ) as the counter electrode, and deposited on carbon paper as the working electrode. The electrolyte was saturated . Gas products were detected and quantified every 15 min by online gas chromatography (GC, Agilent 7890B), equipped with a thermal conductivity detector and a flame ionization detector. Liquid products were analyzed after each measurement with a high-performance liquid chromatograph (Shimadzu Prominence), equipped with a NUCLEOGEL SUGAR 810 column and a refractive index detector, and a liquid GC (Shimadzu 2010 plus), equipped with a fused silica capillary column and a flame ionization detector. The Faradaic efficiencies were calculated by taking only the cathodic part into account since there is no catalytic activity during the anodic pulse. Specifically, for the calculations of the Faradaic efficiencies of the gas products, the cathodic current was weighted by the term to correct for effective time under , while for the Faradaic efficiencies of the liquid products, just the cathodic charge was taken into account.
Data availability
Additional SERS data, fitting parameter, time constants and additional data are given in the Supplementary Information. The raw SERS data (which require specialized software to process) are available from the corresponding authors on request.
References
Nitopi, S. et al. Progress and perspectives of electrochemical reduction on copper in aqueous electrolyte. Chem. Rev. 119, 7610-7672 (2019).
Hori, Y.; Electrochemical CO2 Reduction on Metal Electrodes 89-189 (Springer, New York, 2008).
Mistry, H., Varela, A. S., Kühl, S., Strasser, P. & Roldan Cuenya, B. Nanostructured electrocatalysts with tunable activity and selectivity. Nat. Rev. Mater. 1, 16009-16022 (2016).
Jeon, H. S., Kunze, S., Scholten, F. & Roldan Cuenya, B. Prismshaped Cu nanocatalysts for electrochemical reduction to ethylene. ACS Catal. 8, 531-535 (2018).
Jeon, H. S. et al. Operando insight into the correlation between the structure and composition of CuZn nanoparticles and their selectivity for the electrochemical reduction. J. Am. Chem. Soc. 141, 19879-19887 (2019).
Herzog, A. et al. Operando investigation of Ag -decorated nanocube catalysts with enhanced electroreduction toward liquid products. Angew. Chem. Int. Ed. 60, 7426-7435 (2021).
Rüscher, M. et al. Tracking heterogeneous structural motifs and the redox behaviour of copper-zinc nanocatalysts for the electrocatalytic reduction using operando time resolved spectroscopy and machine learning. Catal. Sci. Technol. 12, 3028-3043 (2022).
Lum, Y., Yue, B., Lobaccaro, P., Bell, A. T. & Ager, J. W. Optimizing C-C coupling on oxide-derived copper catalysts for electrochemical reduction. J. Phys. Chem. C 121, 14191-14203 (2017).
Gao, D., Scholten, F. & Roldan Cuenya, B. Improved electroreduction performance on plasma-activated Cu catalysts via electrolyte design: halide effect. ACS Catal. 7, 5112-5120 (2017).
Singh, M. R., Kwon, Y., Lum, Y., Ager, J. W. & Bell, A. T. Hydrolysis of electrolyte cations enhances the electrochemical reduction of over Ag and Cu. J. Am. Chem. Soc. 138, 13006-13012 (2016).
Zhou, Y. et al. Stabilization of Cu+ via strong electronic interaction for selective and stable electroreduction. Angew. Chem. Int. Ed. 61, e202205832 (2022).
Mistry, H. et al. Highly selective plasma-activated copper catalysts for carbon dioxide reduction to ethylene. Nat. Commun. 7, 12123-12130 (2016).
Ren, D. et al. Selective electrochemical reduction of carbon dioxide to ethylene and ethanol on copper(I) oxide catalysts. ACS Catal. 5, 2814-2821 (2015).
De Luna, P. et al. Catalyst electro-redeposition controls morphology and oxidation state for selective carbon dioxide reduction. Nat. Catal. 1, 103-110 (2018).
Velasco-Vélez, J.-J. et al. The role of the copper oxidation state in the electrocatalytic reduction of into valuable hydrocarbons. ACS Sustain. Chem. Eng. 7, 1485-1492 (2019).
Dattila, F., García-Muelas, R. & López, N. Active and selective ensembles in oxide-derived copper catalysts for reduction. ACS Energy Lett. 5, 3176-3184 (2020).
Casebolt, R., Levine, K., Suntivich, J. & Hanrath, T. Pulse check: potential opportunities in pulsed electrochemical reduction. Joule 5, 1987-2026 (2021).
Timoshenko, J. et al. Steering the structure and selectivity of electroreduction catalysts by potential pulses. Nat. Catal. 5, 259-267 (2022).
Kimura, K. W. et al. Controlled selectivity of reduction on copper by pulsing the electrochemical potential. ChemSusChem 11, 1781-1786 (2018).
Engelbrecht, A. et al. On the electrochemical reduction at copper sheet electrodes with enhanced long-term stability by pulsed electrolysis. J. Electrochem. Soc. 165, J3059-J3068 (2018).
Shiratsuchi, R. & Nogami, G. Pulsed electroreduction of on silver electrodes. J. Electrochem. Soc. 143, 582-586 (1996).
Jeon, H. S. et al. Selectivity control of Cu nanocrystals in a gas-fed flow cell through pulsed electroreduction. J. Am. Chem. Soc. 143, 7578-7587 (2021).
Le Duff, C. S., Lawrence, M. J. & Rodriguez, P. Role of the adsorbed oxygen species in the selective electrochemical reduction of to alcohols and carbonyls on copper electrodes. Angew. Chem. Int. Ed. 56, 12919-12924 (2017).
Kimura, K. W. et al. Selective electrochemical reduction during pulsed potential stems from dynamic interface. ACS Catal. 10, 8632-8639 (2020).
Kim, C., Weng, L.-C. & Bell, A. T. Impact of pulsed electrochemical reduction of on the formation of products over Cu . Catal. 10, 12403-12413 (2020).
Arán-Ais, R. M., Scholten, F., Kunze, S., Rizo, R. & Roldan Cuenya, B. The role of in situ generated morphological motifs and species in C2+ product selectivity during pulsed electroreduction. Nat. Energy 5, 317-325 (2020).
Chou, T.-C. et al. Controlling the oxidation state of the Cu electrode and reaction intermediates for electrochemical reduction to ethylene. J. Am. Chem. Soc. 142, 2857-2867 (2020).
Iijima, G., Inomata, T., Yamaguchi, H., Ito, M. & Masuda, H. Role of a hydroxide layer on Cu electrodes in electrochemical reduction. ACS Catal. 9, 6305-6319 (2019).
Gunathunge, C. M., Ovalle, V. J., Li, Y., Janik, M. J. & Waegele, M. M. Existence of an electrochemically inert CO population on Cu electrodes in alkaline pH. ACS Catal. 8, 7507-7516 (2018).
Dinh, C.-T. et al. electroreduction to ethylene via hydroxidemediated copper catalysis at an abrupt interface. Science 360, 783-787 (2018).
Roiaz, M. et al. Roughening of copper (100) at elevated CO pressure: Cu adatom and cluster formation enable CO fissociation. J. Phys. Chem. C 123, 8112-8121 (2019).
Gameel, K. M., Sharafeldin, I. M., Abourayya, A. U., Biby, A. H. & Allam, N. K. Unveiling CO adsorption on Cu surfaces: new insights from molecular orbital principles. Phys. Chem. Chem. Phys. 20, 25892-25900 (2018).
Zhan, C. et al. Revealing the CO coverage-driven C-C coupling mechanism for electrochemical reduction on nanocubes via operando Raman spectroscopy. ACS Catal. 11, 7694-7701 (2021).
De Ruiter, J. et al. Probing the dynamics of low-overpotential -to-CO activation on copper electrodes with time-resolved Raman spectroscopy. J. Am. Chem. Soc. 144, 15047-15058 (2022).
Moradzaman, M. & Mul, G. In situ Raman study of potentialdependent surface adsorbed carbonate, , and C species on Cu electrodes during electrochemical reduction of . ChemElectroChem 8, 1478-1485 (2021).
Niaura, G. Surface-enhanced Raman spectroscopic observation of two kinds of adsorbed OH- ions at copper electrode. Electrochim. Acta 45, 3507-3519 (2000).
Singhal, A. et al. Copper(I) oxide nanocrystals-one step synthesis, characterization, formation mechanism, and photocatalytic properties. Eur. J. Inorg. Chem. 2013, 2640-2651 (2013).
Deng, Y., Handoko, A. D., Du, Y., Xi, S. & Yeo, B. S. In situ Raman spectroscopy of copper and copper oxide surfaces during electrochemical oxygen evolution reaction: identification of Culll oxides as catalytically active species. ACS Catal. 6, 2473-2481 (2016).
Li, J. et al. Electrokinetic and in situ spectroscopic investigations of CO electrochemical reduction on copper. Nat. Commun. 12, 3264-3274 (2021).
Zhao, Y. et al. Speciation of Cu surfaces during the electrochemical CO reduction reaction. J. Am. Chem. Soc. 142, 9735-9743 (2020).
Chan, H. Y. H., Takoudis, C. G. & Weaver, M. J. Oxide film formation and oxygen adsorption on copper in aqueous media as probed by surface-enhanced Raman spectroscopy. J. Phys. Chem. B 103, 357-365 (1999).
Bodappa, N. et al. Early stages of electrochemical oxidation of Cu(111) and polycrystalline Cu surfaces revealed by in situ Raman spectroscopy. J. Am. Chem. Soc. 141, 12192-12196 (2019).
Jiang, S., Klingan, K., Pasquini, C. & Dau, H. New aspects of operando Raman spectroscopy applied to electrochemical reduction on Cu foams. J. Chem. Phys. 150, 041718-041729 (2019).
An, H. et al. Sub-second time-resolved surface-enhanced Raman spectroscopy reveals dynamic CO intermediates during electrochemical reduction on copper. Angew. Chem. Int. Ed. 60, 16576-16584 (2021).
Chang, . et al. Determining intrinsic stark tuning rates of adsorbed CO on copper surfaces. Catal. Sci. Technol. 11, 6825-6831 (2021).
Cao, Y. et al. Surface hydroxide promotes electrolysis to ethylene in acidic conditions. Nat. Commun. 14, 2387 (2023).
Sun, M., Staykov, A. & Yamauchi, M. Understanding the roles of hydroxide in electroreduction on a Cu electrode for achieving variable selectivity. ACS Catal. 12, 14856-14863 (2022).
Zhang, Q. et al. Regulated CO adsorption by the electrode with repulsive property for enhancing C-C coupling. GreenChE 4, 331-337 (2023).
Reske, R., Mistry, H., Behafarid, F., Roldan Cuenya, B. & Strasser, P. Particle size effects in the catalytic electroreduction of on Cu nanoparticles. J. Am. Chem. Soc. 136, 6978-6986 (2014).
Jiang, K. et al. Effects of surface roughness on the electrochemical reduction of over Cu . ACS Energy Lett. 5, 1206-1214 (2020).
Akemann, W. & Otto, A. Vibrational modes of CO adsorbed on disordered copper films. J. Raman Spectrosc. 22, 797-803 (1991).
Hori, Y., Takahashi, R., Yoshinami, Y. & Murata, A. Electrochemical reduction of CO at a copper electrode. J. Phys. Chem. B 101, 7075-7081 (1997).
Acknowledgements
This work was funded by the Deutsche Forschungsgemeinschaft (DFG, German Research Foundation), project no. 327886311-SPP 2080. Additional financial support from the European Research Council under grant ERC-OPERANDOCAT (ERC-725915) was also greatly appreciated. A.H. and C.R. acknowledge support by the IMPRS for Elementary Processes in Physical Chemistry. We also thank Petrik Bischoff for his help in designing and manufacturing the operando flow cell. We thank Dr. Chao Zhan (FHI) for helpful discussions. Open access funding was provided by the Max Planck Society.
Author contributions
A.H., A.B. and B.R.C. contributed to writing the manuscript. A.B. and B.R.C supervised the study. A.H. designed, planned, and analyzed all operando SERS experiments. A.H. and M.L.L. designed the operando SERS cell setup. A.H. and H.S.J. prepared the samples. A.H. and C.R. performed the electrocatalytic selectivity measurements. P.G. carried out the SEM measurements.
Funding
Open Access funding enabled and organized by Projekt DEAL.
Correspondence and requests for materials should be addressed to Arno Bergmann or Beatriz Roldan Cuenya.
Peer review information Nature Communications thanks Juan Victor Perales-Rondón, and the other, anonymous, reviewers for their contribution to the peer review of this work. A peer review file is available.
¹Department of Interface Science, Fritz Haber Institute of the Max-Planck Society, 14195 Berlin, Germany. Present address: Massachusetts Institute of Technology, Research Laboratory of Electronics, 77 Massachusetts Ave, Cambridge, MA 02139, USA. Present address: Chemical Sciences Division, Lawrence Berkeley National Laboratory, Berkeley, CA 94720, USA. Present address: Korea Institute of Science and Technology, 5 Hwarang-ro 14-gil, Wolgok 2(i)-dong, Seongbuk-gu, Seoul, South Korea. e-mail: abergmann@fhi-berlin.mpg.de; roldan@fhi-berlin.mpg.de