تسهيل لحظات ثنائية القطب المستحثة في محفزات ZnCdS غير المتبلورة لتطور الهيدروجين الضوئي Induced dipole moments in amorphous ZnCdS catalysts facilitate photocatalytic H2 evolution

المجلة: Nature Communications، المجلد: 15، العدد: 1
DOI: https://doi.org/10.1038/s41467-024-47022-z
PMID: https://pubmed.ncbi.nlm.nih.gov/38521830
تاريخ النشر: 2024-03-23

تسهيل لحظات ثنائية القطب المستحثة في محفزات ZnCdS غير المتبلورة لتطور الهيدروجين الضوئي

تاريخ الاستلام: 21 نوفمبر 2023
تم القبول: 18 مارس 2024
نُشر على الإنترنت: 23 مارس 2024
(أ) التحقق من التحديثات

شين وانغ بويان ليو سيكينغ ما ينغجوان زانغ ليانزهو وانغ غانغكيانغ زو © وي هاي (1) سونغكان وانغ

الملخص

تعتبر أشباه الموصلات غير المتبلورة التي تفتقر إلى هياكل الشبكة البلورية المثالية غير ملائمة عادةً للتصوير الضوئي بسبب وجود حالات الفخ الغنية والعيوب. هنا نوضح أن كسر النظام الذري بعيد المدى في محفز ZnCdS غير المتبلور يمكن أن يحفز لحظات ثنائية القطب ويولد مجالات كهربائية قوية داخل الجسيمات مما يسهل فصل الشحنات ونقلها. التحميل منخفض التكلفة المحفزات المساعدة لمادة ZnCdS تزيد من معدل التطور إلى ، وهو أعلى بأكثر من 5 مرات من نظيره البلوري ومستقر على المدى الطويل حتى 160 ساعة. مادة مرنة تم تحضير فيلم ZnCdS بواسطة تقنية الطلاء بالشفرات السهلة ويمكن أن ينتج العديد من الملاحظات. فقاعات تحت ضوء الشمس الطبيعي، تظهر إمكانيات للتوسع في الطاقة الشمسية الإنتاج.

لقد كان الحياد الكربوني هو الإجماع العالمي للتنمية المستدامة في المجتمع الحديث. . نظرًا لسعة الطاقة العالية ( ) وميزات خالية من الكربون، الهيدروجين ( لقد تم اعتبار ( ) مصدراً واعداً للطاقة ليحل محل الوقود الأحفوري في المستقبل. . ومع ذلك، على الرغم من من في العالم يتم إنتاجه من الوقود الأحفوري مثل إعادة تشكيل البخار للغاز الطبيعي، والأكسدة الجزئية للهيدروكربونات الأثقل، وتغويز الفحم، والتي لا تستهلك فقط الوقود الأحفوري غير المتجدد، بل تولد أيضًا ثاني أكسيد الكربون. . لذلك، السعي نحو حلول فعالة ومنخفضة التكلفة وصديقة للبيئة تكنولوجيا الإنتاج ذات أهمية قصوى.
تقسيم الماء باستخدام الطاقة الشمسية بطريقة التحفيز الضوئي يوفر وسيلة فعالة من حيث التكلفة وصديقة للبيئة من أجل الطاقة الخضراء إنتاج . ومع ذلك، فإن التطبيق الواسع النطاق لهذه التكنولوجيا مقيد بشكل رئيسي بسبب انخفاضها كفاءة الإنتاج واستقرار ضعيف، بسبب إعادة التركيب الشديدة للشحنات في الكتلة وقدرات الأكسدة والاختزال القوية لأزواج الإلكترون-الثقب المتولدة ضوئيًا التي قد تؤدي إلى تحلل المحفز الضوئي نفسه. . لذلك، فإن تطوير محفزات ضوئية عالية النشاط، قوية وفعالة من حيث التكلفة هو أمر مهم ولكنه يمثل تحديًا. إذا كانت خصائص الفصل والنقل لـ
يمكن تحسين أزواج الإلكترونات والثقوب الناتجة عن الضوء بشكل كبير، حيث يمكن استهلاك الإلكترونات والثقوب الناتجة عن الضوء في التفاعلات الضوئية الحفازة على السطح، وبالتالي يمكن القضاء على التفاعلات الجانبية بين حوامل الشحنة الناتجة عن الضوء والحفاز الضوئي نفسه. خلال عملية التحفيز الضوئي، يتم نقل الإلكترونات والثقوب الناتجة عن الضوء بشكل عشوائي داخل الحفاز الضوئي الجزيئي بسبب عدم وجود مجال كهربائي موجه. نتيجة لذلك، يمكن فقط لنسبة صغيرة من حوامل الشحنة الناتجة عن الضوء أن تصل إلى أسطح المحفز الضوئي لتفاعلات تحليل الماء. في العقود الماضية، تم تكريس جهود عالمية لتعزيز فصل الشحنات من خلال التلاعب في المجال الكهربائي المدمج في المحفزات الضوئية. . على سبيل المثال، مجال كهربائي مدمج في تم توليده بواسطة استقطاب المواد الفيروكهربائية الذي يحتاج عمومًا إلى طاقة ميكانيكية خارجية (مثل الموجات فوق الصوتية). يمكن أيضًا تشكيل مجال كهربائي مدمج بواسطة الوصلات غير المتجانسة في المحفزات الضوئية، ولكن يتم توليد منطقة شحنة فراغية مختلفة فقط عند واجهة مادتين بدلاً من انحناء النطاق الكتلي المرغوب فيه. . نتيجة لذلك، لا يمكن معالجة مشكلة إعادة التركيب في الشحنة الكثيفة بشكل كامل. كيف يمكن تعزيز الكتلة بشكل كبير
تظل كفاءة فصل الشحنات في التحفيز الضوئي الجزيئي سؤالاً مفتوحاً.
إذا تم كسر تناظر ترتيب الذرات في الهيكل البلوري لمادة التحفيز الضوئي، فسوف ينتقل مركز الشحنة الموجبة والسالبة لتشكيل لحظة ثنائية القطب وتوليد حقل كهربائي. ، والتي قد توفر فرصًا بديلة لمعالجة مشكلة إعادة تركيب الشحنات الكبيرة أثناء التحفيز الضوئي. هنا، نقوم بتطوير عملية تخليق كيميائي رطب سهلة لتصميم محفز ZnCdS غير المتبلور (AZCS). تظهر كل من محاكاة نظرية الكثافة الوظيفية (DFT) والتوصيفات التجريبية أن الترتيب غير المتماثل للذرات في AZCS يمكن أن يولد لحظات ثنائية القطب لتشكيل مجالات كهربائية تسهل فصل الشحنات ونقلها. من خلال تحميل كعامل مساعد منخفض التكلفة، الـ يمكن أن ينتج العديد من فقاعات تحت ضوء مصباح Xe وضوء الشمس الطبيعي (الأفلام التكميلية 1 و 2)، تظهر نشاطًا ضوئيًا محفزًا معدل التطور ، وهو أعلى بأكثر من 5 مرات من نظيره البلوري ( ). علاوة على ذلك، فإن العائد الكمي الظاهر (AQY) لـ يتم الحصول عليه من AZCS مضاء بواسطة ضوء أحادي اللون بطول موجي 420 نانومتر. AZCS يظهر استقرارًا طويل الأمد يصل إلى 160 ساعة للتفاعل الضوئي. التطور. بالإضافة إلى ذلك، فإن مرونة تم تصنيع الفيلم على ورق الألمنيوم باستخدام طريقة الطلاء بالشفرة، والتي تكون قوية بعد الانحناء المتكرر (الفيلم التكميلي 3)، وعدد كبير من يمكن ملاحظة الفقاعات تحت ضوء مصباح الزينون وأشعة الشمس الطبيعية (الأفلام التكميلية 4 و 5).

النتائج

آلية حقول ثنائية القطب الناتجة عن الهيكل غير المتبلور

للتحقق نظريًا من أن ZnCdS غير المتبلور (AZCS) لديه مجالات ثنائية القطب أقوى بسبب ترتيب الذرات غير المنتظم، تم إجراء حسابات نظرية الكثافة (DFT) للتحقيق في تأثير الهيكل غير المتبلور على فصل ونقل الحاملات الناتجة عن الضوء. في النظام السداسي لـ ZnCdS البلوري (CZCS)، يرتبط كل ذرة Zn أو Cd بأربع ذرات S مع هيكل طبقي مثالي (الشكل 1a والرؤية العلوية في الشكل التكميلي S1a)، بينما يظهر AZCS ترتيبًا عشوائيًا لـ و الهرم الرباعي (الشكل 1ب ورؤية من الأعلى في الشكل التكميلي S1ب). الشكل التكميلي S2 يعرض طاقة DFT كدالة للزمن عند 300 كلفن لـ CZCS و AZCS، على التوالي. يظهر CZCS طاقة أقل من
نظير AZCS، مما يدل على الاستقرار الهيكلي الأعلى. علاوة على ذلك، يتم عرض توزيعات كثافة الشحنة الناتجة عن التشوه لـ CZCS و AZCS على طول المستوى (011) في الشكل 1c و d، على التوالي. توزيع الشحنة في CZCS متجانس للغاية ومنظم بشكل كبير، بينما يظهر AZCS توزيعًا عشوائيًا لكثافة الشحنة الناتجة عن التشوه، والذي يُعزى إلى الترتيب والتوزيع الذري المختلف في CZCS و AZCS.
وفقًا لهياكل AZCS و CZCS، تم حساب لحظات ثنائي القطب. كما هو موضح في الشكل 1e، فإن CZCS ذو الهيكل البلوري المثالي يظهر لحظات ثنائي القطب صغيرة نسبيًا تبلغ 31.73 و -27.48 و -87.85 ea على طول -, -, و -الاتجاهات، على التوالي. ومع ذلك، فإن لحظة ثنائي القطب على طول -الاتجاه معزز بشكل كبير إلى Å في AZCS. يتم ملاحظة تحسين أكثر وضوحًا في – و -الاتجاهات، مع قيم -153.80 و Å، على التوالي. عندما يكون هناك زوج من الشحنات المعاكسة ” و ” ” تفصلها مسافة ” “، يتم إنشاء ثنائي قطب كهربائي. يتم قياس حجم الثنائي القطبي بواسطة لحظته القطبية، والتي تساوي مضروب في . اتجاه لحظة ثنائي القطب في الفضاء هو من الشحنة السلبية ” إلى الإيجابي ” يعني الحجم الأكبر للقيمة المطلقة لعزم ثنائي القطب أن القوة الدافعة الإضافية الأقوى يمكن أن تتولد في المحفز الضوئي لتعزيز فصل الشحنات. لذلك، فإن الهيكل غير المتبلور مع ترتيب غير منظم للذرات في AZCS يحفز مجالات ثنائية القطب قوية على طول الاتجاهات (100) و(010) و(001)، مما يسهل فصل الشحنات ونقلها في محفز ضوئي جزيئي.
وفقًا لنتائج الحساب الموضحة في الشكل 1e، فإن توزيعات مراكز الشحنات الموجبة والسالبة لـ CZCS و AZCS في الـ تم عرض الطائرات (الشكل 1f، g). نظرًا لأن توزيع كثافة الشحنة في CZCS متماثل (الشكل 1c)، فإن مراكز الشحنة الموجبة والسالبة قريبة، مما يولد لحظة ثنائية القطب صغيرة نسبيًا (الشكل 1f). بالمقارنة، فإن نظير AZCS غير متماثل تمامًا (الشكل 1d)، ومراكز الشحنة الموجبة والسالبة مفصولة بشكل كبير، مما يشكل لحظة ثنائية القطب أقوى بكثير تبلغ 197.01 eå على طول اتجاه (001) (الشكل 1g).
لتوضيح مساهمة لحظات ثنائية القطب في فصل الشحنة، تم تقديم مخطط (الشكل 1h) لهياكل نطاق الطاقة لـ CZCS و AZCS خلال عملية التحفيز الضوئي. بالنسبة لـ CZCS بدون لحظات ثنائية القطب واضحة، فإن انحناء نطاق الطاقة صغير جدًا
الشكل 1 | التحليل النظري لحقول ثنائية القطب في الهياكل البلورية وغير البلورية. ترتيب الذرات وتوزيع (أ) CZCS و (ب) AZCS. كثافات الشحنة المشوهة لـ (ج) CZCS و (د) AZCS على مستوى (011). هـ لحظات ثنائية القطب المحسوبة لـ AZCS و CZCS على طول ثلاثة اتجاهات مختلفة


0.30 e 0.27 e 0.24 e 0.21 e 0.18 e 0.15 e 0.15 e A 0.12 e 0.09 e 0.06 e 0.03 e 0.00 e
د


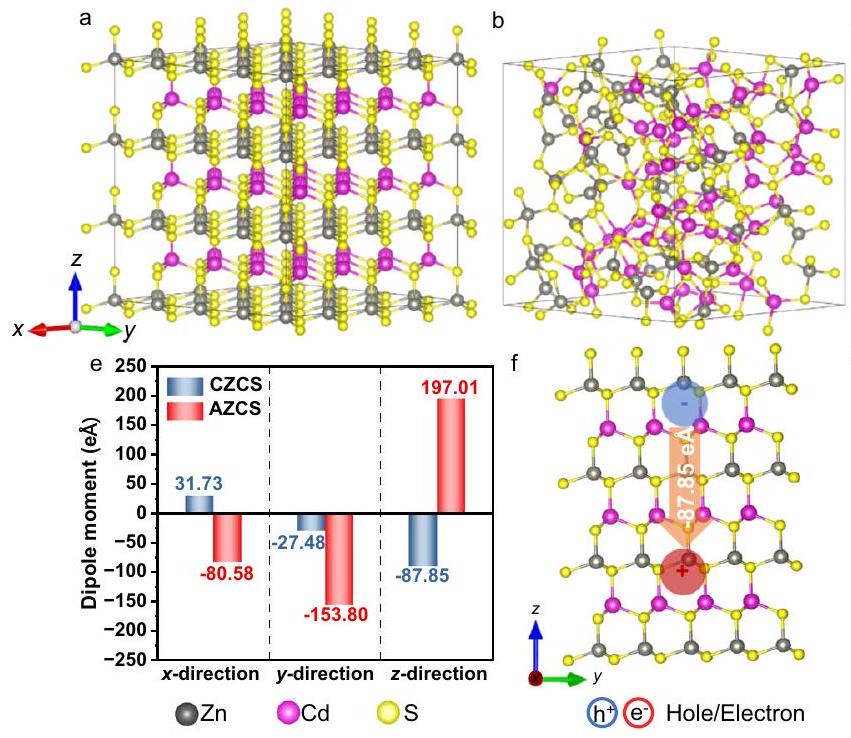
الاتجاهات البلورية. مخططات (ف) CZCS و (ج) AZCS مع مراكز الشحنة الموجبة والسالبة. مخطط لتأثير تعزيز حقل ثنائي القطب على نقل الشحنة.
تخطيط لـ و S في CZCS، ( ) أنماط XRD، طيف رامان و FTIR لـ AZCS و CZCS، (ر) محتوى العناصر النسبية لـ من AZCS و CZCS التي تم الحصول عليها بواسطة ICP-OES.
الشكل 2 | الشكل والمظهر والخصائص السطحية لـ AZCS و CZCS. أ-ج صور SEM، TEM، HRTEM ونمط SAED (الإدراج في ج) لـ AZCS، (د-ز) TEM EDS وتخطيط العناصر لـ Zn و Cd و S في AZCS، ( ) صور SEM، TEM، HRTEM ونمط SAED (الإدراج في ) لـ CZCS، ( ) TEM EDS وتخطيط العناصر
صغير جدًا لتحفيز الفصل الاتجاهي للإلكترونات والثقوب الناتجة عن الضوء، ويحدث إعادة تركيب شحنة شديدة. ومع ذلك، عندما يتم تعطيل ترتيب جميع خلايا الوحدة المرتبة جيدًا في بلورة ZnCdS، فإنه سيسبب توزيع غير متساوٍ للشحنة في الفضاء، مما يولد لحظات ثنائية القطب التي تحفز حقول ثنائية القطب قوية في كامل المحفز الضوئي. سيؤدي حقل ثنائي القطب الاتجاهي القوي إلى انحناء كبير في نطاق الطاقة في AZCS لتعزيز فصل الشحنة، مما يمكن أن يعزز النشاط التحفيزي الضوئي والاستقرار.
لإظهار تأثير ترتيب الذرات وتوزيعها على فجوة الطاقة، تم أيضًا حساب أعلى مدار جزيئي مشغول (HOMO) وأقل مدار جزيئي غير مشغول (LUMO) لـ CZCS و AZCS. كما هو موضح في الشكل التكميلي S3، فإن كثافات الشحنة لـ HOMO محلية بشدة عند ذرات S، وكثافات الشحنة لـ LUMO محلية بشدة عند و S، وهو ما يتماشى مع الأدبيات التي تشير إلى أن الحد الأقصى لنطاق التكافؤ (VB) لـ ZnCdS يهيمن عليه بشكل رئيسي مدار ذرة S، بينما الحد الأدنى لنطاق التوصيل (CB) لـ ZnCdS يساهم فيه بشكل رئيسي تزاوج مدار ذرة Zn، و مدار ذرة Cd و مدار ذرة S . بالإضافة إلى ذلك، فإن فجوة الطاقة لـ AZCS أضيق من نظيرتها CZCS، مما يشير إلى أن AZCS يمكن أن يمتص نطاقًا أوسع من الضوء.

خصائص المحفزات الضوئية التي تم تصنيعها

تم تحليل الشكل والهيكل والميكروستركشر لـ AZCS و CZCS التي تم تصنيعها بواسطة المجهر الإلكتروني الماسح (SEM) والمجهر الإلكتروني الناقل (TEM) و HRTEM
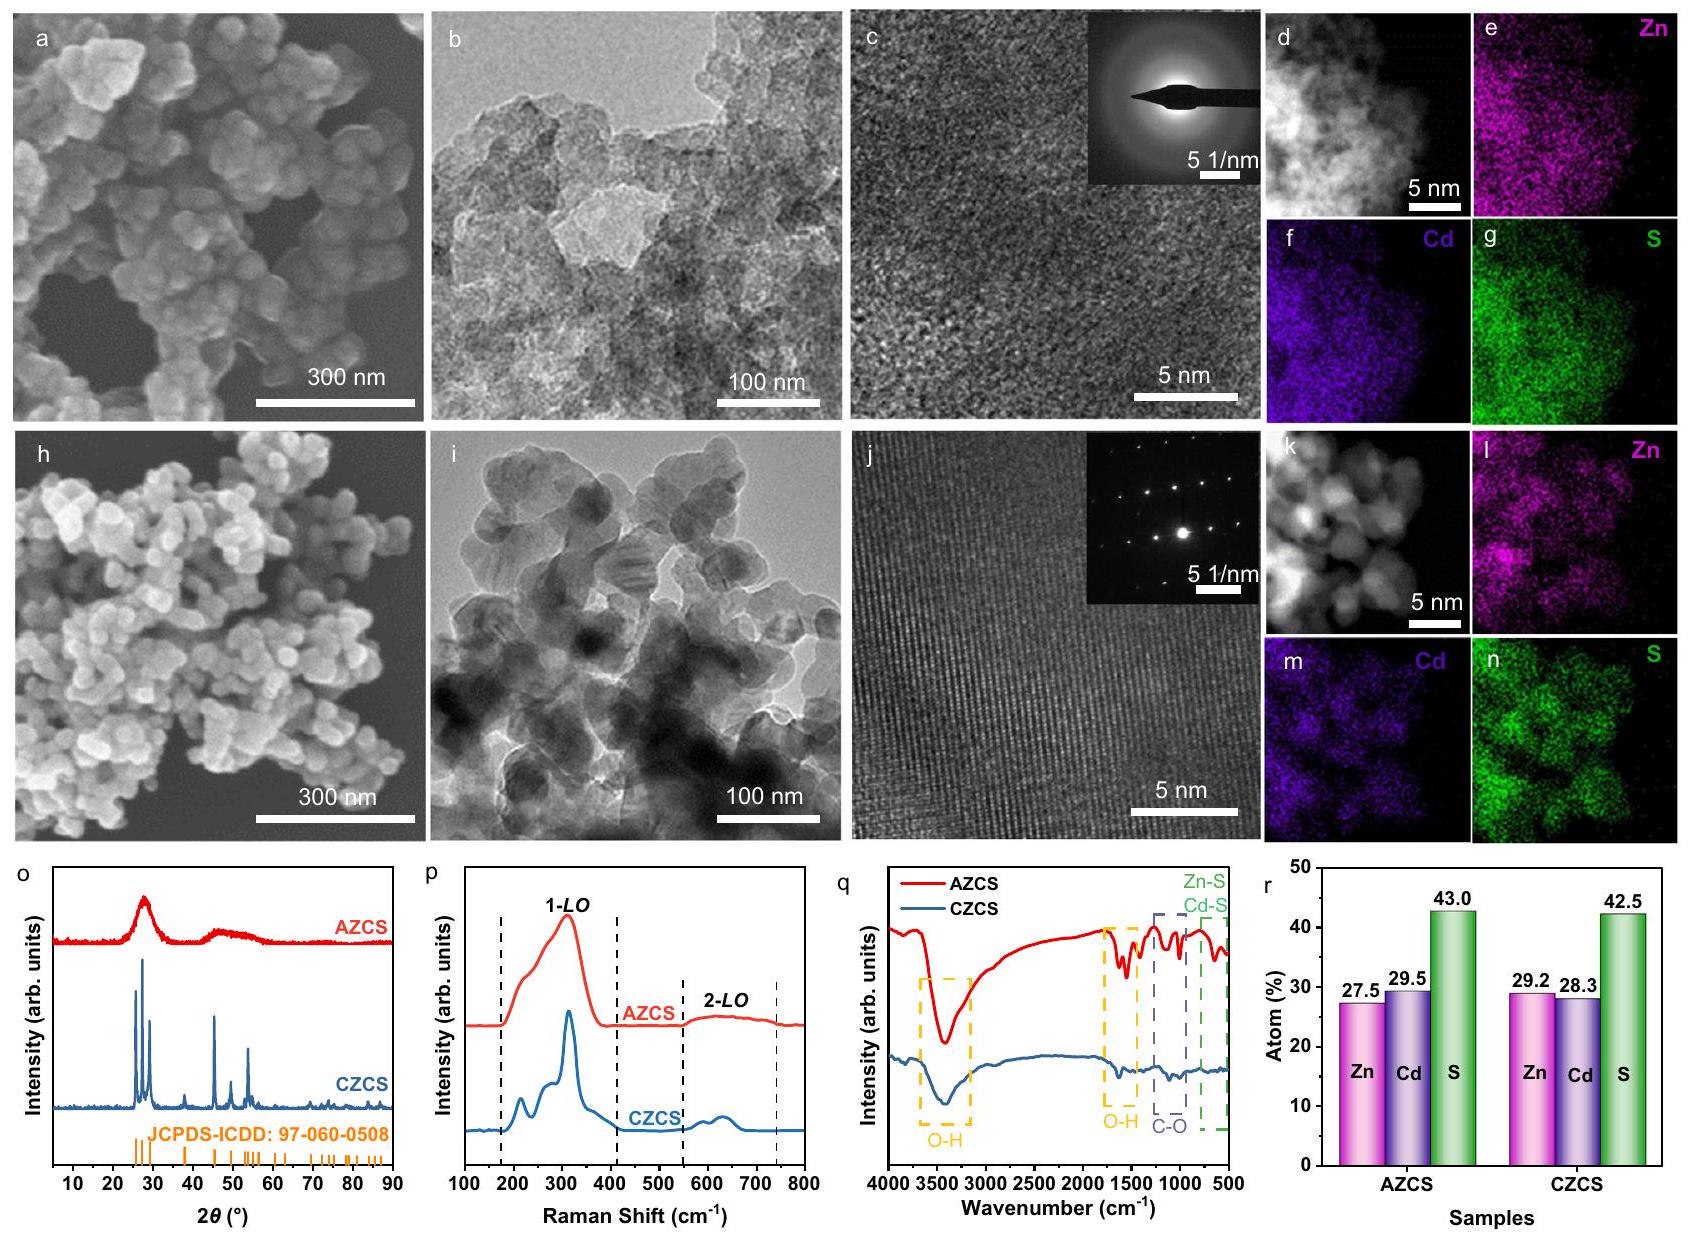
(HRTEM). كما هو موضح في الشكل 2أ، يتكون AZCS من جزيئات نانوية متصلة بحجم يقارب 42.4 نانومتر. لا يمكن ملاحظة حدود حبيبية حادة في صورة TEM (الشكل 2ب)، مما يشير إلى الخصائص غير البلورية. تُظهر صورة HRTEM لـ AZCS ترتيبًا ذريًا غير منظم بدون حواف شبكية واضحة (الشكل 2ج)، ونمط حيود الإلكترون في المنطقة المختارة (SAED) يظهر حلقات هالة مستمرة وسميكة بدون أي نقاط حيود مميزة (الإدراج في الشكل 2ج)، مما يشير إلى السمة غير البلورية لـ AZCS. يُظهر تخطيط طيف الأشعة السينية المشتتة للطاقة (EDS) لـ AZCS توزيعًا متجانسًا لعناصر و S (الشكل 2د-ز). بالمقارنة، يتم ملاحظة العديد من الجزيئات النانوية بحجم حوالي 49.1 نانومتر في CZCS، ويمكن ملاحظة حدود حبيبية واضحة بين الجزيئات (الشكل 2ح، ط)، والتي تُعزى إلى زيادة البلورية خلال عملية التلبيد عند درجات حرارة عالية.
وفقًا لصور SEM و TEM لـ AZCS و CZCS (الشكل 2أ، ح)، فإن أحجام جزيئاتها متشابهة. لتأكيد توزيعات أحجام الجزيئات بشكل أكبر، تم تحليل مسحوق AZCS و CZCS بواسطة محلل حجم الجسيمات النانوية. كما هو موضح في الشكل التكميلي S4، فإن توزيع حجم الجسيمات لـ AZCS هو ، بينما CZCS هو . الأحجام المتوسطة لجزيئات AZCS و CZCS هي 170.47 و 213.43 نانومتر، على التوالي، مما يشير إلى أن التلبيد عند درجات حرارة عالية في يزيد من نطاق توزيع حجم الجسيمات بينما له تأثيرات قليلة على الحجم المتوسط للجسيمات. يجب الإشارة إلى أن حجم الجسيمات الذي تم قياسه بواسطة محلل حجم الجسيمات النانوية هو نتائج إحصائية من 20 ملغ من العينة، بينما حجم الجسيمات الذي تم قياسه بواسطة TEM هو فقط الجسيمات القابلة للملاحظة
المعروضة في صورة TEM. لذلك، قد تكون قيم حجم الجسيمات التي تم قياسها بواسطة هاتين الطريقتين المختلفتين مختلفة، بينما يمكن مقارنة القيم التي تم قياسها بنفس الطريقة بشكل معقول. يتم عكس ترتيب الذرات المنظم من خلال الحواف الشبكية الواضحة في صورة HRTEM (الشكل 2ي)، وتظهر النقاط الأساسية في نمط SAED (الإدراج في الشكل 2ي) أن CZCS بلوري للغاية. يؤكد تخطيط EDS توزيعًا متجانسًا لـ و S (الشكل )، وهو مشابه لذلك الخاص بنظيرتها AZCS.
تم الكشف عن الهياكل البلورية لـ AZCS و CZCS بشكل أكبر بواسطة حيود الأشعة السينية (XRD). كما هو موضح في الشكل 20، يتم ملاحظة أنماط XRD مختلفة تمامًا بين AZCS و CZCS. على وجه التحديد، تعرض CZCS قمم حيود حادة للغاية بينما تحتوي AZCS على قمتين عريضتين فقط، مما يثبت الاضطراب على المدى الطويل في ترتيب الذرات في AZCS. بالإضافة إلى ذلك، يتطابق نمط XRD لـ CZCS بشكل جيد مع ZnCdS السداسي (JCPDS-ICDD: 97-060-0508).
لفهم تأثير درجة الحرارة على البلورية خلال التصنيع والتلبيد، تم إعداد عينات AZCS أخرى في درجة حرارة الغرفة، تليها تلبيد عند درجات حرارة مختلفة (200، 400، و ). مقارنةً بنمط XRD لـ ZCSO، يتم تقسيم القمة العريضة عند إلى قمتين عندما يتم إعداد العينة في درجة حرارة الغرفة (ZCSRT، الشكل التكميلي S5)، مما يشير إلى زيادة البلورية. بالإضافة إلى ذلك، مع زيادة درجة الحرارة خلال التلبيد، تصبح جميع القمم في أنماط XRD أكثر حدة (الشكل التكميلي S5)، مما يشير إلى الزيادة التدريجية في البلورية. تم حساب البلورية النسبية لعينة ZCSO و ZCSRT و ZCS200 و ZCS400 و ZCS600 وفقًا لقمم XRD الخاصة بها. كما هو مدرج في الجدول التكميلي S1، فإن بلورية ZCSO (AZCS) هي فقط بينما نظيرتها ZCS600 (CZCS) هي . البلوريات لـ ZCSRT و ZCS200 و ZCS400 هي و ، على التوالي، وهو ما يتماشى مع القاعدة التي تنص على أن البلورية تزداد مع زيادة درجة حرارة التلبيد.
لإظهار تطور قمم XRD خلال التلبيد بشكل أفضل، تم إجراء تحليل XRD في الموقع لعينة ZCSO التي تم تلبيدها من درجة حرارة الغرفة إلى في جو . يظهر الشكل التكميلي S6 اتجاهات مشابهة للنتائج الخارجية (الشكل التكميلي S5)، مما يؤكد تطور الخصائص غير البلورية إلى البلورية عندما تزداد درجة الحرارة من درجة حرارة الغرفة إلى . يجب الإشارة إلى أن قمم XRD للعينة التي تم جمعها عند بواسطة XRD في الموقع (الشكل التكميلي S6) أضعف من ZCS600 التي تم تحليلها بواسطة XRD الخارجي (الشكل التكميلي S5)، وهو ما يُعزى إلى معدل المسح الأعلى بكثير خلال التحليل في الموقع ( لـ XRD الخارجي، بينما لـ XRD في الموقع).
تم إجراء طيف رامان وطيف الأشعة تحت الحمراء بواسطة تحويل فورييه (FTIR) لمزيد من تحليل الروابط الكيميائية السطحية لـ AZCS و CZCS. كما هو موضح في الشكل 2ص، يوجد حزامان مميزان في رامان عند و تُنسب إلى الطولية البصرية الأولى والثانية ( و ) الفونونات في ZnCdS ، على التوالي . تظهر AZCS شريحتين أوسع وأقل وضوحًا عند 311 و مقارنةً بنظيرها CZCS، مما يظهر الاضطراب المكاني والتماثل الانتقالي للهيكل غير المتبلور تظهر طيف FTIR لـ AZCS و CZCS في الشكل 2q. تقع قمم الاهتزاز في FTIR ضمن النطاقات و ، والتي تتوافق مع اهتزازات تمدد وثني مجموعة O-H على التوالي، مما يمثل الامتزاز لـ الجزيئات على العينات. بالإضافة إلى ذلك، فإن نطاقات الاهتزاز التمددي لـ و تُلاحظ في النطاق من 500 إلى . الفرقة المميزة الأخرى في يجب أن يُنسب إلى روابط C-O-C، والتي تعود إلى الامتزاز السطحي لـ من من الواضح أن كثافة الربط لجميع الروابط في CZCS أضعف من نظيرتها في AZCS، مما يشير إلى امتصاص أقل و الجزيئات، ربما بسبب انخفاض الطاقة السطحية في الهيكل البلوري .
نظرًا لأن الكبريت يميل إلى الهروب من التركيب البلوري لمركبات المعادن الكبريتية أثناء عملية التلبيد عند درجات حرارة عالية، تم إجراء البلازما المقترنة بالحث (ICP) للتحقيق في التغير المحتمل في محتوى العناصر قبل وبعد التبلور. كما هو موضح في الشكل 2r، فإن النسب الذرية لـ Zn و Cd و S في AZCS و CZCS تكاد تكون غير متغيرة، مما يشير إلى أن المعالجة الحرارية عند يزيد فقط بشكل كبير من البلورية بينما له تأثيرات قليلة على المحتوى النسبي للعناصر في العينات. كما تؤكد التحليل الحراري الوزني (TG) أن AZCS مستقر نسبيًا عند (الشكل التوضيحي S7، المناقشة التكميلية). توضح مطيافية الأشعة السينية للألكترونات (XPS) أن حالات التكافؤ لجميع العناصر في AZCS و CZCS تقريبًا لم تتغير (الشكل التوضيحي S8، المناقشة التكميلية).

تحفيز ضوئي أداء التطور

تحفيز ضوئي تم تقييم أداء التطور لكل من AZCS و CZCS عند تعرضهما لإشعاع مصباح Xe باستخدام 20 ملغ من المحفز الضوئي المحمّل بـ من كعامل مساعد في الماء الذي يحتوي على حمض اللبنيك كعامل تضحية كامل. كما هو موضح في الشكل 3a، يظهر CZCS معدل التطور حوالي . بالمقارنة، الـ معدل تطور AZCS يصل إلى ، وهو أعلى بأكثر من 5 مرات من نظيره CZCS. تقدم الأفلام التكميلية 1 و 2 عملية التحفيز الضوئي أداء تطور AZCS تحت إشعاع مصباح Xe وأشعة الشمس الطبيعية، على التوالي. عدد كبير من يمكن ملاحظة الفقاعات، مما يدل بشكل أكبر على التفوق نشاط تطور AZCS. لفهم ما إذا كانت الارتباطات السطحية بين المحفز الضوئي والمحفز المساعد ستؤثر على النشاط الضوئي، تم تحليل طيف رامان (الشكل التكميلي S9) لـ محملة على AZCS و CZCS، والضوء المحفز تم إجراء أداء تطور AZCS و CZCS المحملة بمختلف المساعدات المساعدة (الأشكال التكميلية S10-12). تثبت النتائج أن المساعد المساعد لا يؤثر على النشاط النسبي لـ AZCS و CZCS، بينما يلعب دورًا محوريًا في تسريع التفاعلات الضوئية السطحية لتخفيف التفاعلات الجانبية بين المحفز الضوئي وحوامل الشحنة المتولدة ضوئيًا (النقاش التكميلي).
لدراسة النشاط الضوئي المحفز لـ ZnCdS مع درجات بلورية مختلفة، النشاط الضوئي المحفز أداء التطور لـ ZnCdS المُركب في و (المشار إليه بـ ZCSx، تم قياس درجة حرارة التخليق أيضًا. كما هو موضح في الشكل التكميلي S13، مع زيادة درجة حرارة التحضير، زادت النشاط الضوئي المحفز لـ ZCS. يتم تقليله تدريجياً (الـ معدلات التطور لـ ZCS0 و ZCSRT و ZCS200 و ZCS400 و ZCS600 هي و على التوالي)، مما يوضح أن البلورية تتناسب عكسياً مع النشاط الضوئي الحفاز. بالإضافة إلى ذلك، فإن النشاط الضوئي الحفاز معدلات تطور ZnCdS مع نسب الكتلة المولية المختلفة مبين في الشكل التكميلي S14a. تتحسن نشاط التطور بشكل ملحوظ مع انخفاض نسبة الكتلة المولية لـ . حتى نسبة الكتلة المولية لـ يصل إلى 1:1، معدل التطور يصل إلى أعلى مستوى من عندما تكون نسبة الكتلة المولية لـ مزيد من الانخفاضات، معدل التطور ينخفض أيضًا. أنماط XRD للعينات المختلفة تظهر النسب في الشكل التوضيحي S14b. مع زيادة محتوى الكادميوم، يظهر الذروة حوالي يتحول إلى أعلى درجة، والتي تعود إلى تشوه الشبكة الناتج عن دمج الكادميوم الذي له نصف قطر ذري أكبر ثلاثة قمم حيود و يتحول إلى قمتين في و مما يشير إلى أن إضافة كمية مناسبة من الكادميوم في عملية التخليق عند درجات حرارة منخفضة يمكن أن تؤثر على بلوريتها .
تقدم الشكل 3b والشكل التكميلي S15 قيم العائد الكمي الظاهر (AQY) لـ AZCS و CZCS عند أضواء أحادية اللون مختلفة، والنتائج التفصيلية مدرجة في الجدول التكميلي S2. إن اتجاه تغير AQY المعتمد على الطول الموجي يتماشى تقريبًا مع طيف الامتصاص في كل من AZCS و CZCS.
الشكل 3 | التحفيز الضوئي أداء التطور. التطور خلال 2.5 ساعة لـ AZCS و CZCS، (ب) العائد الكمي الظاهر المعتمد على الطول الموجي (AQY) و (ج) اختبار استقرار التحفيز الضوئي لـ AZCS، (د) معدل التطور و(هـ) الاستقرار لـ
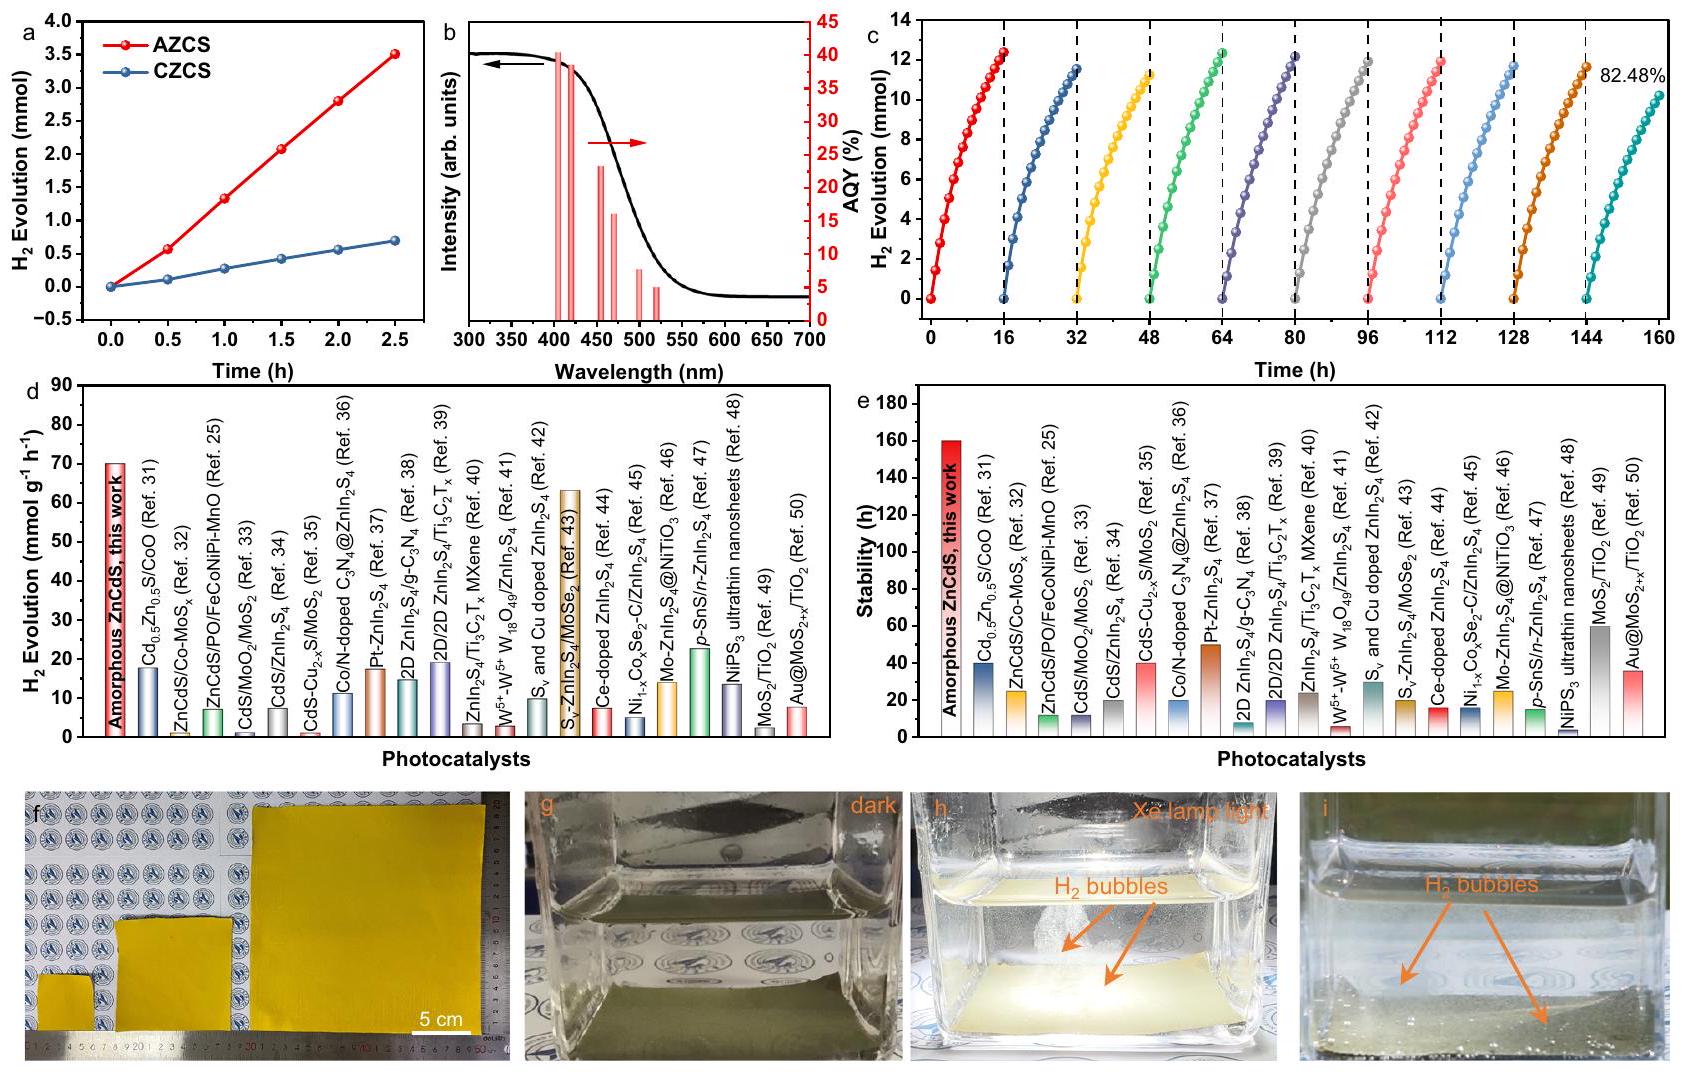
مختلف محفزات الكبريتيد الضوئية التي تم الإبلاغ عنها حتى الآن، (ف) أفلام محفز ضوئي مرنة بأحجام مختلفة ، الـ حالة تطور فيلم المحفز الضوئي في (ج) الظلام، (ح) ضوء مصباح زينون و (ط) ظروف الضوء الطبيعي.
تقترح نفس آلية التحفيز الضوئي. على وجه التحديد، فإن قيم AQY لـ AZCS هي ( 455 نانومتر ) ، و يمكن ملاحظة أن قيم AQY لـ AZCS أعلى بكثير من تلك الخاصة بـ CZCS تحت ضوء أحادي اللون مختلف، مما يشير إلى كفاءة امتصاص الضوء واستخدامه المواتية لـ AZCS.
بالإضافة إلى النشاط الواضح لتفكيك الماء بالتحفيز الضوئي، تعتبر الاستقرار عاملاً محورياً آخر للتطبيق العملي للتحفيز الضوئي. كما هو موضح في الشكل 3c، فإن AZCS/Co-MoS العينة تظهر استقرارًا ممتازًا دون تدهور واضح في أداء التطور بعد 160 ساعة من الاختبار المتكرر (16 ساعة لكل دورة لمدة 10 دورات مع إضافة تم إضافة المساعد المساعد في كل دورة). من الجدير بالذكر أنه عندما لا يتم إضافة أي شيء إضافي تم إضافة المساعد المساعد خلال كل دورة، انخفض أداء التطور بسرعة بعد 5 دورات (الشكل التكميلي S16). من أجل استبعاد تأثير الكمية من المساعد المساعد على الأداء الضوئي التحفيزي، تم دراسة تأثير كميات مختلفة من على تمت دراسة أداء التطور لـ AZCS. كما هو موضح في الشكل التكميلي S17، أداء تطور AZCS هو الأفضل عندما يكون Co المحتوى هو . عندما تم زيادة محتوى المساعد المساعد إلى 1.5 و 2 وزن.٪، وتم الحصول على AZCS/Co-MoS تظهر المحفزات الضوئية أداءً ضوئيًا مشابهًا جدًا مقارنةً بنظيرتها مع من المساعد المساعد. تم استخدام SEM و XRD و ICP لتوصيف الآلية في تعزيز الاستقرار الضوئي المحفز لـ AZCS، وتظهر النتائج أن الشكل والبنية والعناصر في AZCS مستقرة نسبيًا بعد التحفيز الضوئي. اختبار التطور (الأشكال التكميلية S18 و S19 والجدول التكميلية S3 والنقاش التكميلية).
التحفيز الضوئي تم تلخيص معدلات التطور واستقرار المحفزات الضوئية الكبريتية النموذجية في السنوات الأخيرة في الشكل 3d، e. من بين
محفزات ضوئية مختلفة من الكبريتيدات غير المتبلور في هذا العمل يظهر أعلى نشاط ضوئي محفز معدل التطور (الشكل 3د). علاوة على ذلك، تعتبر أشباه الموصلات من كبريتيدات المعادن تقليديًا أقل استقرارًا بسبب سهولة الأكسدة لـ أثناء التحفيز الضوئي . هذا العمل يوضح أن إضافة يمكن أن يحقق المساعد المساعد خلال كل دورة فوتوكاتاليتيكية استقرارًا فائقًا يصل إلى 160 ساعة، وهو ما يزيد بكثير عن غيره من المحفزات الفوتوكيميائية الكبريتية (الشكل 3e). بالإضافة إلى ذلك، تعرض الأشكال التكميلية S20a و S20b مقارنة بين AQY و معدل تطور المحفزات الضوئية المبلغ عنها مع مجالات كهربائية مدمجة أو هياكل غير متبلورة، بالإضافة إلى المحفزات الضوئية القائمة على الكبريتيد وCOF في السنوات الأخيرة. إن AQY في هذا العمل يحمل ميزة تنافسية (الشكل التكميلي S20a)، مما يشير إلى آفاق تطوير واعدة لـ AZCS/Co-MoS. . بالإضافة إلى ذلك، مقارنةً مع المحفزات الضوئية الأخرى، فإن ZnCdS غير المتبلور الذي تم توضيحه في عملنا يظهر معدل التطور يصل إلى الذي يتفوق على جميع هذه المحفزات الضوئية دون تشكيل تقاطعات غير متجانسة أو إضافة مواد بيزوكهربائية (الشكل التكميلي S2Ob).
بالنسبة لتطبيقات التوسع المحتملة، تلبي التحفيز الضوئي الجزيئي أيضًا القضايا المتعلقة بفصل وإعادة تدوير المحفزات الضوئية. لمعالجة هذه القضايا، أظهرنا أن الكوبالت المرن أفلام AZCS بأبعاد ، و يمكن تحضيره بتقنية طلاء سهلة باستخدام شفرة على رقائق الألمنيوم (الشكل 3f). نظرًا لخاصية المرونة في رقائق الألمنيوم، فإن المنتج الناتج أفلام AZCS مرنة وتظل مستقرة بعد الانحناء المتكرر (فيلم إضافي 3). من المثير للإعجاب، أن Co يمكن لأفلام AZCS أن تولد ملاحظات فقاعات تحت ضوء مصباح Xe (الشكل 3g، h، الفيلم التكميلي 4) وأشعة الشمس الطبيعية (الشكل 3i، الفيلم التكميلي 5)، مما يشير إلى إمكانية التوسع المحتمل المدفوع بالطاقة الشمسية. الإنتاج.
الشكل 4 | تحليل آلية التحفيز الضوئي. (أ) منحنيات امتصاص الضوء للأشعة فوق البنفسجية والمرئية لـ AZCS و CZCS، حيث يظهر في الزاوية صورة لـ AZCS و CZCS، (ب) الرسوم البيانية المقابلة لـ Tauc لـ AZCS و CZCS المحولة بواسطة Kubelka-Munk
المعلمة، (ج) طيف VB-XPS، (د) منحنيات M-S، (هـ) هياكل النطاق، (و) مخططات EIS (في الزاوية: الدائرة المعادلة)، (ز) استجابات التيار الضوئي العابر، (ح) طيف الإضاءة الضوئية (PL) و (ط) عمر PL لـ AZCS و CZCS.

استكشاف آلية التحفيز الضوئي

يتطلب التقدم الناجح للتفاعلات الضوئية المحفزة أن تلبي المحفزات الضوئية الشروط الديناميكية الحرارية والحركية. تم إجراء طيف الامتصاص UV-vis، وطيف VB-XPS، واختبارات موت-شوتكي لفهم آلية الأداء المحفز الضوئي المحسن لـ AZCS. الشكل 4 أ هو طيف الامتصاص UV-vis لـ AZCS و CZCS. من الواضح أن شدة الامتصاص لـ AZCS أعلى من CZCS، مما يشير إلى استخدام أفضل لطيف الشمس. بالإضافة إلى ذلك، يظهر AZCS انزياحًا أحمر في حافة الامتصاص، مما يدل على امتصاص نطاق أوسع من الضوء. ومن المثير للاهتمام أن AZCS يظهر لونًا أصفر ساطع بينما يظهر CZCS لونًا أصفر داكن، مما يشير إلى امتصاص نطاقات مختلفة من الضوء (في الإطار في الشكل 4 أ). استنادًا إلى أطياف الامتصاص UV-vis، فإن قيم فجوة الطاقة ( تم الحصول على (AZCS و CZCS) بواسطة دالة كوبيلكا-مونك مقابل طاقة الضوء كما هو موضح في الشكل 4ب، يتميز AZCS بفجوة طاقة ضيقة تبلغ 2.34 إلكترون فولت، وهي أقل بمقدار 0.33 إلكترون فولت من تلك الخاصة بـ CZCS (2.67 إلكترون فولت).
لفهم ترتيب هياكل النطاقات، تم جمع طيف VB-XPS لـ AZCS و CZCS، كما هو موضح في الشكل 4c.
تم حساب القيم القصوى لـ VB لـ AZCS و CZCS لتكون 1.81 و 1.99 إلكترون فولت باستخدام الصيغة لـ ( : جهد القطب الهيدروجيني العادي، هو 4.5 إلكترون فولت يمثل وظيفة عمل الإلكترون للمحلل) للقضاء على تأثير فرق الجهد الناتج عن الاتصال بين المحلل والعينات . وفقًا لمعادلة ( هو إمكانيات CB ، و الـ يمكن تقدير قيم AZCS و CZCS لتكون -0.53 و -0.68 إلكترون فولت، على التوالي. إن إمكانيات الشريط المسطح ( قيم AZCS و CZCS هي 0.38 و 0.53 إلكترون فولت، على التوالي، والتي تم حسابها من خلال مخططات موت-شوتكي في الشكل 4d. تظهر مخططات AZCS و CZCS كلاهما ميلًا إيجابيًا، وهو أمر نموذجي للموصلات شبه الموصلة من النوع n. استنادًا إلى الحساب والتحليل أعلاه، يتم توضيح مواقع النطاقات لـ AZCS و CZCS في الشكل 4e. ومن الجدير بالذكر أن محاذاة النطاقات لـ AZCS و CZCS تلبي كلاهما المتطلبات الديناميكية الحرارية لتقليل وأكسدة الماء، بينما يظهر AZCS فجوة نطاق أضيق بسبب توطين حالات ذيل النطاق في الهيكل غير المتبلور. إن فجوة الطاقة المنخفضة لـ AZCS تتماشى مع نتائج حسابات DFT الموضحة في الشكل التكميلي S3.
الشكل 5 | توصيفات حقل ثنائي القطب. صور رقمية تظهر المعلقين والأفلام المطلية بالتنقيط لـ (أ) AZCS و (ب) CZCS. صور KPFM لـ AZCS في (ج) الظلام و (د) الضوء. صور KPFM لـ CZCS في (هـ) الظلام و (و) الضوء. ج الجهد السطحي من
صور KPFM لـ AZCS مع أو بدون ضوء. الجهد السطحي من صور KPFM لـ CZCS مع أو بدون ضوء. طيف SPV لـ AZCS و CZCS.
تلعب خصائص فصل ونقل حوامل الشحنة دورًا محوريًا في عملية الحركية الضوئية. تم الحصول على طيف التحليل الكهربائي للمعاوقة (EIS) واستجابات التيار الضوئي لاستكشاف مقاومة نقل الشحنة وكثافة حوامل الشحنة. كما هو موضح في الشكل 4f، تم ملاءمة مخططات EIS باستخدام دائرة مكافئة (موجودة في الشكل 4f). يوجد نصف دائرة واحدة فقط في منحنيات EIS لـ AZCS و CZCS، مما يشير إلى أن التبادل الواجهوي لحوامل الشحنة بين المحفز الضوئي والكهارل هو العائق الرئيسي لنقل الحوامل. علاوة على ذلك، فإن قطرًا أصغر في منحنى EIS لـ AZCS مقارنةً بـ CZCS يعكس مقاومة نقل الشحنة الأقل. ). الشكل التوضيحي الإضافي S21 يوضح التغيرات في القطر التي تتوافق مع نمط الأداء المنتظم لتطور الهيدروجين الضوئي المحفز. قيم جميع العينات موضحة في الجدول التكميلي S4، حيث يظهر AZCS الأدنى. من ، الذي هو فقط تلك الخاصة بـ CZCS، مما يشير إلى كيمياء نقل الشحنة السطحية الأسرع بكثير. تم الكشف عن استجابات التيار الضوئي تحت إضاءة AM 1.5 G لـ AZCS و CZCS في الشكل 4g. يظهر AZCS كثافات تيار ضوئي أعلى بأكثر من 23 مرة من تلك الخاصة بـ CZCS، مما يشير إلى كفاءة فصل الثقوب والإلكترونات أعلى بشكل ملحوظ. يتم تقديم تيارات ضوئية لجميع العينات ذات البلورات المختلفة في الشكل التكميلي S22. يمكن ملاحظة أن تغييرات التيار الضوئي تظهر نفس الاتجاه مع أداء التطور، مما يدل على كفاءة فصل الشحنات العالية في العينة ذات البلورية المنخفضة.
في عملية التحفيز الضوئي، يتم استخدام بعض الإلكترونات الناتجة عن الضوء في تفاعل الاختزال، بينما تعيد الأخرى للأسف التآكل مع الثقوب. تم دراسة عملية إعادة التركيب الإشعاعي بواسطة طيفية الفلورية الضوئية (PL). كما هو موضح في الشكل 4h، تحت طول موجي للتحفيز قدره 320 نانومتر، يظهر AZCS
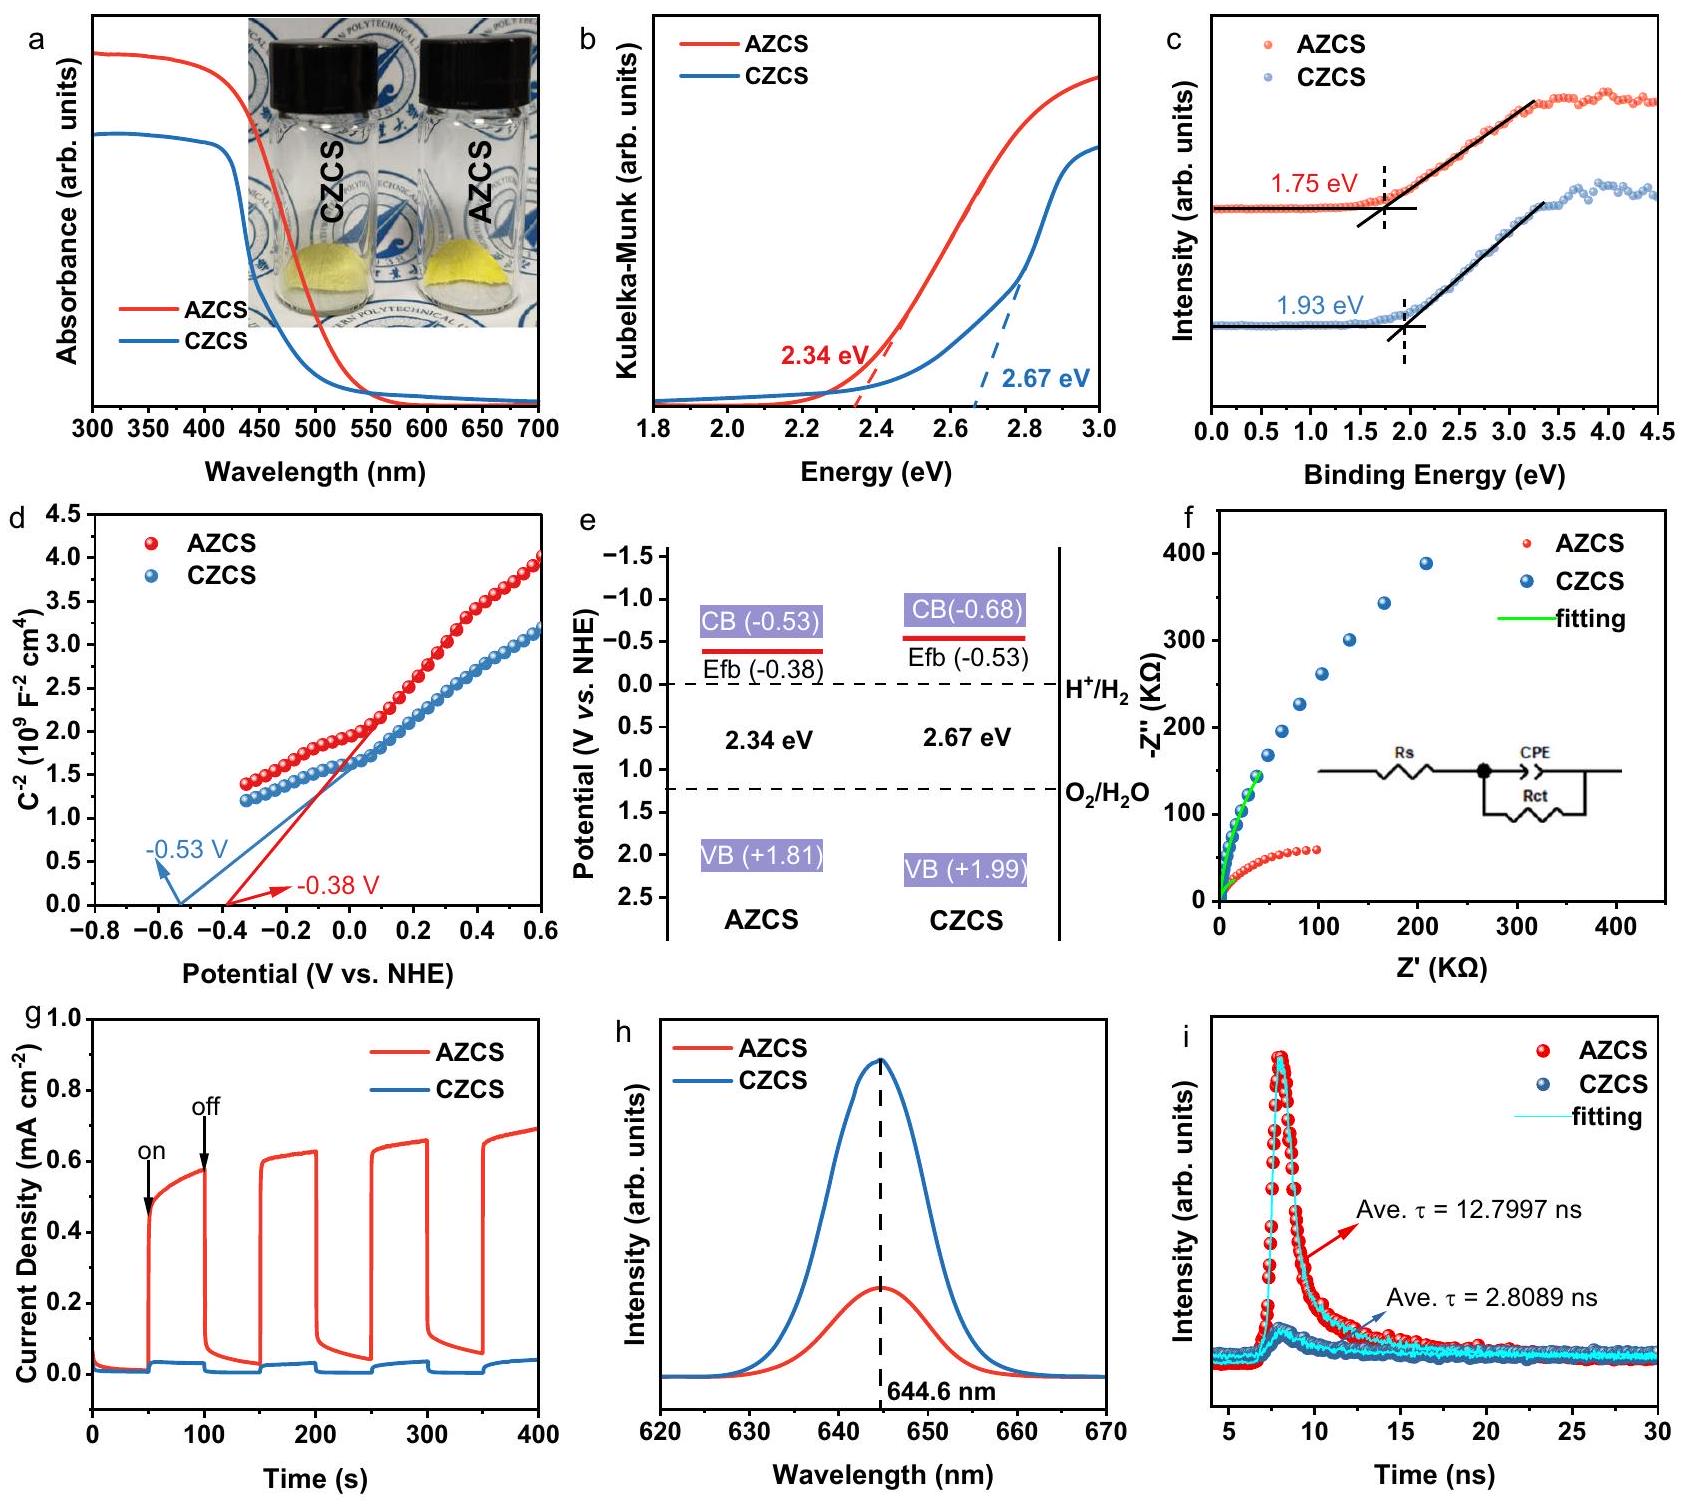
ذروة انبعاث أضعف بين النطاقين عند 644 نانومتر مقارنة بنظيرها CZCS. يمكن تفسير نتيجة تلاشي PL من خلال تثبيط إعادة تركيب الشحنات الناتجة عن الترتيبات الذرية غير المنتظمة. ، كما يتضح من ذروة PL الأقوى بكثير لـ ZCSRT و ZCS200 و ZCS400 مقارنة بـ ZCSO الموضحة في الشكل التكميلي S23. لتوضيح ديناميات التفاعل للشحنات المثارة بشكل أكبر، تم تسجيل ملفات انحلال الانبعاث لـ AZCS و CZCS مع بواسطة الفلورية المتحللة زمنياً بتقنية النانو (TR-PL). كما هو موضح في الشكل 4i، فإن عمر PL (متوسط عمر السعة) لـ AZCS هو 12.8 نانوثانية، وهو حوالي 4.5 مرات أعلى من نظيره CZCS (2.8 نانوثانية). يُعزى الت quenching إلى معدل إعادة التركيب العالي لزوج الإلكترون-الثقب الناتج عن الضوء في CZCS. قيم عمر PL لـ ZCSRT و ZCS200 و ZCS400 هي 8.2 و 5.3 و 3.8 نانوثانية، على التوالي (الشكل التكميلي S24)، مما يشير بشكل أكبر إلى أنه كلما كانت بلورية ZnCdS أقل، كانت كفاءة نقل حاملات الشحنة أعلى.

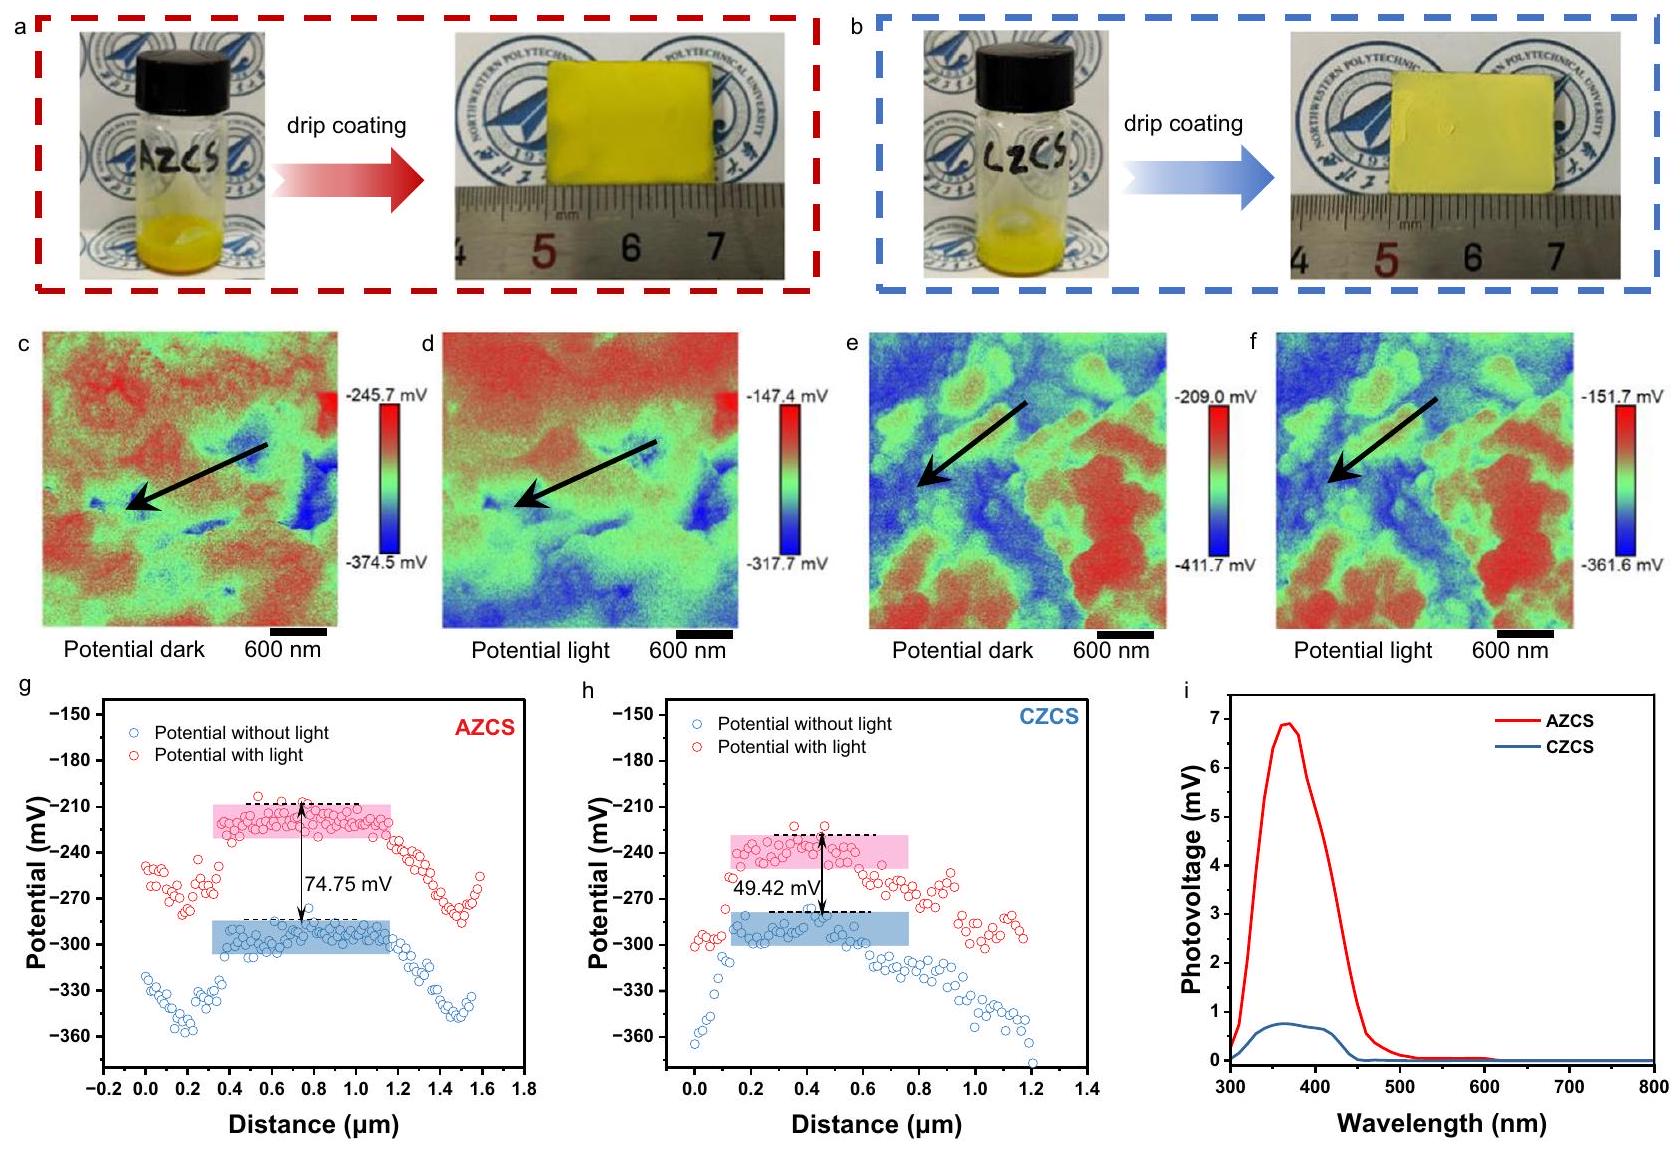
خصائص المجال ثنائي القطب

للمزيد من التحقق من آلية كفاءة فصل الحاملات الضوئية العالية في الهيكل غير المتبلور، تم تطبيق مجهر القوة الكلفانية (KPFM) للكشف عن ملفات الجهد السطحي لـ AZCS و CZCS في الظلام والضوء تحت إضاءة مصباح زينون. كما هو موضح في الشكل 5a و 5b، تم تحويل AZCS و CZCS إلى معلقات وتم طلاءها بالتنقيط على ركائز زجاجية لاختبار KPFM. تظهر صور KPFM لـ AZCS اختلافًا تامًا في الجهود السطحية تحت ظروف الظلام والضوء (الشكل 5c و 5d)، ولا يتغير الجهد السطحي بشكل موحد وفقًا للمواقع، وهو ما يسببه المجال ثنائي القطب الناتج عن الهيكل غير المتبلور على السطح. بالمقابل، تقدم صور KPFM لـ CZCS في الشكل 5e و 5f أيضًا جهودًا سطحية مختلفة تحت الظلام والضوء، بينما يتغير الجهد بشكل موحد.
مع تغيير الموضع. علاوة على ذلك، يظهر AZCS مع الإضاءة الخفيفة زيادة في متوسط الجهد السطحي لـ (الشكل 5g) مقارنةً بذلك بدون ضوء، بينما نظيره CZCS يظهر فقط زيادة في (الشكل 5h)، مما يوضح أكثر أن هناك مجال ثنائي القطب موجود في AZCS.
تم استخدام طيف الفوتوفولتية السطحية (SPV) للكشف عن الشحنات السطحية لـ AZCS و CZCS. كما هو موضح في الشكل 5i، فإن الإشارة الإيجابية تشير إلى أن الثقوب تنتقل إلى جانب الإضاءة من العينات، وهو خاصية تمثيلية لأشباه الموصلات من النوع n تحت إشعاع الضوء. علاوة على ذلك، تم الكشف عن SPV لـ CZCS بشكل ضئيل، مما يدل على انخفاض فصل الشحنات والنقل، بينما يحصل AZCS على إشارة SPV أعلى بكثير ونطاق استجابة ضوئية أوسع. من المعقول أن نقول إن التفاعل الضوئي التحفيزي من المرجح أن يحدث بسبب هجرة المزيد من الحاملات الناتجة عن الضوء إلى سطح AZCS مع ترتيب غير منظم للهياكل الذرية. .
وجدنا أيضًا أن بناء هيكل غير متبلور هو استراتيجية عامة لتعزيز التحفيز الضوئي أداء تطور المحفزات الضوئية من كبريتيدات المعادن. تم تخليق ZnS وCdS غير المتبلورين والمتبلورين بنفس الطريقة، والتي تُعرف باسم AZS وCZS وACS وCCS، على التوالي. كما هو موضح في الشكل التكميلي S25، تشير منحنيات TG لـ ZnS وCdS إلى أنهما لا يتحللان عند درجة حرارة . تحليل حيود الأشعة السينية و تطور ACS و CCS موضح في الشكل التكميلية S26. كمية تطور ACS يزيد بأكثر من 8 مرات عن نظيره CCS خلال 2.5 ساعة (الشكل التوضيحي S26a). قمم XRD لـ CCS حادة وتتوافق مع قمة CdS (JCPDS-ICDD: 97-015-4186) بينما يظهر نمط XRD لـ ACS فقط قمتين مغلفتين (الشكل التوضيحي S26b). بالمثل، تطور ونمط XRD لـ AZS و CZS موضحان في الشكل التكميلي S27. وليس من المستغرب أن يكون لـ AZS أداء أفضل خصائص التطور مقارنةً بنظيرها CZS. النتائج المماثلة لـ ويوضح ZnCdS عالمية بناء الهياكل غير المتبلورة لكسر الترتيب الذري المتماثل في الهيكل البلوري، مما يؤدي إلى تحفيز مجال ثنائي القطب القوي لتعزيز فصل الشحنات ونقلها، وبالتالي تعزيز الأداء الضوئي التحفيزي بشكل كبير.

نقاش

يتم تخليق AZCS عالي الأداء بواسطة طريقة كيميائية رطبة سهلة عند درجات حرارة منخفضة. نظرًا لعدم تماثل ترتيب الذرات، تتشكل مجالات ثنائية القطب قوية في الـ -, -, و تُحفز الاتجاهات، مما يوفر قوى دافعة إضافية لفصل ونقل أزواج الإلكترونات والثقوب الناتجة عن الضوء. بالإضافة إلى ذلك، يتم تقليل فجوة النطاق لـ AZCS بشكل كبير من 2.67 إلى 2.34 إلكترون فولت بسبب توطين حالات ذيل النطاق في الهيكل غير المتبلور. مع الكفاءة المعززة بشكل كبير لفصل الشحنات في الكتلة ونطاق استخدام الضوء، يظهر AZCS معدل التطور ، وهو أعلى بأكثر من 5 مرات من نظيره البلوري. قيمة AQY لـ يتم تحقيق ذلك عند ضوء أحادي اللون بطول موجي 420 نانومتر. من خلال هندسة السطح المساعد المساعد، AZCS/Co-MoS يظهر استقرارًا ضوئيًا يصل إلى 160 ساعة. يمكن الحصول على فيلم ضوئي مرن من خلال تقنية الطلاء بالشفرات بسهولة، مما يظهر بوضوح التطور تحت إضاءة الشمس الطبيعية. توفر النتائج المعروضة في هذا العمل رؤى حول الأداء المحسن للمواد الضوئية غير المتبلورة، والتي قد تلهم تصميم مواد ضوئية عالية الأداء لإنتاج الوقود الشمسي.

طرق

تحضير المواد

تم شراء جميع المواد الكيميائية من شركة بكين إنوكيم للعلوم والتكنولوجيا المحدودة. تم تحضير ZnCdS غير المتبلور (AZCS) بواسطة طريقة كيميائية رطبة عند درجة حرارة منخفضة. باختصار، 20 مل من المحلول المائي تم إضافة محلول (0.1 م ، علاء الدين ، AR) إلى 20 مل من محلول مختلط يحتوي على 0.05 م من
إنوشيم، ) و 0.05 م من (علاء الدين، AR) بمعدل وحرّك في لمدة ساعة واحدة. ثم تم غسل المعجون الأصفر الناتج جيدًا بماء ميلي-كيو، وتم تجفيفه بالتجميد تحت الفراغ. تم الحصول على ZCSRT بنفس إجراء AZCS مع تغيير واحد فقط وهو درجة الحرارة إلى درجة حرارة الغرفة أثناء التحريك. تم تخليق ZCS200 وZCS400 وZCS600 (ZCS600 هو العينة الأكثر بلورية والتي تُعرف أيضًا باسم CZCS) بزيادة درجة الحرارة ZCSRT عند 200 و400 و في فرن أنبوبي لمدة 5 دقائق تحت جو من النيتروجين، على التوالي. من أجل فحص تأثير النسب المختلفة من الزنك والكادميوم، عينات من تمت تخليقها بنفس ظروف AZCS.
AZCS/Co-MoS مرن تم تحضير الأفلام بطريقة الطلاء بالشفرات. باختصار، 5 جرام من AZCS، 14 ملغ من (إنوكيم، من (إنوكيم، 99.95%) و 0.5 جرام من بولي (فلوريد الفينيليدين) (إنوكيم، متوسط تم إضافة مسحوق الكريات إلى هاون. ثم تم خلط 6 مل من 1-ميثيل-2-بيروليدون (إنوكيم، 99.5%، جاف جداً) كمذيب في الخليط أعلاه وطحنه جيداً لمدة 30 دقيقة للحصول على معلق. تم وضع كمية مناسبة من المعلق على رقائق الألمنيوم بأبعاد ، و ، على التوالي، وتم كشط الطلاء في اتجاه واحد باستخدام قضيب زجاجي بسرعة منتظمة للحصول على أفلام متجانسة. ثم تم تجفيف الأفلام الناتجة في فرن مفرغ من الهواء عند لمدة ساعة واحدة. تحميل الكتلة للأفلام بأبعاد ، و كانت 128.9 و 826.1 و 3578.8 ملغ من AZCS ، على التوالي.

توصيف

تم إجراء تحليل SEM على مجهر إلكتروني مسح ميداني من نوع Zeiss Gemini 300. تم الحصول على أنماط TEM وHRTEM وSAED على مجهر إلكتروني نافذ من نوع FEI TalosF200x. تم تسجيل أنماط XRD على جهاز حيود الأشعة السينية (D8 Advance، Bruker) مع الإشعاع. تم حساب بلورية العينات باستخدام صيغة ، حيث و تمثل المنطقة المتكاملة لقمة الانكسار في الحالات البلورية وغير البلورية، على التوالي. تم الحصول على طيف رامان باستخدام مطياف رامان المجهري Alpha 300 R باستخدام ليزر TEM00 (532 نانومتر). تم الحصول على أطياف FTIR باستخدام مطياف Thermo Scientific Nicolet iS5. تم الحصول على أطياف XPS و VB XPS باستخدام مطياف ميكروب XPS. مصدر الإشعاع. ج تم استخدامه كمرجع لمعايرة طاقات الربط. الـ تم تحليل تركيزات أيونات S بواسطة مطياف الانبعاث الضوئي البلازمي المقترن بالحث (ICP-OES) من Agilent 5110. تم الكشف عن توزيع الجسيمات النانوية بواسطة محلل حجم الجسيمات النانوية (Malvern Zetasizer Nano ZS90). تم تسجيل أطياف امتصاص UV-vis لعينات المسحوق الصلب على مطياف ضوئي (UV-2600i، شيمادزو). تم إجراء قياسات PL على مطياف فلوريسانس (FLS-1000، أدوات إدنبرة) مع ضوء تحفيز عند 375 نانومتر. تم الحصول على صور KPFM بواسطة وضع KPFM لميكروسكوب القوة الذرية (Bruker Dimension Icon). تم الحصول على أطياف SPV على مطياف جهد السطح CEL-SPS1000.

اختبارات التحفيز الضوئي

تحفيز ضوئي تم إجراء التطور في في نظام تقييم النشاط الضوئي المحفز (شركة بكين للتعليم Au-Light المحدودة، CEL-PAEM-D8) وفقًا لدراستنا السابقة . تم تجهيز جهاز كروماتوغرافيا الغاز (شركة بكين للتعليم أو لايت المحدودة، GC-7920) بكاشف موصل حراري (TCD) وعمود غربال جزيئي TDX-01. تم استخدام مصباح زينون بقوة 300 واط ( ) تم استخدامه كمصدر للضوء لمحاكاة الإشعاع الشمسي. تم استخدام الأرجون كغاز حامل. تم توزيع 20 ملغ من المحفزات الضوئية في 60 مل من المحلول المائي الذي يحتوي على 10 مل من حمض اللبنيك (ألا الدين، ” ). الـ تم تزيين المساعد المساعد على أسطح المحفز الضوئي بواسطة الترسيب الضوئي مع (إنوكيم، 99%)
و محلول مائي (إنوكيم، 99.95%) يعادل لمدة 10 دقائق قبل التفاعلات الضوئية الحفازة. تم تحليل الغاز الناتج كل 30 دقيقة بشكل تلقائي تحت سيطرة البرنامج.
طريقة اختبار العائد الكمي الظاهر (AQY) لتطور الهيدروجين عند أطوال موجية مختلفة مشابهة لاختبار تطور الهيدروجين ولكن مع إضاءة أحادية اللون فقط، والتي تم حسابها على النحو التالي: AQY (%) ، حيث تشير إلى الإلكترونات المتفاعلة و يمثل عدد الفوتونات الساقطة. هو مقدار المتطور جزيئات ( مول ) هو ثابت أفوجادرو، هو ثابت بلانك، و يمثل سرعة الضوء. هي منطقة الإشعاع ) ، هي كثافة الطاقة للضوء الساقط، هو وقت الإشعاع، و هو الطول الموجي للضوء أحادي اللون.

القياسات الكهروضوئية الكيميائية

تم توزيع 5 ملغ من العينات في محلول يحتوي على 0.375 مل من الإيثانول (Greagent، ) و من نافيون (ألفا، في الماء و1-بروبانول) عن طريق الموجات فوق الصوتية لمدة تم ترسيب المعلق على مادة نظيفة مشوبة بالفلور ركيزة زجاجية (FTO) ) عن طريق الطلاء بالدوار. بعد التجفيف في مكان ساخن عند تم استخدام العينات التي تم الحصول عليها كقطب عمل وتم التحكم في المساحة المعرضة للمادة الفعالة على قطب العمل كـ تم قياس أداء التحليل الضوئي الكهربائي (PEC) في خلية ثلاثية الأقطاب نموذجية تحت إضاءة مصباح زينون مزود بفلتر AM 1.5 G. كانت سلك البلاتين يعمل كقطب مضاد، و تم استخدام قطب مرجعي من كلوريد البوتاسيوم المشبع. خلال الاختبار، تم التحكم في المنطقة النشطة كـ تم الحصول على استجابات التيار الضوئي عند جهد الدائرة للقطب تحت إضاءة لمدة 400 ثانية مع فترة 50 ثانية كل 50 ثانية في الكهربائي. تم إجراء طيف EIS بجهد تيار متردد بقدرة 0.1 فولت عند جهد الدائرة المفتوحة للقطب في الظلام (نطاق التردد: ) باستخدام كإلكتروليت. تم الحصول على مخططات MS في نطاق جهد من -0.32 إلى 0.67 فولت مقابل NHE (التردد: 1200 هرتز) في الظلام باستخدام الكهربائي (تم تعديل الرقم الهيدروجيني إلى 7 بواسطة هيدروكسيد البوتاسيوم).

حسابات DFT

تم إجراء جميع الحسابات باستخدام نظرية الكثافة الوظيفية (DFT)، كما تم تنفيذها في حزمة المحاكاة الأولية فيينا. تم استخدام طريقة الموجة المعززة بواسطة البروجيكتور (PAW) والتقريب العام لتدرج بيردو-بورك-إرنزرهوف (GGA-PBE) لوظائف التبادل والتصحيح. . تم تعيين خطوة الزمن إلى 3 فيمتوثانية فقط تم أخذ نقطة من منطقة بريلوان. تم تطبيق مجموعة كانونية (NVT) مع منظم حرارة نوز-هوفر للتحكم في درجة الحرارة والضغط في محاكاة AIMD. كان ZnCdS البلوري نظام بلوري سداسي، وتم الحصول على نموذج وحدة الخلية بناءً على نتائج حيود الأشعة السينية (XRD). احتوت الخلية الفائقة الأولية على 192 ذرة من مع معلمة الخلية Åتم الحصول على النماذج غير المتبلورة باستخدام عملية التبريد السريع: أولاً، تم إذابة النماذج الأولية بالكامل عند 3000 كلفن لإزالة تأثير الذاكرة من المواقع الأولية. ثانياً، تم تبريد النماذج إلى 1400 كلفن واستراحت عند هذه الدرجة لمدة سائل مستقر. ثم، قمنا بتقليل درجة الحرارة بسرعة إلى 300 كلفن بمعدل تبريد ، وأخيرًا، تم الحفاظ على النماذج عند 300 كلفن لمدة 30 بيكوثانية لجمع مسارات الذرات. بالنسبة لحسابات البنية الإلكترونية، تم تعيين حد الطاقة لقاعدة PAW إلى 450 إلكترون فولت مع تقارب القوة بمقدار 0.02 إلكترون فولت و تم اختيار شبكة النقاط لعينات منطقة بريلوان. تم حساب قيم Zn و Cd بناءً على فجوة الطاقة لـ ZnCdS. عندما كانت قيم الزنك والكادميوم أعلى من 7.0 و 4.0 إلكترون فولت، مما يجعل فجوة الطاقة في ZnCdS تميل إلى الاستقرار. لذلك، فإن التفاعل كولوم. تم تعيين القيم إلى 7.0 و 4.0 إلكترون فولت لوصف إلكترونات 3d
of Zn و إلكترونات الكادميوم، على التوالي، والتي تتوافق أيضًا مع الأدبيات .

توفر البيانات

البيانات التي تم توليدها ضمن الورقة وملف المعلومات التكميلية متاحة من المؤلفين المقابلين عند الطلب. بيانات المصدر للرسوم البيانية 20-r، 3a-e، 4a-d، f-i، و5g-i، والرسوم التكميلية S2-S27 متوفرة في ملف بيانات المصدر. يتم توفير بيانات المصدر مع هذه الورقة.

References

  1. Mora Rollo, A., Rollo, A. & Mora, C. The tree-lined path to carbon neutrality. Nat. Rev. Earth Environ. 1, 332 (2020).
  2. Wang, Z., Li, C. & Domen, K. Recent developments in heterogeneous photocatalysts for solar-driven overall water splitting. Chem. Soc. Rev. 48, 2109-2125 (2019).
  3. Zhou, C., Wu, J., Li, Y. & Cao, H. Highly efficient UV-visible-infrared light-driven photothermocatalytic steam biomass reforming to on Ni nanoparticles loaded on mesoporous silica. Energy Environ. Sci. 15, 3041-3050 (2022).
  4. Wang, Q. et al. Scalable water splitting on particulate photocatalyst sheets with a solar-to-hydrogen energy conversion efficiency exceeding 1%. Nat. Mater. 15, 611-615 (2016).
  5. Wang, X. et al. Development of -type photoanodes for photoelectrochemical water splitting. EcoEnergy 1, 108-153 (2023).
  6. Hisatomi, T. & Domen, K. Reaction systems for solar hydrogen production via water splitting with particulate semiconductor photocatalysts. Nat. Catal. 2, 387-399 (2019).
  7. Yang, L. et al. Beyond п-conjugated metal-free polymeric semiconductors for photocatalytic chemical transformations. Chem. Soc. Rev. 50, 2147-2172 (2021).
  8. Guo, Y. et al. Concentrating electron and activating H-OH bond of absorbed water on metallic boosting photocatalytic hydrogen evolution. Nano Energy 95, 107028 (2022).
  9. Hu, Y. et al. Lattice distortion induced internal electric field in photoelectrode for efficient charge separation and transfer. Nat. Commun. 11, 2129 (2020).
  10. Si, Y. et al. The effect of directed photogenerated carrier separation on photocatalytic hydrogen production. Nano Energy 41, 488-493 (2017).
  11. Zhang, C. et al. Piezo-photocatalysis over metal-organic frameworks: promoting photocatalytic activity by Piezoelectric effect. Adv. Mater. 33, 2106308 (2021).
  12. Xu, Q., Zhang, L., Cheng, B., Fan, J. & Yu, J. S-scheme heterojunction photocatalyst. Chem 6, 1543-1559 (2020).
  13. Cui, Y. et al. Fluid-induced piezoelectric field enhancing photocatalytic hydrogen evolution reaction on membrane. Nano Energy 99, 107429 (2022).
  14. Li, H. et al. Enhanced ferroelectric-nanocrystal-based hybrid photocatalysis by ultrasonic-wave-generated Piezophototronic effect. Nano Lett. 15, 2372-2379 (2015).
  15. Zhang, J. et al. Boosting photocatalytic water splitting by tuning built-in electric field at phase junction. J. Mater. Chem. A 7, 10264-10272 (2019).
  16. Wang, Q. et al. Particulate photocatalyst sheets based on carbon conductor layer for efficient Z-scheme pure-water splitting at ambient pressure. J. Am. Chem. Soc. 139, 1675-1683 (2017).
  17. . et al. Unique S -scheme heterojunctions in self-assembled hybrids for photoreduction. Nat. Commun. 11, 4613 (2020).
  18. Wu, H. et al. Low-bias photoelectrochemical water splitting via mediating trap states and small polaron hopping. Nat. Commun. 13, 6231 (2022).
  19. Mu, L. et al. Enhancing charge separation on high symmetry exposed with anisotropic facets for photocatalytic water splitting. Energy Environ. Sci. 9, 2463-2469 (2016).
  20. Ma, Z. et al. Electrostatic potential of the incorporated asymmetry molecules induced high charge separation efficiency of the modified carbon nitride copolymers. Appl. Catal. B 319, 121922 (2022).
  21. Heckel, S. et al. Beyond Janus geometry: characterization of flow fields around nonspherical photocatalytic microswimmers. Adv. Sci. 9, 19-21 (2022).
  22. Zhang, Y. et al. Visualizing coherent intermolecular dipole-dipole coupling in real space. Nature 531, 623-627 (2016).
  23. Li, Z. et al. Dipole field in nitrogen-enriched carbon nitride with external forces to boost the artificial photosynthesis of hydrogen peroxide. Nat. Commun. 14, 5742 (2023).
  24. Wang, W. et al. Band-gap modulation for enhancing NO photocatalytic oxidation over hollow ZnCdS: a combined experimental and theoretical investigation. J. Phys. Chem. C 126, 3967-3979 (2022).
  25. Song, J. et al. Photochemical construction of the FeCoNiPi-MnO composite for efficient tandem application of photocatalytic partial water splitting and overall water splitting. J. Mater. Chem. A 10, 16029-16036 (2022).
  26. Wang, X. et al. Two-dimensional amorphous nanosheets enabling high-efficiency photoinduced charge transfer for excellent SERS activity. J. Am. Chem. Soc. 141, 5856-5862 (2019).
  27. Song, J., Zhao, H., Sun, R., Li, X. & Sun, D. An efficient hydrogen evolution catalyst composed of palladium phosphorous sulphide ( ) and twin nanocrystal solid solution with both homo- and hetero-junctions. Energy Environ. Sci. 10, 225-235 (2017).
  28. Liu, S. et al. Facilitating nitrogen accessibility to boron-rich covalent organic frameworks via electrochemical excitation for efficient nitrogen fixation. Nat. Commun. 10, 3898 (2019).
  29. Chen, Y. C. et al. Photocatalytic enhancement of hydrogen production in water splitting under simulated solar light by band gap engineering and localized surface plasmon resonance of nanowires decorated by Au nanoparticles. Nano Energy 67, 104225 (2020).
  30. Hsu, Y. Y. et al. Heterojunction of Zinc Blende/Wurtzite in solid solution for efficient solar hydrogen generation: x-ray absorption/diffraction approaches. ACS Appl. Mater. Interfaces 7, 22558-22569 (2015).
  31. Zhao, H., Guo, L., Xing, C., Liu, H. & Li, X. A homojunction-heterojunction-homojunction scaffold boosts photocatalytic evolution over hybrids. J. Mater. Chem. A 8, 1955-1965 (2020).
  32. Lei, Y. et al. Molybdenum sulfide cocatalyst activation upon photodeposition of cobalt for improved photocatalytic hydrogen production activity of ZnCdS. Chem. Eng. J. 425, 131478 (2021).
  33. Bie, C. et al. A bifunctional catalyst enhances photocatalytic evolution and pyruvic acid synthesis. Angew. Chem. Int. Ed. 61, e202212045 (2022).
  34. Li, C. Q. et al. Constructing direct Z-scheme heterostructure by enwrapping on CdS hollow cube for efficient photocatalytic generation. Adv. Sci. 9, 2201773 (2022).
  35. Liu, G. et al. MoS -stratified core-shell nanorods for highly efficient photocatalytic hydrogen production. ACS Nano 14, 5468-5479 (2020).
  36. Wang, S., Wang, Y., Zhang, S. L., Zang, S. Q. & Lou, X. W. Supporting ultrathin nanosheets on -Doped graphitic carbon nanocages for efficient photocatalytic generation. Adv. Mater. 31, 1903404 (2019).
  37. Shi, X . et al. Protruding Pt single-sites on hexagonal to accelerate photocatalytic hydrogen evolution. Nat. Commun. 13, 1287 (2022).
  38. Tan, M. et al. Boosting photocatalytic hydrogen production via interfacial engineering on 2D ultrathin Z-scheme ZnIn heterojunction. Adv. Funct. Mater. 32, 2111740 (2022).
  39. Su, T. et al. Sulfur vacancy and cocatalyst synergistically boosting interfacial charge transfer in 2D/2D heterostructure for enhanced photocatalytic hydrogen evolution. Adv. Sci. 9, 2103715 (2022).
  40. Zuo, G. et al. Ultrathin nanosheets anchored on MXene for photocatalytic evolution. Angew. Chem. Int. Ed. 132, 11383-11388 (2020).
  41. Lu, Y. et al. pair induced LSPR of to sensitize for full-spectrum solar-light-driven photocatalytic hydrogen evolution. Adv. Funct. Mater. 32, 2203638 (2022).
  42. Zhang, S. et al. Gradient hydrogen migration modulated with selfadapting S vacancy in copper-doped nanosheet for photocatalytic hydrogen evolution. ACS Nano 15, 15238-15248 (2021).
  43. Wang, X. et al. Interfacial chemical bond and internal electric field modulated Z-scheme Sv-ZnIn photocatalyst for efficient hydrogen evolution. Nat. Commun. 12, 4112 (2021).
  44. Fan, H., Jin, Y., Liu, K. & Liu, W. One-step MOF-templated strategy to fabrication of Ce-Doped tetrakaidecahedron hollow nanocages as an efficient photocatalyst for hydrogen evolution. Adv. Sci. 9, 2104579 (2022).
  45. Chao, Y. et al. hybrid nanocages with strong 2D/2D hetero-interface interaction enable efficient -releasing photocatalysis. Adv. Funct. Mater. 31, 2100923 (2021).
  46. Zhu, J. et al. Mo-modified -scheme heterojunction with enhanced interfacial electric field for efficient visible-lightdriven hydrogen evolution. Adv. Funct. Mater. 33, 2213131 (2023).
  47. Jia, X. et al. Interfacial mediation by Sn and S vacancies of p-SnS/n for enhancing photocatalytic hydrogen evolution with new scheme of Type-I Heterojunction. Adv. Funct. Mater. 33, 2304072 (2023).
  48. Ran, J. et al. ultrathin nanosheets as versatile platform advancing highly active photocatalytic production. Nat. Commun. 13, 4600 (2022).
  49. Wang, W. et al. Edge-enriched ultrathin embedded yolk-shell with boosted charge transfer for superior photocatalytic evolution. Adv. Funct. Mater. 29, 1901958 (2019).
  50. Gao, D. et al. Reversing free-electron transfer of cocatalyst for optimizing antibonding-orbital occupancy enables high photocatalytic evolution. Angew. Chem. Int. Ed. 62, e202304559 (2023).
  51. Sharma, K. et al. Sulphur vacancy defects engineered metal sulfides for amended photo(electro)catalytic water splitting: a review. J. Mater. Sci. Technol. 152, 50-64 (2023).
  52. Xiao, J. et al. Simultaneously tuning the defects and surface properties of nanoparticles by codoping for significantly accelerated photocatalytic evolution. J. Am. Chem. Soc. 143, 10059-10064 (2021).
  53. Wang, X., Liu, B., Xiao, X., Wang, S. & Huang, W. Boron dopant simultaneously achieving nanostructure control and electronic structure tuning of graphitic carbon nitride with enhanced photocatalytic activity. J. Mater. Chem. C 9, 14876-14884 (2021).
  54. Wang, S. et al. Boosting the photocatalytic hydrogen production performance of graphitic carbon nitride nanosheets by tailoring the cyano groups. J. Colloid Interface Sci. 610, 495-503 (2022).
  55. Lin, Z., Du, C., Yan, B., Wang, C. & Yang, G. Two-dimensional amorphous NiO as a plasmonic photocatalyst for solar evolution. Nat. Commun. 9, 4036 (2018).
  56. Kang, Y. et al. An amorphous carbon nitride photocatalyst with greatly extended visible-light-responsive range for photocatalytic hydrogen generation. Adv. Mater. 27, 4572-4577 (2015).
  57. Zhang, L. J., Li, S., Liu, B. K., Wang, D. J. & Xie, T. F. Highly efficient photocatalysts: Z-scheme photocatalytic mechanism for
    their enhanced photocatalytic evolution under visible light. ACS Catal 4, 3724-3729 (2014).
  58. Sheng, Y., Li, W., Xu, L. & Zhu, Y. High photocatalytic oxygen evolution via strong built-in electric field induced by high crystallinity of perylene imide supramolecule. Adv. Mater. 34, 2102354 (2022).
  59. Wang, S. et al. One-step supramolecular preorganization constructed crinkly graphitic carbon nitride nanosheets with enhanced photocatalytic activity. J. Mater. Sci. Technol. 104, 155-162 (2022).
  60. Kresse, G. & Hafner, J. Ab initio molecular dynamics for liquid metals. Phys. Rev. B 47, 558-561 (1993).
  61. Kresse, G. & Furthmüller, J. Efficient iterative schemes for ab initio total-energy calculations using a plane-wave basis set. Phys. Rev. B Condens. Matter Mater. Phys. 54, 11169-11186 (1996).
  62. Perdew, J. P., Burke, K. & Ernzerhof, M. Generalized gradient approximation made simple. Phys. Rev. Lett. 77, 3865-3868 (1996).
  63. Blöchl, P. E. Projector augmented-wave method. Phys. Rev. B 50, 17953-17979 (1994).
  64. Biswas, A., Meher, S. R. & Kaushik, D. K. Electronic and band structure calculation of Wurtzite CdS using GGA and GGA+U functionals. J. Phys. Conf. Ser. 2267, 012155 (2022).
  65. Jiang, H., Gomez-Abal, R. I., Rinke, P. & Scheffler, M. First-principles modeling of localized d states with the GW@LDA+U approach. Phys. Rev. B Condens. Matter Mater. Phys. 82, 045108 (2010).

شكر وتقدير

تم دعم هذا العمل ماليًا من قبل المؤسسة الوطنية للعلوم الطبيعية في الصين (رقم 52372292) وصندوق البحث الأساسي للجامعات المركزية. كما يود المؤلفون أن يعبروا عن شكرهم للدعم المالي وتوصيف المواد من مركز التحليل والاختبار في جامعة شمال غرب بوليتكنيك (رقم 2022T016)، وقياس طيف SPV من شركة بكين للتعليم في الصين Au-Light المحدودة. يشكر L.W. الدعم المالي من مجلس الأبحاث الأسترالي من خلال مشروع الاكتشاف الخاص به (DP200101900) وزمالة لوريت (FL190100139).

مساهمات المؤلفين

قامت S.W. بتوجيه وتصميم المشروع. نفذ X.W. التجارب وكتب المخطوطة. قام B.L. و S.M. بتصنيع الأقطاب الكهربائية لقياسات PEC وأجروا التوصيف. أجرى Y.Z. SEM.
التوصيف. قام X.W. و S.W. و L.W. و G.Z. و W.H. بتحليل البيانات وإعداد المخطوطة. علق جميع المؤلفين ووافقوا على الورقة.

المصالح المتنافسة

يعلن المؤلفون عدم وجود مصالح متنافسة.

معلومات إضافية

معلومات إضافية النسخة الإلكترونية تحتوي على
المواد التكميلية متاحة على
https://doi.org/10.1038/s41467-024-47022-z.
يجب توجيه المراسلات والطلبات للحصول على المواد إلى ليانزهو وانغ، غانغكيانغ تشو، وي هاي، أو سونغكان وانغ.
معلومات مراجعة الأقران تشكر مجلة Nature Communications كايدين هوانغ والمراجعين الآخرين المجهولين على مساهمتهم في مراجعة هذا العمل. يتوفر ملف مراجعة الأقران.
معلومات إعادة الطباعة والتصاريح متاحة على
http://www.nature.com/reprints
ملاحظة الناشر: تظل شركة سبرينجر ناتشر محايدة فيما يتعلق بالمطالبات القضائية في الخرائط المنشورة والانتماءات المؤسسية.
الوصول المفتوح هذه المقالة مرخصة بموجب رخصة المشاع الإبداعي النسب 4.0 الدولية، التي تسمح بالاستخدام والمشاركة والتكيف والتوزيع وإعادة الإنتاج بأي وسيلة أو صيغة، طالما أنك تعطي الائتمان المناسب للمؤلفين الأصليين والمصدر، وتوفر رابطًا لرخصة المشاع الإبداعي، وتوضح ما إذا تم إجراء تغييرات. الصور أو المواد الأخرى من طرف ثالث في هذه المقالة مشمولة في رخصة المشاع الإبداعي الخاصة بالمقالة، ما لم يُشار إلى خلاف ذلك في سطر الائتمان للمواد. إذا لم تكن المادة مشمولة في رخصة المشاع الإبداعي الخاصة بالمقالة وكان استخدامك المقصود غير مسموح به بموجب اللوائح القانونية أو يتجاوز الاستخدام المسموح به، فستحتاج إلى الحصول على إذن مباشرة من صاحب حقوق الطبع والنشر. لعرض نسخة من هذه الرخصة، قم بزيارةhttp://creativecommons.org/رخص/بواسطة/4.0/.
© المؤلف(ون) 2024

  1. مركز العلوم الحدودية للإلكترونيات المرنة، معهد الإلكترونيات المرنة في شيان (IFE)، جامعة شمال غرب بوليتكنيك، 127 طريق يويي الغربي، شيان 710072، الصين. مركز المواد النانوية، المعهد الأسترالي للهندسة الحيوية والتكنولوجيا النانوية ومدرسة الهندسة الكيميائية، جامعة كوينزلاند، بريسبان، كوينزلاند 4072، أستراليا. كلية الفيزياء وتكنولوجيا المعلومات، جامعة شاندونغ العادية، شيآن 710062، الصين.
    البريد الإلكتروني: l.wang@uq.edu.au; zgq2006@snnu.edu.cn; iamwhuang@nwpu.edu.cn; iamscwang@nwpu.edu.cn

Journal: Nature Communications, Volume: 15, Issue: 1
DOI: https://doi.org/10.1038/s41467-024-47022-z
PMID: https://pubmed.ncbi.nlm.nih.gov/38521830
Publication Date: 2024-03-23

Induced dipole moments in amorphous ZnCdS catalysts facilitate photocatalytic evolution

Received: 21 November 2023
Accepted: 18 March 2024
Published online: 23 March 2024
(A) Check for updates

Xin Wang , Boyan Liu , Siqing Ma , Yingjuan Zhang , Lianzhou Wang , Gangqiang Zhu © , Wei Huang (1) Songcan Wang

Abstract

Amorphous semiconductors without perfect crystalline lattice structures are usually considered to be unfavorable for photocatalysis due to the presence of enriched trap states and defects. Here we demonstrate that breaking longrange atomic order in an amorphous ZnCdS photocatalyst can induce dipole moments and generate strong electric fields within the particles which facilitates charge separation and transfer. Loading of low-cost cocatalysts to the ZnCdS material increases the evolution rate to , which is over 5 times higher than its crystalline counterpart and is stable over the long-term up to 160 h . A flexible ZnCdS film is prepared by a facile blade-coating technique and can generate numerous observable bubbles under natural sunlight, exhibiting potential for scale-up solar production.

Carbon neutrality has been the global consensus for sustainable development in the modern society . Owing to the high energy capacity ( ) and carbon-free features, hydrogen ( ) has been regarded as a promising energy source to replace fossil fuels in the future . However, over of in the world is produced from fossil fuels such as steam reforming of natural gas, partial oxidation of heavier hydrocarbons, and coal gasification, which not only consume nonrenewable fossil fuels, but also generate carbon dioxide . Therefore, seeking efficient, low-cost and green production technology is of paramount importance.
Photocatalytic water splitting using solar energy provides a costeffective and environmental-friendly way for green production . Nevertheless, the large-scale application of this technology is mainly restricted by its low production efficiency and poor stability, due to severe charge recombination in the bulk and strong redox capacities of the photogenerated electron-hole pairs that may decompose the photocatalyst itself . Therefore, the development of highly-active, robust and cost-effective photocatalysts is significant while challenging. If the separation and transfer properties of the
photogenerated electron-hole pairs can be significantly improved, the photogenerated electrons and holes can be consumed in the surface photocatalytic reactions, and thus side-reactions between the photogenerated charge carriers and the photocatalyst itself can be eliminated. During a photocatalytic process, the photogenerated electrons and holes are transported randomly within a particulate photocatalyst due to the lack of directed electric field . Consequently, only a small proportion of photogenerated charge carriers can reach the surfaces of the photocatalyst for water splitting reactions . In the past decades, worldwide efforts have been devoted to promoting charge separation by manipulating the built-in electric field in photocatalysts . For example, a built-in electric field in was generated by polarization of ferroelectric , which generally needs external mechanical energy (e.g. ultrasonication). A built-in electric field also can be formed by heterojunction in photocatalysts, but only a different space charge region is generated at the interface of two materials rather than a desirable bulk band bending . As a result, the bulk charge recombination issue cannot be completely addressed. How to substantially enhance the bulk
charge separation efficiency in particulate photocatalysis remains an open question.
If the symmetry of the atom arrangement in the crystal structure of a photocatalyst is broken, the positive and negative charge center will shift to form a dipole moment and generate an electric field , which may provide alternative opportunities to address the bulk charge recombination issue during photocatalysis. Here, we develop a facile wet-chemical synthesis process for the design of amorphous ZnCdS (AZCS) photocatalyst. Both density functional theory (DFT) simulation and experimental characterizations demonstrate that the asymmetric atom arrangement in AZCS can generate dipole moments to form electric fields which facilitates charge separation and transfer. By loading as a low-cost cocatalyst, the can produce numerous bubbles under both Xe lamp light and natural sunlight (Supplementary Movies 1 and 2), exhibiting a photocatalytic evolution rate of , which is over 5 times higher than its crystalline counterpart ( ). Furthermore, an apparent quantum yield (AQY) of is obtained from AZCS illuminated by a 420 nm monochromatic light. The AZCS demonstrates a long-term stability of up to 160 h for photocatalytic evolution. In addition, a flexible film on an aluminum foil is fabricated by a blade-coating approach, which is robust after repeated bending (Supplementary Movie 3), and a large number of bubbles can be observed under both Xe lamp light and natural sunlight irradiation (Supplementary Movies 4 and 5).

Results

Mechanism of amorphous structure induced dipole fields

To theoretically verify that amorphous ZnCdS (AZCS) has stronger dipole fields due to the disorder arrangement of atoms, density functional theory (DFT) calculation was carried out to investigate the effect of amorphous structure on the separation and transport of photogenerated carriers. In the hexagonal system of crystalline ZnCdS (CZCS), each Zn or Cd atom is connected to four S atoms with a perfect layered structure (Fig. 1a and top view in Supplementary Fig. S1a), while AZCS exhibits a random arrangement of the and tetrahedrons (Fig. 1b and top view in Supplementary Fig. S1b). Supplementary Fig. S2 exhibits the DFT energy as a function of time at 300 K for CZCS and AZCS, respectively. CZCS exhibits a lower energy than its
AZCS counterpart, demonstrating the higher structural stability. Moreover, the deformation charge density distributions of CZCS and AZCS along the (011) plane are shown in Fig. 1c, d, respectively. The charge distribution of CZCS is very uniform and highly order, while AZCS demonstrates the random distribution of the deformation charge density, which is attributed to the different atomic arrangement and distribution in CZCS and AZCS.
According to the structures of AZCS and CZCS, the dipole moments were calculated. As shown in Fig. 1e, CZCS with a perfect crystalline structure exhibits relatively small dipole moments of 31.73, -27.48 , and -87.85 ea along the -, -, and -directions, respectively. However, the dipole moment along the -direction is significantly enhanced to in AZCS. More obvious enhancement is observed in the – and -directions, with the values of -153.80 and , respectively. When a pair of opposite charges ” ” and ” ” are separated by a distance ” “, an electric dipole is established. The size of dipole is measured by its dipole moment, which is equal to multiplied by . The direction of the dipole moment in space is from the negative charge ” ” to the positive one ” . The larger of the absolute value of the dipole moment means the stronger of the extra driving force can be generated in a photocatalyst to promote charge separation. Therefore, the amorphous structure with disorder arrangement of atoms in AZCS induces strong dipole fields along the (100), (010) and (001) directions, thus facilitating charge separation and transfer in a particulate photocatalyst.
According to the calculation results shown in Fig. 1e, the distributions of the positive and negative charge centers of CZCS and AZCS in the plane are demonstrated (Fig. 1f, g). Since the distribution of charge density in CZCS is symmetrical (Fig. 1c), the positive and negative charge centers are close, thus generating a relatively small dipole moment (Fig. 1f). In comparison, the AZCS counterpart is completely asymmetrical (Fig. 1d), and the positive and negative charge centers are significantly separated, thus forming a much stronger dipole moment of 197.01 eå along the (001) direction (Fig. 1g).
To illustrate the contribution of dipole moments to charge separation, a schematic (Fig. 1h) of the energy band structures of CZCS and AZCS during the photocatalytic process were presented. For CZCS without obvious dipole moments, the energy band bending is too
Fig. 1 | Theoretical analysis of dipole fields in crystalline and amorphous structures. The atom arrangement and distribution of (a) CZCS and (b) AZCS. Deformation charge densities of (c) CZCS and (d) AZCS on the (011) plane. e The calculated dipole moments of AZCS and CZCS along three different


0.30 e 0.27 e 0.24 e 0.21 e 0.18 e 0.15 e 0.15 e A 0.12 e 0.09 e 0.06 e 0.03 e 0.00 e
d


crystallographic directions. Schematics of (f) CZCS and (g) AZCS structures with positive and negative charge centers. Schematic of the promotion effect of dipole field on charge transfer.
mapping of and S in CZCS, ( ) XRD patterns, Raman and FTIR spectra of AZCS and CZCS, (r) The relative element content of from AZCS and CZCS obtained by ICP-OES.
Fig. 2 | Morphology, structure and surface characteristics of AZCS and CZCS. a-c SEM, TEM, HRTEM images and SAED pattern (inset in c) of AZCS, (d-g) TEM EDS and elemental mapping of Zn, Cd and S in AZCS, ( ) SEM, TEM, HRTEM images and SAED pattern (inset in ) of CZCS, ( ) TEM EDS and elemental
small to drive the directional separation of the photogenerated electrons and holes, and severe charge recombination occurs. However, when the order of all well-arranged unit cells in the ZnCdS crystal are disrupted, it will cause uneven charge distribution in space, thereby generating dipole moments that induce strong dipole fields in the entire photocatalyst. The strong directional dipole field will cause a large energy band bending in AZCS to promote charge separation, which can enhance the photocatalytic activity and stability.
To demonstrate the effect of atomic arrangement and distribution on the bandgap, the highest occupied molecular orbital (HOMO) and least unoccupied molecular orbital (LUMO) of CZCS and AZCS were also calculated. As shown in Supplementary Fig. S3, the HOMO charge densities are strongly localized at the S atoms, and the LUMO charge densities are strongly localized at the , and S atoms, which is consistent to the literature that the valence band (VB) maximum of ZnCdS is mainly dominated by the orbital of the S atom, while the conduction band (CB) minimum of ZnCdS is mainly contributed by the hybridization of the orbital of the Zn atom, the orbital of the Cd atom and the orbital of the S atom . In addition, the bandgap of AZCS is narrower than its CZCS counterpart, suggesting that AZCS can absorb a broader range of light.

Characterizations of the as-synthesized photocatalysts

The morphology and microstructure of the as-synthesized AZCS and CZCS were analyzed by scanning electron microscopy (SEM), transmission electron microscopy (TEM) and high-resolution TEM
(HRTEM). As shown in Fig. 2a, AZCS is composed of connected nanoparticles with a size of approximately 42.4 nm . No sharp grain boundaries can be observed in the TEM image (Fig. 2b), indicating the amorphous characteristics. The HRTEM image of AZCS shows disordered atomic arrangement without obvious lattice fringes (Fig. 2c), and the selected area electron diffraction (SAED) pattern exhibits diffused continuous and thick halo rings without any distinguishable diffraction spots (inset in Fig. 2c), indicating the amorphous feature of AZCS. Energy dispersive X-ray spectrometry (EDS) mapping of AZCS demonstrates the homogeneous distribution of , and S elements (Fig. 2d-g). In comparison, numerous nanoparticles with a size of around 49.1 nm is observed in CZCS, and obvious grain boundaries between the particles can be observed (Fig. 2h, i), which are attributed to the increased crystallinity during high temperature sintering.
According to the SEM and TEM images of AZCS and CZCS (Fig. 2a, h ), their particle sizes are similar. To further confirm the particle size distributions, the AZCS and CZCS powders were characterized by a nanoparticle size analyzer. As demonstrated in Supplementary Fig. S4, the particle size distribution of AZCS is , while that of CZCS is . The average particle sizes of AZCS and CZCS are 170.47 and 213.43 nm , respectively, suggesting that high temperature sintering at enlarges the particle size distribution range while has little effects on the average particle size. It should be mentioned that the particle size measured by a nanoparticle size analyzer is the statistical results from 20 mg of the sample, while the particle size measured by TEM is only the observable
particles shown in the TEM image. Therefore, the particle size values measured by these two different methods may be different, while the values measured by the same method can be reasonably compared. The ordered atomic arrangement is reflected by the clear lattice fringes in the HRTEM image (Fig. 2j), and the matrix spots in the SAED pattern (inset in Fig. 2j) demonstrate that CZCS is highly crystalline. EDS mapping confirms the homogeneous distribution of and S (Fig. ), which is similar to that of its AZCS counterpart.
The crystal structures of AZCS and CZCS were further revealed by X-ray diffraction (XRD). As shown in Fig. 20, distinctively different XRD patterns are observed between AZCS and CZCS. Specifically, CZCS exhibits extremely sharp diffraction peaks while AZCS has only two broad peaks, which proves the long-range disorder of atomic arrangement in AZCS. In addition, the XRD pattern of CZCS matches well with hexagonal ZnCdS (JCPDS-ICDD: 97-060-0508).
To understand the effect of temperature on the crystallinity during synthesis and sintering, other AZCS samples were prepared at room temperature, followed by sintering at different temperatures ( 200,400 , and ). Compared to the XRD pattern of ZCSO, the wide peak at is divided into two peaks when the sample is prepared at room temperature (ZCSRT, Supplementary Fig. S5), indicating the increase of crystallinity. In addition, with the increase of temperature during sintering, all peaks in the XRD patterns become sharper (Supplementary Fig. S5), suggesting the gradual increase of crystallinity. The relative crystallinity of the ZCSO, ZCSRT, ZCS200, ZCS400, and ZCS600 samples was calculated according to their XRD peaks. As listed in Supplementary Table S1, the crystallinity of ZCSO (AZCS) is only while its ZCS600 (CZCS) counterpart is . The crystallinities of ZCSRT, ZCS200 and ZCS400 are and , respectively, which is in line with the rule that the crystallinity increases with the increase of the sintering temperature.
To better demonstrate the evolution of XRD peaks during sintering, in situ XRD characterization was carried out for a ZCSO sample sintering from room temperature to in a atmosphere. Supplementary Fig. S6 shows similar trends to the ex-situ results (Supplementary Fig. S5), confirming the evolution of amorphous to crystalline features when the temperature is increased from room temperature to . It should be mentioned that the XRD peaks of the sample collected at by in-situ XRD (Supplementary Fig. S6) are weaker than the ZCS600 characterized by ex-situ XRD (Supplementary Fig. S5), which is attributed to the much higher scanning rate during in situ characterization ( for ex situ XRD, while for in situ XRD).
Raman and Fourier transform infrared (FTIR) spectra were carried out to further characterize the surface chemical bonding of AZCS and CZCS. As shown in Fig. 2p, two characteristic Raman bands at and are attributed to the 1st and 2nd longitudinal-optical ( and ) phonons in ZnCdS , respectively . AZCS exhibits two broader and less distinct bands at 311 and compared to its CZCS counterpart, demonstrating the spatial disorder and translational asymmetry of the amorphous structure . The FTIR spectra of AZCS and CZCS are shown in Fig. 2q. The FTIR vibrational peaks lie in the ranges of and , corresponding to the O-H group stretching and bending vibrations respectively, which represents the adsorption of molecules on the samples. In addition, the stretching vibration bands of and are observed in the range from 500 to . The other distinct band at should be ascribed to the C-O-C bonds, which is due to the surface adsorption of from the . It is obvious that the band intensity of all bonds in CZCS are weaker than its AZCS counterpart, indicating the adsorption of less and molecules, possibly due to the decrease of surface energy in the crystalline structure .
Since sulfur tends to escape from the crystal structure of metal sulfides during high temperature sintering, inductively coupled plasma (ICP) was performed to investigate the possible change of element content before and after crystallization. As illustrated in Fig. 2r, the atomic ratios of Zn, Cd, S in AZCS and CZCS are almost unchanged, suggesting that thermal treatment at only significantly increases the crystallinity while has little effects on the relative elemental content of the samples. Thermogravimetric (TG) analysis also confirms that AZCS is relatively stable at (Supplementary Fig. S7, Supplementary Discussion). X-ray photoelectron spectroscopy (XPS) demonstrate that the valence states of all elements in AZCS and CZCS are almost unchanged (Supplementary Fig. S8, Supplementary Discussion).

Photocatalytic evolution performance

Photocatalytic evolution performances of AZCS and CZCS were evaluated upon the irradiation of a Xe lamp using 20 mg of photocatalyst loaded with of as the cocatalyst in water containing lactic acid as a hole sacrificial agent. As shown in Fig. 3a, CZCS demonstrates a evolution rate of about . In comparison, the evolution rate of AZCS reaches , which is over 5 times higher than its CZCS counterpart. Supplementary Movies 1 and 2 present the photocatalytic evolution performance of AZCS under the irradiation of a Xe lamp and natural sunlight, respectively. A large number of bubbles can be observed, further indicating the superior evolution activity of AZCS. To understand whether the interfacial binding of the photocatalyst and the cocatalyst will affect the photocatalytic activity, Raman spectra (Supplementary Fig. S9) of loaded on AZCS and CZCS, and the photocatalytic evolution performances of AZCS and CZCS loaded with different cocatalysts (Supplementary Figs. S10-12) were performed. The results prove that the cocatalyst does not affect the relative activity of AZCS and CZCS, while playing a pivotal role in accelerating surface photocatalytic reactions to alleviate the side reactions between the photocatalyst and the photogenerated charge carriers (Supplementary Discussion).
To study the photocatalytic activity of ZnCdS with different crystallinities, photocatalytic evolution performances of ZnCdS synthesized at and (denoted as ZCSx, is the synthesis temperature) were also measured. As shown in Supplementary Fig. S13, with the increase of the preparation temperature, the photocatalytic activity of ZCS is gradually decreased (the evolution rates of ZCS0, ZCSRT, ZCS200, ZCS400 and ZCS600 are and , respectively), which illustrates that the crystallinity is inversely proportional to the photocatalytic activity. Besides, the photocatalytic evolution rates of ZnCdS with different molar mass ratios of are shown in Supplementary Fig. S14a. The evolution activity is distinctively improved with the decrease of the molar mass ratio of . Until the molar mass ratio of reaches 1:1, the evolution rate achieves the highest of . When the molar mass ratio of further decreases, the evolution rate also decreases. XRD patterns of the samples with different ratios are shown in Supplementary Fig. S14b. With the increase of the Cd content, the peak at around shifts to higher degree, which is due to the lattice distortion caused by the incorporation of Cd with a larger atomic radius . Three diffraction peaks of and transform into two peaks in and , indicating that the addition of appropriate amount of cadmium in the low-temperature synthesis process can affect its crystallinity .
Figure 3b and Supplementary Fig. S15 present the apparent quantum yield (AQY) values of AZCS and CZCS at different monochromatic light and the detailed results are listed in Supplementary Table S2. The wavelength-dependent AQY variation trend is almost consistent with the absorption spectrum in both AZCS and CZCS,
Fig. 3 | Photocatalytic evolution performance. a evolution within 2.5 h for AZCS and CZCS, (b) Wavelength-dependent apparent quantum yield (AQY) and (c) photocatalytic stability test of AZCS, (d) evolution rate and (e) stability of
different sulfide photocatalysts reported so far, (f) Flexible photocatalyst films of different sizes , the evolution state of the photocatalyst film in (g) darkness, (h) Xe lamp light and (i) natural light conditions.
suggesting the same photocatalytic mechanism. Specifically, the AQY values of AZCS are ( 455 nm ), , and , respectively. It can be observed that the AQY values of AZCS are much higher than that of CZCS under different monochromatic light, indicating the favorable light absorption and utilization efficiency of AZCS.
In addition to the obvious photocatalytic water splitting activity, stability is another pivotal factor for the practical application of photocatalysis. As shown in Fig. 3c, the AZCS/Co-MoS sample shows excellent stability without obvious decay in the evolution performance after 160 h of repeated testing ( 16 h per cycle for 10 cycles with an additional cocatalyst added in each cycle). It is worth noting that when no additional cocatalyst was added during each cycle, the evolution performance dropped rapidly after 5 cycles (Supplementary Fig. S16). In order to exclude the promotion effect of the amount of cocatalyst on the photocatalytic performance, the effect of different amounts of on the evolution performance of AZCS was investigated. As shown in Supplementary Fig. S17, the evolution performance of AZCS is the best when the Co content is . When the cocatalyst content is further increased to 1.5 and 2 wt.%, the obtained AZCS/Co-MoS photocatalysts exhibit very similar photocatalytic performance compared to their counterpart with of cocatalyst. SEM, XRD and ICP were used to characterize the mechanism of in promoting the photocatalytic stability of AZCS, and the results demonstrate that the morphology, structure, and elements in AZCS are relatively stable after photocatalytic evolution test (Supplementary Figs. S18, 19 and Supplementary Table S3, Supplementary Discussion).
The photocatalytic evolution rates and stability of typical sulfide photocatalysts in recent years are summarized in Fig. 3d, e. Among
various sulfide photocatalysts , the amorphous in this work exhibits the highest photocatalytic evolution rate (Fig. 3d). Moreover, metal sulfide semiconductors are traditionally considered to be less stable due to the easy oxidation of during photocatalysis . This work demonstrates that the addition of cocatalyst during each photocatalytic cycle can achieve a superior stability as high as 160 h , which is much higher than other sulfide photocatalysts (Fig. 3e). In addition, Supplementary Figs. S20a, b exhibit the comparison of AQY and evolution rate of the reported photocatalysts with built-in electric fields or amorphous structures, as well as sulfide and COF-based photocatalysts in recent years. The AQY in this work holds a competitive advantage (Supplementary Fig. S20a), indicating promising development prospects for AZCS/Co-MoS . In addition, compared with other photocatalysts, the amorphous ZnCdS demonstrated in our work exhibits a evolution rate as high as , which outperforms all these photocatalysts without the formation of heterojunctions or the addition of piezoelectric materials (Supplementary Fig. S2Ob).
For possible scale-up applications, particulate photocatalysis also meet the issues in terms of the separation and recycle of the photocatalysts. To address these issues, we demonstrated that flexible Co AZCS films with dimensions of , and can be prepared by a facile blade-coating technique on aluminum foils (Fig. 3f). Owing to the flexible feature of the aluminum foil, the obtained AZCS films are flexible and keep stable after repeated bending (Supplementary Movie 3). Impressively, the Co AZCS films can generate observable bubbles under both Xe lamp light (Fig. 3g, h, Supplementary Movie 4) and natural sunlight irradiation (Fig. 3i, Supplementary Movie 5), indicating the potential for possible scale-up solar-driven production.
Fig. 4 | Photocatalytic mechanism analysis. a UV-vis light absorption curves of AZCS and CZCS, where inset shows the photograph of AZCS and CZCS, (b) the corresponding Tauc plots for AZCS and CZCS transformed by Kubelka-Munk
parameter, (c) VB-XPS spectra, (d) M-S curves, (e) Band structures, (f) EIS plots (inset: equivalent circuit), (g) Transient photocurrent responses, (h) Photoluminescence (PL) spectra and (i) PL lifetime of AZCS and CZCS.

Photocatalytic mechanism exploration

The successful progress of photocatalytic reactions requires photocatalysts to satisfy both thermodynamic and kinetic conditions. UV-vis absorption spectra, VB-XPS spectra and Mott-Schottky tests were conducted to understand the mechanism of the enhanced photocatalytic performance of AZCS. Figure 4 a is the UV-vis absorption spectra of AZCS and CZCS. It is apparent that the absorption intensity of AZCS is higher than CZCS, indicating the better utilization of the solar spectrum. In addition, AZCS shows a red shift of the absorption edge, indicating the absorption of a broader range of light. Interestingly, AZCS exhibits a bright yellow color while CZCS shows a dark yellow color, indicating the absorption of different range of light (inset in Fig. 4a). Based on the UV-vis absorption spectra, the bandgap values ( ) of AZCS and CZCS were obtained by the Kubelka-Munk function versus the light energy . As demonstrated in Fig. 4b, AZCS presents a narrow bandgap of 2.34 eV , which is 0.33 eV lower than that of CZCS ( 2.67 eV ).
To understand the arrangement of the band structures, VB-XPS spectra of AZCS and CZCS were collected, as shown in Fig. 4c.
The VB maximum values of AZCS and CZCS were calculated to be 1.81 and 1.99 eV using the formula of ( : potential of normal hydrogen electrode, is 4.5 eV representing the electron work function of the analyzer) to eliminate the influence of contact potential difference between the analyzer and the samples . According to the equation of ( is the potential of CB , and the of AZCS and CZCS can be estimated to be -0.53 and -0.68 eV , respectively. The flat-band potentials ( ) of AZCS and CZCS are 0.38 and 0.53 eV , respectively, which are calculated by the Mott-Schottky plots in Fig. 4d. The plots of AZCS and CZCS both show a positive slope, which is typical for n-type semiconductors. Based on the above calculation and analysis, the band positions of AZCS and CZCS are demonstrated in Fig. 4e. Notably, the band alignments of AZCS and CZCS both satisfy the thermodynamic requirements for water reduction and oxidation, while AZCS exhibits a narrower bandgap due to the localization of band tail states in the amorphous structure . The reduced bandgap of AZCS is consistent to the DFT calculation results shown in Supplementary Fig. S3.
Fig. 5 | Dipole field characterizations. Digital images showing the slurries and drip-coated films of (a) AZCS and (b) CZCS. KPFM images of AZCS in (c) dark and (d) light. KPFM images of CZCS in (e) dark and (f) light. g Surface potential from
KPFM images of AZCS with or without light. Surface potential from KPFM images of CZCS with or without light. i SPV spectra of AZCS and CZCS.
Charge carrier separation and transfer properties play a pivotal role in the photocatalytic kinetic process. Electrochemical impedance spectroscopy (EIS) spectra and photocurrent responses were obtained to probe the charge transfer resistance and charge carrier density. As shown in Fig. 4f, the EIS plots were fitted using an equivalent circuit (inset in Fig. 4f). Only one semicircle exists in the EIS curves of AZCS and CZCS, indicating that the interfacial exchange of charge carrier between the photocatalyst and electrolyte is the main impediment for carrier transport. Moreover, a smaller diameter in the EIS curve of AZCS compared to that of CZCS reflects the lower charge transfer resistance ( ). Supplementary Fig. S21 shows the diameter changes that are conform to the performance regular pattern of photocatalytic hydrogen evolution. The values of all samples are shown in Supplementary Table S4, AZCS shows the lowest of , which is only that of CZCS, suggesting the much faster surface charge transfer kinetics. Photocurrent responses under AM 1.5 G illumination of AZCS and CZCS are revealed in Fig. 4g. The AZCS shows over 23 times higher photocurrent densities than that of CZCS, suggesting a significantly higher hole-electron separation efficiency. Photocurrents of all samples with different crystallinities are presented in Supplementary Fig. S22. It can be observed that the photocurrent changes exhibit the same trend with their evolution performances, indicating the high charge separation efficiency in the sample with low crystallinity.
In a photocatalytic process, some of the photogenerated electrons are used for reduction reaction, while others unfortunately recombine with holes. The radiative recombination process was studied by photoluminescence (PL) spectroscopy. As demonstrated in Fig. 4h, under an excitation wavelength of 320 nm , AZCS shows a
weaker band-to-band emission peak at 644 nm than its CZCS counterpart. The PL quenching result could be explained by the inhibition of charge recombination from the disorder atomic arrangements , as evidenced by much stronger PL peaks of ZCSRT, ZCS200 and ZCS400 compared to ZCSO shown in Supplementary Fig. S23. To further elucidate the reaction dynamics of the excited charges, the emission decay profiles of AZCS and CZCS were recorded with by nanosecond time-resolved fluorescence (TR-PL). As shown in Fig. 4i, the PL lifetime (amplitude average lifetime) of AZCS is 12.8 ns , which is around 4.5 times higher than its CZCS counterpart ( 2.8 ns ). The quenching is ascribed to the high recombination rate of the photogenerated electron-hole pairs in CZCS. The PL lifetime values of ZCSRT, ZCS200 and ZCS400 are 8.2, 5.3 and 3.8 ns, respectively (Supplementary Fig. S24), further indicating that the lower the crystallinity of ZnCdS, the higher the charge carrier transport efficiency.

Dipole field characterizations

To further verify the mechanism of the high photogenerated carrier separation efficiency in the amorphous structure, Kelvin probe force microscopy (KPFM) was applied to detect the surface potential profiles of AZCS and CZCS in dark and light under a Xe lamp illumination. As demonstrated in Fig. 5a, b, AZCS and CZCS were made into slurries and drip-coated on glass substrates for KPFM testing. The KPFM images of AZCS exhibit completely different surface potentials under dark and light conditions (Fig. 5c, d), and the surface potential does not vary uniformly according to the locations, which is caused by the dipole field generated by the amorphous structure at the surface. By contrast, the KPFM images of CZCS in Fig. 5e, f also present different surface potentials under dark and light, while the potential is varied uniformly
with the change of position. Furthermore, AZCS with light illumination exhibits an increase average surface potential of (Fig. 5g) compared to that without light, while its CZCS counterpart only shows an increase of (Fig. 5h), which further demonstrates that dipole field exists in AZCS.
The surface photovoltage (SPV) spectra were further used to reveal the surface charges of AZCS and CZCS. As shown in Fig. 5i, the positive signal implies that holes transmit to the illumination side of the samples, which is a representative property for n-type semiconductors under light irradiation. Moreover, the SPV of CZCS was scarcely detected, indicating the low charge separation and transportation, while AZCS obtains a significantly higher SPV signal and wider photo-response range. It is reasonable to state that the photocatalytic reaction is more likely to occur due to the migration of more photogenerated carriers to the AZCS surface with disordered arrangement of atomic structures .
We further found that the construction of an amorphous structure is a generic strategy to boost the photocatalytic evolution performance of metal sulfide photocatalysts. Amorphous and crystalline ZnS and CdS were synthesized by the same method, which are denoted as AZS, CZS, ACS and CCS, respectively. As shown in Supplementary Fig. S25, the TG curves of ZnS and CdS suggest that they are not decomposed at the temperature of . The XRD and evolution of ACS and CCS are demonstrated in Supplementary Fig. S26. The amount of evolution of ACS is over 8 times higher than its CCS counterpart within 2.5 h (Supplementary Fig. S26a). The XRD peaks of CCS are sharp and conform to the peak of CdS (JCPDS-ICDD: 97-015-4186) while the XRD pattern of ACS only exhibits two envelope peaks (Supplementary Fig. S26b). Similarly, the evolution and XRD pattern of AZS and CZS are shown in Supplementary Fig. S27. Not surprisingly, AZS has better evolution properties than its CZS counterpart. The similar results of and ZnCdS illustrate the universality of the construction of amorphous structures to break the symmetric atomic arrangement in the crystal structure, inducing strong dipole field to promote bulk charge separation and transport, thereby significantly enhancing the photocatalytic performance.

Discussion

A high-performance AZCS is synthesized by a facile low-temperature wet-chemical method. Owing to the asymmetry of the atom arrangement, strong dipole fields in the -, -, and -directions are induced, providing extra driving forces for the separation and transport of the photogenerated electron-hole pairs. In addition, the bandgap of AZCS is significantly reduced from 2.67 to 2.34 eV because of the localization of band tail states in the amorphous structure. With the significantly enhanced bulk charge separation efficiency and the light utilization range, AZCS exhibits a evolution rate of , which is over 5 times higher than its crystalline counterpart. An AQY of is achieved at a monochromatic light with a wavelength of 420 nm . By engineering the surface cocatalyst, the AZCS/Co-MoS demonstrates a photocatalytic stability up to 160 h . A flexible photocatalytic film can be obtained by a facile blade-coating technique, demonstrating obvious evolution under natural sunlight illumination. The findings demonstrated in this work provide insights for the enhanced photocatalytic performance of amorphous photocatalysts, which may inspire the design of high-performance photocatalysts for solar fuel production.

Methods

Materials preparation

All of the chemical reagents were purchased from Beijing Innochem Science & Technology Co., Ltd. The amorphous ZnCdS (AZCS) was prepared by a low-temperature wet-chemical method. Briefly, 20 mL of aqueous solution ( 0.1 M , Aladdin, AR) was added into 20 mL of a mixed solution containing 0.05 M of
(Innochem, ) and 0.05 M of (Aladdin, AR) with a rate of and stirred at for 1 h . The resulted yellow slurry was then washed thoroughly with Milli-Q water, and vacuum freezedried. ZCSRT was obtained by the same procedure of AZCS with the only change of the temperature to room temperature during stirring. ZCS200, ZCS400 and ZCS600 (ZCS600 is the most crystalline sample that is also denoted as CZCS) with higher crystallinity were synthesized by annealing the ZCSRT at 200,400 , and in a tube furnace for 5 min under a nitrogen atmosphere, respectively. In order to examine the influence of different proportions of Zn and Cd , the samples of were synthesized by the same conditions of AZCS.
Flexible AZCS/Co-MoS films were prepared by a blade coating method. Briefly, 5 g of AZCS, 14 mg of (Innochem, of (Innochem, 99.95%) and 0.5 g of Poly (vinylidene fluoride) (Innochem, average pellets) powder were added into a mortar. Then, 6 mL of 1-Methyl-2-pyrrolidinone (Innochem, 99.5%, extra dry) as the solvent was mixed in the above mixture and ground thoroughly for 30 minutes to obtain a slurry. An appropriate amount of the slurry was placed on aluminum foils with dimensions of , and , respectively, and the coating was scraped in one direction with a glass rod at a uniform speed to obtain uniform films. The obtained films were then dried in a vacuum oven at for 1 h . The mass loadings of the films with dimensions of , and were 128.9, 826.1, and 3578.8 mg of AZCS , respectively.

Characterization

SEM analysis was carried out on a Zeiss Gemini 300 field emission scanning electron microscope. TEM, HRTEM, and SAED patterns were obtained on a FEI TalosF200x transmission electron microscope. XRD patterns were recorded on an X-ray (D8 Advance, Bruker) diffractometer with radiation. The crystallinities of the samples were calculated by the formula of , where and represent the integrated area of the diffraction peak in the crystalline and amorphous states, respectively. Raman spectra were obtained on an Alpha 300 R Micro confocal Raman spectrometer using an TEM00 laser ( 532 nm ). FTIR spectra were acquired on a Thermo Scientific Nicolet iS5 spectrometer. XPS and VB XPS spectra were obtained on an XPS scanning microprobe spectrometer with an Al radiation source. C was used as a reference to calibrate the binding energies. The and S ion concentrations were analyzed by an Agilent 5110 inductively coupled plasma optical emission spectrometry (ICP-OES). Nano particle distribution was detected by a nanoparticle size analyzer (Malvern Zetasizer Nano ZS90). UV-vis absorbance spectra of the solid powder samples were recorded on a spectrophotometer (UV-2600i, Shimadzu). PL measurements were carried out on a fluorescence spectrophotometer (FLS-1000, Edinburgh Instruments) with an excitation light at 375 nm . KPFM images were obtained by KPFM mode for Atomic Force Microscopy (Bruker Dimension Icon). SPV spectra were obtained on a CEL-SPS1000 surface photovoltage spectrometer.

Photocatalytic tests

Photocatalytic evolution was conducted at in a photocatalytic activity evaluation system (Beijing China Education Au-Light Co., Ltd., CEL-PAEM-D8) according to our previous study . A gas chromatography (Beijing China Education Au-Light Co., Ltd., GC-7920) was equipped with a thermal conductive detector (TCD) and a TDX-01 molecular sieve column. A 300 W Xenon lamp ( ) was employed as the light source of simulated solar irradiation. Argon was used as the carrier gas. 20 mg of photocatalysts were dispersed in 60 mL of aqueous solution containing 10 mL of lactic acid (Aladdin, ). The cocatalyst was decorated on the photocatalyst surfaces by photo-deposition with (Innochem, 99%)
and (Innochem, 99.95%) aqueous solution equivalent to for 10 min before photocatalytic reactions. The produced gas was analyzed every 30 min automatically controlled by the software.
The apparent quantum yield (AQY) test method for hydrogen evolution at different wavelengths is similar to the hydrogen evolution test but only with monochromatic illumination which was calculated as follows: AQY (%) , where refers to the reacted electrons and represents the number of incident photons. is the amount of evolved molecules ( mol ), is the Avogadro constant, is the plank constant, and represents the speed of light. is the irradiation area ( ), is the power density of the incident light, is the irradiation time, and is the wavelength of the monochromatic light.

Photoelectrochemical measurements

5 mg of the samples were distributed in a solution containing 0.375 mL of of ethanol (Greagent, ) and of Nafion (Alfa, in water and 1-propanol) by ultrasonication for of the slurry was deposited on a clean fluorine doped (FTO) glass substrate ( ) by spin-coating. After drying on a hot place at , the obtained samples were used as the working electrode and the exposed area of the active material on the working electrode was controlled as . Photoelectrochemical (PEC) performance were measured in a typical three-electrode cell under the illumination of a Xe lamp equipped with an AM 1.5 G filter. A platinum wire served as the counter electrode, and an (saturated KCl ) electrode was applied as the reference electrode. During the test, the active area was controlled as . Photocurrent responses were obtained at the circuit potential of the electrode under illumination for 400 s with an interval of 50 s every 50 s in a electrolyte. EIS spectra were conducted with an AC voltage amplitude for 0.1 V at the open circuit potentials of the electrode in dark (frequency range: ) using as the electrolyte. MS plots were obtained at a voltage range of -0.32 to 0.67 V versus NHE (frequency: 1200 Hz ) in dark using electrolyte (the pH was adjusted to 7 by KOH ).

DFT calculations

All calculations were performed using the density functional theory (DFT), as implemented in the Vienna ab initio simulation package . The projector augmented-wave (PAW) method and Perdew-BurkeErnzerhof generalized gradient approximation (GGA-PBE) were used for the exchange correlation functionals . The time step was set to 3 fs and only the point was sampled from the Brillouin zone. The canonical (NVT) ensemble with the Nose-Hoover thermostat was applied to control the temperature and the pressure in AIMD simulations. Crystalline ZnCdS was a hexagonal crystal system, and the unit cell model was obtained based on the XRD results. The initial supercell contained 192 atoms of with a cell parameter . The amorphous models were obtained by using the melt-quenched process: Firstly, the primitive models were fully melted at 3000 K to remove the memory effect from the initial sites. Secondly, the models were cooled down to 1400 K and relaxed at this temperature for a stable liquid. Then, we rapidly reduced the temperature to 300 K with a cooling rate of , and finally, the models were maintained at 300 K for 30 ps to collect the trajectories of the atoms. For the calculations of electronic structure, the energy cutoff of the PAW basis was set to 450 eV with a force convergence of 0.02 eV and a point grid was selected for the Brillouin zone sampling. The values of Zn and Cd were calculated based on the bandgap of ZnCdS . When the values of Zn and Cd were higher than 7.0 and 4.0 eV , the bandgap ZnCdS trends to be stable. Therefore, the Coulomb interaction values were set to 7.0 and 4.0 eV to describe the 3d electrons
of Zn and electrons of Cd , respectively, which are also consistent to the literature .

Data availability

The data generated within the paper and its Supplementary Information file are available from the corresponding authors upon request. Source data of Figs. 20-r, 3a-e, 4a-d, f-i, and 5g-i, and Supplementary Figs. S2-S27 are provided in a Source Data file. Source data are provided with this paper.

References

  1. Mora Rollo, A., Rollo, A. & Mora, C. The tree-lined path to carbon neutrality. Nat. Rev. Earth Environ. 1, 332 (2020).
  2. Wang, Z., Li, C. & Domen, K. Recent developments in heterogeneous photocatalysts for solar-driven overall water splitting. Chem. Soc. Rev. 48, 2109-2125 (2019).
  3. Zhou, C., Wu, J., Li, Y. & Cao, H. Highly efficient UV-visible-infrared light-driven photothermocatalytic steam biomass reforming to on Ni nanoparticles loaded on mesoporous silica. Energy Environ. Sci. 15, 3041-3050 (2022).
  4. Wang, Q. et al. Scalable water splitting on particulate photocatalyst sheets with a solar-to-hydrogen energy conversion efficiency exceeding 1%. Nat. Mater. 15, 611-615 (2016).
  5. Wang, X. et al. Development of -type photoanodes for photoelectrochemical water splitting. EcoEnergy 1, 108-153 (2023).
  6. Hisatomi, T. & Domen, K. Reaction systems for solar hydrogen production via water splitting with particulate semiconductor photocatalysts. Nat. Catal. 2, 387-399 (2019).
  7. Yang, L. et al. Beyond п-conjugated metal-free polymeric semiconductors for photocatalytic chemical transformations. Chem. Soc. Rev. 50, 2147-2172 (2021).
  8. Guo, Y. et al. Concentrating electron and activating H-OH bond of absorbed water on metallic boosting photocatalytic hydrogen evolution. Nano Energy 95, 107028 (2022).
  9. Hu, Y. et al. Lattice distortion induced internal electric field in photoelectrode for efficient charge separation and transfer. Nat. Commun. 11, 2129 (2020).
  10. Si, Y. et al. The effect of directed photogenerated carrier separation on photocatalytic hydrogen production. Nano Energy 41, 488-493 (2017).
  11. Zhang, C. et al. Piezo-photocatalysis over metal-organic frameworks: promoting photocatalytic activity by Piezoelectric effect. Adv. Mater. 33, 2106308 (2021).
  12. Xu, Q., Zhang, L., Cheng, B., Fan, J. & Yu, J. S-scheme heterojunction photocatalyst. Chem 6, 1543-1559 (2020).
  13. Cui, Y. et al. Fluid-induced piezoelectric field enhancing photocatalytic hydrogen evolution reaction on membrane. Nano Energy 99, 107429 (2022).
  14. Li, H. et al. Enhanced ferroelectric-nanocrystal-based hybrid photocatalysis by ultrasonic-wave-generated Piezophototronic effect. Nano Lett. 15, 2372-2379 (2015).
  15. Zhang, J. et al. Boosting photocatalytic water splitting by tuning built-in electric field at phase junction. J. Mater. Chem. A 7, 10264-10272 (2019).
  16. Wang, Q. et al. Particulate photocatalyst sheets based on carbon conductor layer for efficient Z-scheme pure-water splitting at ambient pressure. J. Am. Chem. Soc. 139, 1675-1683 (2017).
  17. . et al. Unique S -scheme heterojunctions in self-assembled hybrids for photoreduction. Nat. Commun. 11, 4613 (2020).
  18. Wu, H. et al. Low-bias photoelectrochemical water splitting via mediating trap states and small polaron hopping. Nat. Commun. 13, 6231 (2022).
  19. Mu, L. et al. Enhancing charge separation on high symmetry exposed with anisotropic facets for photocatalytic water splitting. Energy Environ. Sci. 9, 2463-2469 (2016).
  20. Ma, Z. et al. Electrostatic potential of the incorporated asymmetry molecules induced high charge separation efficiency of the modified carbon nitride copolymers. Appl. Catal. B 319, 121922 (2022).
  21. Heckel, S. et al. Beyond Janus geometry: characterization of flow fields around nonspherical photocatalytic microswimmers. Adv. Sci. 9, 19-21 (2022).
  22. Zhang, Y. et al. Visualizing coherent intermolecular dipole-dipole coupling in real space. Nature 531, 623-627 (2016).
  23. Li, Z. et al. Dipole field in nitrogen-enriched carbon nitride with external forces to boost the artificial photosynthesis of hydrogen peroxide. Nat. Commun. 14, 5742 (2023).
  24. Wang, W. et al. Band-gap modulation for enhancing NO photocatalytic oxidation over hollow ZnCdS: a combined experimental and theoretical investigation. J. Phys. Chem. C 126, 3967-3979 (2022).
  25. Song, J. et al. Photochemical construction of the FeCoNiPi-MnO composite for efficient tandem application of photocatalytic partial water splitting and overall water splitting. J. Mater. Chem. A 10, 16029-16036 (2022).
  26. Wang, X. et al. Two-dimensional amorphous nanosheets enabling high-efficiency photoinduced charge transfer for excellent SERS activity. J. Am. Chem. Soc. 141, 5856-5862 (2019).
  27. Song, J., Zhao, H., Sun, R., Li, X. & Sun, D. An efficient hydrogen evolution catalyst composed of palladium phosphorous sulphide ( ) and twin nanocrystal solid solution with both homo- and hetero-junctions. Energy Environ. Sci. 10, 225-235 (2017).
  28. Liu, S. et al. Facilitating nitrogen accessibility to boron-rich covalent organic frameworks via electrochemical excitation for efficient nitrogen fixation. Nat. Commun. 10, 3898 (2019).
  29. Chen, Y. C. et al. Photocatalytic enhancement of hydrogen production in water splitting under simulated solar light by band gap engineering and localized surface plasmon resonance of nanowires decorated by Au nanoparticles. Nano Energy 67, 104225 (2020).
  30. Hsu, Y. Y. et al. Heterojunction of Zinc Blende/Wurtzite in solid solution for efficient solar hydrogen generation: x-ray absorption/diffraction approaches. ACS Appl. Mater. Interfaces 7, 22558-22569 (2015).
  31. Zhao, H., Guo, L., Xing, C., Liu, H. & Li, X. A homojunction-heterojunction-homojunction scaffold boosts photocatalytic evolution over hybrids. J. Mater. Chem. A 8, 1955-1965 (2020).
  32. Lei, Y. et al. Molybdenum sulfide cocatalyst activation upon photodeposition of cobalt for improved photocatalytic hydrogen production activity of ZnCdS. Chem. Eng. J. 425, 131478 (2021).
  33. Bie, C. et al. A bifunctional catalyst enhances photocatalytic evolution and pyruvic acid synthesis. Angew. Chem. Int. Ed. 61, e202212045 (2022).
  34. Li, C. Q. et al. Constructing direct Z-scheme heterostructure by enwrapping on CdS hollow cube for efficient photocatalytic generation. Adv. Sci. 9, 2201773 (2022).
  35. Liu, G. et al. MoS -stratified core-shell nanorods for highly efficient photocatalytic hydrogen production. ACS Nano 14, 5468-5479 (2020).
  36. Wang, S., Wang, Y., Zhang, S. L., Zang, S. Q. & Lou, X. W. Supporting ultrathin nanosheets on -Doped graphitic carbon nanocages for efficient photocatalytic generation. Adv. Mater. 31, 1903404 (2019).
  37. Shi, X . et al. Protruding Pt single-sites on hexagonal to accelerate photocatalytic hydrogen evolution. Nat. Commun. 13, 1287 (2022).
  38. Tan, M. et al. Boosting photocatalytic hydrogen production via interfacial engineering on 2D ultrathin Z-scheme ZnIn heterojunction. Adv. Funct. Mater. 32, 2111740 (2022).
  39. Su, T. et al. Sulfur vacancy and cocatalyst synergistically boosting interfacial charge transfer in 2D/2D heterostructure for enhanced photocatalytic hydrogen evolution. Adv. Sci. 9, 2103715 (2022).
  40. Zuo, G. et al. Ultrathin nanosheets anchored on MXene for photocatalytic evolution. Angew. Chem. Int. Ed. 132, 11383-11388 (2020).
  41. Lu, Y. et al. pair induced LSPR of to sensitize for full-spectrum solar-light-driven photocatalytic hydrogen evolution. Adv. Funct. Mater. 32, 2203638 (2022).
  42. Zhang, S. et al. Gradient hydrogen migration modulated with selfadapting S vacancy in copper-doped nanosheet for photocatalytic hydrogen evolution. ACS Nano 15, 15238-15248 (2021).
  43. Wang, X. et al. Interfacial chemical bond and internal electric field modulated Z-scheme Sv-ZnIn photocatalyst for efficient hydrogen evolution. Nat. Commun. 12, 4112 (2021).
  44. Fan, H., Jin, Y., Liu, K. & Liu, W. One-step MOF-templated strategy to fabrication of Ce-Doped tetrakaidecahedron hollow nanocages as an efficient photocatalyst for hydrogen evolution. Adv. Sci. 9, 2104579 (2022).
  45. Chao, Y. et al. hybrid nanocages with strong 2D/2D hetero-interface interaction enable efficient -releasing photocatalysis. Adv. Funct. Mater. 31, 2100923 (2021).
  46. Zhu, J. et al. Mo-modified -scheme heterojunction with enhanced interfacial electric field for efficient visible-lightdriven hydrogen evolution. Adv. Funct. Mater. 33, 2213131 (2023).
  47. Jia, X. et al. Interfacial mediation by Sn and S vacancies of p-SnS/n for enhancing photocatalytic hydrogen evolution with new scheme of Type-I Heterojunction. Adv. Funct. Mater. 33, 2304072 (2023).
  48. Ran, J. et al. ultrathin nanosheets as versatile platform advancing highly active photocatalytic production. Nat. Commun. 13, 4600 (2022).
  49. Wang, W. et al. Edge-enriched ultrathin embedded yolk-shell with boosted charge transfer for superior photocatalytic evolution. Adv. Funct. Mater. 29, 1901958 (2019).
  50. Gao, D. et al. Reversing free-electron transfer of cocatalyst for optimizing antibonding-orbital occupancy enables high photocatalytic evolution. Angew. Chem. Int. Ed. 62, e202304559 (2023).
  51. Sharma, K. et al. Sulphur vacancy defects engineered metal sulfides for amended photo(electro)catalytic water splitting: a review. J. Mater. Sci. Technol. 152, 50-64 (2023).
  52. Xiao, J. et al. Simultaneously tuning the defects and surface properties of nanoparticles by codoping for significantly accelerated photocatalytic evolution. J. Am. Chem. Soc. 143, 10059-10064 (2021).
  53. Wang, X., Liu, B., Xiao, X., Wang, S. & Huang, W. Boron dopant simultaneously achieving nanostructure control and electronic structure tuning of graphitic carbon nitride with enhanced photocatalytic activity. J. Mater. Chem. C 9, 14876-14884 (2021).
  54. Wang, S. et al. Boosting the photocatalytic hydrogen production performance of graphitic carbon nitride nanosheets by tailoring the cyano groups. J. Colloid Interface Sci. 610, 495-503 (2022).
  55. Lin, Z., Du, C., Yan, B., Wang, C. & Yang, G. Two-dimensional amorphous NiO as a plasmonic photocatalyst for solar evolution. Nat. Commun. 9, 4036 (2018).
  56. Kang, Y. et al. An amorphous carbon nitride photocatalyst with greatly extended visible-light-responsive range for photocatalytic hydrogen generation. Adv. Mater. 27, 4572-4577 (2015).
  57. Zhang, L. J., Li, S., Liu, B. K., Wang, D. J. & Xie, T. F. Highly efficient photocatalysts: Z-scheme photocatalytic mechanism for
    their enhanced photocatalytic evolution under visible light. ACS Catal 4, 3724-3729 (2014).
  58. Sheng, Y., Li, W., Xu, L. & Zhu, Y. High photocatalytic oxygen evolution via strong built-in electric field induced by high crystallinity of perylene imide supramolecule. Adv. Mater. 34, 2102354 (2022).
  59. Wang, S. et al. One-step supramolecular preorganization constructed crinkly graphitic carbon nitride nanosheets with enhanced photocatalytic activity. J. Mater. Sci. Technol. 104, 155-162 (2022).
  60. Kresse, G. & Hafner, J. Ab initio molecular dynamics for liquid metals. Phys. Rev. B 47, 558-561 (1993).
  61. Kresse, G. & Furthmüller, J. Efficient iterative schemes for ab initio total-energy calculations using a plane-wave basis set. Phys. Rev. B Condens. Matter Mater. Phys. 54, 11169-11186 (1996).
  62. Perdew, J. P., Burke, K. & Ernzerhof, M. Generalized gradient approximation made simple. Phys. Rev. Lett. 77, 3865-3868 (1996).
  63. Blöchl, P. E. Projector augmented-wave method. Phys. Rev. B 50, 17953-17979 (1994).
  64. Biswas, A., Meher, S. R. & Kaushik, D. K. Electronic and band structure calculation of Wurtzite CdS using GGA and GGA+U functionals. J. Phys. Conf. Ser. 2267, 012155 (2022).
  65. Jiang, H., Gomez-Abal, R. I., Rinke, P. & Scheffler, M. First-principles modeling of localized d states with the GW@LDA+U approach. Phys. Rev. B Condens. Matter Mater. Phys. 82, 045108 (2010).

Acknowledgements

This work was financially supported by the National Natural Science Foundation of China (No. 52372292), and the Fundamental Research Funds for the Central Universities. The authors would also like to acknowledge financial support and material characterization from the Analytical & Testing Center of Northwestern Polytechnical University (No. 2022T016), and the SPV spectra measurement from Beijing China Education Au-Light Co., Ltd. L.W. is thankful for the financial support of the Australian Research Council through its Discovery Project (DP200101900) and Laureate Fellowship (FL190100139).

Author contributions

S.W. guided and designed the project. X.W. carried out the experiments and wrote the manuscript. B.L. and S.M. fabricated electrodes for PEC measurements and performed the characterization. Y.Z. conducted SEM
characterization. X.W., S.W., L.W., G.Z., and W.H. analyzed the data and prepared the manuscript. All the authors commented and approved the paper.

Competing interests

The authors declare no competing interests.

Additional information

Supplementary information The online version contains
supplementary material available at
https://doi.org/10.1038/s41467-024-47022-z.
Correspondence and requests for materials should be addressed to Lianzhou Wang, Gangqiang Zhu, Wei Huang or Songcan Wang.
Peer review information Nature Communications thanks Caijin Huang and the other, anonymous, reviewers for their contribution to the peer review of this work. A peer review file is available.
Reprints and permissions information is available at
http://www.nature.com/reprints
Publisher’s note Springer Nature remains neutral with regard to jurisdictional claims in published maps and institutional affiliations.
Open Access This article is licensed under a Creative Commons Attribution 4.0 International License, which permits use, sharing, adaptation, distribution and reproduction in any medium or format, as long as you give appropriate credit to the original author(s) and the source, provide a link to the Creative Commons licence, and indicate if changes were made. The images or other third party material in this article are included in the article’s Creative Commons licence, unless indicated otherwise in a credit line to the material. If material is not included in the article’s Creative Commons licence and your intended use is not permitted by statutory regulation or exceeds the permitted use, you will need to obtain permission directly from the copyright holder. To view a copy of this licence, visit http://creativecommons.org/ licenses/by/4.0/.
© The Author(s) 2024

  1. Frontiers Science Center for Flexible Electronics, Xi’an Institute of Flexible Electronics (IFE), Northwestern Polytechnical University, 127 West Youyi Road, Xi’an 710072, China. Nanomaterials Centre, Australian Institute for Bioengineering and Nanotechnology and School of Chemical Engineering, The University of Queensland, Brisbane, QLD 4072, Australia. School of Physics and Information Technology, Shaanxi Normal University, Xi’an 710062, China.
    -e-mail: l.wang@uq.edu.au; zgq2006@snnu.edu.cn; iamwhuang@nwpu.edu.cn; iamscwang@nwpu.edu.cn