DOI: https://doi.org/10.1007/s10654-024-01167-9
PMID: https://pubmed.ncbi.nlm.nih.gov/40146468
تاريخ النشر: 2025-03-27
تصميم عينة المسح في الموجة الأولى من دراسة الازدهار العالمية
© المؤلف(ون) 2025
الملخص
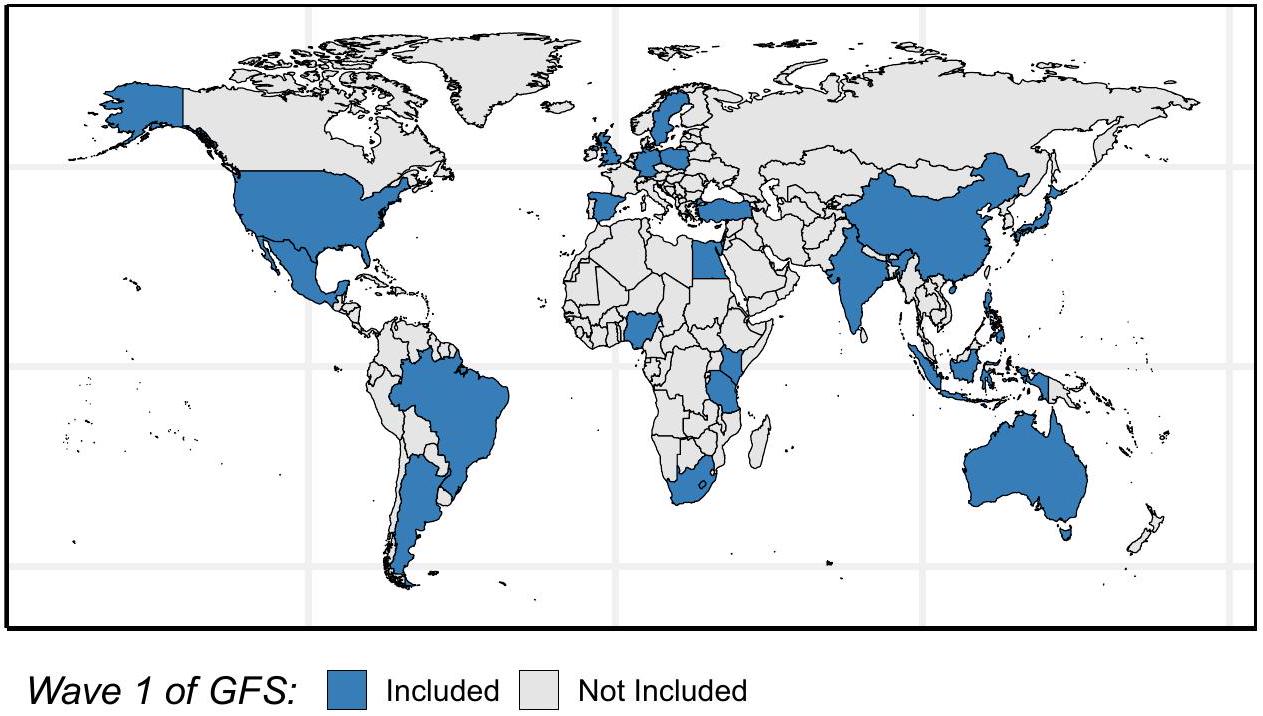
دراسة الازدهار العالمية (GFS) هي تعاون دولي لتطوير مورد بيانات متاح للجمهور لتعزيز البحث العالمي حول الازدهار البشري. تشمل هذه البيانات أكثر من 200,000 مشارك من 22 دولة متنوعة جغرافياً وثقافياً ومنطقة واحدة مصممة لتكون ممثلة وطنياً للسكان البالغين. تهدف GFS إلى أن تكون دراسة طولية مع تجنيد وتسجيل للموجة 1 التي تحدث بين أبريل 2022 وديسمبر 2023. ستدعو الموجات المستقبلية من جمع البيانات المشاركين لإكمال استطلاع سنوي. يغطي الاستطلاع السنوي مجموعة قوية من المقاييس حول الرفاهية والصحة والاجتماعية والاقتصادية والسياسية والدينية والروحية والنفسية والديموغرافية. تصف الورقة الحالية منهجية العينة وأساليب الوزن المستخدمة لتوقع العينات لتكون ممثلة وطنياً. يتم تقديم تفاصيل حول تدريب المحاورين وجمع البيانات، وعينات الاحتمالية وغير الاحتمالية، وإنشاء الأوزان، وتأثيرات التصميم، ومراحل جمع البيانات المستقبلية.
المقدمة
في أجزاء مختلفة من العالم. الدراسة هي الأكبر من نوعها، مع أكثر من 200,000 مشارك عبر مجموعة متنوعة ثقافياً وجغرافياً من الدول المدرجة في الموجة 1 (انظر الشكل 1). تساهم الورقة الحالية في نشر والتزام العلوم المفتوحة لـ GFS من خلال تقديم نظرة عامة على عملية تطوير الاستطلاع للدراسة، وملخص لتصميم العينة، وتغطية السكان، ونهج الوزن، ومعدلات الاستجابة، وتأثيرات التصميم للموجة 1، وخطط للموجات المستقبلية من جمع البيانات. تم تعديل وصف طرق العينة وتصميم الدراسة من تقرير المنهجية الذي تم تطويره بواسطة غالوب إنك [9] وعملية تطوير الاستطلاع التي أبلغت عنها غالوب إنك [10] ولومس وآخرون [11].
نظرة عامة على دراسة الازدهار العالمية
تطوير الاستطلاع
باستخدام أفضل الممارسات لتصميم استطلاعات الويب لتقليل عدم الاستجابة للعناصر، والاستجابات غير المنطقية والاستجابات غير المكتملة؛ و(8) تأكيد من العلماء في عدة دول مشاركة أن الترجمات قد التقطت بدقة المعنى المقصود لكل سؤال. يمكن العثور على مزيد من التفاصيل حول عملية تطوير استطلاع GFS في [10،11].
تغطية محتوى الاستطلاع
الترجمة
تدريب المحاورين
. تم مساعدة فرق العمل الميداني بواسطة دليل تدريب موحد لضمان الاتساق والترتيب. شمل تدريب المحاورين الموضوعات التالية: أخلاقيات البحث؛ حماية سرية المشاركين؛ البقاء آمنين أثناء العمل الميداني؛ بدء المقابلة؛ قراءة أسئلة الاستطلاع حرفيًا؛ التعامل مع أسئلة المشاركين؛ العناصر المغلقة والمفتوحة؛ أنماط التخطي؛ أفضل ممارسات المقابلة، بما في ذلك الاستفسار؛ اختيار المستجيبين؛ اختيار الأسر والاستبدال (للاستطلاعات وجهًا لوجه)؛ وإجراءات مراقبة الجودة. تم تدريب الفرق الميدانية باستخدام نظام المقابلة الشخصية المدعوم بالحاسوب (CAPI) للمقابلات وجهًا لوجه ونظام المقابلة الهاتفية المدعوم بالحاسوب (CATI) للمقابلات الهاتفية، والتي تم استخدامها خلال العمل الميداني. تسهل هذه الأنظمة عبء المحاورين وتساعد في التقاط البيانات بدقة للعناصر مثل اختيار المشاركين في الأسرة، وبيانات الاتصال، وأنماط التخطي.
تصميم العينة وجمع البيانات
البر الرئيسي للصين جزءًا من إصدار مجموعة البيانات الثانية في مارس 2025.
عينات قائمة على الاحتمالات
| بلد | تصميم العينة | تواريخ الجمع | # المشاركون | إجمالي حجم العينة |
| الأرجنتين | احتمالية | 29/11/22-30/11/23 | ٣٨٧٩ | 6724 |
| غير احتمالي | 04/11/23-11/14/23 | 2845 | ||
| أستراليا | احتمالية | 21/03/22-26/09/23 | ٣٣٧٧ | 3844 |
| غير احتمالي | 04/12/23-09/29/23 | ٤٦٧ | ||
| البرازيل | احتمالية | 23/11/22-26/11/23 | ٣٧٩٣ | ١٣,٢٠٤ |
| غير احتمالي | 04/11/23-11/07/23 | 9411 | ||
| مصر | احتمالية | 03/09/23-09/17/23 | 4729 | 4729 |
| ألمانيا | احتمالية | 08/11/22-11/16/23 | ٤٤٨٠ | 9506 |
| غير احتمالي | 06/12/23-08/27/23 | ٥٠٢٦ | ||
| هونغ كونغ (المنطقة الإدارية الخاصة بالصين) | غير احتمالي | 10/10/23-11/24/23 | ٣٠١٢ | ٣٠١٢ |
| الهند | احتمالية | 25/04/23-08/12/23 | 12,765 | 12,765 |
| إندونيسيا | احتمالية | 11/07/22-10/27/23 | 6992 | 6992 |
| إسرائيل | احتمالية | 11/07/22-11/23/23 | ٣٦٦٩ | ٣٦٦٩ |
| اليابان | غير احتمالي | 12/13/22-30/06/23 | ٢٠٥٤٣ | ٢٠٥٤٣ |
| كينيا | احتمالية | 04/13/23-11/21/23 | 11,389 | 11,389 |
| المكسيك | احتمالية | 29/10/22-13/12/23 | 2672 | 5776 |
| غير احتمالي | 05/09/23-20/11/23 | ٣١٠٤ | ||
| نيجيريا | احتمالية | 16/05/23-17/11/23 | 6827 | 6827 |
| الفلبين | احتمالية | 04/04/23-01/05/24 | 5292 | 5292 |
| بولندا | احتمالية | 12/14/22-10/13/23 | 8444 | 10,389 |
| غير احتمالي | 06/10/23-10/16/23 | 1945 | ||
| جنوب أفريقيا | احتمالية | 26/02/23-08/12/23 | ٢٦٥١ | ٢٦٥١ |
| إسبانيا | احتمالية | 08/17/22-11/08/23 | 2309 | 6290 |
| غير احتمالي | 22/06/23-30/08/23 | ٣٩٨١ | ||
| السويد | غير احتمالي | 01/16/23-02/22/23 | 15,068 | 15,068 |
| تنزانيا | احتمالية | 17/02/23-30/11/23 | 9075 | 9075 |
| تركيا | احتمالية | 15/04/23-05/01/24 | 1473 | 1473 |
| المملكة المتحدة | احتمالية | 26/04/22-20/11/23 | 2341 | ٥٣٦٨ |
| غير احتمالي | 06/12/23-08/30/23 | 3027 | ||
| الولايات المتحدة | احتمالية | 08/04/22-04/04/23 | ٣٨,٣١٢ | ٣٨,٣١٢ |
تمت محاولات الاتصال في أيام مختلفة من الأسبوع وأوقات مختلفة من اليوم (حتى ثلاث محاولات اتصال).
أو أكبر للمقابلات التي تمت عبر الهاتف. حاول المحاورون الاتصال على مدار عدة أيام وأوقات مختلفة، مع ما لا يقل عن خمس محاولات للاتصال، للوصول إلى المشاركين المستهدفين لإجراء المقابلة. عندما تم إجراء الاتصال بنجاح، كانت المقابلة الهاتفية مدعومة بنظام المقابلات الهاتفية المعتمدة على الكمبيوتر (CATI)، الذي تم استخدامه أيضًا لمساعدة المحاورين في إجراء الاستطلاع السنوي للحفاظ على منطق التخطي الصحيح عند الضرورة.
| بلد | استطلاع التوظيف (الاستيعاب) | استطلاع الموجة الأولى السنوي | ||||
| وجهًا لوجه
|
هاتف
|
ويب
|
وجهًا لوجه
|
هاتف
|
ويب
|
|
| الأرجنتين | ١١٥٢ | ٢٧٨٨ | 2784 | 0 | 1451 | 5273 |
| أستراليا | 0 | ٣٨٤٤ | 0 | 0 | 0 | 3844 |
| البرازيل | 859 | ٢٩٤٨ | 9397 | 0 | 1265 | 11,939 |
| مصر | 4729 | 0 | 0 | 0 | ٤٥٠٨ | 221 |
| ألمانيا | 0 | ٤٥٠٤ | 5002 | 0 | 0 | 9506 |
| هونغ كونغ (المنطقة الإدارية الخاصة للصين) | 0 | 0 | ٣٠١٢ | 0 | 0 | ٣٠١٢ |
| الهند | 12,765 | 0 | 0 | 0 | 12,549 | 216 |
| إندونيسيا | 6139 | 853 | 0 | 0 | ٣٦٢٠ | ٣٣٧٢ |
| إسرائيل | ٣٦٦٩ | 0 | 0 | 0 | ٢٧٤٣ | 926 |
| اليابان | 0 | 542 | ٢٠٠٠١ | 0 | 542 | ٢٠٠٠١ |
| كينيا | 11,389 | 0 | 0 | 0 | 9917 | 1472 |
| المكسيك | 1250 | 1535 | ٢٩٩١ | 0 | 1559 | 4217 |
| نيجيريا | 6827 | 0 | 0 |
|
5609 | 668 |
| الفلبين | 4620 | 672 | 0 | 0 | ٤١٧٤ | 1118 |
| بولندا | 8444 | 1945 | 0 | 0 | 625 | 9764 |
| جنوب أفريقيا | ٢٦٥١ | 0 | 0 | 0 | 2010 | 641 |
| إسبانيا | 0 | ٢٣٣٩ | ٣٩٥١ | 0 | 0 | 6290 |
| السويد | 0 | 0 | 15,068 | 0 | 0 | 15,068 |
| تنزانيا | 9075 | 0 | 0 | 0 | 8790 | ٢٨٥ |
| تركيا | ٣٣٣ | 1140 | 0 | 0 | 840 | ٦٣٣ |
| المملكة المتحدة | 0 | ٢٣٥٨ | ٣٠١٠ | 0 | 0 | ٥٣٦٨ |
| الولايات المتحدة | 0 | 0 | ٣٨,٣١٢ | 0 | 0 | ٣٨,٣١٢ |
استطلاع سنوي حصل على بطاقة هدايا أو تعبئة رصيد موبايل بقيمة تقارب
عينات غير قائمة على الاحتمالية
لذا فإن التقديرات الموزونة تمثل تقريبًا السكان.
عينات احتمالية وغير احتمالية مجمعة
الأخلاقيات وسرية المستجيبين
تقريبها إلى أقرب درجة) ولغة التقييم. قد يتمكن الباحثون الأفراد الذين لديهم موافقة مناسبة من مجلس المراجعة المؤسسية من الوصول إلى مجموعة بيانات للاستخدام المقيد تحتوي على هذه الأنواع الأكثر حساسية من البيانات.
تقييم جودة البيانات بعد الجمع
إدارة الاستبيانات وجهًا لوجه وعبر الهاتف
لتقييم البيانات المجمعة بانتظام. استخدم محللو مراقبة الجودة والشركاء في البلاد هذه الأدوات لضمان أن المقابلات المكتملة كانت صالحة وملتزمة بالمنهجية. غطت المراجعات الشاملة في فترات العمل الميداني مجموعة من إجراءات مراقبة الجودة وهدفت إلى تحديد الأنماط المشبوهة في البيانات (مثل الشذوذ في مدة المقابلة، والموقع، واختيار الأسر، واختيار المشاركين). تم التحقيق في المقابلات المرفوعة والتحقق منها، وتمت إزالة الاستبيانات التي بها مشكلات جودة واستبدالها (عند الإمكان). في نهاية العمل الميداني، ضمنت المراجعة النهائية للبيانات من قبل جالوب صلاحية وموثوقية ودقة البيانات المجمعة. تم تقديم معدلات الاحتفاظ العامة لكل دولة بعد عدم الاستجابة وفحوصات الجودة في الجدول 3.
استبيان عبر الإنترنت
التعامل مع الاستجابات غير المتناسقة ظاهريًا
قد تحتوي مجموعة البيانات مع ذلك على استجابات غير متناسقة ظاهريًا. قد تكون الاستجابة غير المتناسقة ظاهريًا ناتجة عن أسباب متنوعة، مثل سوء تفسير السؤال من قبل المستجيب، أو فقدان مؤقت للاهتمام من قبل المستجيب، أو خطأ عرضي في إدخال البيانات من قبل المحاور، أو سبب آخر غير معروف لنا ولكنه منطقي داخليًا بالنسبة للمستجيب. من خلال اعتماد نهج شامل لمراقبة الجودة على مستوى الحالة، لا يتم استبعاد الحالة من مجموعة البيانات بسبب واحدة أو اثنتين من عدم التناسق في الاستجابة المتصورة. ستتطلب الحالة غير المتناسقة ظاهريًا عبء إثبات إضافي قبل أن يتم التخلص منها؛ وإلا فإن مثل هذا الإلغاء لديه القدرة على خلق عواقب غير مقصودة تتعلق بالإزالة غير المتناسبة لبعض أنواع المستجيبين. قد يواجه الباحثون، مع ذلك، استجابات تبدو غير متناسقة منطقيًا ولكن قد لا تزال استجابات صالحة من قبل المستجيب.
| البلد | المتغيرات المستخدمة | المصدر المستهدف | |||
| الأرجنتين | العمر × الجنس × المنطقة، التعليم، التوظيف | تعداد السكان والإسكان 2010، المعهد الوطني للإحصاءات والتعدادات (INDEC) | |||
| أستراليا | العمر × الجنس × المنطقة، العمر × الجنس × التعليم، العمر × الجنس × التوظيف | تعداد 2021، المكتب الأسترالي للإحصاءات | |||
| البرازيل | العمر، التعليم، المنطقة × الجنس | تعداد 2010، المعهد البرازيلي للجغرافيا والإحصاءات (IBGE) | |||
| مصر | العمر، التعليم، العمر × الجنس × المنطقة | تعداد 2017 | |||
| ألمانيا | العمر × الجنس × المنطقة، التعليم، التوظيف، العمر × الجنس × الحالة الاجتماعية | يوروستات 2021؛ المكتب الفيدرالي للإحصاء 2019 | |||
| هونغ كونغ | العمر × الجنس × المنطقة، العمر × الجنس × التعليم | بيانات 2022 من إدارة الإحصاءات والتعدادات في هونغ كونغ | |||
| الهند | العمر × الجنس × المنطقة، العمر × الجنس × التعليم، العمر × الجنس × الدين، العمر × الجنس × التحضر | تعداد الهند 2011، مكتب المسجل العام ومفوض التعداد، الهند | |||
| إندونيسيا | العمر × الجنس × المنطقة، التعليم | تعداد السكان في إندونيسيا 2020 وتعداد 2010، المكتب الوطني للإحصاءات | |||
| إسرائيل | العمر × الجنس × المنطقة، العمر × الجنس × الحالة الاجتماعية، العمر × الجنس × التعليم × العرق، الجنس × الإثنية × التوظيف | السنة الإحصائية 2023 | |||
| اليابان | التعليم، المنطقة، العمر × الجنس × المنطقة × التوظيف، العمر × الجنس × المنطقة × الحالة الاجتماعية | تعداد السكان 2020 | |||
| كينيا | العمر × الجنس × المنطقة، التعليم | تعداد السكان والإسكان في كينيا 2019، المكتب الوطني للإحصاءات في كينيا | |||
| المكسيك | العمر × الجنس × التوظيف، الجنس × التعليم × المنطقة | تعداد السكان 2020، المكتب الوطني للإحصاءات في المكسيك (INEGI) | |||
| نيجيريا | العمر، الجنس، التعليم، المنطقة، الملحق الرئيسي (هل لديك أي وصول إلى الخط الثابت، الهاتف المحمول، الإنترنت مقابل لا) | DHS 2018 | |||
| الفلبين | العمر × الجنس × التعليم، العمر × الجنس × المنطقة، العمر | تعداد السكان والإسكان في الفلبين 2020، هيئة الإحصاءات في الفلبين | |||
| بولندا | العمر × الجنس × المنطقة، العمر × الجنس × التوظيف، التعليم | يوروستات 2021 والمكتب الإحصائي المركزي في بولندا، 2019 | |||
| جنوب أفريقيا | العمر × الجنس، العمر × المنطقة، التعليم | تعداد الولايات المتحدة، IDB 2022 وDHS 2016 | |||
| إسبانيا | العمر × الجنس × المنطقة، العمر × الجنس × التعليم، العمر × الجنس × التوظيف، العمر × الجنس × الحالة الاجتماعية | يوروستات 2021 وتعداد السكان والإسكان 2021 | |||
| السويد | العمر × الجنس، التعليم، المنطقة | تقديرات السكان لعام 2018، إحصاءات السويد | |||
| تنزانيا | العمر × الجنس × المنطقة، العمر × الجنس × التعليم | تعداد 2022 وDHS 2022 | |||
| تركيا | العمر × الجنس، التعليم، المنطقة، التوظيف، الحالة الاجتماعية | نظام تسجيل السكان القائم على العنوان، 2022؛ قاعدة بيانات إحصاءات التعليم الوطنية 2008-2022؛ مسح قوة العمل الأسرية اعتبارًا من يناير 2021؛ تعداد السكان والإسكان 2021، تركستات | |||
| المملكة المتحدة | العمر × الجنس × المنطقة، التعليم، العمر × الجنس × التوظيف | تعداد إنجلترا وويلز 2021، تعداد أيرلندا الشمالية 2021، السجلات الوطنية لاسكتلندا – تقديرات منتصف العام للسكان 2021 | |||
| الولايات المتحدة |
|
استطلاع المجتمع الأمريكي 2021 تقديرات لمدة 5 سنوات |
الوزن وتأثيرات التصميم
حدثت المعايرة على الوزن الأولي عندما تم تعديل طبقة إضافية من التصنيف بعد الاستجابة لعدم الاستجابة في الاستبيان السنوي. تطابقت جميع تعديلات عدم الاستجابة / التصنيف بعد الاستجابة مع المتغيرات بناءً على التوزيع الهامشي لكل خاصية مطابقة. الدول التي تم استخدام أهداف سكانية مصنفة بشكل أكثر تفصيلاً فيها موضحة في الجدول 3. يمكن تصنيف الطرق المستخدمة لوزن استبيانات الاستقبال إلى ثلاثة نهج رئيسية بناءً على نوع مصادر العينات.
النهج 1: عينات احتمالية فقط
احتمالية الإدراج، ولكن مع اختلاف طفيف في إطار العينة. الطريقة العامة المستخدمة عبر الدول لبناء أوزان العينة الأساسية بافتراض تصميم من مرحلة واحدة هي
حيث
حيث
الاعتبار فقط التباين في الأوزان). لغرض معايرة الوزن، تم قياس تأثير التصميم بواسطة التباين في الأوزان حيث كانت تأثيرات التصميم المفضلة أقل من 2.
حيث
deff
deff
تم الإبلاغ عن تأثيرات التصميم المرتبطة بكل دولة في الجدول 4. تم تقدير تأثير تصميم إجمالي لكل دولة وتأثير تصميم محدد لكل طريقة لجمع البيانات للاستبيان السنوي (استبيان ويب، فترة الهاتف، ووجهًا لوجه لعينة نيجيرية فرعية). في جميع الدول باستثناء دولة واحدة (الولايات المتحدة) كان تأثير التصميم الإجمالي في أقصى حد 2.0، وفي الولايات المتحدة، كان تأثير التصميم 5.49.
ملاحظة حول العينة النيجيرية. في نيجيريا وحدها، تم تقسيم عينة الاستقبال إلى جزئين – واحد لتغطية الأسر التي لديها أفراد لديهم وصول إلى خط أرضي، هاتف محمول، أو الإنترنت، وعدد قليل من PSUs لتمثيل الأفراد الذين يعيشون في أسر لا تملك وصولاً إلى خط أرضي، هاتف محمول، أو الإنترنت. كل عينة
| الدولة | ويب | هاتف | الإجمالي |
| الأرجنتين | 2.01 | 1.87 | 1.99 |
| أستراليا | 1.58 | – | 1.58 |
| البرازيل | 1.81 | 1.50 | 1.79 |
| مصر | 1.46 | 1.44 | 1.44 |
| ألمانيا | 1.65 | – | 1.65 |
| هونغ كونغ | 1.93 | – | 1.93 |
| الهند | 1.55 | 1.43 | 1.43 |
| إندونيسيا | 1.52 | 1.61 | 1.59 |
| إسرائيل | 1.42 | 1.31 | 1.34 |
| اليابان | 1.38 | 1.29 | 1.38 |
| كينيا | 1.42 | 1.49 | 1.48 |
| المكسيك | 1.77 | 1.47 | 1.68 |
| نيجيريا* | 1.59 | 1.93 | 1.97 |
| الفلبين | 1.53 | 1.57 | 1.56 |
| بولندا | 1.91 | 1.83 | 1.91 |
| جنوب أفريقيا | 1.52 | 1.77 | 1.71 |
| إسبانيا | 1.79 | – | 1.79 |
| السويد | 1.48 | – | 1.48 |
| تنزانيا | 1.45 | 1.50 | 1.50 |
| تركيا | 1.36 | 1.45 | 1.49 |
| المملكة المتحدة | 1.97 | – | 1.97 |
| الولايات المتحدة | 5.49 | – | 5.49 |
تم وزنها بشكل منفصل وتمت معالجتها لتتناسب مع السكان المستهدفين المقابلين. تم اشتقاق الأهداف للسكان الذين ليس لديهم وصول إلى الهاتف الثابت أو الهاتف المحمول من أحدث مسح ديموغرافي وصحي في نيجيريا [25]. تم دمج العينات الموزونة الناتجة حيث
النهج 2: عينات غير احتمالية فقط
تم سحبها من إطار احتمالي، لكن ذلك كان غير كافٍ لتقدير تلك العينة للسكان المستهدفين. لأغراض بناء الأوزان، تم التعامل مع جميع السجلات في اليابان كعينات غير احتمالية. نظرًا لأن احتمال الاختيار للدخول في العينة النهائية غير معروف، تم بناء أوزان عينة زائفة باستخدام وزن الميل [19، 26]. اعتمدت عينة السويد فقط على وزن الميل. استخدمت عينات هونغ كونغ واليابان وزنًا أساسيًا قدره 1 تلاه عملية تصحيح مع أهداف سكانية مفصلة (انظر الجدول 3). قدّر هذا النهج احتمال الدخول في إطار اللوحة وولد أوزان استجابة على مستوى المستجيب للتحليل اللاحق، انظر الصفحات 16-17 من [16].
المنطقة، العمر، الجنس، والحالة الاجتماعية، بالإضافة إلى التعليم والمحافظة.
النهج 3: مزيج من العينات الاحتمالية وغير الاحتمالية فقط
معدل الاستجابة
حيث
النسبة المقدرة للحالات ذات الأهلية غير المعروفة التي تكون مؤهلة، مع
حيث
نقاط القوة والقيود للموجة 1
| الدولة | نوع العينة | استطلاع التجنيد (الاستقبال) | استطلاع سنوي للموجة 1 | ||
| # كامل | معدل الاستجابة | # كامل | معدل الاستجابة | ||
| الأرجنتين | احتمالية | 9398 | 10.5 | 3879 | 41.3 |
| غير احتمالية | 2905 | أ | 2845 | 97.9 | |
| أستراليا | احتمالية | 5539 | 2.4 | 3377 | 61 |
| غير احتمالية | 677 | أ | 467 | 69 | |
| البرازيل | احتمالية | 10,257 | 13.3 | 3793 | 37 |
| غير احتمالية | 9437 | أ | 9411 | 99.7 | |
| مصر | احتمالية | 7500 | 55 | 4729 | 63.1 |
| ألمانيا | احتمالية | 10,941 | 2.5 | 4480 | 41 |
| غير احتمالية | 5141 | أ | 5026 | 97.8 | |
| هونغ كونغ (منطقة إدارية خاصة من الصين) | غير احتمالية | 3012 | أ | 3012 | 100 |
| الهند | احتمالية | 28,644 | 68.9 | 12,765 | 44.6 |
| إندونيسيا | احتمالية | 11,808 | ٥٤.٦ | 6992 | ٥٩.٢ |
| إسرائيل | احتمالية | ٥٥٠٧ | ٥٥.٨ | ٣٦٦٩ | 66.6 |
| اليابان | غير احتمالي | ٢٠٥٤٣ | أ | ٢٠٥٤٣ | 100 |
| كينيا | احتمالية | 14,993 | ٦٣.٧ | 11,389 | 76.1 |
| المكسيك | احتمالية | 9896 | ٢٠.٥ | 2672 | 27 |
| غير احتمالي | ٣٢٤٤ |
|
٣١٠٤ | 95.7 | |
| نيجيريا | احتمالية | 13,849 | 79.2 | 6827 | 49.3 |
| الفلبين | احتمالية | 13,995 | 42.6 | 5292 | 37.8 |
| بولندا | احتمالية | 11,013 | 71.1 | 8444 | ٧٦.٧ |
| غير احتمالي | ٣٢١٧ | أ | 1945 | 60.5 | |
| جنوب أفريقيا | احتمالية | 11,035 | 82 | ٢٦٥١ | ٢٤ |
| إسبانيا | احتمالية | 5446 | 3.6 | 2309 | 42.4 |
| غير احتمالي | ٤١١٧ |
|
٣٩٨١ | 96.7 | |
| السويد | غير احتمالي | 15,068 |
|
15,068 | 100 |
| تنزانيا | احتمالية | ١٠,٩٩٧ | 70.9 | 9075 | 82.5 |
| تركيا | احتمالية | 5414 | 19.2 | 1473 | ٢٧.٢ |
| المملكة المتحدة | احتمالية | 5380 | 1.8 | 2341 | ٤٣.٥ |
| غير احتمالي | ٣١٥٣ |
|
3027 | 96 | |
| الولايات المتحدة | احتمالية | ٣٨,٣١٢ |
|
٣٨,٣١٢ | 100 |
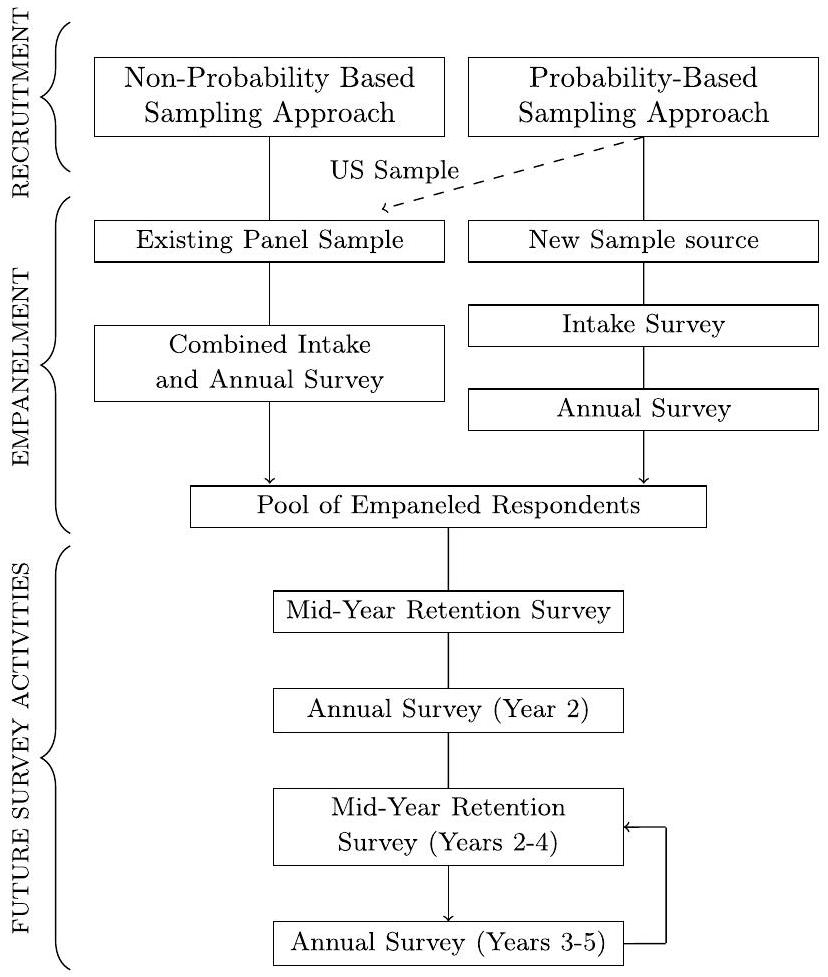
الموجات المستمرة والمستقبلية
بدلاً من ذلك في مسح الموجة 2. ستتم جمع بيانات الموجة 2 بعد حوالي عام من الموجة 1. سيتضمن الاستطلاع نفس مجموعة العناصر التي تم طرحها في الموجة 1، مما ينتج بيانات طولية يمكن استخدامها لتتبع التغيرات داخل الموضوع على مر الزمن. بالإضافة إلى ذلك، قد تتضمن الموجات اللاحقة من GFS تجنيدًا إضافيًا لمجموعات جديدة حسبما يسمح التمويل.
الملاحظات الختامية
الالتزام بممارسات العلوم المفتوحة
الإعلانات
References
- VanderWeele TJ. On the promotion of human flourishing. PNAS. 2017;114:8148-56. https://doi.org/10.1073/pnas.1702996114.
- Lomas T, VanderWeele TJ. The garden and the orchestra: generative metaphors for conceptualizing the complexities of well-being. Int J Environ Res Public Health. 2022;19:14544. https://doi.org/ 10.3390/ijerph192114544.
- Lomas T. Making waves in the great ocean: a historical perspective on the emergence and evolution of wellbeing scholarship. J Posit Psychol. 2022;17:270-5. https://doi.org/10.1080/17439760. 2021.2016900.
- Henrich J, Heine SJ, Norenzayan A. Most people are not WEIRD. Nature. 2010;466:29. https://doi.org/10.1038/466029a.
- Ghai S. It’s time to reimagine sample diversity and retire the WEIRD dichotomy. Nat Hum Behav. 2021;5:971-2. https://doi. org/10.1038/s41562-021-01175-9.
- Wong PTP, Cowden RG. Accelerating the science and practice of psychology beyond WEIRD biases: enriching the landscape through Asian psychology. Front Psychol. 2022;13:1054519. https://doi.org/10.3389/fpsyg.2022.1054519.
- Höltge J, Cowden RG, Lee MT, Bechara AO, Joynt S, Kamble S, Khalanskyi VV, Shtanko L, Kurniati NMT, Tymchenko S, Voytenko VL, McNeely E, VanderWeele TJ. A systems perspective on human flourishing: exploring cross-country similarities and differences of a multisystemic flourishing network. J Posit Psychol. 2022;18:695-710. https://doi.org/10.1080/17439760. 2022.2093784.
- Johnson BR, Ritter Z, Fogleman A, Markham L, Stankov T, Srinivasan R, Honohan J, Ripley A, Philips T, Wang H, VanderWeele TJ. The Global Flourishing Study; 2024. https://doi.org/10.17605/ OSF.IO/3JTZ8
- Ritter Z, Srinivasan R, Han Y, Chattopadhyay M, Honohan J, Johnson BR, VanderWeele TJ. Global Flourishing Study methodology. Gallup Inc.; 2024. [Retrieved on [2024-05-10] from https:// osf.io/k2s7u].
- Crabtree S, English C, Johnson BR, Ritter Z, VanderWeele TJ. Global Flourishing Study: Questionnaire Development report. Gallup Inc; 2021. [Retrieved on [2024-05-10] from https://osf.io/ y3t6m]
- Lomas T, Cowden RG, Case B, Fogelman A, Johnson BR, VanderWeele TJ. The development of the Global Flourishing Study survey: charting the evolution of a new 109-Item inventory of
human flourishing. in prep/under review (to be part of the Nature-Springer-BMC Special Collection). - Wickham H. ggplot2: elegant graphics for data analysis. New York: Springer; 2016.
- R Core Team. R: A language and environment for statistical computing. R Foundation for Statistical Computing; 2024. https:// www.R-project.org.
- Mohler P, Dorer B, de Jong J, Hu M. Cross-cultural survey guidelines. 2016. [Retrieved on [2024-05-06] from https://ccsg.isr. umich.edu/chapters/translation/overview/]
- Ritter Z, Markham L, Tyner A, Stankov T, Wang H, Call M, Olson EL, Staller A, Johnson BR, Fogleman A, Ripley A, Phillips T, Srinivasan R, Honohan J, VanderWeele TJ. GFS Translation Document. Center For Open Science; 2024. [Retrieved on [2024-05-06] from https://osf.io/d4qw8].
- McPhee C, Barlas F, Brigham N, Darling J, Dutwin D, Jackson C, Jackson M, Kirzinger A, Little R, Lorenz E, Marlar J, Mercer A, Scanlon PJ, Weiss S, Wronski L. Data quality metrics for online samples, Considerations for study design and analysis. American Association for Public Opinion Research; 2022. [Retrieve on [2024-05-07] from https://aapor.org/wp-content/uploads/2023/02/ Task-Force-Report-FINAL.pdf].
- Edwards JR. Response invalidity in empirical research: causes, detection, and remedies. J Oper Manag. 2019;65:62-76. https:// doi.org/10.1016/j.jom.2018.12.002.
- Greszki R, Meyer M, Schoen H. The impact of speeding on data quality in nonprobability and freshly recruited probability-based online panels. In: Callegaro M, Baker R, Bethlehem J, Goritz AS, Krosnick JA, Lavrakas PJ, editors. Online panel research: a data quality perspective. Hoboken: Wiley; 2014.
- Elliott MR, Valliant R. Inference for nonprobability samples. Stat Sci. 2017;32:249-64.
- Frankel MR, Battaglia MP, Link M, Mokdad AH. Integrating cell phone numbers into Random Digit-Dialed (RDD) landline surveys. In: ASA Proceedings of the Social Statistics Section. 2007; 3793-800. http://www.asasrms.org/Proceedings/y2007/ Files/JSM2007-000200.pdf
- Waksberg J. Sampling methods for random digit dialing. J Am Stat Assoc. 1978;73:40-6. https://doi.org/10.1080/01621459. 1978.10479995.
- Valliant R, Dever JA, Kreuter F. Practical tools for designing and weighting survey samples. Cham: Springer; 2018.
- Kish L. Cumulating/combining population surveys. Surv Methodol. 1999;25:129-38.
- Kish L. Methods for design effects. J Off Stat. 1995;11:55-77.
- Demographic and Health Surveys Program. Nigeria-National Demographic and Health Data; 2023. [Retrieved from https://data. humdata.org/dataset/dhs-data-for-nigeria].
- Valliant R. Comparing alternatives for estimation from nonprobability samples. J Surv Stat Methodol. 2020;8:231-63.
- Wiśniowski A, Sakshaug J, Ruiz DAP, Blom A. Integrating probability and nonprobability samples for survey inference. J Surv Stat Methodol. 2020;8:120-47.
- Dever JA, Rafferty A, Valliant R. Internet surveys: Can statistical adjustments eliminate coverage bias? Surv Res Methods. 2008;2:47-62.
- Sakshaug JW, Wiśniowski A, Perez Ruiz DA, Blom AG. Supplementing small probability samples with nonprobability samples: a Bayesian approach. J Off Stat. 2019;35:629-53.
- American Association for Public Opinion Research (AAPOR). Standard definitions: final dispositions of case codes and outcome rates for surveys. 10th edition; 2023.
- Peytchev A. Consequences of survey nonresponse. Ann Am Acad Pol Soc Sci. 2013;645:88-111. https://doi.org/10.1177/00027 16212461748.
- Peytcheva E, Groves RM. Using variation in response rates of demographic subgroups as evidence of nonresponse bias in survey estimates. J Off Stat. 2009;25:193-201.
- Dutwin D, Buskirk T. Telephone sample surveys: Dearly beloved or nearly departed? Trends in survey errors in the era of declining response rates. J Surv Stat Methodol. 2021;9:353-80. https://doi. org/10.1093/jssam/smz044.
- Groves RM. Nonresponse rates and nonresponse bias in household surveys. Public Opin Q. 2006;70:646-75. https://doi.org/10.1093/ poq/nf1033.
- Groves RM, Peytcheva E. The impact of nonresponse rates on nonresponse bias: a meta-analysis. Public Opin Q. 2008;72:16789. https://doi.org/10.1093/poq/nfn011.
- Cowden RG, Skinstad D, Lomas T, Johnson BR, VanderWeele TJ. Measuring wellbeing in the Global Flourishing Study: insights from a cross-national analysis of cognitive interviews from 22 countries. Qual Quant. 2024. https://doi.org/10.1007/ s11135-024-01947-1.
- Tyler J. VanderWeele
tvanderw@hsph.harvard.edu
Department of Epidemiology, Harvard T.H. Chan School of Public Health, Boston, MA, USA 2 Human Flourishing Program, Harvard University, Cambridge, MA, USA
3 Gallup, Inc., Rockville, MD, USA
4 Gallup, Inc., Ellicott City, MD, USA
5 Gallup, Inc., Ossining, NY, USA
6 Gallup, Inc., San Mateo, CA, USA
7 Gallup, Inc., Princeton, NJ, USA
8 Institute for Studies of Religion, Department of Sociology, Baylor University, Waco, TX, USA
School of Public Policy, Pepperdine University, Malibu, CA, USA 10 Department of Biostatistics, Harvard T.H. Chan School of Public Health, MA, Boston, USA Face-to-face interviews used the computer-assisted personal interview (CAPI) system; Telephone interviews used the computer-assisted telephone interview (CATI) system; Web surveys used the computerassisted web interview (CAWI) system; and Nigerian face-to-face annual subsample is weighted to be representative of the population of Nigeria without access to a landline, mobile device, or internet Response rate for non-probability-based samples was not possible due to lack of information about sampling frame
DOI: https://doi.org/10.1007/s10654-024-01167-9
PMID: https://pubmed.ncbi.nlm.nih.gov/40146468
Publication Date: 2025-03-27
Survey sampling design in wave 1 of the Global Flourishing Study
© The Author(s) 2025
Abstract
The Global Flourishing Study (GFS) is an international collaboration to develop a publicly accessible data resource to promote global research on human flourishing. These data include over 200,000 participants from 22 geographically and culturally diverse countries and one territory designed to be nationally representative of the adult population. The GFS is intended as a longitudinal panel study with recruitment and empanelment for Wave 1 occurring between April 2022 and December 2023. Future waves of data collection will invite participants to complete a survey annually. The annual survey covers a robust set of measures on well-being, health, social, economic, political, religious, spiritual, psychological and demographic variables. The current paper describes the sampling methodology and weighting approaches used to project the samples to be nationally representative. Details are provided on interviewer training and data collection, probability and non-probability samples, creating weights, design effects, and future data collection stages.
Introduction
flourishing in various parts of the world. The study is the largest of its kind, with more 200,000 participants across a culturally and geographically diverse set of countries included in Wave 1 (see Fig. 1). The current paper contributes to the dissemination and open-science commitment of the GFS by providing an overview of the survey development process for the study, a summary of the sampling design, population coverage, weighting approach, response rates, and design effects for Wave 1 , and plans for future waves of data collection. The description of the sampling methods and study design are adapted from the methodology report developed by Gallup Inc. [9] and the survey development process reported by Gallup Inc. [10] and Lomas et al. [11].
Global Flourishing Study overview
Survey development
instrument using best practices for web survey design to minimize item non-response, illogical responses and incomplete responses; and (8) confirmation by scholars in several participating countries that translations accurately captured the intended meaning of each question. Further details about the survey development process of the GFS survey can be found in [10,11].
Content coverage of the survey
Translation
Interviewer training
collection. Fieldwork teams were assisted by a standardized training manual to ensure consistency and structure. Interviewer training included the following topics: research ethics; protecting participants’ confidentiality; staying safe while in the field; starting the interview; reading survey questions verbatim; handling questions from participants; closed-end and open-end items; skip patterns; interviewing best practices, including probing; respondent selection; household selection and substitution (for face-to-face surveys); and quality control procedures. Field teams trained using the computer-assisted personal interview (CAPI) system for face-to-face interviews and the computer-assisted telephone interview (CATI) system for telephone interviews, which were employed during fieldwork. These systems ease interviewer burden and facilitate accurate data capture for items such as participant selection in the household, contact data, and skip patterns.
Sampling design and data collection
mainland China will be part of the second dataset release in March 2025.
Probability-based samples
| Country | Sampling design | Dates of collection | # Participants | Total sample size |
| Argentina | Probability | 11/29/22-11/30/23 | 3879 | 6724 |
| Non-probability | 04/11/23-11/14/23 | 2845 | ||
| Australia | Probability | 03/21/22-09/26/23 | 3377 | 3844 |
| Non-probability | 04/12/23-09/29/23 | 467 | ||
| Brazil | Probability | 11/23/22-11/26/23 | 3793 | 13,204 |
| Non-probability | 04/11/23-11/07/23 | 9411 | ||
| Egypt | Probability | 03/09/23-09/17/23 | 4729 | 4729 |
| Germany | Probability | 08/11/22-11/16/23 | 4480 | 9506 |
| Non-probability | 06/12/23-08/27/23 | 5026 | ||
| Hong Kong (S.A.R. of China) | Non-probability | 10/10/23-11/24/23 | 3012 | 3012 |
| India | Probability | 04/25/23-12/08/23 | 12,765 | 12,765 |
| Indonesia | Probability | 11/07/22-10/27/23 | 6992 | 6992 |
| Israel | Probability | 11/07/22-11/23/23 | 3669 | 3669 |
| Japan | Non-probability | 12/13/22-06/30/23 | 20,543 | 20,543 |
| Kenya | Probability | 04/13/23-11/21/23 | 11,389 | 11,389 |
| Mexico | Probability | 10/29/22-12/13/23 | 2672 | 5776 |
| Non-probability | 05/09/23-11/20/23 | 3104 | ||
| Nigeria | Probability | 05/16/23-11/17/23 | 6827 | 6827 |
| Philippines | Probability | 04/04/23-01/05/24 | 5292 | 5292 |
| Poland | Probability | 12/14/22-10/13/23 | 8444 | 10,389 |
| Non-probability | 06/10/23-10/16/23 | 1945 | ||
| South Africa | Probability | 02/26/23-12/08/23 | 2651 | 2651 |
| Spain | Probability | 08/17/22-11/08/23 | 2309 | 6290 |
| Non-probability | 06/22/23-08/30/23 | 3981 | ||
| Sweden | Non-probability | 01/16/23-02/22/23 | 15,068 | 15,068 |
| Tanzania | Probability | 02/17/23-11/30/23 | 9075 | 9075 |
| Turkey | Probability | 04/15/23-01/05/24 | 1473 | 1473 |
| United Kingdom | Probability | 04/26/22-11/20/23 | 2341 | 5368 |
| Non-probability | 06/12/23-08/30/23 | 3027 | ||
| United States | Probability | 08/04/22-04/04/23 | 38,312 | 38,312 |
contact attempts were made at varying days of the week and times of day (up to three contact attempts).
or older for interviews completed over telephone. Interviewers attempted contact over several different days and times, with at least five attempts at contact, to reach the intended participants to complete the interview. When successful contact was made, the telephone intake interview was aided by a computer assisted telephone interview (CATI) system, which was also used to help guide interviewers through the annual survey to maintain valid skip logic when necessary.
| Country | Recruitment (Intake) survey | Wave 1 annual survey | ||||
| Face-to-face
|
Telephone
|
Web
|
Face-to-face
|
Telephone
|
Web
|
|
| Argentina | 1152 | 2788 | 2784 | 0 | 1451 | 5273 |
| Australia | 0 | 3844 | 0 | 0 | 0 | 3844 |
| Brazil | 859 | 2948 | 9397 | 0 | 1265 | 11,939 |
| Egypt | 4729 | 0 | 0 | 0 | 4508 | 221 |
| Germany | 0 | 4504 | 5002 | 0 | 0 | 9506 |
| Hong Kong (S.A.R. of China) | 0 | 0 | 3012 | 0 | 0 | 3012 |
| India | 12,765 | 0 | 0 | 0 | 12,549 | 216 |
| Indonesia | 6139 | 853 | 0 | 0 | 3620 | 3372 |
| Israel | 3669 | 0 | 0 | 0 | 2743 | 926 |
| Japan | 0 | 542 | 20,001 | 0 | 542 | 20,001 |
| Kenya | 11,389 | 0 | 0 | 0 | 9917 | 1472 |
| Mexico | 1250 | 1535 | 2991 | 0 | 1559 | 4217 |
| Nigeria | 6827 | 0 | 0 |
|
5609 | 668 |
| Philippines | 4620 | 672 | 0 | 0 | 4174 | 1118 |
| Poland | 8444 | 1945 | 0 | 0 | 625 | 9764 |
| South Africa | 2651 | 0 | 0 | 0 | 2010 | 641 |
| Spain | 0 | 2339 | 3951 | 0 | 0 | 6290 |
| Sweden | 0 | 0 | 15,068 | 0 | 0 | 15,068 |
| Tanzania | 9075 | 0 | 0 | 0 | 8790 | 285 |
| Turkey | 333 | 1140 | 0 | 0 | 840 | 633 |
| United Kingdom | 0 | 2358 | 3010 | 0 | 0 | 5368 |
| United States | 0 | 0 | 38,312 | 0 | 0 | 38,312 |
annual survey received a gift card or mobile top-up worth roughly
Non-probability based samples
so that weighted estimates are approximately representative of the population.
Combined probability and non-probability samples
Ethics and respondent confidentiality
rounded to the nearest degree) and language of assessment. Individual researchers with appropriate institutional review board approval may be able to access a restricted use dataset that contain these more sensitive types of data.
Post-collection data quality evaluation
Face-to-face and telephone survey administration
tools for regularly evaluating collected data. Quality control analysts and in-country partners used these tools to ensure that completed interviews were valid and adhered to the methodology. Holistic reviews at regular fieldwork intervals covered a range of quality control procedures and aimed to identify suspicious patterns in the data (e.g., anomalies in interview duration, location, household selection, and participant selection). Flagged interviews were further investigated and validated, and surveys with quality issues were removed and replaced (when possible). At the end of fieldwork, final data vetting by Gallup ensured the validity, reliability, and accuracy of the collected data. The overall retention rates for each country after non-response and quality checks are provided Table 3.
Online survey
Handling seemingly inconsistent responses
the dataset may nevertheless may contain seemingly inconsistent responses. A seemingly inconsistent response could be due to various reasons, such as misinterpretation of question by the respondent, temporary loss of attention by respondent, accidental data entry error by the interviewer, or another reason that is unknown to us but is internally logically consistent for the respondent. Adopting a holistic approach to quality control at the case level, a case is not thrown out of the dataset due to one or two perceived response inconsistencies. An ostensibly inconsistent case would require additional burden of proof before being discarded; otherwise such discarding has the potential to create unintended consequences related to disproportionate removal of certain types of respondents. Researchers may, however, still come across responses that seem logically inconsistent but may still be valid responses by the respondent.
| Country | Variables used | Target source | |||
| Argentina | Age × Gender × Region, Education, Employment | Population and Housing Census 2010, National Institute of Statistics and Censuses (INDEC) | |||
| Australia | Age × Gender × Region, Age × Gender × Education, Age × Gender × Employment | 2021 Census, Australian Bureau of Statistics | |||
| Brazil | Age, Education, Region × Gender | 2010 Census, Brasilian Institute of Geography and Statistics (IBGE) | |||
| Egypt | Age, Education, Age × Gender × Region | Census 2017 | |||
| Germany | Age × Gender × Region, Education, Employment, Age × Gender × Marital | Eurostat 2021; Federal Statistical Office 2019 | |||
| Hong Kong | Age × Gender × Region, Age × Gender × Education | 2022 data from Census and Statistics Department of Hong Kong | |||
| India | Age × Gender × Region, Age × Gender × Education, Age × Gender × Religion, Age × Gender × Urbanicity | India Census 2011, Office of the Registrar General & Census Commissioner, India | |||
| Indonesia | Age × Gender × Region, Education | Indonesia Population Census 2020 and Census 2010, National Bureau of Statistics | |||
| Israel | Age × Gender × Region, Age × Gender × Marital, Age × Gender× Education × Race, Gender × Ethnicity × Employment | Statistical Yearbook 2023 | |||
| Japan | Education, Region, Age × Sex × Region × Employment, Age × Sex × Region × Marital Status | 2020 Population Census | |||
| Kenya | Age × Gender × Region, Education | Kenya Population and Housing Census 2019, Kenya National Bureau of Statistics | |||
| Mexico | Age × Gender × Employment, Gender × Education × Region | Population Census 2020, Mexico’s National Bureau of Statistics (INEGI) | |||
| Nigeria | Age, Gender, Education, Region, Main Supplement (have any access to landline, mobile, internet vs not) | DHS 2018 | |||
| Philippines | Age × Gender × Education, Age × Gender × Region, Age | Philippines Population and Housing Census 2020, Philippines Statistics Authority | |||
| Poland | Age × Gender × Region, Age × Gender × Employment, Education | Eurostat 2021 and Central Statistical Office of Poland, 2019 | |||
| South Africa | Age × Gender, Age × Region, Education | U.S. Census, IDB 2022 and DHS 2016 | |||
| Spain | Age × Gender × Region, Age × Gender × Education, Age × Gender × Employment, Age × Gender × Marital | Eurostat 2021 and Population and Housing Census 2021 | |||
| Sweden | Age × Gender, Education, Region | 2018 population estimates, Statistics Sweden | |||
| Tanzania | Age × Gender × Region, Age × Gender × Education | Census 2022 and DHS 2022 | |||
| Turkey | Age × Gender, Education, Region, Employment, Marital Status | Address Based Population Registration System, 2022; National Education Statistics Database 2008-2022; Household Labour Force Survey as of January 2021; Population and Housing Census 2021, TurkStat | |||
| United Kingdom | Age × Gender × Region, Education, Age × Gender × Employment | England and Wales Census 2021, Northern Ireland Census 2021, National Records of Scotland-Mid Year Population Estimates 2021 | |||
| United States |
|
American Community Survey 2021 5-year estimates |
Weighting and design effects
calibration on the initial weight occurred when an additional layer of post-stratification was adjusted for non-response on the annual survey. All non-response/post-stratification adjustments matched variables based on the marginal distribution of each matching characteristic. Countries where more detailed cross-classified population targets were used are shown in Table 3. The methods used for weighting intake surveys can be grouped into three main approaches based on the type of sample sources.
Approach 1: Probability samples only
probability of inclusion, but with a slightly difference in sampling frame. The general method used across countries to construct the base sampling weights assuming a single stage design is
where
where
sideration just the variability in weights). For the purpose of weight calibration, the design effect measured by variability in weights where preferred design effect were below 2 .
where
deff
deff
The design effects associated with each country are reported in Table 4. A total design effect was estimated for each country and a design effect specific to each mode of data collection for the annual survey (web survey, telephone interval, and face-to-face for Nigerian subsample). In all but one country (the United States) the total design effect was at most 2.0, and in the United States, the design effect was 5.49.
A note on the Nigerian sample. In Nigeria alone, the intake sample was split into two parts-one to cover households with individuals having access to a landline, mobile phone, or the internet, and a small number of PSUs to represent individuals living in households that do not have access to a landline, mobile phone, or the internet. Each sample
| Country | Web | Telephone | Total |
| Argentina | 2.01 | 1.87 | 1.99 |
| Australia | 1.58 | – | 1.58 |
| Brazil | 1.81 | 1.50 | 1.79 |
| Egypt | 1.46 | 1.44 | 1.44 |
| Germany | 1.65 | – | 1.65 |
| Hong Kong | 1.93 | – | 1.93 |
| India | 1.55 | 1.43 | 1.43 |
| Indonesia | 1.52 | 1.61 | 1.59 |
| Israel | 1.42 | 1.31 | 1.34 |
| Japan | 1.38 | 1.29 | 1.38 |
| Kenya | 1.42 | 1.49 | 1.48 |
| Mexico | 1.77 | 1.47 | 1.68 |
| Nigeria* | 1.59 | 1.93 | 1.97 |
| Philippines | 1.53 | 1.57 | 1.56 |
| Poland | 1.91 | 1.83 | 1.91 |
| South Africa | 1.52 | 1.77 | 1.71 |
| Spain | 1.79 | – | 1.79 |
| Sweden | 1.48 | – | 1.48 |
| Tanzania | 1.45 | 1.50 | 1.50 |
| Turkey | 1.36 | 1.45 | 1.49 |
| United Kingdom | 1.97 | – | 1.97 |
| United States | 5.49 | – | 5.49 |
was weighted separately and projected to the corresponding target population. Targets for the population without access to landline or a mobile phone were derived from the latest Demographic and Health Survey in Nigeria [25]. The resulting weighted samples were combined where
Approach 2: Non-probability samples only
was drawn from a probability frame, but it was insufficient to project that sample to the target population. For the purposes of constructing weights, all records in Japan were treated as non-probability samples. Since the selection probability of inclusion in the final sample is unknown, pseudo-base sampling weights were constructed using propensity weighting [19, 26]. The Sweden sample relied solely on propensity weighting. Hong Kong and Japan samples utilized a baseweight of 1 followed up with raking with detailed population targets (see Table 3). This approach estimated the probability of inclusion in the panel frame and generated respondentlevel survey weights for subsequent analysis, see pg. 16-17 of [16].
region, age, gender, and marital status, in addition to education and prefecture.
Approach 3: A combination of probability and non-probability samples only
Response rate
where
the estimated proportion of cases with unknown eligibility that are eligible, with
where
Strengths and limitations of wave 1
| Country | Sample-type | Recruitment (Intake) survey | Wave 1 Annual survey | ||
| # Complete | Response rate | # Complete | Response rate | ||
| Argentina | Probability | 9398 | 10.5 | 3879 | 41.3 |
| Non-probability | 2905 | a | 2845 | 97.9 | |
| Australia | Probability | 5539 | 2.4 | 3377 | 61 |
| Non-probability | 677 | a | 467 | 69 | |
| Brazil | Probability | 10,257 | 13.3 | 3793 | 37 |
| Non-probability | 9437 | a | 9411 | 99.7 | |
| Egypt | Probability | 7500 | 55 | 4729 | 63.1 |
| Germany | Probability | 10,941 | 2.5 | 4480 | 41 |
| Non-probability | 5141 | a | 5026 | 97.8 | |
| Hong Kong (S.A.R. of China) | Non-probability | 3012 | a | 3012 | 100 |
| India | Probability | 28,644 | 68.9 | 12,765 | 44.6 |
| Indonesia | Probability | 11,808 | 54.6 | 6992 | 59.2 |
| Israel | Probability | 5507 | 55.8 | 3669 | 66.6 |
| Japan | Non-probability | 20,543 | a | 20,543 | 100 |
| Kenya | Probability | 14,993 | 63.7 | 11,389 | 76.1 |
| Mexico | Probability | 9896 | 20.5 | 2672 | 27 |
| Non-probability | 3244 |
|
3104 | 95.7 | |
| Nigeria | Probability | 13,849 | 79.2 | 6827 | 49.3 |
| Philippines | Probability | 13,995 | 42.6 | 5292 | 37.8 |
| Poland | Probability | 11,013 | 71.1 | 8444 | 76.7 |
| Non-probability | 3217 | a | 1945 | 60.5 | |
| South Africa | Probability | 11,035 | 82 | 2651 | 24 |
| Spain | Probability | 5446 | 3.6 | 2309 | 42.4 |
| Non-probability | 4117 |
|
3981 | 96.7 | |
| Sweden | Non-probability | 15,068 |
|
15,068 | 100 |
| Tanzania | Probability | 10,997 | 70.9 | 9075 | 82.5 |
| Turkey | Probability | 5414 | 19.2 | 1473 | 27.2 |
| United Kingdom | Probability | 5380 | 1.8 | 2341 | 43.5 |
| Non-probability | 3153 |
|
3027 | 96 | |
| United States | Probability | 38,312 |
|
38,312 | 100 |
Ongoing and future waves
instead in the Wave 2 survey. Wave 2 data collection will occur roughly one year following Wave 1 . The survey will include the same set of items fielded in Wave 1, producing longitudinal data that can be used to track within-subject changes over time. Additionally, subsequent waves of the GFS may include additional recruitment of new cohorts as funding permits.
Concluding remarks
Commitment to open science practices
Declarations
References
- VanderWeele TJ. On the promotion of human flourishing. PNAS. 2017;114:8148-56. https://doi.org/10.1073/pnas.1702996114.
- Lomas T, VanderWeele TJ. The garden and the orchestra: generative metaphors for conceptualizing the complexities of well-being. Int J Environ Res Public Health. 2022;19:14544. https://doi.org/ 10.3390/ijerph192114544.
- Lomas T. Making waves in the great ocean: a historical perspective on the emergence and evolution of wellbeing scholarship. J Posit Psychol. 2022;17:270-5. https://doi.org/10.1080/17439760. 2021.2016900.
- Henrich J, Heine SJ, Norenzayan A. Most people are not WEIRD. Nature. 2010;466:29. https://doi.org/10.1038/466029a.
- Ghai S. It’s time to reimagine sample diversity and retire the WEIRD dichotomy. Nat Hum Behav. 2021;5:971-2. https://doi. org/10.1038/s41562-021-01175-9.
- Wong PTP, Cowden RG. Accelerating the science and practice of psychology beyond WEIRD biases: enriching the landscape through Asian psychology. Front Psychol. 2022;13:1054519. https://doi.org/10.3389/fpsyg.2022.1054519.
- Höltge J, Cowden RG, Lee MT, Bechara AO, Joynt S, Kamble S, Khalanskyi VV, Shtanko L, Kurniati NMT, Tymchenko S, Voytenko VL, McNeely E, VanderWeele TJ. A systems perspective on human flourishing: exploring cross-country similarities and differences of a multisystemic flourishing network. J Posit Psychol. 2022;18:695-710. https://doi.org/10.1080/17439760. 2022.2093784.
- Johnson BR, Ritter Z, Fogleman A, Markham L, Stankov T, Srinivasan R, Honohan J, Ripley A, Philips T, Wang H, VanderWeele TJ. The Global Flourishing Study; 2024. https://doi.org/10.17605/ OSF.IO/3JTZ8
- Ritter Z, Srinivasan R, Han Y, Chattopadhyay M, Honohan J, Johnson BR, VanderWeele TJ. Global Flourishing Study methodology. Gallup Inc.; 2024. [Retrieved on [2024-05-10] from https:// osf.io/k2s7u].
- Crabtree S, English C, Johnson BR, Ritter Z, VanderWeele TJ. Global Flourishing Study: Questionnaire Development report. Gallup Inc; 2021. [Retrieved on [2024-05-10] from https://osf.io/ y3t6m]
- Lomas T, Cowden RG, Case B, Fogelman A, Johnson BR, VanderWeele TJ. The development of the Global Flourishing Study survey: charting the evolution of a new 109-Item inventory of
human flourishing. in prep/under review (to be part of the Nature-Springer-BMC Special Collection). - Wickham H. ggplot2: elegant graphics for data analysis. New York: Springer; 2016.
- R Core Team. R: A language and environment for statistical computing. R Foundation for Statistical Computing; 2024. https:// www.R-project.org.
- Mohler P, Dorer B, de Jong J, Hu M. Cross-cultural survey guidelines. 2016. [Retrieved on [2024-05-06] from https://ccsg.isr. umich.edu/chapters/translation/overview/]
- Ritter Z, Markham L, Tyner A, Stankov T, Wang H, Call M, Olson EL, Staller A, Johnson BR, Fogleman A, Ripley A, Phillips T, Srinivasan R, Honohan J, VanderWeele TJ. GFS Translation Document. Center For Open Science; 2024. [Retrieved on [2024-05-06] from https://osf.io/d4qw8].
- McPhee C, Barlas F, Brigham N, Darling J, Dutwin D, Jackson C, Jackson M, Kirzinger A, Little R, Lorenz E, Marlar J, Mercer A, Scanlon PJ, Weiss S, Wronski L. Data quality metrics for online samples, Considerations for study design and analysis. American Association for Public Opinion Research; 2022. [Retrieve on [2024-05-07] from https://aapor.org/wp-content/uploads/2023/02/ Task-Force-Report-FINAL.pdf].
- Edwards JR. Response invalidity in empirical research: causes, detection, and remedies. J Oper Manag. 2019;65:62-76. https:// doi.org/10.1016/j.jom.2018.12.002.
- Greszki R, Meyer M, Schoen H. The impact of speeding on data quality in nonprobability and freshly recruited probability-based online panels. In: Callegaro M, Baker R, Bethlehem J, Goritz AS, Krosnick JA, Lavrakas PJ, editors. Online panel research: a data quality perspective. Hoboken: Wiley; 2014.
- Elliott MR, Valliant R. Inference for nonprobability samples. Stat Sci. 2017;32:249-64.
- Frankel MR, Battaglia MP, Link M, Mokdad AH. Integrating cell phone numbers into Random Digit-Dialed (RDD) landline surveys. In: ASA Proceedings of the Social Statistics Section. 2007; 3793-800. http://www.asasrms.org/Proceedings/y2007/ Files/JSM2007-000200.pdf
- Waksberg J. Sampling methods for random digit dialing. J Am Stat Assoc. 1978;73:40-6. https://doi.org/10.1080/01621459. 1978.10479995.
- Valliant R, Dever JA, Kreuter F. Practical tools for designing and weighting survey samples. Cham: Springer; 2018.
- Kish L. Cumulating/combining population surveys. Surv Methodol. 1999;25:129-38.
- Kish L. Methods for design effects. J Off Stat. 1995;11:55-77.
- Demographic and Health Surveys Program. Nigeria-National Demographic and Health Data; 2023. [Retrieved from https://data. humdata.org/dataset/dhs-data-for-nigeria].
- Valliant R. Comparing alternatives for estimation from nonprobability samples. J Surv Stat Methodol. 2020;8:231-63.
- Wiśniowski A, Sakshaug J, Ruiz DAP, Blom A. Integrating probability and nonprobability samples for survey inference. J Surv Stat Methodol. 2020;8:120-47.
- Dever JA, Rafferty A, Valliant R. Internet surveys: Can statistical adjustments eliminate coverage bias? Surv Res Methods. 2008;2:47-62.
- Sakshaug JW, Wiśniowski A, Perez Ruiz DA, Blom AG. Supplementing small probability samples with nonprobability samples: a Bayesian approach. J Off Stat. 2019;35:629-53.
- American Association for Public Opinion Research (AAPOR). Standard definitions: final dispositions of case codes and outcome rates for surveys. 10th edition; 2023.
- Peytchev A. Consequences of survey nonresponse. Ann Am Acad Pol Soc Sci. 2013;645:88-111. https://doi.org/10.1177/00027 16212461748.
- Peytcheva E, Groves RM. Using variation in response rates of demographic subgroups as evidence of nonresponse bias in survey estimates. J Off Stat. 2009;25:193-201.
- Dutwin D, Buskirk T. Telephone sample surveys: Dearly beloved or nearly departed? Trends in survey errors in the era of declining response rates. J Surv Stat Methodol. 2021;9:353-80. https://doi. org/10.1093/jssam/smz044.
- Groves RM. Nonresponse rates and nonresponse bias in household surveys. Public Opin Q. 2006;70:646-75. https://doi.org/10.1093/ poq/nf1033.
- Groves RM, Peytcheva E. The impact of nonresponse rates on nonresponse bias: a meta-analysis. Public Opin Q. 2008;72:16789. https://doi.org/10.1093/poq/nfn011.
- Cowden RG, Skinstad D, Lomas T, Johnson BR, VanderWeele TJ. Measuring wellbeing in the Global Flourishing Study: insights from a cross-national analysis of cognitive interviews from 22 countries. Qual Quant. 2024. https://doi.org/10.1007/ s11135-024-01947-1.
- Tyler J. VanderWeele
tvanderw@hsph.harvard.edu
Department of Epidemiology, Harvard T.H. Chan School of Public Health, Boston, MA, USA 2 Human Flourishing Program, Harvard University, Cambridge, MA, USA
3 Gallup, Inc., Rockville, MD, USA
4 Gallup, Inc., Ellicott City, MD, USA
5 Gallup, Inc., Ossining, NY, USA
6 Gallup, Inc., San Mateo, CA, USA
7 Gallup, Inc., Princeton, NJ, USA
8 Institute for Studies of Religion, Department of Sociology, Baylor University, Waco, TX, USA
School of Public Policy, Pepperdine University, Malibu, CA, USA 10 Department of Biostatistics, Harvard T.H. Chan School of Public Health, MA, Boston, USA Face-to-face interviews used the computer-assisted personal interview (CAPI) system; Telephone interviews used the computer-assisted telephone interview (CATI) system; Web surveys used the computerassisted web interview (CAWI) system; and Nigerian face-to-face annual subsample is weighted to be representative of the population of Nigeria without access to a landline, mobile device, or internet Response rate for non-probability-based samples was not possible due to lack of information about sampling frame