بريا راماكريشنا, فرانسيسكو م. غاميز-أرجونا, إتيان بيلاني, كريستينا مارتن-أولموس, ستيفان إسكرغ, داميان دي بيلليس, آنا دي لوكا, خوسيه م. باردو, فرانسيسكو ج. كوينتيرو, كريستيل جينود, كلارا سانشيز-رودريغيز, نيكو جيلدنر & أندرس ميبوم
تسبب زيادة ملوحة التربة في خسائر كبيرة في المحاصيل على مستوى العالم؛ لذلك، فإن فهم استجابات النباتات للإجهاد الناتج عن الملح (الصوديوم) هو أمر ذو أهمية كبيرة. تتجنب النباتات سمية الصوديوم من خلال تقسيمه إلى حُجرات خلوية عبر عمليات معقدة تتضمن مستوى عالٍ من الاعتماد المتبادل العنصري. التقنيات الحالية لتصور الصوديوم، على وجه الخصوص، مع عناصر أخرى، إما غير مباشرة أو تفتقر إلى الدقة. هنا استخدمنا مجهر الأيونات الثانوية البارد النانوي المطور حديثًا , الذي يسمح بتصوير العناصر بدقة عالية للعينات المحفوظة بالتبريد ويكشف التوزيعات الخلوية للعناصر الغذائية الرئيسية في خلايا القمة الجذرية من الأرابيدوبسيس والأرز. وجدنا تغييرًا غير متوقع، يعتمد على التركيز، في توزيع الصوديوم، حيث يتحول من تراكم الصوديوم في جدران الخلايا عند تركيزات صوديوم خارجية منخفضة إلى تراكم فجوي عند تركيزات مرهقة. نستنتج أنه، في القمم الجذرية، فإن الوظيفة الرئيسية لعائلة مضخات الصوديوم/البروتون NHX SALT OVERLY SENSITIVE1 (المعروفة أيضًا باسم المبادل 7؛ SOS1/NHX7) هي احتجاز الصوديوم في الفجوات، بدلاً من طرد الصوديوم إلى الفضاء الخارجي. يتم تأكيد ذلك من خلال استخدام متغيرات SOS1 الجديدة المميزة بالفلور. نظهر أنه، بالإضافة إلى غشاء البلازما، يتراكم SOS1 بشكل كبير في الإندوسومات المتأخرة/ما قبل الفجوات وكذلك الفجوات، مما يدعم دور SOS1 في احتجاز الصوديوم الفجوي.
تجمع الخلايا مجموعة محدودة من العناصر ضمن نطاق تركيزات محددة للحفاظ على أنشطتها الأيضية. لذا فإن النقل الانتقائي للعناصر عبر غشاء البلازما وإلى العضيات الخلوية المحددة هو أمر أساسي للحياة . لقد دفع هذا تطور شبكة معقدة من القنوات والناقلات التي تنظم ديناميكيًا اختلافات التركيز القوية مع المحيط، وكذلك داخل الخلايا بين الحُجرات الخلوية . في النباتات الأرضية، حتى الانحرافات الصغيرة نسبيًا عن التوازن العنصري يمكن أن يكون لها عواقب عميقة على وظيفة الكائنات الحية، بما في ذلك الفشل في النمو والتكاثر . معظم النباتات الزراعية حساسة جدًا لوجود الصوديوم في التربة (المشار إليه بإجهاد الملح)، مما يؤدي اليوم إلى خسارة سنوية تقدر بـ 20-40% (مرجع 6). الظروف التي تؤدي إلى إجهاد الملح تتفاقم بسبب تغير المناخ وبالتالي أصبحت مشكلة ملحة لسكان العالم المتزايد.
على الرغم من أهمية إزالة سمية الصوديوم لبقاء النباتات في التربة المالحة، فإن الجهود المبذولة للحصول على فهم آلي للتوازن العنصري والتكيف الخلوي مع إجهاد الملح قد تعثرت بسبب عدم القدرة على ملاحظة توزيعات العناصر بشكل مباشر
داخل الخلايا بدقة كافية. توفر المستشعرات الفلورية المشفرة جينيًا والأصباغ الخاصة بالعناصر قياسات غير مباشرة لعنصر واحد في كل مرة وغالبًا ما تكون مقيدة بحجرة خلوية محددة. يمكن أن تكون أيضًا محدودة في الحساسية أو النطاق الديناميكي. تفتقر تقنيات التحليل القائمة على مطيافية الكتلة أو الأشعة السينية، مثل مطيافية الكتلة بالتحليل الطيفي بالليزر (LA-ICP-MS)، أو مجهر الفلورسنت بالأشعة السينية أو التحليل الطيفي بالأشعة السينية المشتتة للطاقة إما إلى الدقة المكانية أو الحساسية للكشف عن توزيعات العناصر داخل الخلايا. علاوة على ذلك، تتطلب هذه عمومًا إعداد العينات الذي يتضمن التجفيف، مما يؤدي حتمًا إلى فقدان و/أو إعادة توزيع كبيرة للذائبات . بناءً على الأعمال السابقة , قمنا مؤخرًا بتطوير مجهر الأيونات الثانوية البارد النانوي (CryoNanoSIMS) الذي يتكامل مع سير عمل كامل التبريد، بما في ذلك تصوير مجهر الإلكترون الماسح بالتبريد (cryoSEM) للعينات الزجاجية. يسمح لنا هذا النهج الجديد بالحصول على خرائط عنصرية ونظيرية للأنسجة البيولوجية الزجاجية في حالتها الأكثر نقاءً مع حساسية غير مسبوقة، وكتلة ودقة صورة، ودون أي فقد أو إزاحة للمركبات القابلة للذوبان .
هنا قمنا بإجراء تصوير متزامن باستخدام cryoSEM وCryoNanoSIMS لتسليط الضوء على الآليات الخلوية التي تكمن وراء استجابة النباتات لإجهاد الملح (الشكل 1a-c). نستخدم قمم الجذر من الأرابيدوبسيس ثاليانا (الأرابيدوبسيس) كنموذج، ولكننا نوضح أيضًا قابلية تطبيق تقنيتنا على الأرز (Oryza sativa)، وهو محصول عالمي، حيث نؤكد نتائجنا الرئيسية. تحمل قمم الجذر مجموعات خلايا الجذعية الحيوية التي تنشأ منها جسم الجذر بالكامل. تستكشف مناطق جديدة من التربة ومن المحتمل أن تكون أول من يواجه، ويتعامل محليًا مع، تركيزات الصوديوم المفرطة. لذلك، فإن قدرة قمم الجذر على طرد أو تقسيم الصوديوم هي عامل رئيسي في قدرة النبات على الحفاظ على النمو عند ملوحة التربة المعطاة.
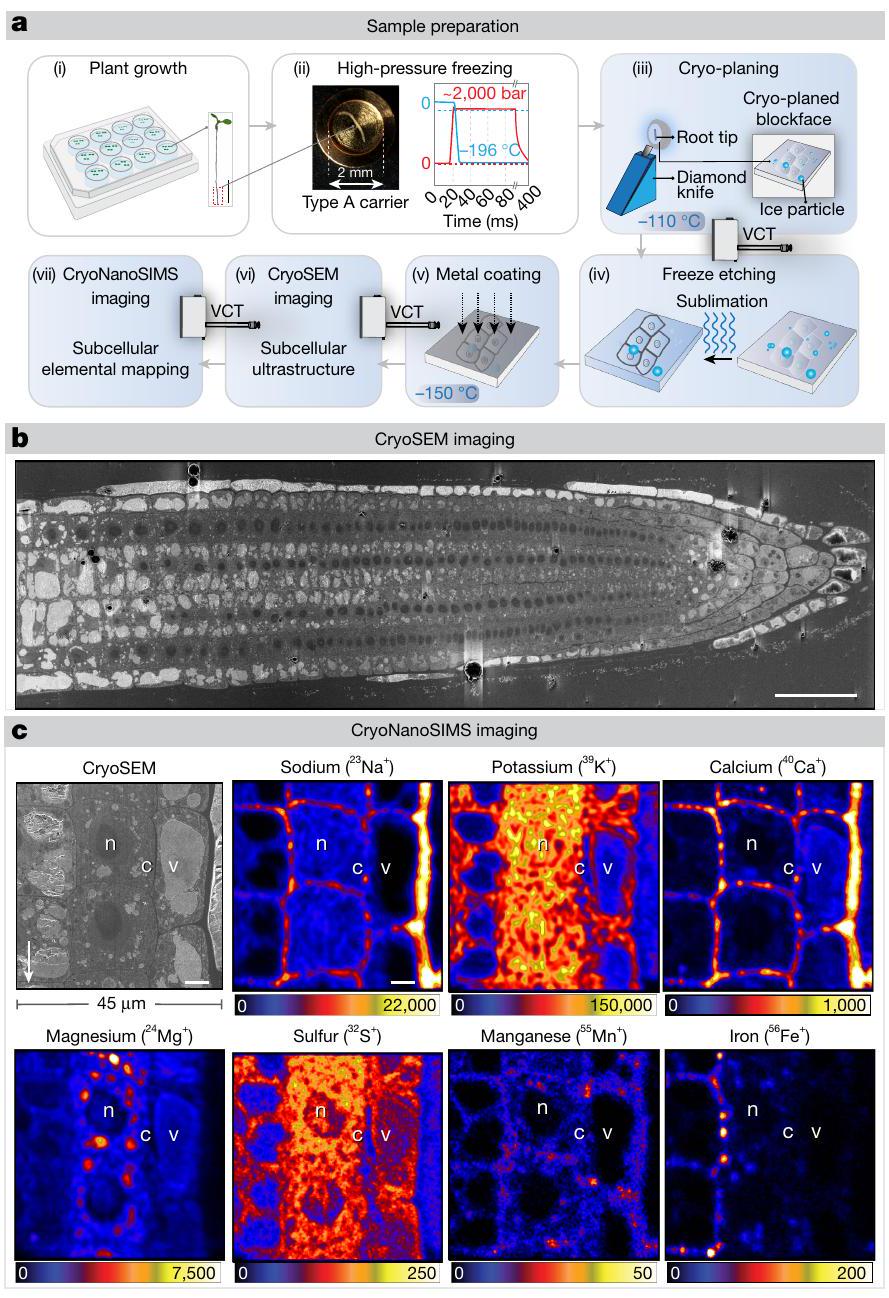
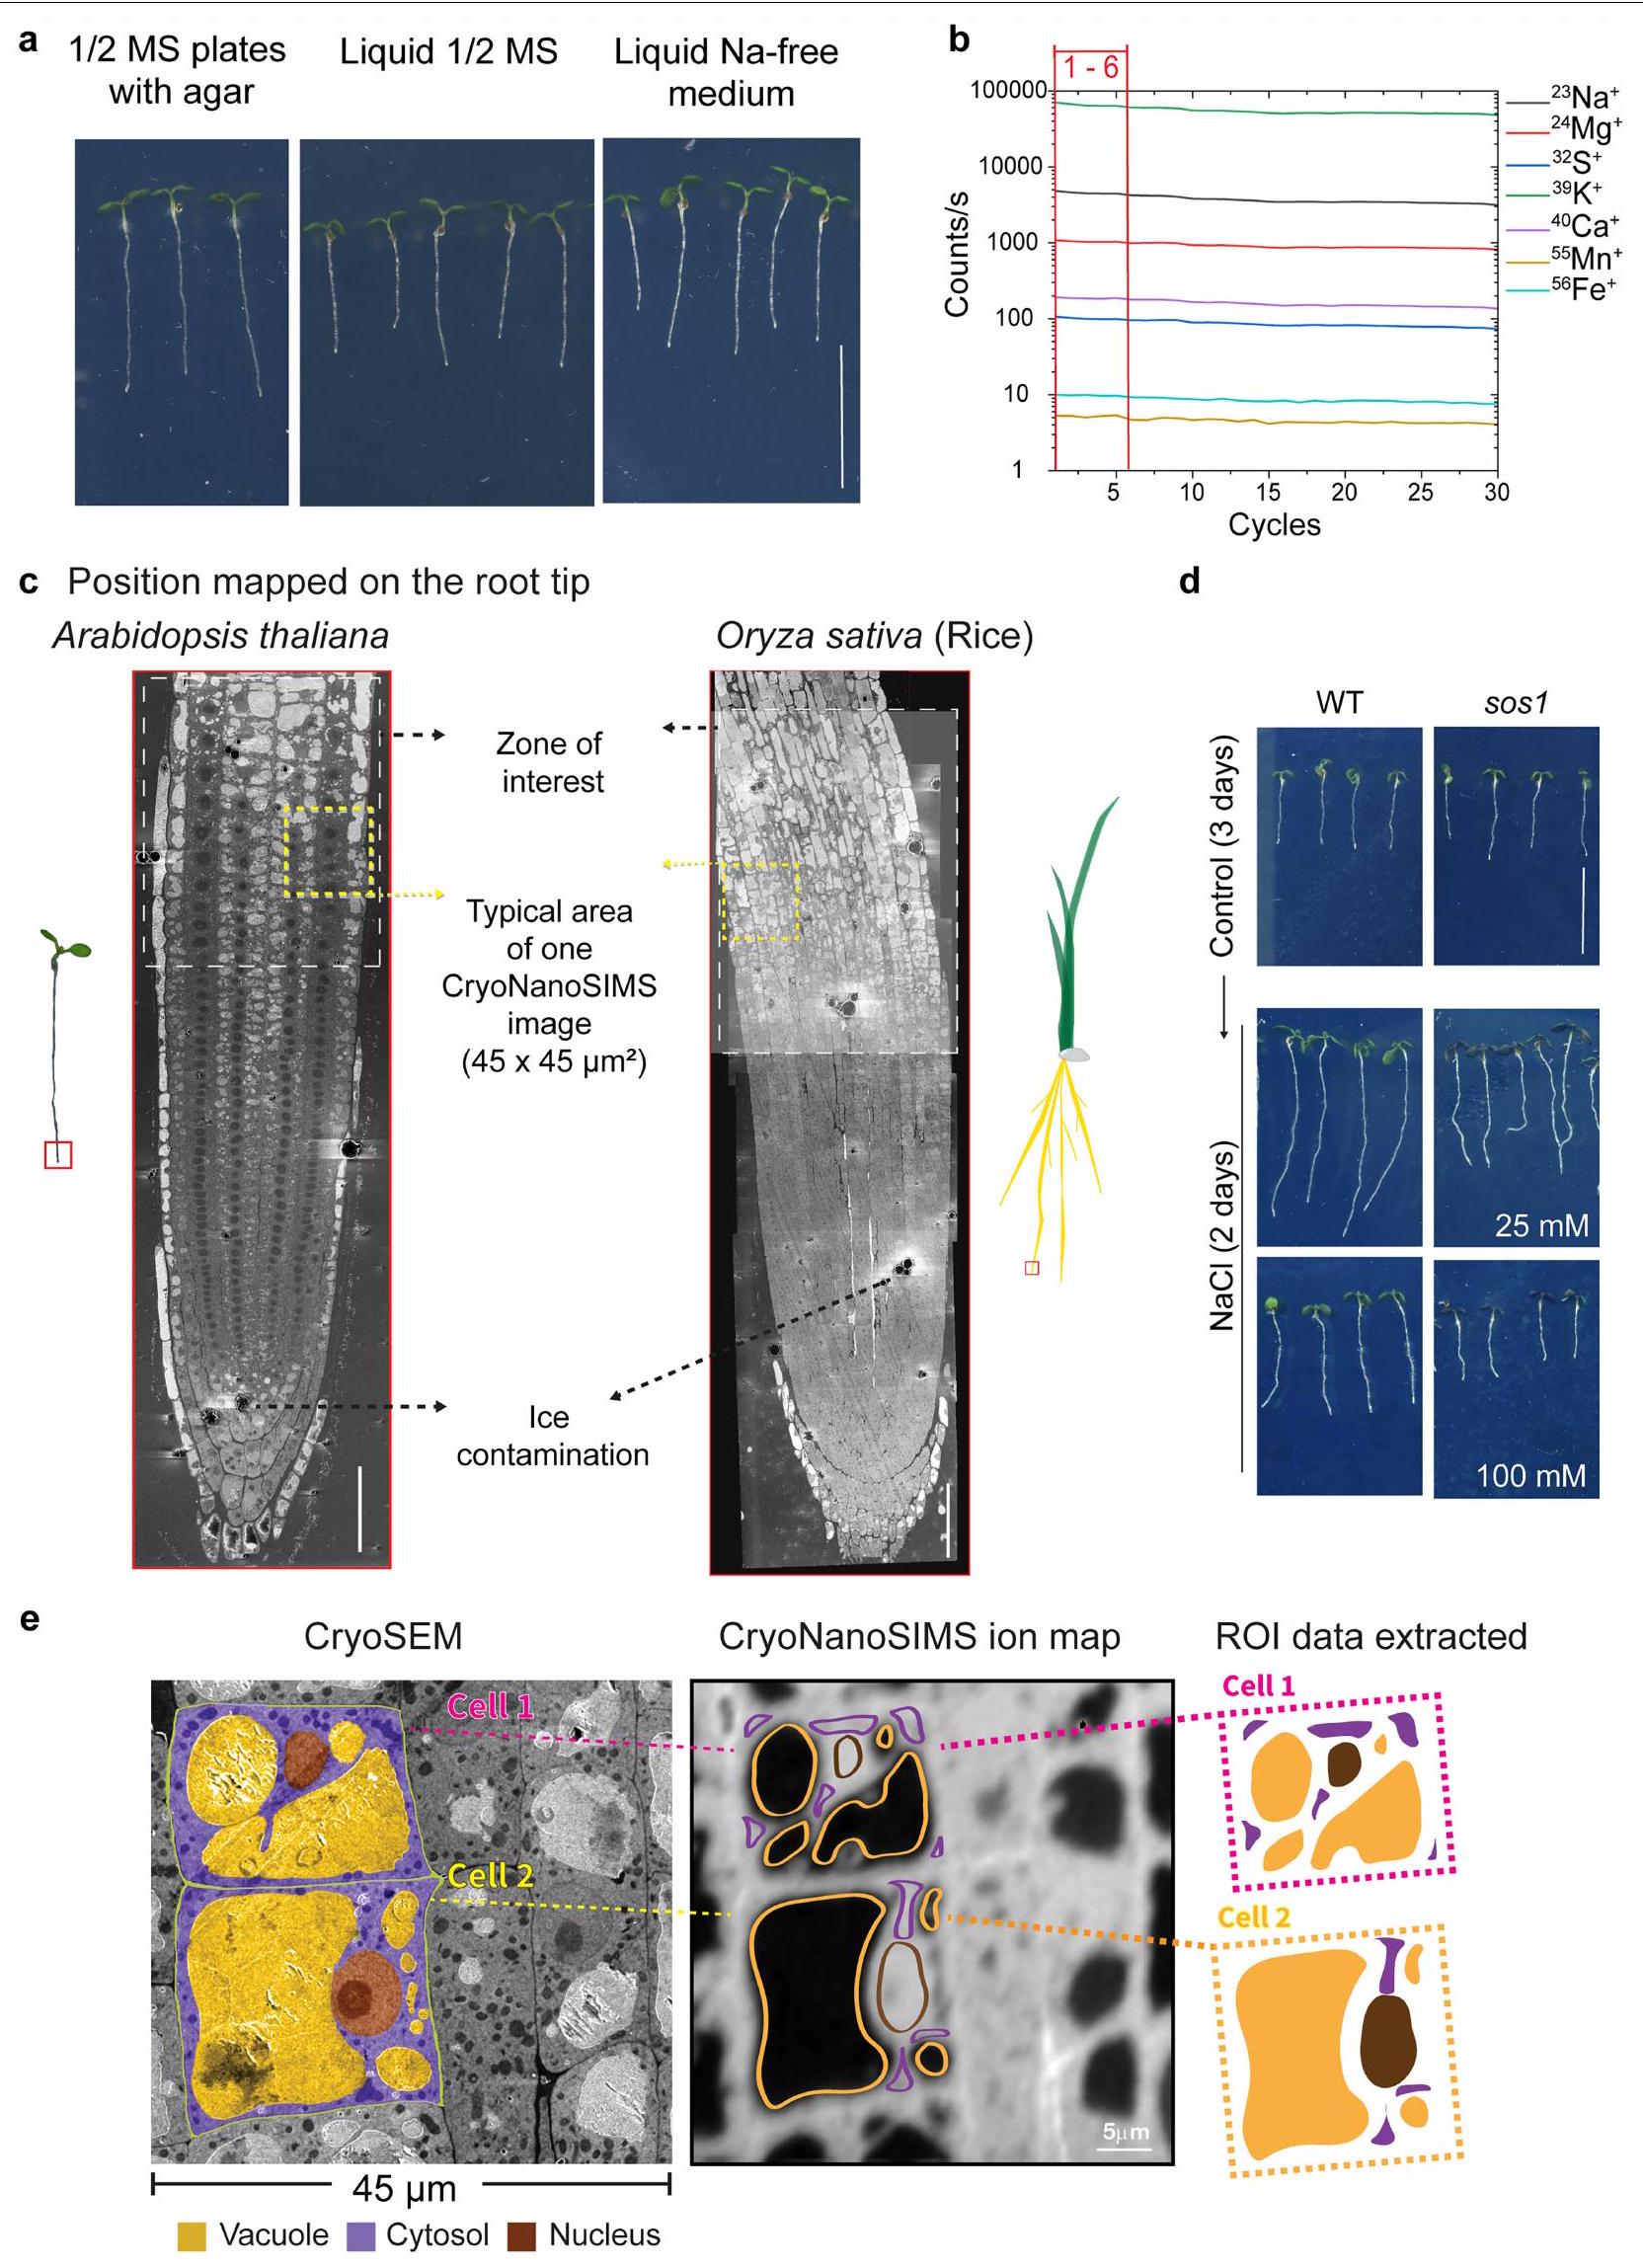
يوضح الشكل 1 بشكل تخطيطي سير العمل العام (الشكل 1a) وأمثلة على صورة cryoSEM المتزامنة وخرائط CryoNanoSIMS الناتجة (الشكل 1b,c). لتسهيل المقارنة المباشرة بين الجذور المختلفة، تم رسم خرائط مناطق الجذر الميرستيمية المحددة بوضوح بشكل منهجي باستخدام CryoNanoSIMS؛ وهي المنطقة التي تنتقل فيها الخلايا من الانقسام إلى الاستطالة (الشكل الممتد 1c). باستخدام هذا سير العمل، نظهر أننا يمكن أن نحصل على خرائط عنصرية متوازية بدقة عالية تصل إلى سبعة عناصر رئيسية، تم قياسها بواسطة نظائرها المستقرة الرئيسية: و (الشكل 1c). من خلال التحقق من طريقتنا، كانت توزيعات العناصر الخلوية الملحوظة في أطراف جذور الأرابيدوبسيس المزروعة في وسط سائل نصف قوة موراشيغ-سكوغ (MS) متسقة للغاية مع التوقعات المحددة (الشكل 1c). على سبيل المثال، من المعروف أن الكالسيوم له تركيزات منخفضة في السيتوسول ويتراكم في جدار الخلية , وهو ما يتماشى مع خريطة الكالسيوم CryoNanoSIMS (الشكل 1c). علاوة على ذلك، أظهرت خرائط الكالسيوم نقاط ساخنة في الجدار وزوايا الخلايا، والتي من المحتمل أن تكون مرتبطة بوجود البكتين (بوليمرات سكرية سلبية الشحنة تعتمد على حمض الجالكتورونيك) التي تتقاطع مع الكالسيوم . من ناحية أخرى، تم ملاحظة المغنيسيوم (المعروف بتفاعله مع أغشية الفوسفوليبيد، والبروتينات، والنوكلوتيدات الفوسفاتية؛ على وجه الخصوص، ATP) في السيتوسول والفجوات (الشكل 1c). عرض الصوديوم والبوتاسيوم، وهما العنصران المعنيان مباشرة في هذه الدراسة، توزيعات متباينة بشكل كبير، حيث كان الصوديوم مركزًا بشكل أساسي في الفضاء الخارجي والبوتاسيوم يتراكم بشكل تفضيلي في السيتوسول، حيث يعمل كأيون أحادي الشحنة الرئيسي (الشكل 1c).
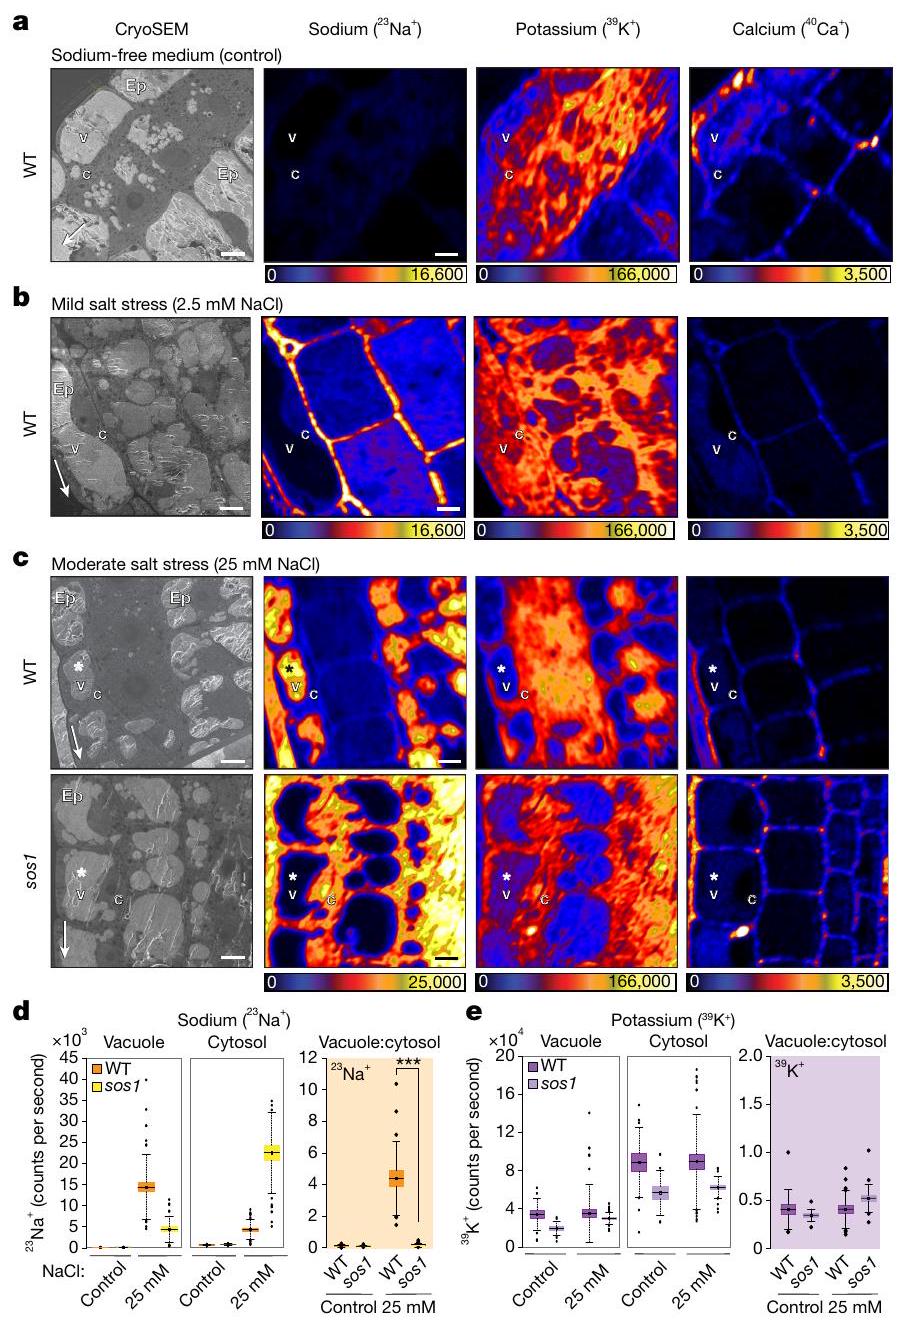
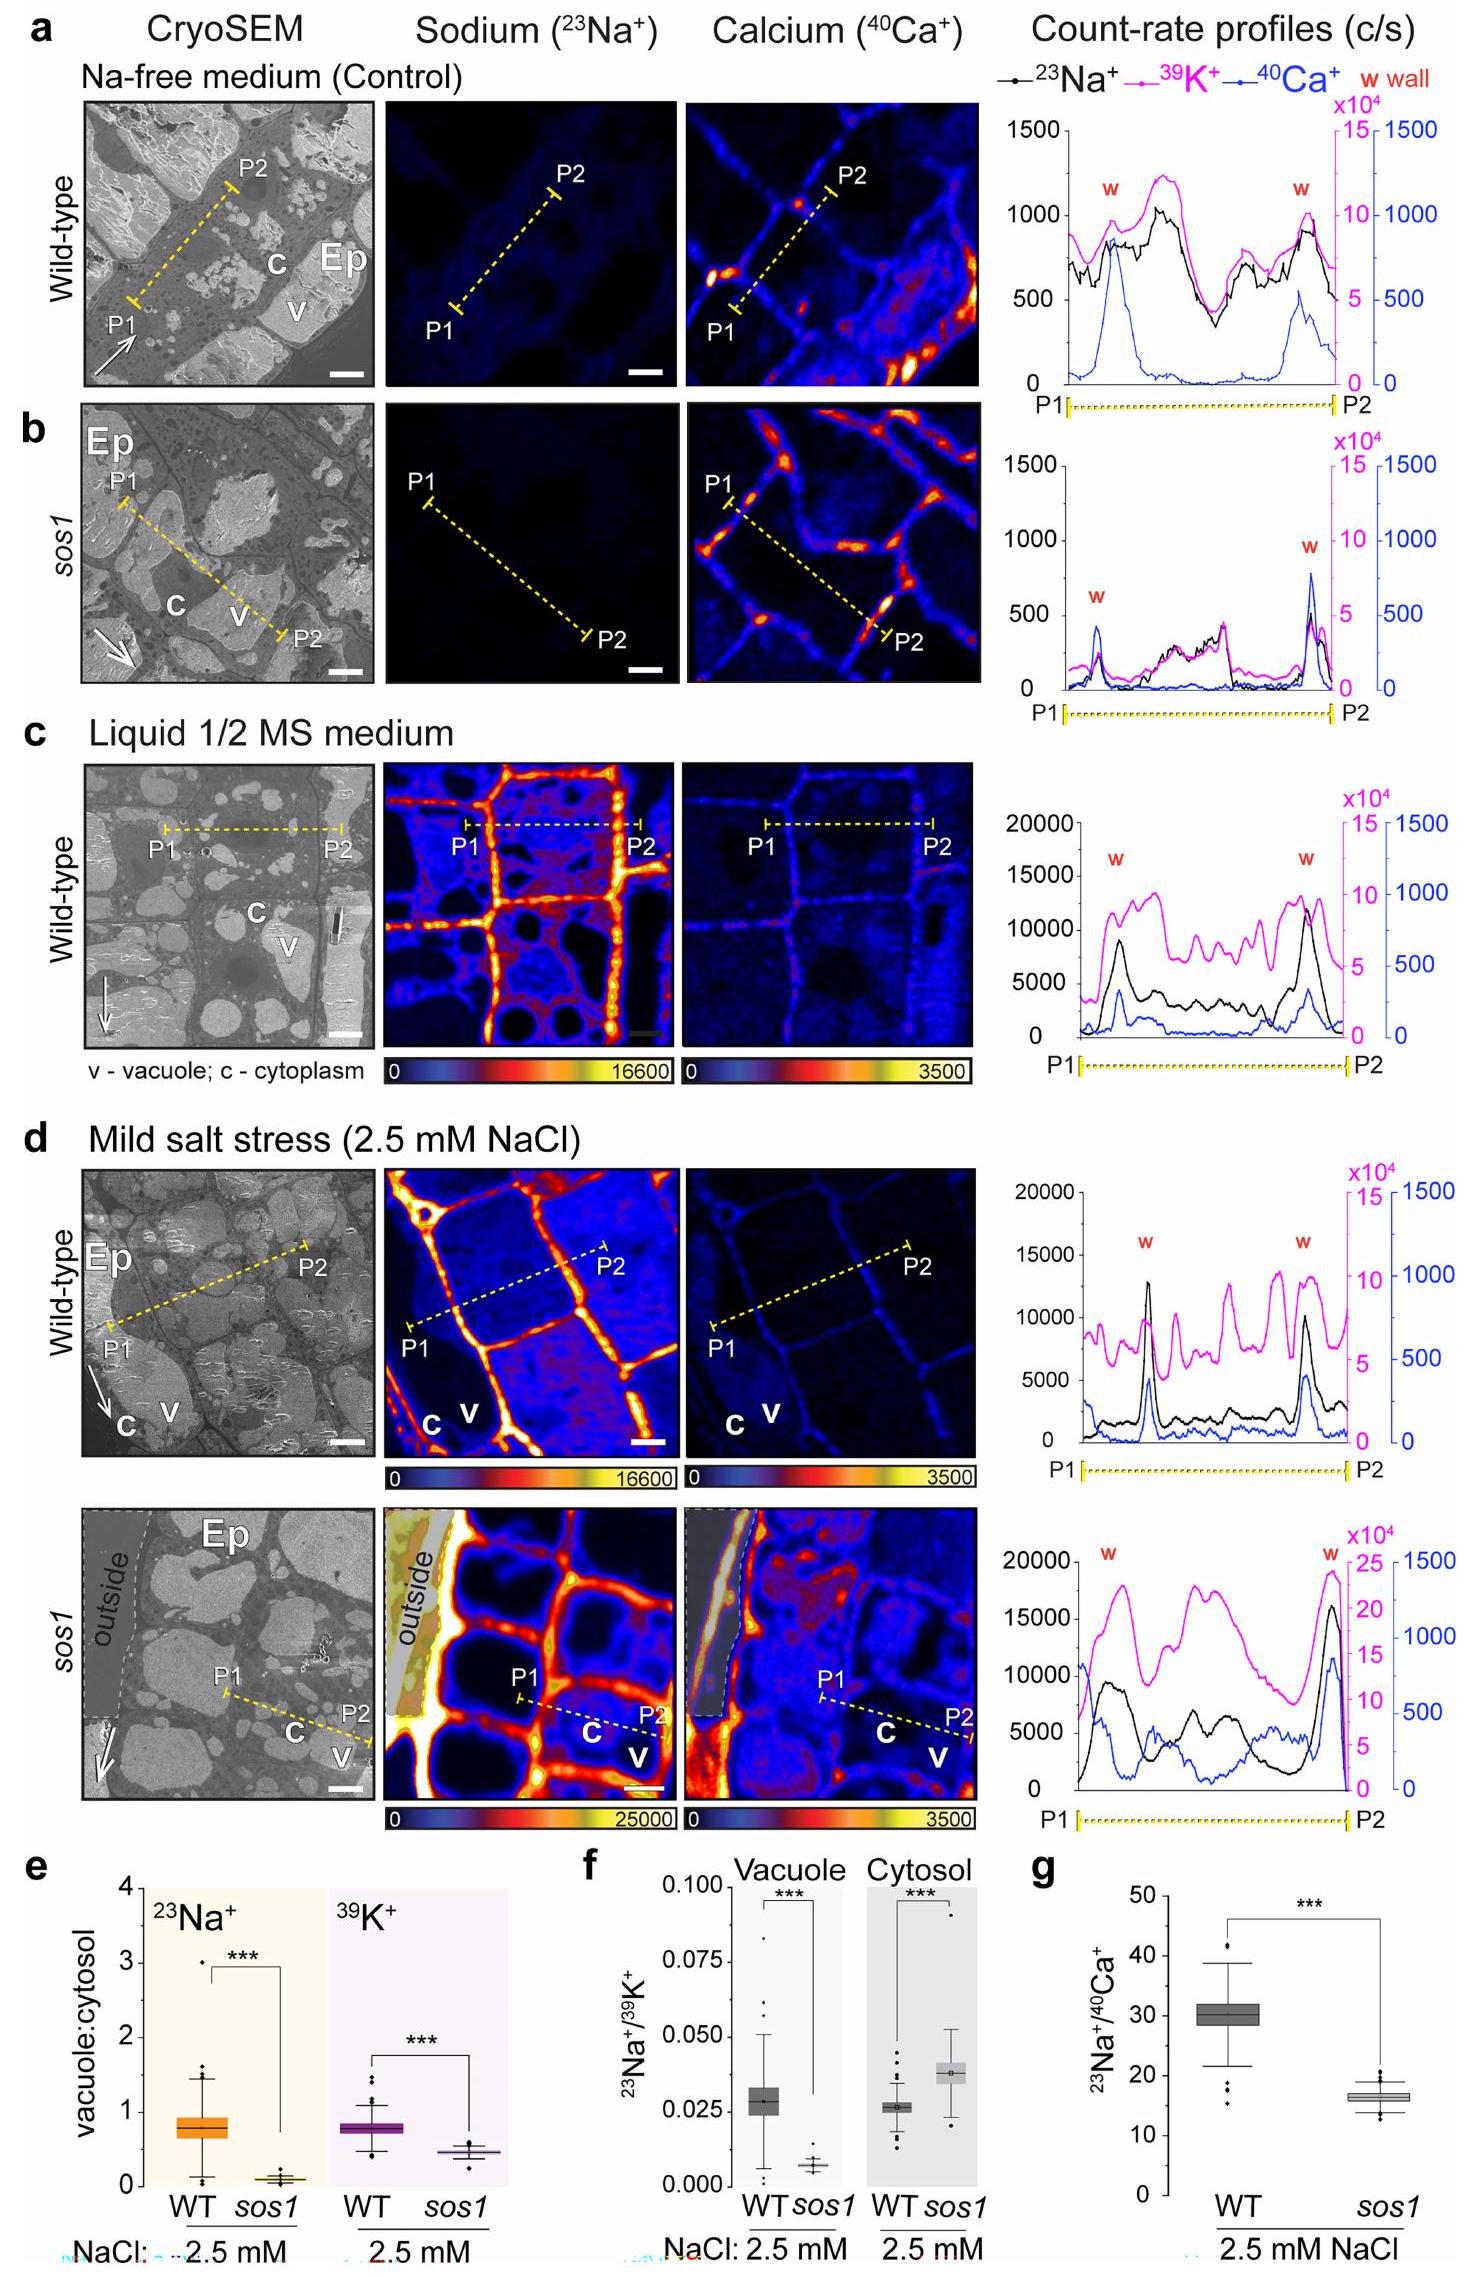
على عكس الحيوانات، فإن معظم أنواع النباتات لا تتطلب الصوديوم لأي عملية خلوية حيوية وتنمو بشكل جيد في غيابه. استخدمنا نظام هيدروبونيك مصغر لزراعة نباتات الأرابيدوبسيس، للحصول على تحكم كامل على تركيزات العناصر في الوسط (الشكل الممتد 1a). كما هو متوقع، اكتشف جهاز CryoNanoSIMS لدينا عددًا قليلاً فقط من الصوديوم عندما نمت الشتلات في وسط خالٍ من الصوديوم (شرط التحكم) (الشكل 2a والشكل الممتد 2a). على النقيض من ذلك، تم ملاحظة مستويات منخفضة من الصوديوم (وسط MS نصف القوة، تقريبًا 0.1 مليمول“; الشكل البياني الموسع 2c) ومستويات الصوديوم المرتفعة قليلاً (2.5 مليمول NaCl؛ الشكل 2b، الشكل البياني الموسع 2d) أدت إلى زيادة قوية في الصوديوم في جدار الخلية (الشكل البياني الموسع 2g)، ووجود نسبي منخفض، ولكنه قابل للاكتشاف بوضوح، للصوديوم في السيتوسول (الشكل البياني الموسع 2e، f). وهذا يشير إما إلى تصدير نشط للصوديوم، أو امتصاص محدود للصوديوم كآلية تحافظ على مستويات منخفضة من الصوديوم في السيتوسول تحت ضغط الملح الخفيف. يعتبر مضاد الصوديوم/البروتون SOS1/NHX7 من عائلة مضادات النقل NHX محددًا رئيسيًا لتحمل الملح في الأرابيدوبسيس. يتم التعبير عنه بقوة في قمة الجذر التي قمنا بالتحقيق فيها ويعتقد أنه يعمل عند الغشاء البلازمي لطرد الصوديوم إلى جدار الخلية.من المثير للاهتمام أنه حتى عند هذه التركيزات المنخفضة من الصوديوم (2.5 مليمول NaCl)، أظهر طافرة من SOS1 (sos1-1؛ sos1 من الآن فصاعدًا) زيادة في نسب Na:K في السيتوسول وانخفاض في نسب Na:Ca في جدار الخلية، مما يتماشى مع وظيفة SOS1 في تصدير الصوديوم عند هذه التركيزات (البيانات الموسعة الشكل 2d-g).
ومع ذلك، عندما زدنا إجهاد الملح إلى مستويات معتدلة (25 مليمول NaCl لمدة 4 ساعات) لاحظنا تغييرًا جذريًا في توزيع الصوديوم داخل الخلايا (الشكل 2c). ثم أظهرت الخلايا المرستيمية تراكمًا قويًا للصوديوم في الفجوات، مع وجود كمية أقل نسبيًا من الصوديوم في جدران الخلايا (الشكل 2c، d والشكل الإضافي 3a-c). بالمقابل، sos1
الشكل 1| سير العمل بالتبريد و تصوير الكتلة المتزامنة بالتبريد (cryosem) و (CryoNanoSIMS) لجذور الأرابيدوبسيس. أ، (i) مخطط لشتلات الأرابيدوبسيس المزروعة في طبق زراعة مائي مكون من 12 بئر. الصورة المصغرة، صورة لشتلات عمرها 5 أيام تم أخذ عينات من أطراف جذورها للتجميد تحت ضغط عالٍ. (ii) التزجج عن طريق التجميد تحت ضغط عالٍ يظهر مقطعًا لجذر مقطوع تقريبًا 3 مم من الطرف موضوع في حاملة من النوع A مملوءة بمادة واقية للتبريد. يوضح الرسم البياني عملية التجميد، مع زيادة سريعة في الضغط إلى حوالي 2000 بار مصحوبة بالتبريد باستخدام سائل.إلى، مما أدى إلى تزجيج العينة. من هذه النقطة فصاعدًا، تم الحفاظ على العينة والتعامل معها تحت ظروف التبريد. (iii) تم تسوية عينات الجذور المزججة لإنشاء وجه كتلة مسطح مناسب للتصوير. ثم تم نقل العينة إلى جهاز تبخير مع ناقل VCT. (iv) تم تسامي وجه الكتلة (تجميد النقش) لإزالة تلوث الجليد السطحي وإبراز التفاصيل فوق المجهرية للجذر. (v) ثم تم طلاء سطح العينة ونقلها باستخدام VCT إلى جهاز CryoSEM. (vi) تم تصوير البنية فوق المجهرية للأنسجة باستخدام CryoSEM. (vii) تم إعادة طلاء العينة ونقلها إلى CryoNanoSIMS للتصوير العنصري. لمزيد من التفاصيل، انظر الطرق. ب، تم تصوير عرض طولي لجذر أرابيدوبسيس تم تسويته على وسط MS سائل نصف القوة يظهر التفاصيل فوق المجهرية لخلايا مرستيم الجذر في حالتها الأصلية المزججة. ج، مثال على صورة CryoSEM عالية الدقة مرتبطة مباشرة بخرائط العناصر من CryoNanoSIMS لقمم جذور أرابيدوبسيس WT المزججة التي نمت على وسط MS سائل نصف القوة وتمت معالجتها كما هو موضح في أ، مما يكشف عن تنظيم الأنسجة وتوزيعاتها داخل الخلايا.، و الفجوة (v) والسيتوبلازم (c) والنواة (n) موضحة. مقاييس الألوان خطية ومعدلات العد القصوى (العد في الثانية) موضحة بواسطة أشرطة الألوان. أشرطة القياس،.
أظهرت الطفرات توزيعًا معكوسًا للصوديوم، مع انخفاض الصوديوم في الفجوات وارتفاع كبير في الصوديوم في السيتوسول (الشكل 2c، d)، مما أدى إلى عكس نسب الفجوة: السيتوسول مقارنة بالنمط البري (WT)
الشكل 2 | رسم خرائط متزامن باستخدام cryoSEM وCryoNanoSIMS لعناصر الصوديوم والبوتاسيوم والكالسيوم في قمم الجذور لنباتات الأرابيدوبسيس البرية وطفرة sos1 تحت ضغط ملحي خفيف ومتوسط. أ، صور تمثيلية لنباتات WT المزروعة في وسط خالٍ من الصوديوم (تحكم)، تتميز بمستويات منخفضة، ولكن يمكن قياسها بوضوح من الصوديوم قبل تجارب الضغط الملحي؛ قارن مع البيانات الموسعة الشكل 2أ، ب ل sos1. تم وضع علامات على البشرة (Ep) والفجوة (v) والسيتوبلازم (c). ب، قمة الجذر لنباتات WT المعالجة بـ 2.5 مللي مولار NaCl لمدة ساعتين (ضغط ملحي خفيف)؛ قارن مع البيانات الموسعة الشكل 2د ل sos1. ج، قمة الجذر لنباتات WT و sos1 التي تم حضانتها مع 25 مللي مولار NaCl لمدة 4 ساعات (ضغط ملحي متوسط). لاحظ أن خلايا WT تراكمت فيها الصوديوم في الفجوات (*)، بينما تراكمت في الطفرات sos1 في السيتوسول. د، متوسط معدلات العد للصوديومفي الفجوة والسيتوسول لخلايا الميرستيم في WT و sos1 (يسار) بعد النمو في وسط خالٍ من الصوديوم (التحكم) وبعد المعالجة بـ 25 مللي مولار NaCl لمدة 4 ساعات. كما تم عرض نسب معدل العد بين الفجوة والسيتوسول لـداخل خلايا الميرستيم الفردية في WT و sos1 (يمين، برتقالي). هـ، معدلات العد المتوسطة المقابلة للبوتاسيومفي الفجوة والسيتوسول لخلايا الميرستيم في WT و sos1 (يسار). كما تم عرض نسب معدل العد بين الفجوة والسيتوسول لـداخل خلايا الميرستيم الفردية في WT و sos1 بعد النمو (يمين، ليلكي). لم يتغير التوزيع الداخلي للبوتاسيوم بشكل ملحوظ مع العلاج. تُظهر الرسوم البيانية الصندوقية القيم المتوسطة (الخطوط الأفقية)، و25% (الصناديق) و75% (الخطوط الرأسية الرفيعة) من الربع؛ يتم الإشارة إلى القيم الشاذة بدوائر صلبة. تم زراعة العينة هيدروبونيًا على وسط خالٍ من الصوديوم وتعرضت للعلاجات المعنية. مقياس الألوان خطي ومعدلات عدد الأيونات القصوى (عدد في الثانية) موضحة بواسطة أشرطة الألوان. تشير الأسهم البيضاء الرفيعة في صور cryoSEM نحو طرف الجذر. أشرطة القياس،.
(الشكل 2d والشكل الإضافي 3b). وقد كشف ذلك أن الطفرة sos1 تعاني من ضعف في نقل الصوديوم إلى الفجوات. ومع ذلك، في هذا المستوى من إجهاد الملح ورغم التراكم الكبير للصوديوم في سيتوبلازم sos1، فإن التوزيع الداخلي للبوتاسيوم، أي، نسبة الفجوة البوتاسية إلى السيتوسول، لم تتأثر بعد (الشكل 2c-e والشكل الإضافي 3b).
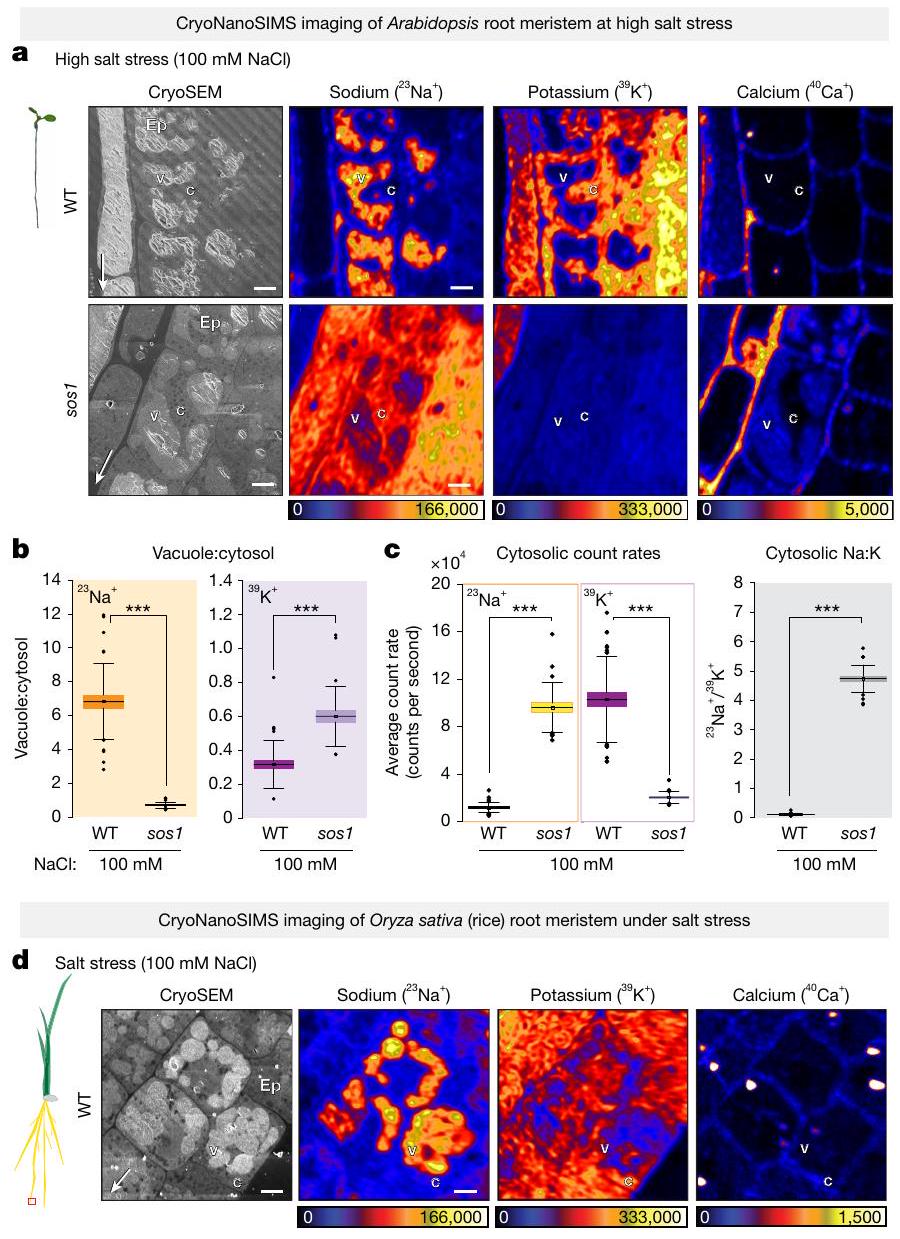
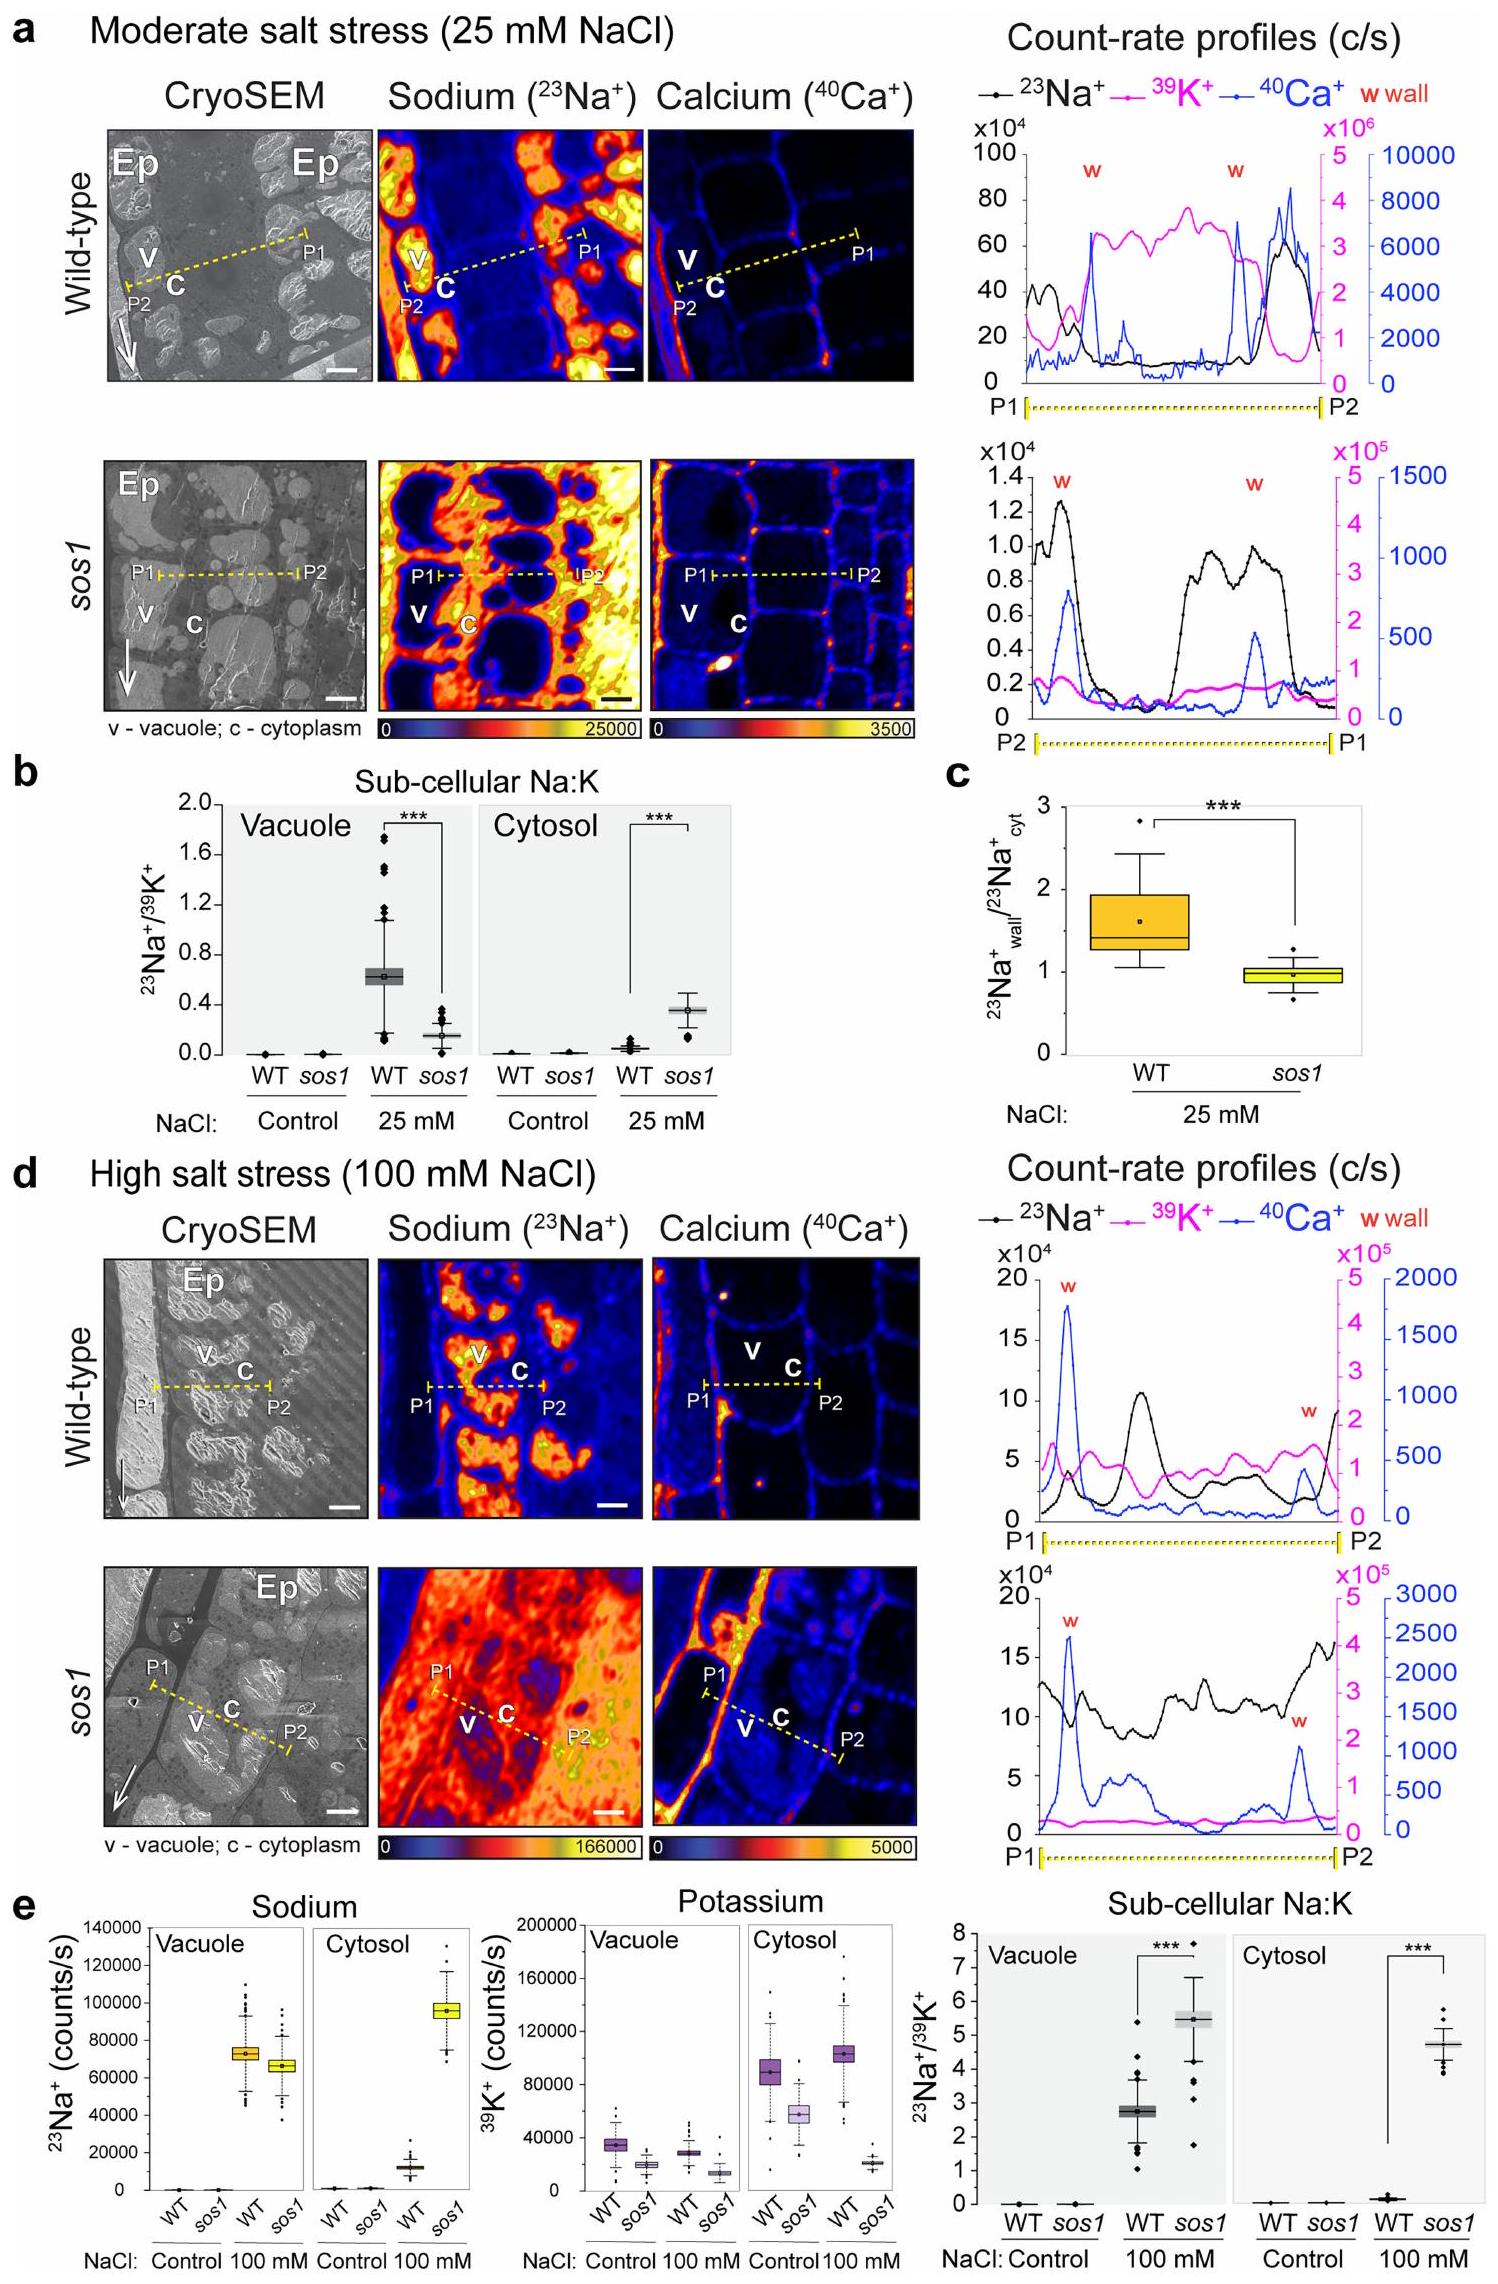
عند مستويات أعلى من إجهاد الملحلمدة 4 ساعاتظلت خلايا مرستيم الجذور في WT قادرة على تركيز الصوديوم في الفجوات وبالتالي حافظت على مستوى منخفض من الصوديوم في السيتوسول (الشكل 3أ). بالمقابل، عانى الطافرة sos1 من تراكم أقوى للصوديوم في سيتوسولها، مرتبطًا بدرجة معينة من التراكم الفجوي (الشكل 3أ-ج والشكل الإضافي 3د، هـ). من المهم ملاحظة أن هناك انخفاضًا متزامنًا في البوتاسيوم السيتوسولي لوحظ في sos1، ولكن ليس في WT (الشكل 3أ، ج)، مما أدى إلى تغيير دراماتيكي في نسبة Na:K السيتوسولية في sos1، مقارنةً بـ WT (الشكل 3ج). الانخفاض الملحوظ في أيونات البوتاسيوم السيتوسولية وظهور أيونات الصوديوم في الفجوات في sos1 تحت ضغط الملح العالي (الشكل 3أ) يتماشى مع الفكرة المقترحة غالبًا بأن سمية الصوديوم ناتجة عن إزاحة البوتاسيوم كأيون مضاد للبروتينات السيتوسولية.. في الواقع، كانت نباتات WT قادرة على التعافي من هذا الإجهاد الملحي الحاد وحتى الحفاظ على نمو بطيء في 100 مليمول من NaCl على أطباق الأجار، في حين أن التعرض لفترة أطول من sos1 للتركيز الملحي نفسه أدى إلى توقف كامل للنمو لم يتمكن sos1 من التعافي منه، على عكس WT (الشكل البياني الممتد 5d-f).
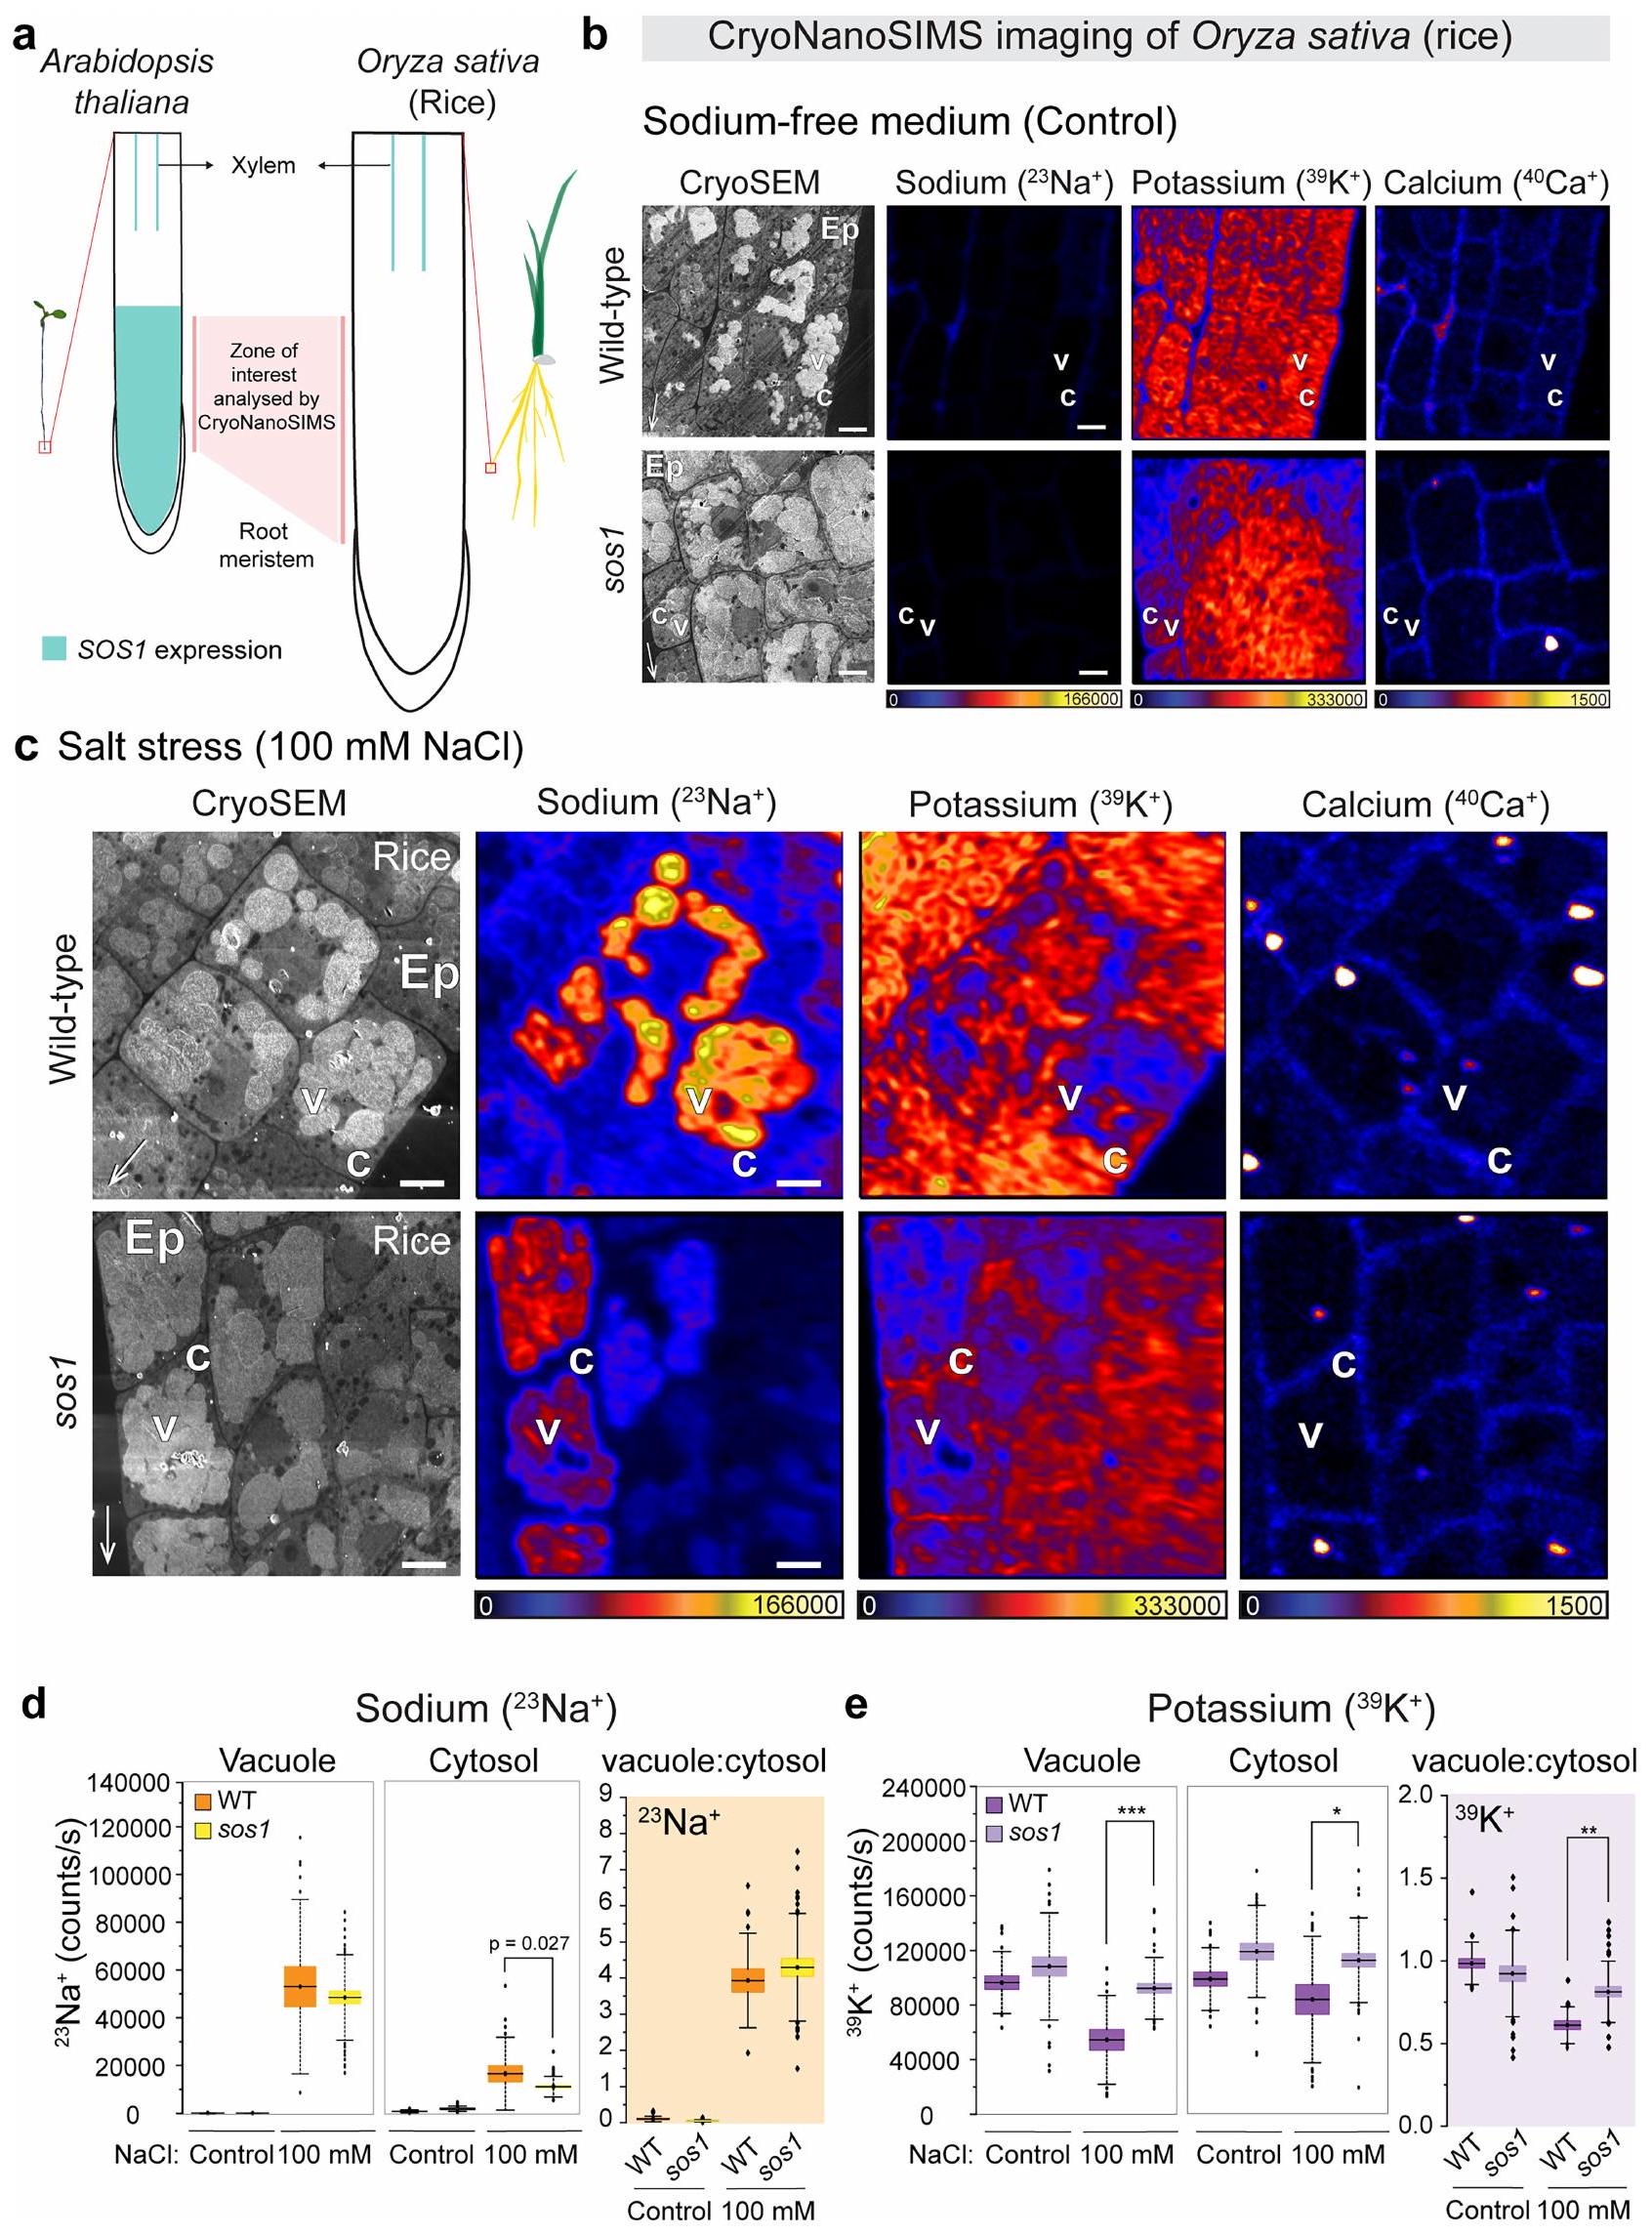
استنادًا إلى بياناتنا في خلايا الجذر الميرستيمية في الأرابيدوبسيس، يبدو أن استراتيجية إزالة السموم من خلال احتجاز الصوديوم في جدار الخلية، سواء من خلال التصدير أو تثبيط الامتصاص، ذات صلة فقط عند تركيزات منخفضة من الصوديوم. بالفعل عند الضغط الملحي المعتدل، يبدو أن آلية جديدة تعتمد على احتجاز الصوديوم في الفجوات أو ما قبل الفجوات تهيمن على التصدير لتقليل تركيز الصوديوم في السيتوسول (الأشكال 2 و3). نظرًا لأن الميرستيمات الجذرية لم تُعتبر سابقًا تستخدم احتجاز الصوديوم في الفجوات كآلية حماية، أردنا أن نرى ما إذا كانت هذه الآلية محفوظة بشكل أوسع. لهذا، استخدمنا الميرستيمات الجذرية للأرز، كأحد المحاصيل الرئيسية وممثل للفرع المتباين من أحاديات الفلقة في النباتات المزهرة. من المثير للاهتمام أننا لاحظنا نفس التراكم القوي في الفجوات عند الضغط الملحي، مع الحفاظ على نسب عالية من البوتاسيوم إلى الصوديوم في السيتوسول (الشكل 3د والشكل الممتد 4ب-هـ)، مما يوضح حفظ هذه الآلية بين كاسيات البذور. على النقيض من الأرابيدوبسيس، حيث يتم التعبير عن SOS1 في كل من الميرستيم الجذري والأنسجة الوعائية المتمايزة، فإن نظير SOS1 في الأرز لا يتم التعبير عنه في الميرستيمات الجذرية، بل يقتصر على الأوعية الجذرية المتمايزة (الشكل الممتد 4أ).لذلك توقعنا أن تراكم الفجوات الملحوظ في قمم جذور الأرز يجب ألا يعتمد على. في الواقع، وجدنا نفس نمط تراكم الفجوات للصوديوم في طفرات الأرز sos1 كما لوحظ في الأرز WT (الشكل 4b-e من البيانات الموسعة). وبالتالي، من المحتمل أن تقوم ناقلات أخرى، مثل أعضاء NHX في الإندوسوم أو الفجوات، بتسهيل النقل الفجوي في خلايا الأرز الميرستيمية. الاختلافات الملحوظة بين و من المرجح أن تكون SOS1 ليست ناتجة عن أي اختلافات في النشاط الخلوي أو الكيميائي الحيوي للبروتينات، لأن OsSOS1 تحت سيطرة محفز ثابت يعيد بشكل كامل ظاهرة sos1 في الأرابيدوبسيس..
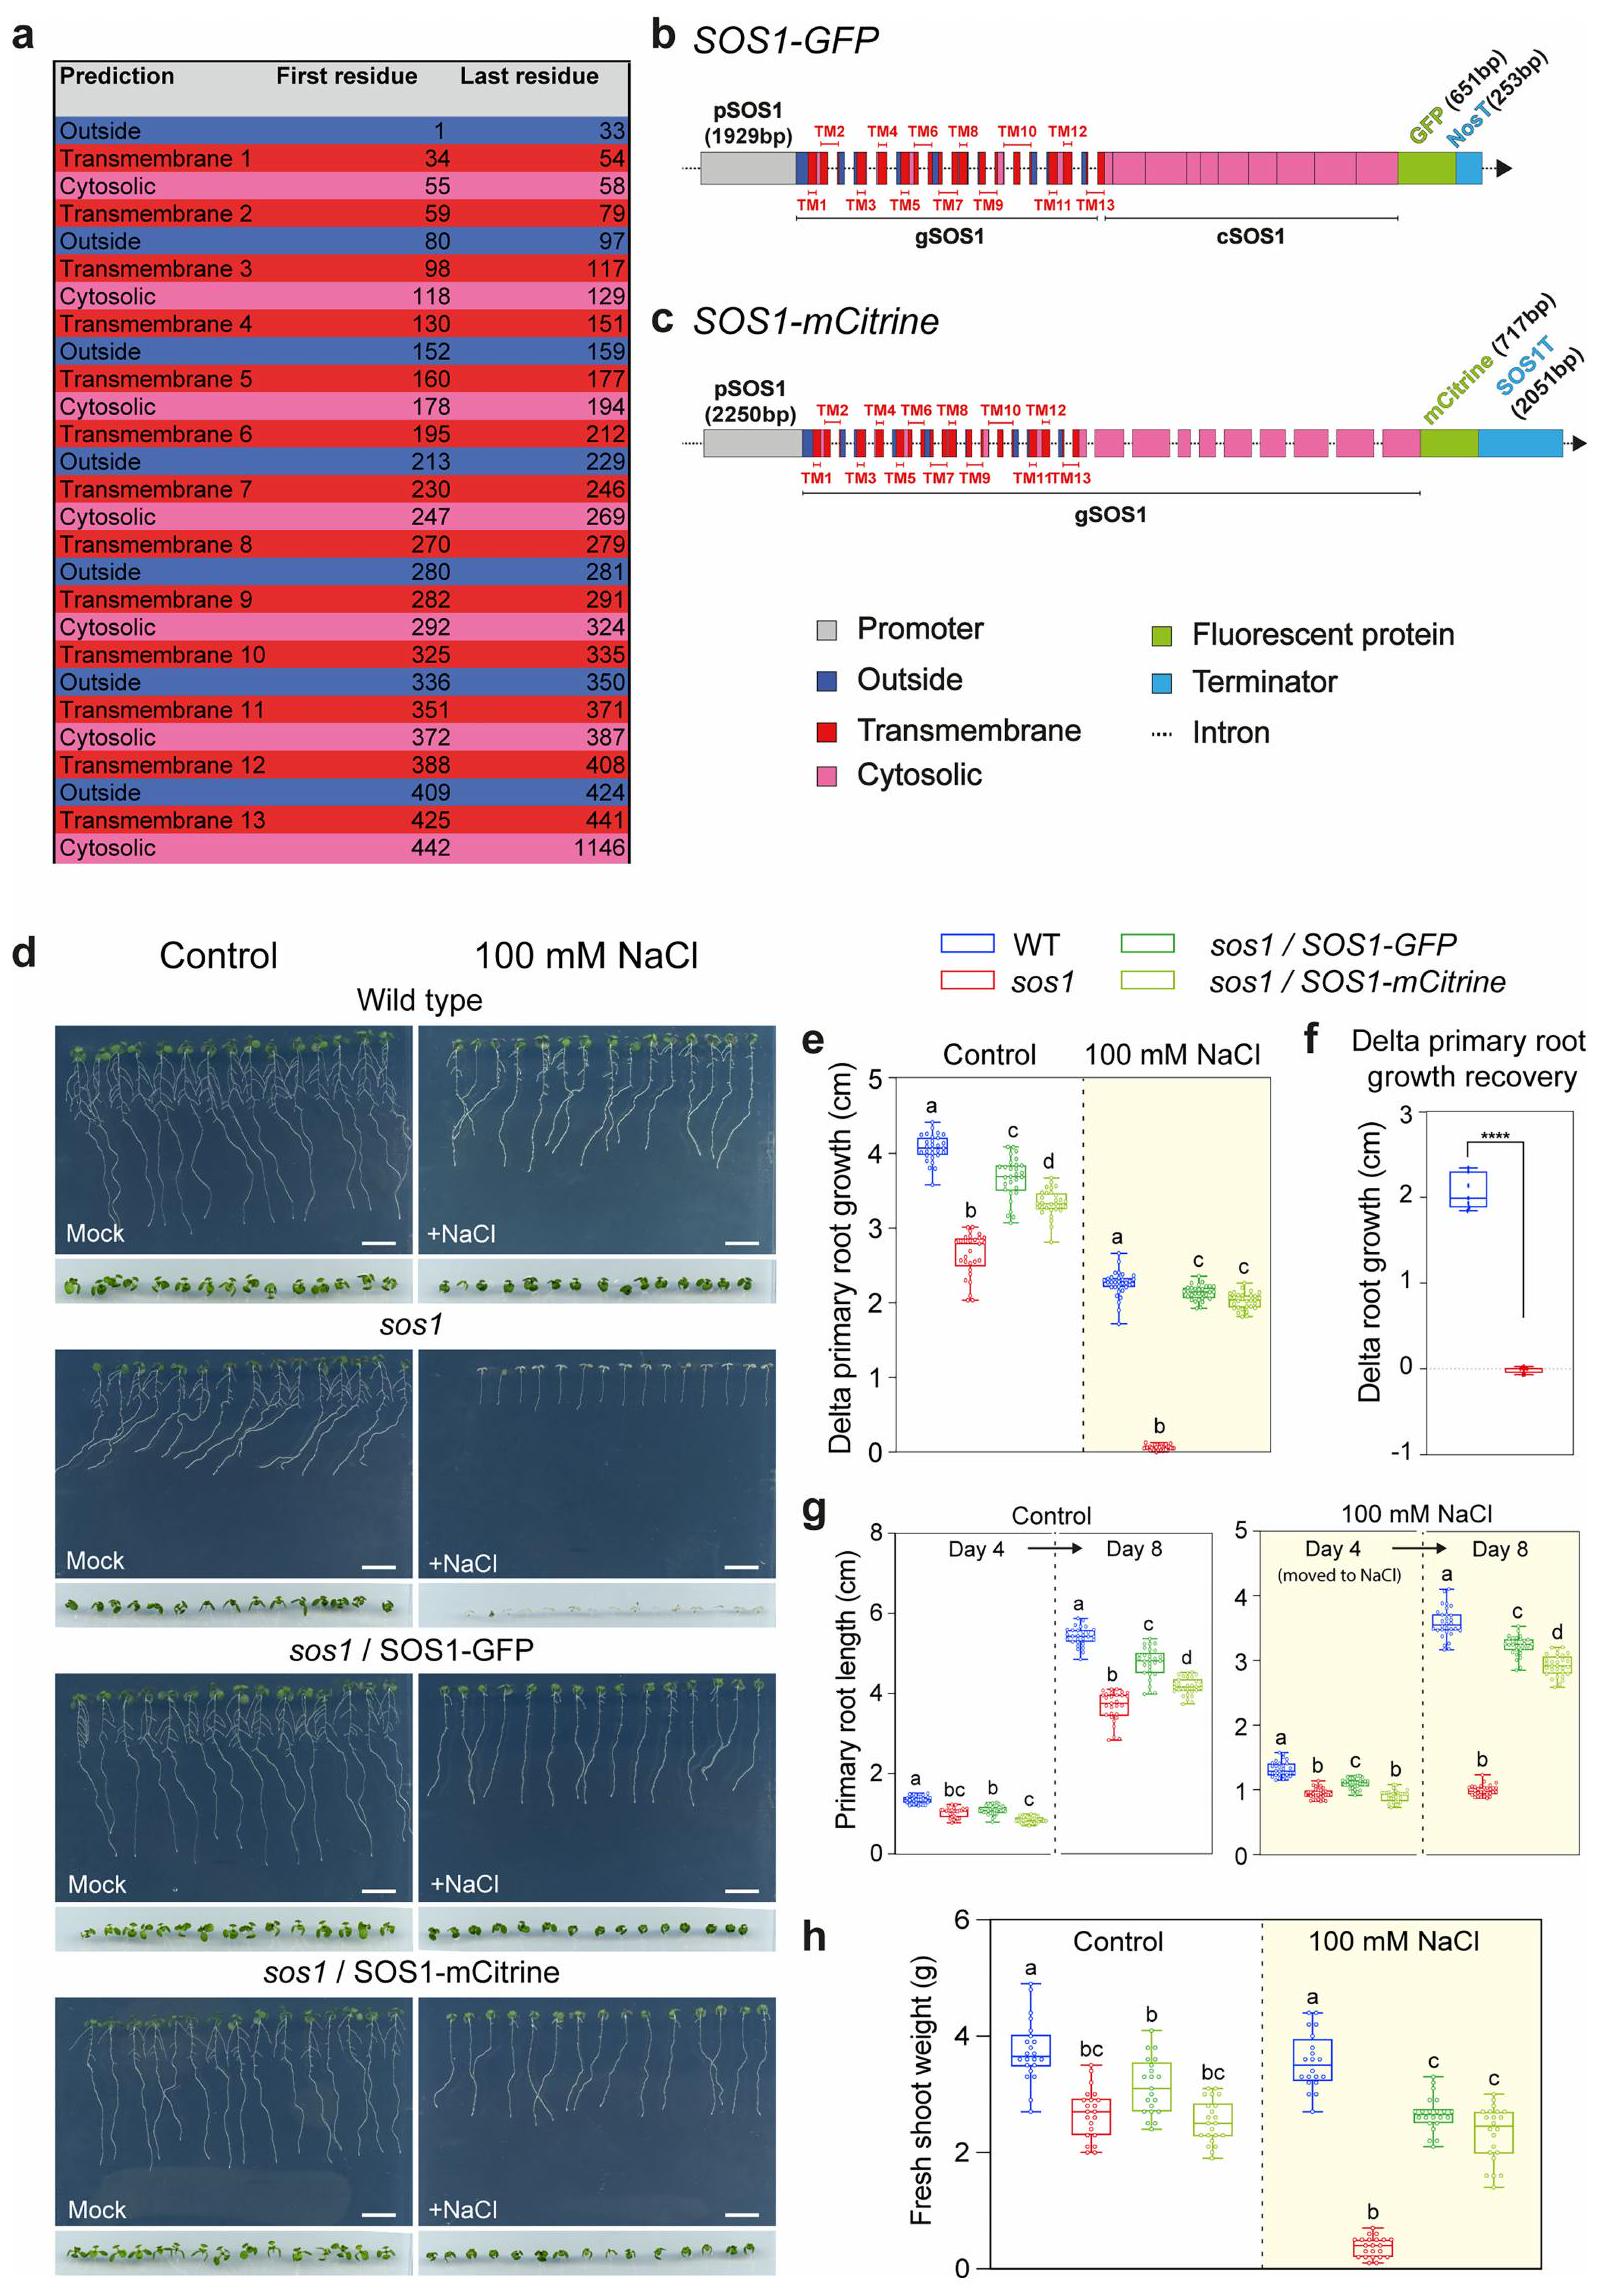
لقد كان يُعتقد منذ فترة طويلة أن SOS1 محصور فقط في الغشاء البلازمي.حيث يقوم بوساطة تصدير الصوديوم إلى جدار الخلية. ومع ذلك، تظهر بياناتنا أنه، تحت تركيزات مرتفعة من الصوديوم، يلعب بروتين SOS1 دورًا رئيسيًا في تراكم الصوديوم في الفجوات (الأشكال 2 و 3). تظهر بيانات هيكلية جديدة أن SOS1 هو بروتين يمتلك 13 مجالًا عبر الغشاء، مع طرف N خارجي وطرف C سيتوبلازمي. (الشكل 5a من البيانات الموسعة). المعرفة الحالية بموقع SOS1 تعتمد بالكامل على التعبير المفرط عن هياكل الاندماج cDNA الفلورية في خلفية WT. لذلك قمنا بإنشاء بنائين جينيين مستقلين من SOS1. احتوى أحدهما على منطقة محفز بطول 1,929 زوج قاعدي مرتبطة بتسلسل الترميز، بما في ذلك الـ 13 إنترون الأول، ومُنهٍ من نوع نوبالين (NOS) وعلامة بروتين فلوري أخضر (SOS1-GFP). بينما كان الآخر أكبرشريحة المحفز مع العدد الكامل من الإنترونات وشريحة النهاية 3’UTR من SOS1 (SOS1-mCitrine) (الشكل 5b,c من البيانات الموسعة). في شتلات الأرابيدوبسيس، أكملت كلا التركيبين المدمجين بشكل كبير ظاهرة حساسية الملح لـ sos1 (الشكل 5d-h من البيانات الموسعة) وأعطت توطينًا فرعيًا مشابهًا جدًا.
الشكل 3 | رسم خرائط متزامن باستخدام cryoSEM وCryoNanoSIMS لعنصري Na و K و Ca في قمم الجذور لنبات الأرابيدوبسيس WT والطافرة sos1 والأرز WT تحت ضغط ملحي مرتفع. أ، صور تمثيلية للخلايا البشرة من WT و sos1 المعالجة بـ 100 مليمول NaCl لمدة 4 ساعات. لاحظ الحفاظ على مستويات منخفضة من Na في سيتوسول WT، على عكس التراكم القوي لـ Na في سيتوسول sos1. لاحظ أيضًا انخفاضًا كبيرًا في K السيتوسولي في خلايا sos1 مقارنة بـ WT. تم وضع علامات على البشرة (Ep) والفجوة (v) والسيتوبلازم (c). ب، نسب معدل العد بين الفجوة والسيتوسول لـ(يسار) و (يمين) من خلايا القمة الجذرية الظهارية في WT و sos1 على 100 مليمول NaCl لمدة 4 ساعات. ج، متوسط معدلات العد لـوفي السيتوسول لخلايا الميرستيم في WT و sos1 (يسار) ومتوسط السيتوسول المقابلنسب (يمين). لاحظ الحفاظ على مستويات الصوديوم المنخفضة في سيتوسول WT، على عكس تراكم الصوديوم القوي في سيتوسول sos1، وانخفاض كبير في البوتاسيوم السيتوسولي في sos1 مقارنة بـ WT. د، صور تمثيلية لخلايا البشرة في قمة جذر الأرز تحت ضغط الملح. تم معالجة شتلات WT بـ 100 مللي مول من NaCl لمدة 4 ساعات. لاحظ أن خلايا WT تراكمت الصوديوم في الفجوات بشكل مشابه لـ WT أرابيدوبسيس. تم تكرار التجربة مرتين مع نتائج مماثلة. انظر البيانات الموسعة الشكل 4 للتحليل المقارن مع طفرة sos1 في الأرز. تظهر الرسوم البيانية الصندوقية القيم المتوسطة (الخطوط الأفقية)، (صناديق) و (أشرطة رأسية رفيعة) الربعيات؛ يتم الإشارة إلى القيم الشاذة بدوائر صلبة. تم زراعة العينات في الزراعة المائية على وسط خالٍ من الصوديوم وتعرضت للعلاجات المناسبة. مقاييس الألوان خطية ومعدلات عدد الأيونات القصوى (عدد في الثانية) موضحة بواسطة أشرطة الألوان. تشير الأسهم البيضاء الرفيعة في صور المجهر الإلكتروني الماسح إلى طرف الجذر. أشرطة القياس، .
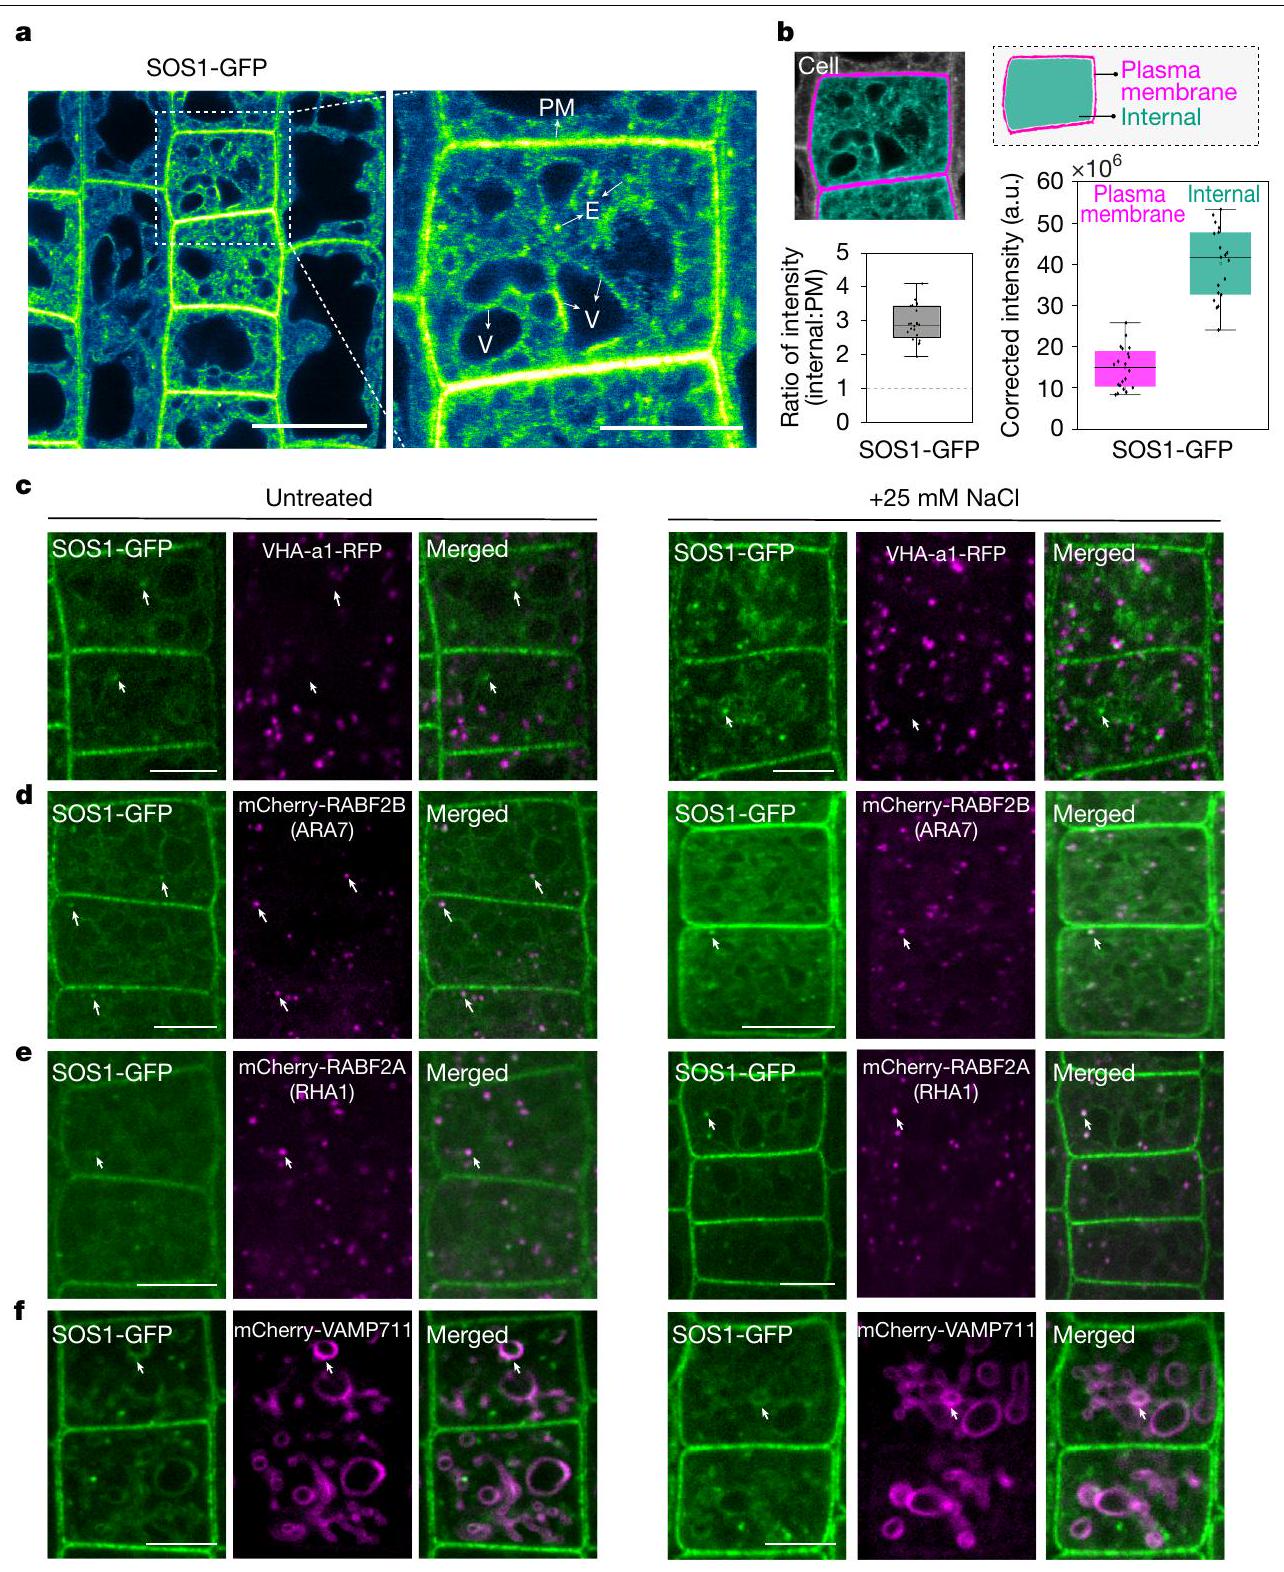
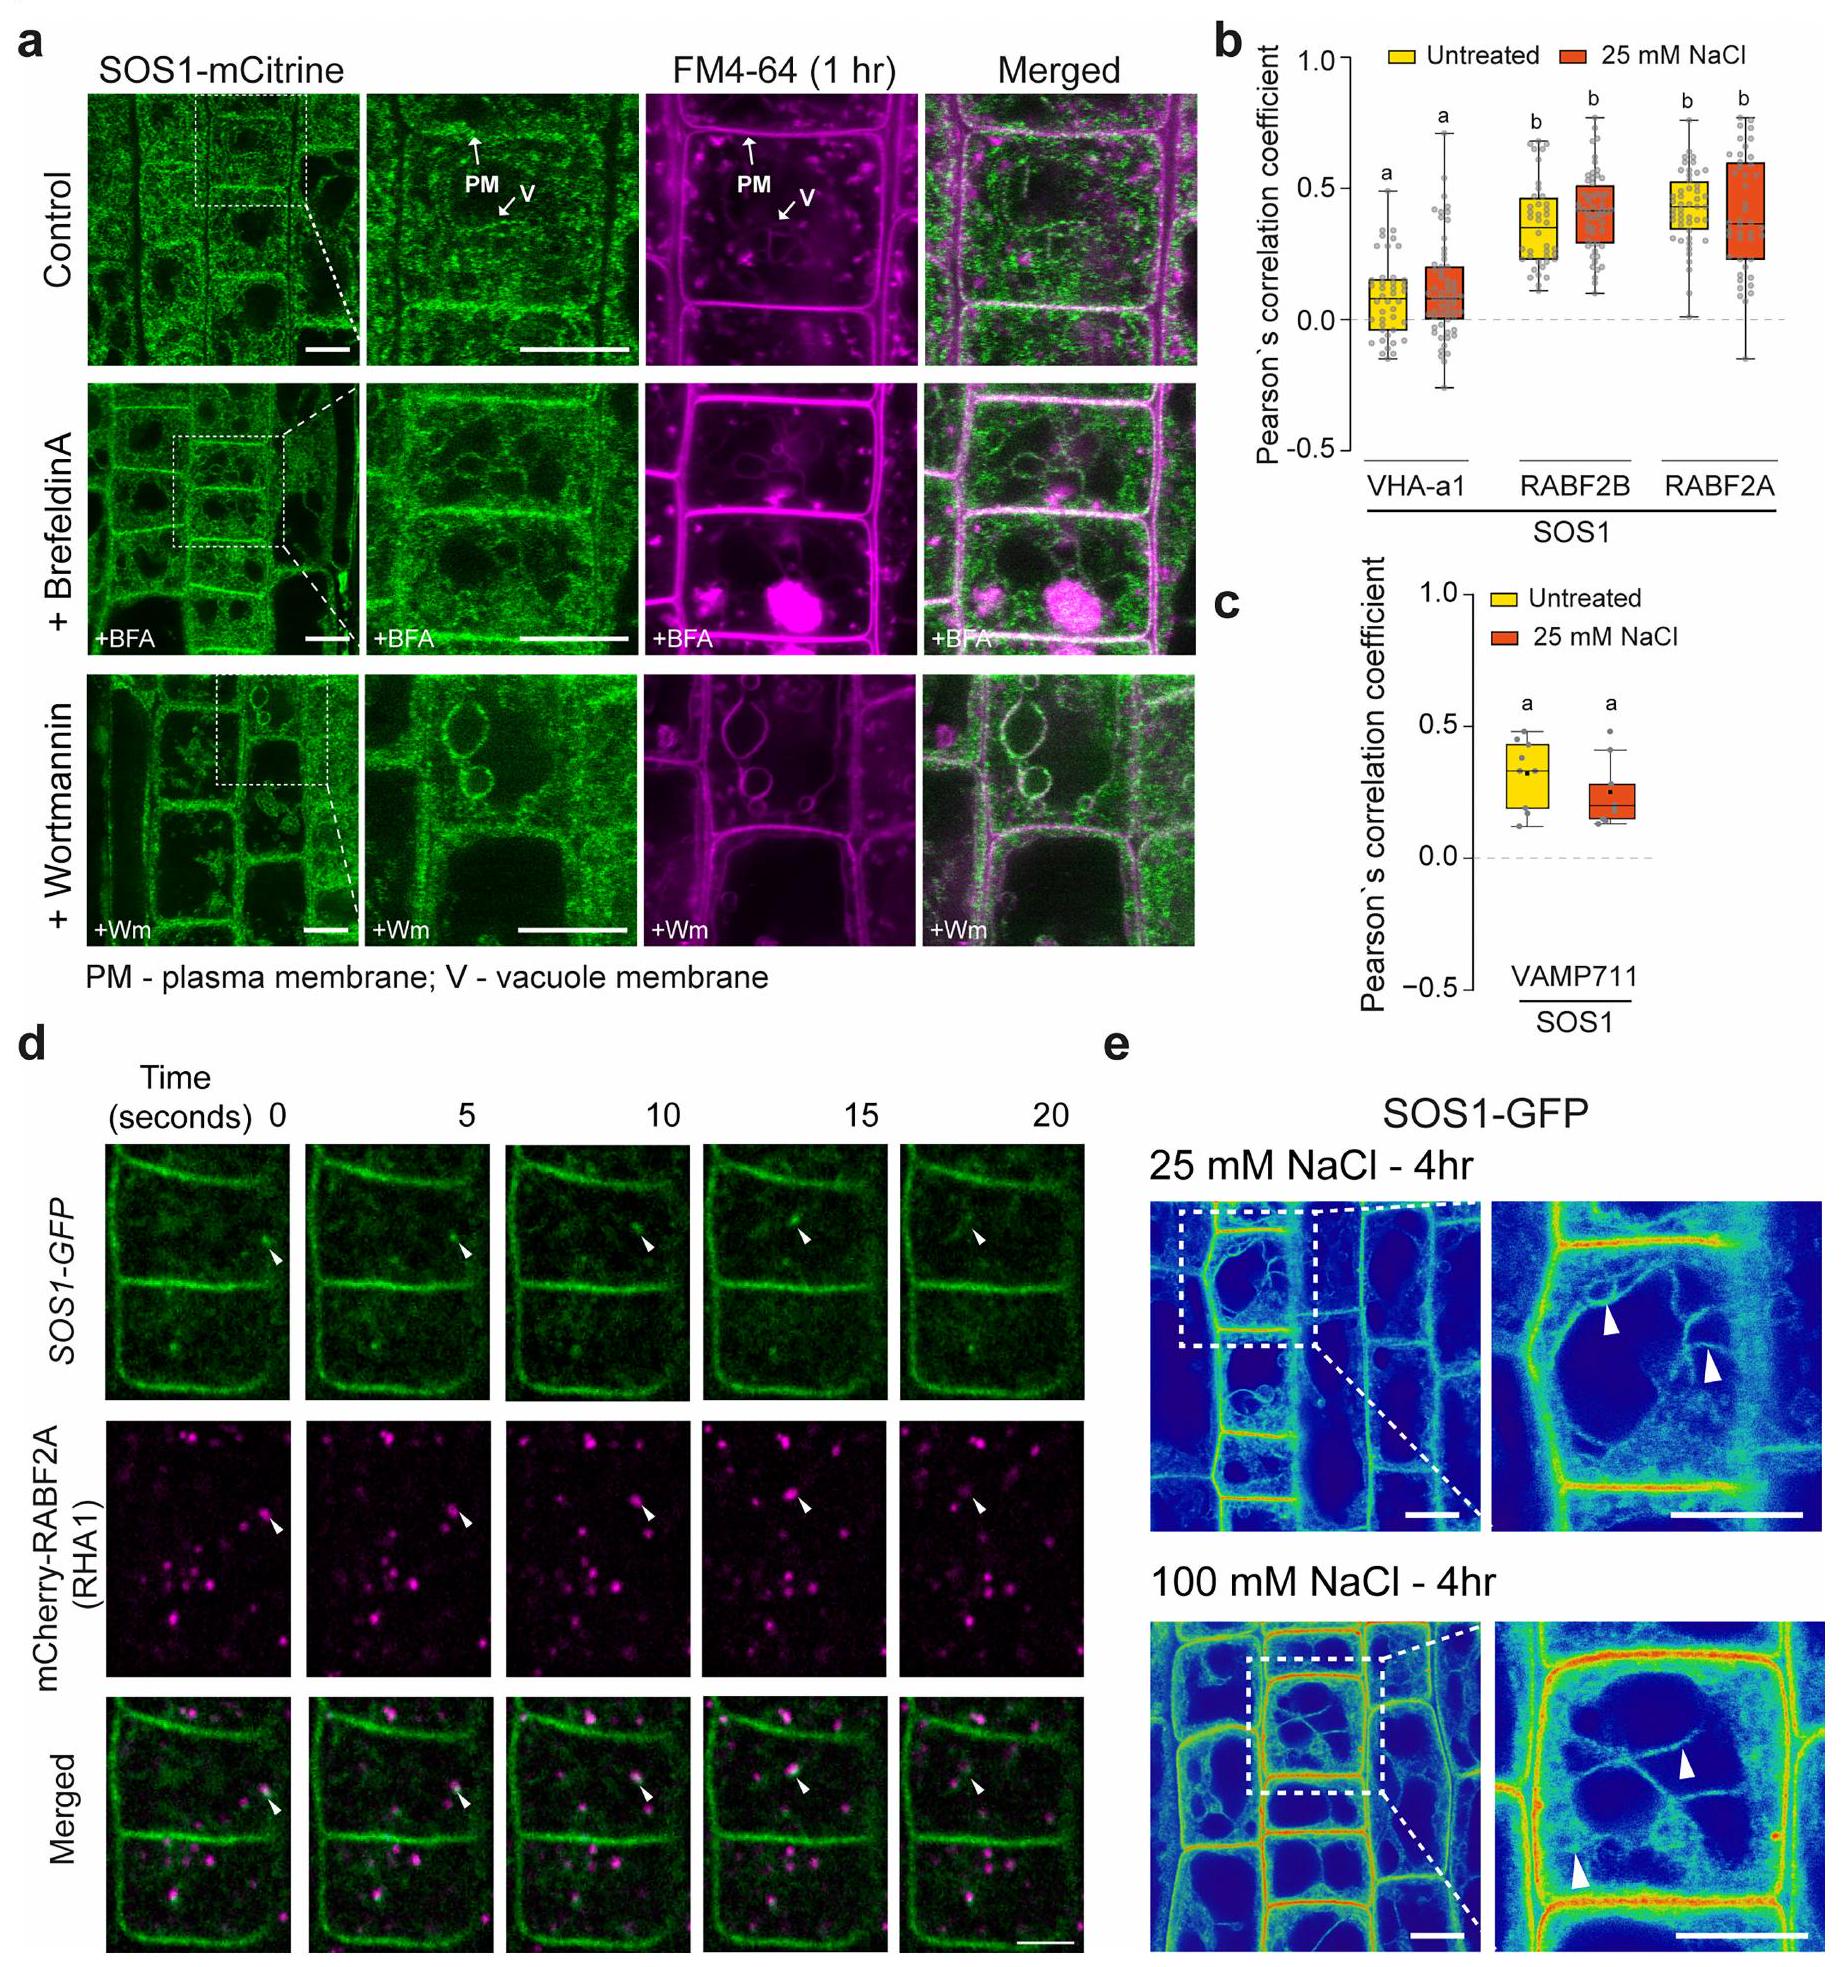
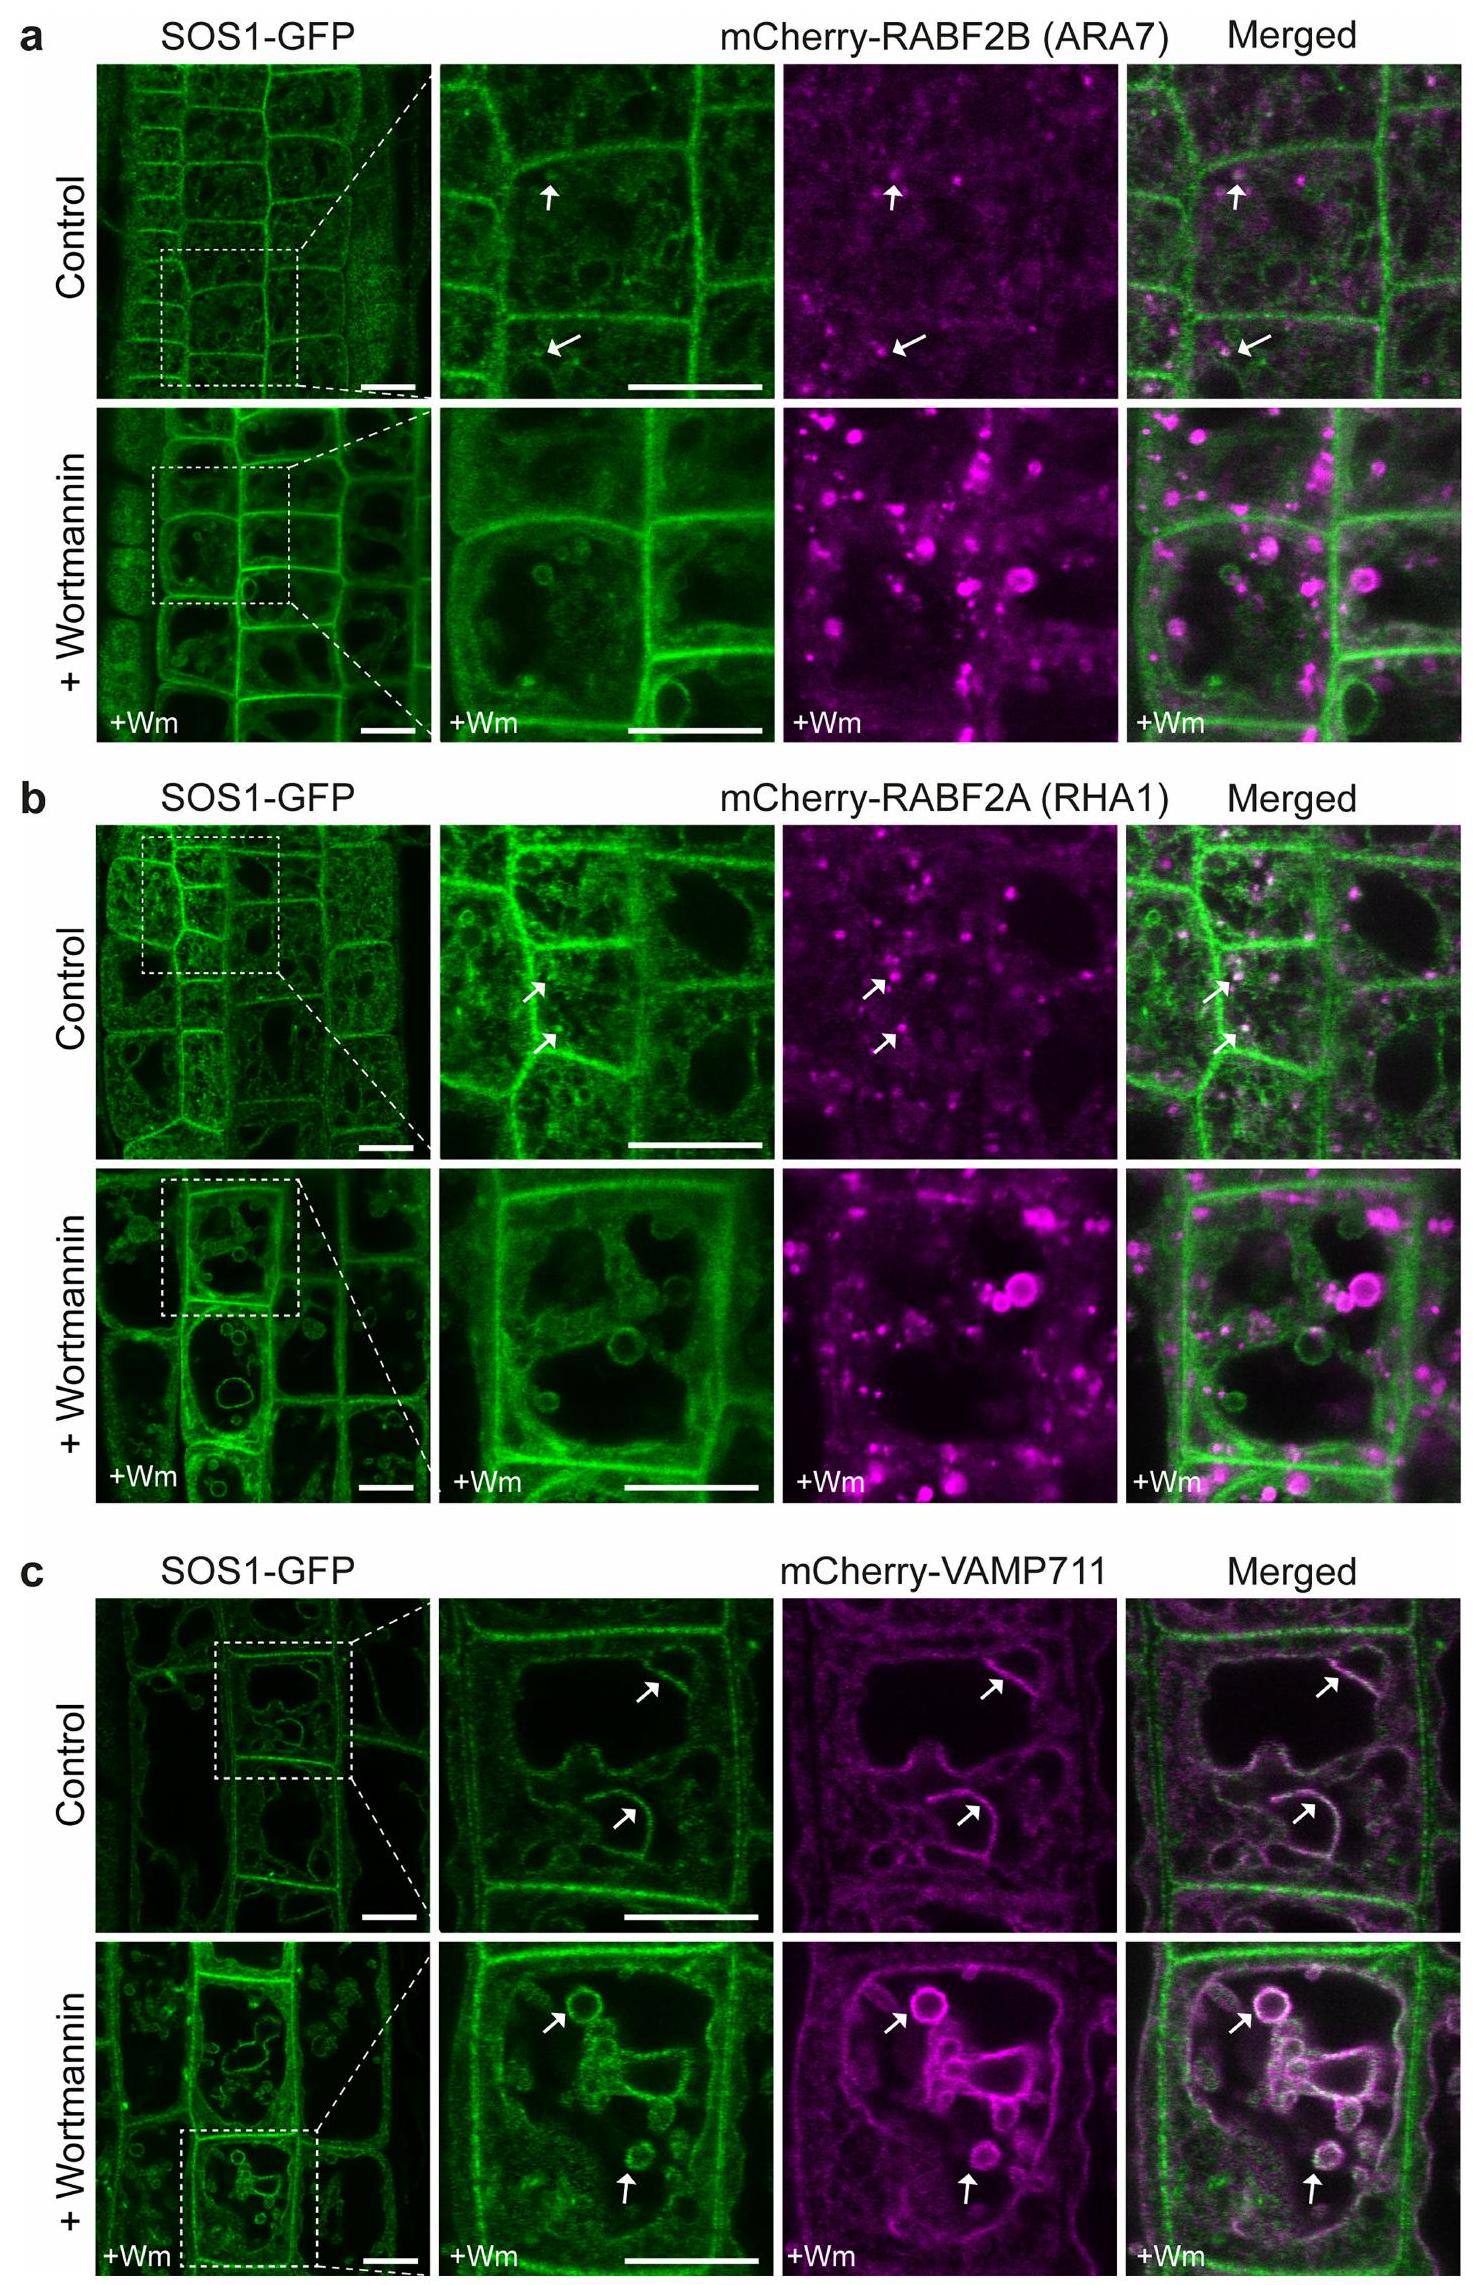
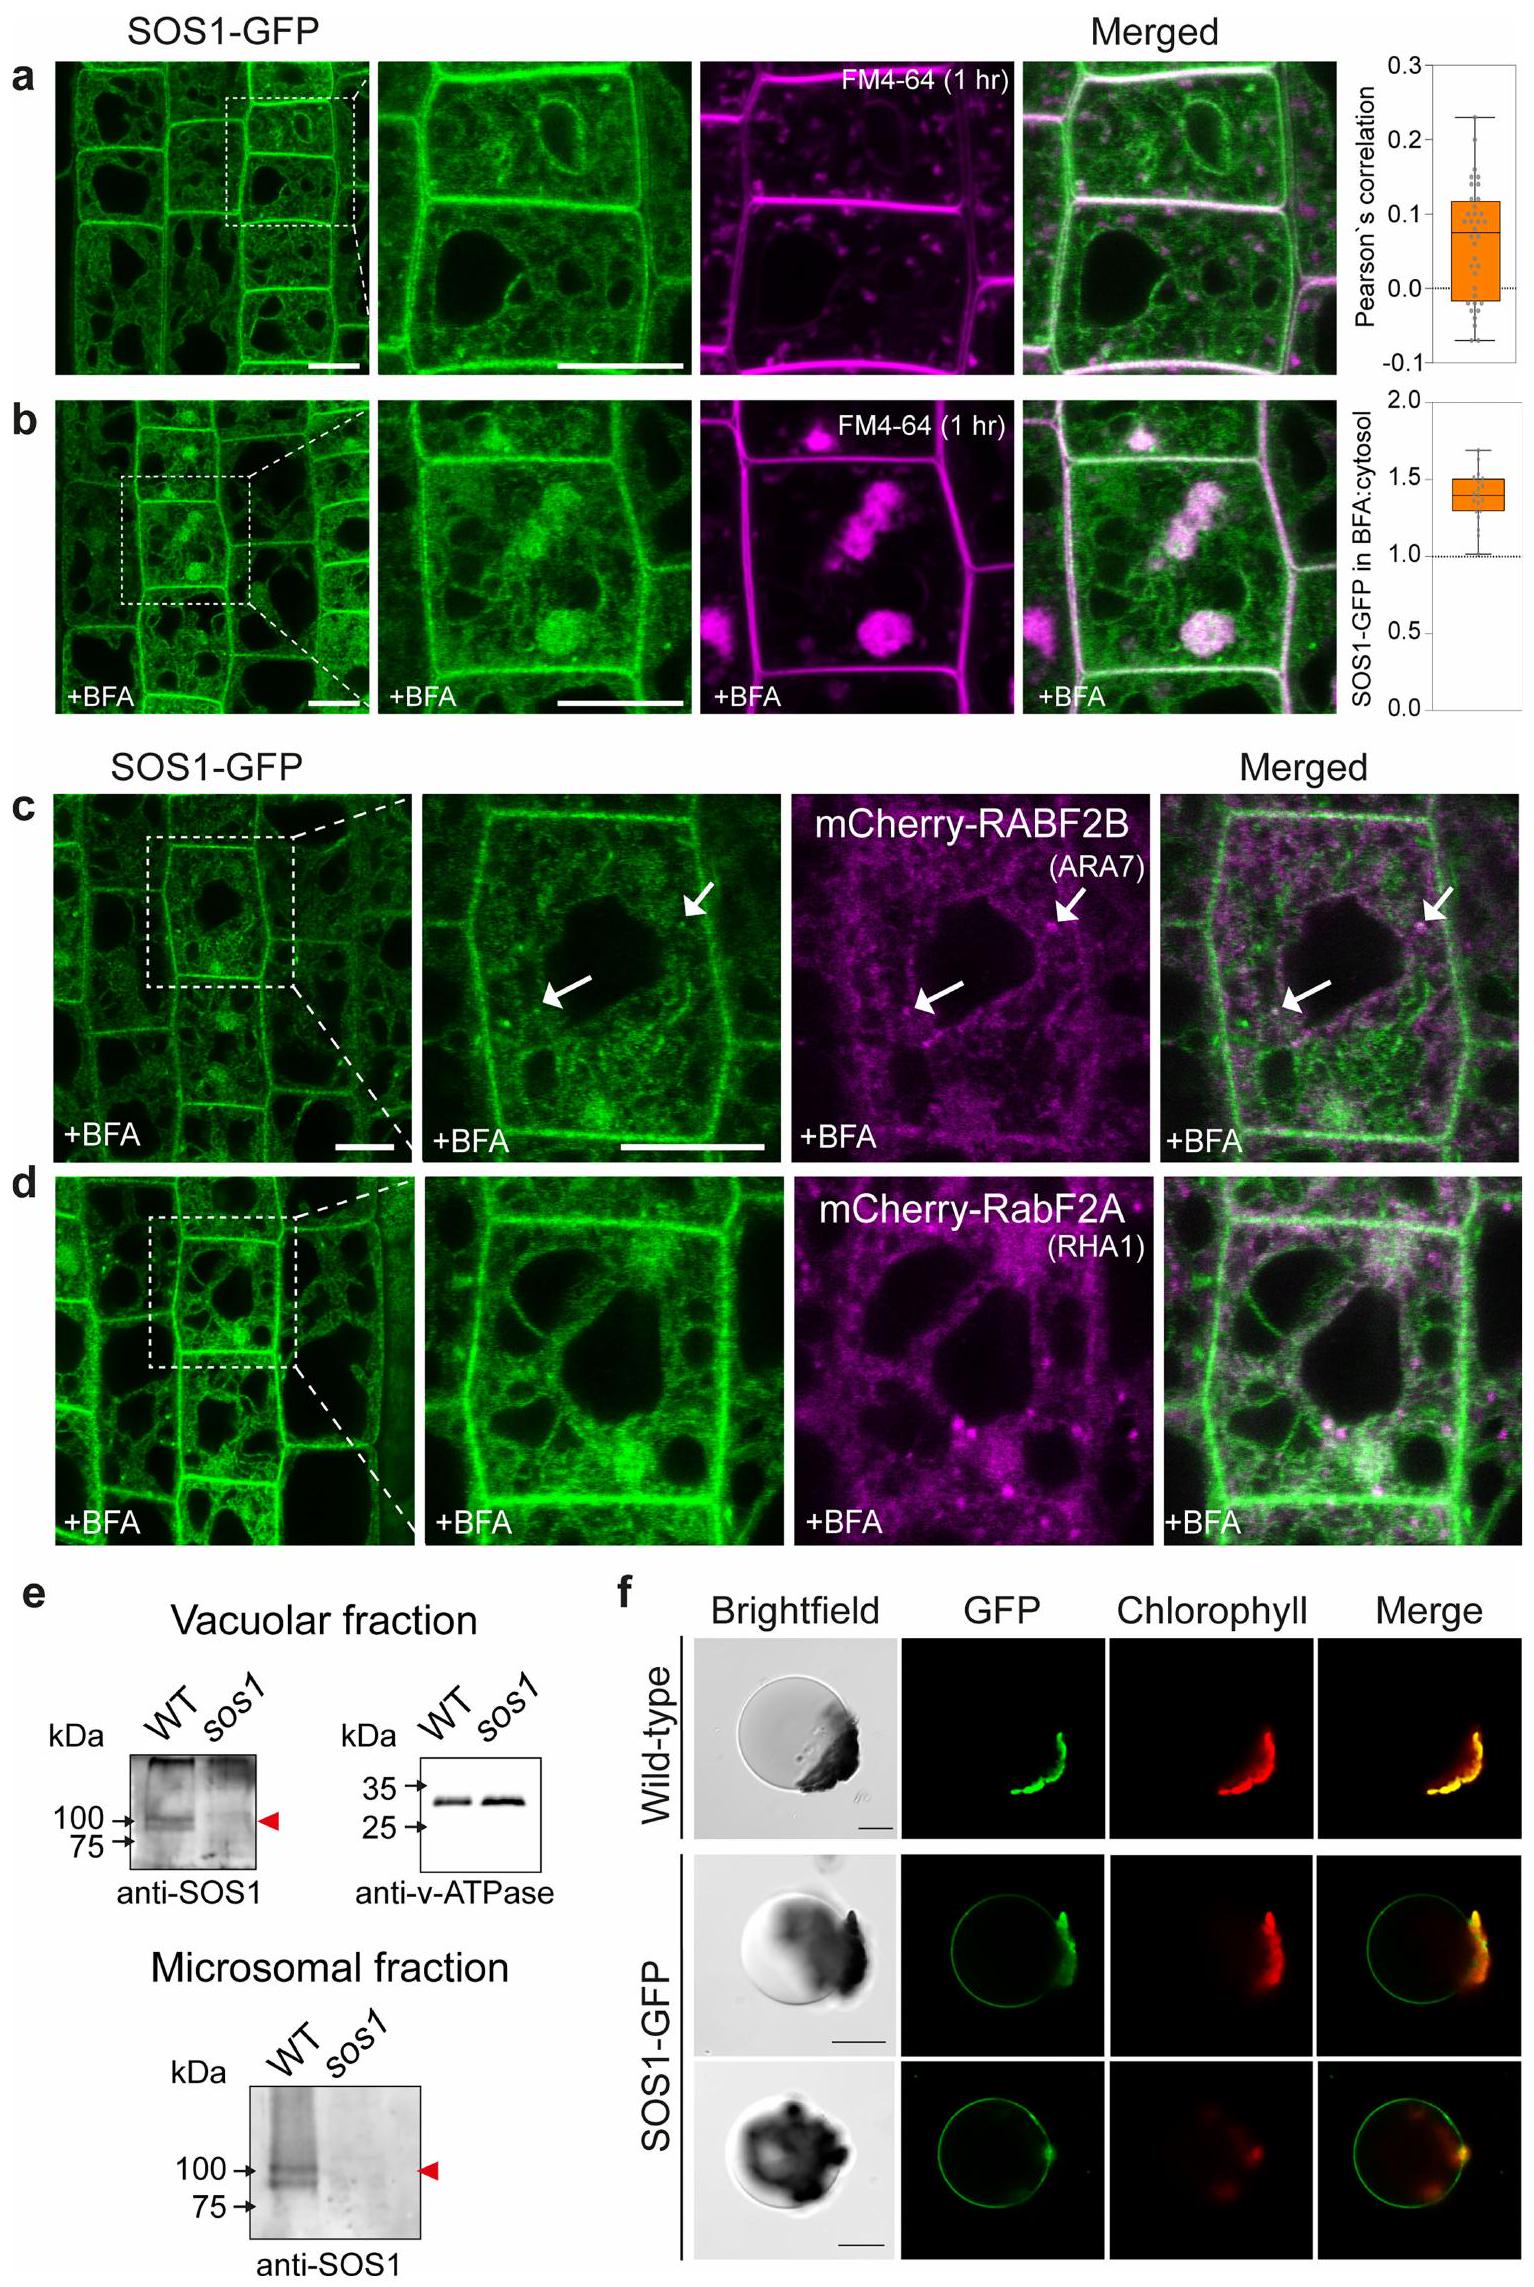
مع إشارات ضعيفة إلى حد ما (الشكل 4أ والشكل 6أ من البيانات الموسعة). أظهر المتغير الأول من البناء إشارة أعلى بشكل متسق، وأكثر سهولة في الملاحظة من الثاني، وبالتالي تم استخدامه في معظم التجارب المقدمة هنا (الشكل 4أ). من المدهش أن بناءات الاندماج المكملة لدينا أظهرت تراكمًا قويًا في حُقُب غشائية داخلية غير محددة، ذات طبيعة شبكية وكرية، وبعض درجة من تراكم الغشاء الطنيني، بالإضافة إلى ما تم الإبلاغ عنه من غشاء البلازما. توطين الغشاء (الشكل 4أ). عند القياس، تجاوزت إشارة الفلورسنت SOS1 المقاسة في حُجرات الأغشية الداخلية بشكل كبير تلك الموجودة في الغشاء البلازمي (الشكل 4ب). لم تتداخل هذه الحُجرات الداخلية بشكل كبير مع المؤشر الخاص بالتقاط الخلايا FM4-64 (امتصاص لمدة ساعة) (البيانات الموسعة الأشكال 6أ و8أ) ولا مع مؤشر الشبكة المبكرة للحويصلات/الشبكة الغولجية VHA-a1 (الشكل 4ج، البيانات الموسعة الشكل 6ب والفيديو التكميلية 1). تم تأكيد وجود SOS1 على كل من أغشية الحويصلات السابقة/الحويصلات المتأخرة وأغشية الحويصلات من خلال التداخل والهجرة المشتركة مع مؤشرات Rab للحويصلات المتأخرة (الشكل 4د، هـ، البيانات الموسعة الشكل 6ب والفيديو التكميلية 2) والتداخل مع بروتين SNARE للحويصلات mCherry-VAMP711 (بروتين الغشاء المرتبط بالحويصلات 711) (الشكل 4و والبيانات الموسعة الشكل 6ج).لم نلاحظ أي تغيير في توطين SOS1 عند تعرضه لإجهاد الملح (الشكل 4c-f اللوحة اليمنى والشكل التمديدي 6b,e)، باستثناء زيادة توطينه في الغشاء البلازمي، كما تم الإبلاغ عنه سابقًا.ومظهر مختلف للغشاء الفجوي، بسبب تغيير معروف في الهياكل الفجوية. أظهرت الهياكل الشبيهة بالحويصلات الإيجابية لـ SOS1 تداخلًا واضحًا وهجرة مشتركة مع علامات الحويصلات المتأخرة / الحويصلات السابقة، كما كان واضحًا في تحليلات الزمن المتقطع (الشكل التمديدي 6d والفيديو التكميلي 2). بشكل متسق، عند تطبيق مثبط كيناز PI3 وورتمانين، المعروف بتأثيره على الحويصلات الإيجابية لـ RabF، لوحظ أن SOS1-GFP و RABF2A يتداخلان في الهياكل السابقة للفجوات المتورمة الناتجة عن ورتمانين (الشكل التمديدي 7). بالمقابل، تسبب بريفيلدين A (BFA)، الذي يمنع الحويصلات المبكرة وإعادة التدوير، فقط في تراكم ضعيف لـ SOS1-GFP في “أجسام BFA”، مما دعم بشكل أكبر موقعه في الحويصلات المتأخرة (الشكل التمديدي 8b-d). يمكننا أيضًا إثبات أن الموقع الفجوي الملحوظ لـ SOS1 ليس بسبب وجود علامة بروتين فلورية، ولا بسبب خصوصية خلايا القمة الجذرية. لقد اكتشفنا SOS1 الداخلي على كسور أغشية الفجوات المحضرة من الأوراق، باستخدام جسم مضاد للببتيد المنقى (الشكل التمديدي 8e). وقد تم تأكيد ذلك من خلال إشارات SOS1-GFP الواضحة على تحضيرات الفجوات لخلايا الميزوفيل في الأرابيدوبسيس (الشكل التمديدي 8f).
الموقع الإضافي المتأخر في الحويصلات والفراغات الذي لوحظ هنا يتماشى تمامًا مع نشاط SOS1 في احتجاز الصوديوم في الفجوات، كما اقترحت بيانات CryoNanoSIMS (الأشكال 2 و 3). في الواقع، قد تكون النسب الكبيرة بين السطح والحجم لمكونات الحويصلات السابقة مفيدة لتخليص فعال من الصوديوم من السيتوسول واحتجازه في المساحات اللمعية التي تندمج في النهاية مع الفجوة وتقوم بتوصيل محتوياتها. تم اقتراح مثل هذا الآلية لاحتجاز الصوديوم سابقًا، استنادًا إلى الأهمية غير المتوقعة لنشاطات مضخات البروتون في الحويصلات (بدلاً من الفجوات) لتحمل الصوديوم..
كانت الملاحظات السابقة للصوديوم في النباتات غالبًا ما تخلط بين العديد من أنواع الخلايا داخل الأعضاء أو الأنسجة المعقدة.لقد سمح تطبيق تقنيتنا الجديدة للتصوير العنصري عالي الدقة على النباتات بوصف التعقيد غير المتوقع لإزالة سمية الصوديوم داخل خلايا القمة الجذرية الفردية، والتي تشمل الاحتفاظ في جدار الخلية والتخزين الفجوي، اعتمادًا على شدة الإجهاد الملحي. تُظهر ملاحظاتنا باستخدام CryoNanoSIMS، جنبًا إلى جنب مع التوطين غير المتوقع داخل الخلايا لمضاد الصوديوم/البروتون المركزي SOS1 في الأغشية الاندوسومية المتأخرة والفجوات، أن SOS1 يشارك بشكل حاسم في تخزين الصوديوم الفجوي بالإضافة إلى دوره في تدفق الصوديوم خارج سطح الخلية. في حالة تحميل الخشب، على سبيل المثال، تدعم الأدلة الواضحة نشاط SOS1 المعتمد على غشاء البلازما، مما يعاكس نشاط HKT1 الذي يعزز احتفاظ الصوديوم في الجذور، وكذلك في أعضاء أخرى.. قد يسمح هذه الدورة بالتبديل السريع للاحتفاظ بالجذور للصوديوم نحو النقل إلى الأنسجة الهوائية عند زيادة تركيزات الصوديومقد يؤدي غياب الأوعية الدموية المتمايزة في القمم الجذرية إلى جعل استراتيجية طرد الصوديوم غير فعالة، ويشرح دور التخزين الفجوي كاستراتيجية لإزالة السموم لهذه الخلايا القمية المهمة بشكل حاسم. من المهم أن نلاحظ أن عملنا مع مسبار CryoNanoSIMS يتيح لنا الحصول على بيانات في الموقع، ليست عن النقل، ولكن عن توزيع الأيونات تحت الخلوية، والتي نقارن فيها بين الطفرات والنمط الظاهري البري.
الشكل 4 | الموقع تحت الخلوي لمضاد ناقل الصوديوم/البروتون SOS1.
أ، تحديد موقع SOS1-GFP في خلايا البشرة الجذرية لنبات الأرابيدوبسيس في خطوط التكامل sos1. عرض مقرب لخلايا البشرة (المنطقة المحددة بالصندوق المنقط). لاحظ الإشارة القوية من حُقُب الأغشية الداخلية بالإضافة إلى الغشاء البلازمي (PM). الأسهم تبرز حُقُب الأغشية الداخلية (E) والفجوات (V). ب، قياس إشارة SOS1-GFP في الغشاء البلازمي وداخل الخلية (داخلي)، كما هو موضح في الرسم التخطيطي، والنسبة المقابلة لإشارة SOS1-GFP (داخلي:PM). يتم إعطاء الكثافة المصححة بوحدات عشوائية (a.u.). ج، لم يتداخل بروتين SOS1 مع علامة شبكة جولجي العابر VHA-a1 في خلايا البشرة الجذرية. يمكن ملاحظة غياب التداخل في الفيديو التكميلي 1. د، أظهر SOS1-GFP ارتباطًا جزئيًا مع mCherry-RABF2B (ARA7). الأسهم تبرز نقاط مختارة تظهر الارتباط. هـ، SOS1-GFP بدلاً من استبدال قياسات النقل، تضيف طريقتنا بُعدًا جديدًا مهمًا لفهم تعقيدات إزالة سمية الملح في النباتات. من الواضح أن قياسات النقل التقليدية لا يمكن استبدالها، لكنها صعبة التنفيذ جدًا بالنسبة للعضيات المحددة في أنواع الخلايا المحددة.
SOS1/NHX7 يتمتع بانتقائية عالية لنقل الصوديوم، في حين أن جميع متغيرات NHX الداخلية الأخرى التي تم اختبارها حتى الآن تميز بشكل ضعيف بين الصوديوم والبوتاسيوم كركائز للنقل.. ومع ذلك، تظهر نتائجنا في الأرز أنه، على الرغم من تراكم الصوديوم في الفجوات ارتباط جزئي مع mCherry-RABF2A (RHA1). لتتبع تزامن الحويصلات، قارن مع الشكل الإضافي 5b والفيديو التكميلية 2. f، عرض SOS1-GFP (الأخضر) تزامنًا كبيرًا مع علامة الغشاء البلازمي mCherry-VAMP711 (المغنتا). لجميع العلامات، يتم عرض التوطين بعد معالجة 25 مليمول من NaCl لمدة يوم واحد بواسطة الصور المقابلة على اليمين. الشتلات لـ و تم زراعتها في ظروف النمو 1 و لـتم زراعتها في ظروف النمو 2 (الطرق). قياس إشارة SOS1-GFP،تم فحص خلايا من أربعة جذور مختلفة بشكل مستقل. تُظهر الرسوم البيانية الصندوقية القيم الوسيطة (الخطوط الأفقية)، و25% (الصناديق) و75% (الخطوط الرأسية الرفيعة) من الربعيات، ويمثل المتوسط بالرمز المربع داخل الصندوق. للحصول على قياس ارتباط الحويصلات، يرجى الرجوع إلى الشكل 6b من البيانات الموسعة ومقاطع الفيديو التكميلية 1 و2. قضبان القياس، (أ) (نظرة عامة) (أ (إدراج)، ج-و). في القمم الجذرية، يتم الحفاظ على هذا التراكم، ويجب أن تتوسط ناقلات أخرى غير SOS1 هذا التراكم. بناءً على نتائجنا، سيكون من المهم إعادة تقييم دور نظائر SOS1 من عائلة NHX باستخدام CryoNanoSIMS، حيث تم تحديد موقع عدة أعضاء من عائلة NHX في الحُويصلات والمقصورات الإندوسومية ويُعتقد أنها تتوسط احتجاز الفجوات بشكل مستقل عن SOS1 (المراجع 30، 33). متسقة مع نتائجنا، تم الإبلاغ عن أن غياب جميع أعضاء عائلة NHX الفجوية (NHX1-4) في الأرابيدوبسيس لم يُلغِ تراكم NaCl الفجوي في الأرابيدوبسيس، وهي نشاط قد يتم التوسط فيه. من خلال SOS1 الموجود في الفجوات (المرجع 34). ومن المثير للاهتمام، أن تقريرًا حديثًا عن نوع النبات الذي يتحمل الملح بشكل كبير، Salicornia bigelovii، وجد وجود نظير محتمل لـ SOS1 في كسور أغشية الفجوات من أنسجة الأوراق.تم اقتراح أن هذه الحالة تمثل حالة من النيوفانكشنالية لـ SOS1 في هذه النبتة المتكيفة بشكل كبير مع الملح، من أجل الاحتجاز الفجوي بدلاً من الطرد إلى جدار الخلية. بدلاً من ذلك، تشير بياناتنا إلى أن الاحتجاز الفجوي هو في الواقع وظيفة محفوظة لـ SOS1، حيث نجد توطين SOS1 في الحويصلات/الفجوات ليس فقط في خلايا القمة الجذرية، ولكن أيضًا في نسيج الأوراق من الأرابيدوبسيس، وهو نبات جليكوفايت يتحمل الملح بشكل مشابه جدًا لجميع الأنواع الرئيسية من المحاصيل.
من منظور أوسع، لقد أظهرنا أن CryoNanoSIMS يمكّن من التصوير المباشر متعدد العناصر بدقة دون الخلوية، ليس فقط في الأرابيدوبسيس، ولكن أيضًا في الأرز، كنوع رئيسي من المحاصيل ونموذج أحادي الفلقة. وهذا يعد بحدوث اختراقات في فهمنا للتوازن العنصري في النباتات، من خلال معالجة مجموعة واسعة من الأسئلة الأساسية المتعلقة باكتساب وتوزيع العناصر الغذائية الكبرى الأخرى المهمة زراعيًا مثل البوتاسيوم والكالسيوم والمغنيسيوم؛ خاصة عند دمجه مع الطفرات الناقلة المتاحة والمميزة بالفعل. علاوة على ذلك، فإن CryoNanoSIMS لديه القدرة على تقديم رؤى حول الأدوار الحية للعديد من الناقلات التي لم يتم التعرف عليها بعد، أو التي لم يتم وصفها بشكل كافٍ. أخيرًا، لقد أظهرنا أنه حتى العناصر الدقيقة أو العناصر النزرة، مثل الحديد أو المنغنيز، يمكن تصويرها بهذه التقنية (الشكل 1c). منطقة أخرى لم يتم استكشافها حاليًا ولها إمكانيات كبيرة ستكون استخدام النظائر لقياسات تدفق العناصر، للسماح بتتبع امتصاصها وتوزيعها.
المحتوى عبر الإنترنت
أي طرق، مراجع إضافية، ملخصات تقارير Nature Portfolio، بيانات المصدر، بيانات موسعة، معلومات إضافية، شكر وتقدير، معلومات مراجعة الأقران؛ تفاصيل مساهمات المؤلفين والمصالح المتنافسة؛ وبيانات توفر البيانات والرموز متاحة علىhttps://doi.org/10.1038/s41586-024-08403-y.
12. ميتزنر، ر.، شنايدر، هـ. ي.، بروير، أ. وشرودر، و. هـ. تصوير توزيع العناصر الغذائية في أنسجة النبات باستخدام مطيافية الكتلة للأيونات الثانوية بتقنية زمن الطيران والمجهر الإلكتروني الماسح. فيزيولوجيا النبات 147، 1774-1787 (2008). 13. تشاندرا، س.، بيرنيوس، م. ت. وموريسون، ج. هـ. التوطين داخل الخلايا للعناصر القابلة للتشتت في العينات البيولوجية المجمدة والمائية باستخدام مجهر الأيونات. التحليل الكيميائي 58، 493-496 (1986). 14. ديروي، سي. وآخرون. تصوير ديناميكي-SIMS وقياس الأيونات غير العضوية في عينات النباتات المجمدة والمائية. تقنية البحث المجهري 69، 53-63 (2006). 15. بالين، ر. وجيتمان، أ. دور البكتين في تشكل النباتات. نظم حيوية 109، 397-402 (2012). 16. روماني، أ. م. ب. في المغنيسيوم في الجهاز العصبي المركزي (تحرير فينك، ر. ونيتشيفور، م.) الفصل 2 (جامعة أديلايد برس، 2011). 17. وو، س. ج.، دينغ، ل. وزو، ج. ك. SOS1، موقع جيني أساسي لتحمل الملح واكتساب البوتاسيوم. خلية النبات 8، 617-627 (1996). 18. شي، هـ.، إيشيتاني، م.، كيم، ج. & زو، ج.-ك. جين تحمل الملح في الأرابيدوبسيس ثاليانا SOS1 يشفر بروتينًا افتراضيًاناقل مضاد. وقائع الأكاديمية الوطنية للعلوم في الولايات المتحدة الأمريكية 97، 6896-6901 (2000). 19. شي، هـ.، كوينتيرو، ف. ج.، باردو، ج. م. وزو، ج.-ك. الغشاء البلازمي المفترضالناقل المضاد SOS1 يتحكم في المسافات الطويلةالنقل في النباتات. خلية النبات 14، 465-477 (2002). 20. ماثيوس،التغذية والسُمية: أساس الخلايانسب. آن. بوت. 84، 123-133 (1999). 21. بينيتو، ب.، هارو، ر.، أمتمن، أ.، كوين، ت. أ. ودراير، إ. التوائموفي النباتات. ج. فيزيولوجيا النبات. 171، 723-731 (2014). 22. المهى، ح. وآخرون. دور حاسم لتدفق الصوديوم عبر الغشاء البلازميالمبادل SOS1 في تحمل الأرز للملوحة. فيزيولوجيا النبات. 180، 1046-1065 (2019). 23. مارتينيز-أتيينزا، ج. وآخرون. الحفاظ على مسار الحساسية المفرطة للملح في الأرز. فيزيولوجيا النبات. 143، 1001-1012 (2007). 24. وانغ، ي. وآخرون. بنية وآلية التثبيط الذاتي لغشاء البلازماالناقل المعاكس SOS1 في الأرابيدوبسيس. نات. كوميونيك. 14، 4487 (2023). 25. جيلدنر، ن. وآخرون. تحليل سريع وتركيبي لمكونات الأغشية في النباتات السليمة باستخدام مجموعة علامات متعددة الألوان. مجلة النبات 59، 169-178 (2009). 26. غاميز-أرجونا، ف. وآخرون. التنظيم العكسي لموقع واستقرار بروتينات SOS1 و HKT1 بواسطة SOS3/CBL4 في الأرابيدوبسيس ثالiana. وقائع الأكاديمية الوطنية للعلوم في الولايات المتحدة الأمريكية 121، e232O657121 (2024). 27. كريبس، م. وآخرون. نشاط V-ATPase في الطونوبلاست في الأرابيدوبسيس مطلوب لتخزين المغذيات بكفاءة ولكن ليس لتراكم الصوديوم. وقائع الأكاديمية الوطنية للعلوم في الولايات المتحدة الأمريكية 107، 3251-3256 (2010). 28. حماجي، ك. وآخرون. الجوانب الديناميكية لتراكم الأيونات بواسطة حركة الحويصلات تحت ضغط الملح في الأرابيدوبسيس. فيزيولوجيا خلايا النبات. 50، 2023-2033 (2009). 29. كرونزوكر، هـ. ج. و بريتو، د. ت. نقل الصوديوم في النباتات: مراجعة نقدية. نيو فيتولوجي. 189، 54-81 (2011). 30. أبس، م. ب.، أهرون، ج. س.، سنيدن، و. أ. وبلوموالد، إ. تحمل الملح الناتج عن التعبير المفرط عن الفجوةمضاد النقل في الأرابيدوبسيس. ساينس 285، 1256-1258 (1999). 31. أوشياما، ت. وآخرون. HKT1الناقل يحمي خصوبة النبات عن طريق تقليلالمحتوى في خيوط السداة. Sci. Adv. 9، eadg5495 (2023). 32. راداتز، ن.، موراليس دي لوس ريوس، ل.، لينداهل، م.، كوينتيرو، ف. ج. & باردو، ج. م. النقل المنسق للنترات والبوتاسيوم والصوديوم. فرونت. بلانت ساي. 11، 247 (2020). 33. باسل، إ. وآخرون. الخلايا الداخلية في الأرابيدوبسيسالناقلات المعاكسة NHX5 و NHX6 مرتبطة بالجسيمات الحالة الضرورية لنمو النبات وتطوره. خلية النبات 23، 224-239 (2011). 34. باسل، إ.، زانغ، س.، غونغ، هـ.، تاجيما، هـ. وبلوموالد، إ. خصوصية الكاتيونات لنوع NHX في الفجواتمضادات النقل. فيزيولوجيا النبات. 179، 616-629 (2019). 35. سالازار، أ. ر. وآخرون. إعادة توطين SOS1 في الغشاء البلازمي والبروتين RGG SALTY مهمان في تحمل الملوحة الشديدة لنبات سالكورنيا بيغيلوفي. نات. كوم. 15، 4279 (2024).
ملاحظة الناشر: تظل شركة سبرينغر ناتشر محايدة فيما يتعلق بالمطالبات القضائية في الخرائط المنشورة والانتماءات المؤسسية.
الوصول المفتوح هذه المقالة مرخصة بموجب رخصة المشاع الإبداعي النسب-غير التجارية-عدم الاشتقاق 4.0 الدولية، التي تسمح بأي استخدام غير تجاري، ومشاركة، وتوزيع، واستنساخ في أي وسيلة أو صيغة، طالما أنك تعطي الائتمان المناسب للمؤلفين الأصليين والمصدر، وتوفر رابطًا لرخصة المشاع الإبداعي، وتوضح إذا قمت بتعديل المادة المرخصة. ليس لديك إذن بموجب هذه الرخصة لمشاركة المواد المعدلة المشتقة من هذه المقالة أو أجزاء منها. الصور أو المواد الأخرى من طرف ثالث في هذه المقالة مشمولة في رخصة المشاع الإبداعي الخاصة بالمقالة، ما لم يُشار إلى خلاف ذلك في سطر الائتمان للمادة. إذا لم تكن المادة مشمولة في رخصة المشاع الإبداعي الخاصة بالمقالة واستخدامك المقصود غير مسموح به بموجب اللوائح القانونية أو يتجاوز الاستخدام المسموح به، ستحتاج إلى الحصول على إذن مباشرة من صاحب حقوق الطبع والنشر. لعرض نسخة من هذه الرخصة، قم بزيارة http:// creativecommons.org/licenses/by-nc-nd/4.0/. (ج) المؤلف(ون) 2025
طرق
مواد نباتية
للتجارب، تم استخدام نوع الأربيذوبس ثاليانا كولومبيا-0 (Col-0) المعروف باسم WT وطافرة الحساسية المفرطة للملح 1 (sos1) في خلفية Col-0 gl-1؛ تم تحديد أليل sos1-1 سابقًا في فحص باستخدام الإيثيل ميثان سلفونات.. تم تقديم التركيبات المنشورة التالية إما عن طريق التحويل أو التهجين إلى sos1: SOS1-GFP (المرجع 26)؛ VHA-A1-RFP (AT2G28520: ATPASE البروتون الفجوي A1)؛ mCherry-RABF2A (AT5G45130: RHA1 أو ARABIDOPSIS RAB HOMOLOG F2A)؛ mCherry-RABF2B (AT4G19640: ARA7 أو ARABIDOPSIS RAB GTPASE HOMOLOG F2B)؛ mCherry-VAMP711 (AT4G32150: بروتين الغشاء المرتبط بالحويصلة 711) (المراجع 25، 36). الأرز (Oryza sativa) cv. Nipponbare (WT) والطافرة Ossos1 هي خطوط تم وصفها سابقًا..
نمو النباتات بالزراعة المائية
تم زراعة الشتلات تحت ظروف قياسية على أطباق أagar من وسط موراشيجي-سكوغ (MS) نصف القوة القياسية، وتم تعريضها لمستويات منخفضة ومتغيرة من الصوديوم، مما أدى إلى وجود خلفية عالية من الصوديوم في صور CryoNanoSIMS. لضمان نقطة انطلاق مضبوطة للتجارب اللاحقة المتعلقة بإجهاد الملح، كان من الضروري استخدام وسط نمو خالٍ من الصوديوم. تم تحقيق ذلك باستخدام نظام الزراعة المائية وبتطبيق تركيبة وسط خالية من الصوديوم (المشار إليها في جميع أنحاء المخطوطة بوسط خالٍ من الصوديوم) للسماح بإجراء تجارب إجهاد الملح بشكل كامل ومضبوط لتجارب النمو.
تركيب وسط MS السائل الخالي من الصوديوم للزراعة المائية. كان الوسط الخالي من الصوديوم مكونًا من محلول مغذيات ماكرو العناصر الأساسي MS (رقم التركيبة M0654؛ سيغما-ألدريتش) كمصدر للعناصر الكبيرة. تم تحضير كل محلول من العناصر الدقيقة بشكل منفصل وتم تحضير جميع المحاليل باستخدام مياه MilliQ. تم استخدام العناصر الدقيقة الأساسية، الخالية من المركبات المحتوية على الصوديوم، بالتركيزات التالية:حمض البوريككبريتات النحاس خماسية الماءملح حمض الموليبدينوم الأمونيوم سباعي الماءيوديد البوتاسيوم (KI)كلوريد الكوبالت (II) سداسي الهيدرات III (كيمياء برونشفغ AG، سويسرا) كبريتات المنغنيز (II) أحادي الهيدرات و كبريتات الزنك سباعية الماءتم إضافة 2.5 مليمول من محلول MES (حمض 2-مorpholinoethanesulfonic) وتم ضبط الرقم الهيدروجيني على 5.7 باستخدام KOH وتم تعقيم المحلول. للمقارنة مع وسط MS السائل نصف القوة، تم زراعة الشتلات في محلول MS السائل نصف القوة المعقم، وتم ضبط الرقم الهيدروجيني على 5.7 باستخدام KOH. نمو الأرابيدوبسيس. تم زراعة بذور الأرابيدوبسيس المعقمة على قرص مثقوب مبلل موضوع في طبق زراعة معقم مكون من 12 بئرًا وتم تعريضها للظلام لمدة يومين. كان حجم مسام القرص حوالي، مما منع البذور من السقوط، ولكنه كان كافياً لجذور النباتات لتنمو. بعد عملية الطبقية، تم إضافة 4 مل من الوسط الخالي من الصوديوم بعناية إلى الآبار مما سمح للأقراص التي تحتوي على البذور بالطفو. تم نقل الإعداد إلى غرف النمو في مع ضوء مستمر ونمت لمدة 5 أيام. بالنسبة لعلاجات NaCl، تم استخدام محاليل مخزنة تم إعدادها في ماء MilliQ وتم معالجة الشتلات مباشرة بـ و 100 مليمول من NaCl للأوقات المحددة في نظام الزراعة المائية تحت ظروف معقمة، ثم تم أخذ عينات للتحليل باستخدام سير العمل بالتبريد الموضح أدناه (الشكل 1أ). تم مقارنة نمو الجذور في نظام الزراعة المائية مع وسط نمو MS نصف القوة القياسي والنمو على أطباق الأجار (الشكل التمديدي 1أ). تم اختبار تركيزات Na لإجهاد النمو على أطباق الأجار وتم اختيار ظروف المعالجة لعلاج الزراعة المائية (الشكل التمديدي 1د). نمو الأرز. تم إنبات بذور الأرز المعقمة على ورق ترشيح مبلل لمدة 3 أيام في الظلام ثم تم نقلها إلى نظام الزراعة المائية على ورق ترشيح معقم مثقوب مع وجود الفلقات في اتصال مع نفس الوسط الخالي من الصوديوم الموصوف أعلاه. تم الاستمرار في النمو في إعدادات الزراعة المائية في غرفة النمو مضبوطة علىمع إضاءة مستمرة ونمت لمدة 5 أيام. تم إعطاء علاجات الملح عن طريق إضافة NaCl مباشرة إلى نظام الزراعة المائية ثم تم أخذ عينات للتجميد تحت ضغط عالٍ (انظر أدناه) في النقطة الزمنية المحددة.
سير عمل CryoSEM-CryoNanoSIMS
يمكن العثور على وصف عام لعملية عمل CryoNanoSIMS في المرجع 1. هنا نصف عملية عمل محددة تم تحسينها للنباتات التي تركز على قمم الجذور في الأرابيدوبسيس، كما هو موضح في الشكل 1 والشكل الإضافي 1.
تحضير العينة والتجميد تحت ضغط عالٍ. يتم تلخيص هذه العملية بشكل تخطيطي في الشكل 1a. للتجميد تحت ضغط عالٍ، تم نقل الشتلات برفق إلى طبق بتري صغير مع الوسط. الجذور (نصف القطر تقريبًا ) تم قطعها تقريبًا 3 مم من الطرف وتم وضعها على الفور في -قطرها مغطاة بالذهب من نوع A حامل نحاسي مع تجويف يبلغ 0.1 مم (المقالة 1322، Wohlwend GmbH، سينوالد، سويسرا) مملوءة بالمواد الحافظة للتبريد ديكسترانفي 50 مليمول من MES، pH 5.7) ثم تم تغطيته بالجانب المسطح لحامل العينات من الألمنيوم من النوع B (المادة 1313، Wohlwend GmbH، سيني والد، سويسرا) وتم تجميده مباشرة تحت ضغط عالٍ باستخدام جهاز EM ICE (لايكا). من هذه النقطة فصاعدًا في سير العمل، تم الحفاظ على العينات والتعامل معها تحت ظروف تجميد صارمة.
تخطيط العينة الزجاجية المجمدة. تم تحميل حوامل النحاس مع عينات الجذور في حامل العينات داخل جهاز ليكا EMVCM مع بيئة تجميد مستقرة (سائلحمام) وتم نقله إلى غرفة تجميد ليكا EM FC7 على جهاز الميكروتوم الفائق ليكا EM UC7 مع الحفاظ على الغرفة وحامل العينة عندتم إنشاء سطح مستوٍ وناعم، وهو أمر ضروري لتصوير CryoNanoSIMS، باستخدام سكين الماس المقطوع Cryo TRIM20 (Diatome، بيل)، مما أدى إلى توليد وجه كتلة سطحية تحتوي على قسم من عينة الجذر. تم استخدام سكين الماس Cryo TRIM20 Diatome لمزيد من تنعيم سطح العينة.
من هذه النقطة فصاعدًا، يتم استخدام شاحنة نقل فراغية بالتبريد (VCT) من نوع لايكا EM VCT500، تحمل العينة عند حواليفي فراغ من، تم استخدامه لنقل العينة بين أدوات مختلفة.
نقش التجميد. تم نقل العينات إلى جهاز طلاء المعادن بالليزر البارد EM ACE600 من ليكا تحت ظروف تجميد، وتم ضخها إلى فراغ منتمت عملية التسامي للعينات بدورة حرارة حيث تم رفع درجة حرارتها منإلىأكثر من 20 دقيقة، محتجز فيلمدة 90 ثانية ثم انخفضت إلىأكثر من 20 دقيقة بمعدل انحدار. تم تحسين هذه الإعدادات تجريبيًا لإزالة تلوث الجليد السطحي وإبراز التفاصيل فوق الدقيقة لشرائح الجذر، والتي يمكن تصويرها في جهاز المسح الإلكتروني الماسح بالتبريد (cryoSEM).
تغطية معدنية وتصوير باستخدام cryoSEM. قبل تصوير cryoSEM، تم تغطية سطح العينة بطبقة تبلغ حوالي 3 نانومتر من PtC باستخدام جهاز تغطية المعادن Leica cryo-eBeam (EM ACE600). ثم تم تصوير الجذور باستخدام مجهر إلكتروني من نوع Zeiss Gemini 500 مع منصة تبريد Leica تعمل عندمع الفراغ عندتم الحصول على الصور باستخدام كاشف Inlens وجهد تسريع قدره 1.7 كيلو فولت مع مسافة عمل تبلغ 3.5 مم وحجم فتحةصور عالية الدقة لـتم الحصول على صور بكسل لكل من نظرات عامة على عينات الجذور وعند تكبير أعلى من مناطق الاهتمام على سطح العينة. خدمت هذه الصور بتقنية CryoSEM لاختيار وربط مناطق مقاطع الجذور مع تصوير CryoNanoSIMS.
طلاء معدني ثانٍ. تم إعادة العينات مع VCT تحت الفراغ من cryoSEM إلى جهاز الطلاء المعدني Leica cryo-eBeam EM ACE600. تم ترسيب طبقة إضافية تبلغ حوالي 17 نانومتر من PtC على سطح العينة وتم الحفاظ عليها عند. كان هذا ضروريًا لزيادة الموصلية وتفريغ الشحن السطحي أثناء
تحليل CryoNanoSIMS. تم نقل العينة بعد ذلك باستخدام VCT إلى CryoNanoSIMS للتصوير.
تصوير CryoNanoSIMS. تم إجراء رسم خرائط عنصري باستخدام جهاز CryoNanoSIMS الجديد داخل مختبر الكيمياء الحيوية البيولوجية في EPFL.تم الحصول على الصور بشكل منهجي على القمة الجذرية مع خلايا البشرة في المنطقة التي تنتقل فيها الخلايا من الانقسام إلى الاستطالة (البيانات الموسعة الأشكال 1c و 4a). تم تجنب مناطق سطح العينة التي تحتوي على تلوث من الجليد أو الجسيمات (مرئية في صور الكريوSEM). تم تحضير المناطق المختارة للتصوير لمدة 5 دقائق باستخدام تقنية التفريغ غير المركّز.حزمة الأيونات بجرعة إجمالية تبلغ حواليأيونات لكل، لإزالة الطلاء المعدني. ثم تم قصف سطح العينة بشعاع أيوني أولي بقوة حوالي 20 بيكو أمبيرأيونات مركزة إلى حجم نقطة يبلغ حوالي 400 نانومتر. صور لـمعتم الحصول على البيكسلات عن طريق تمرير هذا الشعاع الأساسي عبر سطح العينة مع وقت إقامة بيكسل قدره 5 مللي ثانية. الأيونات الثانويةوتم جمعها في نفس الوقت في مضاعفات الإلكترون بدقة كتلة تبلغ حوالي 7000 (تعريف كاميك)، وهو ما كان كافياً لحل جميع التداخلات الكتلية. تم تسجيل ما مجموعه ست دورات اكتساب لمدة إجمالية تبلغ حوالي 35 دقيقة لكل صورة (الشكل 1b من البيانات الموسعة). من المهم، مع هذه الإعدادات التحليلية،والأيونان اللذان لهما أهمية مباشرة لهذه الدراسة كانا قابلين للاكتشاف بوضوح في جميع أجزاء نسيج النبات من جميع الظروف التجريبية (الشكل البياني الموسع 2)، مما جعل المقارنة المباشرة الإحصائية لتوزيعات الصوديوم والبوتاسيوم النسبية ممكنة.
معالجة وتحليل صور NanoSIMS. تم إجراء تحليل الصور باستخدام برنامج L’IMAGE الإصدار 10-15-2021 (الذي طوره L. Nittler). تم تصحيح انحراف الطبقات وتجميعها. تم رسم مناطق الاهتمام (ROIs) على صور الأيونات بناءً على صور cryoSEM لتحديد الخلايا والمنطقتين الفرعيتين الرئيسيتين من الاهتمام: الفجوات والسيتوسول (الشكل التمديدي 1e). بالنسبة لعلاج 2.5 مليمول، تم اختيار ROIs لجدار الخلية بشكل محافظ استنادًا إلى خريطة أيون الكالسيوم كأساس لتعيين ROIs. تم استخراج بيانات معدل العد من خلايا البشرة، دون تمييز بين خلايا التريكو بلاست (شعر الجذر) والأتريكو بلاست (غير شعر الجذر). داخل الخلايا الفردية، تم دمج ROIs الفجوية (أو السيتوسولية) في ROI واحد (أي، ROI واحد لكل نوع من العضيات)، لأن هذه المناطق من المحتمل أن تكون متصلة في الفضاء ثلاثي الأبعاد داخل الخلايا (الشكل التمديدي 1e). تم اختيار الهياكل التي لها أصغر بعد خطي لا يقل عن 5 بكسلات (أي، أكبر بكثير من حجم الشعاع الأساسي) كـ ROIs. لكل ROI، تم الحصول على متوسط معدل العد لكل نوع عنصري (العد في الثانية) من الصور المجمعة. في غياب معايير متطابقة مع المصفوفة، لا يمكن تحديد التركيزات العنصرية المطلقة، ولكن يمكن مقارنة النسب العنصرية المقاسة لمناطق فرعية معينة تحت ظروف تحليل متطابقة بشكل ذي معنى داخل وبين العينات. لتحسين القابلية للمقارنة، تم زراعة شتلات WT و sos1 على نفس الوسط، تحت ظروف نمو متطابقة، ومرت عبر نفس سير العمل التحليلي cryo والتحليل مع إعدادات الأجهزة المتطابقة. تم تضمين جذور WT و sos1 في كل تشغيل CryoNanoSIMS. تم استخراج بيانات خط الملف (بعرض 5 بكسلات) من المناطق المميزة في الصورة (الأشكال التمديدية 2a-d و 3a,d).
ظروف النمو لتجارب المجهر الضوئي التداخلي، التكامل واختبارات نمو الجذور
في حالة النمو 1، تم تعقيم البذور سطحياً، وزرعها على أطباق تحتوي على نصف قوة MS مع 0.8% من الأجار (روث)، وتم طبقاتها عندفي الظلام لمدة يومين ونمت عمودياً في غرف النمو عندفي ضوء ثابت. في حالة النمو 2، تم زراعة البذور في أطباق MS نصف القوة مع السكروز في غرفة النهار الطويل .
اختبار التكامل. بعد 4 أيام من النمو في ظروف النمو 1، تم نقل الشتلات إلى أطباق MS نصف القوة مع 100 مليمول
تمت معالجة النباتات بمحلول NaCl لمدة 4 أيام وتم تصويرها. تم قياس طول الجذر الرئيسي عند النقل وبعد 4 أيام من النمو، وتم تقديم الزيادة في نمو الجذر الرئيسي على أنها دلتا نمو الجذر الرئيسي. لاستعادة دلتا نمو الجذر الرئيسي، تم نقل الشتلات لمدة يومين إلى أطباق MS نصف القوة بعد 8 أيام من إجهاد الملح وتم قياس نمو الجذر في اليوم العاشر.
التصوير التوافقي. بالنسبة للتجربة مع معالجة الملح في الشكل 4، بعد 7 أيام من النمو في ظروف النمو 2، تم نقل الشتلات إلى أطباق MS نصف القوة مع 1% سكروز و 25 مللي مول من NaCl أو بدون NaCl، مع الحفاظ على نفس ظروف النمو ليوم آخر. تم إجراء معالجة الملح قصيرة الأمد بتركيز 25 مللي مول و 100 مللي مول على الجذور التي تبلغ من العمر 4 أيام والتي نمت في ظروف النمو 1 (بدون سكروز). بريفيلتم إجراء علاجات (BFA) وWortmannin على الشتلات التي تبلغ من العمر 7 أيام والتي نمت في ظروف النمو 1، وتمت العلاجات في وسط MS نصف القوة السائل. كانت علاجات BFA مع BFA وتم تلطيخه مع تمت معالجة M FM4-64 لمدة تقارب ساعة واحدة قبل التصوير. بالنسبة لعلاج BFA على خطوط SOS1-GFP المتقاطعة مع VAMP711-mCherry، لم يتم تلوين الشتلات مع FM4-64. كانت علاجات وورتمنين معوورتمنين لمدة تقارب ساعة واحدة قبل التصوير.
استنساخ وبناء البلازميد
للبلازميد البنائية 1، SOS1-GFP (الشكل البياني الموسع 5b)، قطعة DNA بطول 4.8 كيلوباز تحتوي على المحفز و13 إكسون و13 إنترون الأولى (منإلى ) من موضع SOS1، تم تضخيمه بواسطة تفاعل البوليميراز المتسلسل (PCR) باستخدام الحمض النووي الجينومي من الأرابيدوبسيس كقالب وبرايمرات SOS1proHindIII-fwd (CGGGAAGCTT ATACGTTTCGTAAGAAAC) و SOS1BamHI-rev (AAATTGGGTAGTGG ATC). تم هضم منتج PCR وإعادة استنساخه في pBI321 باستخدام مواقع HindIII و BamHI. بعد ذلك، تم هضم بلازميد pGPTV-II-GFP الذي يحتوي على cDNA الخاص بـ SOS1 عند مواقع BamHI و SacI الفريدة. تم عزل قطعة بطول 2.9 كيلوبايت من BamHI/Sacl تحتوي على الجزء النهائي من cDNA الخاص بـ SOS1 المدمج مع GFP وتم ربطها في إطار مع تسلسل SOS1 الجينومي في بناء pBI321 الذي تم هضمه بنفس إنزيمات التقييد. بالنسبة لبناء البلازميد 2، SOS1-mCitrine (الشكل التمديدي 5c)، تم الحصول على قطعة DNA بطول 8.357 كيلوبايت تحتوي على المحفز والتسلسل الجينومي الكامل لـ SOS1 (منإلى ) تم تضخيمه بواسطة PCR باستخدام الحمض النووي الجينومي من أرابيدوبسيس كقالب وبرايمرات SOS1-fwd (ACAAAAAAGCAGGCT actaggatgatgtgtgttaatgtgagaggaagaagaa) و SOS1-rev (cccttgctca ccatTAGATCGTTCCTGAAAACGATTTTACTCGGAGA). بالنسبة لـ mCitrine، تم تضخيم قطعة DNA بطول 7.47 كيلوبايت بواسطة PCR من بلازميد pEN-R2-mCitrine-L3 (pEDO05) وبرايمرات mCitrine-fwd (TCAGGAACGATCTAatgg tgagcaagggcgag) و mCitrine-rev (AACATCTCAATTCTCActtgtacag ctcgtccatgc). بالنسبة للمنهي SOS1، تم تضخيم قطعة DNA بطول 2.087 كيلوبايت (من إلىتم تضخيم ( ) بواسطة PCR باستخدام الحمض النووي الجينومي من الأرابيدوبسيس كقالب وبرايمرات SOS1t-fwd (cgagctgtacaagTGAGAATTG AGATGTTTGTAACATAAGAAAACAAAATTGTTAGCT) و SOS1t-rev (CAAGAAAGCTGGGTTactagactgtgttatattggtaattagttggggct). تم تجميع القطع بواسطة In-Fusion (تاكارا) في متجه pENTR_L1L2 الذي تم هضمه باستخدام Bcul (pRU335).
مجهر المسح بالليزر المدمج
تم الحصول على الصور المدمجة باستخدام مجهر ليكا ستيلاريس 5 WLL المقلوب. الهدف مع برنامج LASX (2022). بالنسبة للعلاجات، تم تثبيت شتلات الأرابيدopsis التي تبلغ من العمر 7 أيام بـمن الوسط المقابل (نفس المستخدم للعلاج) وتم تصويره. بالنسبة لصبغة بروبيديوم يوديد (PI)، تم إذابة PI في وسط سائل خالٍ من الصوديوم (تم غمر الشتلات لمدة 3 دقائق، ثم تم غسلها وتصويرها. تم تحفيز GFP باستخدام خط الليزر 488 نانومتر من ليزر MaiTai الأبيض وتم الكشف عن الانبعاث بين 495 و 545 نانومتر. تم تحفيز PI و mCherry باستخدام 561 نانومتر وتم الكشف عن الانبعاث بين 580 و 680 نانومتر. تم التقاط صور ذات مرة واحدة بدقة عالية.زوم، بعمق 8 بت، معمتوسط الخط.
ميكروسكوبية التداخل باستخدام قرص دوار
استخدمنا رأس قرص دوار CSU-W1 من يوكوجاوا مزودًا بمجهر نيكون إكليبس Ti-E المقلوب، والمجهز بعدسة هدف زيتية CFIPlanApo × 100 ذات فتحة عددية 1.40، ومع اثنين من كاميرات EMCCD Andor iXon Ultra، تعمل بدقة 1,024. بكسلات و حجم البكسل. تم تحفيز GFP و RFP أو mCherry واكتشافهما في نفس الوقت (التحفيز: GFP; الكشف: GFP ; تم معالجة صور تسلسل الزمن باستخدام الإضافات المدمجة في فيجي، أي، طرح الخلفية (نصف قطر الكرة المتدحرجة،بكسل) ومتوسط المشي التقديري (تجميع الإطارات) للصور لأغراض تمثيلية.
تQuantification إشارة الفلورية وتحديد موضع الحويصلات
لقياس كثافة بكسلات الصورة، تم تعريف مناطق الاهتمام بشكل محافظ للهياكل المعنية: الغشاء البلازمي والمنطقة الداخلية للخلية. تم استخراج قيم الكثافة المدمجة الخام لمناطق الاهتمام. بالنسبة للغشاء البلازمي، تم ضرب قيم الكثافة المدمجة الخام بعامل تصحيح قدره 0.75 لأخذ الغشاء البلازمي المتداخل بين الخلايا وواجهات الخلايا غير المحسوبة في الاعتبار. بالنسبة لتداخل الحويصلات، تم إجراء طرح الخلفية باستخدام أداة ‘طرح الخلفية’ مع نصف قطر كرة متدحرجة قدره 50 بكسل. كانت المنطقة التي تشمل حويصلة SOS1-GFP هي منطقة الاهتمام لكل قياس تداخل لـ VHAa-1 و RABF2a و RABF2b. تم استخدام منطقة اهتمام ثابتة بحجم مع إشارة من mCherry-VAMP711 كمرجع لت quantifying التداخل مع SOS1-GFP لأغشية الفجوات. معامل بيرسونتم تحديد القيم باستخدام ملحق Coloc2 في FIJI.
عزل الفجوات السليمة
تم عزل البروتوبلاست من أوراق نباتات الأرابيدوبسيس التي تبلغ من العمر 5 أسابيع وفقًا للطريقة الموضحة في المرجع 37. تم خلط المحلول الذي يحتوي على البروتوبلاست (1:1) مع محلول التحلل، 200 مليمول من السوربيتول،فيكول، 20 مللي مول EDTA، 10 مللي مول HEPES، pH 8.0، لتحرير الفجوات.
عزل وتنقية أغشية الأرابيدوبسيس
تم عزل الميكروسومات الكلية وأغشية التونوبلاست المستخدمة في تحليل الويسترن بلوت كما هو موضح في المرجع 39. تم هرس الأوراق في خلاط تجاري وتم الطرد المركزي عندلمدة 20 دقيقة عندتمت عملية الطرد المركزي للمستخلص العلوي عندلمدة 50 دقيقة عندللحصول على الكسر الميكروسومي. تم عزل الأغشية الفجوية عن طريق تحميل التعليق الميكروسومي على تدرج السكروز غير المتقطع. ) التي تم طردها مركزيًا عند لمدة 3 ساعات عند.
تنقية الأجسام المضادة بواسطة الارتباط وطرق الترحيل الغربي
تم تنقية الأجسام المضادة المضادة لـ SOS1 بطريقة الطرد الجزيئي وفقًا للمرجع 40. تم التعبير عن بولي ببتيد يتكون من الأحماض الأمينية 998-1146 من نبات الأرابيدوبسيس SOS1 وتنقيته من بكتيريا الإشريكية القولونية كدمج GST. تم إجراء SDS-PAGE على البروتين ونقله إلى ورق النيتروسليلوز. بعد صبغ بونسو S، تم قطع شريط البروتين الذي يتوافق مع GST-SOS1 وتمت معالجته في TBS-T مع 5% حليب خالي من الدسم لمدة ساعة واحدة. تم تحضين شريط النيتروسليلوز طوال الليل مع مصل مضاد لـ SOS1.مخفف 1:1 في TBS. من أجل استخلاص الأجسام المضادة المرتبطة بشكل محدد، تم تحضين شريط النيتروسليلوز مع و 1 مليمول من EGTA لمدة دقيقتين. تم تحييد الإيلاوت على الفور باستخدام 1 م مول من قاعدة تريس. بالنسبة لبلوتات ويسترن، تم فصل عينات البروتين على هلام SDS-PAGE بتركيز 10% ثم تم نقلها كهربائيًا إلى غشاء نيتروسليلوز من أميرشام بروتران (سايتيفا). تم حجب الغشاء لمدة ساعة واحدة باستخدام TBS-T مع 5% حليب خالي من الدسم. ثم، تم حضانة الغشاء طوال الليل عند مع الأجسام المضادة الأولية (أجسام مضادة مكررة ضد SOS1، تخفيف 1:2000؛ مضاد لوحدة الإبسيلون من غشاء الفجوة Hأجسام مضادة لـ ATPase AS07213 من Agrisera، بتخفيف 1:10,000 في TBS-T مع 5% حليب خالي من الدسم. تم استخدام جسم مضاد ثانوي من الماعز مرتبط ببيروكسيداز الفجل، مخفف 1:10,000 في TBS-T. تم غسل الغشاء ثلاث مرات في TBS-T وتم حضنه في كاشف الكشف عن Western Blotting ECL Select. لمدة 5 دقائق. تم الحصول على الصور باستخدام نظام GE Amersham Imager AI680. يرجى الرجوع إلى الشكل التكميلية 1 للحصول على الصور الكاملة.
تحليل صورة SEM وإعداد الشكل
تم معالجة صور SEM باستخدام إعدادات المستويات في برنامج فوتوشوب (الإصدار 25.11.0). تم تحليل جميع صور NanoSIMS باستخدام برنامج L’IMAGE الإصدار 10-15-2021 الذي طوره L. Nittler. تم تحليل جميع الصور المأخوذة بواسطة المجهر الضوئي الماسح باستخدام برنامج ImageJ الإصدار 1.54 f.http://imagej.nih.gov/ij/) وبرامج فيجي. تم إعداد الأشكال باستخدام أدوبي إليستريتور (الإصدار 28.7.1) وفيجي. كانت التعديلات الوحيدة على الصور هي تعديلات الهيستوجرام. ثم تم تجميع الأشكال في برامج أدوبي إليستريتور وفوتوشوب.
الإحصائيات وإمكانية التكرار
قمنا بمقارنة تأثير العلاج على النمطين الجينيين واعتبرنا كل عضية على حدة. أجرينا تحليل التباين ثنائي الاتجاه (ANOVA) ومقارنة مزدوجة مع العلاج والنمط الجيني كعاملين، وتم تحديد التفاعلات المهمة بواسطة اختبار توكي بعد الاختبار لنسبة الفجوة:السيتوسول ونسبة Na:K. تُظهر الرسوم البيانية للصناديق للنسب المتوسط مع الانحراف المعياري والخطأ المعياري. بالنسبة للشكل 1b,c، فإن الصور هي تمثيلات توضيحية لميرستيم الجذر المخطط بالتبريد وتوزيع العناصر الذي تم إجراؤه على ثلاثة جذور مختلفة. تم الحصول على البيانات للشكل 2d,e باستخدام الوسيط الخالي من الصوديوم: WT خلايا؛ سوس1 الخلايا، من تجربة واحدة مع ثلاثة جذور مختلفة. معالجة 25 مليمول NaCl: WT خلايا؛ سوس1 الخلايا، من تجربتين مع ستة جذور في المجموع. تم إجراء مقارنة ثنائية بين نسبة الفجوة:السيتوبلازم مع العلاج والنمط الجيني كعوامل؛ وسط خالٍ من الصوديوم: WT خلايا؛ سوس الخلايا، من تجربة واحدة مع ثلاثة جذور مختلفة. معالجة 25 مليمول من NaCl: WT خلايا؛ سوس1 الخلايا، من تجربتين مع ستة جذور في المجموع. الدلالة: ***تم تحليلها بواسطة تحليل التباين ثنائي الاتجاه مع اختبارات توكي بعد الاختبار. تم الحصول على بيانات الشكل 3ب، ج باستخدام معالجة 100 مM NaCl التالية: WT خلايا؛ sos1، خلايا من تجربتين مع ستة جذور في المجموع. تُظهر الرسوم البيانية الصندوقية القيم المتوسطة (الخطوط الأفقية)، (الصناديق) و 75% (الأشرطة الرأسية الرفيعة) الربعيات؛ يتم الإشارة إلى القيم الشاذة بدوائر صلبة. تم إجراء مقارنة ثنائية للنسب مع العلاج والنمط الجيني كعوامل. الدلالة: تم تحليلها بواسطة تحليل التباين ثنائي الاتجاه مع اختبارات توكي بعد الاختبار. بالنسبة للشكل 3د، تم معالجة قمم جذور الأرز بـ 100 مللي مول من NaCl، WTالخلايا. تم إجراء التحليلات الإحصائية باستخدام برنامج OriginPro v.2023b وبرنامج GraphPad (Prism10). الشكل 4أ هو صورة تمثيلية لـجذور مع ثلاثة مكررات بيولوجية.
ملخص التقرير
معلومات إضافية حول تصميم البحث متاحة في ملخص تقارير مجموعة ناتشر المرتبط بهذه المقالة.
توفر البيانات
جميع البيانات المعالجة مسبقًا والمعالجة المرتبطة بصور CryoNanoSIMS والفلوريسcence متاحة على Zenodohttps://doi. org/10.5281/zenodo.14054006) تتوفر النسخ الكاملة لجميع الجل والبلوت المعروضة في الشكل التكميلية 1. يتم توفير بيانات المصدر مع هذه الورقة. 36. ديتمر، ج.، هونغ-هيرميسدورف، أ.، ستيرهوف، ي.-د. وشوماخر، ك. الفجواتنشاط -ATPase مطلوب للتداول الداخلي والإفرازي في الأرابيدوبسيس. خلية النبات 18، 715-730 (2006). 37. وو، ف.-هـ. وآخرون. شطيرة الشريط – طريقة أبسط لعزل بروتوبلاست الأرابيدوبسيس. طرق النباتات 5، 16 (2009). 38. شنايدر، س. وآخرون. الفجوات تطلق السكروز عبر ناقلات من نوع SUC4 الموجودة في الغشاء المحيط بالفجوة. بيولوجيا النبات. 14، 325-336 (2012). 39. فيرا-استريلا، ر.، باركلا، ب. ج.، غارسيا-راميريز، ل. و بانتوجا، أ. إجهاد الملح في ثيلونجييلا هالوفيلا ينشطآليات النقل المطلوبة لتحمل الملوحة. فيزيولوجيا النبات. 139، 1507-1517 (2005). 40. سامبروك، ج. الاستنساخ الجزيئي: دليل مختبر، المجلد 3 (مختبر كولد سبرينغ هاربور، 1989). 41. نونيز-راميريز، ر. وآخرون. رؤى هيكلية حول حساس الملح الزائد في النبات 1 (SOS1)ناقل مضاد. J. Mol. Biol. 424، 283-294 (2012). 42. راسبان، و. س. إيميج جي v.1.54f (NIH، 2023). 43. راماكريشنا، ب. وآخرون. بيانات لـ “تراكم الصوديوم الفجوي المعتمد على SOS1 الذي تم الكشف عنه بواسطة التصوير البارد العنصري”. زينودوhttps://doi.org/10.5281/zenodo.14054006 (2024). 44. هالغرين، ج. وآخرون. DeepTMHMM يتنبأ بالبروتينات العابرة للغشاء ألفا وبيتا باستخدام الشبكات العصبية العميقة. مسودة في bioRxivhttps://doi.org/10.1101/2022.04.08.487609 (2022).
الشكر والتقدير نشكر F. Plane و A. Mucciolo و J. Daraspe على النصائح الفنية والمساعدة. نشكر D. Salt على التعليقات النقدية حول المخطوطة. نشكر المرافق المركزية للتصوير في جامعة لوزان والمركز العلمي لعلم الميكروسكوب الضوئي والإلكتروني (ScopeM، ETH زيورخ) على الدعم الفني. تم دعم هذا العمل من خلال منحة PID2022-140705OB-I00 (AEI-MCIN، إسبانيا، الممولة جزئيًا من ERDF) لـ F.J.Q.، ومن خلال تمويل داخلي من ETH زيورخ لـ C.S.-R.، ومن جامعة لوزان لـ N.G. ومن EPFL لـ A.M. تم تمويل تطوير CryoNanoSIMS من قبل EPFL وجامعة لوزان ومنح من المؤسسة السويسرية الوطنية للعلوم (206021_150762، 200021_179092 و 205321_212614) ومنحة متقدمة من المجلس الأوروبي للبحث 246749 لـ A.M.
مساهمات المؤلفين: قام P.R. و N.G. و A.M. بتصميم وتنسيق مشروع CryoNanoSIMS. ساهم P.R. و C.M.-O. و D.D.B. و C.G. في إعداد وتحليل العينات المبردة. قام P.R. و S.E. و A.M. بإجراء تحليلات CryoNanoSIMS. صمم N.G. و P.R. و C.S.-R. ونسقوا تحليل الطفرات، وعلاجات الإجهاد، وأعمال تحديد موضع البروتين. ساهم F.M.G.-A. و E.B. بالتساوي في أعمال البروتين والتحليلات. ساهم P.R. و F.M.G.-A. و E.B. و A.D.L. و J.M.P. و F.J.Q. و C.S.-R. و N.G. في أعمال تحديد موضع البروتين وتفسير النتائج. كتب P.R. و N.G. و A.M. المسودة الأولى من المخطوطة. ساهم جميع المؤلفين في النسخة النهائية من المخطوطة.
المصالح المتنافسة يعلن المؤلفون عدم وجود مصالح متنافسة.
معلومات إضافية
معلومات إضافية النسخة الإلكترونية تحتوي على مواد إضافية متاحة فيhttps://doi.org/10.1038/s41586-024-08403-y. يجب توجيه المراسلات والطلبات للحصول على المواد إلى بريا راماكريشنا، نيكو جيلدنر أو أندرس ميبوم. تُعرب مجلة Nature عن شكرها لنوبويكي أوزومي، وكريستا تيستيرينك، والمراجعين الآخرين المجهولين، على مساهمتهم في مراجعة الأقران لهذا العمل. تقارير مراجعي الأقران متاحة. معلومات إعادة الطبع والتصاريح متاحة علىhttp://www.nature.com/reprints.
الشكل البياني الممتد 1|انظر الصفحة التالية للتعليق.
الشكل البياني الممتد 1 | الوثائق الداعمة للتجارب وسير العمل المرتبط بـ CryoSEM وCryoNanoSIMS. أ. مقارنة بين شتلات الأربيذوبس WT التي تبلغ من العمر 5 أيام المزروعة على أطباق MS نصف القوة مقابل النظام المائي مع MS نصف القوة السائل، أو وسائط خالية من الصوديوم، مما يظهر أن معدلات النمو كانت متشابهة. لتسهيل المقارنة، تم نقل الشتلات من نظام الزراعة المائية إلى سطح من الأجار وتم تصويرها على الفور. ب. رسم بياني يظهر معدلات العد لـ CryoNanoSIMS من، ومن ممثلمنطقة على جذر WT المزجج، مشابهة لتلك المشار إليها في (ج). لاحظ أن معدلات العد مستقرة لأكثر من 30 دورة صورة. بالنسبة للبيانات المبلغ عنها في هذه الدراسة، تم الحصول على 6 دورات صورة بشكل منهجي في كل منطقة مصورة من الجذور. كان هذا كافيًا للحصول على إحصائيات عد كافية في جميع مناطق الاهتمام. ج. صورة تمثيلية لوجه كتلة مجمد باستخدام تقنية SEM عند درجة حرارة منخفضة لجذر طرفي من أرابيدوبسيس والأرز (Oryza sativa) تم معالجته باستخدام سير العمل المجمد (يرجى الرجوع أيضًا إلى الشكل 1). الإطارات الصفراء المنقطة تحدد كل منها منطقة منعلى العينة، حجم صورة CryoNanoSIMS النموذجية في هذه الدراسة. المستطيل الأبيض الأكبر يشير إلى منطقة الجذر العامة. تم رسم خريطة منهجية باستخدام CryoNanoSIMS في كل طرف جذر لضمان مقارنة نفس أنواع الخلايا في مراحل تطور مماثلة، هنا المنطقة التي تنتقل فيها الخلايا من الانقسام إلى الاستطالة. د. تم تقليل نمو الجذر استجابةً لإجهاد الملح في نبات الأرابيدوبسيس sos1 مقارنةً بالنباتات البرية مع زيادة تركيزات الملح. تم زراعة شتلات WT و sos1 التي تبلغ من العمر خمسة أيام لمدة 3 أيام (تحكم) على أطباق أجار MS نصف القوة وتعرضت لتركيزات ملح تبلغ 25 و 100 مللي مول على التوالي لمدة يومين. هـ. اليسار: صورة تمثيلية باستخدام cryoSEM لخلايا قمة جذر الأرابيدوبسيس مع توضيح المناطق ذات الاهتمام (ROIs) التي تمثل الفجوات (باللون الأصفر)، السيتوسول (باللون الأرجواني) والنواة (مع النوية) (باللون البني). خدمت هذه الصور SEM لتعيين ROIs على صور CryoNanoSIMS. الوسط: خريطة أيونية مرتبطة بـ CryoNanoSIMS مع تعريفات ROIs مماثلة منها تم الحصول على معدلات العد المتوسطة للأيونات المقاسة باستخدام برنامج L’IMAGE. داخل الخلايا الفردية، تم اعتبار مناطق الفجوات كـ ROI واحدة، ومناطق السيتوسول كـ ROI واحدة، والتي تم استخدامها بعد ذلك لاشتقاق نسبة الفجوة: السيتوسول لكل خلية، كما هو موضح على اليمين. قضبان القياس،.
الشكل البياني الممتد 2 | انظر الصفحة التالية للتعليق.
الشكل البياني الموسع 2 | رسم خرائط CryoNanoSIMS على المستوى تحت الخلويوتراكم الكالسيوم في قمة جذر الأرابيدوبسيس المزروعة على وسائط مختلفة. صور SEM المرتبطة والخرائط العنصرية لـومن جذور الشتلات المزروعة في نظام الزراعة المائية. على اليمين توجد ملفات خطية مستخرجة كما هو موضح في خرائط CryoNanoSIMS. تُظهر الملفات الخطية ملفات معدل العد لـويمتد عبر جدارين خلويين، مع علامة ‘W’. لاحظ أن الكالسيوم مركز بشكل قوي في جدران الخلايا. أ-ب. WT (أ) و (ب) الشتلات المزروعة في وسط خالٍ من الصوديوم. لاحظ أنه حتى في الشتلات المزروعة في الوسط الخالي من الصوديوم (التحكم)، فإن تركيزات الصوديوم الخلوية تسمح بالكشف الواضح بواسطة CryoNanoSIMS، مما يدل على الحساسية العالية للجهاز لهذه العناصر. البشرة (Ep)، الفجوة (v) والسيتوبلازم (c) مُعلمة. ج. شتلات WT المزروعة في وسط MS السائل نصف القوة لمدة 5 أيام. يتركز الصوديوم في جدران الخلايا في خلايا قمة الجذر. د. تحت ضغط صوديوم خفيف (2.5 مليمول NaCl) لمدة ساعتين، يبقى الصوديوم مركزًا في جدران الخلايا لخلايا قمة الجذر في كل من WT و sos1. هـ. نسب معدل العد بين الفجوة والسيتوسول من وداخل خلايا الميرستيم الفردية في النوع البري و sos1 بعد المعالجة بـ 2.5 مليمول من NaCl لمدة ساعتين. ف. متوسطنسب مقاسة في الفجوات والسيتوسول داخل القمة النامية الخلايا في شتلات WT و sos1 المزروعة في وسط خالٍ من الصوديوم وبعد المعالجة بـ 2.5 مللي مولار NaCl لمدة ساعتين. متوسطنسب مقاسة في جدران الخلايا لنباتات WT و sos1 بعد المعالجة بـ 2.5 مليمول من NaCl لمدة ساعتين. خطوط الملف الشخصي بعرض 5 بكسلات وتمثل الصورة والموقع المميز. للوسط الخالي من الصوديوم: WT خلايا؛ سوس1 الخلايا، من تجربة واحدة مع ثلاثة جذور مختلفة. بالنسبة لمحلول MS نصف القوة السائل، WT خلايا من تجربتين مع جذرين مختلفين. لعلاج 2.5 مليمول من NaCl: WT خلايا؛ سوس1 الخلايا، من تجربة واحدة مع ثلاثة جذور مختلفة. بالنسبة لـ (g)، WT; sos1 تظهر الرسوم البيانية الصندوقية القيم المتوسطة (الخطوط الأفقية) والربع 25% (الصناديق) والربع 75% (الأشرطة الرأسية الرفيعة)؛ يتم الإشارة إلى القيم الشاذة بدوائر صلبة. مقارنة ثنائية للمعامل مع العلاج والنمط الجيني كعوامل. الدلالة: ***تم تحليلها بواسطة تحليل التباين ثنائي الاتجاه مع اختبارات توكي بعد الاختبار. تم زراعة العينة بطريقة الهيدروبونيك على وسط خالٍ من الصوديوم وتعرضت للعلاجات المعنية. مقاييس الألوان خطية ومعدلات عدد الأيونات القصوى (عدد في الثانية) موضحة بواسطة أشرطة الألوان. الأسهم البيضاء الرقيقة في صور الكريوSEM تشير نحو طرف الجذر. أشرطة القياس،.
الشكل البياني الممتد 3 | انظر الصفحة التالية للتعليق.
الشكل 3 من البيانات الموسعة | بيانات داعمة لرسم الخرائط لـ، والكالسيوم في القمم الجذرية لنبات الأرابيدوبسيس البري والطفرات sos1 تحت ضغط ملحي معتدل وعالي. أ. صورة SEM مرتبطة وخرائط نظائرية لـ، و من جذور نباتات WT و sos1 المزروعة في 25 مللي مولار NaCl لمدة 4 ساعات، مع ملفات معدل العد المقابلة عبر جدارين خلويين، بما في ذلك أيضاً (يمين). ب. نسب معدلات العد المتوسطة لـوفي الفجوات والسيتوسول لخلايا البشرة القمية الجذرية للنباتات البرية و sos1 المزروعة في وسائط خالية من الصوديوم، وبعد المعالجة بـ 25 مللي مول من NaCl لمدة 4 ساعات.نسب الجدار إلى السيتوسول في خلايا البشرة للمرستيم الجذري لنباتات WT و sos1 بعد المعالجة بـ 25 مليمول من NaCl لمدة 4 ساعات. صورة SEM المرتبطة وخرائط النظائر لـ، و من جذور شتلات WT و sos1 المزروعة في 100 مللي مولار NaCl لمدة 4 ساعات، مع ملفات معدل العد المقابلة عبر جدارين خلويين، بما في ذلك أيضاً(يمين). هـ. متوسط معدلات العد (العد في الثانية) لـ(يسار) و (الوسط) في الفجوات والسيتوسول لشتلات WT و sos1 المزروعة في وسائط خالية من الصوديوم، وبعد المعالجة بـ 100 مللي مولار NaCl لمدة 4 ساعات. اليمين: نسبومعدلات العد في الفجوات والسيتوسول لخلايا البشرة في قمة الجذر للنباتات البرية و sos1 شتلات نمت على وسط خالٍ من الصوديوم، وبعد المعالجة بـ 100 مليمول من كلوريد الصوديوم لمدة 4 ساعات. تُظهر مخططات معدل العد متوسط معدل العد للصوديوم والبوتاسيوم والكالسيوم للملفات الخطية المميزة في الصور المقابلة. بيانات الملف الخطي بعرض 5 بكسلات. للوسط الخالي من الصوديوم: WT خلايا؛ سوس1 الخلايا، من تجربة واحدة مع ثلاثة جذور مختلفة. لمعالجة 25 مليمول من NaCl (أ-ج): WT خلايا؛ سوس1 الخلايا، من تجربتين مع ثلاثة جذور مختلفة. لعلاج 100 مM NaCl (د، هـ): WT خلايا؛ سوس1، خلايا من تجربتين مع ثلاثة جذور مختلفة. تُظهر الرسوم البيانية الصندوقية القيم المتوسطة (الخطوط الأفقية)، (صناديق) و (أشرطة عمودية رفيعة) الأرباع؛ يتم الإشارة إلى القيم الشاذة بدوائر صلبة. مقارنة ثنائية بين نسب الفجوات: السيتوسول مع العلاج والنمط الجيني كعوامل. الدلالة: تم تحليلها بواسطة تحليل التباين ثنائي الاتجاه مع اختبارات توكي بعد ذلك. مقاييس الألوان خطية ومعدلات عدد الأيونات القصوى (عدد في الثانية) موضحة بواسطة أشرطة الألوان. الأسهم البيضاء الرفيعة في صور الكريوSEM تشير نحو طرف الجذر. أشرطة القياس،.
الشكل البياني الممتد 4|انظر الصفحة التالية للتعليق.
الشكل البياني الممتد 4 | رسم خرائط الكريوSEM والكريوNanoSIMS المرتبط على مستوى الخلايا الفرعيةوتوزيع الكالسيوم في قمة جذر الأرز. أ. مخطط لنمط التعبير الجيني SOS1 الموصوف سابقًا في الأرابيدوبسيس والأرز (أوريزا ساتيفا) مع منطقة الاهتمام التي تم تحليلها بواسطة CryoNanoSIMS مميزة. ب. شتلات الأرز WT و sos1 المزروعة في وسط خالٍ من الصوديوم (التحكم)، والتي تتميز بمستويات خلفية منخفضة جداً، ولكن يمكن قياسها بوضوح، من الصوديوم قبل تجارب إجهاد الملح. تم وضع علامات على البشرة (Ep) والفجوة (v) والسيتوبلازم (c). ج. قمة الجذر لشتلات الأرز WT و sos1 التي تعرضت لإجهاد الملح عن طريق المعالجة بـ 100 مليمول من NaCl لمدة 4 ساعات. لاحظ أنه في الأرز حيث لا يتم التعبير عن SOS1 في قمة الجذر، يتراكم الصوديوم في الفجوة لـ sos1 مشابهًا لـ WT. د. متوسط معدلات العد للصوديوم () في الفجوة والسيتوسول لخلايا قمة جذر الأرز في WT و sos1 (يسار) بعد النمو في وسط خالٍ من الصوديوم (التحكم) وبعد المعالجة بـ 100 مللي مول من NaCl لمدة 4 ساعات. نسب معدل العد بين الفجوة والسيتوسول لـداخل خلايا الميرستيم الفردية في WT و sos1 (يمين، برتقالي). هـ. المقابل معدلات العد المتوسطة للبوتاسيوم () في الفجوة والسيتوسول لخلايا الميرستيم في WT و sos1 (يسار). نسب معدل العد بين الفجوة والسيتوسول لـداخل خلايا الميرستيم الفردية في WT و sos1 بعد النمو (يمين، ليلكي). لوسط خالٍ من الصوديوم (ب، د، هـ): WT خلايا؛ سوس1 الخلايا، من تجربة واحدة مع جذور مختلفة على الأقل. لعلاج 100 مليمول من NaCl (c-e): WTالخلايا؛ sos1الخلايا، من تجربتين مع إجمالي خمسة جذور. تُظهر الرسوم البيانية الصندوقية القيم المتوسطة (الخطوط الأفقية)، (صناديق) و (أشرطة عمودية رفيعة) الأرباع؛ يتم الإشارة إلى القيم الشاذة بدوائر صلبة. مقارنة ثنائية للمتوسطات مع العلاج والنمط الجيني كعوامل. الدلالة: *P<0.05; **P<0.01؛ تم تحليلها بواسطة تحليل التباين ثنائي الاتجاه مع اختبارات توكي بعد ذلك. مقاييس الألوان خطية ومعدلات عدد الأيونات القصوى (عدد في الثانية) موضحة بواسطة أشرطة الألوان. الأسهم البيضاء الرفيعة في صور الكريوSEM تشير نحو طرف الجذر. أشرطة القياس،.
الشكل 5 من البيانات الموسعة | انظر الصفحة التالية للتعليق.
الشكل التوضيحي الممتد 5|هيكل بروتين SOS1 في الأرابيدوبسيس والمجالات والتكامل لبروتين SOS1. أ. جدول توقع الشكل الهندسي لبروتين SOS1. تأخذ البقايا المعروضة في الاعتبار تسلسل الأحماض الأمينية من قاعدة بيانات يوني بروت (Q9LKW9، AT2G01980) والتوقع يعتمد على DeepTMHMM.. الألوان تتوافق مع الهيكل المعروض في (ب) و (ج). ب. مخطط للبناء الجينومي 1 (SOS1-GFP) المستخدم في جميع التحليلات. منطقة محفز SOS1 (pSOS1) تتوافق مع 1929 زوج قاعدي upstream من كودون البدء. تم استخدام أول 13 إنترون فقط وتم دمج GFP بدون رابط. تم استخدام سينثاز النوبالين (NosT) من Agrobacterium tumefaciens كمنهي. تشير الألوان إلى الطوبولوجيا المتوقعة للبروتين للنيوكليوتيدات المقابلة. حجم صندوق الإكسونات متناسب مع بعضها البعض وفقًا لعدد النيوكليوتيدات. حجم صندوق المحفز والإنترونات غير متناسب. الطول (بالنيوكليوتيدات) للمحفزات والبروتينات الفلورية والمنهيات موضح في الشكل. ج. مخطط للبناء الجينومي 2 (SOS1-mCitrine) المستخدم للتحليلات المقارنة مع البناء 1. منطقة محفز SOS1 (pSOS1) تتوافق مع 2250 زوج قاعدي upstream من كودون البدء. تم استخدام تسلسل الحمض النووي الجيني الكامل لـ SOS1 الذي يتضمن جميع الإنترونات مع دمج mCitrine بدون رابط. تم استخدام المنهي الداخلي (SOS1T) الذي يتوافق مع 2051 زوج قاعدي downstream من كودون التوقف. د. صور تمثيلية لشتلات الأرابيدوبسيس التي تبلغ من العمر 8 أيام والتي نمت على وسط أغار MS نصف القوة لمدة 4 أيام قبل الانتقال إلى أغار MS نصف القوة بدون (تحكم) أو مع 100 مللي مول من NaCl لمدة 4 أيام إضافية. WT، sos1، sos1 مكمل بـ SOS1-GFP، sos1 مكمل بـ SOS1-mCitrine هي تم العرض. تم تقديم أيضًا صورة مقربة لكتلة الأنسجة الخضرية للخطوط المعنية في عمر 8 أيام. e. نمو الجذر الأساسي دلتا للخطوط المعنية من الأرابيدوبسيس بعد 4 أيام من النمو على وسط MS نصف القوة (التحكم) أو وسط MS نصف القوة المضاف إليه 100 مليمول من NaCl. f. استعادة نمو الجذر الأساسي دلتا للخطوط المعنية من الأرابيدوبسيس بعد يومين من الانتقال إلى أطباق MS نصف القوة (وهمي) بعد أن نمت لمدة 4 أيام على MS نصف القوة (وهمي) بالإضافة إلى 4 أيام على MS نصف القوة المضاف إليه 100 مليمول من NaCl (أصفر). g. طول الجذر الأساسي للخطوط المعنية من الأرابيدوبسيس في التحكم في (اليوم 4) وبعد 4 أيام من النمو (اليوم 8) (اللوحة اليسرى)؛ على 100 مليمول من NaCl مباشرة بعد الانتقال (اليوم 4) وبعد 4 أيام من النمو (اليوم 8) (اللوحة اليمنى، أصفر). h. وزن الأنسجة الخضرية الطازجة للشتلات التي تبلغ من العمر 8 أيام والمعالجة كما هو موضح في (g). تم زراعة الشتلات في ظروف النمو 1 لجميع هذه الاختبارات ومع المعالجات المناسبة. تظهر الرسوم البيانية في e-g قياسات طول الجذر الأساسي في التحكم وبعد الانتقال إلى معالجة 100 مليمول من NaCl لمدة 5 أيام. بالنسبة لـ (e) التحكم: WT, sos1 ، SOS1GFP / sos1 ، SOS1-mCitrine/sos1 ; للعلاج بـ 100 مM NaCl : WT, sos1 ، SOS1-GFP/sos1 ، SOS1-mCitrine/sos1 . لالتحكم و 100 مM NaCl : WT, sos1 ، SOS1-GFP/sos1 ،SOS1من ثلاثة تجارب مستقلة. تُظهر الرسوم البيانية الصندوقية القيم المتوسطة (الخطوط الأفقية) والـ 25% (الصناديق) و75% (الأشرطة الرأسية الرفيعة) من الربعيات. تم إجراء تحليل التباين الثنائي مع مقارنات متعددة مع تصحيح توكي لجميع الحالات باستثناء (ج) حيث تم تطبيق اختبار t غير المقترن. تمثل الحروف المختلفة الفرق الذي. قضبان القياس، 1 سم .
مقالة
الشكل البياني الممتد 6 | انظر الصفحة التالية للتعليق.
الشكل 6 من البيانات الموسعة | التوطين تحت الخلوي لبروتين SOS1 و الارتباط بعلامات نقل الأغشية الداخلية في الأرابيدopsis. صورة تمثيلية لموقع SOS1-mCitrine تحت الخلوية في قمم الجذور لشتلات عمرها 7 أيام. تم تسليط الضوء على الجسم الاندماجي المتأخر – ما قبل الفجوات والغشاء الفجوي بواسطة سهم، وتمت ملاحظته عند استخدام بريفيلدين.وورتمنينلمدة حوالي ساعة واحدةالعلاج. تم زراعة الشتلات في ظروف النمو 1. تم معالجة جميع الشتلات بصبغة FM4-64 الفلورية المحبة للدهون.، لمدة حوالي ساعة واحدة قبل التصوير. ب. تحليل التداخل المكاني لـ SOS1. ارتباط بروتينات SOS1-GFP مع علامة الحويصلة المبكرة/شبكة جولجي المتوسطة VHA-a1، وعلامات الحويصلة المتأخرة/الأقسام ما قبل الفجوة RABF2A (RHA1) أو RABF2B (ARA7) كما هو موضح بواسطة معامل ارتباط بيرسون. ج. تداخل SOS1-GFP مع الفجوات والأقسام الغشائية الداخلية في mCherry-VAMP711. د. لقطات من سلسلة زمنية لفيديو القرص الدوار تظهر السلوك الديناميكي لـ SOS1-GFP (الأخضر)، وعلامة الغشاء الداخلي.
RABF2A (ماجنتا)، الحويصلات المرتبطة (الأسهم البيضاء) تحت ظروف السيطرة؛ يرجى أيضًا الرجوع إلى الفيديو التكميلي S2. الشتلات المزروعة تحت ظروف النمو 2. e. صور تمثيلية لشتلات SOS1-GFP المعالجة بـ 25 و 100 مللي مولار NaCl لمدة 4 ساعات. تم زراعة الشتلات تحت ظروف النمو 1. لعلاج السيطرة + FM6-64 (أ، الصف الأول)الجذور؛ معالجة BFA + FM4-64 (أ، الصف الثاني)الجذور؛ معالجة وورتمنين + FM4-64، الصف 3. جميعها من ثلاث تجارب مستقلة. بالنسبة لـ (ب)،حويصلات من 26 خلية من ستة نباتات وثلاث تجارب مستقلة؛ لـ (ج) مناطق الاهتمام الثابتة من خلايا من ثلاث نباتات. تشير الحروف المختلفة إلى اختلافات ذات دلالة إحصائية، ، استنادًا إلى تحليل التباين أحادي الاتجاه واختبار المقارنات المتعددة لتوكاي. بالنسبة لـ (e)،جذور؛مخططات الصندوق: تُظهر الخطوط المركزية الوسيطات؛ تحدد حدود الصندوق النسب المئوية 25 و75؛ تمتد الشعيرات إلى الحد الأدنى والحد الأقصى. قضبان المقياس، (أ، هـ (نظرة عامة)) (أ، هـ (إدراج)) (د).
الشكل 7 من البيانات الموسعة | انظر الصفحة التالية للتعليق.
الشكل البياني الممتد 7| تم تواجد SOS1-GFP مع RABF2A و RABF2B في هياكل ما قبل الفجوة المتورمة الناتجة عن وورتمانين في الأرابيدوبسيس. أ-ب. تم ملاحظة ارتباط جزئي لـ SOS1-GFP مع علامات الحويصلات المتأخرة/ما قبل الفجوة mCherry-RABF2B (ARA7) (أ) و mCherry-RABF2A (RHA1) (ب)، تحت ظروف غير معالجة (تحكم) وكان مميزًا بعد معالجة وورتمانين (Wm). الأسهم تظهر نقاط تمثيلية. ج. تم تحفيز تواجد قوي لـ SOS1-GFP مع mCherry-VAMP711 بواسطة معالجة Wm، مما يؤكد أن جزءًا كبيرًا من حُقَيْبَات SOS1-GFP الإيجابية كانت حُقَيْبَات فجوية وسابقة للفجوة. يمكن ملاحظتها تحت كل من ظروف المعالجة غير المعالجة (التحكم) وظروف معالجة Wm. تم زراعة الشتلات في ظروف النمو 1. بالنسبة لـ (أ) التحكمالجذور، وعلاجات Wmالجذور؛ من أجل (ب) السيطرةالجذور، وعلاجات Wm،الجذور؛ من أجل (ج) السيطرةالجذور، وعلاجات Wmالجذور. تم معالجة الشتلات بـلمدة حوالي ساعة واحدة. قضبان القياس،نظرة عامة (إدراج).
الشكل 8 من البيانات الموسعة | انظر الصفحة التالية للتعليق.
الشكل البياني الممتد 8 | تراكم ضعيف لـ SOS1-GFP في أجسام BFA واكتشاف SOS1-GFP في حجرة الفجوة في نسيج ورقة الأرابيدوبسيس. أ. تحديد موقع SOS1-GFP في خلايا البشرة الجذرية في خطوط sos1 المكملة. امتصاص FM4-64 (ماجنتا) بعد حوالي ساعة، مع تسليط الضوء بشكل عام على حُجرات الإندوسوم المبكرة إلى المتأخرة. عرض مقرب لخلية جلدية وتراكب (المنطقة المحددة بمربع منقط). ملاحظة: الكمية التي تظهر عدم التداخل بين FM4-64 و SOS1-GFP داخل الخلية. ب. أدى علاج بريفيلدين A (BFA) إلى تراكم جزئي لـ SOS1 في حُجرات BFA، مع تأثير ضئيل على التوزيع العام لـ SOS1 في حُجرات الإندوميمبرين الأخرى أو الغشاء البلازمي. أظهرت الحُجرات الإيجابية لـ FM4-64 تجمعًا قويًا في حجرة BFA. تم معالجة الشتلات بـتمت معالجة BFA وتم تلوينها مع FM4-64 لمدة حوالي ساعة. على اليمين، تم قياس كميات أجسام BFA مع SOS1-GFP. ج-د. أدت معالجة BFA إلى تراكم ضعيف لـ SOS1 مع RABF2B (ARA7) (ج)، و RABF2A (RHA1) (د) في حُجرات BFA. هـ. تم إجراء تحليل Western blot لفرزات الفجوات والميكروسومات من أنسجة الأوراق لـ WT و sos1 باستخدام جسم مضاد متعدد النسائل ضد SOS1 تم تنقيته بال affinity مع SOS1. (السهم الأحمر)، تم اكتشافه في الكسر الفجوي. تم الكشف عن علامة الفجوة v-ATPase باستخدام أجسام مضادة تجارية. تعتبر البقع تمثيلاً لنسختين بيولوجيتين. يرجى الرجوع إلى الشكل التكميلية 1 للبقع الأصلية. ف. تم ملاحظة توطين SOS1-GFP في الغشاء المحيط بالفجوة في الفجوات السليمة المستخرجة من أنسجة الأوراق. تظهر الفجوات من نباتات WT غير المحولة كتحكم سلبي. صور الضوء المنقول (يسار)، فلوروسينس GFP (وسط) ودمج كلاهما (يمين). الصور تمثل ثلاث نسخ بيولوجية. يمثل الرسم البياني الصندوقي معامل ارتباط بيرسون. بالنسبة لـ (أ) التحكمالجذور؛ التكميمحويصلات من خلايا القمة الجذرية لأربع نباتات؛ من أجلمعالج بـ BFAالجذور؛ التكميم، خلايا من 4 نباتات. تُظهر الرسوم البيانية الصندوقية خطوط المركز الوسيطة؛ تشير حدود الصندوق إلى النسب المئوية 25 و75؛ تمتد الشعيرات إلى الحد الأدنى والحد الأقصى. بالنسبة لـ (ج) المعالجة بـ BFA الجذور؛ (د) المعالجة بـ BFA . الصور تمثل صورًا متداخلة لشتلات عمرها 7 أيام نمت على أطباق MS في حالة نمو 1. قضبان القياس،((أ-د)(نظرة عامة)، ف) (أ-د)(إدراج)).
محفظة الطبيعة
بريا راماكريشنا، نيكو جيلدنر، أندرس المؤلف(المؤلفون) المراسلون: ميبوم آخر تحديث من المؤلفين: 8 سبتمبر 2024
ملخص التقرير
تسعى Nature Portfolio إلى تحسين إمكانية تكرار العمل الذي ننشره. يوفر هذا النموذج هيكلًا للاتساق والشفافية في التقرير. لمزيد من المعلومات حول سياسات Nature Portfolio، يرجى الاطلاع على سياسات التحرير وقائمة مراجعة سياسة التحرير.
الإحصائيات
لجميع التحليلات الإحصائية، تأكد من أن العناصر التالية موجودة في أسطورة الشكل، أسطورة الجدول، النص الرئيسي، أو قسم الطرق. □ □ □ □ □ □ □
حجم العينة بالضبطلكل مجموعة/شرط تجريبي، معطاة كرقم منفصل ووحدة قياس
بيان حول ما إذا كانت القياسات قد أُخذت من عينات متميزة أو ما إذا كانت نفس العينة قد تم قياسها عدة مرات X اختبار(ات) الإحصاء المستخدمة وما إذا كانت أحادية الجانب أو ثنائية الجانب يجب أن تُوصف الاختبارات الشائعة فقط بالاسم؛ واصفًا التقنيات الأكثر تعقيدًا في قسم الطرق. تم التأكيد
وصف لجميع المتغيرات المشتركة التي تم اختبارها □ وصف لأي افتراضات أو تصحيحات، مثل اختبارات الطبيعية والتعديل للمقارنات المتعددة
لاختبار الفرضية الصفرية، إحصائية الاختبار (على سبيل المثال، ) مع فترات الثقة، أحجام التأثير، درجات الحرية وقيمة ملحوظة أعطِالقيم كقيم دقيقة كلما كان ذلك مناسبًا. □ لتحليل بايزي، معلومات حول اختيار القيم الأولية وإعدادات سلسلة ماركوف مونت كارلو □ لتصميمات هرمية ومعقدة، تحديد المستوى المناسب للاختبارات والتقارير الكاملة عن النتائج
تقديرات أحجام التأثير (مثل حجم تأثير كوهين)بيرسون )، مما يشير إلى كيفية حسابها
البرمجيات والشيفرة
معلومات السياسة حول توفر كود الكمبيوتر
جمع البيانات
تحليل البيانات
تم استخدام جهاز CryoNanoSIMS في مختبر الكيمياء الحيوية البيولوجية في EPFL، سويسرا، للحصول على صور CryoNanoSIMS. تم التقاط الصور المدمجة باستخدام ميكروسكوب ليكا ستيلاريس 5 WLL المقلوب وبرنامج LAS X (2022). تم إنتاج أفلام القرص الدوار باستخدام رأس القرص الدوار CSU-W1 من يوكوجاوا المثبت على ميكروسكوب نيكون إكليبس Ti-E المقلوب.
بالنسبة للمخطوطات التي تستخدم خوارزميات أو برامج مخصصة تكون مركزية في البحث ولكن لم يتم وصفها بعد في الأدبيات المنشورة، يجب أن تكون البرمجيات متاحة للمحررين والمراجعين. نحن نشجع بشدة على إيداع الشيفرة في مستودع مجتمعي (مثل GitHub). راجع إرشادات مجموعة Nature لتقديم الشيفرة والبرمجيات لمزيد من المعلومات. محفظة الطبيعة | ملخص التقرير –
بيانات
معلومات السياسة حول توفر البيانات
يجب أن تتضمن جميع المخطوطات بيانًا حول توفر البيانات. يجب أن يتضمن هذا البيان المعلومات التالية، حيثما ينطبق:
رموز الانضمام، معرفات فريدة، أو روابط ويب لمجموعات البيانات المتاحة للجمهور
وصف لأي قيود على توفر البيانات
بالنسبة لمجموعات البيانات السريرية أو بيانات الطرف الثالث، يرجى التأكد من أن البيان يتماشى مع سياستنا
جميع البيانات المعالجة مسبقًا والمعالجة المرتبطة بصور CryoNanoSIMS والفلوريسcence متاحة في أحدث إصدار منhttps://doi.org/10.5281/zenodo.14054006. تتوفر النسخ الكاملة لجميع الجل والبلوتات المقدمة في الشكل التكميلية 1. يتم توفير بيانات المصدر مع هذه الورقة لجميع الأشكال الرئيسية والموسعة التي تحتوي على التحليلات.
البحث الذي يتضمن مشاركين بشريين، بياناتهم، أو مواد بيولوجية
معلومات السياسة حول الدراسات التي تشمل مشاركين بشريين أو بيانات بشرية. انظر أيضًا معلومات السياسة حول الجنس، الهوية/التقديم الجنسي، والتوجه الجنسي والعرق، والعرقية والعنصرية.
التقارير عن الجنس والنوع الاجتماعي
غير متوفر
التقارير عن العرق أو الإثنية أو غيرها من المجموعات الاجتماعية ذات الصلة
غير متوفر
خصائص السكان
غير متوفر
التوظيف
غير متوفر
رقابة الأخلاقيات
غير متوفر
يرجى ملاحظة أنه يجب أيضًا تقديم معلومات كاملة حول الموافقة على بروتوكول الدراسة في المخطوطة.
التقارير الخاصة بالمجال
يرجى اختيار الخيار أدناه الذي يناسب بحثك بشكل أفضل. إذا لم تكن متأكدًا، اقرأ الأقسام المناسبة قبل اتخاذ قرارك. علوم الحياة العلوم السلوكية والاجتماعية □ العلوم البيئية والتطورية والبيئية لنسخة مرجعية من الوثيقة بجميع الأقسام، انظرnature.com/documents/nr-reporting-summary-flat.pdf
تصميم دراسة علوم الحياة
يجب على جميع الدراسات الإفصاح عن هذه النقاط حتى عندما يكون الإفصاح سلبياً.
حجم العينة
تم تحديد حجم العينة بناءً على نوع التحليل. نظرًا لأن تجارب CryoNanoSIMS ذات إنتاجية منخفضة، فإن الحد الأدنى منتم اختيار الجذور لكل حالة في كل نقطة زمنية كأدنى عدد من التكرارات. تم اختبار عينة التحكم وعينة العلاج لكل من الحالات المختبرة بالتوازي في نفس التجربة. كانت تجارب نمو وتوصيف الجذور تحتوي على أحجام عينات أكبر لكل تكرار بيولوجي كما هو مذكور في أساطير الأشكال الخاصة بها. تم إجراء تجارب تحديد موضع البروتينات على الحد الأدنى منشتلات لكل علاج وتمت مقارنتها مع الضوابط الداخلية (وهمية).
استثناءات البيانات
لم يتم استبعاد البيانات من التحليل.
التكرار
تم معالجة جميع تجارب النسخ لـ CryoNanoSIMS وفقًا لسير العمل المبرد الموصوف في الطرق. تم إجراء التقديرات من خلال تجميع عمليات مختلفة وتم وصف معايير صارمة لاختيار مناطق الاهتمام بالتفصيل في قسم الطرق. بالنسبة للعلاجات المختلفة، تم تكرار جميع الظروف ومقارنتها مع التحكم (المزيف) لأنماط توطين البروتين. تم تكرار جميع التجارب وكانت جميع محاولات النسخ ناجحة.
العشوائية
تم اختيار الشتلات المستخدمة في التصوير بشكل عشوائي، ومع ذلك تم تحليل جميع الجذور بشكل متساوٍ دون أخذ عينات فرعية، وبالتالي لم يكن هناك حاجة للتوزيع العشوائي.
عمى
لم يكن من الممكن إخفاء الهوية لأن الظروف التجريبية كانت بحاجة إلى تتبع دقيق طوال سير عمل CryoNanoSIMS. تم إجراء التقديرات باستخدام نفس النهج بالتساوي لجميع الظروف والتكرارات.
التقارير عن مواد وأنظمة وطرق محددة
نحتاج إلى معلومات من المؤلفين حول بعض أنواع المواد والأنظمة التجريبية والأساليب المستخدمة في العديد من الدراسات. هنا، يرجى الإشارة إلى ما إذا كانت كل مادة أو نظام أو طريقة مدرجة ذات صلة بدراستك. إذا لم تكن متأكدًا مما إذا كان عنصر القائمة ينطبق على بحثك، يرجى قراءة القسم المناسب قبل اختيار رد.
المواد والأنظمة التجريبية
طرق
غير متوفر
مشارك في الدراسة
غير متوفر
مشارك في الدراسة
□
□
□
–
□
□
–
□
□
□
□
□
الأجسام المضادة
الأجسام المضادة المستخدمة
تم تحضير الأجسام المضادة ضد الببتيد “RSFRKEHRGMSWPE” من المنطقة الطرفية C لبروتين SOS1.
الأجسام المضادة الأولية (أجسام مضادة نقية ضد SOS1، تخفيف 1:2000؛ أجسام مضادة ضد الوحدة الإبسيلونية من مضخة البروتون H+ATPase من Agrisera AS07 213، تخفيف 1:10000).
الأجسام المضادة الثانوية: تم استخدام جسم مضاد ثانوي من الماعز ضد الفأر مرتبط بإنزيم البيروكسيداز من الفجل (HRP) مخفف بنسبة 1:10,000 في TBS-T.
التحقق
تم التحقق من الأجسام المضادة SOS1 من خلال الكشف عن المصل المضاد باستخدام تقنية الويسترن بلوت مع SOS1 المنقى المعزول من الخميرة.
نباتات
مخزونات البذور
تم الحصول على بذور الطفرات وعلامات العضيات من NASC – المركز الأوروبي لأسهم الأرابيدopsis.
أنماط جينية نباتية جديدة
تم إنشاء بنائين مستقلين لتأكيد موضع البروتين. تم إجراء تكامل الوظيفة من خلال تحويل النباتات البرية والطافرة بواسطة Agrobacterium باستخدام البنى الجينومية وتحليل الخطوط المستقلة.
المصادقة
تمت دراسة الأليل الطافر وخطوط العلامات للهياكل تحت الخلوية بشكل جيد سابقًا. تم التحقق من البذور لخطوط النباتات المعدلة وراثيًا من خلال علامة الاختيار (تألق غلاف البذور أو المضادات الحيوية) وتم التأكد من أنها متجانسة قبل التحليلات.
مختبر الكيمياء الجيولوجية الحيوية، كلية الهندسة المعمارية والهندسة المدنية والبيئية، المدرسة الفيدرالية Polytechnic في لوزان (EPFL)، لوزان، سويسرا.قسم بيولوجيا النباتات الجزيئية، بيوفور، جامعة لوزان – سورج، جامعة لوزان، لوزان، سويسرا.قسم البيولوجيا، ETH زيورخ، زيورخ، سويسرا.معهد بيochemistry النباتية والتمثيل الضوئي، المجلس الأعلى للبحوث العلمية وجامعة إشبيلية، إشبيلية، إسبانيا.مركز التحليل السطحي المتقدم، معهد علوم الأرض، جامعة لوزان، لوزان، سويسرا.مرفق المجهر الإلكتروني، جامعة لوزان، لوزان، سويسرا.علوم الحياة، المدرسة الفيدرالية Polytechnic في لوزان، لوزان، سويسرا. مركز التكنولوجيا الحيوية وعلم الجينوم للنباتات، الجامعة البوليتكنيكية في مدريد (UPM) – المعهد الوطني للبحث والتكنولوجيا الزراعية والغذائية (INIA/CSIC)، بوزويلو دي ألركون، إسبانيا.ساهم هؤلاء المؤلفون بالتساوي: فرانسيسكو م. غاميز-أرجونا، إتيان بيلاني.البريد الإلكتروني: priya.ramakrishna@epfl.ch; niko.geldner@unil.ch; anders.meibom@epfl.ch
ميبوم، أ. وآخرون. التصوير المتزامن باستخدام المجهر الإلكتروني الماسح بالتبريد وCryoNanoSIMS للأنسجة البيولوجية. BMC Biol. 21، 126 (2023).
دوبياك، ج. ر. توازن الأيونات، القنوات، والناقلات: تحديث حول الآليات الخلوية. التعليم الفسيولوجي المتقدم. 28، 143-154 (2004).
وايت، ب. ج. في تغذية المعادن للنباتات العليا لمارشينر (الطبعة الثالثة) (تحرير: مارشينر، ب.) 7-47 (أكاديميك، 2012).
رومهولد، ف. في تغذية المعادن للنباتات العليا لمارشنر (الطبعة الثالثة) (تحرير: مارشنر، ب.) 299-312 (أكاديميك، 2012).
فارغاس، ر. وآخرون (محررون) دليل إدارة التربة المالحة (منظمة الأغذية والزراعة للأمم المتحدة، جامعة لومونوسوف موسكو الحكومية، 2018).
كيم، س. أ. وآخرون. تحديد موقع الحديد في بذور الأرابيدوبسيس يتطلب الناقل الغشائي الفجوي VIT1. ساينس 314، 1295-1298 (2006).
بيرسون، د. ب. وآخرون. التصوير الحيوي متعدد العناصر لجذور الأرابيدوبسيس ثاليانا. فيزيولوجيا النبات. 172، 835-847 (2016).
مور، ك. ل. وآخرون. تكشف تقنيات NanoSIMS وفلوروسنس الأشعة السينية المتزامنة عن أنماط توزيع مميزة للعناصر النزرة في أنسجة الأرز. نيو فيتولوجي. 201، 104-115 (2014).
روان، أ.، مكولي، م. إ. و كاني، م. ج. أصل الإفراز من جذور الذرة المقطوعة. فيزيولوجيا النبات. الكيمياء الحيوية 38، 957-967 (2000).
شيا، ج.-س. وآخرون. فقدان وظيفة OPT3 يقلل من مستويات النحاس في اللحاء ويؤثر على التواصل بين توازن النحاس والحديد وإشارات من الساق إلى الجذر في أرابيدوبسيس ثالiana. خلية النبات 35، 2157-2185 (2023).
Priya Ramakrishna , Francisco M. Gámez-Arjona , Etienne Bellani , Cristina Martin-Olmos , Stéphane Escrig , Damien De Bellis , Anna De Luca , José M. Pardo , Francisco J. Quintero , Christel Genoud , Clara Sánchez-Rodriguez , Niko Geldner & Anders Meibom
Increasing soil salinity causes significant crop losses globally; therefore, understanding plant responses to salt (sodium) stress is of high importance. Plants avoid sodium toxicity through subcellular compartmentation by intricate processes involving a high level of elemental interdependence. Current technologies to visualize sodium, in particular, together with other elements, are either indirect or lack in resolution. Here we used the newly developed cryo nanoscale secondary ion mass spectrometry ion microprobe , which allows high-resolution elemental imaging of cryo-preserved samples and reveals the subcellular distributions of key macronutrients and micronutrients in root meristem cells of Arabidopsis and rice. We found an unexpected, concentration-dependent change in sodium distribution, switching from sodium accumulation in the cell walls at low external sodium concentrations to vacuolar accumulation at stressful concentrations. We conclude that, in root meristems, a key function of the NHX family sodium/proton antiporter SALT OVERLY SENSITIVE1 (also known as exchanger 7; SOS1/NHX7) is to sequester sodium into vacuoles, rather than extrusion of sodium into the extracellular space. This is corroborated by the use of new genomic, complementing fluorescently tagged SOS1 variants. We show that, in addition to the plasma membrane, SOS1 strongly accumulates at late endosome/prevacuoles as well as vacuoles, supporting a role of SOS1 in vacuolar sodium sequestration.
Cells accumulate a restricted set of elements within a specific range of concentrations to sustain their metabolic activities. Element-selective transport across the plasma membrane and into specific subcellular organelles is thus fundamental to life . This has driven evolution of an elaborate network of channels and transporters that dynamically regulate strong concentration differences with the surroundings, as well as intracellularly between subcellular compartments . In terrestrial plants, even relatively small deviations from elemental homeostasis can have profound consequences for organismal function, including failure to grow and reproduce . Most agricultural plants are very sensitive to the presence of sodium in the soil (referred to as salt stress), which today results in an estimated annual crop loss of 20-40% (ref. 6). Conditions leading to salt stress are exacerbated by climate change and are thus becoming an urgent problem for a growing world population.
Despite the importance of sodium detoxification for survival of plants in saline soils, efforts to obtain a mechanistic understanding of elemental homeostasis and cellular adaptation to salt stress have been hampered by the inability to directly observe element distributions
within cells at sufficient resolution. Genetically encoded fluorescent sensors and element-specific dyes provide indirect measures of one element at a time and are often restricted to a specific subcellular compartment. They can also be limited in sensitivity or dynamic range. Mass spectrometry or X-ray-based analytical techniques, such as laser ablation inductively coupled plasma mass spectrometry (LA-ICP-MS), X-ray fluorescence microscopy or energy dispersive X-ray spectroscopy either lack the spatial resolution or the sensitivity to detect intracellular elemental distributions. Furthermore, these generally require sample preparation involving dehydration, which unavoidably results in loss and/or substantial redistribution of solutes . Building on previous work , we have recently developed a cryo nanoscale secondary ion mass spectrometry (CryoNanoSIMS) ion microprobe that integrates with a fully cryogenic workflow, including block face cryo-scanning electron microscope (cryoSEM) imaging of vitrified samples. This new approach permits us to obtain elemental and isotope maps of vitrified biological tissues in their most pristine state with unparalleled sensitivity, mass and image resolution, and without any loss or displacement of soluble compounds .
Here we performed correlated cryoSEM and CryoNanoSIMS imaging to shed light on the cellular mechanisms underlying the salt-stress response in plants (Fig. 1a-c). We use Arabidopsis thaliana (Arabidopsis) root meristems as a model, but also demonstrate the applicability of our technique to Oryza sativa (rice), a global crop, in which we confirm our major findings. Root meristems carry the vital stem cell populations from which the entire root body originates. They explore new soil areas and are arguably the first to encounter, and locally deal with, excessive sodium concentrations. The ability of root meristems to extrude or compartmentalize sodium is therefore a major determinant of a plant’s ability to maintain growth at a given soil salinity.
Figure 1 schematically illustrates the general workflow (Fig. 1a) and examples of the resulting correlated cryoSEM image and CryoNanoSIMS maps (Fig.1b,c). To facilitate direct comparison between different roots, clearly defined meristematic root zones were systematically mapped with CryoNanoSIMS; namely, the region in which the cells transition from division to elongation (Extended Data Fig.1c). Using this workflow, we demonstrate that we can obtain parallel, high-resolution elemental maps for up to seven key elements, measured by their major stable isotopes: and (Fig. 1c). Validating our method, the observed subcellular elemental distributions in Arabidopsis root tips grown on a standard liquid half-strength Murashige-Skoog(MS) medium are highly consistent with specific predictions (Fig.1c). Calcium, for example, is known to have low cytosolic concentrations and to accumulate in the cell wall , which is consistent with the CryoNanoSIMS calcium map (Fig.1c). Moreover, calcium maps exhibited hot-spots in the wall and cell corners, which are likely to be correlated with the presence of pectins (negatively charged, galacturonic acid-based polymers) that cross-link with calcium .On the other hand, magnesium (known to interact with phospholipid membranes, proteins and phospho-nucleotides; in particular, ATP) was observed in the cytosol and vacuoles (Fig.1c). Sodium and potassium, the elements of direct interest to this study, displayed strongly contrasting distributions, with sodium concentrated primarily in the extracellular space and potassium preferentially accumulating in the cytosol, where it acts as the major monovalent cation (Fig.1c).
In contrast to animals, most plant species do not require sodium for any vital cellular process and grow well in its absence. We used a mini-hydroponics system to grow Arabidopsis plants, to obtain full control over elemental concentrations in the medium (Extended Data Fig. 1a). As expected, our CryoNanoSIMS detected only few counts of sodium when seedlings were grown on a sodium-free (Na-free) medium (control condition) (Fig. 2a and Extended Data Fig. 2a). By contrast, both low levels of sodium (half-strength MS medium, approx. 0.1 mM ; Extended Data Fig. 2c) and slightly elevated sodium levels ( 2.5 mM NaCl ; Fig. 2b, Extended Data Fig. 2d) resulted in a strong increase of sodium in the cell wall (Extended Data Fig. 2 g ), and a relatively low, but clearly detectable, presence of sodium in the cytosol (Extended Data Fig. 2e,f). This suggests either active sodium export, or limited uptake of sodium as the mechanism that maintains low cytosolic sodium levels under mild salt stress. The sodium/proton antiporter SOS1/NHX7 of the NHX family of antiporters is a major determinant of salt tolerance in Arabidopsis. It is expressed strongly in the root meristem that we investigated and is thought to act at the plasma membrane for extrusion of sodium into the cell wall . Interestingly, already at these low sodium concentrations ( 2.5 mM NaCl ), a mutant of SOS1 (sos1-1; sos1 from now on) showed increased cytosolic Na:K ratios and a decrease in Na :Ca ratios in the cell wall, which would be consistent with a function of SOS1 in sodium export at these concentrations (Extended Data Fig. 2d-g).
However, when we increased the salt stress to moderate levels ( 25 mM NaCl for 4 h ) we observed a radical change in the subcellular distribution of sodium (Fig. 2c). Meristematic cells then displayed strong accumulation of sodium in their vacuoles, with relatively less sodium in the cell walls (Fig. 2c,d and Extended Data Fig. 3a-c). By contrast, sos1
Fig. 1|Cryogenic workflow and correlative block face cryoSEMCryoNanoSIMS imaging of Arabidopsis roots. a, (i) Schematic of Arabidopsis seedlings grown in a 12-well hydroponics culture dish. Inset, image of 5-dayold seedlings from which root tips were sampled for high-pressure freezing. (ii) Vitrification by high-pressure freezing showing a root segment cut approximately 3 mm from the tip placed in a type A carrier filled with cryoprotectant. The graph illustrates the freezing process, with rapid build-up of pressure to approximately 2,000 bar accompanied by cooling with liquid to , vitrifying the sample. From this point on, the sample was maintained and handled under cryo-conditions. (iii) Vitrified root samples were cryo-planed to create a flat block face suitable for imaging. The sample was then transferred to an evaporator with a VCT shuttle. (iv) The block face was sublimated (freeze etched) to remove surface ice contamination and bring out ultrastructural detail of the root. (v) The sample surface was then coated and shuttled with the VCT into the cryoSEM. (vi) Tissue ultrastructure was imaged with cryoSEM. (vii) The sample was recoated and shuttled into the CryoNanoSIMS for elemental imaging. For more details, see Methods.b, CryoSEM imaged longitudinal view of a cryo-planed Arabidopsis root tip grown on liquid half-strength MS medium exhibiting the ultrastructural details of root meristem cells in their pristine, vitrified state.c, Example of a high-resolution cryoSEM image directly correlated with CryoNanoSIMS elemental maps of a cryo-planed root tip of WT Arabidopsis grown on liquid half-strength MS medium and treated as described in a, revealing the tissue organization and intracellular distributions of , and Fe . Vacuole (v), cytoplasm (c) and nucleus (n) are labelled. Colour scales are linear and maximum count rates (counts per second) are indicated by the colour bars. Scale bars, .
mutants showed the opposite sodium distribution, with low sodium in the vacuoles and much higher sodium in the cytosol (Fig. 2c,d), producing a reversal of vacuole:cytosol ratios compared with wild type (WT)
Fig. 2 | Correlated cryoSEM and CryoNanoSIMS mapping of Na, K and Ca in root meristems of Arabidopsis WT and sos1 mutant under mild and moderate salt stress. a, Representative images of WT seedlings grown on a Na-free medium (control), characterized by low, but clearly measurable background Na levels before salt-stress experiments; compare with Extended Data Fig. 2a,b for sos1. Epidermis (Ep), vacuole (v) and cytoplasm (c) are labelled. b, Root meristem of WT seedlings treated with 2.5 mM NaCl for 2 h (mild salt stress); compare with Extended Data Fig. 2d for sos1. c, Root meristem of WT and sos1 seedlings incubated with 25 mM NaCl for 4 h (moderate salt stress). Note that WT cells accumulated Na into vacuoles (*), whereas sos1 mutants accumulated Na in the cytosol. d, Average count rates for sodium in the vacuole and cytosol of the meristem cells in WT and sos1 (left) after growth in Na-free medium (control) and after treatment with 25 mM NaCl for 4 h . Also shown are vacuole:cytosol count-rate ratios of within individual meristem cells in WT and sos1 (right, orange). e, Corresponding average count rates for potassium in the vacuole and cytosol of the meristem cells in WT and sos1 (left). Also shown are vacuole:cytosol count-rate ratios of within individual meristem cells in WT and sos1 after growth (right, lilac). The intracellular distribution of potassium did not change significantly with the treatment. Box plots show the mean values (horizontal lines), 25% (boxes) and 75% (thin vertical bars) quartiles; outliers are indicated with solid circles. The sample were hydroponically grown on a Na-free medium and subject to respective treatments. Colour scales are linear and maximum ion count rates (counts per second) are indicated by the colour bars. Thin white arrows in cryoSEM images point towards the root tip. Scale bars, .
(Fig. 2d and Extended Data Fig. 3b). This revealed that the sos1 mutant is impaired in sodium translocation into vacuoles. However, at this level of salt stress and despite the substantial build-up of sodium in sos1 cytosol, the intracellular distribution of potassium, that is, the
potassium vacuole:cytosol ratio, was not yet perturbed (Fig. 2c-e and Extended Data Fig. 3b).
At higher levels of salt stress for 4 h, WT root meristem cells remained capable of concentrating sodium in their vacuoles and thus maintained a low cytosolic sodium level (Fig. 3a). The sos1 mutant, by contrast, suffered an even stronger build-up of sodium in its cytosol, associated with some degree of vacuolar accumulation (Fig. 3a-c and Extended Data Fig. 3d,e). Importantly, a concomitant drop in cytosolic potassium was observed in sos1, but not in WT (Fig. 3a,c), leading to a dramatic change of the cytosolic Na:K ratio in sos1, compared with WT (Fig. 3c). The observed decrease in cytosolic potassium ions and the appearance of sodium ions in the vacuoles in sos1 under high salt stress (Fig. 3a), is consistent with the often-proposed notion of sodium toxicity being due to a displacement of potassium as a counterion for cytosolic proteins . Indeed, WT plants were able to recover from this acute salt stress and even maintain slow growth on 100 mM NaCl on agar plates, whereas longer exposure of sos1 mutants to this salt concentration caused a complete cessation of growth from which sos1 did not recover, in contrast to WT (Extended Data Fig. 5d-f).
Based on our data in Arabidopsis root meristematic cells, the detoxification strategy of sodium sequestration in the cell wall, either through export or inhibition of uptake, appears relevant only at low sodium concentrations. Already at moderate salt stress, a new mechanism based on vacuolar or prevacuolar sequestration appears to dominate over export to reduce sodium concentration in the cytosol (Figs. 2 and 3). As root meristems were previously not considered to use sodium vacuolar sequestration as a protective mechanism, we wanted to see whether this mechanism is more broadly conserved. For this, we used root meristems of rice, as a major crop and a representative of the divergent monocot branch of flowering plants. Intriguingly, we observed the same, strong vacuolar accumulation upon salt stress, with maintenance of high potassium-to-sodium ratios in the cytosol (Fig. 3d and Extended Data Fig. 4b-e), demonstrating the conservation of this mechanism among angiosperms. In contrast to Arabidopsis, where SOS1 is expressed in both root meristem and differentiated vascular tissue, the rice SOS1 ortholog is not expressed in root meristems, but is exclusive to the differentiated root vasculature (Extended Data Fig. 4a) . We therefore predicted that the observed vacuolar accumulation in rice root meristems should not be dependent on . Indeed, we found the same pattern of vacuolar accumulation of sodium in the rice sos1 mutant as that observed in WT rice (Extended Data Fig. 4b-e). Thus, other transporters, such as of the endosomal or vacuolar NHX members, probably mediate vacuolar translocation in rice meristematic cells. The observed differences between and SOS1 are most likely not to be due to any differences in the cellular or biochemical activity of the proteins, because OsSOS1 under the control of a constitutive promoter fully rescues the Arabidopsis sos1 phenotype .
SOS1 has long been thought to be localized exclusively to the plasma membrane where it mediates sodium export into the cell wall. However, our data show that, under elevated sodium concentrations, the SOS1 protein has a dominant role in sodium accumulation into vacuoles (Figs. 2 and 3). New structural data shows SOS1 as a 13 transmembrane-spanning domain protein with an extracellular N-terminus and cytosolic C-terminus (Extended Data Fig. 5a). Current knowledge of SOS1 localization is entirely based on overexpression of fluorescent cDNA fusion constructs in a WT background . We therefore generated two independent genomic fusion constructs of SOS1. One contained a 1,929 bp promoter region linked to the coding sequence, including the first 13 introns, a nopaline synthase (NOS)-terminator and green fluorescent protein tag (SOS1-GFP). The other had a larger promoter fragment with the full number of introns and an endogenous SOS1 3’UTR-terminator fragment (SOS1-mCitrine) (Extended Data Fig. 5b,c). In Arabidopsis seedlings, both fusion constructs largely complemented the salt sensitivity phenotype of sos1 (Extended Data Fig. 5d-h) and gave very similar subcellular localization
Fig. 3 | Correlated cryoSEM and CryoNanoSIMS mapping of Na , K and Ca in root meristems of Arabidopsis WT and sos1 mutant and rice WT under high salt stress. a, Representative images of epidermal cells from WT and sos1 treated with 100 mM NaCl for 4 h . Note the maintenance of low Na levels in WT cytosol, in contrast with the strong accumulation of Na in sos1 cytosol. Note also a significant decrease in the cytosolic K in sos1 cells compared with the WT. Epidermis (Ep), vacuole (v) and cytoplasm (c) are labelled. b, Vacuole:cytosol count-rate ratios of (left) and (right) from root epidermal meristem cells in WT and sos1 on 100 mM NaCl for 4 h. c, Average count rates for and in the cytosol of the meristem cells in WT and sos1 (left) and the corresponding average cytosolic ratios (right). Note the maintenance of low sodium levels in WT cytosol, in contrast with the strong cytosolic sodium accumulation in sos1, and a significant decrease in the cytosolic potassium in sos1 compared with the WT.d, Representative images of rice root meristem epidermal cells under salt stress. WT seedlings were treated with 100 mM NaCl for 4 h . Note that WT cells accumulated Na into vacuoles similarly to WT Arabidopsis. The experiment was repeated twice with similar results. See Extended Data Fig. 4 for comparative analysis with rice sos1 mutant. Box plots show the mean values (horizontal lines), (boxes) and (thin vertical bars) quartiles; outliers are indicated with solid circles. Samples were grown in hydroponics on Na -free medium and subject to respective treatments. Colour scales are linear and maximum ion count rates (counts per second) are indicated by the colour bars. Thin white arrows in SEM images point towards the root tip. Scale bars, .
with rather weak signals (Fig.4a and Extended Data Fig. 6a). The former construct variant showed a consistently higher, more easily observable signal than the latter and was therefore used for most experiments presented here (Fig. 4a). Surprisingly, our complementing fusion constructs showed strong accumulation in undefined endomembrane compartments, of both reticulate and vesicle-like nature, and some degree of tonoplast accumulation, in addition to its reported plasma
membrane localization (Fig. 4a). When quantified, the SOS1 fluorescence signal measured in endomembrane compartments largely surpassed that at the plasma membrane (Fig. 4b). These endomembrane compartments did not significantly colocalize with the endocytic tracer FM4-64 (1 h uptake) (Extended Data Figs. 6a and 8a) nor with the early endosome/trans-Golgi network marker VHA-a1 (Fig.4c, Extended Data Fig. 6b and Supplementary Video 1). The presence of SOS1 on both prevacuolar/late endosomal and vacuolar membranes was confirmed by colocalization and comigration with late endosomal Rab markers (Fig. 4d,e, Extended Data Fig. 6b and Supplementary Video 2) and colocalization with the vacuolar SNARE protein mCherry-VAMP711 (VESICLE-ASSOCIATED MEMBRANE PROTEIN 711) (Fig. 4f and Extended Data Fig. 6c) . We observed no change in SOS1 localization upon salt stress (Fig. 4c-f right panel and Extended Data Fig. 6b,e), except for its enhancement at the plasma membrane, as previously reported and a different appearance of the tonoplast, due to a known change of vacuolar structures. SOS1-positive vesicle-like structures showed clear colocalization and comigration with late endosomal/prevacuolar compartment markers, as was evident in time-lapse analyses (Extended Data Fig. 6d and Supplementary Video 2). Consistently, on application of the PI3 kinase inhibitor Wortmannin, known to affect RabF-positive compartments, SOS1-GFP and RABF2A were seen to colocalize in swollen Wortmannin-induced prevacuolar structures (Extended Data Fig. 7). By contrast, Brefeldin A (BFA), which inhibits early and recycling endosomes, only caused weak accumulation of SOS1-GFP in ‘BFA bodies’, which further supported its late endosomal localization (Extended Data Fig. 8b-d). We could further demonstrate that the observed vacuolar localization of SOS1 is not due to the presence of fluorescent protein tag, nor to a specificity of root meristem cells. We detected endogenous SOS1 on vacuolar membrane fractions prepared from leaves, using a purified peptide antibody (Extended Data Fig. 8e). This was corroborated by clear SOS1-GFP signals on vacuolar preparations of Arabidopsis mesophyll cells (Extended Data Fig. 8f).
The additional late endosomal and vacuolar localization observed here is fully consistent with an activity of SOS1 in vacuolar sodium sequestration, as suggested by the CryoNanoSIMS data (Figs. 2 and 3). Indeed, the large surface-to-volume ratios of the prevacuolar endosomal compartments might be advantageous for efficient clearing of sodium from the cytosol and sequestration into luminal spaces that eventually fuse with the vacuole and deliver their contents. Such a mechanism for sodium sequestration was previously proposed, based on the unexpected importance of endosomal (as opposed to vacuolar) proton-pump activities for sodium tolerance .
Previous observations of sodium in planta often confounded many cell types within organs or complex tissues . The application of our new high-resolution elemental imaging technology to plants has allowed us to describe the unexpected complexity of the sodium detoxification within single root meristem cells, involving retention in the cell wall and vacuolar sequestration, depending on salt-stress intensity. Our CryoNanoSIMS observations, in combination with the unexpected subcellular localization of the central sodium/proton antiporter SOS1 to late endosomal and vacuolar membranes, demonstrate that SOS1 is critically involved in vacuolar sodium sequestration in addition to its role of sodium efflux at the cell surface. In the case of xylem loading, for example, clear evidence supports a plasma membrane-based activity of SOS1, counteracting the activity of HKT1 that promotes sodium retention in roots, as well as in other organs . This cycle might allow rapid switching of root retention of sodium towards transport to aerial tissues upon increases in sodium concentrations . The absence of a differentiated vasculature in root meristems might render a sodium extrusion strategy ineffective and explain a critical role of vacuolar accumulation as a detoxification strategy for these crucially important meristem cells. It is important to note that our work with the CryoNanoSIMS probe allows us to obtain in situ data, not of transport, but of subcellular ion distribution, for which we compare mutant and WT. Therefore,
Fig. 4 | Subcellular localization of sodium/proton antiporter SOS1.
a, Localization of SOS1-GFP in Arabidopsis root epidermal cells in sos1 complemented lines. Close-up view of an epidermal cell (area marked with dotted box). Note the strong signal from endomembrane compartments in addition to the plasma membrane (PM). The arrows highlight endomembrane compartments (E) and vacuoles (V).b, Quantification of the SOS1-GFP signal measured in the plasma membrane and inside the cell (internal), as shown in the schematic, and the corresponding ratio of the SOS1-GFP signal (internal:PM). Corrected intensity is given in arbitrary units (a.u.).c, SOS1 protein did not colocalize with the trans-Golgi network marker VHA-a1 in the root epidermal cells. Absence of colocalization can be observed in Supplementary Video 1. d, SOS1-GFP showed partial association with mCherry-RABF2B (ARA7). Arrows highlight selected punctuate points that show the association.e, SOS1-GFP
rather than replacing transport measurements, our method adds an important new dimension to our understanding of the intricacies of salt detoxification in plants. Actual, traditional transport measurements are evidently irreplacable but are very difficult to execute for specific organelles in specific cell types.
SOS1/NHX7 is highly selective for sodium transport whereas all other intracellular NHX variants tested so far discriminate poorly between sodium and potassium as transport substrates . Nevertheless, our results in rice show that, although vacuolar sodium accumulation
partial association with mCherry-RABF2A (RHA1). For tracking of vesicle comigration, compare with Extended Data Fig. 5b and Supplementary Video 2. f, SOS1-GFP (green) displayed significant colocalization with the tonoplast marker mCherry-VAMP711 (magenta). For all the markers, the localization upon 25 mM NaCl treatment for 1 day is shown by corresponding images on the right. The seedlings for and were grown in growth condition 1 and for they were grown in growth condition 2 (Methods). Quantification of SOS1-GFP signal, cells from four different roots examined independently. Box plots show the median values (horizontal lines), 25% (boxes) and 75% (thin vertical bars) quartiles, and the mean is represented by the square symbol within the box. For quantification of vesicle association, refer to Extended Data Fig. 6b and Supplementary Videos 1 and 2. Scale bars, (a)(overview)), (a (inset), c-f).
in root meristems is conserved, transporters other than SOS1 must mediate this accumulation. Based on our results, it will be important to reassess the role of the SOS1 homologs of the NHX family with CryoNanoSIMS, as several NHX family members have been localized to vacuolar and endosomal compartments and are thought to mediate vacuolar sequestration independently of SOS1 (refs. 30,33). Consistent with our findings, it was reported that absence of all vacuolar NHX family members (NHX1-4) of Arabidopsis did not abrogate vacuolar accumulation of NaCl in Arabidopsis, an activity that might be mediated
by vacuolar-localized SOS1 (ref.34). Interestingly, a recent report on the highly salt-tolerant plant species Salicornia bigelovii found the presence of a putative ortholog of SOS1 in vacuolar membrane fractions of leaf tissues . It was suggested that this presents a case of neofunctionalization of SOS1 in this highly salt-adapted plant, for vacuolar sequestration instead of extrusion into the cell wall. Instead, our data suggests that vacuolar sequestration is actually a conserved function of SOS1, as we find endosomal/vacuolar localization of SOS1 not only in root meristematic cells, but also in leaf tissue of Arabidopsis, which is a glycophyte with a salt tolerance much more similar to all major crop species.
In a broader perspective, we have demonstrated that CryoNanoSIMS enables direct, multi-elemental imaging at subcellular resolution, not only in Arabidopsis, but also in rice, as a major crop and monocot model species. This promises to lead to breakthroughs in our understanding of elemental homeostasis in plants, by addressing a broad range of fundamental questions concerning acquisition and distribution of other agronomically important macronutrients such as potassium, calcium and magnesium; particularly when combined with already available and characterized transport mutants. Moreover, CryoNanoSIMS has the potential to provide insights into the in vivo roles of many as yet unidentified, or insufficiently characterized transporters. Finally, we have demonstrated that even micronutrients or trace elements, such as iron or manganese, can be imaged with this technology (Fig. 1c). Another currently unexplored area of great potential will be the use of isotopes for elemental flux measurements, to allow their uptake and distribution to be traced.
Online content
Any methods, additional references, Nature Portfolio reporting summaries, source data, extended data, supplementary information, acknowledgements, peer review information; details of author contributions and competing interests; and statements of data and code availability are available at https://doi.org/10.1038/s41586-024-08403-y.
12. Metzner, R., Schneider, H. U., Breuer, U. & Schroeder, W. H. Imaging nutrient distributions in plant tissue using time-of-flight secondary ion mass spectrometry and scanning electron microscopy. Plant Physiol. 147, 1774-1787 (2008).
13. Chandra, S., Bernius, M. T. & Morrison, G. H. Intracellular localization of diffusible elements in frozen-hydrated biological specimens with ion microscopy. Anal. Chem. 58, 493-496 (1986).
14. Dérue, C. et al. Dynamic-SIMS imaging and quantification of inorganic ions in frozenhydrated plant samples. Microsc. Res. Tech. 69, 53-63 (2006).
15. Palin, R. & Geitmann, A. The role of pectin in plant morphogenesis. BioSystems 109, 397-402 (2012).
16. Romani, A. M. P. in Magnesium in the Central Nervous System (eds Vink, R. & Nechifor, M.) Ch. 2 (Univ. Adelaide Press, 2011).
17. Wu, S. J., Ding, L. & Zhu, J. K. SOS1, a genetic locus essential for salt tolerance and potassium acquisition. Plant Cell 8, 617-627 (1996).
18. Shi, H., Ishitani, M., Kim, C. & Zhu, J.-K. The Arabidopsis thaliana salt tolerance gene SOS1 encodes a putative antiporter. Proc. Natl Acad. Sci. USA 97, 6896-6901 (2000).
19. Shi, H., Quintero, F. J., Pardo, J. M. & Zhu, J.-K. The putative plasma membrane antiporter SOS1 controls long-distance transport in plants. Plant Cell 14, 465-477 (2002).
20. Maathuis, nutrition and toxicity: the basis of cellular ratios. Ann. Bot. 84, 123-133 (1999).
21. Benito, B., Haro, R., Amtmann, A., Cuin, T. A. & Dreyer, I. The twins and in plants. J. Plant Physiol. 171, 723-731 (2014).
22. El Mahi, H. et al. A critical role of sodium flux via the plasma membrane exchanger SOS1 in the salt tolerance of rice. Plant Physiol. 180, 1046-1065 (2019).
23. Martínez-Atienza, J. et al. Conservation of the salt overly sensitive pathway in rice. Plant Physiol. 143, 1001-1012 (2007).
24. Wang, Y. et al. Architecture and autoinhibitory mechanism of the plasma membrane antiporter SOS1 in Arabidopsis. Nat. Commun. 14, 4487 (2023).
25. Geldner, N. et al. Rapid, combinatorial analysis of membrane compartments in intact plants with a multicolor marker set. Plant J. 59, 169-178 (2009).
26. Gámez-Arjona, F. et al. Inverse regulation of SOS1 and HKT1 protein localization and stability by SOS3/CBL4 in Arabidopsis thaliana. Proc. Natl Acad. Sci. USA 121, e232O657121 (2024).
27. Krebs, M. et al. Arabidopsis V-ATPase activity at the tonoplast is required for efficient nutrient storage but not for sodium accumulation. Proc. Natl Acad. Sci. USA 107, 3251-3256 (2010).
28. Hamaji, K. et al. Dynamic aspects of ion accumulation by vesicle traffic under salt stress in Arabidopsis. Plant Cell Physiol. 50, 2023-2033 (2009).
29. Kronzucker, H. J. & Britto, D. T. Sodium transport in plants: a critical review. New Phytol. 189, 54-81 (2011).
30. Apse, M. P., Aharon, G. S., Snedden, W. A. & Blumwald, E. Salt tolerance conferred by overexpression of a vacuolar antiport in Arabidopsis. Science 285, 1256-1258 (1999).
31. Uchiyama, T. et al. The HKT1 transporter protects plant fertility by decreasing content in stamen filaments. Sci. Adv. 9, eadg5495 (2023).
32. Raddatz, N., Morales de los Ríos, L., Lindahl, M., Quintero, F. J. & Pardo, J. M. Coordinated transport of nitrate, potassium, and sodium. Front. Plant Sci. 11, 247 (2020).
33. Bassil, E. et al. The Arabidopsis intracellular antiporters NHX5 and NHX6 are endosome associated and necessary for plant growth and development. Plant Cell 23, 224-239 (2011).
34. Bassil, E., Zhang, S., Gong, H., Tajima, H. & Blumwald, E. Cation specificity of vacuolar NHX-type cation/ antiporters. Plant Physiol. 179, 616-629 (2019).
35. Salazar, O. R. et al. SOS1 tonoplast neo-localization and the RGG protein SALTY are important in the extreme salinity tolerance of Salicornia bigelovii. Nat. Commun. 15, 4279 (2024).
Publisher’s note Springer Nature remains neutral with regard to jurisdictional claims in published maps and institutional affiliations.
Open Access This article is licensed under a Creative Commons Attribution-NonCommercial-NoDerivatives 4.0 International License, which permits any non-commercial use, sharing, distribution and reproduction in any medium or format, as long as you give appropriate credit to the original author(s) and the source, provide a link to the Creative Commons licence, and indicate if you modified the licensed material. You do not have permission under this licence to share adapted material derived from this article or parts of it. The images or other third party material in this article are included in the article’s Creative Commons licence, unless indicated otherwise in a credit line to the material. If material is not included in the article’s Creative Commons licence and your intended use is not permitted by statutory regulation or exceeds the permitted use, you will need to obtain permission directly from the copyright holder. To view a copy of this licence, visit http:// creativecommons.org/licenses/by-nc-nd/4.0/.
(c) The Author(s) 2025
Methods
Plant materials
For the experiments, Arabidopsis thaliana ecotype Columbia-0 (Col-0) referred to as WT and salt overly sensitive 1 (sos1) mutant in the Col-0 gl-1 background were used; the sos1-1 allele was previously identified in an ethyl methane sulfonate screen . The following published constructs were introduced either by transformation or crossing into sos1:SOS1-GFP(ref. 26); VHA-A1-RFP(AT2G28520: VACUOLAR PROTON ATPASE A1); mCherry-RABF2A (AT5G45130: RHA1 or ARABIDOPSIS RAB HOMOLOG F2A); mCherry-RABF2B (AT4G19640: ARA7 or ARABIDOPSIS RAB GTPASE HOMOLOG F2B); mCherry-VAMP711 (AT4G32150: VESICLE-ASSOCIATED MEMBRANE PROTEIN 711) (refs. 25,36). Rice (Oryza sativa) cv. Nipponbare (WT) and the mutant Ossos1 are lines previously described .
Hydroponics plant growth
Seedlings grown under standard conditions on standard half-strength Murashige-Skoog (MS) media agar plates were exposed to low and variable levels of Na , which resulted in a high Na -background in the CryoNanoSIMS images. To ensure controlled starting point for subsequent salt-stress experiments, a growth medium free of Na was required. This was achieved with a hydroponics system and using a medium formulation free of sodium (referred throughout the manuscript as Na-free medium) to allow fully controlled salt-stress assays for growth experiments.
Composition of liquid MS and Na-free medium for hydroponics. The Na-free medium was composed of MS basal salt macronutrient solution (formulation number M0654; Sigma-Aldrich) as the macroelement source. Each microelement solution was prepared separately and all solutions were prepared with MilliQ water. Essential micronutrients, free from Na -containing compounds, were used at the following concentrations: boric acid copper sulfate pentahydrate molybdic acid ammonium salt heptahydrate ( potassium iodide (KI), cobalt(II) chloride hexahydrate III (Chemie Brunschwig AG, CH), manganese(II) sulfate monohydrate and zinc sulfate heptahydrate . 2.5 mM MES (2-morpholinoethanesulfonic acid) buffer was added, the pH was adjusted to 5.7 with KOH and the solution was sterilized. For comparison with a liquid half-strength MS medium, the seedlings were grown on a sterile liquid half-strength MS solution, pH adjusted to 5.7 with KOH .
Arabidopsis growth. Sterilized Arabidopsis seeds were sown on a wetted perforated disc placed in a sterile 12-well culture plate and stratified in the dark for 2 days. The pore size of the disc was approximately , which prevented the seeds from falling through, but was sufficient for the roots to grow through. Post stratification, the wells were carefully topped with 4 ml of Na -free medium which enabled the discs with the seeds to float. The set-up was transferred to growth chambers at with constant light and grown for 5 days. For NaCl treatments, stock solutions prepared in MilliQ water were used and the seedlings were directly treated with and 100 mM NaCl for the indicated times in the hydroponics system under sterile condition and subsequently sampled for analysis with the cryogenic workflow described below (Fig. 1a). Root growth in the hydroponics system was compared with standard half-strength MS growth medium and growth on agar plates (Extended Data Fig. 1a). The concentrations of Na for growth stress were tested on agar plates and treatment conditions selected for hydroponics treatment (Extended Data Fig.1d).
Rice growth. Sterilized rice seeds were germinated on wet filter paper for 3 days in the dark and then transferred to a hydroponics system on perforated sterile filter paper with the cotyledon in contact with the same Na-free medium described above. Growth was continued in a
hydroponics settings in the growth chamber set to with constant light and grown for 5 days. Salt treatments were given by adding NaCl directly to the hydroponic set-up and then sampled for high-pressure freezing (see below) at the set time point.
CryoSEM-CryoNanoSIMS workflow
A general description of the CryoNanoSIMS workflow can be found in ref. 1. Here we describe a specific workflow optimized for plants that focusing on Arabidopsis root meristems, as illustrated in Fig. 1 and Extended Data Fig. 1.
Sample preparation and high-pressure freezing. This process is schematically summarized in Fig. 1a. For high-pressure freezing, the seedlings were gently transferred to a small petri dish with the media. The roots (radius approximately ) were cut approximately 3 mm from the tip and immediately placed in a -diameter gold coated Type A Cu-carrier with a cavity of 0.1 mm (Article 1322, Wohlwend GmbH, Sennwald, Switzerland) filled with the cryoprotectant Dextran in 50 mM MES, pH 5.7 ) and then covered with the flat side of an aluminium specimen carrier type B (Article 1313, Wohlwend GmbH, Sennwald, Switzerland) and directly high-pressure frozen using an EM ICE (Leica) device. From this point on in the workflow, the samples were maintained and handled under strictly controlled cryo-conditions.
Cryo-planing of vitrified sample block face. The Cu-carriers with the root samples were loaded into a sample holder inside a Leica instrument EMVCM with a stable cryo-environment (liquid bath) and transferred to a Leica cryo-chamber EM FC7 on a Leica EM UC7 Ultramicrotome with the chamber and the sample holder maintained at . A flat and smooth surface, which is essential for CryoNanoSIMS imaging, was created with a trimming diamond knife Cryo TRIM20 (Diatome, Biel), generating a surface block face containing a section of the root sample. A diamond cryo TRIM20 Diatome knife was used to further smooth the surface of the sample.
From this point on, a Leica EM VCT500 vacuum cryo-transfer (VCT) shuttle, holding the sample at about in a vacuum of , was used to transfer the sample between different instruments.
Freeze etching. The samples were transferred to a Leica cryo-eBeam metal coater EM ACE600 under cryogenic conditions, pumped to a vacuum of . Samples were sublimated with a temperature cycle in which they were ramped up from to over 20 min , held at for 90 s and ramped down to over 20 min with a ramp rate of . These settings were empirically optimized to remove surface ice contamination and gently bring out ultrastructural detail of the root sections, which could be imaged in the cryoSEM.
Metal coating and cryoSEM imaging. Before cryoSEM imaging, the sample surface was coated with an approximately 3 nm layer of PtC using Leica cryo-eBeam metal coater (EM ACE600). The roots were then imaged using a Zeiss Gemini 500 SEM with a Leica cryostage operated at with the vacuum at . Images were acquired with the Inlens detector and an accelerating voltage of 1.7 kV with a working distance of 3.5 mm and an aperture size of . High-resolution images of pixels were obtained both for overviews of the root samples and at higher magnification from areas of interest at the surface of the sample. These cryoSEM images served to select and correlate regions of the root sections with CryoNanoSIMS imaging.
Second metal coating. The samples were returned with the VCT under vacuum from the cryoSEM to the Leica cryo-eBeam metal coater EM ACE600. An additional approximately 17 nm layer of PtC was deposited on the sample surface and maintained at . This was necessary to increase the conductivity and dissipate surface charging during
CryoNanoSIMS analysis. The sample was then transferred with the VCT to the CryoNanoSIMS for imaging.
CryoNanoSIMS imaging. Elemental mapping was performed with the new CryoNanoSIMS instrument within the Laboratory for Biological Geochemistry at EPFL . Images were systematically acquired on the root meristem with epidermal cells in the region where the cells transition from division to elongation (Extended Data Figs. 1c and 4a). Sample surface areas with ice or particle contamination (visible in cryoSEM images) were avoided. Areas selected for imaging were presputtered for 5 min with a defocused ion beam to a total dose of about ions per , to remove the metal coating. The sample surface was then bombarded with a primary ion beam of about 20 pA ions focused to a spot size of about 400 nm . Images of with pixels were obtained by rastering this primary beam across the sample surface with a pixel dwell-time of 5 ms . Secondary ions and were simultaneously collected in electron multipliers at a mass resolution of about 7,000 (Cameca definition), which was enough to resolve all mass interferences. A total of six acquisition cycles were recorded for a total analysis time of about 35 min per image (Extended Data Fig. 1b). Importantly, with these analytical settings, and , the two ions of direct importance for this study, were clearly detectable in all parts of the plant tissue from all experimental conditions (Extended Data Fig. 2), rendering a statistically robust direct comparison of the relative sodium and potassium distributions possible.
NanoSIMS image processing and analysis. Image analysis was performed using the L’IMAGE software v.10-15-2021 (developed by L. Nittler). Layers were drift corrected and accumulated. Regions of interest (ROIs) were drawn on ion images based on cryoSEM images to demarcate cells and the two primary subcellular areas of interest: vacuoles and cytosol (Extended Data Fig.1e). For the 2.5 mM treatment, ROIs for the cell wall were conservatively selected with the calcium ion map as the basis for ROI assignment. Count-rate data were extracted from epidermal cells, without distinguishing between trichoblast (root hair) and atrichoblast (non-root hair) cells. Within individual cells, the vacuolar (or cytosolic) ROIs were combined into one ROI (that is, one ROI for each organelle type), because these regions are likely to be connected in three-dimensional space within the cells (Extended Data Fig. 1e). Only structures with smallest linear dimension of at least 5 pixels (that is, substantially larger than the size of the primary beam) were selected as ROIs. For each ROI, the average count rate for each elemental species (counts per second) was obtained from the accumulated images. In the absence of suitably matrix-matched standards, absolute elemental concentrations cannot be determined, but measured elemental ratios for specific subcellular compartments, obtained under identical analytical conditions, can meaningfully be compared within and between samples. To optimize comparability, WT and sos1 seedlings were grown on the same medium, under identical growth conditions, and went through identical cryo-workflow and analysis with identical instrument settings. Both WT and sos1 roots were included in each CryoNanoSIMS run. Line-profile data (5 pixels wide) were extracted from the regions highlighted on the image (Extended Data Figs. 2a-d and 3a,d).
Growth conditions for confocal microscopy experiments, complementation and root growth assays
In growth condition1, seeds were surface-sterilized, sown on plates that contained half-strength MS with 0.8% agar (Roth), stratified at in the dark for 2 days and grown vertically in growth chambers at at constant light. In growth condition 2, seeds were sown in half-strength MS plates with sucrose in a long-day chamber at .
Complementation assay. After 4 days of growth on growth condition1, seedlings were transferred to half-strength MS plates with 100 mM
NaCl for 4 days and imaged. The primary root length was measured at transfer and after 4 days of growth and the increase in primary root growth was presented as delta primary root growth. For delta primary root growth recovery, the seedlings were transferred for 2 days to half-strength MS plates 8 days after salt stress and measured for root growth on day 10 .
Confocal imaging. For the experiment with salt treatment in Fig.4, 7 days after growth in growth condition 2, the seedlings were transferred to half-strength MS plates with 1% sucrose with 25 mM of NaCl or without NaCl , keeping the same growth conditions for another day. The short-term 25 mM and 100 mM NaCl treatments were done on 4-day-old roots grown in growth condition1 (without sucrose). Brefel A (BFA) and Wortmannin treatments were performed on 7-day-old seedlings grown on growth condition 1 and treatments performed in liquid half-strength MS. BFA treatments were with BFA and costained with M FM4-64 for approximately 1 h before imaging. For the BFA treatment on SOS1-GFP lines crossed with VAMP711-mCherry, the seedlings were not costained with FM4-64. Wortmannin treatments were with Wortmannin for approximately 1 h before imaging.
Cloning and plasmid construction
For plasmid construct 1, SOS1-GFP (Extended Data Fig. 5b), a 4.8 kb DNA fragment containing the promoter and the first 13 exons and 13 introns (from to ) of the SOS1 locus, was amplified by polymerase chain reaction (PCR) using Arabidopsis genomic DNA as template and primers SOS1proHindIII-fwd (CGGGAAGCTT ATACGTTTCGTAAGAAAC) and SOS1BamHI-rev (AAATTGGGTAGTGG ATC). The PCR product was digested and subcloned in pBI321 using HindIII and BamHI sites. Next, pGPTV-II-GFP plasmid containing the SOS1 cDNA was digested at the unique BamHI and SacI sites. A 2.9 kb BamHI/Sacl fragment containing the final part of the SOS1 cDNA fused to GFP was isolated and ligated in frame to the SOS1 genomic sequence of the pBI321 construct digested with the same restriction enzymes. For plasmid construct 2,SOS1-mCitrine (Extended Data Fig. 5c), a 8.357 kb DNA fragment containing the promoter and the full genomic sequence of SOS1 (from to ), was amplified by PCR using Arabidopsis genomic DNA as template and primers SOS1-fwd (ACAAAAAAGCAGGCT actaggatgatgtgtgttaatgtgagaggaagaagaa) and SOS1-rev (cccttgctca ccatTAGATCGTTCCTGAAAACGATTTTACTCGGAGA). For the mCitrine, a 7.47 kb DNA fragment was amplified by PCR from a pEN-R2-mCitrine-L3 plasmid (pEDO05) and primers mCitrine-fwd (TCAGGAACGATCTAatgg tgagcaagggcgag) and mCitrine-rev (AACATCTCAATTCTCActtgtacag ctcgtccatgc). For the terminator of SOS1, a 2.087 kb DNA fragment (from to ) was amplified by PCR using Arabidopsis genomic DNA as template and primers SOS1t-fwd (cgagctgtacaagTGAGAATTG AGATGTTTGTAACATAAGAAAACAAAATTGTTAGCT) and SOS1t-rev (CAAGAAAGCTGGGTTactagactgtgttatattggtaattagttggggct). Fragments were assembled by In-Fusion (Takara) into pENTR_L1L2 vector digested with Bcul (pRU335).
Confocal laser-scanning microscopy
Confocal images were acquired using a Leica Stellaris 5 WLL inverted confocal microscope with a objective with LASX (2022) software. For treatments, 7-day-old Arabidopsis seedlings were mounted with of the corresponding medium (the same as used for the treatment) and imaged. For propidium iodide (PI) staining, PI was dissolved in liquid Na-free medium ( ) and seedlings were immersed for 3 min , washed and imaged. GFP was excited with the 488 nm laser line of the MaiTai white laser and the emission was detected between 495 and 545 nm . PI and mCherry were excited with the 561 nm and emission was detected between 580 and 680 nm . One-shot images were taken with high-resolution , zoom , in 8 bit depth, with line averaging.
Spinning disc confocal microscopy
We used a CSU-W1 Yokogawa spinning disk head fitted to a Nikon Eclipse Ti-E-inverted microscope, equipped with a CFIPlanApo × 100 numerical aperture, 1.40 oil immersion objective and with two EMCCD Andor iXon Ultra, operating with 1,024 pixels and pixel size. GFP and RFP or mCherry were excited and detected simultaneously (excitation: GFP ; detection: GFP ; ). Time-lapse images were processed using the in-built plugins of Fiji, that is, background subtraction (rolling ball radius, pixels) and walking average projection ( frames averaging) for the images for representative purposes.
Fluorescence signal and vesicle colocalization quantification
For intensity measurement of pixels, the ROIs were defined conservatively for the structures of interest: plasma membrane and internal area of the cell. The raw integrated density values were extracted for the ROIs. For the plasma membrane, the raw integrated density values were multiplied by a correction factor of 0.75 to account for the overlapping plasma membrane between cells and unaccounted cell faces. For the vesicle colocalization, background subtraction was performed using the ‘subtract background’ tool with a rolling ball radius of 50 pixels. The region encompassing a SOS1-GFP vesicle served as the ROI for each colocalization measurement for VHAa-1, RABF2a and RABF2b. A fixed size ROI with signal from mCherry-VAMP711 was used as a reference to quantify colocalization with SOS1-GFP for the vacuolar membranes. Pearson’s values were determined using the Coloc2 plugin in FIJI.
Isolation of intact vacuoles
Protoplasts from leaves of 5-weeks-older Arabidopsis plants were isolated following the method described in ref.37. The solution containing protoplasts was mixed (1:1) with lysis buffer, 200 mM sorbitol, ficoll, 20 mM EDTA, 10 mM HEPES, pH 8.0 , to release the vacuoles .
Arabidopsis membrane isolation and purification
Total microsomes and tonoplast membranes used for western-blot analysis were isolated as described in ref.39. Leaves were homogenized in a commercial blender and centrifuged at for 20 min at . The supernatant was centrifuged at for 50 min at , to obtain the microsomal fraction. Vacuolar membranes were isolated by loading the microsomal suspension onto a discontinuous sucrose gradient ( ) that were centrifuged at for 3 h at .
Affinity purification of antibodies and western blotting
Anti-SOS1 antibodies were affinity purified according to ref. 40. A polypeptide comprising amino acids 998-1146 of Arabidopsis SOS1 was expressed and purified from E.coli as GST fusion. The protein was subjected to SDS-PAGE and transferred to nitrocellulose paper. After Ponceau S staining, the protein band corresponding to GST-SOS1 was cut out and incubated in TBS-T 5% non-fat milk for 1 h . The nitrocellulose strip was incubated overnight with anti-SOS1 serum diluted 1:1 in TBS. For elution of specifically bound antibodies, the nitrocellulose strip was incubated with and 1 mM EGTA for 2 min . The eluate was neutralized immediately with 1 M Tris base. For western blots, protein samples were separated on 10% polyacrylamide SDS-PAGE gel and then electroblotted onto an Amersham Protran nitrocellulose membrane (Cytiva). The membrane was blocked for 1 h with TBS-T 5% non-fat milk. Then, the membrane was incubated overnight at with the primary antibody (purified anti-SOS1 antibodies, 1:2,000 dilution; antiEpsilon subunit of tonoplast H ATPase antibody AS07213 from Agrisera, 1:10,000 dilution) in TBS-T 5% non-fat milk. Horseradish peroxidase-conjugated goat antimouse secondary antibody was used diluted 1:10,000 in TBS-T. The membrane was washed three times in TBS-T and incubated in ECL Select Western Blotting Detection Reagent
for 5 min . The images were obtained using a GE Amersham Imager AI680 system. Refer to Supplementary Fig. 1 for full blots.
SEM image analysis and figure preparation
The SEM images were processed with levels setting in Photoshop (v.25.11.0). All NanoSIMS images were analysed using the L’IMAGE software v.10-15-2021 developed by L. Nittler. All confocal images were analysed using the ImageJ v.1.54 f (http://imagej.nih.gov/ij/) and Fiji programs. Figures were prepared using Adobe Illustrator (v.28.7.1) and Fiji. The only manipulation of images were histogram adjustments. Figures were then assembled in the Adobe Illustrator and Photoshop programs.
Statistics and reproducibility
We compared the effect of treatment on the two genotypes and considered each organelle separately. We performed two-way analysis of variance (ANOVA) and a paired comparison with treatment and genotype as the two factors, and significant interactions were determined by post hoc Tukey test for vacuole:cytosol ratio and Na:K ratio. Box plots for ratios show the mean with standard deviation and standard error. For Fig. 1b,c, the images are representative illustrations of a cryo-planed root meristem and elemental distribution performed on three different roots. The data for Fig. 2d,e were obtained using the following. Na-free medium: WT cells; sos1 cells, from one experiment with three different roots. 25 mM NaCl treatment: WT cells; sos1 cells, from two experiments with six roots in total. Pairwise comparison of vacuole:cytoplasm ratio was carried out with treatment and genotype as factors; Na-free medium: WT cells; sos cells, from one experiment with three different roots. 25 mM NaCl treatment: WT cells; sos1 cells, from two experiments with six roots in total. Significance: *** analysed by two-way ANOVA with Tukey post hoc tests. The data for Fig. 3b,c were obtained using the following 100 mM NaCl treatment: WT cells; sos1, cells from two experiments with six roots in total. Box plots show the mean values (horizontal lines), (boxes) and 75% (thin vertical bars) quartiles; outliers are indicated with solid circles. Pairwise comparison of ratios was carried out with treatment and genotype as factors. Significance: analysed by two-way ANOVA with Tukey post hoc tests. For Fig. 3d, rice root meristems were treated with 100 mM NaCl , WT cells. Statistical analyses were performed using OriginPro v.2023b and GraphPad software (Prism10). Figure 4a is a representative picture of roots with three biological replicates.
Reporting summary
Further information on research design is available in the Nature Portfolio Reporting Summary linked to this article.
Data availability
All associated pre-processed and processed data for the CryoNanoSIMS and fluorescence images are available at Zenodo (https://doi. org/10.5281/zenodo.14054006) . Full versions of all gels and blots presented are provided in Supplementary Fig. 1. Source data are provided with this paper.
36. Dettmer, J., Hong-Hermesdorf, A., Stierhof, Y.-D. & Schumacher, K. Vacuolar -ATPase activity is required for endocytic and secretory trafficking in Arabidopsis. Plant Cell 18, 715-730 (2006).
37. Wu, F.-H. et al. Tape-Arabidopsis Sandwich – a simpler Arabidopsis protoplast isolation method. Plant Methods 5, 16 (2009).
38. Schneider, S. et al. Vacuoles release sucrose via tonoplast-localised SUC4-type transporters. Plant Biol. 14, 325-336 (2012).
39. Vera-Estrella, R., Barkla, B. J., García-Ramírez, L. & Pantoja, O. Salt stress in Thellungiella halophila activates transport mechanisms required for salinity tolerance. Plant Physiol. 139, 1507-1517 (2005).
40. Sambrook, J. Molecular Cloning: A Laboratory Manual, Vol. 3 (Cold Spring Harbor Laboratory, 1989).
41. Núñez-Ramírez, R. et al. Structural insights on the plant salt-overly-sensitive 1 (SOS1) antiporter. J. Mol. Biol. 424, 283-294 (2012).
42. Rasband, W. S. Image J v.1.54f (NIH, 2023).
43. Ramakrishna, P. et al. Data for “SOS1-dependent vacuolar sodium accumulation revealed by elemental cryo-imaging”. Zenodo https://doi.org/10.5281/zenodo.14054006 (2024).
44. Hallgren, J. et al. DeepTMHMM predicts alpha and beta transmembrane proteins using deep neural networks. Preprint at bioRxiv https://doi.org/10.1101/2022.04.08.487609 (2022).
Acknowledgements We thank F. Plane, A. Mucciolo and J. Daraspe for technical advice and assistance. We thank D. Salt for critical comments on the manuscript. We thank the Central Imaging Facility of the University of Lausanne and the Scientific Center for Optical and Electron Microscopy (ScopeM, ETH Zurich) for technical support. This work was supported by grant PID2022-140705OB-I00 (AEI-MCIN, Spain, co-financed by ERDF) to F.J.Q., and by in-house funding from ETH Zurich to C.S.-R., from the University of Lausanne to N.G. and from EPFL to A.M. The development of the CryoNanoSIMS was funded by EPFL, the University of Lausanne, grants from the Swiss National Science Foundation (206021_150762, 200021_179092 and 205321_212614) and a European Research Council Advanced Grant 246749 to A.M.
Author contributions P.R., N.G. and A.M. conceived, designed and coordinated the CryoNanoSIMS project. P.R., C.M.-O., D.D.B. and C.G. contributed to the cryo-sample preparation and analyses. P.R., S.E. and A.M. carried out CryoNanoSIMS analyses. N.G., P.R. and C.S.-R. designed and coordinated mutant analysis, stress treatments and protein localization work. F.M.G.-A. and E.B. contributed equally to the protein work and analyses. P.R., F.M.G.-A., E.B., A.D.L., J.M.P., F.J.Q., C.S.-R. and N.G. contributed to the protein localization work and interpretation of the results. P.R., N.G. and A.M. wrote the first draft of the manuscript. All authors contributed to the final version of the manuscript.
Competing interests The authors declare no competing interests.
Additional information
Supplementary information The online version contains supplementary material available at https://doi.org/10.1038/s41586-024-08403-y.
Correspondence and requests for materials should be addressed to Priya Ramakrishna, Niko Geldner or Anders Meibom.
Peer review information Nature thanks Nobuyuki Uozumi, Christa Testerink and the other, anonymous, reviewer(s) for their contribution to the peer review of this work. Peer reviewer reports are available.
Reprints and permissions information is available at http://www.nature.com/reprints.
Extended Data Fig.1|See next page for caption.
Extended Data Fig. 1 | Supporting documentation of experiments and the correlated cryoSEM and CryoNanoSIMS workflow. a. Comparison of 5-day old WT Arabidopsis seedlings grown on half-strength MS plates versus the hydroponic system with liquid half-strength MS, or Na-free media, demonstrating that growth rates were similar. For easy comparison, the seedlings from the hydroponics system were transferred to an agar surface and immediately imaged. b. Plot showing CryoNanoSIMS count rates of , and from a representative area on a vitrified WT root, similar to that indicated in (c). Note that the count rates are stable for (more than) 30 image cycles. For the data reported in this study, 6 image cycles were systematically acquired in each imaged area of the roots. This was enough to obtain sufficient counting statistics in all regions of interest.c. Representative block face cryoSEM image of a high-pressure frozen and vitrified Arabidopsis and rice (Oryza sativa) root tip processed with the cryogenic workflow (also refer to Fig.1). The dotted yellow boxes each frame an area of on the sample, the size of a typical CryoNanoSIMS image in this study. The larger white shaded rectangle indicates the general root-zone
systematically mapped with the CryoNanoSIMS in each the root tip to ensure comparison of the same cell types in similar stage of development, here the region in which the cells transition from division to elongation.d. Reduced root growth in response to salt stress in sos1 Arabidopsis compared to WT with increasing salt concentrations. Five-day old WT and sos1 seedlings were grown for 3 days (control) on half-strength MS agar plates and exposed to salt concentrations of 25 and 100 mM respectively for two days. e. Left: A representative cryoSEM image of Arabidopsis root meristem cells annotated with regions of interest (ROIs) representing vacuoles (yellow), cytosol (purple) and nucleus (with nucleolus) (brown). These SEM images served to assign ROIs on the CryoNanoSIMS images. Middle: Correlated CryoNanoSIMS ion map with similar ROI definitions from which average count-rates of the measured ions were obtained using the L’IMAGE software. Within individual cells, the vacuole areas were treated as one single ROI, and the cytosol areas as one single ROI, which were then used to derive the average vacuole:cytosol ratio for each cell, as indicated on the right. Scale bars, .
Extended Data Fig. 2 | See next page for caption.
Extended Data Fig. 2 | CryoNanoSIMS mapping of sub-cellular and Ca accumulation in the Arabidopsis root meristem grown on different media.
Correlated SEM images and elemental maps of and from roots of seedlings grown in the hydroponics set-up. To the right are extracted line profiles as indicated on the CryoNanoSIMS maps. The line profiles show count rate profiles for and spanning two cell walls, marked with ‘ W ‘. Note that Ca is strongly concentrated in the cell walls. a-b. WT (a) and (b) seedlings grown on Na-free medium. Note that, even in seedlings grown on the Na-free medium (control), the cellular Na concentrations permit clear detection by the CryoNanoSIMS, testifying to the high sensitivity of the instrument for these elements. Epidermis (Ep), vacuole (v) and cytoplasm (c) are labelled. c. WT seedlings grown on liquid half-strength MS for 5 days. Na is concentrated in cell walls in the root meristem cells. d. Under mild Na-stress ( 2.5 mM NaCl ) for 2 h , Na remains concentrated in the cell walls of root meristem cells in both WT and sos1. e. Vacuole:cytosol count rate ratios of and within individual meristem cells in wild-type and sos1 after treatment with 2.5 mM NaCl for 2 h . f. Average ratios measured in vacuoles and cytosol within meristem
cells in WT and sos1 seedlings grown on Na-free media and after treatment with 2.5 mM NaCl for 2 h.g. Average ratios measured in the cell walls of WT and sos1 seedlings after treatment with 2.5 mM NaCl for 2 h . Line-profiles are 5 pixels wide and representative of image and position highlighted. For Na-free medium: WT cells; sos1 cells, from one experiment with three different roots. For liquid half-strength MS, WT cells from two experiments with two different roots. For the 2.5 mM NaCl treatment: WT cells; sos1 cells, from one experiment with three different roots. For (g), WT ; sos1 . Box plots show the mean values (horizontal lines), 25% (boxes) and 75% (thin vertical bars) quartiles; outliers are indicated with solid circles. Pairwise comparison of ratio with treatment and genotype as factors. Significance: *** analysed by two-way ANOVA with Tukey post hoc tests. The sample were hydroponically grown on a Na-free medium and subject to respective treatments. Colour scales are linear and maximum ion count rates (counts per second) are indicated by the colour bars. Thin white arrows in cryoSEM images point towards the root tip. Scale bars, .
Extended Data Fig. 3 | See next page for caption.
Extended Data Fig. 3 | Supporting data for mapping of , and Ca in root meristems of Arabidopsis WT and sos1 mutants under moderate and high salt stress. a. Correlated SEM image and isotope maps of , and from roots of WT and sos1 seedlings grown on 25 mM NaCl for 4 hrs , with corresponding count rate profiles across two cell walls, including also (right). b. Ratios of average count rates of and in vacuole and cytosol of root meristematic epidermal cells of WT and sos1 seedlings grown on Na-free media, and after treatment with 25 mM NaCl for 4 h.c. wall-to-cytosol ratios in root meristem epidermal cells of WT and sos1 seedlings after treatment with 25 mM NaCl for 4 h.d. Correlated SEM image and isotope maps of , and from roots of WT and sos1 seedlings grown on 100 mM NaCl for 4 hrs , with corresponding count rate profiles across two cell walls, including also (right). e. Average count rates (counts per second) of (left) and (middle) in vacuoles and cytosol of WT and sos1 seedlings grown on Na-free media, and post treatment with 100 mM NaCl for 4 h . Right: Ratios of and count rates in vacuole and cytosol of root meristem epidermal cells of WT and sos1
seedlings grown on Na-free media, and after treatment with 100 mM NaCl for 4 h . Count rate profile plots show the average count rate for sodium, potassium and calcium for the line-profiles highlighted on the corresponding images. Line-profile data are 5 pixels wide. For the Na-free medium: WT cells; sos1 cells, from one experiment with three different roots. For 25 mM NaCl treatment (a-c): WT cells; sos1 cells, from two experiments with three different roots. For the 100 mM NaCl treatment (d,e): WT cells; sos1, cells from two experiments with three different roots. Box plots show the mean values (horizontal lines), (boxes) and (thin vertical bars) quartiles; outliers are indicated with solid circles. Pairwise comparison of vacuole:cytosol ratios with treatment and genotype as factors. Significance: analysed by two-way ANOVA with Tukey post hoc tests. Colour scales are linear and maximum ion count rates (counts per second) are indicated by the colour bars. Thin white arrows in cryoSEM images point towards the root tip. Scale bars, .
Extended Data Fig. 4|See next page for caption.
Extended Data Fig. 4 | Correlative cryoSEM-CryoNanoSIMS mapping of subcellular and Ca distribution in rice root meristem. a. Schematic of previously described SOS1 gene expression pattern in Arabidopsis and rice (Oryza sativa) with the zone of interest analysed by CryoNanoSIMS highlighted. b. WT and sos1 rice seedlings grown in a Na-free media (control), characterized by very low, but clearly measurable, background Na levels prior to salt stress experiments. Epidermis (Ep), vacuole (v) and cytoplasm (c) are labelled.c. Root meristem of WT and sos1 rice seedlings subject to salt stress by treatment with 100 mM NaCl for 4 h . Note, in rice where SOS1 is not expressed in the root meristem, Na accumulates in the vacuole of sos1 similar to WT. d. Average count rates for sodium ( ) in the vacuole and cytosol of the rice root meristem cells in WT and sos1 (left) after growth in Na-free medium (control) and after treatment with 100 mM NaCl for 4 h . Vacuole:cytosol count rate ratios of within individual meristem cells in WT and sos1 (right, orange). e. Corresponding
average count rates for potassium ( ) in the vacuole and cytosol of the meristem cells in WT and sos1 (left). Vacuole:cytosol count rate ratios of within individual meristem cells in WT and sos1 after growth (right, lilac). For Na-free medium (b,d,e): WT cells; sos1 cells, from one experiment with at least two different roots. For c-e 100 mM NaCl treatment (c-e): WT cells; sos1 cells, from two experiments with total five roots. Box plots show the mean values (horizontal lines), (boxes) and (thin vertical bars) quartiles; outliers are indicated with solid circles. Pairwise comparison of ratios with treatment and genotype as factors. Significance:*P<0.05;**P<0.01; analysed by two-way ANOVA with Tukey post hoc tests. Colour scales are linear and maximum ion count rates (counts per second) are indicated by the colour bars. Thin white arrows in cryoSEM images point towards the root tip. Scale bars, .
Extended Data Fig.5|See next page for caption.
Extended Data Fig. 5|Arabidopsis SOS1 protein structure and domains and complementation of SOS1 protein. a. Table of the topology prediction for SOS1 protein. The residues presented take into account the amino acid sequence from UniProt database (Q9LKW9, AT2G01980) and prediction is based on DeepTMHMM . Colours correspond to structure presented in (b) and (c). b. Schematic of the genomic construct 1 (SOS1-GFP) used for all the analyses. SOS1 promoter region (pSOS1) corresponded to 1929 bp upstream from the START codon. Only the first 13 introns were used and the GFP was fused without a linker. Nopaline synthase (NosT) from Agrobacterium tumefaciens was used as terminator. Colours indicate the predicted protein topology of the corresponding nucleotides. Box size of the exons are scaled to each other according to their number of nucleotides. Box size of promoter and introns are not scaled. The length (in nucleotides) of the promoters, fluorescent proteins and terminators are indicated on the figure. c. Schematic of genomic construct 2 (SOS1-mCitrine) used for comparative analyses with construct1.SOS1 promoter region (pSOS1) corresponded to 2250 bp upstream from the START codon. A full genomic DNA sequence of SOS1 was used that included all introns with the mCitrine fused in without a linker. The endogenous terminator (SOS1T) was used that corresponded to 2051 bp downstream from the STOP codon. d. Representative images of 8 day old Arabidopsis seedlings grown on half-strength MS agar medium for 4 days before transfer to half-strength MS agar without (control) or with 100 mM NaCl for 4 additional days. WT, sos1, sos1 complemented with SOS1-GFP, sos1 complemented with SOS1-mCitrine are
shown. Presented also, the close-up of shoot biomass of the corresponding lines at 8 days old. e. Delta primary root growth of the indicated Arabidopsis lines after 4 days of growth on half-strength MS (control) or half-strength MS supplemented with 100 mM NaCl . f. Delta primary root growth recovery of indicated Arabidopsis lines 2 days after transfer to half-strength MS plates (mock) once they grew for 4 days on half-strength MS (mock) plus 4 days on half-strength MS supplemented with 100 mM NaCl (yellow).g. Primary root length of the indicated Arabidopsis lines on control at (day 4) and after 4 days of growth (day 8) (left panel); on 100 mM NaCl right after transfer (day 4) and after 4 days of growth (day 8) (right panel, yellow). h. Fresh shoot weight of 8 day-old seedlings treated as indicated in (g). Seedlings were grown on growth condition 1 for all these tests and with respective treatments. Box-plots in e-g show primary root length measurements on control and post-transfer to 100 mM NaCl treatment for 5 days. For (e) control: WT , sos1 , SOS1GFP/sos1 , SOS1-mCitrine/sos1 ; For treatment with 100 mM NaCl : WT , sos1 , SOS1-GFP/sos1 , SOS1-mCitrine/sos1 . For control and 100 mM NaCl : WT , sos1 , SOS1-GFP/sos1 , SOS1 from three independent experiments. Box plots show the mean values (horizontal lines), 25% (boxes) and 75% (thin vertical bars) quartiles. A two-way ANOVA multiple-comparison with Tukey correction was performed for all except (c) where an unpaired t-test has been applied. Different letters represents difference for which . Scale bars, 1 cm .
Article
Extended Data Fig. 6 | See next page for caption.
Extended Data Fig. 6| Subcellular localization of SOS1 protein and
association with endomembrane trafficking markers in Arabidopsis.
a. Representative picture of subcellular localization of SOS1-mCitrine in root meristems of 7 days old seedlings. Late endosome – prevacuoles and tonoplast highlighted by an arrow, and observed upon Brefeldin and Wortmannin for about 1 h treatment. Seedlings were grown on growth condition 1 . All seedlings were treated with the fluorescent lipophilic dye FM4-64 , for about 1 h before imaging. b. SOS1 colocalization analysis. Association of SOS1-GFP proteins with the early-endosome/trans-Golgi-network marker VHA-a1, and the late-endosome/pre-vacuolar compartments markers RABF2A (RHA1) or RABF2B (ARA7) as shown by Pearson’s correlation coefficient. c. SOS1-GFP colocalization with vacuolar and endomembrane compartments in mCherry-VAMP711.d. Stills from time series of spinning disc video shows the dynamic behaviour of SOS1-GFP (green), and the endomembrane marker
RABF2A (magenta), associated vesicles (white arrows) under control conditions; Also refer to Supplementary Video S2. Seedlings grown on growth condition 2. e. Representative images of SOS1-GFP seedlings treated with 25 and 100 mM NaCl for 4 hrs . Seedlings were grown on growth condition 1 . For control+FM6-64 treatment (a, row one) roots; BFA + FM4-64 treatments (a, row two) roots; Wortmannin + FM4-64 treatments , row 3. All from three independent experiments. For (b), vesicles from 26 cells from six plants and three independent experiments; for (c) fixed ROIs from cells from three plants. Different letters indicate statistically significant differences, , based on one-way ANOVA and Tukeys multiple comparison test. For (e), roots; . Box plots: centerlines show the medians; box limits indicate the 25th and 75th percentiles; whiskers extend to the minimum and maximum. Scale bars, (a, e (overview)), (a, e (inset)), (d).
Extended Data Fig.7|See next page for caption.
Extended Data Fig. 7| SOS1-GFP colocalized with RABF2A and RABF2B in swollen Wortmannin-induced prevacuolar structures in Arabidopsis. a-b. Partial association of SOS1-GFP was observed with late endosomal/prevacuolar markers mCherry-RABF2B (ARA7) (a) and mCherry-RABF2A (RHA1) (b), under untreated (control) conditions and was distinct upon Wortmannin (Wm) treatment. Arrows show representative points. c. Strong colocalization of SOS1-GFP with mCherry-VAMP711 was induced by Wm treatment, confirming
that a significant part of SOS1-GFP positive endomembrane compartments were vacuolar and prevacuolar compartments. Observable under both untreated (control) and Wm treatment conditions. Seedlings were grown on growth condition 1 . For (a) control roots, Wm treatements roots; For (b) control roots, Wm treatments, roots; For (c) control roots, Wm treatments roots. Seedlings were treated with for about 1 h . Scale bars, (overview), (inset).
Extended Data Fig. 8|See next page for caption.
Extended Data Fig. 8 | Weak accumulation of SOS1-GFP in BFA bodies and detection of SOS1-GFP in vacuolar compartment of Arabidopsis leaf tissue. a. Localization of SOS1-GFP in root epidermal cells in sos1 complemented lines. Uptake of FM4-64 (magenta) after about 1 h , broadly highlighting early-to-late endosomal compartments. Close-up view of an epidermal cell and overlay (area marked with dotted box). Note: The quantification to show the lack of co-localization between FM4-64 and SOS1-GFP inside the cell. b. Brefeldin A (BFA) treatment led to partial accumulation of SOS1 in BFA compartments, with little effect on overall SOS1 localization at other endomembrane compartments or plasma membrane. FM4-64 positive compartments displayed strong aggregation into the BFA compartment. Seedlings were treated with BFA and co-stained with FM4-64 for about 1 h . On the right, quantification for the BFA bodies with SOS1-GFP. c-d. BFA treatment led to weak accumulation of SOS1 with RABF2B (ARA7) (c), and RABF2A (RHA1) (d) in the BFA compartments. e. Western blot of vacuolar and microsomal fractions of leaf tissue of WT and sos1 analyzed using a affinity purified anti-SOS1 polyclonal antibody with SOS1
(red arrow), detected in the vacuolar fraction. The vacuole marker v-ATPase was detected using commercial antibodies. Blots are representative of two biological replicates. Refer to Supplementary Fig. 1 for original blots. f. SOS1-GFP localization to the tonoplast observed in intact vacuoles extracted from leaf tissue. Vacuoles from non-transformed WT plants are shown as negative control. Images of transmitted light (left), GFP fluorescence (centre) and merge of both (right). Images are representative of three biological replicates. Box plot represents Pearson’s correlation coefficient. For (a) control roots; quantification vesicles from root meristem cells from 4 plants; for BFA treated roots; quantification, cells from 4 plants. Box plots show centrelines medians; box limits indicate the 25th and 75th percentiles; whiskers extend to the minimum and maximum. For (c) BFA treated roots; (d) BFA treated . Images are representative confocal images of 7 day old seedlings grown on MS plates in growth condition 1 . Scale bars, ((a-d)(overview), f), (a-d)(inset)).
natureportfolio
Priya Ramakrishna, Niko Geldner, Anders
Corresponding author(s):
Meibom
Last updated by author(s): Sep 8, 2024
Reporting Summary
Nature Portfolio wishes to improve the reproducibility of the work that we publish. This form provides structure for consistency and transparency in reporting. For further information on Nature Portfolio policies, see our Editorial Policies and the Editorial Policy Checklist.
Statistics
For all statistical analyses, confirm that the following items are present in the figure legend, table legend, main text, or Methods section.
□
□
□
□
□
□
□
The exact sample size for each experimental group/condition, given as a discrete number and unit of measurement
A statement on whether measurements were taken from distinct samples or whether the same sample was measured repeatedly
X
The statistical test(s) used AND whether they are one- or two-sided
Only common tests should be described solely by name; describe more complex techniques in the Methods section.
Confirmed
A description of all covariates tested
□ A description of any assumptions or corrections, such as tests of normality and adjustment for multiple comparisons
For null hypothesis testing, the test statistic (e.g. ) with confidence intervals, effect sizes, degrees of freedom and value noted Give values as exact values whenever suitable.
□ For Bayesian analysis, information on the choice of priors and Markov chain Monte Carlo settings
□ For hierarchical and complex designs, identification of the appropriate level for tests and full reporting of outcomes
Estimates of effect sizes (e.g. Cohen’s , Pearson’s ), indicating how they were calculated
Software and code
Policy information about availability of computer code
Data collection
Data analysis
CryoNanoSIMS instrument at the Laboratory for Biological Geochemistry at EPFL, Switzerland were used to acquire CryoNanoSIMS images. Confocal images were taken using Leica Stellaris 5 WLL inverted confocal microscope and the LAS X (2022) software. Spinning disc movies were generated using CSU-W1 Yokogawa spinning disk head fitted to a Nikon Eclipse Ti-E-inverted microscope.
For manuscripts utilizing custom algorithms or software that are central to the research but not yet described in published literature, software must be made available to editors and reviewers. We strongly encourage code deposition in a community repository (e.g. GitHub). See the Nature Portfolio guidelines for submitting code & software for further information.
nature portfolio | reporting summary –
Data
Policy information about availability of data
All manuscripts must include a data availability statement. This statement should provide the following information, where applicable:
Accession codes, unique identifiers, or web links for publicly available datasets
A description of any restrictions on data availability
For clinical datasets or third party data, please ensure that the statement adheres to our policy
All associated pre-processed and processed data for the CryoNanoSIMS and fluorescence images are available in the latest version of https://doi.org/10.5281/ zenodo.14054006. Full versions of all gels and blots presented are provided in Supplementary Figure 1. Source data are provided with this paper for all the main and extended data figures that contain analyses.
Research involving human participants, their data, or biological material
Policy information about studies with human participants or human data. See also policy information about sex, gender (identity/presentation), and sexual orientation and race, ethnicity and racism.
Reporting on sex and gender
NA
Reporting on race, ethnicity, or other socially relevant groupings
NA
Population characteristics
NA
Recruitment
NA
Ethics oversight
NA
Note that full information on the approval of the study protocol must also be provided in the manuscript.
Field-specific reporting
Please select the one below that is the best fit for your research. If you are not sure, read the appropriate sections before making your selection.
Life sciences
Behavioural & social sciences □ Ecological, evolutionary & environmental sciences
For a reference copy of the document with all sections, see nature.com/documents/nr-reporting-summary-flat.pdf
Life sciences study design
All studies must disclose on these points even when the disclosure is negative.
Sample size
Sample size was determined based on the type of analysis. The CryoNanoSIMS experiments being low-throughput, a minimum of roots per condition per time point were chosen as minimum replicate numbers. A control and treatment sample for each of the conditions tested were tested in parallel in the same run. Growth and root phenotyping experiments had larger sample sizes per biological replicate as stated in their respective figure legends. Protein localization experiments were performed on minimum seedlings for each treatment and compared against internal controls (mock).
Data exclusions
Data were not excluded from analysis.
Replication
All replication experiments for CryoNanoSIMS were processed following the cryo-workflow described in the methods. The quantifications were performed pooling different runs and stringent parameters for selection of regions of interest have been described in detail in the methods section. For the different treatments, all conditions were replicated and compared against a control (mock) for protein localization patterns. All experiments were replicated and all attempts at replication were successful.
Randomization
Seedlings used for imaging were selected randomly, however all roots were analyzed equally with no sub-sampling and therefore, there was no requirement for randomization.
Blinding
Blinding was not possible as experimental conditions needed rigorous tracking throughout the CryoNanoSIMS workflow. Quantifications were performed applying the same approach equally to all conditions and replicates.
Reporting for specific materials, systems and methods
We require information from authors about some types of materials, experimental systems and methods used in many studies. Here, indicate whether each material, system or method listed is relevant to your study. If you are not sure if a list item applies to your research, read the appropriate section before selecting a response.
Materials & experimental systems
Methods
n/a
Involved in the study
n/a
Involved in the study
□
□
□
–
□
□
–
□
□
□
□
□
Antibodies
Antibodies used
Antibodies were prepared against the peptide “RSFRKEHRGMSWPE” of the C-terminal region of SOS1.
Primary antibody (purified antiSOS1 antibodies, 1:2,000 dilution; antiEpsilon subunit of tonoplast H+ATPase antibody AS07 213 from Agrisera, 1:10,000 dilution).
Secondary antibody: Horseradish peroxidase (HRP)-conjugated goat anti-mouse secondary antibody was used diluted 1:10,000 in TBS-T.
Validation
The SOS1 antibodies were validated by antiserum detection by Western blot using purified SOS1 isolated from yeast.
Plants
Seed stocks
Seeds of mutants and organelle markers were sourced from NASC – The European Arabidopsis Stock Centre.
Novel plant genotypes
Two independent constructs were generated for confirmation of protein localization. Complementation of function was performed by Agrobacterium mediated transformation of wild-type and mutant plants with the genomic constructs and analyses of independent lines.
Authentication
The mutant allele and marker lines for sub-cellular structures have been previously well characterized. Seeds for transgenic lines were verified by selection marker (seed coat fluorescence or antibiotics) and confirmed to be homozygous before analyses.
Laboratory for Biological Geochemistry, School of Architecture, Civil and Environmental Engineering, Ecole Polytechnique Fédérale de Lausanne (EPFL), Lausanne, Switzerland. Department of Plant Molecular Biology, Biophore, UNIL-Sorge, University of Lausanne, Lausanne, Switzerland. Department of Biology, ETH Zürich, Zürich, Switzerland. Institute of Plant Biochemistry and Photosynthesis, Consejo Superior de Investigaciones Cientificas and Universidad de Sevilla, Seville, Spain. Center for Advanced Surface Analysis, Institute of Earth Sciences, University of Lausanne, Lausanne, Switzerland. Electron Microscopy Facility, University of Lausanne, Lausanne, Switzerland. Life Sciences, Ecole Polytechnique Fédérale de Lausanne, Lausanne, Switzerland. Centro de Biotecnología y Genómica de Plantas, Universidad Politécnica de Madrid (UPM) – Instituto Nacional de Investigación y Tecnología Agraria y Alimentaria (INIA/CSIC), Pozuelo de Alarcón, Spain. These authors contributed equally: Francisco M. Gámez-Arjona, Etienne Bellani. e-mail: priya.ramakrishna@epfl.ch; niko.geldner@unil.ch; anders.meibom@epfl.ch
Meibom, A. et al. Correlated cryo-SEM and CryoNanoSIMS imaging of biological tissue. BMC Biol. 21, 126 (2023).
Dubyak, G. R. Ion homeostasis, channels, and transporters: an update on cellular mechanisms. Adv. Physiol. Educ. 28, 143-154 (2004).
Nelson, N. Metal ion transporters and homeostasis. EMBO J. 18, 4361-4371 (1999).
White, P. J. in Marschner’s Mineral Nutrition of Higher Plants (Third edition) (ed. Marschner, P.) 7-47 (Academic, 2012).
Römheld, V. in Marschner’s Mineral Nutrition of Higher Plants (Third edition) (ed. Marschner, P.) 299-312 (Academic, 2012).
Vargas, R. et al. (eds) Handbook for Saline Soil Management (Food and Agriculture Organization of the United Nations, Lomonosov Moscow State Univ., 2018).
Kim, S. A. et al. Localization of iron in Arabidopsis seed requires the vacuolar membrane transporter VIT1. Science 314, 1295-1298 (2006).
Persson, D. P. et al. Multi-element bioimaging of Arabidopsis thaliana roots. Plant Physiol. 172, 835-847 (2016).
Moore, K. L. et al. Combined NanoSIMS and synchrotron X-ray fluorescence reveal distinct cellular and subcellular distribution patterns of trace elements in rice tissues. New Phytol. 201, 104-115 (2014).
Rowan, A., McCully, M. E. & Canny, M. J. The origin of the exudate from cut maize roots. Plant Physiol. Biochem. 38, 957-967 (2000).
Chia, J.-C. et al. Loss of OPT3 function decreases phloem copper levels and impairs crosstalk between copper and iron homeostasis and shoot-to-root signaling in Arabidopsis thaliana. Plant Cell 35, 2157-2185 (2023).