تعديل ثلاثي متآزر مستحث بالعيوب في النحاس لإنتاج الأمونيا الكهروكيميائية المتفوقة عبر تركيزات نترات واسعة Defect-induced triple synergistic modulation in copper for superior electrochemical ammonia production across broad nitrate concentrations
يمكن تحلل النترات كهربائيًا لإنتاج الأمونيا أثناء معالجة مياه الصرف الصحي، بينما لا يزال التحدي الكبير هو تحقيق كفاءة فاراداي عالية ومعدل إنتاج مرتفع عبر نطاق واسع من التركيزات في مياه الصرف الصحي الحقيقية. هنا، نبلغ عن قطب كهربائي من مصفوفة أسلاك النحاس الغنية بالعيوب التي تم إنشاؤها من خلال الاختزال الكهربائي في الموقع، والتي تظهر أداءً متفوقًا في تفاعل اختزال النترات الكهربائي بفضل التعديل الثلاثي التآزري. ومن الجدير بالذكر أن قطب مصفوفة أسلاك النحاس الغنية بالعيوب يوفر كثافة تيار تتراوح من 50 إلىعبر تركيزات نترات واسعة ) بكفاءة فارادائية تزيد عن أظهرت تقنيات التحليل الطيفي بالأشعة تحت الحمراء باستخدام إشعاع السنكروترون والعمليات النظرية أن المواقع المعيبة للنحاس يمكن أن تعزز في الوقت نفسه امتصاص النترات، وتعزز تفكك الماء، وتثبط تطور الهيدروجين. نظام ذو قطبين يدمج تفاعل اختزال النترات في مياه الصرف الصناعي مع تفاعل أكسدة الجليسرول يحقق كثافة تيار قدرهاعند -1.4 فولت معانتقائية الأمونيا وتحويل النترات مع استقرار لمدة 100 ساعة، مما يدل على قابلية عملية استثنائية.
يتواجد النترات على نطاق واسع في مياه الصرف الصناعي والمياه الجوفية بسبب الاستخدام المفرط للأسمدة الكيميائية والتلوث الصناعي.يمكن أن تؤدي النترات الزائدة إلى تعطيل التوازن العالمي للنيتروجين، وقد يتسبب تحويلها غير الكامل إلى نتريت في الجسم في الإصابة بالسرطان لدى البشر.يعتبر الاختزال الكهروكيميائي للنترات إلى نيتروجين غير سام طريقًا صديقًا للبيئة مع ظروف تفاعل معتدلة.. ومع ذلك، فإن هذه الطريقة تتطلب طاقة كبيرة وتفتقر إلى الفوائد ذات القيمة المضافةالأمونيا، كيميائي متعدد الوظائف، يُستخدم في صناعة الأسمدة والأدوية، وهو ناقل حيوي للطاقة النظيفة.الاختزال الكهربائي للنتراتيمكن استخدامه للإنتاج الموزع لـ الأمونيا الخضراء تحت ظروف معتدلة ومدفوعة بالطاقة النظيفة المولدة محليًا، والتي حظيت باهتمام واسع..
تتراوح تركيزات النترات في مجاري النفايات من 1 إلى. ومع ذلك، ركزت معظم الدراسات على الأداء تحت تركيزات نترات عالية وظروف نظرية، مما جعلها تكافح لتحقيق أداء مرضٍ في السيناريوهات ذات تركيزات نترات متغيرة، لا سيما تحت التركيزات المنخفضة حيث يكون هناك تفاعل هيدروجين قوي.. لقد اعترفت المجتمع العلمي بشكل متزايد بأهمية تقليل النترات ذات التركيز المنخفض. على سبيل المثال، قدم كانغ وزملاؤه مساهمة كبيرة من خلال تطوير رغوة LDH/Cu لتقليل النترات ذات التركيز المنخفض
تحقيق إنجاز يستحق الثناء FE مع في. ومع ذلك، شهد الأداء انخفاضًا عند 1 مللي مول و 2 مللي مول، مسجلاً و في و ، على التوالي، مما يشير إلى فرصة لمزيد من التحسين. بالإضافة إلى ذلك، حقق جونكيريا وزملاؤه تحسينًا ملحوظًا في الكفاءة الكهربائية عبر نطاق تركيز واسع من 1 إلى 100 مللي مول باستخدام محفز CuCoSP المُصنّع، وهو تقدم ملحوظ في هذا المجال.. ومع ذلك، فإن الكثافة الحالية، التي تتراوح من 8 إلىيمكن أن يكون عاملاً محددًا لتطبيقه العملي. في الوقت نفسه، فإن البحث في تقليل النترات لإنتاج الأمونيا في مياه الصرف الصحي الحقيقية نادر وصعب.من الواضح أنه عند تركيزات النترات المنخفضة، فإن تطور الهيدروجين النشيط يقيّد الكفاءة العالية والعائد.في تركيزات النترات النموذجية، فإن الإمداد غير الكافي من النشطقد يحد من تحقيق التيار على مستوى الصناعة. لذلك، نهدف إلى معالجة قضايا تطور الهيدروجين القوي عند التركيزات المنخفضة وندرة المواد الفعالة في الوقت نفسه.توفير عند تركيزات نترات نموذجية، مما يمكّن من تقليل كفاءة لمجاري النفايات الحقيقية التي تحتوي على مجموعة واسعة من تركيزات النترات.
هنا، نقدم مصفوفة أقطاب نانوية من النحاس الغني بالعيوب (V-Cu NAE) تم تصنيعها من خلال الاختزال الكهروكيميائي في الموقع لـنانوأسلاك، محققة كثافات تيار تتراوح من 50 إلى عبر تركيزات النترات التي تتراوح من 1 إلى 100 مللي مول والحفاظ على FE لتقليل مستويات النترات بما يتماشى مع معايير منظمة الصحة العالمية (WHO) لمياه الشرب. تكشف أشعة السنكروترون-FTIR أثناء التشغيل وحسابات نظرية الكثافة الوظيفية (DFT) أن تعديل ثلاثي متآزر، بما في ذلك تعزيز امتصاص النترات، وتعزيز تفكك الماء، وكبح تطور الهيدروجين، يساهم في الأداء الاستثنائي عبر نطاق واسع من تركيزات النترات. علاوة على ذلك، نظام ذو قطبين يدمج تفاعل تقليل النترات (تفاعل أكسدة الجلسرين (GOR) في مياه الصرف الصناعي الحقيقية ذات التركيز المنخفض يظهرعند -1.4 فولت، مع انتقائية استثنائية للأمونيا تصل إلىتحويل نترات متفوقوثبات ممتاز لمدة 100 ساعة، مع تحقيق جمع منتج عالي النقاء بنجاح في شكل كل من و .
النتائج
أسلاك نانوية من هيدروكسيد النحاستم تحضيرها عن طريق أكسدة رغوة النحاس، والتي تم بعد ذلك تلبيدها تحت غاز الأمونيا أو الهيدروجين للحصول على أسلاك نانوية من نيتريد النحاس.ألياف النحاس النانوية بدون عيوب (Cu NWs). تم الحصول على مصفوفة أقطاب ألياف النحاس النانوية المعيبة (V-Cu NAE) من خلال الاختزال الكهروكيميائي في الموقع لـNW في محلول كبريتات البوتاسيوم (الشكل 1أ). أكدت تحليل حيود الأشعة السينية (XRD) (الشكل 1ب) نجاح تخليقNW و تحويلها الكامل إلى مرحلة النحاس النقي بعد الاختزال الكهروكيميائي في الموقعتم استخدام مجهر المسح الإلكتروني الميداني (FESEM) ومجهر الإلكترون الناقل عالي الدقة (HRTEM) لوصف الانتقال الشكلي منإلى NWs، وأخيرًا إلى V-Cu NAE (الشكل 1c، d). شكل كانت NWs (الشكل التوضيحي الإضافي 1) تعكس ذلك لـ NWs (الشكل التوضيحي 2). من الجدير بالذكر أنه عند الاختزال الكهروكيميائي، أظهر V-Cu NAE انحناءً وتكونت حفر سوداء غنية بالعيوب، مما ميزه بوضوح عنNW (الشكل 1e). يظهر الشكل 1c مجموعة من أسلاك النحاس النانوية المعيبة، حيث تكشف تقنية HRTEM (الشكل 1d) عن حفر داكنة على أسطحها، مما يدل على تجمعات من فراغات النحاس.لتحقيق فهم أكثر شمولاً لطبيعة وتوزيع هذه العيوب، استخدمنا تقنيات TEM المصححة بواسطة Cs. في تحليلنا المعروض في الشكل 1e، نحدد فراغات النحاس باستخدام دوائر مميزة، مما يسلط الضوء على وجودها الواسع في العينة.. بناءً على هذه التصور، قمنا بإجراء تحليل لخطوط كثافة الذرات الواقعة بين الأسهم في المناطق i و ii و iii، كما هو موضح في الشكل 1f. تؤكد ملاحظاتنا أن الكثافة في مناطق فراغات النحاس ومناطق التكتل أقل بشكل ملحوظ من في المناطق المحيطة بالشبكة السليمة، مما يعزز التأكيد على وجود كبير لفراغات النحاس.
أشارت تقنية التحليل الطيفي بالأشعة السينية المشتتة للطاقة (EDS) (الشكل 1g) إلى أن يتم القضاء عليه تمامًا بعد الاختزال الكهروكيميائي، مما يؤدي إلى تحويل فشلت أشعة السنكروترون لامتصاص الأشعة السينية بالقرب من حافة الهيكل (XANES) (الشكل 1h) وطيف الإلكترون الضوئي للأشعة السينية (XPS) (الأشكال التكميلية 3، 4) في الكشف عن أي إشارة ملحوظة للنيتروجين في V-Cu NAE.في XANES لـ V-Cu NAE (الشكل 1i)، تم نسب القمم عند 931.0 و 950.9 eV إلى و من مرحلة النحاس المعدنيتحليل رامان في الموقع يوضح بوضوح (الشكل 1j والشكل التكميلي 5) التناقص المتسلسل والاختفاء النهائي لـذروة رامان، مما يدل على تشكيل المعدني. بناءً على هذه التحليلات، أظهرت نتائج XPS لـ V-Cu NAE أن و تم نقل القمم بمقدار 0.13 إلكترون فولت و0.17 إلكترون فولت، على التوالي، عند مقارنتها بتلك الخاصة بأسلاك النحاس النانوية (الشكل التكميلي 6). قد تُعزى هذه التحولات في القمم إلى التفاعل بين الفراغات المعدنية والإلكترونات.
التم تقييم أداء العينة أولاً باستخدامالإلكتروليت في خلية من نوع H ذات ثلاثة أقطاب (انظر الشكل التوضيحي 7 للترتيب)، حيث يكون للقطب العامل مساحةتحميل المحفزات كانتم الكشف عن الأمونيا والنيتريت والنترات المتبقية الناتجة بواسطة طيف الامتصاص فوق البنفسجي والمرئي (UV/Vis) (الشكل التوضيحي 8).كما هو موضح في الشكل 2أ، زادت كثافة التيار لـ V-Cu NAE بشكل ملحوظ مع إضافةفي الإلكتروليت، ومن الواضح أن V-Cu NAE أظهر أفضل أداء مقارنةً برغوة النحاس، وأسلاك النحاس النانوية ومصفوفات الأسلاك النانوية. أظهرت الكفاءة الكهربية (FE) والانتقائية لإنتاج الأمونيا للجهد المحتمل الذي يتراوح من -0.1 إلى -0.5 فولت (بالنسبة إلى RHE) (الشكل 2b) اتجاهًا بركانيًا، حيث وصلت إلى أفضل أداء عند -0.3 فولت (بالنسبة إلى RHE) مع كفاءة كهربية قدرهاانتقائيةومعدل تحويل يصل إلىبعد ساعة من التحفيز، والذي هو أفضل مقارنةً بـ NWs (FE الانتقائيةتحويل ) وألياف النحاس النانوية (FE الانتقائيةتحويل ). ضمن النطاق المحتمل من -0.1 إلى -0.5 فولت (مقابل RHE)، كلا أظهرت أسلاك النحاس النانوية (NWs) وأسلاك النحاس النانوية (Cu NWs) أيضًا انخفاضًا في الكفاءة الانتقائية (FE) والانتقائية مقارنةً بـ V-Cu NAE (الشكل التكميلي 9).تم حساب معدل إنتاج V-Cu NAE ليكونعند -0.3 فولت خلال ساعة واحدة من التحليل الكهربائي، وهو ما هو أعلى بكثير من عينات المقارنة (الشكل 2d). علاوة على ذلك، يمكن إثبات استقرار المحفز بشكل جيد من خلال قياس الدورات المتكررة عند -0.3 فولت لكل دورة مدتها ساعة واحدة، حيث لا يمكن ملاحظة أي تدهور مرئي في الكفاءة، الانتقائية ومعدل إنتاج الأمونيا خلال ثماني دورات (الشكل 2e).
لتقييم الجدوى، تم إجراء اختبار قدرة المحفز على إزالة النترات عند -0.3 فولت على مياه الصرف الصحي المحاكية التي تحتوي على-ن. كما هو موضح في الشكل 2f، تركيزات كل من و يمكن أن تنخفض إلى 2.1 جزء في المليون و 0.52 جزء في المليون بعد 90 دقيقة، وهو ما هو أقل بكثير من معايير منظمة الصحة العالمية لمياه الشرب. جزء في المليون ). من المهم أن يبقى المؤشر فوق ويمكن أن تصل نسبة تحويل النتراتمع انتقائية عالية لـلإنتاج الأمونيا، والذي يظهر القدرة الممتازة على معالجة مياه الصرف الصحي المحتوية على النترات. نظرًا لحقيقة أنقد تتفاوت المستويات في تيارات النفايات تحت سيناريوهات مختلفة من 1 إلى 1000 مللي مول، ومن الضروري أن يظهر المحفز أداءً ممتازًا عبر نطاق واسع منتركيزات. من بين مجاري النفايات المختلفة، مياه الصرف الصحي من النسيج ومياه الصرف الصناعي، مع تتراوح التركيزات من 10 إلى 50 مللي مول، وتقدم مجموعة واسعة من المصادر وقيمة استخدام عالية.. ومع ذلك، فإن انخفاض قد تؤدي التركيزات إلى كثافة تيار منخفضة وتنافس قوي في تفاعل الهيدروجين. وبالتالي، قمنا أولاً بمحاكاة تدهور مياه الصرف الصحي معتركيزات تتراوح بين 10 إلى 50 مللي مول. كما هو موضح في الشكل 2g، يمكن لجهاز V-Cu NAE توفير كثافة تيار تتراوح بينفينطاقات التركيز من 10 إلى 50 مللي مولار عند -0.3 فولت، مع الحفاظ على أكثر منحيث تم تقليل النترات إلى
الشكل 1 | عملية التكوين التخطيطية، والخصائص الشكلية والهيكلية لـ V-Cu NAE. أ رسم تخطيطي لعملية التكوين. ب أنماط XRD، (ج) SEM، (د) HRTEM، (هـ) صورة HAADF-STEM مزدوجة مصححة للانحراف الكروي لـ V-Cu NAE، مع المناطق المحددة بدائرة تشير إلى فراغات النحاس.ملف الكثافة لذرات النحاس بين السهمين في المناطق i و ii و iii من (هـ).تخطيط EDS لـالأشعة السينية الناعمة من الإشعاع السنكروتروني لـ NWs و V-Cu NAE. NWs و V-Cu NAE: (h) طيف حافة N K و (i) طيف حافة Cu L. j طيف رامان في الموقع لعملية الاختزال الكهروكيميائي لـإلىوخريطة الشكل الخاصة بها التي تتوافق معنطاق. مقياس الألوان مع سهم يشير إلى التغير في شدة الإشارة من المنخفض إلى المرتفع. نطاق تركيز مياه الشرب. علاوة على ذلك، حتى عند تركيزات النترات المنخفضة جداً (المياه الجوفية الملوثة) عند -0.2 فولت، أظهر V-Cu NAE تحويل نترات عالي وكفاءة عالية. في الوقت نفسه، تحت تركيزات نترات عالية (0.1 إلى 1 م من النفايات النووية السائلة) عند -0.4 فولت، عرض V-Cu NAE كثافة تيار عالية من وأكثر من حيث تم تقليل النترات إلى نطاق تركيز مستوى مياه الشربالتحويل). يمكن أن يُعزى التيار بمستوى الأمبير إلى العيوب التي تعززالانفصال إلى نموذج نشط، وهو أمر أساسي للهدرجة لإنتاج الأمونيا. في الختام، أزال المحفز النترات بفعالية من مصادر نترات متنوعة مع FE يتجاوز 90% عند كثافة تيار عالية، مما يدل على إمكانات كبيرة للتطبيق العملي. بالمقارنة، كانت Cu NWs دون المستوى الأمثل (الشكل التكميلي 10). على مدى تركيزات واسعة، كانت جميع المقاييس – كثافة التيار، FE، الانتقائية، ومعدل التحويل – لـ Cu NWs أقل من تلك الخاصة بـ V-Cu NAE. هذه التمييز يبرز العيوب كعامل رئيسي في تحسين
الشكل 2 | النشاط الكهروكيميائي لـفي-خلية. أ – منحنيات رغوة النحاس، أسلاك النحاس النانوية، NWs و V-Cu NAE في إلكتروليت ) مع (خطوط صلبة) وبدون (خط متقطع) معدل المسح لـ LSV كان. تم إجراء جميع التفاعلات عند درجة حرارة بسرعة تحريك مغناطيسي تبلغ 300 دورة في الدقيقة. كانت المقاومة المقاسة للخلية الكهروكيميائية هي. ب الكفاءة الفارادية المعتمدة على الجهد (FE، الأعمدة الخضراء) وانتقائية الأمونيا (الأعمدة الخضراء) على V-Cu NAE (كانت تحميل المحفزات ). c FE وانتقائية الأمونيا ومعدل تحويل النترات (الأعمدة الصفراء) على عينات مختلفة. d معدل إنتاج الأمونيا (الأعمدة البنفسجية) للعينات المحضرة كما هي عينات عند -0.3 فولت (مقابل RHE). e اختبار الاستقرار الدوري لـ V-Cu NAE. (f) تغيير التركيز مع مرور الوقتو FE على V-Cu NAE عند -0.3 فولت (مقابل RHE). كثافة التيار، FE منانتقائية، وتحويل في تركيزات مختلفة من مصادر النترات (المياه الجوفية الملوثة، مياه الصرف الصحي من صناعة النسيج، مياه الصرف الصناعي، النفايات النووية السائلة). مقارنة بين إنتاج الأمونيا وكفاءة فاراداي لـ V-Cu NAE مع محفزات أخرى عند تركيزات نترات مختلفة. تمثل أشرطة الخطأ الانحرافات المعيارية المحسوبة من ثلاث قياسات مستقلة. أداء على نطاق واسع من التركيزات. كما هو موضح في الشكل 2h، ضمن نطاق تركيز النترات من، تفوق V-Cu NAE على المحفزات الأخرى من خلال تحقيق معدل إنتاج الأمونيا أعلى بشكل ملحوظ مع الحفاظ على كفاءة تعادل أو تتجاوز تلك الخاصة بالمحفزات المنافسة. وقد أظهر ذلك الأداء الاستثنائي لـ V-Cu NAE عبر مجموعة واسعة من تركيزات النترات، مما يوفر حلاً محتملاً للتعامل مع مياه الصرف الصحي المحتوية على النترات المعقدة والمتنوعة في التطبيقات الصناعية. كما هو موضح في الشكل التكميلي 11، فإن السعة الكهربائية للطبقة المزدوجة (تم استخدام طريقة القياس لتقدير المساحة السطحية النشطة كهربائياً (ECSA) في هذه الدراسة. كانت قيمة ECSA لـ V-Cu NAE مع العيوب الوفيرة أعلى بخمس مرات من تلك الخاصة بـ Cu NW الخالي من العيوب، مما يوضح أن العيوب التي تم إنشاؤها في الموقع تعزز بشكل كبير عدد المواقع النشطة. أثبتت تجارب الوسم النظائري والمقارنات الفارغة بشكل قاطع أن الأمونيا نشأت حصرياً منبدلاً من التلوث الخارجي (الشكل التكميلي 12). في هذه الأثناء، لمقارنة الطرق الكروماترية باستخدام كاشف نيسلر (الشكل التوضيحي 8)، تم تحديد تركيز الأمونيوم بشكل إضافي بواسطة الرنين المغناطيسي النووي باستخدام المعايير الخارجية (الشكل التكميلي 13). عوائد الأمونيا من و تم الحصول عليه بواسطةتم العثور على الرنين المغناطيسي النووي متسقة للغاية مع النتائج الكمية التي تم الحصول عليها بواسطة الطرق الكروماترية، كما هو موضح في الشكل التكميلية 14، مما يؤكد دقة هذه التقنيات الكمية..
لتحقيق عملية التفاعل وآليتهاتم إجراء طيفية FTIR المتقدمة أثناء التشغيل على V-Cu NAE. يتم توضيح إعداد المختبر وخلايا التحليل الكهربائي المستخدمة في هذه القياسات في الشكل التكميلي 15 والشكل التكميلي 16، على التوالي.لتوفير قاعدة للمقارنة، تم إجراء تجارب تحكم بدون نترات تحت ظروف مشابهة (الشكل التوضيحي 17). كما هو موضح في الشكل 3a، قمنا بجمع وتحليل إشارات الأشعة تحت الحمراء التي تتراوح من 4000 إلىتحت جهد مطبق يتراوح بين -0.1 و -0.5 فولت (مقابل RHE) وعند جهد الدائرة المفتوحة. في نتائج تشغيل SR-FTIR لـ (الشكل 3ب)، يتم تمثيل الأمونيا الحرة عند ، والذروة عند يُنسب إلى الماء. علاوة على ذلك، مع انخفاض الجهد من -0.1 إلى -0.5 فولت، زادت شدة الذروة، مما يدل على زيادة في عائد.
ضمن نطاق (الشكل 3ج)، قمم لوحظت عند و نُسِبَت إلىالمتوسطات وعلى التواليمن الواضح أن معدلات الإنتاج لـ و ارتفعت بشكل تدريجي مع انخفاض الجهد المطبق من -0.1 إلى -0.5 فولت (مقابل RHE). الندرةالمحتوى عند -0.5 فولت، المنسوب إلى
الشكل 3 | قياسات طيف الأشعة السينية المتزامنة (FTIR) تحت إمكانيات مختلفة لـ V-Cu NAE أثناء
. طيف FTIR ثلاثي الأبعاد وخرائط كونتور المقابلة في و عند OCP (جهد الدائرة المفتوحة). مقياس الألوان مع سهم يشير إلى التغير في شدة الإشارة من المنخفض إلى المرتفع.الإشارات تحت الحمراء في نطاق. إشارات الأشعة تحت الحمراء في نطاق نطاق، مقاسة تحت إمكانيات تتراوح من -0.1 إلى -0.5 فولت مقابل RHE الذروة، قد تكون نتيجة لاستنفادها السريع عند الفولتية العالية في الوقت نفسه، قدمت طيفيات FTIR ثلاثية الأبعاد والخرائط الكنتورية المقابلة (الشكل 3أ) انعكاسًا أكثر مباشرة لاتجاه محتوى الوسط.
لتوضيح القدرة الفائقة على إزالة النترات وأداء إنتاج الأمونيا لـ V-Cu NAE، تم إجراء حسابات DFT علىالوجوه والعيوبالوجوه استنادًا إلى الملاحظات السابقة. تم إضافة أربع جزيئات ماء بشكل صريح إلى سطح المحفز لأخذ تأثير الروابط الهيدروجينية على الوسائط في الاعتبار، بينما تم اعتماد نموذج حل مائي ضمني لمعالجة بيئة المذيب كاستمرارية قطبية. تم إنشاء نموذج V-Cu عن طريق إزالة ذرة نحاس سطحية من (كما هو موضح في الشكل التكميلي 18 والشكل التكميلي 19). بالإضافة إلى ذلك، تم استخدام محاكاة الجهد الكهربائي الثابت ومحاكاة طاقة التنشيط المعتمدة على الجهد لدراسة الاعتماد على الجهد.، HER، وطاقة تحليل الماء.
نموذج مركز الفرقة كان بمثابة منهجية قوية لفحص طاقة الربط والتفاعلات الحفزية بين المعادن الانتقالية والمواد المتفاعلة أو الوسائط.في نموذج V-Cu،
تظهر ذرات النحاس بالقرب من العيب حالة غير مشبعة، حيث يمتلك مركز نطاق d أقرب إلى مستوى فيرمي (الشكل 4أ). وهذا يؤدي إلى Vلإظهار امتصاص أقوى لمختلف الوسائط مقارنةً بـ. استنادًا إلى النتائج التجريبية، تم ملاحظة الأداء الأمثل لـ V-Cu(111) عند مقابل RHE، وبالتالي تم حساب جميع الطاقات في الشكل 4a-e عند هذه الإمكانية. أولاً، تم حساب الطاقات الكلية للوسائط المعنية في انقسام الماء وHER على و V-Cu(111)، مثل الشريحة،، *OH، و *OH + *H، تختلف مع كما هو موضح في الشكل التوضيحي الإضافي 20. الشكل 4ب يعرض مخطط الطاقة الحرة لتفكيك الماء لـو V-Cu(111). تشير النتائج إلى أن V-Cu(111) يظهر امتصاصًا أقوى لجزيئات الماء ولديه طاقة تنشيط لتفكيك الماء أقل (0.38 إلكترون فولت) من Cu(111).. هذا يعني أن أكثر قدرة على توفير بروتونات نشطة لتسهيل عملية البروتنة في ، مما يؤدي إلى كثافة تيار إنتاج الأمونيا العالية ( ) لــ V-Cu NAE . في الوقت نفسه، فإن V-Cu(111) لديه حاجز تفاعل HER أعلى (0.84 eV) مقارنة بـمما يشير إلى قدرة أقوى على الكبح لـ HER، وتم تحسين FE.
لـعلىو V-Cu(111)، الشكل التوضيحي التكميلي 21 يعرض الوسائط المحتملة وعمليات الامتزاز/التحرر المعقدة،
الشكل 4 | حسابات DFT. أ تم توضيح كثافة الحالات المتوقعة (PDOS) مع النماذج الهيكلية لكل من V-Cu NAE و Cu NWs. ب تم تصوير مسارات تفاعل انقسام الماء لكل من V-Cu و Cu عندما مقابل RHE. ج يعرض مسارات تفاعل تطور الهيدروجين لـو النحاس عند مقابل RHE. د تظهر المسارات للنحاس، مع تمييز المسار الأمثل بوضوح باللون الأزرق في ضد RHE. e ال تم توضيح المسارات لـ V-Cu مع تمييز المسار الأمثل باللون الأحمر في مقابل RHE. من المهم أن هذه المسارات التفاعلية مكملة بمخططات الطاقة الحرة والنماذج المقابلة. النماذج المرسومة بخطوط صلبة تشير إلى حالات مستقرة، بينما تلك التي بخطوط متقطعة تدل على حالات الانتقال (TS). لتسهيل التمييز، تمثل النماذج داخل الإطارات الحمراء V-Cu، وتلك داخل الإطارات الزرقاء تشير إلى Cu. شبكة تفاعلات إزالة الأكسجين وتفاعل البروتون. الطاقات الكلية للوسطاء المرتبطين بـعلىو V-Cu(111) مثل اللوح، *NO3، *NO2، *NO، *NOH، *NHO، *NHOH، *NH2O، *NH2OH، *N، *NH، *تختلف معكما هو موضح في الشكل التوضيحي 22. حالات الانتقال للخطوات الأساسية لـعلىوتم تحديد V-Cu(111) باستخدام طريقة النمو البطيء (الشكل التكميلي 23 والشكل التكميلي 24). يوضح الشكل 4d و e مسارات التفاعل لـعلى و V-Cu(111)، تشمل جميع طاقات الحالة الحرة في الحالة الأساسية والحواجز الحركية. استنادًا إلى طاقات التنشيط لكل خطوة أساسية، فإن المسارات التفاعلية المثلى لـ وتم التأكد من أن V-Cu(111) هو * * * * * * * * .
يظهر V-Cu(111) ذو التنسيق المنخفض قدرات امتصاص معززة للنترات والنيتريت، مع طاقات امتصاص حرة تبلغ -1.62 eV و -1.34 eV على التوالي. بالمقارنة مع و يستخلص النترات من المحلول بشكل أسرع، بينما يثبط أيضًا انطلاق النيتريت. الخطوة المحددة لمعدل كل من و يحدث أثناء بروتنة *، مع حواجز تنشيط تبلغ 0.93 إلكترون فولت و1.07 إلكترون فولت، على التوالي. وهذا يشير إلى ميزة تنافسية لـفي تحويل الأمونيا.
علاوة على ذلك، تم تنفيذ محاكيات ميكروكينية لحساب إنتاج النيتريت والأمونيا لـ و في مقابل RHE. تظهر النتائج من الشكل التوضيحي 22a أنه، عند التوازن، من المواقع علىمحتلة بواسطة *O و *OH، مع وجود المواقع المتبقية شاغرة. تعتبر معدلات بروتنة الأنواع الأكسجينية الأبطأ والطاقة الضعيفة لعملية الامتصاص هي المسؤولة عن ذلك. بسبب طاقة امتصاص النترات الأكثر سلبية وسرعة أكبرمعدل إزالة الأكسجين، يتم استهلاك المواقع على V-Cu(111) بسرعة عند بدء التفاعل، مما يؤدي إلى إزالة الأكسجين بشكل سريعلإنتاج و (الشكل التوضيحي 25ب). بسبب معدلات البروتنة الأسرع للأنواع الأكسجينية على V و تُستهلك أيضًا بسرعة. بمجرد تحقيق حالة التوازن الثابت، يتم تغطية السطح بالكامل بـ، في هذه المرحلة، فإن معدل إزالة الأكسجين لـ *يصبح الخطوة الحاسمة في تحويل النترات إلى الأمونيا. أخيرًا، كما هو موضح في الشكل التوضيحي 25c، تم تحديد العوائد الثابتة من النيتريت والأمونيا لكل من النحاس وV-Cu. تظهر النتائج أن عائد الأمونيا لـ V-Cu هو، مع إنتاج النيتريت عند. بالمقابل، ينتج النحاسمن الأمونيا مع ناتج نيتريت منتؤكد نتائج محاكاة الميكروكينتيك هذه على الانتقائية الأعلى لـ V-Cu(111) في إنتاج الأمونيا.
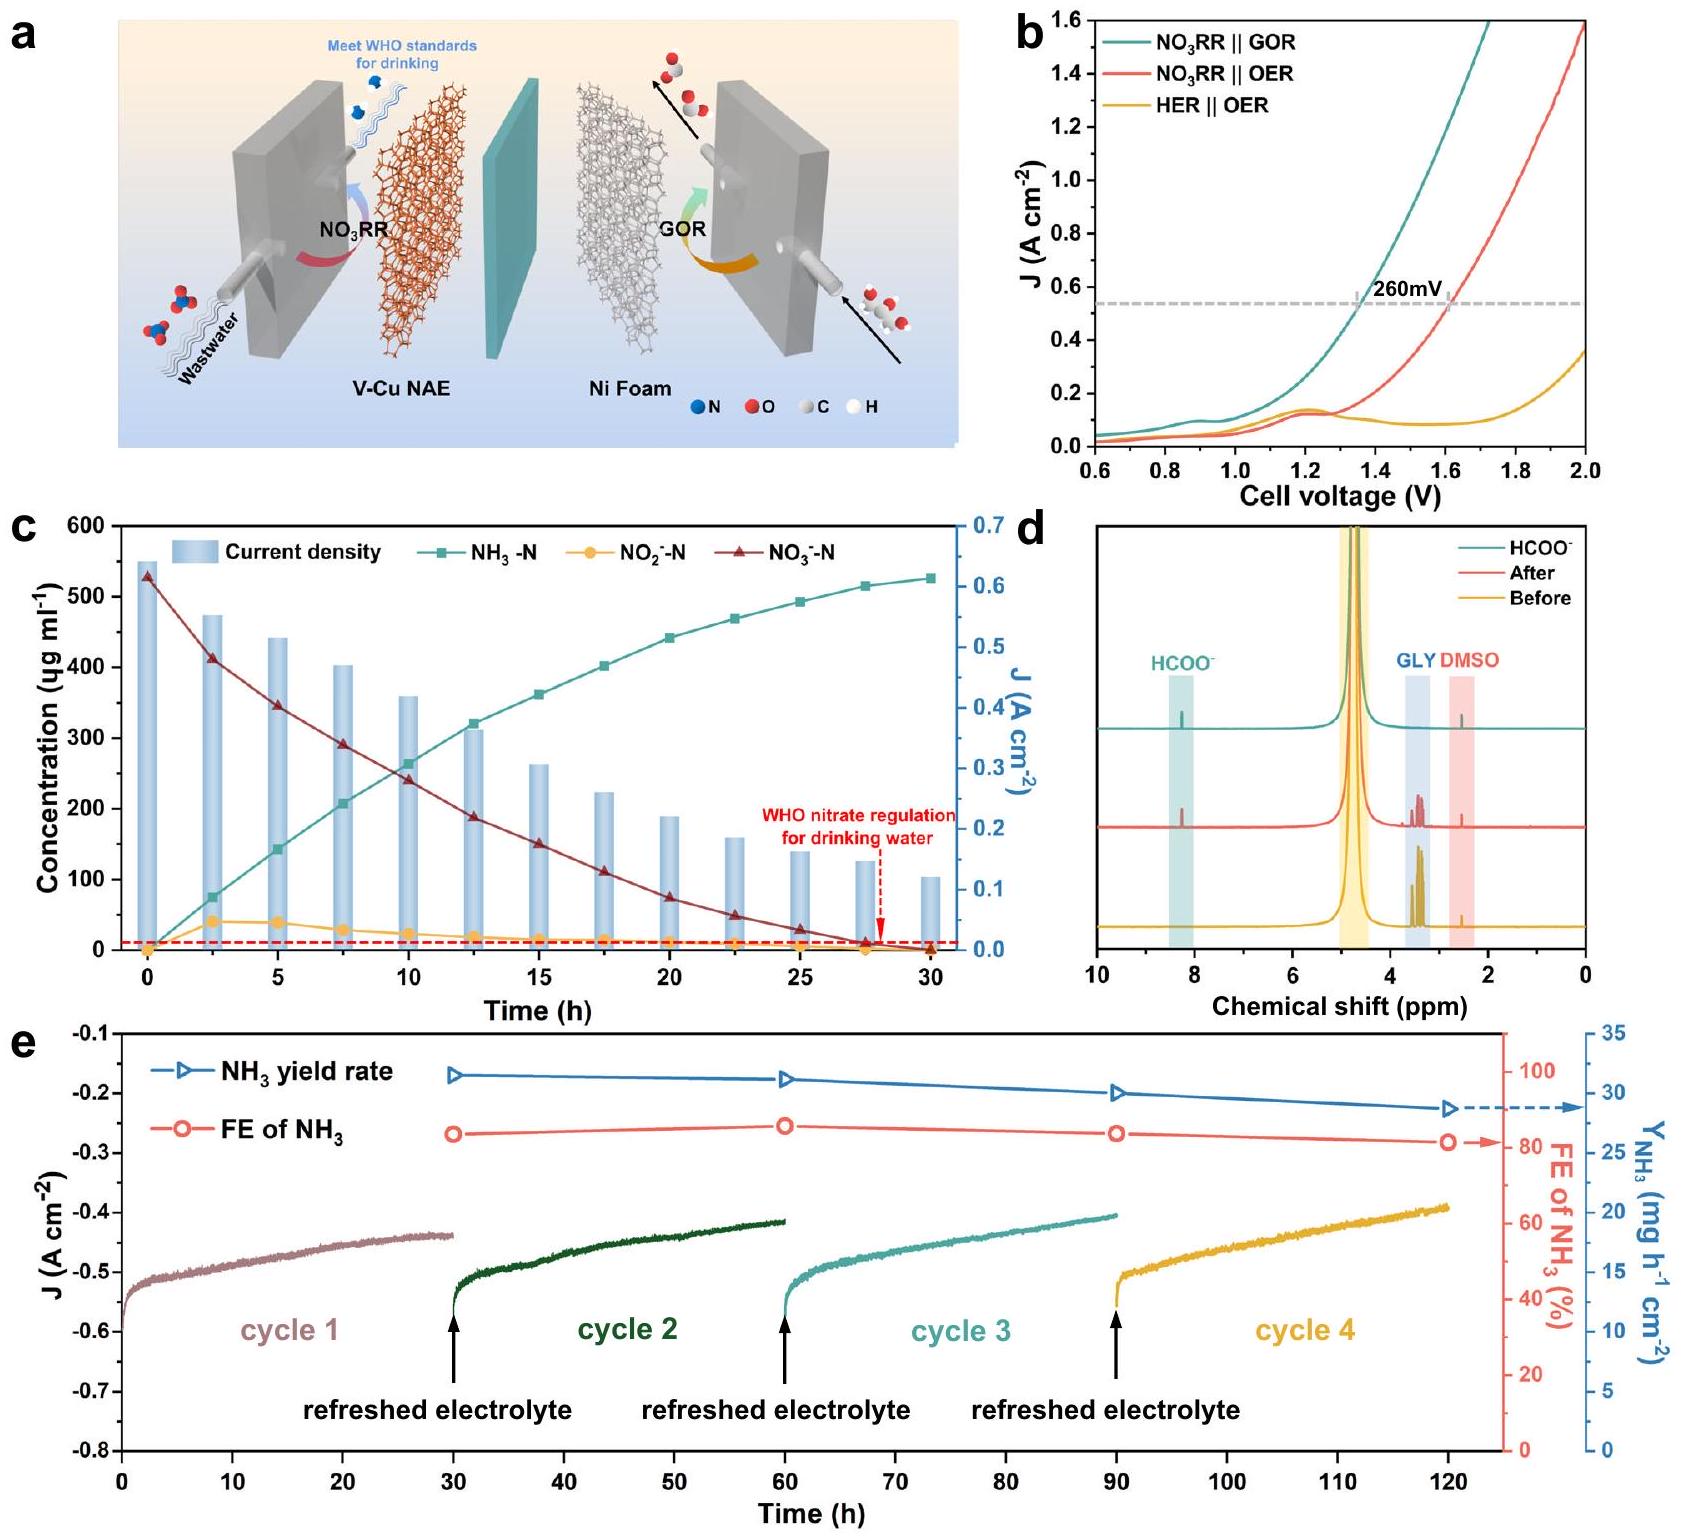
لاستكشاف إمكانيات التصنيع للمحفز بشكل أعمق، تم استخدام خلية إلكتروليتية جارية ذات قطبين مرتبطة بـ وتم تصميم تفاعل GOR لتعزيز كفاءة استخدام الطاقة وسعة معالجة مياه الصرف الصحي (الشكل 5a). على وجه التحديد، تم استخدام V-Cu NAE ورغوة النيكل التجارية كالكاثود والأنود على التوالي. مياه الصرف الصناعي الفعلية (-نسبة محتوى 527 جزء في المليون) و0.1 م من الجلسرين عملت كإلكتروليت للقطب السالب والقطب الموجب، على التوالي. تم تقديم مخطط تفصيلي لجهاز خلية التدفق ذات القطبين في الشكل التكميلية 32. أشارت منحنيات LSV الموضحة في الشكل 5b إلى أن إضافة 0.1 م من الجلسرين (GLY) خفضت الجهد المطلوب لتحقيق كثافة تيار من الدرجة الصناعية منإلى 1.34 فولت فقط، وهو انخفاض كبير قدره 260 مللي فولت. لتقييم قدرة معالجة مياه الصرف الصحي وأداء إنتاج الأمونيا للجهاز، تم إجراء تجربة تحويل لمياه الصرف الصناعي الفعلية بكمية 1 لتر. V-Cu NAE. كما هو موضح في الشكل 5c، مع جهد خلية منخفض قدره -1.4 فولت، تقلص التركيز تدريجياً خلال التحليل الكهربائي، مصحوباً بانخفاض في كثافة التيار منإلىبعد 30 ساعة من التحليل الكهربائي، فقط 0.52 جزء في المليون منو 0.38 جزء في المليون منظلّت، أقل بكثير من معايير منظمة الصحة العالمية لمياه الشرب، والتي تتوافق معانتقائية، الـتحويل و الـ FE فوق تم ملاحظة أن تم تقليل المحفز بنجاح إلى و محتوى 1 لتر من مياه الصرف الصناعي الفعلية إلى معيار مياه الشرب خلال 30 ساعة، مما يوضح قدرته المثيرة للإعجاب في معالجة مياه الصرف. بالإضافة إلى ذلك، أشارت نتائج NMR (الشكل 5d) إلى أن الجلسرين تم أكسدته عند الأنود إلى شكل فورمات عالي القيمة المضافة، مع FE بنسبة 81.3% (الشكل التوضيحي 33)، مما يعزز الفوائد الاقتصادية العامة . نظرًا لأن الاستقرار هو معلمة حاسمة للتصنيع، تم إجراء اختبار استقرار على الجهاز باستخدام 5 لترات من مياه الصرف عند 1.4 فولت، مع تحديثات دورية كل 30 ساعة. كما هو موضح في الشكل 5e، معدل الإنتاج وFE للمحفز ظل مستقرًا حتى بعد 100 ساعة، مما يكشف عن استقرار استثنائي. للتحقيق بشكل أكبر في استقرار المحفز بعد التشغيل ومتانته، قمنا بإجراء توصيفات شاملة. كما هو موضح في الشكل التوضيحي 34، ظل الطور البلوري للمحفز متسقًا كطور معدني من النحاس بعد اختبارات الاستقرار. من الفحوصات SEM، تم تحديد عدة تغييرات شكلية بعد اختبارات الدورة (الشكل التوضيحي 35). على وجه التحديد، تم فصل بعض مصفوفات الأسلاك النانوية عن ركيزة رغوة النحاس، مما يتناقض مع حالتها الأولية كما هو موضح في الشكل التوضيحي 35a، c، e، g. بالإضافة إلى ذلك، لوحظ تجمع الأسلاك النانوية في بعض المناطق (الشكل التوضيحي 35f)، وكانت الكسور واضحة في بعض الأسلاك النانوية (الشكل التوضيحي 35h). قد تسهم هذه التغييرات الشكلية الملحوظة في تباين الأداء الذي تم اكتشافه خلال اختبارات الدورة. علاوة على ذلك، أشارت تحليلات XPS إلى أنه، مقارنة بالعينة الأصلية، لا تزال قمم النحاس من V-Cu NAE المدورة تظهر تحولًا كبيرًا عند مقارنتها بتلك الخاصة بأسلاك النحاس الخالية من العيوب (الشكل التوضيحي 36). هذا التحول المستمر يؤكد الاستقرار الدائم لفراغات النحاس طوال عملية الدورة، مما يبرز الوجود المستمر لفراغات النحاس في المحفز. تجاوز جهازنا ثنائي القطب جميع الأداءات المبلغ عنها سابقًا في تقليل النترات الكهروكيميائي إلى الأمونيا .
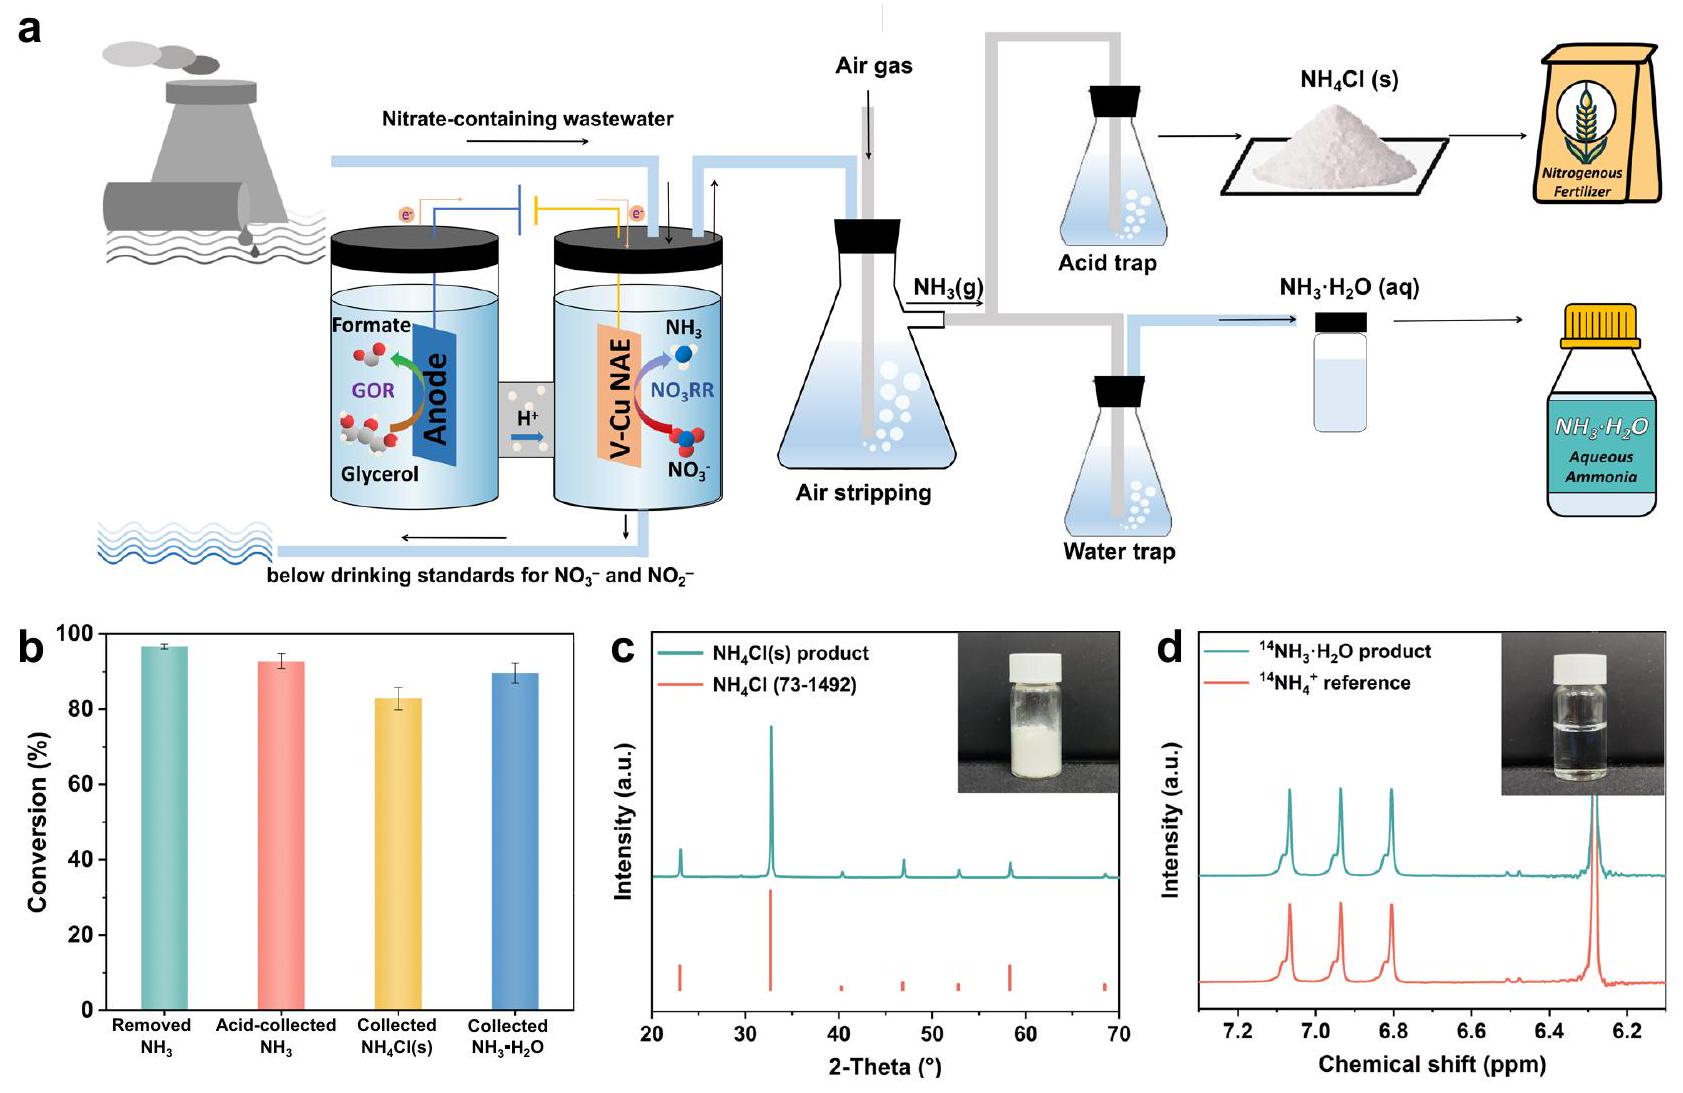
أثناء معالجة مياه الصرف الصناعي الأصلية، تم استخدام إزالة الهواء بشكل فعال لاستخراج الأمونيا ( )، مما أدى بعد ذلك إلى إنتاج منتج نهائي قيم . الشكل 6a يوضح أنه تحت ظروف التشغيل من وتدفق الهواء، يمكن إزالة حوالي من بشكل فعال من مياه الصرف المعالجة دون التأثير على الشوائب الأخرى. بعد استخراج ، تم استخدام حمض الهيدروكلوريك لالتقاط الأمونيا، مما أدى إلى إنتاج كلوريد الأمونيوم . بعد ذلك، ساعد جهاز التبخير الدوار في فصل . بالإضافة إلى ذلك، فإن الحقن المباشر لـ في الماء يولد أحادي هيدرات الأمونيا ( ). ساهمت كلا الإجرائين بشكل ملحوظ في تحويل أكثر من من الموجود في مياه الصرف إلى منتجات كيميائية، كما هو موضح في الشكل 6b. تم إجراء تحليل حيود الأشعة السينية (XRD) وتحليل الرنين المغناطيسي النووي البروتوني ( NMR) للتحقق من نقاء المنتجات الناتجة. كما يتضح من الشكل 6c، d، أكدت هذه التقنيات التحليلية نقاء عالي لـ و تم الحصول عليهما من مياه الصرف الصناعي المعالجة، دون شوائب ملحوظة. في الختام، تثبت طريقة إزالة الهواء المنفذة أنها استراتيجية فعالة وانتقائية لاستخراج من مياه الصرف الصناعي الحقيقية، مما يؤدي إلى إنتاج منتجات نهائية قيمة عالية النقاء مثل و . وضعت هذه الدراسة الأساس لمزيد من تحسين وتطوير عمليات معالجة مياه الصرف، مما يساهم في النهاية نحو استخدام أكثر استدامة وكفاءة للموارد.
باختصار، قمنا بتخليق NAE من النحاس الغني بالعيوب تم الحصول عليه من خلال الاختزال الكهروكيميائي في الموقع لـ NWs. كشفت الأشعة السينية المتزامنة-FTIR وحسابات DFT أن العيوب أدت إلى تعديل ثلاثي متآزر: تعزيز امتصاص النترات، تعزيز تفكك الماء، وكبح تطور الهيدروجين. وبالتالي، يصل محفز V-Cu NAE إلى ضمن نطاق تركيز النترات من ، مع الحفاظ على FE يتجاوز وتقليل مستويات النترات بفعالية لتتوافق مع معايير مياه الشرب لمنظمة الصحة العالمية. علاوة على ذلك، استكشفنا الإمكانات الصناعية لـ V-Cu NAE باستخدام نظام ثنائي القطب
الشكل 5 | الكهروكيميائية مع مياه الصرف الصناعي الفعلية مقترنة بتفاعل أكسدة الجلسرين في نظام ثنائي القطب. أ مخطط للكهروكيميائي مقترن بـ مع مياه الصرف الصناعي وتفاعل أكسدة الجلسرين (GOR). ب منحنيات LSV (بدون تعويض IR) باستخدام الكهروكيميائي مع وبدون الجلسرين عند الأنود. كانت المقاومة المقاسة لنظام القطبين . ج إزالة كاملة للنترات باستخدام V-Cu NAE ( ) مع 1 لتر من مياه الصرف الصناعي الفعلية (تحتوي على مع ) عند
1.4 فولت. بعد 30 ساعة من التحليل الكهربائي، بقي فقط و ، وكلاهما أقل بكثير من لوائح منظمة الصحة العالمية لمياه الشرب ( و )، مع انتقائية، تحويل، فوق . تظهر البيانات الزرقاء تغير التيار مع مرور الوقت. د نتائج NMR لتوصيف إنتاج GOR. هـ منحنيات الكرونوأمبيرومتر، FE و معدل العائد لـ V-Cu NAE عند 1.4 فولت من خلال 4 دورات، مع تقديم كل دورة 30 ساعة من التحليل الكهربائي طويل الأمد.
نظام القطبين لمعالجة مياه الصرف الفعلية مع انتقائية، تحويل. تقدم أعمالنا حلاً محتملاً لمعالجة مياه الصرف المعقدة والمتنوعة المحتوية على النترات التي تواجهها التطبيقات الصناعية.
طرق
توصيف المواد
تم توصيف شكل وبنية العينات باستخدام تقنيات مختلفة، بما في ذلك المجهر الإلكتروني الماسح ذو الانبعاث الميداني (FESEM، SU-8200)، المجهر الإلكتروني الناقل (TEM، HIACHI HT7700؛ Talox F200X)، جهاز حيود الأشعة السينية (XRD، TTR-III)، ومطياف رامان (Renishaw inVia) مع ليزر تحفيز 532 نانومتر. تم تسجيل صور TEM عالية الدقة (HRTEM) وصور رسم خرائط الطيف الطاقي (EDS) باستخدام مجهر إلكتروني ناقل Talox F200X يعمل عند 200 كيلو فولت.
تم تحليل الحالة الكيميائية للعينات باستخدام مطياف الأشعة السينية للكهروضوئية ESCALAB 250 مع مصدر أشعة سينية (Al 1486.6 eV). تم معايرة جميع القمم باستخدام طيف C 1 s عند طاقة ربط تبلغ 284.8 eV. تم قياس طيف الامتصاص للأشعة فوق البنفسجية-المرئية (UV-Vis) باستخدام مطياف Shimadzu UV-3600. تم إجراء تجارب وضع العلامات النظيرية وتم قياسها باستخدام مطياف 1H NMR (Bruker النظام).
المعالجة المسبقة لرغوة النحاس. تم قطع رغوة النحاس إلى مستطيل بمساحة ، ثم تم استخدام الموجات فوق الصوتية في محلول مائي من HCl 1M، والماء، على التوالي.
تخليق مصفوفات الأسلاك النانوية . تم غمر رغوة النحاس أعلاه في محلول من 10 مل من بيرسلفات الأمونيوم (0.285 جرام) و10 مل من هيدروكسيد الصوديوم (1.0 جرام) لمدة 30 دقيقة، خلال
الشكل 6 | تخليق واستخراج منتجات الأمونيا من مياه الصرف الصناعي. أ مخطط لعملية تخليق منتج الأمونيا من مياه الصرف الصناعي إلى و . ب كفاءة التحويل لمراحل مختلفة لعملية تخليق منتج الأمونيا. ج XRD وصورة للمنتجات المخلقة . NMR وصورة للمنتج المخلوق . تمثل أشرطة الخطأ الانحرافات المعيارية المحسوبة من ثلاث قياسات مستقلة.
خلاله تغير لون سطح رغوة النحاس إلى الأزرق الفاتح وأصبح المحلول أزرق. بعد ذلك، تم غسل رغوة النحاس ذات اللون الأزرق الفاتح بالماء المقطر والإيثانول، وتم تجفيفها تحت الفراغ عند .
تخليق مصفوفات الأسلاك النانوية . تم تسخين NWs عند لمدة ساعتين بمعدل تسخين قدره تحت جو . ثم، تم تبريدها إلى درجة الحرارة الطبيعية.
تخليق مصفوفات الأسلاك النانوية ( NWs). تم تسخين NWAs عند لمدة ساعتين بمعدل تسخين قدره تحت جو Ar .
تخليق مصفوفات الأسلاك النانوية الغنية بالفراغ (V-Cu NAE). تم إنتاج V-Cu NAEs المستخدمة في تقليل النترات بعد ذلك من خلال الاختزال الكهروكيميائي في الموقع لـ NWs، مما أزال النيتروجين من السطح، وبالتالي بناء V-Cu NAE. تم استخدام تقنية CV من -0.4 إلى -1.8 فولت بمعدل مسح قدره لمدة 20 دقيقة على الأقل حتى استقر الخط الأساسي. خلال الاختزال الكهروكيميائي في الموقع، NWs تفقد النيتروجين تدريجيًا وتصبح مصفوفات أسلاك نحاسية غنية بالفراغ، وبالتالي تتغير من اللون الأسود إلى البني المحمر.
القياسات الكهروكيميائية
تم إجراء جميع القياسات الكهروكيميائية للعينات باستخدام محطة عمل كهروكيميائية CS (CS150M، الصين) في خلية إلكتروليتية من نوع H مفصولة بغشاء. كانت العينة القائمة على النحاس على شبكة النحاس، مع قطب زئبقي مشبع (SCE) ورقة بلاتين. تم استخدامه كقطب عمل وقطب مرجعي وقطب مضاد، على التوالي. تم التحكم في مساحة سطح قطب العمل عند، وكانت كمية التحفيز تم توزيع المحلول (35 مل) بالتساوي على حجرة الكاثود وحجرة الأنود.تم إضافته إلى حجرة الكاثود لـالاختزال (الذي يحتوي على 1، 2، 5، 10، 20، 30، 40، 50، 100، 500، 1000 مللي مولار من نترات النيتروجين، على التوالي). قبل اختبار اختزال النترات، يتم إجراء منحنيات الفولتامترية المسحية الخطية (LSV) حتى تحقق منحنيات الاستقطاب حالة مستقرة بمعدلمن 0.2 فولت إلى -0.6 فولت مقابل RHE. ثم تم إجراء الاختبار البوتنستاتيكي عند إمكانيات مختلفة لمدة ساعة واحدة مع معدل تحريك 300 دورة في الدقيقة. تم تحديد مقاومة الخلية الكهروكيميائية باستخدام طيف الامتصاص الكهروكيميائي البوتنستاتيكي، الذي تم إجراؤه على نطاق تردد من 0.1 هرتز إلى 200 كيلوهرتز مع تعيين سعة الإشارة علىمنحنيات الفولتمترية الدائرية (CV) في سعة الطبقة الثنائية الكهروكيميائيةتم قياس العزم في نافذة محتملة تقريبًا بدون عملية فاراداي عند معدلات مسح مختلفة من و في محلول يحتوي على 200 جزء في المليون من نيتروجين النتراتإن مخطط كثافة التيار عند جهد محدد مقابل معدل المسح له علاقة خطية ويمثل ميله.
تحديد تركيز الأيونات
تم استخدام تقنية الطيف الضوئي للأشعة فوق البنفسجية والمرئية (UV-Vis) لتحديد تركيزات الأيونات ضمن نطاقات المعايرة المحددة. فيما يلي المنهجيات المعدلة للكشف عن مركبات النيتروجين المختلفة:
تحديد نترات-N. في البداية، تم تخفيف حجم محدد من العينة إلى 5 مل ضمن حدود الكشف. إلى هذا المحلول، تم إضافة 0.1 مل من 1 م من حمض الهيدروكلوريك و0.01 مل منتم إضافة محلول حمض السلفاميك. ثم تم السماح للمزيج بالتوازن لمدة 20 دقيقة تحت درجة حرارة الغرفة. تم استخدام مطياف الأشعة فوق البنفسجية-المرئية لقياس طيف الامتصاص، مع التركيز على قمم الامتصاص عند أطوال الموجات 220 نانومتر و 275 نانومتر. تم تحديد الامتصاص الصافي باستخدام المعادلة:تم إنشاء منحنى المعايرة باستخدام مجموعة من محاليل نترات البوتاسيوم القياسية لربط الامتصاص مع التركيز، مما يسهل تحديد تركيزات النترات في عينات الاختبار.
تحديد نيتريت-N. تم تحضير الكاشف الملون عن طريق دمج p-أمينوبنزين سلفوناميد (4 جرام)، N-(1-نافثيل) إيثيلين ثنائي الأمين ثنائي الهيدروكلوريد (0.2 جرام)، ماء نقي للغاية (50 مل)، وحمض الفوسفوريك (10 مل بكثافة)تم تخفيف حجم محدد من العينة إلى 5 مل ليكون ضمن حدود الكشف، تلاه إضافة 0.1 مل من كاشف اللون المحضر. تم تجانس المحلول وتركه ليستقر لمدة 20 دقيقة، بعد ذلك تم قياس شدة الامتصاص عند 540 نانومتر. تم استخدام سلسلة من محاليل نترات الصوديوم القياسية لمعايرة منحنى التركيز-الامتصاص، مما مكن من حساب تركيزات النترات في العينات.
تحديد الأمونيا-N. تم استخدام كاشف نيسلر كعامل لوني للكشف عن الأمونيا. تم تخفيف العينة إلى حجم 5 مل ضمن نطاق الكشف، حيث أضيفت 0.1 مل من محلول تارترات البوتاسيوم والصوديوم (الكثافة ) تم إضافته وخلطه جيدًا. بعد ذلك، تم إدخال 0.1 مل من كاشف نيسلر، وتم خلط المحلول بشكل موحد. تم تسجيل الامتصاص عند طول موجي قدره 420 نانومتر بعد فترة الاستقرار. تم إجراء المعايرة باستخدام سلسلة من محاليل كلوريد الأمونيوم القياسية، مما سهل تحديد تركيزات الأمونيا.
حساب العائد، معدل التحويل، الانتقائية، وكفاءة فاراداي
عائدتم تحديده باستخدام المعادلة أدناه:
أينيشير إلى تركيز الكتلة من الأمونيا في المحلول المائي،يحدد الحجم الإجمالي للإلكتروليت الموجود داخل حجرة الكاثود،هو الكتلة المولية لـيمثل مدة عملية التحليل الكهربائي، هو مساحة الكاثود، ؛
تم حساب معدل التحويل باستخدام المعادلة أدناه:
أينهل هناك اختلاف في تركيز النترات قبل وبعد التحليل الكهربائي،يمثل التركيز الأولي للنترات،.
تم الحصول على انتقائية الأمونيا أو النيتريت باستخدام المعادلة أدناه:
أينيشير إلى التركيز الناتج من الأمونيا أو النيتريت،.
تم تقييم الكفاءة فاراداي من خلال المعادلة (4)، والتي تُعرف بأنها نسبة الشحنة الكهربائية المستخدمة في تخليق الأمونيا إلى إجمالي الشحنة المنقولة عبر القطب:
أين هو ثابت فاراداي، بقيمة 96,485 كولوم لكل مول ( ); هو إجمالي كمية الشحنة المستهلكة، كولوم.
تجربة وسم النظائر
استخدام 99 ذرةكمصدر للنيتروجين في التغذية، تم إجراء تجربة تقليل النترات المعلمة بالنظائر لتحديد مصدر الأمونيا. تم استخدام كبريتات البوتاسيوم بتركيز 0.5 م كإلكتروليت، وبتركيز 200 جزء في المليون وتم إضافته إلى غرفة الكاثود كمواد متفاعلة. بعد الاختزال الكهربائي، كانت الإلكتروليت لـتم إخراجه. تم تعديل قيمة الرقم الهيدروجيني إلى حمض ضعيف بواسطة حمض الكبريتيك 4 م، وتم تحديده بشكل أكبر بواسطةتم استخدام NMR (400 ميجاهرتز) باستخدام معيار حمض الماليك. تم إنشاء منحنى المعايرة على النحو التالي: أولاً،تم تحضيرها بتركيز معروف (50، 100، 150، 200، 250) في 0.5 م من كبريتات البوتاسيومتم استخدام المحلول كمعيار؛ ثانياً،تم خلط محلول قياسي بتركيزات مختلفة مع 0.02 جرام من حمض الماليك؛ ثالثًا،أكسيد الديوتيريوم ) أُضيفت إلى 0.5 مل من المحلول المختلط للكشف بواسطة الرنين المغناطيسي النووي. أخيرًا، كانت نسبة مساحة القمة لـ وتم استخدام حمض الماليك للمعايرة، لأن تركيز كان مرتبطًا إيجابيًا بنسبة المساحة. وبالمثل، فإن كمية تم قياسه كميًا.
طيف رامان في الموقع
تم استخدام تحليل الطيف Raman في الموقع باستخدام مجهر رامان المجهري المترافق (Renishaw inVia) المزود بعدسة أوليمبوس 50X.عدسة ذات مسافة عمل طويلة. ليزر بطول موجي 532 نانومتر، بقوة خرج 2.5 مللي واط ويستخدم 1800 خط.المبشور، تم نشره. الـكانت NWs التي تقيس 1 سم × 1 سم بمثابة الركيزة للقطب الكهربائي العامل، بينما كانت سلك البلاتين وتم استخدامهما كأقطاب مرجعية وعكسية، على التوالي. كانت قياسات طيف رامان المعتمدة على الزمن تجاه عملية التحفيز الكهربائي تحت جهد مطبق مبرمج فييتم الاحتفاظ بالتحفيز الكهربائي لمدة 300 ثانية عند الجهد المطبق للوصول إلى ظروف الحالة المستقرة قبل تسجيل كل طيف. تم الحصول على كل طيف على مدى 15 عملية مسح، تغطي النطاق من 175 إلى.
قياسات SR-FTIR أثناء التشغيل
في مختبر الإشعاع الوطني على خط الأشعة تحت الحمراء BL01B، تم استخدام تحليلات SR-FTIR في الموقع باستخدام جهاز انعكاس مصمم خصيصًا مع نافذة بلورية من ZnSe لنقل الأشعة تحت الحمراء، مما يسمح بمرور الطول الموجي من 20,000 إلىمع نفاذية أكبر من. تضمنت الإعدادات مقياس طيف الأشعة تحت الحمراء FTIR الذي يحتوي على مقسم شعاع KBr والعديد من الكواشف، ولا سيما كاشف الزئبق والكادميوم والتيلوريوم المبرد بالنيتروجين السائل، المدمج مع ميكروسكوب الأشعة تحت الحمراء Bruker Hyperion 2000 وعدسة التكبير. تم الحفاظ على فجوة بسمك ميكرومتر بين قطب التحفيز ونافذة ZnSe. في البداية، تم تحديد موقع العينة باستخدام وضع الملاحظة الانعكاسية للتركيز على سطح المحفز. ثم تم إجراء القياسات في وضع الانعكاس مع سقوط عمودي للضوء تحت الأحمر. مع تيار شعاع مصدر الضوءتم الحصول على كل طيف امتصاص للأشعة تحت الحمراء عن طريق متوسط 128 مسحًا بدقةقبل القياس، تم جمع طيف الخلفية لقطب التحفيز عند جهد الدائرة المفتوحة (OCP). تم تغيير إمكانيات تفاعل الاقتران الكهربائي بشكل منهجي من -0.4 إلى -0.9 فولت مقابل RHE، بخطوات قدرها 0.1 فولت. من المهم ملاحظة أن الجهاز قام تلقائيًا بطرح الخلفية التي تم الحصول عليها عند OCP من نتائج الاختبار.
تفاصيل حسابية
تم استخدام حزمة محاكاة فيينا من البداية (VASP) المستندة إلى نظرية الوظائف الكثيفة (DFT) لجميع الحسابات في هذه الدراسةاعتمدنا على إمكانيات زائفة معززة بالمشاريع (PAW) وتقريب تدرج عام شبه محلي (GGA) مع طاقة تبادل-ترابط Perdew-Burker-Ernzerhof (PBE)لأخذ تأثيرات فان دير فال الضعيفة وطويلة المدى في الاعتبار بشكل معقول، استخدمنا طريقة DFT مصححة بالتشتت تجريبياً (DFT-D3)تم تعيين حد قطع طاقة الحركة لتوسيع الموجة المسطحة إلى 400 eV، وتم تعيين عتبة تقارب تكرار المجال الذاتي (SCF) إلىتم إجراء تحسين الهندسة باستخدام طريقة التدرج المترافق، مع قوى على كل ذرة أقل من.
طاقة الامتصاص للنترات والنيتريت
بالنسبة لـ DFT، فإن الحصول على طاقة أيون النترات يمثل تحديًا لأن DFT لا يمكنه الحصول بدقة على طاقة الجزيئات المشحونة. يمكننا اشتقاق طاقة الامتصاص للنترات باستخدام بيانات الديناميكا الحرارية من دليل CRC مع الطاقة الدقيقة التي يمكن لـ DFT حسابها. في الواقع، هذه هي الطريقة التي تعاملنا بها في المخطوطة التي قدمناها في البداية، لكننا لم نفصل هذا الجانب في المعلومات الداعمة أو النص الرئيسي. سيتم إعادة تضمين هذه التفاصيل في قسم التفاصيل الحسابية من المعلومات الداعمة. عملية الاشتقاق المحددة هي كما يلي:
وفقًا لقانون هيس، يمثل S4 عملية امتصاص أيون النترات، ويمكن اشتقاق الطاقة الحرة لـ S4 من S1 و S2 و S3، وهي:
حيث يمكن الحصول علىوبالإشارة إلى دليل CRC للكيمياء والفيزياء، بقيم تبلغ 0.317 eV و 0.075 eV، على التوالي.يمكن اشتقاقها من حسابات DFT.
حيثوهما الطاقات الحرة للنظام بعدالامتصاص على اللوح، وطاقة الجزيء الغازيوطاقة اللوح، على التوالي.وتمثل الإمكانيات الكيميائية لـو، على التوالي. تتضمن حساباتالإمكانيات الكيميائية للبروتونات والإلكترونات. لذلك، حتى عند استخدام طاقةكمرجع لحساب امتصاص النترات، تظل هذه العملية تعتمد على الإمكانيات.
بالإضافة إلى ذلك، لأخذ إزالة النيتريت في الاعتبار، فإن طاقة النيتريت مطلوبة أيضًا. بالمثل، يتم اشتقاق طاقة النيتريت باستخدام بيانات الديناميكا الحرارية من دليل CRC مع DFT لحساب الطاقة بدقة.
وفقًا لقانون هيس، يمكن اشتقاق الطاقة الحرة لـ S7 من S8 و S9 و S10، وهي:
حيث يمكن الحصول علىوبالإشارة إلى دليل CRC للكيمياء والفيزياء، بقيم تبلغ -0.198 eV و 0.069 eV، على التوالي.يمكن اشتقاقها من حسابات DFT.
حيثوهما الطاقات الحرة للنظام بعدالامتصاص على اللوح، وطاقة الجزيء الغازيوطاقة اللوح، على التوالي.وتمثل الإمكانيات الكيميائية لـو، على التوالي.
تتكون الطاقة الحرة من ثلاثة مصطلحات، كما هو موضح في المعادلة (S13)، وهي الطاقة المحسوبة بواسطة DFT ()، وطاقة النقطة الصفرية ()، والمساهمة من تغيير الإنتروبيا ():
في هذه الحالة، يتم أخذ درجة الحرارةكـ 298.15 K.
طاقة التفاعل المعتمدة على الإمكانيات
تم استخدام طريقة Nørskov للقطب الهيدروجيني الحسابي (CHE) لوصف الإمكانية الكيميائية للبروتونات والإلكترونات. بشكل محدد، باستخدام الاعتماد الخطي للطاقة الحرة على الطاقة الإلكترونية تحت هذه الإمكانية، يتم تحديد اعتماد الطاقة الحرة لزوج البروتون-إلكترون على الإمكانية الكهربائية، أي أن الطاقة الإلكترونية يتم تعويضها بـ.
هنا، يمثلالشحنة الإيجابية الأساسية، وهي الإمكانية الكهربائية بالنسبة للقطب الهيدروجيني القابل للعكس (RHE). بالنسبة لعملية البروتنة، ستخضع حاجز الطاقة الحرة لهاللتغييرات التالية:
حيث،هي الإمكانية الكهربائية بالنسبة لـ RHE. تحت جهد اختزال أكثر سلبية، تصبح عملية البروتنة أكثر ملاءمة.
بالنسبة لعملية امتصاص أيون النترات وعملية إزالة أيون النيتريت، ستخضع حواجز الطاقة الحرة لها للتغييرات التالية:
تحت جهد اختزال أكثر سلبية، تصبح عملية امتصاص أيون النترات أكثر صعوبة، بينما تصبح عملية إزالة أيون النيتريت أكثر ملاءمة. في الوقت نفسه، تصبح عملية البروتنة أسهل نسبيًا.
محاكاة الإمكانية الثابتة
لأخذ الظروف الفعلية للتفاعل، مثل الرقم الهيدروجيني والإمكانية الكهربائية، بعين الاعتبار بدقة أكبر، اعتمدنا على طريقة الإشارة المزدوجة التي طورها دوآن وآخرون لدراسة طاقة. توضح هذه الطريقة المواقع النشطة الحفازة الجوهرية والنشاط المعتمد على الرقم الهيدروجيني لـتحت ظروف التفاعل الفعلية. يتم تنفيذ نموذج الذوبان الضمني من خلال VASPsol. تم تعيين ثابت العزل النسبي إلى 80 لمحاكاة الإلكتروليت المائي. يقوم VASPsol بتعيين قيمة معلمة توتر السطح الفعالة إلى 0، مما يتجاهل مساهمة طاقة التجويف. تم محاكاة الشحنة التعويضية بواسطة نموذج بواسون-بولتزمان الخطي مع طول ديباي يبلغ 3.0 Å. لتوضيح آلية التفاعل تحت إمكانيات كهربائية مختلفة، قمنا بضبط كميات متغيرة من الشحنة الزائدة (q)، تتراوح من -2.0 e إلى +2.0 e بزيادات قدرها +0.5 e.
تكون الطاقة الحرة تحت التجمع الكبير المعتمد على الإمكانيات كما يلي:
حيث يمثلالطاقة الحرة تحت التجمع الكبير،هي الطاقة المشتقة من حسابات DFT،هي متوسط الإمكانية الكهروستاتيكية للنموذج،هي وظيفة العمل للنظام المشحون، وهي عدد الإلكترونات المدخلة في النظام.
يمكن تحديد الإمكانية الكهربائية بالنسبة للقطب الهيدروجيني القياسي (SHE) من وظيفة العمل للنظام.
حيث 4.6 V هي الإمكانية الكهربائية المطلقة المرجعية للقطب الهيدروجيني القياسي (SHE) في VASPsol.
يوجد علاقة دالة تربيعية بينو
حيث يمثلسعة النظام.وهما الإمكانية الكهربائية والطاقة الحرة، على التوالي، بالنسبة لـ SHE في نظام بدون شحنة. يمكن تبسيط الشكل الرأسي لعلاقة الدالة التربيعية إلى الشكل القياسي لدالة تربيعية، حيثوهما المعلمات التي تحتاج إلى التناسب. بعد الحصول علىتحت ظروف التفاعل الفعلية، يمكن استبدالفي المعادلة (S13) بـلتمثيل الطاقة الحرة تحت الإمكانية الثابتة.
حاجز طاقة التنشيط المعتمد على الإمكانيات
ابتكر Akhade وآخرون طريقة لمعالجة طاقات التنشيط التي تختلف مع الإمكانية.
بالنسبة للبروتنة السطحية غير الكهروكيميائية:
يسمح استخدام DFT لحساب هندسة الطاقة الدنيا وحالة الانتقال للهيدروجين للمتفاعلات بتحديد طاقة التنشيط () للعمليات خارج البروتنة السطحية الكهروكيميائية. بالنسبة للتفاعل، فإن طاقة التنشيط، الممثلة بـتعادل Ea. عندالإمكانية التوازنية، تجد الحالةالتي لا تتشابه كهروميكانيكيًا توازنها مع النظير الكهروكيميائي،). في هذا السياق، يتوافقمع الطاقة الحرة لامتصاص الهيدروجين () عند سطح معين مقاسة عند 0 V مقابل RHE. يمكن حساب تغير الطاقة الحرة لعملية الهيدروجين الكهروكيميائية على السطح باستخدام الصيغةe. يُفترض أن طاقة التنشيط الأمامية عند الإمكانية U تلتزم بصيغة بتلر-فولمر، مع الأخذ في الاعتبار نقل n إلكترونات:
في هذه الدراسة، قمنا بتثبيتعند 0.5 عبر جميع الخطوات الأساسية، وهو اختيار تم التحقق منه بشكل متكرر كاقتراب عملي.
محاكاة الميكروكينتيك
استخدمت تحقيقاتنا محاكاة ميكروكينتيك شاملة لتفكيك آليات التفاعل السطحي المعنية في عمليات تقليل النترات. في البداية، قمنا بتحديد الثوابت المعدلة للأمام والعكسية للتفاعلات الأساسية المعنية، المشتقة عبر معادلة أرهينيوس الكلاسيكية. علاوة على ذلك، تم حساب معدلات الامتصاص للامتصاص الجزيئي غير المنشط وفقًا لمعادلة هيرتز-كنودسن، مع الأخذ في الاعتبار معدلات التصادم لجزيئات الطور الغازي مع السطح.
تم استخدام مجموعة برامج النمذجة الميكروكينية MKMXXC لمحاكاة معدلات اختزال النترات تحت ظروف قياسية، تحديدًا عند درجة حرارة تفاعل تبلغ 300 كلفن ونسبة مولية من النترات إلى البروتون تبلغ 1:1. لكل خطوة تفاعل تم اعتبارها في نموذجنا، تم صياغة معادلة تفاضلية مقابلة، تتضمن الضغوط الجزئية للمواد المتفاعلة وتغطية الأنواع السطحية.
لتحقيق تغطيات سطحية في حالة الاستقرار، تم دمج هذه المعادلات التفاضلية على مدى فترة طويلة حتى أصبحت التغيرات في التغطية السطحية ضئيلة للغاية (أقل منوبذلك نضمن دقة محاكياتنا. بعد ذلك، تم حساب معدلات التفاعل لكل خطوة أساسية بناءً على هذه التغطيات السطحية في حالة الاستقرار.
سمح لنا هذا النهج الصارم ببناء نموذج ميكروكينتيكي معقد لتفاعل اختزال النترات، موضحًا كل خطوة أساسية ومساهماتها في مسار التفاعل الكلي. علاوة على ذلك، قدم نظرة ميكروسكوبية على الأسس الميكانيكية لعملية اختزال النترات.
طريقة النمو البطيء
تم حساب حواجز الطاقة الحرة في المحاكاة باستخدام كل من الديناميكا الجزيئية من أولى المبادئ (AIMD) وطريقة النمو البطيء ضمن مجموعة كانونية (NVT)، التي تنظمها ثيرموستات نوز هوفر عند درجة حرارة ثابتة تبلغ 300 كلفن وخطوة زمنية قدرها 1.0 فيمتوثانية. تعتمد طريقة النمو البطيء على المعامل الهندسيمتغير جماعي (CV)، يتم تغييره من حالة أولية (إلى حالة نهائية ) بسرعة محددة للتحول ( ). فرق الطاقة الحرة هلمهولتز ( ) يتم حسابه من خلال تكامل مشتق الطاقة الكامنة بالنسبة لـ على مدى مدة المحاكاة، والتي، في حدها الأدنى، تكون صغيرة بشكل غير ملحوظيتوافق مع فرق الطاقة الحرة لجيبس (بين الحالة الابتدائية والحالة النهائية. تتضمن المعلمات التفصيلية لهذه الطريقة المطبقة على تفاعلات أولية مختلفة في المواد التكميلية.
تم استخدام دورة حرارية لحساب الطاقة الحرة لجيبس للامتزاز لـ و في الطور الغازي. تم الحصول على القيم الديناميكية الحرارية ذات الصلة من دليل CRC للكيمياء والفيزياء. تتضمن الدورة حساب اختلافات الطاقة الحرة لجيبس لعمليات الامتزاز لـ و مع القيم الطاقية المعنية المشار إليها بوضوح في المخططات المقدمة.
توفر البيانات
البيانات الخام للأرقام في المخطوطة الرئيسية متاحة في figshare مع المعرف(ات) https://doi.org/10.6084/m9.figshare. 25124129. جميع البيانات الأخرى اللازمة لتقييم الاستنتاجات في الورقة موجودة في الورقة والمعلومات التكميلية أو يمكن الحصول عليها من المؤلفين المقابلين عند الطلب.
توفر الشيفرة
يمكن الحصول على الشيفرة المستخدمة في هذا العمل من المؤلفين المعنيين عند الطلب.
References
Yu, C. Q. et al. Managing nitrogen to restore water quality in China. Nature 567, 516-520 (2019).
Su, L. H. et al. Electrochemical nitrate reduction by using a novel cathode. Water Res. 120, 1-11 (2017).
Yao, F. B. et al. Highly selective electrochemical nitrate reduction using copper phosphide self-supported copper foam electrode:
Performance, mechanism, and application. Water Res. 193, 116881 (2021).
4. Murphy, A. P. Chemical Removal of Nitrate from Water. Nature 350, 223-225 (1991).
5. Deng, Z. Q. et al. High-efficiency ammonia electrosynthesis on selfsupported nanoarray in neutral media by selective reduction of nitrate. Chem. Eng. J. 435, 135104 (2022).
6. Wang, Y. T. et al. Structurally disordered nanosheets with rich oxygen vacancies for enhanced nitrate electroreduction to ammonia. Angew. Chem. Int. Ed. 61, e202218717 (2022).
7. Wang, J. et al. Nanodenitrification with bimetallic nanoparticles confined in N-doped mesoporous carbon. Environ. Sci.: Nano 7, 1496-1506 (2020).
8. Ma, J. et al. Electrochemical reduction of nitrate in a catalytic carbon membrane nano-reactor. Water Res 208, 117862 (2022).
9. Xu, H., Ma, Y. Y., Chen, J., Zhang, W. X. & Yang, J. P. Electrocatalytic reduction of nitrate – a step towards a sustainable nitrogen cycle. Chem. Soc. Rev. 51, 2710-2758 (2022).
10. Chen, G. F. et al. Electrochemical reduction of nitrate to ammonia via direct eight-electron transfer using a copper-molecular solid catalyst. Nat. Energy 5, 605-613 (2020).
11. Li, Z., Wang, W., Qian, Q. & Zhu, Y. Magic hybrid structure as multifunctional electrocatalyst surpassing benchmark Pt/C enables practical hydrazine fuel cell integrated with energy-saving production. eScience 4, 416-427 (2022).
12. Wen, G. L. et al. nanosheet array for high-efficiency electrohydrogenation of nitrite to ammonia at ambient conditions. J. Colloid Interface Sci. 606, 1055-1063 (2022).
13. Jiang, H. F. et al. Enabled efficient ammonia synthesis and energy supply in a zinc-nitrate battery system by separating nitrate reduction process into two stages. Angew. Chem. Int. Ed. 62, e202218717 (2023).
14. Suryanto, B. H. R. et al. Challenges and prospects in the catalysis of electroreduction of nitrogen to ammonia. Nat. Catal. 2, 290-296 (2019).
15. Liu, H. M. et al. Efficient electrochemical nitrate reduction to ammonia with copper-supported rhodium cluster and single-atom catalysts. Angew. Chem. Int. Ed. 61, e202202556 (2022).
16. Foster, S. L. et al. Catalysts for nitrogen reduction to ammonia. Nat. Catal. 1, 490-500 (2018).
17. Han, S. H. et al. Ultralow overpotential nitrate reduction to ammonia via a three-step relay mechanism. Nat. Catal. 6, 402-414 (2023).
18. van Langevelde, P. H., Katsounaros, I. & Koper, M. T. M. Electrocatalytic nitrate reduction for sustainable ammonia production. Joule 5, 290-294 (2021).
19. Fan, K. et al. Active hydrogen boosts electrochemical nitrate reduction to ammonia. Nat. Commun. 13, 7958 (2022).
20. Kim, K. H. et al. Energy-efficient electrochemical ammonia production from dilute nitrate solution. Energy Environ. Sci. 16, 663-672 (2023).
21. He, W. H. et al. Splicing the active phases of copper/cobalt-based catalysts achieves high-rate tandem electroreduction of nitrate to ammonia. Nat. Commun. 13, 1129 (2022).
22. Chen, F. Y. et al. Efficient conversion of low-concentration nitrate sources into ammonia on a Ru-dispersed Cu nanowire electrocatalyst. Nat. Nanotechnol. 17, 759-767 (2022).
23. Zhao, C. M. et al. In situ topotactic transformation of an interstitial alloy for CO electroreduction. Adv. Mater. 32, 2002382 (2020).
24. Lee, D. et al. Copper nitride nanowires printed li with stable cycling for li metal batteries in carbonate electrolytes. Adv. Mater. 32, 1905573 (2020).
25. Zhang, B. X. et al. Highly electrocatalytic ethylene production from on nanodefective Cu nanosheets. J. Am. Chem. Soc. 142, 13606-13613 (2020).
26. Guo, N. K. et al. Achieve superior electrocatalytic performance by surface copper vacancy defects during electrochemical etching process. Angew. Chem. Int. Ed. 59, 13778-13784 (2020).
27. Zhang, Y. Z., Chen, X., Wang, W. L., Yin, L. F. & Crittenden, J. C. Electrocatalytic nitrate reduction to ammonia on defective (111) single-atom alloys. Appl. Catal. B 310, 121346 (2022).
28. Liu, S. Q., Gao, M. R., Liu, S. B. & Luo, J. L. Hierarchically assembling cobalt/nickel carbonate hydroxide on copper nitride nanowires for highly efficient water splitting. Appl. Catal. B 292, 120148 (2021).
29. Krbal, M. et al. Detection of N-Te bonds in the as-deposited amorphous nitrogen-doped GeTe-based phase change alloys using N K-edge XANES spectroscopy and their impact on crystallization. J. Colloid Interface Sci. 704, 254-259 (2017).
30. Zhuang, T. T. et al. Steering post-C-C coupling selectivity enables high efficiency electroreduction of carbon dioxide to multi-carbon alcohols. Nat. Catal. 1, 421-428 (2018).
31. Mavridou, K. et al. Oxidation of thin films obtained from Cu annealed under flow: A Raman and N-K-edge NEXAFS study. J. Alloy. Compd. 914, 165293 (2022).
32. Zhao, Y. et al. Elucidating electrochemical CO2 reduction reaction processes on Cu(hkl) single-crystal surfaces by in situ Raman spectroscopy. Energy Environ. Sci. 15, 3968-3977 (2022).
33. Wang, Y. T., Zhou, W., Jia, R. R., Yu, Y. F. & Zhang, B. Unveiling the activity origin of a copper-based electrocatalyst for selective nitrate reduction to ammonia. Angew. Chem. Int. Ed. 59, 5350-5354 (2020).
34. Yin, H. B. et al. Alloying effect-induced electron polarization drives nitrate electroreduction to ammonia. Chem. Catal. 1, 1088-1103 (2021).
35. Zhang, L. L., Ding, L. X., Chen, G. F., Yang, X. F. & Wang, H. H. Ammonia synthesis under ambient conditions: selective electroreduction of dinitrogen to ammonia on black phosphorus nanosheets. Angew. Chem. Int. Ed. 58, 2612-2616 (2019).
36. Yu, W. L., Lewis, N. S., Gray, H. B. & Dalleska, N. F. Isotopically selective quantification by UPLC-MS of aqueous ammonia at submicromolar concentrations using dansyl chloride derivatization. ACS Energy Lett. 5, 1532-1536 (2020).
37. Lv, C. D. et al. Selective electrocatalytic synthesis of urea with nitrate and carbon dioxide. Nat. Sustain. 4, 868-876 (2021).
38. Hu, C. Y. et al. Surface plasmon enabling nitrogen fixation in pure water through a dissociative mechanism under mild conditions. J. Am. Chem. Soc. 141, 7807-7814 (2019).
39. Rosca, V. & Koper, M. T. M. Mechanism of electrocatalytic reduction of nitric oxide on Pt(100). J. Phys. Chem. B 109, 16750-16759 (2005).
40. Qin, J. Z. et al. Achieving high selectivity for nitrate electrochemical reduction to ammonia over MOF-supported clusters. J. Mater. Chem. A 10, 3963-3969 (2022).
41. Hammer, B. & Norskov, J. K. Why gold is the noblest of all the metals. Nature 376, 238-240 (1995).
42. Norskov, J. K., Abild-Pedersen, F., Studt, F. & Bligaard, T. Density functional theory in surface chemistry and catalysis. Proc. Natl. Acad. Sci. USA 108, 937-943 (2011).
43. Yang, H. et al. Intermediates adsorption engineering of electroreduction reaction in highly selective heterostructure Cu-based electrocatalysts for CO production. Adv. Energy Mater. 9, 1901396 (2019).
44. Zhang, X. et al. Optimum Cu nanoparticle catalysts for CO2 hydrogenation towards methanol. Nano Energy 43, 200-209 (2018).
45. Zheng, Y. et al. High electrocatalytic hydrogen evolution activity of an anomalous ruthenium catalyst. J. Am. Chem. Soc. 138, 16174-16181 (2016).
46. Li, Y., Wei, X. F., Han, S. H., Chen, L. S. & Shi, J. L. MnO2 electrocatalysts coordinating alcohol oxidation for ultra-durable hydrogen
and chemical productions in acidic solutions. Angew. Chem. Int. Ed. 60, 21464-21472 (2021).
47. Li, S. L. et al. Reconstruction-induced NiCu-based catalysts towards paired electrochemical refining. Energy Environ. Sci. 15, 3004-3014 (2022).
48. Ye, S. H. et al. Elucidating the activity, mechanism and application of selective electrosynthesis of ammonia from nitrate on cobalt phosphide. Energy Environ. Sci. 15, 760-770 (2022).
49. Niu, Z. D. et al. Tailored electronic structure by sulfur filling oxygen vacancies boosts electrocatalytic nitrogen oxyanions reduction to ammonia. Chem. Eng. J. 451, 138890 (2023).
50. Bernal, E. E. L., Maya, C., Valderrama, C. & Cortina, J. L. Valorization of ammonia concentrates from treated urban wastewater using liquid-liquid membrane contactors. Chem. Eng. J. 302, 641-649 (2016).
51. Liao, P. H., Chen, A. & Lo, K. V. Removal of nitrogen from swine manure wastewaters by ammonia stripping. Bioresour. Technol. 54, 17-20 (1995).
شكر وتقدير
يقر G. Q. Z. بمؤسسة العلوم الطبيعية الوطنية في الصين (رقم المنحة 52072359)، وبرنامج توظيف الخبراء العالميين، وصندوق البحث الأساسي للجامعات المركزية (WK2060000016). تم إجراء الحسابات العددية في هذه الورقة في مركز الحوسبة الفائقة بجامعة العلوم والتكنولوجيا في الصين. يعرب المؤلفون عن امتنانهم لخط الأشعة تحت الحمراء (BLO1B) في المختبر الوطني للإشعاع المتزامن لدعم وقت التجربة. تم تنفيذ هذا العمل جزئيًا في مركز أدوات العلوم الفيزيائية، جامعة العلوم والتكنولوجيا في الصين.
مساهمات المؤلفين
ساهم B.C.Z. و Z.C.D. و G.Q.Z. في تصور الدراسة. قام B.C.Z. بإجراء التجارب. أجرى Y.X.C. تحليل حسابات نظرية الكثافة الوظيفية (DFT). قدم M.Y.C. المساعدة في تحليل المجهر الإلكتروني الماسح (SEM)، وساعد H.K.Z. في تحليل طيف الأشعة تحت الحمراء التحويلي (FTIR) الكهروكيميائي في الموقع. قدم P.Y.F. و K.B.Q. و Y.Y.Z. المساعدة في الجزء التجريبي. ساهم G.Q.Z. بشكل كبير في التحليل. وإعداد المخطوط. تم الإشراف على المشروع من قبل G.Q.Z. شارك جميع المؤلفين في التحليل من خلال مناقشات بناءة.
المصالح المتنافسة
يعلن المؤلفون عدم وجود مصالح متنافسة.
معلومات إضافية
معلومات إضافية النسخة الإلكترونية تحتوي على المواد التكميلية متاحة على https://doi.org/10.1038/s41467-024-47025-w. يجب توجيه المراسلات والطلبات للحصول على المواد إلى جينكيانغ تشانغ.
معلومات مراجعة الأقران تشكر مجلة ناتشر كوميونيكيشنز مينغفي شاو والمراجعين الآخرين المجهولين على مساهمتهم في مراجعة هذا العمل. يتوفر ملف مراجعة الأقران.
معلومات إعادة الطباعة والتصاريح متاحة على http://www.nature.com/reprints ملاحظة الناشر: تظل شركة سبرينغر ناتشر محايدة فيما يتعلق بالمطالبات القضائية في الخرائط المنشورة والانتماءات المؤسسية.
مركز هيفي الوطني للبحوث في العلوم الفيزيائية على المقياس المجهري، مختبر المواد لتحويل الطاقة التابع للأكاديمية الصينية للعلوم، قسم علوم المواد والهندسة، جامعة العلوم والتكنولوجيا في الصين، هيفي، آنهوي 230026، الصين.ساهم هؤلاء المؤلفون بالتساوي: بوشينغ تشانغ، زيشوان داي، يانكسو تشين.البريد الإلكتروني: gqzhangmse@ustc.edu.cn
Nitrate can be electrochemically degraded to produce ammonia while treating sewage while it remains grand challenge to simultaneously realize high Faradaic efficiency and production rate over wide-range concentrations in real wastewater. Herein, we report the defect-rich Cu nanowire array electrode generated by in-situ electrochemical reduction, exhibiting superior performance in the electrochemical nitrate reduction reaction benefitting from the triple synergistic modulation. Notably, the defect-rich Cu nanowire array electrode delivers current density ranging from 50 to across wide nitrate concentrations ( ) with Faradaic efficiency over . Operando Synchrotron radiation Fourier Transform Infrared Spectroscopy and theoretical calculations revealed that the defective Cu sites can simultaneously enhance nitrate adsorption, promote water dissociation and suppress hydrogen evolution. A two-electrode system integrating nitrate reduction reaction in industrial wastewater with glycerol oxidation reaction achieves current density of at -1.4 V with ammonia selectivity and nitrate conversion with 100 h stability, demonstrating outstanding practicability.
Nitrate is widely found in industrial wastewater and groundwater due to the excessive use of chemical fertilizers and industrial contamination . Excessive nitrates can disrupt the global nitrogen balance, and their incomplete conversion to nitrites in the body may cause cancer in humans . Electrochemical reduction of nitrate to non-toxic nitrogen is considered an environmentally friendly route with mild reaction conditions . However, this method is energyintensive and lacks value-added benefits . Ammonia, as a multifunctional chemical, is used in the manufacture of fertilizer and medicine, and is a vital carrier of clean energy . Electrochemical nitrate reduction ( ) can be employed for distributed production of
green ammonia under mild conditions and driven by locally generated clean energy, which has garnered widespread attention .
Nitrate concentrations in waste streams span a broad range, from 1 to . However, most studies have focused on performance under high nitrate concentrations and theoretical conditions, struggling to achieve satisfactory performance in scenarios with varying nitrate concentrations, particularly under low concentrations where strong HER is present . The scientific community has increasingly recognized the significance of low-concentration nitrate reduction. For instance, Kang et al. made a significant contribution by developing a LDH/Cu foam for the reduction of low-concentration nitrate,
achieving a commendable FE with at . Nonetheless, the performance experienced a dip at 1 mM and 2 mM , recording and at and , respectively, signaling an opportunity for further optimization. Additionally, Junqueira et al. achieved a notable enhancement in FE across a wide concentration range of 1 to 100 mM using a synthesized CuCoSP catalyst, a notable advancement in this field . However, the current density, ranging from 8 to , could be a limiting factor for its practical application. Simultaneously, the research on reduction of nitrate to produce ammonia in authentic wastewater is rare and challenging . It is evident that, at low nitrate concentrations, vigorous hydrogen evolution restricts high FE and yield . At typical nitrate concentrations, the insufficient supply of active may limit the achievement of industrial-level current . Therefore, we aim to concurrently address the issues of strong hydrogen evolution at low concentrations and the scarcity of active supply at typical nitrate concentrations, thus enabling the efficient reduction of real waste streams with a wide range of nitrate concentrations.
Herein, we present defect-rich Cu nanowire array electrode (V-Cu NAE) synthesized through in-situ electrochemical reduction of NWs, achieving current densities ranging from 50 to across nitrate concentrations ranging from 1 to 100 mM and maintaining over FE for degrading nitrate levels in compliance with World Health Organization (WHO) drinking water standards. Operando Synchrotron radiation-FTIR and density functional theory (DFT) calculations reveal that a triple synergistic modulation, including enhanced nitrate adsorption, promoted water dissociation, and suppressed hydrogen evolution, contributes to the exceptional performance across a broad nitrate concentration range. Furthermore, a two-electrode system integrating nitrate reduction reaction ( ) and glycerol oxidation reaction (GOR) in authentic lowconcentration industrial wastewater exhibits at -1.4 V , with exceptional ammonia selectivity as high as , superior nitrate conversion of , and outstanding stability for 100 h , while successfully achieving high-purity product collection in form of both and .
Results
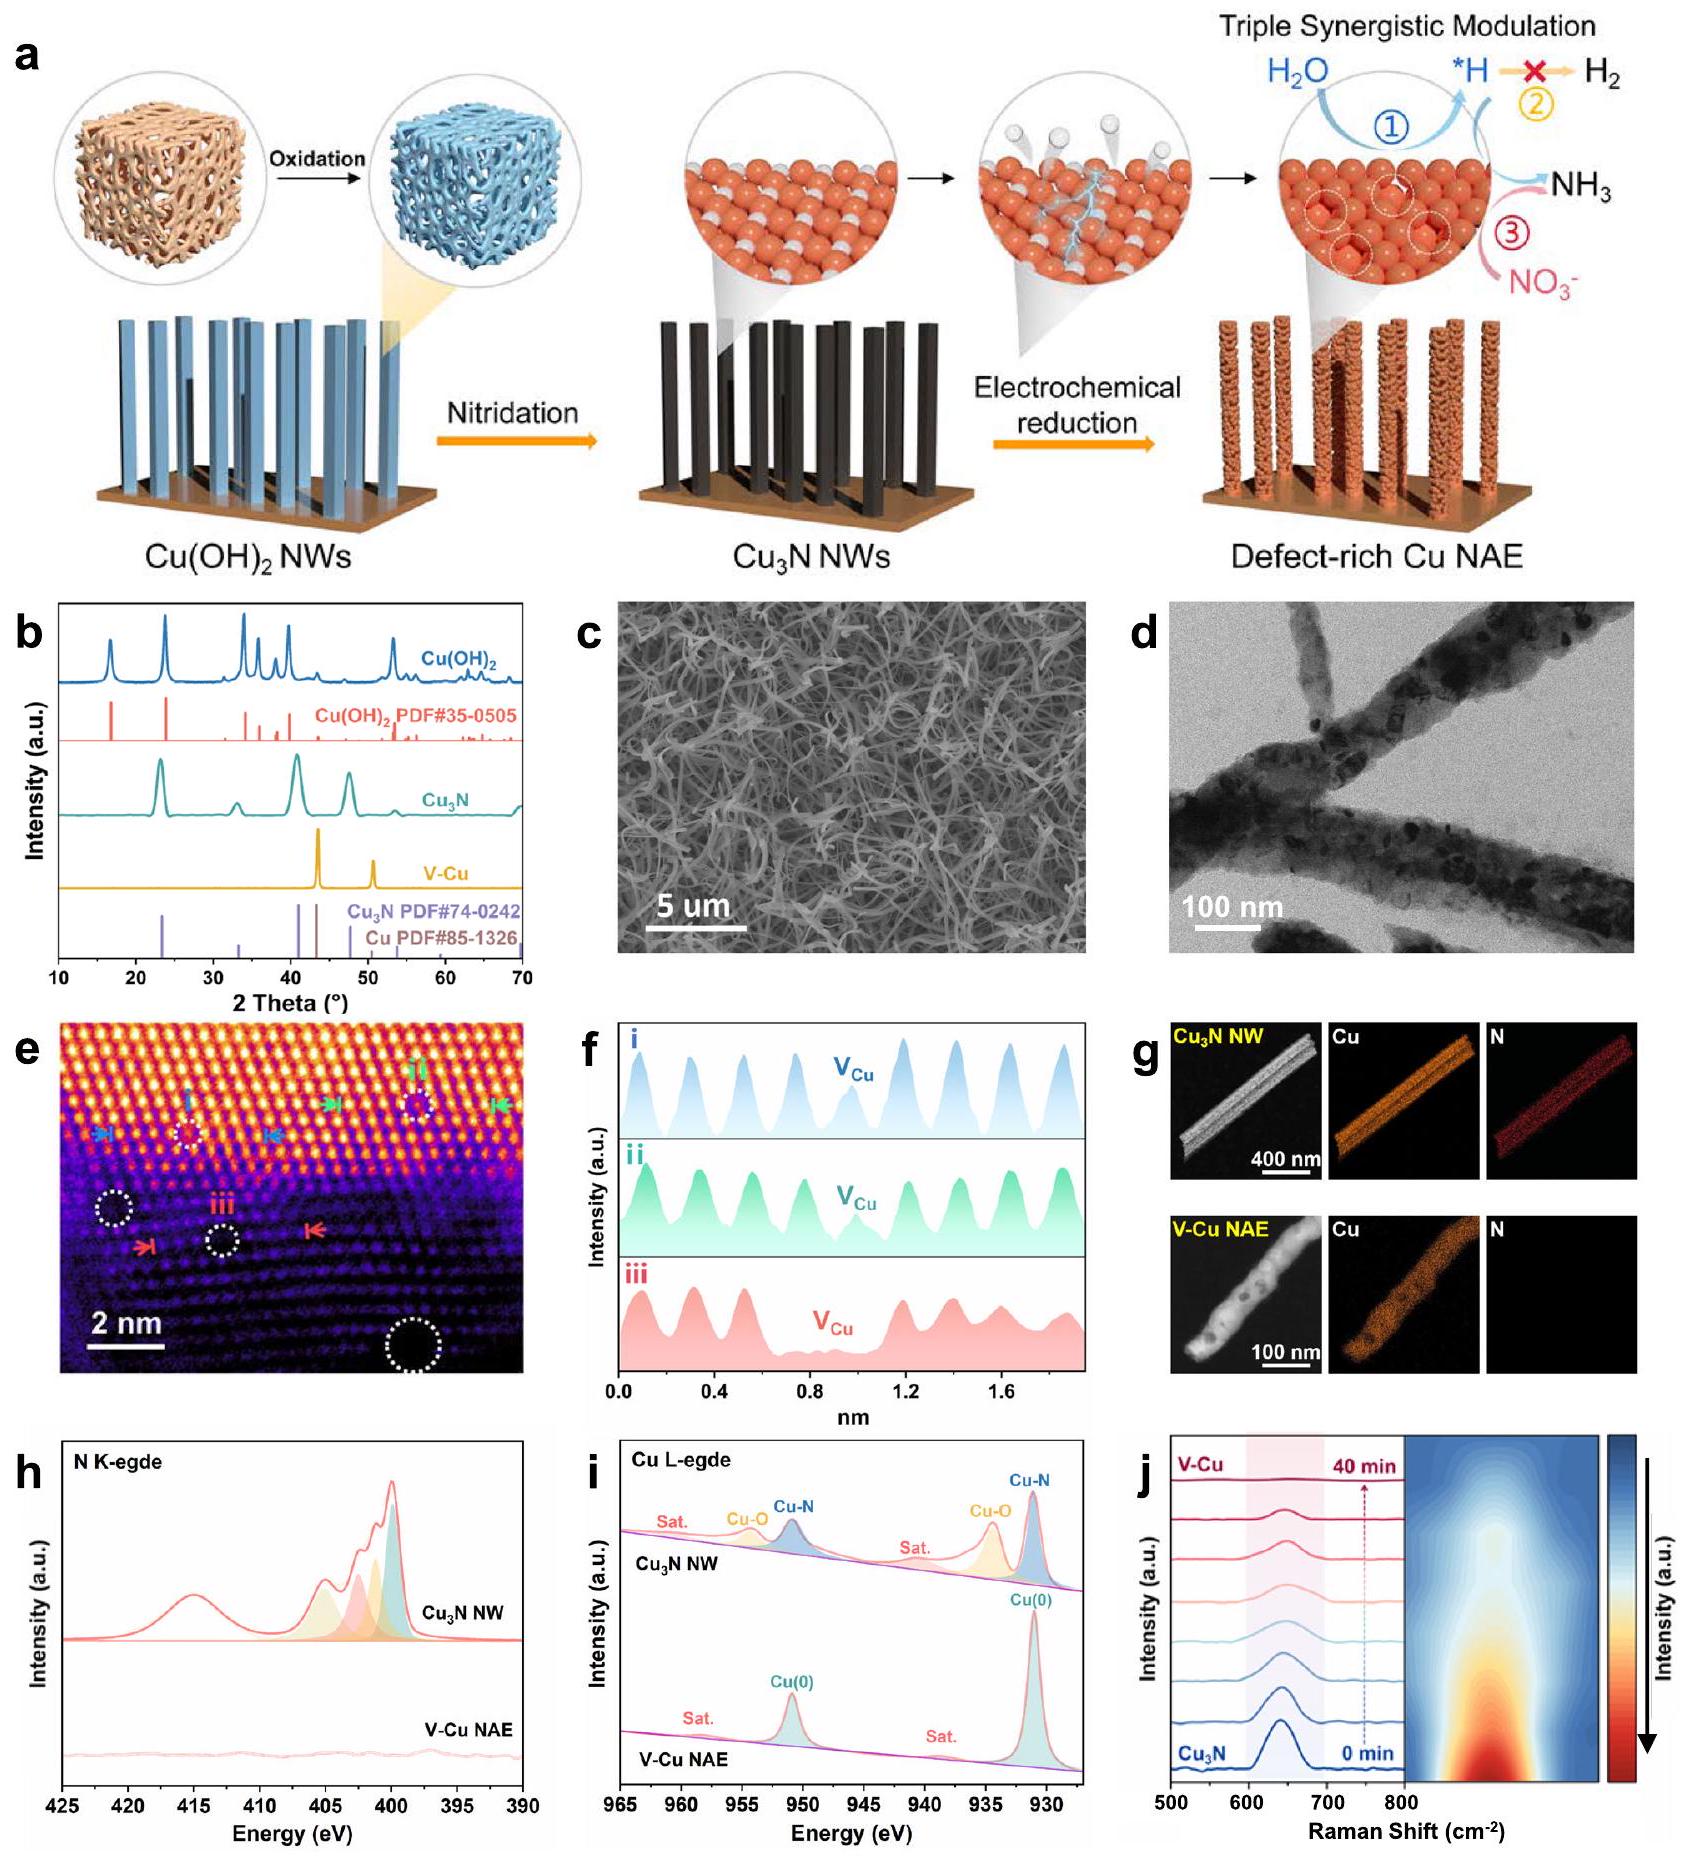
Copper hydroxide nanowires ( ) were prepared by oxidizing copper foam, which were then sintered under ammonia or hydrogen gas to obtain copper nitride nanowires ( NWs) and Copper nanowires without defects (Cu NWs). Defective copper nanowire array electrode (V-Cu NAE) was obtained by in-situ electrochemical reduction of NWs in potassium sulfate solution (Fig. 1a). The powder X-ray diffraction (XRD) analysis (Fig. 1b) confirmed the successful synthesis of NWs and their complete conversion to pure Cu phase after in-situ electrochemical reduction . Fieldemissions scanning electron microscopy (FESEM) and highresolution transmission electron microscopy (HRTEM) were used to characterize the morphological transition from to NWs, and finally to V-Cu NAE (Fig. 1c, d). The morphology of NWs (Supplementary Fig. 1) mirrored that of NWs (Supplementary Fig. 2). Notably, upon electrochemical reduction, V-Cu NAE exhibited bending and formed defect-rich black pits, which marked a clear distinction from NWs (Fig. 1e). Figure 1c shows an array of defective copper nanowires, where HRTEM (Fig. 1d) reveals dark pits on their surfaces, signifying agglomerations of copper vacancies . To investigate the nature and distribution of these defects more comprehensively, we utilized Cs-corrected TEM techniques. In our analysis showcased in Fig. 1e, we demarcate Cu vacancies using distinct circles, shedding light on their pervasive presence across the sample . Building upon this visualization, we conducted an intensity contour analysis on the atoms situated between the arrows in regions i, ii and iii, as illustrated in Fig. 1f. Our observations underscore that the intensity in the Cu vacancies and agglomeration areas is discernibly lower than
in the surrounding intact lattice regions, bolstering the assertion of a significant presence of Cu vacancies .
Energy-Dispersive X-ray Spectroscopy (EDS) (Fig. 1g) indicated that is completely eliminated after electrochemical reduction, resulting in the transformation of NWs to V-Cu NAE. Synchrotron radiation X-ray absorption near edge structure (XANES) (Fig. 1h) and X-ray photoelectron spectroscopy (XPS) (Supplementary Figs. 3, 4) failed to detect any significant signal of N in V-Cu NAE . In the XANES of V-Cu NAE (Fig. 1i), the peaks at 931.0 and 950.9 eV were attributed to and of metallic Cu phase . The in-situ Raman analysis clearly illustrates (Fig. 1j and Supplementary Fig. 5) illustrates the sequential diminishment and ultimate disappearance of the Raman peak, implying the formation of metallic . Building upon these analyses, XPS results for the V-Cu NAE showed that the and peaks shifted by 0.13 eV and 0.17 eV , respectively, when compared to those of Cu NWs (Supplementary Fig. 6). Such peak shifts might be attributed to the interaction between the metal vacancies and electrons.
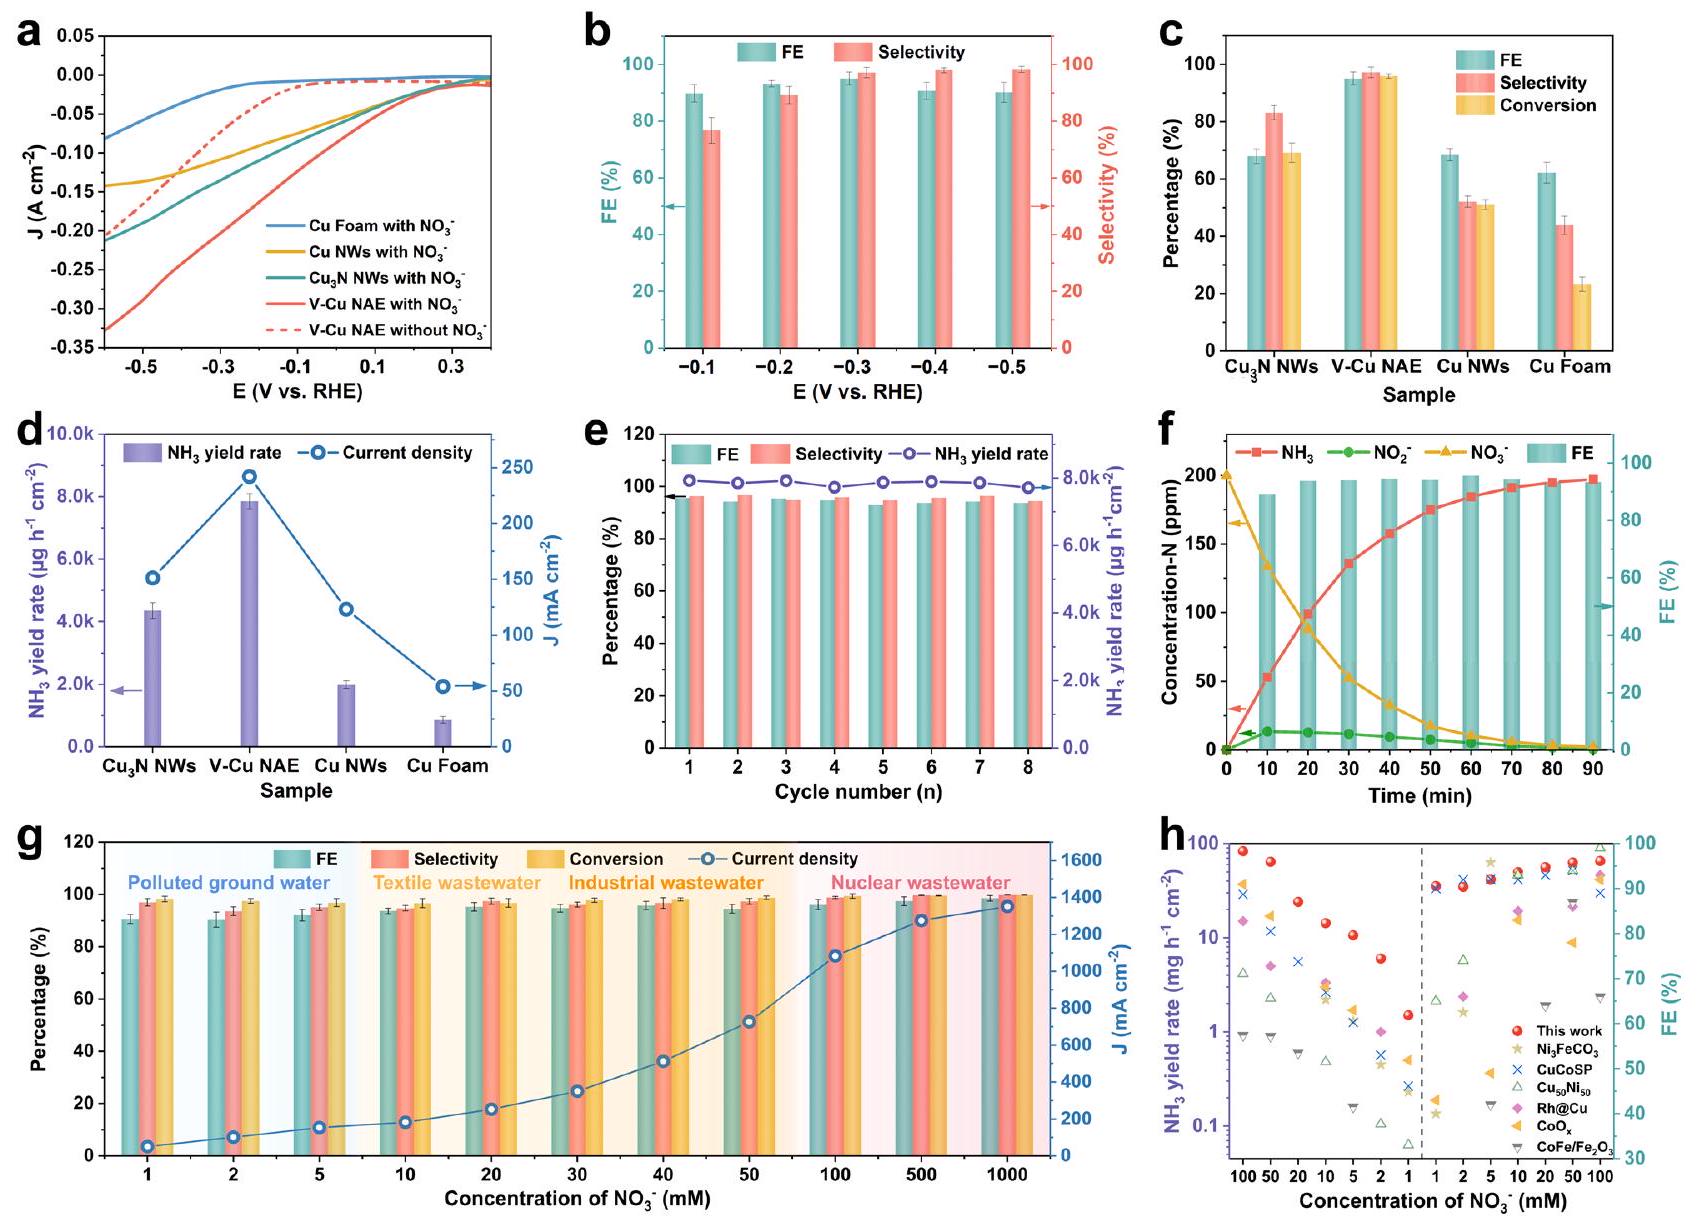
The performance of the sample was firstly evaluated by using a electrolyte in a typical three-electrode H-type cell (see Supplementary Fig. 7 for the setup), with the working electrode having an area of (catalysts loading was ). The resulting ammonia, nitrite and residual nitrate were detected by ultravioletvisible (UV/Vis) absorbance spectra (Supplementary Fig. 8) . As shown in Fig. 2a, the current density of V-Cu NAE increased significantly with the addition of in the electrolyte, and it is clearly that the V-Cu NAE exhibited the most impressive performance compared with Cu foam, Cu nanowires and nanowire arrays. The calculated FE and selectivity of ammonia production for the potential ranging from -0.1 to -0.5 V (vs. RHE) (Fig. 2b) showed a volcanic trend, reaching the best performance at -0.3 V (vs. RHE) with FE of , selectivity of and conversion as high as after 1 h catalysis which is superior compared to that of NWs (FE , selectivity , conversion ) and Cu NWs (FE , selectivity , conversion ). Within the potential range of -0.1 to -0.5 V (vs. RHE), both NWs and Cu NWs also exhibited lower FE and selectivity compared to V-Cu NAE (Supplementary Fig. 9). The production rate of the V-Cu NAE was calculated to be at -0.3 V during 1 h of electrolysis, which is much higher than that of the comparing samples (Fig. 2d). Furthermore, the stability of the catalyst can be well evidenced by repeated cycle measurement at -0.3 V for each 1 h cycle, where no visible decay can be observed for FE, selectivity and ammonia production rate within eight cycles (Fig. 2e).
To evaluate the practicability, the nitrate removal ability of the catalyst was conducted at -0.3 V on simulated wastewater containing -N. As shown in Fig. 2f, the concentrations of both and could be degraded to 2.1 ppm and 0.52 ppm after 90 mins , which is much lower than WHO drinking water standards ( ppm and ). Importantly, the FE remained above and the nitrate conversion rate can reach with a high selectivity of for ammonia production, which demonstrates the excellent nitrate wastewater treatment capacity. Given the fact that the levels in waste streams under different scenario may vary from 1 to 1000 mM , it is necessary for the catalyst to exhibit excellent performance across a wide range of concentrations . Of the various waste streams, textile wastewater and industrial wastewater, with concentrations ranging from 10 to 50 mM , present a wide range of sources and high utilization value . However, a low concentration might lead to low current density and strong competitive HER. Consequently, we first simulated the degradation of wastewater with concentrations ranging from 10 to 50 mM . As shown in Fig. 2g, the V-Cu NAE can deliver current density ranging from in the concentration ranges of 10 to 50 mM at -0.3 V , while maintaining over as nitrate was reduced to the
Fig. 1 | Schematic formation process, morphological and structural characterizations of the V-Cu NAE. a Schematic illustration of the formation process. b XRD patterns, (c) SEM, (d) HRTEM, (e) double Spherical Aberration-corrected HAADF-STEM image of V-Cu NAE, with the circled areas indicating Cu vacancies. Intensity profile of the Cu atoms between the two arrows in regions i , ii and iii
of (e). EDS mapping of NWs and V-Cu NAE. Synchrotron radiation soft XANES of NWs and V-Cu NAE: (h) N K-edge spectra and (i) Cu L-edge spectra. j In situ Raman spectroscopy of the electrochemical reduction of to and its contour map corresponding to the range. Color scale with arrow indicating the change in signal intensity from low to high.
concentration range of drinking water. Furthermore, even at ultralow nitrate concentration (polluted ground water) at -0.2 V , the V-Cu NAE exhibited high nitrate conversion and FE. Meanwhile, under high nitrate concentrations ( 0.1 to 1 M liquid nuclear waste) at -0.4 V , the V-Cu NAE displayed high current density of and more than as nitrate was reduced to the concentration range of drinking water level ( conversion). The ampere-level current could be attributed to defects promoting dissociation to
form active , which is essential for hydrogenation to produce ammonia. In conclusion, the catalyst effectively removed nitrate from various nitrate sources with FE exceeding 90% at high current density, signifying considerable potential for practical application. In comparison, the Cu NWs was suboptimal (Supplementary Fig. 10). Over widerange concentrations, all metrics – current density, FE, selectivity, and conversion rate – for Cu NWs lagged behind those of V-Cu NAE. This distinction underscores defects as a key determinant in optimizing
Fig. 2 | The electrocatalytic activity for in -cell. a – curves of Cu foam, Cu NWs, NWs and V-Cu NAE in electrolyte ( ) with (solid lines) and without (dotted line) . The scan rate for LSV was . All reactions were conducted at a temperature of with a magnetic stirring speed of 300 rpm . The measured resistance of the electrochemical cell was . b Potential-dependent Faradaic efficiency (FE, green bars) and selectivity of ammonia (green bars) over V-Cu NAE (catalysts loading was ). c FE and selectivity of ammonia and conversion rate of nitrate (yellow bars) over different samples. d The ammonia yield rate (purple bars) of as-prepared
samples at -0.3 V (vs. RHE). e The cyclic stability test of V-Cu NAE. (f) Timedependent concentration change of and FE over the V-Cu NAE at -0.3 V (vs. RHE). g Current density, FE of , selectivity of , and conversion of in different concentration nitrate sources (contaminated groundwater, textile wastewater, industrial wastewater, liquid nuclear wastes). h Comparison of ammonia yield and Faraday efficiency of V-Cu NAE with other catalysts at different nitrate concentrations. Error bars represent the standard deviations calculated from three independent measurements.
performance over wide-range concentrations. As shown in Fig. 2h, within the nitrate concentration range of , the V-Cu NAE outperformed other catalysts by yielding a notably higher ammonia production rate while preserving an FE equal to or exceeding that of competing catalysts. This demonstrated the exceptional performance of the V-Cu NAE across a wide range of nitrate concentrations, providing a potential solution to tackle the complex and diverse nitratecontaining wastewater in industrial applications. As shown in Supplementary Fig. 11, the electrochemical double-layer capacitance ( ) measurement method was employed to estimate the electrochemically active surface area (ECSA) in this study. The ECSA value of V-Cu NAE with abundant defects was five times higher than that of defect-free Cu NW, demonstrating that in situ constructed defects significantly augments the number of active sites. Isotopic labeling experiments and blank comparisons conclusively established that the ammonia originated exclusively from rather than external contamination (Supplementary Fig. 12) . Meanwhile, to compare with colorimetric methods using Nessler’s reagent (Supplementary Fig. 8), the concentration of ammonium was further determined by NMR using external standards (Supplementary Fig. 13). The ammonia yields of and obtained by NMR were found to be
highly consistent with the quantitative results obtained by colorimetric methods, as demonstrated in Supplementary Fig. 14, thus confirming the accuracy of these quantitative techniques .
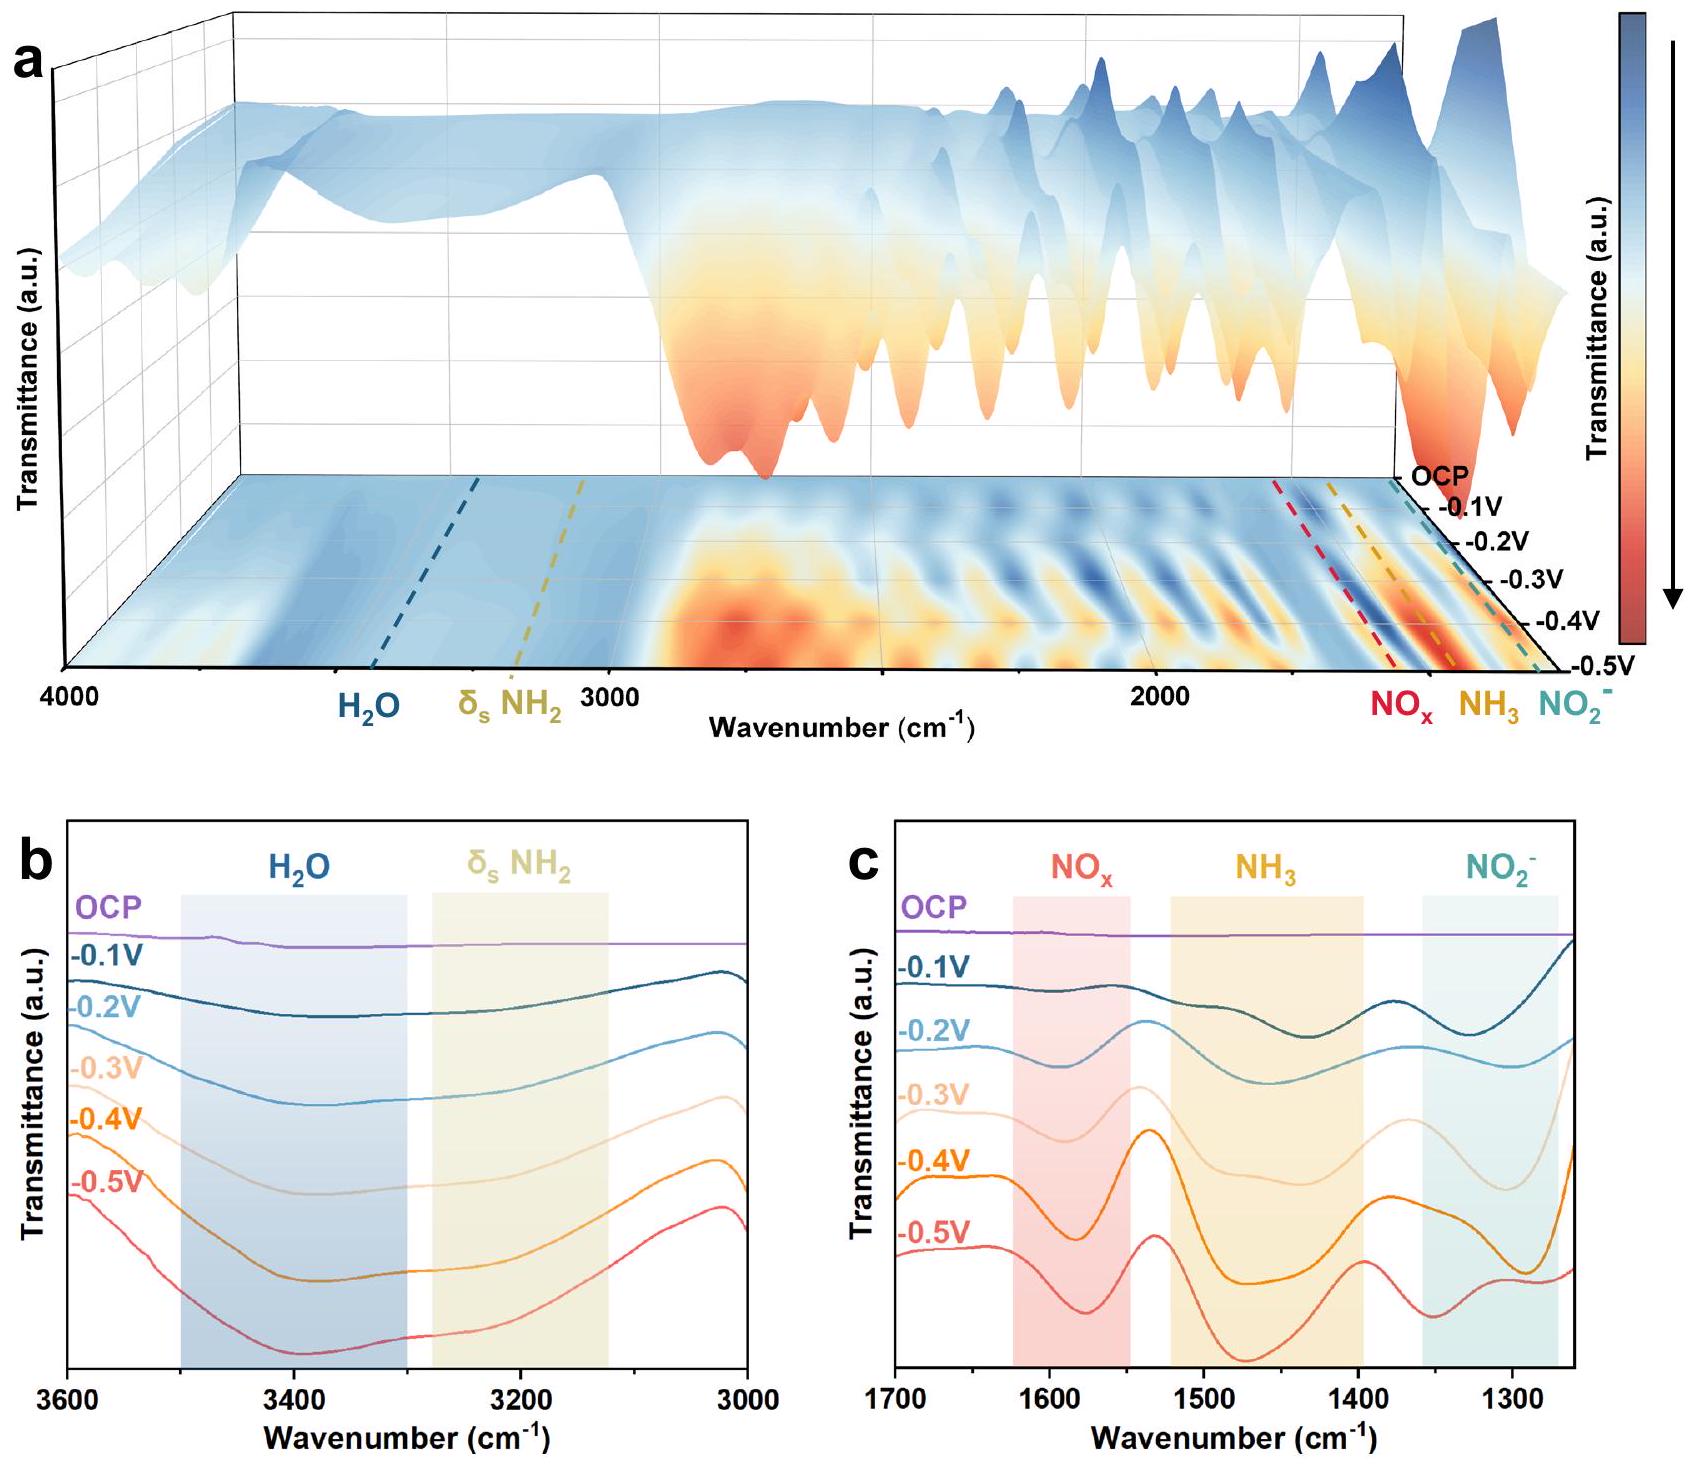
To investigate the reaction process and mechanism of on the V-Cu NAE, advanced Operando SR-FTIR spectroscopy was conducted. The laboratory setup and the electrolytic cell used for these measurements are depicted in Supplementary Fig. 15 and Supplementary Fig. 16, respectively . To provide a baseline for comparison, control experiments without nitrate were conducted under similar conditions (Supplementary Fig. 17). As shown in Fig. 3a, we collected and analyzed infrared signals ranging from 4000 to under an applied potential between -0.1 and -0.5 V (vs. RHE) and at OCP. In the SR-FTIR operation results of (Fig. 3b), free ammonia is represented at , and the peak at is attributed to water. Furthermore, as the voltage decreased from -0.1 to -0.5 V , the peak intensity increased, indicating an increase in yield .
Within the range of (Fig. 3c), peaks observed at and were ascribed to the intermediates and , respectively . It is clear that the production rates of and incrementally rose as the applied potential decreased from -0.1 to -0.5 V (vs. RHE). The scarce content at -0.5 V , attributed to the
Fig. 3 | Operando Synchrotron radiation Fourier Transform Infrared Spectroscopy (FTIR) measurements under various potentials for V-Cu NAE during
. a Three-dimensional FTIR spectra and corresponding contour maps in the and at OCP (Open Circuit Potential). Color scale with arrow indicating the change in signal intensity from low to high. Infrared signals in the range of . c Infrared signals in the range of . range of , measured under potentials from -0.1 to -0.5 V vs. RHE peak, could be a consequence of its swift depletion at higher voltages . Simultaneously, the three-dimensional FTIR spectra and corresponding contour maps (Fig. 3a) offered a more direct reflection of the intermediate content trend.
To elucidate the superior nitrate removal ability and ammonia production performance of V-Cu NAE, DFT calculations were conducted on facets and defective facets based on earlier observations. Four water molecules were explicitly added to the catalyst surface to account for the stabilizing effect of hydrogen bonding on intermediates, while an implicit solvation model was adopted to treat the solvent environment as a polarizable continuum. The V-Cu model was established by removing a surface Cu atom from the (as depicted in Supplementary Fig. 18 and Supplementary Fig. 19). Additionally, the constant electrode potential simulation and the potential-dependent activation energy simulation were employed to study the potential-dependent , HER, and water splitting energetics.
The band center model served as a robust methodology for examining the binding energy and catalytic interactions between transition metals and reactants or intermediates . In the V-Cu model,
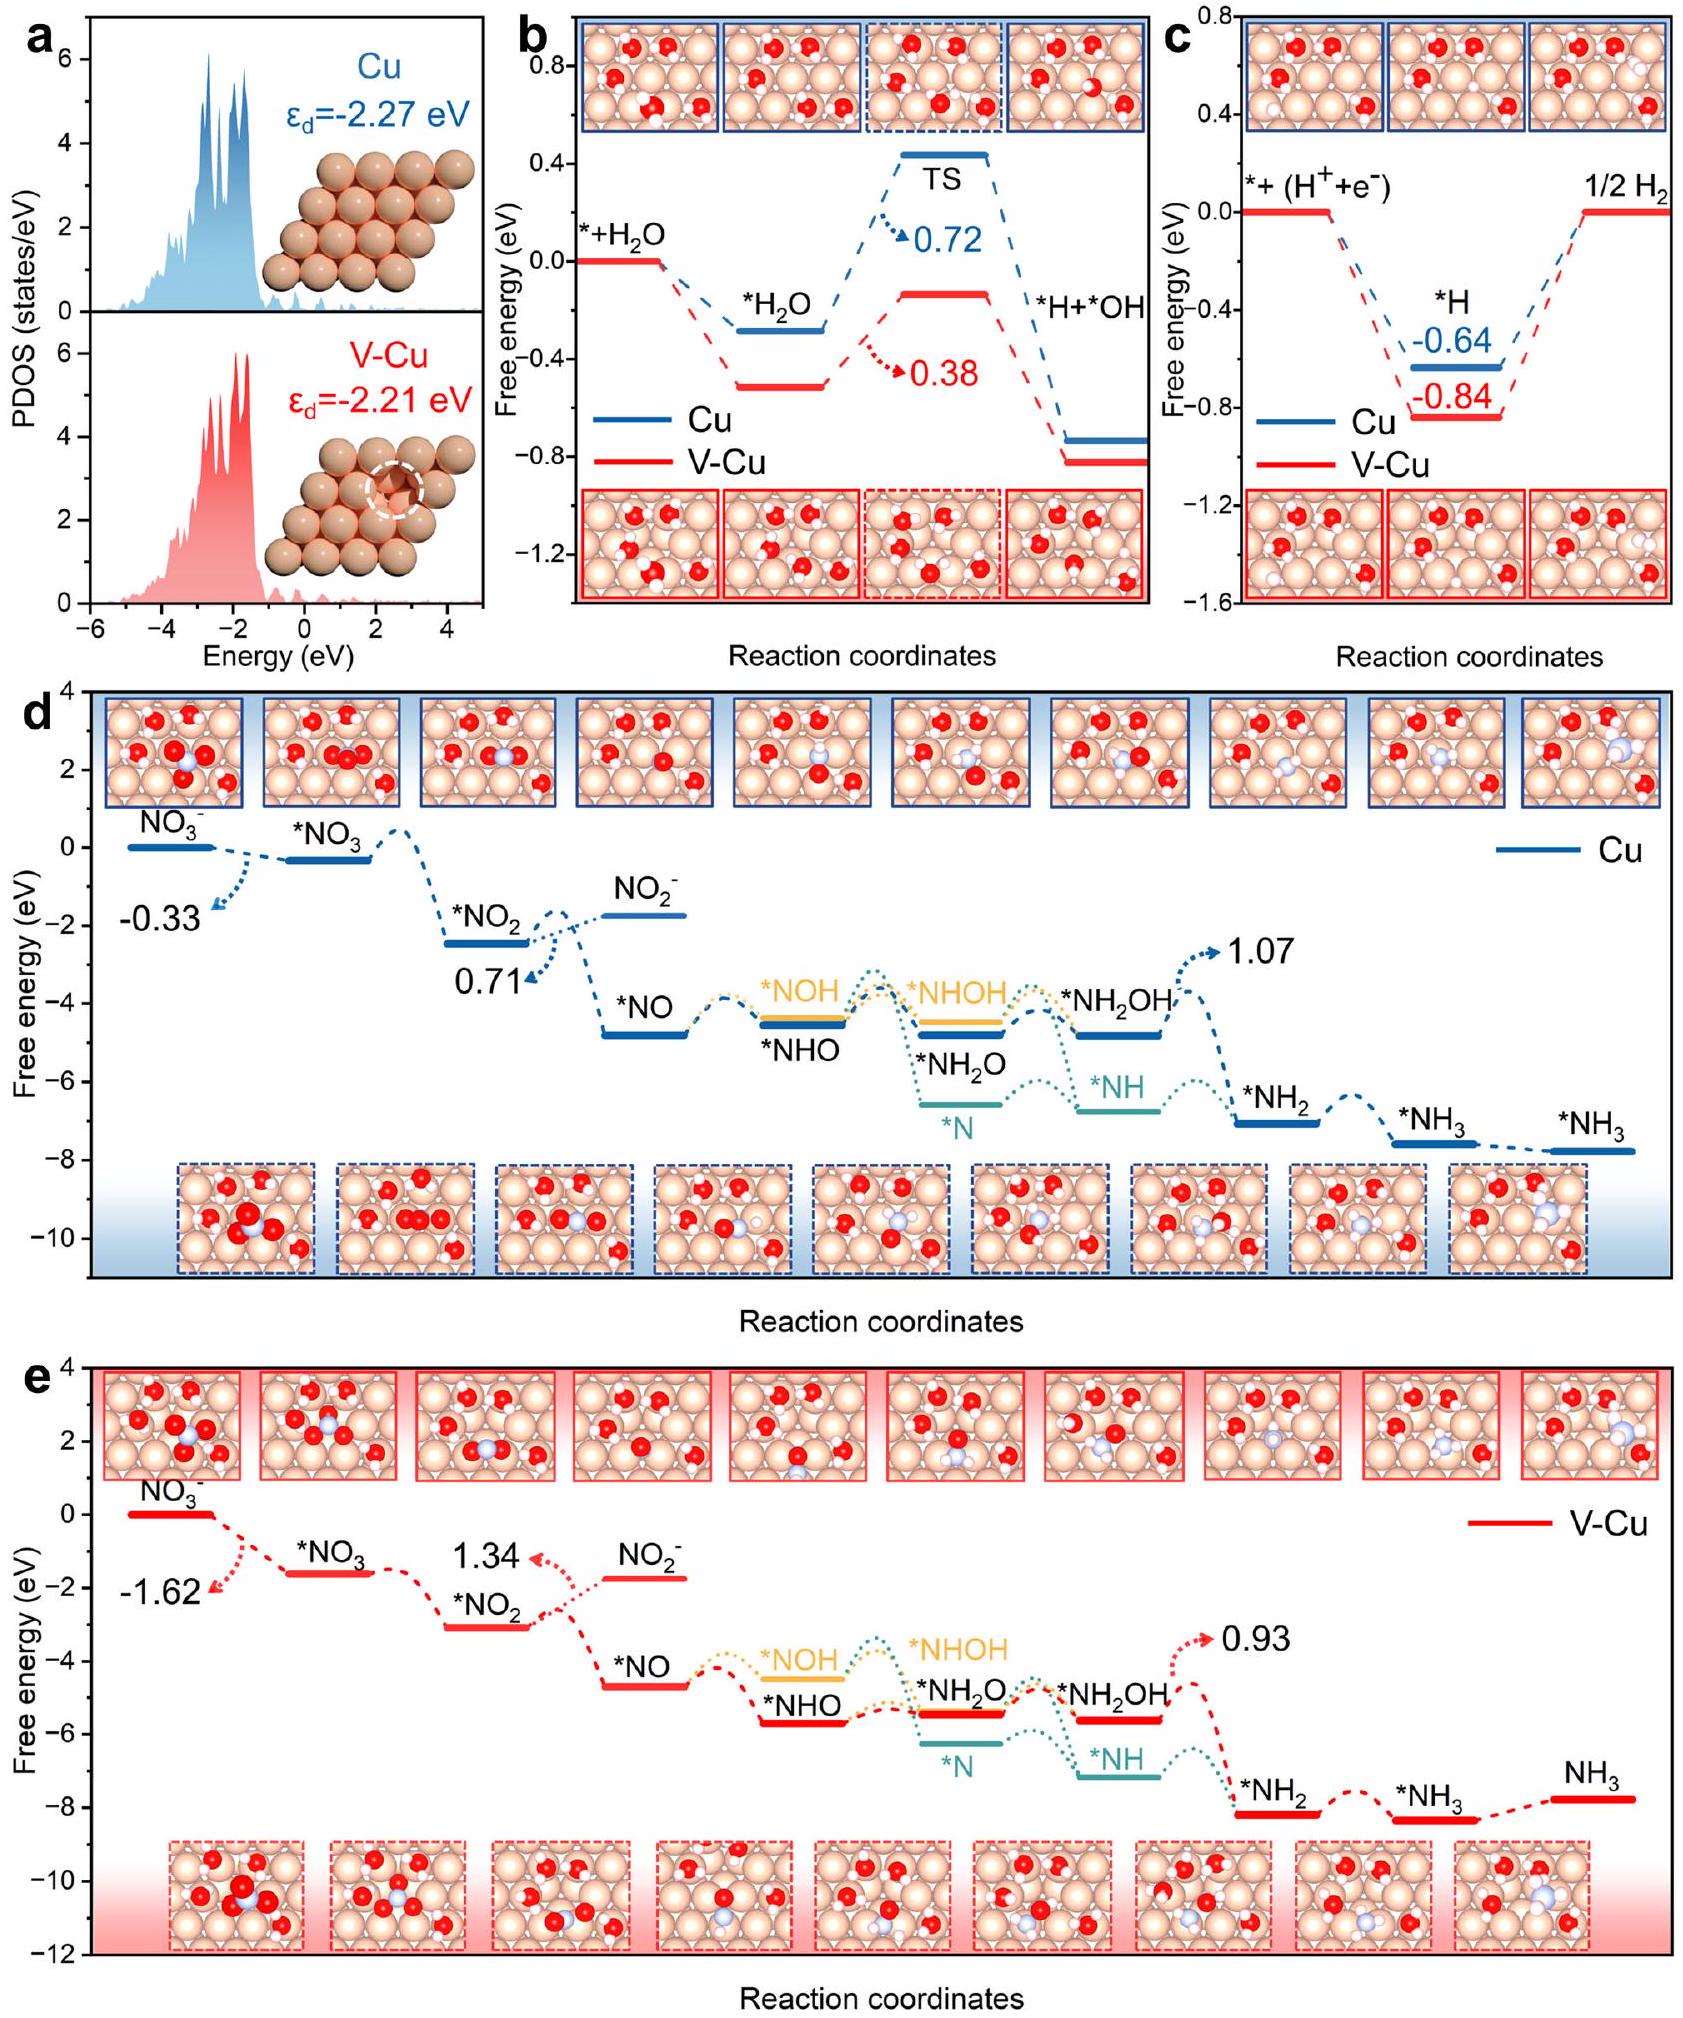
Cu atoms near the defect exhibit an unsaturated state, possessing a d -band center closer to the Fermi level (Fig. 4a). This leads the V to exhibit stronger adsorption for various intermediates compared to . Based on experimental findings, the optimum performance of V-Cu(111) was observed at vs RHE, hence all energies in Fig. 4a-e were calculated at this potential. Firstly, the total energies of intermediates involved in water splitting and HER on and V-Cu(111), such as slab, , *OH, and *OH + *H, vary with , as shown in Supplementary Fig. 20. Figure 4b presents the water splitting free energy diagram for and V-Cu(111). The results indicate that V-Cu(111) exhibits stronger water molecule adsorption and has a lower water splitting activation energy ( 0.38 eV ) than Cu (111) . This implies that is more capable of supplying active protons to facilitate the protonation process in , culminating in a high ammonia production current density ( ) for the V-Cu NAE . Simultaneously, V-Cu(111) has a higher HER reaction barrier ( 0.84 eV ) compared to , indicating a stronger suppression ability for HER, and FE was improved.
For on and V-Cu(111), Supplementary Fig. 21 showcases the potential intermediates and a complex adsorption/desorption,
Fig. 4 | DFT calculations. a Illustrated are the projected density of states (PDOS) along with structural models for both V-Cu NAE and Cu NWs. b Depicted water splitting reaction pathways for both V-Cu and Cu when vs RHE. c Showcases the hydrogen evolution reaction pathways for and Cu at vs RHE. d The pathways for Cu are displayed, with the optimal pathway distinctly highlighted in blue at vs RHE. e The
pathways for V-Cu are demonstrated with the optimal pathway prominently marked in red at vs RHE. Importantly, these reaction pathways are complemented with free energy diagrams and corresponding models. Models framed in solid lines denote steady-states, while those with dashed lines signify transition states (TS). For ease of differentiation, models within red frames represent V-Cu, and those within blue frames denote Cu.
deoxygenation, and protonation reaction network. The total energies of intermediates associated with on and V-Cu(111) like slab, *NO3, *NO2, *NO, *NOH, *NHO, *NHOH, *NH2O, *NH2OH, *N, *NH, * vary with , as illustrated in Supplementary Fig. 22. The transition states for the elementary steps of on and V-Cu(111) were identified using the Slow-growth method (Supplementary Fig. 23 and Supplementary Fig. 24). Figure 4d, e outlines the reaction pathways of on and V-Cu(111), encompassing all ground-state free energies and kinetic barriers. Based on the activation energies of each elementary step, the optimal reaction pathways for and V-Cu(111) were ascertained to be * * * * * * * * .
The low-coordinated V-Cu(111) showcases enhanced adsorption capabilities for nitrate and nitrite, with adsorption free energies of -1.62 eV and -1.34 eV , respectively. In comparison to and captures nitrate from the solution more swiftly, while also suppressing nitrite desorption. The rate-determining step for both and occurs during the protonation of * , with activation barriers of 0.93 eV and 1.07 eV , respectively. This indicates a competitive edge for in ammonia conversion.
Furthermore, microkinetic simulations were executed to calculate the yield of nitrite and ammonia for and at vs RHE. The results from Supplementary Fig. 22a demonstrate that, at equilibrium, of the sites on are occupied by *O and *OH, with the remaining sites vacant. Slower protonation rates of oxygen species and weaker adsorption energies are the culprits for this. Due to its more negative nitrate adsorption energy and faster deoxygenation rate, sites on V-Cu(111) are rapidly consumed at the onset of the reaction, leading to the prompt deoxygenation of to produce and (Supplementary Fig. 25b). Owing to the faster protonation rates of oxygen species on V and are also rapidly consumed. Once steady-state equilibrium is attained, the surface is completely covered by , at which point the deoxygenation rate of * becomes the critical step in converting nitrate to ammonia. Finally, as depicted in Supplementary Fig. 25c, the steady-state yields of nitrite and ammonia for Cu and V-Cu were determined. The results show that the ammonia yield for V-Cu is , with nitrite production at . In contrast, Cu yields of ammonia with a nitrite output of . These microkinetic simulation results affirm the higher selectivity of V-Cu(111) for ammonia production.
To further explore the industrialization potential of the catalyst, a two-electrode flow electrolytic cell coupled with and GOR reaction was designed to enhance energy utilization efficiency and wastewater treatment capacity (Fig. 5a). Specifically, the V-Cu NAE and commercial Ni foam were utilized as the cathode and the anode respectively. Actual industrial wastewater ( -N content of 527 ppm ) and 0.1 M glycerin served as the electrolyte for the cathode and anode, respectively. A detailed schematic diagram of the two-electrode flow cell device was presented in Supplementary Fig. 32. The LSV curves depicted in Fig. 5b indicated that the addition of 0.1 M glycerol (GLY) reduced the voltage required to achieve an industrial-grade current density of to just 1.34 V , a substantial drop of 260 mV . To evaluate the wastewater treatment capacity and ammonia production performance of the device, a transformation experiment of 1 L actual industrial wastewater was conducted with V-Cu NAE. As shown in Fig. 5c, with a low cell voltage of -1.4 V , the concentration diminished progressively during electrolysis, accompanied by a decrease in current density from to . Following 30 h of electrolysis, only 0.52 ppm of and 0.38 ppm of remained, both significantly below the WHO regulations for drinking water, which corresponds to the selectivity of , the conversion of and the FE over . It was observed that the catalyst successfully reduced the and content of 1 L of actual industrial wastewater to the drinking water standard within 30 h , which demonstrates its impressive wastewater treatment capacity. Additionally, the NMR results (Fig. 5d) indicated that glycerol was oxidized at the anode into a high value-added formate, with a FE of 81.3% (Supplementary Fig. 33), thereby enhancing the overall economic benefits . Given that stability is a critical parameter for industrialization, a stability test was conducted on the device using 5 L of wastewater at 1.4 V , with periodic updates taken every 30 h . As illustrated in Fig. 5e, the production rate and FE of the catalyst remained stable even after 100 h , revealing exceptional stability. To further investigate the post-operational stability and durability of the catalyst, we conducted comprehensive characterizations. As shown in Supplementary Fig. 34, the crystalline phase of the catalyst remained consistent as metallic Cu phase after the stability tests. From the SEM examinations, several morphological changes were identified after the cycling tests (Supplementary Fig. 35). Specifically, some nanowire arrays detached from the Cu foam substrate, contrasting with their initial state as shown in Supplementary Fig. 35a, c, e, g. In addition, aggregation of nanowires was observed in certain areas (Supplementary Fig. 35f), and fractures were evident in some nanowires (Supplementary Fig. 35h). These observed morphological changes might contribute to performance variations detected during the cycling tests. Furthermore, XPS analysis indicated that, relative to the pristine sample, the Cu peaks of the cycled V-Cu NAE still displayed a significant shift when juxtaposed with those of the defect-free Cu NWs (Supplementary Fig. 36). This persistent shift corroborates the enduring stability of the Cu vacancies throughout the cycling process, underscoring the sustained presence of Cu vacancies in the catalyst. Our two-electrode device surpassed all previously reported performances in electrocatalytic nitrate reduction to ammonia .
During the treatment of authentic industrial wastewater, air stripping has been effectively utilized to extract ammonia ( ), subsequently yielding a valuable end product . Figure 6a illustrated that under operational conditions of and an air flow, approximately of the could be effectively removed from the treated wastewater without affecting other impurities. Following the extraction of , hydrochloric acid was utilized to capture the ammonia, yielding ammonium chloride . Subsequently, a rotary evaporator facilitated the separation of . Additionally, the direct infusion of into water generates ammonia monohydrate ( ). Both procedures remarkably contributed to the conversion of over of the present in the wastewater into chemical products, as depicted in Fig. 6b. X-ray diffraction (XRD) and proton nuclear magnetic resonance ( NMR) analyses were performed to verify the purity of the resultant products. As evidenced by Fig. 6c, d, these analytical techniques confirmed the high-purity and obtained from the treated industrial wastewater, with no noticeable impurities. To conclusion, the implemented air stripping method proves to be an effective and selective strategy for extracting from real industrial wastewater, thus yielding high purity valuable end products such as and . This study set the foundation for further refinement and optimization of wastewater treatment processes, ultimately contributing towards a more sustainable and efficient utilization of resources.
In summary, we successfully synthesized a defect-rich Cu NAE obtained by in-situ electrochemical reduction of NWs. Operando Synchrotron radiation-FTIR and DFT calculations revealed that the defect induced triple synergistic modulation: enhanced nitrate adsorption, promoted water dissociation, and suppressed hydrogen evolution. Consequently, the V-Cu NAE catalyst attains within a nitrate concentration range of , maintaining a FE exceeding and effectively reducing nitrate levels to comply with the WHO drinking water standards. Furthermore, we explored the industrial potential of the V-Cu NAE by using a two-
Fig. 5 | Electrochemical with actual industrial wastewater coupled with Glycerol Oxidation Reaction in a two-electrode system. a Scheme of the electrolyzer coupling with industrial wastewater and Glycerol Oxidation Reaction (GOR). b LSV curves (without IR compensation) using the electrolyzer with and without glycerol at the anode. The measured resistance of the two-electrode system was . c Complete nitrate removal using V-Cu NAE ( ) with 1 L of actual industrial wastewater (containing with ) at
1.4 V . After 30 h of electrolysis, only and remained, both significantly below the WHO regulations for drinking water ( and ), with selectivity, conversion, over . The blue data shows the change of current over time. d NMR results for GOR production characterization. e Chronoamperometric curves, FE and yield rate of V-Cu NAE at 1.4 V by 4 cycles, with each cycle presenting 30 h of long-term electrolysis.
electrode system to treat actual wastewater with selectivity, conversion. Our work offers a potential solution for addressing the complex and diverse nitrate-containing wastewater encountered in industrial applications.
Methods
Materials characterization
The morphology and structure of the samples were characterized using various techniques, including field-emission scanning electron microscopy (FESEM, SU-8200), transmission electron microscopy (TEM, HIACHI HT7700; Talox F200X), powder X-ray diffractor (XRD, TTR-III), and Raman spectrometer (Renishaw inVia) with a 532 nm excitation laser. High-resolution TEM (HRTEM) images and energy dispersive spectroscopy (EDS) mapping images were recorded using a Talox F200X transmission electron microscope operating at 200 kV .
The chemical state of the samples was analyzed using an ESCALAB 250 X-ray photoelectron spectrometer with an X-ray source (Al 1486.6 eV ). All peaks were calibrated with the C 1 s spectrum at a binding energy of 284.8 eV . Ultraviolet-visible (UV-Vis) absorbance spectra were measured using a Shimadzu UV-3600 spectrophotometer. Isotope labeling experiments were conducted and measured using 1H NMR spectroscopy (Bruker system).
Pre-treatment of Cu foam. The Cu foam was cut into rectangle with an area of , and then ultrasonicated in 1 M HCl aqueous solution, water, respectively.
Synthesis of nanowire arrays . The above Cu foam was immersed in a solution of 10 mL of ammonium persulfate ( 0.285 g ) and 10 mL of sodium hydroxide ( 1.0 g ) for 30 min , during
Fig. 6 | Synthesis and extraction of ammonia products from industrial wastewater. a Schematic of the ammonia product synthesis process from industrial wastewater to and . b Conversion efficiency of different steps for the ammonia product synthesis process. c XRD and picture of synthesized products. NMR and picture of the synthesized . Error bars represent the standard deviations calculated from three independent measurements.
which the surface of the Cu foam changed color to cyan and the solution became blue. After that, the cyan-colored Cu foam were washed with deionized water and ethanol, and dried under vacuum at .
Synthesis of nanowire arrays . The NWs were heated at for 2 h with the heating rate of under the atmosphere. Then, they were cooled down to natural temperature.
Synthesis of nanowire arrays ( NWs). The NWAs were heated at for 2 h with the heating rate of under the Ar atmosphere.
Synthesis of Cu nanowire arrays rich in vacancy (V-Cu NAE). The V-Cu NAEs used for nitrate reduction was then produced by in-situ electrochemical reduction of the NWs, which removed nitrogen from the surface, thereby constructing V-Cu NAE. CV technology was employed from -0.4 to -1.8 V at a scan rate of for at least 20 min until the baseline kept steady. During in situ electrochemical reduction, NWs gradually loses nitrogen and becomes Cu nanowire arrays rich in vacancy, thus changing from black to reddish-brown.
Electrochemical measurements
All the electrochemical measurements of the samples were carried out using a CS Electrochemical Workstation (CS150M, China) in a H-type electrolytic cell separated by a membrane. The copper-based sample on Cu mesh, saturated calomel electrode (SCE) and platinum foil was
used as the working electrode, reference electrode and counter electrode, respectively. The surface area of the working electrode was controlled at , and the catalyst loading was solution ( 35 mL ) was evenly distributed to the cathode and anode compartment. was added into the cathode compartment for reduction (containing 1, 2, 5, 10, 20, 30, 40, 50, 100, 500, 1000 mM nitrate-N, respectively). Before nitrate electroreduction test, Linear sweep voltammetry (LSV) curves are performed until that the polarization curves achieve steady-state ones at a rate of from 0.2 V to -0.6 V vs RHE. Then, the potentiostatic test was carried out at different potentials for 1 h with a stirring rate of 300 rpm . The resistance of the electrochemical cell was determined using potentiostatic electrochemical impedance spectroscopy, conducted over a frequency range from 0.1 Hz to 200 kHz with a signal amplitude set at . Cyclic voltammetry (CV) curves in electrochemical doublelayer capacitance determination were measured in a potential window nearly without the Faradaic process at different scan rates of and in a solution containing 200 ppm nitrateN and . The plot of current density at set potential against scan rate has a linear relationship and its slope is the .
Determination of ion concentration
The ultraviolet-visible (UV-Vis) spectrophotometry technique was employed for the quantification of ion concentrations within specific calibration ranges. Below are the adapted methodologies for the detection of various nitrogenous compounds:
Nitrate-N determination. Initially, a predefined volume of the sample was diluted to 5 mL within the detection limit. To this solution, 0.1 mL
of 1 M hydrochloric acid and 0.01 mL of a solution of sulfamic acid were added. The mixture was then allowed to equilibrate for 20 min under room temperature. An ultraviolet-visible spectrophotometer was used to measure the absorption spectrum, focusing on the absorption peaks at 220 nm and 275 nm wavelengths. The net absorbance was determined using the equation: calibration curve was established using a range of standard potassium nitrate solutions to correlate absorbance with concentration, facilitating the determination of nitrate concentrations in test samples.
Nitrite-N determination. The colorimetric reagent was prepared by combining p-aminobenzenesulfonamide ( 4 g ), N -( 1 -Naphthyl)ethylenediamine dihydrochloride ( 0.2 g ), ultrapure water ( 50 mL ), and phosphoric acid ( 10 mL with a density of ). A specific volume of the sample was diluted to 5 mL to fall within the detection limit, followed by the addition of 0.1 mL of the prepared color reagent. The solution was homogenized and allowed to rest for 20 min , after which the absorption intensity at 540 nm was measured. A series of standard sodium nitrite solutions were used to calibrate the concentrationabsorbance curve, enabling the calculation of nitrite concentrations in samples.
Ammonia-N determination. The detection of ammonia utilized Nessler’s reagent as the colorimetric agent. The sample was diluted to a 5 mL volume within the detection range, to which 0.1 mL of a potassium sodium tartrate solution (density ) was added and mixed well. Subsequently, 0.1 mL of Nessler’s reagent was introduced, and the solution was uniformly mixed. The absorbance was recorded at a wavelength of 420 nm after a stabilization period. Calibration was performed using a series of standard ammonium chloride solutions, facilitating the determination of ammonia concentrations.
Calculation of the yield, conversion rate, selectivity, and Faradaic efficiency
The yield of was determined using below equation:
where signifies the mass concentration of ammonia in aqueous solution, specifies the total volume of electrolyte present within the cathode compartment, is the molar mass of represents the duration of the electrolysis process, is the area of the cathode, ;
The conversion rate was calculated using below equation:
where is the variation in nitrate concentration before and after electrolysis, represents the initial concentration of nitrate, .
The selectivity of ammonia or nitrite was obtained using below equation:
where denotes the generated concentration of ammonia or nitrite, .
Faradaic efficiency was assessed through Eq. (4), defined as the ratio of the electric charge utilized for ammonia synthesis to the total charge transferred across the electrode:
where is the Faraday constant, valued at 96,485 Coulombs per mole ( ); is the total amount of charge consumed, C .
Isotope labeling experiment
Using 99 atom as feed nitrogen source, isotope labeled nitrate reduction experiment was carried out to determine the source of ammonia. Potassium sulfate of 0.5 M was used as electrolyte, and with concentration of 200 ppm and was added into the cathode chamber as reactant. After electric reduction, the electrolyte of was taken out. The pH value was adjusted to weak acid by 4 M sulfuric acid, and further quantified by NMR ( 400 MHz ) using maleic acid standard. The calibration curve was established as follows: Firstly, with known concentration (50,100,150,200,250,) was prepared in 0.5 M potassium sulfate ( solution was used as the standard); secondly, standard solution with different concentration was mixed with 0.02 g maleic acid; Thirdly, deuterium oxide ( ) was added to 0.5 mL of mixed solution for NMR detection. Finally, the peak area ratio of and maleic acid was used for calibration, because the concentration of was positively correlated with the area ratio. Similarly, the amount of was quantitatively measured.
In-situ Raman spectroscopy
Raman spectroscopic analysis in-situ utilized a Confocal Raman Microscope (Renishaw inVia) equipped with an Olympus 50 X ( .) long working distance lens. A 532 nm wavelength laser, with a power output of 2.5 mW and utilizing an 1800 lines grating, was deployed. The NWs measuring 1 cm by 1 cm served as the substrate for the working electrode, while Pt wire and were employed as the counter and reference electrodes, respectively. The time-dependent Raman spectroscopy measurement towards electrocatalysis process were under programmed applied potentials in . The electrocatalyst is held for 300 s at the applied potential to reach steady state conditions before recording each spectrum. Each spectrum was acquired over 15 sweeps, spanning the range of 175 to .
Operando SR-FTIR measurements
At the National Synchrotron on Radiation Laboratory’s BL01B infrared beamline, in-situ SR-FTIR analyses utilized a custom-built reflection apparatus with a ZnSe crystal window for infrared transmission, which allows a wavelength pass-through from 20,000 to with a transmittance greater than . The setup included an FTIR spectrometer featuring a KBr beam splitter and multiple detectors, notably a liquid-nitrogen-cooled mercury cadmium telluride detector, integrated with a Bruker Hyperion 2000 infrared microscope and a magnification objective. A micrometer-thick gap was maintained between the catalyst electrode and the ZnSe window. Initially, the sample was located using a reflection observation mode to focus on the catalyst surface. Measurements were then conducted in a reflection mode with vertical incidence of infrared light. With the light source beam current , each infrared absorption spectrum was acquired by averaging 128 scans at a resolution of . Before measurement, the catalyst electrode’s background spectrum was collected at open-circuit voltage (OCP). The electrocoupling reaction potentials were systematically varied from -0.4 to -0.9 V versus RHE, in steps of 0.1 V . It’s important to note that the instrument automatically subtracted the background obtained at OCP from the test results.
Computational detail
The Vienna ab initio simulation package (VASP) based on density functional theory (DFT) was utilized for all calculations in this study . We adopted projector augmented wave (PAW) pseudopotentials and a semi-local generalized gradient approximation (GGA) with Perdew-Burker-Ernzerhof (PBE) exchange-correlation energy . To reasonably account for weak, long-distance van der Waals (vdWs) effects, we employed an empirical dispersion-corrected DFT method (DFT-D3) . The planewave expansion kinetic energy cutoff was set to 400 eV , and the self-consistent field (SCF) iteration convergence threshold was set
to . Geometry optimization using the conjugate gradient method was carried out, with forces on each atom less than .
Adsorption energies of nitrate and nitrite
For DFT, obtaining the energy of the nitrate ion is challenging because DFT cannot accurately obtain the energy of charged molecules. We can derive the adsorption energy of the nitrate using thermodynamic data from the CRC Handbook combined with the accurate energy that DFT can calculate. In fact, this is how we handled it in the manuscript we initially submitted, but we did not detail this aspect in the supporting information or main text. These details will be re-included in the computational details section of the supporting information. The specific derivation process is as follows:
According to Hess’s law, S4 represents the adsorption process of the nitrate ion, and the Gibbs free energy of S4 can be derived from S1, S2, and S3, namely:
Where and can be obtained by referring to the CRC Handbook of Chemistry and Physics, with values of 0.317 eV and 0.075 eV , respectively. can be derived from DFT calculations.
Where and are the free energies of the system after adsorption on the slab, the free energy of the gaseous molecule, and the free energy of the slab, respectively. and represent the chemical potentials of and , respectively. The calculation of involves the chemical potentials of protons and electrons. Therefore, even when the energy of is used as a reference for calculating nitrate adsorption, this process remains potential-dependent.
Additionally, to consider the desorption of nitrite, the energy of nitrite is also required. Similarly, the energy of nitrite is derived using thermodynamic data from the CRC Handbook combined with DFT for accurate energy calculation.
According to Hess’s law, the Gibbs free energy of S7 can be derived from S8, S9, and S10, namely:
Where and can be obtained by referring to the CRC Handbook of Chemistry and Physics, with values of -0.198 eV and 0.069 eV , respectively. can be derived from DFT calculations.
Where and are the free energies of the system after adsorption on the slab, the free energy of the gaseous molecule, and the free energy of the slab, respectively. and represent the chemical potentials of and , respectively.
The free energy consists of three terms, as shown in Eq. (S13), which are the DFT computed energy ( ), zero-point energy ( ), and the contribution from entropy change ( ):
In this case, the temperature is taken as 298.15 K .
Potential dependent reaction energy
Nørskov’s computational hydrogen electrode (CHE) method is utilized to describe the chemical potential of protons and electrons. Specifically, using the linear free energy dependency on electronic energy under this potential, the free energy dependency of the protonelectron pair on the electrode potential is determined, that is, the electronic energy is offset by .
Here, represents the elementary positive charge , and is the electrode potential relative to Reversible Hydrogen Electrode (RHE). For the protonation process , its free energy barrier will undergo the following changes:
Where, is the electrode potential relative to the RHE. Under a more negative reduction voltage, the protonation process becomes increasingly favorable.
For the adsorption process of the nitrate ion and the desorption process of the nitrite ion, their free energy barriers will undergo the following changes:
Under a more negative reduction voltage, the adsorption process of the nitrate ion becomes increasingly difficult, while the desorption process of the nitrite ion becomes increasingly favorable. At the same time, the protonation process becomes relatively easier.
Constant potential simulation
To more precisely account for actual reaction conditions, such as pH and electrode potential, we adopted the double-referencing method developed by Duan et al. to study the energetics of . This approach elucidates the intrinsic catalytic active sites and pH dependent activity of under actual reaction conditions. The implicit solvation model is implemented through VASPsol. A relative dielectric constant of 80 was set to simulate the water electrolyte. VASPsol assigns an effective surface tension parameter value of 0 , thereby neglecting the contribution of cavitation energy. The compensating charge was simulated by a linearized Poisson-Boltzmann
model with a Debye length of 3.0 Å. To clarify the reaction mechanism under different electrode potentials, we adjusted varying amounts of excess charge ( q ), varying from -2.0 e to +2.0 e in increments of +0.5 e.
The free energy under the potential-dependent grand canonical ensemble is as follows:
Where represents the free energy under the grand canonical ensemble, is the energy derived from DFT calculations, is the average electrostatic potential of the model, is the work function of the charged system, and is the number of electrons doped into the system.
The electrode potential relative to the standard hydrogen electrode (SHE) can be determined from the system’s work function .
Where 4.6 V is the absolute electrode potential reference of the standard hydrogen electrode (SHE) in VASPsol.
A quadratic function relationship exists between and
Where represents the capacitance of the system. and are the electrode potential and free energy, respectively, relative to SHE in a zero-charge system. The vertex form of the quadratic function relationship can be simplified to the standard form of a quadratic function, where , and are parameters that need to be fitted. After obtaining under actual reaction conditions, in Eq. (S13) can be replaced with to simulate the free energy under constant potential.
Potential dependent activation energy barrier
Akhade et al. have devised a method for addressing activation energies that vary with potential.
For non-electrochemical surface protonation:
Utilizing DFT to calculate the minimal energy geometry and hydrogenation transition state of reactants allows the determination of activation energy ( ) for processes outside of electrochemical surface protonation. For the reaction , the activation energy, represented as , is equivalent to Ea . At , the equilibrium potential, the state that is non-electrochemically analogous finds its balance with the electrochemical counterpart, ). In this context, corresponds to the free energy of hydrogen adsorption ( ) at a given surface measured at 0 V versus RHE. One can calculate the free energy variation for electrochemical hydrogenation on the surface using the formula e. The forward activation energy at potential U is presumed to adhere to the Butler-Volmer formalism, taking into account the transfer of n electrons:
In this study, we fixed at 0.5 across all basic steps, a choice frequently validated as a practical approximation.
Microkinetic Simulations
Our investigation employed comprehensive microkinetic simulations to dissect the surface reaction mechanisms implicated in nitrate
reduction processes. Initially, we ascertained the forward and reverse rate constants for the elementary reactions involved, derived via the classical Arrhenius equation. Furthermore, the adsorption rates for non-activated molecular adsorption were computed following the Hertz-Knudsen equation, taking into account the collision rates of gasphase molecules with the surface.
The MKMXXC microkinetic modeling software suite was utilized to simulate the nitrate reduction rates under standard conditions, specifically at a reaction temperature of 300 K and a molar ratio of nitrate to proton of 1:1. For each reaction step considered in our model, a corresponding differential equation was crafted, incorporating the partial pressures of reactants and the coverage of surface species.
To achieve steady-state surface coverages, these differential equations were integrated over an extended duration until the variations in surface coverage were exceedingly minor (less than ), thereby ensuring the precision of our simulations. Subsequently, the reaction rates for each elementary step were calculated based on these steady-state surface coverages.
This rigorous approach allowed us to construct an intricate microkinetic model of the nitrate reduction reaction, detailing each elementary step and their contributions to the overall reaction pathway. Moreover, it provided a microscopic insight into the mechanistic underpinnings of the nitrate reduction process.
Slow-growth method
The free energy barriers in the simulations were computed using both Ab Initio Molecular Dynamics (AIMD) and the Slow-growth method within the canonical (NVT) ensemble, regulated by NoséHoover thermostats at a fixed temperature of 300 K and a time step of 1.0 fs . The Slow-growth method hinges on the geometric parameter , a collective variable (CV), which is varied from an initial state ( ) to a final state ( ) with a specified velocity of transformation ( ). The Helmholtz free energy difference ( ) is calculated by integrating the potential energy’s derivative with respect to over the simulation duration, which, in the limit of infinitesimally small , corresponds to the Gibbs free energy difference ( ) between the initial and final states. The detailed parameters for this method applied to various elementary reactions are included in the Supplementary Materials.
A thermodynamic cycle was utilized to calculate the Gibbs free energy of adsorption for and in the gas phase. The relevant thermodynamic values were sourced from the CRC Handbook of Chemistry and Physics. The cycle involves the calculation of Gibbs free energy differences for the adsorption processes of and , with the respective energy values explicitly indicated in the provided schemes.
Data availability
The raw data of the figures in the main manuscript are available in figshare with the identifier(s) https://doi.org/10.6084/m9.figshare. 25124129. All other data needed to evaluate the conclusions in the paper are present in the paper and the Supplementary Information or can be obtained from the corresponding authors upon request.
Code availability
The code used in this work can be obtained from the corresponding authors on request.
References
Yu, C. Q. et al. Managing nitrogen to restore water quality in China. Nature 567, 516-520 (2019).
Su, L. H. et al. Electrochemical nitrate reduction by using a novel cathode. Water Res. 120, 1-11 (2017).
Yao, F. B. et al. Highly selective electrochemical nitrate reduction using copper phosphide self-supported copper foam electrode:
Performance, mechanism, and application. Water Res. 193, 116881 (2021).
4. Murphy, A. P. Chemical Removal of Nitrate from Water. Nature 350, 223-225 (1991).
5. Deng, Z. Q. et al. High-efficiency ammonia electrosynthesis on selfsupported nanoarray in neutral media by selective reduction of nitrate. Chem. Eng. J. 435, 135104 (2022).
6. Wang, Y. T. et al. Structurally disordered nanosheets with rich oxygen vacancies for enhanced nitrate electroreduction to ammonia. Angew. Chem. Int. Ed. 61, e202218717 (2022).
7. Wang, J. et al. Nanodenitrification with bimetallic nanoparticles confined in N-doped mesoporous carbon. Environ. Sci.: Nano 7, 1496-1506 (2020).
8. Ma, J. et al. Electrochemical reduction of nitrate in a catalytic carbon membrane nano-reactor. Water Res 208, 117862 (2022).
9. Xu, H., Ma, Y. Y., Chen, J., Zhang, W. X. & Yang, J. P. Electrocatalytic reduction of nitrate – a step towards a sustainable nitrogen cycle. Chem. Soc. Rev. 51, 2710-2758 (2022).
10. Chen, G. F. et al. Electrochemical reduction of nitrate to ammonia via direct eight-electron transfer using a copper-molecular solid catalyst. Nat. Energy 5, 605-613 (2020).
11. Li, Z., Wang, W., Qian, Q. & Zhu, Y. Magic hybrid structure as multifunctional electrocatalyst surpassing benchmark Pt/C enables practical hydrazine fuel cell integrated with energy-saving production. eScience 4, 416-427 (2022).
12. Wen, G. L. et al. nanosheet array for high-efficiency electrohydrogenation of nitrite to ammonia at ambient conditions. J. Colloid Interface Sci. 606, 1055-1063 (2022).
13. Jiang, H. F. et al. Enabled efficient ammonia synthesis and energy supply in a zinc-nitrate battery system by separating nitrate reduction process into two stages. Angew. Chem. Int. Ed. 62, e202218717 (2023).
14. Suryanto, B. H. R. et al. Challenges and prospects in the catalysis of electroreduction of nitrogen to ammonia. Nat. Catal. 2, 290-296 (2019).
15. Liu, H. M. et al. Efficient electrochemical nitrate reduction to ammonia with copper-supported rhodium cluster and single-atom catalysts. Angew. Chem. Int. Ed. 61, e202202556 (2022).
16. Foster, S. L. et al. Catalysts for nitrogen reduction to ammonia. Nat. Catal. 1, 490-500 (2018).
17. Han, S. H. et al. Ultralow overpotential nitrate reduction to ammonia via a three-step relay mechanism. Nat. Catal. 6, 402-414 (2023).
18. van Langevelde, P. H., Katsounaros, I. & Koper, M. T. M. Electrocatalytic nitrate reduction for sustainable ammonia production. Joule 5, 290-294 (2021).
19. Fan, K. et al. Active hydrogen boosts electrochemical nitrate reduction to ammonia. Nat. Commun. 13, 7958 (2022).
20. Kim, K. H. et al. Energy-efficient electrochemical ammonia production from dilute nitrate solution. Energy Environ. Sci. 16, 663-672 (2023).
21. He, W. H. et al. Splicing the active phases of copper/cobalt-based catalysts achieves high-rate tandem electroreduction of nitrate to ammonia. Nat. Commun. 13, 1129 (2022).
22. Chen, F. Y. et al. Efficient conversion of low-concentration nitrate sources into ammonia on a Ru-dispersed Cu nanowire electrocatalyst. Nat. Nanotechnol. 17, 759-767 (2022).
23. Zhao, C. M. et al. In situ topotactic transformation of an interstitial alloy for CO electroreduction. Adv. Mater. 32, 2002382 (2020).
24. Lee, D. et al. Copper nitride nanowires printed li with stable cycling for li metal batteries in carbonate electrolytes. Adv. Mater. 32, 1905573 (2020).
25. Zhang, B. X. et al. Highly electrocatalytic ethylene production from on nanodefective Cu nanosheets. J. Am. Chem. Soc. 142, 13606-13613 (2020).
26. Guo, N. K. et al. Achieve superior electrocatalytic performance by surface copper vacancy defects during electrochemical etching process. Angew. Chem. Int. Ed. 59, 13778-13784 (2020).
27. Zhang, Y. Z., Chen, X., Wang, W. L., Yin, L. F. & Crittenden, J. C. Electrocatalytic nitrate reduction to ammonia on defective (111) single-atom alloys. Appl. Catal. B 310, 121346 (2022).
28. Liu, S. Q., Gao, M. R., Liu, S. B. & Luo, J. L. Hierarchically assembling cobalt/nickel carbonate hydroxide on copper nitride nanowires for highly efficient water splitting. Appl. Catal. B 292, 120148 (2021).
29. Krbal, M. et al. Detection of N-Te bonds in the as-deposited amorphous nitrogen-doped GeTe-based phase change alloys using N K-edge XANES spectroscopy and their impact on crystallization. J. Colloid Interface Sci. 704, 254-259 (2017).
30. Zhuang, T. T. et al. Steering post-C-C coupling selectivity enables high efficiency electroreduction of carbon dioxide to multi-carbon alcohols. Nat. Catal. 1, 421-428 (2018).
31. Mavridou, K. et al. Oxidation of thin films obtained from Cu annealed under flow: A Raman and N-K-edge NEXAFS study. J. Alloy. Compd. 914, 165293 (2022).
32. Zhao, Y. et al. Elucidating electrochemical CO2 reduction reaction processes on Cu(hkl) single-crystal surfaces by in situ Raman spectroscopy. Energy Environ. Sci. 15, 3968-3977 (2022).
33. Wang, Y. T., Zhou, W., Jia, R. R., Yu, Y. F. & Zhang, B. Unveiling the activity origin of a copper-based electrocatalyst for selective nitrate reduction to ammonia. Angew. Chem. Int. Ed. 59, 5350-5354 (2020).
34. Yin, H. B. et al. Alloying effect-induced electron polarization drives nitrate electroreduction to ammonia. Chem. Catal. 1, 1088-1103 (2021).
35. Zhang, L. L., Ding, L. X., Chen, G. F., Yang, X. F. & Wang, H. H. Ammonia synthesis under ambient conditions: selective electroreduction of dinitrogen to ammonia on black phosphorus nanosheets. Angew. Chem. Int. Ed. 58, 2612-2616 (2019).
36. Yu, W. L., Lewis, N. S., Gray, H. B. & Dalleska, N. F. Isotopically selective quantification by UPLC-MS of aqueous ammonia at submicromolar concentrations using dansyl chloride derivatization. ACS Energy Lett. 5, 1532-1536 (2020).
37. Lv, C. D. et al. Selective electrocatalytic synthesis of urea with nitrate and carbon dioxide. Nat. Sustain. 4, 868-876 (2021).
38. Hu, C. Y. et al. Surface plasmon enabling nitrogen fixation in pure water through a dissociative mechanism under mild conditions. J. Am. Chem. Soc. 141, 7807-7814 (2019).
39. Rosca, V. & Koper, M. T. M. Mechanism of electrocatalytic reduction of nitric oxide on Pt(100). J. Phys. Chem. B 109, 16750-16759 (2005).
40. Qin, J. Z. et al. Achieving high selectivity for nitrate electrochemical reduction to ammonia over MOF-supported clusters. J. Mater. Chem. A 10, 3963-3969 (2022).
41. Hammer, B. & Norskov, J. K. Why gold is the noblest of all the metals. Nature 376, 238-240 (1995).
42. Norskov, J. K., Abild-Pedersen, F., Studt, F. & Bligaard, T. Density functional theory in surface chemistry and catalysis. Proc. Natl. Acad. Sci. USA 108, 937-943 (2011).
43. Yang, H. et al. Intermediates adsorption engineering of electroreduction reaction in highly selective heterostructure Cu-based electrocatalysts for CO production. Adv. Energy Mater. 9, 1901396 (2019).
44. Zhang, X. et al. Optimum Cu nanoparticle catalysts for CO2 hydrogenation towards methanol. Nano Energy 43, 200-209 (2018).
45. Zheng, Y. et al. High electrocatalytic hydrogen evolution activity of an anomalous ruthenium catalyst. J. Am. Chem. Soc. 138, 16174-16181 (2016).
46. Li, Y., Wei, X. F., Han, S. H., Chen, L. S. & Shi, J. L. MnO2 electrocatalysts coordinating alcohol oxidation for ultra-durable hydrogen
and chemical productions in acidic solutions. Angew. Chem. Int. Ed. 60, 21464-21472 (2021).
47. Li, S. L. et al. Reconstruction-induced NiCu-based catalysts towards paired electrochemical refining. Energy Environ. Sci. 15, 3004-3014 (2022).
48. Ye, S. H. et al. Elucidating the activity, mechanism and application of selective electrosynthesis of ammonia from nitrate on cobalt phosphide. Energy Environ. Sci. 15, 760-770 (2022).
49. Niu, Z. D. et al. Tailored electronic structure by sulfur filling oxygen vacancies boosts electrocatalytic nitrogen oxyanions reduction to ammonia. Chem. Eng. J. 451, 138890 (2023).
50. Bernal, E. E. L., Maya, C., Valderrama, C. & Cortina, J. L. Valorization of ammonia concentrates from treated urban wastewater using liquid-liquid membrane contactors. Chem. Eng. J. 302, 641-649 (2016).
51. Liao, P. H., Chen, A. & Lo, K. V. Removal of nitrogen from swine manure wastewaters by ammonia stripping. Bioresour. Technol. 54, 17-20 (1995).
Acknowledgements
G. Q. Z. acknowledges the National Natural Science Foundation of China (Grant No. 52072359), the Recruitment Program of Global Experts and the Fundamental Research Funds for the Central Universities (WK2060000016). The numerical calculations in this paper have been done in the Supercomputing Center of University of Science and Technology of China. The authors are grateful to infrared beamline (BLO1B) at National Synchrotron Radiation Laboratory for the experimental beamtime support. This work was partially carried out at the Instruments Center for Physical Science, University of Science and Technology of China.
Author contributions
B.C.Z., Z.C.D., and G.Q.Z. contributed to the conception of the study. B.C.Z. performed the experiments. Y.X.C. conducted the Density Functional Theory (DFT) calculations analysis. M.Y.C. provided assistance with the Scanning Electron Microscope (SEM) analysis, and H.K.Z. assisted with the electrochemical in situ Fourier Transform Infrared (FTIR) spectroscopy analysis. P.Y.F., K.B.Q., and Y.Y.Z. provided help in the experimental part. G.Q.Z. contributed significantly to the analysis
and manuscript preparation. The project was supervised by G.Q.Z. All authors participated in the analysis with constructive discussions.
Competing interests
The authors declare no competing interests.
Additional information
Supplementary information The online version contains
supplementary material available at https://doi.org/10.1038/s41467-024-47025-w.
Correspondence and requests for materials should be addressed to Genqiang Zhang.
Peer review information Nature Communications thanks Mingfei Shao, and the other, anonymous, reviewer(s) for their contribution to the peer review of this work. A peer review file is available.
Reprints and permissions information is available at http://www.nature.com/reprints
Publisher’s note Springer Nature remains neutral with regard to jurisdictional claims in published maps and institutional affiliations.
Hefei National Research Center for Physical Sciences at the Microscale, CAS Key Laboratory of Materials for Energy Conversion Department of Materials Science and Engineering, University of Science and Technology of China, Hefei, Anhui 230026, China. These authors contributed equally: Bocheng Zhang, Zechuan Dai, Yanxu Chen. e-mail: gqzhangmse@ustc.edu.cn