تعزيز أداء تطور الهيدروجين الكهروكيميائي من خلال ديناميات الفقاعات الناتجة عن التلاحم Performance Enhancement of Electrocatalytic Hydrogen Evolution through Coalescence-Induced Bubble Dynamics

المجلة: Journal of the American Chemical Society، المجلد: 146، العدد: 14
DOI: https://doi.org/10.1021/jacs.4c02018
PMID: https://pubmed.ncbi.nlm.nih.gov/38538570
تاريخ النشر: 2024-03-27

تعزيز أداء تطور الهيدروجين الكهروكيميائي من خلال ديناميات الفقاعات الناتجة عن التلاحم

ألكسندر باشكاتوف، سونغ هاك بارك تشايان ديميركير جيفري أ. وود، مارك ت. م. كوبر، ديتلف لوهس §ودومينيك كروغ* مجموعة فيزياء السوائل، مركز ماكس بلانك لديناميات السوائل المعقدة ومركز ج. م. بورجر لديناميات السوائل، جامعة توينتي، إنشخيده، هولندا معهد لايدن للكيمياء، جامعة لايدن، لايدن، هولندا【المواد اللينة، الديناميكا السائلة والواجهات، معهد ميسا لتكنولوجيا النانو، مركز جي. إم. بورجر للديناميكا السائلة، جامعة توينتي، إنشخيده، هولندا §معهد ماكس بلانك للديناميات والتنظيم الذاتي، غوتنغن، ألمانياالبريد الإلكتروني: a.bashkatov@utwente.nl; d.j.krug@utwente.nl

الملخص

تطور فقاعات الغاز الناتجة عن الكهرباء أثناء التحليل الكهربائي للماء يمكن أن يعيق بشكل كبير كفاءة العملية العامة. لذلك، فإن تعزيز مغادرة الفقاعات الناتجة عن الكهرباء أثناء (التحليل الكهربائي للماء) يعد مفيدًا. بالنسبة لفقاعة واحدة، تحدث مغادرة من سطح القطب عندما تنتصر القوة الطافية على القوى المؤثرة لأسفل (مثل قوى التلامس، وقوى مارانغوني، والقوى الكهربائية). في هذا العمل، يتم دراسة ديناميات زوج من الفقاعات الناتجة أثناء تفاعل تطور الهيدروجين في تمت دراسة استخدام نظام الميكروإلكترود البلاتيني الثنائي بشكل منهجي من خلال تغيير مسافة الإلكترود والجهد الكاثودي. من خلال الجمع بين السرعة العالية

من خلال التصوير والتحليل الكهروكيميائي، نوضح أهمية تفاعلات الفقاعات مع بعضها البعض في عملية الانفصال. نُظهر أن تلاحم الفقاعات قد يؤدي إلى انفصال الفقاعات في وقت أبكر بكثير مقارنةً بتأثيرات الطفو وحدها، مما ينتج عنه معدلات تفاعل أعلى بكثير عند جهد ثابت. ومع ذلك، بسبب استمرار إدخال الكتلة والحفاظ على الزخم، قد تؤدي أحداث التلاحم المتكررة مع الفقاعات القريبة من القطب إلى دفع الفقاعات المنفصلة مرة أخرى إلى السطح بعد تيار حرج، والذي يزداد مع زيادة المسافة بين الأقطاب. يؤدي ذلك إلى استئناف نمو الفقاعات بالقرب من سطح القطب، يتبعه انفصال مدفوع بالطفو. بينما يكون هذا التكوين أقل ملاءمة عند المسافات الصغيرة بين الأقطاب، إلا أنه يثبت أنه مفيد جدًا عند المسافات الأكبر، مما يزيد من التيار المتوسط حتى 2.4 مرة مقارنةً بقطب واحد تحت الظروف التي تم استكشافها في هذه الدراسة.

مقدمة

من المحتمل أن تصبح التحليل الكهربائي للماء تقنية مركزية في -نظام الطاقة المحايد في المستقبل. بالإضافة إلى كونه ناقلاً محتملاً للطاقة ووقودًا، يعمل غاز الهيدروجين كمواد أولية للصناعات الكيميائية (مثل إنتاج الأمونيا للأسمدة) وصناعة الصلب (بديل الفحم)، والمصافي (الميثانول، والوقود الاصطناعي). ومع ذلك، تتطلب كفاءة العملية مزيدًا من التحسين للتنافس في سوق الطاقة وتمكين إنتاج الهيدروجين على نطاق واسع. في كل من الإلكتروليزر القلوي التقليدي وإلكتروليزر غشاء تبادل البروتون، يمكن أن يُعزى جزء كبير من الفائض المحتمل وبالتالي الخسائر إلى تكوين و فقاعات، موجودة عند الأقطاب وفي الكتلة. تقوم هذه الفقاعات بحجب الأقطاب الكهربائية عن طريق إخفاء مساحة سطحها النشطة، مما يقلل من عدد مواقع النواة. بالإضافة إلى ذلك، فإنها تزيد من المقاومة الأومية عن طريق حجب المسارات الموصلة للأيونات. لذلك من الضروري الحفاظ على منطقة إلكترود خالية من الفقاعات لضمان نشاط تحفيزي مستمر. سيساهم تحسين إزالة فقاعات الغاز وفهم أعمق لعمليات تطورها في تحسين كفاءة الطاقة في النظام.
تم تطوير طرق متنوعة للمساعدة في مغادرة الفقاعات، مصنفة على أنها نشطة (مثل،
الموجات الصوتية، القوى الطرد المركزي، الحمل الميكانيكي، تعديل الضغط، المجالات المغناطيسية الخارجية) والطرق السلبية. تشمل الطرق السلبية، المفضلة لكفاءتها في استهلاك الطاقة، بشكل أساسي تعديلات على السطح لتغيير قابلية البلل. من السطح الحفاز. على سبيل المثال، تسهل الأسطح فائقة المحبة للماء مغادرة الفقاعات في وقت مبكر بسبب الزاوية المنخفضة للتلامس عند واجهات السائل-الصلب.
يمكن أن تستفيد عملية إزالة الفقاعات أيضًا من الأسطح الكارهة للماء. أحد الأمثلة هو مفهوم التحليل الكهربائي الخالي من الفقاعات الذي يستخدم طبقة مسامية كارهة للماء بجوار إلكترود مسامي. هذا يمنع تكوين الفقاعات داخل المحفز، ويوجه الغاز الناتج من خلال التأثيرات الشعرية عبر الطبقة الكارهة للماء. مفهوم مختلف لتعزيز إزالة الغاز، والذي أظهر وعدًا بناءً على التحليل النظري، هو استخدام الجزر الكارهة للماء على القطب كأماكن تفضيلية للنواة. أيضًا، تم إثبات أن هذا ممكن عمليًا باستخدام أقطاب مغطاة جزئيًا ببقع كارهة للماء مصنوعة من بولي تترافلوروإيثيلين (PTFE). هذا يسمح بتوجيه الغاز المنتج بعيدًا عن المناطق النشطة من القطب الكهربائي مع إمكانية تقليل الفائض الناتج عن الفقاعات. بروسيو وآخرون أظهر أن، اعتمادًا على حجم المساحات البينية والمسافة بينها، يمكن التحكم في معايير إطلاق الغاز مثل حجم الفقاعات وموقعها، لكنه لم يدرس تأثير ذلك على أداء الأقطاب. مؤخرًا، قام ليك وآخرون. وجد أن مصفوفات الميكروبوست المطلية بالبلاتين المعبأة بكثافة تعزز من إطلاق فقاعات أصغر بشكل متسق من خلال تلاحمها المتبادل. بينما زاد ذلك من استقرار التيار مقارنةً بالأقطاب غير المنقوشة، إلا أنه لم يؤدِ إلى تحسينات في الأداء عند التطبيع حسب المساحة السطحية النشطة في هذا النظام، بسبب تكوين فقاعات إضافية بين الأعمدة. في هذا السياق، فإن إزالة الفقاعات الناتجة عن التلاحم تكتسب أهمية خاصة. يؤدي التلاحم إلى تقليل الطاقة السطحية، ويتم تحويل جزء من هذه الفروق إلى طاقة حركية، مما يتسبب في قفز الفقاعة عن السطح دون الاعتماد على الطفو. وهذا يجعل هذه العملية لإزالة الفقاعات جذابة للغاية أيضًا في تطبيقات الجاذبية الصغرى.
ومع ذلك، فإن الفهم التفصيلي للآلية وقياس مدى
لا يزال هناك نقص في كيفية استغلال الديناميات الناتجة عن التلاحم لتحسين أداء الأقطاب الكهربائية التي تطلق الغاز. وينطبق هذا أيضًا على تحسين المعلمات، نظرًا للتعقيدات مثل احتمال عودة الفقاعات إلى سطح القطب الكهربائي. غير تافه للغاية. نحن نتناول هذه الأسئلة المفتوحة في العمل الحالي من خلال دراسة الديناميات المدفوعة بالاندماج لفقاعات الهيدروجين الناتجة عن قطب ميكروي مزدوج أثناء التحليل الكهربائي للماء. يتيح هذا الإعداد الجديد التحكم الدقيق في المعلمات المهمة مثل حجم الفقاعات أثناء الاندماج، بينما يوفر أيضًا رؤية ممتازة للديناميات. نحن نثبت أن أحداث الاندماج قد تؤدي إلى مغادرة الفقاعات بشكل مبكر مقارنةً بتأثيرات الطفو وحدها وعودة الفقاعات المغادرة إلى سطح القطب، مما يغير بشكل كبير معدلات التفاعل. يظهر تكوين القطب الميكروي المزدوج، اعتمادًا على الجهد المطبق والمسافة بين الأقطاب، زيادة تصل إلى 2.4 مرة في التيار مقارنةً بقطب ميكروي واحد.

طرق

الأزواج من تم توليد الفقاعات الموضحة في الشكل 1a على سطح ميكرو-إلكترود مزدوج من البلاتين خلال تفاعل تطور الهيدروجين (HER). تم إجراء التجربة في خلية كيميائية كهربائية ثلاثية الأقطاب مملوءة بـ .
تم تصنيع الأقطاب الدقيقة المزدوجة وفقًا لطريقة تم تأسيسها مسبقًا. باختصار، سلكان من البلاتين ( ، تم ختم (غودفيلو) في شعيرة زجاجية من الصودا والجير (قطر خارجي القطر الداخلي هيلغنبرغ) عن طريق تليين الشعيرات بلطف في لهب. خمسة قيم مختلفة لمسافة بين الأقطاب الكهربائية تم إنشاء واختبار، كما هو موضح في الشكل 1ب. خضعت سطح القطب لتنظيف كيميائي كهربائي (تدوير الجهد بين مقابل RHE، تم تكرارها 50 مرة) بعد أن تم تلميعها ميكانيكياً بورق الصنفرة (2000 حبيبة)، وتمت معالجتها بالموجات فوق الصوتية وشطفها بالماء النقي للغاية. الخلية المستخدمة هنا تشبه إلى حد كبير تلك المستخدمة في الدراسات السابقة. يتم إدخال الميكرو-إلكترود الثنائي (الكاثود) أفقيًا موجهًا لأعلى في قاعدة مكعب.
كوبية زجاجية (هيلما) بأبعاد . يتم إكمال النظام بواسطة القطب المرجعي ( ) وقطب العكس ( سلك) تم إدخالهما عمودياً من الأعلى. يتم التحكم في الخلية الكهروكيميائية بواسطة جهاز قياس الجهد (BioLogic، VSP-300، 6 قنوات) عند جهد ثابت يتراوح بين -0.2 إلى -2.8 فولت (مقابل RHE). كل من القطبين متصل ويدار بواسطة قناة منفصلة من جهاز قياس الجهد. لكل تجربة، تم تسجيل التيار الكهربائي بمعدل أخذ عينات لا يقل عن 1 كيلو هرتز على مدى 30 ثانية. تسمح الخلية الشفافة بصرياً برؤية ديناميات فقاعات الغاز-
الشكل 1: (أ) مخطط للقطب الميكروي المزدوج واثنين من الفقاعات الجالسة على سجادة من الفقاعات الدقيقة. كل فقاعة متزايدة تخضع لتوازن قوى يشمل الطفو، والقوى الكهربائية، وقوى مارانغوني. تمثل الخطوط الحمراء كثافة التيار ( ) وتمثل خطوط التدفق السوداء على اليمين الحمل الحراري لمارانغوني بسرعة هي الطاقة الحركية المنبعثة أثناء تمازج الفقاعات اليسرى ( ) واليمنى ( ). (ب) منظر علوي للخمسة أقطاب ميكروية مزدوجة مع مسافات بين الأقطاب مختلفة .
الديناميات باستخدام نظام الظل. يتكون من إضاءة LED (SCHOTT، KL 2500) مع ميكروسكوب، متصل بكاميرا عالية السرعة (Photron، FASTCAM NOVA S16)، توفر دقة مكانية قدرها . عادة ما يتم تسجيل الصور بمعدل 5 كيلو هرتز، ما لم يُذكر خلاف ذلك. تم استخدام تسجيل عالي السرعة يصل إلى 264 كيلو هرتز لحل أحداث التمازج الفردية. تم استخراج نصف قطر الفقاعة بواسطة روتين معالجة الصور القياسية بناءً على طريقة كشف الحواف Canny في Matlab R2022b (للمزيد من التفاصيل، انظر المواد التكميلية في Bashkatov et al. ). لقياس مجالات السرعة حول الفقاعات المعروضة في الشكل 6، تم زرع جزيئات بولي ستيرين أحادية التشتت (microParticles GmbH) من في الإلكتروليت. هذه الجزيئات عائمة محايدة بكثافة كتلة قدرها . تم معالجة سلسلة الصور الناتجة، المسجلة بمعدل 1000 إطار في الثانية،
تمت معالجتها بواسطة برنامج DaViS 10، الذي يستخدم خوارزمية تتبع الجسيمات (PTV) لتتبع كل جزيء على مدى 25 مللي ثانية قبل المغادرة. بسبب العدد المحدود من الجزيئات القريبة من أو عند واجهة الفقاعة-الإلكتروليت، تم جمع المسارات الناتجة للجزيئات لـ 60 فقاعة. بعد ذلك، تم تحويل المسارات إلى حقل متجه باستخدام دالة تجميع تقوم بترتيب المسارات المحلية على شبكة دقيقة محددة.

قطب واحد

لتحديد الأساس، نبلغ باختصار عن النتائج للحالة التي يتم فيها تشغيل قطب واحد فقط، والتي تم دراستها سابقاً. كمثال، يظهر الشكل 2a التيار العابر ( ) ونصف القطر ( ) للفقاعة لثلاث دورات كاملة من تطور الفقاعة عند -1.0 فولت. تم تضمين صور الظل التي تتوافق مع دورة كاملة من النواة إلى المغادرة في الشكل 2b. هذه العملية دورية للغاية مع عمر فقاعة . يؤثر تطور الفقاعة بشكل كبير على تيار التفاعل، حيث تتزامن القيم القصوى في التيار الكاثودي المميزة بالدوائر الحمراء مع مغادرة الفقاعة. يتبع ذلك مباشرة نواة فقاعة جديدة، التي يؤدي نموها في محيط القطب إلى تقليل كبير في يصل إلى في هذه الحالة. يستمر هذا حتى مغادرة الفقاعة التالية، بعد ذلك تتكرر الدورة.
أخيرًا، يلخص الشكل 2c كيف يتغير متوسط التيار الكهربائي ، حيث تشير الخطوط العلوية إلى متوسط على ، ونصف القطر عند المغادرة ، وعمر الفقاعة لمختلف الجهود الكاثودية ( ). جميع الإحصائيات متوسطة على دورات فقاعات متعددة مع أشرطة خطأ تمثل الانحراف المعياري. يؤكد الشكل أيضًا أن النتائج المتسقة تم الحصول عليها من كلا القطبين.
في هذا النظام، يحدث تشكيل الفقاعات بالفعل عند جهد زائد منخفض. تتشكل فقاعات بحجم ميكرون على سطح القطب وتندمج باستمرار لتشكيل فقاعة أكبر واحدة. هذه الفقاعة الأكبر عادة لا تكون في اتصال مباشر مع سطح القطب، بل تقيم على طبقة من الفقاعات الدقيقة. تستمر في النمو عبر
الشكل 2: (أ) التيار الكهربائي ونصف القطر مع مرور الوقت يمثل ثلاث دورات كاملة من تطور الفقاعة عند عند قطب ميكروي واحد. تحدد الدوائر الحمراء لحظات النواة والمغادرة. (ب) صور الظل تعرض دورة التطور، المميزة باللون الرمادي في (أ). (ج) التيار الكهربائي المتوسط (دوائر)، نصف القطر عند المغادرة (مثلثات) وعمر الفقاعة (مربعات) مقابل الجهد للقطبين الأيمن (أسود) والأيسر (برتقالي)، تم تشغيلهما بشكل منفصل. تم تسجيل الصور بمعدل 500 إطار/ثانية.
التمازج مع هذه الفقاعات الدقيقة ومن خلال انتشار الغاز. في هذه الحالة، تحدث مغادرة الفقاعة بمجرد تجاوز القوى المحتفظة بسبب المجال الكهربائي، الحراري وذوباني تأثيرات مارانغوني بواسطة الطفو (انظر الشكل 1a). يرتبط تأثير مارانغوني الحراري بالتسخين الجوي الناتج عن كثافة التيار العالية محليًا عند قاعدة الفقاعة كما هو موضح في الشكل 1a. لذلك يتناسب التأثير (عبر قانون أوم) مع ويسود عند الجهود الزائدة العالية. من المتوقع أن يعتمد التأثير الذوباني بسبب استنفاد الإلكتروليت عند القطب بشكل خطي على وبالتالي يهيمن عند الجهود الزائدة المنخفضة ( فولت في الحالة الحالية). القوة الكهربائية تتناسب طرديًا مع وبالتالي تتناقص جميع القوى المحتفظة مع تقليل الجهد الزائد، مما يفسر الاتجاه المتناقص لنصف القطر عند المغادرة حيث يصبح أقل سلبية. نظرًا لأن الفقاعة تلتقط تقريبًا كل الغاز المنتج، 45،46 فإن فترة المغادرة تتبع الوقت الذي يستغرقه إنتاج الغاز المحتوى في حجم الفقاعة و وبالتالي تتناسب مع .

قطب مزدوج

أنماط تطور الفقاعات

من الآن فصاعدًا، يتم تشغيل كلا القطبين في وقت واحد، بشكل مستقل عن بعضهما البعض، وعند نفس الجهد. في البداية، سننظر فقط في الزوج الذي يفصل بين . تم رسم التيارات المقاسة لهذه التكوين في الشكل 3a لجهود مختلفة. تم تضمين تتبع الوقت للتيار لكل من القطبين (‘الأيسر’ و ‘الأيمن’) وللإشارة، نعرض أيضًا إشارة التيار المقاسة عند تشغيل قطب واحد فقط عند نفس الجهد (الخط الرمادي). مع التركيز في البداية على الجهد الزائد الأدنى، ، تظل تذبذبات التيار دورية أثناء التشغيل المزدوج؛ ومع ذلك، فإن كل من الفترة والسعة تتناقص بشكل ملحوظ. يمكن فهم سبب ذلك من صور الظل المقابلة المقدمة في الشكل 3b، التي توضح ديناميات الفقاعات على مدى فترة واحدة (موضحة بالصندوق الأسود في الشكل 3a).
على غرار ما لوحظ لقطب واحد، تتشكل فقاعة أكبر وتنمو في البداية عند كل من القطبين، مما يؤدي إلى تقليل تدريجي في التيار. تستمر هذه العملية حتى تلمس الفقاعتان وتندمجان، مما يتبعه مغادرة الفقاعة المدمجة مع ارتفاع في التيار (انظر الإطار في -0.3 فولت في الشكل 3a). يوضح الشكل 3c هذه العملية التمازج، التي تحدث في حدود الميكروثانية، والتشوهات الناشئة لشكل الفقاعة. يتم تشغيل القفزة الناتجة عن التمازج بواسطة الطاقة السطحية المنبعثة. بينما يتم استهلاك معظم هذه الطاقة من خلال الأمواج الشعرية التي تظهر في الشكل يمكن أن تتسبب النسبة التي تتحول إلى طاقة حركية (أقل من ، لمزيد من التفاصيل انظر المعلومات الداعمة) في مغادرة الفقاعة عند نصف قطر أصغر بكثير من السيناريو المدفوع بالطفو، للفقاعة الجديدة المتكونة. مع حقيقة أن كل من الفقاعات المتمازجة تساهم فقط بنصف الحجم، يفسر هذا تكرار المغادرة المعزز بشكل كبير.
عند جهد زائد أعلى عند ، تبدأ الأحداث ذات طول الفترة الأطول في الظهور بشكل متقطع في تتبعات التيار. تصبح هذه الأحداث أكثر تكرارًا و
الشكل 3: (أ) التيار الكهربائي على مدى ثانيتين (من 30 ثانية) من التجربة عند جهود مختلفة تمثل المنحنيات السوداء والبرتقالية التيار الكهربائي المقاس عند الأقطاب اليمنى واليسرى، على التوالي. تمثل الخطوط الرمادية النتائج المقابلة لتشغيل القطب الفردي. (ب) تعرض اللقطات تطور الفقاعات بعد الوضع I كما هو موضح في (أ) بواسطة الإطار المستطيل الأسود عند -0.3 فولت. (ج) تعرض اللقطات تفاصيل عملية المغادرة المدفوعة بالاندماج المسجلة عند -0.5 فولت. هو إطار واحد قبل بدء عملية التمازج. (د) عرض مكبر للتيار عند -0.7 فولت، كما هو موضح بالمستطيل الأخضر في (أ)، مع التطور المقابل لـ . تت correspond الألوان البرتقالية والزرقاء إلى الوضعين I و II، على التوالي. (e) الوضع II لتطور الفقاعات من (d). تشير الخط الأحمر إلى أقصى ارتفاع وصل إليه الفقاعة المنفصلة. تم التسجيل في (b) و (e) عند 5 كيلو هرتز، وعند 264 كيلو هرتز في (c).
تسيطر على الإشارة في ، قبل أن تحل تقريبًا محل نمط التلاقي عالي التردد في لتوضيح الديناميات الأساسية للفقاعات، نقدم عرضًا مكبرًا لجزء من إشارة التيار عند (صندوق أخضر) في
الشكل 3d مع تطور حجم الفقاعات. كانت مغادرة الفقاعة الأولى المضمنة في الشكل 3d تسير بشكل مشابه لتلك المعروضة في الشكل 3b، وتستمر الفقاعة في الارتفاع بعيدًا عن القطب بعد الإقلاع الناتج عن التلاحم. سنشير إلى هذا باسم ‘الوضع I’ من الآن فصاعدًا. ومع ذلك، كما تظهر الظلال المقابلة في الشكل 3e، على الرغم من أن الفقاعة تقفز أيضًا بعد حدث التلاحم الثاني، إلا أنها تُعاد في النهاية إلى السطح من خلال التلاحم المتكرر مع فقاعات جديدة تتشكل عند كلا القطبين (انظر الفترة بين و ). بعد هذا العودة، تستقر الفقاعة بين القطبين الكهربائيين فوق السطح مباشرة. هناك، تستمر في النمو حتى يحدث انفصال مدفوع بالطفو (عند مقابل )، مما يفسر عمرًا أطول بمقدار ترتيب من الحجم ( مقابل ) من الفقاعة في هذه الحالة. سنشير إلى ذلك باسم ‘وضع العودة’ أو ‘الوضع الثاني’.
من الواضح من الشكل 3a أن الديناميات الناتجة عن الاندماج لها تأثير قوي ليس فقط على تقلبات التيار، ولكن أيضًا على متوسط التيار عند جهد معين. لتحليل ذلك، نقارن بين متوسطات التيارات لفترتين للطريقتين. و ، يُعتبر مجموع التيارات عند كلا القطبين إلى في الشكل 4. لاحظ أن
الشكل 4: التيار الكهربائي مقابل الإمكانية لإلكترود واحد (أسود) وللأنماط I (أزرق) وII (أحمر) في الميكروإلكترود المزدوج. كلاهما و هي مجموع التيارات عند الأقطاب اليسرى واليمنى.
من الممكن تحديد حتى عند الجهود العالية حيث يسود الوضع الثاني من خلال اعتبار الوقت حتى التلاحم الأول، مما يؤدي إلى مغادرة مؤقتة للفقاعة (انظر الشكل 3د). على الرغم من إزالة الغاز بشكل أسرع بكثير، إلا أن التيار عند الجهود المنخفضة الزائدة ( V) يبقى كما هو أو حتى ينخفض قليلاً في التشغيل المزدوج مقارنةً بحالة القطب المفرد. يمكن أن يُعزى ذلك إلى الحماية الإضافية التي يوفرها الفقاعة الثانية في محيط القطب والمنافسة الانتشارية بين موقعَي التفاعل، وكلاهما يقلل من الأداء. ومع ذلك، فإن فوائد إزالة الغاز المعجلة تتجاوز هذه التأثيرات بشكل متزايد مع زيادة الجهد الزائد. وهذا صحيح بشكل خاص في الوضع I، حيث يكون التيار أكثر من ضعف ذلك للقطب المفرد عند نفس الجهد للقيم الأكثر سلبية. تم التحقيق. بينما يُظهر هذا بوضوح الإمكانية لتحسين الأداء من خلال إزالة الغاز الناتجة عن التكتل، فإن تحسين الأداء الفعلي ينخفض إلى أقل من للفجوة الحالية بين الأقطاب الكهربائية بسبب انتشار عودة الفقاعات (الوضع II) عند الفائض الكهربائي الأعلى. التيارات في الوضع II تكون باستمرار أقل مقارنةً بالوضع I لأن المسافة بين الأقطاب الكهربائية صغيرة جداً، مما يجعل الفقاعة العائدة تحجب جزءاً كبيراً من كلا الأقطاب (انظر الشكل 3e)، على الرغم من أنها تقع في منتصف الطريق بينهما.

مخطط الطور

لفهم أفضل تحت أي ظروف يحدث عودة الفقاعة بعد القفز، توثق الشكل 5 الاحتمالية ( ) للعائد لمسافات مختلفة بين الأقطاب وكوظيفة لـ (الشكل 5أ) و (الشكل 5ب). كما يزداد، الانتقال من الوضع I ( دوائر)، إلى نظام مختلط ( ، مثلثات) وأخيرًا إلى الوضع II ( تحدث عند قيم أكبر بشكل متزايد من . في الواقع، الاعتماد على قوي جدًا: لجهد ثابت من تغييرات من حوالي في إلى ما يقرب من 0 عندما تزداد المسافة إلى توضح الرسمة في الشكل 5c الآلية ذات الصلة لعودة الفقاعة. فقاعة جديدة التكوين (بشعاع ) على أحد الأقطاب الكهربائية تلتحم مع الفقاعة المنفصلة
الشكل 5: مخطط الطور الذي يمثل الاحتمالية فقاعة العودة بعد المغادرة الأولية موضحة من حيث (أ) الإمكانية و (ب) الحالية مقابل شريط الألوان يقيس الاحتمالية من 0 إلى . الدوائر تشير إلى السيناريو الأول، أي عندما أقل من ، والمربعات تشير إلى السيناريو الثاني، مع أكثر من . المثلثات تشير إلى نظام مختلط، حيث تتفاوت الاحتمالية بشكل كبير من 5 إلى خطوط حمراء ترسم باستخدام المعادلة 1. (ج) الرسم التوضيحي الذي يوضح الهندسة ذات الصلة لعودة الفقاعة. (د) سرعة القفز العمودية المتوسط على أول 0.5 مللي ثانية من القفزة مقابل لعدد كبير من الفقاعات. الخط يمثل القيم المتوسطة في كل ، مكتمل مع الانحراف المعياري.
مع نصف القطر . بسبب حفظ الزخم، فإن الفقاعة الناتجة تقع بعد ذلك في مركز الكتلة المشترك للفقاعتين المتداخلتين، مما يعني حدوث انزلاق نحو الأسفل بواسطة مقارنة بموقع الفقاعة ذات نصف القطر تؤدي أحداث التلاحم المتكررة من كلا الجانبين إلى إعادة الفقاعة إلى السطح كما هو موضح في الشكل 3e. الانتقال
بين الوضع I والوضع II يتم التحكم فيهما بالتالي من خلال تنافس بين سرعة مغادرة أو ‘قفز’ الفقاعة بعد الاندماج ومعدل نمو الفقاعات عند القطب. إن مقدار التيار الكهربائي الأكبر، الذي يزداد تقريبًا بشكل خطي مع (انظر الشكل 6)، يمكّن من تشكيل فقاعات جديدة بشكل أسرع مما يزيد من احتمال تفاعلها مع الفقاعة التي غادرت سابقًا. عند زيادة يحتاج الوريث الفقاعي إلى النمو إلى حجم أكبر، وبالتالي لفترة أطول قبل التفاعل مع الفقاعة التي غادرت بالفعل، مما يسمح للأخيرة بالابتعاد أكثر. سيؤدي ذلك إلى زيادة كبيرة في التيار المطلوب لوضع العودة. يمكننا التقاط ذلك في نموذج بسيط يعتمد على الهندسة الموضحة في الشكل 5 ج للتنبؤ بالتيار الأدنى. لعودة الفقاعة. تحليلنا يأخذ في الاعتبار الحالة التي تكون فيها الفقاعة الجديدة ذات نصف قطر لقد نمت بشكل كافٍ للتواصل مع الفقاعة المغادرة. الوقت الذي يستغرقه نمو الفقاعة إلى نصف القطر هو ، حيث هو عامل مسبق يحتوي على ثابت فاراداي الضغط داخل الفقاعة ثابت الغاز ودرجة الحرارة (انظر المعلومات الداعمة للتفاصيل). خلال هذه الفترة الزمنية، تسافر الفقاعة المغادرة المسافة ، مع تشير إلى سرعة القفز الفعالة. استنادًا إلى هندسة المثلث الذي يمتد بين مراكز الفقاعتين والنقطة A في الشكل 5c، فإن التيار الحرج لانتقال الوضع كدالة لـ يتم إعطاؤه بواسطة
لأي قيمة يمكن تحديده من أجل أي يصل إلى قيمة دنيا، للحصول على قيمة التيار الحالي في هذا التكوين الحرج، يتطلب الأمر تقدير سرعة القفز. للحصول على ذلك، قمنا بتتبع الفقاعات التي تغادر بعد التلاحم ثم قمنا بحساب متوسط سرعتها الرأسية على مدى 0.5 مللي ثانية الأولى للحصول على لاحظ أن يختلف بشكل كبير اعتمادًا على موضع الفقاعتين قبل الاندماج (انظر المعلومات الداعمة للتفاصيل). تظهر النتائج لهذه الكمية في الشكل 5d كدالة لـ . من هذه البيانات، القيم النموذجية لـ توجد في النطاق من إلى
مع ميل طفيف نحو سرعات أعلى مع زيادة حجم الفقاعات عند زيادة تباعد الأقطاب الكهربائية. . في الشكل 5ب، قمنا بتضمين النتائج لـ كنتيجة لـ ولقيم مختلفة من يمكن ملاحظة أن النموذج يلتقط بشكل جيد جدًا زيادة التيار الحرج مع زيادة فصل الأقطاب. أفضل توافق بين النموذج والبيانات هو لـ ، والذي قريب من، على الرغم من كونه أقل قليلاً، من سرعات القفز المقاسة في الشكل 5d. من بين عوامل محتملة أخرى، فإن سبب هذه الفجوة الطفيفة هو حقيقة أن الفقاعة الجديدة ذات نصف القطر يتشكل أيضًا من خلال التمازج وبالتالي يقفز أيضًا عن القطب. بالإضافة إلى ذلك، لا نأخذ في الاعتبار اهتزازات الشكل للفقاعات الأكبر، التي تصبح أكثر شيوعًا عند الأحجام الأكبر. .

الأداء مقابل مسافة بين الأقطاب

لفهم كيف يتغير التيار عند مسافات أقطاب مختلفة، من المفيد أولاً أن نأخذ في الاعتبار كيف يتغير حجم خروج الفقاعات لمختلف . في الوضع الأول، يكون المغادرة مدفوعة بالاندماج بحيث مستقل عن ويختلف فقط مع مسافة بين الأقطاب . بسبب الاهتزازات الجانبية لموقع الفقاعة على القطب الكهربائي وربما ميل طفيف لأسطح الأقطاب، فإن النتائج لـ الموضح في الشكل 6أ هو حوالي أقل من أي، القيمة لتجمع فقاعتين كل منهما بقطر . تم أخذ هذه الفروق الصغيرة في الاعتبار عند التقييم في المعادلة 1.
مقارنةً بالقطب الكهربائي الفردي، فإن التيار في الوضع I الموضح في الشكل 6b يكون معززًا بشكل أكبر عند الجهد الزائد العالي وصغير ، لأنه في هذه الحالة يكون تقليل حجم مغادرة الفقاعات في أقصى حد. هناك فقط انخفاض معتدل في لأكبر بشكل أساسي بسبب النطاق النسبي الصغير في وبالتالي، في ، وهو أمر بسيط مقارنة بالتغيرات الملحوظة في عند إمكانيات مختلفة. عند الفائض المنخفض، للفواصل الأكبر بين الأقطاب التي تم دراستها ولا يوجد زيادة في التيار مقارنة بـ تمامًا كما لوحظ في في الشكل 4.
في الوضع الثاني، يعتمد نصف قطر المغادرة بشكل كبير على الجهد ولكن بشكل ضعيف في الغالب.
الشكل 6: نصف قطر المغادرة (أ) “، (ج) والتيار الكهربائي (ب) ، (د) للوضاع و على التوالي. يتم إعطاؤه كدالة لـ و تظهر كدوال للإمكانات ولأغراض متنوعة المنحنيات الرمادية تمثل القطب الفردي. (هـ) و (و) مجالات السرعة، ، تمثيل الحمل مارانغوني خلال الوضع الثاني عند -2.8 فولت و و على التوالي. يتم قياس السرعة في فترة زمنية قدرها 25 مللي ثانية قبل مغادرة الفقاعة.
على كما هو موضح في الشكل 6c. من المRemarkably، تقريبًا نفس الشيء كما هو الحال في حالة القطب الفردي عند نفس الجهد (انظر الرموز الرمادية التي تمثل ). تحقيق في توازن القوة مما يؤدي إلى هذه الاتجاهات في تتجاوز نطاق هذه الدراسة. ومع ذلك، نقدم أدلة واضحة على الحمل الحراري مارانغوني (انظر الأشكال 6(e,f))، متسقة مع وجود تأثيرات حرارية سطحية في نفس النطاق المحتمل على الأقطاب الفردية. استنادًا إلى اتجاه التدفق، من المتوقع أن تكون هناك قوة مارانغوني نازلة على الفقاعة (انظر الشكل 1أ). الحركة الحملية أكثر وضوحًا بكثير في (الشكل 6f) مقارنةً بالمسافة الأضيق لـ في الشكل 6e، الذي يتماشى مع الفرق في التيار بين الحالتين مقابل 8.46 مللي أمبير، على التوالي). من المثير للاهتمام أن هذا لا يؤدي إلى فرق ملحوظ في للمسافات المختلفة بين الأقطاب، والتي يُفترض أنها ناتجة عن اختلافات في القوة الكهربائية المعتمدة على الهندسة. أكدنا أن التمازج المستمر مع الفقاعات الصغيرة
لا تمارس قوة ظاهرة كبيرة على الفقاعة (انظر المعلومات الداعمة للتفاصيل).
على عكس الوضع الأول، يظهر التيار في الوضع الثاني الموضح في الشكل 6d اعتمادًا واضحًا على تباعد الأقطاب الكهربائية ويزداد بشكل كبير مع زيادة . هذا لأن الفقاعة الآن مركزها بين القطبين. لذلك تصبح الأقطاب أكثر تعرضًا كلما زادت المسافة بينهما، حتى لو ظل حجم الفقاعة كما هو. إن الإزالة المستمرة للفقاعات الصغيرة على القطب من خلال التلاحم مع الفقاعة الأكبر تثبت أنها مفيدة جدًا وتؤدي إلى تيارات قصوى تزيد عن الضعف. مساويًا لأكبر التيارات التي تم ملاحظتها في الوضع الأول.
الشكل 7: التيار الكهربائي (أ) ، (ب) و (ج) جميعها في شكل بلا أبعاد مع الإشارة إلى تُعرض البيانات كدالة للجهد ( ) والمسافة بين الأقطاب ( ). يوضح الشكل في (ب) مقابل في و -2.8 فولت. المقتطف في (ج) يوثق مقابل هو المتوسط الحالي على كلا الوضعين و الوضع الثاني . (د) لقطات خلال تطور الفقاعة عند -2.8 فولت و يحدد لحظة زمنية صورة واحدة قبل تداخل فقاعتين (بأقطار و ، على التوالي) تليها قفزة الفقاعة المدمجة عن القطب الكهربائي وعودتها المتتالية. يوضح الشكل الفرعي التيار الكهربائي طوال التطور الكامل، مع الدوائر الحمراء التي تحدد اللقطات المقابلة.
لتحديد مقدار زيادة الأداء ولتعويض عن اعتماد التيار، نقوم بتطبيع التيار على القطب الثنائي بواسطة . هذا أيضًا يفسر الفروق الصغيرة
في بين الأقطاب الكهربائية المختلفة المستخدمة في هذه الدراسة (انظر المعلومات الداعمة). في الشكل 7أ، النسبة يتم رسمه لمختلف كنتيجة لـ كما توضح الشكل، فإن تأثيرات التداخل عند الجهود الزائدة المنخفضة التي تم مناقشتها بالفعل في سياق الشكل 3، تسبب حتى تنخفض دون لـ . هذا لا يتحسن بشكل ملحوظ مع زيادة تباعد الأقطاب، على الأرجح بسبب التوازن بين تقليل تأثيرات التداخل وزيادة حجم الفقاعة مع لجهود التحفيز الأكبر، تسود فوائد إزالة الغاز المعززة، كما يتضح في نسبة الذي يزيد باستمرار مع زيادة الجهد الزائد متجاوزًا قيمة 2 عند تُواجه تقريبًا نفس القيم أيضًا لهذا الجهد بالنسبة للنسبة في الشكل 7 ب. بينما يتحسن الأداء في الوضع II قليلاً أيضاً عند زيادة الجهد الزائد، فإنه يعتمد بشكل أكبر على كما يظهر الإدراج في الشكل 7ب، النسبة يزداد تقريبًا بشكل خطي مع عند جهد ثابت.
أخيرًا، توضح الشكل 7 ج كيف أن التيار الفعال الناتج على القطب الثنائي التغييرات بالنسبة إلى . بالإضافة إلى الاختلافات في و ، هذه الكمية تتأثر أيضًا بالاحتمالية لعودة الفقاعة (الوضع II). بالنظر إلى النتائج في الشكل 5أ، فإن النسبة لذلك يتم السيطرة على الوضع الأول في الجهد المنخفض والوضع الثاني في الجهد العالي. وهذا يعني أن مكاسب الأداء في الوضع الأول عند الجهد العالي ليست قابلة للتحقيق عمليًا. ومع ذلك، فإن هذه مجرد قيود عند المسافات الصغيرة بين الأقطاب، حيث إن التيار في الوضع II يتجاوز حتى ذلك في الوضع I لـ و (انظر الشكل 7c). في هذه الحالات، فإن الانتقال بين الأوضاع يكون مفيدًا حتى.
تظهر الشكل 7d لقطات لمجموعة المعلمات و الذي له أعلى نسبة تمت ملاحظته. وجود الفقاعة المعادة في المركز بين الأقطاب الكهربائية يتجنب تكوين فقاعات أكبر مباشرة على الأقطاب. ومن الجدير بالذكر أنه لوحظ فقط انخفاض طفيف في التيار (انظر الشكل المصغر في ) حيث يتحرك مخطط الفقاعة خارج مواقع الأقطاب. هذا يتعارض مع الممارسة الشائعة التي تعتبر المنطقة تحت الفقاعة غير نشطة ولكنه يتماشى مع التخمينات السابقة.

الاستنتاجات

لقد استكشفنا ديناميات تمازج الفقاعات الناتجة عن الكهرباء وتأثيرها على معدل التفاعل الكهروكيميائي باستخدام أقطاب ميكروية من البلاتين. وجدنا أن تمازج فقاعتين متجاورتين يؤدي إلى قفزة أولية للفقاعة المدمجة وهروب مبكر من السطح. ومع ذلك، قد يؤدي التمازج المستمر مع الفقاعات الجديدة المتكونة إلى العودة إلى القطب، مما يؤدي إلى نمو مطول. يصبح هذا النمط الأخير أكثر شيوعًا كلما زادت شدة التيار وقلّت المسافة بين الأقطاب. اقترحنا نموذجًا بسيطًا لالتقاط هذه الاتجاهات والتنبؤ بالحجم الحرج للتيار المطلوب لبدء عملية العودة. هذا النمط من العودة ينفي التحسين المحتمل في الأداء الذي تم تحقيقه من خلال المغادرة المباشرة بعد حدث التمازج عند مستويات أصغر. (حتى زيادة تصل إلى 1.7- مقابل 2.3 ضعف في التيار عند جهد ثابت عند مقارنتها بقطب كهربائي واحد). ومع ذلك، حتى في حالات عودة الفقاعات، فإن التيار الفعال عند أحجام أكبر زاد بمقدار يصل إلى 2.4 مرة لأن الفقاعة كانت تقع حينها بين الأقطاب، مما يعرض مساحة أكبر من الأقطاب للتفاعل. لذلك، فإن هذه الطريقة واعدة، خاصةً أنه، بالنظر إلى الاعتماد على مسافة الأقطاب، يمكن توقع تحقيق مكاسب أداء أكبر من خلال زيادة المسافة أكثر. في الممارسة العملية، يمكن تحقيق تكوين مشابه على أقطاب موسعة باستخدام جزر كارهة للماء، يجب أن تكون متباعدة لتفضيل مغادرة تعتمد على التكتل وتقليل احتمال عودة الفقاعات، وبالتالي تجنب انسداد مساحة السطح النشطة.

تعارض المصالح

لا توجد صراعات للإعلان عنها.

شكر وتقدير

تلقى هذا البحث تمويلاً من مجلس البحث الهولندي (NWO) مع تمويل مشترك تم الحصول عليه من نوبين ومركز هيلمهولتز دريسدن-روسندورف (HZDR) في إطار تحويل المواد الكيميائية الكهربائية (ECCM) KICkstart DE-NL (KICH1.ED04.20.009). يشكر S.P. الدعم المقدم من برنامج البحث العلمي الأساسي من خلال مؤسسة البحث الوطنية الكورية (NRF) الممولة من وزارة التعليم (2021R1A6A3A14039678).
تلقى D.K. و D.L. و M.T.M.K. تمويلاً من المجلس الأوروبي للبحث (ERC) (رقم اتفاق منحة BU-PACT 950111، رقم منحة متقدمة ERC 740479-DDD ورقم منحة متقدمة ERC ‘FRUMKIN’ 101019998، على التوالي). نشكر V. Sanjay على المناقشات المثمرة حول هذا الموضوع.

References

(1) Brandon, N. P.; Kurban, Z. Clean energy and the hydrogen economy. Philosophical Transactions of the Royal Society A: Mathematical, Physical and Engineering Sciences 2017, 375, 20160400.
(2) Staffell, I.; Scamman, D.; Abad, A. V.; Balcombe, P.; Dodds, P. E.; Ekins, P.; Shah, N.; Ward, K. R. The role of hydrogen and fuel cells in the global energy system. Energy Environmental Science 2019, 12, 463-491.
(3) Dawood, F.; Anda, M.; Shafiullah, G. Hydrogen production for energy: An overview. International Journal of Hydrogen Energy 2020, 45, 3847-3869.
(4) Lee, J. K.; Lee, C.; Fahy, K. F.; Kim, P. J.; Krause, K.; LaManna, J. M.; Baltic, E.; Jacobson, D. L.; Hussey, D. S.; Bazylak, A. Accelerating bubble detachment in porous transport layers with patterned through-pores. ACS Applied Energy Materials 2020, 3, 9676-9684.
(5) Swiegers, G. F.; Terrett, R. N.; Tsekouras, G.; Tsuzuki, T.; Pace, R. J.; Stranger, R. The prospects of developing a highly energy-efficient water electrolyser by eliminating or mitigating bubble effects. Sustainable Energy & Fuels 2021, 5, 1280-1310.
(6) Yu, S.; Li, K.; Wang, W.; Xie, Z.; Ding, L.; Kang, Z.; Wrubel, J.; Ma, Z.; Bender, G.; Yu, H.; others Tuning Catalyst Activation and Utilization Via Controlled Electrode Patterning for Low-Loading and High-Efficiency Water Electrolyzers. Small 2022, 18, 2107745.
(7) Yuan, S.; Zhao, C.; Cai, X.; An, L.; Shen, S.; Yan, X.; Zhang, J. Bubble evolution and transport in PEM water electrolysis: Mechanism, impact, and management. Progress in Energy and Combustion Science 2023, 96, 101075.
(8) Zhao, X.; Ren, H.; Luo, L. Gas bubbles in electrochemical gas evolution reactions. Langmuir 2019, 35, 5392-5408.
(9) Angulo, A.; van der Linde, P.; Gardeniers, H.; Modestino, M.; Rivas, D. F. Influence of bubbles on the energy conversion efficiency of electrochemical reactors. Joule 2020, 4, 555-579.
(10) Angulo, A. E.; Frey, D.; Modestino, M. A. Understanding bubble-induced overpotential losses in multiphase flow electrochemical reactors. Energy & Fuels 2022, 36, 7908-7914.
(11) Shih, A. J.; Monteiro, M. C.; Dattila, F.; Pavesi, D.; Philips, M.; da Silva, A. H.; Vos, R. E.; Ojha, K.; Park, S.; van der Heijden, O.; others Water electrolysis. Nature Reviews Methods Primers 2022, 2, 84.
(12) He, Y.; Cui, Y.; Zhao, Z.; Chen, Y.; Shang, W.; Tan, P. Strategies for bubble removal in electrochemical systems. Energy Reviews 2023, 100015.
(13) Gross, S. J.; McDevitt, K. M.; Mumm, D. R.; Mohraz, A. Mitigating bubble traffic in
gas-evolving electrodes via spinodally derived architectures. ACS Applied Materials Interfaces 2021, 13, 8528-8537.
(14) Tang, Z.; Wang, P.; Xu, B.; Meng, L.; Jiang, L.; Liu, H. Bioinspired Robust Water Repellency in High Humidity by Micro-meter-Scaled Conical Fibers: Toward a LongTime Underwater Aerobic Reaction. Journal of the American Chemical Society 2022, 144, 10950-10957.
(15) Krause, L.; Skibińska, K.; Rox, H.; Baumann, R.; Marzec, M. M.; Yang, X.; Mutschke, G.; Żabiński, P.; Lasagni, A. F.; Eckert, K. Hydrogen Bubble Size Distribution on Nanostructured Ni Surfaces: Electrochemically Active Surface Area Versus Wettability. ACS Applied Materials & Interfaces 2023, 15, 18290-18299.
(16) Nam, Y.; Aktinol, E.; Dhir, V. K.; Ju, Y. S. Single bubble dynamics on a superhydrophilic surface with artificial nucleation sites. International Journal of Heat and Mass Transfer 2011, 54, 1572-1577.
(17) Lu, Z.; Zhu, W.; Yu, X.; Zhang, H.; Li, Y.; Sun, X.; Wang, X.; Wang, H.; Wang, J.; Luo, J.; others Ultrahigh hydrogen evolution performance of under-water “superaerophobic” nanostructured electrodes. Advanced Materials 2014, 26, 2683-2687.
(18) Li, Y.; Zhang, H.; Xu, T.; Lu, Z.; Wu, X.; Wan, P.; Sun, X.; Jiang, L. Under-water superaerophobic pine-shaped Pt nanoarray electrode for ultrahigh-performance hydrogen evolution. Advanced Functional Materials 2015, 25, 1737-1744.
(19) Hao, J.; Yang, W.; Huang, Z.; Zhang, C. Superhydrophilic and superaerophobic copper phosphide microsheets for efficient electrocatalytic hydrogen and oxygen evolution. Advanced Materials Interfaces 2016, 3, 1600236.
(20) Iwata, R.; Zhang, L.; Wilke, K. L.; Gong, S.; He, M.; Gallant, B. M.; Wang, E. N. Bubble growth and departure modes on wettable/non-wettable porous foams in alkaline water splitting. Joule 2021, 5, 887-900.
(21) Andaveh, R.; Darband, G. B.; Maleki, M.; Rouhaghdam, A. S. Superaerophobic/superhydrophilic surfaces as advanced electrocatalysts for the hydrogen evolution reaction: a comprehensive review. Journal of Materials Chemistry A 2022, 10, 51475173.
(22) Cheng, X.; Du, Z.-d.; Ding, Y.; Li, F.-y.; Hua, Z.-s.; Liu, H. Bubble Management for Electrolytic Water Splitting by Surface Engineering: A Review. Langmuir 2023,
(23) Winther-Jensen, O.; Chatjaroenporn, K.; Winther-Jensen, B.; MacFarlane, D. R. Towards hydrogen production using a breathable electrode structure to directly separate gases in the water splitting reaction. International Journal of Hydrogen Energy 2012, 37, 8185-8189.
(24) Tiwari, P.; Tsekouras, G.; Wagner, K.; Swiegers, G. F.; Wallace, G. G. A new class of bubble-free water electrolyzer that is intrinsically highly efficient. International Journal of Hydrogen Energy 2019, 44, 23568-23579.
(25) Tsekouras, G.; Terrett, R.; Yu, Z.; Cheng, Z.; Swiegers, G. F.; Tsuzuki, T.; Stranger, R.; Pace, R. J. Insights into the phenomenon of ‘bubble-free’ electrocatalytic oxygen evolution from water. Sustainable Energy & Fuels 2021, 5, 808-819.
(26) Hodges, A.; Hoang, A. L.; Tsekouras, G.; Wagner, K.; Lee, C.-Y.; Swiegers, G. F.; Wallace, G. G. A high-performance capillary-fed electrolysis cell promises more costcompetitive renewable hydrogen. Nature Communications 2022, 13, 1304.
(27) Kadyk, T.; Bruce, D.; Eikerling, M. How to Enhance Gas Removal from Porous Electrodes? Scientific Reports 2016, 6.
(28) Teschke, O.; Galembeck, F. A New Type of Separator for High Temperature Water Electrolyzers. Journal of The Electrochemical Society 1983, 130, 33-36.
(29) Teschke, O.; Galembeck, F. Effect of PTFE Coverage on the Performance of Gas Evolving Electrodes. Journal of The Electrochemical Society 1984, 131, 1095-1097.
(30) Brussieux, C.; Viers, P.; Roustan, H.; Rakib, M. Controlled electrochemical gas bubble release from electrodes entirely and partially covered with hydrophobic materials. Electrochimica Acta 2011, 56, 7194-7201.
(31) Lake, J. R.; Soto, Á. M.; Varanasi, K. K. Impact of Bubbles on Electrochemically Active Surface Area of Microtextured Gas-Evolving Electrodes. Langmuir 2022, 38, 3276-3283.
(32) Matsushima, H.; Nishida, T.; Konishi, Y.; Fukunaka, Y.; Ito, Y.; Kuribayashi, K. Water electrolysis under microgravity: Part 1. Experimental technique. Electrochimica Acta 2003, 48, 4119-4125.
(33) Zhou, J.; Zhang, Y.; Wei, J. A modified bubble dynamics model for predicting bubble departure diameter on micro-pin-finned surfaces under microgravity. Applied Thermal Engineering 2018, 132, 450-462.
(34) Brinkert, K.; Richter, M. H.; Akay, Ö.; Liedtke, J.; Giersig, M.; Fountaine, K. T.; Lewerenz, H.-J. Efficient solar hydrogen generation in microgravity environment. Nature Communications 2018, 9, 2527.
(35) Akay, Ö.; Bashkatov, A.; Coy, E.; Eckert, K.; Einarsrud, K. E.; Friedrich, A.; Kimmel, B.; Loos, S.; Mutschke, G.; Röntzsch, L.; others Electrolysis in reduced gravitational environments: current research perspectives and future applications. npj Microgravity 2022, 8, 56.
(36) Akay, Ö.; Poon, J.; Robertson, C.; Abdi, F. F.; Cuenya, B. R.; Giersig, M.; Brinkert, K. Releasing the bubbles: nanotopographical electrocatalyst design for efficient photoelectrochemical hydrogen production in microgravity environment. Advanced Science 2022, 9, 2105380.
(37) Raza, M. Q.; Köckritz, M. v.; Sebilleau, J.; Colin, C.; Zupancic, M.; Bucci, M.; Troha, T.; Golobic, I. Coalescence-induced jumping of bubbles in shear flow in microgravity. Physics of Fluids 2023, 35.
(38) Bashkatov, A.; Yang, X.; Mutschke, G.; Fritzsche, B.; Hossain, S. S.; Eckert, K. Dynamics of single hydrogen bubbles at Pt microelectrodes in microgravity. Physical Chemistry Chemical Physics 2021, 23, 11818-11830.
(39) Janssen, L. J.; Hoogland, J. The effect of electrolytically evolved gas bubbles on the thickness of the diffusion layer. Electrochimica Acta 1970, 15, 1013-1023.
(40) Sides, P. J.; Tobias, C. W. A close view of gas evolution from the back side of a transparent electrode. Journal of the Electrochemical Society 1985, 132, 583.
(41) Hashemi, S. M. H.; Karnakov, P.; Hadikhani, P.; Chinello, E.; Litvinov, S.; Moser, C.; Koumoutsakos, P.; Psaltis, D. A versatile and membrane-less electrochemical reactor for the electrolysis of water and brine. Energy & Environmental Science 2019, 12, 1592-1604.
(42) Ikeda, H.; Misumi, R.; Nishiki, Y.; Kuroda, Y.; Mitsushima, S. tert-Butyl-alcoholinduced breakage of the rigid bubble layer that causes overpotential in the oxygen evolution reaction during alkaline water electrolysis. Electrochimica Acta 2023, 452, 142283.
(43) Westerheide, D. E.; Westwater, J. Isothermal growth of hydrogen bubbles during electrolysis. AIChE Journal 1961, 7, 357-362.
(44) Bashkatov, A.; Hossain, S. S.; Mutschke, G.; Yang, X.; Rox, H.; Weidinger, I. M.; Eckert, K. On the growth regimes of hydrogen bubbles at microelectrodes. Physical Chemistry Chemical Physics 2022, 24, 26738-26752.
(45) Park, S.; Liu, L.; Demirkır, Ç.; van der Heijden, O.; Lohse, D.; Krug, D.; Koper, M. T. Solutal Marangoni effect determines bubble dynamics during electrocatalytic hydrogen evolution. Nature Chemistry 2023, 1-9.
(46) Yang, X.; Karnbach, F.; Uhlemann, M.; Odenbach, S.; Eckert, K. Dynamics of single hydrogen bubbles at a platinum microelectrode. Langmuir 2015, 31, 8184-8193.
(47) Bashkatov, A.; Hossain, S. S.; Yang, X.; Mutschke, G.; Eckert, K. Oscillating hydrogen bubbles at Pt microelectrodes. Physical Review Letters 2019, 123, 214503.
(48) Kristof, P.; Pritzker, M. Effect of electrolyte composition on the dynamics of hydrogen gas bubble evolution at copper microelectrodes. Journal of Applied Electrochemistry 1997, 27, 255-265.
(49) Brandon, N.; Kelsall, G. Growth kinetics of bubbles electrogenerated at microelectrodes. Journal of Applied Electrochemistry 1985, 15, 475-484.
(50) Fernandez, D.; Maurer, P.; Martine, M.; Coey, J.; Möbius, M. E. Bubble formation at a gas-evolving microelectrode. Langmuir 2014, 30, 13065-13074.
(51) Massing, J.; Mutschke, G.; Baczyzmalski, D.; Hossain, S. S.; Yang, X.; Eckert, K.; Cierpka, C. Thermocapillary convection during hydrogen evolution at microelectrodes. Electrochimica Acta 2019, 297, 929-940.
(52) Hossain, S. S.; Mutschke, G.; Bashkatov, A.; Eckert, K. The thermocapillary effect on gas bubbles growing on electrodes of different sizes. Electrochimica Acta 2020, 353, 136461.
(53) Babich, A.; Bashkatov, A.; Yang, X.; Mutschke, G.; Eckert, K. In-situ measurements of temperature field and Marangoni convection at hydrogen bubbles using schlieren and PTV techniques. International Journal of Heat and Mass Transfer 2023, 215, 124466.
(54) Zhan, S.; Yuan, R.; Wang, X.; Zhang, W.; Yu, K.; Li, B.; Wang, Z.; Wang, J. Dynamics of growth and detachment of single hydrogen bubble on horizontal and vertical microelectrode surfaces considering liquid microlayer structure in water electrolysis. Physics of Fluids 2023, 35.
(55) Meulenbroek, A.; Vreman, A.; Deen, N. Competing Marangoni effects form a stagnant cap on the interface of a hydrogen bubble attached to a microelectrode. Electrochimica Acta 2021, 385, 138298.
(56) Perez Sirkin, Y. A.; Gadea, E. D.; Scherlis, D. A.; Molinero, V. Mechanisms of nucleation and stationary states of electrochemically generated nanobubbles. Journal of the American Chemical Society 2019, 141, 10801-10811.
(57) Chen, Q.; Wiedenroth, H. S.; German, S. R.; White, H. S. Electrochemical nucleation of stable nanobubbles at Pt nanoelectrodes. Journal of the American Chemical Society 2015, 137, 12064-12069.
(58) German, S. R.; Edwards, M. A.; Ren, H.; White, H. S. Critical nuclei size, rate, and activation energy of gas nucleation. Journal of the American Chemical Society 2018, 140, 4047-4053.
(59) Sepahi, F.; Verzicco, R.; Lohse, D.; Krug, D. Mass transport at gas-evolving electrodes. 2023.
(60) Young, N.; Goldstein, J. S.; Block, M. The motion of bubbles in a vertical temperature gradient. Journal of Fluid Mechanics 1959, 6, 350-356.
(61) Guelcher, S. A.; Solomentsev, Y. E.; Sides, P. J.; Anderson, J. L. Thermocapillary phenomena and bubble coalescence during electrolytic gas evolution. Journal of The Electrochemical Society 1998, 145, 1848.
(62) Lubetkin, S. Thermal Marangoni effects on gas bubbles are generally accompanied by solutal Marangoni effects. Langmuir 2003, 19, 10774-10778.
(63) Yang, X.; Baczyzmalski, D.; Cierpka, C.; Mutschke, G.; Eckert, K. Marangoni convection at electrogenerated hydrogen bubbles. Physical Chemistry Chemical Physics 2018, 20, 11542-11548.
(64) Soto, Á. M.; Maddalena, T.; Fraters, A.; Van Der Meer, D.; Lohse, D. Coalescence of diffusively growing gas bubbles. Journal of Fluid Mechanics 2018, 846, 143-165.
(65) Lv, P.; Peñas, P.; Eijkel, J.; Van Den Berg, A.; Zhang, X.; Lohse, D.; others Selfpropelled detachment upon coalescence of surface bubbles. Physical Review Letters 2021, 127, 235501.
(66) Sanjay, V.; Lohse, D.; Jalaal, M. Bursting bubble in a viscoplastic medium. Journal of Fluid Mechanics 2021, 922, A2.
(67) Thorncroft, G. E.; Klausner, J. F. Bubble forces and detachment models. Multiphase Science and Technology 2001, 13.
(68) Favre, L.; Colin, C.; Pujet, S.; Mimouni, S. An updated force balance approach to investigate bubble sliding in vertical flow boiling at low and high pressures. International Journal of Heat and Mass Transfer 2023, 211, 124227.
(69) Hossain, S. S.; Bashkatov, A.; Yang, X.; Mutschke, G.; Eckert, K. Force balance of hydrogen bubbles growing and oscillating on a microelectrode. Physical Review E 2022,
(70) Pande, N.; Mul, G.; Lohse, D.; Mei, B. Correlating the short-time current response of a hydrogen evolving nickel electrode to bubble growth. Journal of The Electrochemical Society 2019, 166, E280.

المعلومات الداعمة:

تعزيز الأداء في تطور الهيدروجين الكهروكيميائي من خلال ديناميات الفقاعات الناتجة عن التلاحم

ألكسندر باشكاتوف، سونغ هاك بارك تشايان ديميركير جيفري أ. وود، مارك ت. م. كوبر، ديتلف لوهس §ودومينيك كروغ* مجموعة فيزياء السوائل، مركز ماكس بلانك لديناميات السوائل المعقدة و ج. م.مركز برجر لديناميكا السوائل، جامعة توينتي، إنشخيده، هولندا معهد لايدن للكيمياء، جامعة لايدن، لايدن، هولندا【المواد اللينة، الديناميكا السائلة والواجهات، معهد ميسا لتكنولوجيا النانو، مركز جي. إم. بورجرز للديناميكا السائلة، جامعة توينتي، إنشخيده، هولندامعهد ماكس بلانك للديناميات والتنظيم الذاتي، غوتنغن، ألمانياالبريد الإلكتروني: a.bashkatov@utwente.nl; d.j.krug@utwente.nl

القطب الفردي: التوصيف

توضح الشكل S1 التيار الكهربائي على مدى 5 ثوانٍ (من أصل 30 ثانية) من التجربة عند إمكانيات مختلفة. ). يتم عرض التيارات لـ للأقطاب الكهربائية اليسرى واليمنى (انظر الشكل 1أ في المخطوطة)، يتم تشغيلها بشكل منفصل.
الشكل S1: التيار الكهربائي مع مرور الوقت للأقطاب اليسرى واليمنى.
الشكل S2 يصف خمسة أقطاب كهربائية من حيث التيار الكهربائي ( )، العمر ( )، ونصف القطر عند المغادرة ( ) مقابل يتم حسابه كمتوسط على مدى 30 ثانية وعلى الأقطاب الكهربائية اليسرى واليمنى. و يتم حسابها كمتوسط لفقاعات متعددة وترافقها الانحرافات المعيارية. الانحراف المعياري المنخفض لـ و يظهر بشكل كبير
الشكل S2: التيار الكهربائي، العمر الافتراضي ونصف قطر المغادرة لـ الفقاعات الناتجة عند قطب واحد مقابل لأقطاب كهربائية مختلفة تمثل أشرطة الخطأ الانحراف المعياري.
التطور الدوري للف bubbles. التيار المتشابه إلى حد كبير بين مختلف يشير إلى أن أسطح هذه الأقطاب الكهربائية متشابهة. ومع ذلك، فإن الاختلافات الصغيرة كافية للتأثير على الديناميات لـ فقاعات وتغير بشكل كبير من عمرها وحجمها عند المغادرة.

القطب الثنائي: التوصيف

لإكمال النتائج المقدمة في المخطوطة، توثق الأشكال S3 و S4 التيار الكهربائي مقابل الوقت تم رسمه لمدة ثانية واحدة من 30 ثانية من مدة التجربة. يتم رسمه لجهود مختلفة ( ) والمسافة بين الأقطاب ( ). الأشكال S3a و S3b و
الشكل S3: التيار الكهربائي مقابل الزمن موضح لمدة ثانية واحدة من 30 ثانية من التجربة لمختلف الجهود والمسافة بين الأقطاب: (أ) ، (ب) ، (ج) .
ج هي من أجل ، على التوالي. الأشكال S4a و b هي لـ و (ب) .
الشكل S4: التيار الكهربائي مقابل الزمن موضح لمدة ثانية واحدة من 30 ثانية من التجربة لمختلف الجهود والمسافة بين الأقطاب: (أ) ، (ب) .
توضح الشكل S5 عمر الفقاعات المنتجة عند القطبين المزدوجين مقابل الجهد لأنماط I (يسار) و II (يمين) ولإلكترودات مختلفة. يتم حسابه كمتوسط لفقاعات متعددة ويصاحبه الانحرافات المعيارية. يمكن ملاحظة اتجاهين رئيسيين: (ط) نظرًا لأن نصف قطر المغادرة في الوضع الأول مستقل عن يقل عند الفائض الكهربائي الأكبر، بسبب زيادة التيار الكهربائي. كما أنه يزيد مع ، خاصة في الأماكن الأكبر . – هذا لأن زوج الفقاعات يحتاج إلى النمو إلى حجم أكبر قبل التمازج عند حجم أكبر ; (ii) من ناحية أخرى، يزداد عند الفائض الكهربائي الأكبر ويقل عند الأكبر . كما ذُكر بالفعل في المخطوطة، فإن الفائض الأكبر يعني وجود قوى أكبر تعمل في الاتجاه المعاكس، مما يزيد من حجم انفصال الفقاعة. لذلك ستستمر الفقاعة في النمو لفترة أطول. ومع ذلك، فإن فصل اثنين من الأقطاب عن بعضهما البعض يتطلب المزيد من
المسافات يمكن أن يتيح تيارات أعلى، وبالتالي أسرع معدل الإنتاج.
الشكل S5: العمر عند القطبين المزدوجين كدالة للجهد ( ) والمسافة بين الأقطاب ( ). و هي للوضع I والوضع II، على التوالي. تمثل أشرطة الخطأ الانحراف المعياري.
توضح الشكل S6 المسافة التي قطعها الفقاعة المدمجة في الاتجاه العمودي خلال أول 5 مللي ثانية بعد انطلاق الإلكترود المدفوع بحدث التلاحم عند . تظهر النتائج لـ و -0.5 فولت وثلاث فقاعات في كل حالة. توثق المنحنيات أن سرعة القفز تتناقص بشكل ملحوظ مع مرور الوقت ( بسبب تأثيرات قوة السحب، خاصة في اللحظات التي تلي القفزة. ومن المثير للاهتمام أن “السرعة النهائية” للفقاعة، التي يمكن قراءتها من ميل المنحنيات، أي بعد حوالي 2 مللي ثانية، زادت عند جهد زائد أكبر (-0.5 فولت). يمكن تفسير ذلك بالتيار خلف الفقاعة الصاعدة السابقة. هذا التدفق يسحب، وبالتالي يسرع الفقاعة المدمجة في لحظة الانطلاق. يزداد التيار مع مغادرة الفقاعات السابقة بشكل أسرع (أصغر ) وهو الحال في جهد أكثر سلبية.
الشكل S7 يمثل سرعة القفز العمودي لعدد كبير من الفقاعات، متوسطًا على أول 0.5 مللي ثانية من القفزة، مقابل نسبة حجم الوالد . التجارب التي أجريت في و (أ) ، (ب) . و هي أنصاف أقطار الفقاعات الصغيرة والكبيرة، على التوالي. تُظهر المعلمات الهندسية في الشكل S7c. مقياس شريط الألوان يُظهر معلمة هندسية أخرى. مُعطى بشكل غير بعدي. يمثل الموقع النسبي للفقاعة، أي المسافة من قاع الفقاعة إلى القطب، المختارة كأقصى قيمة بين الفقاعات الصغيرة والكبيرة. تجلس الفقاعة على القطب إذا وهو بعيد عن القطب إذا . الدوائر تمثل الوضع الأول، أي عندما يغادر الفقاعة إلى الكتلة بعد حدث الاندماج، والمربعات
الشكل S6: مسار الفقاعة عند -0.3 فولت و -0.5 فولت خلال أول 5 مللي ثانية بعد قفزة الاندماج المدفوعة. هو إطار واحد قبل التمازج. يتم تقديم كل جهد بواسطة ثلاث فقاعات. المسافة بين الأقطاب الكهربائية .
تشير إلى الوضع الثاني، أي عندما تعود الفقاعة التي غادرت سابقًا بعد حدث التلاحم إلى السطح، وتستمر في النمو، وتغادر في مرحلة لاحقة بسبب الطفو. لاحظ أن يختلف بشكل كبير اعتمادًا على موضع الفقاعتين قبل الاندماج ونسبة حجمهما.
الشكل S7: (أ)،(ب) سرعة القفز العمودي ( ) مقابل.. في و شريط الألوان يقيس الموقع النسبي للفقاعة المعروضة في (ج)، أي الحد الأقصى إما للفقاعات الصغيرة أو الكبيرة، قبل التلاحم عند تم تسجيل الصورة بمعدل 10 كيلو هرتز.
تظهر الأشكال S 7 أ وب اتجاهين عامين: (i) يقل وفقًا للتقليل في وبحسب الزيادة في ; (ii) عند جهد أعلى، وبالتالي التيار، ستقوم الفقاعة بـ
عد إلى القطب الكهربائي بشكل أكثر تكرارًا مع الابتعاد بسرعة قفز أعلى، كما تم التأكيد عليه بالفعل في المخطوطة (انظر الشكل 5).
عند تلاحم فقاعتين، يحدث إطلاق للطاقة السطحية المعطاة كـ
أين و هي الفقاعات اليسرى، اليمنى والمدمجة، على التوالي. هو توتر السطح للكهارل. الطاقة المنبعثة تتبدد جزئيًا من خلال اهتزازات الفقاعة، مما يعمل ضد السحب اللزج. عندما تكون بالقرب من السطح، يتم تحويل الطاقة المتبقية إلى الطاقة الحركية ( ) التي تدفع الفقاعة الناتجة (المتجمعة) للقفز عن القطب الكهربائي. الطاقة الحركية هي
حيث هو معامل الكتلة المضافة، كثافة الكهارل و هي سرعة القفز الأولية. بالنسبة لفقاعة كروية ، ومع ذلك، عندما تكون الفقاعة بالقرب من الجدار، يكون المعامل أكبر. بالتفصيل، عندما تقترب فقاعتان من بعضهما البعض، يتم تصريف الفيلم الرقيق من الكهارل الذي يفصل بينهما تدريجيًا وفي النهاية يتمزق. يؤدي ذلك إلى تشكيل عنق، أي تجويف مفتوح، وسلسلة من الموجات الشعرية ذات القوة المتفاوتة التي تنتشر على طول واجهة الكهارل-الغاز. تتحرك هذه الموجات بعيدًا عن منطقة العنق حتى تلتقي عند قمة التقاء التجمع (انظر المخطوطة، الشكل 3c). تقل قوة هذه الموجات كلما انتقلت على طول الواجهة بسبب التبدد اللزج المستمر. في هذه الأثناء، توتر السطح يدفع انكماش الموجات الشعرية المتبقية نحو شكل كروي، مما يشوه شكل الفقاعة. بمجرد أن تتجاوز الطاقة السطحية الزائدة العمل المنجز بواسطة الفقاعة ضد السحب اللزج ( ) خلال عمليات التمدد والانكماش، فإن المكون الصافي الناتج من الزخم العمودي على السطح يتسبب في قفز الفقاعة عن القطب الكهربائي. نظرًا لأن أيًا من الفقاعات ليست ملتصقة بالقطب الكهربائي، يتم تجاهل طاقة الالتصاق . يتم التحكم في
العملية بواسطة توتر السطح واللزوجة وغالبًا ما يتم وصفها من حيث رقم أونيسورغ هو اللزوجة الديناميكية للكهارل. تأثير الجاذبية أثناء التجمع، قبل الإقلاع، ضئيل. بينما تعتبر العملية غير فعالة للغاية، مع تحويل جزء صغير فقط من الطاقة السطحية إلى طاقة حركية، إلا أنها كافية لفقاعة ناتجة للقفز عن القطب الكهربائي مكتسبة سرعة أولية .
الشكل S8 يوثق تقدير النسبة بين الطاقة الحركية المترجمة ( ) والطاقة السطحية المنبعثة ( ) كدالة لـ (أ) و (ب) . تم حساب نقاط البيانات في الشكل S8a باستخدام المعادلة 1 والمعادلة 2 من خلال أخذ و للفقاعات المعروضة في الشكل S7a، أي عند و . تمثل الدوائر الفقاعات التي تتبع الوضع I والمربعات الوضع II. تستند نقاط البيانات في الشكل S8b إلى من الشكل 6a و من الشكل 5d في المخطوطة، مع افتراض أن ، ومن ثم .
الشكل S8: النسبة بين الطاقة الحركية المترجمة ( ) والطاقة السطحية المنبعثة ( ) كدالة لـ (أ) و (ب) .
على الرغم من أن السرعة المأخوذة أصغر من سرعة القفز الأولية وتتأثر أكثر بالذيل خلف الفقاعة السابقة المغادرة، يؤكد الشكل S8 عدم كفاءة عملية التجمع، حيث أن الطاقة الحركية المترجمة أقل من من الطاقة السطحية المنبعثة.

مخطط الطور: نموذج

لتوفير فهم عام للعلاقة بين الاحتمالية ( )، المسافة بين الأقطاب الكهربائية ، والتيار الكهربائي المعروضة في الشكل 5 (انظر المخطوطة)، نقترح نموذجًا بسيطًا يعتمد على سرعة الفقاعة المغادرة ومعدل نمو الفقاعة اللاحقة. يتنبأ النموذج بالحجم الحرج للتيار المطلوب لإنتاج الهيدروجين بسرعة كافية لضمان التجمع بين الفقاعة المغادرة ( ) ووريثها ( ). الوقت الذي تستغرقه الفقاعة الجديدة للنمو إلى نصف القطر هو والذي يمكن العثور عليه من قوانين فاراداي وقوانين الغاز المثالي.
قانون الغاز المثالي المعطى كـ
حيث هو الضغط داخل الفقاعة، هو حجم الغاز، هو الكتلة الكلية للغاز، هو الكتلة المولية، هو ثابت الغاز المثالي و هو درجة حرارة الغاز. الشحنة المنتجة هي
قانون فاراداي يقرأ
حيث هو ثابت فاراداي و هو التكافؤ للأيونات ( +1 ) مضروبًا في عدد البروتونات (2).
من خلال استبدال المعادلات 4 والمعادلة 5 في المعادلة 3
مع . خلال هذه الفترة الزمنية ، تسافر الفقاعة المغادرة المسافة
، مع تشير إلى سرعة القفز الفعالة. بناءً على هندسة المثلث الذي يمتد بين مراكز الفقاعتين ونقطة A في الشكل 5c (انظر المخطوطة)، يمكن التعبير عن العلاقة التالية:
حيث أو تؤخذ من التجربة (انظر الشكل 6a).
من خلال استبدال في المعادلة 7، يتم إعطاء التيار الحرج لانتقال الوضع كدالة لـ :

القوة الظاهرة: تفاعل الفقاعة-السجادة

لقد أظهر أن الفقاعة تنمو بينما تجلس على سجادة من الفقاعات الدقيقة، خاضعة لتجمع مكثف مستمر معها. على مدار العديد من أحداث التجمع، تشهد الفقاعة الأم تحولًا في مركز الكتلة، مما يؤدي إلى تسارع نحو سطح القطب الكهربائي. يمكن اعتبار هذا التسارع كقوة ظاهرة . يتم اشتقاق تقدير لهذه القوة الظاهرة من مبدأ حفظ الزخم، المعطى كـ
حيث و تمثل الكتلة الكلية ومركز الكتلة للفقاعة في الوقت ، على التوالي؛ و تشير إلى الكتلة الأولية ومركز الكتلة للفقاعة في وقت عشوائي ؛ و تمثل معدل حقن الكتلة بسبب التجمع المستمر مع سجادة الفقاعات الدقيقة مع مركز الكتلة عند و ثابتة. جميع مراكز الكتلة تشير إلى سطح القطب الكهربائي. كتلة الفقاعة في أي لحظة معينة هي
من خلال استبدال من المعادلة 9 في المعادلة 10
نظرًا لأن عند تيار معين هو ثابت (وكذلك و )
نفترض أيضًا أن ثابت أيضًا عند . من خلال إجراء التفاضل مرة أخرى باستخدام المعادلة 12
من خلال استبدال المعادلة 12 في المعادلة 13
عند النظر فقط إلى فترة قصيرة ، يمكننا تقريب وتقرأ المعادلة 14
، والتي هي سمك السجادة، يتم تجاهلها أيضًا. باستخدام قوانين فاراداي وقوانين الغاز المثالي
حيث .
أخيرًا، من خلال استبدال المعادلة 16 في المعادلة 15، تقرأ القوة الظاهرة
الشكل S9: الطفو والقوى الظاهرة كدالة لنصف قطر الفقاعة عند .
الشكل S9 يوثق مقارنة بين قوة الطفو والقوة الظاهرة، المحسوبة باستخدام المعادلة 17 عند (التي تتوافق تقريبًا مع الحد الأقصى للتيار الملاحظ في هذه الدراسة)، مقابل نصف قطر الفقاعة . تُعرف قوة الطفو كـ ، حيث تمثل تسارع الجاذبية. يوضح الشكل S9 أن التجمع المستمر مع سجادة الفقاعات الدقيقة لا يفرض قوة ظاهرة كبيرة على الفقاعة. – هذه القوة تتلاشى بسرعة مع زيادة وتصبح أصغر من قوة الطفو عند حوالي .

References

(1) Lv, P.; Peñas, P.; Eijkel, J.; Van Den Berg, A.; Zhang, X.; Lohse, D.; others Self-propelled detachment upon coalescence of surface bubbles. Physical Review Letters 2021, 127, 235501.
(2) Raza, M. Q.; Köckritz, M. v.; Sebilleau, J.; Colin, C.; Zupancic, M.; Bucci, M.; Troha, T.;
Golobic, I. Coalescence-induced jumping of bubbles in shear flow in microgravity. Physics of Fluids 2023, 35.
(3) Sanjay, V.; Lohse, D.; Jalaal, M. Bursting bubble in a viscoplastic medium. Journal of Fluid Mechanics 2021, 922, A2.

Journal: Journal of the American Chemical Society, Volume: 146, Issue: 14
DOI: https://doi.org/10.1021/jacs.4c02018
PMID: https://pubmed.ncbi.nlm.nih.gov/38538570
Publication Date: 2024-03-27

Performance enhancement of electrocatalytic hydrogen evolution through coalescence-induced bubble dynamics

Aleksandr Bashkatov, Sunghak Park, Çayan Demirkır, Jeffery A. Wood, Marc T.M. Koper, Detlef Lohse, § and Dominik Krug*, Physics of Fluids Group, Max Planck Center for Complex Fluid Dynamics and J. M. Burgers Centre for Fluid Dynamics, University of Twente, Enschede, Netherlands Leiden Institute of Chemistry, Leiden University, Leiden, Netherlands【Soft Matter, Fluidics and Interfaces, MESA + Institute for Nanotechnology, J. M. Burgers Centre for Fluid Dynamics, University of Twente, Enschede, Netherlands §Max Planck Institute for Dynamics and Self-Organization, Göttingen, GermanyE-mail: a.bashkatov@utwente.nl; d.j.krug@utwente.nl

Abstract

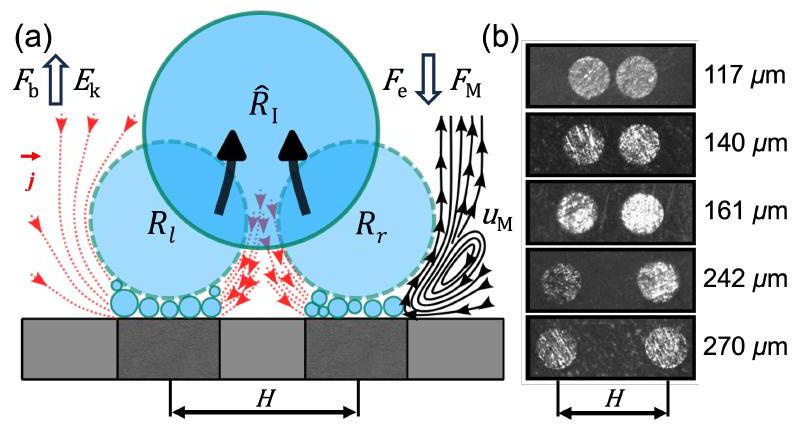
The evolution of electrogenerated gas bubbles during water electrolysis can significantly hamper the overall process efficiency. Promoting the departure of electrochemically generated bubbles during (water) electrolysis is therefore beneficial. For a single bubble, a departure from the electrode surface occurs when buoyancy wins over the downward-acting forces (e.g. contact, Marangoni, and electric forces). In this work, the dynamics of a pair of bubbles produced during hydrogen evolution reaction in using dual platinum micro-electrode system is systematically studied by varying the electrode distance and the cathodic potential. By combining high-speed

imaging and electrochemical analysis, we demonstrate the importance of bubble-bubble interactions for the departure process. We show that bubble coalescence may lead to substantially earlier bubble departure as compared to buoyancy effects alone, resulting in considerably higher reaction rates at constant potential. However, due to continued mass input and conservation of momentum repeated coalescence events with bubbles close to the electrode may drive departed bubbles back to the surface beyond a critical current, which increases with the electrode spacing. The latter leads to the resumption of bubble growth near the electrode surface, followed by buoyancy-driven departure. While less favourable at small electrode spacing, this configuration proves to be very beneficial at larger separations increasing the mean current up to 2.4 times compared to a single electrode under the conditions explored in this study.

Introduction

Water electrolysis is likely to become a central technology in the -neutral energy system of the future. Apart from being a potential energy carrier and fuel, hydrogen gas serves as a feedstock for the chemical (e.g. ammonia production for fertilisers) and steel industries (coal replacement), and refineries (methanol, synthetic fuels). Yet, the process efficiency requires further improvement to compete on the energy market and enable large-scale hydrogen production. In both conventional alkaline and proton exchange membrane water electrolyzers a considerable part of the overpotentials and hence losses can be attributed to the formation of and bubbles, present at the electrodes and in the bulk. These bubbles block the electrodes by masking their active surface area, reducing the number of nucleation sites. Additionally, they raise ohmic resistance by blocking the ion-conducting pathways. It is therefore vital to maintain a bubble-free electrode area for continuous catalytic activity. Enhanced removal of gas bubbles and deeper insights into their evolution processes will benefit further optimization of the system’s energy efficiency.
Various methods have been developed to aid bubble departure, categorized as active (e.g.,
sonication, centrifugal forces, mechanical convection, pressure modulation, external magnetic fields) and passive approaches. Passive methods, preferred for their energy-efficiency, primarily involve surface modifications to alter the wettability of the catalytic surface. For example, superhydrophilic surfaces facilitate earlier bubble departure due to the reduced contact angle at liquid-solid interfaces.
The bubble removal process can also benefit from hydrophobic surfaces. One example is the bubble-free electrolysis concept that employs a hydrophobic porous layer adjacent to a porous electrode. This prevents bubble formation within the catalyst, guiding the generated gas by capillary effects through the hydrophobic layer. A different concept to enhance gas removal, which was shown to hold promise based on theoretical analysis, is the use of hydrophobic islands on the electrode as preferential nucleation sites. Also practically, this has been shown to be feasible using electrodes partially covered with hydrophobic spots made of polytetrafluoroethylene (PTFE). This allows to guide the produced gas away from the active areas of the electrode with the potential to lower the bubble-induced overpotentials. Brussieux et al. demonstrated that, depending on the size of and distance between islets, parameters of the gas release such as bubble size and location can be controlled, but did not study the effect on electrode performance. More recently, Lake et al. found that densely packed Pt -coated micropost arrays promote consistent release of smaller bubbles through their mutual coalescence. While this enhanced the stability of the current compared to untextured electrodes, it did not lead to performance gains when normalising by the active surface area in this system, due to additional bubbles forming in between the pillars. In this context, coalescence induced removal of bubbles is of particular interest. Coalescence leads to a reduction in surface energy and this difference is in part converted to kinetic energy, causing the bubble to jump off the surface without having to rely on buoyancy. This makes this removal process also highly attractive in microgravity applications.
However, a detailed understanding of the mechanism and quantification of the extent
to which coalescence-induced dynamics can be exploited to improve the performance of gas-evolving electrodes is still lacking. This also applies to parameter optimisation, which in view of complications such as a possible bubble return to the electrode surface, is highly nontrivial. We address these open questions in the present work by studying the coalescence-driven dynamics of hydrogen bubbles produced at a dual micro-electrode during water electrolysis. This new setup allows precise control of important parameters such as the bubble size during coalescence, while also providing excellent observability of the dynamics. We demonstrate that coalescence events may lead to both premature bubble departure compared to buoyancy effects alone and the return of departed bubbles to the surface of the electrode, substantially altering the reaction rates. The dual micro-electrode configuration shows, depending on the applied potential and inter-electrode distance, up to a 2.4 -fold increase in current compared to a single micro-electrode.

Methods

The pairs of bubbles sketched in figure 1a were generated at the surface of a dual platinum micro-electrode during the hydrogen evolution reaction (HER). The experiment was performed in a three-electrode electrochemical cell filled with .
The fabrication of dual micro-electrodes followed a previously established method. Briefly, two Pt wires ( , Goodfellow) were sealed into a soda-lime glass capillary (outer diameter , inner diameter , Hilgenberg) by gently softening the capillary in a flame. Five different values for the interelectrode distance were established and tested, as shown in fig. 1b. The electrode surface underwent electrochemical cleaning (potential cycling between vs. RHE, repeated 50 times) after being mechanically polished with sandpaper ( 2000 grit), sonicated and rinsed with ultrapure water. The cell used here closely resembles that used in earlier studies. The dual micro-electrode (cathode) is inserted horizontally facing upward in the base of a cuboid
glass cuvette (Hellma) with dimensions of . The system is completed by the reference electrode ( ) and counter electrode ( wire) both inserted vertically from the top. The electrochemical cell is controlled by a potentiostat (BioLogic, VSP-300, 6 channels) at a constant potential of -0.2 to -2.8 V (vs. RHE). Each of the two electrodes is connected to and controlled by a separate channel of the potentiostat. For each experimental run, the electric current was recorded with a sampling rate of at least 1 kHz over a period of 30 s . The optically transparent cell allows visualization of the bubble dy-
Figure 1: (a) Schematic of the dual micro-electrode and two bubbles sitting on the carpet of microbubbles. Each growing bubble is subject to a force balance including buoyancy, electric, and Marangoni forces. The red lines represent current density ( ) and the black streamlines on the right represent the Marangoni convection with velocity is the kinetic energy released during the coalescence of the left ( ) and right ( ) bubbles. (b) Top view of the five dual micro-electrodes with different interelectrode distance .
namics using a shadowgraphy system. It consists of LED illumination (SCHOTT, KL 2500) with a microscope, connected to a high-speed camera (Photron, FASTCAM NOVA S16), providing a spatial resolution of . Image recording was typically performed at 5 kHz , unless otherwise stated. High-speed recording up to 264 kHz was used to resolve individual coalescence events. The bubble radius was extracted by standard image processing routine based on the Canny edge detection method in Matlab R2022b (for further details see Supplemental Material in Bashkatov et al. ). To measure the velocity fields around bubbles presented in figure 6, monodisperse polystyrene particles (microParticles GmbH) of were seeded into the electrolyte. These particles are neutrally buoyant with a mass density of . The resulting series of images, recorded at 1000 frames per second,
were processed by the software DaViS 10, which employs a Particle Tracking Velocimetry (PTV) algorithm to track each particle over 25 ms shortly before departure. Due to the limited number of particles close to or at the bubble-electrolyte interface, the resulting tracks of the particles were collected for 60 bubbles. Subsequently, the tracks were converted into a vector field using a binning function that interpolates local tracks on a specified fine grid.
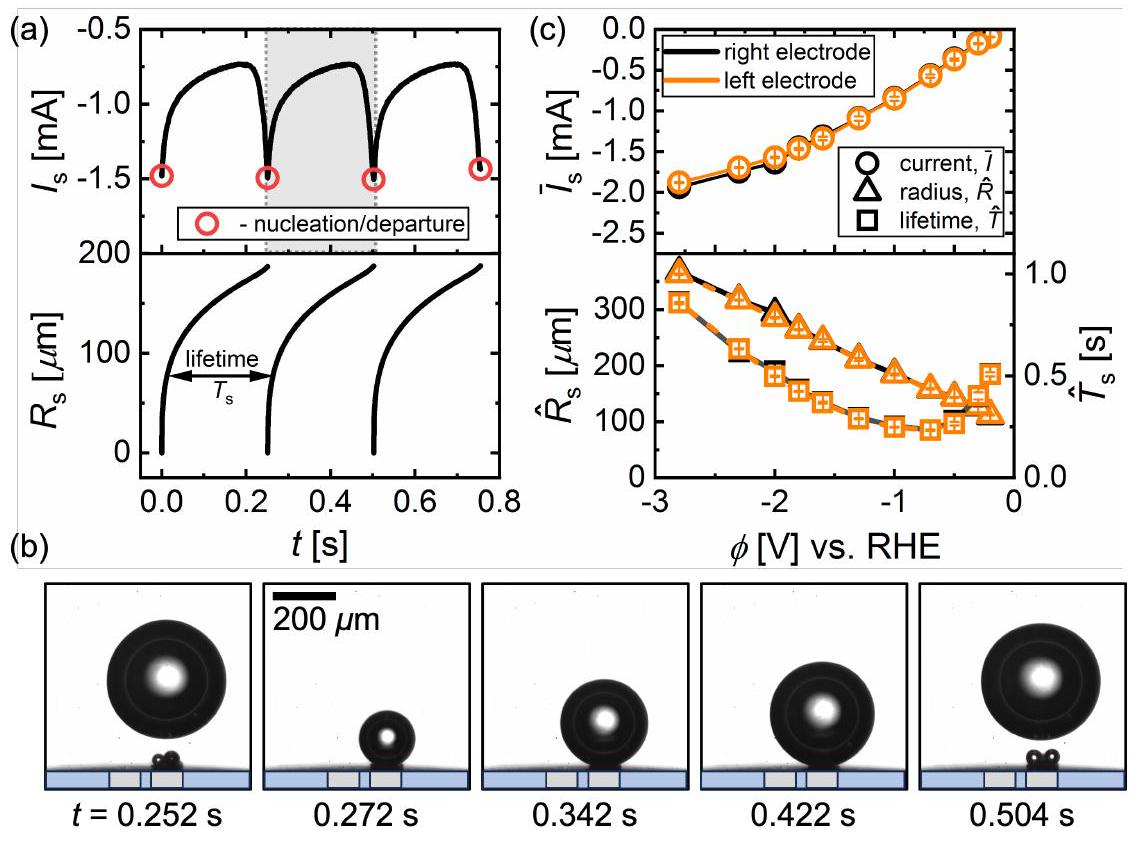
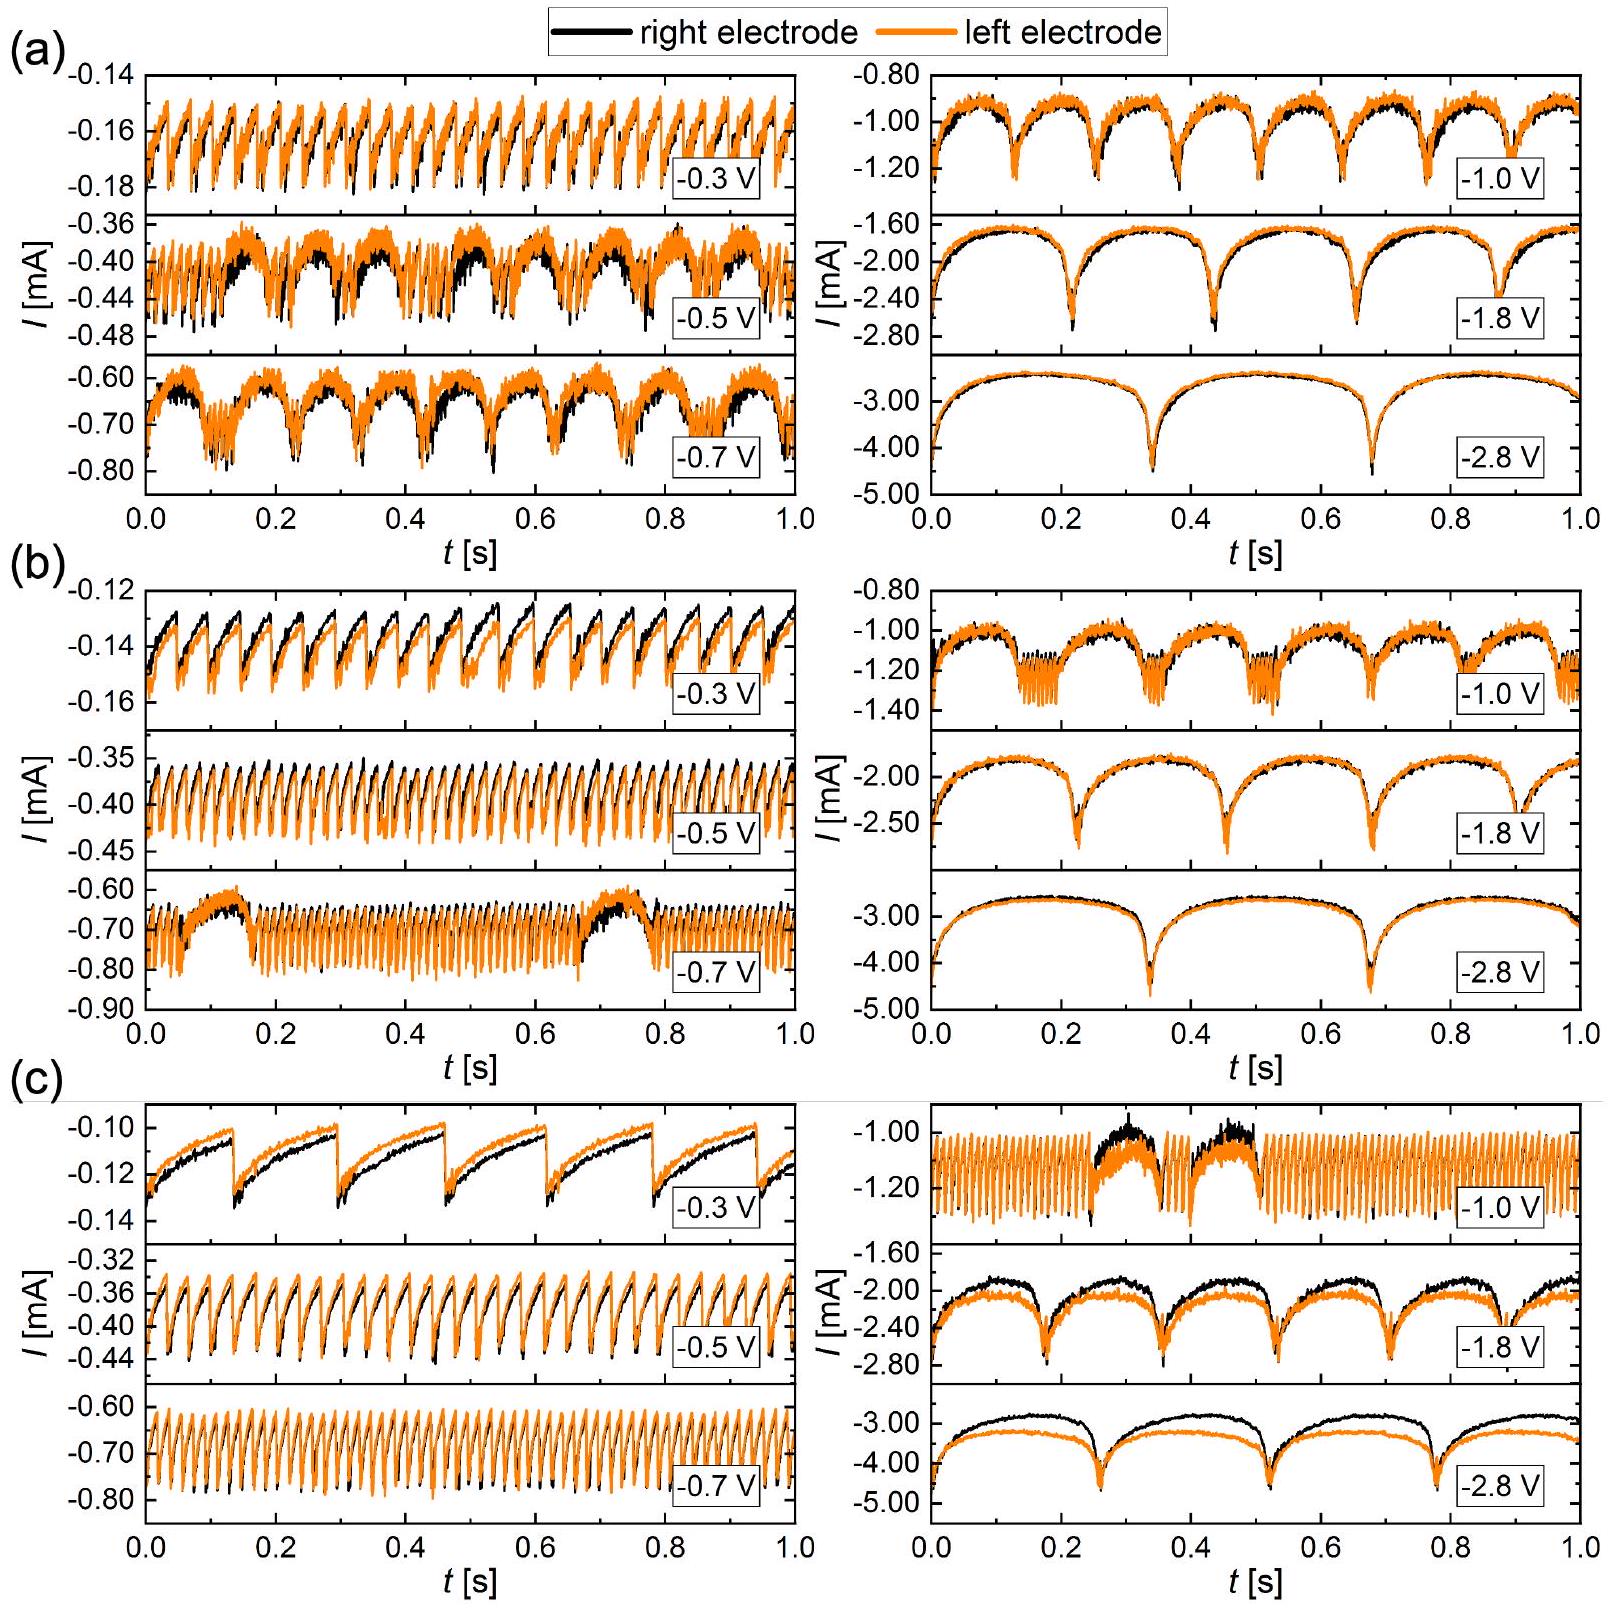
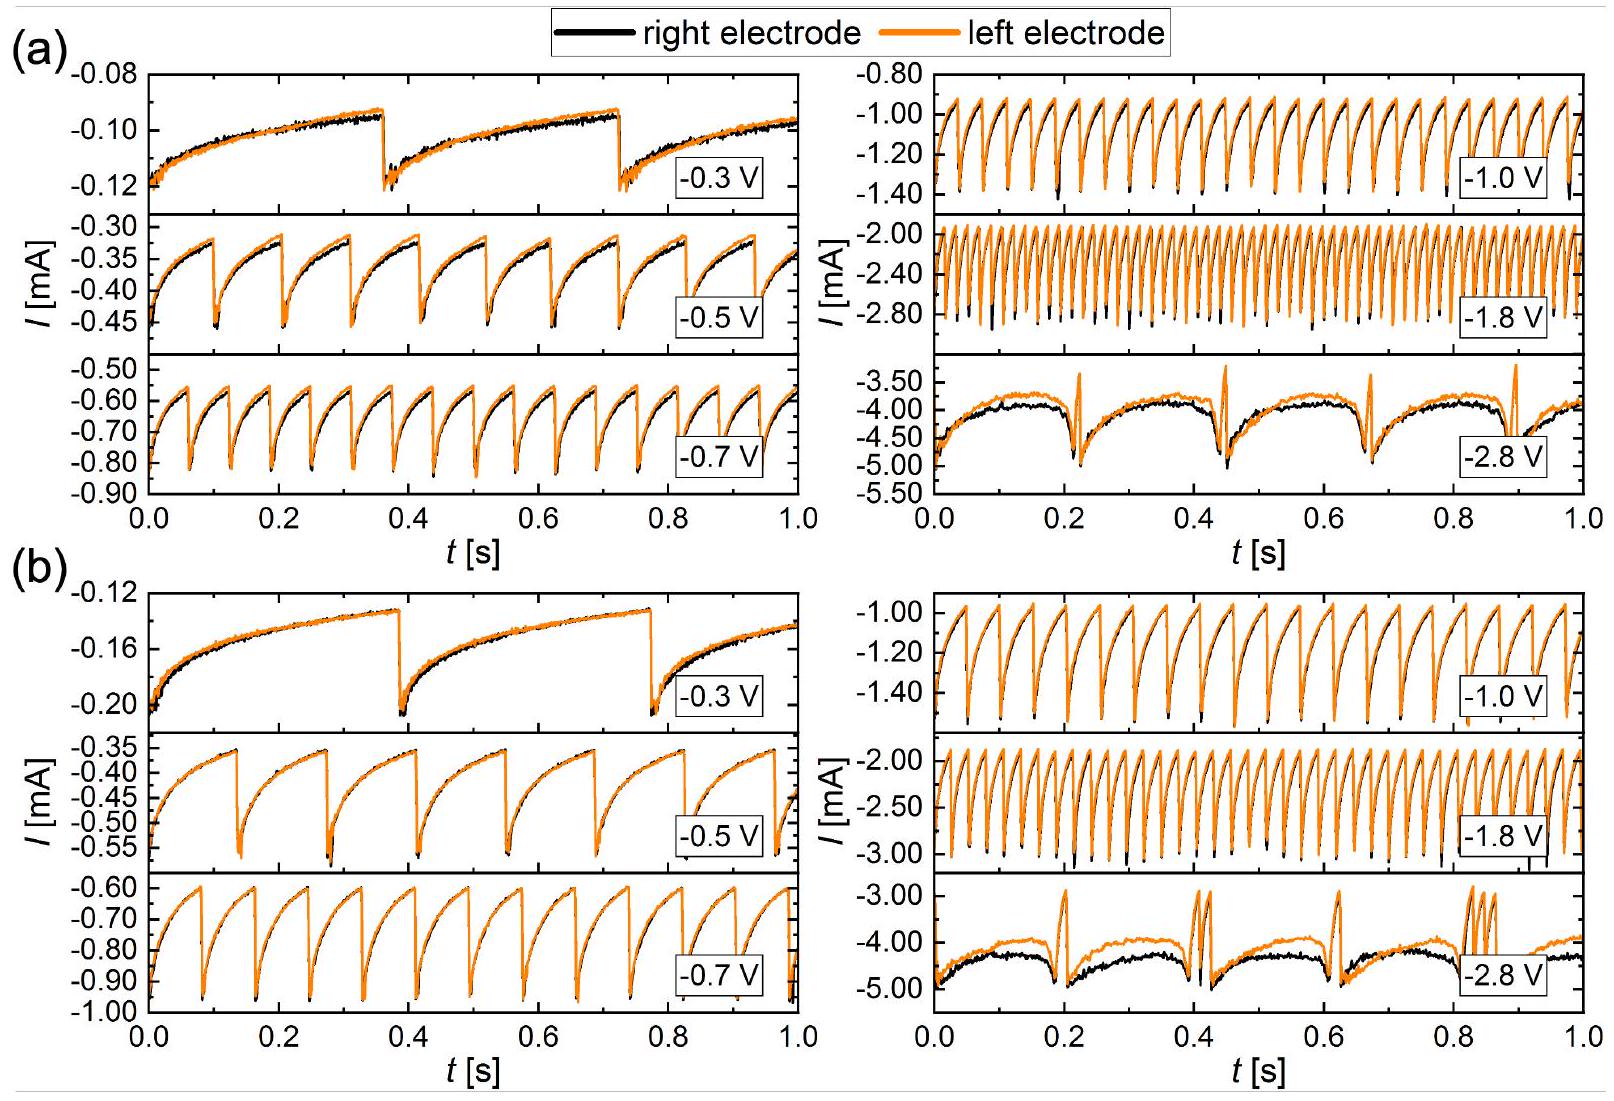
Single electrode

To set the baseline, we briefly report the results for the case where only a single electrode is operated, which has been studied previously. As an example, figure 2a shows the transient current ( ) and radius ( ) of the bubble for three complete bubble evolution cycles at -1.0 V . Shadowgraphs corresponding to a complete cycle from nucleation to departure are included in figure 2b. This process is highly periodic with a bubble lifetime . The evolution of the bubble has a strong influence on the reaction current, for which the maxima in cathodic current marked by the red circles coincide with the departure of the bubble. This is immediately followed by the nucleation of a new bubble, whose growth in the vicinity of the electrode leads to a considerable reduction in of up to in this case. This continues until the next bubble departure, after which the cycle repeats itself.
Finally, figure 2c summarizes how the average electric current , where the overline denotes an average over , the departure radius , and lifetime varies for different cathodic potentials ( ). All statistics are averaged over multiple bubble cycles with error bars representing the standard deviation. The figure also confirms that consistent results are obtained from both electrodes.
In this system, bubble formation occurs already at low overpotentials. Micron-sized bubbles form on the electrode surface and continuously coalesce to form a single larger bubble. This larger bubble is typically not in direct contact with the electrode surface, but rather resides on the layer of microbubbles. It continues to grow via the intensive
Figure 2: (a) The electric current and radius over time representing three complete cycles of bubble evolution at at a single micro-electrode. The red circles mark nucleation and departure instants of time. (b) Shadowgraphs displaying the evolution cycle, marked in grey in (a). (c) The averaged electric current (circles), departure radius (triangles) and lifetime (squares) versus the potential for the right (black) and left (orange) electrodes, run separately. Image recording performed at 500 frames/second.
coalescence with these microbubbles and via gas diffusion. In this case, departure of the bubble occurs once the retaining forces due to the electric field, thermal and solutal Marangoni effects are overcome by buoyancy (see figure 1a). The thermal Marangoni effect is related to the Joule heating caused by the locally high current density at the bubble foot as indicated in figure 1a. The effect therefore scales (via Ohm’s law) with and prevails at high overpotentials. The solutal effect due to the depletion of the electrolyte at the electrode is expected to depend linearly on and therefore dominates at lower overpotentials ( V in the present case). The electric force is directly proportional to and therefore all retaining forces diminish as the overpotential is reduced, which explains the decreasing trend of the departure radius as is made less negative. Since the bubble captures almost all the produced gas, 45,46 the departure period follows from the time it takes to produce the gas contained in the bubble volume and is therefore proportional to .

Dual electrode

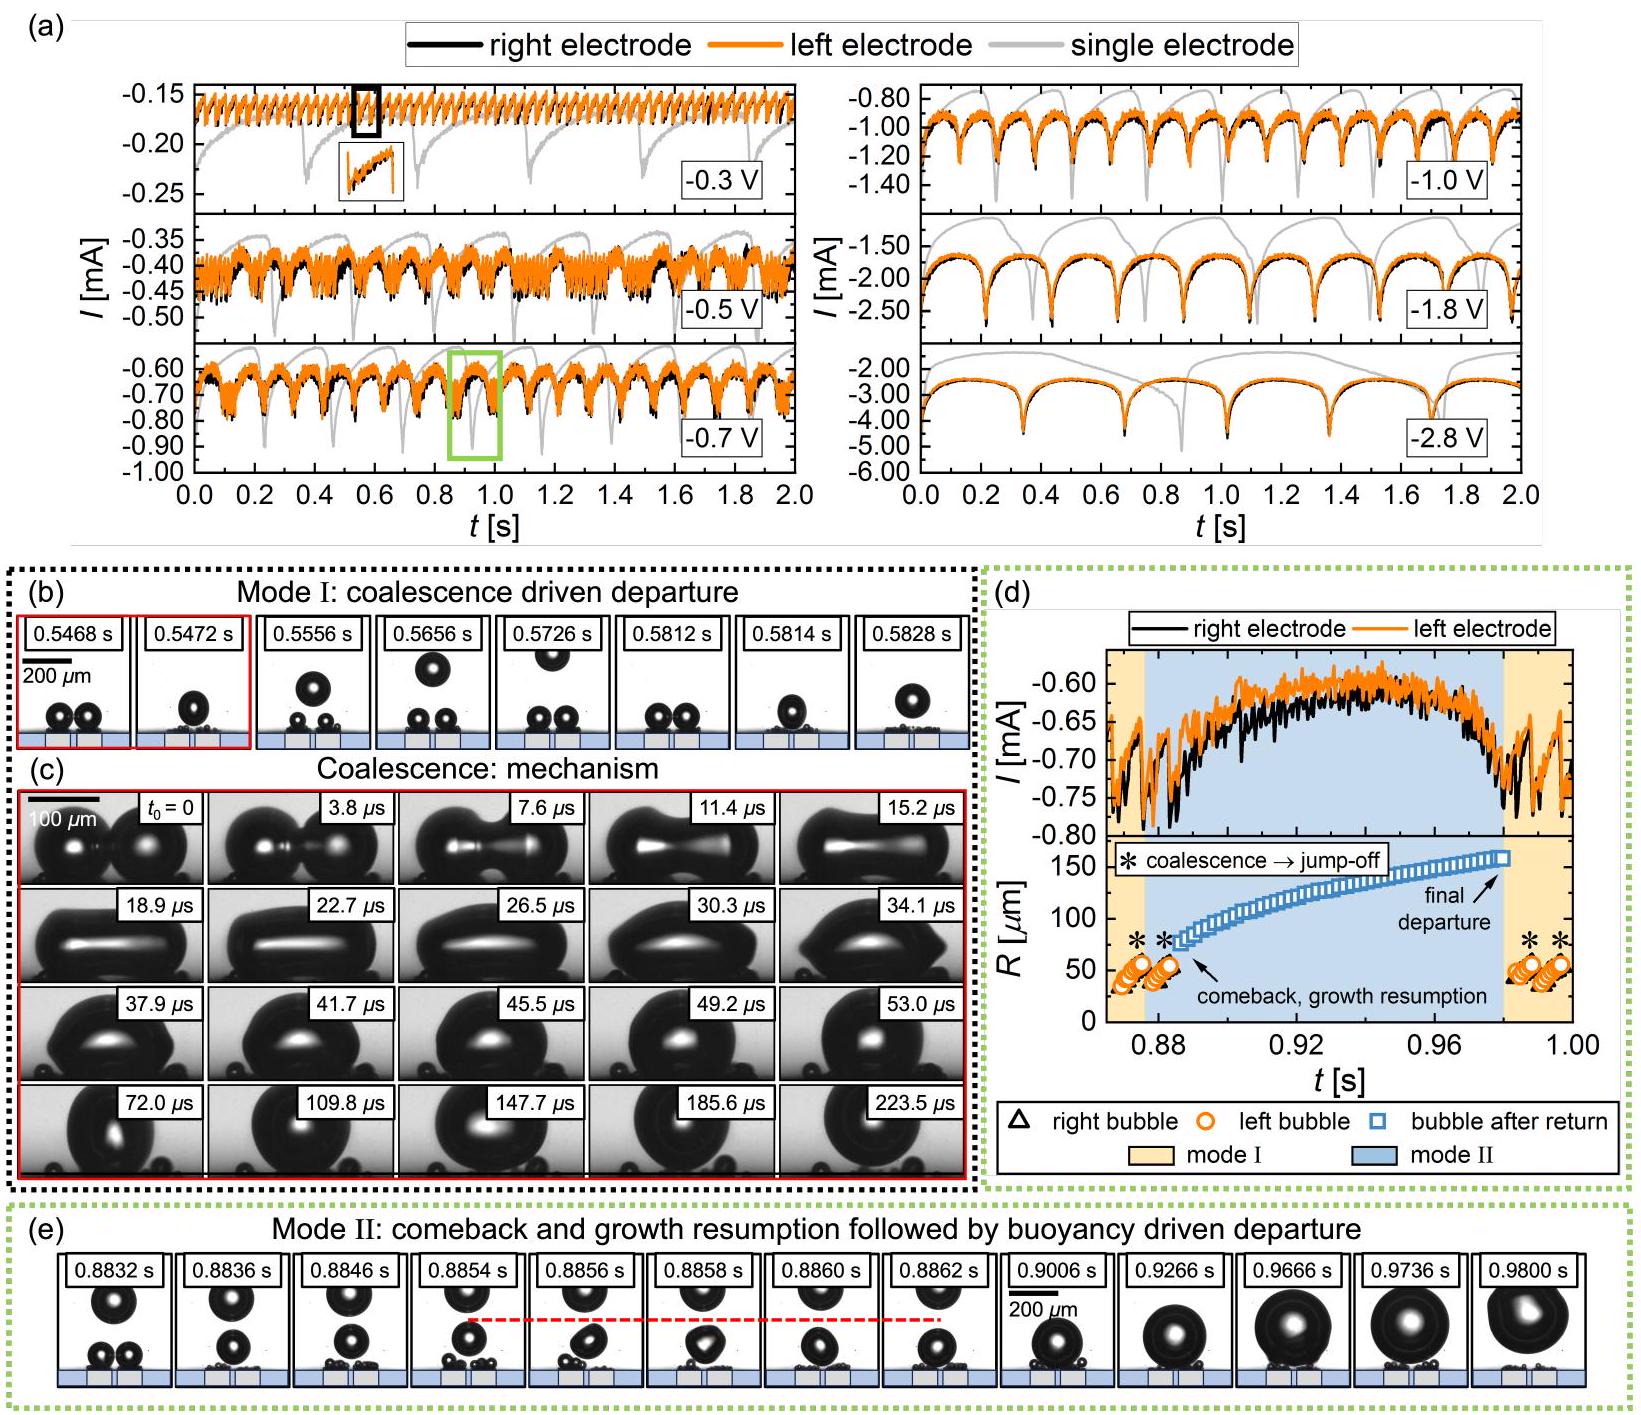
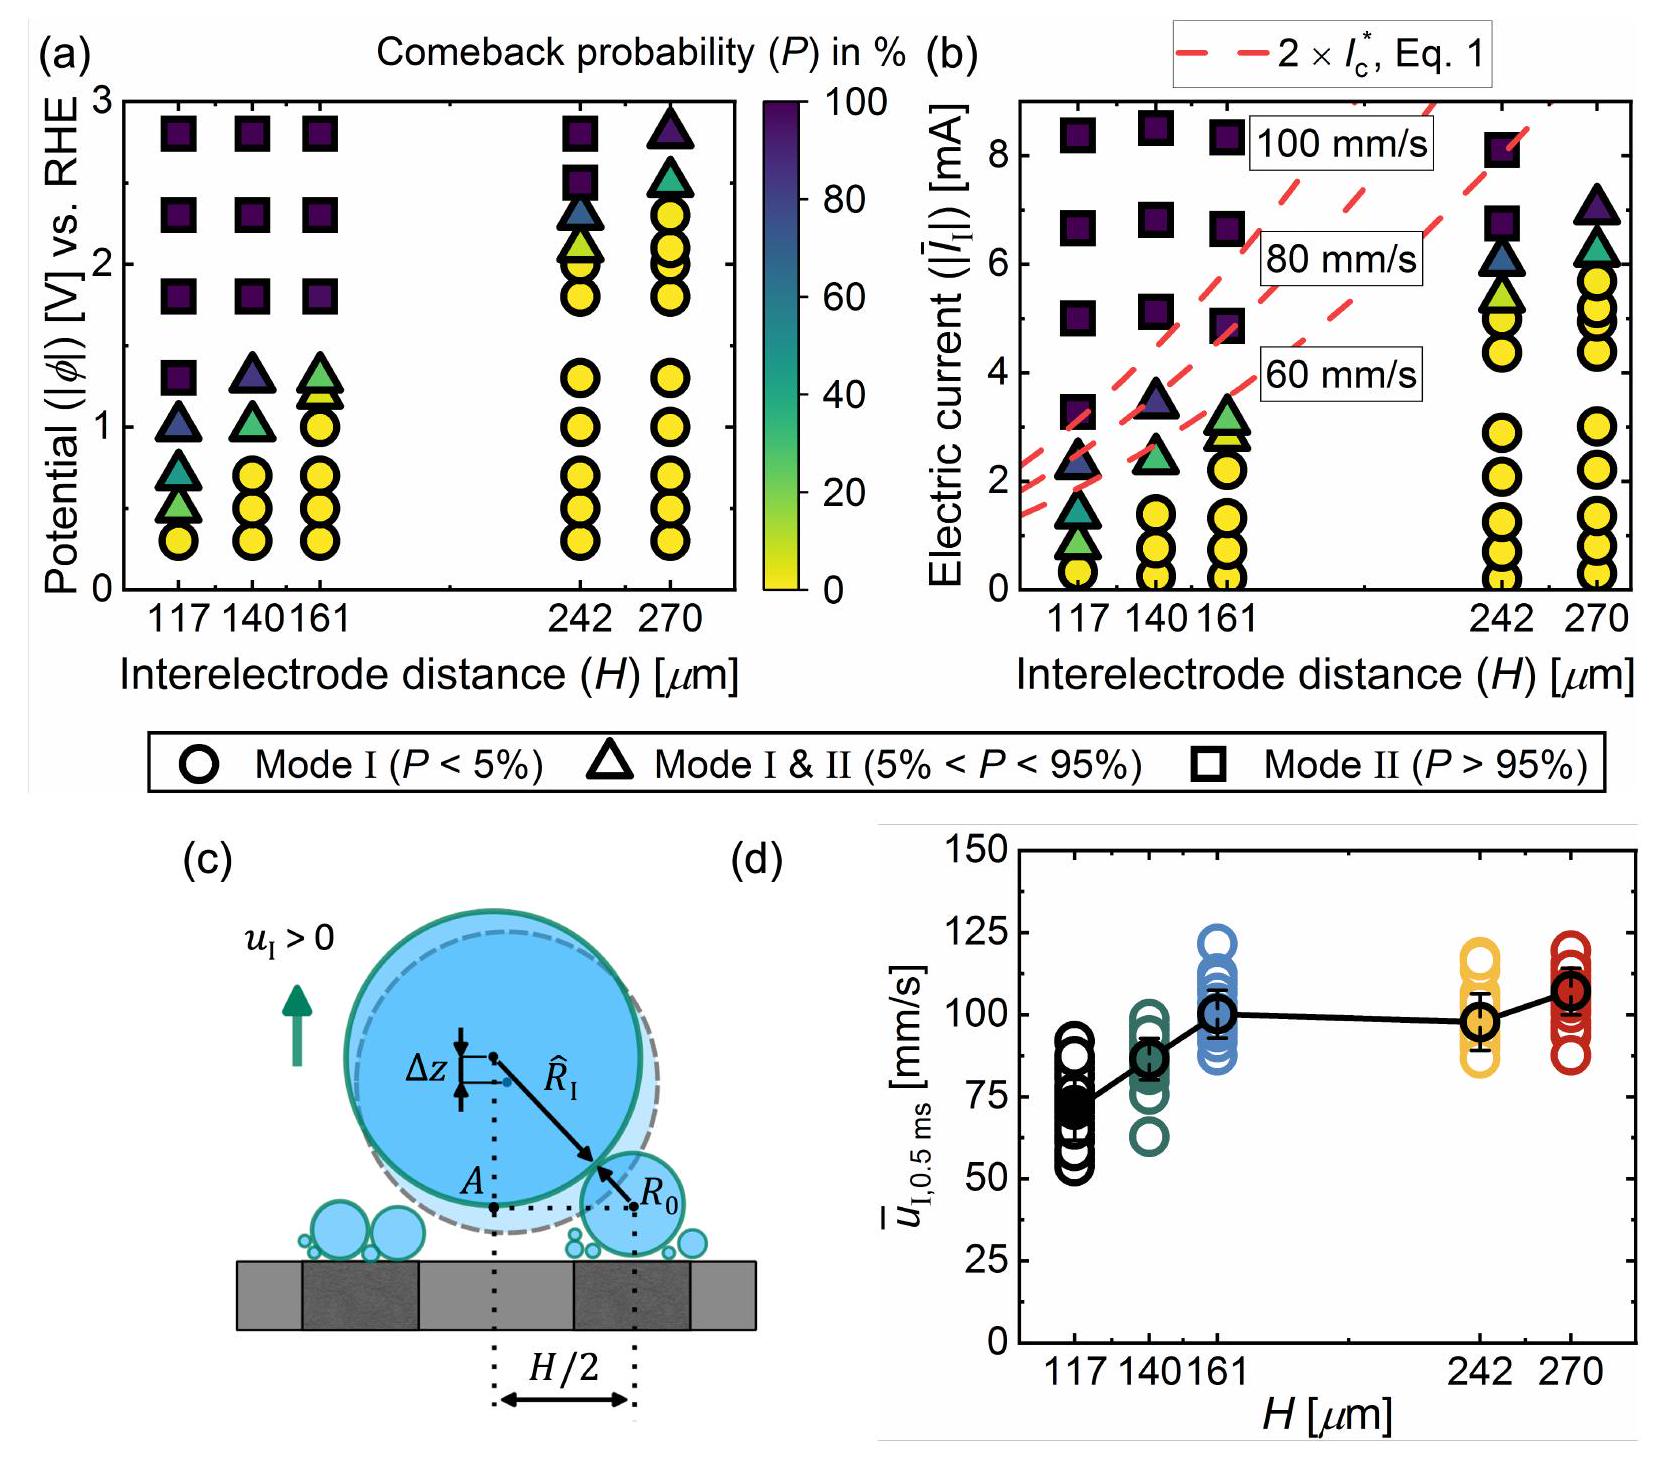
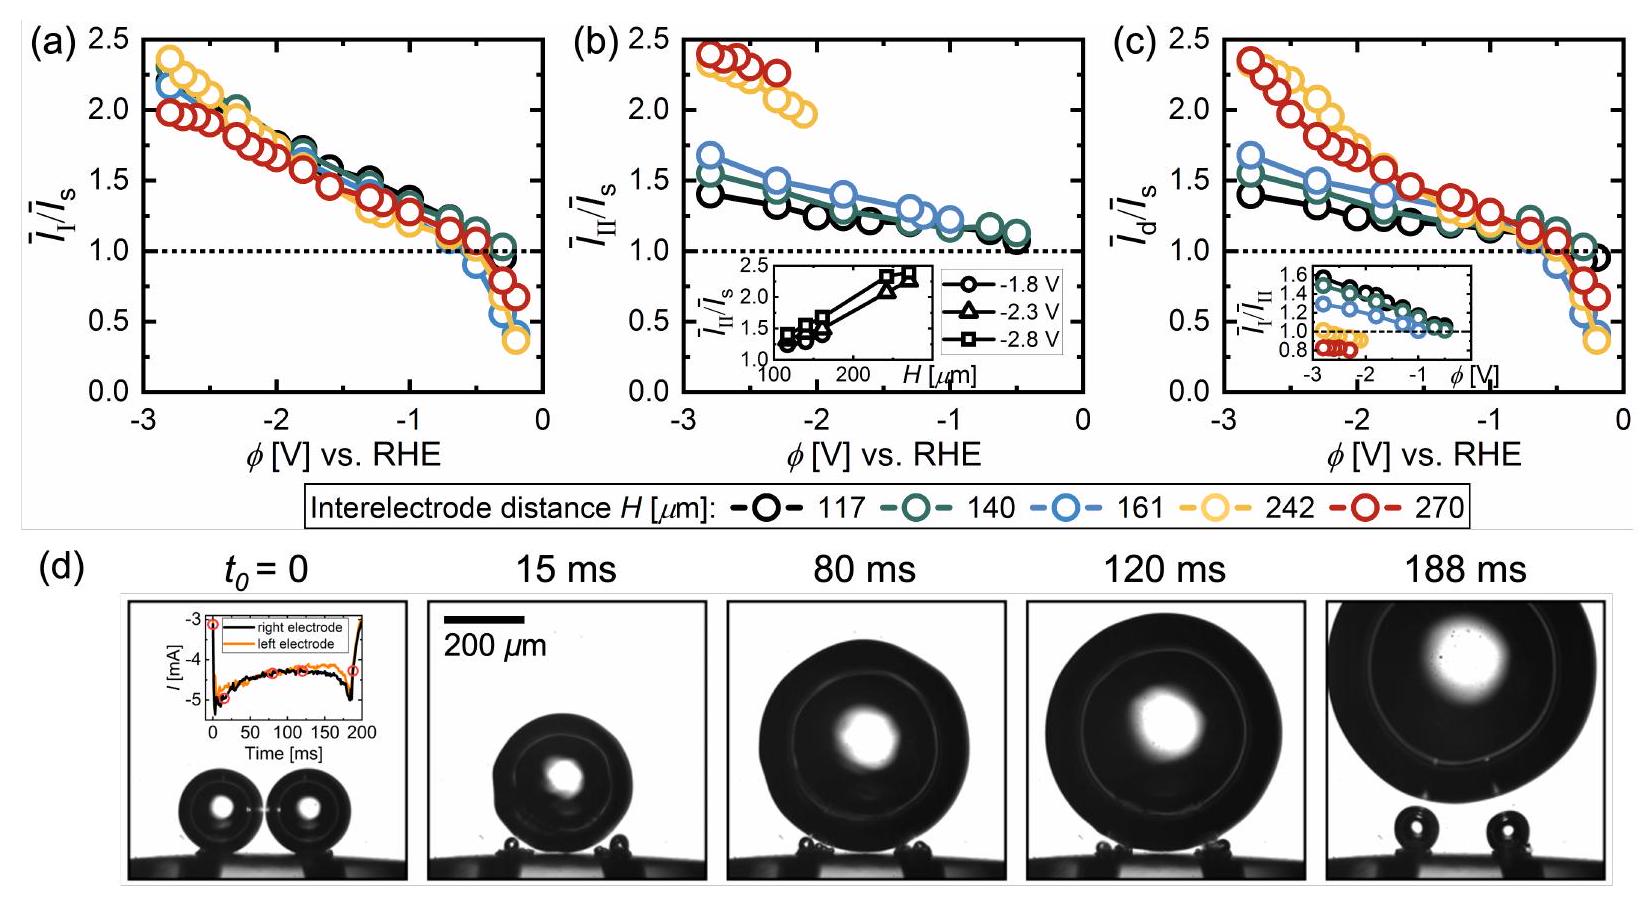
Modes of bubbles evolution

From now on, both electrodes are operated simultaneously, independently of each other, and at the same potential. Initially, we will only consider the pair with a separation of . The measured currents for this configuration are plotted in figure 3a for different potentials. Time traces of the current for both electrodes (‘left’ and ‘right’) are included and for reference we also show the current signal measured when only a single electrode is operated at the same potential (grey line). Focusing initially on the lowest overpotential, , the current oscillations remain periodic during dual operation; however, both the period and amplitude are notably diminished. The reason for this can be understood from the corresponding shadowgraphs presented in figure 3b, which illustrate the bubble dynamics over one period (shown by black box in fig. 3a).
Similar to what is observed for a single electrode, a larger bubble forms and grows initially at each of the two electrodes, leading to a gradual reduction in the current. This process continues until the two bubbles touch and coalesce, which is followed by the departure of the merged bubble along with a spike in the current (see inset at -0.3 V in fig. 3a). Figure 3c details this coalescence process, which happens on the order of micro-seconds, and the emerging deformations of the bubble shape. The coalescence induced jump-off is powered by the released surface energy. While the majority of this energy is dissipated through the capillary waves seen in figure the fraction that is transformed into kinetic energy (less than , for details see Supporting Information) can cause bubble departure at much smaller radii than in the buoyancy-driven scenario, for the newly formed bubble. Together with the fact that each of the coalescing bubbles only contributes half the volume, this explains the significantly enhanced departure frequency.
At higher overpotential at , events with a much longer period length start appearing intermittently in the current traces. These events become more frequent and
Figure 3: (a) Electric current over 2 seconds (out of 30 seconds) of the experimental run at various potentials . The black and orange curves represent the electric current measured at the right and left electrodes, respectively. Grey lines represent corresponding results for single electrode operation. (b) Snapshots depict the bubble evolution following mode I as indicated in (a) by the black rectangular inset at -0.3 V . (c) Snapshots detailing the coalescence-driven departure process recorded at -0.5 V . is one frame before the coalescence process begins. (d) A zoomed-in view of the current at -0.7 V , shown by the green rectangle in (a), with corresponding evolution of . The orange and blue shades correspond to modes I and II, respectively. (e) Mode II of bubble evolution from (d). The red line indicates the maximum height reached by the departed bubble. Recordings in (b) and (e) were performed at 5 kHz , and at 264 kHz in (c).
dominate the signal at , before almost fully superseding the high-frequency coalescence pattern at . In order to elucidate the underlying bubble dynamics, we provide an enlarged view of a segment of the current signal at (green box) in
figure 3d along with the size evolution of the bubbles. The first bubble departure included in figure 3d proceeds analogously to the one shown in figure 3b, and the bubble continues to rise away from the electrode after the coalescence induced take-off. We will refer to this as ‘mode I’ from now on. However, as the corresponding shadowgraphs in figure 3e show, even though the bubble also jumps off after the second coalescence event, it is eventually brought back to the surface through repeated coalescence with newly formed bubbles at both electrodes (see period between
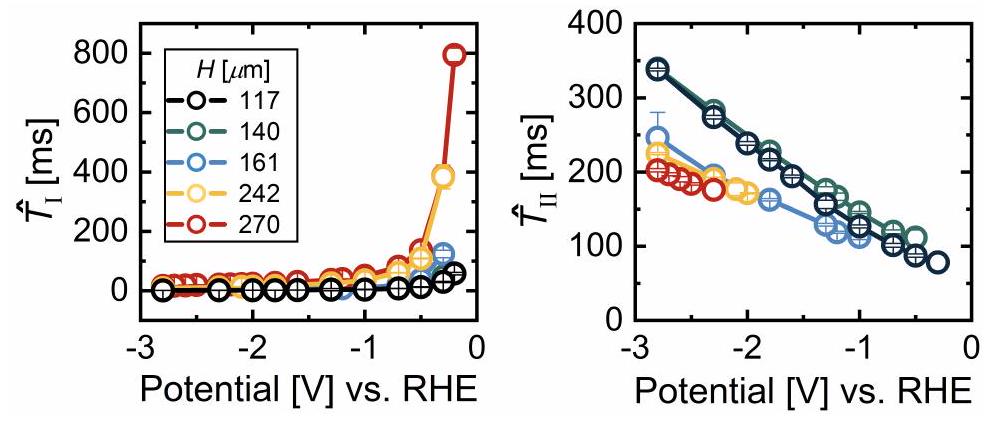
 and ). Following this return, the bubble rests between the two electrodes just above the surface. There, it continues to grow until a buoyancy driven departure (at vs. ), which explains an order of magnitude longer lifetime ( vs. ) of the bubble in this instance. We will denote this as ‘comeback mode’ or ‘mode II’.
It is evident from figure 3a that the dynamics induced by coalescence have a strong impact not only on the current fluctuations, but also on the mean current at a specific potential. To analyse this, we compare period averaged currents for the two modes ( and , taken to be the sum of the currents at both electrodes) to in figure 4 . Note that
Figure 4: Electric current vs. potential for single electrode (black) and for modes I (blue) and II (red) at dual micro-electrode. Both and are the sum of the currents at the left and right electrodes.
it is possible to determine even at high potentials where mode II prevails by considering only the time until the first coalescence, leading to temporary departure of the bubble (see figure 3d). Despite the much faster gas removal, the current at low overpotentials ( V) remains the same or even slightly decreases in dual operation compared to the single electrode case. This can be attributed to the additional shielding by the second bubble in the vicinity of the electrode and the diffusive competition between the two reaction sites, both of which lower performance. However, the benefits of the accelerated gas removal increasingly outweigh these effects as the overpotential is increased. This is particularly true for mode I, where the current is more than double than that of the single electrode at the same potential for the most negative values of investigated. While this clearly demonstrates the potential for performance enhancement through coalescence-induced gas removal, the effective performance enhancement is reduced to less than for the current electrode spacing due to the prevalence of bubble return (mode II) at higher overpotentials. The currents in mode II are consistently lower compared to mode I because the electrode separation is so small, that the returning bubble still blocks a large part of both electrodes (see figure 3e), even though it is located half-way between them.

Phase diagram

To better understand under what conditions under which the return of the bubble after jump-off happens, figure 5 documents the probability ( ) of return for different interelectrode distances and as a function of (figure 5a) and (figure 5b). As is increased, the transition from mode I ( , circles), to a mixed regime ( , triangles) and finally to mode II ( , squares) occurs at increasingly larger values of . In fact, the dependence on is quite strong: for a fixed potential of changes from about at to almost 0 when the distance is increased to . The sketch in figure 5c illustrates the relevant mechanism for the bubble return. A newly formed bubble (with radius ) on one of the electrodes catches up and coalesces with the departed bubble
Figure 5: Phase diagram representing the probability of the bubble coming back after initial departure shown in terms of (a) Potential and (b) Current vs. . The color bar scales the probability from 0 to . The circles denote Scenario I, i.e. when is less than , and squares denote Scenario II, with more than . The triangles are for a mixed regime, where the probability varies widely from 5 to . The red lines plot using eq. 1. (c) The sketch illustrating the relevant geometry for the bubble return. (d) Vertical jump velocity averaged over the first 0.5 ms of the jump vs. for numerous bubbles. The line represents the averaged values at each , completed with standard deviation.
with radius . Due to momentum conservation, the resulting bubble is then located at the joint center of mass of the two coalescing bubbles, which implies a downward shift by compared to the location of the bubble with radius . Repeated coalescence events from both sides then bring the bubble back to the surface as seen in figure 3e. The transition
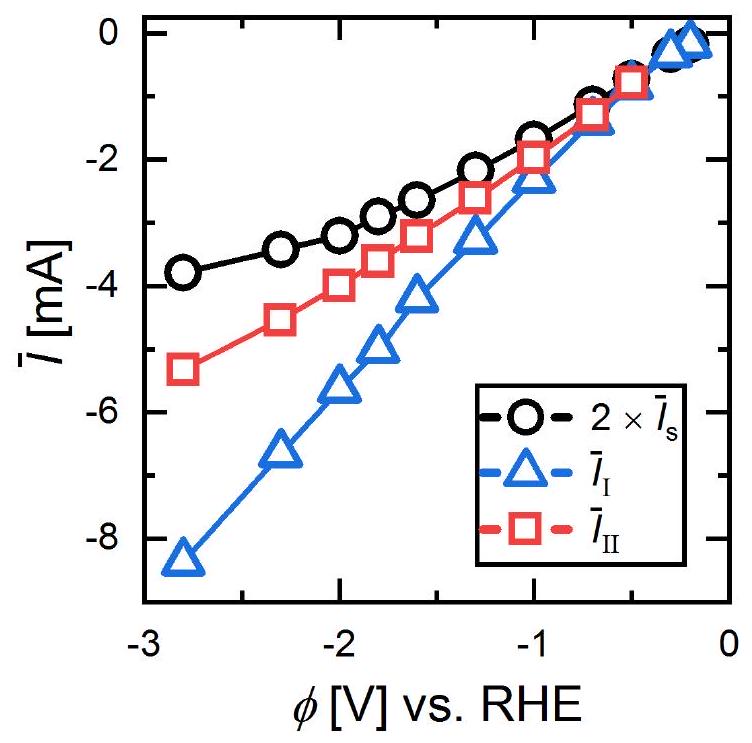
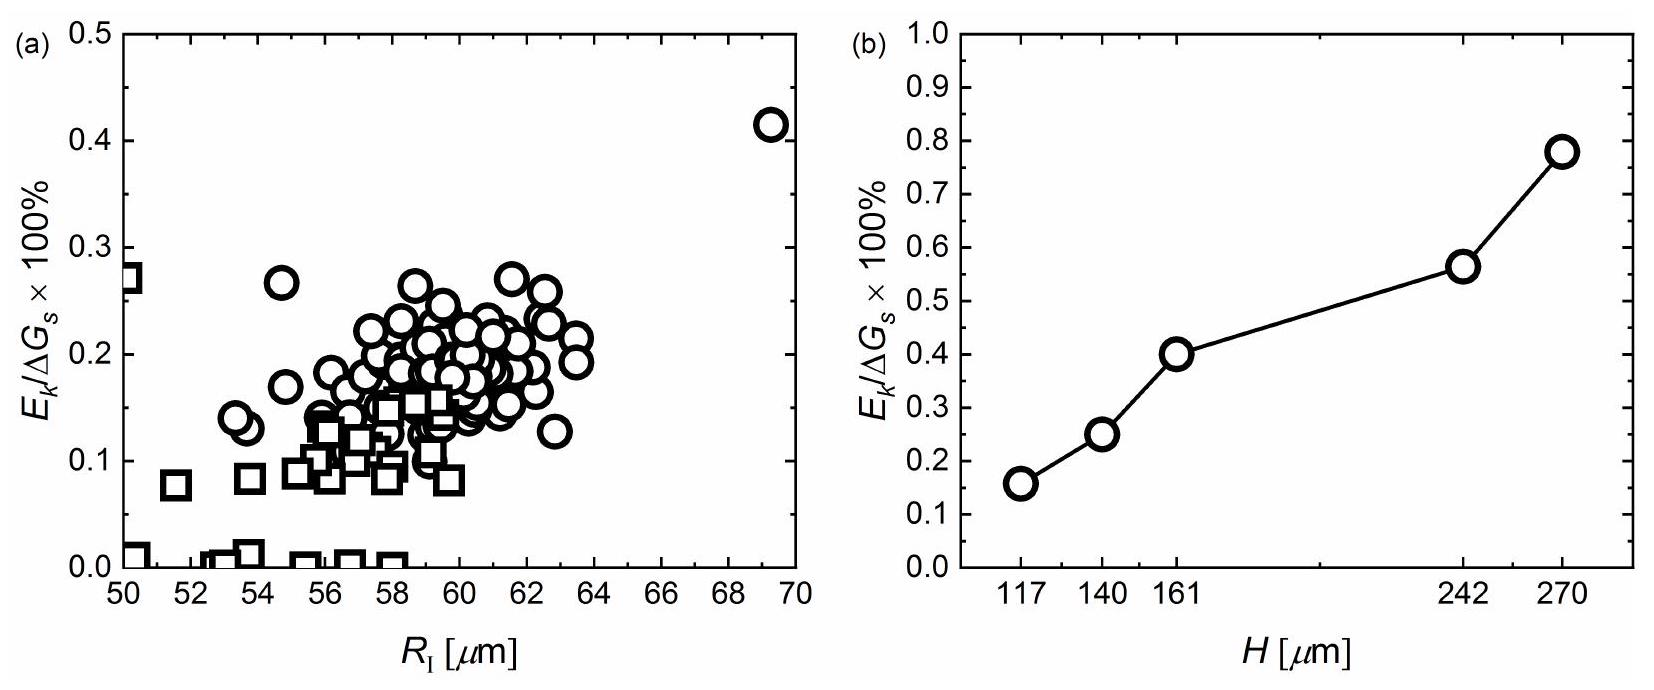
between mode I and mode II is therefore governed by a competition between the departure or ‘jump’ velocity of a bubble after coalescence and the growth rate of bubbles at the electrode. A larger magnitude of electric current, increasing approximately linearly with (see figure 6), enables faster formation of new bubbles which then increases the likelihood of their interaction with the previously departed bubble. Upon increasing the bubble-successor needs to grow to a larger size, hence for a longer time before interacting with the already departed bubble, allowing the latter to move farther away. This will dramatically increase the current required for comeback mode. We can capture this in a simple model based on the geometry sketched in figure 5 c to predict the minimum current for bubble return. Our analysis considers the situation where the new bubble with radius has grown large enough to get in contact with the departing bubble. The time it takes for the bubble to grow to the radius is , where is a prefactor containing the Faraday constant , the pressure inside the bubble , the gas constant and the temperature (see Supporting Information for details). During this time interval, the departing bubble travels the distance , with denoting the effective jump velocity. Based on the geometry of the triangle spanned by the centers of the two bubbles and the point A in figure 5c, the critical current for the mode transition as a function of is given by
For any , a value of can be determined for which reaches a minimum value, . To obtain the value of the current in this critical configuration, an estimate of the jump velocity is required. To obtain this, we tracked bubbles departing after coalescence and then averaged their vertical velocity over the first 0.5 ms to obtain . Note that varies widely depending on the position of both bubbles before coalescence (see Supporting Information for details). The results for this quantity are shown in figure 5d as a function of . From these data, typical values for are found to be in the range from to
with a slight tendency towards higher velocities as the bubble size increases at larger electrode separations . In figure 5b, we have included results for as a function of and for different values of . It can be seen that the model very well captures the increase of the critical current as the electrode separation increases. The best agreement between the model and the data is for , which is close to, although slightly lower, than the measured jump velocities in figure 5d. Among potentially other factors, a reason for this slight difference is the fact that the new bubble with radius is also formed by coalescence and therefore also jumps off the electrode. Additionally, we do not account for shape oscillations of the larger bubbles, which become more prevalent at larger .

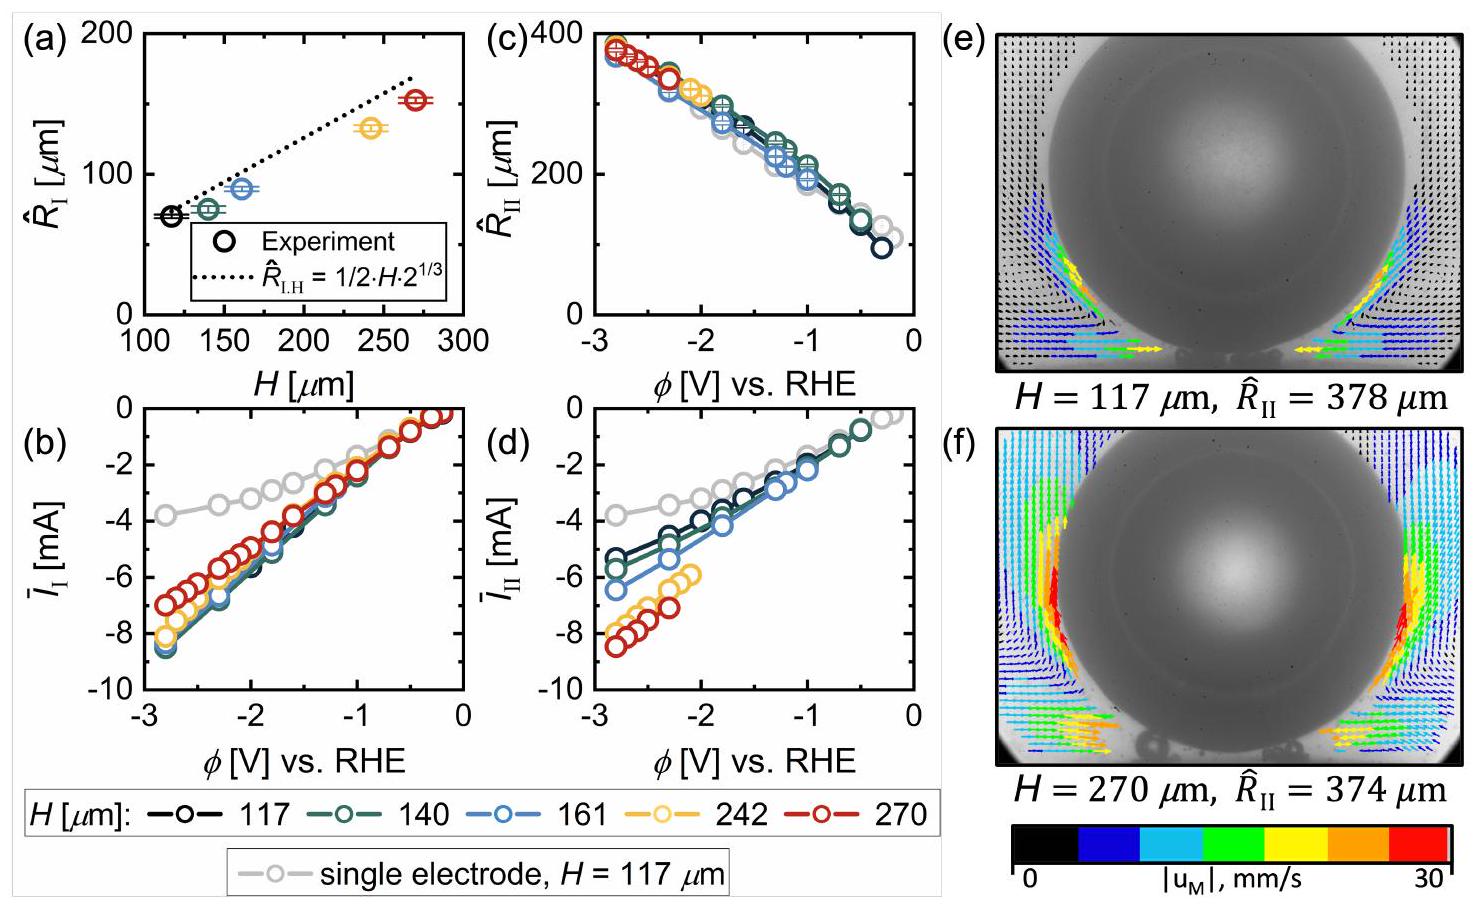
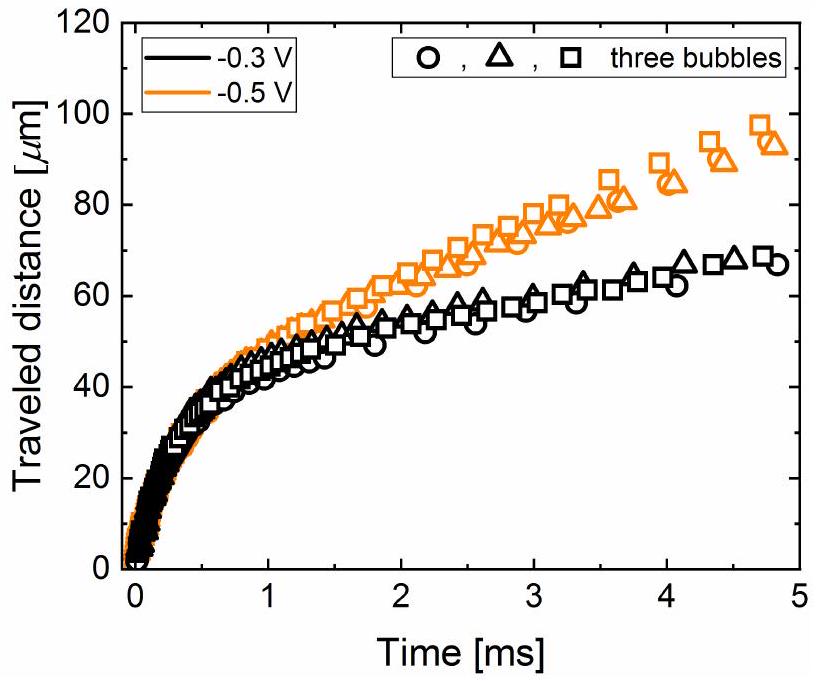
Performance vs. Inter-electrode distance,

To understand how the current varies at different electrode separations, it is useful to first consider how the departure size of the bubbles changes for different . In mode I, the departure is coalescence-driven so that is independent of and varies only with the interelectrode distance . Due to lateral oscillations of the bubble position on the electrode and possibly a slight inclination of the electrode surfaces, the results for shown in figure 6a are about lower than , i.e. the value for the coalescence of two bubbles each with a radius of . This small difference was taken into account when evaluating in equation 1.
Compared to the single electrode, the current in mode I shown in figure 6b is most enhanced at high overpotential and small , because in this case the reduction in bubble departure size is maximal. There is only moderate decrease of for larger primarily due to the relatively small range in and, consequently, in , which is minor compared to variations observed in at different potentials. At low overpotentials, for the larger electrode separations studied and there is no increase of the current compared to , just as was observed at in figure 4 .
In mode II, the departure radius strongly depends on the potential but at most weakly
Figure 6: Departure radius (a) , (c) and electric current (b) , (d) for Modes and , respectively. is given as a function of and are shown as functions of potential and for various . Grey curves are for single electrode. (e) and (f) Velocity fields, , representing Marangoni convection during mode II at -2.8 V and and , respectively. The velocity is measured in a period of 25 ms before the bubble departure.
on , as shown in figure 6c. Remarkably, is approximately the same as for the single electrode case at the same potential (see grey symbols representing ). An investigation of the force balance leading to these trends in are beyond the scope of this study. Nevertheless, we present clear evidence of Marangoni convection (see figures 6(e,f)), consistent with the presence of thermocapillary effects in the same potential range on single electrodes. Based on the flow direction, a resulting downward Marangoni force on the bubble is expected (see figure 1a). The convective motion is much more pronounced at (figure 6f) compared to the narrower spacing of in figure 6e, which is in line with the difference in current between the two cases ( vs. 8.46 mA , respectively). Interestingly, this does not result in a noticeable difference in for the different interelectrode distances, which is presumably due to differences in the geometry dependent electric force. We confirmed that the continued coalescence with small bubble
does not exert a significant apparent force on the bubble (see Supporting Information for details).
In contrast to mode I, the current in mode II shown in figure 6d shows a clear dependence on the electrode separation and increases strongly for larger . This is because the bubble is now centered in between the two electrodes. Therefore the electrodes become more exposed as the distance between them increases, even if the bubble size remains the same. The continuous removal of the smaller bubbles on the electrode by coalescence with the larger one proves to be very beneficial and leads to maximum currents of more than twice , equalling the largest currents observed in mode I.
Figure 7: The electric current (a) , (b) and (c) , all in dimensionless form with reference to . Data are presented as a function of potential ( ) and interelectrode distance ( ). The inset in (b) shows vs. at and -2.8 V . The inset in (c) documents vs. is the current averaged over both mode and mode II . (d) Snapshots throughout the bubble evolution at -2.8 V and marks an instant of time one image before the coalescence of two bubbles (with radii and , respectively) followed by the jump of the merged bubble off the electrode and its consecutive return. The inset shows the electric current throughout the entire evolution, with the red circles marking the corresponding snapshots.
To quantify the performance gain and to compensate for the dependence of the current, we normalise the current on the dual electrode by . This also accounts for small differences
in between the different electrodes used in this study (see Supporting Information). In figure 7a, the ratio is plotted for different as a function of . As the figure shows, the interference effects at low overpotentials already discussed in the context of figure 3, cause to even fall below for . This does not improve noticeably for larger electrode spacing, presumably due to a trade-off between reduced interference effects and the increase in the bubble size with . For larger overpotentials, the benefits of the enhanced gas removal prevail, reflected in a ratio which also consistently increases with increased overpotential exceeding a value of 2 at . Approximately the same values are also encountered for this potential for the ratio in figure 7 b . While the performance in mode II also improves slightly for higher overpotential, it most strongly depends on . As the inset in figure 7b shows, the ratio increases approximately linearly with at constant potential.
Finally, figure 7 c shows how the resulting effective current on the dual electrode changes relative to . In addition to variations in and , this quantity is also influenced by the probability of bubble return (mode II). Given the results in figure 5a, the ratio is therefore dominated by mode I at low and by mode II at large overpotentials. This implies that the performance gains in mode I at high are not practically realisable. However, this is only a limitation at smaller electrode separations, since the current in mode II even exceeds that of mode I for and (see inset of figure 7c). For these cases, the mode transition is therefore even beneficial.
Figure 7d shows snapshots for the parameter combination and for which the highest ratio was observed. Having the returned bubble located at the center in between the electrodes avoids the formation of larger bubbles directly on the electrodes. Notably, only a slight drop in the current is observed (see inset at ) as the outline of the bubble moves beyond the electrode positions. This contradicts the common practice of considering the region under the bubble as inactive but is in line with earlier conjectures.

Conclusions

We have explored the coalescence dynamics of electrogenerated bubbles and their influence on the electrochemical reaction rate using dual platinum micro-electrodes. We found that the coalescence of two adjacent bubbles leads to an initial jump-off of the merged bubble and premature escape from the surface. However, the continued coalescence with newly formed successors may result in a return to the electrode, hence prolonged growth. The latter mode is increasingly prevalent the higher the current and the smaller the interelectrode distance. We proposed a simple model to capture these trends and predict the critical magnitude of the current required to initiate the return process. This comeback mode negates the potential performance improvement achieved through direct departure following the coalescence event at smaller (up to a 1.7- vs. 2.3-fold increase in current at constant potential when compared to a single electrode). However, even in cases of bubble return, the effective current at larger increased by up to 2.4 times because the bubble was then located between the electrodes, exposing a greater electrode area for the reaction. Therefore, this mode is promising, especially since, given the dependence on electrode separation, even greater performance gains can be expected by further increasing . In practice, a similar configuration may be achieved on extended electrodes using hydrophobic islands, which should be spaced to favour coalescence-based departure and minimize the probability of bubble return, thus avoiding the blocking of the active surface area.

Conflicts of interest

There are no conflicts to declare.

Acknowledgements

This research received funding from the Dutch Research Council (NWO) with a co-funding acquired from Nobian and Helmholtz-Zentrum Dresden-Rossendorf (HZDR) in the framework of ElectroChemical Conversion and Materials (ECCM) KICkstart DE-NL (KICH1.ED04.20.009). S.P. acknowledges the support by Basic Science Research Program through the National Research Foundation of Korea (NRF) funded by the Ministry of Education (2021R1A6A3A14039678).
D.K., D.L. and M.T.M.K. received funding from the European Research Council (ERC) (BU-PACT grant agreement number 950111, ERC Advanced grant number 740479-DDD and ERC Advanced Grant ‘FRUMKIN’ number 101019998, respectively). We thank V. Sanjay for insightful discussions on the subject.

References

(1) Brandon, N. P.; Kurban, Z. Clean energy and the hydrogen economy. Philosophical Transactions of the Royal Society A: Mathematical, Physical and Engineering Sciences 2017, 375, 20160400.
(2) Staffell, I.; Scamman, D.; Abad, A. V.; Balcombe, P.; Dodds, P. E.; Ekins, P.; Shah, N.; Ward, K. R. The role of hydrogen and fuel cells in the global energy system. Energy Environmental Science 2019, 12, 463-491.
(3) Dawood, F.; Anda, M.; Shafiullah, G. Hydrogen production for energy: An overview. International Journal of Hydrogen Energy 2020, 45, 3847-3869.
(4) Lee, J. K.; Lee, C.; Fahy, K. F.; Kim, P. J.; Krause, K.; LaManna, J. M.; Baltic, E.; Jacobson, D. L.; Hussey, D. S.; Bazylak, A. Accelerating bubble detachment in porous transport layers with patterned through-pores. ACS Applied Energy Materials 2020, 3, 9676-9684.
(5) Swiegers, G. F.; Terrett, R. N.; Tsekouras, G.; Tsuzuki, T.; Pace, R. J.; Stranger, R. The prospects of developing a highly energy-efficient water electrolyser by eliminating or mitigating bubble effects. Sustainable Energy & Fuels 2021, 5, 1280-1310.
(6) Yu, S.; Li, K.; Wang, W.; Xie, Z.; Ding, L.; Kang, Z.; Wrubel, J.; Ma, Z.; Bender, G.; Yu, H.; others Tuning Catalyst Activation and Utilization Via Controlled Electrode Patterning for Low-Loading and High-Efficiency Water Electrolyzers. Small 2022, 18, 2107745.
(7) Yuan, S.; Zhao, C.; Cai, X.; An, L.; Shen, S.; Yan, X.; Zhang, J. Bubble evolution and transport in PEM water electrolysis: Mechanism, impact, and management. Progress in Energy and Combustion Science 2023, 96, 101075.
(8) Zhao, X.; Ren, H.; Luo, L. Gas bubbles in electrochemical gas evolution reactions. Langmuir 2019, 35, 5392-5408.
(9) Angulo, A.; van der Linde, P.; Gardeniers, H.; Modestino, M.; Rivas, D. F. Influence of bubbles on the energy conversion efficiency of electrochemical reactors. Joule 2020, 4, 555-579.
(10) Angulo, A. E.; Frey, D.; Modestino, M. A. Understanding bubble-induced overpotential losses in multiphase flow electrochemical reactors. Energy & Fuels 2022, 36, 7908-7914.
(11) Shih, A. J.; Monteiro, M. C.; Dattila, F.; Pavesi, D.; Philips, M.; da Silva, A. H.; Vos, R. E.; Ojha, K.; Park, S.; van der Heijden, O.; others Water electrolysis. Nature Reviews Methods Primers 2022, 2, 84.
(12) He, Y.; Cui, Y.; Zhao, Z.; Chen, Y.; Shang, W.; Tan, P. Strategies for bubble removal in electrochemical systems. Energy Reviews 2023, 100015.
(13) Gross, S. J.; McDevitt, K. M.; Mumm, D. R.; Mohraz, A. Mitigating bubble traffic in
gas-evolving electrodes via spinodally derived architectures. ACS Applied Materials Interfaces 2021, 13, 8528-8537.
(14) Tang, Z.; Wang, P.; Xu, B.; Meng, L.; Jiang, L.; Liu, H. Bioinspired Robust Water Repellency in High Humidity by Micro-meter-Scaled Conical Fibers: Toward a LongTime Underwater Aerobic Reaction. Journal of the American Chemical Society 2022, 144, 10950-10957.
(15) Krause, L.; Skibińska, K.; Rox, H.; Baumann, R.; Marzec, M. M.; Yang, X.; Mutschke, G.; Żabiński, P.; Lasagni, A. F.; Eckert, K. Hydrogen Bubble Size Distribution on Nanostructured Ni Surfaces: Electrochemically Active Surface Area Versus Wettability. ACS Applied Materials & Interfaces 2023, 15, 18290-18299.
(16) Nam, Y.; Aktinol, E.; Dhir, V. K.; Ju, Y. S. Single bubble dynamics on a superhydrophilic surface with artificial nucleation sites. International Journal of Heat and Mass Transfer 2011, 54, 1572-1577.
(17) Lu, Z.; Zhu, W.; Yu, X.; Zhang, H.; Li, Y.; Sun, X.; Wang, X.; Wang, H.; Wang, J.; Luo, J.; others Ultrahigh hydrogen evolution performance of under-water “superaerophobic” nanostructured electrodes. Advanced Materials 2014, 26, 2683-2687.
(18) Li, Y.; Zhang, H.; Xu, T.; Lu, Z.; Wu, X.; Wan, P.; Sun, X.; Jiang, L. Under-water superaerophobic pine-shaped Pt nanoarray electrode for ultrahigh-performance hydrogen evolution. Advanced Functional Materials 2015, 25, 1737-1744.
(19) Hao, J.; Yang, W.; Huang, Z.; Zhang, C. Superhydrophilic and superaerophobic copper phosphide microsheets for efficient electrocatalytic hydrogen and oxygen evolution. Advanced Materials Interfaces 2016, 3, 1600236.
(20) Iwata, R.; Zhang, L.; Wilke, K. L.; Gong, S.; He, M.; Gallant, B. M.; Wang, E. N. Bubble growth and departure modes on wettable/non-wettable porous foams in alkaline water splitting. Joule 2021, 5, 887-900.
(21) Andaveh, R.; Darband, G. B.; Maleki, M.; Rouhaghdam, A. S. Superaerophobic/superhydrophilic surfaces as advanced electrocatalysts for the hydrogen evolution reaction: a comprehensive review. Journal of Materials Chemistry A 2022, 10, 51475173.
(22) Cheng, X.; Du, Z.-d.; Ding, Y.; Li, F.-y.; Hua, Z.-s.; Liu, H. Bubble Management for Electrolytic Water Splitting by Surface Engineering: A Review. Langmuir 2023,
(23) Winther-Jensen, O.; Chatjaroenporn, K.; Winther-Jensen, B.; MacFarlane, D. R. Towards hydrogen production using a breathable electrode structure to directly separate gases in the water splitting reaction. International Journal of Hydrogen Energy 2012, 37, 8185-8189.
(24) Tiwari, P.; Tsekouras, G.; Wagner, K.; Swiegers, G. F.; Wallace, G. G. A new class of bubble-free water electrolyzer that is intrinsically highly efficient. International Journal of Hydrogen Energy 2019, 44, 23568-23579.
(25) Tsekouras, G.; Terrett, R.; Yu, Z.; Cheng, Z.; Swiegers, G. F.; Tsuzuki, T.; Stranger, R.; Pace, R. J. Insights into the phenomenon of ‘bubble-free’ electrocatalytic oxygen evolution from water. Sustainable Energy & Fuels 2021, 5, 808-819.
(26) Hodges, A.; Hoang, A. L.; Tsekouras, G.; Wagner, K.; Lee, C.-Y.; Swiegers, G. F.; Wallace, G. G. A high-performance capillary-fed electrolysis cell promises more costcompetitive renewable hydrogen. Nature Communications 2022, 13, 1304.
(27) Kadyk, T.; Bruce, D.; Eikerling, M. How to Enhance Gas Removal from Porous Electrodes? Scientific Reports 2016, 6.
(28) Teschke, O.; Galembeck, F. A New Type of Separator for High Temperature Water Electrolyzers. Journal of The Electrochemical Society 1983, 130, 33-36.
(29) Teschke, O.; Galembeck, F. Effect of PTFE Coverage on the Performance of Gas Evolving Electrodes. Journal of The Electrochemical Society 1984, 131, 1095-1097.
(30) Brussieux, C.; Viers, P.; Roustan, H.; Rakib, M. Controlled electrochemical gas bubble release from electrodes entirely and partially covered with hydrophobic materials. Electrochimica Acta 2011, 56, 7194-7201.
(31) Lake, J. R.; Soto, Á. M.; Varanasi, K. K. Impact of Bubbles on Electrochemically Active Surface Area of Microtextured Gas-Evolving Electrodes. Langmuir 2022, 38, 3276-3283.
(32) Matsushima, H.; Nishida, T.; Konishi, Y.; Fukunaka, Y.; Ito, Y.; Kuribayashi, K. Water electrolysis under microgravity: Part 1. Experimental technique. Electrochimica Acta 2003, 48, 4119-4125.
(33) Zhou, J.; Zhang, Y.; Wei, J. A modified bubble dynamics model for predicting bubble departure diameter on micro-pin-finned surfaces under microgravity. Applied Thermal Engineering 2018, 132, 450-462.
(34) Brinkert, K.; Richter, M. H.; Akay, Ö.; Liedtke, J.; Giersig, M.; Fountaine, K. T.; Lewerenz, H.-J. Efficient solar hydrogen generation in microgravity environment. Nature Communications 2018, 9, 2527.
(35) Akay, Ö.; Bashkatov, A.; Coy, E.; Eckert, K.; Einarsrud, K. E.; Friedrich, A.; Kimmel, B.; Loos, S.; Mutschke, G.; Röntzsch, L.; others Electrolysis in reduced gravitational environments: current research perspectives and future applications. npj Microgravity 2022, 8, 56.
(36) Akay, Ö.; Poon, J.; Robertson, C.; Abdi, F. F.; Cuenya, B. R.; Giersig, M.; Brinkert, K. Releasing the bubbles: nanotopographical electrocatalyst design for efficient photoelectrochemical hydrogen production in microgravity environment. Advanced Science 2022, 9, 2105380.
(37) Raza, M. Q.; Köckritz, M. v.; Sebilleau, J.; Colin, C.; Zupancic, M.; Bucci, M.; Troha, T.; Golobic, I. Coalescence-induced jumping of bubbles in shear flow in microgravity. Physics of Fluids 2023, 35.
(38) Bashkatov, A.; Yang, X.; Mutschke, G.; Fritzsche, B.; Hossain, S. S.; Eckert, K. Dynamics of single hydrogen bubbles at Pt microelectrodes in microgravity. Physical Chemistry Chemical Physics 2021, 23, 11818-11830.
(39) Janssen, L. J.; Hoogland, J. The effect of electrolytically evolved gas bubbles on the thickness of the diffusion layer. Electrochimica Acta 1970, 15, 1013-1023.
(40) Sides, P. J.; Tobias, C. W. A close view of gas evolution from the back side of a transparent electrode. Journal of the Electrochemical Society 1985, 132, 583.
(41) Hashemi, S. M. H.; Karnakov, P.; Hadikhani, P.; Chinello, E.; Litvinov, S.; Moser, C.; Koumoutsakos, P.; Psaltis, D. A versatile and membrane-less electrochemical reactor for the electrolysis of water and brine. Energy & Environmental Science 2019, 12, 1592-1604.
(42) Ikeda, H.; Misumi, R.; Nishiki, Y.; Kuroda, Y.; Mitsushima, S. tert-Butyl-alcoholinduced breakage of the rigid bubble layer that causes overpotential in the oxygen evolution reaction during alkaline water electrolysis. Electrochimica Acta 2023, 452, 142283.
(43) Westerheide, D. E.; Westwater, J. Isothermal growth of hydrogen bubbles during electrolysis. AIChE Journal 1961, 7, 357-362.
(44) Bashkatov, A.; Hossain, S. S.; Mutschke, G.; Yang, X.; Rox, H.; Weidinger, I. M.; Eckert, K. On the growth regimes of hydrogen bubbles at microelectrodes. Physical Chemistry Chemical Physics 2022, 24, 26738-26752.
(45) Park, S.; Liu, L.; Demirkır, Ç.; van der Heijden, O.; Lohse, D.; Krug, D.; Koper, M. T. Solutal Marangoni effect determines bubble dynamics during electrocatalytic hydrogen evolution. Nature Chemistry 2023, 1-9.
(46) Yang, X.; Karnbach, F.; Uhlemann, M.; Odenbach, S.; Eckert, K. Dynamics of single hydrogen bubbles at a platinum microelectrode. Langmuir 2015, 31, 8184-8193.
(47) Bashkatov, A.; Hossain, S. S.; Yang, X.; Mutschke, G.; Eckert, K. Oscillating hydrogen bubbles at Pt microelectrodes. Physical Review Letters 2019, 123, 214503.
(48) Kristof, P.; Pritzker, M. Effect of electrolyte composition on the dynamics of hydrogen gas bubble evolution at copper microelectrodes. Journal of Applied Electrochemistry 1997, 27, 255-265.
(49) Brandon, N.; Kelsall, G. Growth kinetics of bubbles electrogenerated at microelectrodes. Journal of Applied Electrochemistry 1985, 15, 475-484.
(50) Fernandez, D.; Maurer, P.; Martine, M.; Coey, J.; Möbius, M. E. Bubble formation at a gas-evolving microelectrode. Langmuir 2014, 30, 13065-13074.
(51) Massing, J.; Mutschke, G.; Baczyzmalski, D.; Hossain, S. S.; Yang, X.; Eckert, K.; Cierpka, C. Thermocapillary convection during hydrogen evolution at microelectrodes. Electrochimica Acta 2019, 297, 929-940.
(52) Hossain, S. S.; Mutschke, G.; Bashkatov, A.; Eckert, K. The thermocapillary effect on gas bubbles growing on electrodes of different sizes. Electrochimica Acta 2020, 353, 136461.
(53) Babich, A.; Bashkatov, A.; Yang, X.; Mutschke, G.; Eckert, K. In-situ measurements of temperature field and Marangoni convection at hydrogen bubbles using schlieren and PTV techniques. International Journal of Heat and Mass Transfer 2023, 215, 124466.
(54) Zhan, S.; Yuan, R.; Wang, X.; Zhang, W.; Yu, K.; Li, B.; Wang, Z.; Wang, J. Dynamics of growth and detachment of single hydrogen bubble on horizontal and vertical microelectrode surfaces considering liquid microlayer structure in water electrolysis. Physics of Fluids 2023, 35.
(55) Meulenbroek, A.; Vreman, A.; Deen, N. Competing Marangoni effects form a stagnant cap on the interface of a hydrogen bubble attached to a microelectrode. Electrochimica Acta 2021, 385, 138298.
(56) Perez Sirkin, Y. A.; Gadea, E. D.; Scherlis, D. A.; Molinero, V. Mechanisms of nucleation and stationary states of electrochemically generated nanobubbles. Journal of the American Chemical Society 2019, 141, 10801-10811.
(57) Chen, Q.; Wiedenroth, H. S.; German, S. R.; White, H. S. Electrochemical nucleation of stable nanobubbles at Pt nanoelectrodes. Journal of the American Chemical Society 2015, 137, 12064-12069.
(58) German, S. R.; Edwards, M. A.; Ren, H.; White, H. S. Critical nuclei size, rate, and activation energy of gas nucleation. Journal of the American Chemical Society 2018, 140, 4047-4053.
(59) Sepahi, F.; Verzicco, R.; Lohse, D.; Krug, D. Mass transport at gas-evolving electrodes. 2023.
(60) Young, N.; Goldstein, J. S.; Block, M. The motion of bubbles in a vertical temperature gradient. Journal of Fluid Mechanics 1959, 6, 350-356.
(61) Guelcher, S. A.; Solomentsev, Y. E.; Sides, P. J.; Anderson, J. L. Thermocapillary phenomena and bubble coalescence during electrolytic gas evolution. Journal of The Electrochemical Society 1998, 145, 1848.
(62) Lubetkin, S. Thermal Marangoni effects on gas bubbles are generally accompanied by solutal Marangoni effects. Langmuir 2003, 19, 10774-10778.
(63) Yang, X.; Baczyzmalski, D.; Cierpka, C.; Mutschke, G.; Eckert, K. Marangoni convection at electrogenerated hydrogen bubbles. Physical Chemistry Chemical Physics 2018, 20, 11542-11548.
(64) Soto, Á. M.; Maddalena, T.; Fraters, A.; Van Der Meer, D.; Lohse, D. Coalescence of diffusively growing gas bubbles. Journal of Fluid Mechanics 2018, 846, 143-165.
(65) Lv, P.; Peñas, P.; Eijkel, J.; Van Den Berg, A.; Zhang, X.; Lohse, D.; others Selfpropelled detachment upon coalescence of surface bubbles. Physical Review Letters 2021, 127, 235501.
(66) Sanjay, V.; Lohse, D.; Jalaal, M. Bursting bubble in a viscoplastic medium. Journal of Fluid Mechanics 2021, 922, A2.
(67) Thorncroft, G. E.; Klausner, J. F. Bubble forces and detachment models. Multiphase Science and Technology 2001, 13.
(68) Favre, L.; Colin, C.; Pujet, S.; Mimouni, S. An updated force balance approach to investigate bubble sliding in vertical flow boiling at low and high pressures. International Journal of Heat and Mass Transfer 2023, 211, 124227.
(69) Hossain, S. S.; Bashkatov, A.; Yang, X.; Mutschke, G.; Eckert, K. Force balance of hydrogen bubbles growing and oscillating on a microelectrode. Physical Review E 2022,
(70) Pande, N.; Mul, G.; Lohse, D.; Mei, B. Correlating the short-time current response of a hydrogen evolving nickel electrode to bubble growth. Journal of The Electrochemical Society 2019, 166, E280.

Supporting Information:

Performance enhancement of electrocatalytic hydrogen evolution through coalescence-induced bubble dynamics

Aleksandr Bashkatov, Sunghak Park, Çayan Demirkır, Jeffery A. Wood, Marc T.M. Koper, Detlef Lohse, § and Dominik Krug*, Physics of Fluids Group, Max Planck Center for Complex Fluid Dynamics and J. M.Burgers Centre for Fluid Dynamics, University of Twente, Enschede, Netherlands Leiden Institute of Chemistry, Leiden University, Leiden, Netherlands【Soft Matter, Fluidics and Interfaces, MESA + Institute for Nanotechnology, J. M. Burgers Centre for Fluid Dynamics, University of Twente, Enschede, Netherlands§Max Planck Institute for Dynamics and Self-Organization, Göttingen, GermanyE-mail: a.bashkatov@utwente.nl; d.j.krug@utwente.nl

Single electrode: characterization

Figure S1 documents the electric current over 5 seconds (out of 30 seconds) of the experimental run at various potentials ( ). The currents are shown for for left and right electrodes (see figure 1a in the manuscript), run separately.
Figure S1: The electric current over time for left and right electrodes.
Figure S2 characterizes five electrodes in terms of the electric current ( ), lifetime ( ), and radius at the departure ( ) vs. is averaged over 30 seconds and the left and right electrodes. and are averaged for multiple bubbles and accompanied by the standard deviations. The low standard deviation for and demonstrates the highly
Figure S2: The electric current, lifetime and departure radius for bubbles produced at single electrode vs. for different electrodes . The error bars represent standard deviation.
periodical evolution of bubbles. The quite similar current between various suggests that the surfaces of these electrodes are alike. However, the small differences are enough to affect the dynamics of bubbles and significantly alter the lifetime and size at the departure.

Dual electrode: characterization

For completeness of the results presented in the manuscript figures S3 and S4 document the electric current vs. time plotted for 1 second our of 30 seconds of the experiment run. is plotted for various potentials ( ) and interelectrode distance ( ). Figs. S3a, b and
Figure S3: The electric current vs. time plotted for 1 second out of 30 seconds of the experimental run for various potentials and interelectrode distance: (a) , (b) , (c) .
c are for , respectively. Figs. S4a and b are for and (b) .
Figure S4: The electric current vs. time plotted for 1 second out of 30 seconds of the experimental run for various potentials and interelectrode distance: (a) , (b) .
Figure S5 documents the lifetime of the bubbles produced at dual electrode vs. potential for Modes I (left) and II (right) and for different electrodes. is averaged for multiple bubbles and accompanied by the standard deviations. Two main trends can be observed: (i) Since the departure radius in mode I is independent of the reduces at larger overpotentials, owing to higher electric current. It also increases together with , especially at larger . – This is because the pair of bubbles need to grow to a bigger size before coalescence at larger ; (ii) On the other hand, increases at larger overpotentials and reduces at larger . As already mentioned in the manuscript, larger overpotentials imply larger downwardacting forces increasing the departure size of the bubble. Therefore the bubble would grow for a longer time. However, the separation of two electrodes away from each other for larger
distances enables higher currents, hence faster production rate.
Figure S5: The lifetime at dual electrode as a function of potential ( ) and interelectrode distance ( ). and are for mode I and mode II, respectively. The error bars represent standard deviation.
Figure S6 demonstrates the traveling distance in vertical direction of the merged bubble in the first 5 milliseconds after the jump-off of the electrode driven by the coalescence event at . The results are shown for and -0.5 V and three bubbles in each case. The curves document that the jumping velocity notably decays over time ( ) due to the effects of drag force, particularly in the moments following the jump. Interestingly, the “terminal” velocity of the bubble, which can be read from the slope of the curves and i.e. ca. after 2 ms , increased at a larger overpotential ( -0.5 V ). This might be explained by the wake behind the rising bubble-predecessor. This flow drags, hence accelerates the merged bubble in the moment of departure. The wake enhances with the faster departure of bubbles-predecessors (smaller ) which is the case at a more negative potential.
Figure S7 represents the vertical jumping velocity for numerous bubbles, averaged over the first 0.5 ms of the jump, vs. parent size ratio . The experiments performed at and (a) , (b) . and are radii for smaller and larger bubbles, respectively. The geometric parameters are shown in figure S7c. The color bar scales another geometric parameter given in dimensionless form. It represents the relative position of the bubble i.e. the distance from the bubble bottom to the electrode, chosen as the maximum value between the smaller and bigger bubbles. The bubble sits at the electrode if and is away from the electrode if . The circles represent mode I, i.e. when the bubble departs into the bulk following the coalescence event, and squares
Figure S6: The trajectory of bubble at -0.3 V and -0.5 V over the first 5 milliseconds after coalescence driven jump-off. is one frame before coalescence. Each potential is presented by three bubbles. The interelectrode distance .
denote mode II, i.e. when the once departed bubble following the coalescence event comes back to the surface, continues to grow, and departs at a later stage due to buoyancy. Note that varies widely depending on the position of both bubbles before coalescence and their size ratio.
Figure S7: (a),(b) The vertical jumping velocity ( ) vs.. at and . The color bar scales the relative position of the bubble shown in (c), i.e. the maximum of either smaller or bigger bubbles, prior to coalescence at . Image recording performed at 10 kHz .
Figures S 7 a and b demonstrate two general trends: (i) reduces as per reduction in and as per increase in ; (ii) at higher potential, hence current, the bubble would
come back to the electrode more often moving away with even higher jumping velocity, as already emphasized in the manuscript (see figure 5).
Upon coalescence of two bubbles, there is a release of surface energy ( ) given as
where and are the left, right and merged bubbles, respectively. is the surface tension of the electrolyte. The released energy partly dissipates by the bubble oscillations, working against viscous drag. When in the proximity to the surface, the remaining energy is converted to the kinetic energy ( ) driving the resultant (merged) bubble to jump off the electrode. The kinetic energy is
where is added mass coefficient, electrolyte density and is the initial jumping velocity. For a spherical bubble , however, when the bubble is in proximity to the wall the coefficient is larger. In detail, when two bubbles approach each other, the thin film of electrolyte separating them gradually drains and eventually ruptures. This leads to the formation of a neck, i.e. an open cavity, and a series of capillary waves of varying strengths that propagate along the electrolyte-gas interface. These waves move away from the neck region until they meet at the opposite apex of the coalescence point (see manuscript, fig. 3c). The strength of these waves decreases as they travel along the interface due to continuous viscous dissipation. Meanwhile, the surface tension drives the retraction of the remaining capillary waves towards a spherical shape, deforming the bubble shape. Once the excess surface energy overcomes the work done by the bubble against viscous drag ( ) during the expansion and retraction processes, the resultant net component of momentum perpendicular to the surface causes the bubble to jump off the electrode. As neither of the bubbles is attached to the electrode, the adhesion energy is neglected. The
process is controlled by surface tension and viscosity and is often characterized in terms of the Ohnesorge number is the dynamic viscosity of the electrolyte. The influence of gravity during the coalescence, before lift-off, is negligible. While the process is considered highly inefficient, with only a small portion of surface energy translating into kinetic energy, it is sufficient for a resultant bubble to jump off the electrode acquiring an initial velocity .
Figure S8 documents an estimation of the ratio between the translated kinetic energy ( ) and the released surface energy ( ) as a function of (a) and (b) . The data points in fig. S8a is calculated using eq. 1 and eq. 2 by taking corresponding and for the bubbles presented in fig. S7a, i.e. at and . The circles represent the bubbles following mode I and squares mode II. The data points in fig. S8b is based on the from fig. 6a and from fig. 5 d in the manuscript, assuming that , hence .
Figure S8: The ratio between the translated kinetic energy ( ) and the released surface energy ( ) as a function of (a) and (b) .
Although the taken velocity is smaller than the initial jumping velocity and is further affected by the wake behind the departed bubble-predecessor, fig. S8 confirms the inefficiency of the coalescence process, as the translated kinetic energy is below of the released surface energy.

Phase diagram: model

To provide a general understanding of the relationship between probability ( ), interelectrode distance , and electric current presented in fig. 5 (see manuscript), we propose a simple model based on the velocity of the departing bubble and the growth rate of the bubble-successor. The model predicts the critical magnitude of the current required to produce hydrogen quickly enough to guarantee the coalescence between the departing bubble ( ) and its successor ( ). The time it takes for the new bubble to grow to the radius is which can be found from Faraday’s and ideal gas laws.
The ideal gas law given as
where is the pressure inside the bubble, is the volume of the gas, is the total mass of the gas, is the molar mass, is the ideal gas constant and is temperature of the gas. The produced charge is
The Faraday’s law reads
where is the Faraday’s constant and is the valency of the ions ( +1 ) multiplied by number of protons (2).
By substituting Eqs. 4 and Eq. 5 in Eq. 3
with . During this time interval , the departing bubble travels the distance
, with denoting the effective jump velocity. Based on the geometry of the triangle spanned by the centers of the two bubbles and the point A in figure 5c (see manuscript), the following relation can be expressed:
where or is taken from experiment (see figure 6a).
By substituting into eq. 7 , the critical current for the mode transition as a function of is given by:

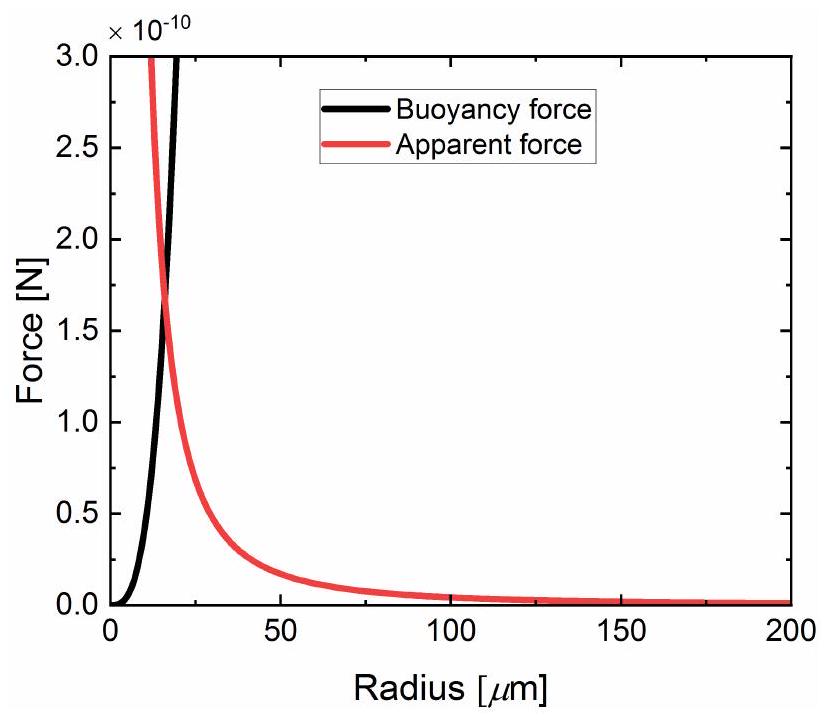
Apparent force: bubble-carpet interaction

It was shown that the bubble grows while seated on a carpet of microbubbles, undergoing a continuous intensive coalescence with it. Throughout numerous coalescence events, the mother bubble experiences a shift in the mass center, resulting in acceleration towards the electrode surface. This acceleration can be considered as an apparent force . An estimate for this apparent force is derived from the principle of momentum conservation, given as
where and represent the total mass and mass center of the bubble at time , respectively; and denote the initial mass and mass center of the bubble at an arbitrary time ; and stands for the mass injection rate due to continuous coalescence with the carpet of microbubbles with the center of mass at and are constant. All mass centers are with reference to the electrode surface. The mass of the bubble at any given moment is
By substituting from eq. 9 into eq. 10
Given that at a given current is a constant (as well as and )
We further assume that is also constant at given . By performing differentiation one more time using eq. 12
By substituting eq. 12 in eq. 13
When considering only a short interval , we can approximate and eq. 14 reads
, which is the thickness of the carpet, is also neglected. Using the Faraday’s and ideal gas laws
where .
Finally, by substituting eq. 16 into eq. 15 the apparent force reads
Figure S9: Buoyancy and apparent forces as a function of bubble radius at .
Figure S9 documents a comparison between the buoyancy force and apparent force, calculated using eq. 17 at (which corresponds to approximately the maximum current observed in this study), against the bubble radius . The buoyancy force defined as , where represents gravitational acceleration. Fig. S9 demonstrates that the continued coalescence with the carpet of microbubbles does not impose a significant apparent force on the bubble. – This force decays rapidly with increasing and becomes smaller than the buoyancy force at at approximately .

References

(1) Lv, P.; Peñas, P.; Eijkel, J.; Van Den Berg, A.; Zhang, X.; Lohse, D.; others Self-propelled detachment upon coalescence of surface bubbles. Physical Review Letters 2021, 127, 235501.
(2) Raza, M. Q.; Köckritz, M. v.; Sebilleau, J.; Colin, C.; Zupancic, M.; Bucci, M.; Troha, T.;
Golobic, I. Coalescence-induced jumping of bubbles in shear flow in microgravity. Physics of Fluids 2023, 35.
(3) Sanjay, V.; Lohse, D.; Jalaal, M. Bursting bubble in a viscoplastic medium. Journal of Fluid Mechanics 2021, 922, A2.