تعزيز أنظمة توصية المحاصيل باستخدام الذكاء الاصطناعي القابل للتفسير: دراسة حول اتخاذ القرارات الزراعية Enhancing crop recommendation systems with explainable artificial intelligence: a study on agricultural decision-making

المجلة: Neural Computing and Applications، المجلد: 36، العدد: 11
DOI: https://doi.org/10.1007/s00521-023-09391-2
تاريخ النشر: 2024-01-11

تعزيز أنظمة توصية المحاصيل باستخدام الذكاء الاصطناعي القابل للتفسير: دراسة حول اتخاذ القرارات الزراعية

محمود ي. شمس سماح أ. جمل فاطمة م. طلعت (د)

تاريخ الاستلام: 1 مايو 2023 / تاريخ القبول: 13 ديسمبر 2023 / تاريخ النشر على الإنترنت: 11 يناير 2024
© المؤلف(ون) 2024

الملخص

أنظمة توصية المحاصيل هي أدوات لا تقدر بثمن للمزارعين، تساعدهم في اتخاذ قرارات مستنيرة بشأن اختيار المحاصيل لتحسين العوائد. تستفيد هذه الأنظمة من ثروة من البيانات، بما في ذلك خصائص التربة، وأداء المحاصيل التاريخي، وأنماط الطقس السائدة، لتقديم توصيات مخصصة. استجابةً للطلب المتزايد على الشفافية وقابلية التفسير في اتخاذ القرارات الزراعية، يقدم هذه الدراسة XAI-CROP، وهو خوارزمية مبتكرة تستفيد من مبادئ الذكاء الاصطناعي القابل للتفسير (XAI). الهدف الأساسي من XAI-CROP هو تمكين المزارعين من الحصول على رؤى مفهومة حول عملية التوصية، متجاوزة الطبيعة الغامضة لنماذج التعلم الآلي التقليدية. تقارن الدراسة بدقة بين XAI-CROP ونماذج التعلم الآلي البارزة، بما في ذلك تعزيز التدرج (GB)، شجرة القرار (DT)، الغابة العشوائية (RF)، بايزي الغاوسي الساذج (GNB)، وبايزي الساذج متعدد الوسائط (MNB). تستخدم تقييم الأداء ثلاثة مقاييس أساسية: متوسط الخطأ التربيعي (MSE)، ومتوسط الخطأ المطلق (MAE)، وR-squared (R2). تثبت النتائج التجريبية بشكل قاطع الأداء المتفوق لـ XAI-CROP. حيث يحقق MSE منخفضًا بشكل مثير للإعجاب قدره 0.9412، مما يشير إلى توقعات دقيقة للغاية لعوائد المحاصيل. علاوة على ذلك، مع MAE قدره 0.9874، يحافظ XAI-CROP باستمرار على الأخطاء دون العتبة الحرجة 1، مما يعزز موثوقيته. قيمة 0.94152 تبرز قدرة XAI-CROP على التفسير لتنوع البيانات، مع تسليط الضوء على قابليتها للتفسير وقوتها التفسيرية.

نظام توصية المحاصيل تعلم الآلة الذكاء الاصطناعي القابل للتفسير الزراعة نظام دعم القرار

1 المقدمة

وفقًا لمنظمة الأغذية والزراعة للأمم المتحدة (الفاو)، تعتبر الزراعة قطاعًا مهمًا في اقتصاديات الدول الأفريقية، حيث يعمل حوالي ثلثي العمال في هذا القطاع. يُعتقد أن إصلاح الزراعة في أفريقيا أمر ضروري للقضاء على الفقر والجوع وسوء التغذية. ومع ذلك، فإن تغير المناخ يشكل تحديًا للقطاع الزراعي، حيث تؤثر أنماط الأمطار المتغيرة، والجفاف، والفيضانات، وانتشار الآفات والأمراض على إنتاج المحاصيل. لذلك، أصبح التنبؤ بعائد المحاصيل قضية صعبة في الزراعة الدقيقة. ويرجع ذلك إلى المتغيرات المختلفة، خاصة عائد المحاصيل مع تأثير تغير المناخ. يُعتبر تغير المناخ أحد العوامل الرئيسية التي يمكن أن تؤثر على عائد المحاصيل، مما يجعل من الضروري تطوير نماذج تنبؤية دقيقة لتوقع تأثيره. الظروف البيئية المتغيرة، لا سيما العالمية.
تؤثر ظواهر الاحترار وتغير المناخ سلبًا على مستقبل الزراعة. تتطلب هذه العوامل، جنبًا إلى جنب مع متغيرات أخرى مثل المناخ والطقس والتربة واستخدام الأسمدة ونوع البذور، استخدام مجموعات بيانات متعددة لمعالجة هذه المشكلة المعقدة. تقليديًا، كان الاعتماد على النماذج الإحصائية في توقع إنتاج المحاصيل يستغرق وقتًا طويلاً وجهدًا كبيرًا. ومع ذلك، فإن إدخال البيانات الضخمة في السنوات الأخيرة قد فتح آفاقًا جديدة لأساليب تحليل أكثر تقدمًا، مثل التعلم الآلي. يمكن تصنيف نماذج التعلم الآلي إلى نماذج وصفية أو تنبؤية، اعتمادًا على أسئلة البحث والتحديات المطروحة. تُستخدم النماذج التنبؤية للتنبؤ بالمستقبل، بينما تُستخدم النماذج الوصفية للتعلم من البيانات وشرح الأحداث الماضية.
سوف يكون لتغير المناخ الناتج عن الأنشطة البشرية تأثير أكثر حدة على صناعة الزراعة بسبب اعتمادها على الطقس. في تقدير الإنتاج من أجل تقييم آثار تغير المناخ، تُستخدم عادةً نماذج المحاصيل البيوفيزيائية الحتمية. هذه النماذج، التي تعتمد على تمثيلات مفصلة لفيزيولوجيا النباتات، لا تزال قيمة لتحليل عمليات الاستجابة والتكيفات المحتملة. ومع ذلك، فإن النماذج الإحصائية تتفوق عليها عمومًا من حيث التنبؤ عبر نطاقات مكانية أوسع.
لقد استخدمت مجموعة كبيرة من الأدبيات، خاصة منذ عمل شلينكر وروبرتس [13]، نماذج إحصائية لإظهار وجود علاقة قوية بين الحرارة الشديدة وأداء المحاصيل دون المتوسط. وقد تم استخدام طرق الاقتصاد القياسي التقليدية في هذه الدراسات. في الأعمال الأخيرة، تم دمج مخرجات نماذج المحاصيل في النماذج الإحصائية، وتم استخدام رؤى من نماذج المحاصيل لتحديد معلمات النماذج الإحصائية [14، 15]. في الوقت نفسه، حققت أساليب التعلم الآلي تقدمًا كبيرًا في العقود القليلة الماضية. نظرًا لأنها تركز بشكل أساسي على توقع النتائج بدلاً من الاستدلال في العمليات الميكانيكية التي تسبب تلك النتائج، فإن التعلم الآلي يختلف من الناحية المفاهيمية عن الكثير من الإحصائيات الكلاسيكية.
أنظمة توصية المحاصيل (CRS) هي أدوات قائمة على الكمبيوتر تساعد المزارعين في اتخاذ قرارات مستنيرة حول المحاصيل التي يجب زراعتها بناءً على عوامل مثل نوع التربة، وأنماط الطقس، وعوائد المحاصيل التاريخية [16-18]. يمكن أن تعمل أنظمة CRS على تحسين عوائد المحاصيل مع تقليل استخدام الموارد مثل الماء، والأسمدة، والمبيدات الحشرية. تُستخدم نماذج التعلم الآلي، مثل أشجار القرار، وآلات الدعم الناقل، والشبكات العصبية، بشكل شائع في أنظمة CRS، ولكن غالبًا ما تعتبر هذه النماذج “صناديق سوداء”.
مع وجود شفافية وقابلية تفسير محدودة، مما يمكن أن يقلل من الثقة في النظام.
تُستخدم نماذج التعلم الآلي (ML) حاليًا لتعزيز الكشف المبكر عن الأمراض بما في ذلك مراحل مختلفة مثل المعالجة المسبقة، واستخراج الميزات، والتصنيف [19]. علاوة على ذلك، استخدم نموذج التعلم الآلي تقنيات تحسين المعلمات الفائقة وخوارزميات التعلم الجماعي للتنبؤ بأمراض القلب [20].
لمعالجة هذه القضية، ظهرت الذكاء الاصطناعي القابل للتفسير (XAI) كفرع فرعي من الذكاء الاصطناعي يركز على تطوير نماذج التعلم الآلي التي يمكن أن تقدم تفسيرات واضحة لقراراتها. تسهل الأنظمة العددية دمج المشتقات الصحيحة وغير الصحيحة في خوارزميات التعلم الآلي وXAI، مما يمكّن من نمذجة وتحليل الأنظمة المعقدة ذات الارتباطات بعيدة المدى وتأثيرات الذاكرة. يعزز هذا الدمج من قابلية تفسير نماذج التعلم الآلي وXAI وقدراتها التنبؤية، مما يسمح بفهم أعمق واتخاذ قرارات فعالة في مجالات متنوعة، بما في ذلك الزراعة والمالية والرعاية الصحية [21-23].
تقترح هذه الدراسة خوارزمية تُدعى “XAI-CROP” تستفيد من الذكاء الاصطناعي القابل للتفسير (XAI) لتعزيز الشفافية وقابلية التفسير في أنظمة توصية المحاصيل (CRS). تستخدم XAI-CROP خوارزمية شجرة القرار المدربة على مجموعة بيانات لزراعة المحاصيل في الهند لتوليد توصيات بناءً على بيانات الإدخال مثل الموقع، والموسم، والإنتاج لكل كيلومتر مربع، والمساحة، والمحصول. يوفر النظام تفسيرات واضحة لتوصياته باستخدام تقنية التفسيرات المحلية القابلة للتفسير وغير المعتمدة على نموذج (LIME)، مما يساعد المزارعين على فهم الأسباب وراء اختيارات النظام. الدافع وراء الخوارزمية المقترحة “XAI-CROP” هو معالجة قيود أنظمة توصية المحاصيل التقليدية (CRS) التي تعتمد بشكل كبير على نماذج التعلم الآلي، والتي غالبًا ما تُعتبر “صناديق سوداء” بسبب نقص الشفافية وقابلية التفسير. هذا النقص في الشفافية يقلل من الثقة التي قد يمتلكها المزارعون في النظام ويعيق فهمهم لعملية اتخاذ القرار الأساسية.
لقد ظهرت الذكاء الاصطناعي القابل للتفسير (XAI) كفرع فرعي من الذكاء الاصطناعي يهدف إلى تطوير نماذج تعلم الآلة القادرة على تقديم تفسيرات واضحة لقراراتها. من خلال دمج مبادئ XAI في أنظمة التوصية، يسعى الخوارزم إلى تعزيز الشفافية وقابلية التفسير للتوصيات المقدمة للمزارعين.
فجوة البحث:
  • شفافية محدودة وقابلية تفسير أنظمة توصية المحاصيل الحالية.
  • نقص في التفسيرات الواضحة للأسباب وراء اختيارات النظام.
تُدرج مساهمة هذه الورقة على النحو التالي:
  • تطوير خوارزمية تُدعى “XAI-CROP” تستخدم الذكاء الاصطناعي القابل للتفسير لتعزيز أنظمة توصية المحاصيل.
  • تحسين الشفافية وقابلية التفسير في اتخاذ القرارات الزراعية.
  • توفير تفسيرات واضحة لتوصيات النظام، مما يساعد المزارعين على فهم الأسباب وراء الخيارات.
  • تم تقييم أداء XAI-CROP ومقارنته بأنظمة توصية المحاصيل الأخرى.
  • تم العثور على أن XAI-CROP يتمتع بدقة وشفافية أفضل مقارنة بالأنظمة الأخرى.
  • المساهمة في زيادة حجم الأبحاث حول استخدام الذكاء الاصطناعي القابل للتفسير في الزراعة.
  • رؤية حول كيفية استغلال التكنولوجيا لمعالجة تحديات الأمن الغذائي والزراعة المستدامة.
هيكل الورقة كالتالي: في القسم 2، نستعرض الأدبيات ذات الصلة بالموضوع. يوضح القسم 3 النهج المقترح لمعالجة سؤال البحث. يتم تقديم التقييم التجريبي في القسم 4. أخيرًا، يقدم القسم 5 الملاحظات الختامية للورقة.
يتعلق تغير المناخ بالتعديلات المستمرة في درجات الحرارة المحلية أو العالمية أو أنماط الطقس. إن معالجة الاحتباس الحراري وتقليل انبعاثات غازات الدفيئة هي مهمة صعبة تعقدها الصعوبات القانونية والتنظيمية المرتبطة بتغير المناخ. نتيجة لتغير المناخ العالمي، من المتوقع أن يعاني ملايين الأشخاص، وخاصة في جنوب آسيا، وأفريقيا جنوب الصحراء، والجزر الصغيرة، من زيادة في انعدام الأمن الغذائي، وسوء التغذية، والجوع. يشكل تغير المناخ تهديدًا كبيرًا لتطوير الزراعة في أفريقيا. تؤثر الأحوال الجوية ودرجات الحرارة وجودة الهواء، التي تؤثر على تركيبة التربة، بشكل كبير على جودة الإنتاج الزراعي. لذلك، من الضروري أن تضع الأجيال الحالية استراتيجيات للتخفيف من الآثار السلبية للعواقب البيئية على غلات المحاصيل.
يواصل الباحثون في جميع أنحاء العالم دراسة توقعات إنتاج المحاصيل عن كثب [27]. قدم يو وآخرون [28] إطار عمل للتعلم العميق لتوقع إنتاج المحاصيل باستخدام بيانات الاستشعار عن بُعد. وقد توقعوا إنتاج المحاصيل سنويًا في البلدان النامية باستخدام شبكة عصبية تلافيفية.
تم دمج الشبكة العصبية التلافيفية (CNN) مع مكون عملية غاوسية وتقنية تقليل الأبعاد. وقد طبقوا طريقتهم على مجموعة بيانات فول الصويا التي تم إنتاجها من دمج بيانات التربة والاستشعار والمناخ من الولايات المتحدة الأمريكية. تم استخدام النهج الغاوسي لتقليل خطأ الجذر التربيعي المتوسط (RMSE) للنموذج، الذي تحسن من 6.27 إلى 5.83 في المتوسط مع نموذج الذاكرة طويلة وقصيرة المدى (LSTM) ومن 5.77 إلى 5.57 مع نموذج CNN.
في دراسة أخرى، استخدم باوديل وآخرون [29] التعلم الآلي بالاشتراك مع المبادئ الزراعية لنمذجة المحاصيل لتأسيس خط أساس للتعلم الآلي لتوقع غلة المحاصيل على نطاق واسع. بدأوا بتدفق عمل يركز على الدقة، والمرونة، وإعادة الاستخدام. أنشأوا ميزات باستخدام مخرجات محاكاة المحاصيل، بالإضافة إلى بيانات الطقس، والاستشعار عن بعد، والتربة من قاعدة بيانات نظام توقع غلة المحاصيل MARS (MCYFS).
استخدم صن وآخرون [30] تقنية تعزيز التدرج، والانحدار باستخدام دعم المتجهات (SVR)، وجيران الأقرب (k-Nearest Neighbors) للتنبؤ بعوائد المحاصيل من القمح الطري، والشعير الربيعي، وعباد الشمس، وبنجر السكر، ومحاصيل البطاطس في هولندا، وألمانيا، وفرنسا. لاستخراج الميزات الزمنية والمكانية، اقترحوا نموذج تعلم عميق متعدد المستويات يجمع بين الشبكة العصبية التكرارية (RNN) والشبكة العصبية التلافيفية (CNN). كان هدفهم تقييم فعالية النهج المقترح في التنبؤ بعوائد حزام الذرة في الولايات المتحدة، والتحقيق في تأثير مجموعات البيانات المختلفة على مهمة التنبؤ. أجريت تجاربهم في ولايات حزام الذرة الأمريكية، حيث استخدموا بيانات الاستشعار عن بعد الزمنية وبيانات خصائص التربة كمدخلات. توقعوا عوائد الذرة على مستوى المقاطعة من 2013 إلى 2016.
اقترح يون وآخرون [31] دراسة استقصائية لإظهار تأثير دمج نمذجة المحاصيل وتعلم الآلة على تحسين توقعات إنتاج الذرة في حزام الذرة الأمريكي. كانوا يهدفون إلى تحديد ما إذا كانت الطريقة الهجينة (نمذجة المحاصيل + تعلم الآلة) يمكن أن تنتج توقعات أفضل، وتحديد أكثر تركيبات النماذج الهجينة دقة، وتحديد أي جوانب من نمذجة المحاصيل يجب دمجها بشكل أكثر فعالية مع تعلم الآلة لتوقع إنتاج الذرة. أظهرت دراستهم أن معلومات الطقس وحدها لم تكن كافية، وأن إضافة متغيرات نماذج المحاصيل المحاكاة كميزات إدخال إلى نماذج تعلم الآلة يمكن أن تقلل من خطأ التوقع الجذري (RMSE) للإنتاج من 7 إلى 20%. واقترحوا أنه من أجل تحسين توقعات الإنتاج، تتطلب نماذج تعلم الآلة المقترحة المزيد من المدخلات الهيدرولوجية.
طور خاكي ووانغ [32] حلاً يعتمد على الشبكات العصبية العميقة للتنبؤ بالعائد، والتحقق من العائد، واختلاف العائد للهجن من الذرة، استنادًا إلى الجينوم و
بيانات بيئية (الطقس والتربة). شاركوا في تحدي المحاصيل من سينجنتا لعام 2018 وكانت مشاركتهم ناجحة. حقق نموذجهم RMSE قدره للعائد المتوسط و للانحراف المعياري عند التنبؤ ببيانات الطقس، مما يدل على دقة عالية. أجرى عباس وآخرون [33] دراسة مماثلة حول التنبؤ بعائد درنات البطاطس باستخدام أربعة خوارزميات تعلم آلي: الانحدار الخطي، الشبكة المرنة، الجار الأقرب، والانحدار باستخدام الدعم المتجه. استخدموا بيانات عن خصائص التربة والمحاصيل التي تم الحصول عليها من خلال الاستشعار القريب للتنبؤ.
في ورقة حديثة لتعلت [34]، تم تقديم طريقة جديدة تُسمى خوارزمية توقع محصول المحاصيل (CYPA)، التي تستخدم تقنيات إنترنت الأشياء في الزراعة الدقيقة لتوقع محصول المحاصيل. تم تصميم الخوارزمية لتحليل تأثير العوامل المختلفة على نمو المحاصيل، مثل نقص المياه والمواد الغذائية، والآفات، والأمراض، طوال موسم النمو. مع قواعد بيانات البيانات الضخمة التي يمكن أن تخزن كميات كبيرة من البيانات حول الطقس والتربة وأنواع النباتات، يمكن أن توفر CYPA رؤى قيمة لصانعي السياسات والمزارعين على حد سواء في توقع المحاصيل السنوية.
يحقق. استخدمت الدراسة خمسة نماذج مختلفة من التعلم الآلي، كل منها مع إعدادات مثلى للمعلمات الفائقة، لتدريب والتحقق من صحة الخوارزمية. حقق نموذج DecisionTreeRegressor درجة 0.9814، بينما حصل RandomForestRegressor على درجة 0.9903، وحصل ExtraTreeRegressor على درجة 0.9933، مما يدل على الدقة العالية وفعالية نهج CYPA.
تقدم الجدول 1 النماذج التي تُستخدم عادةً في أنظمة توصية المحاصيل، بما في ذلك تعزيز التدرج (GB)، شجرة القرار (DT)، الغابة العشوائية (RF)، بايزي Gaussian البسيط (GNB)، وبايزي متعدد الأنماط (MNB).
قدمت المقارنة ملخصًا واضحًا وموجزًا لأكثر النماذج استخدامًا في أنظمة توصية المحاصيل. تسلط الضوء على الوصف، والمزايا، والعيوب لكل نموذج، مما يوفر فهمًا جيدًا لنقاط قوتها وقيودها. تبرز المقارنة أن تعزيز التدرج، والغابة العشوائية، وشجرة القرار قادرة على التعامل مع أنواع مختلفة من البيانات، بما في ذلك البيانات العددية والفئوية. تعتبر خوارزميات بايز الغاوسي وبايس المتعدد النماذج بسيطة وسريعة.
الجدول 1 التحليل المقارن للنماذج السائدة المستخدمة في هذا المجال
نموذج وصف الخوارزمية الإيجابيات سلبيات
تعزيز التدرج (GB) تقنية تعلم الآلة التي تجمع بين نماذج ضعيفة متعددة لإنشاء نموذج قوي يمكنه إجراء توقعات دقيقة
يمكنه العمل مع أنواع مختلفة من البيانات مثل البيانات الفئوية والبيانات العددية
يمتلك قوة تنبؤية عالية ويمكنه تحقيق دقة عالية
يمكن أن يكون مكلفًا حسابيًا
قد يتجاوز النموذج إذا كانت البيانات مشوشة أو تحتوي على قيم شاذة
شجرة القرار (DT) نموذج شبيه بالشجرة حيث يمثل كل عقدة ميزة، ويمثل كل فرع قرارًا بناءً على تلك الميزة
سهل الفهم والتفسير
يمكنه التعامل مع كل من البيانات الفئوية والبيانات العددية
يمكنه التعامل مع القيم المفقودة والقيم الشاذة
يمكن أن يتجاوز البيانات بسهولة
قد لا تلتقط العلاقات المعقدة بين الميزات
الغابة العشوائية (RF) طريقة تجميعية تقوم بإنشاء عدة أشجار قرار ومتوسط توقعاتها لتقليل الإفراط في التكيف وزيادة الدقة
يمكنه التعامل مع البيانات عالية الأبعاد التي تحتوي على العديد من الميزات
أقل عرضة للتكيف الزائد من شجرة قرار واحدة
يمكنه العمل مع كل من البيانات الفئوية والبيانات العددية
يمكن أن يكون مكلفًا حسابيًا
قد لا يؤدي بشكل جيد مع البيانات غير المتوازنة
بايزي الغوسي الساذج (GNB) نموذج احتمالي يعتمد على نظرية بايز ويفترض أن الميزات مستقلة عن بعضها البعض
خوارزمية بسيطة وسريعة
يمكنه التعامل مع البيانات عالية الأبعاد
يمكنه العمل مع كل من البيانات الفئوية والبيانات العددية
يفترض أن الميزات مستقلة، وهو ما قد لا يكون صحيحًا في مجموعات البيانات الواقعية
قد لا يؤدي أداءً جيدًا مع البيانات التي تحتوي على ميزات مرتبطة.
بايزي الساذج متعدد الوسائط (MNB) امتداد لأسلوب بايز الغاوسي البسيط يمكنه التعامل مع البيانات ذات الأنماط أو المجموعات المتعددة
يمكنه التعامل مع البيانات ذات المجموعات المتعددة
خوارزمية بسيطة وسريعة
يمكنه العمل مع كل من البيانات الفئوية والبيانات العددية
يفترض أن الميزات مستقلة، وهو ما قد لا يكون صحيحًا في مجموعات البيانات الواقعية
قد لا يؤدي أداءً جيدًا مع البيانات التي تحتوي على ميزات مرتبطة.
الشكل 1 المخطط العام للكتل للخوارزمية المقترحة “XAI-CROP”
التي يمكنها التعامل مع البيانات عالية الأبعاد، لكنها قد لا تؤدي بشكل جيد مع الميزات المرتبطة. كما تسلط الضوء على القيود المحتملة لكل نموذج، مثل الإفراط في التكيف أو التكاليف الحاسوبية. بشكل عام، يوفر المقارنة رؤى قيمة حول التبادلات الموجودة عند اختيار نموذج لمهمة معينة في أنظمة توصية المحاصيل.

3 XAI-CROP: الذكاء الاصطناعي القابل للتفسير لأنظمة توصية المحاصيل

الخوارزمية المقترحة “XAI-CROP” هي نهج للذكاء الاصطناعي القابل للتفسير (XAI) لتعزيز الشفافية وقابلية التفسير في أنظمة توصية المحاصيل (CRS). تتكون الخوارزمية من خمس مراحل رئيسية كما هو موضح في الشكل 1.
i. معالجة البيانات: في هذه المرحلة، يتم جمع ومعالجة البيانات المدخلة، والتي تشمل نوع التربة، وأنماط الطقس، والعوائد الزراعية التاريخية، لمزيد من التحليل.
iii. اختيار الميزات: يتم تحديد الميزات ذات الصلة التي تؤثر على محصول الزراعة باستخدام تقنيات إحصائية وتقنيات تعلم الآلة. ثم تُستخدم هذه الميزات كمدخلات لنموذج XAI-CROP.
iii. تدريب النموذج: يتم تدريب نموذج XAI-CROP على مجموعة بيانات لزراعة المحاصيل في الهند، والتي تتضمن معلومات عن إنتاج المحاصيل، نوع التربة، أنماط الطقس، وإنتاج المحاصيل التاريخي. يعتمد النموذج على خوارزمية شجرة القرار التي تولد توصيات بناءً على البيانات المدخلة مثل الموقع، الموسم، والإنتاج لكل كيلومتر مربع، والمساحة، والمحصول.
iv. دمج الذكاء الاصطناعي القابل للتفسير: يستخدم نموذج XAI-CROP تقنية تُسمى “تفسيرات نموذجية محلية غير مرتبطة” (LIME) لتقديم تفسيرات واضحة لتوصياته. LIME هي تقنية لشرح توقعات نماذج التعلم الآلي من خلال إنشاء نماذج محلية تقارب توقعات النموذج الأصلي.
v. التحقق: يتم التحقق من نموذج XAI-CROP باستخدام مجموعة بيانات التحقق لتقييم أدائه في التنبؤ بعائد المحاصيل. دقة النموذج هي
تم قياسها باستخدام خطأ الجذر التربيعي المتوسط (RMSE) وخطأ القيمة المطلقة المتوسطة (MAE) ومعامل التحديد (R2).

3.1 معالجة البيانات

تتحمل وحدة معالجة البيانات مسؤولية جمع وتنظيف ومعالجة البيانات المكتسبة. تستخدم تقنيات جمع البيانات المختلفة مثل المستشعرات والكاميرات وأجهزة إنترنت الأشياء للحصول على بيانات في الوقت الحقيقي. بعد جمع البيانات، يتم تنظيفها ومعالجتها لإزالة أي inaccuracies أو اضطرابات. يوضح الخوارزم 1 ست خطوات رئيسية متضمنة في وحدة معالجة البيانات. (i) جمع بيانات الإدخال: جمع بيانات عن نوع التربة، وأنماط الطقس، وعوائد المحاصيل التاريخية من المصادر ذات الصلة. (ii) تنظيف البيانات: إزالة أي تكرارات أو قيم مفقودة في البيانات. (iii) تحويل البيانات: تحويل البيانات إلى تنسيق يمكن استخدامه لمزيد من التحليل، مثل تحويل المتغيرات الفئوية إلى متغيرات عددية. (iv) دمج البيانات: دمج مجموعات البيانات المختلفة في مجموعة بيانات واحدة للتحليل. (v) تطبيع البيانات: تطبيع البيانات لضمان أن جميع المتغيرات على نفس المقياس. يمكن القيام بذلك باستخدام تقنيات مثل مقياس الحد الأدنى والحد الأقصى أو تطبيع درجة z. (vi) تقسيم البيانات: تقسيم البيانات إلى مجموعات بيانات للتدريب والاختبار لاستخدامها في تدريب النموذج والتحقق منه.

3.2 اختيار الميزات

يتكون نموذج اختيار الميزات من ست خطوات رئيسية كما هو موضح في الخوارزمية 2: (i) تحميل مجموعة البيانات المعالجة مسبقًا التي تحتوي على معلومات حول نوع التربة، وأنماط الطقس، وعوائد المحاصيل التاريخية. (ii) تقسيم مجموعة البيانات إلى مجموعات تدريب واختبار. (iii) تطبيق تقنيات إحصائية مثل تحليل الارتباط، واختبار كاي-تربيع، وتحليل التباين (ANOVA) لتحديد الميزات التي لها تأثير كبير على عائد المحاصيل. (iv) تطبيق تقنيات التعلم الآلي مثل الغابات العشوائية، وأشجار القرار، وتعزيز التدرج لتحديد الميزات المهمة. (v) تصنيف الميزات المحددة بناءً على درجات أهميتها التي تم إنشاؤها بواسطة خوارزمية التعلم الآلي المختارة. (vi) اختيار أعلى الميزات التي لديها أعلى درجات الأهمية كمدخلات لنموذج XAI-CROP.
الخوارزمية 1 خوارزمية معالجة البيانات
  • إدخال:
  • البيانات المجمعة
  • الإخراج:
  • البيانات المعالجة مسبقًا
  • الخطوات:
    // الخطوة 1: جمع بيانات الإدخال
    بيانات_التربة = قراءة_csv(‘بيانات_التربة.csv’)
    بيانات الطقس اقرأ_csv(‘بيانات_الطقس.csv’)
    بيانات إنتاج المحاصيل اقرأ_csv(‘crop_yield_data.csv’)
    // الخطوة 2: تنظيف البيانات
    بيانات التربة إزالة_التكرارات(بيانات_التربة)
    بيانات الطقس إزالة_القيم_المفقودة(بيانات_الطقس)
    بيانات إنتاج المحاصيل إزالة_التكرارات(بيانات_محصول_الزراعة)
    // الخطوة 3: تحويل البيانات
    بيانات التربة تحويل_المتغيرات_الفئوية(بيانات_التربة)
    بيانات الطقس تحويل_المتغيرات_الفئوية(بيانات_الطقس)
    // الخطوة 4: دمج البيانات
    بيانات المحاصيل دمج_المجموعات(بيانات_التربة، بيانات_الطقس، بيانات_محصول_الزراعة)
    // الخطوة 5: تطبيع البيانات
    بيانات المحاصيل normalize_data(crop_data)
    // الخطوة 6: تقسيم البيانات
    بيانات التدريب، بيانات الاختبار تقسيم_البيانات(بيانات_المحاصيل، نسبة_التدريب=0.8)
الخوارزمية 2 خوارزمية اختيار الميزات
  • الإدخال:
  • مجموعة البيانات المعالجة مسبقًا
  • الإخراج:
  • الميزات المختارة لنموذج XAI-CROP
  • الخطوات:
  1. قم بتقسيم مجموعة البيانات إلى مجموعة تدريب ومجموعة اختبار.
  2. تطبيق تقنيات إحصائية لتحديد الميزات التي لها تأثير كبير على محصول الزراعة.
  3. تطبيق تقنيات التعلم الآلي لتحديد الميزات المهمة.
  4. رتب الميزات المحددة بناءً على درجات أهميتها.
  5. اختر الأعلى الميزات التي تحمل أعلى درجات الأهمية كمدخلات لنموذج XAI-CROP.
  6. أعد الميزات المحددة كإخراج.
    3.3 تدريب النموذج
يتكون نموذج تدريب النموذج من سبع خطوات رئيسية كما هو موضح في الخوارزمية 3: (i) تحميل البيانات المعالجة مسبقًا
مجموعة بيانات تحتوي على معلومات حول محصول الزراعة، نوع التربة، أنماط الطقس، والمحاصيل التاريخية. (ii) تقسيم مجموعة البيانات إلى مجموعات تدريب واختبار باستخدام نسبة محددة مسبقًا. (iii) إنشاء مصنف شجرة قرار وتعيين
معلمات الخوارزمية. (iv) تدريب مصنف شجرة القرار باستخدام مجموعة بيانات التدريب. (v) تقييم أداء النموذج على مجموعة بيانات الاختبار باستخدام مقاييس مختلفة مثل الدقة، والموثوقية، والاسترجاع، ودرجة F1. (vi) إذا لم يكن أداء النموذج مرضيًا، قم بضبط المعلمات الفائقة لخوارزمية شجرة القرار وأعد تدريب النموذج. (vii) حفظ النموذج المدرب للاستخدام في المستقبل.
توفر GB نتائج توقعات أكثر دقة من خلال ملاءمة وتحديث معلمات النموذج الجديدة. وبالتالي، يتم بناء متعلم أساسي جديد وتحسين نتائج التدرج السالب من دالة الخسارة المتعلقة بالكل التجميعي.
مع تحسن النموذج، يتم ضبط المتعلمين الضعفاء بطريقة تجعل كل متعلم جديد يتناسب مع المتبقيات من المرحلة السابقة. يجمع النموذج النهائي نتائج كل مرحلة، مما يؤدي إلى متعلم قوي. يتم اكتشاف المتبقيات باستخدام دالة خسارة. يمكن استخدام متوسط الخطأ التربيعي (MSE) على سبيل المثال، لمهام الانحدار.
- Input:
    - Selected Features
- Output:
    - Trained Model
- Steps:
    # Load dataset
    dataset = load_dataset()
# Split dataset into training and testing sets
train_set, test_set $=$ split_dataset(dataset)
# Prepare input data for decision tree model
input_data $=$ prepare_input_data(train_set, relevant_features)
# Train decision tree model
model $=$ train_decision_tree(input_data)
# Test model accuracy
accuracy $=$ test_model(model, test_set)
# Evaluate model performance
performance_metrics $=$ evaluate_performance(model, test_set)

3.4 ضبط المعلمات الفائقة

يمكن ضبط المعلمات الفائقة للنموذج المقترح باستخدام تعزيز التدرج (GB) ، شجرة القرار (DT) ، الغابة العشوائية (RF) ، بايزيان الغاوسي الساذج (GNB) ، وبايزيان الساذج متعدد النماذج (MNB).
في تعزيز التدرج، يتم تدريب النموذج بطريقة تسلسلية من خلال تقليل دالة الخسارة للنظام بأكمله باستخدام مُحسِّن الانحدار التدرجي (GD). لذلك،
بينما يمكن استخدام خسارة اللوغاريتم (خسارة اللوغ) لمهام التصنيف. ومن الجدير بالذكر أنه عند إضافة شجرة جديدة إلى النموذج، لا تتغير الأشجار الحالية كما هو موضح في الشكل 2. الشجرة القرار التي تم تقديمها تناسب المتبقيات من النموذج الحالي [37].
تعتبر المعلمات الفائقة عناصر حاسمة في خوارزميات التعلم الآلي التي يمكن أن تؤثر على دقة النموذج وأدائه. في أشجار القرار المعززة بالتدرج، هناك معلمتان فائقتان مهمتان هما معدل التعلم و
الشكل 2 المخطط العام لخوارزمية تعزيز التدرج
الشكل 3 الهيكل العام لشجرة القرار
المقدرات. معدل التعلم، الذي يُشار إليه بـ ، يتحكم في سرعة تعلم النموذج. كل شجرة جديدة تغير النموذج الكلي، ويحدد معدل التعلم حجم هذا التغيير. يؤدي معدل التعلم المنخفض إلى تعلم أبطأ، مما يفيد النموذج من خلال جعله أكثر قوة وكفاءة. لقد أظهرت النماذج ذات التعلم الأبطأ أنها تتفوق على النماذج الأسرع في التعلم الإحصائي. ومع ذلك، فإن التعلم الأبطأ له تكلفة؛ يستغرق وقتًا أطول لتدريب النموذج، مما يقودنا إلى المعلمة الفائقة المهمة التالية. يتم تمثيل عدد الأشجار المستخدمة في النموذج بواسطة n مقدر. إذا كان معدل التعلم منخفضًا، يجب تدريب المزيد من الأشجار. ومع ذلك، يجب توخي الحذر عند تحديد عدد الأشجار المستخدمة. استخدام
الكثير من الأشجار يزيد من خطر الإفراط في التكيف، مما قد يؤدي إلى أداء عام ضعيف للنموذج [38].
تقنية شجرة القرار (DT) هي طريقة تعلم تحت إشراف يمكن استخدامها لمهام التصنيف والانحدار، وهي غير معلمية. تحتوي DT على هيكل هرمي، يتكون من عقدة جذرية، وعقد داخلية، وفروع، وعقد أوراق. من خلال إجراء بحث جشع لتحديد نقاط الانقسام المثلى في الشجرة، تستخدم تعلم DT نهج تقسيم وغزو. تتكرر هذه العملية الانقسامية بشكل متكرر من الأعلى إلى الأسفل حتى يتم تصنيف جميع أو معظم الإدخالات إلى تسميات فئة محددة، كما هو موضح في الشكل 3. تحدد تعقيد شجرة القرار ما إذا كانت جميع نقاط البيانات
الشكل 4 المخطط العام للغابة العشوائية
مجموعة في مجموعات متجانسة. يمكن للأشجار الصغيرة بسهولة تحقيق عقد أوراق نقية، أو نقاط بيانات في فئة واحدة. ومع ذلك، مع زيادة حجم الشجرة، يصبح من الصعب بشكل متزايد الحفاظ على هذه النقاء، مما يؤدي غالبًا إلى وجود بيانات قليلة جدًا تحت شجرة فرعية محددة، وهو ظاهرة تعرف بتجزئة البيانات، وغالبًا ما تؤدي إلى الإفراط في التكيف. التقليم هو تقنية شائعة تستخدم لتقليل التعقيد ومنع الإفراط في التكيف. يتضمن إزالة الفروع التي تنقسم على سمات ذات قيمة منخفضة. يمكن تقييم دقة النموذج باستخدام طريقة التحقق المتقاطع. نهج آخر لضمان دقة أشجار القرار هو إنشاء مجموعة باستخدام خوارزمية الغابة العشوائية، التي تنتج توقعات أكثر دقة، خاصة عندما تكون الأشجار الفردية غير مرتبطة ببعضها البعض [39، 40].
الغابة العشوائية (RF) هي خوارزمية تعلم آلي تقع تحت فئة التعلم تحت الإشراف وتستخدم على نطاق واسع لمهام الانحدار والتصنيف. تقوم بإنشاء أشجار قرار على عينات مختلفة من البيانات ثم تجمعها من خلال تصويت الأغلبية في التصنيف ومتوسط في الانحدار. واحدة من المزايا الرئيسية لخوارزمية RF هي قدرتها على التعامل مع مجموعات البيانات التي تحتوي على متغيرات مستمرة وفئوية، مما يجعلها مناسبة لمشاكل الانحدار والتصنيف. لقد أظهرت الخوارزمية أنها تنتج نتائج متفوقة في مهام التصنيف، كما هو موضح في الشكل 4 [41، 42].
نايف بايز الكلاسيكي مناسب للبيانات الفئوية ويقوم بنمذجتها كما لو كانت تتبع توزيع متعدد الحدود. من ناحية أخرى، فإن نايف بايز الغاوسي مناسب للميزات المستمرة ويقوم بنمذجتها كما لو كانت تتبع توزيع غاوسي (عادي). عند التعامل مع بيانات فئوية بالكامل، يكفي مصنف نايف بايز التقليدي، بينما يكون مصنف نايف بايز الغاوسي مناسبًا لمجموعات البيانات التي تحتوي فقط على ميزات مستمرة. إذا كانت مجموعة البيانات تحتوي على خصائص فئوية ومستمرّة، فهناك خياران متاحان: تحويل الميزات المستمرة باستخدام تقسيم أو تقنية مشابهة أو استخدام نموذج نايف بايز هجين. للأسف، لا يبدو أن حزم التعلم الآلي التقليدية تقدم مثل هذا النموذج. في هذه الدراسة، استخدمنا بيانات مستمرة، وبالتالي استخدمنا GNB لتحليلنا. [43، 44].
نايف بايز متعدد الحدود هو نهج تعلم احتمالي يستخدم نظرية بايز لحساب احتمال كل علامة لعينة معينة ويختار العلامة ذات الاحتمال الأعلى. يفترض النهج أن كل ميزة يتم تصنيفها مستقلة عن أي ميزة أخرى، مما يعني أن وجود أو عدم وجود ميزة واحدة ليس له تأثير على وجود أو عدم وجود ميزة أخرى. نايف بايز هو أداة قوية لتحليل إدخال النص ومعالجة مشاكل متعددة الفئات. لتطبيق نظرية نايف بايز، يجب على المرء أولاً فهم نظرية بايز التي طورها توماس بايز، والتي تقدر احتمال حدث بناءً على المعرفة السابقة بظروفه. بشكل محدد، تحسب احتمال الفئة A عندما يتم تقديم المتنبئ B. [45، 46].

3.5 وحدة تكامل XAI

تستخدم مرحلة تكامل XAI من خوارزمية XAI-CROP تفسيرات نموذجية قابلة للتفسير محليًا (LIME) لتقديم تفسيرات واضحة للتوصيات التي يقدمها نموذج XAI-CROP. تتكون مرحلة تكامل XAI من ست خطوات رئيسية كما هو موضح في الخوارزمية 4: (i) تحميل نموذج XAI-CROP. (ii) اختيار عينة من مجموعة بيانات التحقق لتوليد تفسير. (iii) توليد اضطرابات للعينة المختارة لإنشاء مجموعة بيانات لتدريب النموذج المحلي. (iv) تدريب نموذج انحدار خطي على مجموعة البيانات المضطربة. (v) حساب وزن كل ميزة في النموذج المحلي. (vi) توليد تفسير من خلال تسليط الضوء على الميزات التي تساهم أكثر في توقع نموذج XAI-CROP للعينة المختارة.

الخوارزمية 4 خوارزمية تكامل XAI

  • الخطوات:
    # تحميل نموذج XAI-CROP
    xai_crop_model load_model(‘xai_crop_model.h5’)
    # اختيار عينة من مجموعة بيانات التحقق لتوليد تفسير
    sample validation_dataset.sample()
    # توليد اضطرابات للعينة المختارة لإنشاء مجموعة بيانات لتدريب النموذج المحلي
    perturbed_dataset generate_perturbations(sample, num_perturbations)
    # تدريب نموذج انحدار خطي على مجموعة البيانات المضطربة
    local_model train_linear_regression(perturbed_dataset)
    # حساب وزن كل ميزة في النموذج المحلي
    weights calculate_feature_weights(local_model)
    # توليد تفسير من خلال تسليط الضوء على الميزات التي تساهم أكثر في
    توقع نموذج XAI-CROP للعينة المختارة
    explanation generate_explanation(sample, weights)
    قوة وموثوقية توقعات النموذج، مع تسهيل أيضًا قابلية تفسير النتائج وشرحها.

3.6 وحدة التحقق

تعتبر مرحلة التحقق من خوارزمية XAI-CROP
الخوارزمية 5 خوارزمية التحقق مكونًا حيويًا، تشمل ثلاث خطوات رئيسية موضحة في الخوارزمية 5. تم تصميم هذه الخطوات لضمان
  • الإدخال:
  • النموذج المدرب
  • الإخراج:
  • مقاييس الأداء
  • الخطوات:
    function validate(XAI-CROP model, validation dataset)
    # الخطوة 3a
    validation_features, validation_target separate_features_target(validation dataset)
    # الخطوة 3b
    predicted_crop_yield XAI-CROP model.predict(validation_features)
    # الخطوة 3d
    rmse mean
    mae mean(abs(validation_target – predicted_crop_yield))
    – sum((validation_target – predicted_crop_yield)^2) / sum((validation_target –
    mean(validation_target))^2)
    # الخطوة 3e
    return rmse, mae, r2

4 التنفيذ والتقييم

تقدم هذه القسم نظرة عامة على مجموعات البيانات المستخدمة، ومقاييس الأداء المعتمدة، ومنهجية التقييم المعتمدة.

4.1 البرمجيات

في هذه الدراسة، تم استخدام أدوات برمجية متنوعة، مثل لغة البرمجة بايثون، ومكتبة LIME للذكاء الاصطناعي القابل للتفسير، ومكتبة Pandas لمعالجة البيانات وتحليلها، ومكتبة Scikit-learn لنماذج التعلم الآلي ومقاييس التقييم. تم اختيار بايثون كلغة برمجة بناءً على مرونتها وسهولة استخدامها وتوفر العديد من المكتبات لتحليل البيانات والتعلم الآلي. تم استخدام LIME لتحسين قابلية تفسير نماذج التعلم الآلي المستخدمة في الدراسة، مما يسمح للباحثين بفهم كيفية توليد هذه النماذج للتنبؤات.

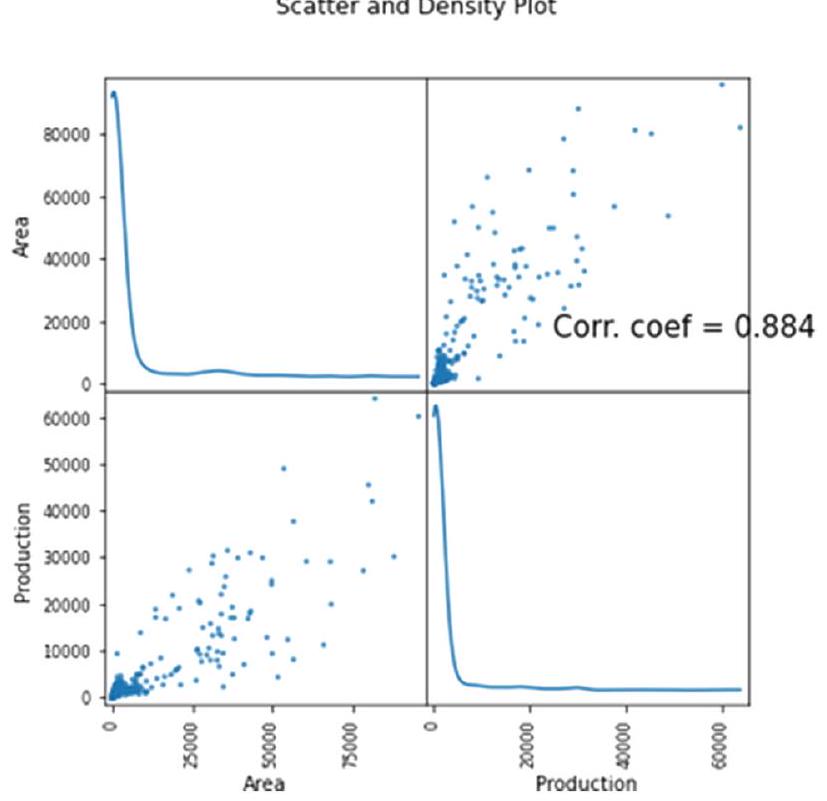
4.2 مجموعة بيانات إنتاج المحاصيل

توفر مجموعة بيانات إنتاج المحاصيل [47] المستخدمة في هذه الدراسة معلومات قيمة حول زراعة المحاصيل في الهند. تم استخدام هذه المجموعة لتطوير نظام توصية بالمحاصيل لمساعدة المزارعين في اختيار المحصول الأنسب لموقعهم وموسمهم والعوامل ذات الصلة الأخرى. تحتوي مجموعة البيانات على عدة أعمدة مهمة تشمل الموقع والموسم والإنتاج لكل كيلومتر مربع، والمساحة، والمحصول. هذه الميزات حاسمة في التنبؤ بالمحصول المناسب الذي يجب زراعته في منطقة معينة بناءً على البيانات التاريخية. تعتبر مجموعة البيانات مهمة لتطبيقات التعلم الآلي في الزراعة، حيث توفر مصدرًا موثوقًا وذا صلة للبيانات لتدريب النماذج والتحقق من صحتها.

4.3 مقاييس الأداء

لتقييم أداء الخوارزمية المقترحة لتنبؤ درجة الإنفاق، نستخدم ثلاثة مقاييس انحدار شائعة: متوسط الخطأ التربيعي (MSE)، ومتوسط الخطأ المطلق (MAE)، وR-squared.
الشكل 6 مصفوفة الارتباط
i. متوسط الخطأ التربيعي (MSE): يقيس MSE متوسط الفرق التربيعي بين درجات الإنفاق المتوقعة والفعلية. يمكن حساب MSE كما هو موضح في المعادلة (1).

ii. متوسط الخطأ المطلق (MAE): يقيس MAE متوسط الفرق المطلق بين درجات الإنفاق المتوقعة والفعلية. يمكن حساب MAE كما هو موضح في المعادلة (2).

iii. R-squared: R-squared هو مقياس إحصائي يمثل نسبة التباين في المتغير التابع الذي يفسره المتغيرات المستقلة. يمكن حساب R-squared كما هو موضح في المعادلة (3).
الشكل 5 عينة من مجموعة البيانات المستخدمة
اسم المنطقة الموسم المساحة الإنتاج المحصول
0 شمال ووسط أندامان ربيع 294.5 90.8 تور
1 جنوب أندامان ربيع 20.5 13.2 تور
2 أنانتابور خريف 21400.0 2600.0 تور
3 أنانتابور خريف 27400.0 9100.0 تور
4 أنانتابور خريف 30693.0 7888.0 تور
الشكل 7 مخططات التشتت والكثافة
حيث n هو عدد العينات، pred هو درجة الإنفاق المتوقعة، وy_actual هي درجة الإنفاق الفعلية [48، 49].

4.4 تقييم الأداء

يوضح الشكل 5 عينة من مجموعة البيانات المستخدمة، مما يوفر تمثيلًا بصريًا لنقاط البيانات المستخدمة في البحث. توضح هذه العينة الخصائص والتوزيع لمجموعة البيانات، مما يعرض الميزات المختلفة وقيمها المقابلة. من خلال فحص هذا الشكل، يمكن للباحثين والممارسين الحصول على رؤى حول تكوين وتنوع مجموعة البيانات، وهو أمر حاسم لفهم الأنماط والاتجاهات الأساسية.
يقدم الشكل 6 مصفوفة الارتباط، مما يوفر تصويرًا شاملاً للعلاقات المتبادلة بين الميزات المختلفة في مجموعة البيانات. تمكن مصفوفة الارتباط من تحديد الاعتماديات المحتملة،
الجدول 2 التحليل المقارن لنموذج XAI-CROP والنماذج السابقة
النموذج MSE MAE R^2
XAI-CROP 0.9412 0.9874 0.94152
تعزيز التدرج (GB) 1.6861 1.0745 0.78521
شجرة القرار (DT) 1.1785 1.0002 0.8942
الغابة العشوائية (RF) 1.2487 1.0015 0.8745
بايزي Gaussian (GNB) 1.4123 1.0098 0.8456
بايزي متعدد الأبعاد (MNB) 1.0452 1.0078 0.77521
الارتباطات، أو التكرار بين السمات. تساعد هذه التصويرات في تقييم قوة واتجاه هذه العلاقات، مما يساعد الباحثين في تحديد المتغيرات ذات الصلة وتوجيه عمليات اختيار الميزات أو هندستها. فهم مصفوفة الارتباط أمر ضروري لفهم تأثير وأهمية الميزات الفردية على المهمة العامة للتنبؤ أو التشخيص.
يعرض الشكل 7 مخططات التشتت والكثافة، مما يوفر تمثيلًا رسوميًا لتوزيع البيانات والعلاقات بين سمات أو متغيرات معينة. تعرض مخططات التشتت العلاقة بين متغيرين، موضحة كيف تتوافق التغيرات في متغير واحد مع التغيرات في الآخر. تساعد هذه التصويرات في تحديد الأنماط أو الاتجاهات أو التجمعات أو القيم الشاذة في البيانات. من ناحية أخرى، توضح مخططات الكثافة كثافة الاحتمال لقيم متغير، مما يسمح للباحثين بتقييم شكل التوزيع أو انحرافه أو تعدد الأبعاد. توفر هذه المخططات رؤى قيمة حول الهيكل الأساسي للبيانات، مما يمكّن الباحثين من اتخاذ قرارات مستنيرة بشأن معالجة البيانات أو اختيار النموذج أو تخصيص الخوارزمية.
تساهم إضافة هذه الأشكال في ورقة البحث في تعزيز وضوح وفهم النتائج. توفر تمثيلات بصرية لخصائص مجموعة البيانات، والعلاقات المتبادلة بين المتغيرات، وتوزيع البيانات، مما يمنح القراء فهمًا شاملاً لمنهجية البحث وآثارها. علاوة على ذلك، تسهل هذه الأشكال إعادة إنتاج البحث، مما يمكّن باحثين آخرين من التحقق من النتائج وبناء على المنهجية المقترحة.
يقدم الجدول 2 مقارنة شاملة للنتائج التي تم الحصول عليها من نموذج XAI-CROP المقترح مع تلك الخاصة بالنماذج السابقة المستخدمة في البحث. يوفر هذا الجدول تحليلًا هيكليًا وكمياً لمقاييس التقييم المختلفة مثل الدقة، والدقة، والاسترجاع، وF1-score، وأي مؤشرات أداء ذات صلة أخرى. من خلال مقارنة أداء نموذج XAI-CROP المقترح مع النماذج السابقة، يحصل الباحثون والقراء على رؤى قيمة حول التحسينات التي تم تحقيقها وفعالية النهج المقترح. يعمل هذا التحليل المقارن كمعيار لتقييم التقدم المحرز في تنبؤ التشخيص لمحول الطاقة ويبرز تفوق نموذج XAI-CROP من حيث دقة التنبؤ والموثوقية.
يكمل الشكل 8 النتائج المقدمة في الجدول 2 من خلال توضيح بصري للمقارنة في الأداء بين نموذج XAI-CROP المقترح والنماذج السابقة. يسمح هذا التمثيل الرسومي بفهم سريع وبديهي للاختلافات في الأداء بين النماذج المختلفة. قد يتضمن مخططات شريطية، أو مخططات خطية،
الشكل 8 التحليل المقارن لنموذج XAI-CROP والنماذج السابقة
مخططات، أو أي تقنيات تصوير مناسبة أخرى لتسليط الضوء على التباينات في الدقة، والدقة، والاسترجاع، أو أي مقاييس ذات صلة أخرى. يعمل الشكل 8 كأداة بصرية للباحثين والقراء لفهم أهمية نموذج XAI-CROP المقترح والتحسينات التي يقدمها مقارنة بالنهج الحالية. يعزز هذا الشكل من التواصل حول نتائج البحث ويعزز مصداقية وصلاحية المنهجية المقترحة.
تمنح إضافة الجدول 2 والشكل 8 في ورقة البحث القراء القدرة على إجراء مقارنات مستنيرة واستخلاص استنتاجات بناءً على الأدلة التجريبية المقدمة. تساهم هذه الأشكال في وضوح وشفافية البحث من خلال توفير نظرة شاملة على تحسينات الأداء التي حققها نموذج XAI-CROP المقترح. بالإضافة إلى ذلك، تبرز الآثار العملية للبحث، مما يسلط الضوء على التأثير والفوائد المحتملة التي يجلبها إلى مجال تنبؤ تشخيص محولات الطاقة.
يعرض الشكل 9 منحنيات تقارب R2 التي تم إنشاؤها بواسطة النموذج القائم على الليمون لكل نموذج فردي قيد التقييم. توفر هذه المنحنيات رؤى قيمة حول أداء النموذج وقدرته على التقاط الأنماط والعلاقات الأساسية في مجموعة البيانات.
توضح منحنى تقارب R2 سلوك التقارب للنموذج القائم على الليمون خلال عملية التدريب. يرسم درجة R2، المعروفة أيضًا بمعامل التحديد، على -المحور ضد عدد التكرارات أو العصور على المحور السيني. يمثل معدل R2 نسبة التباين في المتغير المستهدف الذي يمكن تفسيره بواسطة النموذج. يشير معدل R2 الأعلى إلى ملاءمة أفضل للنموذج مع البيانات وقدرة أكبر على إجراء توقعات دقيقة.
من خلال فحص منحنيات تقارب R2 لكل نموذج، يمكن للباحثين والقراء تقييم ديناميات التدريب واستقرار الأداء للنموذج القائم على الجير. توفر هذه المنحنيات رؤى حول
تقدم التعلم، وسرعة التقارب، وإمكانية الإفراط في التكيف أو نقص التكيف. يمكن ملاحظة وتحليل أنماط مثل هضاب التقارب، والتقلبات، أو التحسينات السريعة في معدل R2، مما يساعد في تقييم ومقارنة النماذج.
تعزز إضافة الشكل 9 في ورقة البحث الشفافية وقابلية إعادة إنتاج عملية التجريب. يسمح للقراء بتصور أداء النموذج القائم على الجير وفهم أعمق لديناميات تدريبه. بالإضافة إلى ذلك، تعمل هذه المنحنيات التقاربية كأدلة داعمة لفعالية وموثوقية النموذج القائم على الجير في التقاط العلاقات المعقدة داخل مجموعة البيانات، مما يمكّن من التنبؤ الدقيق والتفسير.
بشكل عام، يوفر الشكل 9 ملخصًا موجزًا ومفيدًا لمنحنيات تقارب R2 التي تم إنشاؤها بواسطة النموذج القائم على الجير، مما يقدم رؤى حاسمة حول سلوك التدريب وأداء النموذج. يعزز نتائج البحث ويسهل فهمًا شاملاً لفعالية النموذج القائم على الجير في المهمة المحددة.

5 مناقشة النتائج

تمت مقارنة أداء نموذج XAI-CROP بعدة نماذج أخرى من التعلم الآلي، بما في ذلك تعزيز التدرج (GB)، شجرة القرار (DT)، الغابة العشوائية (RF)، بايزي Gaussian البسيط (GNB)، وبايزي متعدد الأنماط (MNB). تم تقييم أداء كل نموذج باستخدام ثلاثة مقاييس: متوسط الخطأ التربيعي (MSE)، ومتوسط الخطأ المطلق (MAE)، وR-squared (R2).
تفوق نموذج XAI-CROP على جميع النماذج الأخرى من حيث MSE، بقيمة 0.9412، مما يشير إلى أن النموذج كان لديه أقل الأخطاء في توقع محصول المحاصيل. كان MAE لنموذج XAI-CROP 0.9874، مما يشير إلى أنه، في المتوسط، كان لدى النموذج خطأ أقل من 1 في التنبؤ
الشكل 9 منحنى تقارب R2 لكل نموذج
محصول المحاصيل. أخيرًا، كانت قيمة R2 لنموذج XAI-CROP 0.94152، مما يشير إلى أن النموذج يفسر من التباين في البيانات.
بالمقارنة، كان أداء نموذج شجرة القرار هو الثاني الأفضل، مع MSE قدره 1.1785، وMAE قدره 1.0002، وR2 قدره 0.8942. كانت نماذج الغابة العشوائية و
بايزي Gaussian البسيط تؤدي بشكل مشابه، مع MSE قدره 1.2487 و1.4123، على التوالي، وMAE قدره 1.0015 و1.0098، على التوالي. كان لنموذج بايزي متعدد الأنماط أعلى قيمة R2 بين جميع النماذج، بقيمة 0.77521.
بشكل عام، أظهر نموذج XAI-CROP أداءً متفوقًا مقارنة بالنماذج الأخرى في توقع محصول المحاصيل. قدمت تقنية LIME المستخدمة في نموذج XAI-CROP تفسيرات قابلة للتفسير لتوقعات النموذج، مما يمكّن الباحثين من فهم كيفية تقديم النموذج للتوصيات. تظهر نتائج هذه الدراسة فعالية XAI-CROP كأداة لأنظمة توصية المحاصيل في الزراعة. يتم التحقيق في الاختلاف الرئيسي بين الدراسة الحالية التي قدمها ريو [50] ودوشي وآخرون [51] ونموذجنا المقترح كما يلي:
ناقش ريو [50] الاستخدام المتزايد للذكاء الاصطناعي والتعلم الآلي في الزراعة لأغراض التنبؤ. يبرزون مشكلة نماذج الصندوق الأسود، التي تفتقر إلى القابلية للتفسير وتجعل من الصعب فهم المنطق وراء التوقعات. يقدم المؤلف الذكاء الاصطناعي القابل للتفسير (XAI) والتعلم الآلي القابل للتفسير كحلول لهذه المشكلة. يظهرون فائدة هذه الطرق من خلال تطبيقها على مجموعة بيانات تتعلق بتأثير إدارة عدم الحراثة على محصول المحاصيل.
يكشف التحليل أن عدم الحراثة يمكن أن يزيد من محصول الذرة تحت ظروف معينة. يؤكد المؤلف على أهمية الإجابة على الأسئلة الرئيسية المتعلقة بمتغيرات التنبؤ، والتفاعلات، والارتباطات، والأسباب الكامنة. يجادلون بأن الممارسات الحالية تركز بشكل مفرط على مقاييس أداء النموذج وتتجاهل هذه الأسئلة الحاسمة، ويقترحون أن XAI والتعلم الآلي القابل للتفسير يمكن أن يعززا الثقة والقابلية للتفسير في الذكاء الاصطناعي. بينما ركز دوشي وآخرون [51] على أهمية الزراعة في الاقتصاد الهندي والاعتماد الكبير للسكان على الزراعة.
يشير المؤلف إلى أن العديد من المزارعين يعتمدون على أنماط الزراعة التقليدية دون النظر في تأثير الظروف الجوية والتربة الحالية على نمو المحاصيل. يقترحون استخدام تحليلات البيانات الضخمة والتعلم الآلي لمعالجة هذه المشكلة ويقدمون AgroConsultant، وهو نظام ذكي مصمم لمساعدة المزارعين الهنود في اتخاذ قرارات مستنيرة بشأن اختيار المحاصيل بناءً على عوامل مختلفة مثل موسم الزراعة، والموقع الجغرافي، وخصائص التربة، ودرجة الحرارة، وهطول الأمطار. يقدم النموذج المقترح أنظمة توصية المحاصيل كأدوات قيمة للمزارعين لتحسين العوائد من خلال تقديم توصيات مخصصة بناءً على بيانات مثل خصائص التربة، وأداء المحاصيل التاريخي، وأنماط الطقس.
تقدم الدراسة XAI-CROP، وهو خوارزمية تستفيد من مبادئ الذكاء الاصطناعي القابل للتفسير لتقديم توصيات شفافة وقابلة للتفسير. يتم مقارنة الخوارزمية مع نماذج التعلم الآلي الأخرى، وتستخدم مقاييس تقييم الأداء مثل متوسط الخطأ التربيعي، ومتوسط الخطأ المطلق، وR-squared. تسلط النتائج الضوء على الأداء المتفوق لنموذج XAI-CROP،
مع معدلات خطأ منخفضة وقيمة R-squared عالية تشير إلى دقتها وقابليتها للتفسير في شرح تباين البيانات.
في الاتجاهات المستقبلية، يمكننا تعديل النموذج المقترح للتحقيق في تأثير XAI خاصة في مهام التحسين [52]، ومعالجة اللغة الطبيعية (NLP) [53]، وسلسلة التوريد [54].
الافتراضات: في سياق بحثنا، وضعنا عدة افتراضات أساسية تشكل أساس دراستنا. هذه الافتراضات أساسية في تشكيل المنهجية ونتائج بحثنا. أولاً، نعمل تحت افتراض أن بيانات محصول المحاصيل التاريخية المتاحة لدينا دقيقة وتمثل الظروف الزراعية في المناطق المدروسة. بالإضافة إلى ذلك، نفترض أن نوع التربة وبيانات الطقس التي تم جمعها موثوقة وتعكس الظروف الفعلية على الأرض. علاوة على ذلك، نفترض أن العلاقات بين هذه العوامل ومحصول المحاصيل تظل مستقرة نسبيًا بمرور الوقت، مما يسمح بتطوير نماذج تنبؤية. هذه الافتراضات حيوية لجدوى ودقة بحثنا.
المستفيدون والفوائد: من المتوقع أن تمنح ورقتنا مزايا كبيرة لمجموعة متنوعة من أصحاب المصلحة في المجال الزراعي.
المزارعون: في مقدمة المستفيدين هم المزارعون الأفراد. من خلال تنفيذ نظام XAI-CROP، يمكن للمزارعين الوصول إلى توصيات محاصيل مصممة خصيصًا تتناسب مع موقعهم الجغرافي، وظروف التربة، والبيانات التاريخية. هذا لديه القدرة على رفع عوائد المحاصيل بشكل كبير، وتقليل هدر الموارد، وزيادة الربحية العامة للمزارعين الأفراد.
مديرو الزراعة وصناع القرار: يمكن لمديري الزراعة وصناع القرار الحصول على رؤى لا تقدر بثمن من بحثنا. يزودهم بأداة قوية لتحسين تخصيص الموارد وتبسيط عمليات اتخاذ القرار. من خلال استغلال قوة XAI-CROP، يمكنهم اتخاذ خيارات حكيمة بشأن زراعة المحاصيل، وإدارة الموارد، وتوقيت التدابير للتخفيف من الظروف الجوية السلبية أو الأمراض. وبالتالي، يحمل هذا وعدًا بتحسين إنتاجية واستدامة العمليات الزراعية على نطاق أوسع.
الباحثون والأكاديميون: بالإضافة إلى تطبيقاته الفورية، يساهم بحثنا بشكل كبير في الجسم المتزايد من المعرفة المتعلقة بتطبيق الذكاء الاصطناعي القابل للتفسير في الزراعة. يمكن للباحثين والأكاديميين الاستفادة من نتائجنا كأساس للدراسات والابتكارات اللاحقة في أنظمة توصية المحاصيل. يحمل هذا المجال البحثي المتنامي إمكانات هائلة لمزيد من التطورات، و
يعمل بحثنا كخطوة محورية للتقدم المستقبلي.
القيمة للمديرين: يوفر بحثنا قيمة كبيرة لمديري الزراعة من خلال تقديم رؤى وتوصيات مدفوعة بالبيانات. في الممارسة العملية، يمكن للمديرين الاستفادة من قدرات XAI-CROP لـ:
تحسين تخصيص الموارد: من خلال اختيار المحاصيل الأكثر ملاءمة بناءً على الظروف المحلية، يمكن للمديرين توزيع الموارد مثل المياه والأسمدة والعمالة بكفاءة. وهذا، بدوره، يترجم إلى توفير التكاليف وزيادة الاستدامة.
تعزيز اتخاذ القرار: يوفر XAI-CROP توصيات شفافة وقابلة للتفسير، مما يقلل بشكل كبير من عدم اليقين في اتخاذ القرار. يمكن للمديرين الاعتماد بثقة على هذه الرؤى لاتخاذ خيارات مستنيرة تتماشى مع أهدافهم.
زيادة الإنتاجية الزراعية: إن الإمكانية لزيادة غلة المحاصيل من خلال نظامنا تؤثر بشكل مباشر على الربحية. يمكن للمديرين توقع عوائد مرتفعة على الاستثمارات وتحسين الأمن الغذائي في مناطقهم.
اقتراحات للمديرين: لفتح الإمكانات الكاملة لبحثنا، نقدم عدة توصيات لمديري الزراعة:
تحديثات البيانات المنتظمة: إن تنفيذ آلية لتحديث البيانات بشكل دوري أمر بالغ الأهمية. يضمن ذلك بقاء نموذج XAICROP دقيقًا ومحدثًا. إن دمج بيانات جديدة تتعلق بأداء المحاصيل، وأنماط الطقس، وظروف التربة أمر ضروري للحفاظ على موثوقية النظام.
تعزيز ثقافة مدفوعة بالبيانات: إن زراعة ثقافة اتخاذ القرار المدفوع بالبيانات داخل فرق إدارة الزراعة تسهم في دمج XAI-CROP بسلاسة في الممارسات الحالية. قد يتطلب ذلك تدريب الموظفين على استخدام النظام بكفاءة وتعزيز التعاون بين علماء البيانات والخبراء الزراعيين.
التعاون ومشاركة المعرفة: يُنصح بالتعاون بين أصحاب المصلحة، بما في ذلك المزارعين والباحثين والهيئات الحكومية. يمكن أن تسهل تبادل المعرفة والخبرات المشتركة تسريع اعتماد نظامنا وتخصيصه لمناطق وتحديات زراعية متنوعة.
تفسير النتائج: على الرغم من أنك قدمت ملخصًا لوظائف النموذج وكيف يقارن بالنماذج الأخرى، قد ترغب في التعمق أكثر عند تفسير النتائج. قدم شرحًا لسبب أداء XAI-CROP بشكل أفضل من النماذج الأخرى وشرح العوامل التي أدت إلى قيم R2 الأعلى، وMSE الأقل، وMAE الأقل. يمكن أن يسهل ذلك على القارئ فهم مزايا نموذجك.
حالات استخدام مفيدة: وصف حالات معينة يمكن فيها استخدام نموذج XAI-CROP. يمكنك،
على سبيل المثال، شرح كيف يمكن أن تتضمن عملية اتخاذ القرار لدى المزارع النموذج. قد يتطلب ذلك شرحًا شاملاً لكيفية تنفيذ اقتراحات النموذج في العالم الحقيقي أو دليل خطوة بخطوة.

6 يمكن تنفيذ عدة آثار في العالم الحقيقي مثل:

  1. الزراعة الدقيقة: يمكن استخدام النموذج المقترح لتقديم توصيات مخصصة للمحاصيل للمزارعين بناءً على عوامل مثل جودة التربة، وظروف الطقس، والبيانات التاريخية، ومتطلبات المحاصيل المحددة. يمكن أن يساعد ذلك في تحسين تخصيص الموارد، وزيادة غلة المحاصيل، وتقليل الأثر البيئي من خلال تقليل استخدام الأسمدة والمبيدات.
  2. ممارسات الزراعة المستدامة: من خلال دمج الذكاء الاصطناعي القابل للتفسير في أنظمة توصية المحاصيل، يمكن أن يساعد النموذج المقترح المزارعين في اعتماد ممارسات زراعية مستدامة. يمكن أن يوفر رؤى حول الأثر البيئي لاختيارات المحاصيل المختلفة ويوصي باستراتيجيات صديقة للبيئة، مثل تدوير المحاصيل أو الزراعة المختلطة، لتعزيز صحة التربة والحفاظ على التنوع البيولوجي.
  3. التكيف مع تغير المناخ: مع تأثير تغير المناخ على الإنتاجية الزراعية والأنماط، يمكن أن يساعد النموذج المقترح المزارعين في التكيف مع الظروف المتغيرة. من خلال تحليل البيانات المناخية التاريخية ودمج النماذج التنبؤية، يمكنه توليد توصيات لاختيارات المحاصيل المقاومة التي تتناسب بشكل أفضل مع تحمل الأحداث المناخية المتطرفة أو الأنماط المناخية المتغيرة.
  4. دعم الزراعة الصغيرة: غالبًا ما يواجه المزارعون الصغار تحديات فريدة من حيث الموارد المحدودة والوصول إلى المعلومات. يمكن أن يقدم النموذج المقترح توصيات مخصصة للمحاصيل ويوفر رؤى قيمة لدعم اتخاذ القرار للمزارعين الصغار، مما يساعدهم على زيادة إنتاجيتهم وربحيتهم.
  5. دعم القرار للمستشارين الزراعيين: يمكن للمستشارين الزراعيين استخدام النموذج المقترح لتقديم توصيات خبراء للمزارعين. من خلال دمج الذكاء الاصطناعي القابل للتفسير، يمكن للنموذج تقديم الأسباب والتبريرات الأساسية لتوصيات المحاصيل المحددة بشكل شفاف، مما يمكّن المستشارين من التواصل بفعالية وكسب ثقة المزارعين.

7 الخاتمة

في هذه الدراسة، طورنا XAI-CROP، نظام توصية المحاصيل الذي يستفيد من تقنيات التعلم الآلي والذكاء الاصطناعي القابل للتفسير. من خلال التدريب والتقييم المكثف على مجموعة بيانات تشمل زراعة المحاصيل في الهند، أظهرنا الأداء المتفوق لـ XAI-CROP مقارنةً بالنماذج الأخرى للتعلم الآلي. أظهرت نتائجنا دقتها الأعلى، كما يتضح من انخفاض متوسط الخطأ التربيعي (MSE)، ومتوسط الخطأ المطلق (MAE)، وقيمة R-squared (R2) الأعلى.
تكمن الابتكار الرئيسي في XAI-CROP في قدرته على تقديم تفسيرات قابلة للتفسير لتوصياته. من خلال دمج تقنيات الذكاء الاصطناعي القابل للتفسير (XAI) مثل LIME، يوضح XAI-CROP عملية اتخاذ القرار، مما يجعلها شفافة وقابلة للفهم للمزارعين وأصحاب المصلحة الزراعيين. تعزز هذه الشفافية من قابلية استخدام النظام وتبني الثقة والاطمئنان بين المستخدمين النهائيين من خلال تمكينهم من فهم الأسباب وراء اختيارات المحاصيل الموصى بها.
علاوة على ذلك، يحمل XAI-CROP آثارًا عميقة للتطبيقات في العالم الحقيقي، لا سيما في سياق الزراعة الدقيقة والزراعة المدفوعة بالبيانات. من خلال أخذ الموقع الجغرافي، والتغيرات الموسمية، والبيانات التاريخية في الاعتبار، يمكّن XAI-CROP المستخدمين من اتخاذ قرارات مستنيرة بشأن اختيار المحاصيل. تسهم هذه القدرة في تحسين توقعات غلة المحاصيل، وتحسين تخصيص الموارد، وفي النهاية، تعزيز الأمن الغذائي في المناطق الزراعية. يتم تسليط الضوء على الأهمية المادية لـ XAI-CROP من خلال توافقه مع مواقع جغرافية مختلفة، وقابليته للتوسع لمجموعة متنوعة من المحاصيل، وإمكانية دمجه مع تقنيات متطورة. من خلال أخذ هذه الجوانب في الاعتبار، يظهر نموذجنا إمكاناته لمعالجة تحديات زراعية متنوعة ولعب دور محوري في زراعة المحاصيل المستدامة والفعالة في جميع أنحاء العالم.
في الختام، يتمتع XAI-CROP بإمكانية إحداث ثورة في القطاع الزراعي من خلال تمكين المزارعين من اتخاذ قرارات مدفوعة بالبيانات، مما يؤدي إلى زيادة غلة المحاصيل وتحسين الأمن الغذائي. تؤكد دراستنا على أهمية استخدام تقنيات التعلم الآلي والذكاء الاصطناعي القابل للتفسير في تطوير أنظمة توصية المحاصيل العملية والفعالة. يمكن أن تركز الأبحاث المستقبلية على تعزيز دقة وقابلية توسيع XAI-CROP، وتوسيع تطبيقه لمناطق ومحاصيل أخرى، واستكشاف التكامل مع تقنيات متطورة لتعزيز دعم القرار الزراعي. من خلال سد الفجوة بين التكنولوجيا المتقدمة والعالم المادي للزراعة، يمثل XAI-CROP خطوة كبيرة إلى الأمام في تمكين المزارعين من التنقل في
تعقيدات الزراعة الحديثة واتخاذ قرارات مستنيرة من أجل زراعة المحاصيل المستدامة والفعالة. نأمل أن تسهم هذه الأبحاث في تقدم الممارسات الزراعية على مستوى العالم، وتعزيز الأمن الغذائي والاستدامة البيئية.
في المستقبل، يمكن استخدام الخوارزمية المقترحة مع OCNN [55-58] والاستفادة من Resnet [59]. يمكن استخدام آلية الانتباه كما في [60] وخوارزميات الارتباط كما في [61]. يمكن استخدام YOLO v8 كما في [62]. بالإضافة إلى ذلك، يمكن أن تستكشف الأعمال المستقبلية دمج XAI-CROP مع التقنيات المتطورة مثل تلك التي تم عرضها في المراجع [63-71]، مما يوفر قدرات أكثر تطوراً لدعم القرار المالي.
مساهمات المؤلفين هي جهد تعاوني حيث عمل محمود وفاطمة وسماح معًا. اقترحت فاطمة الفكرة وكتبت الملخص والمقترح، بينما ساهمت سماح من خلال إجراء المقارنات وإجراء التجارب. كتب محمود المقدمة والأعمال ذات الصلة.
التمويل تم توفير تمويل الوصول المفتوح من قبل هيئة تمويل العلوم والتكنولوجيا والابتكار (STDF) بالتعاون مع البنك المصري للمعرفة (EKB). لم يتلق المؤلفون أي تمويل محدد لهذه الدراسة.

الإقرارات

تضارب المصالح يعلن المؤلفون أنهم ليس لديهم أي تضارب في المصالح للإبلاغ عنه فيما يتعلق بالدراسة الحالية.
الموافقة الأخلاقية لا توجد أي تضاربات أخلاقية.
الوصول المفتوح هذه المقالة مرخصة بموجب رخصة المشاع الإبداعي للاستخدام الدولي 4.0، والتي تسمح بالاستخدام والمشاركة والتكيف والتوزيع وإعادة الإنتاج في أي وسيلة أو صيغة، طالما أنك تعطي الائتمان المناسب للمؤلفين الأصليين والمصدر، وتوفر رابطًا لرخصة المشاع الإبداعي، وتوضح ما إذا كانت هناك تغييرات قد تم إجراؤها. الصور أو المواد الأخرى من طرف ثالث في هذه المقالة مشمولة في رخصة المشاع الإبداعي للمقالة، ما لم يُشار إلى خلاف ذلك في سطر الائتمان للمادة. إذا لم تكن المادة مشمولة في رخصة المشاع الإبداعي للمقالة وكان استخدامك المقصود غير مسموح به بموجب اللوائح القانونية أو يتجاوز الاستخدام المسموح به، ستحتاج إلى الحصول على إذن مباشرة من صاحب حقوق الطبع والنشر. لعرض نسخة من هذه الرخصة، قم بزيارة http://creativecommons. org/licenses/by/4.0/.

References

  1. Bhadouria R, et al. (2019) Agriculture in the era of climate change: Consequences and effects. In Climate Change and Agricultural Ecosystems, Elsevier, 1-23.
  2. Xu X et al (2019) Design of an integrated climatic assessment indicator (ICAI) for wheat production: a case study in Jiangsu Province, China. Ecol Ind 101:943-953
  3. Bali N, Singla A (2021) Deep learning based wheat crop yield prediction model in punjab region of north india. Appl Artif Intell 35(15):1304-1328
  4. Van Klompenburg T, Kassahun A, Catal C (2020) Crop yield prediction using machine learning: A systematic literature review. Comput Electron Agric 177:105709
  5. Alpaydin E (2020) Introduction to machine learning. MIT press.
  6. Tarek Z et al (2023) Soil erosion status prediction using a novel random forest model optimized by random search method. Sustainability 15(9):9. https://doi.org/10.3390/su15097114
  7. Shams MY, Tarek Z, Elshewey AM, Hany M, Darwish A, Hassanien AE (2023) A machine learning-based model for predicting temperature under the effects of climate change. In: The Power of Data: Driving Climate Change with Data Science and Artificial Intelligence Innovations, A. E. Hassanien and A. Darwish, Eds., in Studies in Big Data. Cham: Springer Nature Switzerland, 2023: 61-81. https://doi.org/10.1007/978-3-031-22456-0_4.
  8. Elshewey AM et al (2023) A novel WD-SARIMAX model for temperature forecasting using daily Delhi climate dataset. Sustainability 15(1):1. https://doi.org/10.3390/su15010757
  9. Porter JR, Xie L, Challinor AJ, Cochrane K, Howden SM, Iqbal MM, Lobell DB, Travasso MI (2014) Food security and food production systems. Part A: Global and Sectoral Aspects. Contribution of Working Group II to the Fifth Assessment Report of the Intergovernmental Panel on Climate Change, 1(1): 485-533 (2014).
  10. Rosenzweig C et al (2013) The agricultural model intercomparison and improvement project (AgMIP): protocols and pilot studies. Agric For Meteorol 170:166-182
  11. Khater HA, Gamel SA (2023) Early diagnosis of respiratory system diseases (RSD) using deep convolutional neural networks. J Ambient Intell Human Comput 14:12273-12283
  12. Lobell DB, Asseng S (2017) Comparing estimates of climate change impacts from process-based and statistical crop models. Environ Res Lett 12(1):015001
  13. Schlenker W, Roberts MJ (2009) Nonlinear temperature effects indicate severe damages to US crop yields under climate change. Proc Natl Acad Sci 106(37):15594-15598
  14. Roberts MJ, Braun NO, Sinclair TR, Lobell DB, Schlenker W (2017) Comparing and combining process-based crop models and statistical models with some implications for climate change. Environ Res Lett 12(9):095010
  15. Roberts MJ, Schlenker W, Eyer J (2013) Agronomic weather measures in econometric models of crop yield with implications for climate change. Am J Agr Econ 95(2):236-243
  16. Patel K, Patel HB (2023) Multi-criteria agriculture recommendation system using machine learning for crop and fertilizesrs prediction. Curr Agricult Res J 11(1), 2023.
  17. Mittal N, Bhanja A (2023) Implementation and identification of crop based on soil texture using AI. In: 2023 4th International Conference on Electronics and Sustainable Communication Systems (ICESC), IEEE. 1467-1471.
  18. Fenz S, Neubauer T, Heurix J, Friedel JK, Wohlmuth M-L (2023) AI- and data-driven pre-crop values and crop rotation matrices. Eur J Agron 150:126949. https://doi.org/10.1016/j.eja.2023. 126949
  19. Arif MS, Mukheimer A, Asif D (2023) Enhancing the early detection of chronic kidney disease: a robust machine learning model. Big Data Cognit Comput 7(3):3. https://doi.org/10.3390/ bdcc7030144
  20. Asif D, Bibi M, Arif MS, Mukheimer A (2023) Enhancing heart disease prediction through ensemble learning techniques with hyperparameter optimization. Algorithms 16(6):6. https://doi.org/ 10.3390/a16060308
  21. Nawaz Y, Arif MS, Shatanawi W, Nazeer A (2021) An explicit fourth-order compact numerical scheme for heat transfer of
    boundary layer flow. Energies 14(12):12. https://doi.org/10.3390/ en14123396
  22. Nawaz Y, Arif MS, Abodayeh K (2022) A third-order two-stage numerical scheme for fractional stokes problems: a comparative computational study. J Comput Nonlinear Dyn 17:101004. https://doi.org/10.1115/1.4054800
  23. Nawaz Y, Arif MS, Abodayeh K (2022) An explicit-implicit numerical scheme for time fractional boundary layer flows. Int J Numer Meth Fluids 94(7):920-940. https://doi.org/10.1002/fld. 5078
  24. McEldowney JF (2021) Climate change and the law. In: the impacts of climate change, Elsevier. 503-519.
  25. de Oliveira AC, Marini N, Farias DR (2014) Climate change: New breeding pressures and goals. Encyclopedia Agricult Food Syst 2014:284-293
  26. Williams TO, et al. (2015) Climate smart agriculture in the African context. Unlocking Africa’s Agricultural Potentials for Transformation to Scale, FAO and UNEP, Abdou Diouf International Conference, Dakar, Senegal, pp. 1-26, 2015.
  27. Reddy PS, Amarnath B, Sankari M (2023) Study on machine learning and back propagation for crop recommendation system. In: 2023 International Conference on Sustainable Computing and Data Communication Systems (ICSCDS), IEEE. 1533-1537.
  28. You J, Li X, Low M, Lobell D, Ermon S (2017) Deep gaussian process for crop yield prediction based on remote sensing data. In: Thirty-First AAAI conference on artificial intelligence.
  29. Paudel D et al (2021) Machine learning for large-scale crop yield forecasting. Agric Syst 187:103016
  30. Sun J, Lai Z, Di L, Sun Z, Tao J, Shen Y (2020) Multilevel deep learning network for county-level corn yield estimation in the us corn belt. IEEE J Selected Top Appl Earth Obs
  31. Yoon HS et al (2021) Akkermansia muciniphila secretes a glu-cagon-like peptide-1-inducing protein that improves glucose homeostasis and ameliorates metabolic disease in mice. Nat Microbiol 6(5):5. https://doi.org/10.1038/s41564-021-00880-5
  32. Khaki S, Wang L (2022) Crop Yield Prediction Using Deep Neural Networks. Front Plant Sci 10, 2019, Accessed: Sep. 27, 2022. Available: https://doi.org/10.3389/fpls.2019.00621
  33. Abbas F, Afzaal H, Farooque AA, Tang S (2020) Crop yield prediction through proximal sensing and machine learning algorithms. Agronomy 10(7):7. https://doi.org/10.3390/ agronomy10071046
  34. Talaat FM (2023) Crop yield prediction algorithm (CYPA) in precision agriculture based on IoT techniques and climate changes. Neural Comput Applic. https://doi.org/10.1007/s00521-023-08619-5
  35. Friedman JH (2001) Greedy function approximation: a gradient boosting machine. Ann Stat 29(5):1189-1232
  36. Natekin A, Knoll A (2022) Gradient boosting machines, a tutorial. Front Neurorobotics 7, 2013, Accessed: Sep. 27, 2022. Available: https://doi.org/10.3389/fnbot.2013.00021
  37. Ke G, et al. (2017) LightGBM: A Highly Efficient Gradient Boosting Decision Tree. In: Advances in Neural Information Processing Systems, 2017, 30. Accessed: Sep. 27, 2022. Available: https://proceedings.neurips.cc/paper/2017/hash/ 6449f44a102fde848669bdd9eb6b76fa-Abstract.html
  38. Rao H et al (2019) Feature selection based on artificial bee colony and gradient boosting decision tree. Appl Soft Comput 74:634-642. https://doi.org/10.1016/j.asoc.2018.10.036
  39. Freund Y, Mason L (1999) The alternating decision tree learning algorithm. In: Icml, 1999, 99, pp. 124-133.
  40. Feng J, Yu Y, Zhou Z-H (2018) Multi-Layered Gradient Boosting Decision Trees. In: Advances in Neural Information Processing Systems, 2018, 31. Accessed: Sep. 27, 2022. Available: https:// proceedings.neurips.cc/paper/2018/hash/39027dfad5138c9 ca0c474d71db915c3-Abstract.html
  41. Pretorius A, Bierman S, Steel SJ (2016) A meta-analysis of research in random forests for classification. In: 2016 Pattern Recognition Association of South Africa and Robotics and Mechatronics International Conference (PRASA-RobMech), 2016, pp. 1-6.
  42. Sun C, Li X, Guo R (2021) Research on electrical fire risk assessment technology of cultural building based on random forest algorithm. In: 2021 International Conference on Aviation Safety and Information Technology, New York, NY, USA, Dec. 2021, pp. 769-773. https://doi.org/10.1145/3510858.3511382.
  43. Geenen PL, van der Gaag LC, Loeffen WLA, Elbers ARW (2011) Constructing naive Bayesian classifiers for veterinary medicine: A case study in the clinical diagnosis of classical swine fever. Res Vet Sci 91(1):64-70. https://doi.org/10.1016/j.rvsc. 2010.08.006
  44. Xu S (2018) Bayesian Naïve Bayes classifiers to text classification. J Inf Sci 44(1):48-59. https://doi.org/10.1177/016555151 6677946
  45. Kibriya AM, Frank E, Pfahringer B, Holmes G (2005) Multinomial naive bayes for text categorization revisited. In: AI 2004: Advances in Artificial Intelligence, Berlin, Heidelberg, 2005, pp. 488-499. https://doi.org/10.1007/978-3-540-30549-1_43.
  46. Jiang L, Wang S, Li C, Zhang L (2016) Structure extended multinomial naive Bayes. Inf Sci 329:346-356. https://doi.org/10. 1016/j.ins.2015.09.037
  47. https://www.kaggle.com/datasets/ananysharma/crop-yield.
  48. Elshewey A, Shams M, Tarek Z, Megahed M, El-kenawy E-S, El-dosuky M (2023) Weight prediction using the hybrid stackedLSTM food selection model. CSSE, 46(1): 765-781, 2023, https://doi.org/10.32604/csse.2023.034324.
  49. Shams MY, Elshewey AM, El-kenawy E-SM, Ibrahim A, Talaat FM, Tarek Z (2023) Water quality prediction using machine learning models based on grid search method. Multimed Tools Appl. https://doi.org/10.1007/s11042-023-16737-4
  50. Ryo M (2022) Explainable artificial intelligence and interpretable machine learning for agricultural data analysis. Artif Intell Agricult 6:257-265. https://doi.org/10.1016/j.aiia.2022.11. 003
  51. Doshi Z, Nadkarni S, Agrawal R, Shah N (2018) AgroConsultant: Intelligent crop recommendation system using machine learning algorithms. In: 2018 Fourth International Conference on Computing Communication Control and Automation (ICCUBEA), Aug. 2018, pp. 1-6. https://doi.org/10.1109/ICCUBEA.2018. 8697349.
  52. Taleizadeh AA, Amjadian A, Hashemi-Petroodi SE, Moon I (2023) Supply chain coordination based on mean-variance risk optimisation: pricing, warranty, and full-refund decisions. Int J Syst Sci: Oper Logist 10(1):2249808. https://doi.org/10.1080/ 23302674.2023 .2249808
  53. Gharaei A, Amjadian A, Shavandi A, Amjadian A (2023) An augmented Lagrangian approach with general constraints to solve nonlinear models of the large-scale reliable inventory systems. J Comb Optim 45(2):78. https://doi.org/10.1007/s10878-023-01002-z
  54. Taleizadeh AA, Varzi AM, Amjadian A, Noori-daryan M, Konstantaras I (2023) How cash-back strategy affect sale rate under refund and customers’ credit. Oper Res Int J 23(1):19. https://doi. org/10.1007/s12351-023-00752-2
  55. Talaat FM (2022) Effective deep Q-networks (EDQN) strategy for resource allocation based on optimized reinforcement learning algorithm. Multimed Tools Appl 81(17). https://doi.org/10. 1007/s11042-022-13000-0
  56. Talaat FM (2022) Effective prediction and resource allocation method (EPRAM) in fog computing environment for smart healthcare system. Multimed Tools Appl
  57. Talaat Fatma M, Alshathri Samah, Nasr Aida A (2022) A new reliable system for managing virtualcloud network. Comput Mater Continua 73(3):5863-5885. https://doi.org/10.32604/cmc. 2022.026547
  58. El-Rashidy N, ElSayed NE, El-Ghamry A, Talaat FM (2022) Prediction of gestational diabetes based on explainable deep learning and fog computing. Soft Comput 26(21):11435-11450
  59. El-Rashidy N, Ebrahim N, el Ghamry A, Talaat FM (2022) Utilizing fog computing and explainable deep learning techniques for gestational diabetes prediction. Neural Comput Applic. https://doi.org/10.1007/s00521-022-08007-59. FaivdullahL,AzaharF,HtikeZZ,Naing
  60. Hanaa S, Fatma BT (2022) Detection and classification using deep learning and sine-cosine fitnessgrey wolf optimization. Bioengineering 10(1):18. https://doi.org/10.3390/bioengineering 10010018
  61. Talaat FM (2023) Real-time facial emotion recognition system among children with autism based on deep learning and IoT. Neural Comput Appl 35(3), https://doi.org/10.1007/s00521-023-08372-9
  62. Talaat FM (2023) Crop yield prediction algorithm (CYPA) in precision agriculture based on IoT techniques and climate changes, April 2023, Neural Comput Appl 35(2), https://doi.org/10. 1007/s00521-023-08619-5
  63. Hassan E, El-Rashidy N, Talaat FM (2022) Review: Mask R-CNN Models. May 2022, https://doi.org/10.21608/njccs.2022. 280047.
  64. Siam AI, Gamel SA, Talaat FM (2023) Automatic stress detection in car drivers based on non-invasive physiological signals using machine learning techniques. Neural Comput Applic. https://doi.org/10.1007/s00521-023-08428-w
  65. Talaat FM, Gamel SA (2023) A2M-LEUK: attention-augmented algorithm for blood cancer detection in children, June 2023, Neural Comput Appl. https://doi.org/10.1007/s00521-023-086788
  66. Gamel SA, Hassan E, El-Rashidy N et al (2023) Exploring the effects of pandemics on transportation through correlations and deep learning techniques. Multimed Tools Appl. https://doi.org/ 10.1007/s11042-023-15803-1
  67. Talaat FM, ZainEldin H (2023) An improved fire detection approach based on YOLO-v8 for smart cities. Neural Comput Applic. https://doi.org/10.1007/s00521-023-08809-1
  68. Alnaggar M, Siam AI, Handosa M, Medhat T, Rashad MZ (2023) Video-based real-time monitoring for heart rate and respiration rate. Expert Syst Appl 1(225):120135
  69. Alnaggar M, Handosa M, Medhat T, Z Rashad M (2023) Thyroid Disease multi-class classification based on optimized gradient boosting model. Egypt J Artif Intell. 2(1):1-4.
  70. Alnaggar M, Handosa M, Medhat T, Rashad MZ (2023) An IoTbased framework for detecting heart conditions using machine learning. Int J Adv Comput Sci Appl. 14(4).
  71. Alhussan AA, Talaat FM, El-kenawy ES, Abdelhamid AA, Ibrahim A, Khafaga DS, Alnaggar M (2023) Facial expression recognition model depending on optimized support vector machine. Comput Mater Continua. 76(1).
Publisher’s Note Springer Nature remains neutral with regard to jurisdictional claims in published maps and institutional affiliations.

  1. Fatma M. Talaat
    fatma.nada@ai.kfs.edu.eg
    Mahmoud Y. Shams
    mahmoud.yasin@ai.kfs.edu.eg
    Samah A. Gamel
    sgamel@horus.edu.eg
    Faculty of Artificial Intelligence, Kafrelsheikh University, Kafrelsheikh, Egypt
    2 Faculty of Engineering, Horus University, Damietta, Egypt
    3 Faculty of Computer Science and Engineering, New Mansoura University, Gamasa 35712, Egypt
    4 Nile Higher Institute for Engineering and Technology, Mansoura, Egypt

Journal: Neural Computing and Applications, Volume: 36, Issue: 11
DOI: https://doi.org/10.1007/s00521-023-09391-2
Publication Date: 2024-01-11

Enhancing crop recommendation systems with explainable artificial intelligence: a study on agricultural decision-making

Mahmoud Y. Shams Samah A. Gamel Fatma M. Talaat (D)

Received: 1 May 2023 / Accepted: 13 December 2023 / Published online: 11 January 2024
© The Author(s) 2024

Abstract

Crop Recommendation Systems are invaluable tools for farmers, assisting them in making informed decisions about crop selection to optimize yields. These systems leverage a wealth of data, including soil characteristics, historical crop performance, and prevailing weather patterns, to provide personalized recommendations. In response to the growing demand for transparency and interpretability in agricultural decision-making, this study introduces XAI-CROP an innovative algorithm that harnesses eXplainable artificial intelligence (XAI) principles. The fundamental objective of XAICROP is to empower farmers with comprehensible insights into the recommendation process, surpassing the opaque nature of conventional machine learning models. The study rigorously compares XAI-CROP with prominent machine learning models, including Gradient Boosting (GB), Decision Tree (DT), Random Forest (RF), Gaussian Naïve Bayes (GNB), and Multimodal Naïve Bayes (MNB). Performance evaluation employs three essential metrics: Mean Squared Error (MSE), Mean Absolute Error (MAE), and R-squared (R2). The empirical results unequivocally establish the superior performance of XAI-CROP. It achieves an impressively low MSE of 0.9412 , indicating highly accurate crop yield predictions. Moreover, with an MAE of 0.9874, XAI-CROP consistently maintains errors below the critical threshold of 1, reinforcing its reliability. The robust value of 0.94152 underscores XAI-CROP’s ability to explain of the data’s variability, highlighting its interpretability and explanatory power.

Keywords Crop recommendation systems Machine learning eXplainable artificial intelligence Agriculture Decision support system

1 Introduction

According to the Food and Agriculture Organization of the United Nations (FAO), agriculture is a significant sector in the economics of African nations, with approximately twothirds of workers employed in this sector. Reforming agriculture in Africa is believed to be essential to eradicate poverty, hunger, and malnutrition [1]. However, the changing climate poses a challenge to the agricultural sector, with changing rainfall patterns, droughts, floods, and the spread of pests and diseases affecting crop production [2]. Therefore, predicting crop yield has become a difficult issue in precision agriculture. This is due to different variables especially the crop yield with the effect of climate change. Climate change is one of the major factors that can affect crop yields, making it essential to develop accurate predictive models to anticipate its effect. The changing environmental conditions, particularly global
warming, and climate variability, have a negative impact on the future of agriculture. These factors, combined with other variables such as climate, weather, soil, fertilizer use, and seed variety, necessitate the use of multiple datasets to address this complex problem [3]. Traditionally, predicting crop production has relied on statistical models, which can be time-consuming and arduous. However, the introduction of big data in recent years has opened up new possibilities for more advanced analysis methods, such as machine learning [4]. Machine learning models can be categorized as either descriptive or predictive, depending on the research questions and challenges at hand. Predictive models are employed to forecast the future, while descriptive models are used to learn from the data and explain past events [5-8].
Anthropogenic climate change will have a more severe impact on the agricultural industry due to its dependence on weather [9]. In estimating yield for the purpose of assessing the effects of climate change, deterministic biophysical crop models are commonly used [10]. These models, which rely on detailed representations of plant physiology, are still valuable for analyzing response processes and possible adaptations [11]. However, statistical models generally outperform them in terms of prediction across wider spatial scales [12].
A significant body of literature, particularly since the work of Schlenker and Roberts [13], has employed statistical models to demonstrate a strong correlation between severe heat and below-average crop performance. Traditional econometric methods have been used in these studies. In recent work, crop model output has been incorporated into statistical models, and insights from crop models have been used to parameterize statistical models [14, 15]. Meanwhile, machine learning approaches have made significant progress in the last few decades. Because it is primarily focused on outcome prediction rather than inference into the mechanical processes causing those outcomes, ML is conceptually distinct from much of classical statistics.
Crop Recommendation Systems (CRS) are computerbased tools that help farmers make informed decisions about which crops to plant based on factors such as soil type, weather patterns, and historical crop yields [16-18]. CRS can optimize crop yields while minimizing resource usage such as water, fertilizer, and pesticides. Machine learning models, such as decision trees, support vector machines, and neural networks, are commonly used in CRS, but these models are often considered “black boxes”
with limited transparency and interpretability, which can reduce trust in the system.
Machine learning (ML) models are currently utilized for enhancing the early detection of diseases including different stages such as preprocessing, feature extraction and classification [19]. Furthermore, ML model used hyperparameter optimization techniques and ensemble learning algorithms to predict heart disease [20].
To address this issue, eXplainable artificial intelligence (XAI) has emerged as a subfield of AI that focuses on developing machine learning models that can provide clear explanations for their decisions. The numerical schemes facilitate the integration of integer and no integer tempered derivatives into ML and XAI algorithms, enabling the modeling and analysis of complex systems with long-range correlations and memory effects. This integration enhances the interpretability and predictive capabilities of ML and XAI models, allowing for a deeper understanding and effective decision-making in various domains, including agriculture, finance, and healthcare [21-23].
This study proposes an algorithm called “XAI-CROP” that leverages XAI to enhance the transparency and interpretability of CRS. XAI-CROP uses a decision tree algorithm trained on a dataset of crop cultivation in India to generate recommendations based on input data such as location, season, and production per square kilometer, area, and crop. The system provides clear explanations for its recommendations using the Local Interpretable Model-agnostic Explanations (LIME) technique, which helps farmers understand the reasoning behind the system’s choices. The motivation behind the proposed algorithm “XAICROP” is to address the limitations of traditional Crop Recommendation Systems (CRS) that heavily rely on machine learning models, which are often considered “black boxes” due to their lack of transparency and interpretability. This lack of transparency reduces the trust that farmers may have in the system and hinders their understanding of the underlying decision-making process.
eXplainable artificial intelligence (XAI) has emerged as a subfield of AI that aims to develop machine learning models capable of providing clear explanations for their decisions. By incorporating XAI principles into CRS, the algorithm seeks to enhance the transparency and interpretability of the recommendations provided to farmers.
Research gap:
  • Limited transparency and interpretability of current crop recommendation systems.
  • Lack of clear explanations for the reasoning behind the system’s choices.
The contribution of this paper is listed as follows:
  • Development of an algorithm called “XAI-CROP” that utilizes eXplainable artificial intelligence to enhance crop recommendation systems.
  • Improvement of transparency and interpretability in agricultural decision-making.
  • Provision of clear explanations for the system’s recommendations, helping farmers understand the reasoning behind the choices.
  • The performance of XAI-CROP was assessed and compared to other crop recommendation systems.
  • XAI-CROP was found to have better accuracy and transparency compared to other systems.
  • Contribution to the growing body of research on the use of XAI in agriculture.
  • Insight into how the technology can be leveraged to address the challenges of food security and sustainable agriculture.
The structure of the paper is as follows: In Sect. 2, we review the relevant literature pertaining to the subject. Section 3 outlines the proposed approach for addressing the research question. The experimental assessment is presented in Sect. 4. Finally, Sect. 5 offers the concluding remarks for the paper.
Climate change pertains to persistent modifications in local or global temperatures or weather patterns. Addressing global warming and reducing greenhouse gas emissions is a challenging task complicated by the legal and regulatory difficulties associated with climate change [24]. As a result of global climate change, millions of people, particularly those in South Asia, Sub-Saharan Africa, and small islands, are expected to experience a rise in food insecurity, malnutrition, and hunger [25]. Climate change poses a major threat to African agricultural development [26]. Weather, temperatures, and air quality, which affect soil composition, have a significant impact on the quality of agricultural output. Therefore, it is crucial for the present generation to devise strategies to mitigate the adverse effects of environmental consequences on crop yields.
Researchers worldwide are continuing to study crop yield prediction closely [27]. You et al. [28] presented a deep learning framework for predicting crop yields using remote sensing data. They predicted crop yields annually in developing countries using a Convolutional Neural
Network (CNN) combined with a Gaussian process component and dimensional reduction technique. They applied their method to a soybean dataset produced by merging soil, sensing, and climate data from the USA. The Gaussian approach was employed to reduce the Root Mean Square Error (RMSE) of the model, which improved from 6.27 to 5.83 on average with the Long Short-Term Memory (LSTM) model and from 5.77 to 5.57 with the CNN model.
In another study, Paudel et al. [29] used machine learning in combination with agronomic principles of crop modeling to establish a machine learning baseline for large-scale crop yield prediction. They started with a workflow that emphasized accuracy, modularity, and reuse. They created features using crop simulation outputs, as well as weather, remote sensing, and soil data from the MARS Crop Yield Forecasting System (MCYFS) database.
Sun et al. [30] utilized Gradient boosting, Support Vector Regression (SVR), and k-Nearest Neighbors to predict crop yields of soft wheat, spring barley, sunflower, sugar beet, and potato crops in the Netherlands, Germany, and France. To extract both temporal and spatial features, they proposed a multilevel deep learning model that combines Recurrent Neural Network (RNN) and Convolutional Neural Network (CNN). Their objective was to evaluate the effectiveness of the suggested approach for predicting Corn Belt yields in the USA and to investigate the impact of various datasets on the prediction task. Their experiments were conducted in the US Corn Belt states, where they used both time-series remote sensing data and data on soil properties as inputs. They predicted countylevel corn yield from 2013 to 2016.
Yoon et al. [31] proposed an investigative study to demonstrate the effect of combining crop modeling and machine learning on improving corn yield predictions in the US Corn Belt. They aimed to determine if a hybrid approach (crop modeling + machine learning) can produce better predictions, identify the most accurate hybrid model combinations, and determine which aspects of crop modeling should be most effectively combined with machine learning to predict maize yield. Their study showed that weather information alone was insufficient and that adding simulation crop model variables as input features to machine learning models could reduce yield prediction RMSE from 7 to 20%. They suggested that for better yield predictions, their proposed machine learning models require more hydrological inputs.
Khaki and Wang [32] developed a Deep Neural Net-work-based solution to predict yield, check yield, and yield difference of corn hybrids, based on genotype and
environmental (weather and soil) data. They participated in the 2018 Syngenta Crop Challenge and their submission was successful. Their model achieved an RMSE of for the average yield and for the standard deviation when predicting with weather data, indicating high accuracy. Abbas et al. [33] conducted a similar study on predicting potato tuber yield using four machine learning algorithms: linear regression, elastic net, k -nearest neighbor, and support vector regression. They utilized data on soil and crop properties obtained through proximal sensing for the prediction.
In a recent paper by Talaat [34], a new method called the Crop Yield Prediction Algorithm (CYPA) is introduced, which utilizes IoT technologies in precision agriculture to predict crop yield. The algorithm is designed to analyze the impact of various factors on crop growth, such as water and nutrient deficits, pests, and diseases, throughout the growing season. With big data databases that can store large amounts of data on weather, soils, and plant species, the CYPA can provide valuable insights for policymakers and farmers alike in anticipating annual crop
yields. The study used five different machine learning models, each with optimal hyperparameter settings, to train and validate the algorithm. The DecisionTreeRegressor achieved a score of 0.9814, RandomForestRegressor scored 0.9903, and ExtraTreeRegressor scored 0.9933, indicating the high accuracy and effectiveness of the CYPA approach.
Table 1 presents the models that are commonly utilized in Crop Recommendation Systems, including Gradient Boosting (GB), Decision Tree (DT), Random Forest (RF), Gaussian Naïve Bayes (GNB), and Multimodal Naïve Bayes (MNB).
The comparison provided a clear and concise summary of the most commonly used models in Crop Recommendation Systems. It highlights the description, pros, and cons of each model, providing a good understanding of their strengths and limitations. The comparison highlights that Gradient Boosting, Random Forest, and Decision Tree are capable of handling different types of data, including numerical and categorical data. Gaussian Naïve Bayes and Multimodal Naïve Bayes are simple and fast algorithms
Table 1 Comparative Analysis of the Prevalent Models Employed in the Field
Model Algorithm Description Pros Cons
Gradient Boosting (GB) A machine learning technique that combines multiple weak models to create a strong model that can make accurate predictions
Can work with different types of data such as categorical and numerical data
Has high predictive power and can achieve high accuracy
Can be computationally expensive
May overfit if the data is noisy or has outliers
Decision Tree (DT) A tree-like model where each node represents a feature, and each branch represents a decision based on that feature
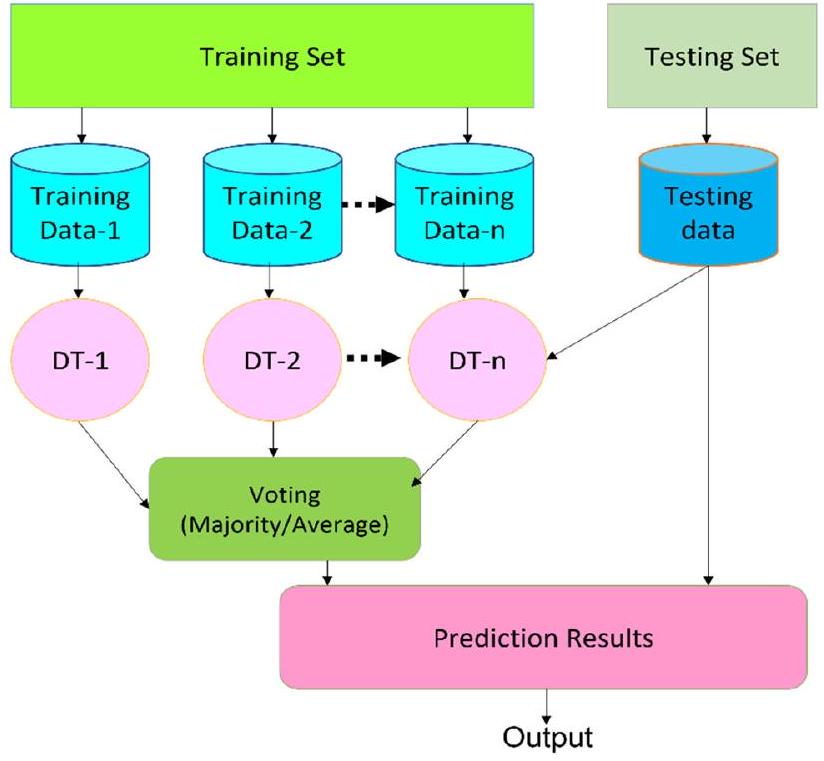
Easy to understand and interpret
Can handle both categorical and numerical data
Can handle missing values and outliers
Can easily overfit the data
May not capture complex relationships between features
Random Forest (RF) An ensemble method that creates multiple decision trees and averages their predictions to reduce overfitting and increase accuracy
Can handle high-dimensional data with many features
Less prone to overfitting than a single decision tree
Can work with both categorical and numerical data
Can be computationally expensive
May not perform well with imbalanced data
Gaussian Naïve Bayes (GNB) A probabilistic model based on Bayes’ theorem that assumes features are independent of each other
Simple and fast algorithm
Can handle high-dimensional data
Can work with both categorical and numerical data
Assumes features are independent, which may not be true in real-world datasets
May not perform well with data that has correlated features
Multimodal Naïve Bayes (MNB) An extension of Gaussian Naïve Bayes that can handle data with multiple modes or clusters
Can handle data with multiple clusters
Simple and fast algorithm
Can work with both categorical and numerical data
Assumes features are independent, which may not be true in real-world datasets
May not perform well with data that has correlated features
Fig. 1 The general block diagram of proposed algorithm “XAI-CROP”
that can handle high-dimensional data, but they may not perform well with correlated features. It also highlights the potential limitations of each model, such as overfitting or computational expenses. Overall, the comparison provides valuable insights into the tradeoffs that exist when selecting a model for a specific task in Crop Recommendation Systems.

3 XAI-CROP: eXplainable artificial intelligence for CROP recommendation systems

The proposed algorithm “XAI-CROP” is an eXplainable artificial intelligence (XAI) approach for enhancing the transparency and interpretability of Crop Recommendation Systems (CRS). The algorithm consists of five main phases as shown in Fig. 1.
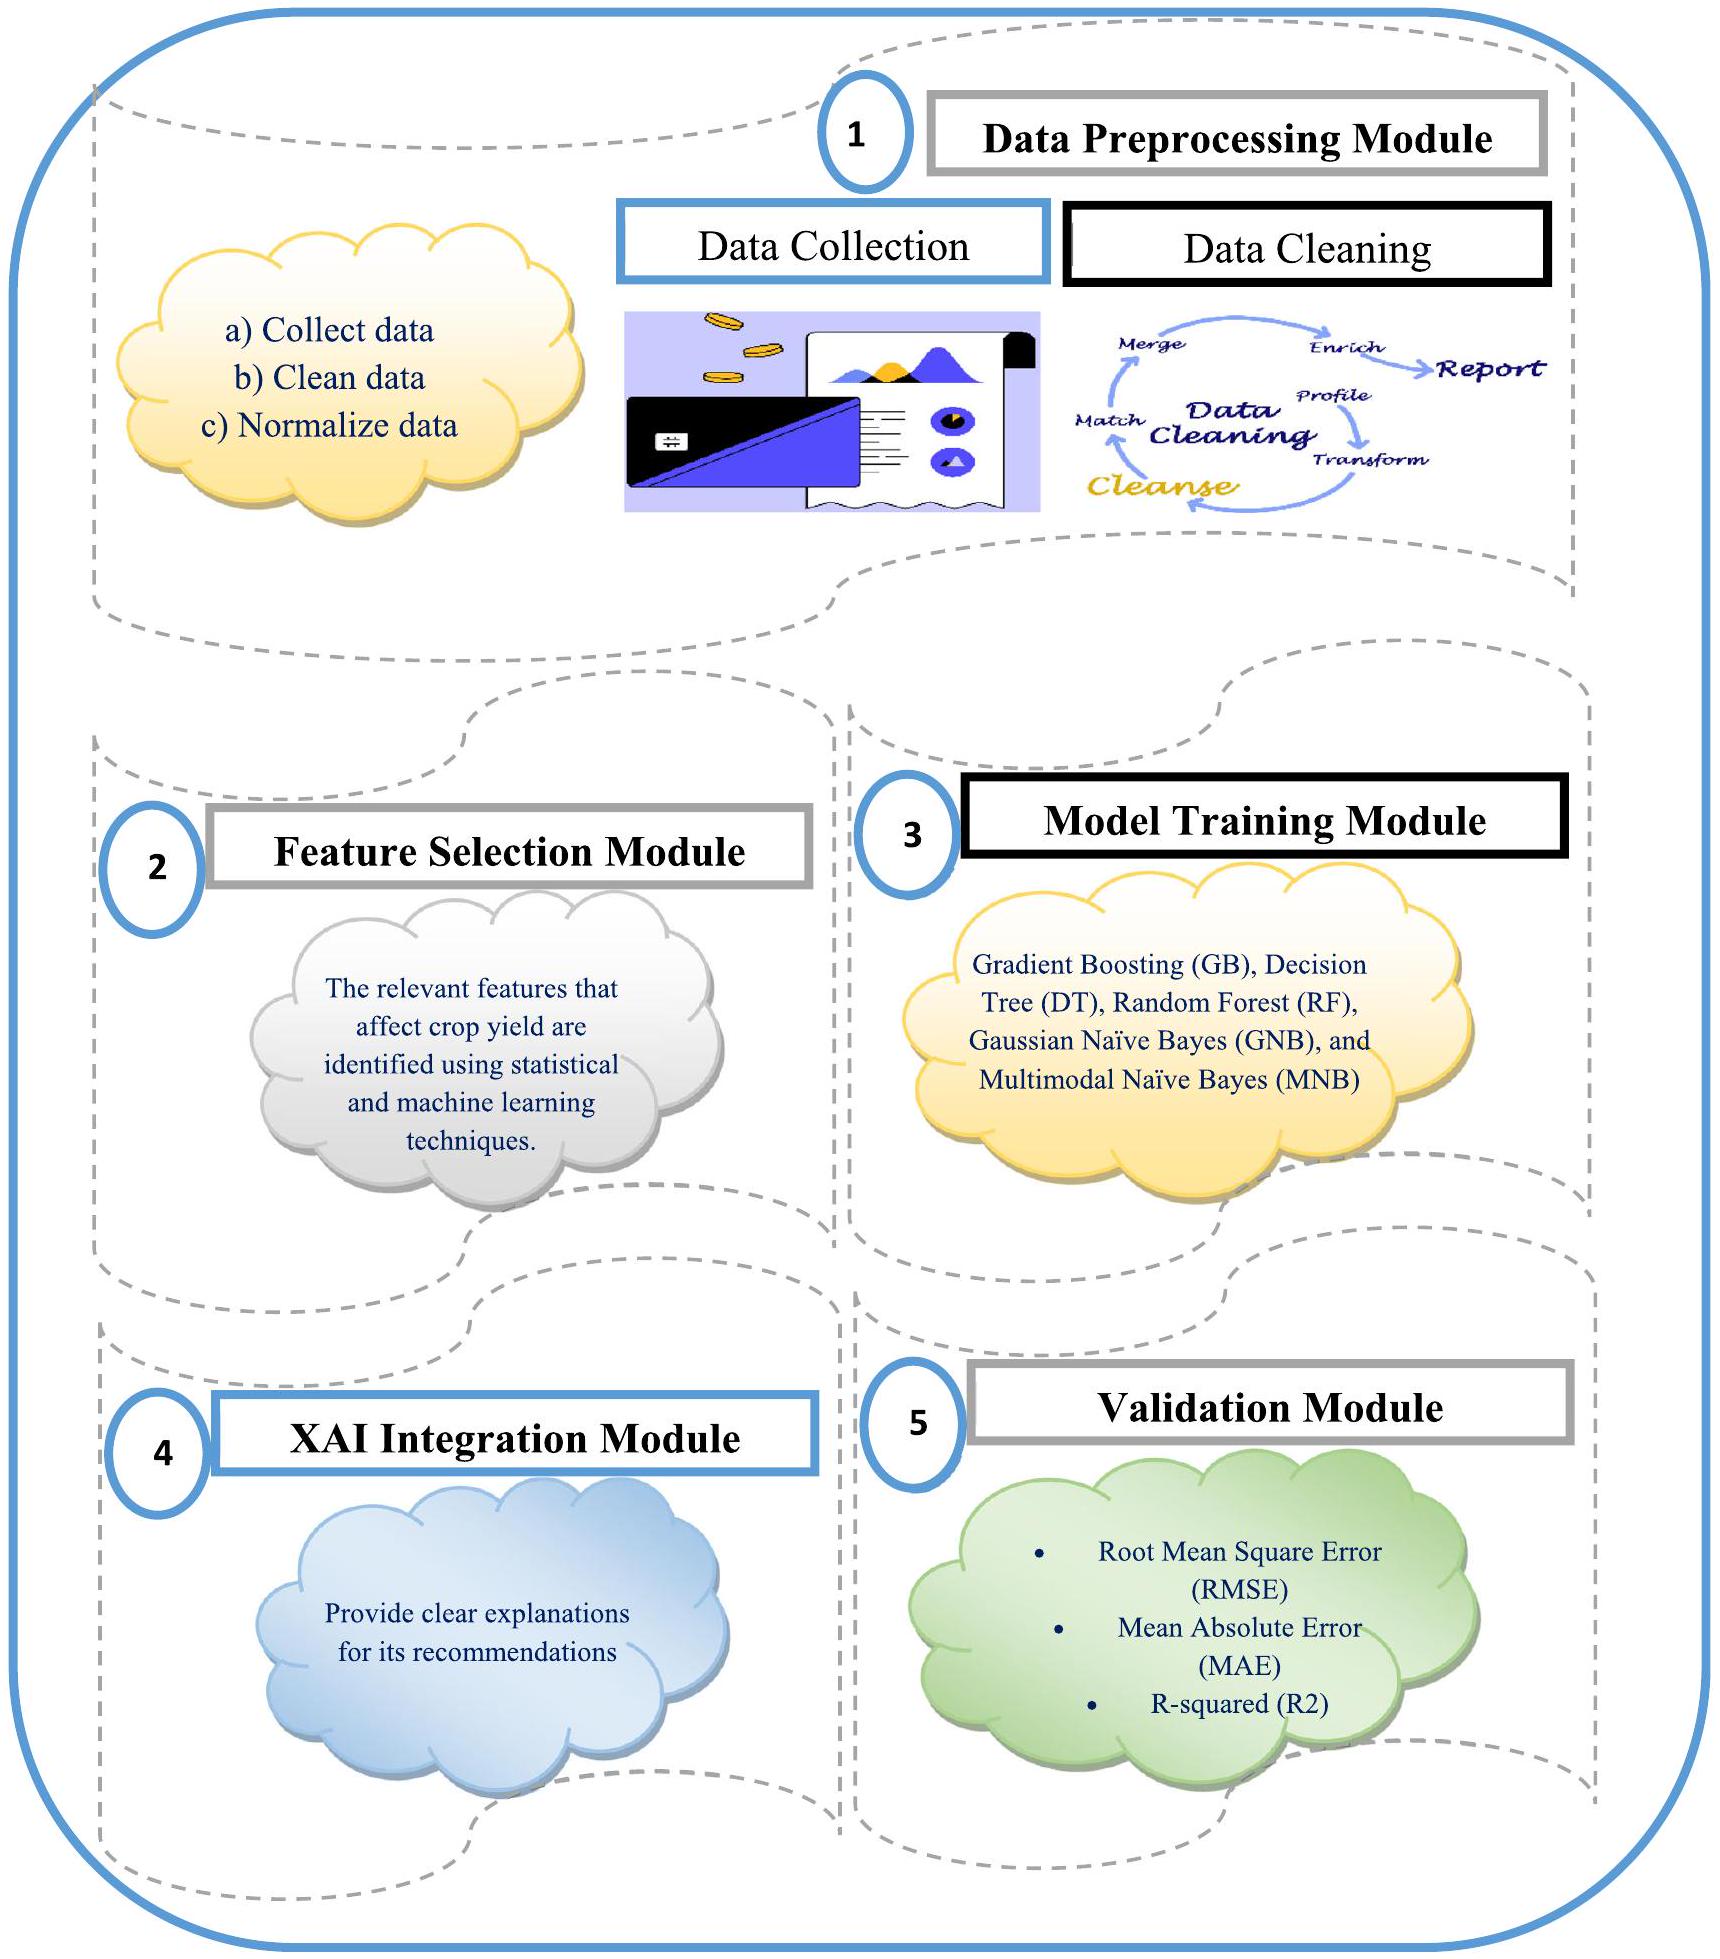
i. Data Preprocessing: In this phase, the input data, which includes soil type, weather patterns, and historical crop yields, are collected and processed for further analysis.
ii. Feature Selection: The relevant features that affect crop yield are identified using statistical and machine learning techniques. These features are then used as input for the XAI-CROP model.
iii. Model Training: The XAI-CROP model is trained on a dataset of crop cultivation in India, which includes information on crop yield, soil type, weather patterns, and historical crop yields. The model is based on a decision tree algorithm that generates recommendations based on the input data such as location, season, and production per square kilometer, area, and crop.
iv. XAI Integration: The XAI-CROP model utilizes a technique called “Local Interpretable Model-agnostic Explanations” (LIME) to provide clear explanations for its recommendations. LIME is a technique for explaining the predictions of machine learning models by generating local models that approximate the predictions of the original model.
v. Validation: The XAI-CROP model is validated using a validation dataset to assess its performance in predicting crop yield. The model’s accuracy is
measured using Root Mean Square Error (RMSE), Mean Absolute Error (MAE), and R-squared (R2).

3.1 Data preprocessing

The module for data preprocessing has the responsibility of gathering, sanitizing, and processing the acquired data. It leverages different data collection technologies like sensors, cameras, and IoT devices to obtain real-time data. After the data has been collected, it is scrubbed and processed to eliminate any inaccuracies or disturbances. Algorithm 1 depicts six primary steps involved in the Data Preprocessing Module. (i) Collect input data: Collect data on soil type, weather patterns, and historical crop yields from relevant sources. (ii) Data cleaning: Remove any duplicates or missing values in the data. (iii) Data transformation: Transform the data into a format that can be used for further analysis, such as converting categorical variables into numerical ones. (iv) Data integration: Combine the different datasets into a single dataset for analysis. (v) Data normalization: Normalize the data to ensure that all variables are on the same scale. This can be done using techniques such as min-max scaling or z-score normalization. (vi) Data splitting: Split the data into training and testing datasets for use in model training and validation.

3.2 Feature selection

The Feature Selection Module consists of six main steps as depicted in Algorithm 2: (i) Load the preprocessed dataset containing information on soil type, weather patterns, and historical crop yields. (ii) Split the dataset into training and testing sets. (iii) Apply statistical techniques such as correlation analysis, chi-square test, and ANOVA to identify features that have a significant impact on crop yield. (iv) Apply machine learning techniques such as Random Forest, Decision Trees, and Gradient Boosting to identify important features. (v) Rank the identified features based on their importance scores generated by the selected machine learning algorithm. (vi) Select the top features that have the highest importance scores as input for the XAI-CROP model.
Algorithm 1 Data preprocessing Algorithm
  • Input:
  • Collected data
  • Output:
  • Preprocessed data
  • Steps:
    // Step 1: Collect input data
    soil_data = read_csv(‘soil_data.csv’)
    weather_data read_csv(‘weather_data.csv’)
    crop_yield_data read_csv(‘crop_yield_data.csv’)
    // Step 2: Data cleaning
    soil_data remove_duplicates(soil_data)
    weather_data remove_missing_values(weather_data)
    crop_yield_data remove_duplicates(crop_yield_data)
    // Step 3: Data transformation
    soil_data convert_categorical_variables(soil_data)
    weather_data convert_categorical_variables(weather_data)
    // Step 4: Data integration
    crop_data join_datasets(soil_data, weather_data, crop_yield_data)
    // Step 5: Data normalization
    crop_data normalize_data(crop_data)
    // Step 6: Data splitting
    train_data, test_data split_data(crop_data, train_ratio=0.8)
Algorithm 2 Feature Selection Algorithm
  • Input:
  • Preprocessed dataset
  • Output:
  • Selected features for the XAI-CROP model
  • Steps:
  1. Split the dataset into training and testing set.
  2. Apply statistical techniques to identify features that have a significant impact on crop yield.
  3. Apply machine learning techniques to identify important features.
  4. Rank the identified features based on their importance scores.
  5. Select the top features that have the highest importance scores as input for the XAI-CROP model.
  6. Return the selected features as output.
    3.3 Model training
The Model Training Module consists of seven main steps as depicted in Algorithm 3: (i) Load the preprocessed
dataset containing information on crop yield, soil type, weather patterns, and historical crop yields. (ii) Split the dataset into training and testing sets using a predefined ratio. (iii) Instantiate a decision tree classifier and set the
parameters for the algorithm. (iv) Train the decision tree classifier using the training dataset. (v) Evaluate the performance of the model on the testing dataset using various metrics such as accuracy, precision, recall, and F1-score. (vi) If the performance of the model is not satisfactory, tune the hyperparameters of the decision tree algorithm and retrain the model. (vii) Save the trained model for future use.
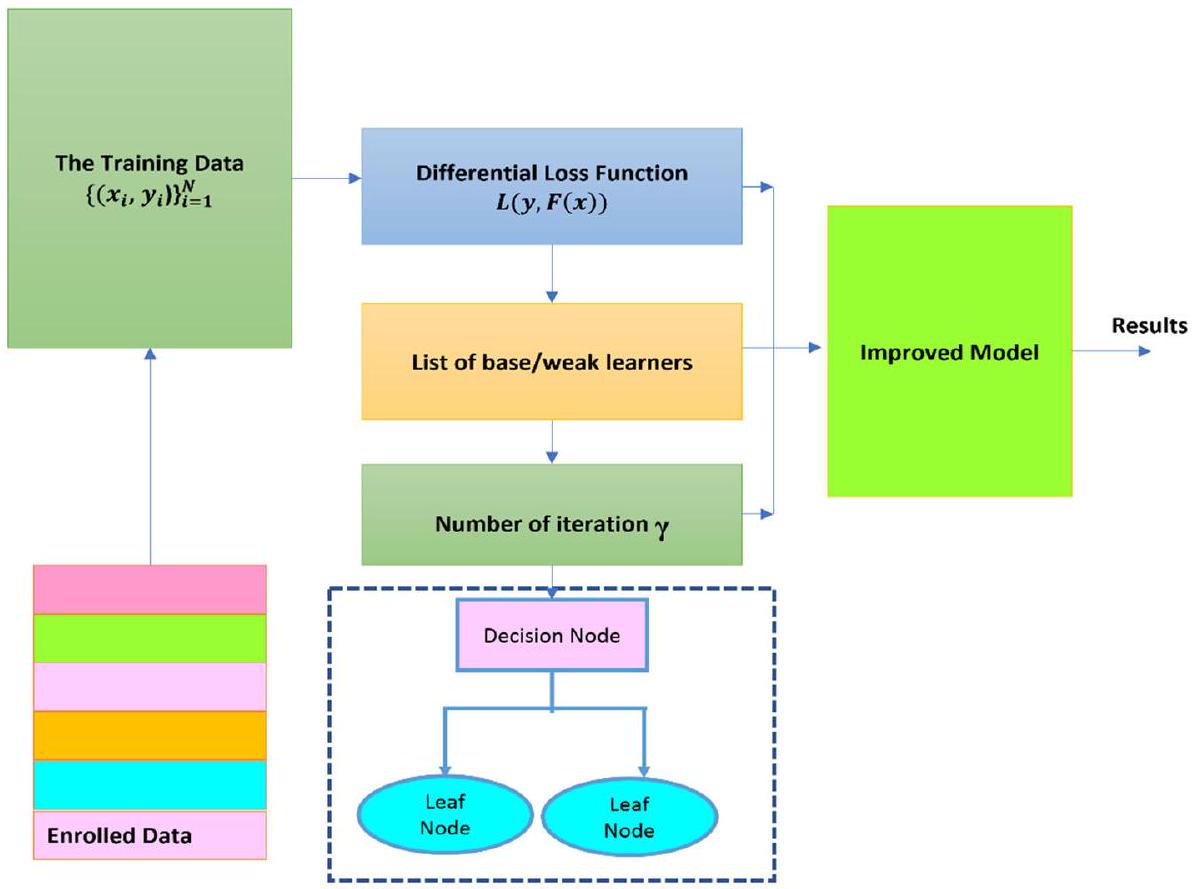
the GB provide more accurate prediction results by fit and update the new model parameters. Hence, a new base leaner is constructed and improve the negative gradient results from loss function related to the whole ensemble [35, 36].
As the model improves, the weak learners are fitted in such a way that each new learner fits into the residuals of the preceding stage. The final model aggregates the results of each phase, resulting in a strong learner. The residuals are detected using a loss function. Mean Squared Error (MSE), for example, can be utilized for regression tasks,
- Input:
    - Selected Features
- Output:
    - Trained Model
- Steps:
    # Load dataset
    dataset = load_dataset()
# Split dataset into training and testing sets
train_set, test_set $=$ split_dataset(dataset)
# Prepare input data for decision tree model
input_data $=$ prepare_input_data(train_set, relevant_features)
# Train decision tree model
model $=$ train_decision_tree(input_data)
# Test model accuracy
accuracy $=$ test_model(model, test_set)
# Evaluate model performance
performance_metrics $=$ evaluate_performance(model, test_set)

3.4 Hyperparameters tuning

The hyperparameters of the proposed model can be tuned using Gradient Boosting (GB), Decision Tree (DT), Random Forest (RF), Gaussian Naïve Bayes (GNB), and Multimodal Naïve Bayes (MNB).
In the gradient boosting, the model trained in sequential manner by minimizing the loss function of the whole system using Gradient Decent (GD) optimizer. Therefore,
while logarithmic loss (log loss) can be used for classification tasks. It is worth mentioning that when a new tree is added to the model, the current trees do not alter as shown in Fig. 2. The decision tree that was introduced fits the residuals from the present model [37].
Hyperparameters are crucial elements of machine learning algorithms that can affect a model’s accuracy and performance. In gradient boosting decision trees, two important hyperparameters are learning rate and
Fig. 2 The general block diagram of Gradient Boosting algorithm
Fig. 3 The general structure of Decision Tree
estimators. The learning rate, denoted as , controls the speed at which the model learns. Each new tree changes the overall model, and the learning rate determines the magnitude of this change. A lower learning rate leads to slower learning, which benefits the model by making it more robust and efficient. Slower learning models have been shown to outperform faster ones in statistical learning. However, slower learning has a cost; it takes longer to train the model, which leads us to the next important hyperparameter. The number of trees used in the model is represented by n estimators. If the learning rate is low, more trees need to be trained. However, caution must be exercised when determining the number of trees to use. Using
too many trees increases the risk of overfitting, which can lead to poor generalization performance of the model [38].
The Decision Tree (DT) technique is a supervised learning method that can be used for classification and regression tasks, and it is nonparametric. The DT has a hierarchical structure, which consists of a root node, internal nodes, branches, and leaf nodes. By performing a greedy search to identify the optimal split points in a tree, DT learning uses a divide and conquer approach. This splitting process is repeated recursively from top to bottom until all or most of the entries are categorized into specific class labels, as depicted in Fig. 3. The complexity of the decision tree determines whether all data points are
Fig. 4 The general block diagram of Random Forest
grouped into homogeneous sets. Smaller trees can easily achieve pure leaf nodes, or data points in a single class. However, as the tree becomes larger, it becomes increasingly difficult to maintain this purity, which often leads to too little data falling under a specific subtree, a phenomenon known as data fragmentation, and frequently results in overfitting. Pruning is a common technique used to reduce complexity and prevent overfitting. It involves removing branches that divide on attributes of low value. The model’s accuracy can be assessed using the crossvalidation method. Another approach to ensure the accuracy of decision trees is to create an ensemble using the Random Forest algorithm, which produces more precise predictions, especially when the individual trees are uncorrelated with one another [39, 40].
Random Forest (RF) is a machine learning algorithm that falls under the category of supervised learning and is widely used for regression and classification tasks. It creates decision trees on various samples of data and then combines them through a majority vote in classification and averaging in regression. One of the key advantages of the RF algorithm is its ability to handle datasets that have both continuous and categorical variables, making it suitable for both regression and classification problems. The algorithm has shown to produce superior results in classification tasks, as depicted in Fig. 4 [41, 42].
Classical Naive Bayes is suitable for categorical data and models them as following a Multinomial Distribution. Gaussian Naive Bayes, on the other hand, is appropriate for continuous features and models them as following a Gaussian (normal) distribution. When dealing with completely categorical data, the conventional Naive Bayes classifier suffices, whereas the Gaussian Naive Bayes classifier is appropriate for data sets containing only continuous features. If the data set has both categorical and continuous characteristics, two options are available: discretizing the continuous features using bucketing or a similar technique or using a hybrid Naive Bayes model. Unfortunately, the conventional machine learning packages do not seem to offer such a model. In this study, we utilized continuous data, thus we employed GNB for our analysis. [43, 44].
Multinomial Naive Bayes is a probabilistic learning approach that uses the Bayes theorem to calculate the likelihood of each tag for a given sample and selects the tag with the highest likelihood. The approach assumes that each feature being categorized is independent of any other feature, meaning that the presence or absence of one feature has no impact on the presence or absence of another. Naive Bayes is a powerful tool for analyzing text input and addressing multi-class problems. To apply the Naive Bayes theorem, one must first understand the Bayes theorem developed by Thomas Bayes, which estimates the likelihood of an event based on prior knowledge of its circumstances. Specifically, it computes the likelihood of class A when predictor B is provided. [45, 46].

3.5 XAI integration module

The XAI Integration phase of the XAI-CROP algorithm uses Local Interpretable Model-agnostic Explanations (LIME) to provide clear explanations for the recommendations made by the XAI-CROP model. XAI Integration phase consists of six main steps as depicted in Algorithm 4: (i) Load the XAI-CROP model. (ii) Select a sample from the validation dataset for which to generate an explanation. (iii) Generate perturbations of the selected sample to create a dataset for local model training. (iv) Train a linear regression model on the perturbed dataset. (v) Calculate the weight of each feature in the local model. (vi) Generate an explanation by highlighting the features that contribute the most to the XAI-CROP model’s prediction for the selected sample.

Algorithm 4 XAI Integration Algorithm

  • Steps:
    # Load the XAI-CROP model
    xai_crop_model load_model(‘xai_crop_model.h5’)
    # Select a sample from the validation dataset for which to generate an explanation
    sample validation_dataset.sample()
    # Generate perturbations of the selected sample to create a dataset for local model training
    perturbed_dataset generate_perturbations(sample, num_perturbations)
    # Train a linear regression model on the perturbed dataset
    local_model train_linear_regression(perturbed_dataset)
    # Calculate the weight of each feature in the local model
    weights calculate_feature_weights(local_model)
    # Generate an explanation by highlighting the features that contribute the most to the
    XAI-CROP model’s prediction for the selected sample
    explanation generate_explanation(sample, weights)
    the robustness and reliability of the model’s predictions, while also facilitating the interpretability and explainability of the results.

3.6 Validation module

The Validation phase of the XAI-CROP algorithm is a
Algorithm 5 Validation Algorithm crucial component, encompassing three main steps that are depicted in Algorithm 5. These steps are designed to ensure
  • Input:
  • Trained Model
  • Output:
  • Performance Metrics
  • Steps:
    function validate(XAI-CROP model, validation dataset)
    # Step 3a
    validation_features, validation_target separate_features_target(validation dataset)
    # Step 3b
    predicted_crop_yield XAI-CROP model.predict(validation_features)
    # Step 3d
    rmse mean
    mae mean(abs(validation_target – predicted_crop_yield))
    – sum((validation_target – predicted_crop_yield)^2) / sum((validation_target –
    mean(validation_target))^2)
    # Step 3e
    return rmse, mae, r2

4 Implementation and evaluation

This section presents an overview of the datasets used, performance metrics employed, and evaluation methodology adopted.

4.1 Software

In this study, various software tools were used, such as the Python programming language, LIME library for explainable AI, Pandas library for data manipulation and analysis, and Scikit-learn library for machine learning models and evaluation metrics. The choice of Python as the programming language was based on its versatility, user-friendliness, and the availability of numerous libraries for data analysis and machine learning. LIME was utilized to improve the interpretability of the machine learning models used in the study, allowing researchers to comprehend how these models generate predictions.

4.2 Crop yield dataset

The Crop Yield dataset [47] used in this study provides valuable information about crop cultivation in India. This dataset was used to develop a crop recommendation system to assist farmers in selecting the most appropriate crop for their location, season, and other relevant factors. The dataset contains several important columns including location, season, and production per square kilometer, area, and crop. These features are crucial in predicting the appropriate crop to be cultivated in a particular region based on historical data. The dataset is important for machine learning applications in agriculture, as it provides a reliable and relevant source of data for training and validation of models.

4.3 Performance metrics

To evaluate the performance of the proposed algorithm for predicting the Spending Score, we use three common regression metrics: Mean Squared Error (MSE), Mean Absolute Error (MAE), and R-squared.
Fig. 6 Correlation matrix
i. Mean Squared Error (MSE): MSE measures the average squared difference between the predicted and actual spending scores. MSE can be calculated as in Eq. (1).

ii. Mean Absolute Error (MAE): MAE measures the average absolute difference between the predicted and actual spending scores. MAE can be calculated as in Eq. (2).

iii. R-squared: R-squared is a statistical measure representing the proportion of variance in the dependent variable explained by the independent variables. R-squared can be calculated as in Eq. (3).
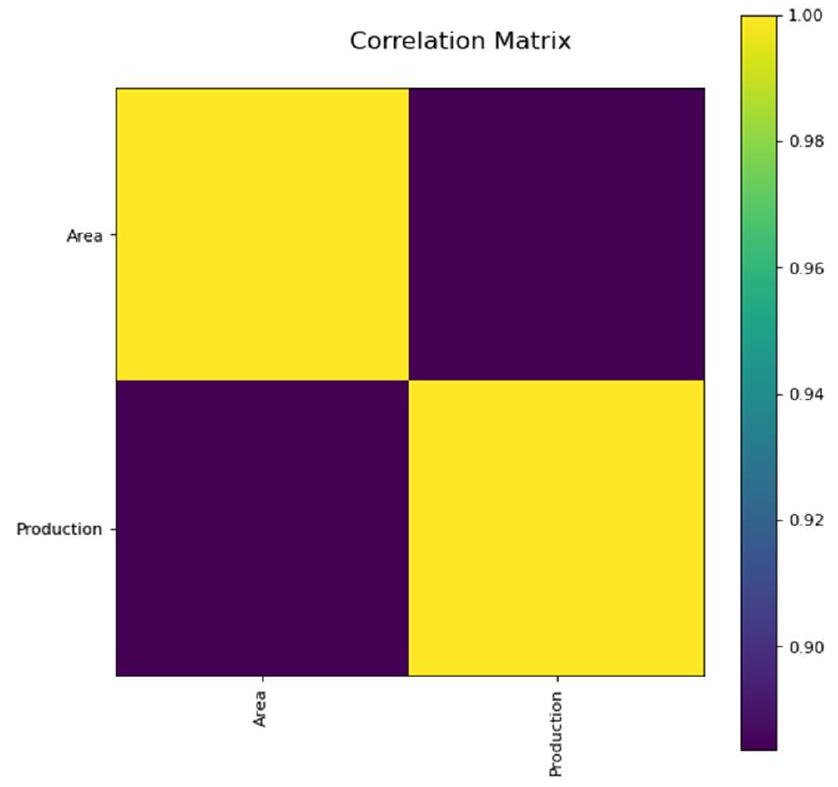
Fig. 5 A sample of the used dataset
District_Name Season Area Production Crop
0 NORTH AND MIDDLE ANDAMAN Rabi 294.5 90.8 Tur
1 SOUTH ANDAMANS Rabi 20.5 13.2 Tur
2 ANANTAPUR Kharif 21400.0 2600.0 Tur
3 ANANTAPUR Kharif 27400.0 9100.0 Tur
4 ANANTAPUR Kharif 30693.0 7888.0 Tur
Fig. 7 Scatter and density plots
where n is the number of samples, pred is the predicted Spending Score, and y_actual is the actual Spending Score [48, 49].

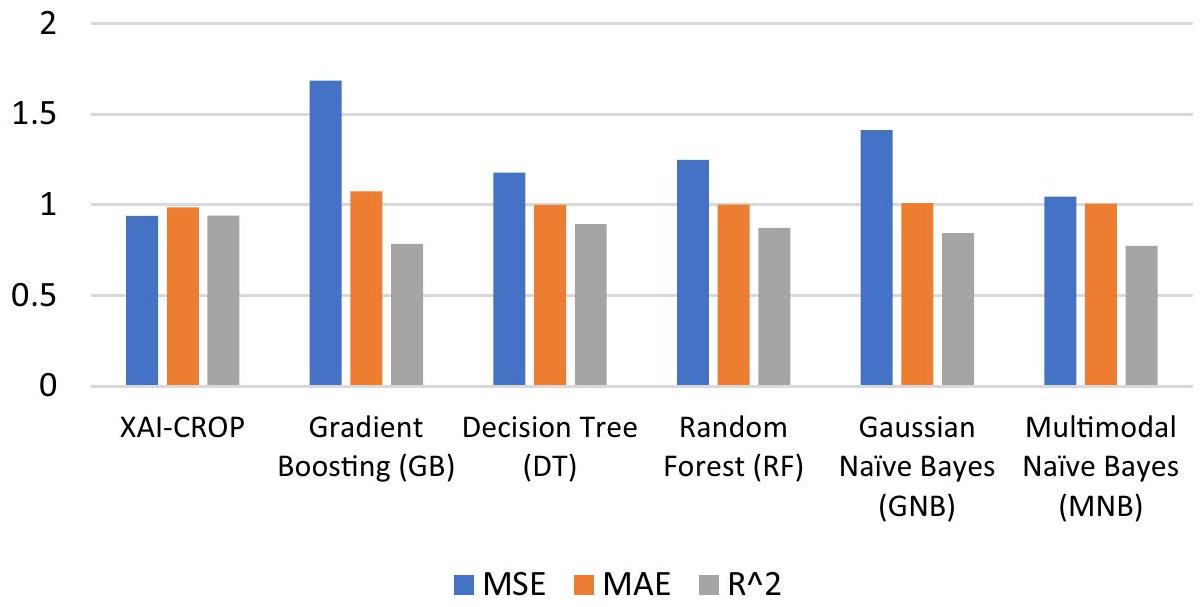
4.4 Performance evaluation

Figure 5 illustrates a sample of the used dataset, providing a visual representation of the data points utilized in the research. This sample demonstrates the characteristics and distribution of the dataset, showcasing the different features and their corresponding values. By examining this figure, researchers and practitioners can gain insights into the composition and variability of the dataset, which is crucial for understanding the underlying patterns and trends.
Figure 6 presents the correlation matrix, offering a comprehensive depiction of the interrelationships between the various features in the dataset. The correlation matrix enables the identification of potential dependencies,
Table 2 Comparative Analysis of XAI-CROP and Preceding Models
Model MSE MAE R^2
XAI-CROP 0.9412 0.9874 0.94152
Gradient Boosting (GB) 1.6861 1.0745 0.78521
Decision Tree (DT) 1.1785 1.0002 0.8942
Random Forest (RF) 1.2487 1.0015 0.8745
Gaussian Naïve Bayes (GNB) 1.4123 1.0098 0.8456
Multimodal Naïve Bayes (MNB) 1.0452 1.0078 0.77521
associations, or redundancies among the attributes. This visualization aids in assessing the strength and direction of these relationships, thereby assisting researchers in identifying relevant variables and guiding feature selection or engineering processes. Understanding the correlation matrix is essential for comprehending the impact and significance of individual features on the overall prediction or diagnosis task.
Figure 7 showcases scatter and density plots, providing a graphical representation of the data distribution and relationships between specific attributes or variables. Scatter plots display the relationship between two variables, illustrating how changes in one variable correspond to changes in another. This visualization aids in identifying patterns, trends, clusters, or outliers in the data. Density plots, on the other hand, depict the probability density of a variable’s values, allowing researchers to assess the distribution shape, skewness, or multimodality. These plots provide valuable insights into the underlying data structure, enabling researchers to make informed decisions regarding data preprocessing, model selection, or algorithm customization.
The inclusion of these figures in the research paper enhances the clarity and comprehensibility of the findings. They provide visual representations of the dataset’s characteristics, interrelationships among variables, and data distribution, offering readers a comprehensive understanding of the research methodology and its implications. Furthermore, these figures facilitate the reproducibility of the research, enabling other researchers to validate the results and potentially build upon the proposed methodology.
Table 2 presents a comprehensive comparison of the results obtained from the proposed XAI-CROP model with those of previous models employed in the research. This table provides a structured and quantitative analysis of various evaluation metrics such as accuracy, precision, recall, F1-score, and any other relevant performance indicators. By comparing the performance of the proposed XAI-CROP model with previous models, researchers and readers gain valuable insights into the improvements achieved and the effectiveness of the proposed approach. This comparative analysis serves as a benchmark for assessing the advancements made in diagnosis prediction for power transformers and highlights the superiority of the XAI-CROP model in terms of predictive accuracy and reliability.
Figure 8 complements the findings presented in Table 2 by visually illustrating the performance comparison between the proposed XAI-CROP model and the previous models. This graphical representation allows for a quick and intuitive understanding of the performance disparities among the different models. It may include bar charts, line
Fig. 8 Comparative Analysis of XAI-CROP and Preceding Models
graphs, or any other suitable visualization techniques to highlight the variations in accuracy, precision, recall, or other relevant metrics. Figure 8 serves as a visual aid for researchers and readers to grasp the significance of the proposed XAI-CROP model and the improvements it offers over the existing approaches. This figure enhances the communication of research findings and reinforces the credibility and validity of the proposed methodology.
The inclusion of Table 2 and Fig. 8 in the research paper empowers readers to make informed comparisons and draw conclusions based on the presented empirical evidence. These figures contribute to the overall clarity and transparency of the research by providing a comprehensive overview of the performance enhancements achieved by the proposed XAI-CROP model. Additionally, they emphasize the practical implications of the research, highlighting the potential impact and benefits it brings to the field of power transformer diagnosis prediction.
Figure 9 displays the R2 convergence curves generated by the lime-based model for each individual model under evaluation. These convergence curves provide valuable insights into the model’s performance and its ability to capture the underlying patterns and relationships in the dataset.
The R2 convergence curve illustrates the convergence behavior of the lime-based model during the training process. It plots the R2 score, also known as the coefficient of determination, on the -axis against the number of iterations or epochs on the x-axis. The R2 score represents the proportion of the variance in the target variable that can be explained by the model. A higher R2 score indicates a better fit of the model to the data and a greater ability to make accurate predictions.
By examining the R2 convergence curves for each model, researchers and readers can assess the training dynamics and performance stability of the lime-based model. These curves provide insights into the model’s
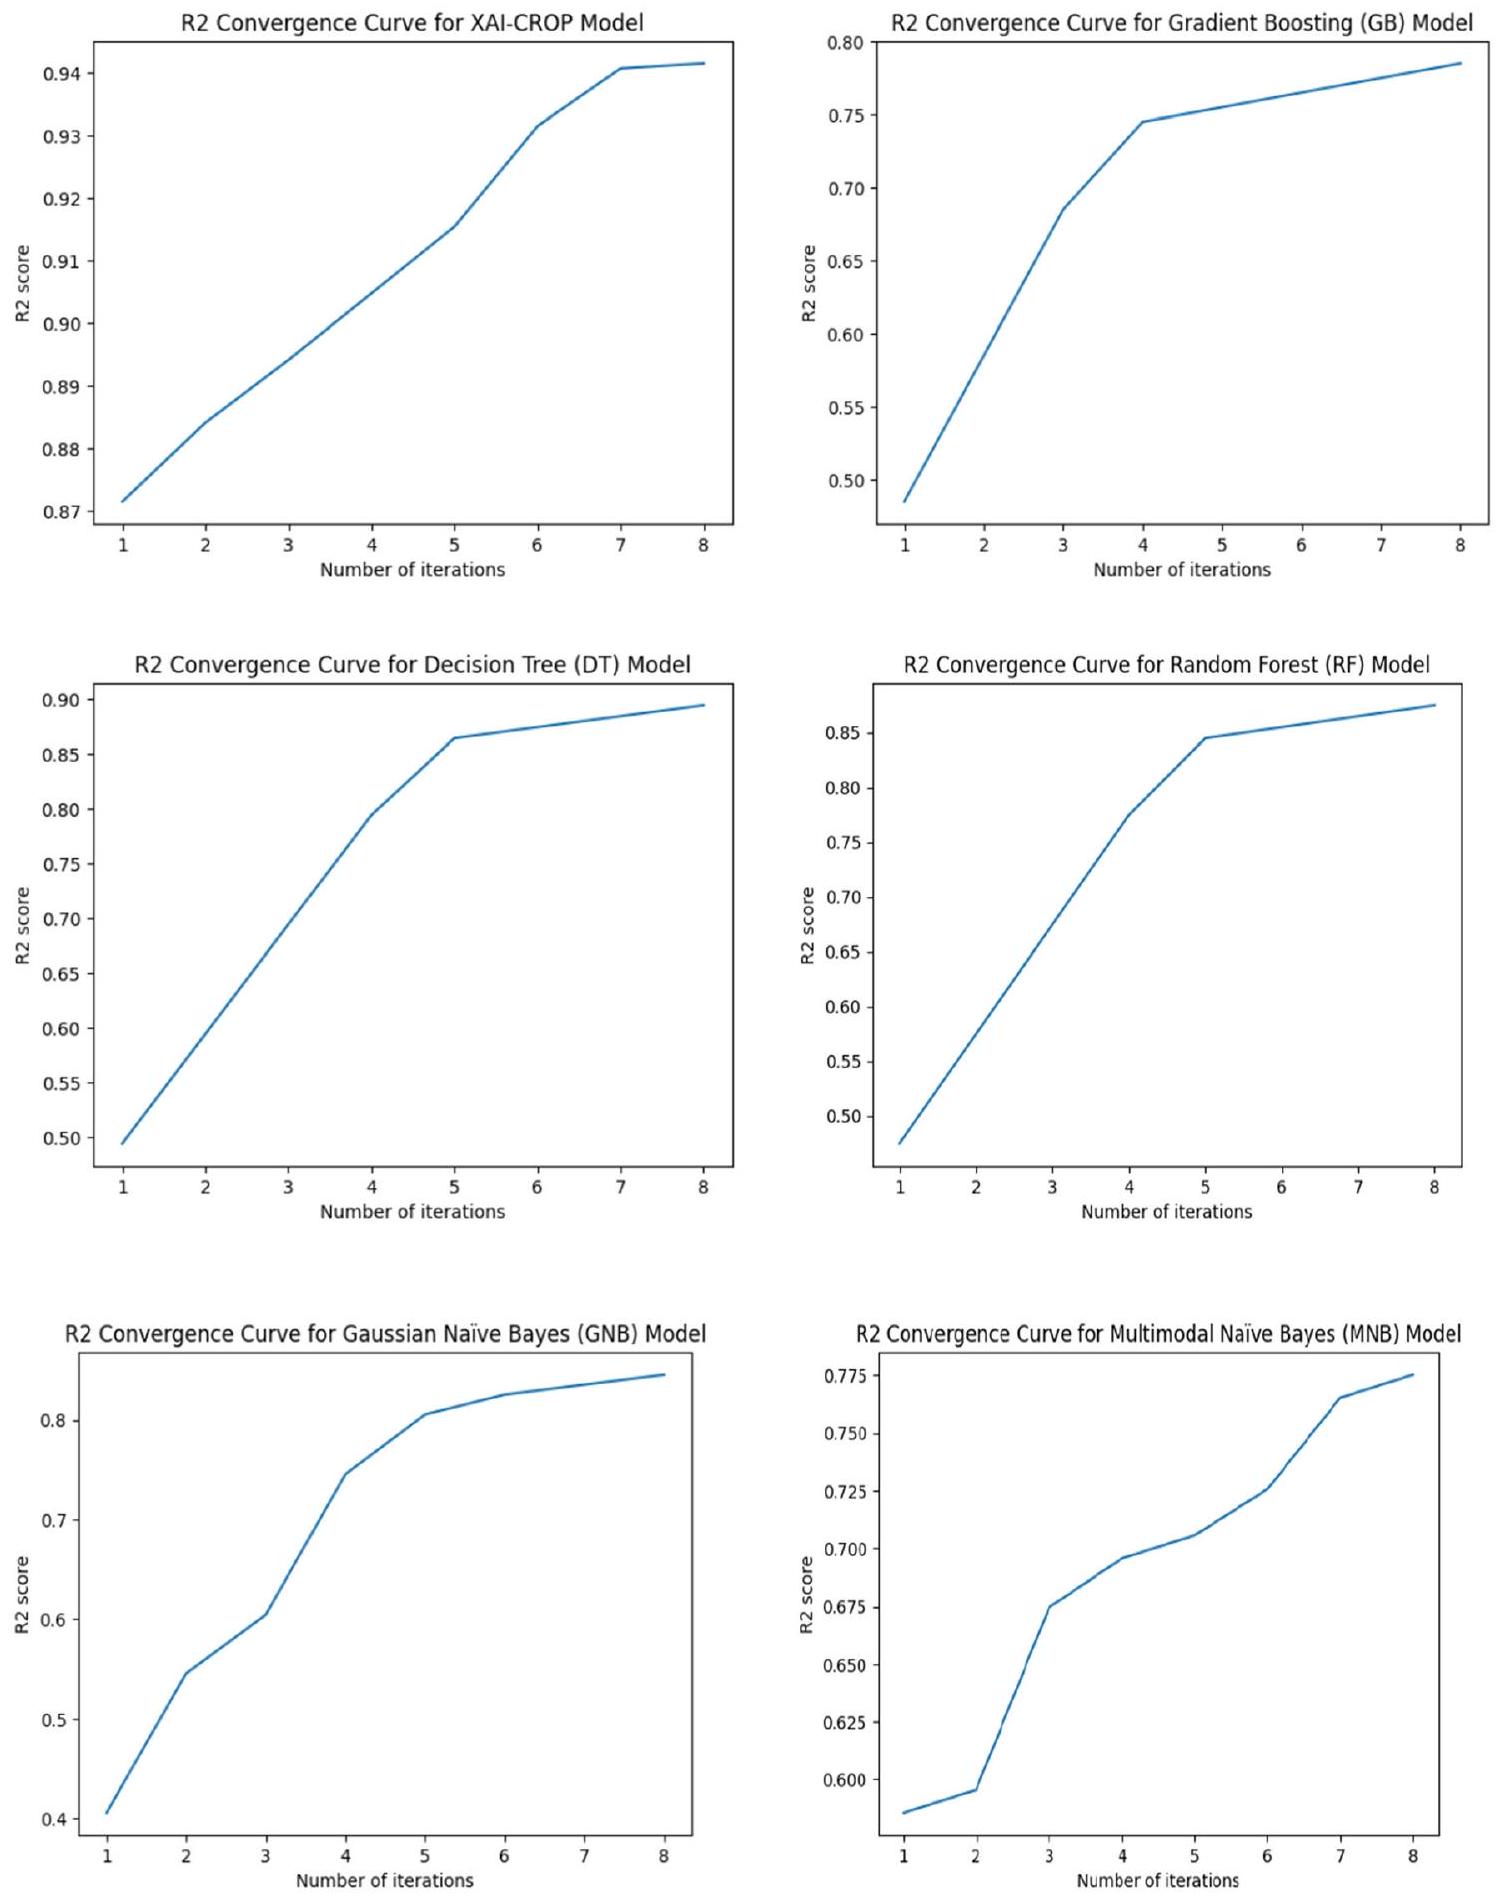
learning progress, convergence speed, and potential for overfitting or underfitting. Patterns such as convergence plateaus, fluctuations, or rapid improvements in the R2 score can be observed and analyzed, aiding in the evaluation and comparison of the models.
The inclusion of Fig. 9 in the research paper reinforces the transparency and reproducibility of the experimentation process. It allows readers to visualize the performance of the lime-based model and gain a deeper understanding of its training dynamics. Additionally, these convergence curves serve as supporting evidence for the efficacy and reliability of the lime-based model in capturing the complex relationships within the dataset, enabling accurate prediction and interpretation.
Overall, Fig. 9 provides a concise and informative summary of the R2 convergence curves generated by the lime-based model, offering crucial insights into the model’s training behavior and performance. It strengthens the research findings and facilitates a comprehensive understanding of the lime-based model’s effectiveness for the specific task at hand.

5 Results discussion

The performance of the XAI-CROP model was compared to several other machine learning models, including Gradient Boosting (GB), Decision Tree (DT), Random Forest (RF), Gaussian Naïve Bayes (GNB), and Multimodal Naïve Bayes (MNB). The performance of each model was evaluated using three metrics: Mean Squared Error (MSE), Mean Absolute Error (MAE), and R-squared (R2).
The XAI-CROP model outperformed all other models in terms of MSE, with a value of 0.9412 , which indicates that the model had the smallest errors in predicting crop yield. The MAE for XAI-CROP was 0.9874 , indicating that, on average, the model had an error of less than 1 in predicting
Fig. 9 R2 convergence curve for each model
crop yield. Finally, the R2 value for XAI-CROP was 0.94152 , indicating that the model explains of the variability in the data.
Comparatively, the Decision Tree model had the sec-ond-best performance, with an MSE of 1.1785, MAE of 1.0002, and R2 of 0.8942 . The Random Forest and
Gaussian Naïve Bayes models performed similarly, with an MSE of 1.2487 and 1.4123, respectively, and an MAE of 1.0015 and 1.0098, respectively. The Multimodal Naïve Bayes model had the highest R2 value among all models, with a value of 0.77521 .
Overall, the XAI-CROP model showed superior performance compared to the other models in predicting crop yield. The LIME technique used in the XAI-CROP model provided interpretable explanations for the model’s predictions, enabling researchers to understand how the model makes recommendations. The results of this study demonstrate the effectiveness of XAI-CROP as a tool for crop recommendation systems in agriculture. The main difference between the current study introduced by Ryo [50] and Doshi et al. [51] and our proposed model is investigated as follows:
Ryo [50] discussed the increasing use of artificial intelligence and machine learning in agriculture for prediction purposes. They highlight the issue of black box models, which lack explainability and make it difficult to understand the reasoning behind predictions. The author introduces eXplainable artificial intelligence (XAI) and interpretable machine learning as solutions to this problem. They demonstrate the usefulness of these methods by applying them to a dataset related to the impact of notillage management on crop yield.
The analysis reveals that no-tillage can increase maize crop yield under specific conditions. The author emphasizes the importance of answering key questions related to prediction variables, interactions, associations, and underlying reasons. They argue that current practices focus too heavily on model performance measures and overlook these crucial questions, and suggest that XAI and interpretable machine learning can enhance trust and explainability in AI. While Doshi et al. [51] focused on the importance of agriculture in the Indian economy and the heavy reliance of the population on farming.
The author notes that many farmers rely on traditional farming patterns without considering the impact of presentday weather and soil conditions on crop growth. They propose using Big Data Analytics and Machine Learning to address this issue and present AgroConsultant, an intelligent system designed to assist Indian farmers in making informed decisions about crop selection based on various factors such as sowing season, geographical location, soil characteristics, temperature, and rainfall. The proposed model introduces crop recommendation systems as valuable tools for farmers to optimize yields by providing personalized recommendations based on data such as soil characteristics, historical crop performance, and weather patterns.
The study presents XAI-CROP, an algorithm that leverages eXplainable artificial intelligence principles to offer transparent and interpretable recommendations. The algorithm is compared to other machine learning models, and performance evaluation metrics such as Mean Squared Error, Mean Absolute Error, and R-squared are used. The results highlight the superior performance of XAI-CROP,
with low error rates and a high R -squared value indicating its accuracy and interpretability in explaining the data’s variability.
For future directions, we can adapt the proposed model to investigate the effect of XAI especially in optimization tasks [52], Natural language processing (NLP) [53], and supply chain [54].
Assumptions: In the course of our research, we have laid out several foundational assumptions that underpin our study. These assumptions are fundamental in shaping the methodology and outcomes of our research. Firstly, we operate under the assumption that the historical crop yield data at our disposal is both accurate and representative of the agricultural conditions in the regions under study. Additionally, we assume the soil type and weather data collected to be reliable and reflective of the actual conditions on the ground. Furthermore, we assume that the relationships between these factors and crop yield remain relatively stable over time, thus permitting the development of predictive models. These assumptions are pivotal to the feasibility and accuracy of our research.
Beneficiaries and benefits: Our paper stands to confer significant advantages upon a diverse array of stakeholders within the agricultural domain.
Farmers: Foremost among the beneficiaries are individual farmers. By implementing the XAI-CROP system, farmers can access tailored crop recommendations specifically adapted to their geographical location, soil conditions, and historical data. This has the potential to significantly elevate crop yields, minimize resource wastage, and augment overall profitability for individual farmers.
Agricultural managers and decision-makers: Agricultural managers and decision-makers can glean invaluable insights from our research. It equips them with a potent tool to optimize the allocation of resources and streamline decision-making processes. By harnessing the power of XAI-CROP, they can make judicious choices regarding crop cultivation, resource management, and the timing of measures to mitigate adverse weather conditions or diseases. Consequently, this holds the promise of enhancing the productivity and sustainability of agricultural operations on a broader scale.
Researchers and academics: Beyond its immediate applications, our paper contributes substantively to the expanding body of knowledge concerning the application of eXplainable artificial intelligence in agriculture. Researchers and academics can utilize our findings as a foundation for subsequent studies and innovations in crop recommendation systems. This burgeoning research field holds immense potential for further developments, and our
work serves as a pivotal stepping stone for future advancements.
Value to managers: Our research yields considerable value for agricultural managers by furnishing data-driven insights and recommendations. In practice, managers can harness the capabilities of XAI-CROP to:
Optimize resource allocation: By selecting the most apt crops based on local conditions, managers can efficiently distribute resources such as water, fertilizers, and labor. This, in turn, translates to cost savings and heightened sustainability.
Enhance decision-making: XAI-CROP provides transparent and interpretable recommendations, significantly diminishing uncertainty in decision-making. Managers can confidently rely on these insights to make informed choices that align with their objectives.
Augment agricultural productivity: The potential for amplified crop yields through our system directly impacts profitability. Managers can anticipate elevated returns on investments and improved food security within their regions.
Suggestions for managers: To unlock the full potential of our research, we proffer several recommendations for agricultural managers:
Regular data updates: Implementing a mechanism for periodic data updates is paramount. This ensures the XAICROP model remains precise and up-to-date. The integration of fresh data pertaining to crop performance, weather patterns, and soil conditions is essential for maintaining the system’s reliability.
Promotion of a data-driven culture: Cultivating a culture of data-driven decision-making within agricultural management teams is conducive to seamless integration of XAI-CROP into existing practices. This may necessitate training personnel to proficiently utilize the system and fostering collaboration between data scientists and agricultural experts.
Collaboration and knowledge sharing: Collaborative synergy among stakeholders, encompassing farmers, researchers, and governmental bodies, is advisable. Facilitating knowledge exchange and shared experiences can expedite the adoption of our system and its customization to various agricultural regions and challenges.
Interpretation of results: Although you have given a summary of the model’s functionality and how it compares to other models, you might want to go into further detail when interpreting the findings. Give an explanation of why XAI-CROP performed better than the other models and an explanation of the factors that led to its higher R2 values, lower MSE, and lower MAE. This can make it easier for the reader to comprehend your model’s advantages.
Useful use cases: Describe particular situations in which the XAI-CROP model can be put to use. You could,
for example, explain how a farmer’s decision-making process could incorporate the model. This could entail a comprehensive explanation of how the model’s suggestions are implemented in the real world or a step-by-step manual.

6 Several real-world implications can be done in the real world such as:

  1. Precision Agriculture: The proposed model can be utilized to provide personalized crop recommendations to farmers based on factors such as soil quality, weather conditions, historical data, and specific crop requirements. This can help optimize resource allocation, improve crop yield, and minimize environmental impact by reducing the use of fertilizers and pesticides.
  2. Sustainable Farming Practices: By incorporating explainable AI into crop recommendation systems, the proposed model can assist farmers in adopting sustainable farming practices. It can provide insights into the ecological impact of different crop choices and recommend environmentally friendly strategies, such as crop rotation or intercropping, to enhance soil health and biodiversity preservation.
  3. Climate Change Adaptation: With climate change affecting agricultural productivity and patterns, the proposed model can aid farmers in adapting to changing conditions. By analyzing historical climate data and incorporating predictive models, it can generate recommendations for resilient crop choices that are better suited to withstand extreme weather events or shifting climate patterns.
  4. Small-Scale Farming Support: Small-scale farmers often face unique challenges in terms of limited resources and access to information. The proposed model can offer tailored crop recommendations and provide valuable insights to support decision-making for small-scale farmers, helping them maximize their productivity and profitability.
  5. Decision Support for Agricultural Advisors: Agricultural advisors and consultants can utilize the proposed model to provide expert recommendations to farmers. By incorporating explainable AI, the model can transparently present the underlying reasoning and justifications for specific crop recommendations, enabling advisors to effectively communicate and gain trust from farmers.

7 Conclusion

In this study, we developed XAI-CROP, a crop recommendation system that leverages machine learning and eXplainable artificial intelligence techniques. Through extensive training and evaluation on a dataset encompassing crop cultivation in India, we demonstrated the superior performance of XAI-CROP compared to other machine learning models. Our results showcased its higher accuracy, as indicated by lower Mean Squared Error (MSE), Mean Absolute Error (MAE), and higher R-squared (R2) value.
The key innovation of XAI-CROP lies in its ability to provide interpretable explanations for its recommendations. By incorporating eXplainable artificial intelligence (XAI) techniques such as LIME, XAI-CROP demystifies the decision-making process, making it transparent and understandable for farmers and agricultural stakeholders. This transparency not only enhances the system’s usability but also builds trust and confidence among end-users by enabling them to comprehend the rationale behind the recommended crop choices.
Moreover, XAI-CROP holds profound implications for real-world applications, particularly in the context of precision agriculture and data-driven farming. By factoring in geographical location, seasonal variations, and historical data, XAI-CROP empowers users to make informed decisions regarding crop selection. This capability contributes to improved crop yield predictions, optimized resource allocation, and ultimately, enhanced food security in agricultural regions. The physical relevance of XAI-CROP is further highlighted by its compatibility with different geographical locations, scalability to various crops, and potential integration with state-of-the-art techniques. By considering these aspects, our model demonstrates its potential to address diverse agricultural challenges and play a pivotal role in sustainable and efficient crop cultivation worldwide.
In conclusion, XAI-CROP has the potential to revolutionize the agricultural sector by enabling farmers to make data-driven decisions, leading to increased crop yields and improved food security. Our study underscores the importance of utilizing machine learning and explainable AI techniques in the development of practical and effective crop recommendation systems. Future research can focus on enhancing the accuracy and scalability of XAI-CROP, extending its application to other regions and crops, and exploring integration with state-of-the-art techniques to further advance agricultural decision support. By bridging the gap between advanced technology and the physical world of agriculture, XAI-CROP represents a significant step forward in enabling farmers to navigate the
complexities of modern farming and make informed choices for sustainable and efficient crop cultivation. It is our hope that this research contributes to the advancement of agricultural practices worldwide, promoting food security and environmental sustainability.
In the future, the proposed algorithm can be used with OCNN [55-58] and make use of Resnet [59]. Attention mechanism can be used as in [60] and correlation algorithms as in [61]. YOLO v8 can be used as in [62]. Additionally, future work can explore the integration of XAI-CROP with state-of-the-art techniques such as those demonstrated in references [63-71], offering even more sophisticated capabilities for financial decision support.
Author contributions It is a collaborative effort where Mahmoud, Fatma and Samah worked together. Fatma came up with the idea and wrote the abstract and the proposal, while Samah contributed by making comparisons and made the experiments. Mahmoud wrote the introduction and the related work.
Funding Open access funding provided by The Science, Technology & Innovation Funding Authority (STDF) in cooperation with The Egyptian Knowledge Bank (EKB). The authors received no specific funding for this study.

Declarations

Conflict of interests The authors declare that they have no conflicts of interest to report regarding the present study.
Ethical approval There is no any ethical conflicts.
Open Access This article is licensed under a Creative Commons Attribution 4.0 International License, which permits use, sharing, adaptation, distribution and reproduction in any medium or format, as long as you give appropriate credit to the original author(s) and the source, provide a link to the Creative Commons licence, and indicate if changes were made. The images or other third party material in this article are included in the article’s Creative Commons licence, unless indicated otherwise in a credit line to the material. If material is not included in the article’s Creative Commons licence and your intended use is not permitted by statutory regulation or exceeds the permitted use, you will need to obtain permission directly from the copyright holder. To view a copy of this licence, visit http://creativecommons. org/licenses/by/4.0/.

References

  1. Bhadouria R, et al. (2019) Agriculture in the era of climate change: Consequences and effects. In Climate Change and Agricultural Ecosystems, Elsevier, 1-23.
  2. Xu X et al (2019) Design of an integrated climatic assessment indicator (ICAI) for wheat production: a case study in Jiangsu Province, China. Ecol Ind 101:943-953
  3. Bali N, Singla A (2021) Deep learning based wheat crop yield prediction model in punjab region of north india. Appl Artif Intell 35(15):1304-1328
  4. Van Klompenburg T, Kassahun A, Catal C (2020) Crop yield prediction using machine learning: A systematic literature review. Comput Electron Agric 177:105709
  5. Alpaydin E (2020) Introduction to machine learning. MIT press.
  6. Tarek Z et al (2023) Soil erosion status prediction using a novel random forest model optimized by random search method. Sustainability 15(9):9. https://doi.org/10.3390/su15097114
  7. Shams MY, Tarek Z, Elshewey AM, Hany M, Darwish A, Hassanien AE (2023) A machine learning-based model for predicting temperature under the effects of climate change. In: The Power of Data: Driving Climate Change with Data Science and Artificial Intelligence Innovations, A. E. Hassanien and A. Darwish, Eds., in Studies in Big Data. Cham: Springer Nature Switzerland, 2023: 61-81. https://doi.org/10.1007/978-3-031-22456-0_4.
  8. Elshewey AM et al (2023) A novel WD-SARIMAX model for temperature forecasting using daily Delhi climate dataset. Sustainability 15(1):1. https://doi.org/10.3390/su15010757
  9. Porter JR, Xie L, Challinor AJ, Cochrane K, Howden SM, Iqbal MM, Lobell DB, Travasso MI (2014) Food security and food production systems. Part A: Global and Sectoral Aspects. Contribution of Working Group II to the Fifth Assessment Report of the Intergovernmental Panel on Climate Change, 1(1): 485-533 (2014).
  10. Rosenzweig C et al (2013) The agricultural model intercomparison and improvement project (AgMIP): protocols and pilot studies. Agric For Meteorol 170:166-182
  11. Khater HA, Gamel SA (2023) Early diagnosis of respiratory system diseases (RSD) using deep convolutional neural networks. J Ambient Intell Human Comput 14:12273-12283
  12. Lobell DB, Asseng S (2017) Comparing estimates of climate change impacts from process-based and statistical crop models. Environ Res Lett 12(1):015001
  13. Schlenker W, Roberts MJ (2009) Nonlinear temperature effects indicate severe damages to US crop yields under climate change. Proc Natl Acad Sci 106(37):15594-15598
  14. Roberts MJ, Braun NO, Sinclair TR, Lobell DB, Schlenker W (2017) Comparing and combining process-based crop models and statistical models with some implications for climate change. Environ Res Lett 12(9):095010
  15. Roberts MJ, Schlenker W, Eyer J (2013) Agronomic weather measures in econometric models of crop yield with implications for climate change. Am J Agr Econ 95(2):236-243
  16. Patel K, Patel HB (2023) Multi-criteria agriculture recommendation system using machine learning for crop and fertilizesrs prediction. Curr Agricult Res J 11(1), 2023.
  17. Mittal N, Bhanja A (2023) Implementation and identification of crop based on soil texture using AI. In: 2023 4th International Conference on Electronics and Sustainable Communication Systems (ICESC), IEEE. 1467-1471.
  18. Fenz S, Neubauer T, Heurix J, Friedel JK, Wohlmuth M-L (2023) AI- and data-driven pre-crop values and crop rotation matrices. Eur J Agron 150:126949. https://doi.org/10.1016/j.eja.2023. 126949
  19. Arif MS, Mukheimer A, Asif D (2023) Enhancing the early detection of chronic kidney disease: a robust machine learning model. Big Data Cognit Comput 7(3):3. https://doi.org/10.3390/ bdcc7030144
  20. Asif D, Bibi M, Arif MS, Mukheimer A (2023) Enhancing heart disease prediction through ensemble learning techniques with hyperparameter optimization. Algorithms 16(6):6. https://doi.org/ 10.3390/a16060308
  21. Nawaz Y, Arif MS, Shatanawi W, Nazeer A (2021) An explicit fourth-order compact numerical scheme for heat transfer of
    boundary layer flow. Energies 14(12):12. https://doi.org/10.3390/ en14123396
  22. Nawaz Y, Arif MS, Abodayeh K (2022) A third-order two-stage numerical scheme for fractional stokes problems: a comparative computational study. J Comput Nonlinear Dyn 17:101004. https://doi.org/10.1115/1.4054800
  23. Nawaz Y, Arif MS, Abodayeh K (2022) An explicit-implicit numerical scheme for time fractional boundary layer flows. Int J Numer Meth Fluids 94(7):920-940. https://doi.org/10.1002/fld. 5078
  24. McEldowney JF (2021) Climate change and the law. In: the impacts of climate change, Elsevier. 503-519.
  25. de Oliveira AC, Marini N, Farias DR (2014) Climate change: New breeding pressures and goals. Encyclopedia Agricult Food Syst 2014:284-293
  26. Williams TO, et al. (2015) Climate smart agriculture in the African context. Unlocking Africa’s Agricultural Potentials for Transformation to Scale, FAO and UNEP, Abdou Diouf International Conference, Dakar, Senegal, pp. 1-26, 2015.
  27. Reddy PS, Amarnath B, Sankari M (2023) Study on machine learning and back propagation for crop recommendation system. In: 2023 International Conference on Sustainable Computing and Data Communication Systems (ICSCDS), IEEE. 1533-1537.
  28. You J, Li X, Low M, Lobell D, Ermon S (2017) Deep gaussian process for crop yield prediction based on remote sensing data. In: Thirty-First AAAI conference on artificial intelligence.
  29. Paudel D et al (2021) Machine learning for large-scale crop yield forecasting. Agric Syst 187:103016
  30. Sun J, Lai Z, Di L, Sun Z, Tao J, Shen Y (2020) Multilevel deep learning network for county-level corn yield estimation in the us corn belt. IEEE J Selected Top Appl Earth Obs
  31. Yoon HS et al (2021) Akkermansia muciniphila secretes a glu-cagon-like peptide-1-inducing protein that improves glucose homeostasis and ameliorates metabolic disease in mice. Nat Microbiol 6(5):5. https://doi.org/10.1038/s41564-021-00880-5
  32. Khaki S, Wang L (2022) Crop Yield Prediction Using Deep Neural Networks. Front Plant Sci 10, 2019, Accessed: Sep. 27, 2022. Available: https://doi.org/10.3389/fpls.2019.00621
  33. Abbas F, Afzaal H, Farooque AA, Tang S (2020) Crop yield prediction through proximal sensing and machine learning algorithms. Agronomy 10(7):7. https://doi.org/10.3390/ agronomy10071046
  34. Talaat FM (2023) Crop yield prediction algorithm (CYPA) in precision agriculture based on IoT techniques and climate changes. Neural Comput Applic. https://doi.org/10.1007/s00521-023-08619-5
  35. Friedman JH (2001) Greedy function approximation: a gradient boosting machine. Ann Stat 29(5):1189-1232
  36. Natekin A, Knoll A (2022) Gradient boosting machines, a tutorial. Front Neurorobotics 7, 2013, Accessed: Sep. 27, 2022. Available: https://doi.org/10.3389/fnbot.2013.00021
  37. Ke G, et al. (2017) LightGBM: A Highly Efficient Gradient Boosting Decision Tree. In: Advances in Neural Information Processing Systems, 2017, 30. Accessed: Sep. 27, 2022. Available: https://proceedings.neurips.cc/paper/2017/hash/ 6449f44a102fde848669bdd9eb6b76fa-Abstract.html
  38. Rao H et al (2019) Feature selection based on artificial bee colony and gradient boosting decision tree. Appl Soft Comput 74:634-642. https://doi.org/10.1016/j.asoc.2018.10.036
  39. Freund Y, Mason L (1999) The alternating decision tree learning algorithm. In: Icml, 1999, 99, pp. 124-133.
  40. Feng J, Yu Y, Zhou Z-H (2018) Multi-Layered Gradient Boosting Decision Trees. In: Advances in Neural Information Processing Systems, 2018, 31. Accessed: Sep. 27, 2022. Available: https:// proceedings.neurips.cc/paper/2018/hash/39027dfad5138c9 ca0c474d71db915c3-Abstract.html
  41. Pretorius A, Bierman S, Steel SJ (2016) A meta-analysis of research in random forests for classification. In: 2016 Pattern Recognition Association of South Africa and Robotics and Mechatronics International Conference (PRASA-RobMech), 2016, pp. 1-6.
  42. Sun C, Li X, Guo R (2021) Research on electrical fire risk assessment technology of cultural building based on random forest algorithm. In: 2021 International Conference on Aviation Safety and Information Technology, New York, NY, USA, Dec. 2021, pp. 769-773. https://doi.org/10.1145/3510858.3511382.
  43. Geenen PL, van der Gaag LC, Loeffen WLA, Elbers ARW (2011) Constructing naive Bayesian classifiers for veterinary medicine: A case study in the clinical diagnosis of classical swine fever. Res Vet Sci 91(1):64-70. https://doi.org/10.1016/j.rvsc. 2010.08.006
  44. Xu S (2018) Bayesian Naïve Bayes classifiers to text classification. J Inf Sci 44(1):48-59. https://doi.org/10.1177/016555151 6677946
  45. Kibriya AM, Frank E, Pfahringer B, Holmes G (2005) Multinomial naive bayes for text categorization revisited. In: AI 2004: Advances in Artificial Intelligence, Berlin, Heidelberg, 2005, pp. 488-499. https://doi.org/10.1007/978-3-540-30549-1_43.
  46. Jiang L, Wang S, Li C, Zhang L (2016) Structure extended multinomial naive Bayes. Inf Sci 329:346-356. https://doi.org/10. 1016/j.ins.2015.09.037
  47. https://www.kaggle.com/datasets/ananysharma/crop-yield.
  48. Elshewey A, Shams M, Tarek Z, Megahed M, El-kenawy E-S, El-dosuky M (2023) Weight prediction using the hybrid stackedLSTM food selection model. CSSE, 46(1): 765-781, 2023, https://doi.org/10.32604/csse.2023.034324.
  49. Shams MY, Elshewey AM, El-kenawy E-SM, Ibrahim A, Talaat FM, Tarek Z (2023) Water quality prediction using machine learning models based on grid search method. Multimed Tools Appl. https://doi.org/10.1007/s11042-023-16737-4
  50. Ryo M (2022) Explainable artificial intelligence and interpretable machine learning for agricultural data analysis. Artif Intell Agricult 6:257-265. https://doi.org/10.1016/j.aiia.2022.11. 003
  51. Doshi Z, Nadkarni S, Agrawal R, Shah N (2018) AgroConsultant: Intelligent crop recommendation system using machine learning algorithms. In: 2018 Fourth International Conference on Computing Communication Control and Automation (ICCUBEA), Aug. 2018, pp. 1-6. https://doi.org/10.1109/ICCUBEA.2018. 8697349.
  52. Taleizadeh AA, Amjadian A, Hashemi-Petroodi SE, Moon I (2023) Supply chain coordination based on mean-variance risk optimisation: pricing, warranty, and full-refund decisions. Int J Syst Sci: Oper Logist 10(1):2249808. https://doi.org/10.1080/ 23302674.2023 .2249808
  53. Gharaei A, Amjadian A, Shavandi A, Amjadian A (2023) An augmented Lagrangian approach with general constraints to solve nonlinear models of the large-scale reliable inventory systems. J Comb Optim 45(2):78. https://doi.org/10.1007/s10878-023-01002-z
  54. Taleizadeh AA, Varzi AM, Amjadian A, Noori-daryan M, Konstantaras I (2023) How cash-back strategy affect sale rate under refund and customers’ credit. Oper Res Int J 23(1):19. https://doi. org/10.1007/s12351-023-00752-2
  55. Talaat FM (2022) Effective deep Q-networks (EDQN) strategy for resource allocation based on optimized reinforcement learning algorithm. Multimed Tools Appl 81(17). https://doi.org/10. 1007/s11042-022-13000-0
  56. Talaat FM (2022) Effective prediction and resource allocation method (EPRAM) in fog computing environment for smart healthcare system. Multimed Tools Appl
  57. Talaat Fatma M, Alshathri Samah, Nasr Aida A (2022) A new reliable system for managing virtualcloud network. Comput Mater Continua 73(3):5863-5885. https://doi.org/10.32604/cmc. 2022.026547
  58. El-Rashidy N, ElSayed NE, El-Ghamry A, Talaat FM (2022) Prediction of gestational diabetes based on explainable deep learning and fog computing. Soft Comput 26(21):11435-11450
  59. El-Rashidy N, Ebrahim N, el Ghamry A, Talaat FM (2022) Utilizing fog computing and explainable deep learning techniques for gestational diabetes prediction. Neural Comput Applic. https://doi.org/10.1007/s00521-022-08007-59. FaivdullahL,AzaharF,HtikeZZ,Naing
  60. Hanaa S, Fatma BT (2022) Detection and classification using deep learning and sine-cosine fitnessgrey wolf optimization. Bioengineering 10(1):18. https://doi.org/10.3390/bioengineering 10010018
  61. Talaat FM (2023) Real-time facial emotion recognition system among children with autism based on deep learning and IoT. Neural Comput Appl 35(3), https://doi.org/10.1007/s00521-023-08372-9
  62. Talaat FM (2023) Crop yield prediction algorithm (CYPA) in precision agriculture based on IoT techniques and climate changes, April 2023, Neural Comput Appl 35(2), https://doi.org/10. 1007/s00521-023-08619-5
  63. Hassan E, El-Rashidy N, Talaat FM (2022) Review: Mask R-CNN Models. May 2022, https://doi.org/10.21608/njccs.2022. 280047.
  64. Siam AI, Gamel SA, Talaat FM (2023) Automatic stress detection in car drivers based on non-invasive physiological signals using machine learning techniques. Neural Comput Applic. https://doi.org/10.1007/s00521-023-08428-w
  65. Talaat FM, Gamel SA (2023) A2M-LEUK: attention-augmented algorithm for blood cancer detection in children, June 2023, Neural Comput Appl. https://doi.org/10.1007/s00521-023-086788
  66. Gamel SA, Hassan E, El-Rashidy N et al (2023) Exploring the effects of pandemics on transportation through correlations and deep learning techniques. Multimed Tools Appl. https://doi.org/ 10.1007/s11042-023-15803-1
  67. Talaat FM, ZainEldin H (2023) An improved fire detection approach based on YOLO-v8 for smart cities. Neural Comput Applic. https://doi.org/10.1007/s00521-023-08809-1
  68. Alnaggar M, Siam AI, Handosa M, Medhat T, Rashad MZ (2023) Video-based real-time monitoring for heart rate and respiration rate. Expert Syst Appl 1(225):120135
  69. Alnaggar M, Handosa M, Medhat T, Z Rashad M (2023) Thyroid Disease multi-class classification based on optimized gradient boosting model. Egypt J Artif Intell. 2(1):1-4.
  70. Alnaggar M, Handosa M, Medhat T, Rashad MZ (2023) An IoTbased framework for detecting heart conditions using machine learning. Int J Adv Comput Sci Appl. 14(4).
  71. Alhussan AA, Talaat FM, El-kenawy ES, Abdelhamid AA, Ibrahim A, Khafaga DS, Alnaggar M (2023) Facial expression recognition model depending on optimized support vector machine. Comput Mater Continua. 76(1).
Publisher’s Note Springer Nature remains neutral with regard to jurisdictional claims in published maps and institutional affiliations.

  1. Fatma M. Talaat
    fatma.nada@ai.kfs.edu.eg
    Mahmoud Y. Shams
    mahmoud.yasin@ai.kfs.edu.eg
    Samah A. Gamel
    sgamel@horus.edu.eg
    Faculty of Artificial Intelligence, Kafrelsheikh University, Kafrelsheikh, Egypt
    2 Faculty of Engineering, Horus University, Damietta, Egypt
    3 Faculty of Computer Science and Engineering, New Mansoura University, Gamasa 35712, Egypt
    4 Nile Higher Institute for Engineering and Technology, Mansoura, Egypt