DOI: https://doi.org/10.1038/s41598-024-83592-0
PMID: https://pubmed.ncbi.nlm.nih.gov/39779779
تاريخ النشر: 2025-01-08
افتح
تعزيز تصنيف أمراض القلب استنادًا إلى خوارزمية تحسين الإوز الرمادي وذاكرة المدى الطويل والقصير
الملخص
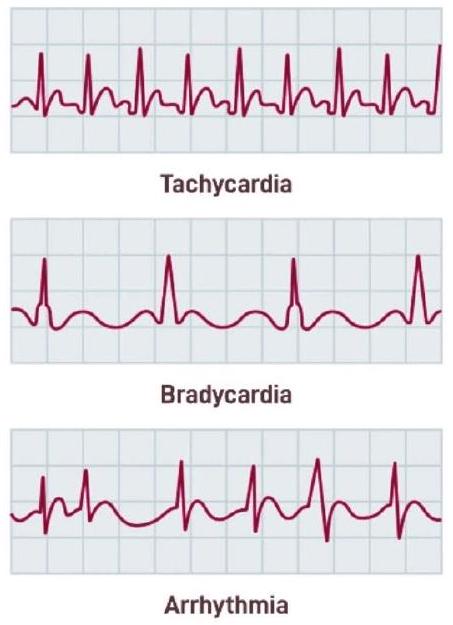
أمراض القلب هي فئة من الحالات المختلفة التي تؤثر على القلب، والتي تشمل العديد من الأمراض التي تؤثر على هيكله وعمله. قد تتضمن هذه الحالات مرض الشريان التاجي، الذي يتميز بضيق أو تجلط الشرايين التي تزود عضلة القلب بالدم، مع التهديد الناتج عن النوبات القلبية. اضطرابات نظم القلب (عدم انتظام ضربات القلب)، مشاكل صمامات القلب، العيوب الخلقية في القلب الموجودة عند الولادة، واضطرابات عضلة القلب (اعتلال عضلة القلب) هي أنواع أخرى من أمراض القلب. الهدف من هذا العمل هو تقديم خوارزمية تحسين الإوز الرمادي (GGO)، التي تسعى لتحسين دقة تصنيف أمراض القلب. تم تصميم تنسيق GGO الثنائي بشكل خاص لاختيار المجموعة الأكثر فعالية من الميزات التي يمكن أن تحسن دقة التصنيف عند مقارنتها بستة خوارزميات تحسين ثنائية أخرى. تعتبر خوارزمية bGGO هي الأكثر فعالية في اختيار الميزات المثلى لتعزيز دقة التصنيف. تستخدم مرحلة التصنيف العديد من المصنفات، وأشارت النتائج إلى أن ذاكرة المدى الطويل والقصير (LSTM) ظهرت كأكثر مصنف فعالية، محققة معدل دقة قدره
على مدار السنوات الأخيرة، زادت الأبحاث بشكل كبير حول الرعاية الصحية، خاصة بعد تأثير جائحة كوفيد-19. تحدد منظمة الصحة العالمية (WHO)
عدم انتظام ضربات القلب المرضي
السمنة، وارتفاع ضغط الدم تزيد بشكل كبير من احتمال الإصابة بالأمراض القلبية الوعائية
المركزية في تقدم أمراض القلب. الزانثوهومول هو مركب طبيعي، يثبط بشكل فعال TGF-
الأعمال ذات الصلة
المواد والأساليب
خوارزمية تحسين غازة غريلا (GGO)
| المؤلفون | التقنيات المستخدمة | الدقة | مجموعة البيانات |
| هارشيت جيندال وآخرون
|
الغابة العشوائية، الانحدار اللوجستي، KNN | 87.50% | 304 عنصر، 13 ميزة |
| أوطوم وآخرون
|
بايز الساذج، SVM، أشجار الدالة (FT) | 88.3% (SVM)، 83.8% (SVM و بايز نت)، 81.5% (FT) | مجموعة بيانات مرض القلب في كليفلاند، 303 حالة، 76 ميزة (13 مستخدمة) |
| أبورب راجدان وآخرون
|
الغابة العشوائية، بايز الساذج، أشجار القرار، الانحدار اللوجستي | 90.16% (الغابة العشوائية)، 85.25% (بايز الساذج)، 85.25% (أشجار القرار)، 81.97% (الانحدار اللوجستي) | مجموعة بيانات مرض القلب في كليفلاند، 14 ميزة من 76 |
| أمين الحق وآخرون
|
KNN، SVM، الانحدار اللوجستي، شجرة القرار، الغابة العشوائية، بايز الساذج، الشبكات العصبية | 88% (SVM)، 87% (الانحدار اللوجستي)، 86% (الشبكات العصبية)، 89% (الانحدار اللوجستي مع التحقق المتقاطع 10 مرات) | مجموعة بيانات مرض القلب في كليفلاند |
| راهول كاتاريا وآخرون
|
الإدراك متعدد الطبقات، شجرة القرار، بايز الساذج، أقرب جار K، SVM، الغابة العشوائية، ANN، الشبكات العصبية العميقة، الانحدار اللوجستي | 95.6% (الغابة العشوائية)، 93.4% (الانحدار اللوجستي)، 92.3% (ANN)، 99.6% (PSO + الغابة العشوائية)، 99.65% (PSO + KNN) | مستودع UCI، 14 ميزة من 76 |
| يونس خورديفي وآخرون
|
الغابة العشوائية، أقرب جار K، الشبكات العصبية، تحسين سرب الجسيمات (PSO)، تحسين مستعمرة النمل (ACO) | 99.6% (الغابة العشوائية + ACO)، 99.65% (KNN + ACO) | مستودع UCI |
Initialize GGO population $mathbf{X}_{i}(i=1,2, ldots, n)$, size $n$, iterations $t_{text {max }}$, objective function $F_{n}$.
Initialize GGO parameters $mathbf{a}, mathbf{A}, mathbf{C}, b, l, c, r_{1}, r_{2}, r_{3}, r_{4}, r_{5}, w, w_{1}, w_{2}, w_{3}, w_{4}, mathbf{A}_{1}, mathbf{A}_{2}, mathbf{A}_{3}, mathbf{C}_{1}, mathbf{C}_{2}, mathbf{C}_{3}, t=1$
Calculate objective function $F_{n}$ for each agents $mathbf{X}_{i}$
Set $mathbf{P}=$ best agent position
Update Solutions in exploration group $left(n_{1}right)$ and exploitation group $left(n_{2}right)$
while $t leq t_{text {max }}$ do
        for ( $i=1: i<n_{1}+1$ ) do
            if $(t % 2==0)$ then
                    if $left(r_{3}<0.5right)$ then
                        if $(|A|<1)$ then
                            Update position of current search agent as $mathbf{X}(t+1)=mathbf{X}^{*}(t)-mathbf{A} cdotleft|mathbf{C} cdot mathbf{X}^{*}(t)-mathbf{X}(t)right|$
                        else
                                Select three random search agents $mathbf{X}_{text {Paddle } 1}, mathbf{X}_{text {Paddle } 2}$, and $mathbf{X}$ Paddle 3
                            Update (z) by the exponential form of $boldsymbol{z}=mathbf{1}-left(frac{boldsymbol{t}}{boldsymbol{t}_{text {max }}}right)^{mathbf{2}}$
                            Update position of current search agent as
                                $mathbf{X}(t+1)=w 1 * mathbf{X}$ Paddle $1+mathbf{z} * w 2 *(mathbf{X}$ Paddle $2-mathbf{X}$ Paddle 3$)+(1-mathbf{z}) * w 3 *(mathbf{X}-mathbf{X}$ Paddle 1$)$
                        end if
                    else
                                Update position of current search agent as
                        $mathbf{X}(t+1)=w_{4} *|mathbf{X} *(t)-mathbf{X}(t)| . e^{b l} . cos (2 pi l)+left[2 w_{1}left(r_{4}+r_{5}right)right] * mathbf{X}^{*}(t)$
                    end if
            else
                        Update individual positions as
                    $mathbf{X}(t+1)=mathbf{X}(t)+mathbf{D}(1+mathbf{z}) * w *left(mathbf{X}-mathbf{X}_{text {Flock } 1}right)$
            end if
    end for
        for ( $i=1: i<n_{2}+1$ ) do
                if ( $t % 2==0$ ) then
                        Calculate $mathbf{X} 1=mathbf{X}$ Sentry1-A1. $mid mathbf{C} 1 . mathbf{X}$ Sentry1-X $mid, mathbf{X} 2=mathbf{X}$ Sentry2- A2. $mid mathbf{C} 2 . mathbf{X}$ Sentry2 $-mathbf{X} mid$,
                        $mathbf{X} mathbf{3}=mathbf{X}$ Sentry3 $-mathbf{A} mathbf{3} . mid mathbf{C} mathbf{3} . mathbf{X}$ Sentry3 $-mathbf{X} mid$
                    Update individual positions as $left.overline{mathbf{X}_{mathbf{i}}}right|_{0} ^{3}$
            else
                        Update position of current search agent as
                        $mathbf{X}(t+1)=mathbf{X}(t)+mathbf{D}(1+mathbf{z}) * w *left(mathbf{X}-mathbf{X}_{text {Flock } 1}right)$
            end if
    end for
    Calculate objective function $F_{n}$ for each $mathbf{X}_{i}$
        Update parameters
        Set $t=t+1$
        Adjust beyond the search space solutions
            if (Best $F_{n}$ is same as previous two iterations) then
                Increase solutions of exploration group ( $n_{1}$ )
                Decrease solutions of exploitation group ( $n_{2}$ )
    end if
end while
Return best agent $mathbf{P}$
خوارزمية تحسين GGO الثنائية
Initialize GGO population, objective function, and GGO parameters
Convert solution to binary [0 or 1]
Calculate objective function for each agent and get best agent position
Update Solutions in exploration group and exploitation group
while $mathrm{t} leq mathrm{t}_{text {max }}$ do
    for ( $mathrm{i}=1: mathrm{i}<mathrm{n}_{1}+1$ ) do
        if $(mathrm{t} % 2==0)$ then
            if $left(mathrm{r}_{3}<0.5right)$ then
                if $(|mathrm{A}|<1)$ then
                            Update position of current search agent in exploration group
                        else
                            Update position of current search agent based on three random search agents
                        end if
                    else
                        Update position of current search agent
                            end if
                    else
                        Update individual positions
                    end if
        end for
        for ( $mathrm{i}=1: mathrm{i}<mathrm{n} 2+1$ ) do
            if $(mathrm{t} % 2==0)$ then
                    Update position of current search agent in exploitation group
            else
                    Update position of current search agent
                end if
        end for
        Convert updated solution to binary
        Calculate objective function
        Update parameters
        Adjust beyond the search space solutions
        Update Solutions in exploration group and exploitation group
    end while
Return best agent
الذاكرة طويلة وقصيرة الأجل (LSTM)
بينما يتم حساب الأخطاء وإرسالها للخلف لضبط معلمات الشبكة. تتضمن هذه الشبكات حلقات تغذية راجعة داخل طبقاتها المخفية، مما يسمح للمعلومات بالتداول في اتجاهين، مما يمكّن الحالة المخفية من الاحتفاظ بالمعرفة من خطوات الزمن السابقة. نتيجة لذلك، يتأثر ناتج النموذج بالتنبؤات السابقة. ومع ذلك، تكافح RNN التقليدية لالتقاط الاعتماديات طويلة الأجل، ويرجع ذلك أساسًا إلى مشكلة تلاشي التدرجات، حيث يتناقص تأثير المعلومات السابقة مع انتشارها عبر المزيد من خطوات الزمن. تؤدي هذه الظاهرة إلى تشفير الشبكة بشكل أساسي للاعتماديات قصيرة الأجل، مع تلاشي المعلومات من الخطوات السابقة مع مرور الوقت. يقترب تدرج دالة الخسارة من الصفر مع إضافة المزيد من الطبقات مع دوال تنشيط، مما يزيد من تفاقم هذه المشكلة. تتعامل شبكات LSTM، أو LSTM-ANNs، مع هذا التحدي من خلال إدخال وحدات الذاكرة وآليات البوابات التي تمكّن النموذج من التقاط الاعتماديات طويلة الأجل. يسمح تضمين حالات الخلايا وثلاث بوابات متميزة لـ LSTMs بالاحتفاظ أو التخلص من المعلومات بشكل انتقائي، مما يجعلها قادرة على تعلم الاعتماديات عبر آلاف خطوات الزمن. وبالتالي، فإن شبكات LSTM بارعة في تذكر ونسيان المعلومات الحرجة، مما يسمح لها بنمذجة العلاقات الزمنية طويلة الأجل بفعالية أكبر بكثير من RNN التقليدية.
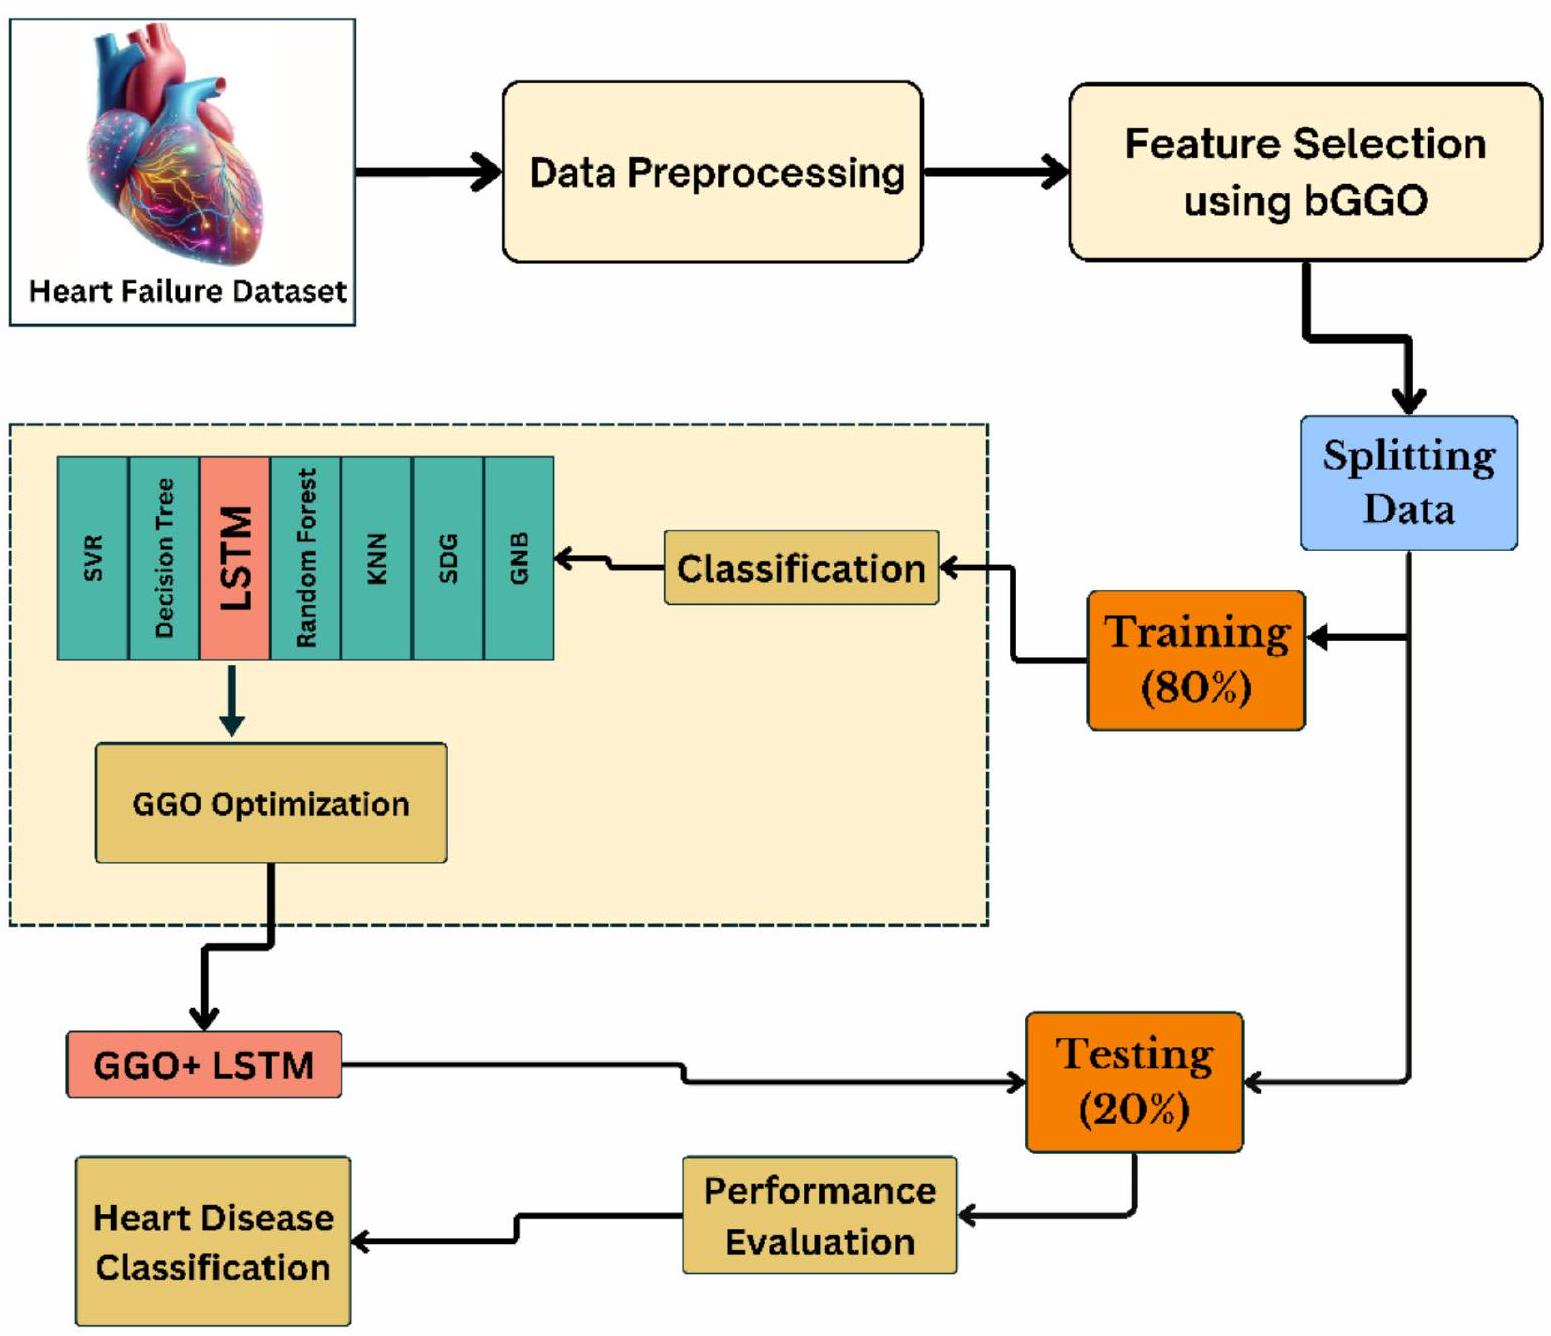
الإطار المقترح
النتائج التجريبية
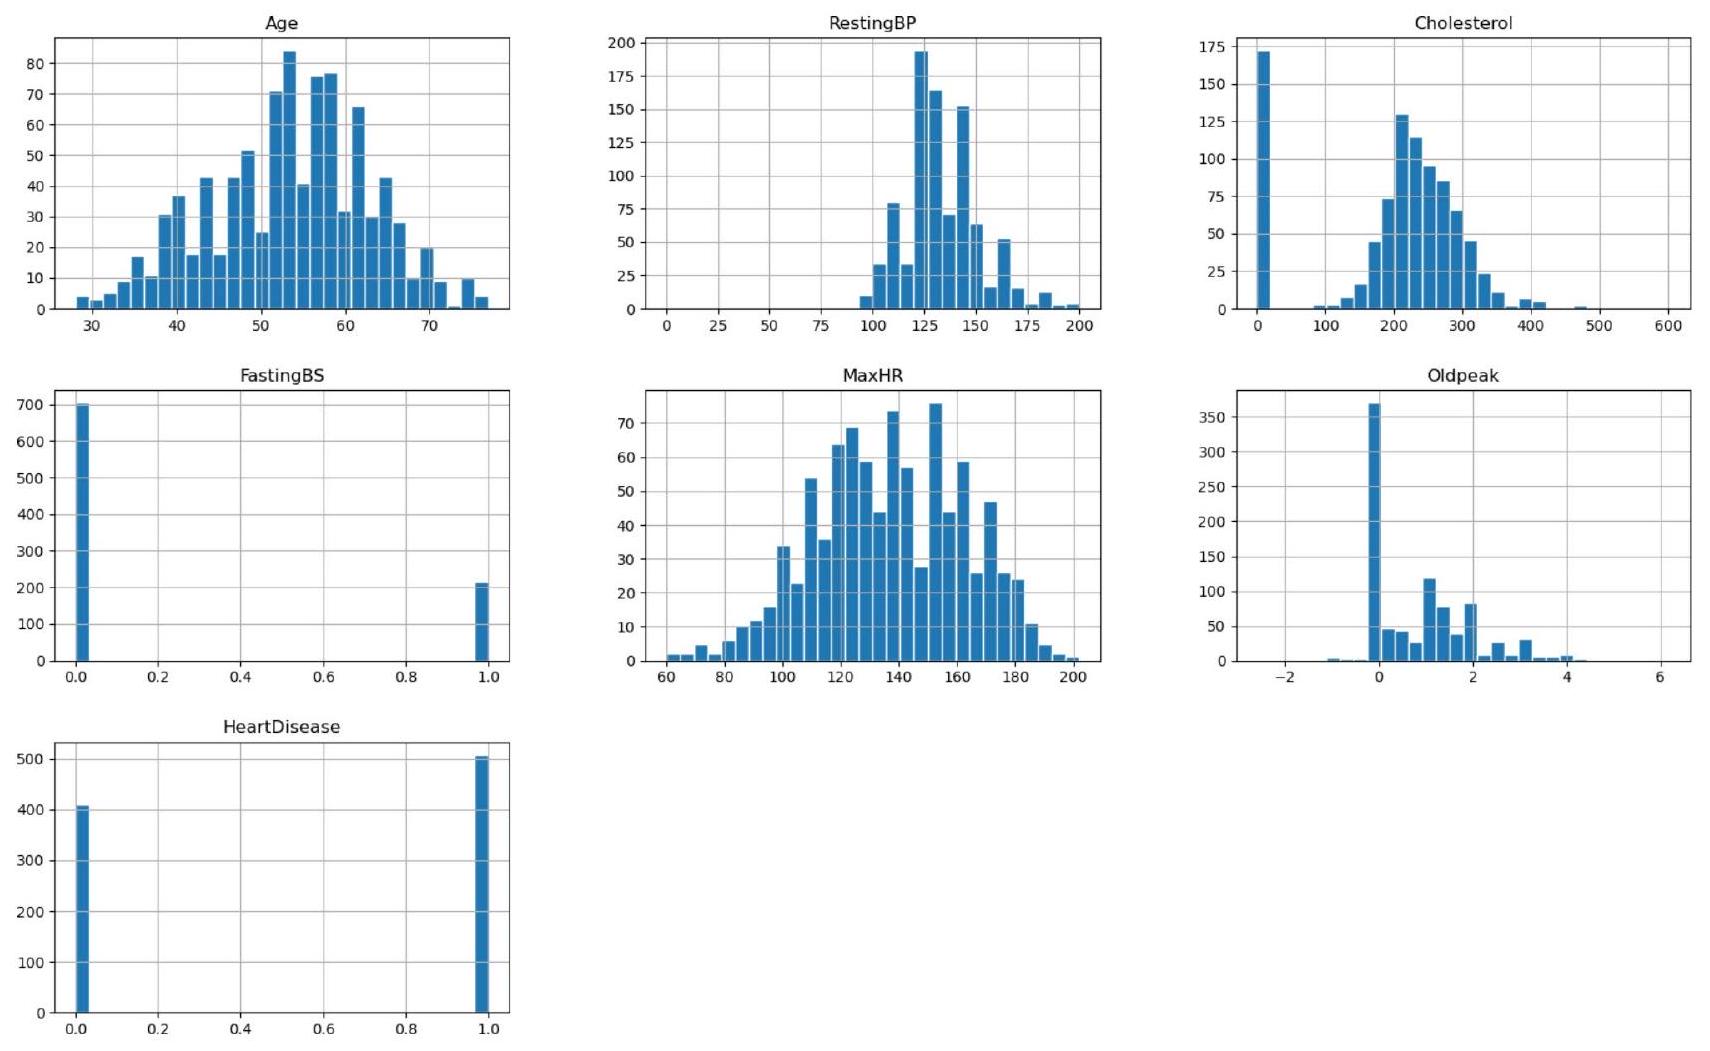
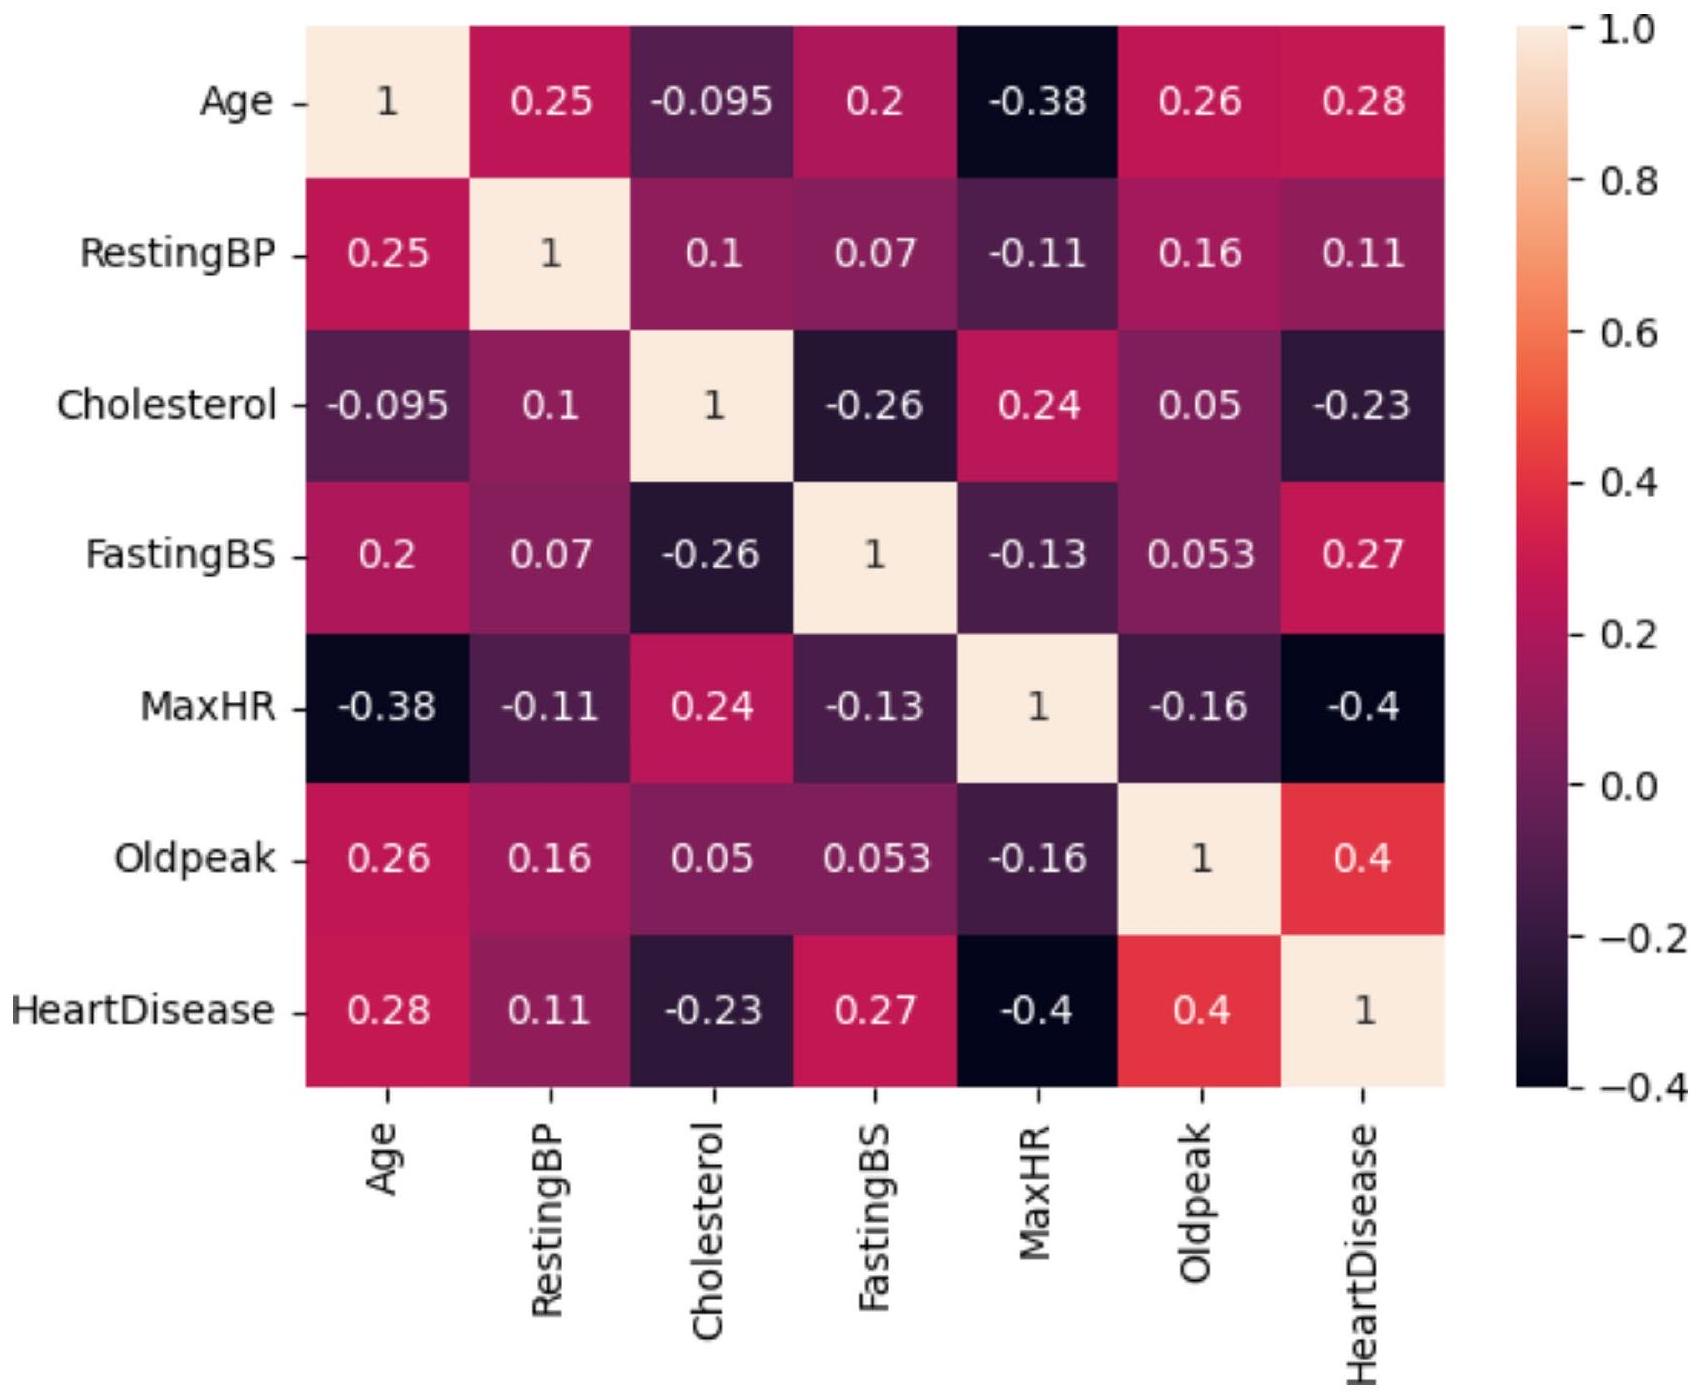
وصف مجموعة البيانات
| معاملات فرعية | القيم |
| عدد العقد | 256 |
| عدد الطبقات المخفية | ٤ |
| التسرب الدراسي | 0.5 |
| دالة التنشيط | ريلو |
| معدل التعلم | 0.001 |
| عدد العصور | 100 |
| حجم الدفعة | 64 |
نتائج اختيار الميزات
| بغو | ببر | بي دي تي أو | BPSO | بواو | bGWO | بفاو | |
| خطأ متوسط | 0.286625 | 0.303825 | 0.317425 | 0.337625 | 0.337425 | 0.323925 | 0.336025 |
| متوسط حجم الاختيار | 0.239425 | 0.439425 | 0.381825 | 0.439425 | 0.602825 | 0.362225 | 0.473925 |
| لياقة بدنية متوسطة | 0.349825 | 0.366025 | 0.377425 | 0.364425 | 0.372225 | 0.372125 | 0.416325 |
| أفضل لياقة | 0.251625 | 0.286325 | 0.280725 | 0.344725 | 0.336325 | 0.349925 | 0.335025 |
| أسوأ لياقة | 0.350125 | 0.353225 | 0.395825 | 0.412425 | 0.412425 | 0.426125 | 0.432625 |
| لياقة الانحراف المعياري | 0.172125 | 0.176825 | 0.178425 | 0.176225 | 0.178425 | 0.177425 | 0.213025 |
نتائج التصنيف
متوسط الخطأ
| بغو | ببر | بي دي تي أو | بي.بي.إس.أو | بواو | bGWO | بفاو | |
| قيمة P (ذو طرفين) | 0.002 | 0.002 | 0.002 | 0.002 | 0.002 | 0.002 | 0.002 |
| دقيق أم تقديري؟ | دقيق | دقيق | دقيق | دقيق | دقيق | دقيق | دقيق |
| مهم (ألفا
|
نعم | نعم | نعم | نعم | نعم | نعم | نعم |
| تباين | 0.2866 | 0.3038 | 0.3174 | 0.٣٣٧٦ | 0.3374 | 0.3239 | 0.336 |
| جدول ANOVA | SS | DF | MS | F (DFن، DFد) | قيمة P |
| علاج | 0.02167 | ٦ | 0.003612 |
|
|
| متبقي | 0.002002 | 63 |
|
||
| إجمالي | 0.02368 | 69 |
| نماذج | دقة | الحساسية (TRP) | الخصوصية (TNP) |
|
صافي القيمة الحالية (NPV) | درجة F |
| مصنف SVC | 0.8294393 | 0.856031128 | 0.789473684 | 0.859375 | 0.7848837 | 0.8577 |
| مصنف SGD | 0.840909 | 0.86614173 | 0.80645161 | 0.859375 | 0.8152174 | 0.86274 |
| مصنف Gaussian NB | 0.845474 | 0.87265917 | 0.80645161 | 0.86617100 | 0.8152174 | 0.86940 |
| مصنف الجار الأقرب (KNN) | 0.849137 | 0.87265917 | 0.81725888 | 0.86617100 | 0.8256410 | 0.86940 |
| مصنف شجرة القرار (DT) | 0.864806 | 0.88345864 | 0.84 | 0.88014981 | 0.84422110 | 0.88180 |
| مصنف الغابة العشوائية (RF) | 0.894736 | 0.88679245 | 0.90163934 | 0.88679245 | 0.90163934 | 0.88679 |
| LSTM | 0.917948 | 0.90733590 | 0.92638036 | 0.90733590 | 0.92638036 | 0.90733 |
| نماذج | دقة | الحساسية (TRP) | الخصوصية (TNP) |
|
قيمة N (NPV) | درجة F |
| جي جي أو + إل إس تي إم | 0.995763 | 0.996086 | 0.995516 | 0.994141 | 0.997006 | 0.995112 |
| BER + LSTM | 0.978346 | 0.978846 | 0.977823 | 0.978846 | 0.977823 | 0.978846 |
| DTO + LSTM | 0.970742 | 0.969432 | 0.971944 | 0.969432 | 0.971944 | 0.969432 |
| PSO + LSTM | 0.950363 | 0.951777 | 0.949074 | 0.944584 | 0.955711 | 0.948167 |
| جي دبليو أو + إل إس تي إم | 0.944223 | 0.937695 | 0.949074 | 0.931889 | 0.953488 | 0.934783 |
| FAO + LSTM | 0.935103 | 0.937695 | 0.932773 | 0.926154 | 0.943343 | 0.931889 |
| واو + LSTM | 0.930556 | 0.934783 | 0.92638 | 0.926154 | 0.934985 | 0.930448 |
| جدول ANOVA | SS | DF | MS | F (DFن، DFد) | قيمة P |
| علاج | 0.0334 | ٦ | 0.005567 |
|
|
| متبقي | 0.001638 | 63 | 0.000026 | ||
| إجمالي | 0.03504 | 69 |
| GGO + LSTM | BER + LSTM | DTO + LSTM | PSO + LSTM | GWO + LSTM | FAO + LSTM | WAO + LSTM | |
| قيمة P (ذيلين) | 0.002 | 0.002 | 0.002 | 0.002 | 0.002 | 0.002 | 0.002 |
| دقيق أم تقديري؟ | دقيق | دقيق | دقيق | دقيق | دقيق | دقيق | دقيق |
| ذو دلالة
|
نعم | نعم | نعم | نعم | نعم | نعم | نعم |
| اختلاف | 0.9958 | 0.9783 | 0.9707 | 0.9504 | 0.9442 | 0.9351 | 0.9306 |
تحليل نتائج التصنيف
مخطط الانحدار: الدقة مقابل درجة F
مخطط KDE للدقة
الحساسية (TRP) حسب النموذج
الاستنتاج والعمل المستقبلي
| دراسة | نماذج | الدقة (%) |
| مرجع
|
مجموعة من (الغابة العشوائية، والانحدار اللوجستي، وKNN) | 87.5 |
| مرجع
|
آلة الدعم الناقل | 88.3 |
| مرجع
|
الغابة العشوائية | 90.16 |
| مرجع
|
SVM، الانحدار اللوجستي، الشبكات العصبية | 89 |
| هذه الدراسة | GGO لاختيار الميزات، LSTM للتصنيف | 99.58 |
توفر البيانات
تم النشر عبر الإنترنت: 08 يناير 2025
References
- World Health Organization, Cardiovascular Diseases, WHO, Geneva, Switzerland. https://www.who.int/healthtopics/cardiovascu lar-diseases/ (2020).
- American Heart Association, Classes of Heart Failure, American Heart Association,Chicago, IL, USA. https://www.heart.org/en/h ealth-topics/heart-failure/what-is-heartfailure/%20classes-of-heart-failure (2020).
- American Heart Association, Heart Failure, American Heart Association, Chicago,IL, USA. https://www.heart.org/en/health-topi cs/heart-failure (2020).
- Elshewey, A. M. & Osman, A. M. Orthopedic disease classification based on breadth-first search algorithm. Sci. Rep. 14 (1), 23368 (2024).
- Elkenawy, E. S., Alhussan, A. A., Khafaga, D. S., Tarek, Z. & Elshewey, A. M. Greylag goose optimization and multilayer perceptron for enhancing lung cancer classification. Sci. Rep. 14 (1), 23784 (2024).
- Elshewey, A. M., Alhussan, A. A., Khafaga, D. S., Elkenawy, E. S. & Tarek, Z. EEG-based optimization of eye state classification using modified-BER metaheuristic algorithm. Sci. Rep. 14 (1), 24489 (2024).
- El-Rashidy, N., Tarek, Z., Elshewey, A. M. & Shams, M. Y. Multitask multilayer-prediction model for predicting mechanical ventilation and the associated mortality rate. Neural Comput. Appl. 1-23 (2024).
- Hosny, K. M., Mohammed, M. A., Salama, R. A. & Elshewey, A. M. Explainable ensemble deep learning-based model for brain tumor detection and classification. Neural Comput. Appl. 1-18 (2024).
- Alzakari, S. A., Alhussan, A. A., Qenawy, A. S., Elshewey, A. M. & Eed, M. An enhanced long short-term memory recurrent neural network deep learning model for potato price prediction. Potato Res. 1-9 (2024).
- Elshewey, A. M. et al. Optimizing HCV Disease Prediction in Egypt: The hyOPTGB Framework. Diagnostics 13 (22), 3439 (2023).
- Deserno, T. M., Antani, S. & Long, R. Ontology of gaps in content-based image retrieval. J. Digit. Imaging 22, 202-215 (2009).
- Ezugwu, A. E. et al. Metaheuristics: A comprehensive overview and classification along with bibliometric analysis. Artif. Intell. Rev. 54, 4237-4316 (2021).
- Mehta, P., Kumar, S. & Tejani, G. G. MOBBO: A multiobjective brown bear optimization algorithm for solving constrained structural optimization problems. J. Optim. 2024 (1), 5546940 (2024).
- Mashru, N., Tejani, G. G., Patel, P. & Khishe, M. Optimal truss design with MOHO: A multi-objective optimization perspective. Plos One 19 (8), e0308474 (2024).
- Nonut, A. et al. A small fixed-wing UAV system identification using metaheuristics. Cogent Eng. 9 (1), 2114196 (2022).
- Xia, J. Y. et al. Metalearning-based alternating minimization algorithm for nonconvex optimization. IEEE Trans. Neural Netw. Learn. Syst. 34 (9), 5366-5380 (2022).
- Su, Y. et al. Colon cancer diagnosis and staging classification based on machine learning and bioinformatics analysis. Comput. Biol. Med. 145, 105409 (2022).
- Jiang, C. et al. Xanthohumol inhibits TGF-
-induced cardiac fibroblasts activation via mediating PTEN/Akt/mTOR signaling pathway. Drug. Des. Devel. Ther. 14, 5431-5439(2020). - Deng, J. et al. The Janus face of mitophagy in myocardial ischemia/reperfusion injury and recovery. Biomed. Pharmacother. 173, 116337 (2024).
- Katarya, R. & Meena, S. K. Machine learning techniques for heart disease prediction: A comparative study and analysis, Health and Technology. 11(1), 87-97 (2023).
- Otoom, A. F., Abdallah, E. E., Kilani, Y., Kefaye, A. & Ashour, M. Effective diagnosis and monitoring of heart disease. Int. J. Softw. Eng. Its Appl. 9 (1), 143-156 (2023).
- Rajdhan, A., Agarwal, A., Sai, M. & Ghuli, P. Heart disease prediction using machine learning. Int. J. Res. Technol. 9 (04), 659-662 (2024).
- Haq, A. U., Li, J. P., Memon, M. H., Nazir, S. & Sun, R. A hybrid intelligent system framework for the prediction of heart disease using machine learning algorithms. Mob. Inf. Syst. 2018 (2018).
- Rimm, E. B., Stampfer, M. J. & Willett, W. C. Body size and fat distribution as predictors of coronary heart disease among middleaged and older us men. Am. J. Epidemiol. 141 (12), 1117-1127 (2022).
- Khourdifi, Y. & Bahaj, M. Heart disease prediction and classification using machine learning algorithms optimized by particle swarm optimization and ant colony optimization. Int. J. Intell. Eng. Syst. 12 (1), 242-252 (2019).
- El-kenawy, E. S. M. et al. Greylag goose optimization: Nature-inspired optimization algorithm. Expert Syst. Appl. 238, 122147 (2024).
- Hayrettin, O. Deep learning for subtyping and prediction of diseases: Long-short term memory. Energy Rep. 6, 1147-1159 (2022).
- Mirjalili, S. SCA: A sine cosine algorithm for solving optimization problems. Knowl. Based Syst. 96, 120-133 (2016).
- Zaki, A. M., Towfek, S. K., Gee, W., Zhang, W. & Soliman, M. A. Advancing parking space surveillance using a neural network approach with feature extraction and dipper throated optimization integration. J. Artif. Intell. Metaheuristics 6 (Issue 2), 16-25 (2023).
- Piotrowski, A. P., Napiorkowski, J. J. & Piotrowska, A. E. Particle swarm optimization or differential evolution-A comparison. Eng. Appl. Artif. Intell. 121, 106008 (2023).
- Mirjalili, S. & Lewis, A. The whale optimization algorithm. Adv. Eng. Softw. 95, 51-67 (2016).
- Al-Tashi, Q., Md Rais, H., Abdulkadir, S. J., Mirjalili, S. & Alhussian, H. A review of grey wolf optimizer-based feature selection methods for classification. Evol. Mach. Learn. Tech. Algorithms Appl. ;273-286. (2020).
- de Vasconcelos Segundo, E. H., Mariani, V. C. & dos Santos Coelho, L. Design of heat exchangers using falcon optimization algorithm. Appl. Therm. Eng. 156, 119-144 (2019).
- Saigal, P. & Khanna, V. Multi-category news classification using support vector machine based classifiers. SN Appl. Sci. 2 (3), 458 (2020).
- Shams, M. Y. et al. A machine learning-based model for predicting temperature under the effects of climate change. in The Power of Data: Driving Climate Change with Data Science and Artificial Intelligence Innovations 61-81 (Springer, 2023).
- Fouad, Y., Osman, A. M., Hassan, S. A., El-Bakry, H. M. & Elshewey, A. M. Adaptive visual sentiment prediction model based on event concepts and object detection techniques in social media. Int. J. Adv. Comput. Sci. Appl. 14 (7), 252-256 (2023).
- Elshewey, A. M., Shams, M. Y., Tarek, Z., Megahed, M. & El-kenawy, E. S. M., El-dosuky, M. A. Weight prediction using the hybrid stacked-LSTM food selection model. Comput. Syst. Sci. Eng. 46 (1), 765-781 (2023).
- Al Bataineh, A., Kaur, D. & Jalali, S. M. J. Multi-layer perceptron training optimization using nature inspired computing. IEEE Access 10, 36963-36977 (2022).
- Saeed, M. et al. Electrical power output prediction of combined cycle power plants using a recurrent neural network optimized by waterwheel plant algorithm. Front. Energy Res. 11, 1234624 (2023).
- Shams, M. Y., Tarek, Z., El-kenawy, E. S., Eid, M. M. & Elshewey, A. M. Predicting gross domestic product (GDP) using a PC-LSTM-RNN model in urban profiling areas. Comput. Urban Sci. 4 (1), 3 (2024).
- Sun, F. et al. Solid component ratio influences prognosis of GGO-featured IA stage invasive lung adenocarcinoma. Cancer Imaging 20 (1), 87 (2020).
- Rabehi, A. & Kumar, P. Improving tuberculosis diagnosis and forecasting through machine learning techniques: A systematic review. Metaheuristic Optim. Rev. 1 (1), 35-44 (2024).
- Tarek, Z. et al. An optimized model based on deep learning and gated recurrent unit for COVID-19 death prediction. Biomimetics 8 (7), 552 (2023).
- Wang, D., Tan, D. & Liu, L. Particle swarm optimization algorithm: An overview. Soft Comput. 22 (2), 387-408 (2018).
- Gaber, K. S., Elsebaey, M. A. & Ibrahim, A. A. Weather prediction: Predicting rain using weather conditions. J. Artif. Intell. Metaheuristics 8 (1), 60-69 (2024).
- Rezaei, H., Bozorg-Haddad, O. & Chu, X. Grey Wolf Optimization (GWO) Algorithm. in Advanced Optimization by NatureInspired Algorithms [Internet]. (Studies in Computational Intelligence) (ed Bozorg-Haddad, O.) 81-91 ( Springer, 2018). https://doi .org/10.1007/978-981-10-5221-7_9.
- Tang, H. et al. A novel hybrid algorithm based on PSO and FOA for target searching in unknown environments. Appl. Intell. 49 (7), 2603-2622 (2019).
- Alkhammash, E. H., Kamel, A. F., Al-Fattah, S. M. & Elshewey, A. M. Optimized multivariate adaptive regression splines for predicting crude oil demand in Saudi arabia. Discrete Dyn. Nat. Soc. 2022 (1), 8412895 (2022).
- El-kenawy, E. S. et al. Optimized ensemble algorithm for predicting metamaterial antenna parameters. CMC 71 (3), 4989-5003 (2022).
- El-kenawy, E. S. M. et al. Improved weighted ensemble learning for predicting the daily reference evapotranspiration under the semi-arid climate conditions. Environ. Sci. Pollut Res. 29 (54), 81279-81299 (2022).
- Shams, M. Y., El-Kenawy, E. S., Ibrahim, A. & Elshewey, A. M. A hybrid dipper throated optimization algorithm and particle swarm optimization (DTPSO) model for hepatocellular carcinoma (HCC) prediction. Biomed. Signal Process. Control 85, 104908 (2023).
- Alkhammash, E. H., Hadjouni, M. & Elshewey, A. M. A hybrid ensemble stacking model for gender voice recognition approach. Electronics 11 (11), 1750 (2022).
- Alzakari, S. A., Alhussan, A. A., Qenawy, A. S. & Elshewey, A. M. Early detection of potato disease using an enhanced convolutional neural network-long short-term memory deep learning model. Potato Res. 1-9 (2024).
- Alkhammash, E. H. et al. Application of machine learning to predict COVID-19 spread via an optimized BPSO model. Biomimetics
. - Abdelhamid, A. A. et al. Potato harvesting prediction using an Improved ResNet-59 model. Potato Res. 1-20 (2024).
الشكر والتقدير
مساهمات المؤلفين
التمويل
الإعلانات
المصالح المتنافسة
معلومات إضافية
معلومات إعادة الطبع والإذن متاحة في www.nature.com/reprints.
ملاحظة الناشر تظل Springer Nature محايدة فيما يتعلق بالمطالبات القضائية في الخرائط المنشورة والانتماءات المؤسسية.
© المؤلفون 2025
قسم علوم الحاسوب، كلية الحاسبات والمعلومات، جامعة السويس، صندوق بريد: 43221، السويس، مصر. قسم نظم المعلومات، المؤسسة العليا للتسويق والتجارة ونظم المعلومات، القاهرة، مصر. قسم علوم الحاسوب، كلية علوم الحاسوب والمعلومات، جامعة الأميرة نورة بنت عبد الرحمن، صندوق بريد 84428، الرياض 11671، المملكة العربية السعودية. كلية الذكاء الاصطناعي، جامعة دلتا للعلوم والتكنولوجيا، المنصورة 11152، مصر. قسم الاتصالات والإلكترونيات، المعهد العالي للهندسة والتكنولوجيا، المنصورة 35111، مصر. مدرسة تكنولوجيا المعلومات والاتصالات، كلية الهندسة، تصميم وتكنولوجيا المعلومات والاتصالات (EDICT)، بوليتكنك البحرين، صندوق بريد 33349، مدينة عيسى، البحرين. مركز أبحاث العلوم التطبيقية، الجامعة الخاصة للعلوم التطبيقية، عمان، الأردن. مركز أبحاث جامعة جدارا، جامعة جدارا، إربد، الأردن. البريد الإلكتروني: ahmed.elshewey@fci.suezuni.edu.eg
DOI: https://doi.org/10.1038/s41598-024-83592-0
PMID: https://pubmed.ncbi.nlm.nih.gov/39779779
Publication Date: 2025-01-08
OPEN
Enhancing heart disease classification based on greylag goose optimization algorithm and long short-term memory
Abstract
Heart disease is a category of various conditions that affect the heart, which includes multiple diseases that influence its structure and operation. Such conditions may consist of coronary artery disease, which is characterized by the narrowing or clotting of the arteries that supply blood to the heart muscle, with the resulting threat of heart attacks. Heart rhythm disorders (arrhythmias), heart valve problems, congenital heart defects present at birth, and heart muscle disorders (cardiomyopathies) are other types of heart disease. The objective of this work is to introduce the Greylag Goose Optimization (GGO) algorithm, which seeks to improve the accuracy of heart disease classification. GGO algorithm’s binary format is specifically intended to choose the most effective set of features that can improve classification accuracy when compared to six other binary optimization algorithms. The bGGO algorithm is the most effective optimization algorithm for selecting the optimal features to enhance classification accuracy. The classification phase utilizes many classifiers, the findings indicated that the Long Short-Term Memory (LSTM) emerged as the most effective classifier, achieving an accuracy rate of
Over recent years, substantial research has intensified around healthcare, particularly following the Covid-19 pandemic’s impact. The World Health Organization (WHO)
Pathological Heart Rhythm
obesity, and hypertension significantly heighten the probability of cardiovascular ailments
central to heart disease progression. Xanthohumol is a natural compound, effectively inhibits TGF-
Related work
Materials and methods
Greylag goose optimization (GGO) algorithm
| Authors | Techniques used | Accuracy | Dataset |
| Harshit Jindal et al.
|
Random forest, logistic regression, KNN | 87.50% | 304 items, 13 features |
| Otoom et al.
|
Bayes naive, SVM, function trees (FT) | 88.3% (SVM), 83.8% (SVM and Bayes Net), 81.5% (FT) | Cleveland heart disease dataset, 303 cases, 76 features (13 used) |
| Apurb Rajdhan et al.
|
Random forest, Naive bayes, decision trees, logistic regression | 90.16% (Random Forest), 85.25% (Naive Bayes), 85.25% (Decision Trees), 81.97% (Logistic Regression) | Cleveland heart disease dataset, 14 features out of 76 |
| Amin Ul Haq et al.
|
KNN, SVM, logistic regression, decision tree, random forest, Naive Bayes, neural networks | 88% (SVM), 87% (Logistic Regression), 86% (Neural Networks), 89% (Logistic Regression with 10-fold cross-validation) | Cleveland heart disease dataset |
| Rahul Katarya et al.
|
Multilayer perception, decision tree, Naive Bayes, K nearest neighbor, SVM, random forest, ANN, deep neural networks, logistic regression | 95.6% (Random Forest), 93.4% (Logistic Regression), 92.3% (ANN), 99.6% (PSO + Random Forest), 99.65% (PSO + KNN) | UCI repository, 14 features out of 76 |
| Youness Khourdifi et al.
|
Random forest, K-nearest neighbor, neural networks, particle swarm optimization (PSO), ant colony optimization (ACO) | 99.6% (Random Forest + ACO), 99.65% (KNN + ACO) | UCI repository |
Initialize GGO population $mathbf{X}_{i}(i=1,2, ldots, n)$, size $n$, iterations $t_{text {max }}$, objective function $F_{n}$.
Initialize GGO parameters $mathbf{a}, mathbf{A}, mathbf{C}, b, l, c, r_{1}, r_{2}, r_{3}, r_{4}, r_{5}, w, w_{1}, w_{2}, w_{3}, w_{4}, mathbf{A}_{1}, mathbf{A}_{2}, mathbf{A}_{3}, mathbf{C}_{1}, mathbf{C}_{2}, mathbf{C}_{3}, t=1$
Calculate objective function $F_{n}$ for each agents $mathbf{X}_{i}$
Set $mathbf{P}=$ best agent position
Update Solutions in exploration group $left(n_{1}right)$ and exploitation group $left(n_{2}right)$
while $t leq t_{text {max }}$ do
        for ( $i=1: i<n_{1}+1$ ) do
            if $(t % 2==0)$ then
                    if $left(r_{3}<0.5right)$ then
                        if $(|A|<1)$ then
                            Update position of current search agent as $mathbf{X}(t+1)=mathbf{X}^{*}(t)-mathbf{A} cdotleft|mathbf{C} cdot mathbf{X}^{*}(t)-mathbf{X}(t)right|$
                        else
                                Select three random search agents $mathbf{X}_{text {Paddle } 1}, mathbf{X}_{text {Paddle } 2}$, and $mathbf{X}$ Paddle 3
                            Update (z) by the exponential form of $boldsymbol{z}=mathbf{1}-left(frac{boldsymbol{t}}{boldsymbol{t}_{text {max }}}right)^{mathbf{2}}$
                            Update position of current search agent as
                                $mathbf{X}(t+1)=w 1 * mathbf{X}$ Paddle $1+mathbf{z} * w 2 *(mathbf{X}$ Paddle $2-mathbf{X}$ Paddle 3$)+(1-mathbf{z}) * w 3 *(mathbf{X}-mathbf{X}$ Paddle 1$)$
                        end if
                    else
                                Update position of current search agent as
                        $mathbf{X}(t+1)=w_{4} *|mathbf{X} *(t)-mathbf{X}(t)| . e^{b l} . cos (2 pi l)+left[2 w_{1}left(r_{4}+r_{5}right)right] * mathbf{X}^{*}(t)$
                    end if
            else
                        Update individual positions as
                    $mathbf{X}(t+1)=mathbf{X}(t)+mathbf{D}(1+mathbf{z}) * w *left(mathbf{X}-mathbf{X}_{text {Flock } 1}right)$
            end if
    end for
        for ( $i=1: i<n_{2}+1$ ) do
                if ( $t % 2==0$ ) then
                        Calculate $mathbf{X} 1=mathbf{X}$ Sentry1-A1. $mid mathbf{C} 1 . mathbf{X}$ Sentry1-X $mid, mathbf{X} 2=mathbf{X}$ Sentry2- A2. $mid mathbf{C} 2 . mathbf{X}$ Sentry2 $-mathbf{X} mid$,
                        $mathbf{X} mathbf{3}=mathbf{X}$ Sentry3 $-mathbf{A} mathbf{3} . mid mathbf{C} mathbf{3} . mathbf{X}$ Sentry3 $-mathbf{X} mid$
                    Update individual positions as $left.overline{mathbf{X}_{mathbf{i}}}right|_{0} ^{3}$
            else
                        Update position of current search agent as
                        $mathbf{X}(t+1)=mathbf{X}(t)+mathbf{D}(1+mathbf{z}) * w *left(mathbf{X}-mathbf{X}_{text {Flock } 1}right)$
            end if
    end for
    Calculate objective function $F_{n}$ for each $mathbf{X}_{i}$
        Update parameters
        Set $t=t+1$
        Adjust beyond the search space solutions
            if (Best $F_{n}$ is same as previous two iterations) then
                Increase solutions of exploration group ( $n_{1}$ )
                Decrease solutions of exploitation group ( $n_{2}$ )
    end if
end while
Return best agent $mathbf{P}$
Binary GGO optimization algorithm
Initialize GGO population, objective function, and GGO parameters
Convert solution to binary [0 or 1]
Calculate objective function for each agent and get best agent position
Update Solutions in exploration group and exploitation group
while $mathrm{t} leq mathrm{t}_{text {max }}$ do
    for ( $mathrm{i}=1: mathrm{i}<mathrm{n}_{1}+1$ ) do
        if $(mathrm{t} % 2==0)$ then
            if $left(mathrm{r}_{3}<0.5right)$ then
                if $(|mathrm{A}|<1)$ then
                            Update position of current search agent in exploration group
                        else
                            Update position of current search agent based on three random search agents
                        end if
                    else
                        Update position of current search agent
                            end if
                    else
                        Update individual positions
                    end if
        end for
        for ( $mathrm{i}=1: mathrm{i}<mathrm{n} 2+1$ ) do
            if $(mathrm{t} % 2==0)$ then
                    Update position of current search agent in exploitation group
            else
                    Update position of current search agent
                end if
        end for
        Convert updated solution to binary
        Calculate objective function
        Update parameters
        Adjust beyond the search space solutions
        Update Solutions in exploration group and exploitation group
    end while
Return best agent
The long short-term memory (LSTM)
while errors are computed and sent backward to adjust the network parameters. These networks incorporate feedback loops within their hidden layers, allowing information to circulate bidirectionally, thereby enabling the hidden state to retain knowledge from previous time steps. As a result, the model’s output is influenced by earlier predictions. However, traditional RNNs struggle to capture long-term dependencies, primarily due to the issue of vanishing gradients, where the influence of earlier information diminishes as it propagates through more time steps. This phenomenon leads to the network primarily encoding short-term dependencies, with information from earlier steps fading over time. The gradient of the loss function approaches zero as more layers with activation functions are added, exacerbating this issue. LSTM networks, or LSTM-ANNs, address this challenge by introducing memory units and gating mechanisms that enable the model to capture long-term dependencies. The inclusion of cell states and three distinct gates allows LSTMs to selectively retain or discard information, making them capable of learning dependencies across thousands of time steps. Thus, LSTM networks are adept at remembering and forgetting critical information, allowing them to model long-term temporal relationships with far greater effectiveness than conventional RNNs
The proposed framework
Experimental results
Dataset description
| Hyperparameter | Values |
| Number of nodes | 256 |
| Number of hidden layers | 4 |
| Dropout | 0.5 |
| Activation function | Relu |
| Learning rate | 0.001 |
| Number of epochs | 100 |
| Batch size | 64 |
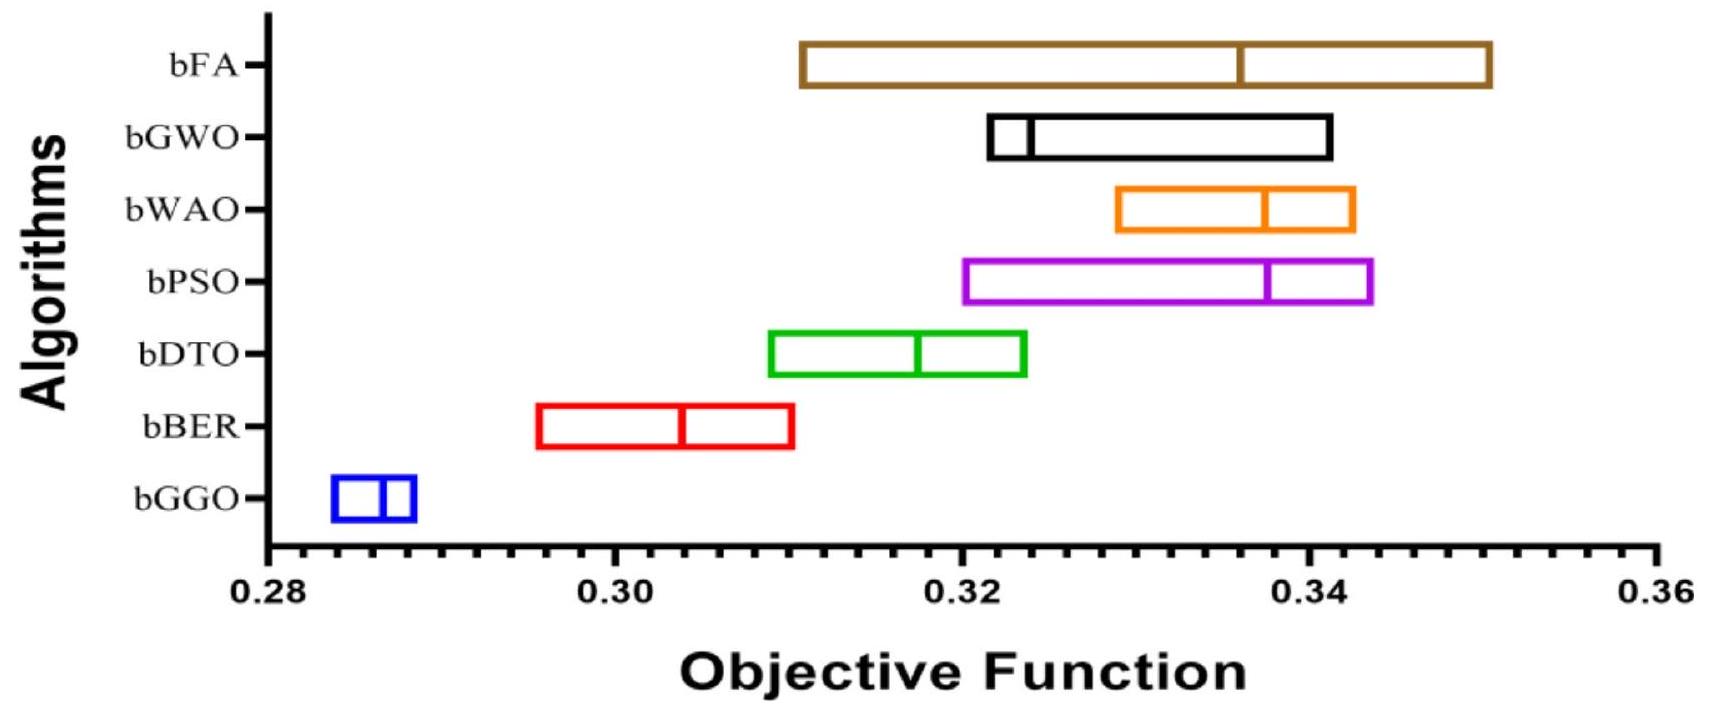
Feature selection results
| bGGO | bBER | bDTO | BPSO | bWAO | bGWO | bFAO | |
| Average error | 0.286625 | 0.303825 | 0.317425 | 0.337625 | 0.337425 | 0.323925 | 0.336025 |
| Average select size | 0.239425 | 0.439425 | 0.381825 | 0.439425 | 0.602825 | 0.362225 | 0.473925 |
| Average fitness | 0.349825 | 0.366025 | 0.377425 | 0.364425 | 0.372225 | 0.372125 | 0.416325 |
| Best fitness | 0.251625 | 0.286325 | 0.280725 | 0.344725 | 0.336325 | 0.349925 | 0.335025 |
| Worst fitness | 0.350125 | 0.353225 | 0.395825 | 0.412425 | 0.412425 | 0.426125 | 0.432625 |
| Standard deviation fitness | 0.172125 | 0.176825 | 0.178425 | 0.176225 | 0.178425 | 0.177425 | 0.213025 |
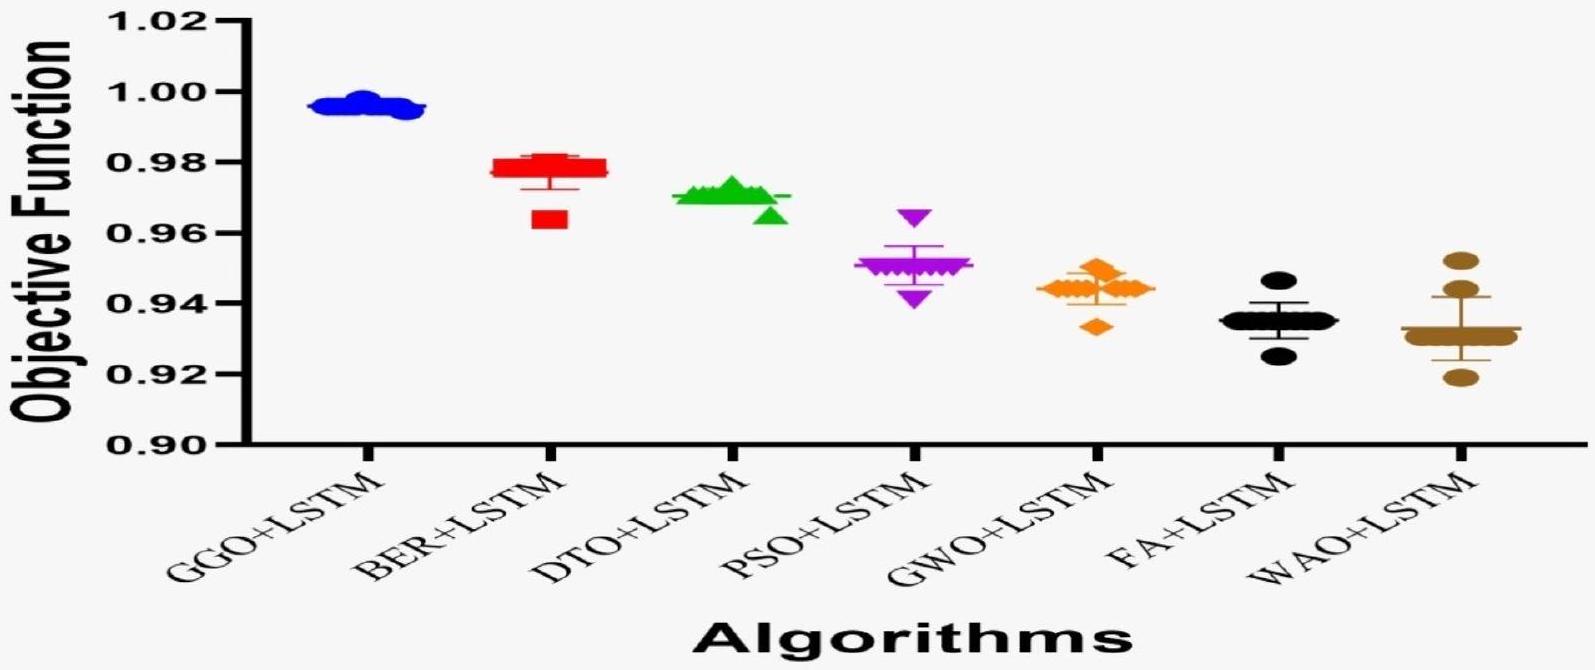
Classification results
Average Error
| bGGO | bBER | bDTO | bPSO | bWAO | bGWO | bFAO | |
| P value (two tailed) | 0.002 | 0.002 | 0.002 | 0.002 | 0.002 | 0.002 | 0.002 |
| Exact or estimate? | Exact | Exact | Exact | Exact | Exact | Exact | Exact |
| Significant (alpha
|
Yes | Yes | Yes | Yes | Yes | Yes | Yes |
| Discrepancy | 0.2866 | 0.3038 | 0.3174 | 0.3376 | 0.3374 | 0.3239 | 0.336 |
| ANOVA table | SS | DF | MS | F (DFn, DFd) | P value |
| Treatment | 0.02167 | 6 | 0.003612 |
|
|
| Residual | 0.002002 | 63 |
|
||
| Total | 0.02368 | 69 |
| Models | Accuracy | Sensitivity (TRP) | Specificity (TNP) |
|
Nvalue (NPV) | F-Score |
| SVC classifier | 0.8294393 | 0.856031128 | 0.789473684 | 0.859375 | 0.7848837 | 0.8577 |
| SGD classifier | 0.840909 | 0.86614173 | 0.80645161 | 0.859375 | 0.8152174 | 0.86274 |
| Gaussian NB classifier | 0.845474 | 0.87265917 | 0.80645161 | 0.86617100 | 0.8152174 | 0.86940 |
| K-nearest neighbor (KNN) Classifier | 0.849137 | 0.87265917 | 0.81725888 | 0.86617100 | 0.8256410 | 0.86940 |
| Decision tree (DT) classifier | 0.864806 | 0.88345864 | 0.84 | 0.88014981 | 0.84422110 | 0.88180 |
| Random forest (RF) classifier | 0.894736 | 0.88679245 | 0.90163934 | 0.88679245 | 0.90163934 | 0.88679 |
| LSTM | 0.917948 | 0.90733590 | 0.92638036 | 0.90733590 | 0.92638036 | 0.90733 |
| Models | Accuracy | Sensitivity (TRP) | Specificity (TNP) |
|
N value (NPV) | F-score |
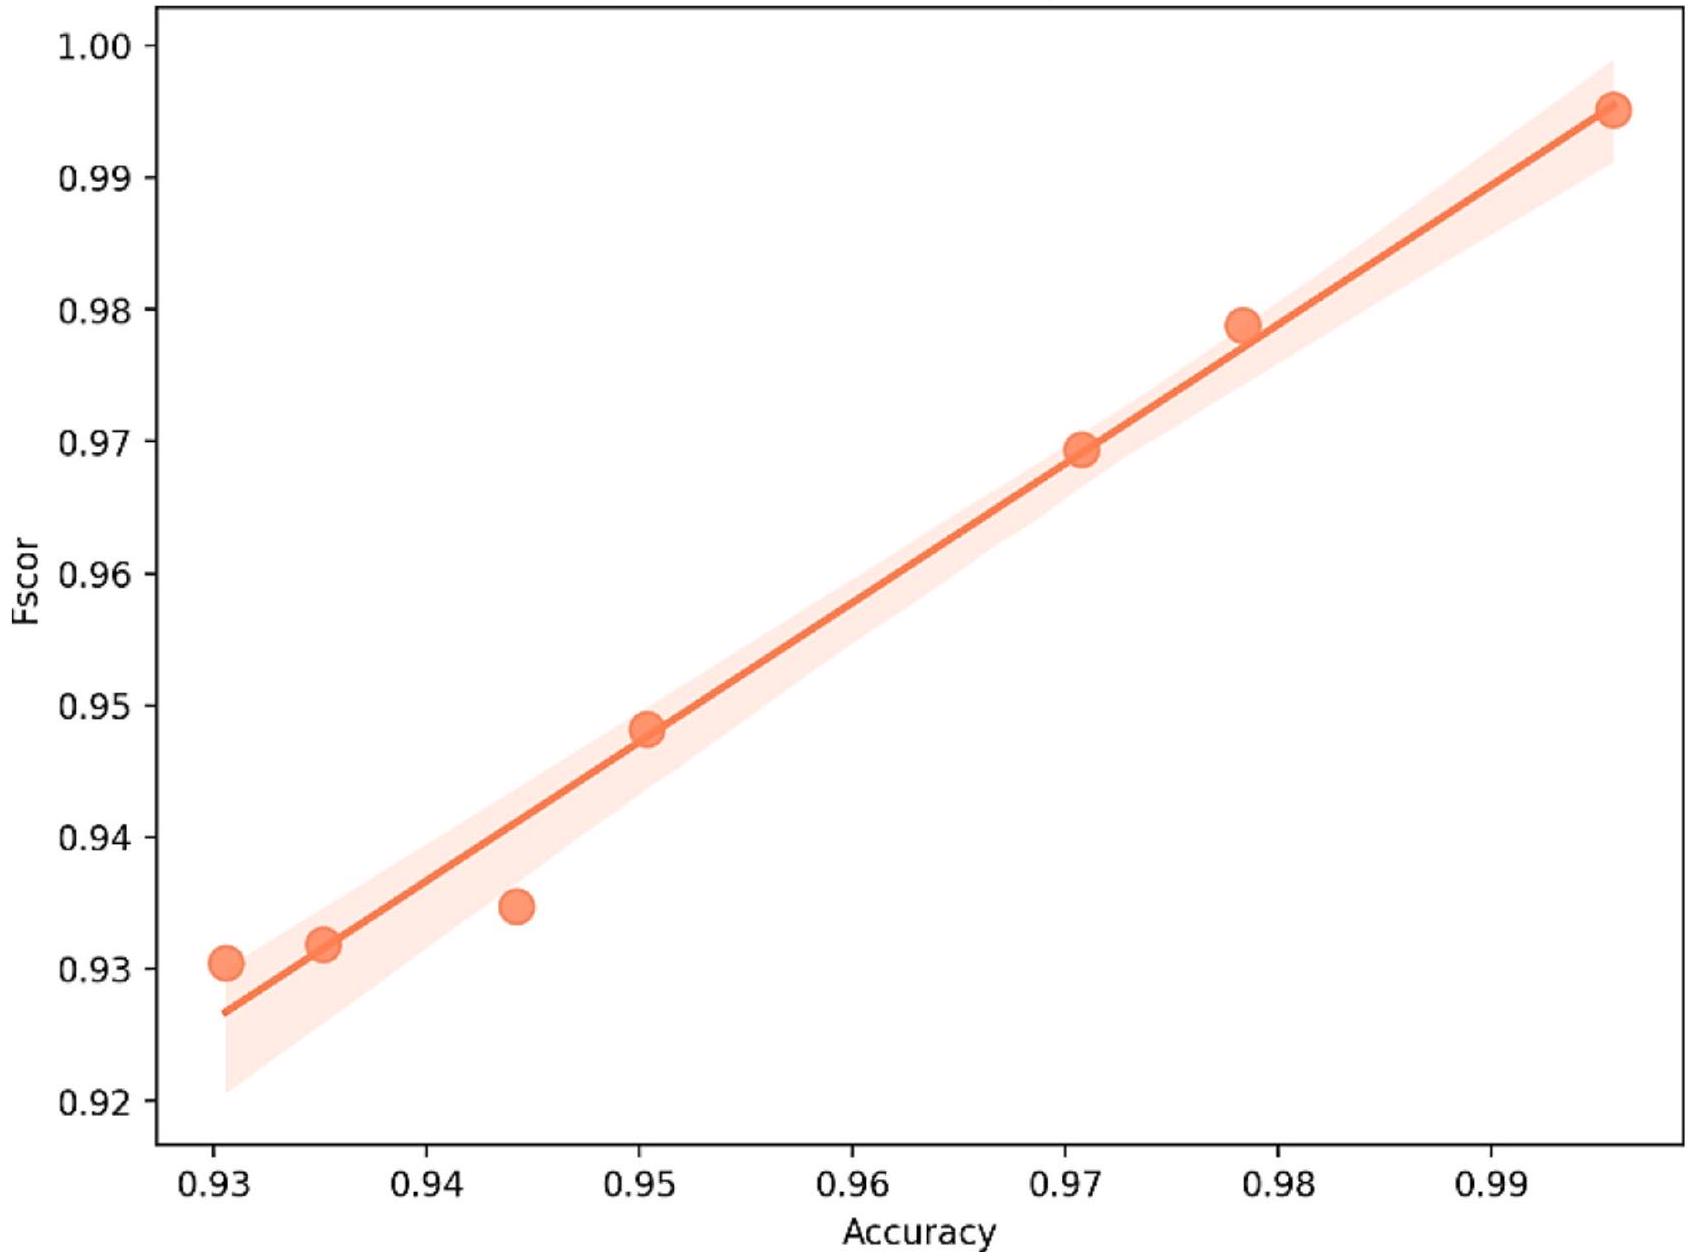
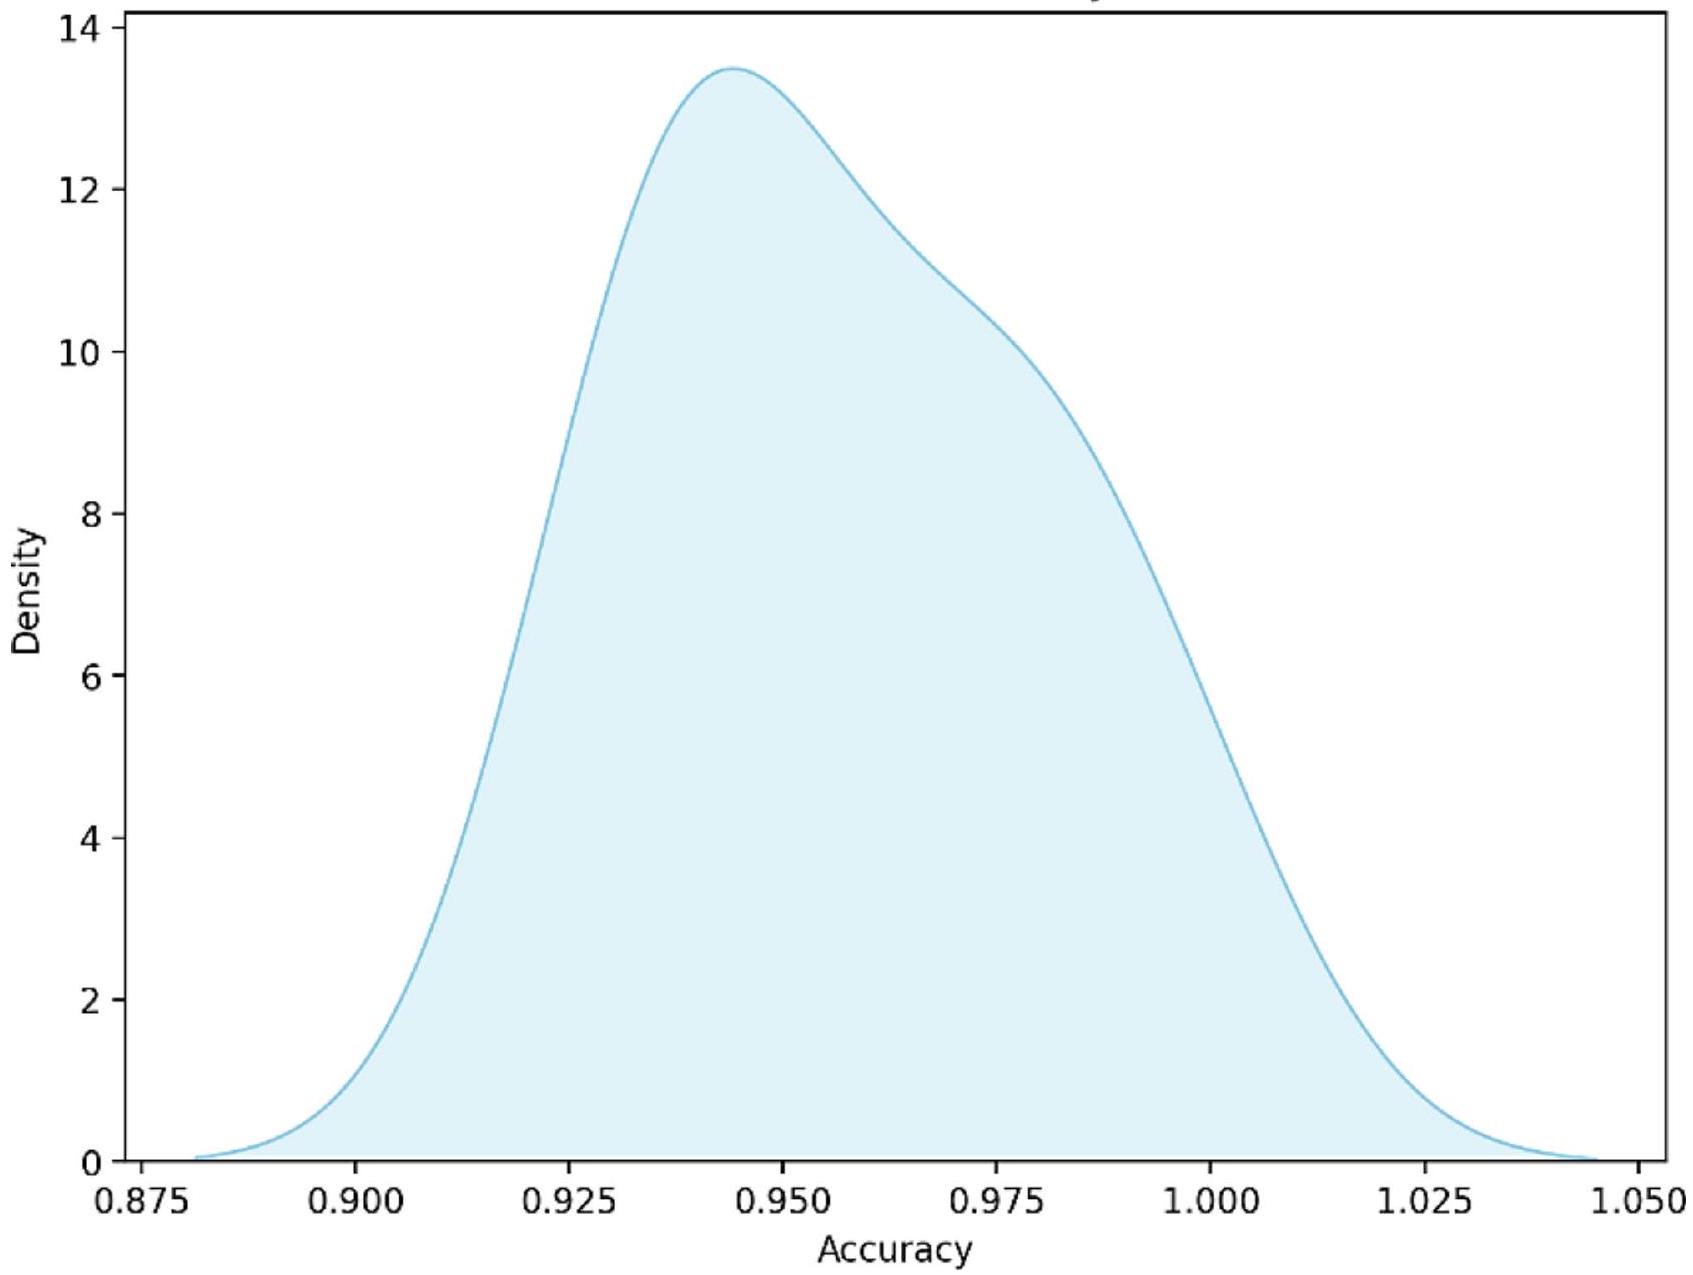
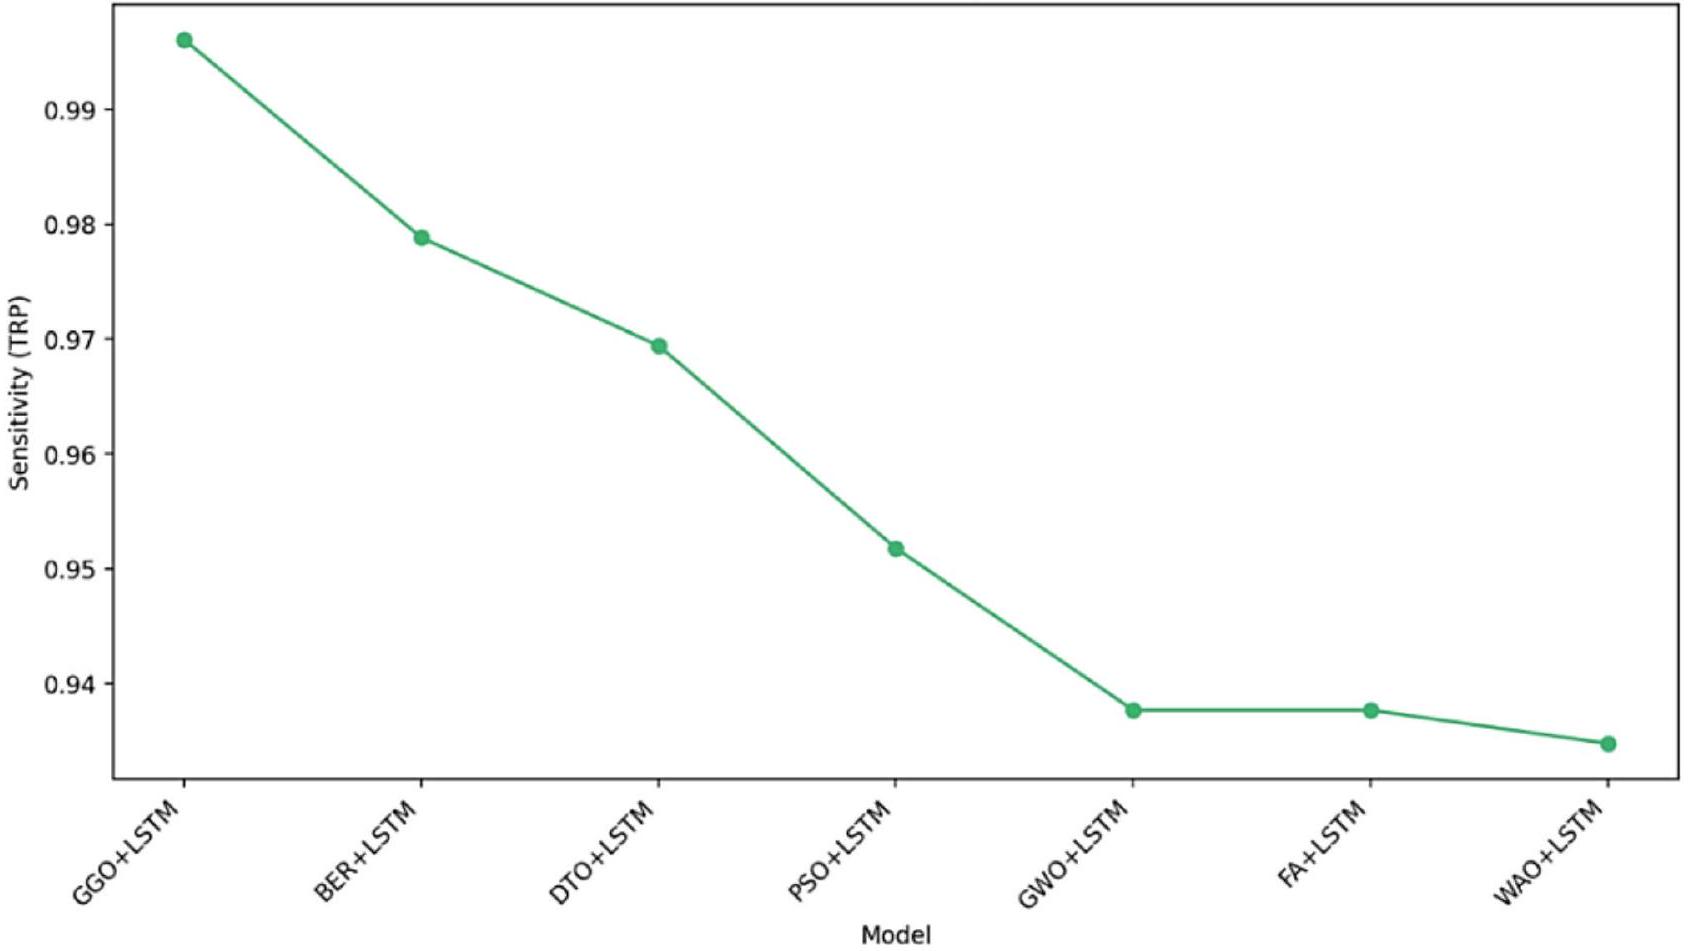
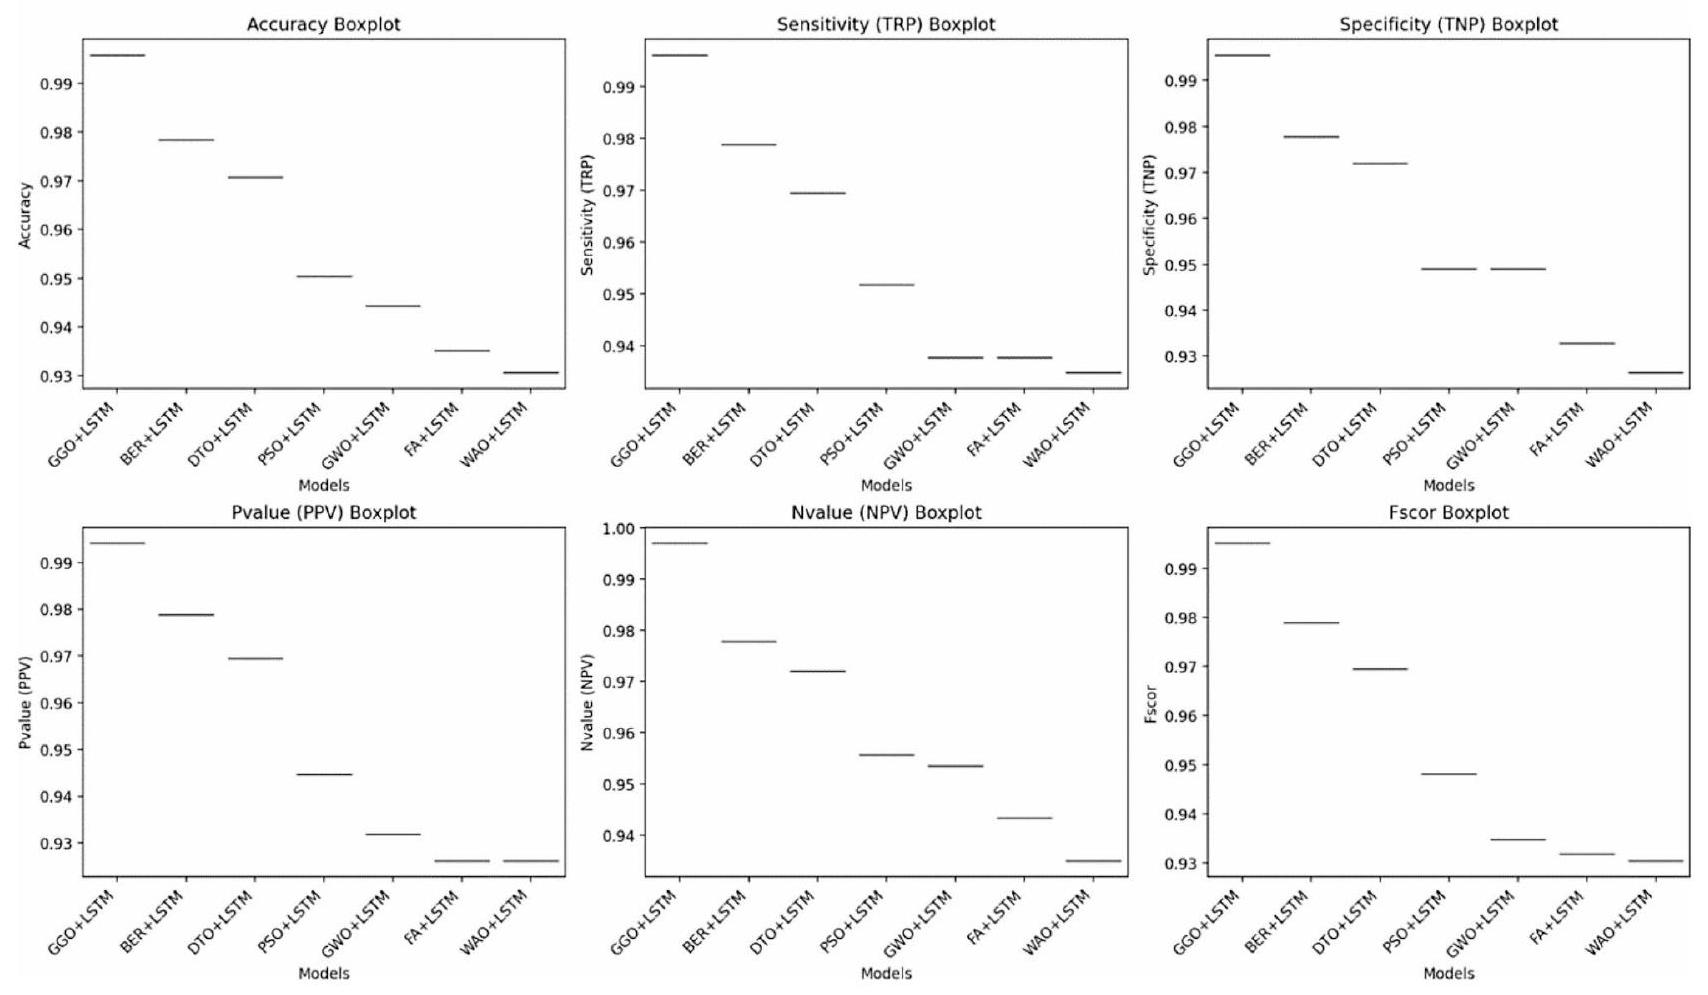
| GGO + LSTM | 0.995763 | 0.996086 | 0.995516 | 0.994141 | 0.997006 | 0.995112 |
| BER + LSTM | 0.978346 | 0.978846 | 0.977823 | 0.978846 | 0.977823 | 0.978846 |
| DTO + LSTM | 0.970742 | 0.969432 | 0.971944 | 0.969432 | 0.971944 | 0.969432 |
| PSO + LSTM | 0.950363 | 0.951777 | 0.949074 | 0.944584 | 0.955711 | 0.948167 |
| GWO + LSTM | 0.944223 | 0.937695 | 0.949074 | 0.931889 | 0.953488 | 0.934783 |
| FAO + LSTM | 0.935103 | 0.937695 | 0.932773 | 0.926154 | 0.943343 | 0.931889 |
| WAO + LSTM | 0.930556 | 0.934783 | 0.92638 | 0.926154 | 0.934985 | 0.930448 |
| ANOVA table | SS | DF | MS | F (DFn, DFd) | P value |
| Treatment | 0.0334 | 6 | 0.005567 |
|
|
| Residual | 0.001638 | 63 | 0.000026 | ||
| Total | 0.03504 | 69 |
| GGO+LSTM | BER + LSTM | DTO + LSTM | PSO+LSTM | GWO + LSTM | FAO + LSTM | WAO+LSTM | |
| P value (two tailed) | 0.002 | 0.002 | 0.002 | 0.002 | 0.002 | 0.002 | 0.002 |
| Exact or estimate? | Exact | Exact | Exact | Exact | Exact | Exact | Exact |
| Significant
|
Yes | Yes | Yes | Yes | Yes | Yes | Yes |
| Discrepancy | 0.9958 | 0.9783 | 0.9707 | 0.9504 | 0.9442 | 0.9351 | 0.9306 |
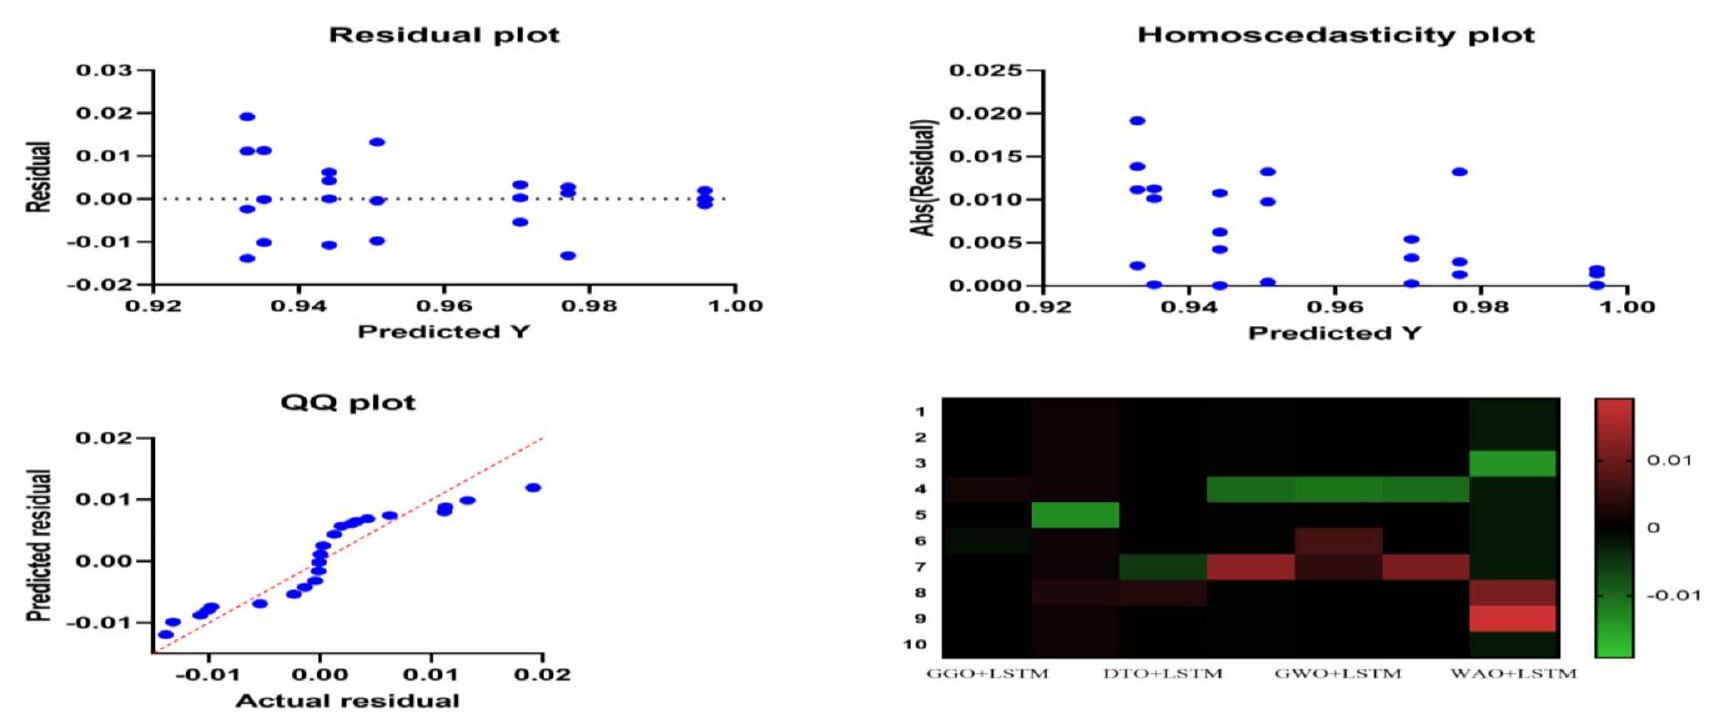
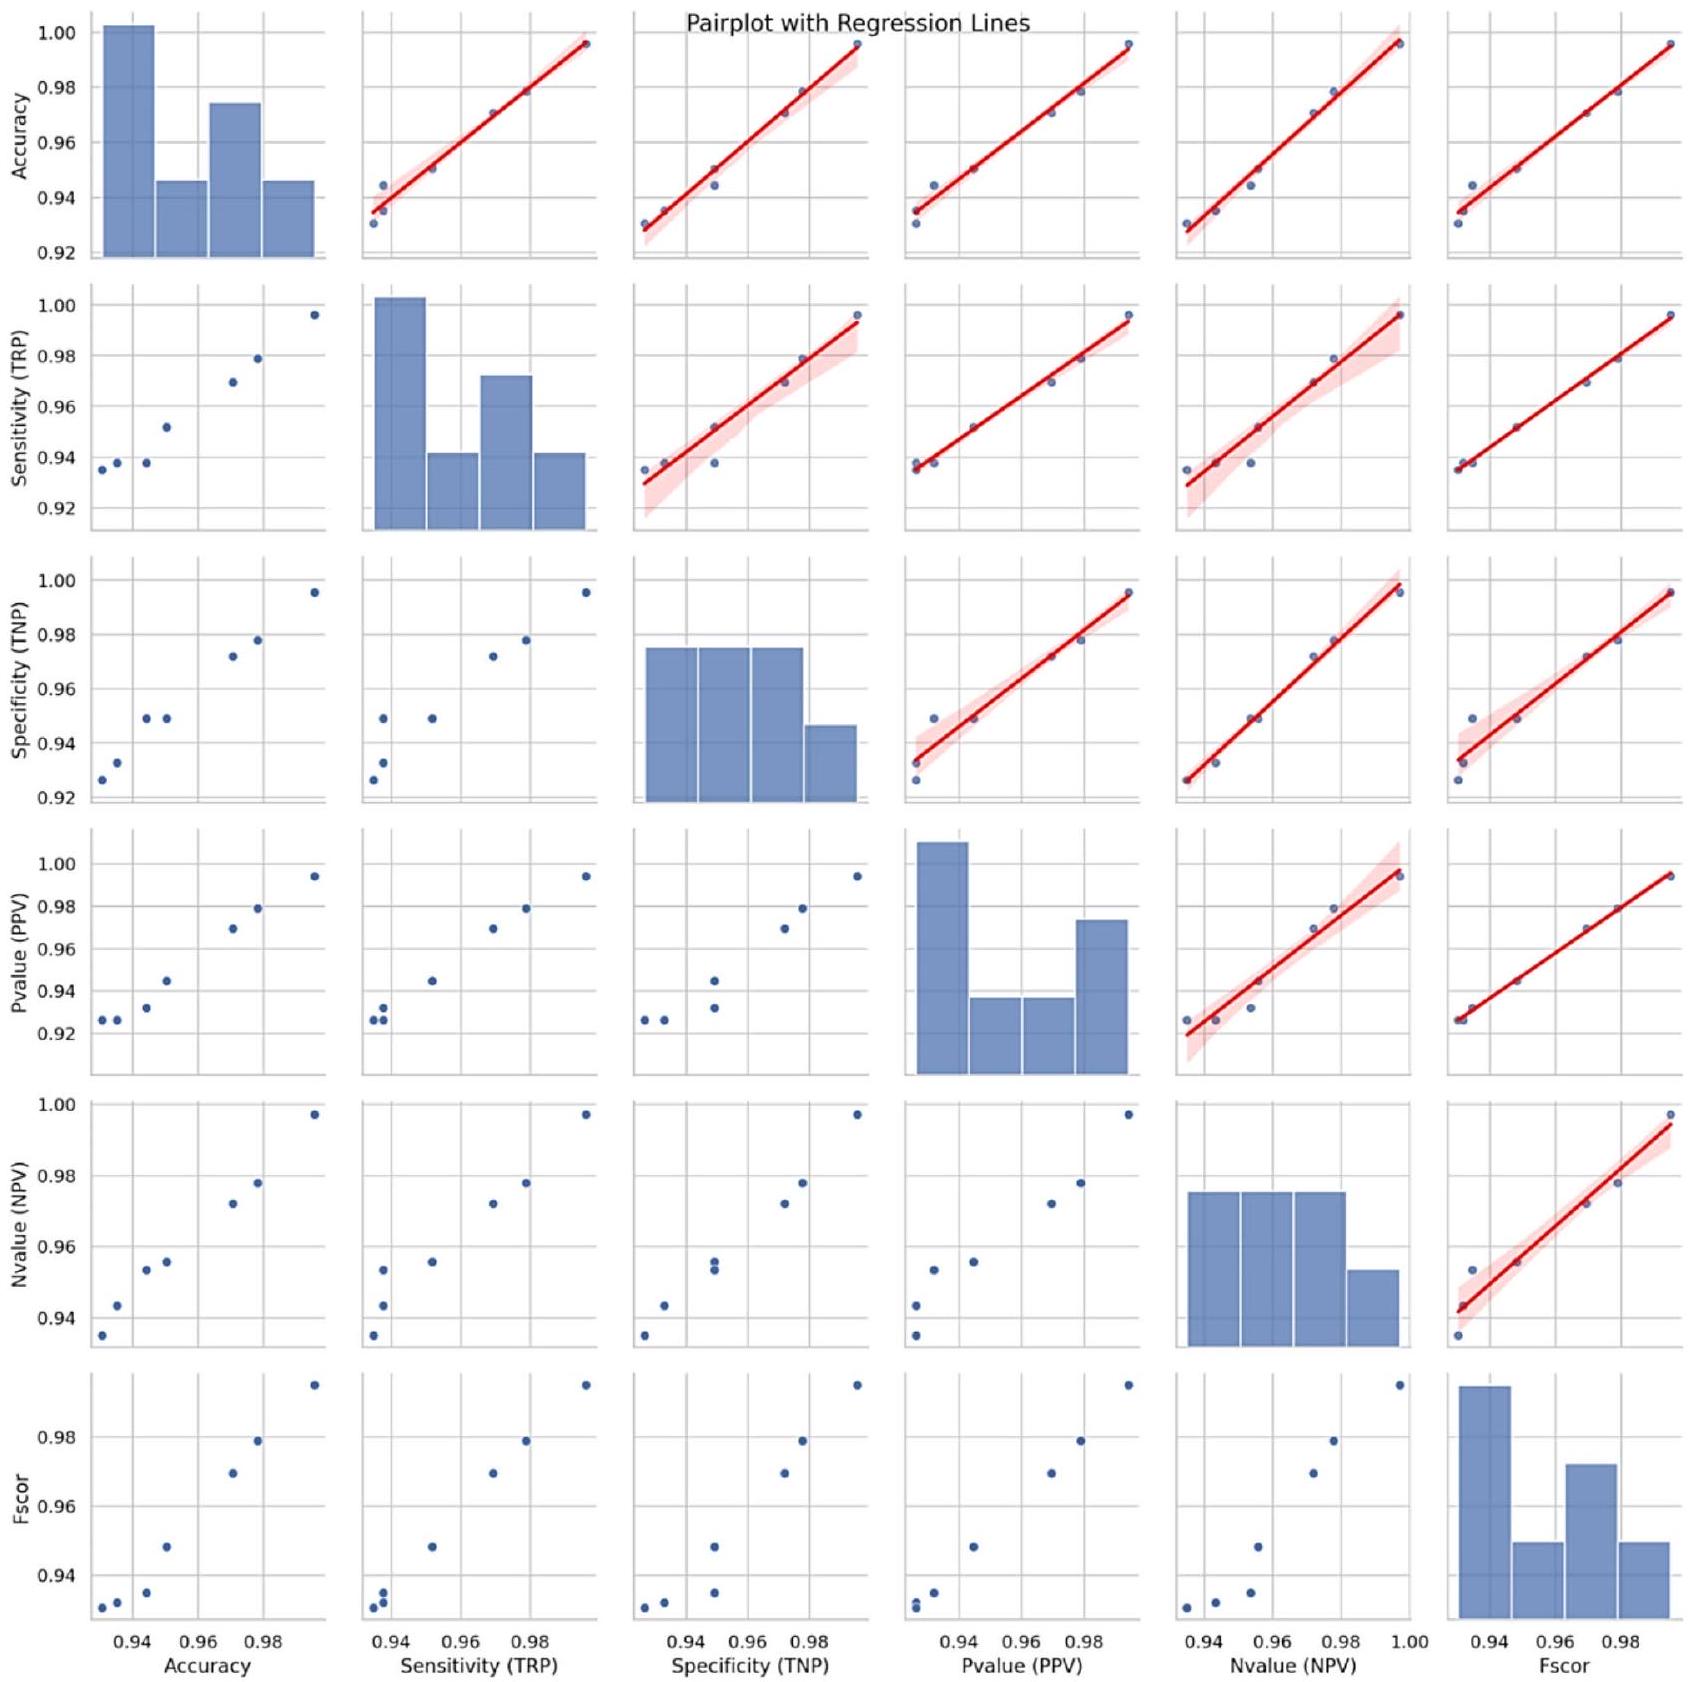
Classification results analysis
Regression Plot: Accuracy vs. F-Score
KDE Plot of Accuracy
Sensitivity (TRP) by Model
Conclusion and future work
| Study | Models | Accuracy (%) |
| Ref
|
Combination of (random forest, logistic regression, and KNN) | 87.5 |
| Ref
|
Support vector machine | 88.3 |
| Ref
|
Random Forest | 90.16 |
| Ref
|
SVM, Logistic Regression, Neural Networks | 89 |
| This study | GGO for feature selection, LSTM for classification | 99.58 |
Data availability
Published online: 08 January 2025
References
- World Health Organization, Cardiovascular Diseases, WHO, Geneva, Switzerland. https://www.who.int/healthtopics/cardiovascu lar-diseases/ (2020).
- American Heart Association, Classes of Heart Failure, American Heart Association,Chicago, IL, USA. https://www.heart.org/en/h ealth-topics/heart-failure/what-is-heartfailure/%20classes-of-heart-failure (2020).
- American Heart Association, Heart Failure, American Heart Association, Chicago,IL, USA. https://www.heart.org/en/health-topi cs/heart-failure (2020).
- Elshewey, A. M. & Osman, A. M. Orthopedic disease classification based on breadth-first search algorithm. Sci. Rep. 14 (1), 23368 (2024).
- Elkenawy, E. S., Alhussan, A. A., Khafaga, D. S., Tarek, Z. & Elshewey, A. M. Greylag goose optimization and multilayer perceptron for enhancing lung cancer classification. Sci. Rep. 14 (1), 23784 (2024).
- Elshewey, A. M., Alhussan, A. A., Khafaga, D. S., Elkenawy, E. S. & Tarek, Z. EEG-based optimization of eye state classification using modified-BER metaheuristic algorithm. Sci. Rep. 14 (1), 24489 (2024).
- El-Rashidy, N., Tarek, Z., Elshewey, A. M. & Shams, M. Y. Multitask multilayer-prediction model for predicting mechanical ventilation and the associated mortality rate. Neural Comput. Appl. 1-23 (2024).
- Hosny, K. M., Mohammed, M. A., Salama, R. A. & Elshewey, A. M. Explainable ensemble deep learning-based model for brain tumor detection and classification. Neural Comput. Appl. 1-18 (2024).
- Alzakari, S. A., Alhussan, A. A., Qenawy, A. S., Elshewey, A. M. & Eed, M. An enhanced long short-term memory recurrent neural network deep learning model for potato price prediction. Potato Res. 1-9 (2024).
- Elshewey, A. M. et al. Optimizing HCV Disease Prediction in Egypt: The hyOPTGB Framework. Diagnostics 13 (22), 3439 (2023).
- Deserno, T. M., Antani, S. & Long, R. Ontology of gaps in content-based image retrieval. J. Digit. Imaging 22, 202-215 (2009).
- Ezugwu, A. E. et al. Metaheuristics: A comprehensive overview and classification along with bibliometric analysis. Artif. Intell. Rev. 54, 4237-4316 (2021).
- Mehta, P., Kumar, S. & Tejani, G. G. MOBBO: A multiobjective brown bear optimization algorithm for solving constrained structural optimization problems. J. Optim. 2024 (1), 5546940 (2024).
- Mashru, N., Tejani, G. G., Patel, P. & Khishe, M. Optimal truss design with MOHO: A multi-objective optimization perspective. Plos One 19 (8), e0308474 (2024).
- Nonut, A. et al. A small fixed-wing UAV system identification using metaheuristics. Cogent Eng. 9 (1), 2114196 (2022).
- Xia, J. Y. et al. Metalearning-based alternating minimization algorithm for nonconvex optimization. IEEE Trans. Neural Netw. Learn. Syst. 34 (9), 5366-5380 (2022).
- Su, Y. et al. Colon cancer diagnosis and staging classification based on machine learning and bioinformatics analysis. Comput. Biol. Med. 145, 105409 (2022).
- Jiang, C. et al. Xanthohumol inhibits TGF-
-induced cardiac fibroblasts activation via mediating PTEN/Akt/mTOR signaling pathway. Drug. Des. Devel. Ther. 14, 5431-5439(2020). - Deng, J. et al. The Janus face of mitophagy in myocardial ischemia/reperfusion injury and recovery. Biomed. Pharmacother. 173, 116337 (2024).
- Katarya, R. & Meena, S. K. Machine learning techniques for heart disease prediction: A comparative study and analysis, Health and Technology. 11(1), 87-97 (2023).
- Otoom, A. F., Abdallah, E. E., Kilani, Y., Kefaye, A. & Ashour, M. Effective diagnosis and monitoring of heart disease. Int. J. Softw. Eng. Its Appl. 9 (1), 143-156 (2023).
- Rajdhan, A., Agarwal, A., Sai, M. & Ghuli, P. Heart disease prediction using machine learning. Int. J. Res. Technol. 9 (04), 659-662 (2024).
- Haq, A. U., Li, J. P., Memon, M. H., Nazir, S. & Sun, R. A hybrid intelligent system framework for the prediction of heart disease using machine learning algorithms. Mob. Inf. Syst. 2018 (2018).
- Rimm, E. B., Stampfer, M. J. & Willett, W. C. Body size and fat distribution as predictors of coronary heart disease among middleaged and older us men. Am. J. Epidemiol. 141 (12), 1117-1127 (2022).
- Khourdifi, Y. & Bahaj, M. Heart disease prediction and classification using machine learning algorithms optimized by particle swarm optimization and ant colony optimization. Int. J. Intell. Eng. Syst. 12 (1), 242-252 (2019).
- El-kenawy, E. S. M. et al. Greylag goose optimization: Nature-inspired optimization algorithm. Expert Syst. Appl. 238, 122147 (2024).
- Hayrettin, O. Deep learning for subtyping and prediction of diseases: Long-short term memory. Energy Rep. 6, 1147-1159 (2022).
- Mirjalili, S. SCA: A sine cosine algorithm for solving optimization problems. Knowl. Based Syst. 96, 120-133 (2016).
- Zaki, A. M., Towfek, S. K., Gee, W., Zhang, W. & Soliman, M. A. Advancing parking space surveillance using a neural network approach with feature extraction and dipper throated optimization integration. J. Artif. Intell. Metaheuristics 6 (Issue 2), 16-25 (2023).
- Piotrowski, A. P., Napiorkowski, J. J. & Piotrowska, A. E. Particle swarm optimization or differential evolution-A comparison. Eng. Appl. Artif. Intell. 121, 106008 (2023).
- Mirjalili, S. & Lewis, A. The whale optimization algorithm. Adv. Eng. Softw. 95, 51-67 (2016).
- Al-Tashi, Q., Md Rais, H., Abdulkadir, S. J., Mirjalili, S. & Alhussian, H. A review of grey wolf optimizer-based feature selection methods for classification. Evol. Mach. Learn. Tech. Algorithms Appl. ;273-286. (2020).
- de Vasconcelos Segundo, E. H., Mariani, V. C. & dos Santos Coelho, L. Design of heat exchangers using falcon optimization algorithm. Appl. Therm. Eng. 156, 119-144 (2019).
- Saigal, P. & Khanna, V. Multi-category news classification using support vector machine based classifiers. SN Appl. Sci. 2 (3), 458 (2020).
- Shams, M. Y. et al. A machine learning-based model for predicting temperature under the effects of climate change. in The Power of Data: Driving Climate Change with Data Science and Artificial Intelligence Innovations 61-81 (Springer, 2023).
- Fouad, Y., Osman, A. M., Hassan, S. A., El-Bakry, H. M. & Elshewey, A. M. Adaptive visual sentiment prediction model based on event concepts and object detection techniques in social media. Int. J. Adv. Comput. Sci. Appl. 14 (7), 252-256 (2023).
- Elshewey, A. M., Shams, M. Y., Tarek, Z., Megahed, M. & El-kenawy, E. S. M., El-dosuky, M. A. Weight prediction using the hybrid stacked-LSTM food selection model. Comput. Syst. Sci. Eng. 46 (1), 765-781 (2023).
- Al Bataineh, A., Kaur, D. & Jalali, S. M. J. Multi-layer perceptron training optimization using nature inspired computing. IEEE Access 10, 36963-36977 (2022).
- Saeed, M. et al. Electrical power output prediction of combined cycle power plants using a recurrent neural network optimized by waterwheel plant algorithm. Front. Energy Res. 11, 1234624 (2023).
- Shams, M. Y., Tarek, Z., El-kenawy, E. S., Eid, M. M. & Elshewey, A. M. Predicting gross domestic product (GDP) using a PC-LSTM-RNN model in urban profiling areas. Comput. Urban Sci. 4 (1), 3 (2024).
- Sun, F. et al. Solid component ratio influences prognosis of GGO-featured IA stage invasive lung adenocarcinoma. Cancer Imaging 20 (1), 87 (2020).
- Rabehi, A. & Kumar, P. Improving tuberculosis diagnosis and forecasting through machine learning techniques: A systematic review. Metaheuristic Optim. Rev. 1 (1), 35-44 (2024).
- Tarek, Z. et al. An optimized model based on deep learning and gated recurrent unit for COVID-19 death prediction. Biomimetics 8 (7), 552 (2023).
- Wang, D., Tan, D. & Liu, L. Particle swarm optimization algorithm: An overview. Soft Comput. 22 (2), 387-408 (2018).
- Gaber, K. S., Elsebaey, M. A. & Ibrahim, A. A. Weather prediction: Predicting rain using weather conditions. J. Artif. Intell. Metaheuristics 8 (1), 60-69 (2024).
- Rezaei, H., Bozorg-Haddad, O. & Chu, X. Grey Wolf Optimization (GWO) Algorithm. in Advanced Optimization by NatureInspired Algorithms [Internet]. (Studies in Computational Intelligence) (ed Bozorg-Haddad, O.) 81-91 ( Springer, 2018). https://doi .org/10.1007/978-981-10-5221-7_9.
- Tang, H. et al. A novel hybrid algorithm based on PSO and FOA for target searching in unknown environments. Appl. Intell. 49 (7), 2603-2622 (2019).
- Alkhammash, E. H., Kamel, A. F., Al-Fattah, S. M. & Elshewey, A. M. Optimized multivariate adaptive regression splines for predicting crude oil demand in Saudi arabia. Discrete Dyn. Nat. Soc. 2022 (1), 8412895 (2022).
- El-kenawy, E. S. et al. Optimized ensemble algorithm for predicting metamaterial antenna parameters. CMC 71 (3), 4989-5003 (2022).
- El-kenawy, E. S. M. et al. Improved weighted ensemble learning for predicting the daily reference evapotranspiration under the semi-arid climate conditions. Environ. Sci. Pollut Res. 29 (54), 81279-81299 (2022).
- Shams, M. Y., El-Kenawy, E. S., Ibrahim, A. & Elshewey, A. M. A hybrid dipper throated optimization algorithm and particle swarm optimization (DTPSO) model for hepatocellular carcinoma (HCC) prediction. Biomed. Signal Process. Control 85, 104908 (2023).
- Alkhammash, E. H., Hadjouni, M. & Elshewey, A. M. A hybrid ensemble stacking model for gender voice recognition approach. Electronics 11 (11), 1750 (2022).
- Alzakari, S. A., Alhussan, A. A., Qenawy, A. S. & Elshewey, A. M. Early detection of potato disease using an enhanced convolutional neural network-long short-term memory deep learning model. Potato Res. 1-9 (2024).
- Alkhammash, E. H. et al. Application of machine learning to predict COVID-19 spread via an optimized BPSO model. Biomimetics
. - Abdelhamid, A. A. et al. Potato harvesting prediction using an Improved ResNet-59 model. Potato Res. 1-20 (2024).
Acknowledgements
Author contributions
Funding
Declarations
Competing interests
Additional information
Reprints and permissions information is available at www.nature.com/reprints.
Publisher’s note Springer Nature remains neutral with regard to jurisdictional claims in published maps and institutional affiliations.
© The Author(s) 2025
Department of Computer Science, Faculty of Computers and Information, Suez University, P.O.BOX:43221, Suez, Egypt. Department of Information Systems, High Institution for Marketing, Commerce & Information Systems, Cairo, Egypt. Department of Computer Sciences, College of Computer and Information Sciences, Princess Nourah bint Abdulrahman University, P.O. Box 84428, Riyadh 11671, Saudi Arabia. Faculty of Artificial Intelligence, Delta University for Science and Technology, Mansoura 11152, Egypt. Department of Communications and Electronics, Delta Higher Institute of Engineering and Technology, Mansoura 35111, Egypt. School of ICT, Faculty of Engineering, Design and Information & Communications Technology (EDICT), Bahrain Polytechnic, PO Box 33349, Isa Town, Bahrain. Applied Science Research Center, Applied Science Private University, Amman, Jordan. Jadara University Research Center, Jadara University, Irbid, Jordan. email: ahmed.elshewey@fci.suezuni.edu.eg