DOI: https://doi.org/10.1038/s43247-025-02169-5
تاريخ النشر: 2025-04-10
تعقيدات سلسلة إمداد البلاستيك العالمية كما تكشفها تحليل تدفق المواد المرتبط بالتجارة
الملخص
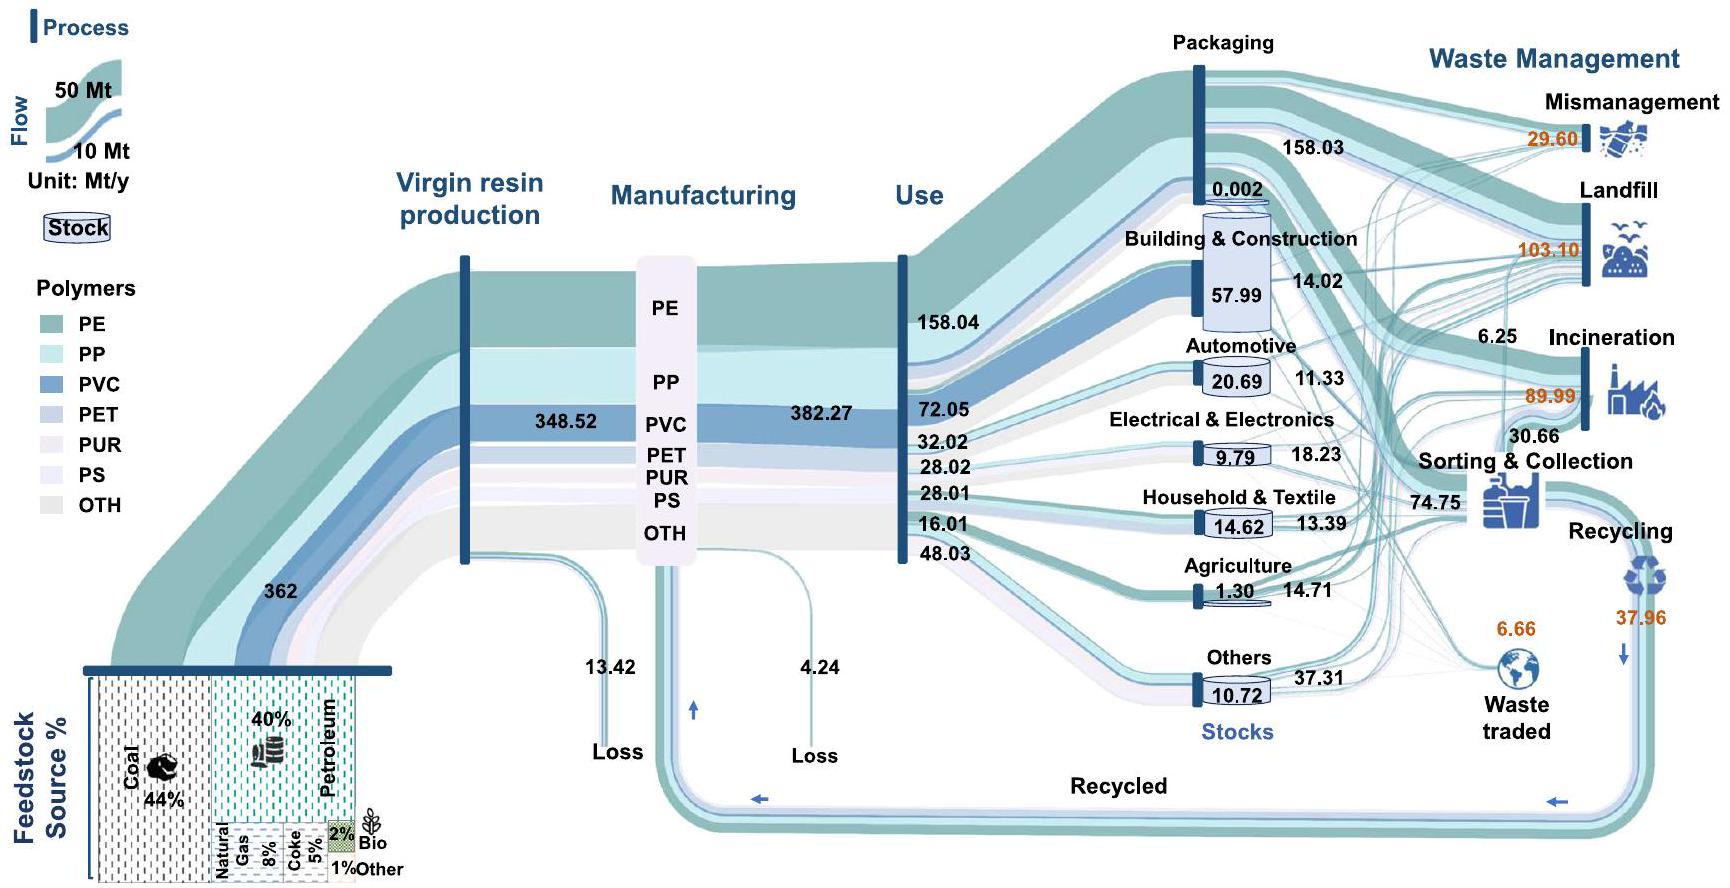
لقد أصبحت البلاستيك جزءًا لا يتجزأ من حياتنا. يتطلب معالجة القضايا البيئية العالمية المتعلقة بالبلاستيك تحليلًا شاملاً على طول سلسلة التوريد بأكملها. هنا، نقدم تحليل تدفق المواد المرتبط بالتجارة العالمية للبلاستيك لعام 2022. على مستوى العالم، تم تداول 436.66 مليون طن (م) من البلاستيك في عام 2022، حيث تمثل المنتجات النهائية وحدها 111 م. تشير نتائجنا إلى أن البلاستيك يخضع لتركيز جغرافي، حيث تتركز المواد الأولية في البلدان الغنية بالموارد النفطية والمعالجة في البلدان ذات القدرة التصنيعية الكبيرة. علاوة على ذلك، هناك تحول كبير في التخلص من النفايات: حيث تبرز الحرق كطريقة بارزة للتخلص من النفايات.
لم يتم تقييمه بشكل شامل على طول سلسلة الإمداد. جير et al.
النتائج
تحليل تدفق المواد البلاستيكية المرتبطة بالتجارة العالمية
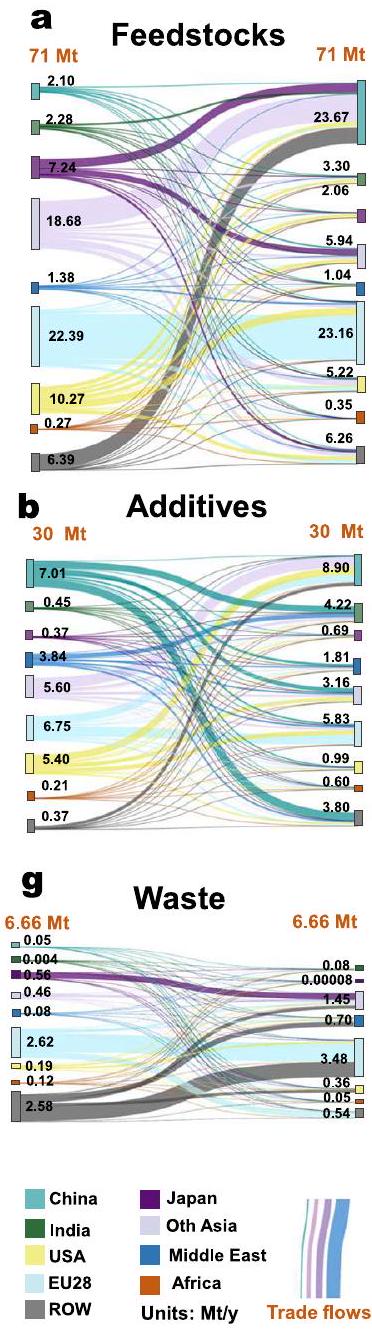
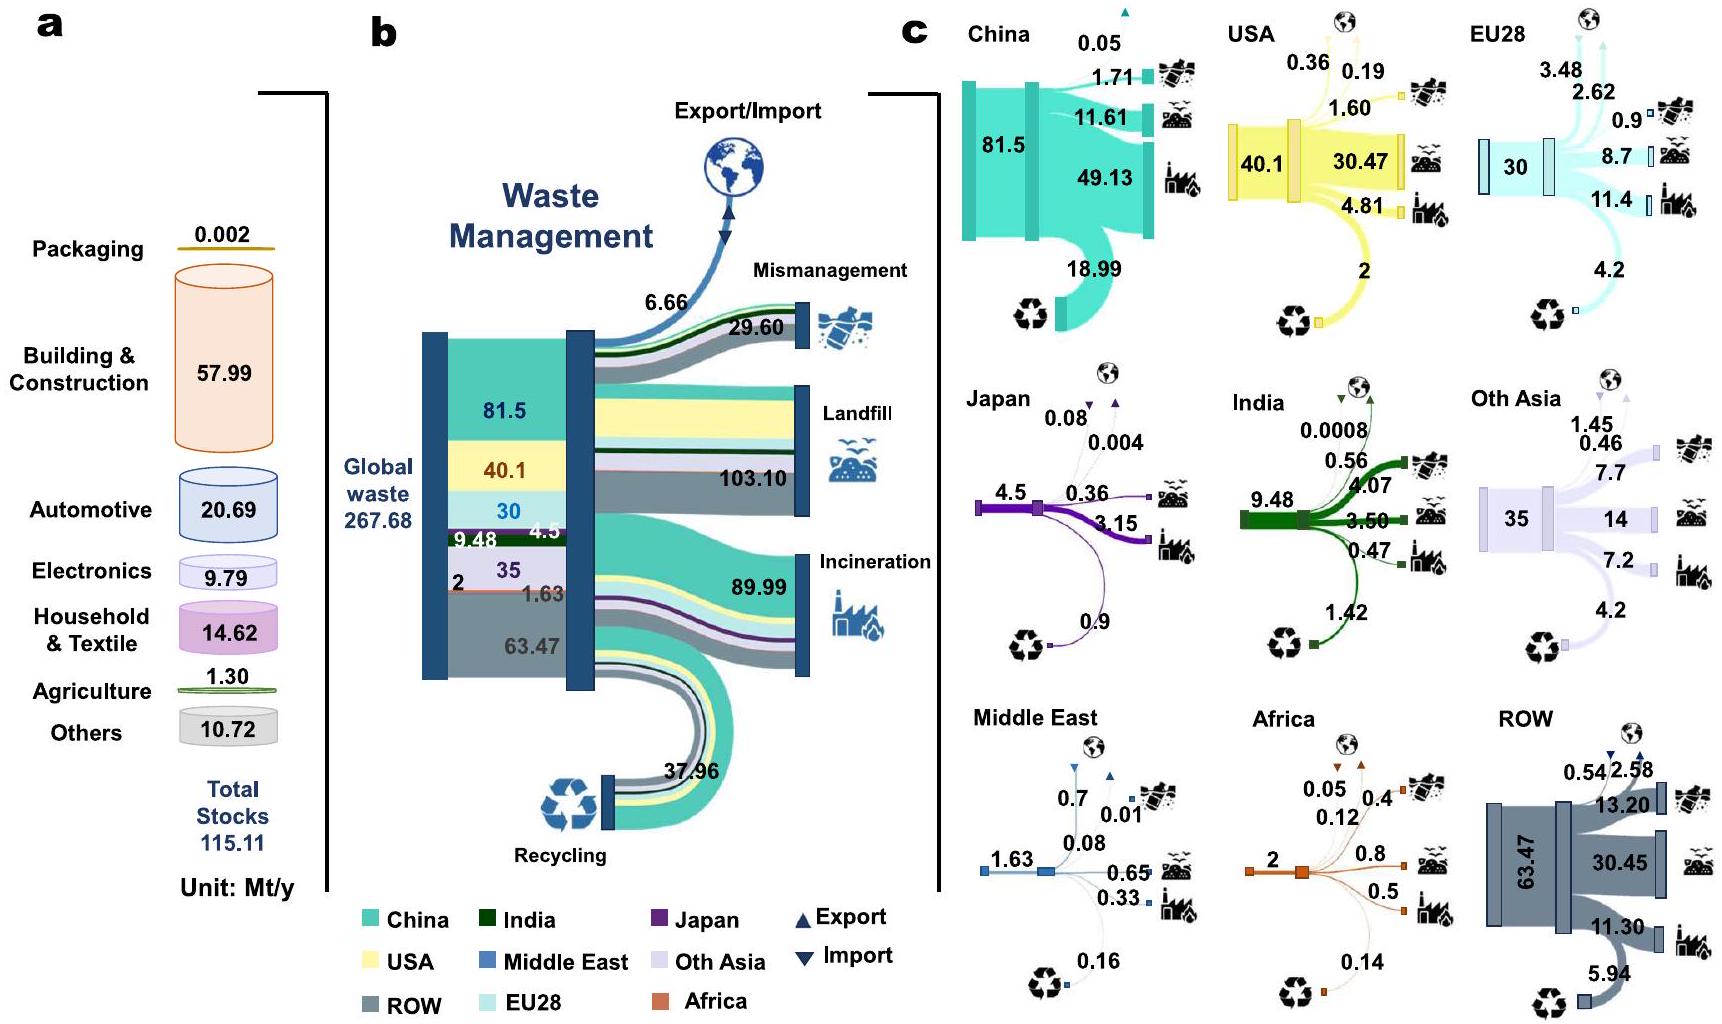
تم دفنها في مكبات النفايات. في المجموع، تم إدارة 29.60 مليون طن من البلاستيك بشكل غير صحيح، وتم دفن 103.10 مليون طن، وتم حرق 89.99 مليون طن. تم تداول ما مجموعه 436.66 مليون طن من البلاستيك في عام 2022 (الشكل 2). من بين ذلك، شكلت تجارة المواد الخام 71 مليون طن (الشكل 2أ). كانت دول الاتحاد الأوروبي 28 أكبر مصدر لمواد البلاستيك الخام.
على طول سلسلة إمداد البلاستيك. يتم التعبير عن القيم التجارية العالمية المرسومة في
المنطقة (
إنتاج واستهلاك البلاستيك على المستوى العالمي والإقليمي
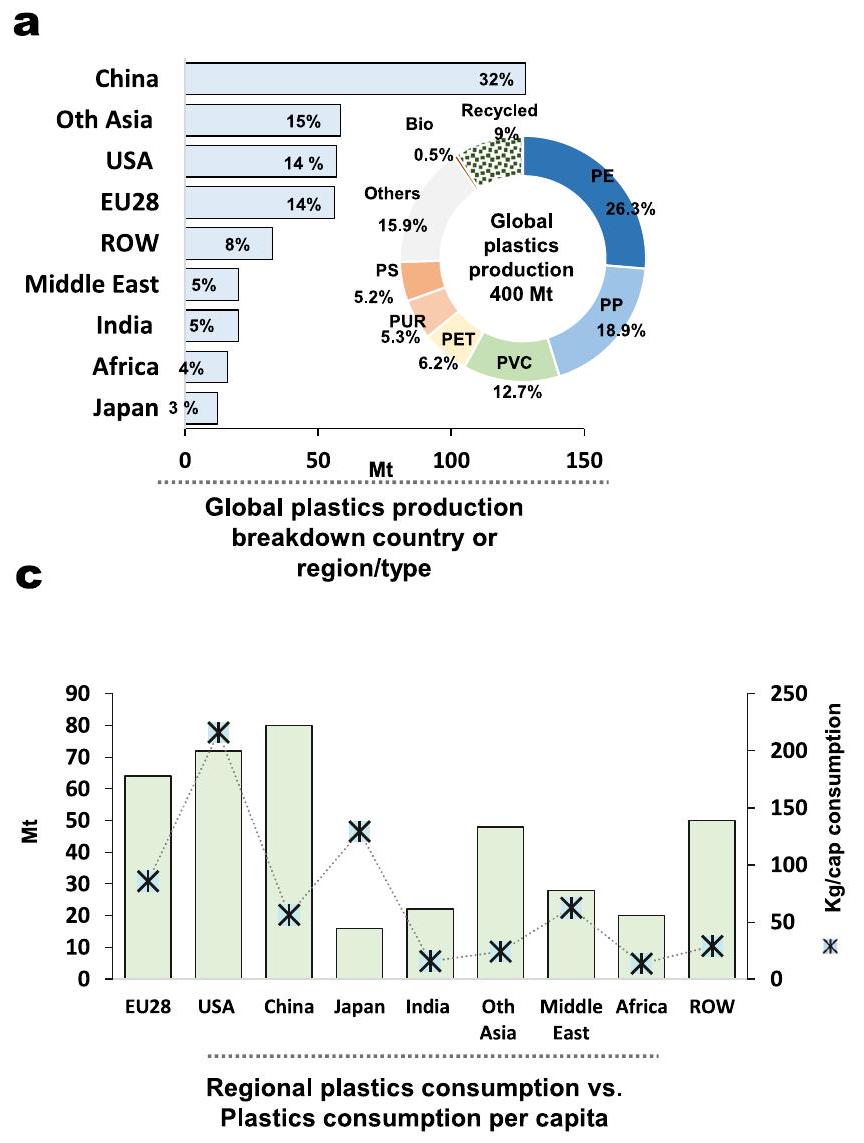
إنتاج البلاستيك للفرد مقابل استهلاك البلاستيك للفرد
إدارة نفايات البلاستيك العالمية والإقليمية
والهند (9.48 مليون طن). أنتجت اليابان والشرق الأوسط وأفريقيا كمية صغيرة نسبيًا من نفايات البلاستيك مقارنةً بـ
إعادة التدوير. انخفض معدل إعادة تدوير البلاستيك في الولايات المتحدة بشكل كبير مقارنةً بعام 2015، عندما وصل معدل إعادة تدوير البلاستيك إلى
نقاش
معضلة مصدر البلاستيك العالمي من الوقود الأحفوري
تنفيذها على نطاق عالمي يمثل تحديًا كبيرًا في السعي نحو حلول مستدامة. نظرًا لهذه المفارقة والخيارات المحدودة للاستبدال المستدام على نطاق واسع، فإن تطبيق مبادئ الاقتصاد الدائري وتقليل تدفقات البلاستيك يظهر كحل حاسم. من خلال التركيز على استراتيجيات مثل إعادة التدوير، وإعادة الاستخدام، وإعادة تصميم المنتجات من أجل الاستدامة، يمكننا تقليل الأثر البيئي للبلاستيك والتحرك نحو مستقبل أكثر استدامة.
التحول العالمي في أنماط تجارة البلاستيك
سمّيتها بناءً على معايير الاتحاد الأوروبي
الآفاق السياسية لإدارة مستدامة لنفايات البلاستيك
(من بين 75 مليون طن تم فرزها وجمعها) يتم إعادة تدويرها. تساهم عدة تحديات في التقدم المحدود في تعزيز ممارسات إعادة التدوير العالمية. إحدى القضايا الرئيسية هي التنوع الكبير وتعقيد المواد البلاستيكية، التي تشمل أنواعًا ودرجات وإضافات مختلفة
تواجه أنظمة إدارة النفايات في أفريقيا تحديات غير مسبوقة بسبب التحضر. إن جمع النفايات غير الكافي، وممارسات التخلص غير السليمة، والبنية التحتية المحدودة لإعادة التدوير تزيد من تلوث البيئة، ومخاطر الصحة البشرية، واستنزاف الموارد في القارة.
مبادئ الاقتصاد الدائري لإدارة مستدامة عالمية للبلاستيك
قيود الدراسة
القدرة على تقديم تحليلات مفصلة لإنتاج وإزالة المواد المضافة المحددة. لقد ركزنا بشكل أساسي على المواد المضافة الأكثر استخدامًا وتداولًا، والتي قد لا تعكس الطيف الكامل للمواد المضافة البلاستيكية المتداولة. في الأبحاث المستقبلية، نهدف إلى التعمق في مجموعة متنوعة من البلاستيك والمواد المضافة لتقديم فهم أكثر شمولاً لتدفقاتها وتأثيراتها الفردية. بالإضافة إلى ذلك، لا تأخذ دراستنا في الاعتبار الدور الكبير لأنظمة إعادة التدوير غير الرسمية، التي تلعب دورًا حيويًا في إدارة النفايات البلاستيكية العالمية. قد يؤثر هذا النقص في الشمولية على دقة معدل إعادة التدوير العالمي، الذي قد يكون أعلى إذا تم احتساب إعادة تدوير النفايات غير الرسمية. يجب أن تأخذ الأبحاث المستقبلية في الاعتبار دمج البيانات من شبكات إعادة التدوير غير الرسمية للحصول على رؤية أكثر شمولية لإدارة النفايات البلاستيكية وممارسات إعادة التدوير في جميع أنحاء العالم.
الاستنتاجات
طرق
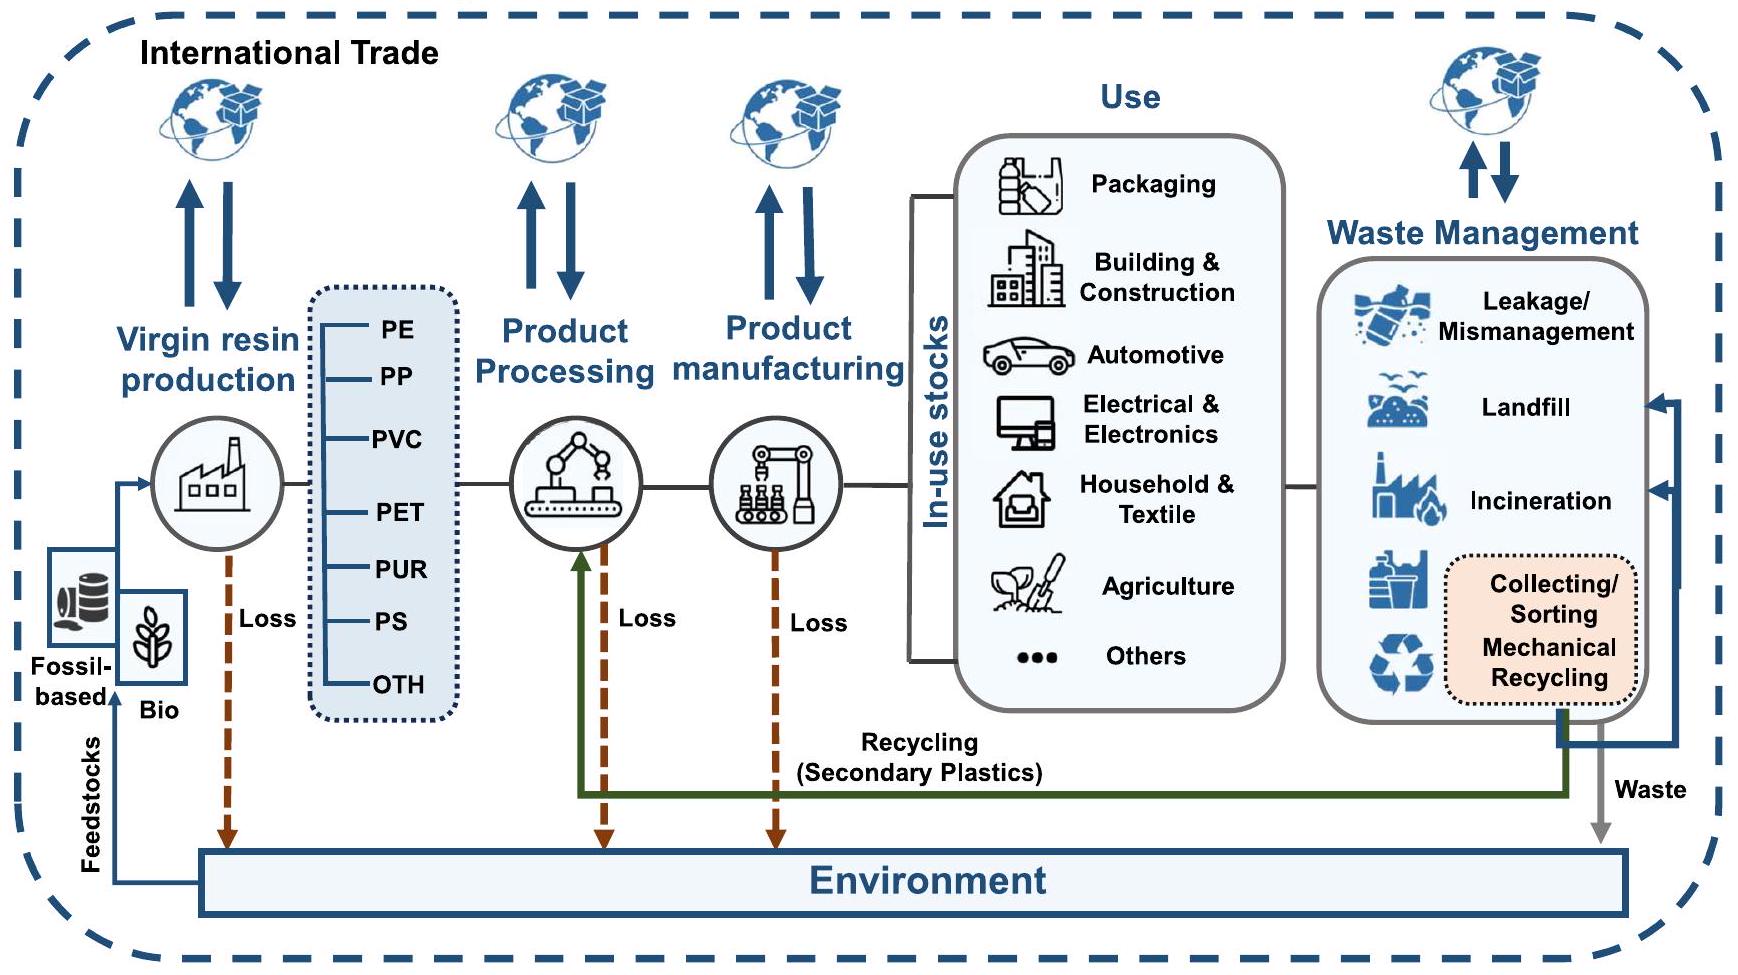
إطار البحث
دورات البلاستيك العالمية
تحليل تدفق المواد المرتبطة بتجارة البلاستيك العالمية
إعادة التدوير في
محاسبة مخزون البلاستيك
المحاسبة العالمية والإقليمية للنفايات
جمع البيانات
تحليل الحساسية
تتغير معدلات الجيل بواسطة
توفر البيانات
نُشر على الإنترنت: 10 أبريل 2025
References
- Geyer, R., Jambeck, J. R. & Law, K. L. Production, use, and fate of all plastics ever made. Science 3, e1700782 (2017).
- OECD Global Plastics Outlook https://www.oecd.org/en/ publications/global-plastics-outlook_aa1edf33-en.html (2022).
- Law, K. L. & Thompson, R. C. Microplastics in the Seas. Science345, 144-145 (2014).
- Rochman, C. M. et al. Classify plastic waste as hazardous. Nature 494, 169-171 (2013).
- PlasticsEurope. Global and Regional Plastics Facts https://plasticseurope. org/knowledge-hub/plastics-the-fast-facts-2023 (2023).
- UNEP. Historic day in the campaign to beat plastic pollution: Nations commit to develop a legally binding agreement https://www.unep. org/news-and-stories/press-release/historic-day-campaign-beat-plastic-pollution-nations-commit-develop (2022).
- Brunner, P. H. & Rechberger, H. Handbook of Material Flow Analysis: For Environmental, Resource, and Waste Engineers 2nd edn (CRC Press, 2017).
- Amadei, A. M., Rigamonti, L. & Sala, S. Exploring the EU Plastic Value Chain: A Material Flow Analysis. Resour. Conserv. Recycl. 197, 107105 (2023).
- Kawecki, D., Scheeder, P. R. W. & Nowack, B. Probabilistic material flow analysis of seven commodity plastics in Europe. Environ. Sci. Technol. 52, 9874-9888 (2018).
- Cimpan, C., Bjelle, E. L. & Strømman, A. H. Plastic packaging flows in Europe: a hybrid input-output approach. J. Ind. Ecol. 25, 1572-1587 (2021).
- Eriksen, M. K., Pivnenko, K., Faraca, G., Boldrin, A. & Astrup, T. F. Dynamic material flow analysis of PET, PE, and PP flows in Europe: evaluation of the potential for circular economy. Environ. Sci. Technol. 54, 16166-16175 (2020).
- Jiang, X. et al. Assessment of plastic stocks and flows in China: 19782017. Resour. Conserv. Recycl. 161, 104969 (2020).
- Jian, X. et al. Material flow analysis of china’s five commodity plastics urges radical waste infrastructure improvement. Environ. Res. Infrastructure Sustain.2, 025002 (2022).
- Xia, L. et al. Mapping Chinese Plastic Flows from 2001 to 2040 based on dynamic probabilistic material flow analysis and scenario projection. Resour. Conserv. Recycl. 203, 10749 (2024).
- Liu, Y., Zhou, C., Li, F., Liu, H. & Yang, J. Stocks and Flows of Polyvinyl Chloride (PVC) in China: 1980-2050. Resour. Conserv. Recycl. 154, 104584 (2020).
- Chen, L. Y., Liu, W. X., Yang, T. & Nowack, B. Probabilistic material flow analysis of eight commodity plastics in China: comparison between 2017 and 2020. Resour. Conserv. Recycl. 191, 106880 (2023).
- Di, J., Reck, B. K., Miatto, A. & Graedel, T. E. United States Plastics: Large Flows, Short Lifetimes, and Negligible Recycling. Resour. Conserv. Recycl. 167, 105440 (2021).
- Smith, R. L., Takkellapati, S. & Riegerix, R. C. Recycling of Plastics in the United States: Plastic Material Flows and Polyethylene Terephthalate (PET) Recycling Processes. ACS Sustain. Chem. Eng. 10, 2084-2096 (2022).
- Akan, O. D. et al. Plastic waste: status, degradation and microbial management options for Africa. J. Environ. Manag.292, 112758 (2021).
- Babayemi, J. O., Nnorom, I. C., Osibanjo, O. & Weber, R. Ensuring sustainability in plastics use in Africa: consumption, waste generation, and projections. Environ. Sci. Eur. 31, 1-20 (2019).
- Alarif, W. M. et al. The occurrence of microplastic in marine ecosystems in the Middle East: a review. Reg. Stud. Mar. Sci. 67, 103208 (2023).
- Emami, N. et al. Plastics in the Indian Economy: A Comprehensive Material Flow Analysis. J. Mater. Cycles. Waste Manag. 26, 3584-3595 (2024).
- Mutha, N. H., Patel, M. & Premnath, V. Plastics materials flow analysis for India. Resour. Conserv. Recycl. 47, 222-244 (2006).
- Nakatani, J., Maruyama, T. & Moriguchi, Y. Revealing the intersectoral material flow of plastic containers and packaging in Japan. Proc. Natl. Acad. Sci. USA. 117, 19844-19853 (2020).
- Drewniok, M. P., Gao, Y., Cullen, J. M. & Cabrera Serrenho, A. What to Do about Plastics? Lessons from a Study of United Kingdom Plastics Flows. Environ. Sci. Technol. 57, 4513-4521 (2023).
- Olatayo, K. I., Mativenga, P. T. & Marnewick, A. L. Comprehensive evaluation of plastic flows and stocks in South Africa. Resour. Conserv. Recycl. 170, 105567 (2021).
- Nakem, S. et al. Material Flow Analysis (MFA) and Life Cycle Assessment (LCA) Study for Sustainable Management of PVC Wastes in Thailand. Computer Aided Chemical Engineering.38, 1689-1694 (2016).
- Tumu, K., Vorst, K. & Curtzwiler, G. Global Plastic Waste Recycling and Extended Producer Responsibility Laws. J. Environ. Manag.348, 119242 (2023).
- Schwarz, A. E., Lensen, S. M. C., Langeveld, E., Parker, L. A. & Urbanus, J. H. Plastics in the Global environment assessed through material flow analysis, degradation and environmental transportation. Sci. Total Environ.875, 162644 (2023).
- Ryberg, M. W., Hauschild, M. Z., Wang, F., Averous-Monnery, S. & Laurent, A. Global environmental losses of plastics across their value chains. Resour. Conserv. Recycl. 151, 104459 (2019).
- Lebreton, L. & Andrady, A. Future Scenarios of Global Plastic Waste Generation and Disposal. Palgrave Commun. 5, 6 (2019).
- Nayanathara Thathsarani Pilapitiya, P. G. C. & Ratnayake, A. S. The World of Plastic Waste: A Review. Clean. Mater. 11, 100220 (2024).
- Xu,T.et al. Evolving Patterns and Drivers of Waste Plastic Trade in Key Global Economies. Resour. Conserv. Recycl. 206, 107606 (2024).
- Wen, Z., Xie, Y., Chen, M. & Dinga, C. D. China’s Plastic Import Ban Increases Prospects of Environmental Impact Mitigation of Plastic Waste Trade Flow Worldwide. Nat. Commun. 12, 1-9 (2021).
- Kan, M. et al. Seven Decades of Plastic Flows and Stocks in the United States and Pathways toward Zero Plastic Pollution by 2050. J. Ind. Ecol. 27, 1538-1552 (2023).
- National Development and Reform Commission, M. of H. and U.R.D.M. of E. Notice on the Issuance of the “Implementation Plan for the Strength and Weakness of Urban Domestic Waste Classification and Treatment Facilities” https://en.ndrc.gov.cn/ (2020).
- Brooks, A. L., Wang, S. & Jambeck, J. R. The Chinese Import Ban and Its Impact on Global Plastic Waste Trade. Sci. Adv. 4 eaat0131 (2018).
- Cabernard, L., Pfister, S., Oberschelp, C. & Hellweg, S. Growing Environmental Footprint of Plastics Driven by Coal Combustion. Nat. Sustain 5, 139-148 (2022).
- Jiang, M. et al. Tracing Fossil-Based Plastics, Chemicals and Fertilizers Production in China. Nat. Commun. 15, 1-12 (2024).
- Meng, F., Brandão, M. & Cullen, J. M. Replacing Plastics with Alternatives Is Worse for Greenhouse Gas Emissions in Most Cases. Environ. Sci. Technol. 58, 2716-2727 (2024).
- Chen, G. et al. Replacing traditional plastics with biodegradable plastics: impact on carbon emissions. Engineering 32, 152-162 (2024).
- Choudhury, B. K., Haloi, R., Bharadwaj, K. K., Rajkhowa, S. & Sarma, J. Bio-based and biodegradable plastics as alternatives to conventional plastics. Plastic Microplastic Environ. Manag. Health Risks 170-186, https://doi.org/10.1002/9781119800897.CH9 (2022).
- Turkcu, D., Tura, N. & Ojanen, V. A conceptual framework of the sustainability challenges experienced during the life cycle of biobased packaging products. Sustainability 14, 10465 (2022).
- Gerassimidou, S., Martin, O. V., Chapman, S. P., Hahladakis, J. N. & lacovidou, E. Development of an integrated sustainability matrix to depict challenges and trade-offs of introducing bio-based plastics in the food packaging value Chain. J. Clean. Prod. 286, 125378 (2021).
- Geng, Y., Sarkis, J. & Bleischwitz, R. How to globalize the circular economy. Nature 565, 153-155 (2019).
- Mordor Intelligence. Plastic additives market – growth, trends, COVID19 impact, and forecasts (2023-2028) https://www. researchandmarkets.com/reports/4514983/plastic-additives-market-growth-trends-covid (2023).
- European Chemical Agency. Plastic additives initiative https://echa. europa.eu/plastic-additives-initiative (2019).
- Wiesinger, H., Wang, Z. & Hellweg, S. Deep dive into plastic monomers, additives, and processing aids. Environ. Sci. Technol. 55, 9339-9351 (2021).
- Hahladakis, J. N., Velis, C. A., Weber, R., lacovidou, E. & Purnell, P. An overview of chemical additives present in plastics: migration, release, fate and environmental impact during their use, disposal and recycling. J. Hazard Mater. 344, 179-199 (2018).
- Basel Convention. Additional annexes and amendments to annexes, Basel Convention on the control of transboundary movements of hazardous wastes https://www.basel.int/theconvention/overview/ textoftheconvention/tabid/1275/default.aspx (2021).
- Basel Convention Basel Convention & Basel Protocol on Liability and Compensation and Annexes https://www.basel.int/theconvention/ overview/liabilityprotocol/tabid/2399/default.aspx (2019).
- Liu, F., Fan, C., Li, J. & Tan, Q. Unraveling the driving factors of the plastic waste trade network formation and dynamics. J. Environ. Manag. 348, 119422 (2023).
- Sun, N. & Tabata, T. Environmental impact assessment of china’s waste import ban policies: an empirical analysis of waste plastics importation from Japan. J. Clean. Prod. 329, 129606 (2021).
- Law, K. L. et al. The United States’ contribution of plastic waste to land and ocean. Sci. Adv. 6, eabd0288 (2020).
- OECD Global Plastics Outlook: Economic Drivers, Environmental Impacts and Policy Options https://www.oecd.org/en/events/2022/ 02/global-plastics-outlook-economic-drivers-environmental-impacts-and-policy-options.html (2022).
- Singh, N. & Walker, T. R. Plastic recycling: a Panacea or environmental pollution problem. npj Mater. Sustain. 2, 1-7 (2024).
- Klotz, M., Haupt, M. & Hellweg, S. Potentials and limits of mechanical plastic recycling. J. Ind. Ecol. 27, 1043-1059 (2023).
- Kaufmann, R. K. & Connelly, C. Oil price regimes and their role in price diversions from market fundamentals. Nat. Energy 5, 141-149 (2020).
- James, B. D., Ward, C. P., Hahn, M. E., Thorpe, S. J. & Reddy, C. M. Minimizing the environmental impacts of plastic pollution through ecodesign of products with low environmental persistence. ACS Sustain. Chem. Eng. 12, 1185-1194 (2024).
- Jones, M. P., Archodoulaki, V. M. & Köck, B. M. The power of good decisions: promoting eco-informed design attitudes in plastic selection and use. Resour. Conserv. Recycl. 182, 106324 (2022).
- European Commission. Single-use plastics https://environment.ec. europa.eu/topics/plastics/single-use-plastics_en (2019).
- Ministry of Environment. Plastic Resource Circulation Strategy https:// www.env.go.jp/press/106866.html (2019).
- National Development and Reform Commission and Ministry of Ecology and Environment. Printing and Distributing the Action Plan for Plastic Pollution Control in the 14th Five-Year Plan https://www.ndrc. gov.cn/xxgk/zcfb/tz/202001/t20200119_1219275.html (2021).
- Zhang, Q. Q., Ma, Z. R., Cai, Y. Y., Li, H. R. & Ying, G. G. Agricultural plastic pollution in China: generation of plastic debris and emission of phthalic acid esters from agricultural films. Environ. Sci. Technol. 55, 12459-12470 (2021).
- National Development and Reform Commission. Notice of the National Development and Reform Commission and the Ministry of Ecology and Environment on Printing and Distributing the Action Plan for Plastic Pollution Control in the 14th Five-Year Plan https://www. gov.cn/zhengce/zhengceku/2021-09/16/content_5637606.htm (2021).
- Eurostat. Waste management indicators https://ec.europa.eu/ eurostat/statistics-explained/index.php?title=Waste_management_ indicators&oldid=461870 (2024).
- Tabata, T. Waste-to-energy incineration plants as greenhouse gas reducers: a case study of seven Japanese Metropolises. Waste Manag. Res. 31, 1110-1117 (2013).
- Tabata, T. & Tsai, P. Heat supply from municipal solid waste incineration plants in Japan: current situation and future challenges. Waste Manag. Res. 34, 148-155 (2015).
- Teng, F., Wang, Z., Ren, K., Liu, S. & Ding, H. Analysis of Composition Characteristics and Treatment Techniques of Municipal Solid Waste Incineration Fly Ash in China. J. Environ. Manag. 357, 120783 (2024).
- Ministry of Ecology and Environment of the People’s Republic of China. The Ministry of Ecology and Environment has released the exemption from punishment for environmental violations committed by domestic waste incineration plants https://www.mee.gov.cn/ ywgz/sthjzf/zfzdyxzcf/202209/t20220921_994584.shtml (2024).
- UNEP. Africa Waste Management Outlook https://www.unep.org/ ietc/resources/publication/africa-waste-management-outlook (2018).
- Schröder, P., Oyinlola, M., Barrie, J., Fwangkwal, B. & Abolfathi, S. Making Policy Work for Africa’s Circular Plastics Economy. Resour. Conserv. Recycl. 190, 106868 (2023).
- International Labour Organization. Women and men in the informal economy: A statistical picture https://www.ilo.org/publications/ women-and-men-informal-economy-statistical-picture-third-edition (2018).
- The World Bank. The Informal Recycling Sector in Developing Countries https://ppp.worldbank.org/public-private-partnership/ library/informal-recycling-sector-developing-countries (2022).
- WEIGO. Waste pickers and human rights https://www.wiego.org/ project/waste-pickers-and-human-rights/ (2019).
- Ferronato, N. & Torretta, V. Waste mismanagement in developing countries: a review of global issues. Int J. Environ. Res. Public Health 16, 1060 (2019).
- Zeng, X. et al. Reshaping global policies for circular economy. Circ. Econ. 1, 100003 (2022).
- Velenturf, A. P. M. & Purnell, P. Principles for a sustainable circular economy. Sustain. Prod. Consum 27, 1437-1457 (2021).
- Van der Voet, E., Kleijn, R., Huele, R., Ishikawa, M. & Verkuijlen, E. Predicting future emissions based on characteristics of stocks. Ecol. Econ. 41, 223-234 (2002).
شكر وتقدير
مساهمات المؤلفين
المصالح المتنافسة
معلومات إضافية
https://doi.org/10.1038/s43247-025-02169-5.
© المؤلف(ون) 2025
- المختبر المشترك الرئيسي للدولة لمحاكاة البيئة ومراقبة التلوث، كلية البيئة، جامعة تسينغhua، بكين، الصين.
⟶البريد الإلكتروني: qy_tan@tsinghua.edu.cn
DOI: https://doi.org/10.1038/s43247-025-02169-5
Publication Date: 2025-04-10
Complexities of the global plastics supply chain revealed in a trade-linked material flow analysis
Abstract
Plastic has become an integral part of our lives. Addressing the global environmental concerns of plastics requires a comprehensive analysis along the whole supply chain. Here, we provide a global trade-linked material flow analysis of plastics for the year 2022. Globally, 436.66 million tonnes (Mt) of plastics were traded in 2022, with final products alone accounting for 111 Mt . Our findings suggest that plastics are subject to geographical concentration, with feedstocks concentrated in oil-resource rich countries and processing in countries with large manufacturing capacity. Furthermore, there is a significant shift in waste disposal: incineration is emerging as a prominent waste disposal method
not been comprehensively evaluated along the whole supply chain. Geyer et al.
Results
Global trade-linked plastics material flow analysis
landfilled. In total 29.60 Mt of plastics have been mismanaged, 103.10 Mt landfilled, 89.99 Mt incinerated. A total of 436.66 Mt of plastics were traded in 2022 (Fig. 2). Among those, feedstocks trade accounted for 71 Mt (Fig. 2a). EU28 was the largest exporter of plastics feedstocks (
along the supply chain of plastics. The global mapped trade values are expressed in
region (
Global and regional plastics production and consumption
d
Plastics per capita production vs. per capita consumption
Global and regional plastics waste management
and India ( 9.48 Mt ). Japan, Middle East and Africa generated a relatively small amount of plastic waste in comparison with
recycled. The recycling rate of USA dropped significantly comparing to 2015, when plastic recycling rate reached
Discussion
The global plastics fossil-fuel source dilemma
be implemented on a global scale presents a significant challenge in the quest for sustainable solutions. Given this paradox and the limited sustainable substitution options at a large scale, implementing circular economy principles and reducing plastic flows emerges as a crucial solution. By focusing on strategies such as recycling, reuse, and redesigning products for longevity, we can minimize the environmental impact of plastics and move towards a more sustainable future
The global shift of plastic trade patterns
their toxicity based on the European Union criteria
Policy prospective for a sustainable management of plastic waste
(out of the 75 Mt sorted and collected) is recycled. Several challenges contribute to the limited progress in enhancing global recycling practices. One major issue is the vast diversity and complexity of plastic materials, which include various types, grades, and additives
and urbanization, waste management systems in Africa face unprecedented challenges. Inadequate waste collection, improper disposal practices, and limited recycling infrastructure exacerbate environmental pollution, human health risks, and resource depletion in the continent
Circular economy principles for a global sustainable management of plastics
Study limitations
ability to offer detailed analyses of specific additives’ production and disposal. We have focused primarily on the most commonly used and traded additives, which may not capture the full spectrum of plastic additives in circulation. In future research, we aim to delve into the multitude of plastics and additives to provide a more comprehensive understanding of their individual flows and impacts. Additionally, our study does not account for the significant role of informal recycling systems, which play a crucial part in the global plastic waste management. This lack of inclusion may affect the accuracy of the global recycling rate, which might be higher if informal waste recycling is accounted. Future research should consider integrating data from informal recycling networks to gain a more holistic view of plastic waste management and recycling practices worldwide.
Conclusions
Methods
Research framework
Global Plastics Cycles
Global plastic trade-linked material flow analysis
recycling in the
Plastics stocks accounting
Global and regional waste accounting
Data collection
Sensitivity analysis
generation rates are altered by
Data availability
Published online: 10 April 2025
References
- Geyer, R., Jambeck, J. R. & Law, K. L. Production, use, and fate of all plastics ever made. Science 3, e1700782 (2017).
- OECD Global Plastics Outlook https://www.oecd.org/en/ publications/global-plastics-outlook_aa1edf33-en.html (2022).
- Law, K. L. & Thompson, R. C. Microplastics in the Seas. Science345, 144-145 (2014).
- Rochman, C. M. et al. Classify plastic waste as hazardous. Nature 494, 169-171 (2013).
- PlasticsEurope. Global and Regional Plastics Facts https://plasticseurope. org/knowledge-hub/plastics-the-fast-facts-2023 (2023).
- UNEP. Historic day in the campaign to beat plastic pollution: Nations commit to develop a legally binding agreement https://www.unep. org/news-and-stories/press-release/historic-day-campaign-beat-plastic-pollution-nations-commit-develop (2022).
- Brunner, P. H. & Rechberger, H. Handbook of Material Flow Analysis: For Environmental, Resource, and Waste Engineers 2nd edn (CRC Press, 2017).
- Amadei, A. M., Rigamonti, L. & Sala, S. Exploring the EU Plastic Value Chain: A Material Flow Analysis. Resour. Conserv. Recycl. 197, 107105 (2023).
- Kawecki, D., Scheeder, P. R. W. & Nowack, B. Probabilistic material flow analysis of seven commodity plastics in Europe. Environ. Sci. Technol. 52, 9874-9888 (2018).
- Cimpan, C., Bjelle, E. L. & Strømman, A. H. Plastic packaging flows in Europe: a hybrid input-output approach. J. Ind. Ecol. 25, 1572-1587 (2021).
- Eriksen, M. K., Pivnenko, K., Faraca, G., Boldrin, A. & Astrup, T. F. Dynamic material flow analysis of PET, PE, and PP flows in Europe: evaluation of the potential for circular economy. Environ. Sci. Technol. 54, 16166-16175 (2020).
- Jiang, X. et al. Assessment of plastic stocks and flows in China: 19782017. Resour. Conserv. Recycl. 161, 104969 (2020).
- Jian, X. et al. Material flow analysis of china’s five commodity plastics urges radical waste infrastructure improvement. Environ. Res. Infrastructure Sustain.2, 025002 (2022).
- Xia, L. et al. Mapping Chinese Plastic Flows from 2001 to 2040 based on dynamic probabilistic material flow analysis and scenario projection. Resour. Conserv. Recycl. 203, 10749 (2024).
- Liu, Y., Zhou, C., Li, F., Liu, H. & Yang, J. Stocks and Flows of Polyvinyl Chloride (PVC) in China: 1980-2050. Resour. Conserv. Recycl. 154, 104584 (2020).
- Chen, L. Y., Liu, W. X., Yang, T. & Nowack, B. Probabilistic material flow analysis of eight commodity plastics in China: comparison between 2017 and 2020. Resour. Conserv. Recycl. 191, 106880 (2023).
- Di, J., Reck, B. K., Miatto, A. & Graedel, T. E. United States Plastics: Large Flows, Short Lifetimes, and Negligible Recycling. Resour. Conserv. Recycl. 167, 105440 (2021).
- Smith, R. L., Takkellapati, S. & Riegerix, R. C. Recycling of Plastics in the United States: Plastic Material Flows and Polyethylene Terephthalate (PET) Recycling Processes. ACS Sustain. Chem. Eng. 10, 2084-2096 (2022).
- Akan, O. D. et al. Plastic waste: status, degradation and microbial management options for Africa. J. Environ. Manag.292, 112758 (2021).
- Babayemi, J. O., Nnorom, I. C., Osibanjo, O. & Weber, R. Ensuring sustainability in plastics use in Africa: consumption, waste generation, and projections. Environ. Sci. Eur. 31, 1-20 (2019).
- Alarif, W. M. et al. The occurrence of microplastic in marine ecosystems in the Middle East: a review. Reg. Stud. Mar. Sci. 67, 103208 (2023).
- Emami, N. et al. Plastics in the Indian Economy: A Comprehensive Material Flow Analysis. J. Mater. Cycles. Waste Manag. 26, 3584-3595 (2024).
- Mutha, N. H., Patel, M. & Premnath, V. Plastics materials flow analysis for India. Resour. Conserv. Recycl. 47, 222-244 (2006).
- Nakatani, J., Maruyama, T. & Moriguchi, Y. Revealing the intersectoral material flow of plastic containers and packaging in Japan. Proc. Natl. Acad. Sci. USA. 117, 19844-19853 (2020).
- Drewniok, M. P., Gao, Y., Cullen, J. M. & Cabrera Serrenho, A. What to Do about Plastics? Lessons from a Study of United Kingdom Plastics Flows. Environ. Sci. Technol. 57, 4513-4521 (2023).
- Olatayo, K. I., Mativenga, P. T. & Marnewick, A. L. Comprehensive evaluation of plastic flows and stocks in South Africa. Resour. Conserv. Recycl. 170, 105567 (2021).
- Nakem, S. et al. Material Flow Analysis (MFA) and Life Cycle Assessment (LCA) Study for Sustainable Management of PVC Wastes in Thailand. Computer Aided Chemical Engineering.38, 1689-1694 (2016).
- Tumu, K., Vorst, K. & Curtzwiler, G. Global Plastic Waste Recycling and Extended Producer Responsibility Laws. J. Environ. Manag.348, 119242 (2023).
- Schwarz, A. E., Lensen, S. M. C., Langeveld, E., Parker, L. A. & Urbanus, J. H. Plastics in the Global environment assessed through material flow analysis, degradation and environmental transportation. Sci. Total Environ.875, 162644 (2023).
- Ryberg, M. W., Hauschild, M. Z., Wang, F., Averous-Monnery, S. & Laurent, A. Global environmental losses of plastics across their value chains. Resour. Conserv. Recycl. 151, 104459 (2019).
- Lebreton, L. & Andrady, A. Future Scenarios of Global Plastic Waste Generation and Disposal. Palgrave Commun. 5, 6 (2019).
- Nayanathara Thathsarani Pilapitiya, P. G. C. & Ratnayake, A. S. The World of Plastic Waste: A Review. Clean. Mater. 11, 100220 (2024).
- Xu,T.et al. Evolving Patterns and Drivers of Waste Plastic Trade in Key Global Economies. Resour. Conserv. Recycl. 206, 107606 (2024).
- Wen, Z., Xie, Y., Chen, M. & Dinga, C. D. China’s Plastic Import Ban Increases Prospects of Environmental Impact Mitigation of Plastic Waste Trade Flow Worldwide. Nat. Commun. 12, 1-9 (2021).
- Kan, M. et al. Seven Decades of Plastic Flows and Stocks in the United States and Pathways toward Zero Plastic Pollution by 2050. J. Ind. Ecol. 27, 1538-1552 (2023).
- National Development and Reform Commission, M. of H. and U.R.D.M. of E. Notice on the Issuance of the “Implementation Plan for the Strength and Weakness of Urban Domestic Waste Classification and Treatment Facilities” https://en.ndrc.gov.cn/ (2020).
- Brooks, A. L., Wang, S. & Jambeck, J. R. The Chinese Import Ban and Its Impact on Global Plastic Waste Trade. Sci. Adv. 4 eaat0131 (2018).
- Cabernard, L., Pfister, S., Oberschelp, C. & Hellweg, S. Growing Environmental Footprint of Plastics Driven by Coal Combustion. Nat. Sustain 5, 139-148 (2022).
- Jiang, M. et al. Tracing Fossil-Based Plastics, Chemicals and Fertilizers Production in China. Nat. Commun. 15, 1-12 (2024).
- Meng, F., Brandão, M. & Cullen, J. M. Replacing Plastics with Alternatives Is Worse for Greenhouse Gas Emissions in Most Cases. Environ. Sci. Technol. 58, 2716-2727 (2024).
- Chen, G. et al. Replacing traditional plastics with biodegradable plastics: impact on carbon emissions. Engineering 32, 152-162 (2024).
- Choudhury, B. K., Haloi, R., Bharadwaj, K. K., Rajkhowa, S. & Sarma, J. Bio-based and biodegradable plastics as alternatives to conventional plastics. Plastic Microplastic Environ. Manag. Health Risks 170-186, https://doi.org/10.1002/9781119800897.CH9 (2022).
- Turkcu, D., Tura, N. & Ojanen, V. A conceptual framework of the sustainability challenges experienced during the life cycle of biobased packaging products. Sustainability 14, 10465 (2022).
- Gerassimidou, S., Martin, O. V., Chapman, S. P., Hahladakis, J. N. & lacovidou, E. Development of an integrated sustainability matrix to depict challenges and trade-offs of introducing bio-based plastics in the food packaging value Chain. J. Clean. Prod. 286, 125378 (2021).
- Geng, Y., Sarkis, J. & Bleischwitz, R. How to globalize the circular economy. Nature 565, 153-155 (2019).
- Mordor Intelligence. Plastic additives market – growth, trends, COVID19 impact, and forecasts (2023-2028) https://www. researchandmarkets.com/reports/4514983/plastic-additives-market-growth-trends-covid (2023).
- European Chemical Agency. Plastic additives initiative https://echa. europa.eu/plastic-additives-initiative (2019).
- Wiesinger, H., Wang, Z. & Hellweg, S. Deep dive into plastic monomers, additives, and processing aids. Environ. Sci. Technol. 55, 9339-9351 (2021).
- Hahladakis, J. N., Velis, C. A., Weber, R., lacovidou, E. & Purnell, P. An overview of chemical additives present in plastics: migration, release, fate and environmental impact during their use, disposal and recycling. J. Hazard Mater. 344, 179-199 (2018).
- Basel Convention. Additional annexes and amendments to annexes, Basel Convention on the control of transboundary movements of hazardous wastes https://www.basel.int/theconvention/overview/ textoftheconvention/tabid/1275/default.aspx (2021).
- Basel Convention Basel Convention & Basel Protocol on Liability and Compensation and Annexes https://www.basel.int/theconvention/ overview/liabilityprotocol/tabid/2399/default.aspx (2019).
- Liu, F., Fan, C., Li, J. & Tan, Q. Unraveling the driving factors of the plastic waste trade network formation and dynamics. J. Environ. Manag. 348, 119422 (2023).
- Sun, N. & Tabata, T. Environmental impact assessment of china’s waste import ban policies: an empirical analysis of waste plastics importation from Japan. J. Clean. Prod. 329, 129606 (2021).
- Law, K. L. et al. The United States’ contribution of plastic waste to land and ocean. Sci. Adv. 6, eabd0288 (2020).
- OECD Global Plastics Outlook: Economic Drivers, Environmental Impacts and Policy Options https://www.oecd.org/en/events/2022/ 02/global-plastics-outlook-economic-drivers-environmental-impacts-and-policy-options.html (2022).
- Singh, N. & Walker, T. R. Plastic recycling: a Panacea or environmental pollution problem. npj Mater. Sustain. 2, 1-7 (2024).
- Klotz, M., Haupt, M. & Hellweg, S. Potentials and limits of mechanical plastic recycling. J. Ind. Ecol. 27, 1043-1059 (2023).
- Kaufmann, R. K. & Connelly, C. Oil price regimes and their role in price diversions from market fundamentals. Nat. Energy 5, 141-149 (2020).
- James, B. D., Ward, C. P., Hahn, M. E., Thorpe, S. J. & Reddy, C. M. Minimizing the environmental impacts of plastic pollution through ecodesign of products with low environmental persistence. ACS Sustain. Chem. Eng. 12, 1185-1194 (2024).
- Jones, M. P., Archodoulaki, V. M. & Köck, B. M. The power of good decisions: promoting eco-informed design attitudes in plastic selection and use. Resour. Conserv. Recycl. 182, 106324 (2022).
- European Commission. Single-use plastics https://environment.ec. europa.eu/topics/plastics/single-use-plastics_en (2019).
- Ministry of Environment. Plastic Resource Circulation Strategy https:// www.env.go.jp/press/106866.html (2019).
- National Development and Reform Commission and Ministry of Ecology and Environment. Printing and Distributing the Action Plan for Plastic Pollution Control in the 14th Five-Year Plan https://www.ndrc. gov.cn/xxgk/zcfb/tz/202001/t20200119_1219275.html (2021).
- Zhang, Q. Q., Ma, Z. R., Cai, Y. Y., Li, H. R. & Ying, G. G. Agricultural plastic pollution in China: generation of plastic debris and emission of phthalic acid esters from agricultural films. Environ. Sci. Technol. 55, 12459-12470 (2021).
- National Development and Reform Commission. Notice of the National Development and Reform Commission and the Ministry of Ecology and Environment on Printing and Distributing the Action Plan for Plastic Pollution Control in the 14th Five-Year Plan https://www. gov.cn/zhengce/zhengceku/2021-09/16/content_5637606.htm (2021).
- Eurostat. Waste management indicators https://ec.europa.eu/ eurostat/statistics-explained/index.php?title=Waste_management_ indicators&oldid=461870 (2024).
- Tabata, T. Waste-to-energy incineration plants as greenhouse gas reducers: a case study of seven Japanese Metropolises. Waste Manag. Res. 31, 1110-1117 (2013).
- Tabata, T. & Tsai, P. Heat supply from municipal solid waste incineration plants in Japan: current situation and future challenges. Waste Manag. Res. 34, 148-155 (2015).
- Teng, F., Wang, Z., Ren, K., Liu, S. & Ding, H. Analysis of Composition Characteristics and Treatment Techniques of Municipal Solid Waste Incineration Fly Ash in China. J. Environ. Manag. 357, 120783 (2024).
- Ministry of Ecology and Environment of the People’s Republic of China. The Ministry of Ecology and Environment has released the exemption from punishment for environmental violations committed by domestic waste incineration plants https://www.mee.gov.cn/ ywgz/sthjzf/zfzdyxzcf/202209/t20220921_994584.shtml (2024).
- UNEP. Africa Waste Management Outlook https://www.unep.org/ ietc/resources/publication/africa-waste-management-outlook (2018).
- Schröder, P., Oyinlola, M., Barrie, J., Fwangkwal, B. & Abolfathi, S. Making Policy Work for Africa’s Circular Plastics Economy. Resour. Conserv. Recycl. 190, 106868 (2023).
- International Labour Organization. Women and men in the informal economy: A statistical picture https://www.ilo.org/publications/ women-and-men-informal-economy-statistical-picture-third-edition (2018).
- The World Bank. The Informal Recycling Sector in Developing Countries https://ppp.worldbank.org/public-private-partnership/ library/informal-recycling-sector-developing-countries (2022).
- WEIGO. Waste pickers and human rights https://www.wiego.org/ project/waste-pickers-and-human-rights/ (2019).
- Ferronato, N. & Torretta, V. Waste mismanagement in developing countries: a review of global issues. Int J. Environ. Res. Public Health 16, 1060 (2019).
- Zeng, X. et al. Reshaping global policies for circular economy. Circ. Econ. 1, 100003 (2022).
- Velenturf, A. P. M. & Purnell, P. Principles for a sustainable circular economy. Sustain. Prod. Consum 27, 1437-1457 (2021).
- Van der Voet, E., Kleijn, R., Huele, R., Ishikawa, M. & Verkuijlen, E. Predicting future emissions based on characteristics of stocks. Ecol. Econ. 41, 223-234 (2002).
Acknowledgements
Author contributions
Competing interests
Additional information
https://doi.org/10.1038/s43247-025-02169-5.
© The Author(s) 2025
- State Key Joint Laboratory of Environment Simulation and Pollution Control, School of Environment, Tsinghua University, Beijing, China.
⟶e-mail: qy_tan@tsinghua.edu.cn