DOI: https://doi.org/10.1038/s41588-025-02077-6
PMID: https://pubmed.ncbi.nlm.nih.gov/40069506
تاريخ النشر: 2025-03-01
تغيرات في استحلاب PD-L1 تشكل استجابات المناعة المضادة للورم في الميلانوما
تم القبول: 6 يناير 2025
نُشر على الإنترنت: 11 مارس 2025
تحقق من التحديثات
لونغ ليانغ

الملخص
تخضع الأورام لإعادة برمجة الأيض لتلبية المتطلبات الطاقية والتركيبية والأكسدة والاختزال الضرورية للسرطانات، وغالبًا ما تتميز بزيادة تحلل الجلوكوز وإنتاج حمض اللبنيك. ومع ذلك، لا يزال دور الأيض الميتوكوندري في مناعة الورم غير واضح. تدمج الدراسة الحالية بين النسخ الجزيئي المكاني، والنسخ الجزيئي الكلي، والبروتيوميات، كاشفة عن ارتباط قوي بين المستقلب سوكسينيل-CoA ومناعة الورم فضلاً عن فعالية علاج مضاد بروتين الموت الخلوي المبرمج-1 (PD-1) لدى المرضى المصابين بالميلانوما. مستويات سوكسينيل-CoA المرتفعة، من خلال
دون المستوى الأمثل، مع فقط
النتائج
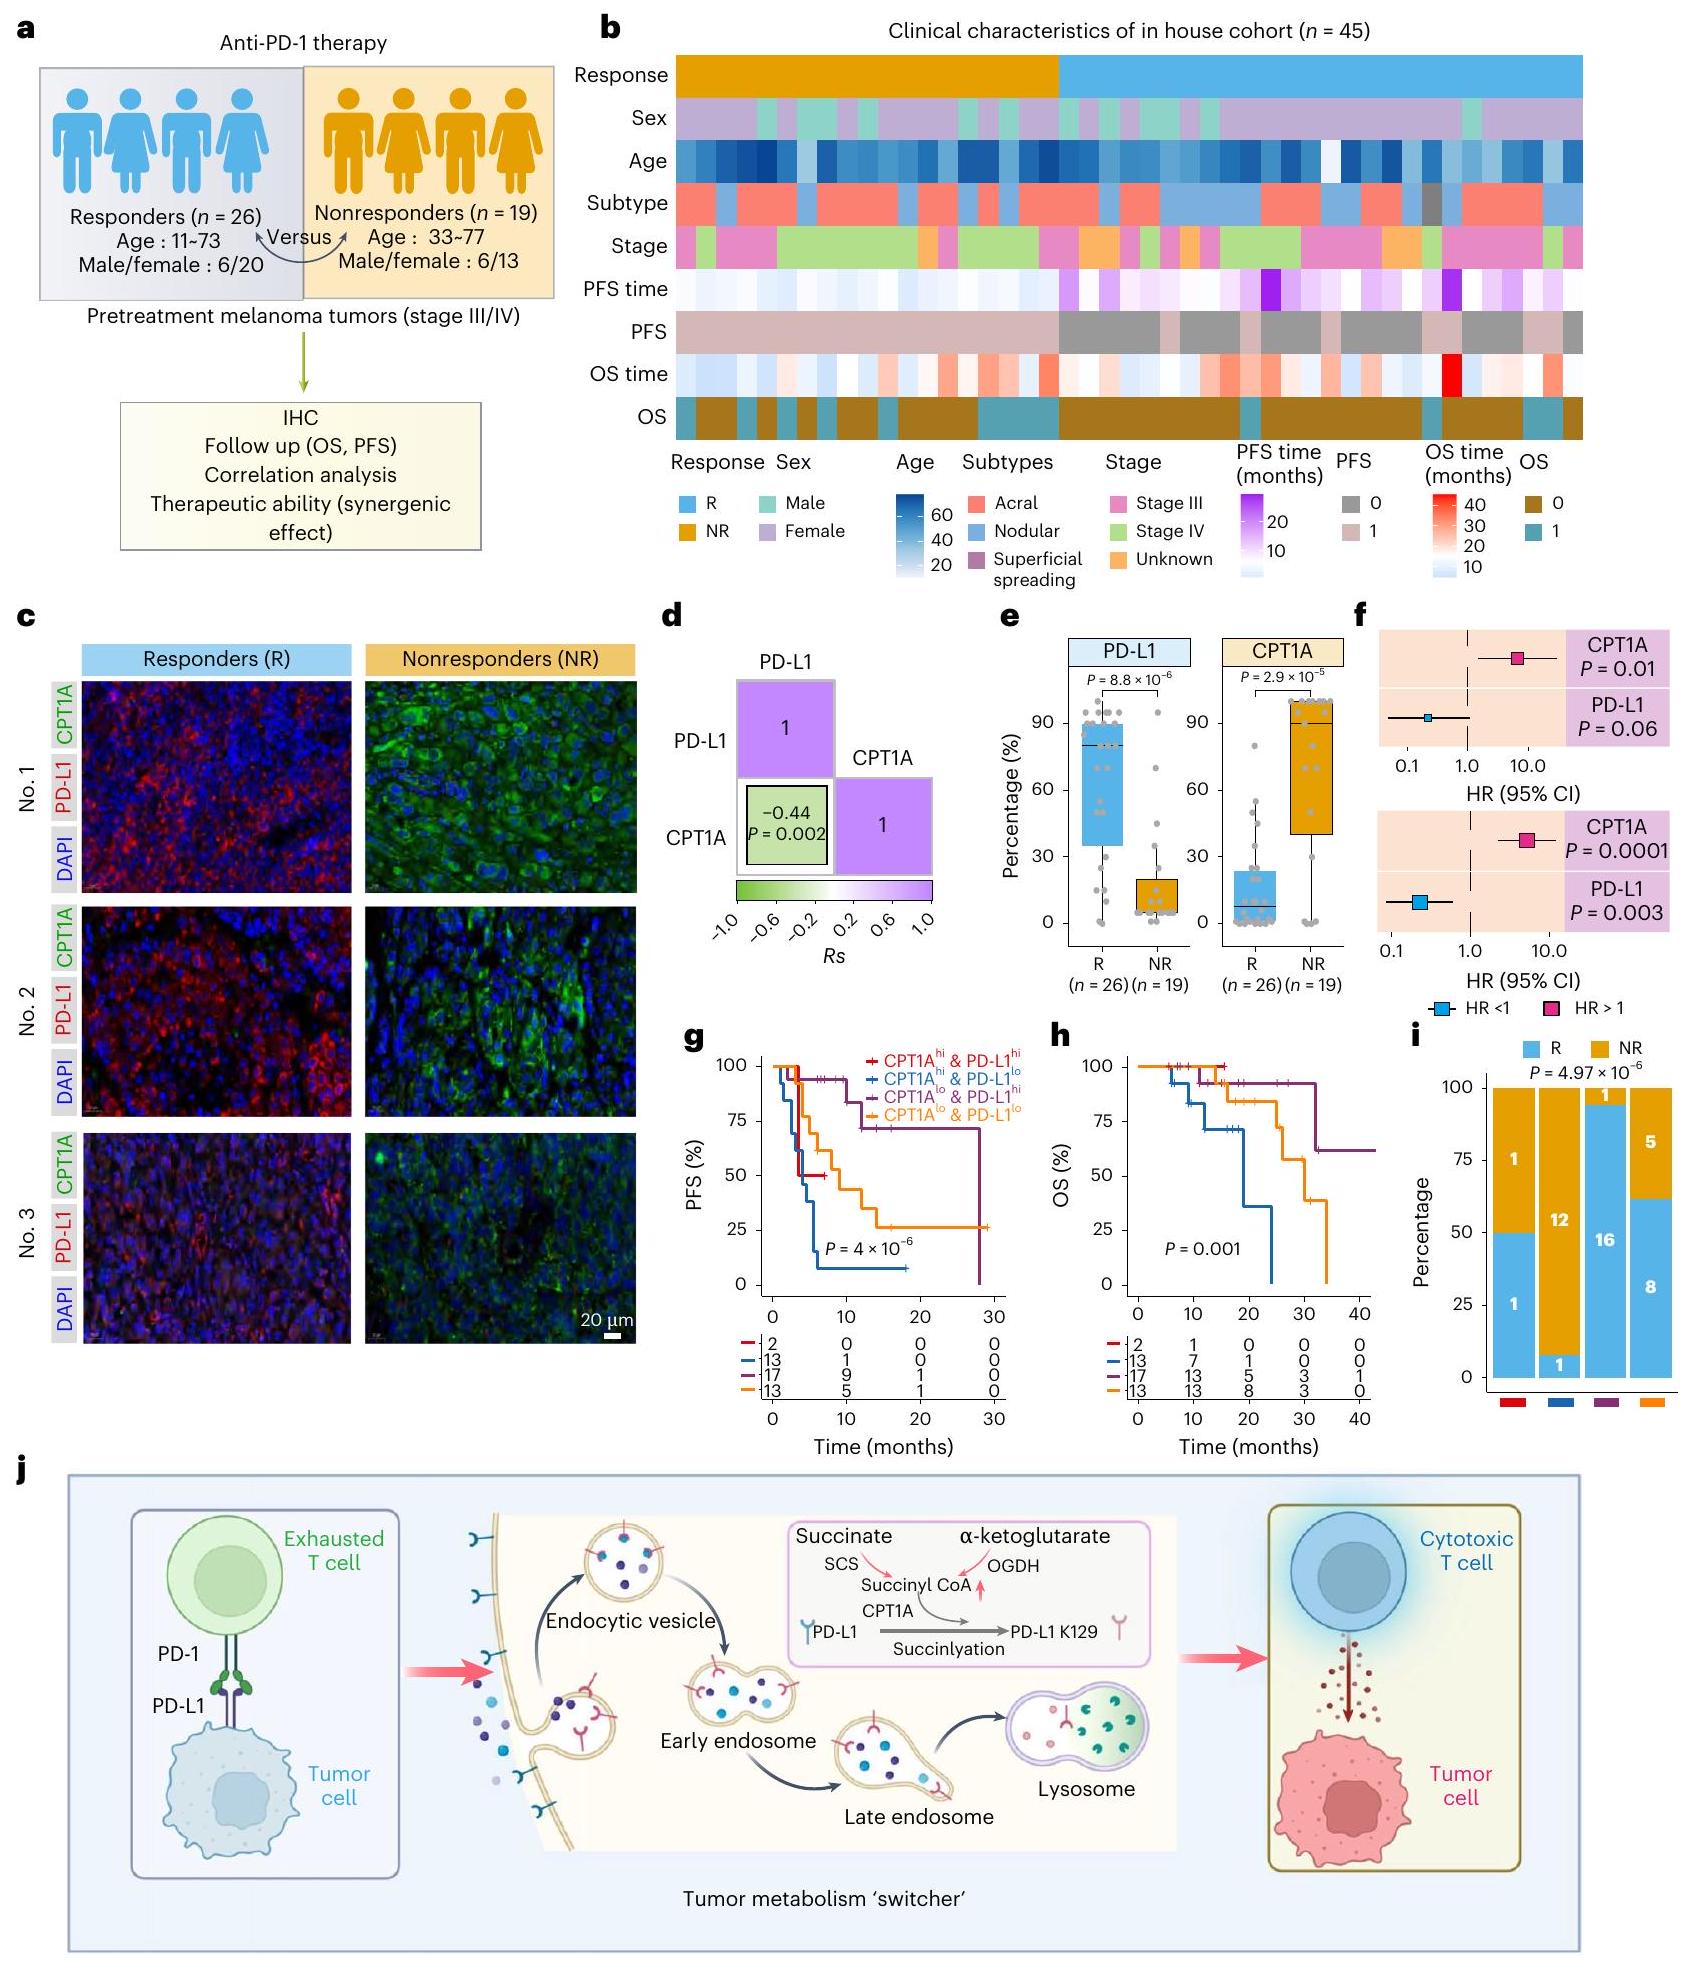
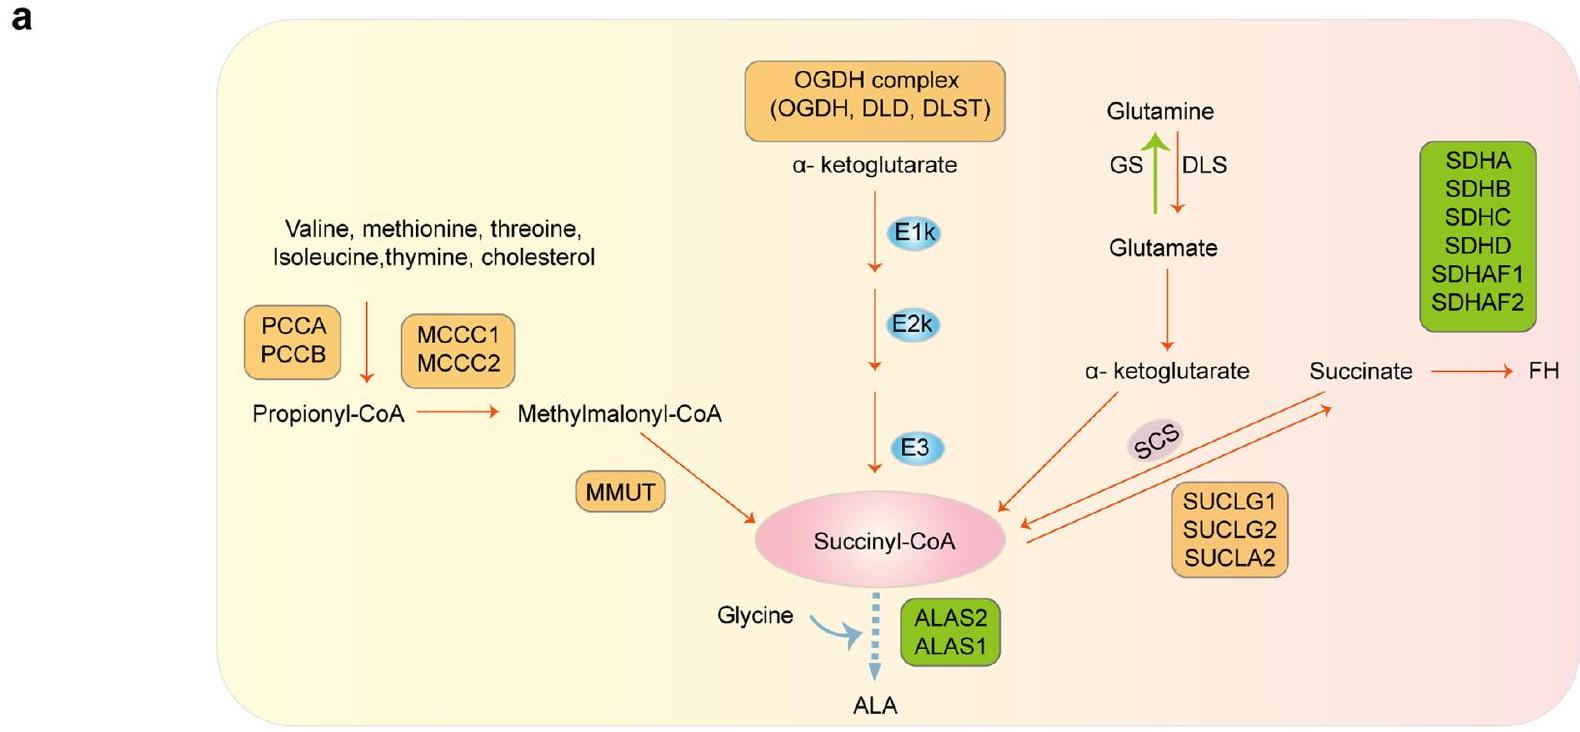
السكسينيل-CoA يشكل المناعة المضادة للأورام
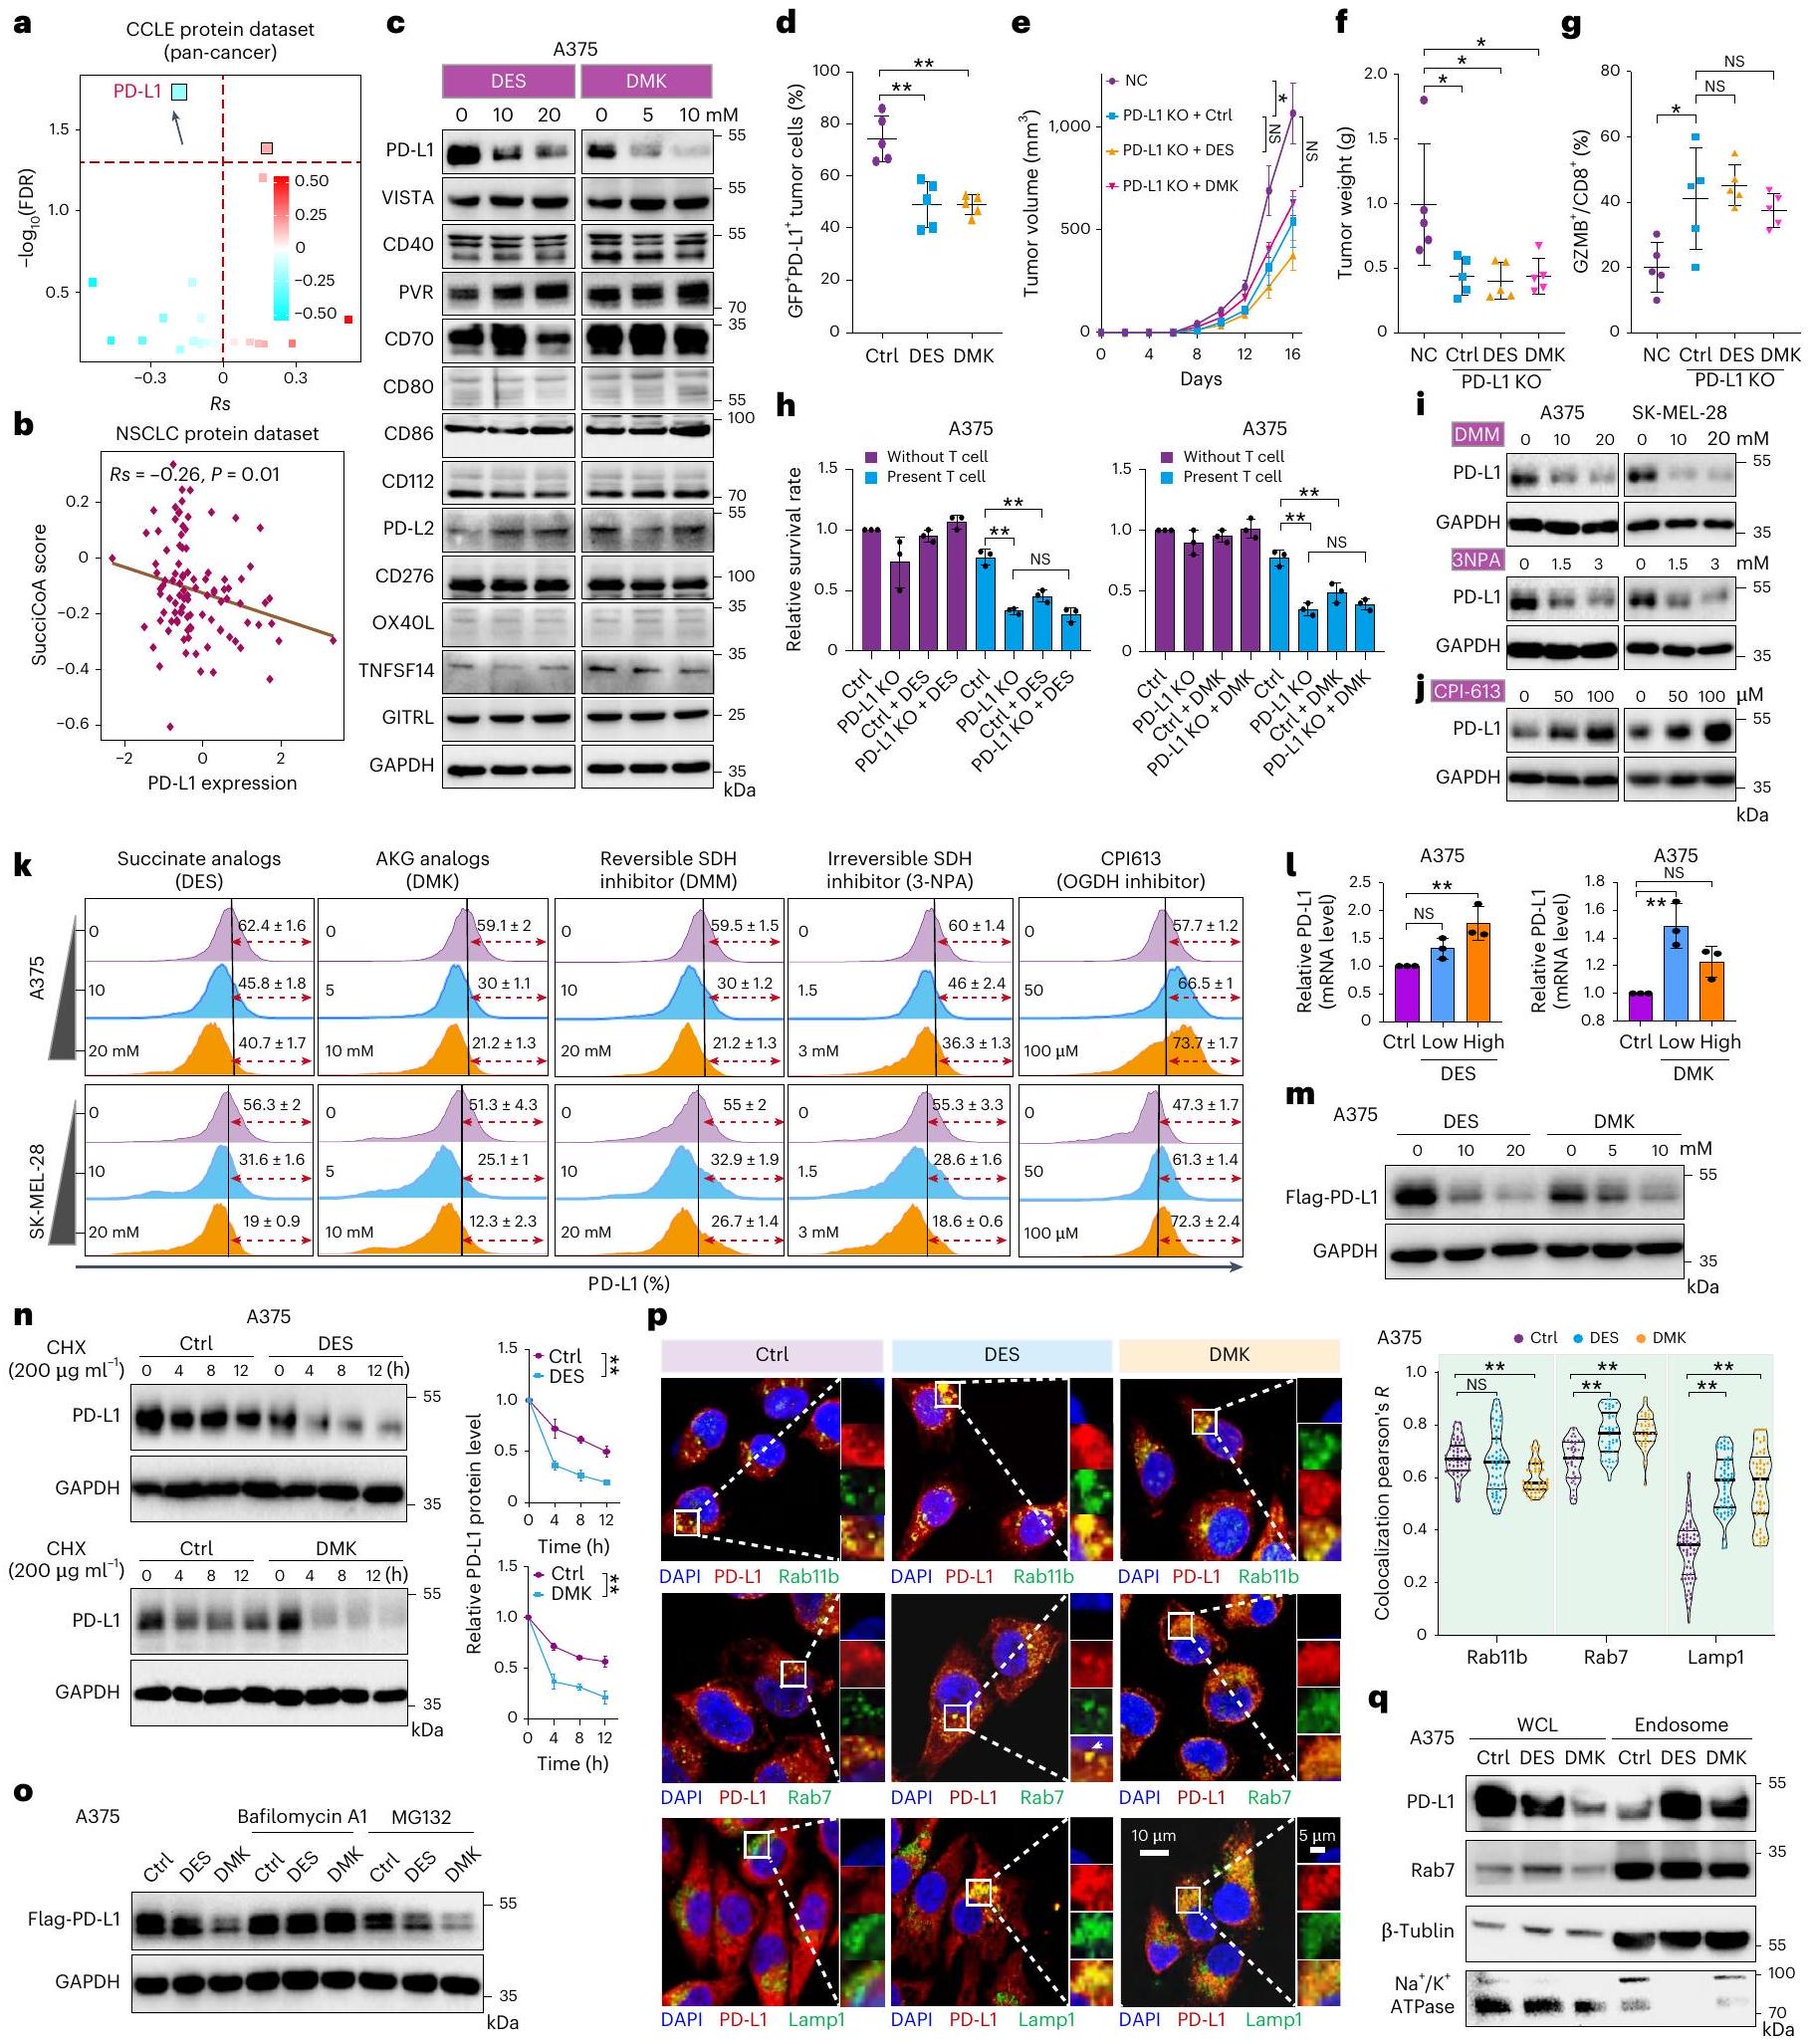
كانت الإنزيمات التي تربط دورة TCA وOXPHOS (OGDH وSCS وSDH؛ ملاحظة إضافية) وفيرة في المستجيبين للعلاج المناعي وارتبطت بنتائج أفضل (الشكل 1c). كان المرضى الذين لديهم تعبير عالٍ عن جميع الإنزيمات الثلاثة (Three_Complex_high) أكثر احتمالًا للاستجابة للعلاج المناعي وكان لديهم توقعات أفضل بشكل ملحوظ (الشكل 1d,e). أشارت هذه الملاحظات إلى أن التعبير العالي عن الإنزيم قد يؤدي إلى مستويات غير طبيعية من المستقلبات، مثل AKG أو السكسينات، مما يساهم في مناعة الورم. في الفئران المناعية السليمة، التي تم علاجها بـ AKG (ثنائي ميثيل
|
||||
 |
|
|||
|
** | |||
| □ | استجابة IFNγ | |||
| □ | ** | |||
| □ | * | |||
|
** | |||
|
** | |||
| □ | استجابة IFNα | |||
| □ | * | |||
|
سبليسوسوم | |||
|
نسخ الحمض النووي | |||
|
دورة الخلية | |||
|
عوامل النسخ الأساسية | |||
| † | أهداف Myc v1 | |||
|
أهداف E2F | |||
|
مسار مراقبة الرنا المرسال | |||
|
إصلاح الاقتطاع النووي | |||
| □ – | استقلاب الأدوية، إنزيمات أخرى * | |||
|
إصلاح الحمض النووي | |||
|
|
□
|
|||
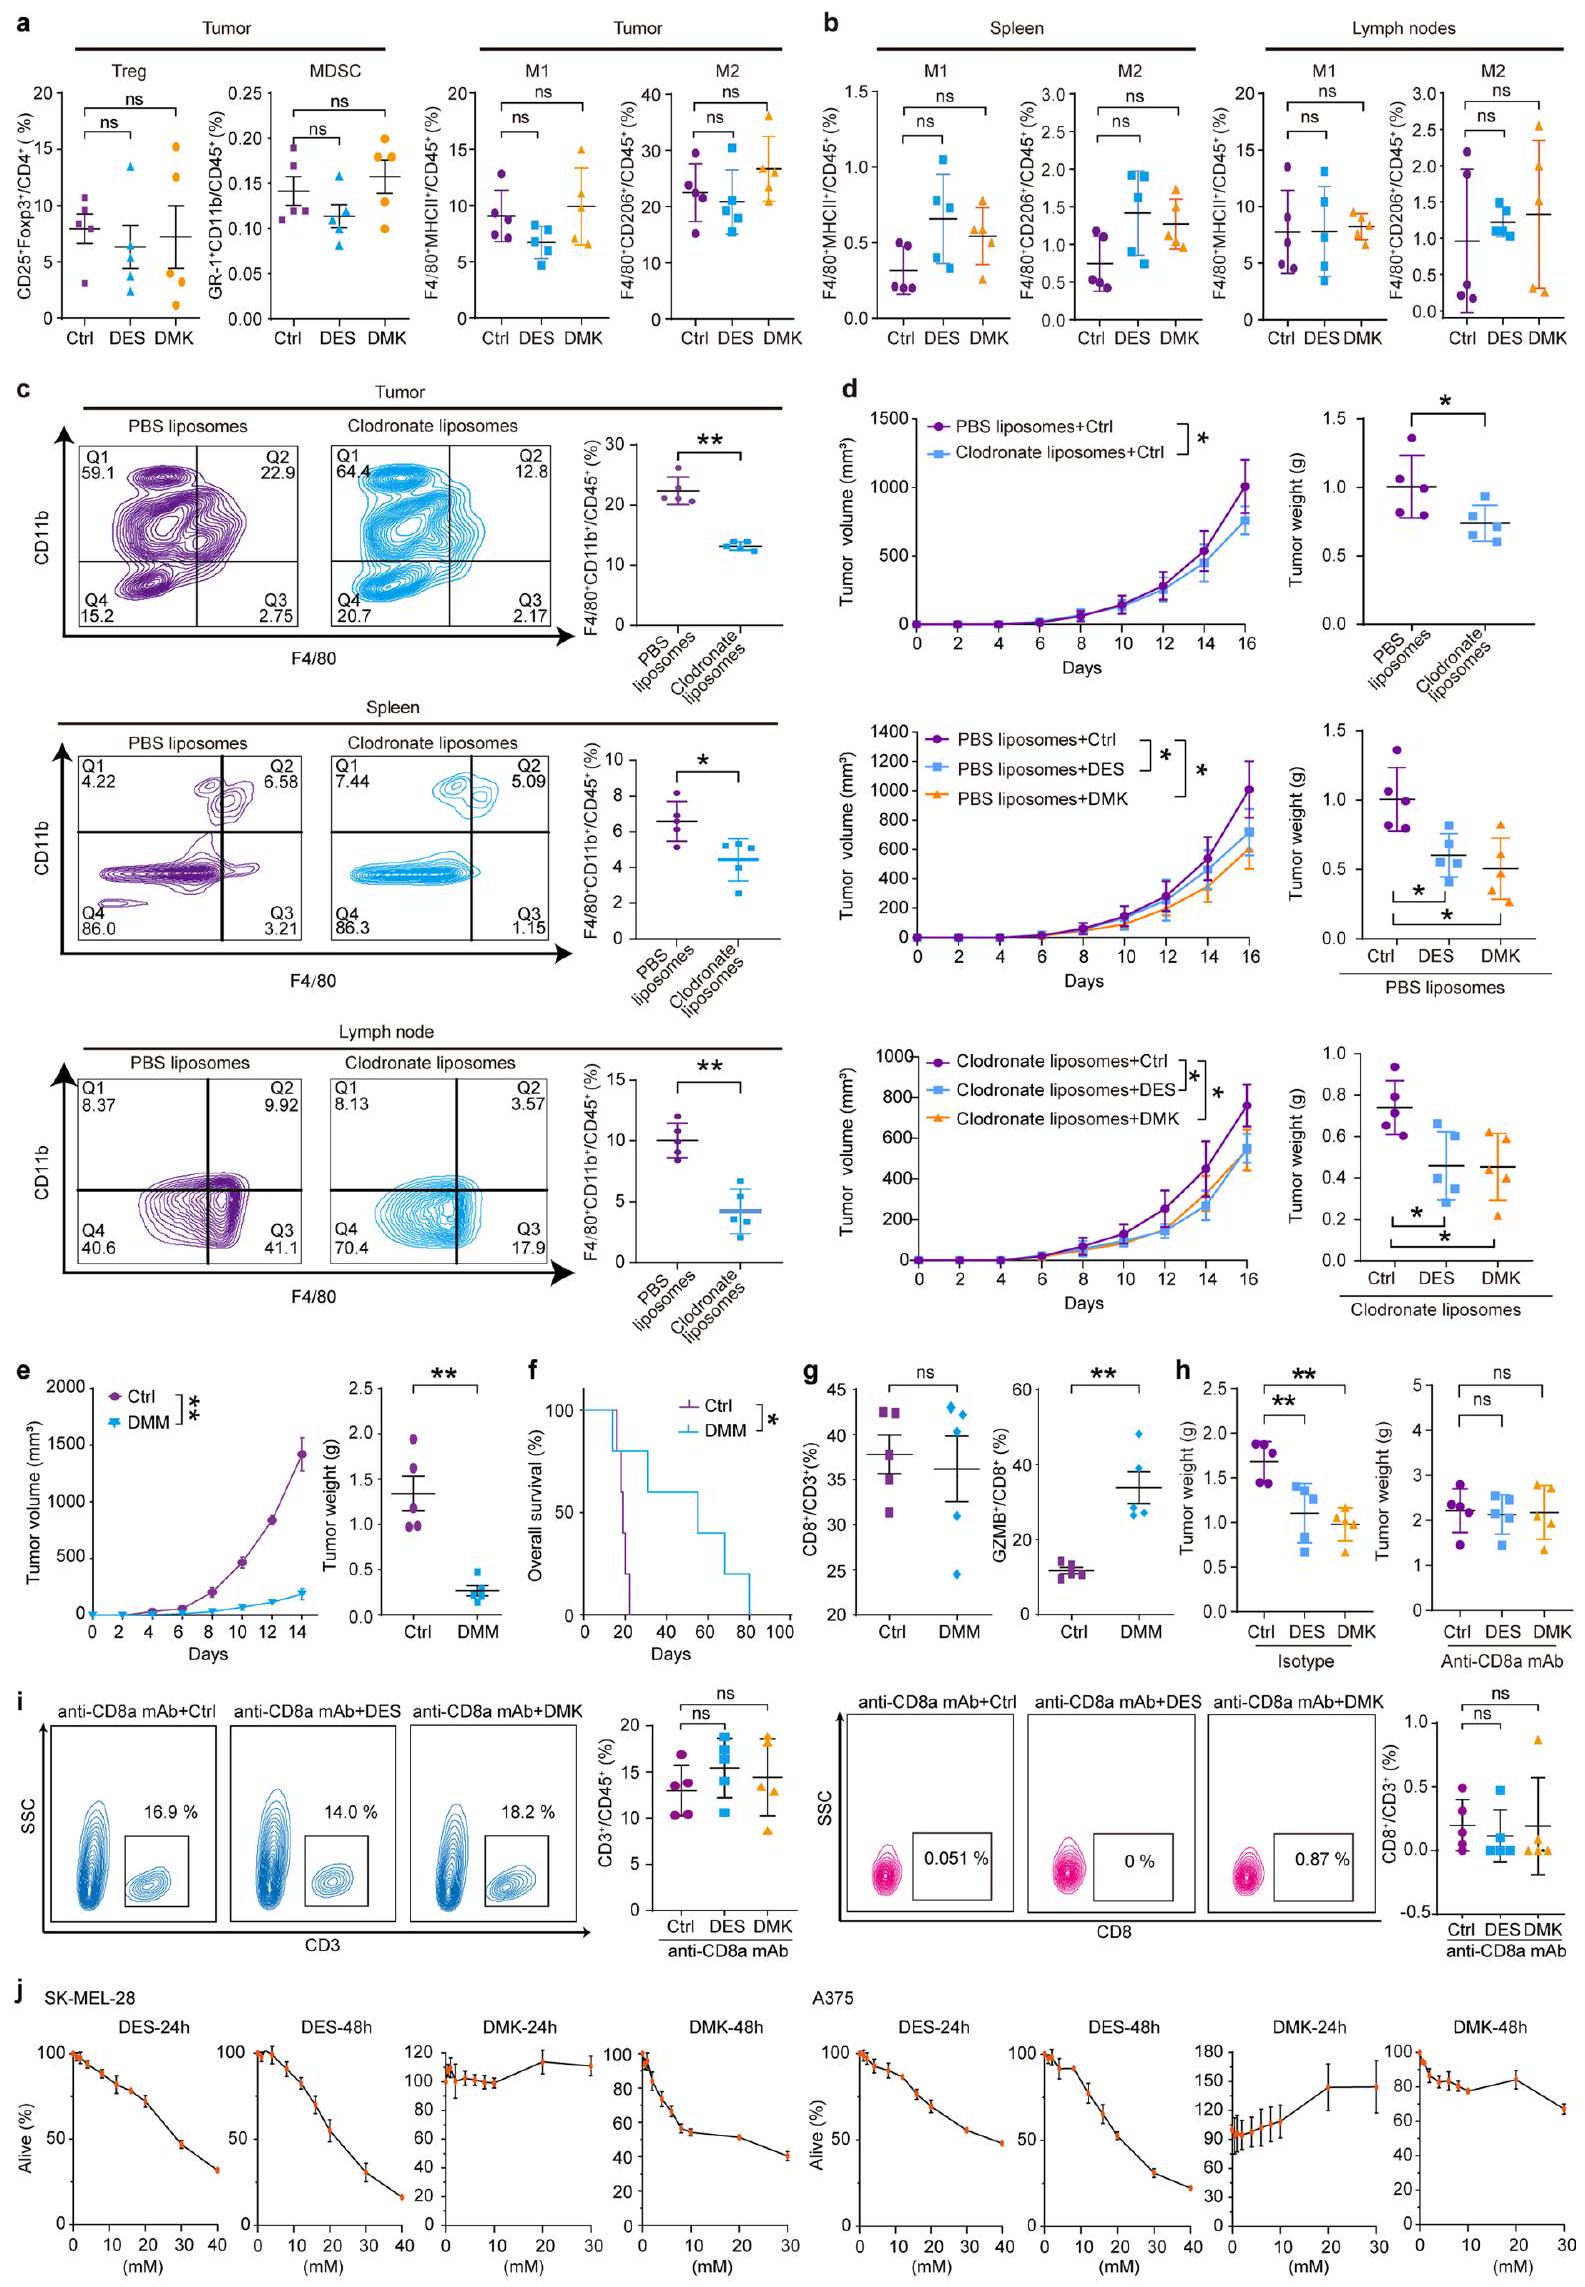
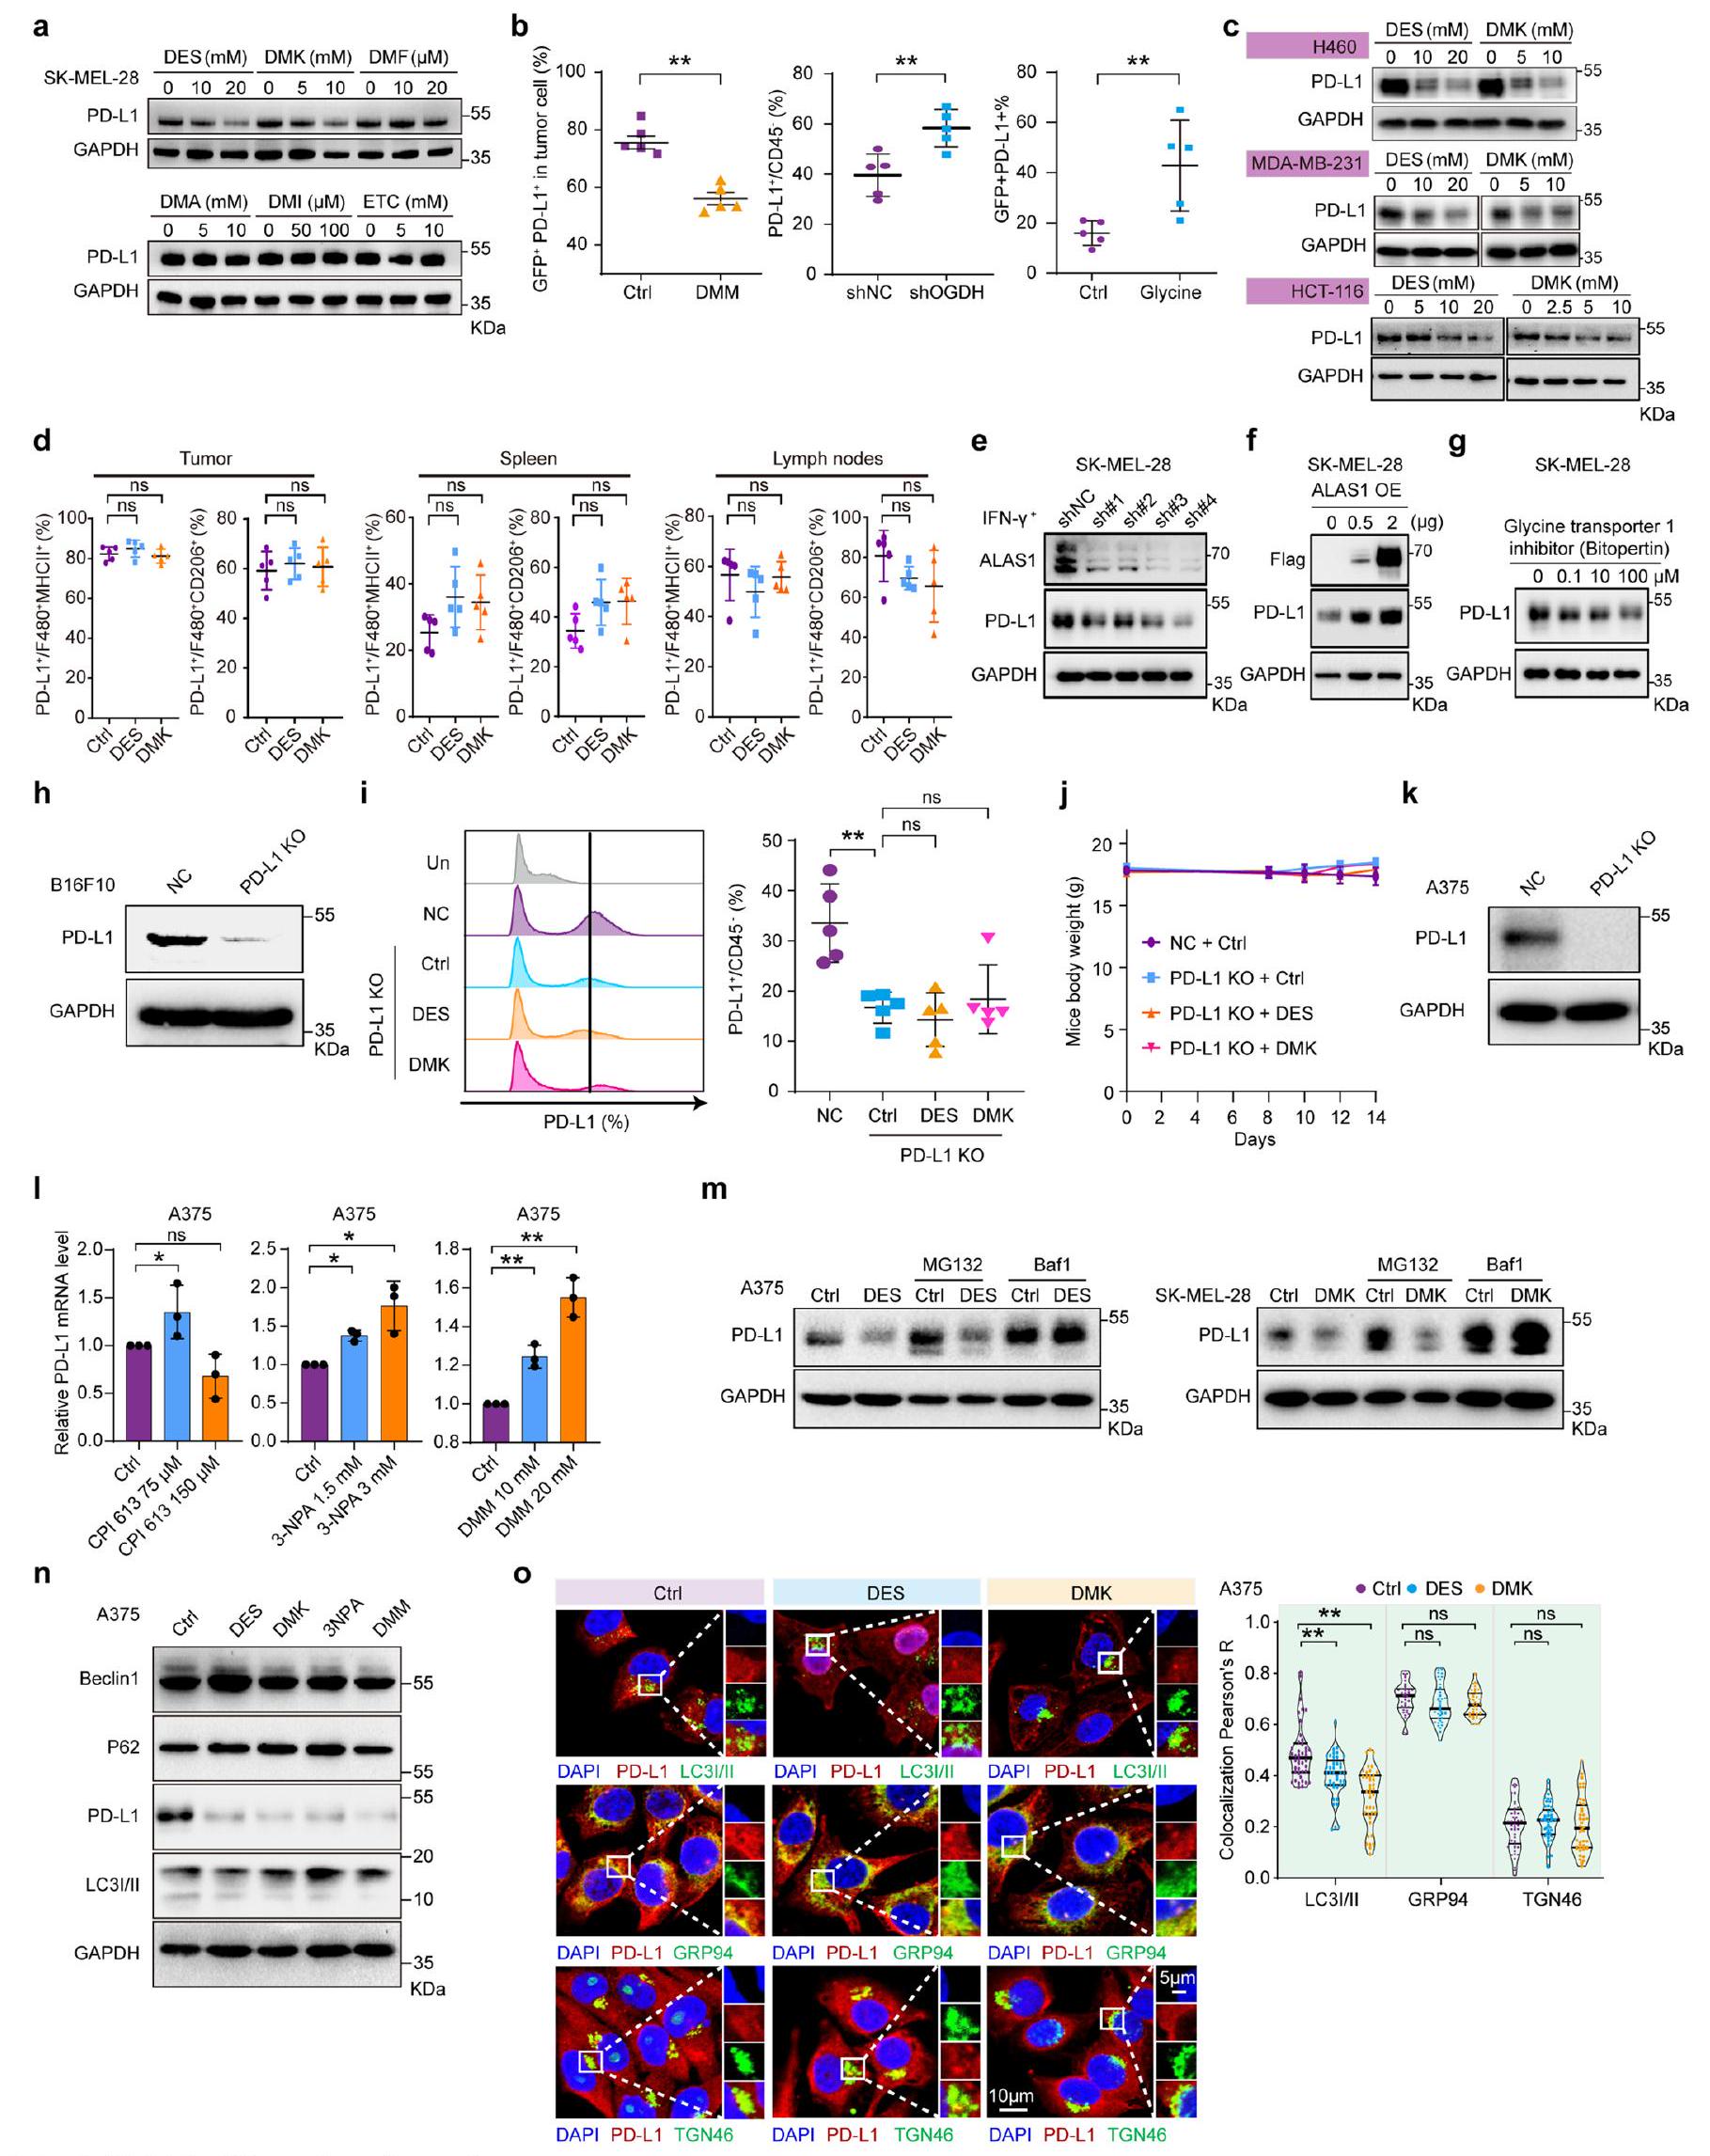
(الشكل 1م، ن)، تليها تجارب قتل الخلايا التائية (الملاحظة التكميلية). أظهرت DES أو DMK زيادة في السمية الخلوية المعتمدة على الخلايا التائية، كما هو موضح بواسطة صبغة الكريستال البنفسجي، في حين لم تتأثر تكاثر الورم في غياب الخلايا التائية (الملاحظة التكميلية والشكل الممتد 3هـ). تم العلاج بمثبط SDH القابل للعكس DMM والمثبط غير القابل للعكس حمض 3-نيتروبروبيونيك (3-NPA)، الذي يرتبط تساهميًا بمتبقية الأرجينين في النواة الحفازة للديهايدروجيناز السكسينيك A (SDHA)
زاد السكسينيل-CoA من نشاط خلايا CTL عن طريق تقليل PD-L1 في خلايا السرطان
تم اختبار ثلاثي إيثيل سيترات، الإيتاكونات والماليات، ووجد أن DES و DMK فقط هما اللذان خفضا مستويات بروتين PD-L1 (الشكل التمديدي 5a). بالإضافة إلى ذلك، أدى العلاج بـ DES و DMK و DMM إلى خفض PD-L1 في أنسجة الأورام لدى الفئران، ولكنه زاد من PD-L1 في الفئران التي تم فيها تقليل OGDH وعولجت بالجلايسين (الشكل 2d والشكل التمديدي 5b). لوحظت تأثيرات مشابهة في أنواع أخرى من السرطان، ولكن لم يُلاحظ أي تأثير في البلعميات التي تعبر عن PD-L1 (الشكل التمديدي 5c، d). لتوضيح ما إذا كان DES أو DMK ينظم PD-L1 عبر السكسينيل-CoA، تم تقليل ALAS1 (
معامل ارتباط رتب سبيرمان بين درجة SucciCoA ونقاط التفتيش المناعية في مجموعة بيانات خطوط خلايا السرطان من قاعدة بيانات CCLE
(الشكل 2q). تشير هذه النتائج إلى أن زيادة مستوى السكسينيل-CoA داخل الخلايا تعزز تحلل PD-L1 عبر المسار الحويصلي-الليزوزومي.
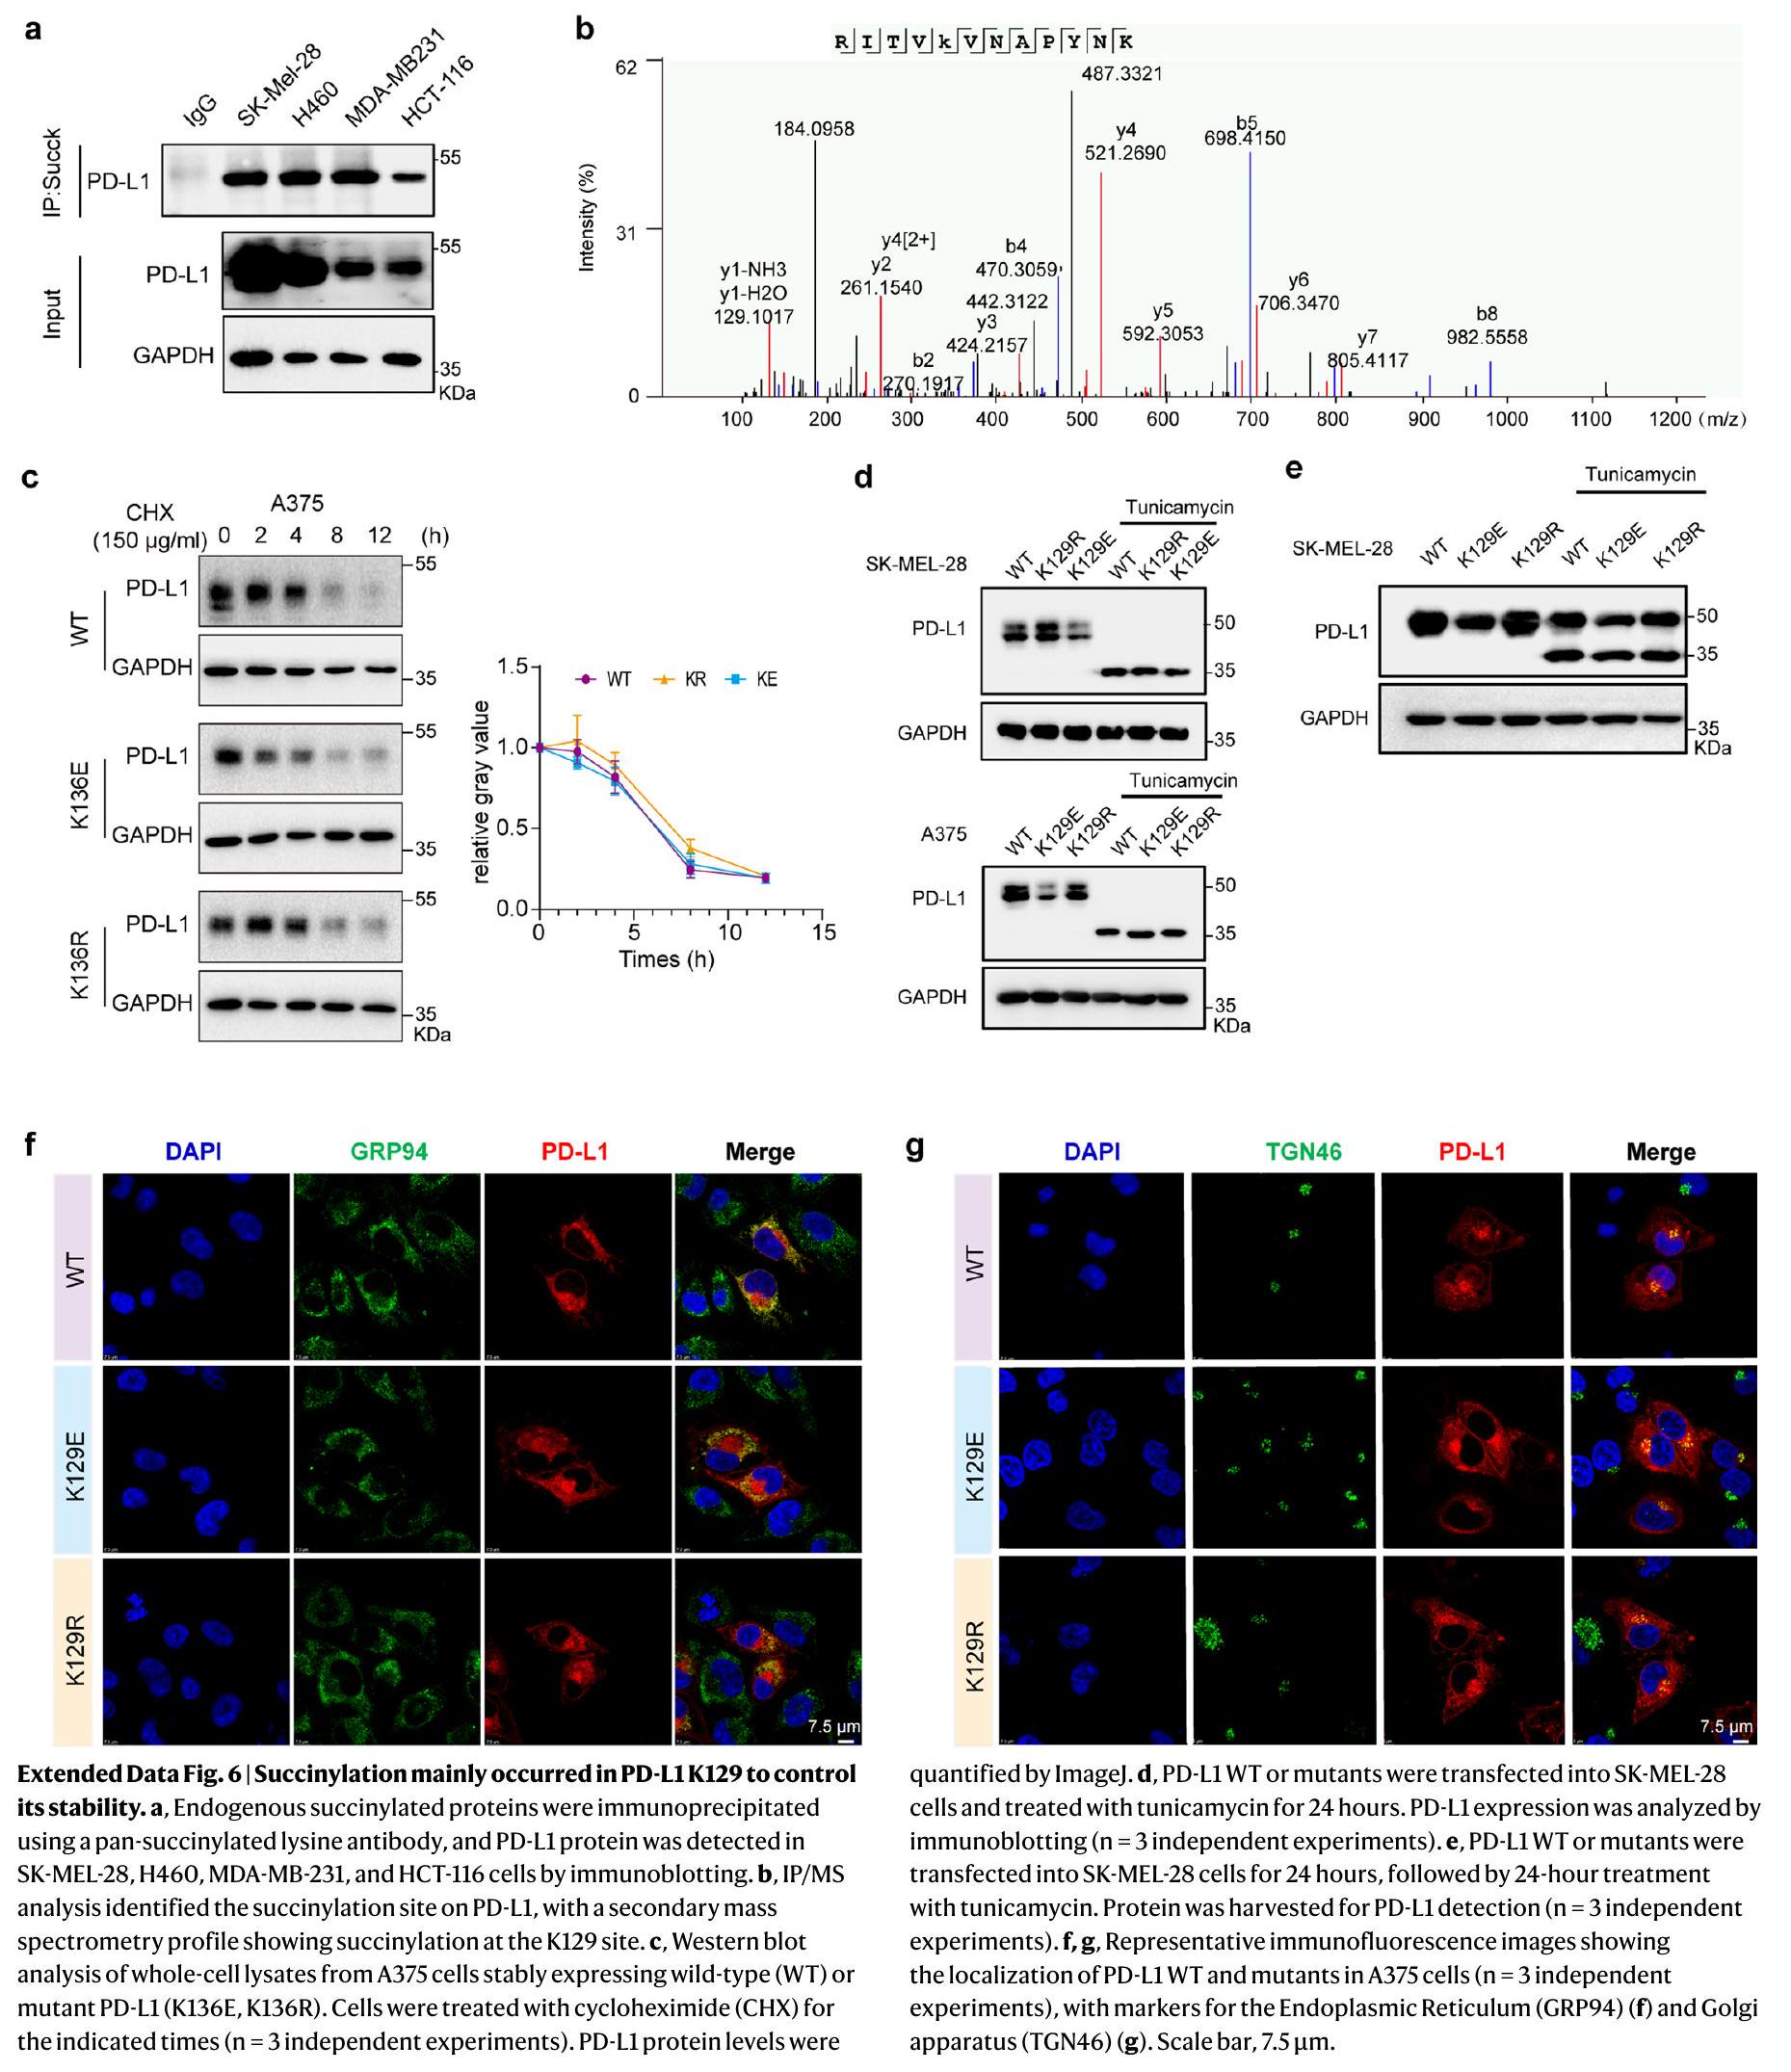
تحفيز التحلل لبروتين PD-L1 عند Lys129
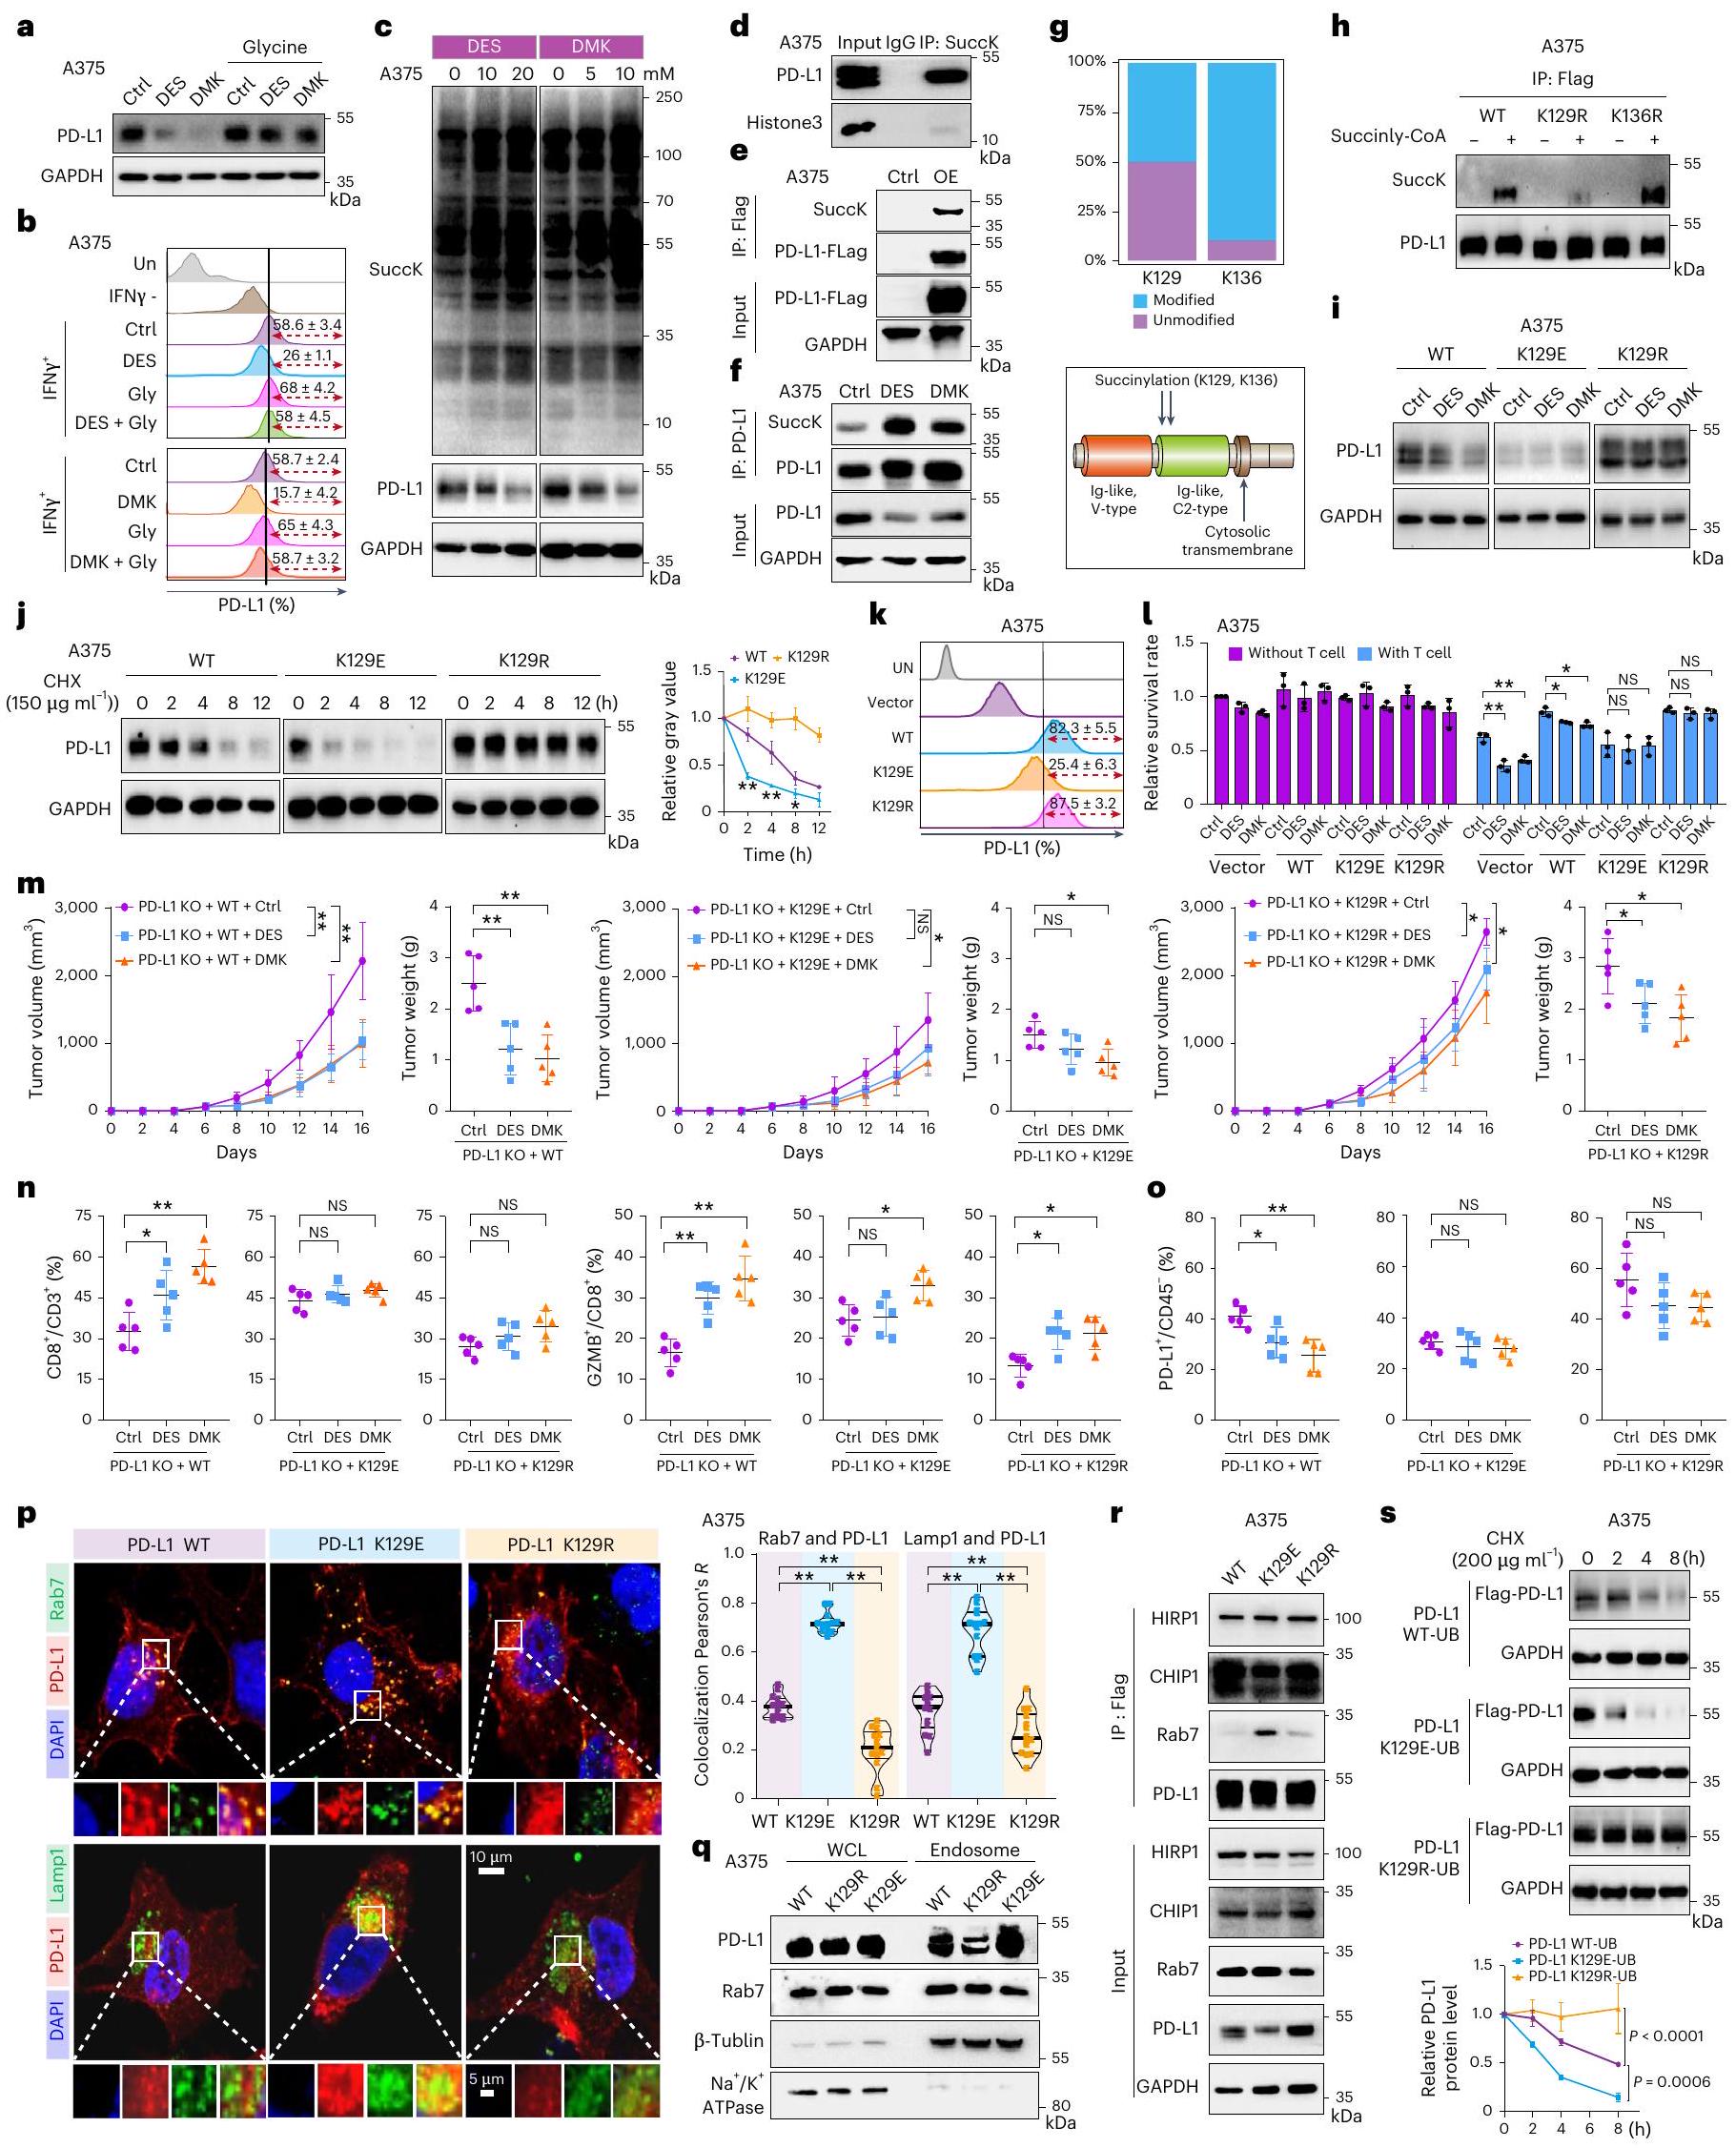
مستويات غشاء PD-L1 للطفرات تم قياسها بواسطة تحليل تدفق الخلايا
مستويات السكسينيل-CoA، وزيادة السكسينيل في البروتين
مجموعات الطفرات (الشكل 3م). كلا من مجموعتي PD-L1 WT و K129R قاما بتثبيط
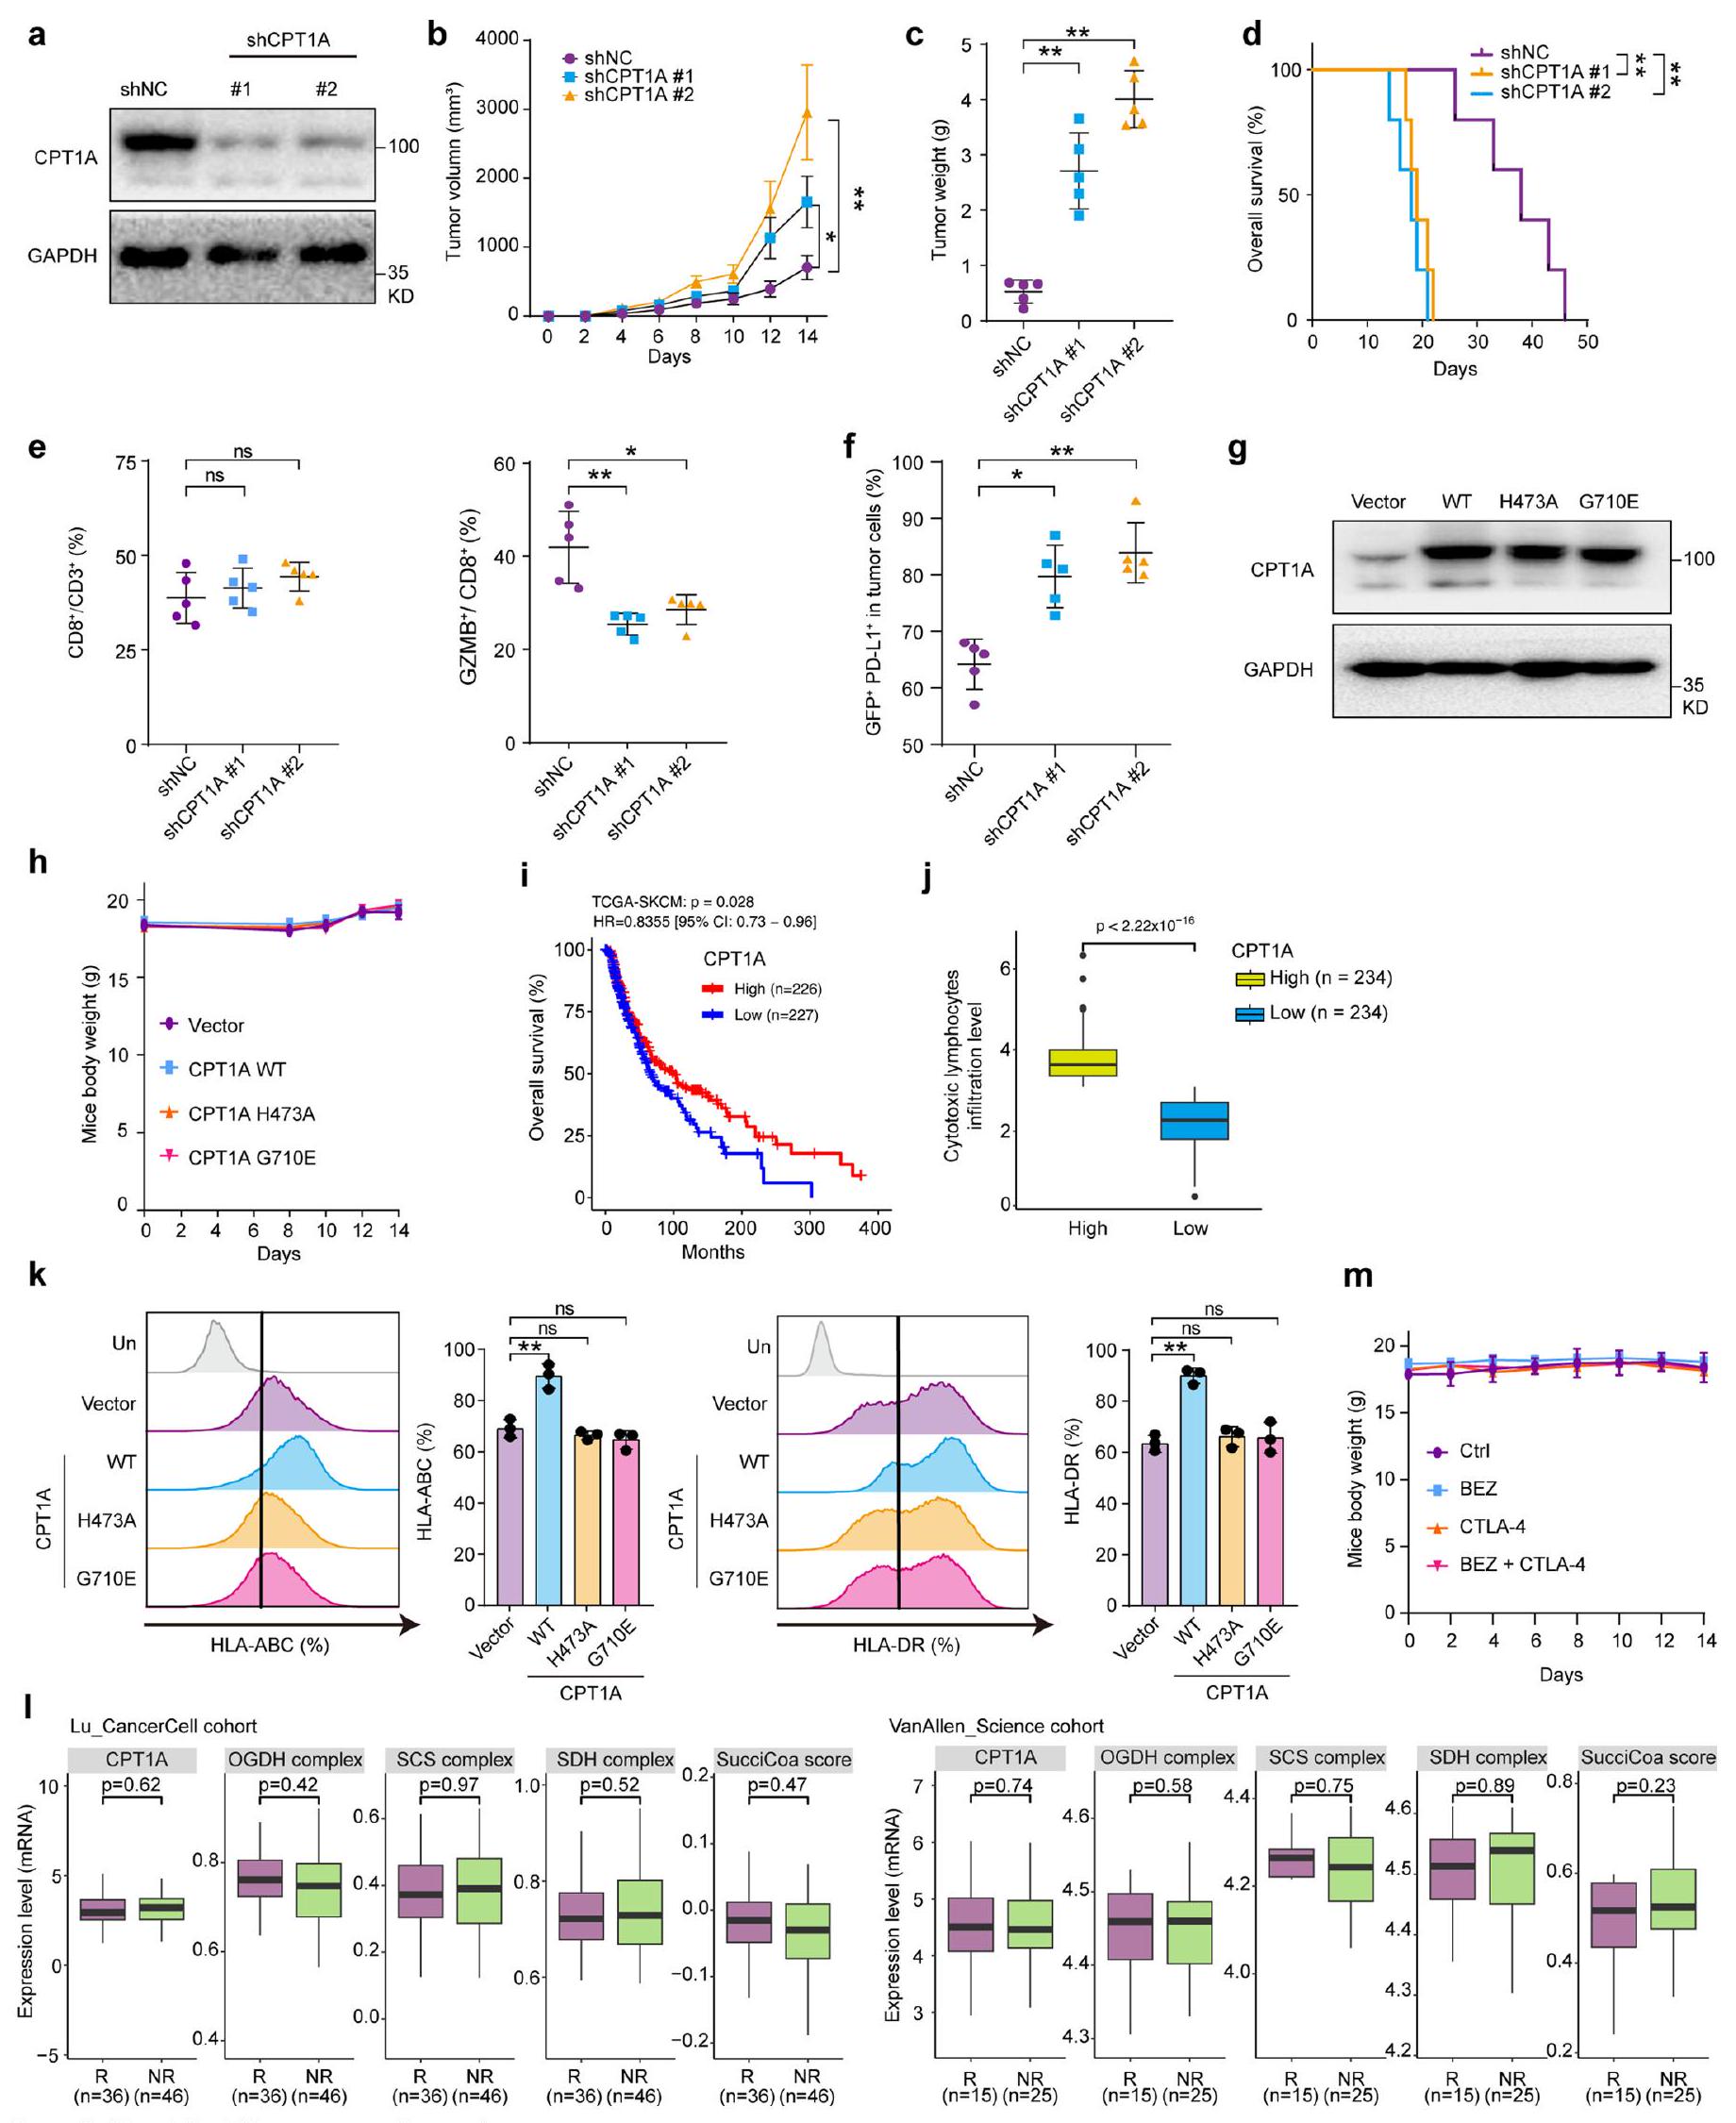
CPT1A يساهم في السكسينيلation لـ PD-L1
إن تنظيم CPT1A لعرض المستضدات مستقل عن نشاطه في نقل السكسينيل.
مستويات CPT1A تت correlates مع فعالية الأجسام المضادة PD-1 في الميلانوما
تحليل البقعة الغربية لمستويات CPT1A و PD-L1 في الخلايا المعالجة بجرعات متفاوتة من BEZ
والمضاد لـ CTLA-4. تم تلخيص أوزان الأورام بعد القتل الرحيم (
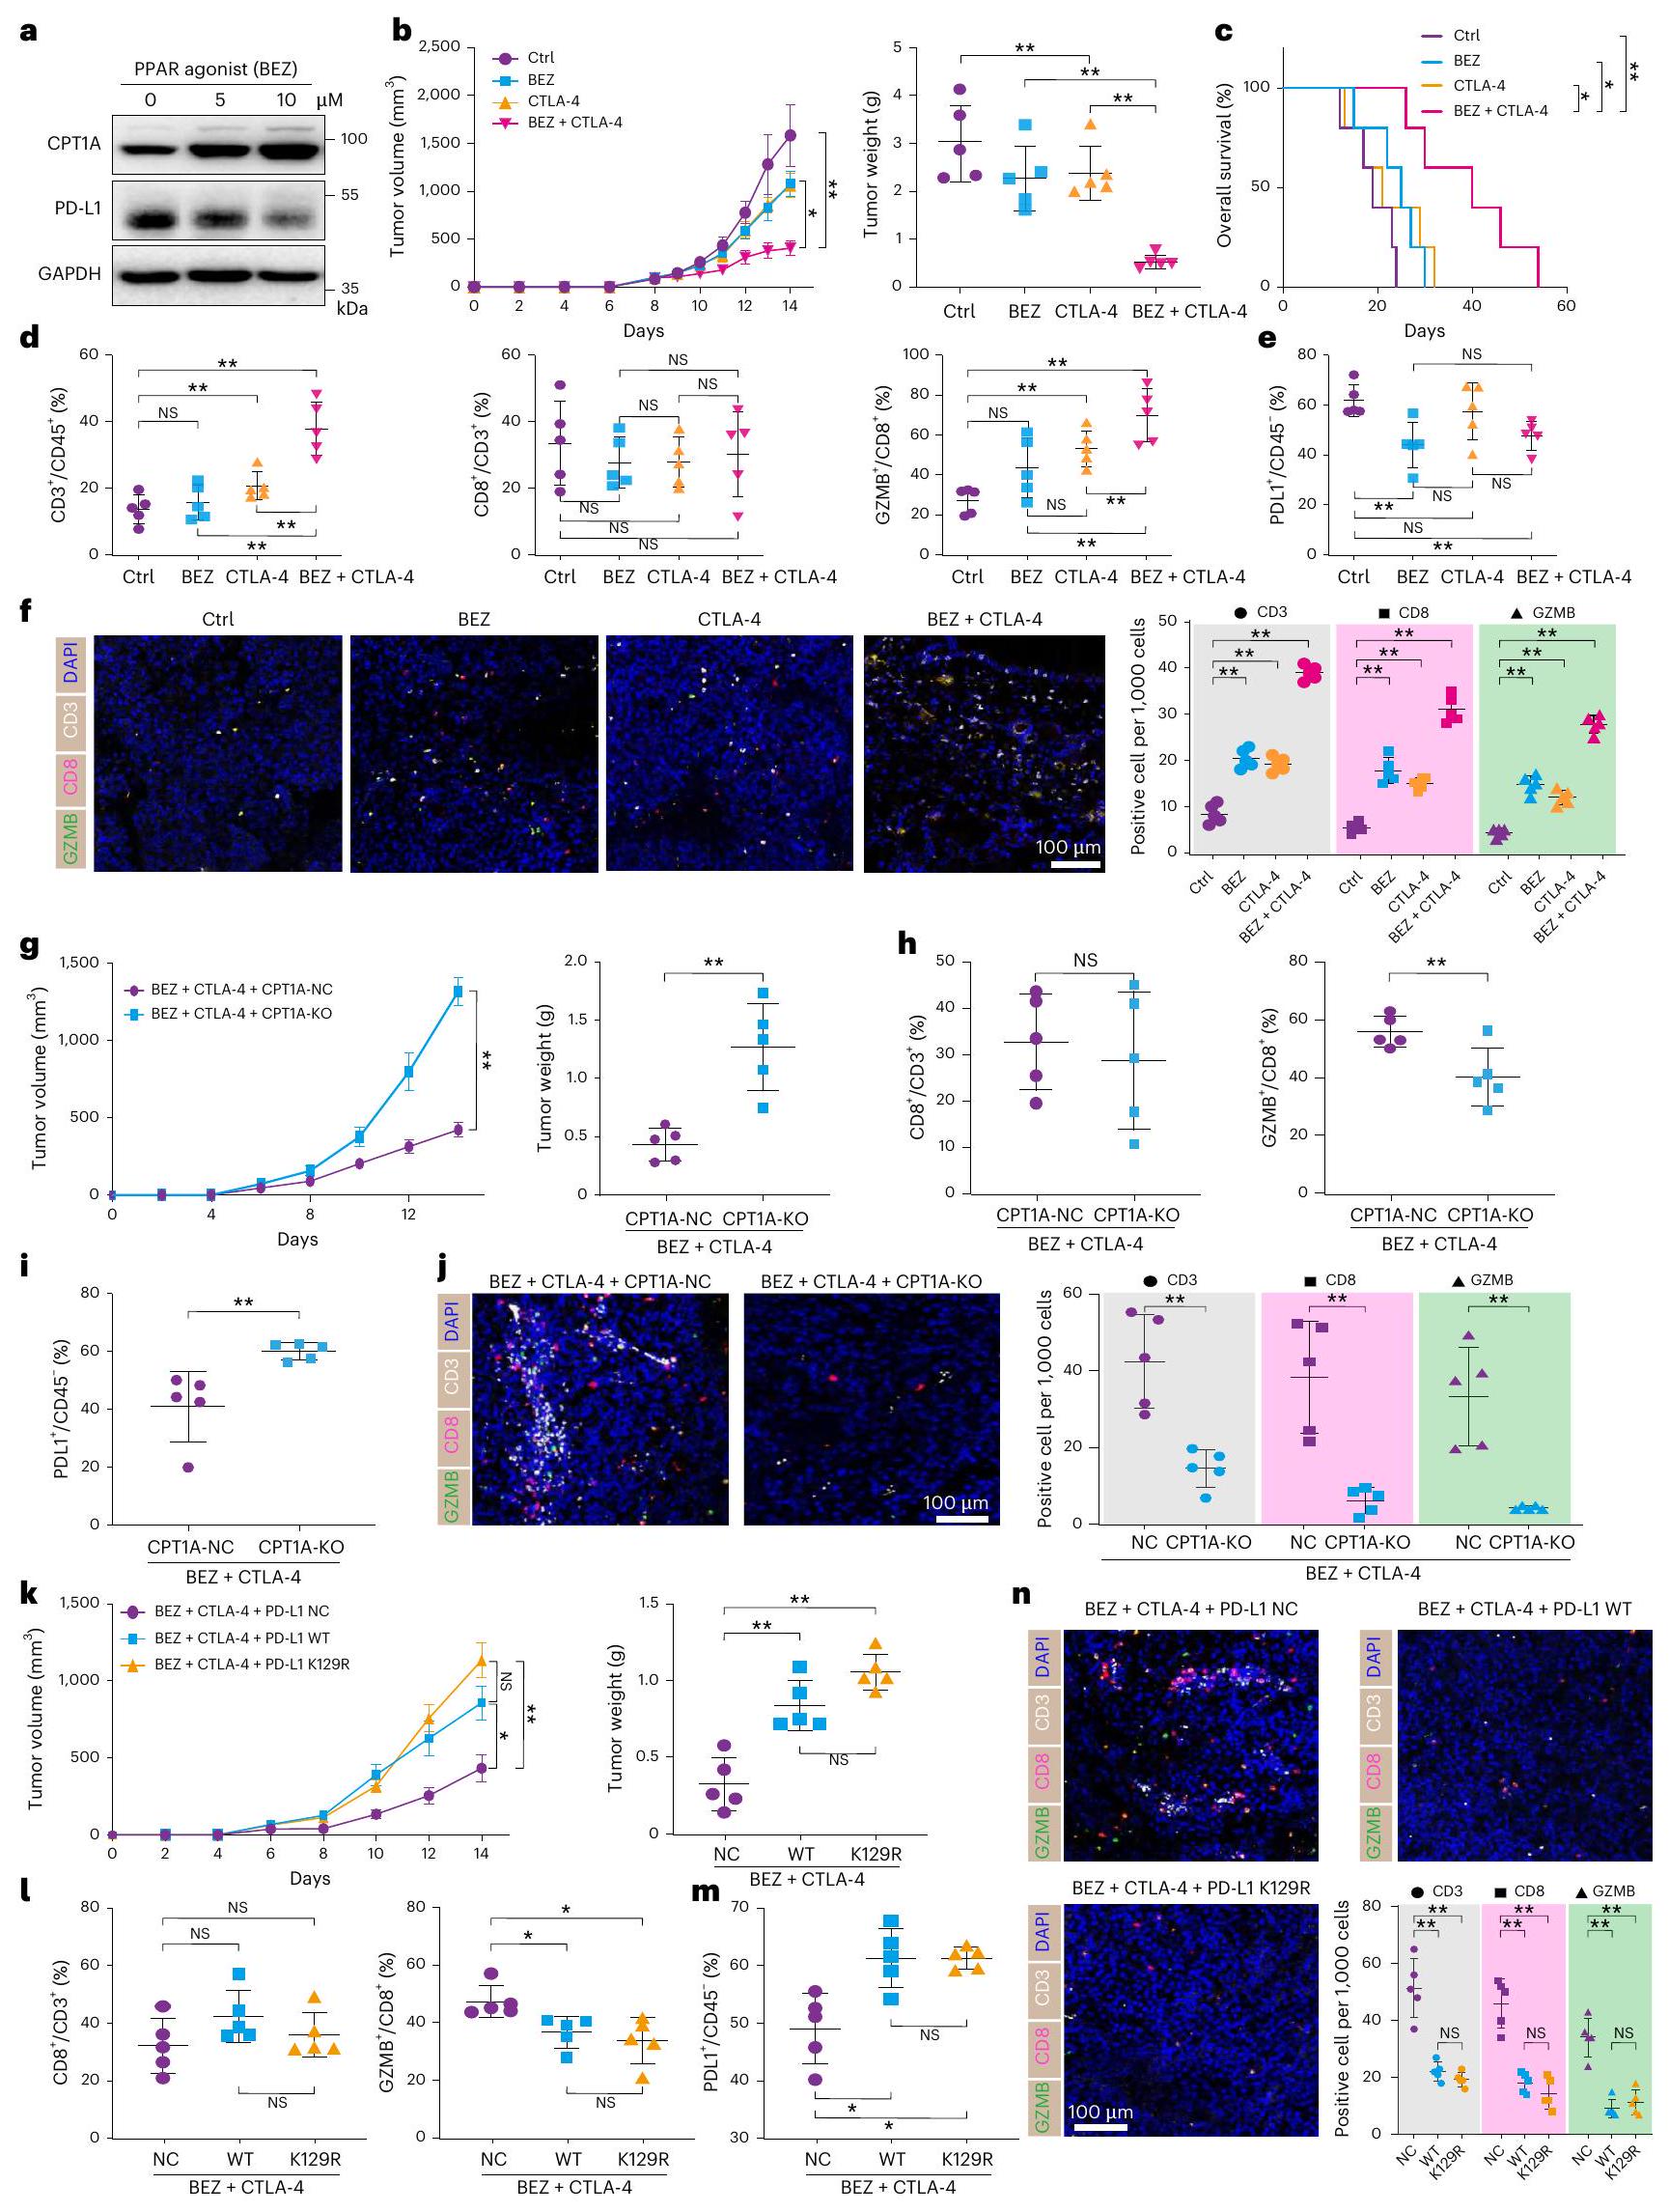
استنادًا إلى تعبير CPT1A و PD-L1
نقاش
المحتوى عبر الإنترنت
References
- Gonzalez, H., Hagerling, C. & Werb, Z. Roles of the immune system in cancer: from tumor initiation to metastatic progression. Genes Dev. 32, 1267-1284 (2018).
- Korman, A. J., Garrett-Thomson, S. C. & Lonberg, N. The foundations of immune checkpoint blockade and the ipilimumab approval decennial. Nat. Rev. Drug Discov. 21, 509-528 (2022).
- Ribas, A. & Wolchok, J. D. Cancer immunotherapy using checkpoint blockade. Science 359, 1350-1355 (2018).
- Morad, G., Helmink, B. A., Sharma, P. & Wargo, J. A. Hallmarks of response, resistance, and toxicity to immune checkpoint blockade. Cell 184, 5309-5337(2021).
- Kumagai, S. et al. Lactic acid promotes PD-1 expression in regulatory T cells in highly glycolytic tumor microenvironments. Cancer Cell 40, 201-218.e9 (2022).
- Pucino, V. et al. Lactate buildup at the site of chronic inflammation promotes disease by inducing
T cell metabolic rewiring. Cell Metab. 30, 1055-1074.e8 (2019). - Wu, X. et al. Targeting protein modifications in metabolic diseases: molecular mechanisms and targeted therapies. Signal Transduct. Target. Ther. 8, 220 (2023).
- Diskin, C., Ryan, T. A. J. & ONeill, L. A. J. Modification of proteins by metabolites in immunity. Immunity 54, 19-31 (2021).
- Zhang, Z. et al. Identification of lysine succinylation as a new post-translational modification. Nat. Chem. Biol. 7, 58-63 (2011).
- Sreedhar, A., Wiese, E. K. & Hitosugi, T. Enzymatic and metabolic regulation of lysine succinylation. Genes Dis. 7, 166-171 (2020).
- Alarcon, C., Wicksteed, B., Prentki, M., Corkey, B. E. & Rhodes, C. J. Succinate is a preferential metabolic stimulus-coupling signal for glucose-induced proinsulin biosynthesis translation. Diabetes 51, 2496-2504 (2002).
- Xu, H. et al. Lysine acetylation and succinylation in HeLa cells and their essential roles in response to UV-induced stress. Sci. Rep. 6, 30212 (2016).
- Wang, F. et al. SIRT5 desuccinylates and activates pyruvate kinase M2 to block macrophage IL-1
production and to prevent DSS-induced colitis in mice. Cell Rep. 19, 2331-2344 (2017). - Du, J. et al. Sirt5 is a NAD-dependent protein lysine demalonylase and desuccinylase. Science 334, 806-809 (2011).
- Wang, Y. et al. KAT2A coupled with the
-KGDH complex acts as a histone H3 succinyltransferase. Nature 552, 273-277 (2017). - Kurmi, K. et al. Carnitine palmitoyltransferase 1 A has a lysine succinyltransferase activity. Cell Rep. 22, 1365-1373 (2018).
- Yuan, H.-F. et al. PRMT5 confers lipid metabolism reprogramming, tumour growth and metastasis depending on the SIRT7-mediated desuccinylation of PRMT5 K387 in tumours. Acta Pharmacol. Sin. 43, 2373-2385 (2022).
- Harel, M. et al. Proteomics of melanoma response to immunotherapy reveals mitochondrial dependence. Cell 179, 236-250.e18 (2019).
- Wu, J.-Y. et al. Cancer-derived succinate promotes macrophage polarization and cancer metastasis via succinate receptor. Mol. Cell 77, 213-227.e5 (2020).
- Liu, P.-S. et al.
-Ketoglutarate orchestrates macrophage activation through metabolic and epigenetic reprogramming. Nat. Immunol. 18, 985-994 (2017). - Yang, Y. et al. Succinate dehydrogenase inhibitor dimethyl malonate alleviates LPS/D-galactosamine-induced acute hepatic damage in mice. Innate Immun. 25, 522-529 (2019).
- Scallet, A. C., Haley, R. L., Scallet, D. M., Duhart, H. M. & Binienda, Z. K. 3-Nitropropionic acid inhibition of succinate dehydrogenase (complex II) activity in cultured Chinese hamster ovary cells: antagonism by L-carnitine. Ann. NY Acad. Sci. 993, 305-309 (2003).
- Dörsam, B. & Fahrer, J. The disulfide compound
-lipoic acid and its derivatives: a novel class of anticancer agents targeting mitochondria. Cancer Lett. 371, 12-19 (2016). - Furuyama, K. & Sassa, S. Interaction between succinyl CoA synthetase and the heme-biosynthetic enzyme ALAS-E is disrupted in sideroblastic anemia. J. Clin. Invest. 105, 757-764 (2000).
- Li, F. et al. NADP
-IDH mutations promote hypersuccinylation that impairs mitochondria respiration and induces apoptosis resistance. Mol. Cell 60, 661-675 (2015). - Nusinow, D. P. et al. Quantitative proteomics of the cancer cell line encyclopedia. Cell 180, 387-402.e16 (2020).
- Chan, L.-C. et al. IL-6/JAK1 pathway drives PD-L1 Y112 phosphorylation to promote cancer immune evasion. J. Clin. Invest. 129, 3324-3338 (2019).
- Burr, M. L. et al. CMTM6 maintains the expression of PD-L1 and regulates anti-tumour immunity. Nature 549, 101-105 (2017).
- Maher, C. M. et al. Small-molecule sigma1 modulator induces autophagic degradation of PD-L1. Mol. Cancer Res. 16, 243-255 (2018).
- Eletto, D., Dersh, D. & Argon, Y. GRP94 in ER quality control and stress responses. Semin. Cell Dev. Biol. 21, 479-485 (2010).
- Pfeffer, S. R. Entry at the trans-face of the Golgi. Cold Spring Harb. Perspect. Biol. 3, a005272 (2011).
- Ferro, E., Bosia, C. & Campa, C. C. RAB11-mediated trafficking and human cancers: an updated review. Biology (Basel) 10, 26 (2021).
- Bucci, C., Bakke, O. & Progida, C. Rab7b and receptors trafficking. Commun. Integr. Biol. 3, 401-404 (2010).
- Cheng, X.-T. et al. Revisiting LAMP1 as a marker for degradative autophagy-lysosomal organelles in the nervous system. Autophagy 14, 1472-1474 (2018).
- Smestad, J., Erber, L., Chen, Y. & Maher, L. J. 3rd Chromatin succinylation correlates with active gene expression and is perturbed by defective TCA cycle metabolism. iScience 2, 63-75 (2018).
- Wang, H. et al. HIP1R targets PD-L1 to lysosomal degradation to alter T cell-mediated cytotoxicity. Nat. Chem. Biol. 15, 42-50 (2019).
- Yao, H. et al. Inhibiting PD-L1 palmitoylation enhances T-cell immune responses against tumours. Nat. Biomed. Eng. 3, 306-317 (2019).
- Xie, X.-Q. et al. Targeting ATAD3A-PINK1-mitophagy axis overcomes chemoimmunotherapy resistance by redirecting PD-L1 to mitochondria. Cell Res. 33, 215-228 (2023).
- Song, S. et al. Peroxisome proliferator activated receptor
(PPARα) and PPAR gamma coactivator (PGC-1α) induce carnitine palmitoyltransferase IA (CPT-1A) via independent gene elements. Mol. Cell. Endocrinol. 325, 54-63 (2010). - Viscomi, C. et al. In vivo correction of COX deficiency by activation of the AMPK/PGC-1
axis. Cell Metab. 14, 80-90 (2011). - Brand, A. et al. LDHA-associated lactic acid production blunts tumor immunosurveillance by T and NK cells. Cell Metab. 24, 657-671 (2016).
- Elia, I. et al. Tumor cells dictate anti-tumor immune responses by altering pyruvate utilization and succinate signaling in CD8
T cells. Cell Metab. 34, 1137-1150.e6 (2022). - Fischer, G. M. et al. Metabolic strategies of melanoma cells: mechanisms, interactions with the tumor microenvironment, and therapeutic implications. Pigment Cell Melanoma Res. 31, 11-30 (2018).
- Altman, B. J., Stine, Z. E. & Dang, C. V. From Krebs to clinic: glutamine metabolism to cancer therapy. Nat. Rev. Cancer 16, 619-634 (2016).
- Chang, L.-C., Chiang, S.-K., Chen, S.-E. & Hung, M.-C. Targeting 2-oxoglutarate dehydrogenase for cancer treatment. Am. J. Cancer Res. 12, 1436-1455 (2022).
- Byun, J.-K. et al. Inhibition of glutamine utilization synergizes with immune checkpoint inhibitor to promote antitumor immunity. Mol. Cell 80, 592-606.e8 (2020).
- Ishak Gabra, M. B. et al. Dietary glutamine supplementation suppresses epigenetically-activated oncogenic pathways to inhibit melanoma tumour growth. Nat. Commun. 11, 3326 (2020).
- Leone, R. D. et al. Glutamine blockade induces divergent metabolic programs to overcome tumor immune evasion. Science 366, 1013-1021 (2019).
- Martínez-Reyes, I. & Chandel, N. S. Mitochondrial TCA cycle metabolites control physiology and disease. Nat. Commun. 11, 102 (2020).
- Cheng, J. et al. Cancer-cell-derived fumarate suppresses the anti-tumor capacity of CD8
cells in the tumor microenvironment. Cell Metab. 35, 961-978.e10 (2023). - Li, J. et al. HDAC1/2/3 are major histone desuccinylases critical for promoter desuccinylation. Cell Discov. 9, 85 (2023).
- Su, Z. et al. TNF-
-induced KAT2A Impedes BMMSC quiescence by mediating succinylation of the mitophagy-related protein VCP. Adv. Sci. 11, e2303388 (2024). - Gut, P. et al. SUCLA2 mutations cause global protein succinylation contributing to the pathomechanism of a hereditary mitochondrial disease. Nat. Commun. 11, 5927 (2020).
- Cha, J.-H. et al. Metformin promotes antitumor immunity via endoplasmic-reticulum-associated degradation of PD-L1. Mol. Cell 71, 606-620.e7 (2018).
- Gao, Y. et al. Acetylation-dependent regulation of PD-L1 nuclear translocation dictates the efficacy of anti-PD-1 immunotherapy. Nat. Cell Biol. 22, 1064-1075 (2020).
- McGarry, J. D., Mannaerts, G. P. & Foster, D. W. A possible role for malonyl-CoA in the regulation of hepatic fatty acid oxidation and ketogenesis. J. Clin. Invest. 60, 265-270 (1977).
- Mills, S. E., Foster, D. W. & McGarry, J. D. Interaction of malonyl-CoA and related compounds with mitochondria from different rat tissues. Relationship between ligand binding and inhibition of carnitine palmitoyltransferase I. Biochem. J 214, 83-91 (1983).
- Ma, Y. et al. Functional analysis of molecular and pharmacological modulators of mitochondrial fatty acid oxidation. Sci. Rep. 10, 1450 (2020).
- Lu, X. et al. Effective combinatorial immunotherapy for castration-resistant prostate cancer. Nature 543, 728-732 (2017).
- Vazquez, F. et al. PGC1α expression defines a subset of human melanoma tumors withincreased mitochondrial capacity and resistance to oxidative stress. Cancer Cell 23, 287-301 (2013).
- Luo, C. et al. A PGC1α-mediated transcriptional axis suppresses melanoma metastasis. Nature 537, 422-426 (2016).
© The Author(s) 2025, corrected publication 2025
طرق
بيان أخلاقي
زراعة الخلايا والعلاج
الأجسام المضادة والمواد الكيميائية
(Baf-A1، رقم الكاتالوج S1413) كانت من Selleck. BEZ (رقم الكاتالوج HY-B0637)، إيتوموكساير (رقم الكاتالوج HY-50202)، C75 (رقم الكاتالوج HY-12364)، PEM (رقم الكاتالوج HY-B1334A)، بيتوبيرتين (رقم الكاتالوج HY-10809)، تونيكاميسين (رقم الكاتالوج HY-A0098)، هيغرومايسين B (رقم الكاتالوج HY-K1051) و CPI-613 (رقم الكاتالوج HY-15453) كانت من MedChemExpress. تم شراء الأجسام المضادة المضادة لـ CTLA-4 في الفئران (رقم الكاتالوج BE0164) والأجسام المضادة المضادة لـ CD8α في الفئران (رقم الكاتالوج BE0061) من Bio X Cell. للحصول على قائمة بالأجسام المضادة المستخدمة في دراسة تدفق الخلايا، يرجى مراجعة الملاحظة التكميلية.
عزل RNA، RT-qPCR
التحليل الغربي
المناعية الفلورية
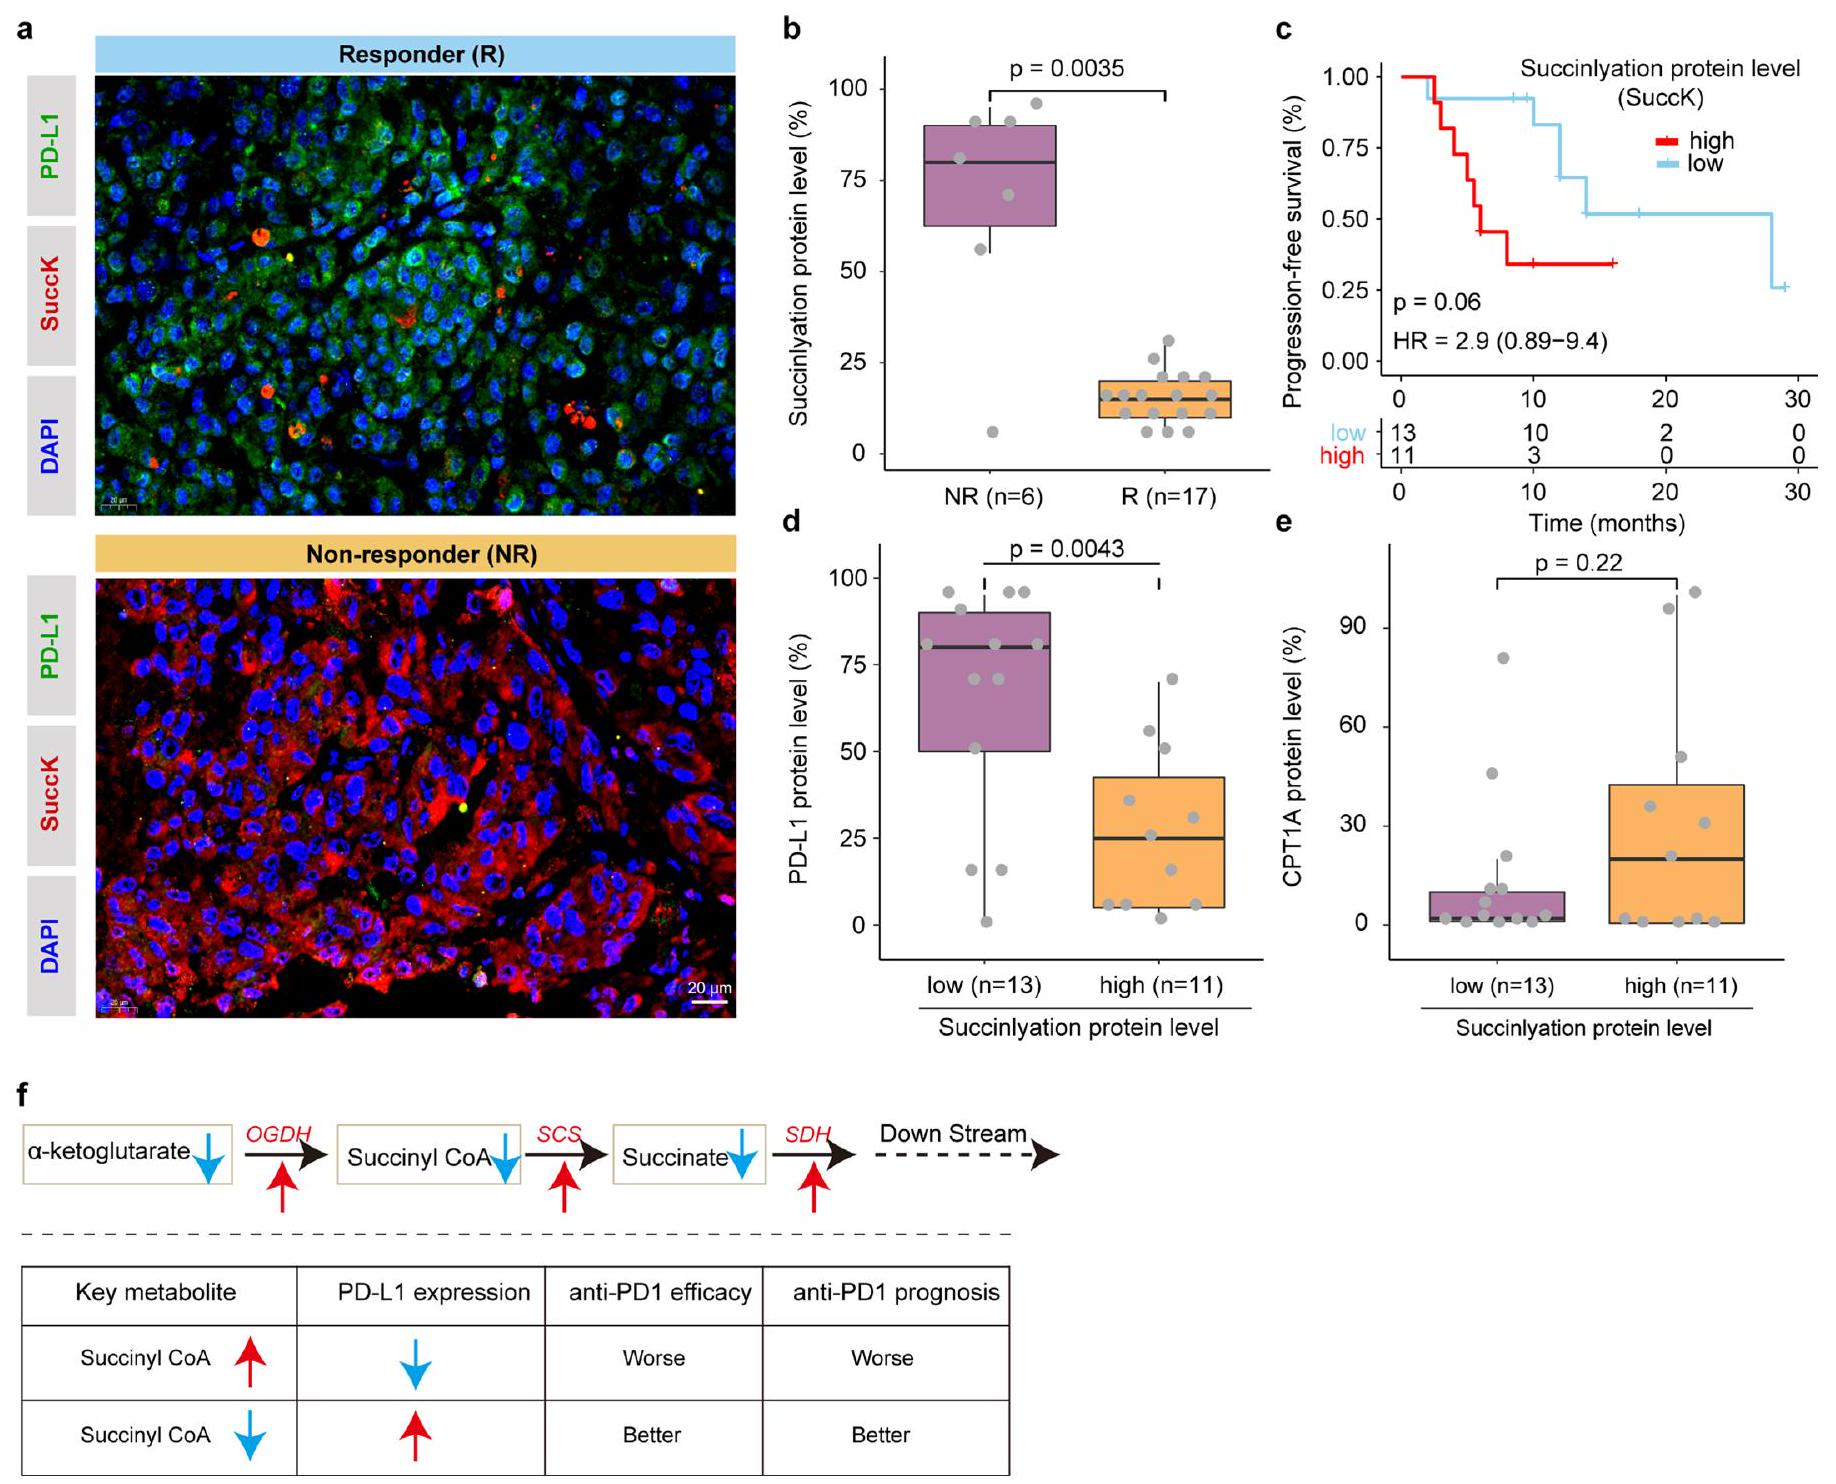
تم إضافة (Jackson ImmunoResearch، رقم الكاتالوج 115-165-003) إلى محلول الحجب وتم حضنه لمدة ساعتين. تم حضن DAPI لمدة 10 دقائق في درجة حرارة الغرفة في الظلام. تم الكشف عن الصور والتقاطها بواسطة المجهر الفلوري (Nikon، ECLIPSE Ts2R). تم تقدير تعبير الورم لـ CPT1A و PD-L1 والسوكينيل بواسطة درجة نسبة الورم، التي تمثل نسبة خلايا الورم ذات الصبغة الغشائية.
البلازميدات والناقلات
نموذج الفأر والعلاج التجريبي في الجسم الحي
جمع البيانات السريرية والعينات
تحليل إثراء المسارات و GSVA
تحليل النسخ الجيني المكاني لمجموعات بيانات الميلانوما
التصور، الإحصائيات وإمكانية التكرار
وتم استخدام تحليل الارتباط سبيرمان ثنائي الجانب في الأشكال 2a وb و6d والأشكال البيانية للبيانات الموسعة 1b مع تصحيح معدل الاكتشاف الكاذب (FDR) للمقارنات المتعددة؛ وتم استخدام اختبار لوغ-رانك في الأشكال 1e وg و5c و6g وh والأشكال البيانية للبيانات الموسعة 2f و3o و4c وd و8d وi؛ الجانب الثنائي
ملخص التقرير
توفر البيانات
تم تنزيل العلاج المشترك لمضاد PD-1 mAb أو مضاد CTLA-4 mAb من قاعدة بيانات أرشيف قراءة التسلسلhttps://www.ncbi.nlm.nih. gov/bioproject). مجموعة ليو/فان ألين
توفر الشيفرة
References
- Liu, H. et al. ADORA1 inhibition promotes tumor immune evasion by regulating the ATF3-PD-L1 axis. Cancer Cell 37, 324-339.e8 (2020).
-
. et al. The beneficial role of sunitinib in tumor immune surveillance by regulating tumor PD-L1. Adv. Sci. 8, 2001596 (2021). - Du, K. et al. Pathway signatures derived from on-treatment tumor specimens predict response to anti-PD1 blockade in metastatic melanoma. Nat. Commun. 12, 6023 (2021).
- Yoshihara, K. et al. Inferring tumour purity and stromal and immune cell admixture from expression data. Nat. Commun. 4, 2612 (2013).
- Hänzelmann, S., Castelo, R. & Guinney, J. GSVA: gene set variation analysis for microarray and RNA-Seq data. BMC Bioinf. 14, 7 (2013).
- Charoentong, P. et al. Pan-cancer immunogenomic analyses reveal genotype-immunophenotype relationships and predictors of response to checkpoint blockade. Cell Rep. 18, 248-262 (2017).
- Liberzon, A. et al. Molecular signatures database (MSigDB) 3.0. Bioinformatics 27, 1739-1740 (2011).
- Sergushichev, A. A. An algorithm for fast preranked gene set enrichment analysis using cumulative statistic calculation. Preprint at bioRxiv https://doi.org/10.1101/060012 (2016).
- Yu, G., Wang, L.-G., Han, Y. & He, Q.-Y. clusterProfiler: an R package for comparing biological themes among gene clusters. OMICS 16, 284-287 (2012).
- Stuart, T. et al. Comprehensive integration of single-cell data. Cell 177, 1888-1902.e21 (2019).
- Li, J. et al. Single-cell characterization of the cellular landscape of acral melanoma identifies novel targets for immunotherapy. Clin. Cancer Res. 28, 2131-2146 (2022).
- Xun, Z. et al. Reconstruction of the tumor spatial microenvironment along the malignant-boundary-nonmalignant axis. Nat. Commun. 14, 933 (2023).
- Beck, L. et al. Clinical proteomics of metastatic melanoma reveals profiles of organ specificity and treatment resistance. Clin. Cancer Res. 27, 2074-2086 (2021).
- Xue, G. et al. Clinical drug screening reveals clofazimine potentiates the efficacy while reducing the toxicity of anti-PD-1 and CTLA-4 immunotherapy. Cancer Cell 42, 780-796.e6 (2024).
- Gide, T. N. et al. Distinct immune cell populations define response to anti-PD-1 monotherapy and anti-PD-1/anti-CTLA-4 combined therapy. Cancer Cell 35, 238-255.e6 (2019).
- Liu, D. et al. Integrative molecular and clinical modeling of clinical outcomes to PD1 blockade in patients with metastatic melanoma. Nat. Med. 25, 1916-1927 (2019).
- Ulloa-Montoya, F. et al. Predictive gene signature in MAGE-A3 antigen-specific cancer immunotherapy. J. Clin. Oncol. 31, 2388-2395 (2013).
- Jung, H. et al. DNA methylation loss promotes immune evasion of tumours with high mutation and copy number load. Nat. Commun. 10, 4278 (2019).
- Chang, K. et al. The cancer genome atlas pan-cancer analysis project. Nat. Genet. 45, 1113-1120 (2013).
- Edwards, N. J. et al. The CPTAC data portal: a resource for cancer proteomics research. J. Proteome Res. 14, 2707-2713 (2015).
شكر وتقدير
مساهمات المؤلفين
المصالح المتنافسة
معلومات إضافية
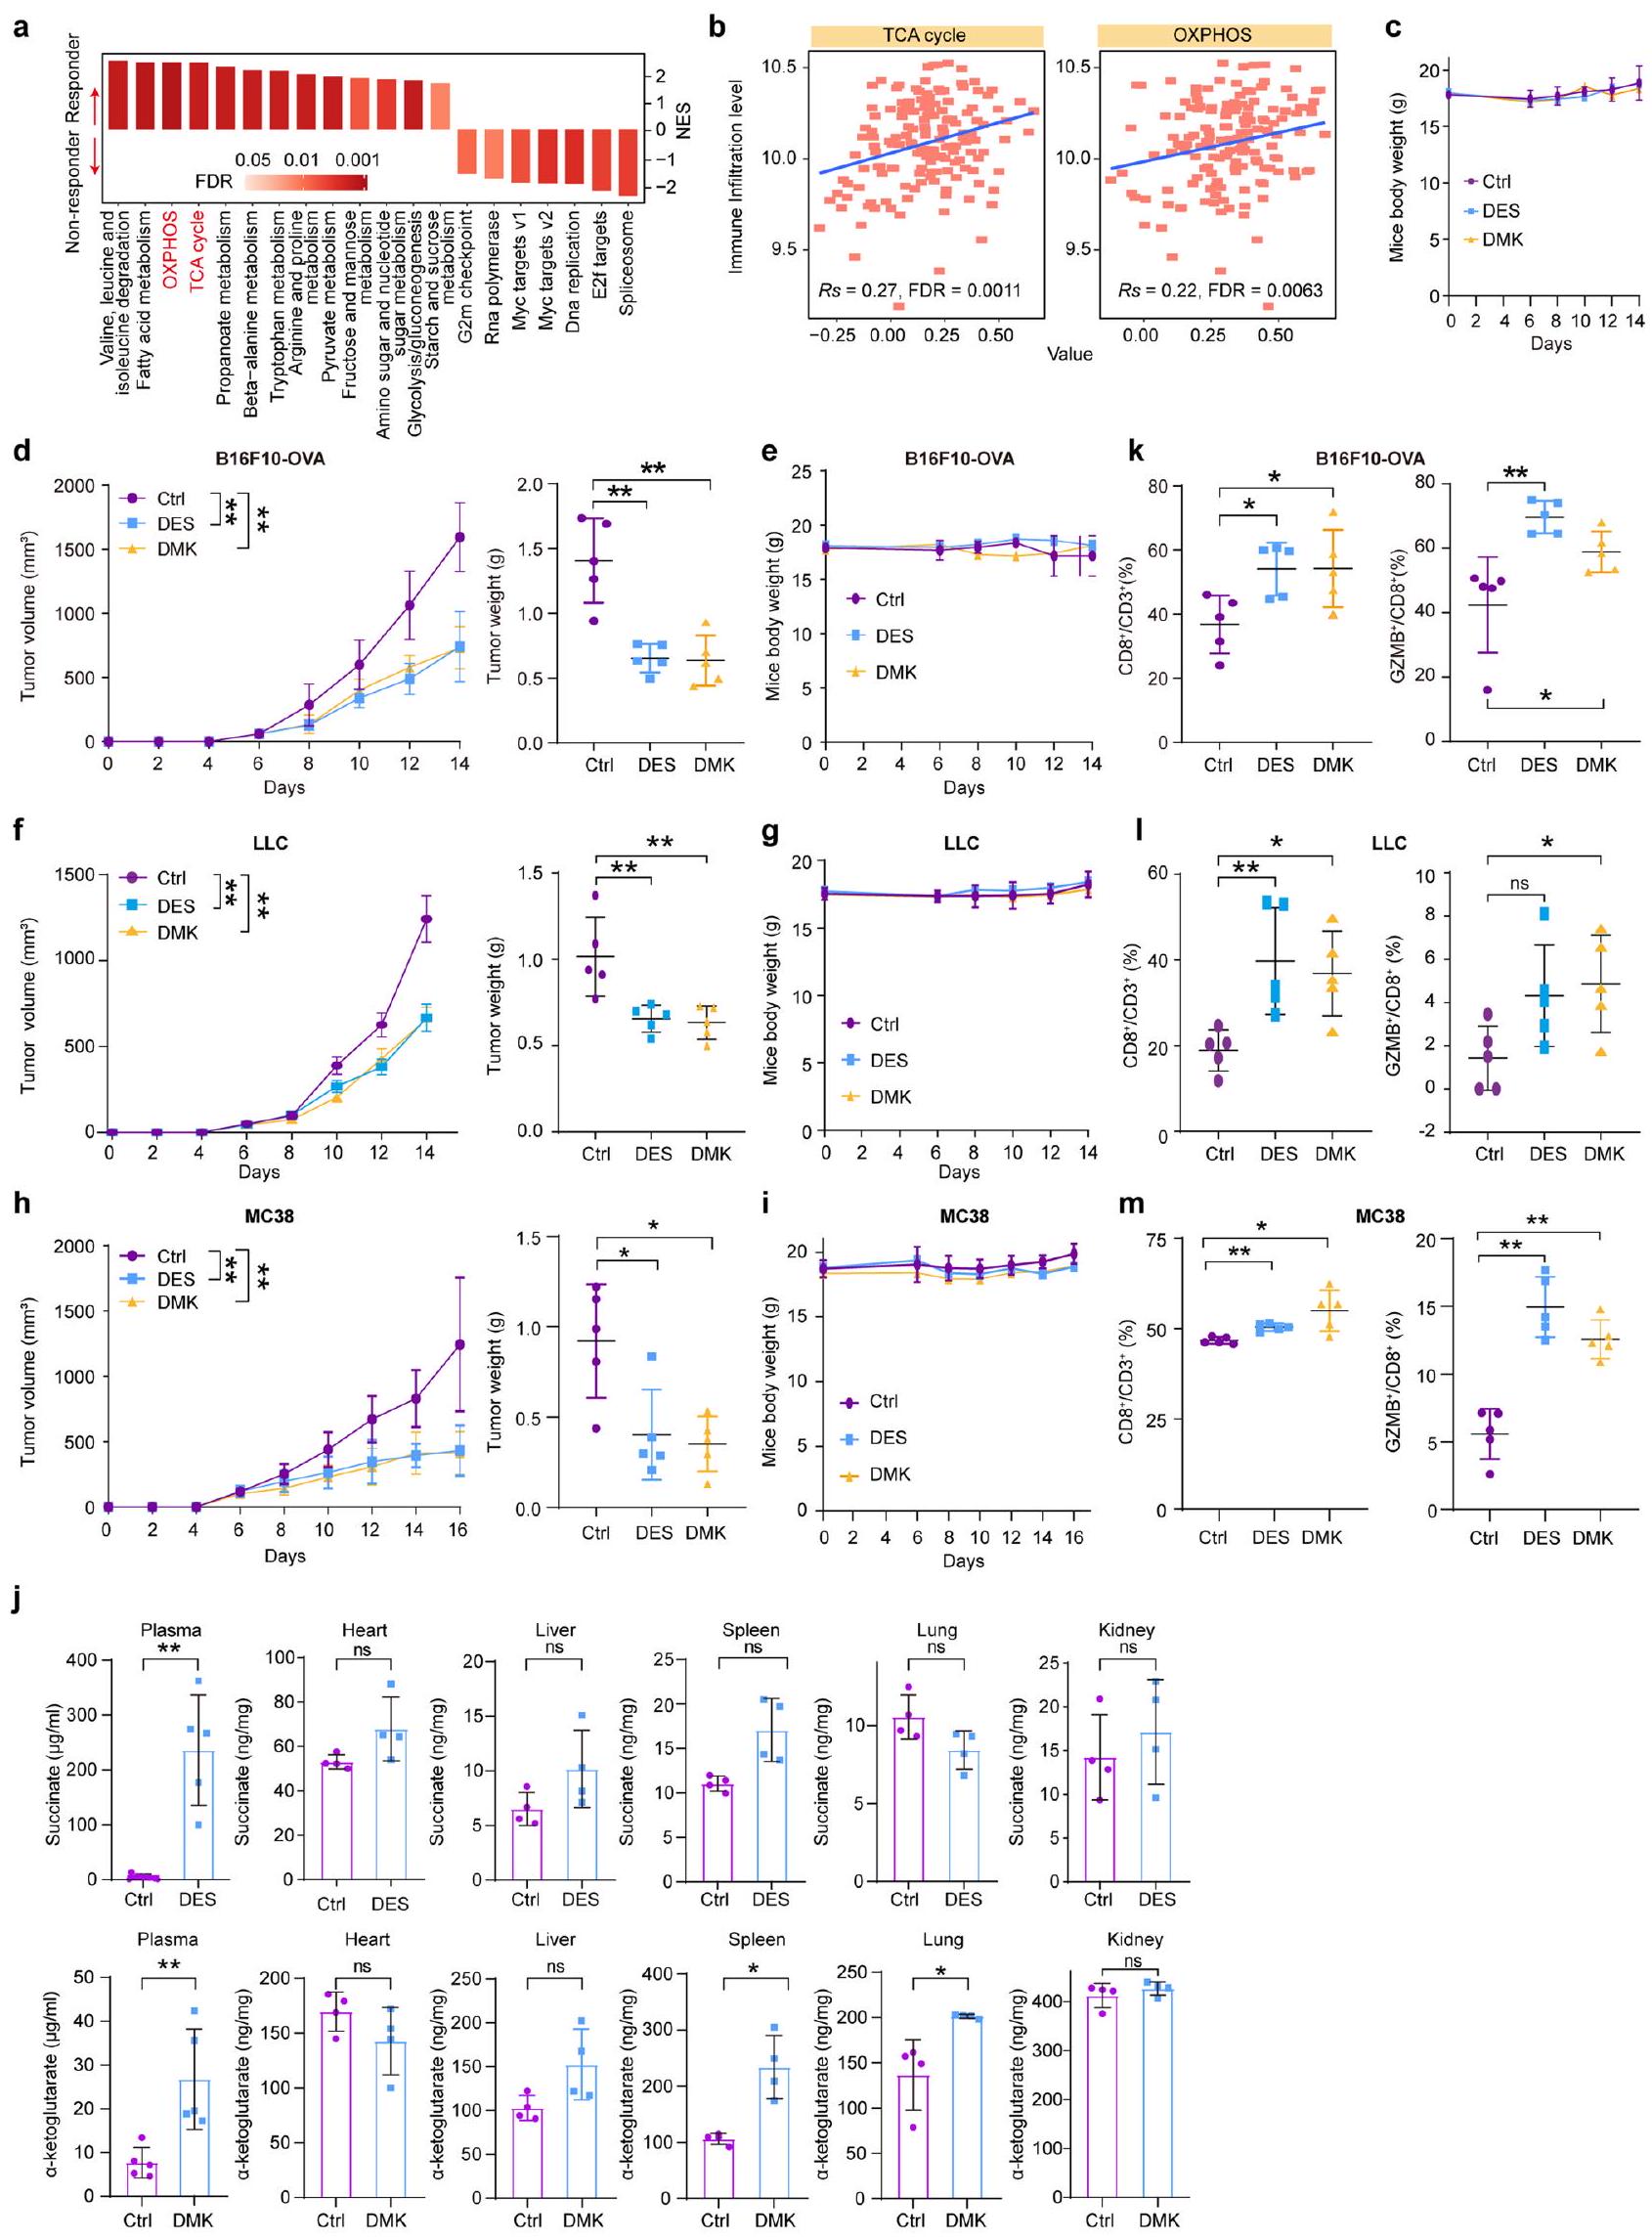
الأوزان في الفئران الحاملة للأورام B16F10-OVA (د، هـ)، LLC (و، ز)، أو MC38 (ح، ط) المعالجة بـ Ctrl، DES، أو DMK (
(
مع مثبط ناقل الجلايسين 1 (بيتوبرتين) و IFN
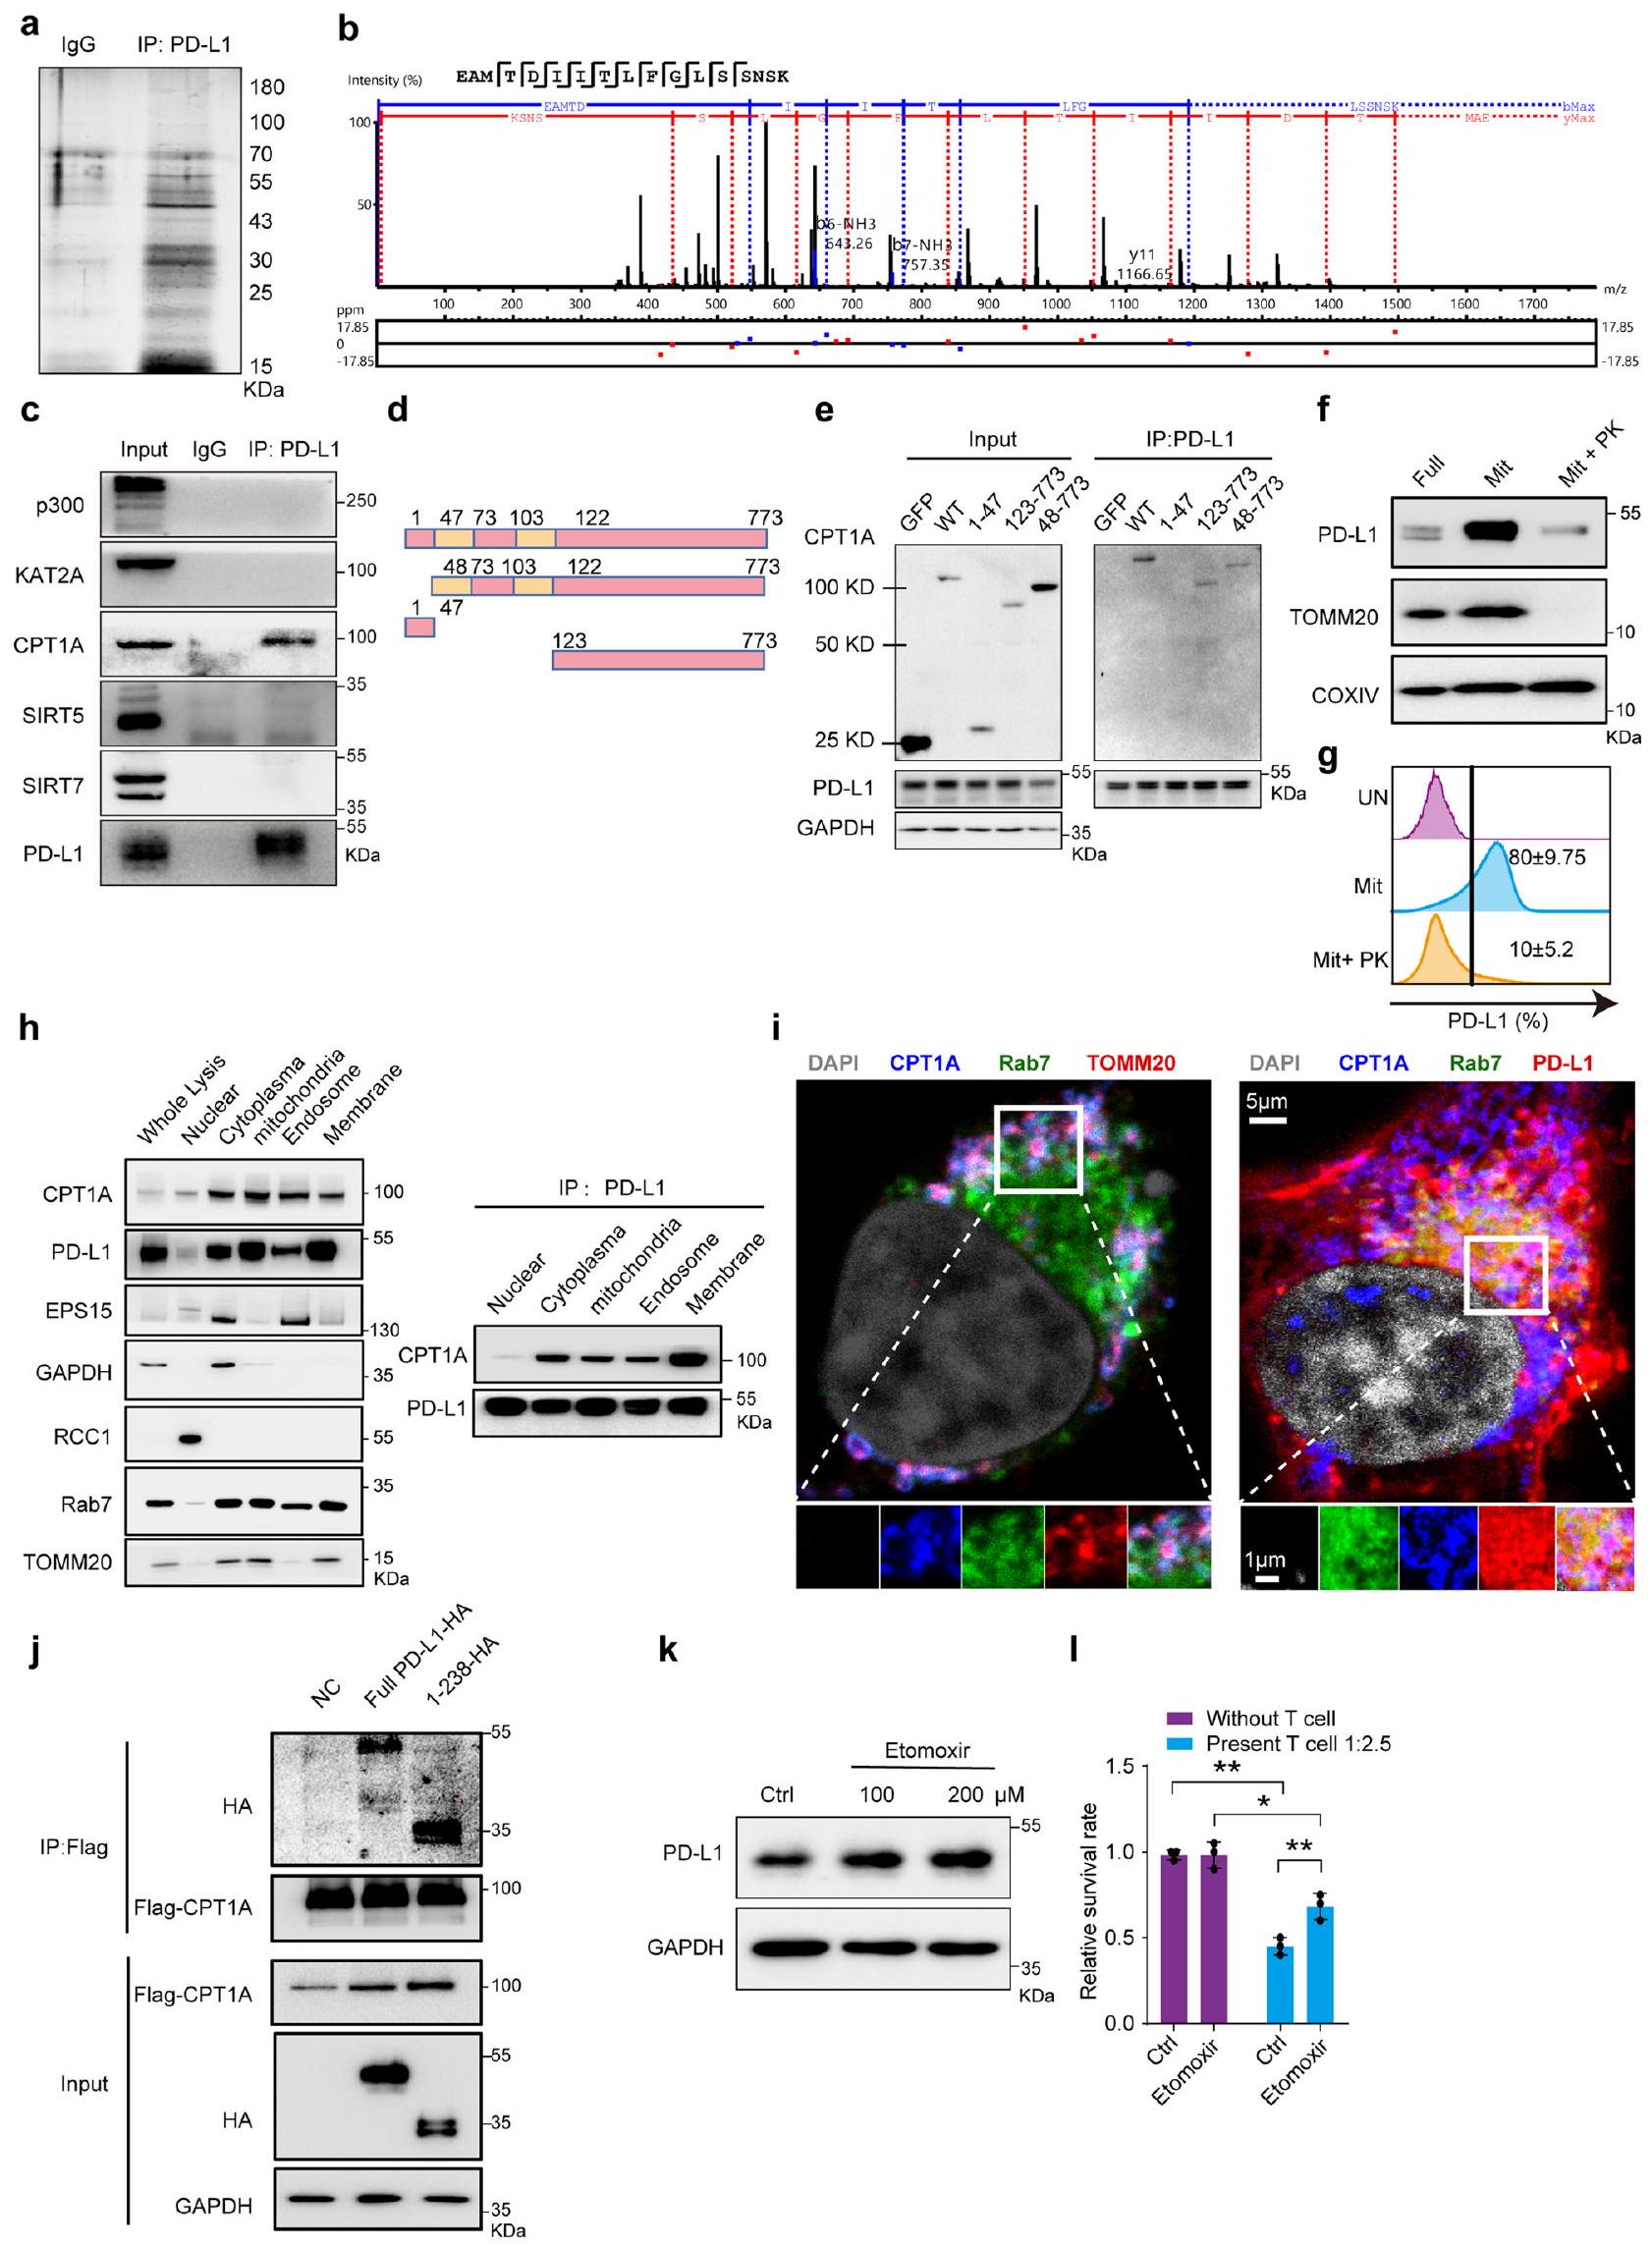
تم تحليل (الغشاء، الإندوسومي) للتعبير عن PD-L1 وCPT1A. قامت تحليل IP بتقييم تفاعل PD-L1 مع CPT1A، مع ضوابط لـ RCC1 (نووي)، GAPDH (سيتوبلازمي)، TOMM20 (ميتوكوندري)، Rab7 (إندوسومي).
العلاج. على وجه التحديد، زادت تعبير OGDH من تحويل
محفظة الطبيعة
آخر تحديث من المؤلفين: 2025.2.5
ملخص التقرير
الإحصائيات
غير متوفر
تم التأكيد
□ X
حجم العينة بالضبط
□

□ X
اختبار(ات) الإحصاء المستخدمة وما إذا كانت أحادية الجانب أو ثنائية الجانب
يجب أن تُوصف الاختبارات الشائعة فقط بالاسم؛ واصفًا التقنيات الأكثر تعقيدًا في قسم الطرق.
□ وصف لجميع المتغيرات المرافقة التي تم اختبارها
□ X
وصف لأي افتراضات أو تصحيحات، مثل اختبارات الطبيعية والتعديل للمقارنات المتعددة
□
□ X
لاختبار الفرضية الصفرية، فإن إحصائية الاختبار (على سبيل المثال،
□ لتحليل بايزي، معلومات حول اختيار القيم الأولية وإعدادات سلسلة ماركوف مونت كارلو
□ ⟶
تقديرات أحجام التأثير (مثل حجم تأثير كوهين)
البرمجيات والشيفرة
جمع البيانات
بيورندرhttps://www.biorender.com/للحصول على مزيد من التفاصيل، يرجى الاطلاع على قسم الطرق وتوافر البيانات.
تم استخدام الأدوات المتاحة للجمهور التالية للتحليلات: Estimate (v1.0.13)، GSVA (v1.40.1)، fgsea (v1.18.0)، clusterProfiler (4.0.5)، Seurat (v4.4.0)، Cottrazm (v0.1.1)، survival (v.3.5.7). حزم R الإحصائية (v4.1.0) وGraphpad Prism (v8.0.1). يمكن العثور على التفاصيل والمراجع ضمن النص في قسم الطرق ذات الصلة والملاحظة التكميلية.
بيانات
يجب أن تتضمن جميع المخطوطات بيانًا حول توفر البيانات. يجب أن يوفر هذا البيان المعلومات التالية، حيثما ينطبق:
- رموز الانضمام، معرفات فريدة، أو روابط ويب لمجموعات البيانات المتاحة للجمهور
- وصف لأي قيود على توفر البيانات
- بالنسبة لمجموعات البيانات السريرية أو بيانات الطرف الثالث، يرجى التأكد من أن البيان يتماشى مع سياستنا
البحث الذي يتضمن مشاركين بشريين، بياناتهم، أو مواد بيولوجية
التقارير الخاصة بالمجال
علوم الحياة □ العلوم السلوكية والاجتماعية □ العلوم البيئية والتطورية والبيئية
لنسخة مرجعية من الوثيقة بجميع الأقسام، انظرnature.com/documents/nr-reporting-summary-flat.pdf
تصميم دراسة العلوم الحياتية
حجم العينة
حجم العينة: تم توثيق تفاصيل حجم العينة بالكامل في قسم الطرق والأساطير المقابلة للأشكال. لم يتم إجراء حسابات القوة مسبقًا لتحديد أحجام العينات. تم اختيار أحجام العينات بناءً على كل من التقاليد المعمول بها في المجال (عادةً
التقارير عن مواد وأنظمة وطرق محددة
محفظة الطبيعة | ملخص التقرير
أبريل 2023
| غير متوفر | مشارك في الدراسة | غير متوفر |
| □ | أجسام مضادة X |  |
| □ | – خطوط خلايا حقيقية النواة | □ |
| V | □ علم الحفريات وعلم الآثار | إكس |
| □ | 【 الحيوانات وغيرها من الكائنات الحية | |
| إكس | □ | |
| إكس | □ |
الأجسام المضادة
| الأجسام المضادة المستخدمة |
|
أبريل 2023
CD40 [مُتعدد النسائل]
https://abclonal.com.cn/catalog/A0218
فيستا [D1L2G] (1:2000)
https://www.cellsignal.cn/products/primary-antibodies/vista-d1|2g-xp-rabbit-mab/64953
PD-L2 [D7U8C] (1:2000)
https://www.cellsignal.cn/products/primary-antibodies/pd-l2-d7u8c-xp-rabbit-mab/82723
PVR [D8A5G] (1:2000)
https://www.cellsignal.cn/products/primary-antibodies/pvr-cd155-d8a5g-rabbit-mab/81254
CD70 [متعدد النسائل]
https://abclonal.com.cn/catalog/A2032
CD80 [E3Q9V] (1:2000)
https://www.cellsignal.cn/products/primary-antibodies/cd80-e3q9v-rabbit-mab/15416
CD86 [متعدد النسائل]
https://abclonal.com.cn/catalog/A19026
CD112 [D8D3F] (1:2000)
https://www.cellsignal.cn/products/primary-antibodies/nectin-2-cd112-d8d3f-xp-rabbit-mab/95333CD276 [متعدد النسائل] (1:2000)
https://abclonal.com.cn/catalog/A21663
OX40L [متعدد النسائل] (1:2000)
https://abclonal.com.cn/catalog/A18389
TNFSF14 [متعدد النسائل] (1:2000)
https://abclonal.com.cn/catalog/A2002
GITRL [مُتعدد النسائل] (1:2000)
https://abclonal.com.cn/catalog/A7028
PD-L1 [E1L3N] (1:2000)
https://www.cellsignal.cn/products/primary-antibodies/pd-I1-e1I3n-xp-rabbit-mab/13684
SQSTM1/p62 [D6M5X] (1:2000)
https://www.cellsignal.cn/products/primary-antibodies/sqstm1-p62-d6m5x-rabbit-mab/23214 LC3A/B [D3U4C] (1:2000)
https://www.cellsignal.cn/products/primary-antibodies/lc3a-b-d3u4c-xp-rabbit-mab/12741PD-L1 [EPR19759] (1:2000)
https://www.abcam.cn/products/primary-antibodies/pd-l1-antibody-epr19759-ab213524.htmlPD-L1 [EPR20529] (1:2000)
https://www.abcam.cn/products/primary-antibodies/pd-l1-antibody-epr20529-ab213480.htmlبيكلين1 [EPR19662] (1:2000)
https://www.abcam.cn/products/primary-antibodies/beclin-1-antibody-epr19662-ab207612.html CPT1A [متعدد النسائل] (1:2000)
https://www.ptgcn.com/products/CPT1A-Antibody-15184-1-AP.htm
HIP1R [مضاد متعدد النسائل]
https://www.ptgcn.com/products/HIP1R-Antibody-16814-1-AP.htm
جيه إيه بي دي إتش [1E6D9] (1:5000)
https://www.ptgcn.com/products/GAPDH-Antibody-60004-1-lg.htm
آلاس1 [A4817] (1:2000)
https://www.abclonal.com/catalog-antibodies/ALAS1RabbitmAb/A4817
TOM20 [A19403] (1:2000)
https://www.abclonal.com/catalog-antibodies/TOM20RabbitmAb/A19403
مضاد CPT1A [8F6AE9] (1:2000)
https://www.abcam.com/ar/products/الأجسام-المضادة-الأولية/cpt1a-antibody-8f6ae9-ab128568
للعلاج
مضاد CTLA-4 [9D9]
https://bioxcell.com/invivoplus-anti-mouse-ctla-4-cd152-bp0164
مضاد CD8
https://bioxcell.com/invivomab-anti-mouse-cd8-alpha-be0061
لـ IHC أو IF
جرانزيم ب [مُتعدد النسائل] (1:200)
https://www.abcam.cn/products/primary-antibodies/granzyme-b-antibody-ab4059.htmlRab7B [EPR15727]
https://www.abcam.cn/products/primary-antibodies/rab7b-antibody-epr15727-ab193360.htmlCD3 [SP7] (1:200)
https://www.abcam.cn/products/primary-antibodies/cd3-epsilon-antibody-sp7-ab16669.htmlPD-L1 [66248-1-Ig] (1:200)
https://www.ptgcn.com/products/PD-L1-CD274-Antibody-66248-1-Ig.htm
TGN46 [وحيد النسيلة] (1:200)
https://www.ptgcn.com/products/TGOLN2,TGN46-Antibody-13573-1-AP.htm
CD8
https://www.abcam.cn/products/primary-antibodies/cd8-alpha-antibody-epr21769-ab217344.html
Rab11B [مُتعدد النسخ]
https://www.ptgcn.com/products/RAB11A-Antibody-15903-1-AP.htm
GRP94 [مُتعدد النسائل] (1:200)
https://www.ptgcn.com/products/HSP90B1-Antibody-14700-1-AP.htm
لتحليل التدفق الخلوي:
APC/Cyanine7-CD45 [30-F11] (1:200)
https://www.biolegend.com/ar/products/apc-cyanine7-anti-mouse-cd45-antibody-2530
APC-CD3 [17A2] (1:200)
https://www.biolegend.com/ar/products/apc-anti-mouse-cd3-antibody-8055
PECY5.5-CD4 [GK1.5] (1:200)
https://www.biolegend.com/ar/products/percp-cyanine5-5-anti-mouse-cd4-antibody-4220
BB700-CD4 [GK1.5]
https://www.bdbiosciences.com/zh-cn/products/reagents/flow-cytometry-reagents/research-reagents/single-color-antibodies-ruo/bb700-فأر-مضاد-للبشر-cd4.745998
PECY7-CD8 [53-6.7] (1:200)
https://www.biolegend.com/ar/products/pe-cyanine7-anti-mouse-cd8a-antibody-1906
APC-PD-L1 [10F.9G2] (1:200)
https://www.biolegend.com/ar/products/apc-anti-mouse-cd274-b7-h1-pd-l1-antibody-6655
APC-F4/80 [BM8] (1:200)
https://www.biolegend.com/ar/products/apc-cyanine7-anti-mouse-f4-80-recombinant-antibody-21272
APC-CD25 [PC61] (1:200)
https://www.biolegend.com/ar/الخلايا-التحكم-المجففة/apc-مضاد-cd25-للفئران-420
BV421-Gr-1 [RB6-8C5] (1:200)
https://www.biolegend.com/ja-jp/products/brilliant-violet-421-anti-mouse-ly-6g-ly-6c-gr-1-antibody-7201?GroupID=BLG4876
PE-Cy7-CD11b [M1/70] (1:200)
https://www.biolegend.com/ar/products/pe-cyanine7-anti-mouse-human-cd11b-antibody-1921?GroupID=BLG10427
PerCP-Cy5.5-MHCII [M5/114.15.2] (1:200)
https://www.biolegend.com/ar/products/percp-cyanine5-5-anti-mouse-i-a-i-e-antibody-4282?GroupID=BLG4736
PE-FOXP3 [FJK-16s] (1:200)
https://www.thermofisher.cn/cn/zh/antibody/product/FOXP3-Antibody-clone-FJK-16s-Monoclonal/12-5773-82
FITC-GZMB [QA16A02] (1:200)
https://www.biolegend.com/ar/products/fitc-anti-human-mouse-granzyme-b-recombinant-antibody-14430
PECY594-GZMB [QA16A02] (1:200)
https://www.biolegend.com/ar/products/pedazzle-594-anti-humanmouse-granzyme-b-recombinant-antibody-15598
PE-CD206 [C068C2] (1:200)
https://www.biolegend.com/ar/products/pe-anti-mouse-cd206-mmr-antibody-7424?GroupID=BLG9506
PE-PD-L1 [29E.2A3] (1:200)
https://www.biolegend.com/ar/products/pe-anti-human-cd274-b7-h1-pd-l1-antibody-4375
الأجسام المضادة الثانوية وDAPI:
الأجسام المضادة من نوع IgG الموجهة ضد الأرانب (GB21303)
https://www.service-bio.com/goodsdetail?id=253
FITC ماعز مضاد للأرنب IgG (GB22303)
https://www.service-bio.com/goodsdetail?id=259
DAPI (G1012)
https://www.servicebio.cn/goodsdetail?id=1762
الأجسام المضادة من الماعز ضد الأرانب IgG (GB27303)
https://www.servicebio.cn/goodsdetail?id=4191
خطوط خلايا حقيقية النواة
تلوث الميكوبلازما
الخطوط التي يتم التعرف عليها بشكل خاطئ بشكل شائع (انظر سجل ICLAC)
تم اختبار جميع خطوط الخلايا سلبية لتلوث الميكوبلازما.
الحيوانات وغيرها من الكائنات البحثية
عينات تم جمعها من الميدان
استخدمت الدراسات إناث الفئران.
لم تتضمن الدراسة عينات تم جمعها من الميدان.
رقابة الأخلاقيات
النباتات
| مخزونات البذور | غير متوفر |
| أنماط جينية نباتية جديدة | غير متوفر |
| المصادقة | غير متوفر |
تدفق الخلايا
المؤامرات
أكد أن:
المقاييس على المحاور واضحة تمامًا. قم بتضمين الأرقام على المحاور فقط للرسم البياني في أسفل اليسار من المجموعة (المجموعة هي تحليل للعلامات المتطابقة).
جميع الرسوم البيانية هي رسوم بيانية متساوية الارتفاع مع نقاط شاذة أو رسوم بيانية بالألوان الزائفة.
تم توفير قيمة عددية لعدد الخلايا أو النسبة المئوية (مع الإحصائيات).
المنهجية
| تحضير العينة | بالنسبة لعينات الفئران، تم إعداد تعليقات خلوية مفردة من أورام زراعة الأنسجة المستمدة من C57BL/6 (بما في ذلك B16F10 و LLC و MC38) عن طريق إزالة سريعة ولطيفة، تلتها تفكيك ميكانيكي وترشيح. |
| آلة | بي دي إل إس آر فورتيسا
|
| برمجيات | تمت معالجة البيانات بشكل إضافي بواسطة برنامج FlowJo (الإصدار 10.0). |
| وفرة تجمع الخلايا | لم يتم استخدام فرز الخلايا في أي من التجارب. |
| استراتيجية البوابة | تم تحديد الخلايا اللمفاوية بناءً على FSC-A و SSC-A. تم تحديد الخلايا المفردة وفقًا لـ FSC-H مقابل FSC-W. تم استبعاد الخلايا الميتة باستخدام صبغة حيوية (Zombie Aqua™). تم تحديد الخلايا المناعية الحية CD45+، تلاها تحديد مجموعات الخلايا المحددة بناءً على تعبير علامات السطح. لاستراتيجية التحديد، انظر الشكل التوضيحي التكميلي 1. |
قسم الأمراض الجلدية، مستشفى شيانغيا ومدرسة علوم الحياة ومختبر فورونغ، جامعة وسط الجنوب، تشانغشا، الصين.
علم الوراثة الطبية وكلية علوم الحياة، جامعة جنوب الوسط، تشانغشا، الصين. مختبر هنان الرئيسي لسرطان الجلد والصدفية، مركز هنان الهندسي لأبحاث صحة الجلد والأمراض، مركز شيانغيا للبحوث السريرية لعلاج السرطان المناعي، المركز الوطني للبحوث السريرية للاضطرابات الشيخوخة، جامعة وسط جنوب الصين، تشانغشا، الصين. قسم العلوم الإحصائية، كلية لندن الجامعية، لندن، المملكة المتحدة. معهد الدراسات العليا للعلوم الطبية الحيوية، معهد الكيمياء الحيوية وعلم الأحياء الجزيئي، مركز أبحاث بيولوجيا السرطان، مركز بيولوجيا السرطان والعلاج الدقيق، ومركز الطب الجزيئي، جامعة الصين الطبية، تايتشونغ، تايوان. ساهم هؤلاء المؤلفون بالتساوي: لونغ ليانغ، شينوي كوانغ، يي هي. هؤلاء المؤلفون أشرفوا بشكل مشترك على هذا العمل: جينغ ليو، هونغ ليو، شيانغ تشين. البريد الإلكتروني:liujing2@sklmg.edu.cn; hongliu1014@csu.edu.cn; chenxiangck@126.com - (
تحليل البقاء للفئران بعد العلاج بـ DMK أو DES مستويات السكسينات و AKG في خلايا الورم من الفئران المعالجة بـ DMK أو DES لكل مجموعة). أنا، قياس و نسب CTL في كتل الورم لكل مجموعة). تلوين المناعة لـ CD3 و CD8 و GZMB في أورام B16F10 لكل مجموعة). شريط القياس، قياسات حجم الورم بعد CD8 استنزاف خلايا T والعلاجات لكل مجموعة). أنا، خريطة حرارية للتعبير عن OGDH و SCS و SDH في مناطق الورم. شريط القياس، مخطط مسارات إنتاج السكسينيل-CoA. ن، مستويات السكسينات وAKG في خلايا A375 المعالجة بنظائر الأيض. .، O، خلايا A375 المعالجة بالجليسين ومتماثلات الأيض، المزروعة مع خلايا T، تليها صبغة الكريستال البنفسجي ( ). مستويات السكسينيل-CoA المقاسة بواسطة LC-MS في خلايا A375 ( ). لمزيد من التفاصيل حول التصور والإحصائيات وإمكانية التكرار، انظر الطرق. لاحظ أن في a-n، تمثل n عينات مستقلة بيولوجيًا و، في و تجارب مستقلة. - مستويات PD-L1 بعد العلاج بـ DES و DMK و DMM و 3-NPA و CPI-613 لمدة 24 ساعة (
). أنا، مستويات mRNA لـ PD-L1 في خلايا A375 بعد المعالجة بـ DES أو DMK ( ). تحليل Western blot لبروتين PD-L1 في خلايا A375 التي تعبر عن PD-L1 بشكل مفرط، المعالجة بـ DES أو DMK ). , مستويات بروتين PD-L1 في خلايا A375 المعالجة بـ DES أو DMK و CHX لمدد زمنية مختلفة (بالساعات) ( )
، خلايا فرط التعبير عن PD-L1 المعالجة بـ DES أو DMK، تليها MG132 أو المعالجة مسبقًا بـ bafilomycin A1 (). , تصوير المناعة الفلورية يظهر التوضع المشترك لـ PD-L1 مع علامة محددة للإنزيمات الراجعة (Rab11)، الإنزيمات المتأخرة (Rab7) والليزوزومات (Lamp1) ( ). شريط القياس، 10 أو . , تحليل Western blot لـ PD-L1 في الفصائل الحويصلية بعد المعالجة بـ DES أو DMK ( ). لمزيد من التفاصيل حول التصوير، الإحصائيات وإمكانية التكرار، انظر الطرق. لاحظ، في d-g، تمثل عينات مستقلة بيولوجيًا و، في و ، تجارب مستقلة.
DOI: https://doi.org/10.1038/s41588-025-02077-6
PMID: https://pubmed.ncbi.nlm.nih.gov/40069506
Publication Date: 2025-03-01
Alterations in PD-L1 succinylation shape anti-tumor immune responses in melanoma
Accepted: 6 January 2025
Published online: 11 March 2025
Check for updates
Long Liang
Abstract
Tumors undergo metabolic reprogramming to meet the energetic, synthetic and redox demands essential for malignancy, often characterized by increased glycolysis and lactate production. However, the role of mitochondrial metabolism in tumor immunity remains unclear. The present study integrates spatial transcriptomics, bulk transcriptomics and proteomics, revealing a strong link between the metabolite succinyl-CoA and tumor immunity as well as the efficacy of anti-programmed cell death protein-1 (PD-1) therapy in patients with melanoma. Elevated succinyl-CoA levels, through
suboptimal, with only
Results
Succinyl-CoA shapes anti-tumor immunity
enzymes bridging the TCA cycle and OXPHOS (OGDH, SCS and SDH; Supplementary Note) were abundant in immunotherapy responders and correlated with better outcomes (Fig.1c). Patients with high expression of all three enzymes (Three_Complex_high) were more likely to respond to immunotherapy and had significantly better prognoses (Fig.1d,e). These observations suggested that high enzyme expression might lead to abnormal metabolite levels, such as AKG or succinate, contributing to tumor immunity. In immunocompetent mice, treated with AKG (dimethyl
|
||||
|
|
|||
|
** | |||
| □ | IFNγ response | |||
| □ | ** | |||
| □ | * | |||
|
** | |||
|
** | |||
| □ | IFNα response | |||
| □ | * | |||
|
Spliceosome | |||
|
DNA replication | |||
|
Cell cycle | |||
|
Basal transcription factors | |||
| † | Myc targets v1 | |||
|
E2F targets | |||
|
mRNA surveillance pathway | |||
|
Nucleotide excision repair | |||
| □ – | Drug metabolism, other enzymes * | |||
|
DNA repair | |||
|
|
□
|
|||
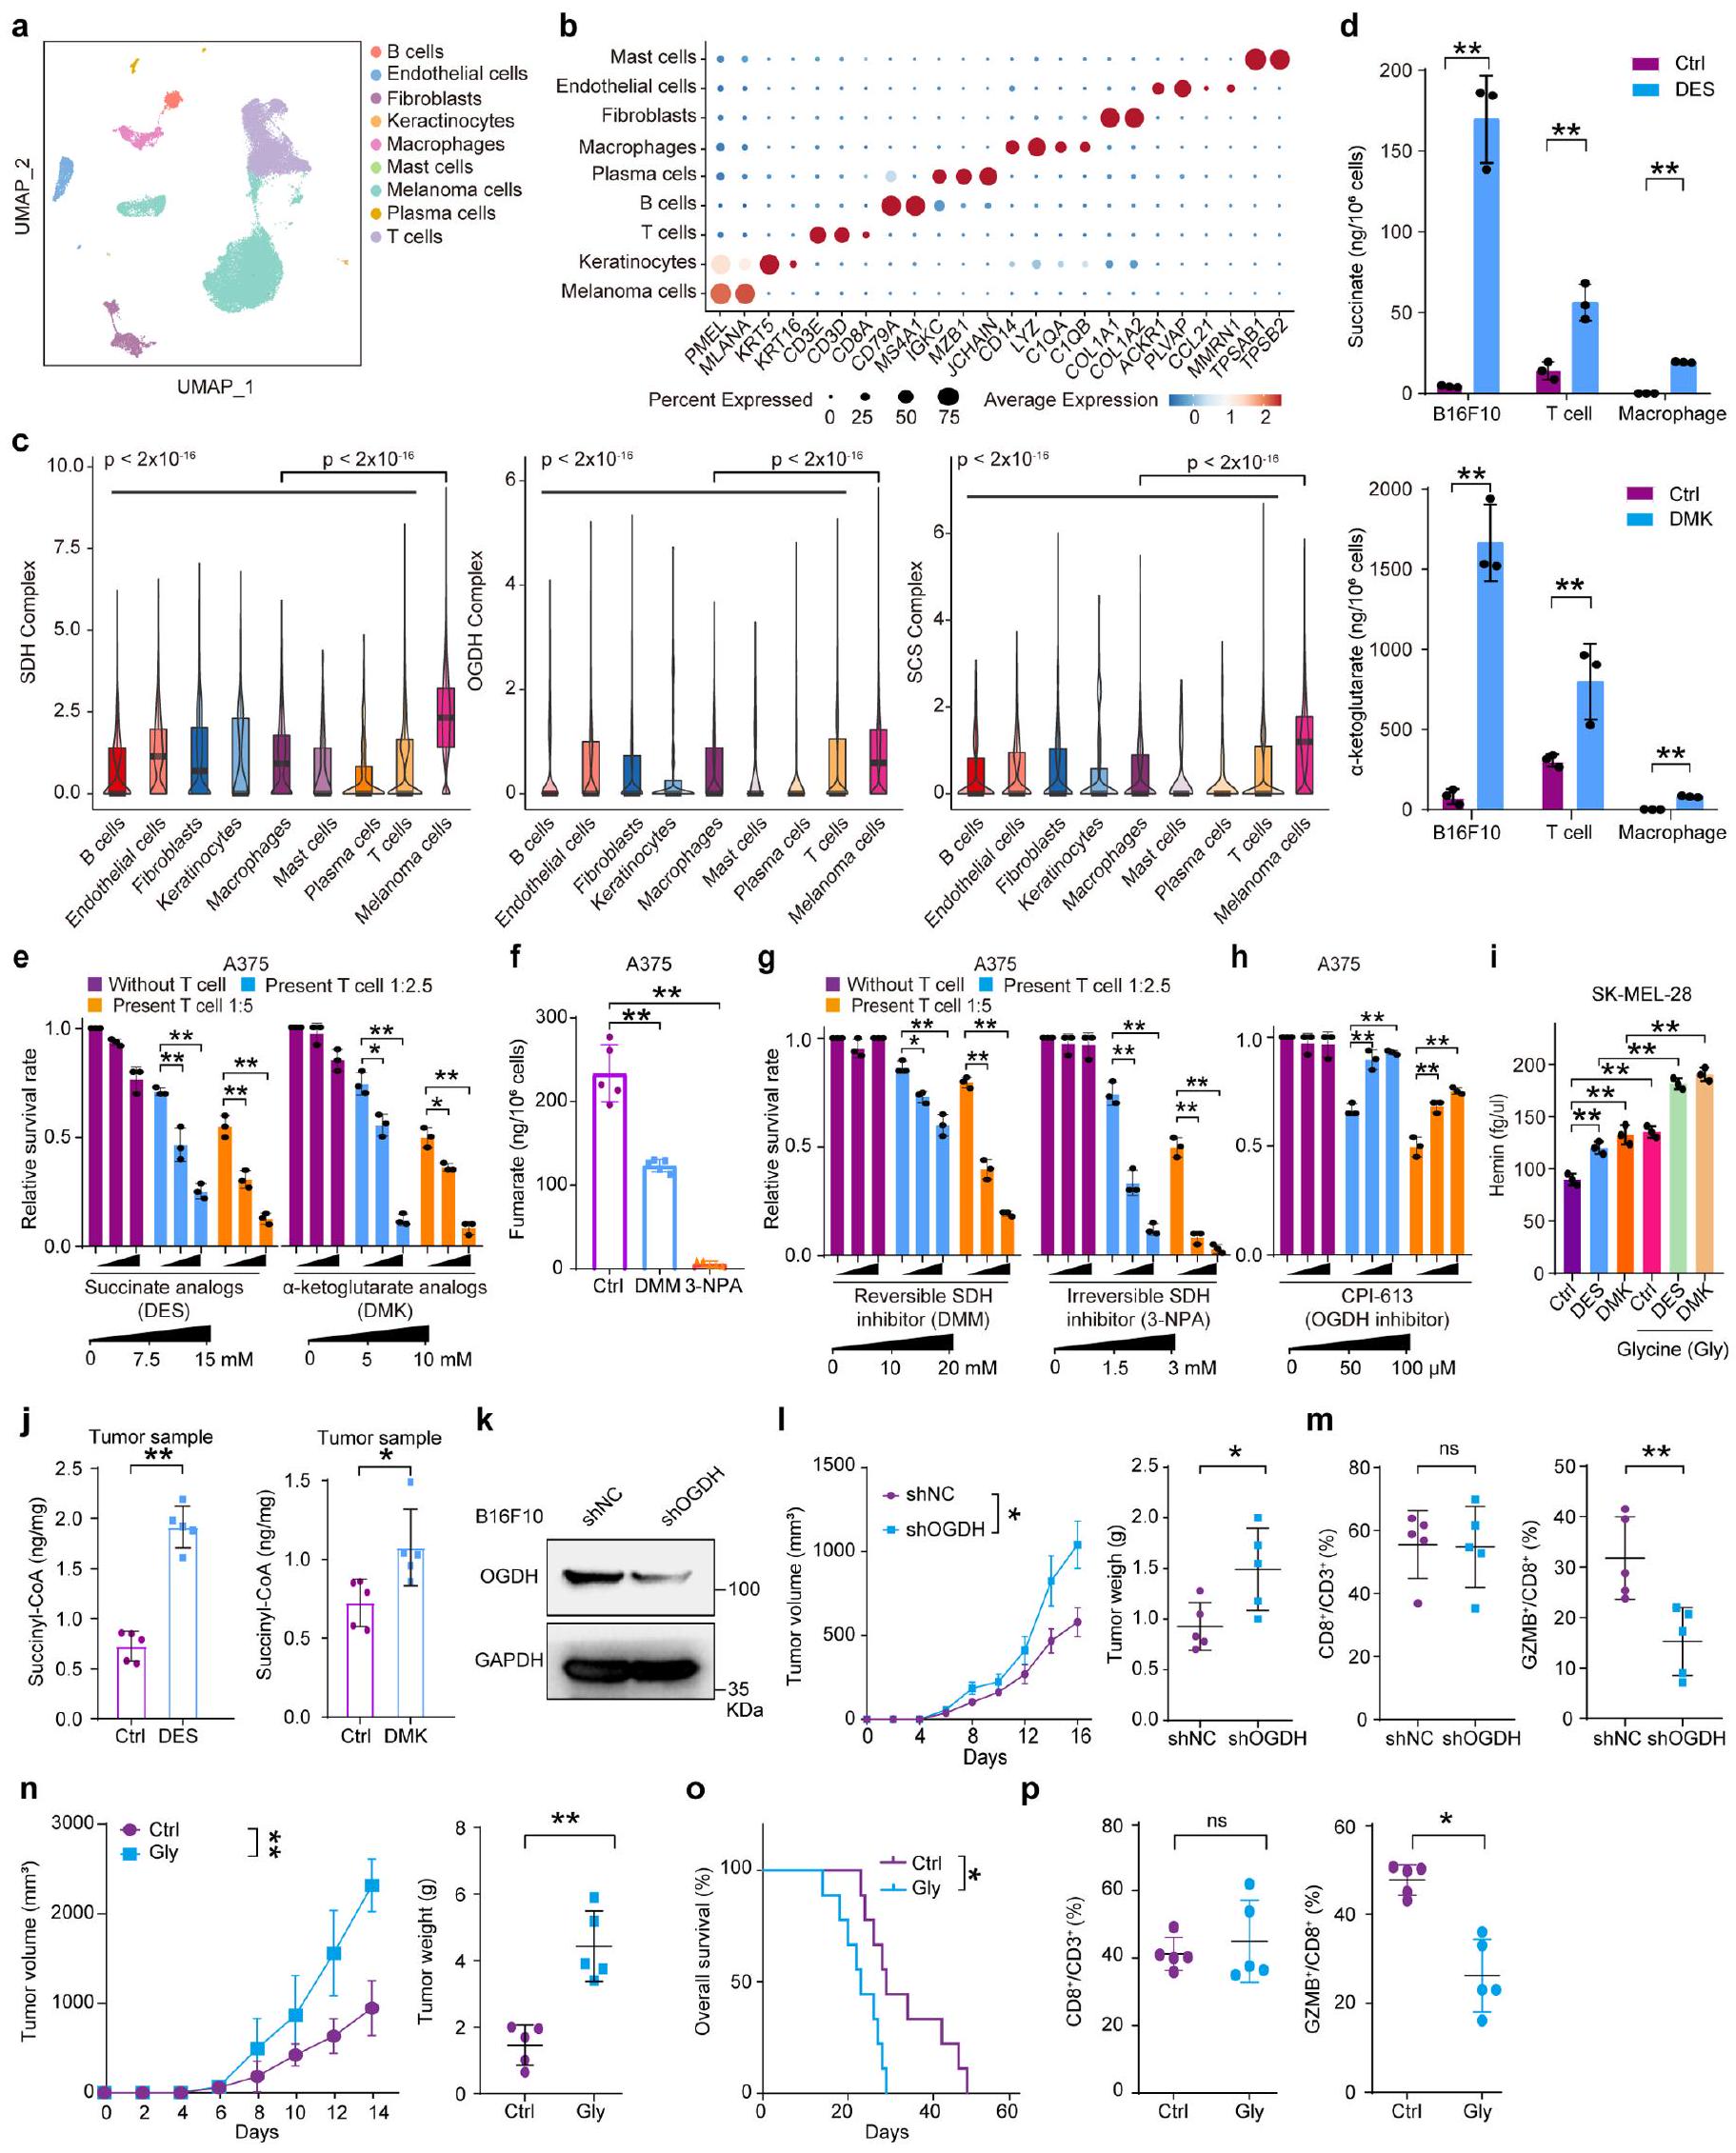
(Fig.1m,n), followed by T cell-killing assays (Supplementary Note). DES or DMK exhibited increased T cell-mediated cytotoxicity, as shown by Crystal Violet staining, whereas tumor proliferation was unaffected in the absence of T cells (Supplementary Note and Extended Data Fig. 3e). Treatment with the reversible SDH inhibitor DMM and the irreversible inhibitor 3-nitropropionic acid (3-NPA), which covalently binds to an arginine residue in the catalytic core of succinate dehydrogenase A (SDHA)
Succinyl-CoA enhanced CTL activity by decreasing cancer cell PD-L1
triethyl citrate, itaconate and malate, were tested and only DES and DMK reduced PD-L1 protein levels (Extended Data Fig. 5a). In addition, treatment with DES, DMK and DMM lowered PD-L1 in mouse tumor tissues, but increased PD-L1 in OGDH knockdown and glycine-treated mice (Fig. 2d and Extended Data Fig. 5b) Similar effects were observed in other cancer types, but no effect was seen in macrophages expressing PD-L1 (Extended Data Fig. 5c,d). To clarify whether DES or DMK modulates PD-L1 via succinyl-CoA, knockdown of ALAS1 (
a,b, Spearman’s rank correlation between the SucciCoA score and immune checkpoints in the cancer cell lines dataset from the CCLE database (
(Fig. 2q). These results suggest that elevated intracellular succinyl-CoA promotes PD-L1 degradation via the endosomal-lysosomal pathway.
Succinylation of PD-L1 Lys129 induces its degradation
k, Membrane PD-L1 levels of mutants measured by flow cytometry (
succinyl-CoA levels, increasing protein succinylation
mutant groups (Fig. 3m). Both the PD-L1 WT and K129R groups inhibited
CPT1A mediates the succinylation of PD-L1
that CPT1A’s regulation of antigen presentation is independent of its succinyltransferase activity.
CPT1A levels correlate with PD-1 mAb efficacy in melanoma
a, Western blot analysis of CPT1A and PD-L1 levels in cells treated with varying doses of BEZ (
and anti-CTLA-4. Tumor weights were summarized post-euthanasia (
based on CPT1A and PD-L1 expression (
Discussion
Online content
References
- Gonzalez, H., Hagerling, C. & Werb, Z. Roles of the immune system in cancer: from tumor initiation to metastatic progression. Genes Dev. 32, 1267-1284 (2018).
- Korman, A. J., Garrett-Thomson, S. C. & Lonberg, N. The foundations of immune checkpoint blockade and the ipilimumab approval decennial. Nat. Rev. Drug Discov. 21, 509-528 (2022).
- Ribas, A. & Wolchok, J. D. Cancer immunotherapy using checkpoint blockade. Science 359, 1350-1355 (2018).
- Morad, G., Helmink, B. A., Sharma, P. & Wargo, J. A. Hallmarks of response, resistance, and toxicity to immune checkpoint blockade. Cell 184, 5309-5337(2021).
- Kumagai, S. et al. Lactic acid promotes PD-1 expression in regulatory T cells in highly glycolytic tumor microenvironments. Cancer Cell 40, 201-218.e9 (2022).
- Pucino, V. et al. Lactate buildup at the site of chronic inflammation promotes disease by inducing
T cell metabolic rewiring. Cell Metab. 30, 1055-1074.e8 (2019). - Wu, X. et al. Targeting protein modifications in metabolic diseases: molecular mechanisms and targeted therapies. Signal Transduct. Target. Ther. 8, 220 (2023).
- Diskin, C., Ryan, T. A. J. & ONeill, L. A. J. Modification of proteins by metabolites in immunity. Immunity 54, 19-31 (2021).
- Zhang, Z. et al. Identification of lysine succinylation as a new post-translational modification. Nat. Chem. Biol. 7, 58-63 (2011).
- Sreedhar, A., Wiese, E. K. & Hitosugi, T. Enzymatic and metabolic regulation of lysine succinylation. Genes Dis. 7, 166-171 (2020).
- Alarcon, C., Wicksteed, B., Prentki, M., Corkey, B. E. & Rhodes, C. J. Succinate is a preferential metabolic stimulus-coupling signal for glucose-induced proinsulin biosynthesis translation. Diabetes 51, 2496-2504 (2002).
- Xu, H. et al. Lysine acetylation and succinylation in HeLa cells and their essential roles in response to UV-induced stress. Sci. Rep. 6, 30212 (2016).
- Wang, F. et al. SIRT5 desuccinylates and activates pyruvate kinase M2 to block macrophage IL-1
production and to prevent DSS-induced colitis in mice. Cell Rep. 19, 2331-2344 (2017). - Du, J. et al. Sirt5 is a NAD-dependent protein lysine demalonylase and desuccinylase. Science 334, 806-809 (2011).
- Wang, Y. et al. KAT2A coupled with the
-KGDH complex acts as a histone H3 succinyltransferase. Nature 552, 273-277 (2017). - Kurmi, K. et al. Carnitine palmitoyltransferase 1 A has a lysine succinyltransferase activity. Cell Rep. 22, 1365-1373 (2018).
- Yuan, H.-F. et al. PRMT5 confers lipid metabolism reprogramming, tumour growth and metastasis depending on the SIRT7-mediated desuccinylation of PRMT5 K387 in tumours. Acta Pharmacol. Sin. 43, 2373-2385 (2022).
- Harel, M. et al. Proteomics of melanoma response to immunotherapy reveals mitochondrial dependence. Cell 179, 236-250.e18 (2019).
- Wu, J.-Y. et al. Cancer-derived succinate promotes macrophage polarization and cancer metastasis via succinate receptor. Mol. Cell 77, 213-227.e5 (2020).
- Liu, P.-S. et al.
-Ketoglutarate orchestrates macrophage activation through metabolic and epigenetic reprogramming. Nat. Immunol. 18, 985-994 (2017). - Yang, Y. et al. Succinate dehydrogenase inhibitor dimethyl malonate alleviates LPS/D-galactosamine-induced acute hepatic damage in mice. Innate Immun. 25, 522-529 (2019).
- Scallet, A. C., Haley, R. L., Scallet, D. M., Duhart, H. M. & Binienda, Z. K. 3-Nitropropionic acid inhibition of succinate dehydrogenase (complex II) activity in cultured Chinese hamster ovary cells: antagonism by L-carnitine. Ann. NY Acad. Sci. 993, 305-309 (2003).
- Dörsam, B. & Fahrer, J. The disulfide compound
-lipoic acid and its derivatives: a novel class of anticancer agents targeting mitochondria. Cancer Lett. 371, 12-19 (2016). - Furuyama, K. & Sassa, S. Interaction between succinyl CoA synthetase and the heme-biosynthetic enzyme ALAS-E is disrupted in sideroblastic anemia. J. Clin. Invest. 105, 757-764 (2000).
- Li, F. et al. NADP
-IDH mutations promote hypersuccinylation that impairs mitochondria respiration and induces apoptosis resistance. Mol. Cell 60, 661-675 (2015). - Nusinow, D. P. et al. Quantitative proteomics of the cancer cell line encyclopedia. Cell 180, 387-402.e16 (2020).
- Chan, L.-C. et al. IL-6/JAK1 pathway drives PD-L1 Y112 phosphorylation to promote cancer immune evasion. J. Clin. Invest. 129, 3324-3338 (2019).
- Burr, M. L. et al. CMTM6 maintains the expression of PD-L1 and regulates anti-tumour immunity. Nature 549, 101-105 (2017).
- Maher, C. M. et al. Small-molecule sigma1 modulator induces autophagic degradation of PD-L1. Mol. Cancer Res. 16, 243-255 (2018).
- Eletto, D., Dersh, D. & Argon, Y. GRP94 in ER quality control and stress responses. Semin. Cell Dev. Biol. 21, 479-485 (2010).
- Pfeffer, S. R. Entry at the trans-face of the Golgi. Cold Spring Harb. Perspect. Biol. 3, a005272 (2011).
- Ferro, E., Bosia, C. & Campa, C. C. RAB11-mediated trafficking and human cancers: an updated review. Biology (Basel) 10, 26 (2021).
- Bucci, C., Bakke, O. & Progida, C. Rab7b and receptors trafficking. Commun. Integr. Biol. 3, 401-404 (2010).
- Cheng, X.-T. et al. Revisiting LAMP1 as a marker for degradative autophagy-lysosomal organelles in the nervous system. Autophagy 14, 1472-1474 (2018).
- Smestad, J., Erber, L., Chen, Y. & Maher, L. J. 3rd Chromatin succinylation correlates with active gene expression and is perturbed by defective TCA cycle metabolism. iScience 2, 63-75 (2018).
- Wang, H. et al. HIP1R targets PD-L1 to lysosomal degradation to alter T cell-mediated cytotoxicity. Nat. Chem. Biol. 15, 42-50 (2019).
- Yao, H. et al. Inhibiting PD-L1 palmitoylation enhances T-cell immune responses against tumours. Nat. Biomed. Eng. 3, 306-317 (2019).
- Xie, X.-Q. et al. Targeting ATAD3A-PINK1-mitophagy axis overcomes chemoimmunotherapy resistance by redirecting PD-L1 to mitochondria. Cell Res. 33, 215-228 (2023).
- Song, S. et al. Peroxisome proliferator activated receptor
(PPARα) and PPAR gamma coactivator (PGC-1α) induce carnitine palmitoyltransferase IA (CPT-1A) via independent gene elements. Mol. Cell. Endocrinol. 325, 54-63 (2010). - Viscomi, C. et al. In vivo correction of COX deficiency by activation of the AMPK/PGC-1
axis. Cell Metab. 14, 80-90 (2011). - Brand, A. et al. LDHA-associated lactic acid production blunts tumor immunosurveillance by T and NK cells. Cell Metab. 24, 657-671 (2016).
- Elia, I. et al. Tumor cells dictate anti-tumor immune responses by altering pyruvate utilization and succinate signaling in CD8
T cells. Cell Metab. 34, 1137-1150.e6 (2022). - Fischer, G. M. et al. Metabolic strategies of melanoma cells: mechanisms, interactions with the tumor microenvironment, and therapeutic implications. Pigment Cell Melanoma Res. 31, 11-30 (2018).
- Altman, B. J., Stine, Z. E. & Dang, C. V. From Krebs to clinic: glutamine metabolism to cancer therapy. Nat. Rev. Cancer 16, 619-634 (2016).
- Chang, L.-C., Chiang, S.-K., Chen, S.-E. & Hung, M.-C. Targeting 2-oxoglutarate dehydrogenase for cancer treatment. Am. J. Cancer Res. 12, 1436-1455 (2022).
- Byun, J.-K. et al. Inhibition of glutamine utilization synergizes with immune checkpoint inhibitor to promote antitumor immunity. Mol. Cell 80, 592-606.e8 (2020).
- Ishak Gabra, M. B. et al. Dietary glutamine supplementation suppresses epigenetically-activated oncogenic pathways to inhibit melanoma tumour growth. Nat. Commun. 11, 3326 (2020).
- Leone, R. D. et al. Glutamine blockade induces divergent metabolic programs to overcome tumor immune evasion. Science 366, 1013-1021 (2019).
- Martínez-Reyes, I. & Chandel, N. S. Mitochondrial TCA cycle metabolites control physiology and disease. Nat. Commun. 11, 102 (2020).
- Cheng, J. et al. Cancer-cell-derived fumarate suppresses the anti-tumor capacity of CD8
cells in the tumor microenvironment. Cell Metab. 35, 961-978.e10 (2023). - Li, J. et al. HDAC1/2/3 are major histone desuccinylases critical for promoter desuccinylation. Cell Discov. 9, 85 (2023).
- Su, Z. et al. TNF-
-induced KAT2A Impedes BMMSC quiescence by mediating succinylation of the mitophagy-related protein VCP. Adv. Sci. 11, e2303388 (2024). - Gut, P. et al. SUCLA2 mutations cause global protein succinylation contributing to the pathomechanism of a hereditary mitochondrial disease. Nat. Commun. 11, 5927 (2020).
- Cha, J.-H. et al. Metformin promotes antitumor immunity via endoplasmic-reticulum-associated degradation of PD-L1. Mol. Cell 71, 606-620.e7 (2018).
- Gao, Y. et al. Acetylation-dependent regulation of PD-L1 nuclear translocation dictates the efficacy of anti-PD-1 immunotherapy. Nat. Cell Biol. 22, 1064-1075 (2020).
- McGarry, J. D., Mannaerts, G. P. & Foster, D. W. A possible role for malonyl-CoA in the regulation of hepatic fatty acid oxidation and ketogenesis. J. Clin. Invest. 60, 265-270 (1977).
- Mills, S. E., Foster, D. W. & McGarry, J. D. Interaction of malonyl-CoA and related compounds with mitochondria from different rat tissues. Relationship between ligand binding and inhibition of carnitine palmitoyltransferase I. Biochem. J 214, 83-91 (1983).
- Ma, Y. et al. Functional analysis of molecular and pharmacological modulators of mitochondrial fatty acid oxidation. Sci. Rep. 10, 1450 (2020).
- Lu, X. et al. Effective combinatorial immunotherapy for castration-resistant prostate cancer. Nature 543, 728-732 (2017).
- Vazquez, F. et al. PGC1α expression defines a subset of human melanoma tumors withincreased mitochondrial capacity and resistance to oxidative stress. Cancer Cell 23, 287-301 (2013).
- Luo, C. et al. A PGC1α-mediated transcriptional axis suppresses melanoma metastasis. Nature 537, 422-426 (2016).
© The Author(s) 2025, corrected publication 2025
Methods
Ethical statement
Cell culture and treatment
Antibodies and chemicals
(Baf-A1, cat. no. S1413) were from Selleck. BEZ (cat. no. HY-B0637), etomoxir (cat. no. HY-50202), C75 (cat. no. HY-12364), PEM (cat. no. HY-B1334A), bitopertin (cat. no. HY-10809), tunicamycin (cat. no. HY-A0098), hygromycin B (cat. no. HY-K1051) and CPI-613 (cat. no. HY-15453) were from MedChemExpress. In vivo anti-mouse CTLA-4 mAb (cat. no. BE0164) and anti-mouse CD8α mAb (cat. no. BE0061) were purchased from Bio X Cell. For a list of flow cytometry antibodies used in the present study, please see Supplementary Note.
RNA isolation, RT-qPCR
Western blotting
Immunofluorescence
(Jackson ImmunoResearch, cat. no. 115-165-003) was added to the blocking solution and incubated for 2 h . DAPI was incubated for 10 min at RT in the dark. Images were detected and captured by fluorescent microscopy (Nikon, ECLIPSE Ts2R). Tumor expression of CPT1A, PD-L1 and succinylation was estimated using the tumor proportion score, representing the percentage of tumor cells with membrane staining
Plasmids and vectors
Mouse model and in vivo experimental therapy
Clinical data and sample collection
Pathway enrichment analysis and GSVA
Spatial transcriptome analysis of melanoma datasets
Visualization, statistics and reproducibility
and 6 e and Extended Data Figs. 3c, 4b, 8j,l and 9b,d,e; two-sided Spearman’s correlation analysis was used in Figs. 2a,b and 6d and Extended Data Fig. 1b with false discovery rate (FDR) correction for multiple comparisons; a log-rank test was used in Figs. 1e,g, 5c and 6g,h and Extended Data Figs. 2f, 3o, 4c,d and 8d,i; the two-sided
Reporting summary
Data availability
anti-PD-1mAb or anti-CTLA-4 mAb combined therapy) was downloaded from the Sequence Read Archive database (https://www.ncbi.nlm.nih. gov/bioproject). The Liu/VanAllen cohort
Code availability
References
- Liu, H. et al. ADORA1 inhibition promotes tumor immune evasion by regulating the ATF3-PD-L1 axis. Cancer Cell 37, 324-339.e8 (2020).
-
. et al. The beneficial role of sunitinib in tumor immune surveillance by regulating tumor PD-L1. Adv. Sci. 8, 2001596 (2021). - Du, K. et al. Pathway signatures derived from on-treatment tumor specimens predict response to anti-PD1 blockade in metastatic melanoma. Nat. Commun. 12, 6023 (2021).
- Yoshihara, K. et al. Inferring tumour purity and stromal and immune cell admixture from expression data. Nat. Commun. 4, 2612 (2013).
- Hänzelmann, S., Castelo, R. & Guinney, J. GSVA: gene set variation analysis for microarray and RNA-Seq data. BMC Bioinf. 14, 7 (2013).
- Charoentong, P. et al. Pan-cancer immunogenomic analyses reveal genotype-immunophenotype relationships and predictors of response to checkpoint blockade. Cell Rep. 18, 248-262 (2017).
- Liberzon, A. et al. Molecular signatures database (MSigDB) 3.0. Bioinformatics 27, 1739-1740 (2011).
- Sergushichev, A. A. An algorithm for fast preranked gene set enrichment analysis using cumulative statistic calculation. Preprint at bioRxiv https://doi.org/10.1101/060012 (2016).
- Yu, G., Wang, L.-G., Han, Y. & He, Q.-Y. clusterProfiler: an R package for comparing biological themes among gene clusters. OMICS 16, 284-287 (2012).
- Stuart, T. et al. Comprehensive integration of single-cell data. Cell 177, 1888-1902.e21 (2019).
- Li, J. et al. Single-cell characterization of the cellular landscape of acral melanoma identifies novel targets for immunotherapy. Clin. Cancer Res. 28, 2131-2146 (2022).
- Xun, Z. et al. Reconstruction of the tumor spatial microenvironment along the malignant-boundary-nonmalignant axis. Nat. Commun. 14, 933 (2023).
- Beck, L. et al. Clinical proteomics of metastatic melanoma reveals profiles of organ specificity and treatment resistance. Clin. Cancer Res. 27, 2074-2086 (2021).
- Xue, G. et al. Clinical drug screening reveals clofazimine potentiates the efficacy while reducing the toxicity of anti-PD-1 and CTLA-4 immunotherapy. Cancer Cell 42, 780-796.e6 (2024).
- Gide, T. N. et al. Distinct immune cell populations define response to anti-PD-1 monotherapy and anti-PD-1/anti-CTLA-4 combined therapy. Cancer Cell 35, 238-255.e6 (2019).
- Liu, D. et al. Integrative molecular and clinical modeling of clinical outcomes to PD1 blockade in patients with metastatic melanoma. Nat. Med. 25, 1916-1927 (2019).
- Ulloa-Montoya, F. et al. Predictive gene signature in MAGE-A3 antigen-specific cancer immunotherapy. J. Clin. Oncol. 31, 2388-2395 (2013).
- Jung, H. et al. DNA methylation loss promotes immune evasion of tumours with high mutation and copy number load. Nat. Commun. 10, 4278 (2019).
- Chang, K. et al. The cancer genome atlas pan-cancer analysis project. Nat. Genet. 45, 1113-1120 (2013).
- Edwards, N. J. et al. The CPTAC data portal: a resource for cancer proteomics research. J. Proteome Res. 14, 2707-2713 (2015).
Acknowledgements
Author contributions
Competing interests
Additional information
weights in B16F10-OVA (d, e), LLC (f, g), or MC38 (h, i) tumor-bearing mice treated with Ctrl, DES, or DMK (
(
with glycine transporter 1 inhibitor (Bitopertin) and IFN
membrane, endosomal) were analyzed for PD-L1 and CPT1A expression. IP analysis assessed PD-L1 interaction with CPT1A, with controls for RCC1 (nuclear), GAPDH (cytoplasmic), TOMM20 (mitochondrial), Rab7 (endosomal) (
treatment. Specifically, increased OGDH expression promoted the conversion of
natureportfolio
Last updated by author(s): 2025.2.5
Reporting Summary
Statistics
n/a
Confirmed
□ X
The exact sample size
□
□ X
The statistical test(s) used AND whether they are one- or two-sided
Only common tests should be described solely by name; describe more complex techniques in the Methods section.
□ A description of all covariates tested
□ X
A description of any assumptions or corrections, such as tests of normality and adjustment for multiple comparisons
□
□ X
For null hypothesis testing, the test statistic (e.g.
□ For Bayesian analysis, information on the choice of priors and Markov chain Monte Carlo settings
□ ⟶
Estimates of effect sizes (e.g. Cohen’s
Software and code
Data collection
Biorender(https://www.biorender.com/); For further details, please see the Methods and Data availability section.
The following publicly available tools were used for analyses: Estimate (v1.0.13), GSVA (v1.40.1), fgsea (v1.18.0), clusterProfiler (4.0.5), Seurat (v4.4.0), Cottrazm (v0.1.1), survival (v.3.5.7). R statistical packages (v4.1.0) and Graphpad Prism (v8.0.1). Details and references can be found within text in the relevant Methods section and Supplementary Note.
Data
All manuscripts must include a data availability statement. This statement should provide the following information, where applicable:
- Accession codes, unique identifiers, or web links for publicly available datasets
- A description of any restrictions on data availability
- For clinical datasets or third party data, please ensure that the statement adheres to our policy
Research involving human participants, their data, or biological material
Field-specific reporting
Life sciences □ Behavioural & social sciences □ Ecological, evolutionary & environmental sciences
For a reference copy of the document with all sections, see nature.com/documents/nr-reporting-summary-flat.pdf
Life sciences study design
Sample size
Sample size: Sample size details are fully documented in the Methods section and corresponding figure legends. No a priori power calculations were performed to predetermine sample sizes. Sample sizes were chosen based on both established conventions in the field (typically
Reporting for specific materials, systems and methods
nature portfolio | reporting summary
April 2023
| n/a | Involved in the study | n/a |
| □ | X Antibodies | |
| □ | – Eukaryotic cell lines | □ |
| V | □ Palaeontology and archaeology | X |
| □ | 【 Animals and other organisms | |
| X | □ | |
| X | □ |
Antibodies
| Antibodies used |
|
April 2023
CD40 [Polyclonal]
https://abclonal.com.cn/catalog/A0218
VISTA [D1L2G] (1:2000)
https://www.cellsignal.cn/products/primary-antibodies/vista-d1|2g-xp-rabbit-mab/64953
PD-L2 [D7U8C] (1:2000)
https://www.cellsignal.cn/products/primary-antibodies/pd-l2-d7u8c-xp-rabbit-mab/82723
PVR [D8A5G] (1:2000)
https://www.cellsignal.cn/products/primary-antibodies/pvr-cd155-d8a5g-rabbit-mab/81254
CD70 [Polyclonal]
https://abclonal.com.cn/catalog/A2032
CD80 [E3Q9V] (1:2000)
https://www.cellsignal.cn/products/primary-antibodies/cd80-e3q9v-rabbit-mab/15416
CD86 [Polyclonal]
https://abclonal.com.cn/catalog/A19026
CD112 [D8D3F] (1:2000)
https://www.cellsignal.cn/products/primary-antibodies/nectin-2-cd112-d8d3f-xp-rabbit-mab/95333 CD276 [Polyclonal] (1:2000)
https://abclonal.com.cn/catalog/A21663
OX40L [Polyclonal] (1:2000)
https://abclonal.com.cn/catalog/A18389
TNFSF14 [Polyclonal] (1:2000)
https://abclonal.com.cn/catalog/A2002
GITRL [Polyclonal] (1:2000)
https://abclonal.com.cn/catalog/A7028
PD-L1 [E1L3N] (1:2000)
https://www.cellsignal.cn/products/primary-antibodies/pd-I1-e1I3n-xp-rabbit-mab/13684
SQSTM1/p62 [D6M5X] (1:2000)
https://www.cellsignal.cn/products/primary-antibodies/sqstm1-p62-d6m5x-rabbit-mab/23214 LC3A/B [D3U4C] (1:2000)
https://www.cellsignal.cn/products/primary-antibodies/lc3a-b-d3u4c-xp-rabbit-mab/12741 PD-L1 [EPR19759] (1:2000)
https://www.abcam.cn/products/primary-antibodies/pd-l1-antibody-epr19759-ab213524.html PD-L1 [EPR20529] (1:2000)
https://www.abcam.cn/products/primary-antibodies/pd-l1-antibody-epr20529-ab213480.html Beclin1 [EPR19662] (1:2000)
https://www.abcam.cn/products/primary-antibodies/beclin-1-antibody-epr19662-ab207612.html CPT1A [Polyclonal] (1:2000)
https://www.ptgcn.com/products/CPT1A-Antibody-15184-1-AP.htm
HIP1R [Polyclonal]
https://www.ptgcn.com/products/HIP1R-Antibody-16814-1-AP.htm
GAPDH [1E6D9] (1:5000)
https://www.ptgcn.com/products/GAPDH-Antibody-60004-1-lg.htm
ALAS1 [A4817] (1:2000)
https://www.abclonal.com/catalog-antibodies/ALAS1RabbitmAb/A4817
TOM20 [A19403] (1:2000)
https://www.abclonal.com/catalog-antibodies/TOM20RabbitmAb/A19403
Anti-CPT1A [8F6AE9] (1:2000)
https://www.abcam.com/en-us/products/primary-antibodies/cpt1a-antibody-8f6ae9-ab128568
For treatment
anti-CTLA-4 [9D9]
https://bioxcell.com/invivoplus-anti-mouse-ctla-4-cd152-bp0164
anti-CD8
https://bioxcell.com/invivomab-anti-mouse-cd8-alpha-be0061
For IHC or IF
Granzyme B [Polyclonal] (1:200)
https://www.abcam.cn/products/primary-antibodies/granzyme-b-antibody-ab4059.html Rab7B [EPR15727]
https://www.abcam.cn/products/primary-antibodies/rab7b-antibody-epr15727-ab193360.html CD3 [SP7] (1:200)
https://www.abcam.cn/products/primary-antibodies/cd3-epsilon-antibody-sp7-ab16669.html PD-L1 [66248-1-Ig] (1:200)
https://www.ptgcn.com/products/PD-L1-CD274-Antibody-66248-1-Ig.htm
TGN46 [Polyclonal] (1:200)
https://www.ptgcn.com/products/TGOLN2,TGN46-Antibody-13573-1-AP.htm
CD8
https://www.abcam.cn/products/primary-antibodies/cd8-alpha-antibody-epr21769-ab217344.html
Rab11B [Polyclonal]
https://www.ptgcn.com/products/RAB11A-Antibody-15903-1-AP.htm
GRP94 [Polyclonal] (1:200)
https://www.ptgcn.com/products/HSP90B1-Antibody-14700-1-AP.htm
For flow cyometry:
APC/Cyanine7-CD45 [30-F11] (1:200)
https://www.biolegend.com/en-gb/products/apc-cyanine7-anti-mouse-cd45-antibody-2530
APC-CD3 [17A2] (1:200)
https://www.biolegend.com/en-gb/products/apc-anti-mouse-cd3-antibody-8055
PECY5.5-CD4 [GK1.5] (1:200)
https://www.biolegend.com/en-gb/products/percp-cyanine5-5-anti-mouse-cd4-antibody-4220
BB700-CD4 [GK1.5]
https://www.bdbiosciences.com/zh-cn/products/reagents/flow-cytometry-reagents/research-reagents/single-color-antibodies-ruo/ bb700-mouse-anti-human-cd4.745998
PECY7-CD8 [53-6.7] (1:200)
https://www.biolegend.com/en-gb/products/pe-cyanine7-anti-mouse-cd8a-antibody-1906
APC-PD-L1 [10F.9G2] (1:200)
https://www.biolegend.com/en-gb/products/apc-anti-mouse-cd274-b7-h1-pd-l1-antibody-6655
APC-F4/80 [BM8] (1:200)
https://www.biolegend.com/en-gb/products/apc-cyanine7-anti-mouse-f4-80-recombinant-antibody-21272
APC-CD25 [PC61] (1:200)
https://www.biolegend.com/en-gb/lyophilized-control-cells/apc-anti-mouse-cd25-antibody-420
BV421-Gr-1 [RB6-8C5] (1:200)
https://www.biolegend.com/ja-jp/products/brilliant-violet-421-anti-mouse-ly-6g-ly-6c-gr-1-antibody-7201?GroupID=BLG4876
PE-Cy7-CD11b [M1/70] (1:200)
https://www.biolegend.com/en-gb/products/pe-cyanine7-anti-mouse-human-cd11b-antibody-1921?GroupID=BLG10427
PerCP-Cy5.5-MHCII [M5/114.15.2] (1:200)
https://www.biolegend.com/en-gb/products/percp-cyanine5-5-anti-mouse-i-a-i-e-antibody-4282?GroupID=BLG4736
PE-FOXP3 [FJK-16s] (1:200)
https://www.thermofisher.cn/cn/zh/antibody/product/FOXP3-Antibody-clone-FJK-16s-Monoclonal/12-5773-82
FITC-GZMB [QA16A02] (1:200)
https://www.biolegend.com/en-gb/products/fitc-anti-human-mouse-granzyme-b-recombinant-antibody-14430
PECY594-GZMB [QA16A02] (1:200)
https://www.biolegend.com/en-gb/products/pedazzle-594-anti-humanmouse-granzyme-b-recombinant-antibody-15598
PE-CD206 [C068C2] (1:200)
https://www.biolegend.com/en-gb/products/pe-anti-mouse-cd206-mmr-antibody-7424?GroupID=BLG9506
PE-PD-L1 [29E.2A3] (1:200)
https://www.biolegend.com/en-gb/products/pe-anti-human-cd274-b7-h1-pd-l1-antibody-4375
Secondary antibodies and DAPI:
CY3 goat anti-rabbit IgG (GB21303)
https://www.service-bio.com/goodsdetail?id=253
FITC goat anti-rabbit IgG (GB22303)
https://www.service-bio.com/goodsdetail?id=259
DAPI (G1012)
https://www.servicebio.cn/goodsdetail?id=1762
CY5 goat anti-rabbit IgG(GB27303)
https://www.servicebio.cn/goodsdetail?id=4191
Eukaryotic cell lines
Mycoplasma contamination
Commonly misidentified lines (See ICLAC register)
All cell lines were tested negative for mycoplasma comtamination.
Animals and other research organisms
Field-collected samples
Studies utilized female mice.
The study did not involve samples collected from the field.
Ethics oversight
Plants
| Seed stocks | N/A |
| Novel plant genotypes | N/A |
| Authentication | N/A |
Flow Cytometry
Plots
Confirm that:
The axis scales are clearly visible. Include numbers along axes only for bottom left plot of group (a ‘group’ is an analysis of identical markers).
All plots are contour plots with outliers or pseudocolor plots.
A numerical value for number of cells or percentage (with statistics) is provided.
Methodology
| Sample preparation | For mouse samples, single-cell suspensions from C57BL/6-derived xenograft tumors (including B16F10, LLC, and MC38) were prepared by rapid and gentle stripping, followed by mechanical dissociation and filtration. |
| Instrument | BD LSRFortessa
|
| Software | Data were further analyzed by FlowJo (version 10.0) software. |
| Cell population abundance | No cell sorting was used in any of the experiments. |
| Gating strategy | The lymphocytes were gated based on FSC-A and SSC-A. Singlets were gated according to FSC-H vs FSC-W. Dead cells were excluded using a viability dye (Zombie Aqua™). Live CD45+ immune cells were gated, followed by the identification of specific cell populations based on the expression of surface markers. For the gating strategy, see Supplementary Figure 1. |
Department of Dermatology, Xiangya Hospital & School of Life Sciences & Furong Laboratory, Central South University, Changsha, China.
Medical Genetics & School of Life Sciences, Central South University, Changsha, China. Hunan Key Laboratory of Skin Cancer and Psoriasis, Hunan Engineering Research Center of Skin Health and Disease, Xiangya Clinical Research Center for Cancer Immunotherapy, National Clinical Research Center for Geriatric Disorders, Central South University, Changsha, China. Department of Statistical Science, University College London, London, UK. Graduate Institute of Biomedical Sciences, Institute of Biochemistry and Molecular Biology, Research Center for Cancer Biology, Cancer Biology and Precision Therapeutics Center, and Center for Molecular Medicine, China Medical University, Taichung, Taiwan. These authors contributed equally: Long Liang, Xinwei Kuang, Yi He. These authors jointly supervised this work: Jing Liu, Hong Liu, Xiang Chen. e-mail: liujing2@sklmg.edu.cn; hongliu1014@csu.edu.cn; chenxiangck@126.com - (
per group).g, Survival analysis of mice after treatment with DMK or DES , Succinate and AKG levels in tumor cells from DMK- or DES-treated mice ( per group). i, Quantification of and CTL percentages in tumor masses ( per group). , Immunostaining of CD3, CD8, and GZMB in B16F10 tumors ( per group). Scale bar, . k, Tumor volume measurements after CD8 T cell depletion and treatments ( per group). I, Spatial transcriptomic heatmap of OGDH, SCS and SDH expression in tumor regions. Scale bar, , Schematic of succinyl-CoA production pathways. n, Succinate and AKG levels in A375 cells treated with metabolite analogs ., O, A375 cells treated with glycine and metabolite analogs, cocultured with T cells, followed by Crystal Violet staining ( ). , Succinyl-CoA levels measured by LC-MS in A375 cells ( ). For details on visualization, statistics and reproducibility, see Methods. Note, in a-n, n represents biologically independent samples and, in and , independent experiments. - PD-L1 levels after treatment with DES, DMK, DMM, 3-NPA and CPI-613 for 24 h (
). I, The mRNA levels of PD-L1 in A375 cells after treatment with DES or DMK ( ). , Western blot analysis of PD-L1 in A375 cells overexpressing PD-L1, treated with DES or DMK ( ). , PD-L1 protein levels in A375 cells treated with DES or DMK and CHX for various times (in hours) ( )
o, PD-L1 overexpression cells treated with DES or DMK, followed by MG132 or pretreated with bafilomycin A1 (). , Immunofluorescence showing PD-L1 co-localization with specific marker for recycling endosomes (Rab11), late endosomes (Rab7) and lysosomes (Lamp1) ( ). Scale bar, 10 or . , Western blot analysis of PD-L1 in endosomal fractions after treatment with DES or DMK ( ). For details on visualization, statistics and reproducibility, see Methods. Note, in d-g, represents biologically independent samples and, in and , independent experiments.