تقدير الوفيات المستقبلية المرتبطة بالحرارة والبرودة تحت تأثير تغير المناخ، والسيناريوهات السكانية وسيناريوهات التكيف في 854 مدينة أوروبية Estimating future heat-related and cold-related mortality under climate change, demographic and adaptation scenarios in 854 European cities
تقدير الوفيات المستقبلية المرتبطة بالحرارة والبرودة تحت تأثير تغير المناخ، والسيناريوهات السكانية وسيناريوهات التكيف في 854 مدينة أوروبية
تاريخ الاستلام: 11 مارس 2024
تم القبول: 9 ديسمبر 2024
نُشر على الإنترنت: 27 يناير 2025
تظهر قائمة بالمؤلفين وانتماءاتهم في نهاية الورقة.
أشارت التقييمات السابقة لتأثيرات الصحة المتعلقة بالحرارة على الوفيات في أوروبا إلى أن عبء الوفيات الناتج عن البرد أكبر بكثير من ذلك الناتج عن الحرارة. لا تزال هناك تساؤلات حول ما إذا كان تغير المناخ يمكن أن يؤدي إلى انخفاض صافي في الوفيات المرتبطة بالحرارة. في هذه الدراسة، قدرنا كيف يمكن أن يؤثر تغير المناخ على الوفيات المستقبلية المرتبطة بالحرارة والبرد في 854 منطقة حضرية أوروبية، تحت عدة سيناريوهات مناخية وديموغرافية وتكيف. أظهرنا أنه، دون أي تكيف مع الحرارة، فإن الزيادة في الوفيات المرتبطة بالحرارة تتجاوز باستمرار أي انخفاض في الوفيات المرتبطة بالبرد عبر جميع السيناريوهات المدروسة في أوروبا. تحت أدنى سيناريو للتخفيف والتكيف (SSP3-7.0)، نقدر أن عبء الوفيات الصافي الناتج عن تغير المناخ سيزداد بـوجمع 2,345,410 (فترة الثقةإلى ) الوفيات المرتبطة بتغير المناخ بين عامي 2015 و2099. سيظل هذا التأثير الصافي إيجابيًا حتى في ظل سيناريوهات التكيف العالية، حيث سيكون هناك تخفيف من المخاطر لـلا يزال غير كافٍ لعكس الاتجاه تحت سيناريو SSP3-7.0. تشير الفروقات الإقليمية إلى انخفاض طفيف في معدلات الوفيات في دول شمال أوروبا، ولكن هناك ضعف كبير في منطقة البحر الأبيض المتوسط وشرق أوروبا. ما لم يتم تنفيذ تدابير قوية للتخفيف والتكيف، يجب أن تشهد معظم المدن الأوروبية زيادة في عبء الوفيات المرتبطة بالحرارة.
تعتبر الحرارة والبرودة عوامل خطر صحية مثبتة لها تأثير ملحوظ على الوفيات في جميع أنحاء أوروبا.تشير التقديرات عمومًا إلى أن هناك حوالي عشرة وفيات مرتبطة بالبرد مقابل كل وفاة مرتبطة بالحرارة.؛ بعض الدراسات اقترحت أن الوفيات المرتبطة بالحرارة في أوروبا قد تنخفض بشكل عام مع تغير المناخ. ومع ذلك، فإن التوازن بين الوفيات المرتبطة بالحرارة والوفيات المرتبطة بالبرد يختلف بشكل كبير عبر المناطق وعلى مر الزمن مع تغير المناخ. وقد ارتبط الأخير بزيادة هامة في الوفيات المرتبطة بالحرارة في القرن الحادي والعشرين.تزداد درجات الحرارة بالتزامن مع نمو المناطق الحضرية والسكان، مما يزيد من التعرض لدرجات الحرارة العالية.. بالنظر إلى التوازن الحالي بين الحرارة المتعلقة ومع أعباء الوفيات المرتبطة بالبرد، يبقى السؤال عما إذا كان انخفاض التعرض للبرد سيعوض الزيادة السلبية في التعرض للحرارة العالية تحت تغير المناخ.
يمكن أن يتأثر التوازن بين زيادة الوفيات المرتبطة بالحرارة وانخفاض الوفيات المرتبطة بالبرد، والذي يُشار إليه هنا بالتأثير الصافي لتغير المناخ، بالعديد من العوامل. قدمت الدراسات السابقة تقديرات غير متسقة للتأثير الصافي، اعتمادًا على الموقع والسيناريوهات المدروسة.في الواقع، يتغير كل من الحرارة الشديدة والبرودة الشديدة بمعدلات مختلفة مع تغير المناخ، مما يؤدي إلى تضييق أو توسيع توزيع درجات الحرارة اعتمادًا على المنطقة.. بالإضافة إلى ذلك، فإن دالة الاستجابة للتعرض (ERF)
العلاقة بين درجة الحرارة والوفيات معقدة، وغالبًا ما تكون على شكل U أو J؛ وغالبًا ما تكون أكثر حدة في جانب الحرارة، على الرغم من أنها تختلف بشكل كبير بين المواقع.كانت الأدلة السابقة إما محدودة النطاق جدًا أو بدقة منخفضة جدًا لتوفير تقدير تمثيلي للأثر على المستوى الأوروبي، مع إغفال أجزاء كبيرة من القارة، مثل الدول الإسكندنافية ودول البلطيق، وبلدان البلقان..
تكمن تعقيد إضافي في تقدير التأثير الصافي لتغير المناخ في القدرة التكيفية للسكان الأوروبيين. قدرت عدة دراسات تراجعًا كبيرًا في خطر الحرارة على الوفيات على مدى العقود الماضية، مرتبطًا عمومًا بزيادة متوسط درجة الحرارة أو انتشار تكييف الهواء.؛ ومع ذلك، فإن الاتجاهات في مخاطر الوفيات المرتبطة بالبرد أقل وضوحًا. على الرغم من بعض المحاولات لدمج التكيف مع الحرارة في توقعات التأثير، من خلال التحولات في درجة حرارة الحد الأدنى للوفيات (MMT) أو تخفيف المخاطرتختلف المنهجيات بشكل كبير مع وجود أدلة تجريبية قليلة لتوجيه نمذجة التكيف. كما أن التكيف مع الحرارة مرتبط ارتباطًا وثيقًا بالاتجاهات الديموغرافية والاجتماعية والاقتصادية الأساسية التي تتطلب التكامل ضمن إطار المسارات الاجتماعية والاقتصادية المشتركة (SSP).يؤدي شيخوخة السكان إلى زيادة القابلية للتأثر بكل من الحرارة والبرودة.بينما يمكن أن يؤدي التحسن العام في الظروف الاجتماعية والاقتصادية وأنظمة الصحة تحت بعض سيناريوهات SSP، من ناحية أخرى، إلى تقليل التأثيرات العامة التي تتركها الحرارة والبرودة على الوفيات.نظرًا للتعقيدات الموضحة أعلاه، فإن توقع الوفيات المرتبطة بالحرارة والبرودة – والأثر الصافي المرتبط بها – في ظل الظروف المستقبلية هو أمر صعب بطبيعته لأنه يعتمد على توقعات درجات الحرارة من نماذج المناخ وERFs المعقدة المستمدة من التحليل الوبائي، بالإضافة إلى المسارات المتنوعة في التغيرات الاجتماعية والاقتصادية والديموغرافية والضعف. يجب أن يعزل التقييم المناسب لوفيات درجات الحرارة المستقبلية الأثر المحدد لتغير المناخ في مجموعة واسعة من السيناريوهات المجتمعية، مع نقل عدم اليقين بدقة من نماذج المناخ والوبائيات.
في هذه الدراسة، هدفنا إلى تقديم تقييم شامل للأثر الصافي لتغير المناخ على الوفيات المرتبطة بدرجات الحرارة عبر 854 مدينة تمتد عبر القارة الأوروبية بأكملها للفترة من 2015 إلى 2099 ولعدة مستويات من الاحترار فوق المستويات ما قبل الصناعية. سعينا لتقديم رؤى حول التطور المتوقع للأثر الصافي في أوروبا، وتحت أي ظروف يمكن تجنب زيادة هذا الأثر الصافي. قمنا بتقييم مجموعة من السيناريوهات المستقبلية الديموغرافية، والتخفيف، والتكيف الممثلة بمصفوفة من ثلاثة سيناريوهات SSP وأربعة سيناريوهات مختلفة للتكيف مع الحرارة.
النتائج
تصميم الدراسة
قمنا بدراسة ثلاثة سيناريوهات SSP استنادًا إلى تقليص النطاق الأوروبي للسيناريوهات العالمية وتأثيرها على التكيف المتعلق بدرجات الحرارة. : (1) أوروبا أكثر عدلاً ملتزمة بالاستدامة وأنماط الحياة ذات الاستهلاك المنخفض مما يؤدي إلى اتخاذ إجراءات كبيرة نحو التخفيف والتكيف (SSP1-2.6)؛ (2) أوروبا تحافظ على الفوارق الحالية مع زيادة الخصخصة وتقدم بطيء نحو التخفيف والتكيف (SSP2-4.5)؛ و(3) أوروبا تعاني من عدم استقرار متزايد، وصراعات إقليمية وفوارق تؤدي إلى جهود قليلة أو معدومة نحو التخفيف والتكيف (SSP3-7.0). في كل سيناريو من سيناريوهات SSP، اعتبرنا في البداية سيناريو أساسي “بدون تكيف” حيث كانت قابلية التأثر بالحرارة تعتمد فقط على توزيع الأعمار المحلي لتوفير صورة عن عبء الوفيات الناتج عن عدم اتخاذ إجراءات تجاه التكيف مع الحرارة. ثم قمنا بتقييم مجموعة من سيناريوهات التكيف مع الحرارة من خلال تقليل مخاطر الوفيات المرتبطة بالحرارة عبر الأعمار بواسطة و تم تقليل المخاطر من خلال تقليص معدل الاستجابة البيئية المحدد حسب العمر المحلي لدرجات الحرارة التي تتجاوز الحد الأقصى المتوسط نحو عدم وجود ارتباط، وفقًا للمستوى المحدد مسبقًا.
هذا العمل يبني على تقييم منشور للوفيات المرتبطة بدرجات الحرارة التاريخية في 854 منطقة حضرية أوروبية يزيد عدد سكانها عن 50,000، ويغطي إجمالي حواليمن 30 أوروبي دوللقد استخدمنا عوامل المخاطر البيئية المحددة للمدينة المنشورة المستمدة لخمس فئات عمريةدمجتها مع سلسلة درجات الحرارة المتوقعة ومعدلات السكان والوفيات حسب الفئات العمرية لكل سيناريو من سيناريوهات SSP، وأجريت توقعات شاملة لتأثيرات الصحة.. في هذا التقييم، عزلنا الجزء المنسوب بشكل خاص إلى تغير المناخ من خلال قياس العبء كفرق في الوفيات المرتبطة بدرجات الحرارة بين سيناريوهين فرعيين: (1) ‘كامل’، حيث يتم أخذ كل من توقعات درجات الحرارة والسكان في الاعتبار؛ و(2) ‘تغير سكاني فقط’، حيث يتغير السكان فقط بينما يتم الحفاظ على توزيع درجات الحرارة من الفترة 2000-2014 ثابتًا عبر القرن. سمح لنا ذلك بالتحكم في شيخوخة السكان والتغيرات في معدلات الوفيات لعزل تأثيرات الحرارة والبرودة وتأثيرات تغير المناخ الصافية المنسوبة مباشرة إلى تطور توزيع درجات الحرارة وتكيف السكان مع الحرارة. لكل سيناريو موصوف أعلاه، أخذنا في الاعتبار عدم اليقين المناخي من خلال النظر في مخرجات درجات الحرارة المعدلة من 19 نموذج دوران عام (GCMs) مستخرجة من قاعدة بيانات NASA Earth Exchange Global Daily Downscaled Projections، بناءً على مخرجات المرحلة 6 من مشروع المقارنة بين النماذج المتصلة (CMIP6) . بالإضافة إلى ذلك، قمنا بنقل عدم اليقين من التحليل الوبائي من خلال إجراء توقعات لـ 500 محاكاة مونت كارلو لـ ERFs . تم تفصيل المنهجية والافتراضات المتعلقة بالسيناريوهات المختلفة بشكل كامل في الطرق عبر الإنترنت ومillustrated في البيانات الموسعة.
نتائج على المستوى الأوروبي
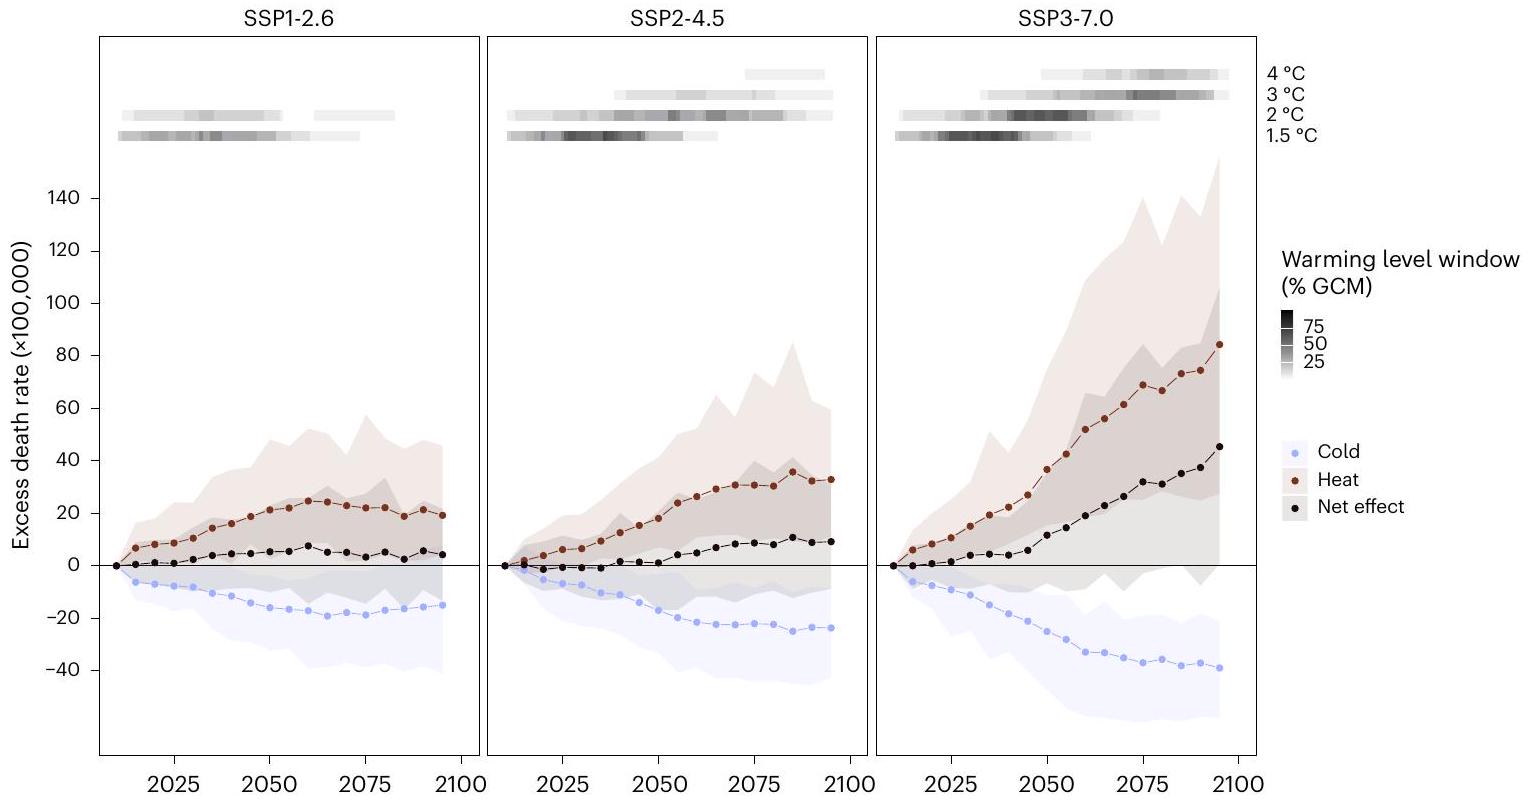
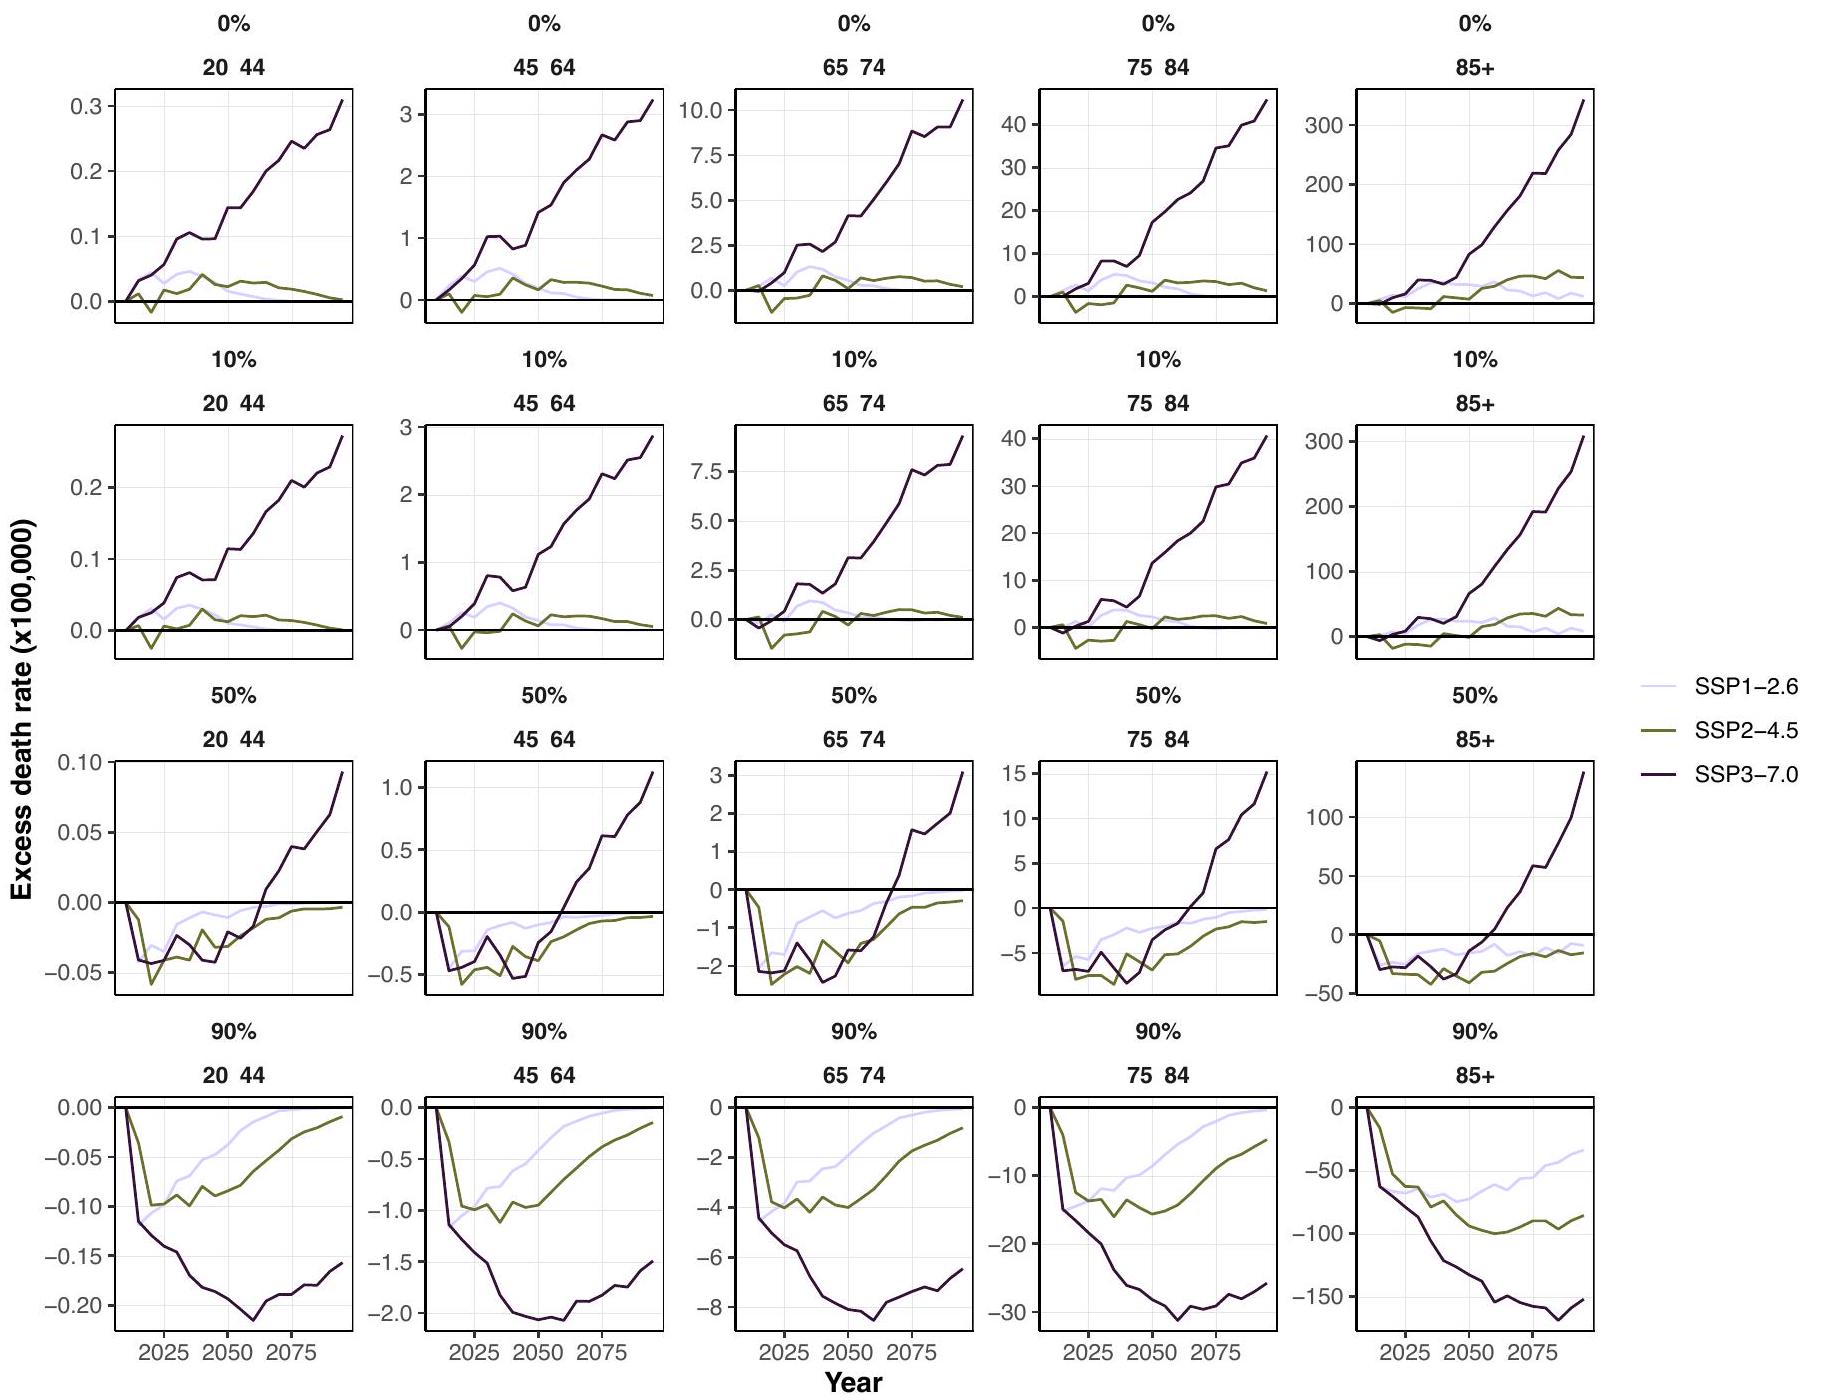
بالنسبة للسيناريوهات الثلاثة SSP المدروسة، أدى سيناريو عدم التكيف إلى زيادة في معدلات الوفيات الزائدة المرتبطة بدرجات الحرارة، المتعلقة بتغير المناخ فقط، عبر الفترة الكاملة من 2015-2099 (الشكل 1). في جميع الحالات، كانت الزيادة في الوفيات المرتبطة بالحرارة تفوق الانخفاض في الوفيات المرتبطة بالبرودة، على الرغم من أن الحجم اختلف عبر سيناريوهات SSP. بالنسبة لسيناريو SSP1-2.6، بلغت الزيادة الصافية في الوفيات المرتبطة بدرجات الحرارة ذروتها عند 7.6 ( الثقة بين – إلى 25.8) وفاة لكل 100,000 سنة شخص في عام 2060، وانخفضت قليلاً بعد ذلك. في سيناريو SSP2-4.5، استقرت معدلات الوفيات المرتبطة بتغير المناخ بين ثمانية وعشرة وفيات لكل 100,000 سنة شخص من 2070 حتى نهاية القرن. في المقابل، تحت سيناريو SSP3-7.0، زاد التأثير الصافي بشكل كبير على مدار القرن ليصل إلى إلى 106.0) وفاة لكل 100,000 سنة شخص (الجدول 1). يمثل هذا زيادة مقارنة بالمستويات التاريخية البالغة 91 وفاة لكل 100,000 سنة شخص . بالإضافة إلى ذلك، بينما اختفت الوفيات المرتبطة بدرجات الحرارة تقريبًا بالنسبة لأصغر الفئات العمرية تحت سيناريوهات SSP1-2.6 و SSP2-4.5، زادت المعدلات باستمرار عبر جميع الأعمار تحت SSP3-7.0 (الشكل الموسع 1).
بالنظر إلى الاتجاهات المناخية والسكانية المعنية في كل سيناريو SSP، تشير الأرقام أعلاه إلى أنه بحلول نهاية القرن، ومع عدم وجود تكيف، قد تصل الوفيات الزائدة السنوية المرتبطة بتغير المناخ بسبب درجات الحرارة غير المثلى في المناطق الحضرية الأوروبية إلى 7,826 ( إلى 40,142) تحت SSP1-2.6، 17,856 ( إلى 60,303) تحت SSP2-4.5 و إلى 186,821) تحت SSP3-7.0. ستؤدي الوفيات التراكمية بين 2015 و 2099 إلى عبء إجمالي قدره إلى وفيات لسيناريو SSP1-2.6، 636,034 ( إلى 2,354,502) وفيات لسيناريو SSP2-4.5 و 2,345,410 ( إلى 4,775,853) وفيات لسيناريو SSP3-7.0.
تحت سيناريو SSP3-7.0، زاد التأثير الصافي لتغير المناخ أيضًا بشكل أسي مع مستويات الاحترار (الشكل 2)، من إلى 22.7) وفاة لكل 100,000 سنة شخص عند ، إلى إلى 53.4) وفاة لكل 100,000 سنة شخص عند و إلى 81.4) وفاة لكل 100,000 سنة شخص عند . بالنظر إلى أنماط السكان في SSP3، فإن هذا يعادل 5,928 وفاة سنويًا ( إلى 38,211) عند وفيات سنويًا ( إلى 89,321) عند و 69,857 وفاة سنويًا ( إلى 136,430) عند .
الشكل 1| توقع التغيرات الصافية في معدلات الوفيات الزائدة المرتبطة بدرجات الحرارة من 2015 إلى 2099 تحت عدم التكيف مع الحرارة لثلاثة سيناريوهات SSP عبر المدن. تمثل الخطوط تقدير النقطة المتوسطة بين 19 GCMs
المعنية. تشير الأشرطة الشفافة إلى فترات الثقة التجريبية من 500 محاكاة في 19 GCMs والألوان الرمادية في أعلى كل لوحة تشير إلى نسبة نوافذ مستوى الاحترار الخاصة بـ GCM التي تغطي كل عام.
التباين بين البلدان
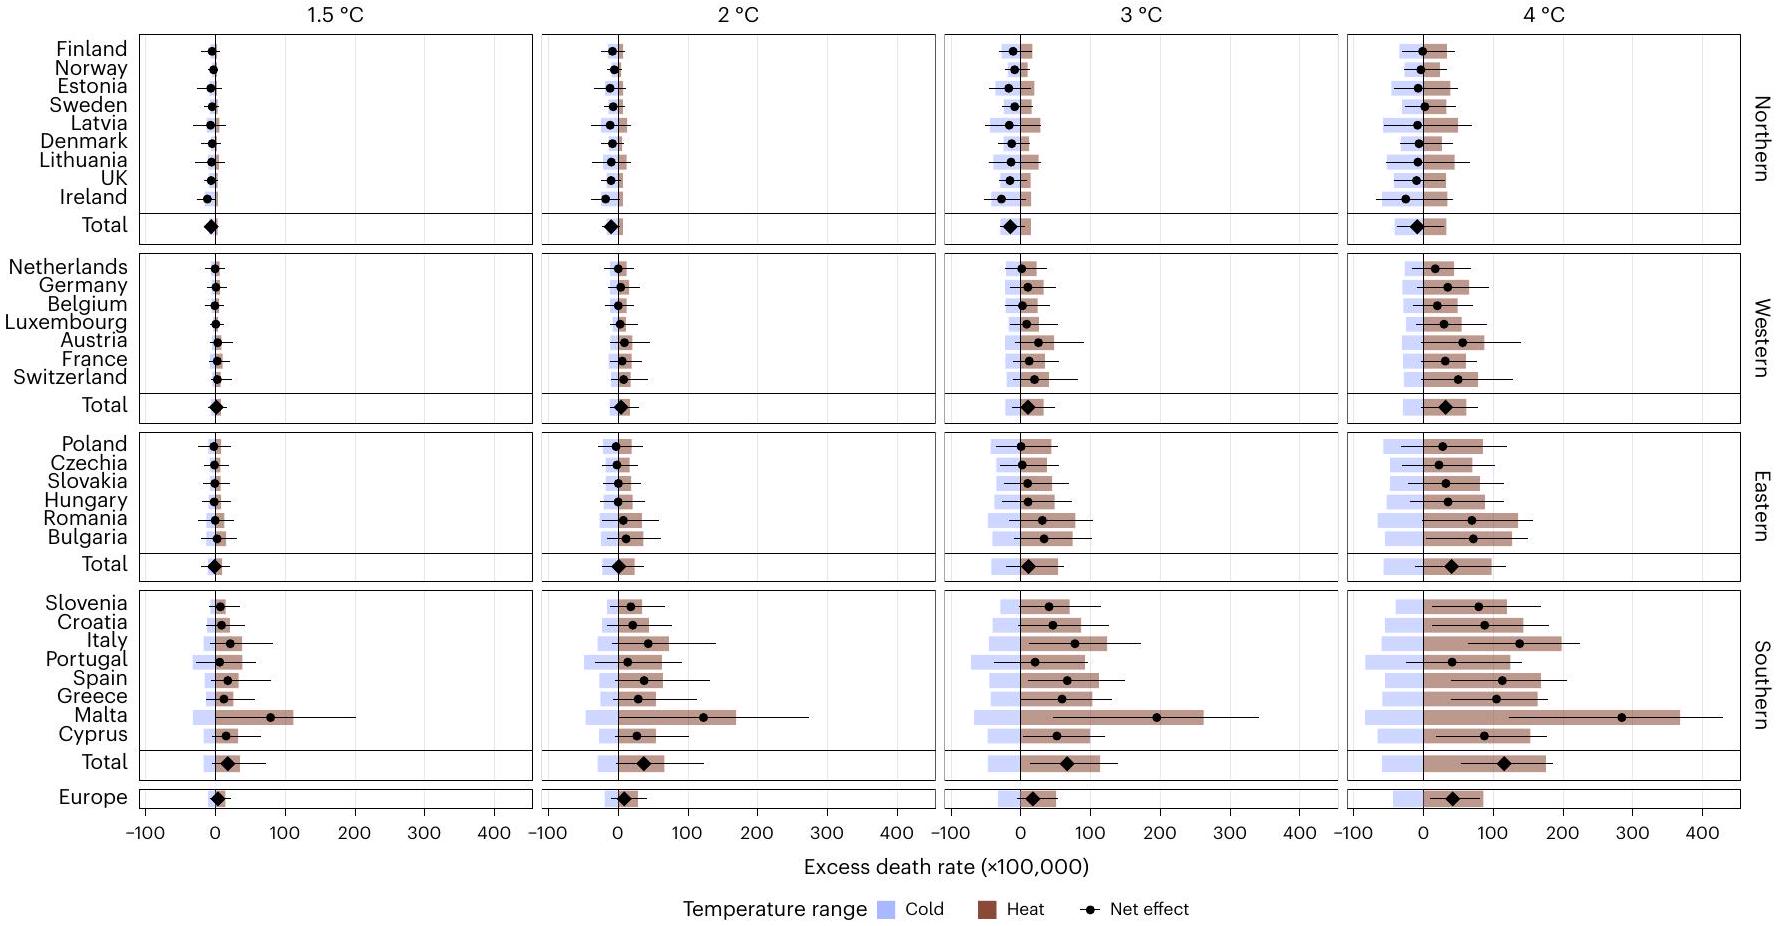
أظهرت النتائج تفاوتات بين المناطق في التأثير الصافي لتغير المناخ، كما هو موضح في الشكل 2، الذي يركز على مستويات الاحترار تحت سيناريو SSP3-7.0 دون تكيف مع الحرارة. أظهرت جنوب أوروبا أكبر التأثيرات الصافية، حيث وصلت الزيادة إلى 124.0 ( إلى 220.3) وفاة لكل 100,000 سنة شخص بحلول نهاية القرن (الجدول 1). قدمت أوروبا الشرقية والغربية تأثيرات صافية لتغير المناخ قريبة من المتوسط الأوروبي، مع زيادات نسبية قدرها 47.0 ( إلى 146.2) و إلى 98.5 وفاة لكل 100,000 سنة شخص بحلول نهاية القرن. دون تكيف مع الحرارة، فقط في شمال أوروبا، كان الانخفاض في الوفيات المرتبطة بالبرودة يعوض قليلاً الزيادة في الوفيات المرتبطة بالحرارة مع تأثير صافي قدره -11.8 ( إلى 2.7) وفاة لكل سنة شخص في عام 2050. ومع ذلك، تم تقليص هذا التأثير الصافي السلبي بأكثر من النصف في نهاية القرن ليصل إلى إلى 38.3 وفاة لكل 100,000 سنة شخص في عام 2095 (الجدول 1)، وعند الاحترار مقارنة بـ (الشكل 2).
كانت هناك أيضًا تفاوتات داخل المناطق. كانت الدولة الأكثر تأثرًا هي جزيرة مالطا الصغيرة، حيث أظهرت تأثيرًا صافيًا قدره 268.6 ( إلى 408.6) وفاة لكل 100,000 سنة شخص في عام 2095. كان هذا أكثر من ضعف القيمة للمنطقة الجنوبية، على الرغم من وجود عدم يقين كبير نظرًا لصغر عدد السكان المعني. أظهرت أيرلندا أقل تأثير صافي قدره إلى 72.5 وفاة لكل 100,000 سنة شخص بحلول نهاية القرن وكانت الدولة الوحيدة التي لم تشهد تقريبًا أي زيادة في أكثر سيناريوهات تغير المناخ تطرفًا. أظهرت رومانيا ( إلى 210.2 وفاة لكل 100,000 سنة شخص في عام 2095) وبلغاريا ( إلى 182.6 وفاة لكل 100,000 سنة شخص في عام 2095) تأثيرات صافية أعلى بكثير من الدول الأوروبية الشرقية الأخرى.
أنماط مكانية
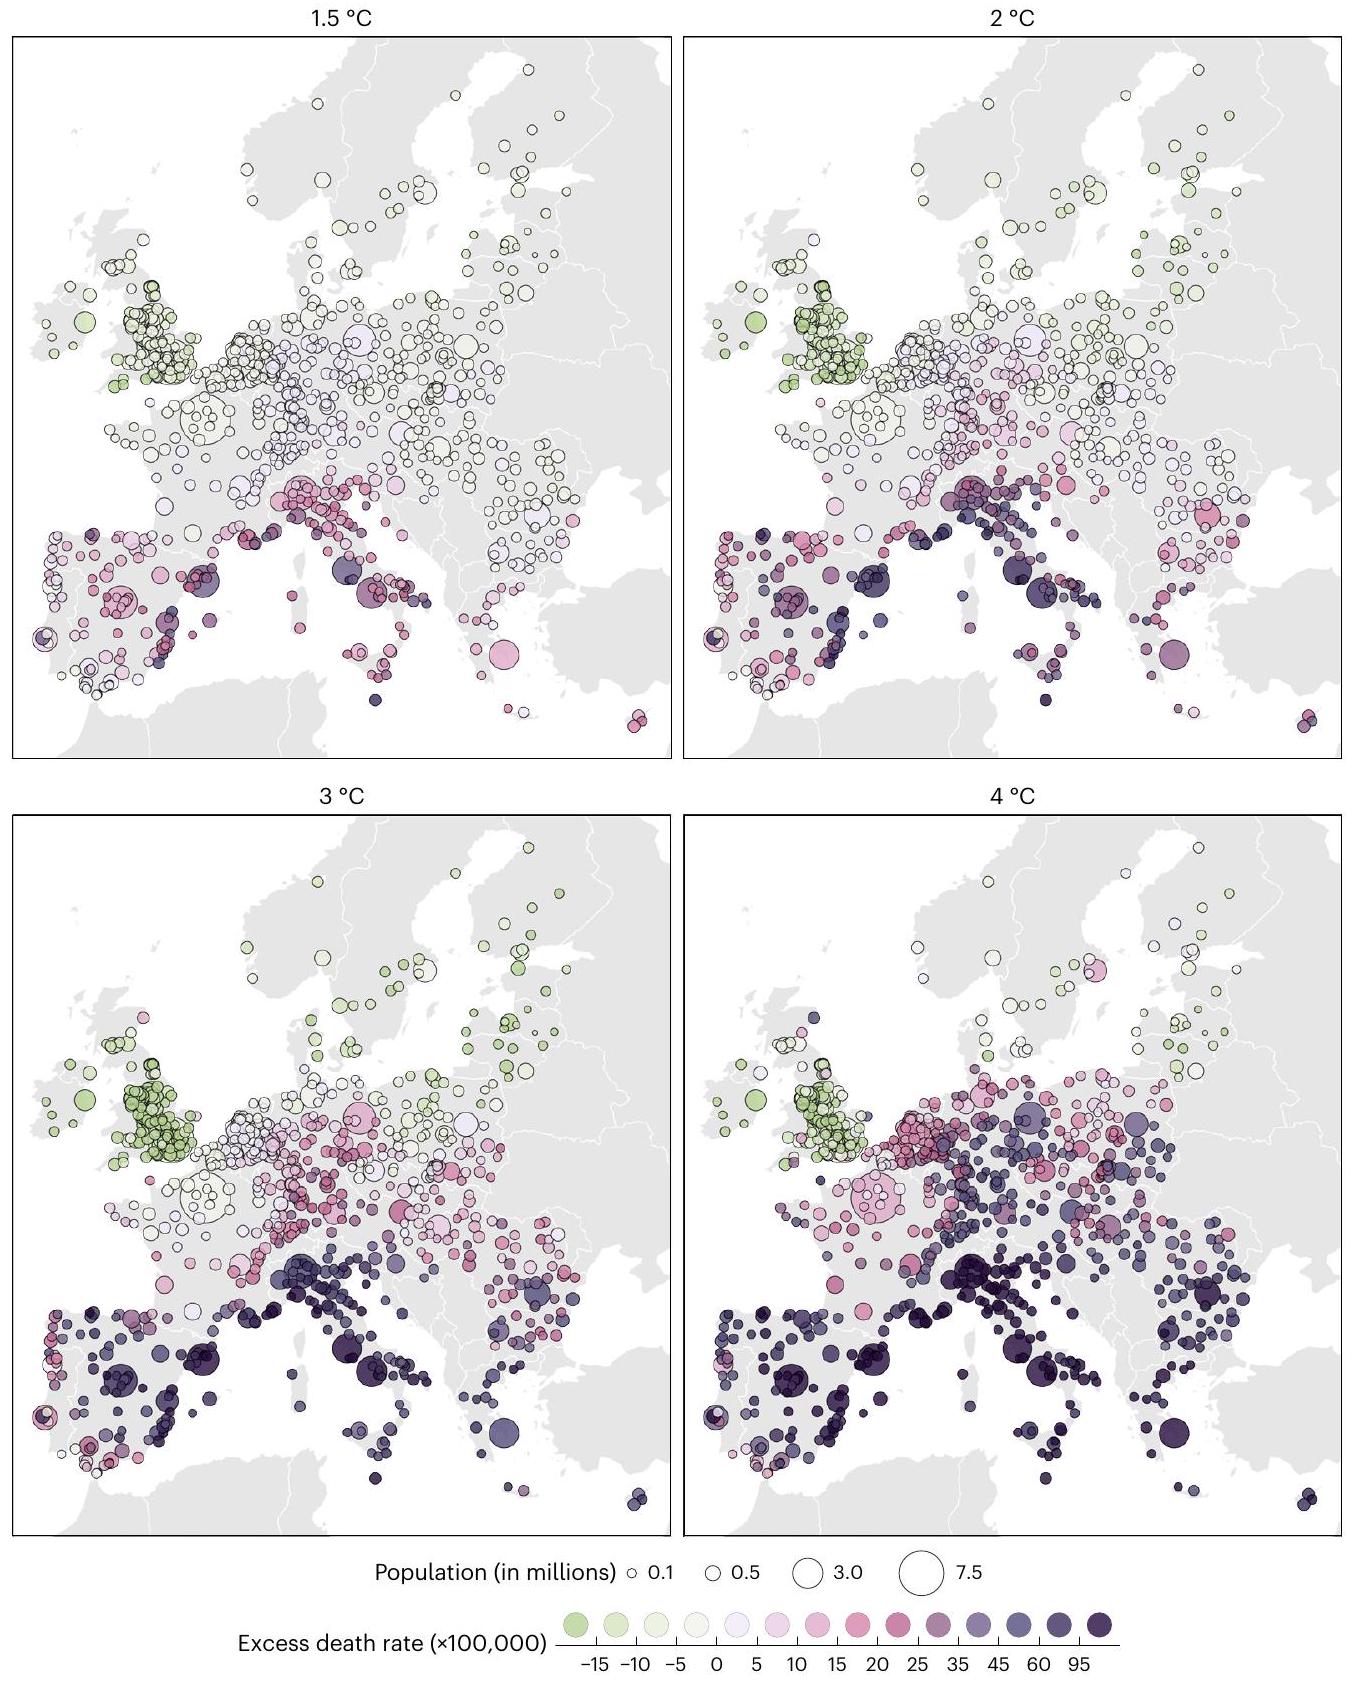
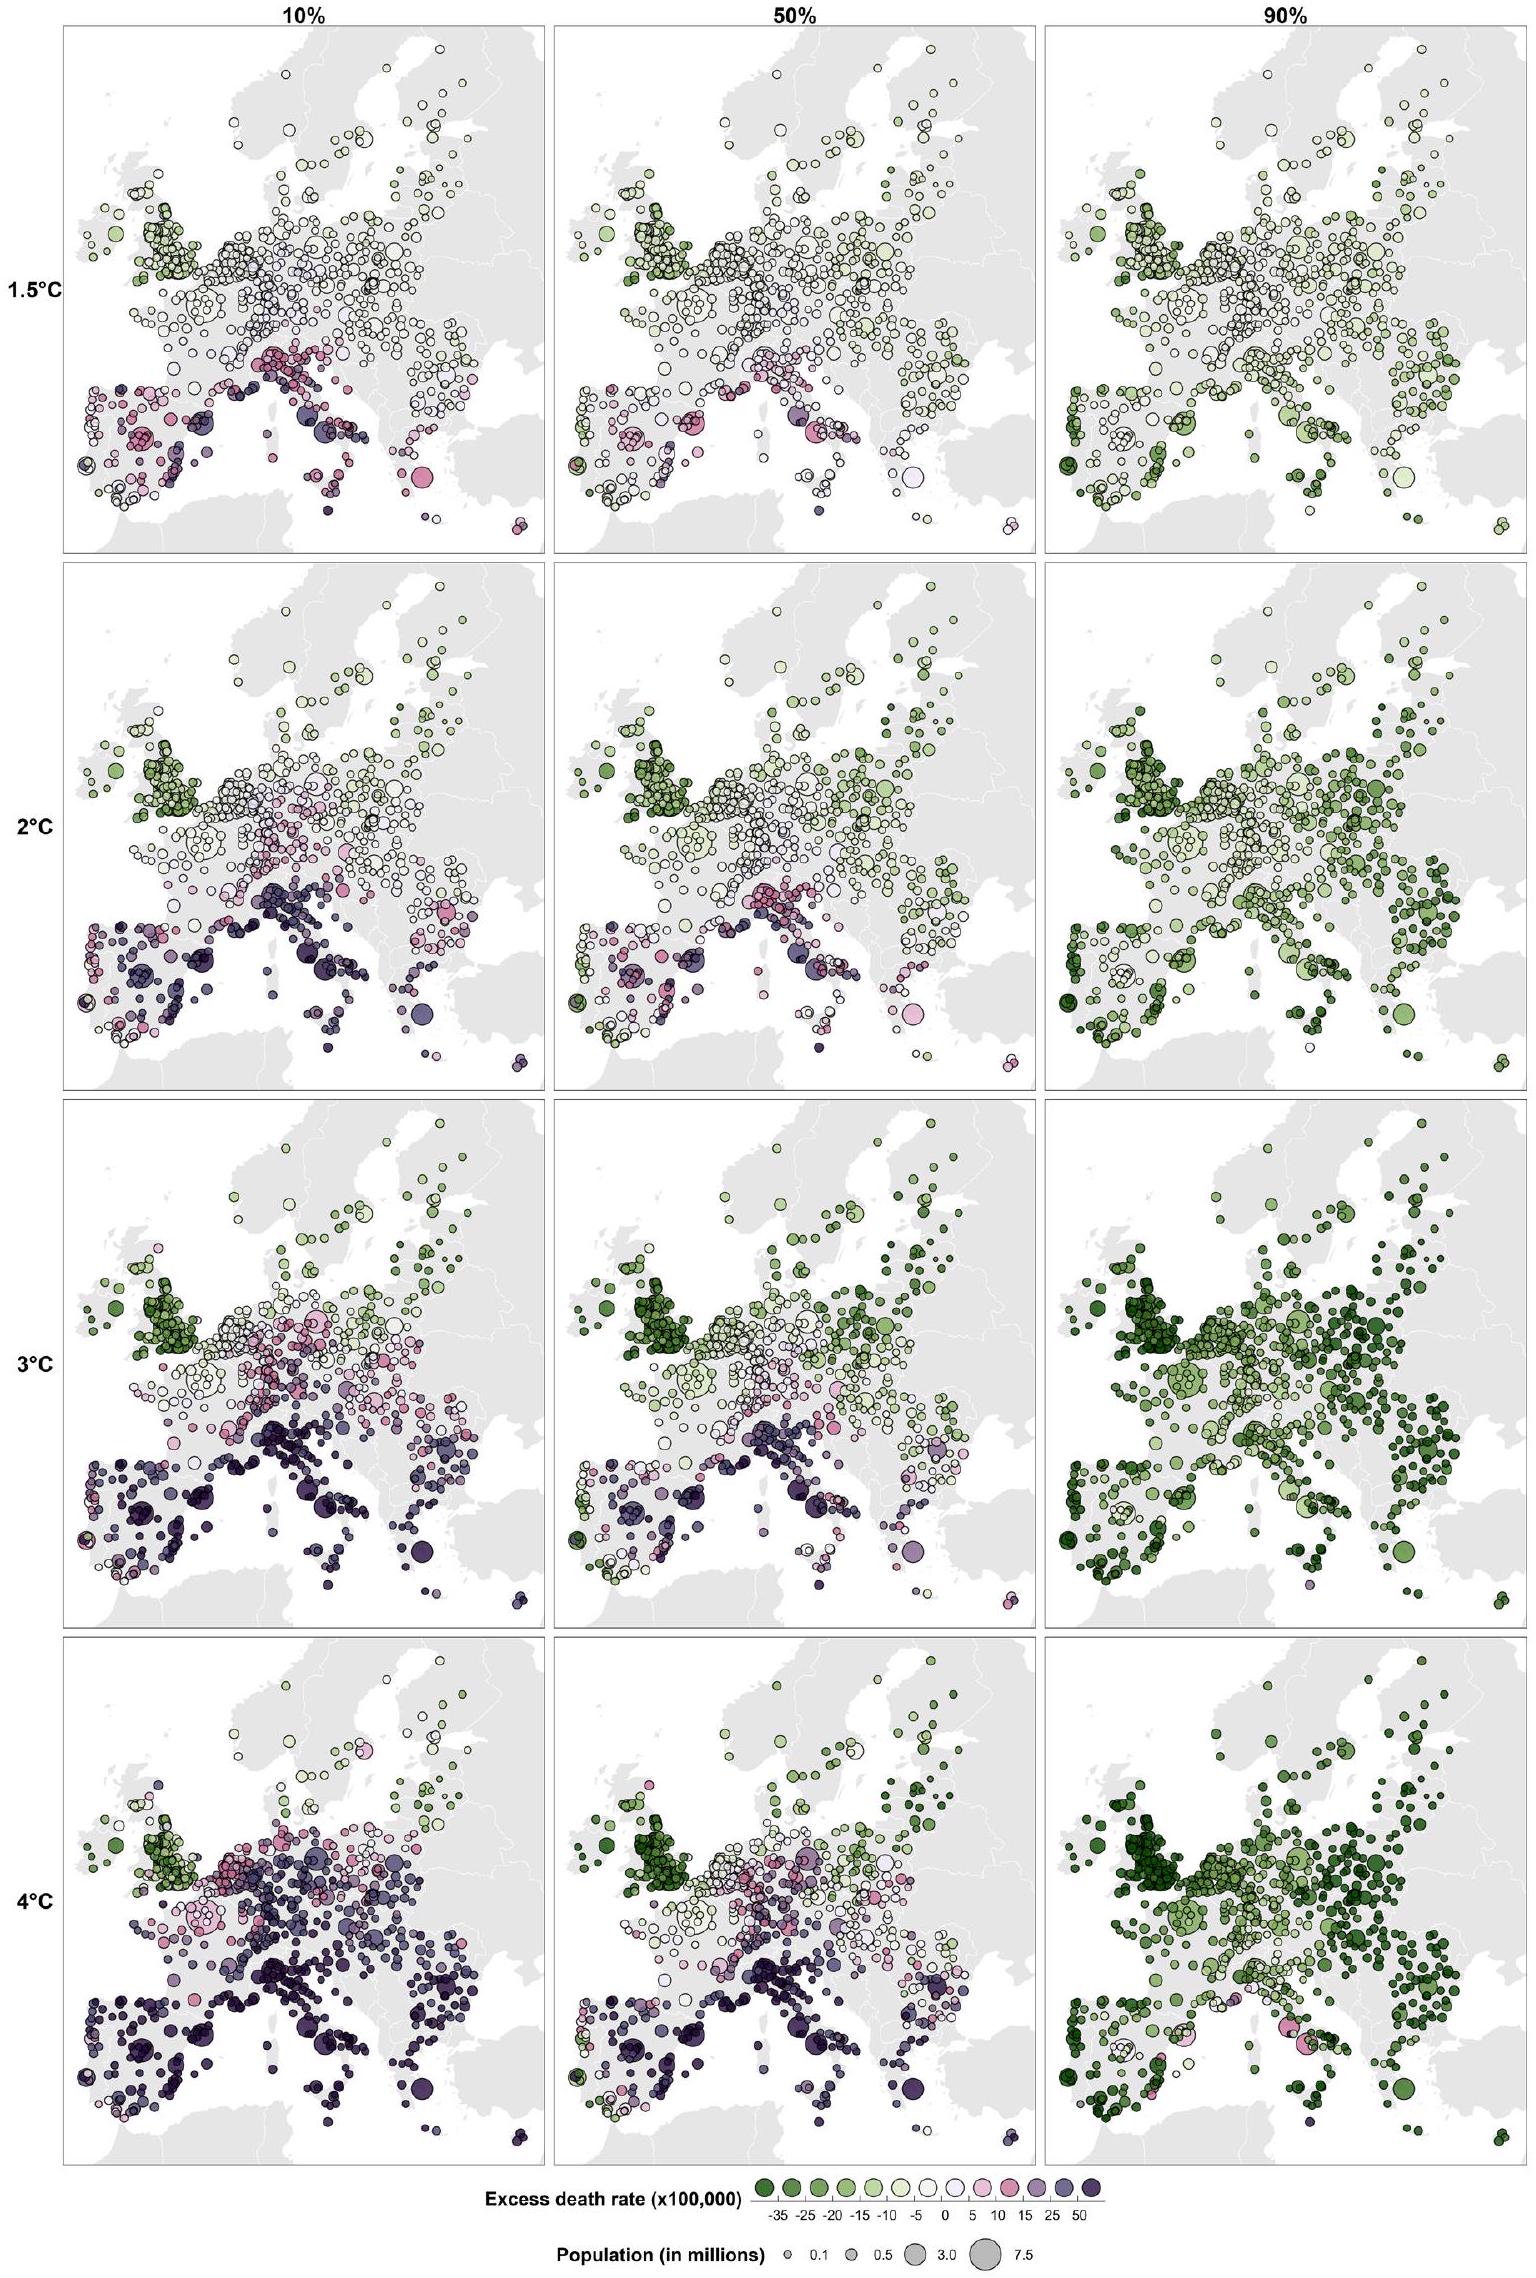
أظهرت خرائط معدلات الوفيات الزائدة أنماطًا جغرافية واضحة بين الدول وداخلها (الشكل 3). كان هناك تدرج شمالي-جنوبي، خاصة في الجزء الغربي حيث كانت الفروقات أقوى بين المملكة المتحدة وإسبانيا، مقارنة بالفروقات بين فنلندا وبلغاريا في الجزء الشرقي. كان هناك أيضًا تأثير متوسط قوي، مع أعلى التأثيرات الصافية في شرق إسبانيا، وجنوب فرنسا، وإيطاليا ومالطا، وهو ما يتوافق مع منطقة حيث معدل الاحترار المناخي أسرع من المناطق الأخرى. أخيرًا، يمكن رؤية نقطة ساخنة في وسط أوروبا، تشمل سويسرا والنمسا (الشكل 2)، بالإضافة إلى جنوب ألمانيا وبولندا.
كانت الفروقات الجغرافية أقوى مع الاحترار العالمي، خاصة بين و . عند زيادة متوسطة عالمية في درجة الحرارة قدرها ، زاد التأثير الصافي بشكل كبير في وسط أوروبا وعكس ليصبح إيجابيًا في بعض المدن الشمالية مثل أبردين، وستوكهولم، وهلسنكي، ومدن في دول البلقان وشمال بولندا.
دور التكيف مع الحرارة
توفر النتائج الموضحة أعلاه صورة عن التأثيرات المحتملة لتغير المناخ إذا لم يتم اتخاذ أي إجراء نحو التكيف مع الحرارة والبرودة. ومع ذلك، هناك أدلة قوية على وجود اختلافات في الضعف تجاه درجات الحرارة عبر الزمن، خاصة تجاه الحرارة . تستكشف هذه القسم كيف سيتغير التوازن بين زيادة الوفيات المرتبطة بالحرارة وانخفاض الوفيات المرتبطة بالبرودة مع درجات مختلفة من التكيف مع الحرارة.
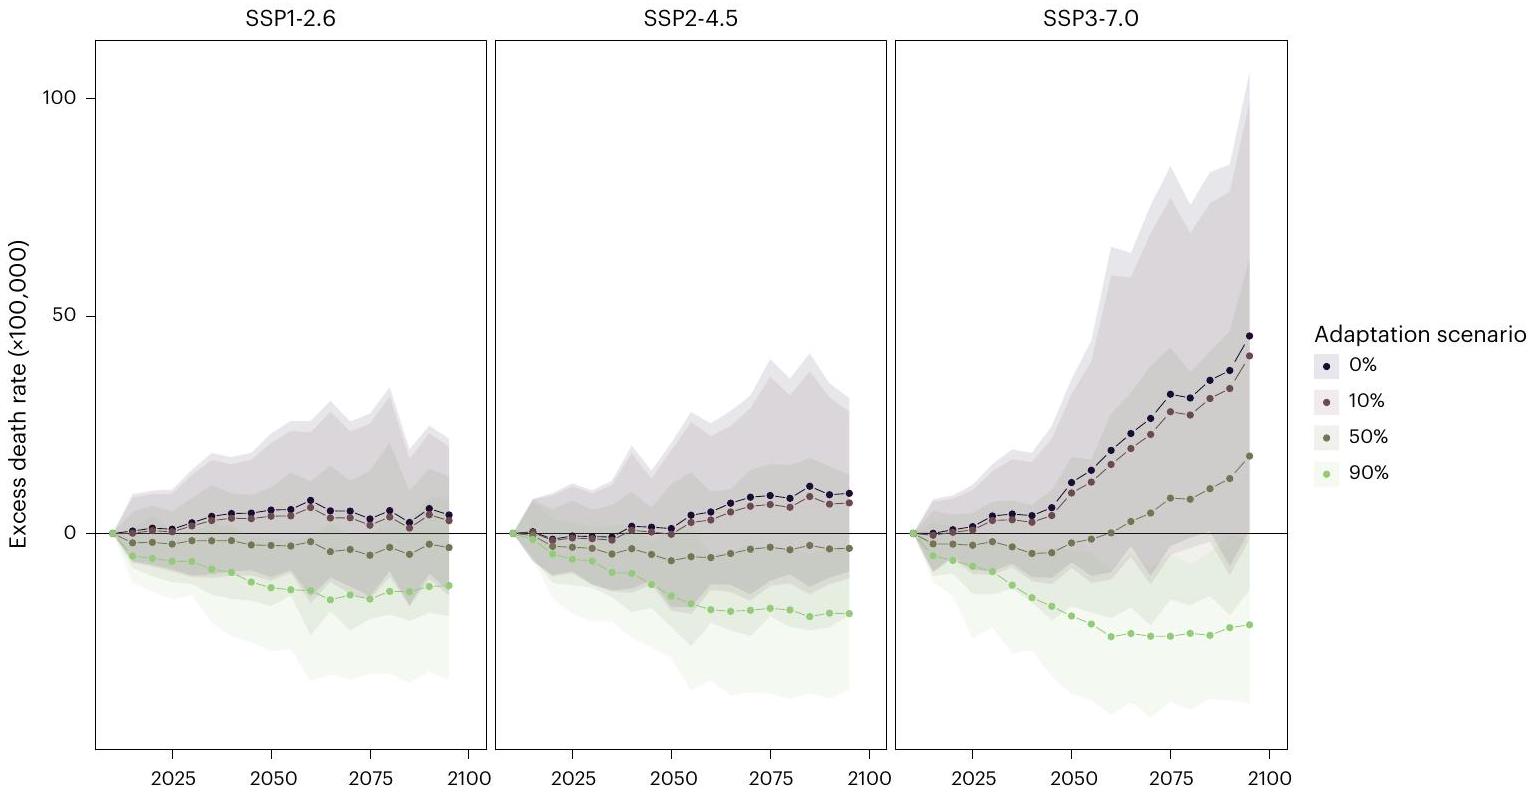
يوضح الشكل 4 أن التخفيف من خطر الوفيات المرتبطة بالحرارة سيؤدي إلى انخفاض طفيف في التأثير الصافي لتغير المناخ عبر جميع سيناريوهات SSP. سيكون التخفيف الأقوى لـ كافيًا لتحقيق انخفاض صافي في الوفيات المرتبطة بدرجات الحرارة تحت SSP12.6 و SSP2-4.5، خاصة في النصف الثاني من القرن، ولكن ليس تحت SSP3-7.0. في السيناريو الأخير ومع تخفيف لـ ، ستظل معدلات الوفيات الزائدة تزيد بمقدار إلى 63.2 وفاة لكل 100,000 سنة شخص (19.6% من المستوى التاريخي) بحلول نهاية القرن. يتوافق هذا مع toll التراكمي البالغ 268,100 وفاة ( إلى ). سيكون التخفيف شبه الكامل من خطر الوفيات المرتبطة بالحرارة ( سيكون من الضروري (تقليل) الحصول على عكس كامل للتأثير الصافي لتغير المناخ. هذا العكس كبير تحت سيناريو SSP3-7.0، حيث ستنخفض الأعباء المرتبطة بالبرد بشكل كبير.
كانت هناك تفاوتات مكانية هامة في آثار التكيف (الشكل البياني الممتد 2). على وجه التحديد، حتى مع تخفيف خطر الوفاة المرتبط بالحرارة، ستظل معظم منطقة البحر الأبيض المتوسط تشهد زيادة كبيرة في الوفيات المرتبطة بالحرارة تحت سيناريو SSP3-7.0. عند مستويات الاحترار العالية ( و هذا الاستمرار في تأثير صافي فوق الصفر انتشر أيضًا إلى وسط أوروبا وبعض أجزاء البلقان. وأخيرًا، يجدر بالذكر أنه، حتى مع التخفيف
الجدول 1 | معدلات الوفيات الزائدة (لكل 100,000 سنة شخص) في كل دولة ومنطقة وعلى المستوى الأوروبي للفترات 2050-2054 و2095-2099 تحت سيناريوهات SSP3-7.0 وعدم التكيف مع الحرارة
2050-2054
2095-2099
بارد
حرارة
الأثر الصافي
بارد
حرارة
الأثر الصافي
فنلندا
-19.0 (-44.5 إلى 5.4)
9.1 (-5.9 إلى 44.2)
-9.8 (-24.9 إلى 8.2)
-31.2 (-49.5 إلى -11.7)
28.2 (3.6 إلى 83.0)
-2.9 (-29.6 إلى 40.7)
النرويج
-12.4 (-30.5 إلى -1.7)
6.2 (-0.4 إلى 22.8)
-6.2 (-18.0 إلى 6.7)
-23.1 (-39.9 إلى -9.0)
19.2 (2.2 إلى 58.6)
-3.9 (-24.1 إلى 27.9)
إستونيا
-23.4 (-51.1 إلى 7.1)
9.7 (-9.6 إلى 50.8)
-13.7 (-33.6 إلى 9.9)
-42.8 (-70.0 إلى -15.2)
٣٣.٤ (٣.٩ إلى ١٠٣.٢)
-9.4 (-45.0 إلى 47.5)
السويد
-16.5 (-35.8 إلى -1.5)
9.2 (-0.3 إلى 40.5)
-7.3 (-21.2 إلى 13.0)
-26.9 (-42.5 إلى -10.9)
28.5 (3.2 إلى 79.5)
1.6 (-25.6 إلى 42.5)
لاتفيا
-30.2 (-65.3 إلى -1.7)
16.5 (-7.0 إلى 70.1)
-13.6 (-41.2 إلى 24.0)
-55.6 (-94.7 إلى -20.0)
٤٦.٨ (٤.٥ إلى ١٥٠.٣)
-8.8 (-60.4 إلى 79.3)
الدنمارك
-17.7 (-44.3 إلى -1.8)
8.4 (-4.4 إلى 40.3)
-9.4 (-28.0 إلى 17.6)
-29.5 (-51.3 إلى -7.8)
25.0 (2.4 إلى 78.3)
-4.5 (-33.8 إلى 34.8)
ليتوانيا
-28.0 (-62.5 إلى -1.9)
15.5 (-6.2 إلى 66.9)
-12.5 (-39.9 إلى 25.1)
-48.8 (-86.4 إلى -17.8)
41.5 (4.2 إلى 136.8)
-7.3 (-54.5 إلى 75.2)
المملكة المتحدة
-22.9 (-49.0 إلى -8.5)
10.9 (0.7 إلى 44.1)
-12.1 (-30.2 إلى 2.0)
-36.0 (-60.2 إلى -13.7)
31.2 (4.3 إلى 88.9)
-4.9 (-38.0 إلى 41.7)
أيرلندا
-33.5 (-67.7 إلى -13.3)
10.9 (0.4 إلى 48.9)
-22.6 (-51.9 إلى 6.1)
-56.5 (-95.2 إلى -21.8)
٣٨.٦ (٢.٤ إلى ١٤٣.٧)
-18.0 (-65.7 إلى 72.5)
شمالي
-22.5 (-47.8 إلى -8.9)
10.7 (1.0 إلى 44.6)
-11.8 (-27.3 إلى 2.7)
-35.9 (-58.9 إلى -13.9)
31.0 (4.9 إلى 85.3)
-4.9 (-34.8 إلى 38.3)
هولندا
-16.1 (-36.7 إلى -1.1)
17.6 (2.2 إلى 62.2)
1.4 (-20.3 إلى 33.1)
-25.7 (-45.2 إلى -9.5)
٤٤.٤ (٨.٦ إلى ١١٧.٢)
18.7 (-21.3 إلى 81.7)
ألمانيا
-16.4 (-35.8 إلى -2.9)
22.8 (1.8 إلى 64.2)
6.5 (-11.0 إلى 39.4)
-26.6 (-43.4 إلى -11.7)
63.6 (12.7 إلى 138.9)
٣٦.٩ (-٨.١ إلى ١٠٣.٨)
بلجيكا
-15.9 (-34.7 إلى -2.1)
17.7 (1.8 إلى 58.6)
1.8 (-17.2 إلى 30.3)
-27.0 (-44.5 إلى -11.1)
٤٩.٦ (١٠.٦ إلى ١١٧.٢)
22.6 (-17.1 إلى 80.9)
لوكسمبورغ
-11.3 (-26.2 إلى -2.3)
16.2 (0.9 إلى 51.3)
4.9 (-10.3 إلى 34.4)
-22.2 (-39.1 إلى -9.4)
54.8 (8.7 إلى 129.7)
32.6 (-10.3 إلى 105.1)
النمسا
-15.3 (-33.2 إلى -2.8)
27.2 (3.8 إلى 73.6)
11.8 (-10.4 إلى 52.8)
-27.5 (-44.9 إلى -13.0)
91.0 (26.0 إلى 212.7)
63.5 (4.7 إلى 176.2)
فرنسا
-17.9 (-35.8 إلى -5.8)
27.2 (8.4 إلى 60.2)
9.3 (-11.4 إلى 40.8)
-28.4 (-44.2 إلى -15.5)
66.4 (15.2 إلى 134.8)
38.0 (-8.0 إلى 101.2)
سويسرا
-13.6 (-35.4 إلى -1.8)
25.0 (4.7 إلى 70.5)
11.4 (-8.1 إلى 51.3)
-24.0 (-40.8 إلى -11.1)
77.9 (18.6 إلى 169.2)
53.9 (-0.6 إلى 140.8)
غربي
-16.7 (-35.1 إلى -3.9)
23.9 (5.7 إلى 61.7)
7.1 (-9.8 إلى 35.3)
-27.2 (-42.6 إلى -13.9)
63.2 (18.4 إلى 132.7)
٣٦.٠ (-٣.٩ إلى ٩٨.٥)
بولندا
-28.3 (-60.1 إلى -5.5)
٢٤.٨ (-٠.٨ إلى ٧٤.٨)
-3.5 (-28.4 إلى 36.6)
-49.9 (-79.0 إلى -23.0)
80.7 (20.7 إلى 191.4)
30.8 (-27.9 إلى 130.9)
التشيك
-22.6 (-48.2 إلى -6.3)
20.5 (2.0 إلى 56.6)
-2.1 (-22.8 إلى 30.4)
-42.7 (-68.8 إلى -21.1)
74.1 (18.0 إلى 177.9)
31.5 (-22.5 إلى 126.9)
سلوفاكيا
-23.4 (-49.6 إلى -6.6)
23.5 (2.8 إلى 63.8)
0.1 (-21.3 إلى 33.6)
-42.2 (-65.8 إلى -20.5)
82.1 (22.9 إلى 194.3)
39.9 (-13.0 إلى 143.0)
المجر
-25.9 (-55.5 إلى -9.5)
٢٤.٨ (٢.٧ إلى ٦٦.٩)
-1.1 (-22.9 إلى 30.9)
-49.2 (-75.9 إلى -24.7)
94.4 (28.2 إلى 216.2)
45.2 (-13.1 إلى 156.7)
رومانيا
-33.0 (-60.7 إلى -11.0)
٣٩.٤ (١٠.٣ إلى ١٠٠.٢)
6.5 (-22.5 إلى 48.6)
-63.7 (-95.7 إلى -28.5)
144.7 (30.5 إلى 284.4)
81.0 (-5.3 إلى 210.2)
بلغاريا
-30.2 (-54.2 إلى -6.3)
41.8 (11.0 إلى 89.3)
11.6 (-17.7 إلى 48.6)
-51.3 (-78.4 إلى -22.7)
129.9 (25.6 إلى 244.4)
78.6 (-1.3 إلى 182.6)
شرقي
-28.4 (-56.9 إلى -9.5)
28.9 (6.0 إلى 73.9)
0.4 (-22.4 إلى 29.8)
-51.7 (-79.2 إلى -25.4)
98.7 (30.5 إلى 207.4)
47.0 (-9.4 إلى 146.2)
سلوفينيا
-21.2 (-47.6 إلى -5.9)
٤٤.٥ (١٢.٥ إلى ٩٦.١)
23.2 (-6.4 إلى 62.4)
-34.5 (-56.9 إلى -16.3)
117.3 (42.1 إلى 234.4)
82.8 (14.9 إلى 193.3)
كرواتيا
-29.1 (-59.9 إلى -11.5)
54.9 (18.4 إلى 107.2)
25.8 (-7.5 إلى 67.3)
-53.7 (-83.3 إلى -27.0)
154.4 (60.7 إلى 280.7)
100.7 (17.2 إلى 217.6)
إيطاليا
-36.5 (-68.7 إلى -17.8)
91.2 (36.4 إلى 165.8)
54.7 (5.6 إلى 117.4)
-52.7 (-78.1 إلى -29.4)
191.3 (69.3 إلى 312.3)
138.6 (25.0 إلى 247.3)
البرتغال
-59.1 (-93.8 إلى -18.2)
76.3 (19.0 إلى 161.5)
17.3 (-40.6 إلى 91.2)
-78.1 (-119.7 إلى -31.7)
135.0 (34.0 إلى 252.9)
56.9 (-22.2 إلى 166.7)
إسبانيا
-33.8 (-56.3 إلى -12.2)
80.3 (24.6 إلى 143.8)
٤٦.٤ (-٠.١ إلى ١٠٨.٤)
-50.1 (-75.3 إلى -24.0)
175.6 (64.4 إلى 305.7)
125.5 (31.2 إلى 249.6)
اليونان
-30.7 (-56.0 إلى -5.1)
64.2 (20.4 إلى 131.3)
33.6 (-7.3 إلى 93.3)
-55.8 (-83.5 إلى -29.7)
175.4 (57.2 إلى 274.1)
119.6 (23.7 إلى 214.7)
مالطا
-53.2 (-77.0 إلى -23.3)
200.8 (50.6 إلى 316.5)
147.6 (26.0 إلى 265.7)
-73.3 (-103.7 إلى -36.9)
٣٤١.٨ (١٠٣.١ إلى ٤٨٩.١)
268.6 (63.7 إلى 408.6)
قبرص
-31.2 (-48.9 إلى -5.9)
63.9 (20.0 إلى 122.8)
32.7 (-3.2 إلى 84.2)
-61.2 (-87.5 إلى -32.5)
155.5 (59.9 إلى 262.8)
94.3 (9.3 إلى 197.8)
جنوبى
-36.3 (-60.5 إلى -15.7)
82.2 (31.5 إلى 141.5)
٤٥.٩ (٣.٥ إلى ٩٩.٦)
-53.8 (-78.1 إلى -27.8)
177.8 (65.5 إلى 284.7)
124.0 (27.9 إلى 220.3)
إجمالي
-25.0 (-47.3 إلى -11.4)
٣٦.٧ (١٥.٤ إلى ٧٥.٠)
11.7 (-6.6 إلى 35.5)
-38.9 (-58.0 إلى -21.1)
84.3 (27.5 إلى 156.0)
٤٥.٤ (٠.٧ إلى ١٠٦.٠)
تشمل الجدول الوفيات المرتبطة بالبرد والوفيات المرتبطة بالحرارة والأثر الصافي. تشير الأقواس إلى فترات الثقة التجريبية. القيم بالخط العريض تشير إلى المجموعات الإقليمية والأوروبية. منارتفاع في درجة الحرارةستظل المستويات فوق ما قبل الصناعة تؤدي إلى تأثير صافي فوق الصفر لبعض المدن في منطقة البحر الأبيض المتوسط (من بينها روما، نابولي، برشلونة ومارسيليا).
نقاش
في هذه الدراسة، قدمنا تقييمًا مقارنًا شاملاً للتغيرات في الوفيات المرتبطة بالحرارة والبرودة تحت عدة سيناريوهات لتغير المناخ، والسكان، والتكيف عبر المناطق الحضرية الأوروبية. أظهرنا أنه، دون التكيف مع الحرارة، من المتوقع أن تزداد الوفيات المرتبطة بالحرارة استجابةً لتغير المناخ عبر السيناريوهات والفترات لمعظم أوروبا. بالنسبة للمدن الـ 854 المختارة، يمكن أن يؤدي هذا التأثير الصافي إلى زيادة في الوفيات المرتبطة بالحرارة معدلات وإجمالي عدد الوفيات التراكمي الذي يتجاوز 2,000,000 نحو نهاية القرن إذا كان العالم سيتبع السيناريو الأكثر تطرفًا SSP3-7.0. يمكن تقليل هذه الأرقام بمقدار الثلثين على الأقل بموجب السيناريوهات الأكثر صرامة SSP1-2.6 و SSP2-4.5، مما يوضح الفوائد الصحية لتنفيذ سياسات قوية للحد من انبعاثات الكربون.
تكشف نتائجنا أنه في غياب التخفيف الطموح، هناك مستوى كبير وغير معقول إلى حد ما من التكيف مع الحرارة ضروري لمنع الزيادة في الوفيات المرتبطة بالحرارة. في الواقع، في سيناريو SSP3-7.0، فإن تقليل المخاطر لـليس كافياً لتعويض التعرض المتزايد للحرارة بسبب تغير المناخ، وخاصة حول منطقة البحر الأبيض المتوسط، وأوروبا الوسطى، والبلقان. لوضع ذلك في السياق، فإنتقليل المخاطر المرتبطة بالحرارة هو
الشكل 2 | التغيرات الصافية في معدلات الوفيات الزائدة المرتبطة بدرجات الحرارة على مستوى الدول لكل مستوى من مستويات الاحترار تحت سيناريو SSP3-7.0 ودون التكيف مع الحرارة.
تمثل الأعمدة والنقاط تقدير النقطة المتوسطة بين 19 نموذجًا من نماذج المناخ العامة المدروسة. تشير الأشرطة الأفقية إلىفترات الثقة التجريبية للأثر الصافي من 500 محاكاة في 19 نموذج مناخي عام. تشير النقاط على شكل الماس إلى القيم الإقليمية والأوروبية. يتم تحديد نطاق درجة الحرارة بالنسبة لمتوسط درجة الحرارة العالمية. أعلى مما تم ملاحظته في ألمانياوحسب التقديرات، فإن ذلك يتماشى تقريبًا مع الانخفاض في المخاطر الذي تم تقديره في إسبانيا على مدى العقود القليلة الماضية (بين و تم تقدير تقليل مخاطر الحرارة العالية فقط في دول مثل السويد وسويسرا، التي تساهم عمومًا بشكل أقل بكثير في عبء الوفيات المرتبطة بالحرارة.من ناحية أخرى، شهدت دول مثل المملكة المتحدة واليونان وجمهورية التشيك القليل من التخفيف في المخاطر أو لم تشهد أي شيء منها.. هذا يُظهر أنه حتى الأهداف الطموحة المتعلقة بالتكيف بالكاد يمكن أن تحل محل أهداف التخفيف القابلة للتحقيق، خاصة في سياق SSP3-7.0.
تسلط نتائجنا الضوء على الفوارق المكانية مع تأثيرات مستقبلية كبيرة في دول البحر الأبيض المتوسط، وزيادات صافية أقل في الوفيات المرتبطة بالحرارة في الدول الشرقية والغربية. مالطا هي الدولة الوحيدة التي تم تقدير زيادات صافية في الوفيات المرتبطة بالحرارة عبر جميع سيناريوهات SSP وسيناريوهات التكيف مع الحرارة؛ قد تصل زيادة معدل الوفيات الصافية إلى ما يقرب منمستويات أوائل القرن الحادي والعشرين. قد يتجاوز الارتفاع أيضًافي إسبانيا. بالإضافة إلى منطقة البحر الأبيض المتوسط، لاحظنا بؤرًا لزيادة صافية في الوفيات المرتبطة بالحرارة في دول جنوب شرق أوروبا مثل رومانيا وبلغاريا، وفي وسط أوروبا، بما في ذلك النمسا وجنوب ألمانيا وجنوب بولندا. تتوافق هذه المناطق أيضًا مع الدول التي تتطلب أكبر تخفيف لمخاطر الحرارة لتجنب زيادة الوفيات المرتبطة بالحرارة. بشكل عام، كانت الفجوات المكانية متوافقة مع عدة تقييمات خاصة بكل دولة.على الرغم من أن المقارنة المباشرة صعبة نظرًا للاختلافات في المنهجيات. تشير نتائجنا أيضًا إلى انخفاض طفيف في الوفيات المرتبطة بالحرارة في الدول الشمالية، بما يتماشى مع التقييمات السابقة.. ومع ذلك، أظهر هذا الانخفاض الطفيف في الوفيات المرتبطة بدرجات الحرارة عكسًا نحو نهاية القرن وتحت سيناريوهات الاحترار الأكثر تطرفًا، وكان يتجاوز بشكل كبير الزيادات الكبيرة في بقية أوروبا.
الزيادة العامة في الوفيات المرتبطة بالحرارة عبر السيناريوهات مرتبطة بالشكل العام لعلاقات الاستجابة البيئية لوفيات الحرارة.. في الواقع، في معظم المواقع، تكون المنحنى أكثر حدة عند الارتفاع درجات الحرارة أكثر من درجات الحرارة المنخفضة، مما يعني أنه بالنسبة لأي تغيير في توزيع درجات الحرارة، فإن خطر الوفاة يزيد بشكل أسرع في الجزء الحار مقارنة بما ينقص في الجزء البارد. وهذا يفسر أيضًا ضرورة التخفيف القوي من خطر الحرارة في التكيف مع تغير المناخ. ويتفاقم هذا التأثير أيضًا بسبب موقع الحد الأدنى المحلي لنسبة الوفيات، حيث تميل المواقع ذات الزيادات الصافية الأقل إلى أن تكون مواقع ذات نسب وفيات دنيا أعلى.لم يكن الزيادة الصافية المبلغ عنها مرتبطة بزيادة السكان أو الشيخوخة، حيث إن نتائجنا تُظهر الفرق بين السيناريوهات مع وبدون تغير المناخ تحت نفس مسارات السكان ومعدلات الوفيات الأساسية. لذلك، قمنا بالتحكم في التأثيرات السكانية من خلال مقارنة مجموعتين سكانيّتين متطابقتين.
تتمتع هذه الدراسة بعدة نقاط قوة. أولاً، إنها تقدم تقييمًا شاملاً للسكان الحضريين في أوروبا، موسعة التحليل ليشمل عدة مناطق تم استبعادها في الدراسات السابقة.مثل الدول الإسكندنافية والبلقانية وشرق أوروبا، حيث كانت الأدلة شبه معدومة. ثانياً، استخدمت نماذج العلاقة بين التعرض والاستجابة الخاصة بكل مدينة وخمس فئات عمرية، في حين اعتبرت الدراسات السابقة نموذج علاقة واحد لجميع الأعمار.أو انقسام واحد عند 75 عامًا. هذا سمح بتمثيل أفضل لمعدل الوفيات الأساسي والضعف تجاه الحرارة والبرودة تحت سيناريوهات مختلفة محتملة. ثالثًا، استكشفت هذه الدراسة كيف سيتطور التأثير الصافي المستقبلي للمناخ تحت عدة سيناريوهات لتخفيف مخاطر الحرارة عبر الفئات العمرية، مما يوفر صورة أوسع لتأثيرات تغير المناخ. أخيرًا، تحسن هذه الدراسة أيضًا دقة تمثيل العبء المنسوب إلى تغير المناخ وعدم اليقين في التوقعات. يتم ذلك من خلال عزل التأثير المحدد لتغير المناخ على الوفيات المستقبلية مع الأخذ في الاعتبار التغيرات السكانية المستقبلية، على عكس الدراسات السابقة التي لم تؤخذ فيها التغيرات السكانية في الاعتبار.أو متشابك مع تغير المناخ في النتائجنظرًا لأن توقعات المناخ هي ممارسة غير مؤكدة بطبيعتها، فقد دمجت هذه التوقعات عدم اليقين من تقدير ERF مع محاكاة مونت كارلو، ومن توقعات المناخ مع العديد من نماذج المناخ العالمية التي تغطي مجموعة واسعة من المستقبلات المحتملة (كما هو موضح في الشكل 3 من البيانات الموسعة).
الشكل 3 | التغيرات الصافية في معدلات الوفيات الزائدة المرتبطة بدرجات الحرارة على مستوى المدينة لكل مستوى من مستويات الاحترار تحت سيناريو SSP3-7.0 ودون التكيف مع الحرارة. تمثل الألواح من أعلى اليسار إلى أسفل اليمين مستويات الاحترار منإلىتشير الألوان الخضراء إلى انخفاض في الوفيات الزائدة المرتبطة بدرجات الحرارة، بينما تشير الألوان البنفسجية إلى زيادة.
تنعكس هذه الحالة من عدم اليقين أيضًا في النتائج عند مستويات الاحترار، حيث اختارت الدراسات السابقة سنة واحدة لكل مستوى..
على الرغم من النظر في عدة سيناريوهات لتخفيف المخاطر، فإن هذا العمل محدود في معالجته للتكيف. في الواقع، تم تعريف السيناريوهات كتكييف عام دون اختلاف جغرافي في مستوى تخفيف المخاطر ودون الإشارة إلى المحركات المحددة للتكيف. تختلف المحركات التي تم اعتبارها للتكيف بين الدراسات، بما في ذلك درجة الحرارة.الناتج المحلي الإجماليتكييف الهواءأو الإسكانلم تظهر منهجية توافقية حول دمج هذه العوامل في التكيف. يمكن أن تؤثر خصائص المناخ المحلية الإضافية، مثل الرطوبة أو أحداث الليالي الحارة المحددة، على الوفيات المرتبطة بدرجات الحرارة وغالبًا ما يتم دمجها في التوقعات.. ومع ذلك، فإن الأدلة الوبائية غير مؤكدة بشأن دور مثل هذه العوامل واقترح أن الوظائف الاستجابة غير الخطية لدرجة الحرارة المتوسطة مع تأخيرات كافية تلتقط معظم الوفيات المرتبطة بدرجة الحرارةلذلك، يجب أن تركز الأبحاث المستقبلية على فهم التفاعل بين العوامل المحلية والضعف تجاه درجات الحرارة وكيفية دمجها كميًا في توقعات الوفيات المرتبطة بالحرارة.
تأتي نطاق التحليل الجغرافي على مستوى المدينة الذي تم النظر فيه في الدراسة الحالية مع بعض القيود. في الواقع، يمكن أن تتفاوت درجات الحرارة والضعف أمام الحرارة والبرودة بشكل كبير داخل المدينة.، مما يعني أن أقصى درجات الحرارة وتأثيراتها المحتملة قد يتم تخفيفها من خلال تصميم دراستنا. هناك حاجة إلى مزيد من التوقعات التي تأخذ في الاعتبار الفروق داخل المدن في التعرض لتسليط الضوء على أكثر الفئات عرضة للخطر. بالإضافة إلى ذلك، فإن تعريف المدينة، على الرغم من أنه مستخرج من يوروستات، وهو معيار موحد
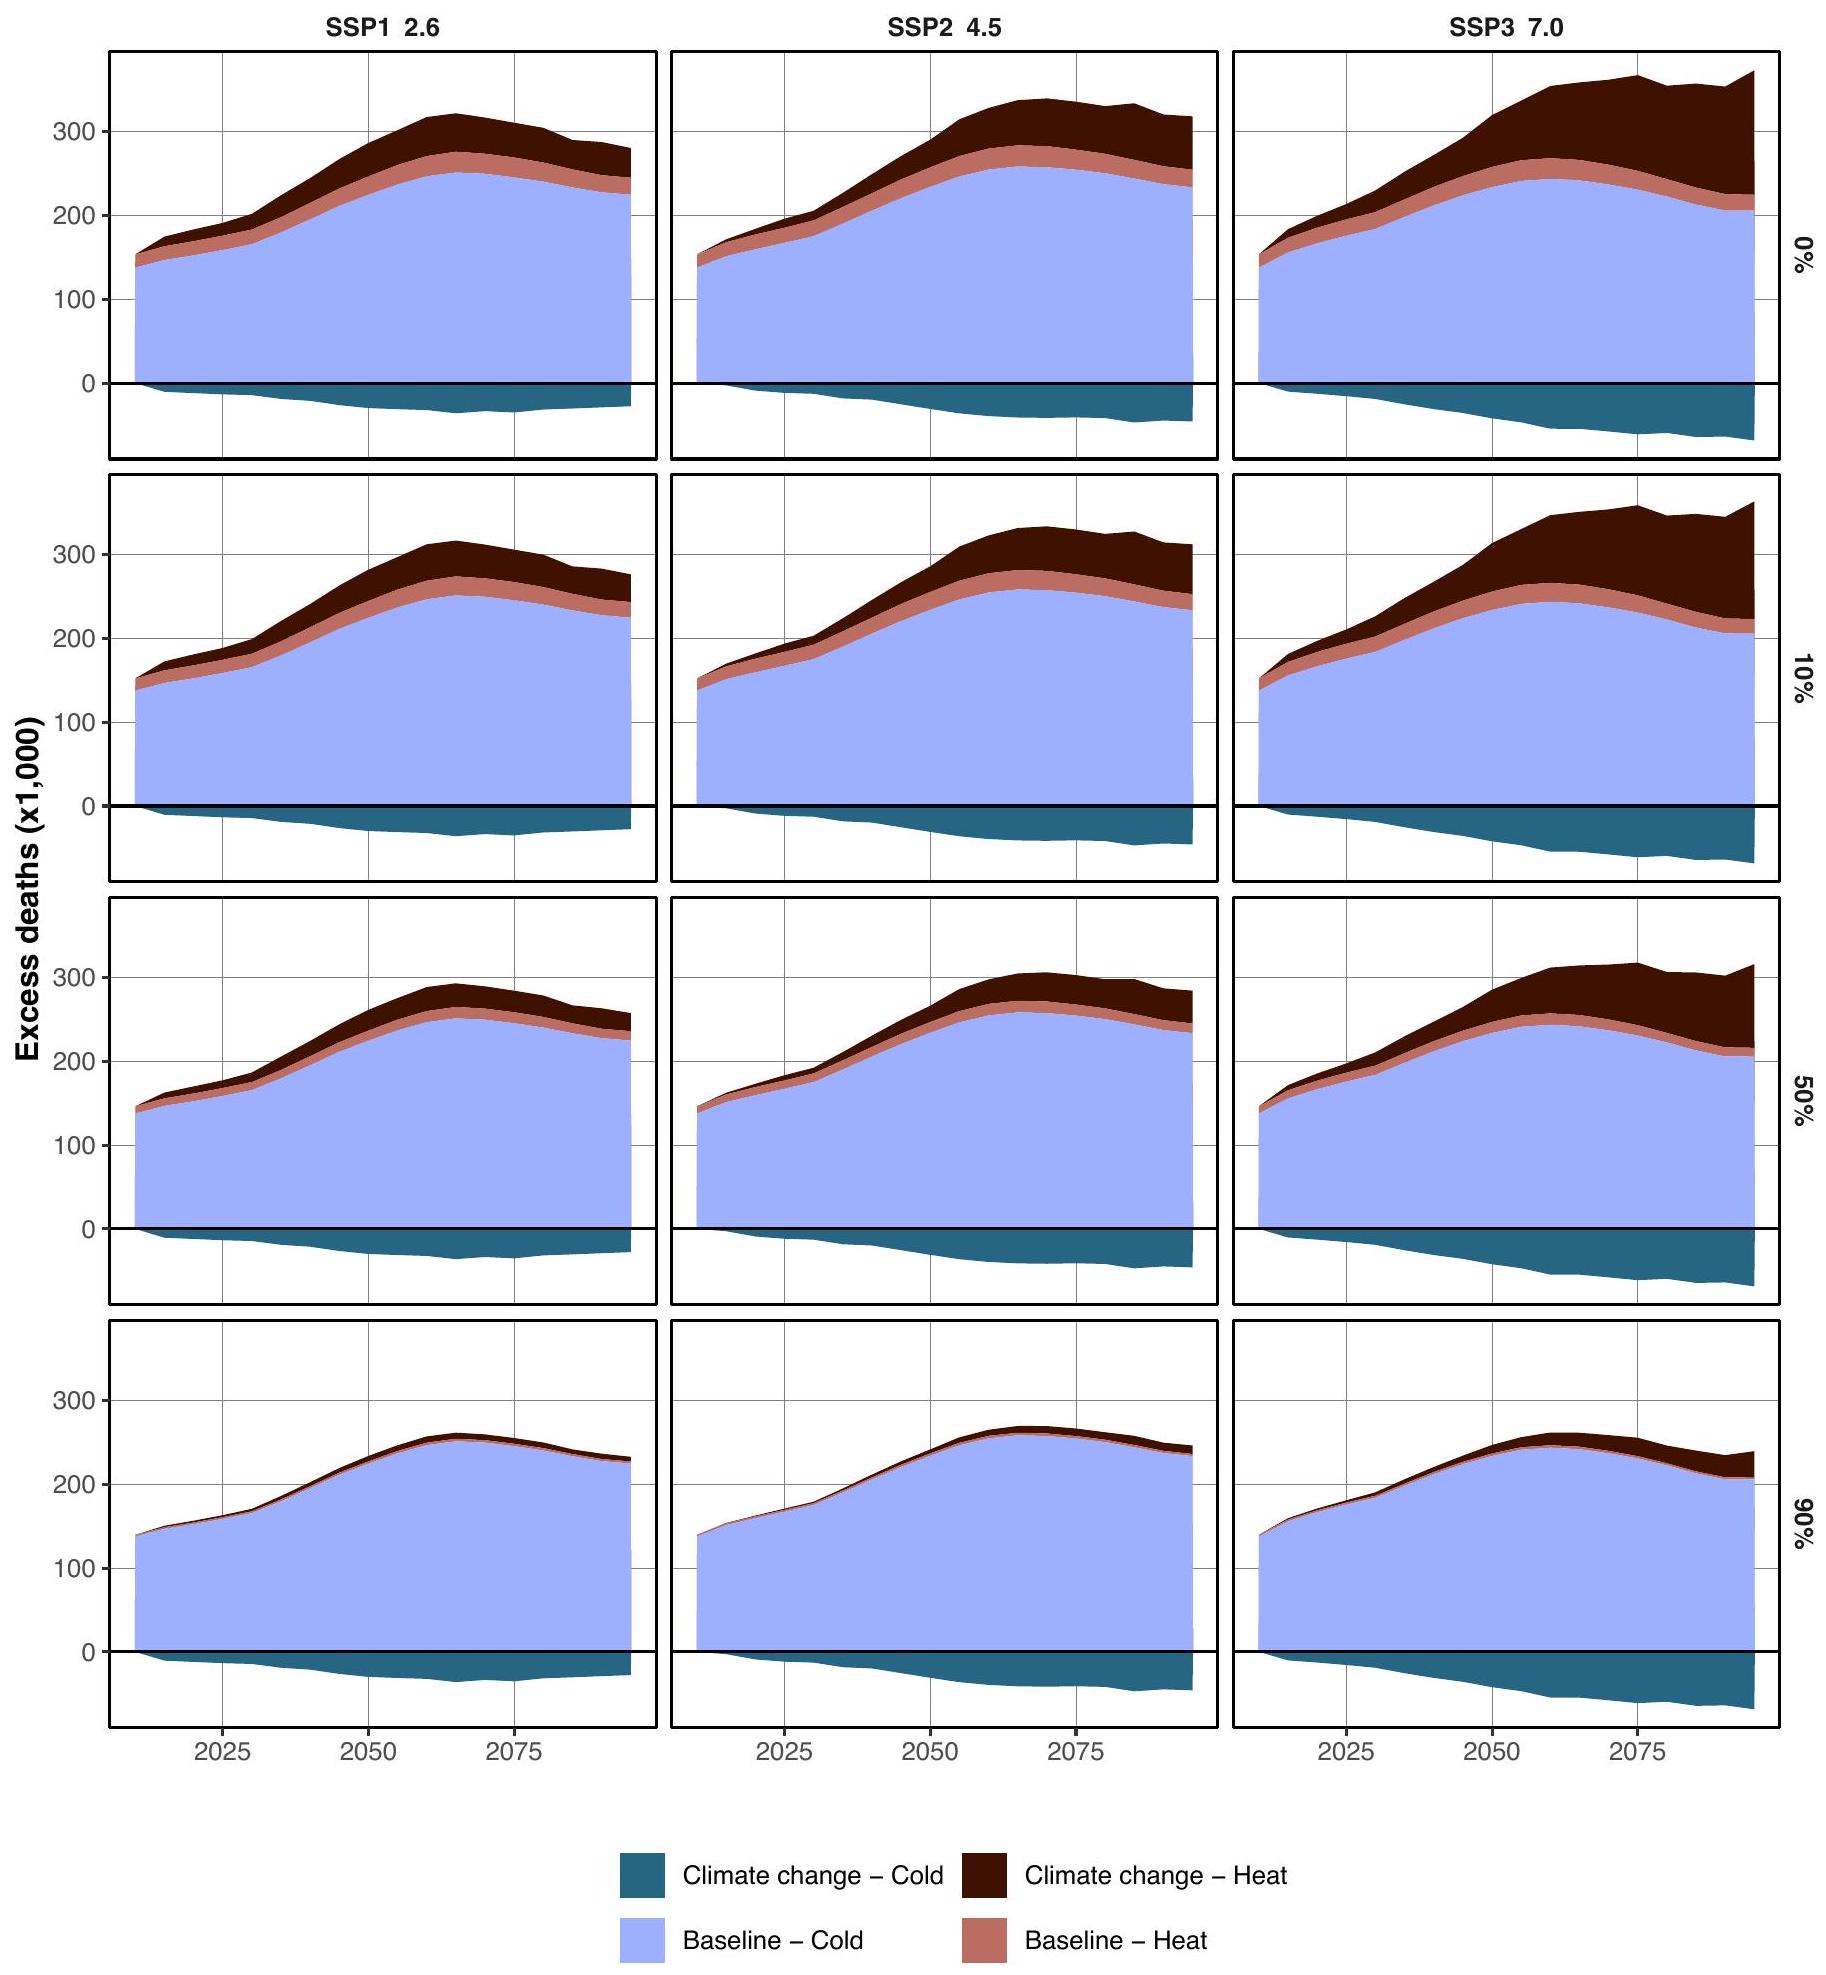
الشكل 4 | توقع التغيرات الصافية في معدلات الوفيات الزائدة المتعلقة بدرجات الحرارة من 2015 إلى 2099 تحت ثلاثة سيناريوهات SSP وأربعة مستويات من التكيف مع الحرارة عبرالمدن. تمثل الخطوط تقدير النقطة المتوسطة بين النماذج المناخية العامة التسعة عشر المدروسة. الأشرطة الشفافة تشير إلىفترات الثقة التجريبية من 500 محاكاة في 19 نموذجًا من نماذج المناخ العالمية. الخطوط السوداء (0% تكيف) تتوافق مع نفس الخطوط السوداء في الشكل 1. قاعدة البياناتيمكن أن تختلف وفقًا للمنطقة الإدارية الأساسية في كل بلد.
في الختام، تتناول هذه الدراسة الأسئلة المفتوحة في وبائيات تغير المناخ، تحديدًا حول ما إذا كان الارتفاع في الوفيات المرتبطة بالحرارة سيتم تعويضه بانخفاض في الوفيات المرتبطة بالبرد، وحول دور التكيف في التأثيرات الصحية المستقبلية المرتبطة بالحرارة.تقدم دراستنا، التي تستند إلى تقييم شامل لـ 854 مدينة أوروبية، دليلًا واضحًا على أن صافي الوفيات سيزداد حتى في ظل أضعف سيناريوهات تغير المناخ. تشير تحليلاتنا إلى أن العبء الصحي الصافي سيزداد بشكل كبير تحت سيناريوهات الاحترار الأكثر تطرفًا، وأنه لا يمكن عكس هذا الاتجاه إلا بمستويات غير معقولة من التكيف في السكان الحضريين. وهذا يوضح الفوائد الصحية المحتملة المرتبطة بتنفيذ استراتيجيات تخفيف صارمة لتقليل انبعاثات غازات الدفيئة بشكل كبير، بالإضافة إلى استراتيجيات التكيف التي تستهدف البلدان والمجموعات السكانية الأكثر ضعفًا.
المحتوى عبر الإنترنت
أي طرق، مراجع إضافية، ملخصات تقارير Nature Portfolio، بيانات المصدر، بيانات موسعة، معلومات إضافية، شكر وتقدير، معلومات مراجعة الأقران؛ تفاصيل مساهمات المؤلفين والمصالح المتنافسة؛ وبيانات توفر البيانات والرموز متاحة علىhttps://doi.org/10.1038/s41591-024-03452-2.
References
Masselot, P. et al. Excess mortality attributed to heat and cold: a health impact assessment study in 854 cities in Europe. Lancet Planet. Health 7, e271-e281 (2023).
Ballester, J. et al. Heat-related mortality in Europe during the summer of 2022. Nat. Med. 29, 1857-1866 (2023).
Zhao, Q. et al. Global, regional, and national burden of mortality associated with non-optimal ambient temperatures from 2000 to 2019: a three-stage modelling study. Lancet Planet. Health 5, e415-e425 (2021).
Gasparrini, A. et al. Mortality risk attributable to high and low ambient temperature: a multicountry observational study. Lancet 386, 369-375 (2015).
Kephart, J. L. et al. City-level impact of extreme temperatures and mortality in Latin America. Nat. Med. 28, 1700-1705 (2022).
García-León, D. et al. Temperature-related mortality burden and projected change in 1368 European regions: a modelling study. Lancet Public Health 9, e644-e653 (2024).
Hayashi, A., Akimoto, K., Sano, F., Mori, S. & Tomoda, T. Evaluation of global warming impacts for different levels of stabilization as a step toward determination of the long-term stabilization target. Clim. Change 98, 87-112 (2010).
Carleton, T. et al. Valuing the global mortality consequences of climate change accounting for adaptation costs and benefits. Q. J. Econ. 137, 2037-2105 (2022).
Vicedo-Cabrera, A. M. et al. The burden of heat-related mortality attributable to recent human-induced climate change. Nat. Clim. Change 11, 492-500 (2021).
Huang, W. T. K. et al. Economic valuation of temperature-related mortality attributed to urban heat islands in European cities. Nat. Commun. 14, 7438 (2023).
Martínez-Solanas, È. et al. Projections of temperature-attributable mortality in Europe: a time series analysis of 147 contiguous regions in 16 countries. Lancet Planet. Health 5, e446-e454 (2021).
de Schrijver, E. et al. Nationwide projections of heat- and cold-related mortality impacts under various climate change and population development scenarios in Switzerland. Environ. Res. Lett. 18, 094010 (2023).
Rai, M. et al. Future temperature-related mortality considering physiological and socioeconomic adaptation: a modelling framework. Lancet Planet. Health 6, e784-e792 (2022).
Huber, V. et al. Temperature-related excess mortality in German cities at and higher degrees of global warming. Environ. Res. 186, 109447 (2020).
Huber, V., Ortiz, C. P., Puyol, D. G., Lange, S. & Sera, F. Evidence of rapid adaptation integrated into projections of temperature-related excess mortality. Environ. Res. Lett. 17, 044075 (2022).
Lay, C. R. et al. City-level vulnerability to temperature-related mortality in the USA and future projections: a geographically clustered meta-regression. Lancet Planet. Health 5, e338-e346 (2021).
Gasparrini, A. et al. Projections of temperature-related excess mortality under climate change scenarios. Lancet Planet. Health 1, e360-e367 (2017).
Fonseca-Rodríguez, O., Adams, R. E., Sheridan, S. C. & Schumann, B. Projection of extreme heat- and cold-related mortality in Sweden based on the spatial synoptic classification. Environ. Res. 239, 117359 (2023).
Dunn, R. J. H., Willett, K. M. & Parker, D. E. Changes in statistical distributions of sub-daily surface temperatures and wind speed. Earth Syst. Dyn. 10, 765-788 (2019).
Nordio, F., Zanobetti, A., Colicino, E., Kloog, I. & Schwartz, J. Changing patterns of the temperature-mortality association by time and location in the US, and implications for climate change. Environ. Int. 81, 80-86 (2015).
Gasparrini, A. et al. Temporal variation in heat-mortality associations: a multicountry study. Environ. Health Perspect. 123, 1200-1207 (2015).
Vicedo-Cabrera, A. M. et al. A multi-country analysis on potential adaptive mechanisms to cold and heat in a changing climate. Environ. Int. 111, 239-246 (2018).
van Vuuren, D. P. et al. A new scenario framework for climate change research: scenario matrix architecture. Clim. Change 122, 373-386 (2014).
O’Neill, B. C. et al. A new scenario framework for climate change research: the concept of shared socioeconomic pathways. Clim. Change 122, 387-400 (2014).
Achebak, H., Devolder, D. & Ballester, J. Trends in temperature-related age-specific and sex-specific mortality from cardiovascular diseases in Spain: a national time-series analysis. Lancet Planet. Health 3, e297-e306 (2019).
Chen, K. et al. Impact of population aging on future temperature-related mortality at different global warming levels. Nat. Commun. 15, 1796 (2024).
Sellers, S. & Ebi, K. L. Climate change and health under the shared socioeconomic pathway framework. Int. J. Environ. Res. Public Health 15, 3 (2017).
Kok, K., Pedde, S., Gramberger, M., Harrison, P. A. & Holman, I. P. New European socio-economic scenarios for climate change research: operationalising concepts to extend the shared socio-economic pathways. Reg. Environ. Change 19, 643-654 (2019).
Eurostat. Urban Europe-Statistics on Cities, Towns and Suburbs (European Union, 2023); https://ec.europa.eu/eurostat/ documents/3217494/7596823/KS-01-16-691-EN-N.pdf/ Oabf140c-ccc7-4a7f-b236-682effcde10f
Masselot, P. & Gasparrini, A. Temperature-related mortality exposure-response functions for 854 cities in Europe. Zenodo https://zenodo.org/records/10288665 (2023).
Kc, S. & Lutz, W. The human core of the shared socioeconomic pathways: population scenarios by age, sex and level of education for all countries to 2100. Glob. Environ. Change 42, 181-192 (2017).
Thrasher, B. et al. NASA Global Daily Downscaled Projections, CMIP6. Sci. Data 9, 262 (2022).
Urban, A., Fonseca-Rodríguez, O., Di Napoli, C. & Plavcová, E. Temporal changes of heat-attributable mortality in Prague, Czech Republic, over 1982-2019. Urban Clim. 44, 101197 (2022).
Ordanovich, D., Tobías, A. & Ramiro, D. Temporal variation of the temperature-mortality association in Spain: a nationwide analysis. Environ. Health 22, 5 (2023).
de Schrijver, E. et al. Nationwide analysis of the heat- and cold-related mortality trends in Switzerland between 1969 and 2017: the role of population aging. Environ. Health Perspect. 130, 037001 (2022).
Åström, D. O., Ebi, K. L., Vicedo-Cabrera, A. M., & Gasparrini, A. Investigating changes in mortality attributable to heat and cold in Stockholm, Sweden. Int. J. Biometeorol. 62, 1777-1780 (2018).
Janoš, T., Ballester, J., Čupr, P. & Achebak, H. Countrywide analysis of heat- and cold-related mortality trends in the Czech Republic: growing inequalities under recent climate warming. Int. J. Epidemiol. 53, dyad141 (2024).
Psistaki, K. et al. Temporal trends in temperature-related mortality and evidence for maladaptation to heat and cold in the Eastern Mediterranean region. Sci. Total Environ. 943, 173899 (2024).
Vardoulakis, S. et al. Comparative assessment of the effects of climate change on heat- and cold-related mortality in the United Kingdom and Australia. Environ. Health Perspect. 122, 1285-1292 (2014).
Taylor, J. et al. Projecting the impacts of housing on temperature-related mortality in London during typical future years. Energy Build. 249, 111233 (2021).
Vecellio, D. J., Kong, Q., Kenney, W. L. & Huber, M. Greatly enhanced risk to humans as a consequence of empirically determined lower moist heat stress tolerance. Proc. Natl Acad. Sci. USA 120, e2305427120 (2023).
He, C. et al. The effects of night-time warming on mortality burden under future climate change scenarios: a modelling study. Lancet Planet. Health 6, e648-e657 (2022).
Barnett, A. G., Tong, S. & Clements, A. C. A. What measure of temperature is the best predictor of mortality? Environ. Res. 110, 604-611 (2010).
Lo, Y. T. E. et al. Optimal heat stress metric for modelling heat-related mortality varies from country to country. Int. J. Climatol. 43, 5553-5568 (2023).
Armstrong, B. et al. The role of humidity in associations of high temperature with mortality: a multiauthor, multicity study. Environ. Health Perspect. 127, 097007 (2019).
Royé, D. et al. Effects of hot nights on mortality in Southern Europe. Epidemiology 32, 487-498 (2021).
Zhang, S. et al. Assessment of short-term heat effects on cardiovascular mortality and vulnerability factors using small area data in Europe. Environ. Int. 179, 108154 (2023).
Gasparrini, A. et al. Small-area assessment of temperature-related mortality risks in England and Wales: a case time series analysis. Lancet Planet. Health 6, e557-e564 (2022).
Ebi, K. L. Greater understanding is needed of whether warmer and shorter winters associated with climate change could reduce winter mortality. Environ. Res. Lett. 10, 111002 (2015).
Publisher’s note Springer Nature remains neutral with regard to jurisdictional claims in published maps and institutional affiliations.
Open Access This article is licensed under a Creative Commons Attribution 4.0 International License, which permits use, sharing, adaptation, distribution and reproduction in any medium or format, as long as you give appropriate credit to the original author(s) and the source, provide a link to the Creative Commons licence, and indicate if changes were made. The images or other third party material in this article are included in the article’s Creative Commons licence, unless indicated otherwise in a credit line to the material. If material is not included in the article’s Creative Commons licence and your intended use is not permitted by statutory regulation or exceeds the permitted use, you will need to obtain permission directly from the copyright holder. To view a copy of this licence, visit http://creativecommons. org/licenses/by/4.0/.
(c) The Author(s) 2025
¹مختبر نمذجة البيئة والصحة (EHM)، قسم الصحة العامة والبيئة والمجتمع، كلية لندن للصحة العامة والطب الاستوائي، لندن، المملكة المتحدة.قسم الاقتصاد، جامعة كا فوسكاري فينيسيا، فينيسيا، إيطاليا.قسم المناخ والصحة البيئية، المعهد النرويجي للصحة العامة، أوسلو، النرويج.محطة دونانا البيولوجية، المجلس الوطني الإسباني للبحوث، إشبيلية، إسبانيا.معهد علم الأوبئة، مركز هيلمهولتز ميونيخ – المركز الألماني لأبحاث الصحة البيئية، نيوهيربرغ، ألمانيا.قسم الجغرافيا، جامعة بورتو، بورتو، البرتغال.قسم النظافة وعلم الأوبئة والإحصاءات الطبية، جامعة أثينا الوطنية وكابوديستريان، أثينا، اليونان.قسم الوبائيات، خدمة الصحة الإقليمية في لاتسيو، ASL ROMA 1، روما، إيطاليا.المفوضية الأوروبية، المركز المشترك للبحوث، إشبيلية، إسبانيا.المفوضية الأوروبية، المركز المشترك للبحوث، إسبرا، إيطاليا.مجموعة البحث البيئي، كلية الصحة العامة، إمبريال كوليدج، لندن، المملكة المتحدة.معهد الطب الاجتماعي والوقائي، جامعة برن، برن، سويسرا.مركز أويشغر لأبحاث تغير المناخ، جامعة برن، برن، سويسرا.مركز CICERO للبحوث المناخية الدولية، أوسلو، النرويج. البريد الإلكتروني: pierre.masselot@lshtm.ac.uk
طرق
منطقة الدراسة والفترة
تم إجراء توقعات تأثير الصحة لـ 854 مدينة مستخرجة من مشروع التدقيق الحضري لليوروستات، والتي تتوافق مع جميع المناطق الحضرية التي يزيد عدد سكانها عن 50,000 نسمة في الاتحاد الأوروبي-27، والنرويج، وسويسرا، والمملكة المتحدة. في المجموع، تمثل هذه المدن الـ 854 حوالي من السكان من الدول الثلاثين المعنية. في التحليل التالي، اعتبرنا الفترة من 2000 إلى 2099 مقسمة إلى قسمين: (1) الفترة التاريخية من 2000 إلى 2014، التي تعتبر نقطة انطلاق وتتناسب تقريبًا مع الفترة التي تم تقدير عوامل الاستجابة البيئية خلالها.; و (2) فترة التوقع من 2015 إلى 2099 التي تتوافق مع فترة السيناريو المستقبلي من المرحلة 6 من CMIP6 (المرجع 52).
سيناريوهات المناخ والسكان والتكيف
لقد اعتبرنا ثلاثة سيناريوهات مجمعة من SSP: (1) SSP1-2.6، الذي يتوافق مع عالم مستدام حيث لا يتجاوز الاحترار العالمي بالكادفي ذروته؛ (2) SSP2-4.5، حيث يتقدم العالم ببطء نحو الاستدامة وحيث من المحتمل أن تظل ظاهرة الاحتباس الحراري دون; و (3) SSP3-7.0، الذي يتوافق مع عالم يشهد زيادة في التنافس الإقليمي حيث تُعطى الأولوية المنخفضة للاستدامة والمخاوف البيئية، والذي من المتوقع أن يؤدي إلى ارتفاع في درجات الحرارة العالمية ربما قريب من أو فوق . في كل سيناريو من سيناريوهات SSP، اعتبرنا أيضًا أربعة سيناريوهات للتكيف مرتبطة بتخفيف مخاطر الحرارة: (1) سيناريو الأساس بدون تخفيف المخاطر؛ (2) تكيف طفيف من بعد الأدلة الأخيرة في ألمانيا; (3) تكيف قوي لـ حيث يتم تقليل خطر الحرارة إلى النصف؛ و (4) تكيف شبه كامل لـ .
مصادر البيانات
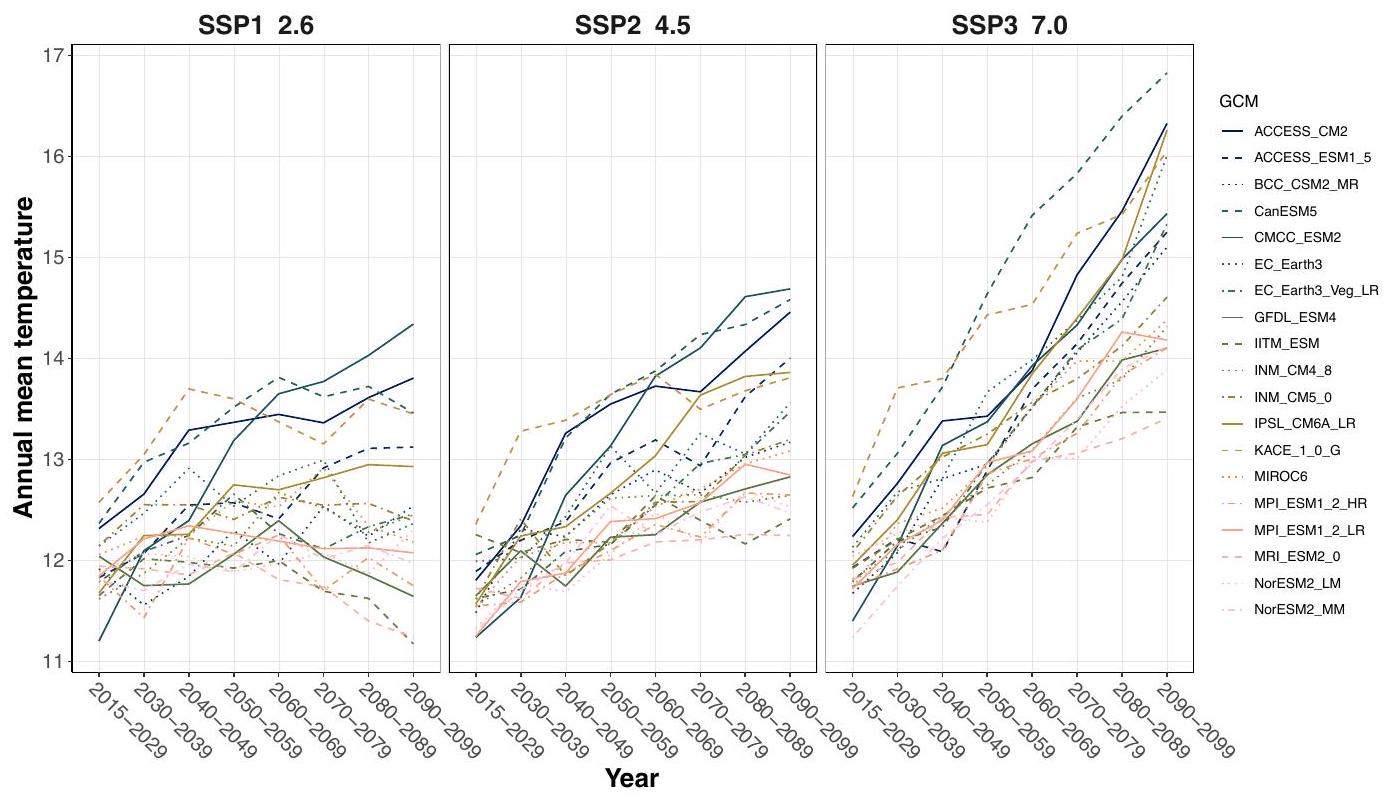
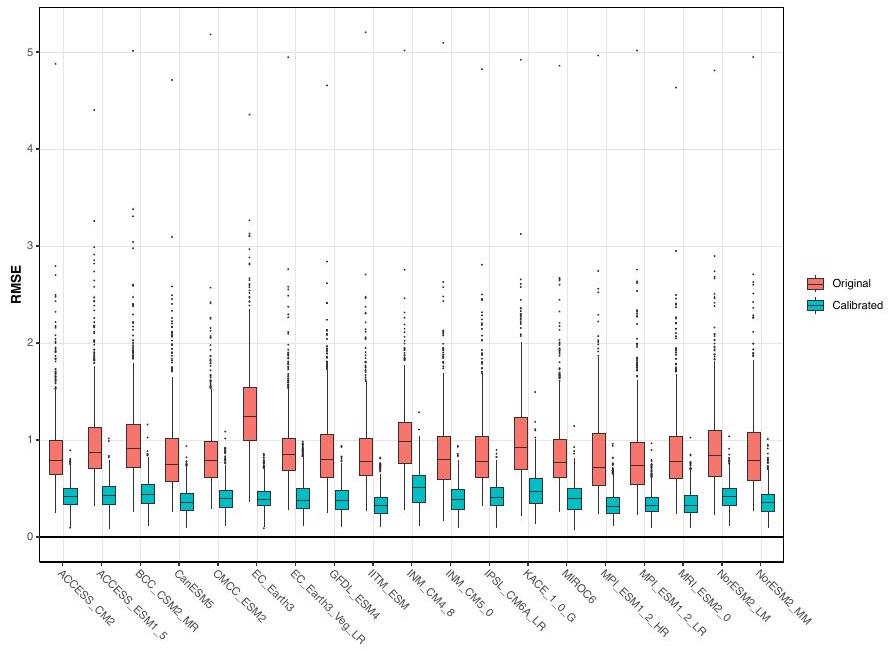
الجدول البياني الموسع 1 يلخص مجموعات البيانات المختلفة المستخدمة في هذه الدراسة. لكل مدينة، قمنا بجمع عوامل الاستجابة البيئية لخمس فئات عمرية.“45-64، 65-74، 75-84 و 85+” من تقييم تأثير الصحة السابقلكل سيناريو SSP ولكل مدينة، قمنا باستخراج توقعات درجات الحرارة اليومية لـ 19 نموذجًا من نماذج المناخ العالمية (GCMs) من قاعدة بيانات توقعات ناسا الأرضية العالمية اليومية المنقحة، والتي هي توقعات مصححة ومنقحة بناءً على مخرجات CMIP6.للمزيد من التوافق بين السلاسل المتوقعة والسلاسل الملاحظة المستخدمة في التقييم التاريخي، قمنا بمعايرتها على سلاسل درجات حرارة الهواء المستخرجة من المكون البري للجيل الخامس من إعادة التحليل الأوروبية (ERA5-Land).باستخدام طريقة تعديل الانحياز والنمذجة الإحصائية التحتية لمشروع مقارنة تأثير القطاعات المتعددة (ISIMIP3BASD)، مع كون فترة المرجع هي فترة تاريخنا 2000-2014. توضح الشكل الإضافي 4 التحسين في التوافق مع البيانات التاريخية بعد المعايرة، بينما يظهر الشكل الإضافي 3 متوسط درجة الحرارة الأوروبية عبر القرن لكل نموذج من نماذج المناخ العامة المدروسة. سنوات تجاوز مستويات الاحترار العالمي عند و تم استخراجها من مستودع GitHub الخاص بمجموعة العمل الأولى لكل نموذج من نماذج المناخ العامة المدروسةلكل نموذج من نماذج المناخ العالمية ومستوى الاحترار، اعتبرنا فترة زمنية مدتها 20 عامًا حول السنة المقدمة.
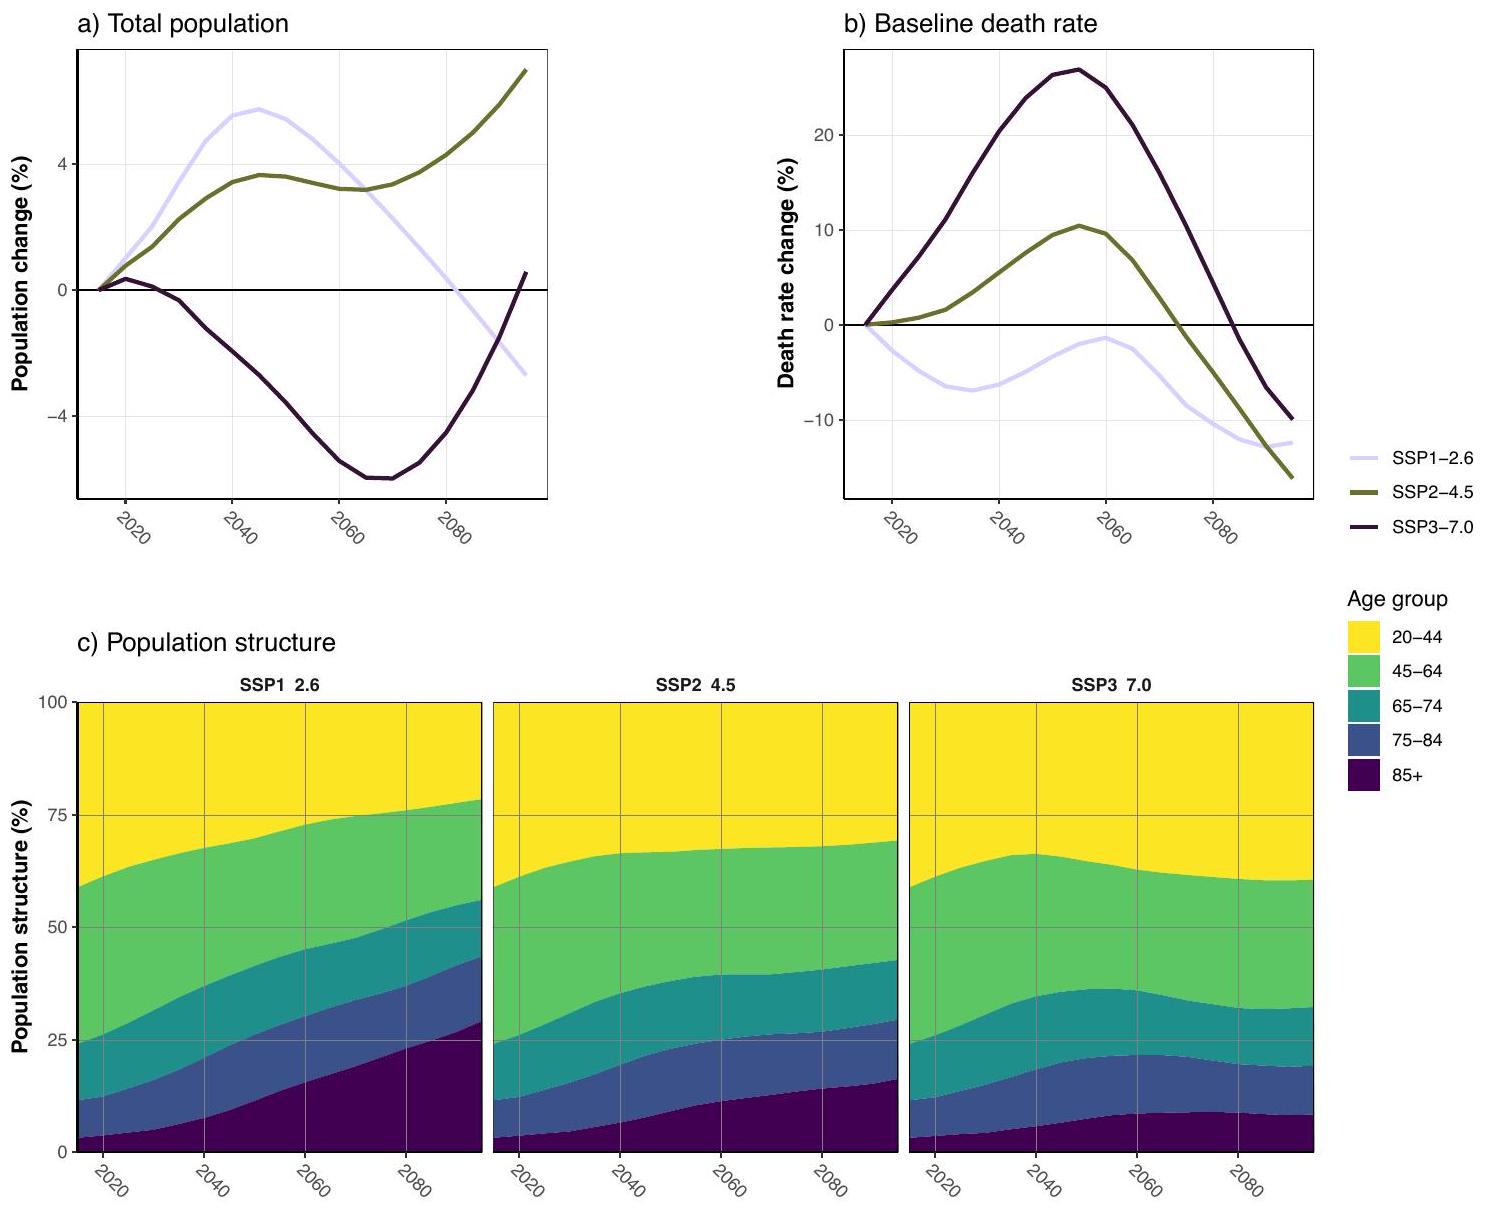
تم استخراج التوقعات السكانية على مستوى الدولة لكل سيناريو SSP من مستكشف بيانات رأس المال البشري لمركز فيتجنشتاين.قمنا باستخراج توقعات السكان ونسب البقاء حسب الفئة العمرية لكل فترة مدتها 5 سنوات. تم حساب الوفيات المتوقعة لفترات 5 سنوات كواحد ناقص نسبة البقاء مضروبة في عدد السكان في بداية فترة الـ 5 سنوات. للحصول على توقعات على مستوى المدينة، قمنا بحساب النسبة بين القيم على مستوى الدولة من مركز فيتجنشتاين في الفترة التاريخية 2010-2014 والقيم التاريخية على مستوى المدينة المستخرجة من يوروستات، وطبقنا عامل التصحيح هذا على التوقعات. افترضت هذه الطريقة أن جميع المدن في الدولة تتبع نفس الاتجاه الديموغرافي. تُظهر الاتجاهات الديموغرافية على المستوى الأوروبي في الشكل التمديدي 5.
التحليل الإحصائي
باستخدام توقعات درجات الحرارة اليومية والسكان والوفيات، والنماذج المذكورة أعلاه، قمنا بتقدير العدد المستقبلي للوفيات. ومعدلات الوفيات باستخدام منهجية النسبة القياسيةباختصار، خلال الفترة بأكملها، تم حساب عدد الوفيات المنسوبة إلى درجة الحرارة (العدد المنسوب (AN)) لكل مدينة.فئة العمرجي سي إمويومباستخدام الصيغة القياسية:
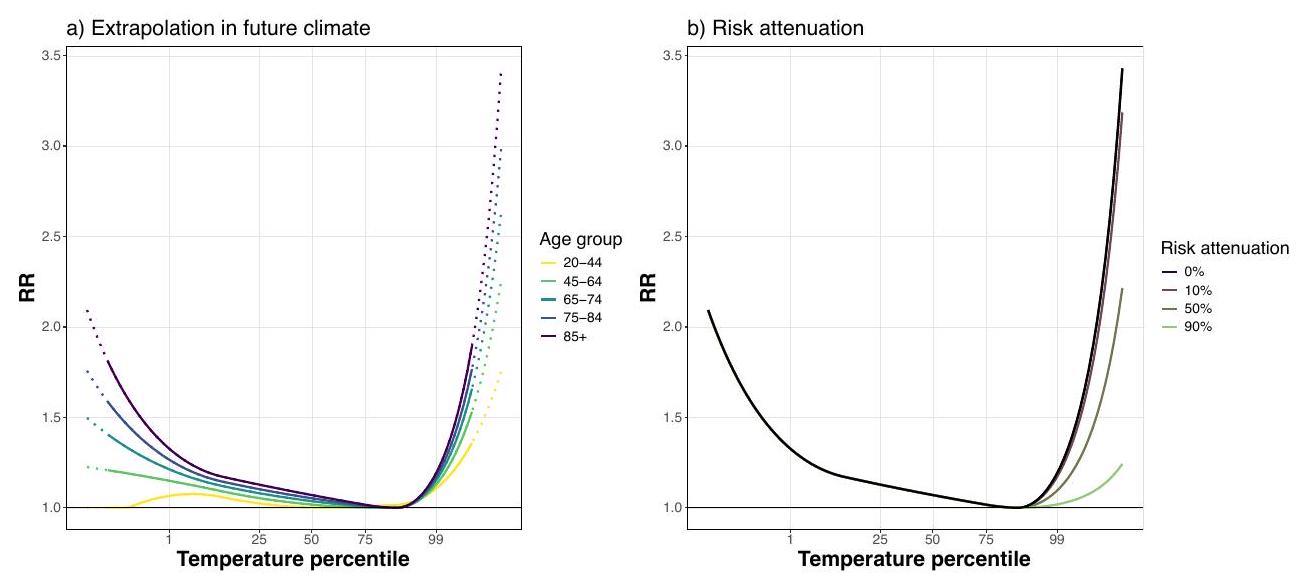
أينهو الخطر النسبي (RR) المرتبط بدرجة الحرارة المتوقعةللمدينةجي سي إمويوممقابل MMT، الذي تم استخراجه من المدينةوفئة العمر-ERF محدد. لدرجات الحرارةخارج النطاق التاريخي، تم إجراء استقراء لوغاريتمي خطيلتجنب العيوب المرتبطة بالتقدير في الأيام الشاذة التي تقع بعيدًا عن النطاق التاريخي المرصود، قمنا بتقييد معدلات المخاطر (RRs) لدرجات الحرارة بحيث لا تقل أبدًا عن 1، كما هو موضح في الشكل 6a من البيانات الموسعة. وهذا مبرر للمدن والفئات العمرية التي تظهر معدلات مخاطر تنخفض قليلاً عند القيم الباردة الشديدة (انظر القسم D من الملحق). هو العدد المتوقع للوفيات في المدينة فئة العمرويوموالتي اعتُبرت ثابتة لكل فترة مدتها 5 سنوات.
بالنسبة لسيناريو تكيف محدد، تم تقليل نسبة المخاطر (RR) لدرجات الحرارة التي تتجاوز الحد الأقصى المحلي والعمري المحدد بمقداركـ:
أينيمثل معدل التوهين المرتبط بكل سيناريو (على سبيل المثال، 0.5 لـالتكيف)نسبة المخاطر في سيناريو ‘عدم التكيف’ الأساسي. يتم توضيح تخفيف المخاطر على المستوى الأوروبي في الشكل 6b من البيانات الموسعة.
للحصول على الوفيات المرتبطة بتغير المناخ، قمنا بحساب ANs كما هو موضح أعلاه تحت سيناريوهين فرعيين. في السيناريو الفرعي ‘الكامل’، تم حساب توقعات تأثير الصحة مباشرة مع الأخذ في الاعتبار توقعات درجة الحرارة والسكان المعايرة كما هو موضح في المعادلة (1). في السيناريو الفرعي الثاني ‘تغيير السكان فقط’، قمنا بإجراء توقعات تأثير الصحة على مجموعة ثانية من توقعات درجة الحرارة.، والتي تم إعادة معايرتها بحيث تظل توزيع درجات الحرارة ثابتًا على مدار الفترة بأكملها. تم إجراء هذه المعايرة من خلال إعادة رسم كميات درجات الحرارة لكل عقد بشكل مستقل إلى توزيع درجات الحرارة التاريخي باستخدام طريقة تصحيح الانحياز ISIMIP3BASD.كما لو أن كل عقد كان فترة تاريخية. سمح ذلك بمحاكاة عالم بدون تغير المناخ ولكن مع نفس الاتجاهات السكانية. حصلنا على التأثير الصافي لتغير المناخ.من خلال تمييز هذين السيناريوهين الفرعيين، مما يسمح بمقارنة عالمين مع أو بدون تغير المناخ ولكن مع نفس السكان بالضبط (الشكل 7 من البيانات الموسعة).
للحصول على القيم المبلغ عنها في المقال، قمنا بعد ذلك بجمع القيم المنسوبة إلى تغير المناخعبر الفئات العمريةولفترات مدتها 5 سنوات وتم حساب القيم الناتجة عبر GCMj. تم الحصول على معدلات الوفيات الزائدة عن طريق قسمة المجموعاتتم الحصول على نتائج مستوى الاحترار من خلال متوسط القيم اليومية عبر فترة 21 عامًا المحيطة بسنة التجاوز لكل نموذج من نماذج المناخ العالمية. ثم تم حساب متوسط النتائج الخاصة بكل نموذج من نماذج المناخ العالمية لكل مستوى من مستويات الاحترار. وهذا يسمح بنقل عدم اليقين في التركيبة السكانية في توقيت التجاوز في النتائج المبلغ عنها لكل مستوى من مستويات الاحترار.
لتمثيل عدم اليقين بشكل أكبر، قمنا بإجراء توقعات تأثير الصحة لكل من نماذج المناخ العامة الـ 19، وذلك لـ 500 تأثيرات استجابة بيئية محاكية مستخرجة من التحليل التاريخي.. تم الحصول على فترات الثقة (CIs) كـ و النسب المئوية لعدد الوفيات المحسوبة البالغ 9,500 ومعدلاتها لكل فترة خمس سنوات ومستوى الاحترار.
ملخص التقرير
معلومات إضافية حول تصميم البحث متاحة في ملخص تقارير مجموعة نيتشر المرتبط بهذه المقالة.
Methodological Manual on City Statistics: 2017 Edition (Publications Office of the European Union, 2017); https://doi.org/ 10.2785/708009
Eyring, V. et al. Overview of the Coupled Model Intercomparison Project Phase 6 (CMIP6) experimental design and organization. Geosci. Model Dev. 9, 1937-1958 (2016).
Muñoz-Sabater, J. et al. ERA5-Land: a state-of-the-art global reanalysis dataset for land applications. Earth Syst. Sci. Data 13, 4349-4383 (2021).
Lange, S. Trend-preserving bias adjustment and statistical downscaling with ISIMIP3BASD (v1.0). Geosci. Model Dev. 12, 3055-3070 (2019).
Lutz, W., Stilianakis, N., Stonawski, M., Goujon, A. & Samir, K. C. Demographic and Human Capital Scenarios for the 21st Century: 2018 Assessment for 201 Countries (Publications Office of the European Union, 2018).
Gasparrini, A. & Leone, M. Attributable risk from distributed lag models. BMC Med. Res. Methodol. 14, 55 (2014).
Vicedo-Cabrera, A. M., Sera, F. & Gasparrini, A. Hands-on tutorial on a modeling framework for projections of climate change impacts on health. Epidemiology 30, 321-329 (2019).
Masselot, P., Mistry, M. N. & Gasparrini, A. Projection of temperature-related mortality in 854 European cities under climate change and adaptation scenarios. Zenodo https://doi. org/10.5281/zenodo. 14004322 (2024).
شكر وتقدير
تم تمويل هذه الدراسة من قبل مشروع الاتحاد الأوروبي هورايزون 2020 EXHAUSTION (رقم المنحة 820655) ومجلس البحوث الطبية في المملكة المتحدة (رقم MR/VO34162/1). تم دعم م.ن.م. و ف.هـ. من قبل المفوضية الأوروبية (H2O2O-MSCA-IF-2O2O) بموجب منح REA رقم 101022870 و 101032087، على التوالي. حصل د.ج.ل.، ج.س.س. و ل.ف. على تمويل من DG REGIO في المفوضية الأوروبية كجزء من مشروع ‘تقييم المخاطر الإقليمية للمناخ في أوروبا (TRACE) (رقم الاتفاق الإداري JRC 36206-2022 // DG REGIO 2022CE160AT126). يقر أ.م.ف.-ك. بالتمويل من المؤسسة الوطنية السويسرية للعلوم (TMSGI3_211626). نشكر جميع المتعاونين الذين شاركوا في المناقشة الأوسع حول هذا المشروع.
مساهمات المؤلفين
قام A.G. و K.A. و A.M.V.-C. بتصميم الدراسة. كتب P.M. و A.G. الشيفرة البرمجية وأجروا التحليل. قام P.M. و M.N.M. بإنتاج واستخراج البيانات اللازمة للتحليل. قاد P.M. و A.G. الكتابة، مع مساهمات منتظمة من M.N.M. و K.A. ساهم جميع المؤلفين في المخطوطة وفي تفسير النتائج. وافق جميع المؤلفين على النسخة النهائية من المخطوطة.
يجب توجيه المراسلات والطلبات للحصول على المواد إلى بيير ماسيلو.
معلومات مراجعة الأقران تشكر مجلة ناتشر ميديسن هشام عجبك والمراجعين الآخرين المجهولين على مساهمتهم في مراجعة هذا العمل. المحرر الرئيسي: مينغ يانغ، بالتعاون مع فريق ناتشر ميديسن.
الشكل البياني الممتد 1 | توقع معدلات الوفيات الزائدة المتعلقة بدرجات الحرارة الصافية من 2015 إلى 2099 تحت ثلاثة سيناريوهات SSP-RCP لكل فئة عمرية. تمثل الخطوط الملونة سيناريوهات SSP، بينما تفصل الألواح سيناريوهات التكيف (الصفوف) والفئات العمرية (الأعمدة).
الشكل البياني الموسع 2 | التأثير الصافي المقدر لتغير المناخ عند كل مستوى من مستويات الاحترار لكل سيناريو تكيف تحت سيناريو SSP3-7.0. تفصل الألواح مستويات الاحترار (الصفوف) وسيناريوهات التكيف (الأعمدة). تشير الألوان الخضراء إلى انخفاض في الوفيات المرتبطة بدرجات الحرارة، بينما تشير الألوان الأرجوانية إلى زيادة.
الشكل البياني الممتد 3 | متوسط درجة حرارة فترة الخمس سنوات الأوروبية لكل نموذج من نماذج المناخ العالمية المدروسة. تمثل الألواح السيناريوهات الثلاثة المدروسة SSP.
الشكل البياني الممتد 4 | جذر متوسط مربع الخطأ لتوزيع درجات الحرارة الكمية لنماذج المناخ العالمية خلال الفترة التاريخية مقارنة بكميات درجات الحرارة المرصودة من ERA5-Land. ‘الأصلي’ يشير إلى سلسلة نماذج المناخ العالمية كما تم استخراجها من توقعات ناسا للأرض العالمية اليومية المنقحة و’المعايرة’
تشير إلى سلسلة GCM المعايرة. يمثل الصندوق النطاق الربعي مع الوسيط كجزء وسطي وتمثل الشعيرات 1.5 مرة من النطاق الربعي، من قيم RMSEs من 854 مدينة وثلاث سيناريوهات SSP.
الشكل البياني الموسعتوقعات التغيرات الديموغرافية على المستوى الأوروبي لكل سيناريو من سيناريوهات التنمية المستدامة. (أ) السكان، (ب) معدلات الوفيات و(ج) هيكل السكان.
الشكل التوضيحي الممتد 6 | متوسط دوال الاستجابة للتعرض الأوروبية (ERF). (أ) دوال الاستجابة للتعرض الخاصة بفئات العمر حيث تمثل الخطوط المنقطة الجزء المستنتج على درجات الحرارة غير الملاحظة وتم تقليم دالة الاستجابة للتعرض لفئة العمر 20-44 إلى 1 للبرد الشديد. (ب) توضيح لتخفيف مخاطر الوفيات المرتبطة بالحرارة على متوسط دالة الاستجابة للتعرض الأوروبية لفئة العمر 85 وما فوق.
الشكل الإضافي 7 | تحليل الوفيات الزائدة السنوية على المستوى الأوروبي. تشمل المكونات الأساسية المستوى التاريخي والتغير الديموغرافي. النتائج المبلغ عنها في النص الرئيسي تت correspond إلى مجموع المنطقتين الداكنتين.
البيانات الموسعة الجدول 1 | قائمة البيانات المستخدمة في توقعات تأثير الصحة
مجموعة بيانات
وصف
مصدر
رابط
مرجع
وظائف استجابة التعرض
وظائف الاستجابة المتعلقة بالتعرض لدرجات الحرارة محددة حسب المدينة والفئة العمرية. مقدمة كمجموعة من المعاملات ومصفوفات التباين والتغاير.
زينودو
https://zenodo.org/records/10288665
31
ERA5-Land
متوسط درجة الحرارة اليومية على مستوى المدينة بين عامي 2000 و 2014.
خدمة كوبرنيكوس لتغير المناخ
https://cds.climate.copernicus.eu/
53
ناسا-نكس-جي دي دي بي-سي إم آي بي 6
محاكاة متوسط درجة الحرارة اليومية من 19 نموذجًا للدورة العامة بين عامي 2000 و2099. تم حسابها على مستوى المدينة.
تسعى Nature Portfolio إلى تحسين إمكانية تكرار العمل الذي ننشره. يوفر هذا النموذج هيكلًا للاتساق والشفافية في التقرير. لمزيد من المعلومات حول سياسات Nature Portfolio، يرجى الاطلاع على سياسات التحرير وقائمة مراجعة سياسة التحرير.
الإحصائيات
لجميع التحليلات الإحصائية، تأكد من أن العناصر التالية موجودة في أسطورة الشكل، أسطورة الجدول، النص الرئيسي، أو قسم الطرق. غير متوفر تم التأكيد
إكس X X □【 X وصف لأي افتراضات أو تصحيحات، مثل اختبارات الطبيعية والتعديل للمقارنات المتعددة □ X وصف كامل للمعلمات الإحصائية بما في ذلك الاتجاه المركزي (مثل المتوسطات) أو تقديرات أساسية أخرى (مثل معامل الانحدار) و التباين (مثل الانحراف المعياري) أو تقديرات مرتبطة بعدم اليقين (مثل فترات الثقة) □ لاختبار الفرضية الصفرية، إحصائية الاختبار (على سبيل المثال، ) مع فترات الثقة، أحجام التأثير، درجات الحرية و القيمة المذكورة أعلاه القيم كقيم دقيقة كلما كان ذلك مناسبًا.
□ لتحليل بايزي، معلومات حول اختيار الأوليات وإعدادات سلسلة ماركوف مونت كارلو
□ س
بالنسبة للتصاميم الهرمية والمعقدة، تحديد المستوى المناسب للاختبارات والتقارير الكاملة عن النتائج
□ تقديرات أحجام التأثير (مثل كوهين’s , بيرسون’s )، موضحًا كيف تم حسابها
تحتوي مجموعتنا على الإنترنت حول الإحصائيات لعلماء الأحياء على مقالات حول العديد من النقاط المذكورة أعلاه.
حجم العينة الدقيقة لكل مجموعة/شرط تجريبي، معطاة كرقم منفصل ووحدة قياس
□ بيان حول ما إذا كانت القياسات قد أُخذت من عينات متميزة أو ما إذا كانت نفس العينة قد تم قياسها عدة مرات
□ الاختبار الإحصائي (الاختبارات) المستخدمة وما إذا كانت أحادية أو ثنائية الجانب
يجب وصف الاختبارات الشائعة فقط بالاسم؛ وصف تقنيات أكثر تعقيدًا في قسم الطرق.
□ وصف لجميع المتغيرات المرافقة التي تم اختبارها
وصف لأي افتراضات أو تصحيحات، مثل اختبارات الطبيعية والتعديل للمقارنات المتعددة
تحتوي مجموعتنا على الإنترنت حول الإحصائيات لعلماء الأحياء على مقالات حول العديد من النقاط المذكورة أعلاه.
البرمجيات والرمز
معلومات السياسة حول توفر كود الكمبيوتر
جمع البيانات
تم جمع البيانات وإعدادها باستخدام 4.4.0. الكود متاح بالكامل في مستودع زينودو (DOI: 10.5281/zenodo.14004322).
تحليل البيانات
بالنسبة للمخطوطات التي تستخدم خوارزميات أو برمجيات مخصصة تكون مركزية للبحث ولكن لم يتم وصفها بعد في الأدبيات المنشورة، يجب أن تكون البرمجيات متاحة للمحررين والمراجعين. نشجع بشدة على إيداع الكود في مستودع مجتمعي (مثل GitHub). راجع إرشادات Nature Portfolio لتقديم الكود والبرمجيات لمزيد من المعلومات.
البيانات
معلومات السياسة حول توفر البيانات
يجب أن تتضمن جميع المخطوطات بيانًا حول توفر البيانات. يجب أن يوفر هذا البيان المعلومات التالية، حيثما كان ذلك مناسبًا:
رموز الوصول، معرفات فريدة، أو روابط ويب لمجموعات البيانات المتاحة للجمهور
وصف لأي قيود على توفر البيانات
بالنسبة لمجموعات البيانات السريرية أو بيانات الطرف الثالث، يرجى التأكد من أن البيان يتماشى مع سياستنا
معلومات السياسة حول الدراسات التي تشمل المشاركين في الأبحاث البشرية والجنس والنوع في البحث.
التقارير حول الجنس والنوع
المعلومات غير متاحة.
خصائص السكان
لم يتم استخدام بيانات بشرية في هذه الدراسة.
التوظيف
غير متاح
الإشراف الأخلاقي
غير متاح
يرجى ملاحظة أنه يجب أيضًا تقديم معلومات كاملة حول موافقة بروتوكول الدراسة في المخطوطة.
التقارير الخاصة بالمجالات
يرجى اختيار الخيار أدناه الذي يناسب بحثك بشكل أفضل. إذا لم تكن متأكدًا، اقرأ الأقسام المناسبة قبل اتخاذ قرارك.
علوم الحياة □ العلوم السلوكية والاجتماعية □ العلوم البيئية والتطورية والبيئية
لنسخة مرجعية من الوثيقة بجميع الأقسام، انظر nature.com/documents/nr-reporting-summary-flat.pdf
تصميم دراسة علوم الحياة
يجب على جميع الدراسات الإفصاح عن هذه النقاط حتى عندما يكون الإفصاح سلبيًا.
حجم العينة
تم اختيار 854 مدينة بناءً على قاعدة بيانات يوروستات للتدقيق الحضري، وتتناسب مع جميع المدن التي يزيد عدد سكانها عن 50,000 نسمة.
استثناءات البيانات
تم استبعاد المدن الخارجية من إسبانيا والبرتغال وفرنسا وآيسلندا بسبب ظروف مناخية مختلفة.
التكرار
9,500 كتركيبة من 19 نموذج دوران عام (GCM) و500 محاكاة من توزيع وظائف الاستجابة للتعرض.
العشوائية
دراسة رصدية على مجموعات بيانات مجمعة.
التعمية
دراسة رصدية على مجموعات بيانات مجمعة.
التقارير للمواد والأنظمة والأساليب المحددة
نحتاج إلى معلومات من المؤلفين حول بعض أنواع المواد والأنظمة التجريبية والأساليب المستخدمة في العديد من الدراسات. هنا، حدد ما إذا كانت كل مادة أو نظام أو طريقة مدرجة ذات صلة بدراستك. إذا لم تكن متأكدًا مما إذا كان عنصر القائمة ينطبق على بحثك، اقرأ القسم المناسب قبل اختيار رد.
Estimating future heat-related and cold-related mortality under climate change, demographic and adaptation scenarios in 854 European cities
Received: 11 March 2024
Accepted: 9 December 2024
Published online: 27 January 2025
A list of authors and their affiliations appears at the end of the paper
Previous health impact assessments of temperature-related mortality in Europe indicated that the mortality burden attributable to cold is much larger than for heat. Questions remain as to whether climate change can result in a net decrease in temperature-related mortality. In this study, we estimated how climate change could affect future heat-related and cold-related mortality in 854 European urban areas, under several climate, demographic and adaptation scenarios. We showed that, with no adaptation to heat, the increase in heat-related deaths consistently exceeds any decrease in cold-related deaths across all considered scenarios in Europe. Under the lowest mitigation and adaptation scenario (SSP3-7.0), we estimate a net death burden due to climate change increasing by and cumulating 2,345,410 ( confidence interval to ) climate change-related deaths between 2015 and 2099. This net effect would remain positive even under high adaptation scenarios, whereby a risk attenuation of is still insufficient to reverse the trend under SSP3-7.0. Regional differences suggest a slight net decrease of death rates in Northern European countries but high vulnerability of the Mediterranean region and Eastern Europe areas. Unless strong mitigation and adaptation measures are implemented, most European cities should experience an increase of their temperature-related mortality burden.
Heat and cold are established health risk factors with a notable impact on mortality across Europe . Estimates generally report that there are roughly ten cold-related deaths for each heat-related death ; some studies suggested that temperature-related mortality in Europe could overall decrease with climate change . However, the balance between heat-related and cold-related mortality varies substantially across regions and over time with climate change. The latter has been associated with an important increase in heat-related deaths in the twenty-first century . Increases in temperature are coupled with growth of urban areas and populations, which enhance exposure to high temperatures . Given the current balance between heat-related
and cold-related mortality burdens, the question of whether a decrease in cold exposure would offset the adverse increase in high heat exposure under climate change remains.
The balance between increased heat-related and decreased cold-related mortality, hereby referred to as the net effect of climate change, can be influenced by many factors. Previous studies provided inconsistent estimations of the net effect, depending on the location and considered scenarios . Indeed, both extreme heat and cold change at different rates with climate change, resulting in narrowing or broadening of the temperature distribution depending on the region . In addition, the exposure-response function (ERF)
for temperature and mortality is complex, being usually U-shaped or J -shaped; it is often steeper on the heat side, although it varies widely between locations . Previous evidence has been either too limited in scope or at a resolution too coarse to provide a representative impact estimate at the European level, while neglecting large portions of the continent, such as the Nordic and Baltic countries, and the Balkans .
An additional complexity of projecting the net effect of climate change lies in the adaptive capacity of European populations. Several studies estimated a substantial attenuation of the heat risk on mortality over the last decades, generally linked to the increase in mean temperature or air conditioning penetration ; however, trends in cold-related mortality risks are less clear . Despite some attempts at integrating heat adaptation into impact projections, through shifts in the minimum mortality temperature (MMT) or risk attenuation , methodologies differ widely and with little empirical evidence to guide the modeling of adaptation. Adaptation to heat is additionally interlinked with underlying demographic and socioeconomic trends that necessitates integration within the shared socioeconomic pathways (SSP) framework . Population aging results in increased vulnerability to both heat and cold , while a general improvement in socioeconomic conditions and health systems under some SSP scenarios could, on the other hand, reduce the overall impacts that heat and cold have on mortality . Given the complexities exposed above, projecting heat-related and cold-related mortality-and related net effect-under future conditions is inherently difficult because it depends on temperature projections from climate models and complex ERFs derived from epidemiological analysis, in addition to varying pathways in socioeconomic, demographic and vulnerability changes. An appropriate assessment of future temperature-related mortality must isolate the specific impact of climate change in a wide range of societal scenarios, while accurately propagating uncertainty from climate and epidemiological models.
In this study, we aimed to provide a comprehensive assessment of the net effect of climate change on temperature-related mortality across 854 cities spanning the whole European continent for the period 2015-2099 and for several levels of warming above preindustrial levels. We sought to provide insights on the expected evolution of the net effect in Europe, and under which conditions an increase of this net effect can be avoided. We evaluated a range of future demographic, mitigation and adaptation scenarios represented by a matrix of three SSP scenarios and four different heat adaptation scenarios.
Results
Study design
We considered three SSP scenarios based on European downscaling of the global scenarios and their effect on temperature-related adaptation : (1) a more equitable Europe committed to sustainability and low-consumption lifestyles resulting in substantial action toward both mitigation and adaptation (SSP1-2.6); (2) a Europe maintaining current inequalities with increased privatization and slow progresses toward mitigation and adaptation (SSP2-4.5); and (3) a Europe with growing instability, regional conflicts and inequalities resulting in little to no effort toward mitigation and adaptation (SSP3-7.0). In each SSP scenario, we initially considered a baseline ‘no adaptation’ scenario in which the vulnerability to heat only depended on the local age distribution to provide a picture of the mortality burden of inaction toward adaptation to heat. We then evaluated a range of adaptation scenarios to heat by attenuating the heat-related mortality risk across ages by and . Attenuating the risk was done by shrinking the local age-specific ERF for temperatures above the MMT toward no association, according to the prespecified level.
This work builds on a published assessment of historical temperature-related mortality in 854 European urban areas with a population above 50,000 , spanning a total of around of 30 European
countries . We used the published city-specific ERFs derived for five age groups , integrated them with projected temperature series and age-specific population and death rates for each SSP scenario, and performed comprehensive health impact projections . In this assessment, we isolated the part specifically attributed to climate change by quantifying the burden as the difference in temperature-related deaths between two subscenarios: (1) ‘full’, in which both temperature and demographic projections are considered; and (2) ‘demographic change only’, in which only the demography changes while the temperature distribution from the period 2000-2014 is kept constant across the century. This allowed us to control for population aging and changes in mortality rates to isolate heat, cold and net effects of climate change directly attributable to the evolution of the temperature distribution and the population adaptation to heat. For each scenario described above, we accounted for climate uncertainty by considering bias-adjusted temperature outputs from 19 general circulation models (GCMs) extracted from the NASA Earth Exchange Global Daily Downscaled Projections database, based on the output from phase 6 of the Coupled Model Intercomparison Project (CMIP6) . We additionally propagated the uncertainty from the epidemiological analysis by performing projections for 500 Monte Carlo simulations of the ERFs . The methodology and the assumptions related to the several scenarios are fully detailed in the online methods and illustrated in the extended data.
European-level results
For the three considered SSP scenarios, the no adaptation scenario resulted in an increase in net temperature-related excess death rates, related to climate change only, across the whole 2015-2099 period (Fig. 1). In all cases, the increase in heat-related deaths outweighed the reduction in cold-related deaths, although the magnitude differed across SSP scenarios. For the SSP1-2.6 scenario, the net increase in temperature-related deaths peaked at 7.6 ( confidence inter- to 25.8) deaths per 100,000 person years in 2060, and decreased slightly afterward. In the SSP2-4.5 scenario, climate change-related death rates plateaued between eight and ten deaths per 100,000 person years from 2070 to the end of the century. In contrast, under the SSP3-7.0 scenario, the net effect substantially increased over the century to reach to 106.0) deaths per 100,000 person years (Table 1). This represents a increase compared to the historical levels of 91 deaths per 100,000 person years . Additionally, while temperature-related deaths almost disappeared for the youngest age groups under the SSP1-2.6 and SSP2-4.5 scenarios, rates consistently increased across all ages under SSP3-7.0 (Extended Data Fig. 1).
Considering the respective climate and demographic trends in each SSP scenario, the numbers above imply that by the end of the century, and with no adaptation, climate change-related annual excess deaths due to nonoptimal temperatures in European urban areas could reach 7,826 ( to 40,142) under SSP1-2.6, 17,856 ( to 60,303 ) under SSP2-4.5 and to 186,821) under SSP3-7.0. Cumulative deaths between 2015 and 2099 would lead to a total burden of to deaths for SSP1-2.6, 636,034 ( to 2,354,502) deaths for SSP2-4.5 and 2,345,410 ( to 4,775,853) deaths for SSP3-7.0.
Under SSP3-7.0, the net effect of climate change also increased exponentially with warming levels (Fig. 2), from to 22.7) deaths per 100,000 person years at , to to 53.4) deaths per 100,000 person years at and to 81.4) deaths per 100,000 person years at . Considering the SSP3 demographic patterns, this amounts to 5,928 deaths per year ( to 38,211 ) at deaths per year ( to 89,321 ) at and 69,857 deaths per year ( to 136,430 ) at .
Fig. 1| Projection of net changes in temperature-related excess death rates from 2015 to 2099 under no adaptation to heat for three SSP scenarios across cities. The lines represent the average point estimate between the 19 GCMs
considered. The transparent ribbons indicate the empirical CIs from the 500 simulations in the 19 GCMs and the shades of gray at the top of each panel indicate the proportion GCM-specific warming level windows covering each year.
Heterogeneity between countries
Results showed disparities between regions in the net effect of climate change, as illustrated by Fig. 2, which focuses on warming levels under SSP3-7.0 with no adaptation to heat. Southern Europe showed the largest net effects, reaching an increase of 124.0 ( to 220.3) deaths per 100,000 person years by the end of the century (Table 1). Eastern and Western Europe presented net effects of climate change close to the European average, with respective increases of 47.0 ( to 146.2 ) and to 98.5 deaths per 100,000 person years by the end of the century. With no adaptation to heat, only in Northern Europe the decrease in cold-related deaths slightly offsets the increase in heat-related deaths with a net effect of -11.8 ( to 2.7 ) death per person years in 2050. This negative net effect was nonetheless more than halved at the end of century to to 38.3 deaths per 100,000 person years in 2095 (Table 1), and at warming compared to (Fig. 2).
There were also disparities within regions. The most affected country was the small island of Malta, showing a net effect of 268.6 ( to 408.6 ) deaths per 100,000 person years in 2095. This was slightly more than twice the value for the Southern region, although with large uncertainty given the small population concerned. Ireland showed the lowest net effect of to 72.5 deaths per 100,000 person years by the end of the century and was the only country with almost no increase at the most extreme climate change scenarios. Romania ( to 210.2 deaths per 100,000 person years in 2095) and Bulgaria ( to 182.6 deaths per 100,000 person years in 2095) showed substantially higher net effects than other Eastern European countries.
Spatial patterns
Maps of excess death rates showed clear geographical patterns between and within countries (Fig. 3). There was a north-south gradient, especially in the Western part where differences were stronger between the UK and Spain, compared to differences between Finland and Bulgaria in the eastern part. There was also a strong Mediterranean effect, with the highest net effects in Eastern Spain, Southern France, Italy and Malta, which corresponds to a region in which the rate of climate warming is faster than in other areas. Finally, a central Europe hotspot can be seen,
encompassing Switzerland and Austria (Fig. 2), as well as southern Germany and Poland.
Geographical disparities were stronger with global warming, especially between and . At a global mean temperature increase of , the net effect substantially increased in Central Europe and reversed to become positive in some Northern cities such as Aberdeen, Stockholm, and Helsinki, and cities in the Balkan states and northern Poland.
The role of heat adaptation
The results shown above provide a picture of the potential impacts of climate change if no action is taken toward adaptation to heat and cold. However, there is compelling evidence of variations in vulnerability to temperature across time, in particular to heat . This section explores how the balance between increased heat-related and decreased cold-related mortality would change with various degrees of adaptation to heat.
Figure 4 shows that a attenuation of the heat-related mortality risk would result in little decrease in the net effect of climate change across all SSP scenarios. A stronger attenuation of would be enough to result in a net decrease in temperature-related mortality under SSP12.6 and SSP2-4.5, especially in the second half of the century, but not under SSP3-7.0. In the latter scenario and with an attenuation of , the excess death rate would still increase by to 63.2 deaths per 100,000 person years (19.6% of the historical level) by the end of the century. This corresponds to a cumulative toll of 268,100 deaths ( to ). An almost complete attenuation of the heat-related mortality risk ( decrease) would be needed to obtain a complete reversal of the net effect of climate change. This reversal is substantial under SSP3-7.0, in which the cold-related burden would greatly decrease.
There were important spatial disparities in the effects of adaptation (Extended Data Fig. 2). Specifically, even with a attenuation of the heat-related mortality risk, most of the Mediterranean region would still experience a substantial increase in temperature-related mortality under SSP3-7.0. At high warming levels ( and ), this persistence of a net effect above zero also spread to central Europe and some parts of the Balkans. Finally, it is worth noting that, even with an attenuation
Table 1 | Excess death rates (per 100,000 person years) in each country, region and at the European level for the periods 2050-2054 and 2095-2099 under the SSP3-7.0 and no adaptation to heat scenarios
2050-2054
2095-2099
Cold
Heat
Net effect
Cold
Heat
Net effect
Finland
-19.0 (-44.5 to 5.4)
9.1 (-5.9 to 44.2)
-9.8 (-24.9 to 8.2)
-31.2 (-49.5 to -11.7)
28.2 (3.6 to 83.0)
-2.9 (-29.6 to 40.7)
Norway
-12.4 (-30.5 to -1.7)
6.2 (-0.4 to 22.8)
-6.2 (-18.0 to 6.7)
-23.1 (-39.9 to -9.0)
19.2 (2.2 to 58.6)
-3.9 (-24.1 to 27.9)
Estonia
-23.4 (-51.1 to 7.1)
9.7 (-9.6 to 50.8)
-13.7 (-33.6 to 9.9)
-42.8 (-70.0 to -15.2)
33.4 (3.9 to 103.2)
-9.4 (-45.0 to 47.5)
Sweden
-16.5 (-35.8 to -1.5)
9.2 (-0.3 to 40.5)
-7.3 (-21.2 to 13.0)
-26.9 (-42.5 to -10.9)
28.5 (3.2 to 79.5)
1.6 (-25.6 to 42.5)
Latvia
-30.2 (-65.3 to -1.7)
16.5 (-7.0 to 70.1)
-13.6 (-41.2 to 24.0)
-55.6 (-94.7 to -20.0)
46.8 (4.5 to 150.3)
-8.8 (-60.4 to 79.3)
Denmark
-17.7 (-44.3 to -1.8)
8.4 (-4.4 to 40.3)
-9.4 (-28.0 to 17.6)
-29.5 (-51.3 to -7.8)
25.0 (2.4 to 78.3)
-4.5 (-33.8 to 34.8)
Lithuania
-28.0 (-62.5 to -1.9)
15.5 (-6.2 to 66.9)
-12.5 (-39.9 to 25.1)
-48.8 (-86.4 to -17.8)
41.5 (4.2 to 136.8)
-7.3 (-54.5 to 75.2)
UK
-22.9 (-49.0 to -8.5)
10.9 (0.7 to 44.1)
-12.1 (-30.2 to 2.0)
-36.0 (-60.2 to -13.7)
31.2 (4.3 to 88.9)
-4.9 (-38.0 to 41.7)
Ireland
-33.5 (-67.7 to -13.3)
10.9 (0.4 to 48.9)
-22.6 (-51.9 to 6.1)
-56.5 (-95.2 to -21.8)
38.6 (2.4 to 143.7)
-18.0 (-65.7 to 72.5)
Northern
-22.5 (-47.8 to -8.9)
10.7 (1.0 to 44.6)
-11.8 (-27.3 to 2.7)
-35.9 (-58.9 to -13.9)
31.0 (4.9 to 85.3)
-4.9 (-34.8 to 38.3)
Netherlands
-16.1 (-36.7 to -1.1)
17.6 (2.2 to 62.2)
1.4 (-20.3 to 33.1)
-25.7 (-45.2 to -9.5)
44.4 (8.6 to 117.2)
18.7 (-21.3 to 81.7)
Germany
-16.4 (-35.8 to -2.9)
22.8 (1.8 to 64.2)
6.5 (-11.0 to 39.4)
-26.6 (-43.4 to -11.7)
63.6 (12.7 to 138.9)
36.9 (-8.1 to 103.8)
Belgium
-15.9 (-34.7 to -2.1)
17.7 (1.8 to 58.6)
1.8 (-17.2 to 30.3)
-27.0 (-44.5 to -11.1)
49.6 (10.6 to 117.2)
22.6 (-17.1 to 80.9)
Luxembourg
-11.3 (-26.2 to -2.3)
16.2 (0.9 to 51.3)
4.9 (-10.3 to 34.4)
-22.2 (-39.1 to -9.4)
54.8 (8.7 to 129.7)
32.6 (-10.3 to 105.1)
Austria
-15.3 (-33.2 to -2.8)
27.2 (3.8 to 73.6)
11.8 (-10.4 to 52.8)
-27.5 (-44.9 to -13.0)
91.0 (26.0 to 212.7)
63.5 (4.7 to 176.2)
France
-17.9 (-35.8 to -5.8)
27.2 (8.4 to 60.2)
9.3 (-11.4 to 40.8)
-28.4 (-44.2 to -15.5)
66.4 (15.2 to 134.8)
38.0 (-8.0 to 101.2)
Switzerland
-13.6 (-35.4 to -1.8)
25.0 (4.7 to 70.5)
11.4 (-8.1 to 51.3)
-24.0 (-40.8 to -11.1)
77.9 (18.6 to 169.2)
53.9 (-0.6 to 140.8)
Western
-16.7 (-35.1 to -3.9)
23.9 (5.7 to 61.7)
7.1 (-9.8 to 35.3)
-27.2 (-42.6 to -13.9)
63.2 (18.4 to 132.7)
36.0 (-3.9 to 98.5)
Poland
-28.3 (-60.1 to -5.5)
24.8 (-0.8 to 74.8)
-3.5 (-28.4 to 36.6)
-49.9 (-79.0 to -23.0)
80.7 (20.7 to 191.4)
30.8 (-27.9 to 130.9)
Czechia
-22.6 (-48.2 to -6.3)
20.5 (2.0 to 56.6)
-2.1 (-22.8 to 30.4)
-42.7 (-68.8 to -21.1)
74.1 (18.0 to 177.9)
31.5 (-22.5 to 126.9)
Slovakia
-23.4 (-49.6 to -6.6)
23.5 (2.8 to 63.8)
0.1 (-21.3 to 33.6)
-42.2 (-65.8 to -20.5)
82.1 (22.9 to 194.3)
39.9 (-13.0 to 143.0)
Hungary
-25.9 (-55.5 to -9.5)
24.8 (2.7 to 66.9)
-1.1 (-22.9 to 30.9)
-49.2 (-75.9 to -24.7)
94.4 (28.2 to 216.2)
45.2 (-13.1 to 156.7)
Romania
-33.0 (-60.7 to -11.0)
39.4 (10.3 to 100.2)
6.5 (-22.5 to 48.6)
-63.7 (-95.7 to -28.5)
144.7 (30.5 to 284.4)
81.0 (-5.3 to 210.2)
Bulgaria
-30.2 (-54.2 to -6.3)
41.8 (11.0 to 89.3)
11.6 (-17.7 to 48.6)
-51.3 (-78.4 to -22.7)
129.9 (25.6 to 244.4)
78.6 (-1.3 to 182.6)
Eastern
-28.4 (-56.9 to -9.5)
28.9 (6.0 to 73.9)
0.4 (-22.4 to 29.8)
-51.7 (-79.2 to -25.4)
98.7 (30.5 to 207.4)
47.0 (-9.4 to 146.2)
Slovenia
-21.2 (-47.6 to -5.9)
44.5 (12.5 to 96.1)
23.2 (-6.4 to 62.4)
-34.5 (-56.9 to -16.3)
117.3 (42.1 to 234.4)
82.8 (14.9 to 193.3)
Croatia
-29.1 (-59.9 to -11.5)
54.9 (18.4 to 107.2)
25.8 (-7.5 to 67.3)
-53.7 (-83.3 to -27.0)
154.4 (60.7 to 280.7)
100.7 (17.2 to 217.6)
Italy
-36.5 (-68.7 to -17.8)
91.2 (36.4 to 165.8)
54.7 (5.6 to 117.4)
-52.7 (-78.1 to -29.4)
191.3 (69.3 to 312.3)
138.6 (25.0 to 247.3)
Portugal
-59.1 (-93.8 to -18.2)
76.3 (19.0 to 161.5)
17.3 (-40.6 to 91.2)
-78.1 (-119.7 to -31.7)
135.0 (34.0 to 252.9)
56.9 (-22.2 to 166.7)
Spain
-33.8 (-56.3 to -12.2)
80.3 (24.6 to 143.8)
46.4 (-0.1 to 108.4)
-50.1 (-75.3 to -24.0)
175.6 (64.4 to 305.7)
125.5 (31.2 to 249.6)
Greece
-30.7 (-56.0 to -5.1)
64.2 (20.4 to 131.3)
33.6 (-7.3 to 93.3)
-55.8 (-83.5 to -29.7)
175.4 (57.2 to 274.1)
119.6 (23.7 to 214.7)
Malta
-53.2 (-77.0 to -23.3)
200.8 (50.6 to 316.5)
147.6 (26.0 to 265.7)
-73.3 (-103.7 to -36.9)
341.8 (103.1 to 489.1)
268.6 (63.7 to 408.6)
Cyprus
-31.2 (-48.9 to -5.9)
63.9 (20.0 to 122.8)
32.7 (-3.2 to 84.2)
-61.2 (-87.5 to -32.5)
155.5 (59.9 to 262.8)
94.3 (9.3 to 197.8)
Southern
-36.3 (-60.5 to -15.7)
82.2 (31.5 to 141.5)
45.9 (3.5 to 99.6)
-53.8 (-78.1 to -27.8)
177.8 (65.5 to 284.7)
124.0 (27.9 to 220.3)
Total
-25.0 (-47.3 to -11.4)
36.7 (15.4 to 75.0)
11.7 (-6.6 to 35.5)
-38.9 (-58.0 to -21.1)
84.3 (27.5 to 156.0)
45.4 (0.7 to 106.0)
The table includes cold-related and heat-related deaths and the net effect. The parentheses indicate the empirical CIs. Values in bold indicate regional and European totals.
of , a warming of above preindustrial levels would still result in a net effect above zero for some cities in the Mediterranean region (among which Rome, Naples, Barcelona and Marseille).
Discussion
In this study, we provided an extensive comparative assessment of changes in heat-related and cold-related mortality under several climate change, demographic and adaptation scenarios across European urban areas. We showed that, with no adaptation to heat, temperature-related mortality is expected to increase in response to climate change across scenarios and periods for most of Europe. For the selected 854 cities, this net effect could lead to a increase in temperature-related death
rates and a total cumulative death toll exceeding 2,000,000 toward the end of the century if the world were to follow the most extreme SSP3-7.0 scenario. These figures could be reduced by at least two-thirds under the more stringent SSP1-2.6 and SSP2-4.5 scenarios, outlining the health benefits of implementing strong policies to reduce carbon emissions.
Our results reveal that in the absence of ambitious mitigation, a substantial and rather implausible level of adaptation to heat is necessary to prevent increases in temperature-related mortality. Indeed, in the SSP3-7.0 scenario, a risk attenuation of is not enough to compensate for the increased heat exposure due to climate change, in particular around the Mediterranean region, Central Europe and the Balkans. To put it in context, a reduction in heat-related risk is
Fig. 2 | Country-level net changes in temperature-related excess death rates for each warming level under scenario SSP3-7.0 and no adaptation to heat.
The bars and points represent the average point estimate between the 19 GCMs considered. The horizontal bars indicate the empirical CIs of the net effect
from the 500 simulations in the 19 GCMs . The diamond-shaped points indicate regional and European-level values. The temperature range is defined relative to the MMT.
higher than what has been observed in Germany and roughly in line with the decrease in risk that has been estimated in Spain over the last few decades (between and . Higher heat risk attenuation has only been estimated in countries like Sweden and Switzerland, which generally contribute much less to the heat-related mortality burden . On the other hand, countries such as the UK, Greece and Czechia have seen little to no risk attenuation . This shows that even ambitious objectives regarding adaptation can hardly replace feasible mitigation targets, especially in the context of SSP3-7.0.
Our results highlight spatial disparities with substantial future impacts in Mediterranean countries, and lower net increases of temperature-related deaths in Eastern and Western countries. Malta is the only country with estimated net increases in temperature-related deaths across all SSP and heat adaptation scenarios; the net death rate increase could reach up to almost of the early twenty-first century levels. The increase could also exceed in Spain. In addition to the Mediterranean region, we observed hotspots of net increases in temperature-related deaths in South-East European countries like Romania and Bulgaria, and in Central Europe, including Austria, southern Germany and southern Poland. These areas also correspond to countries in which the necessary heat risk attenuation to avoid an increase in temperature-related mortality is the highest. Overall, the spatial disparities were in line with several country-specific assessments , although a one-to-one comparison is difficult given the differences in methodologies. Our results also suggest a slight net reduction in temperature-related deaths in northernmost countries, in line with previous assessments . This slight reduction in temperature-related mortality nonetheless showed a reversal toward the end of the century and under more extreme warming scenarios, and was massively outweighed by the large increases in the rest of Europe.
The general net increase in temperature-related deaths across scenarios is related to the general shape of ERFs for temperature-related mortality . Indeed, in most locations, the curve is steeper at high
temperatures than at low temperatures, implying that for a given shift in the temperature distribution, the mortality risk increases more rapidly on the hot part than it decreases in the cold part. This also explains the necessity for strong attenuation of the heat risk in adapting to climate change. This effect is further exacerbated by the location of the local minimum mortality percentile as locations with smaller net increases tend to be locations with higher minimum mortality percentiles . The reported net increase was not related to population increase and aging as our results report the difference between scenarios with and without climate change under the same population and baseline mortality trajectories. Therefore, we controlled for demographic effects by comparing two identical populations.
This study has several strengths. First, it provides a comprehensive assessment of the urban population in Europe, extending the analysis to several regions excluded in previous studies , such as the Scandinavian, Balkan and Eastern European countries, for which evidence was almost nonexistent. Second, it made use of ERFs specific to each city and five age groups, whereas previous studies considered a single ERF for all ages or a single split at 75 years . This allowed a better representation of the baseline death rate and vulnerability to heat and cold under different possible scenarios. Third, this study explored how the future net effect of climate would evolve under several scenarios of heat risk attenuation across age groups, thus providing a wider picture of climate change impacts. Finally, this study also improves the accuracy of the representation of the burden attributed to climate change and in the uncertainty of projections. This is done by isolating the specific impact of climate change on future mortality while still considering future demographic changes, unlike previous studies in which demographic change was either not accounted for or entangled with climate change in the results . As climate projections are an inherently uncertain exercise, these projections integrated uncertainties both from the ERF estimation with the Monte Carlo simulations, and from the climate projections with many GCMs covering a wide range of possible futures (as illustrated in Extended Data Fig. 3).
Fig. 3 | City-level net changes in temperature-related excess death rates for each warming level under scenario SSP3-7.0 and no adaption to heat. Panels from topleft to bottom-right represent warming levels from to . Green colors indicate a decrease of temperature-related excess deaths while purple colors indicate an increase.
This uncertainty is also reflected in the results at warming levels, where previous studies chose a single year for each level .
Despite the consideration of several risk attenuation scenarios, this work is limited in its treatment of adaptation. Indeed, scenarios were defined as general adaptation without geographical difference in the level of risk attenuation and without pointing to specific drivers of adaptation. The drivers of adaptation considered vary between studies, including temperature , gross domestic product , air conditioning or housing ; no consensual methodology on integrating these drivers in the adaptation has emerged. Additional local climate characteristics, such as humidity or specific hot night events, could impact temperature-related mortality and are sometimes integrated into projections . However, epidemiological evidence is uncertain concerning the role of such factors
and has suggested that nonlinear ERFs of mean temperature with adequate lags capture most of temperature-related mortality . Therefore, future research should focus on understanding the interplay between local factors and vulnerability to temperature and on how to quantitatively integrate it into projections of temperaturerelated mortality.
The geographical scale of analysis at the city level considered in the present study also comes with some limitations. Indeed, temperatures and vulnerability to heat and cold can vary widely in a city , which means that the most extreme temperatures and their potential impact may be smoothed out by our study design. Further projections accounting for within cities differences in exposure are needed to shed light on the most vulnerable populations. In addition, the definition of city, although extracted from Eurostat, which is a standardized
Fig. 4 | Projection of net changes in total temperature-related excess death rates from 2015 to 2099 under three SSP scenarios and four heat adaptation levels across cities. The lines represent the average point estimate between
the 19 GCMs considered. The transparent ribbons indicate the empirical CIs from the 500 simulations in the 19 GCMs. The black lines (0% adaptation) correspond to the same black lines in Fig. 1.
database , can differ according to the underlying administrative area in each country.
In conclusion, this study addresses open questions in climate change epidemiology, specifically about whether the increase in heat-related mortality will be offset by a reduction in cold-related deaths, and about the role of adaptation in future temperature-related health impacts . Our study, based on a comprehensive assessment of 854 European cities, provides clear evidence that net mortality will increase even under the mildest climate change scenario. Our analyses indicate that the net health burden will increase substantially under more extreme warming scenarios and that this trend can only be reversed with implausibly strong levels of adaptation in urban populations. This demonstrates the potential health benefits linked with the implementation of stringent mitigation strategies to strongly reduce greenhouse gas emissions as well as adaptation strategies aimed at the most vulnerable countries and population groups.
Online content
Any methods, additional references, Nature Portfolio reporting summaries, source data, extended data, supplementary information, acknowledgements, peer review information; details of author contributions and competing interests; and statements of data and code availability are available at https://doi.org/10.1038/s41591-024-03452-2.
References
Masselot, P. et al. Excess mortality attributed to heat and cold: a health impact assessment study in 854 cities in Europe. Lancet Planet. Health 7, e271-e281 (2023).
Ballester, J. et al. Heat-related mortality in Europe during the summer of 2022. Nat. Med. 29, 1857-1866 (2023).
Zhao, Q. et al. Global, regional, and national burden of mortality associated with non-optimal ambient temperatures from 2000 to 2019: a three-stage modelling study. Lancet Planet. Health 5, e415-e425 (2021).
Gasparrini, A. et al. Mortality risk attributable to high and low ambient temperature: a multicountry observational study. Lancet 386, 369-375 (2015).
Kephart, J. L. et al. City-level impact of extreme temperatures and mortality in Latin America. Nat. Med. 28, 1700-1705 (2022).
García-León, D. et al. Temperature-related mortality burden and projected change in 1368 European regions: a modelling study. Lancet Public Health 9, e644-e653 (2024).
Hayashi, A., Akimoto, K., Sano, F., Mori, S. & Tomoda, T. Evaluation of global warming impacts for different levels of stabilization as a step toward determination of the long-term stabilization target. Clim. Change 98, 87-112 (2010).
Carleton, T. et al. Valuing the global mortality consequences of climate change accounting for adaptation costs and benefits. Q. J. Econ. 137, 2037-2105 (2022).
Vicedo-Cabrera, A. M. et al. The burden of heat-related mortality attributable to recent human-induced climate change. Nat. Clim. Change 11, 492-500 (2021).
Huang, W. T. K. et al. Economic valuation of temperature-related mortality attributed to urban heat islands in European cities. Nat. Commun. 14, 7438 (2023).
Martínez-Solanas, È. et al. Projections of temperature-attributable mortality in Europe: a time series analysis of 147 contiguous regions in 16 countries. Lancet Planet. Health 5, e446-e454 (2021).
de Schrijver, E. et al. Nationwide projections of heat- and cold-related mortality impacts under various climate change and population development scenarios in Switzerland. Environ. Res. Lett. 18, 094010 (2023).
Rai, M. et al. Future temperature-related mortality considering physiological and socioeconomic adaptation: a modelling framework. Lancet Planet. Health 6, e784-e792 (2022).
Huber, V. et al. Temperature-related excess mortality in German cities at and higher degrees of global warming. Environ. Res. 186, 109447 (2020).
Huber, V., Ortiz, C. P., Puyol, D. G., Lange, S. & Sera, F. Evidence of rapid adaptation integrated into projections of temperature-related excess mortality. Environ. Res. Lett. 17, 044075 (2022).
Lay, C. R. et al. City-level vulnerability to temperature-related mortality in the USA and future projections: a geographically clustered meta-regression. Lancet Planet. Health 5, e338-e346 (2021).
Gasparrini, A. et al. Projections of temperature-related excess mortality under climate change scenarios. Lancet Planet. Health 1, e360-e367 (2017).
Fonseca-Rodríguez, O., Adams, R. E., Sheridan, S. C. & Schumann, B. Projection of extreme heat- and cold-related mortality in Sweden based on the spatial synoptic classification. Environ. Res. 239, 117359 (2023).
Dunn, R. J. H., Willett, K. M. & Parker, D. E. Changes in statistical distributions of sub-daily surface temperatures and wind speed. Earth Syst. Dyn. 10, 765-788 (2019).
Nordio, F., Zanobetti, A., Colicino, E., Kloog, I. & Schwartz, J. Changing patterns of the temperature-mortality association by time and location in the US, and implications for climate change. Environ. Int. 81, 80-86 (2015).
Gasparrini, A. et al. Temporal variation in heat-mortality associations: a multicountry study. Environ. Health Perspect. 123, 1200-1207 (2015).
Vicedo-Cabrera, A. M. et al. A multi-country analysis on potential adaptive mechanisms to cold and heat in a changing climate. Environ. Int. 111, 239-246 (2018).
van Vuuren, D. P. et al. A new scenario framework for climate change research: scenario matrix architecture. Clim. Change 122, 373-386 (2014).
O’Neill, B. C. et al. A new scenario framework for climate change research: the concept of shared socioeconomic pathways. Clim. Change 122, 387-400 (2014).
Achebak, H., Devolder, D. & Ballester, J. Trends in temperature-related age-specific and sex-specific mortality from cardiovascular diseases in Spain: a national time-series analysis. Lancet Planet. Health 3, e297-e306 (2019).
Chen, K. et al. Impact of population aging on future temperature-related mortality at different global warming levels. Nat. Commun. 15, 1796 (2024).
Sellers, S. & Ebi, K. L. Climate change and health under the shared socioeconomic pathway framework. Int. J. Environ. Res. Public Health 15, 3 (2017).
Kok, K., Pedde, S., Gramberger, M., Harrison, P. A. & Holman, I. P. New European socio-economic scenarios for climate change research: operationalising concepts to extend the shared socio-economic pathways. Reg. Environ. Change 19, 643-654 (2019).
Eurostat. Urban Europe-Statistics on Cities, Towns and Suburbs (European Union, 2023); https://ec.europa.eu/eurostat/ documents/3217494/7596823/KS-01-16-691-EN-N.pdf/ Oabf140c-ccc7-4a7f-b236-682effcde10f
Masselot, P. & Gasparrini, A. Temperature-related mortality exposure-response functions for 854 cities in Europe. Zenodo https://zenodo.org/records/10288665 (2023).
Kc, S. & Lutz, W. The human core of the shared socioeconomic pathways: population scenarios by age, sex and level of education for all countries to 2100. Glob. Environ. Change 42, 181-192 (2017).
Thrasher, B. et al. NASA Global Daily Downscaled Projections, CMIP6. Sci. Data 9, 262 (2022).
Urban, A., Fonseca-Rodríguez, O., Di Napoli, C. & Plavcová, E. Temporal changes of heat-attributable mortality in Prague, Czech Republic, over 1982-2019. Urban Clim. 44, 101197 (2022).
Ordanovich, D., Tobías, A. & Ramiro, D. Temporal variation of the temperature-mortality association in Spain: a nationwide analysis. Environ. Health 22, 5 (2023).
de Schrijver, E. et al. Nationwide analysis of the heat- and cold-related mortality trends in Switzerland between 1969 and 2017: the role of population aging. Environ. Health Perspect. 130, 037001 (2022).
Åström, D. O., Ebi, K. L., Vicedo-Cabrera, A. M., & Gasparrini, A. Investigating changes in mortality attributable to heat and cold in Stockholm, Sweden. Int. J. Biometeorol. 62, 1777-1780 (2018).
Janoš, T., Ballester, J., Čupr, P. & Achebak, H. Countrywide analysis of heat- and cold-related mortality trends in the Czech Republic: growing inequalities under recent climate warming. Int. J. Epidemiol. 53, dyad141 (2024).
Psistaki, K. et al. Temporal trends in temperature-related mortality and evidence for maladaptation to heat and cold in the Eastern Mediterranean region. Sci. Total Environ. 943, 173899 (2024).
Vardoulakis, S. et al. Comparative assessment of the effects of climate change on heat- and cold-related mortality in the United Kingdom and Australia. Environ. Health Perspect. 122, 1285-1292 (2014).
Taylor, J. et al. Projecting the impacts of housing on temperature-related mortality in London during typical future years. Energy Build. 249, 111233 (2021).
Vecellio, D. J., Kong, Q., Kenney, W. L. & Huber, M. Greatly enhanced risk to humans as a consequence of empirically determined lower moist heat stress tolerance. Proc. Natl Acad. Sci. USA 120, e2305427120 (2023).
He, C. et al. The effects of night-time warming on mortality burden under future climate change scenarios: a modelling study. Lancet Planet. Health 6, e648-e657 (2022).
Barnett, A. G., Tong, S. & Clements, A. C. A. What measure of temperature is the best predictor of mortality? Environ. Res. 110, 604-611 (2010).
Lo, Y. T. E. et al. Optimal heat stress metric for modelling heat-related mortality varies from country to country. Int. J. Climatol. 43, 5553-5568 (2023).
Armstrong, B. et al. The role of humidity in associations of high temperature with mortality: a multiauthor, multicity study. Environ. Health Perspect. 127, 097007 (2019).
Royé, D. et al. Effects of hot nights on mortality in Southern Europe. Epidemiology 32, 487-498 (2021).
Zhang, S. et al. Assessment of short-term heat effects on cardiovascular mortality and vulnerability factors using small area data in Europe. Environ. Int. 179, 108154 (2023).
Gasparrini, A. et al. Small-area assessment of temperature-related mortality risks in England and Wales: a case time series analysis. Lancet Planet. Health 6, e557-e564 (2022).
Ebi, K. L. Greater understanding is needed of whether warmer and shorter winters associated with climate change could reduce winter mortality. Environ. Res. Lett. 10, 111002 (2015).
Publisher’s note Springer Nature remains neutral with regard to jurisdictional claims in published maps and institutional affiliations.
Open Access This article is licensed under a Creative Commons Attribution 4.0 International License, which permits use, sharing, adaptation, distribution and reproduction in any medium or format, as long as you give appropriate credit to the original author(s) and the source, provide a link to the Creative Commons licence, and indicate if changes were made. The images or other third party material in this article are included in the article’s Creative Commons licence, unless indicated otherwise in a credit line to the material. If material is not included in the article’s Creative Commons licence and your intended use is not permitted by statutory regulation or exceeds the permitted use, you will need to obtain permission directly from the copyright holder. To view a copy of this licence, visit http://creativecommons. org/licenses/by/4.0/.
(c) The Author(s) 2025
Pierre Masselot , Malcolm N. Mistry , Shilpa Rao , Veronika Huber , Ana Monteiro , Evangelia Samoli , Massimo Stafoggia , Francesca de’Donato , David Garcia-Leon , Juan-Carlos Ciscar , Luc Feyen (D , Alexandra Schneider , Klea Katsouyanni , Ana Maria Vicedo-Cabrera , Kristin Aunan & Antonio Gasparrini
¹Environment & Health Modelling (EHM) Lab, Department of Public Health Environment & Society, London School of Hygiene & Tropical Medicine, London, UK. Department of Economics, Ca’ Foscari University of Venice, Venice, Italy. Division of Climate and Environmental Health, Norwegian Institute of Public Health, Oslo, Norway. Doñana Biological Station, Spanish National Research Council, Seville, Spain. Institute of Epidemiology, Helmholtz Zentrum München – German Research Center for Environmental Health, Neuherberg, Germany. Department of Geography, University of Porto, Porto, Portugal. Department of Hygiene, Epidemiology and Medical Statistics, National and Kapodistrian University of Athens, Athens, Greece. Department of Epidemiology, Lazio Regional Health Service, ASL ROMA 1, Rome, Italy. European Commission, Joint Research Centre, Seville, Spain. European Commission, Joint Research Centre, Ispra, Italy. Environmental Research Group, School of Public Health, Imperial College, London, UK. Institute of Social and Preventive Medicine, University of Bern, Bern, Switzerland. Oeschger Center for Climate Change Research, University of Bern, Bern, Switzerland. CICERO Center for International Climate Research, Oslo, Norway. e-mail: pierre.masselot@lshtm.ac.uk
Methods
Study area and period
The health impact projections were performed for 854 cities extracted from Eurostat’s Urban Audit project , corresponding to all urban areas with more than 50,000 inhabitants in the EU-27, Norway, Switzerland and the UK. In total, these 854 cities account for around of the population from the 30 countries considered. In the following analysis, we considered the period 2000-2099 separated in two: (1) the historical period from 2000 to 2014, which serves as a baseline and roughly corresponds to the period on which the ERFs were estimated ; and (2) the projection period 2015-2099 corresponding to the future scenario period from the phase 6 of the CMIP6 (ref. 52).
Climate, demographic and adaptation scenarios
We considered three combined SSP scenarios: (1) SSP1-2.6, which corresponds to a sustainable world in which global warming barely exceeds at its peak; (2) SSP2-4.5, in which the world progresses slowly toward sustainability and in which global warming probably remains below ; and (3) SSP3-7.0, which corresponds to a world with increased regional rivalries in which sustainability and environmental concerns are given low priority and which should result in a global warming probably close to or above . In each SSP scenario, we additionally considered four adaptation scenarios associated with risk attenuation of heat: (1) the baseline scenario with no risk attenuation; (2) a slight adaptation of after recent evidence in Germany ; (3) a strong adaptation of in which the risk of heat is halved; and (4) an almost complete adaptation of .
Data sources
Extended Data Table 1 summarizes the different datasets used in this study. For each city, we retrieved ERFs for five age groups ( , 45-64, 65-74, 75-84 and 85+) from a previous health impact assessment . For each SSP scenario and each city, we extracted projections of daily temperatures for 19 GCMs from the NASA Earth Exchange Global Daily Downscaled Projections database, which are downscaled and bias-corrected projections based on CMIP6 outputs . To further align projected series to the observed series used in the historical assessment, we calibrated them on air temperature series extracted from the land component of the fifth generation of European ReAnalysis (ERA5-Land) using the Inter-Sectoral Impact Model Intercomparison Project bias adjustment and statistical downscaling (ISIMIP3BASD) method , with the reference period being our historical period 20002014. Extended Data Fig. 4 illustrates the improved alignment with historical data after calibration, while Extended Data Fig. 3 shows the European average temperature across the century for each considered GCM. Years of exceed ance of global warming levels at and were extracted from the Working Group I Atlas GitHub Repository for each considered GCM . For each GCM and warming level, we considered a 20-year window around the provided year.
For each SSP, demographic projections at the country level were extracted from the Wittgenstein Centre Human Capital Data Explorer . We extracted projections of population and survival ratios according to age group for each 5 -year period. Projected deaths for 5 -year periods were computed as one minus the survival ratio multiplied by the population at the start of the 5 -year period. To obtain city-level projections, we computed the ratio between country-level values from the Wittgenstein Centre in the historical period 2010-2014 and city-level historical values extracted from Eurostat, and applied this correction factor to the projections. This method assumed that all cities in a country follow the same demographic trend. European-level demographic trends are shown in Extended Data Fig. 5.
Statistical analysis
Using projections of daily temperature, population and deaths, and the ERFs described above, we estimated the future number of deaths
and death rates using a standard attribution methodology . Briefly, for the whole period, the number of deaths attributed to temperature (attributable number (AN)) were computed for each city , age group , GCM and day using the standard formula:
where is the relative risk (RR) associated with the projected temperature for city , GCM and day versus the MMT, which was extracted from the city and age group -specific ERF. For temperatures outside the historical range, log-linear extrapolation was performed . To avoid artifacts linked to extrapolation to outlier days far below the historically observed range, we constrained the RRs of temperature to never be below 1 , as illustrated in Extended Data Fig. 6a. This is warranted for cities and age groups displaying slightly decreasing RRs at extreme cold values (see section D of the appendix). is the projected number of deaths for city , age group and day , which were considered constant for each 5-year period.
For a specific adaptation scenario, the RR of temperatures above the local and age-specific MMT was attenuated by a factor as:
where represents the attenuation rate associated with each scenario (for example, 0.5 for adaptation) and the RR in the baseline ‘no adaptation’ scenario. Risk attenuation at the European level is illustrated in Extended Data Fig. 6b.
To obtain climate change-related deaths, we computed ANs as described above under two subscenarios. In the ‘full’ subscenario, health impact projections were computed directly considering calibrated temperature and demographic projections as described by equation (1). In a second ‘demographic change-only’ subscenario, we performed health impact projections on a second set of temperature projections , which were recalibrated such that the temperature distribution remained constant across the whole period. This recalibration was made by independently remapping the temperature quantiles of each decade to the historical temperature distribution using the ISIMIP3BASD bias correction method as if each decade was the historical period. This allowed to simulate a world without climate change but with the same demographic trends. We obtained the net effect of climate change by differentiating these two subscenarios, thus allowing a comparison of two worlds with or without climate change but with the exact same populations (Extended Data Fig. 7).
To obtain the values reported in the article, we then summed climate change-attributed across age group and for 5-year periods and averaged the resulting values across GCMj. Excess death rates were obtained by dividing the aggregated by the projected population for the corresponding period. Warming level results were obtained by averaging daily values across the 21-year window surrounding the year of exceedance for each GCM. GCM-specific results for each warming level were then averaged. This allows transferring uncertainty of the demography at the timing of exceedance in the reported results for each warming level.
To further represent uncertainty, for each of the 19 GCMs, we performed health impact projections for 500 simulated ERFs extracted from the historical analysis . CIs were then obtained as the and quantiles of the 9,500 computed death numbers and rates for each 5-year period and warming level.
Reporting summary
Further information on research design is available in the Nature Portfolio Reporting Summary linked to this article.
Data availability
The data used in this study and the results are publicly available in a Zenodo repository (https://doi.org/10.5281/zenodo.14004322) . The repository includes the code used to extract all raw data for the analysis;links to individual data sources are indicated in Extended Data Table1. Briefly, the city-level and age-group-level ERFs were extracted from a Zenodo repository (https://zenodo.org/records/10288665). Observed temperature series were obtained from the Copernicus Climate Change Service (https://cds.climate.copernicus.eu/), the projected temperature series from the NASA Center for Climate Simulations (https://www. nccs.nasa.gov/services/data-collections/land-based-products/ nex-gddp-cmip6), demographic projections from the Wittgenstein Centre Human Capital Data Explorer (https://dataexplorer.wittgen-steincentre.org/wcde-v2/) and the years of exceedance for global warming levels from the Intergovernmental Panel on Climate Change Working Group I Atlas GitHub Repository (https://github.com/ SantanderMetGroup/ATLAS/tree/main/warming-levels).
Methodological Manual on City Statistics: 2017 Edition (Publications Office of the European Union, 2017); https://doi.org/ 10.2785/708009
Eyring, V. et al. Overview of the Coupled Model Intercomparison Project Phase 6 (CMIP6) experimental design and organization. Geosci. Model Dev. 9, 1937-1958 (2016).
Muñoz-Sabater, J. et al. ERA5-Land: a state-of-the-art global reanalysis dataset for land applications. Earth Syst. Sci. Data 13, 4349-4383 (2021).
Lange, S. Trend-preserving bias adjustment and statistical downscaling with ISIMIP3BASD (v1.0). Geosci. Model Dev. 12, 3055-3070 (2019).
Lutz, W., Stilianakis, N., Stonawski, M., Goujon, A. & Samir, K. C. Demographic and Human Capital Scenarios for the 21st Century: 2018 Assessment for 201 Countries (Publications Office of the European Union, 2018).
Gasparrini, A. & Leone, M. Attributable risk from distributed lag models. BMC Med. Res. Methodol. 14, 55 (2014).
Vicedo-Cabrera, A. M., Sera, F. & Gasparrini, A. Hands-on tutorial on a modeling framework for projections of climate change impacts on health. Epidemiology 30, 321-329 (2019).
Masselot, P., Mistry, M. N. & Gasparrini, A. Projection of temperature-related mortality in 854 European cities under climate change and adaptation scenarios. Zenodo https://doi. org/10.5281/zenodo. 14004322 (2024).
Acknowledgements
This study was funded by the European Union Horizon 2020 Project EXHAUSTION (grant no. 820655) and the UK Medical Research Council (no. MR/VO34162/1). M.N.M. and V.H. were supported by the European Commission (H2O2O-MSCA-IF-2O2O) under REA grant nos. 101022870 and 101032087, respectively. D.G.L., J.C.C. and L.F. received funding from DG REGIO of the European Commission as part of the ‘Territorial Risk Assessment of Climate in Europe (TRACE) project (administrative agreement no. JRC 36206-2022 // DG REGIO 2022CE160AT126). A.M.V.-C. acknowledges funding from the Swiss National Science Foundation (TMSGI3_211626). We thank all the collaborators who participated in the wider discussion about this project.
Author contributions
A.G., K.A. and A.M.V.-C. conceived the study. P.M. and A.G. wrote the computer code and conducted the analysis. P.M. and M.N.M. produced and extracted the data necessary for the analysis. P.M. and A.G. led the writing, with regular inputs from M.N.M. and K.A. All authors contributed to the manuscript and to the interpretation of the results. All authors approved the final version of the manuscript.
Correspondence and requests for materials should be addressed to Pierre Masselot.
Peer review information Nature Medicine thanks Hicham Achebak and the other, anonymous reviewer(s) for their contribution to the peer review of this work. Primary Handling Editor: Ming Yang, in collaboration with the Nature Medicine team.
Extended Data Fig. 1 | Projection of net temperature-related excess death rates from 2015 to 2099 under three SSP-RCP scenarios for each age group. Colored lines represent SSP scenarios, while panels separate adaptation scenarios (rows) and age groups (columns).
Extended Data Fig. 2 | Estimated net effect of climate change at each warming level for each adaptation scenario under the SSP3-7.0 scenario. Panels separate warming levels (rows) and adapation scenarios (columns). Green colors indicate a decrease of net temperature-related deaths, and purple colors an increase.
Extended Data Fig. 3 | Average European five-year period temperature for each considered GCM. Panels represent the three considered SSP scenarios.
Extended Data Fig. 4 | RMSE of the temperature distribution quantiles for the GCMs on the historical period compared to the observed ERA5-Land temperature quantiles. ‘Original’ refers to the GCM series as extracted from the NASA Earth Exchange Global Daily Downscaled Projections and ‘Calibrated’
refers to the calibrated GCM series. The box represents the interquartile range with the median as the middle segment and whiskers represent 1.5 times the interquartile range, of the RMSEs from the 854 cities and three SSP scenarios.
Extended Data Fig. Projections of the European level demographic changes for each SSP. (a) population, (b) death rates and (c) population structure.
Extended Data Fig. 6 | Average European exposure-response functions (ERF). (a) Age groups specific ERFs where dotted lines represent the extrapolated part on unobserved temperatures and the 20-44 ERF is truncated to 1 for extreme cold. (b) Illustration of heat-related mortality risk attenuation on the average European exposure-response function for age-group 85 +.
Extended Data Fig. 7 | Decomposition of annual total excess deaths at the European level. The baseline components include the historical level and demographic change. Results reported in the main text correspond to the sum of the two dark colored areas.
Extended Data Table 1 | List of data used in the health impact projections
Dataset
Description
Source
URL
Ref
Exposure response functions
City and age group-specific temperature-related exposure-response functions. Provided as a set of coefficients and variance covariance matrices.
Zenodo
https://zenodo.org/records/1028 8665
31
ERA5-Land
Daily mean temperature averaged at the city level between 2000 and 2014.
Copernicus Climate Change Service
https://cds.climate.copernicus.e u/
53
NASA-NEX-GDDP-CMIP6
Daily mean temperature simulations from 19 General Circulation Models between 2000 and 2099. Averaged at the city level.
Nature Portfolio wishes to improve the reproducibility of the work that we publish. This form provides structure for consistency and transparency in reporting. For further information on Nature Portfolio policies, see our Editorial Policies and the Editorial Policy Checklist.
Statistics
For all statistical analyses, confirm that the following items are present in the figure legend, table legend, main text, or Methods section.
n/a
Confirmed
X
X
X
□【
X
description of any assumptions or corrections, such as tests of normality and adjustment for multiple comparisons
□ X
A full description of the statistical parameters including central tendency (e.g. means) or other basic estimates (e.g. regression coefficient) AND variation (e.g. standard deviation) or associated estimates of uncertainty (e.g. confidence intervals)
□ For null hypothesis testing, the test statistic (e.g. ) with confidence intervals, effect sizes, degrees of freedom and value noted Give values as exact values whenever suitable.
□ For Bayesian analysis, information on the choice of priors and Markov chain Monte Carlo settings
□ X
For hierarchical and complex designs, identification of the appropriate level for tests and full reporting of outcomes
□ Estimates of effect sizes (e.g. Cohen’s , Pearson’s ), indicating how they were calculated
Our web collection on statistics for biologists contains articles on many of the points above.
The exact sample size for each experimental group/condition, given as a discrete number and unit of measurement
□ A statement on whether measurements were taken from distinct samples or whether the same sample was measured repeatedly
□ The statistical test(s) used AND whether they are one- or two-sided
Only common tests should be described solely by name; describe more complex techniques in the Methods section.
□ A description of all covariates tested
A description of any assumptions or corrections, such as tests of normality and adjustment for multiple comparisons
Our web collection on statistics for biologists contains articles on many of the points above.
Software and code
Policy information about availability of computer code
Data collection
Data have been collected and prepared using 4.4.0. The code is fully available in a in a Zenodo repository (DOI: 10.5281/zenodo.14004322).
Data analysis
For manuscripts utilizing custom algorithms or software that are central to the research but not yet described in published literature, software must be made available to editors and reviewers. We strongly encourage code deposition in a community repository (e.g. GitHub). See the Nature Portfolio guidelines for submitting code & software for further information.
Data
Policy information about availability of data
All manuscripts must include a data availability statement. This statement should provide the following information, where applicable:
Accession codes, unique identifiers, or web links for publicly available datasets
A description of any restrictions on data availability
For clinical datasets or third party data, please ensure that the statement adheres to our policy
Policy information about studies involving human research participants and Sex and Gender in Research.
Reporting on sex and gender
Information not available.
Population characteristics
No human data have been used in this study.
Recruitment
n/a
Ethics oversight
n/a
Note that full information on the approval of the study protocol must also be provided in the manuscript.
Field-specific reporting
Please select the one below that is the best fit for your research. If you are not sure, read the appropriate sections before making your selection.
Life sciences □ Behavioural & social sciences □ Ecological, evolutionary & environmental sciences
For a reference copy of the document with all sections, see nature.com/documents/nr-reporting-summary-flat.pdf
Life sciences study design
All studies must disclose on these points even when the disclosure is negative.
Sample size
The 854 cities have been selected based on the Eurostat Urban Audit database, and correspond to all cities with more than 50,000 inhabitants.
Data exclusions
Overseas cities from Spain, Portugal, France and Iceland have been excluded due to different climatic conditions.
Replication
9,500 as a combination of 19 general circulation models (GCM) and 500 simulations from the exposure-response functions distribution.
Randomization
Observational study on aggregated datasets.
Blinding
Observational study on aggregated datasets.
Reporting for specific materials, systems and methods
We require information from authors about some types of materials, experimental systems and methods used in many studies. Here, indicate whether each material, system or method listed is relevant to your study. If you are not sure if a list item applies to your research, read the appropriate section before selecting a response.