المجلة: Scientific Reports، المجلد: 15، العدد: 1
DOI: https://doi.org/10.1038/s41598-025-91282-8
PMID: https://pubmed.ncbi.nlm.nih.gov/40011613
تاريخ النشر: 2025-02-26
DOI: https://doi.org/10.1038/s41598-025-91282-8
PMID: https://pubmed.ncbi.nlm.nih.gov/40011613
تاريخ النشر: 2025-02-26
افتح
تقنية اختيار ميزات جماعية تكيفية للتنبؤ بالسكري غير المعتمدة على نموذج
تجمع التعلم الجماعي مخرجات عدة نماذج لتحسين أداء النموذج الكلي. يقوم اختيار الميزات الجماعي بفصل الميزات المناسبة عن الميزات الزائدة وغير الأساسية. في هذه الورقة، سيكون التركيز الرئيسي هو توسيع نطاق التعلم الجماعي ليشمل اختيار الميزات. سنقترح طريقة اختيار ميزات جماعية تُسمى AdaptDiab للتنبؤ بمرض السكري التي لا تعتمد على نموذج. تجمع طريقتنا بين تقنيات اختيار الميزات المتنوعة، مثل طرق الفلترة والتغليف، مستفيدة من نقاط قوتها التكميلية. لقد استخدمنا دالة مجمعة تكيفية، تختار ديناميكيًا الميزات الأكثر معلوماتية بناءً على خصائص أعضاء المجموعة. نوضح فعالية طريقتنا المقترحة AdaptDiab من خلال دراسات تجريبية باستخدام نماذج تصنيف متنوعة. نتائج تجريبية لنموذج اختيار الميزات الجماعي المقترح لدينا تتفوق على الطرق التقليدية. تسهم هذه الورقة في طرق التعلم الجماعي وتوفر إطار عمل عملي وأفضل لاختيار الميزات.
الكلمات الرئيسية: التعلم الجماعي، اختيار الميزات، التنبؤ بمرض السكري، متعدد الطرق، غير معتمد على النموذج
مرض السكري هو قضية صحية عالمية رئيسية تحمل أعباء اقتصادية واجتماعية كبيرة. الكشف المبكر والتدخل أمران حاسمان لمنع المضاعفات الشديدة وتحسين نتائج المرضى
مرض السكري هو قضية صحية عالمية رئيسية تحمل أعباء اقتصادية واجتماعية كبيرة. الكشف المبكر والتدخل أمران حاسمان لمنع المضاعفات الشديدة وتحسين نتائج المرضى
بالإضافة إلى ذلك، يمكن أن تعيق الميزات غير ذات الصلة أو الزائدة تحديد النموذج للأنماط المعلوماتية الحقيقية. تتطلب هذه التحديات تقنيات اختيار ميزات قوية لتحديد الميزات الأكثر صلة وتحسين دقة وقابلية تعميم نماذج التنبؤ بمرض السكري. يقوم اختيار الميزات باختيار الميزات ذات الصلة وغير الزائدة من مساحة ميزات واسعة. في العديد من تطبيقات التعلم الآلي والتعرف على الأنماط، يُستخدم اختيار الميزات لاختيار مجموعة الميزات المثلى من مساحة الميزات لتدريب نموذج التعلم.
تؤدي مجموعات البيانات عالية الأبعاد التي تحتوي على العديد من الميزات إلى زيادة التعقيد الحسابي، والإفراط في التكيف، وتقليل أداء التعميم. لقد برز التعلم الآلي كأداة واعدة للتنبؤ بمخاطر مرض السكري، مما يسمح باتخاذ تدابير وقائية وإدارة أفضل للمرضى. ومع ذلك، تواجه الأساليب الحالية للتعلم الآلي العديد من التحديات، بما في ذلك مشكلات جودة البيانات، ونقص القابلية للتفسير، وقيود التعميم.
من خلال الاستفادة من قوة العديد من تقنيات اختيار الميزات كطريقة تآزرية. في طريقة اختيار الميزات الجماعية، يتم دمج تقنيات اختيار الميزات المتعددة لإنتاج مجموعة فرعية مثالية من الميزات باستخدام مجموعة من تصنيفات الميزات التي تحسن الدقة. تضمن طريقة اختيار الميزات الجماعية المتانة من خلال التنوع، والاستكشاف الشامل، وتقليل الضوضاء، وزيادة الاستقرار. في الخطوة الأولى من الطريقة الجماعية، يتم اختيار مجموعة من محددات الميزات المختلفة، ويقدم كل محدد ترتيبًا مرتبًا للميزات. تجمع الخطوة الثانية المجموعات الفرعية المختارة من الميزات باستخدام تقنيات تجميع مختلفة. تبحث هذه الدراسة في فعالية بنية AdaptDiab غير المعتمدة على النموذج في تحسين أداء نماذج التنبؤ بمرض السكري مقارنة بتقنيات اختيار الميزات التقليدية.
الأعمال ذات الصلة
تؤثر جودة البيانات المستخدمة في تدريب نماذج التعلم الآلي بشكل كبير على دقتها. يمكن أن تعيق مشكلات مثل القيم المفقودة، ومجموعات البيانات غير المتوازنة، والبيانات الضوضائية أداء النموذج. يوضح النهج المقترح
يلعب اختيار الميزات دورًا حاسمًا في تعزيز أداء مهام التصنيف. من خلال اختيار مجموعة فرعية من الميزات ذات الصلة، لاحظ الباحثون تحسينات كبيرة في دقة النموذج
تم إنشاء العديد من تقنيات اختيار الميزات لتحقيق هذا الهدف، كل منها له نقاط قوته وقيوده. تقوم طرق الفلترة مثل مربع كاي
لتجاوز قيود التقنيات الفردية، استكشف الباحثون طرق اختيار الميزات الجماعية التي تجمع بين نقاط القوة لعدة أساليب. وقد أظهرت هذه الطرق أنها تحسن من المتانة وتقلل من التحيز مقارنة بتقنية واحدة.
في الختام، يوفر اختيار الميزات أداة قوية لتحسين أداء التصنيف. بينما توجد تقنيات متنوعة، كل منها له مزايا وعيوب، يستكشف المجال بنشاط طرق جماعية للحصول على اختيار ميزات أكثر متانة وفعالية.
التحضير المسبق
يعد التحضير المسبق للبيانات خطوة أساسية في سلسلة تحليل البيانات تلعب دورًا حيويًا في تعزيز جودة وموثوقية مجموعة البيانات للمهام النمذجة اللاحقة. يتضمن ذلك سلسلة من العمليات المصممة لتنظيف وتحويل وتنظيم البيانات الخام لجعلها مناسبة للتحليل بواسطة خوارزميات التعلم الآلي. غالبًا ما تكون مجموعات البيانات في العالم الحقيقي صاخبة أو غير مكتملة أو تحتوي على معلومات غير ذات صلة، مما يمكن أن يؤثر سلبًا على أداء النماذج التنبؤية. الأهداف الرئيسية للتحضير المسبق هي معالجة هذه التحديات، وتحسين جودة البيانات، وخلق بيئة أكثر ملاءمة لتدريب النماذج بدقة ومعنى.
هذه هي الطرق التالية التي استخدمناها للتحضير المسبق:
(1) استبدال القيم الفارغة بالمتوسط: يمكن أن تتسبب القيم المفقودة في مجموعة البيانات في مشاكل أثناء تدريب النموذج، مما يؤدي إلى نتائج متحيزة ودقة منخفضة. يضمن ملء القيم الفارغة بالمتوسط عدم تعطيل البيانات المفقودة الخصائص الإحصائية العامة للميزة. تحافظ هذه الطريقة على سلامة البيانات وتمنع فقدان المعلومات القيمة.
(2) التعامل مع القيم الشاذة: يمكن أن تشوه القيم الشاذة المقاييس الإحصائية، مما يؤدي إلى تدريب نموذج متحيز وتعميم compromised. يمكن أن تشوه القيم الشاذة توزيع البيانات وتؤثر سلبًا على أداء نماذج معينة. يضمن إزالة القيم الشاذة بناءً على IQR مجموعة بيانات أكثر تمثيلًا وقوة.
يتم حساب الربعين السفلي (Q1) والعلوي (Q3) لميزة Xi. ثم يتم تحديد IQR على أنه
(3) التطبيع: يمكن أن تؤدي الميزات ذات المقاييس المتفاوتة إلى تدريب نموذج متحيز، حيث قد تهيمن ميزات معينة على عملية التعلم. يضمن التطبيع أن تسهم الميزات ذات المقاييس المختلفة بالتساوي في عملية تدريب النموذج. يحسن من التقارب والثبات في الخوارزميات الحساسة لمقياس الميزات المدخلة.
(3) التطبيع: يمكن أن تؤدي الميزات ذات المقاييس المتفاوتة إلى تدريب نموذج متحيز، حيث قد تهيمن ميزات معينة على عملية التعلم. يضمن التطبيع أن تسهم الميزات ذات المقاييس المختلفة بالتساوي في عملية تدريب النموذج. يحسن من التقارب والثبات في الخوارزميات الحساسة لمقياس الميزات المدخلة.
بالنسبة لميزة
حيث أن
(4) زيادة العينة باستخدام SMOTE
(4) زيادة العينة باستخدام SMOTE
يولد SMOTE حالات اصطناعية للفئة الأقل عن طريق الاستيفاء بين الحالات الموجودة. بالنظر إلى حالة أقل
حيث أن
استبدال القيم المفقودة بمتوسط البيانات المتبقية يضمن مجموعة بيانات تحليل اختيار الميزات المعتمدة على التجميع. يسمح لطرق اختيار الميزات الجماعية بتقييم الميزات بناءً على توزيعها داخل السكان المصابين وغير المصابين بالسكري. أيضًا، يؤدي ذلك إلى اختيار أكثر دقة للميزات التي تميز بين المجموعتين. يساعد إزالة القيم الشاذة بناءً على IQR في تحديد وإزالة القيم الشاذة التي قد تؤثر بشكل غير متناسب على اختيار الميزات بواسطة خوارزميات اختيار الميزات الجماعية. تضمن هذه الطريقة أن يركز اختيار الميزات الجماعية على الاتجاهات الأساسية داخل السكان المصابين وغير المصابين بالسكري، مما يؤدي إلى اختيار أكثر متانة للميزات التي تمثل معظم المرضى. على سبيل المثال، قد يكون عدد غير عادي من حالات الحمل لنقطة بيانات واحدة قيمة شاذة. لا ينبغي أن تؤثر بشكل مفرط على اختيار الميزات المتعلقة بالحمل كعامل خطر. قد تكون مجموعة بيانات جمعية بيمه الهندية الطبية
استبدال القيم المفقودة بمتوسط البيانات المتبقية يضمن مجموعة بيانات تحليل اختيار الميزات المعتمدة على التجميع. يسمح لطرق اختيار الميزات الجماعية بتقييم الميزات بناءً على توزيعها داخل السكان المصابين وغير المصابين بالسكري. أيضًا، يؤدي ذلك إلى اختيار أكثر دقة للميزات التي تميز بين المجموعتين. يساعد إزالة القيم الشاذة بناءً على IQR في تحديد وإزالة القيم الشاذة التي قد تؤثر بشكل غير متناسب على اختيار الميزات بواسطة خوارزميات اختيار الميزات الجماعية. تضمن هذه الطريقة أن يركز اختيار الميزات الجماعية على الاتجاهات الأساسية داخل السكان المصابين وغير المصابين بالسكري، مما يؤدي إلى اختيار أكثر متانة للميزات التي تمثل معظم المرضى. على سبيل المثال، قد يكون عدد غير عادي من حالات الحمل لنقطة بيانات واحدة قيمة شاذة. لا ينبغي أن تؤثر بشكل مفرط على اختيار الميزات المتعلقة بالحمل كعامل خطر. قد تكون مجموعة بيانات جمعية بيمه الهندية الطبية
من خلال دمج هذه الخطوات التحضيرية، تهدف الدراسة إلى ضمان مجموعة بيانات نظيفة ومتوازنة ومقاسة بشكل مناسب، مما يقلل من المشكلات المحتملة التي قد تؤثر على أداء نماذج التعلم الآلي أثناء التدريب والتقييم.
المواد والأساليب
مجموعة البيانات
نستخدم مواد وأساليب متنوعة لتحليل توقعات السكري بشكل شامل. مجموعة البيانات التي نستخدمها في هذه الدراسة هي مجموعة بيانات جمعية بيمه الهندية الطبية للسكري
يتراوح قيمة الجلوكوز من 0 إلى 199 (النطاق غير المصاب بالسكري أقل). لا توجد قيم مفقودة في حالات الحمل. تتطلب قيم سمك الجلد والأنسولين الاستيفاء. تتراوح قيم DBF من 0.078 إلى 2.42 وتحتاج إلى الاستيفاء. لا تحتوي مجموعة البيانات على متغيرات فئوية. معظم الميزات لها توزيعات مشوهة، مما يشير إلى الحاجة إلى القياس أو التحويل لتحسين أداء النموذج.
اختيار الميزات
يعد اختيار الميزات خطوة أساسية في التعلم الآلي تتضمن اختيار مجموعات فرعية ذات صلة من الميزات من جميع الميزات لتحسين أداء النموذج، وقابليته للتفسير، وكفاءته. يتم تصنيف تقنيات اختيار الميزات بشكل عام إلى تصفية، ولف، ومضمنة. في هذه التجربة، سنستخدم أربعة أنواع من تصفية اختيار الميزات: ANOVA F-Score
ANOVA
ANOVA تعني الكشف عن الشذوذ في التباين. يُشار إليها أيضًا باسم إحصائيات F. ANOVA هي تقنية إحصائية تستخدم لمقارنة القيم المتوسطة لمجموعتين من المشاركين. تحدد درجة ANOVA F-score أهمية ميزات معينة مرتبطة بمتغير مستهدف. ANOVA (الكشف عن الشذوذ في التباين) مفيدة لمهام التصنيف التي تبحث عن ميزات تظهر انحرافًا كبيرًا عبر الفئات.
يتم حساب ANOVA F-Score لميزة
حيث، MSR= متوسط المربع بسبب الانحدار، MSE= متوسط المربع بسبب الخطأ، و F هو ANOVA F-Score.
في سياق اختيار الميزات، تُظهر درجات ANOVA F الأعلى اختلافات كبيرة في المتوسط عبر الفئات. تشير درجة ANOVA F الأعلى إلى تباين أكبر بين متوسطات الفئات مقارنة بتباين داخل الفئة، مما يظهر أن ميزة معينة مهمة للتصنيف.
درجة فيشر
درجة فيشر أو تحليل التمييز هي أداة إحصائية تُستخدم بشكل رئيسي لمهام التصنيف الثنائي. تقيم القوة التمييزية للميزات الفردية من خلال تقييم نسبة التباين بين الفئات وداخل الفئات. الهدف هو تحديد الميزات التي تعظم الفصل بين متوسطات الفئات مع تقليل الانتشار داخل كل فئة.
درجة فيشر للميزة
حيث، Fi هي درجة فيشر للميزة
يمثل البسط الفرق المربع بين متوسطات الفئتين، بينما المقام هو مجموع التباينات داخل كل فئة. كلما كانت درجة فيشر أكبر، كانت الميزة أفضل في التمييز بين الفئتين. تُعتبر الميزات ذات درجات فيشر الأعلى أكثر صلة بمهام التصنيف وغالبًا ما يتم اختيارها للإدراج في النماذج التنبؤية.
عتبة التباين
تتضمن عتبة التباين إزالة الميزات ذات التباين المنخفض. يهدف القضاء على هذه الميزات ذات التباين المنخفض إلى تحسين أداء النموذج وكفاءة الحساب.
بالنسبة لميزة
Vari هو تباين الميزة
تتضمن طريقة عتبة التباين تحديد عتبة محددة مسبقًا (
إزالة الميزة
تكون عتبة التباين مفيدة في السيناريوهات التي لا تسهم فيها الميزات ذات التباين الطفيف بشكل كبير في القوة التنبؤية للنموذج وقد تُدخل ضوضاء.
تكون عتبة التباين مفيدة في السيناريوهات التي لا تسهم فيها الميزات ذات التباين الطفيف بشكل كبير في القوة التنبؤية للنموذج وقد تُدخل ضوضاء.
الارتباط الثنائي النقاط
معامل الارتباط الثنائي النقاط هو مقياس إحصائي يقيم العلاقة بين المتغيرات الثنائية والمستمرة. يتراوح معامل الارتباط الثنائي النقاط
بالنسبة لمتغير الهدف الثنائي
حيث،
تشير قيمة
نماذج التصنيف
يوفر هذا القسم نظرة عامة مفيدة عن 5 خوارزميات تصنيف متنوعة استخدمناها في بحثنا، كل منها له نقاط قوة وتطبيقات فريدة. تم اختيار هذه الخوارزميات لاستكشاف مجموعة البيانات الخاصة بنا وتقنية اختيار الميزات المجمعة المقترحة ومقارنتها بتقنيات اختيار الميزات التقليدية. الخوارزميات الخمس المختارة هي Gaussian Naive Bayes، والانحدار اللوجستي، وغابة عشوائية، وزيادة التدرج، وMultiLayer Perceptron. تجعل قابلية تفسير الانحدار اللوجستي منه معيارًا قيمًا للتقييم. تعتبر SVMs قوية ضد مجموعات البيانات عالية الأبعاد وتتعامل بفعالية مع نقاط البيانات المتداخلة باستخدام طرق النواة. يبرز كيف تحسن تقنيات اختيار الميزات من أداء النموذج من خلال تقليل الميزات غير ذات الصلة، وهو أمر حاسم لـ SVM لتجنب الإفراط في التكيف. تُظهر زيادة التدرج القوة من خلال تعزيز أداء نموذج معقد للغاية وقابل للتكيف. تمثل النماذج المختارة مزيجًا من النماذج الخطية (LR) وغير الخطية (SVM، RF، GBM)، مما يضمن عمومية اختيار الميزات المجمعة عبر أنماط التعلم المتنوعة. يضمن هذا المصفوفة من خوارزميات التصنيف تقييمًا شاملاً لتقنية اختيار الميزات المجمعة المقترحة. تتناول الأقسام التالية منهجيات ونتائج كل نموذج تصنيف محدد، مما يوفر فهمًا لمساهماتها في الإطار التنبؤي العام.
Gaussian Naive Bayes
Gaussian Naive Bayes هو خوارزمية تصنيف احتمالية تعتمد على نظرية بايز، التي تحسب احتمال فرضية معينة بناءً على الأدلة الملاحظة. تم تصميمها بشكل صريح لمجموعات البيانات ذات الميزات المستمرة، مع افتراض أن قيم كل ميزة تتبع توزيع Gaussian (طبيعي) داخل كل فئة.
يتم حساب احتمال حالة ما
حيث،
تم اختيار Gaussian Naive Bayes للأسباب التالية: (1) افتراض استقلال الميزات، (2) البساطة وقابلية التفسير، و(3) القوة ضد البيانات الضوضائية.
من خلال دمج Gaussian Naive Bayes في مجموعة نماذج التصنيف، يهدف البحث إلى تقديم رؤى حول قابلية التكيف وفعالية منهجية اختيار الميزات المقترحة.
الانحدار اللوجستي
الانحدار اللوجستي هو نموذج خطي مستخدم على نطاق واسع لمهام التصنيف الثنائي. يقدر النموذج احتمال أن تنتمي حالة ما إلى فئة معينة ويقوم بعمل تنبؤات بناءً على دالة لوجستية. تُستخدم دالة السيغمويد لتحويل ناتج تركيبة خطية من الميزات إلى احتمال بين 0 و 1:
يتم تدريب نموذج الانحدار اللوجستي من خلال تحسين هذه المعاملات لتعظيم احتمال النتائج الملاحظة.
تم اختيار الانحدار اللوجستي كأحد نماذج التصنيف لتقييم تقنية اختيار الميزات المجمعة المقترحة لعدة أسباب، مثل الحدود الخطية للقرار، وقابلية التفسير، والحساسية لتغيرات الميزات، ومعيار البساطة. تسهم التحليلات باستخدام الانحدار اللوجستي في فهم كيفية تأثير النهج المجمّع على كل من النماذج الخطية وغير الخطية، مما يبرز تعددية تقنية اختيار الميزات.
غابة عشوائية
غابة عشوائية هي خوارزمية تعلم مجمعة تبني العديد من أشجار القرار أثناء التدريب وتدمج تنبؤاتها لتحسين الدقة والصلابة. تُعرف بمرونتها وقدرتها على التعامل مع العلاقات المعقدة ومقاومتها للإفراط في التكيف.
تجمع خوارزمية غابة عشوائية بين تنبؤات العديد من أشجار القرار. بالنسبة لمهمة التصنيف الثنائي، يمكن التعبير عن احتمال انتماء حالة ما إلى الفئة 1 كمتوسط عبر جميع الأشجار الفردية:
تم تضمين غابة عشوائية كأحد نماذج التصنيف لتقييم تقنية اختيار الميزات المجمعة المقترحة بسبب الاعتبارات التالية: الطبيعة المجمعة، القوة والعمومية، أهمية الميزات، عدم الخطية، والتفاعل. يعزز دمج غابة عشوائية في مجموعة نماذج التصنيف شمولية البحث، مما يتيح فحصًا شاملاً لأداء منهجية اختيار الميزات المقترحة عبر أنماط التعلم المختلفة وتعقيدات النماذج.
زيادة التدرج
زيادة التدرج هي خوارزمية تعلم مجمعة تبني سلسلة من المتعلمين الضعفاء (عادةً أشجار القرار) بشكل متسلسل، حيث تعوض كل شجرة عن أخطاء سابقتها. إنها خوارزمية قوية ومرنة معروفة بدقتها التنبؤية العالية وقدرتها على التعامل مع العلاقات المعقدة في البيانات.
بالنسبة لمهمة التصنيف الثنائي، يمكن التعبير عن تنبؤ حالة ما التي تنتمي إلى الفئة 1 في نموذج زيادة التدرج على النحو التالي:
تم اختيار تعزيز التدرج كأحد نماذج التصنيف لتقييم تقنية اختيار الميزات المقترحة للأسباب التالية: الطبيعة التسلسلية، وخصائص المجموعة، والتعامل مع عدم الخطية. يقوم النموذج بتقليل دالة الخسارة أثناء التدريب، ويتم تدريب كل شجرة لاحقة لتصحيح الأخطاء التي ارتكبتها الأشجار السابقة. تسهم هذه التحليل في التقييم الأوسع لمدى قابلية تطبيق تقنية اختيار الميزات عبر نماذج التعلم الجماعي المختلفة.
شبكة عصبية متعددة الطبقات
الشبكة العصبية متعددة الطبقات هي شبكة عصبية اصطناعية تتكون من عدة طبقات من العقد، بما في ذلك طبقات الإدخال، والطبقات المخفية، وطبقات الإخراج. يمكن لشبكات MLP أن تتعلم العلاقات غير الخطية المعقدة في البيانات، مما يجعلها مناسبة لمجموعة متنوعة من التطبيقات، بما في ذلك مهام التصنيف.
بالنسبة لمهمة تصنيف ثنائية، يمكن التعبير عن مخرجات MLP كما يلي:
حيث،
تم تضمين الشبكة العصبية متعددة الطبقات (MLP) في مجموعة نماذج التصنيف لتقييم تقنية اختيار الميزات المقترحة بسبب عدة عوامل رئيسية: عدم الخطية والتعقيد، تعلم التمثيل، التكيف مع البيانات عالية الأبعاد، ومعيار لنماذج التعلم العميق. من خلال دمج الشبكة العصبية متعددة الطبقات في مجموعة نماذج التصنيف، تهدف الدراسة إلى تقييم شامل لمنهجية اختيار الميزات المقترحة عبر هياكل الشبكات العصبية المتنوعة، مما يوفر رؤى حول قابليتها للتكيف وفعاليتها في التعلم العميق.
الهيكل المقترح
أداة اختيار ميزات التنبؤ بالسكري التكيفية – AdaptDiab في هذا البحث، نقدم خوارزمية AdaptDiab لتعزيز فعالية خوارزميات اختيار الميزات. تعتمد العديد من أساليب اختيار الميزات التقليدية على خوارزمية واحدة، مما قد يتسبب في تجاهل معلومات مهمة في البيانات. بالمقابل، يجمع الهيكل AdaptDiab المقدم هنا مخرجات تقنيات اختيار الميزات المختلفة لإنشاء عملية اتخاذ قرار تعاونية تستفيد من نقاط القوة في طرق متنوعة، كما هو موضح في الشكل 1.
النهج الجماعي متعدد الاستخدامات، وقابل للتكيف، وقوي. يجمع التعلم الجماعي التنبؤات من عدة نماذج لتعزيز دقة وموثوقية التنبؤ. الهدف هو تقليل أخطاء أو انحيازات النموذج باستخدام الذكاء الجماعي. يمكن تصنيف بناء المجموعة إلى تقنيات جماعية متجانسة وغير متجانسة.
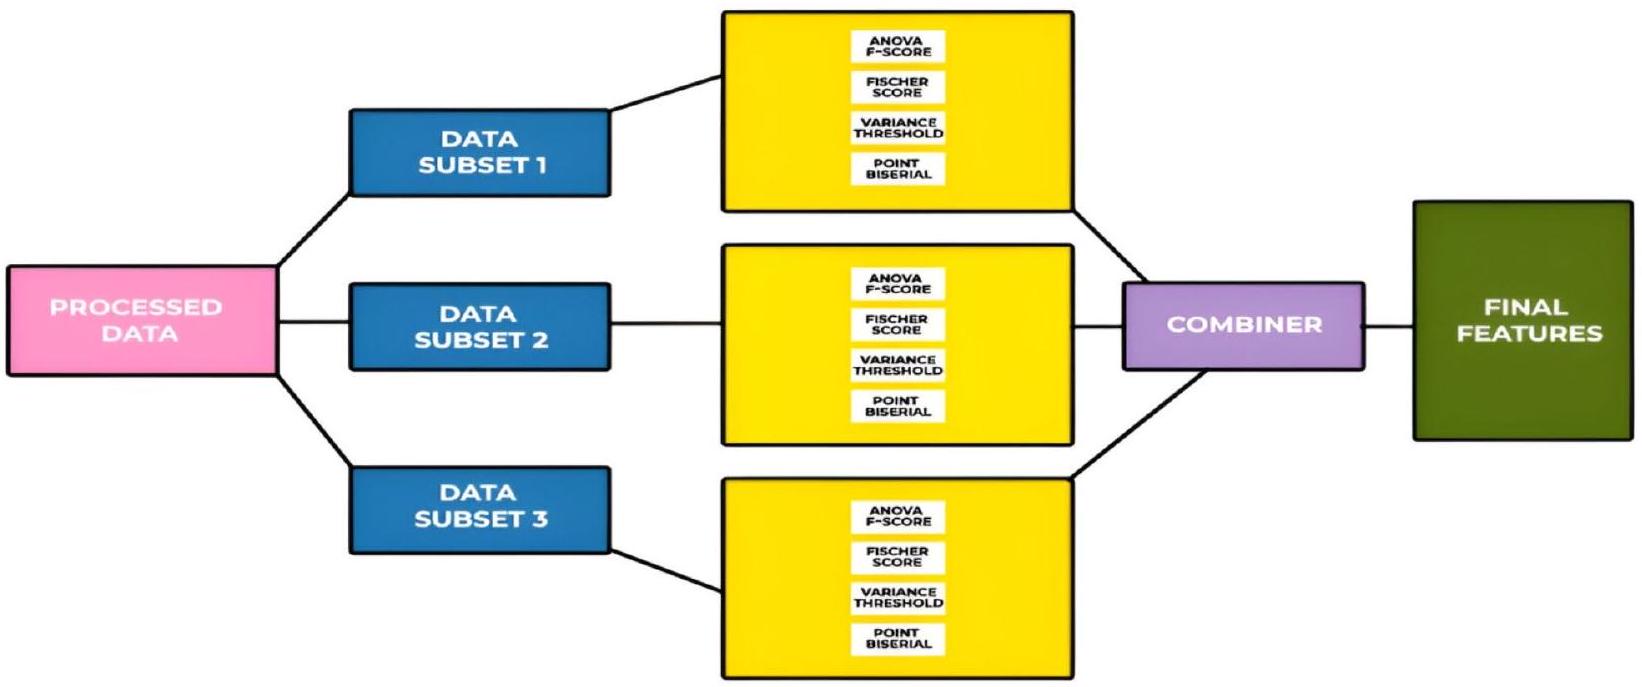
الشكل 1. الهيكل المقترح لتقنية AdaptDiab.
تجمع المجموعة غير المتجانسة نتائج طرق اختيار الميزات المختلفة. يأخذ النهج غير المتجانس في الاعتبار نقاط القوة والضعف في التقنيات الفردية.
يجمع نهجنا المقترح بين قوة كل من تقنيات المجموعة المتجانسة وغير المتجانسة من خلال تقسيم البيانات المعالجة إلى مجموعات فرعية، وتطبيق خوارزميات اختيار الميزات عليها مشابهة لتقنية اختيار الميزات في المجموعة المتجانسة، واستخدام أنواع مختلفة من خوارزميات اختيار الميزات على نفس البيانات مماثلة لتقنية اختيار الميزات في المجموعة غير المتجانسة.
يقوم AdaptDiab بتقسيم البيانات المعالجة إلى ثلاث مجموعات فرعية باستخدام خلط عشوائي. تختار أربع تقنيات لاختيار الميزات، وهي ANOVA F-score، وFisher score، وعتبة التباين، وPoint biserial، الميزات من 3 مجموعات بيانات فرعية. تُستخدم دالة الجمع في هيكل AdaptDiab لتجميع النتائج من جميع خوارزميات اختيار الميزات الفردية المطبقة على مجموعات بيانات مختلفة. تنتج هذه الدالة المجمعة الميزات النهائية المختارة باستخدام تقنية AdaptDiab.
تعمل دالة الجمع في هيكل AdaptDiab بناءً على مبدأ تخصيص أوزان لكل خوارزمية اختيار ميزات، وتحدد هذه الأوزان مساهمة كل تقنية اختيار ميزات في نتائج خوارزمية اختيار الميزات الجماعية المجمعة. يتم تخصيص الأوزان لكل خوارزمية اختيار ميزات باستخدام المعلومات المتبادلة.
تعتبر المعلومات المتبادلة بين متغيرين عشوائيين قيمة غير سالبة، تقيس الاعتماد بين المتغيرات. تساوي صفر إذا كان المتغيران العشوائيان مستقلين؛ القيم الأعلى تعني اعتمادًا أعلى. تُستخدم هذه المعلومات المتبادلة للعثور على الاعتماد بين كل ميزة تم اختيارها باستخدام خوارزمية اختيار الميزات الفردية والمتغير المستهدف.
تخصص دالة الجمع درجة معلومات متبادلة لكل ميزة. متوسط درجات المعلومات المتبادلة هذه المستمدة من كل ميزة مختارة هو درجة المعلومات المتبادلة لتلك الخوارزمية الخاصة باختيار الميزات. متوسط جميع درجات المعلومات المتبادلة هذه من كل خوارزمية اختيار ميزات معالجة تلك المجموعة الفرعية المحددة من البيانات هو درجة المعلومات المتبادلة لتلك المجموعة الفرعية المحددة من البيانات. بناءً على هذه الدرجة المتوسطة للمعلومات المتبادلة، يتم إعطاء وزن للنتائج المستمدة من كل مجموعة بيانات فرعية، وبناءً على هذا الوزن، تختار دالة الجمع في هيكل AdaptDiab الميزات من الميزات المقترحة بواسطة خوارزميات اختيار الميزات المختلفة من مجموعات بيانات فرعية مختلفة.
النتائج والمناقشة
تم تقسيم التقييم إلى مرحلتين. ركزت المرحلة الأولى على تقييم أهمية الميزات؛ لذلك، قمنا بمقارنة أداء عدة خوارزميات تصنيف باستخدام جميع الميزات التي اختارتها خوارزميات اختيار الميزات الحالية مع الأداء الذي تحقق عندما استخدمنا مجموعات فرعية من الميزات ذات الصلة التي اختارها نهج AdaptDiab.
في المرحلة الثانية، تم حساب استقرار مجموعة الميزات ذات الصلة. نحسب الاستقرار لقياس الأداء المتسق للأداة عبر مجموعات بيانات فرعية مختلفة، والموثوقية، والتفسير. تساعد مقاييس الاستقرار مثل مؤشر جاكارد في ضمان عدم انحراف النموذج أو حساسيته المفرطة لخصوصيات مجموعة بيانات معينة، وهو أمر مهم بشكل خاص في التطبيقات الواقعية.
الأداء
تختار تقنيتنا المقترحة AdaptDiab مجموعة ميزات فرعية من مجموعة الميزات الكاملة. كما ذُكر في القسم “التحضير المسبق”، نقوم بتدريب نماذجنا على هذه الميزات. أولاً، نقوم بتدريبها على مجموعة الميزات الكاملة، ثم على مجموعات الميزات الفرعية الفردية التي اختارتها طرق اختيار الميزات الفردية، ثم على مجموعة الميزات الفرعية التي اختارتها أداة اختيار الميزات المقترحة لدينا. نقوم بحساب أداء النماذج على كل مجموعة ميزات فرعية.
تظهر الجدول 1 درجة دقة جميع النماذج على كل مجموعة ميزات فرعية. يشير إلى أن النماذج التي تستخدم الميزات التي اختارتها تقنيتنا AdaptDiab تتفوق على الميزات التي اختارتها تقنيات اختيار الميزات الفردية الأخرى في أداء النموذج.
تظهر الشكل 2 الرسم البياني لمقارنة درجات الدقة لتقنيات اختيار الميزات المختلفة في نموذج Gaussian Naive Bayes. يظهر الرسم البياني أن نهج AdaptDiab المقترح يعمل بشكل أفضل من تقنيات اختيار الميزات الأخرى.
| النماذج | ANOVA F-Score | Fisher Score | عتبة التباين | Point Biserial | AdaptDiab |
| Gaussian Naive Bayes | 76 | 75 | 75 | 75 | 79 |
| الانحدار اللوجستي | 76 | 76 | 76 | 75 | 80 |
| الغابة العشوائية | 75 | 66 | 66 | 66 | 78 |
| تعزيز التدرج | 77 | 75 | 76 | 75 | 80 |
| الشبكة العصبية متعددة الطبقات | 77 | 76 | 78 | 75 | 81 |
الجدول 1. يظهر مقارنة درجات الدقة المتوسطة لنماذج مختلفة.
Gaussian Naive Bayes
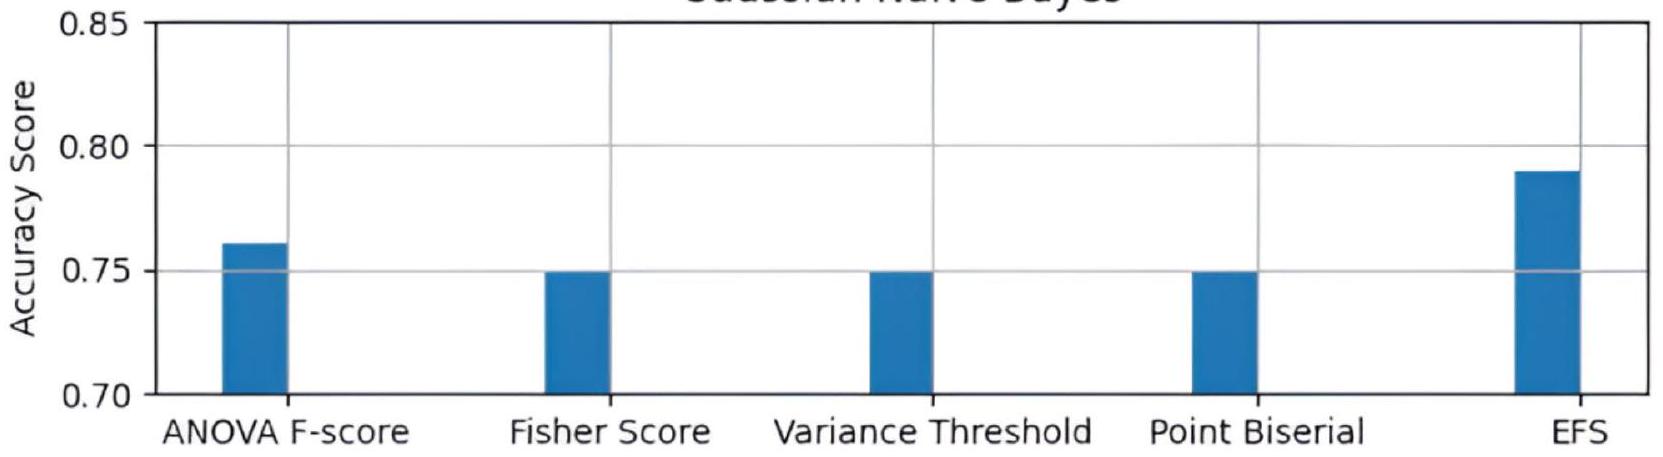
الشكل 2. مقارنة تقنيات FS في نموذج Gradient Naive Bayes.
الانحدار اللوجستي
الشكل 3. مقارنة تقنيات اختيار الميزات في نموذج الانحدار اللوجستي.
الشكل 4. مقارنة تقنيات اختيار الميزات في نموذج الغابة العشوائية.
تظهر الشكل 3 الرسم البياني لمقارنة درجات الدقة لتقنيات اختيار الميزات المختلفة في نموذج الانحدار اللوجستي. يُظهر الرسم البياني أن النهج المقترح AdaptDiab يؤدي بشكل أفضل من تقنيات اختيار الميزات الأخرى.
تظهر الشكل 4 الرسم البياني لمقارنة درجات الدقة لتقنيات اختيار الميزات المختلفة في نموذج الغابة العشوائية. يُظهر الرسم البياني أن النهج المقترح AdaptDiab يؤدي بشكل أفضل من تقنيات اختيار الميزات الأخرى.
تظهر الشكل 5 الرسم البياني لمقارنة درجات الدقة لتقنيات اختيار الميزات المختلفة في نموذج تعزيز التدرج. يُظهر الرسم البياني أن النهج المقترح AdaptDiab يؤدي بشكل أفضل من تقنيات اختيار الميزات الأخرى.
تظهر الشكل 6 الرسم البياني لمقارنة درجات الدقة لتقنيات اختيار الميزات المختلفة في نموذج الشبكة العصبية متعددة الطبقات. يُظهر الرسم البياني أن النهج المقترح AdaptDiab يؤدي بشكل أفضل من تقنيات اختيار الميزات الأخرى.
تعزيز التدرج
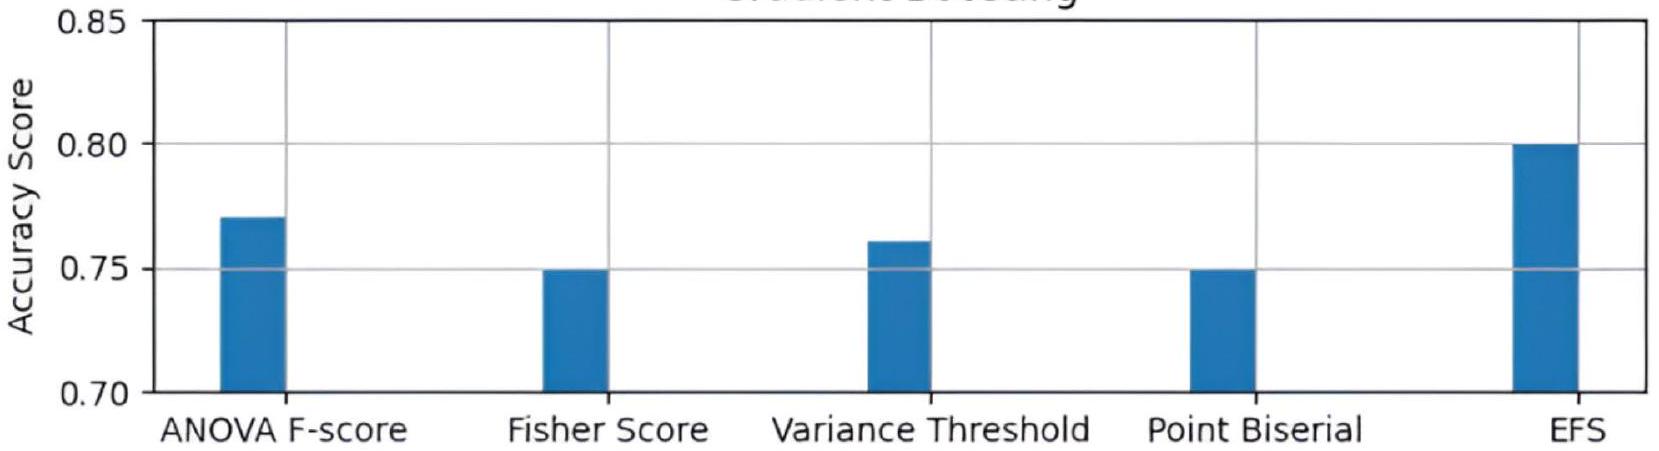
الشكل 5. مقارنة تقنيات اختيار الميزات في نموذج تعزيز التدرج.
البرسبيترون متعدد الطبقات
الشكل 6. مقارنة تقنيات اختيار الميزات في نموذج الشبكة العصبية متعددة الطبقات.
تقنية F-score في ANOVA قد تفضل الميزات ذات التباين العالي، مما قد يكون مفيدًا لبعض النماذج مثل Gaussian naive Bayes ولكنه قد يؤدي إلى ميزات غير ذات صلة لنماذج أخرى مثل الغابة العشوائية. من خلال دمج تقنيات الميزات المتنوعة، يمكن لـ AdaptDiab التقاط ميزات معلوماتية متنوعة، بما في ذلك تلك ذات التباين العالي والمنخفض ولكن مع تأثيرات تفاعلية مع ميزات أخرى. يظهر ذلك الأداء المتسق لتقنيتنا المقترحة عبر نماذج متعددة.
يزدهر نموذج الانحدار اللوجستي على الميزات التي تفصل بين الفئات بشكل فعال. تكمن قوة النقطة الثنائية في تحديد الميزات التي تميز بين الفئات. من خلال دمج تقنيات مختلفة، تختار AdaptDiab مزيجًا من الميزات التي تلتقط قابلية الفصل بين الفئات وميزات قد تكون مفيدة بعلاقة أكثر تعقيدًا مع مرض السكري. يمكن أن تساهم هذه الاختيارات الأوسع في الأداء المتسق لاختيار الميزات في مجموعتنا عبر نماذج مختلفة، بما في ذلك الانحدار اللوجستي.
نموذج الغابة العشوائية معروف بالتعامل مع التفاعلات المعقدة بين الميزات ودرجات أهمية الميزات. قد تؤدي تقنيات عتبة التباين إلى إزالة الميزات ذات التغيرات الطفيفة التي قد تحتوي على معلومات قيمة لالتقاط التفاعلات المعقدة، مما قد يفسر أدائها المنخفض في الغابة العشوائية مقارنة بالنماذج الأخرى. قد تكون طريقتنا أفضل في تحديد هذه التغيرات الطفيفة وتأثيرات التفاعل.
يؤدي نموذج تعزيز التدرج بشكل جيد مع ميزات متنوعة، بما في ذلك تلك ذات الأهمية الفردية المنخفضة. قد تعطي بعض التقنيات، مثل درجة فيشر أو درجة ANOVA F، الأولوية للميزات ذات التباين الفردي العالي، مما قد يؤدي إلى تفويت الميزات التي تساهم ضمن إطار تعزيز التدرج. من خلال دمج الأساليب، قد يكون نهجنا أكثر احتمالاً لالتقاط هذه المجموعة الأوسع من الميزات، بما في ذلك تلك التي تكون أقل بروزًا بشكل فردي ولكنها تساهم في عملية التعزيز. قد يفسر هذا سبب أداء AdaptDiab بشكل جيد في تعزيز التدرج مقارنة ببعض التقنيات الفردية.
الأداة مفيدة في تطبيقات التنبؤ بالسكري في العالم الحقيقي، حيث تكون مجموعات البيانات غالبًا مليئة بالضوضاء وعالية الأبعاد. من خلال اختيار الميزات الأكثر أهمية باستمرار عبر نماذج مختلفة، يضمن AdaptDiab تحسين التعميم وتقليل الإفراط في التكيف، مما يجعله قابلاً للتطبيق بشكل كبير في بيئات الرعاية الصحية. هذه القدرة على التفوق على الأساليب الحالية عبر نماذج متعددة تجعل AdaptDiab أداة قوية لتطوير أنظمة موثوقة وقابلة للتفسير لتنبؤ السكري.
في الختام، يُظهر نهج AdaptDiab المقترح أداءً متسقًا ومتفوقًا في اختيار الميزات عبر نماذج التعلم الآلي المختلفة لتوقع مرض السكري مقارنة بتقنيات اختيار الميزات الفردية. يمكن أن يُعزى هذا التحسن إلى عدة عوامل. يُخفف النهج الجماعي من قيود التقنيات الفردية من خلال الاستفادة من نقاط قوتها المتنوعة. يتجنب التحيز نحو أنواع معينة من الميزات، ويستكشف التفاعلات المعقدة بين الميزات، ويقلل من تأثير البيانات الضوضائية.
تدعم الدرجات العالية من الدقة التي حققتها AdaptDiab عبر نماذج مثل Gaussian Naive Bayes وLogistic Regression وRandom Forest وGradient Boosting وMultilayer Perceptron بشكل قوي فعاليتها.
استقرار
معامل جاكارد
رياضياً، مؤشر جاكارد
أين،
يتراوح مؤشر جاكارد من 0 إلى 1، حيث
باختصار، يقيس مؤشر جاكارد بشكل كمي التشابه بين المجموعات. إنه أداة قيمة لتقييم الاستقرار في خوارزميات اختيار الميزات، وطرق التجميع، أو أي سيناريو يكون فيه مقارنة التداخل بين مجموعات مختلفة من العناصر ذات صلة.
تم تقييم مجموعة الميزات المولدة لدعم تصنيف الأحداث الصرعية لتحديد موثوقية AdaptDiab. أولاً، تم استخدام طريقة AdaptDiab عشر مرات لإنشاء ميزات ذات صلة من عشرة عينات عشوائية من مجموعة البيانات. ثم تم مقارنة المجموعات العشر الناتجة وفقًا لمؤشر جاكارد لتحديد اختلافها. في عشر تنفيذات، حصلت طريقة AdaptDiab على نفس مجموعة الميزات ذات الصلة، مما يعني أن الاستقرار الذي تم قياسه بواسطة مؤشر جاكارد مثالي في
تظهر هذه الدراسة أن طريقة اختيار الميزات الجماعية تختار نفس الميزات ذات الصلة
يمكن أن تؤدي طرق اختيار الميزات غير المستقرة إلى مجموعات متغيرة للغاية من الميزات اعتمادًا على عينة البيانات المحددة المستخدمة. يمكن أن تعيق هذه المتغيرات قدرة النموذج على التعميم، مما يعني أنه قد يؤدي بشكل جيد في بيانات التدريب المحددة ولكن ليس على البيانات غير المرئية. تساعد استقرار نهجنا في التخفيف من هذه المشكلة من خلال اختيار مجموعة أساسية من الميزات المعلوماتية بشكل متسق، مما يؤدي إلى نماذج من المحتمل أن تؤدي بشكل جيد على بيانات جديدة. عندما يحدد AdaptDiab الميزات نفسها باستمرار، فإنه يعزز ثقتنا في أهميتها لتصنيف الأحداث الصرعية.
باختصار، تضمن الاستقرار العالي لتقنية AdaptDiab اختيار ميزات موثوق به، وتقلل من التباين في أداء النموذج، وتزيد من ثقتنا في الميزات المحددة لتصنيف دقيق للأحداث الصرعية. هذا الاستقرار هو ميزة كبيرة لنهجنا مقارنة بالطرق التي قد تظهر تباينًا عاليًا في اختيار الميزات.
على عكس طرق اختيار الميزات التقليدية التي قد تفضل نماذج أو مقاييس معينة، فإن AdaptDiab يعزز باستمرار أداء خمسة نماذج مختلفة من التعلم الآلي عبر جميع مقاييس التقييم.
الخاتمة والعمل المستقبلي
في هذه الورقة، قدمنا AdaptDiab، وهو مجموعة من اختيار الميزات، التي تجمع بين مجموعات من الميزات المختارة بواسطة فلاتر مختلفة، مثل ANOVA F-score، وFisher score، وعتبة التباين، وPoint biserial، مما ينتج عنه مجموعة مثالية من الميزات. لتقييم أداء AdaptDiab، استخدمنا مصنفات مختلفة، مثل Gaussian naive Bayes، والانحدار اللوجستي، وغابة عشوائية، وتعزيز التدرج، وإدراك متعدد الطبقات على مجموعة بيانات السكري الخاصة بجمعية الأطباء الهنود في بيما. من تحليل دقة التصنيف المتوسطة لدينا (ACA)، يمكن ملاحظة أن تقنية AdaptDiab المقترحة تتغلب في الغالب على مشكلة الأمثل المحلي للفلاتر الفردية، خاصة بالنسبة لمجموعات البيانات عالية الأبعاد. الاستقرار الممتاز الذي حققته تقنية AdaptDiab يظهر اتساقًا في اختيار الميزات، ومرونة في التغير، وقابلية للتعميم، وتقليل الإفراط في التكيف.
يمكن استخدام AdaptDiab لتحسين التشخيص والفحص، وخطط العلاج الشخصية، والتكامل في أنظمة دعم القرار السريري، والاستخدام التعليمي والتدريبي. طبيعتها المستقلة عن النموذج تجعل AdaptDiab قابلة للتطبيق على مجموعات بيانات متنوعة، مما يضمن فائدتها في أنظمة الرعاية الصحية على نطاق واسع أو مجالات بيانات معقدة أخرى. يقلل AdaptDiab من الإيجابيات/السلبيات الكاذبة من خلال تحسين الدقة التنبؤية، وتجنب الاختبارات أو العلاجات الطبية غير الضرورية، وتوفير الموارد. بينما تم تصميمه لتصنيف السكري، فإن لـ AdaptDiab تطبيقات محتملة في مجالات أخرى مثل الزراعة (توقع أمراض المحاصيل)، وعلوم المواد (اختيار المعلمات الحرجة في الدراسات التجريبية)، والمالية (تحديد العوامل الرئيسية التي تؤثر على مخاطر الائتمان).
ستستكشف الأعمال المستقبلية طرق تفسير الميزات، والتصور، والتحقق من الصحة الخاصة بالمجال لفهم العوامل الأساسية التي تؤثر على الأداء التنبؤي. التحقيق في دور تنوع المجموعة في تقنية اختيار الميزات الجماعية وتأثيرها على الأداء والاستقرار.
توفر البيانات
كانت مجموعة البيانات المستخدمة في هذه الدراسة متاحة بالفعل في موارد الإنترنت.https://www.kaggle.com/datasets/ uciml/pima-indians-diabetes-database.
تاريخ الاستلام: 8 أكتوبر 2024؛ تاريخ القبول: 19 فبراير 2025
تم النشر عبر الإنترنت: 26 فبراير 2025
تم النشر عبر الإنترنت: 26 فبراير 2025
References
- Centers for Disease Control and Prevention. National Diabetes Statistics Report (2023). https://www.cdc.gov/diabetes/php/datare search/?CDC_AAref_Val=https://www.cdc.gov/diabetes/data/statistics-report/index.html
- AlZu’bi, S. Diabetes monitoring system in smart health cities based on Big Data intelligence. Future Internet (2023).
- Hao, J., Wang, C. & Yang, G. Annealing genetic GAN for imbalanced web data learning. IEEE Trans. Multim. (2021). https://doi. org/10.1109/TMM.2021.3120642.
- Jiang, Z., Zhao, L. & Lu, Y. A semi-supervised resampling method for class imbalanced learning. Elsevier Expert Syst. Appl. (2023). https://doi.org/10.1016/j.eswa.2023.119733.
- Hongfang, Z. A diabetes prediction model based on Boruta feature selection and ensemble learning. BMC Bioinform. (2023).
- Francesco & Prendin Machine Learning-Based Feature Selection Techniques for Diabetes Prediction (Current Medical Research and Opinion, 2021).
- Chen, C., Zhou, K., Wang, Z., Zhang, Q. & Xiao, R. All answers are in the images: A review of deep learning for cerebrovascular segmentation. Comput. Med. Imaging Graph. 107, 102229. https://doi.org/10.1016/j.compmedimag.2023.102229 (2023).
- Han & Kamber. Feature Selection for Knowledge Discovery and Data Mining (MIT Press, 1999) Chap. 6.
- Salton & McGill. Introduction to Information Retrieval (McGraw-Hill, Chap. 11, 2005).
- Aha, D.W. & Bankert, R.L. A Comparative Evaluation of Sequential Feature Selection Algorithms (1996).
- Kuhn, M. & Johnson, K. Feature Engineering and Selection: A Practical Approach for Predictive Models, Chap. 11 (2021).
- Härdle, W.K. & Prastyo, D.D. Embedded Predictor Selection for Default Risk Calculation: A Southeast Asian Industry Study, Chap. 7.
- Zou, H. & Hastie, T. Regularization and variable selection via the elastic net (2004).
- Saeys et al. Ensembles for Feature Selection: A Review and Future Trends (Springer, 2016).
- Mohsen & Moshki. Scalable feature selection in high-dimensional data based on GRASP. Appl. Artif. Intell. (2015).
- Chawla, N.V. SMOTE: Synthetic minority over-sampling technique. J. Artif. Intell. (2002).
- UCI Machine Learning Repository. https://archive.ics.uci.edu/dataset/34/diabetes
- Keselman, H.J., Kowalchuk, R.K., Laureen, L.L., Petoskey, M.D., Keselman, J.C. & Levin, J.R. An Analysis of Their ANOVA, MANOVA (2002).
- Hastie, T., Tibshirani, R. & Friedman, J. The Elements of Statistical Learning (2009).
- Guyon & Elisseeff. An introduction to variable and feature selection. J. Mach. Learn. Res. (2003).
- Glass, V. & Hopkins, K.D. Statistical methods in education and psychology. Gene (1995).
- Seijo-Pardo, B., Porto-Díaz, I., Bolón-Canedo, V. & Alonso-Betanzos, A. Ensemble feature selection: Homogeneous and heterogeneous approaches. Knowl.-Based Syst. 118 (2017).
- Jaccard, P. ‘Etude comparative de la distribution florale dans une portion des alpes et des jura’ (1901).
الشكر والتقدير
لا شيء.
مساهمات المؤلفين
Natarajan K وDhanalakshmi Baskaran وSelvakumar Kamalanathan قام المؤلفون بمساهمة متساوية في هذا العمل البحثي.
التمويل
لم يتم توفير أي تمويل لهذا العمل البحثي.
الإعلانات
موافقة الأخلاقيات والموافقة على المشاركة
تمت الموافقة على هذا العمل من قبل “NIT Tiruchirappalli.” جميع الإجراءات التي تم تنفيذها في هذه الدراسة اتبعت المعايير الأخلاقية للمؤسسة ولجنة البحث الوطنية، بالإضافة إلى التعديلات اللاحقة أو المعايير الأخلاقية المماثلة. كما تم الحصول على موافقة مستنيرة من جميع المشاركين قبل إدراجهم في الدراسة.
الموافقة على النشر
كانت مجموعة البيانات المستخدمة في هذه الدراسة بيانات مرجعية. لذلك، لا توجد قضايا تغطي معلومات يمكن التعرف عليها مثل الصور، أو التفاصيل الشخصية، أو أي معلومات أخرى قد تحدد مشاركًا.
المصالح المتنافسة
يعلن المؤلفون عدم وجود مصالح متنافسة.
معلومات إضافية
يجب توجيه المراسلات والطلبات للحصول على المواد إلى S.K.
معلومات إعادة الطبع والتصاريح متاحة على www.nature.com/reprints.
ملاحظة الناشر تظل Springer Nature محايدة فيما يتعلق بالمطالبات القضائية في الخرائط المنشورة والانتماءات المؤسسية.
معلومات إعادة الطبع والتصاريح متاحة على www.nature.com/reprints.
ملاحظة الناشر تظل Springer Nature محايدة فيما يتعلق بالمطالبات القضائية في الخرائط المنشورة والانتماءات المؤسسية.
الوصول المفتوح هذه المقالة مرخصة بموجب رخصة المشاع الإبداعي للاستخدام غير التجاري، والتي تسمح بأي استخدام غير تجاري، ومشاركة، وتوزيع، وإعادة إنتاج في أي وسيلة أو تنسيق، طالما أنك تعطي الائتمان المناسب للمؤلفين الأصليين والمصدر، وتوفر رابطًا لرخصة المشاع الإبداعي، وتوضح إذا قمت بتعديل المادة المرخصة. ليس لديك إذن بموجب هذه الرخصة لمشاركة المواد المعدلة المشتقة من هذه المقالة أو أجزاء منها. الصور أو المواد الأخرى من طرف ثالث في هذه المقالة مشمولة في رخصة المشاع الإبداعي للمقالة، ما لم يُشار إلى خلاف ذلك في سطر الائتمان للمادة. إذا لم تكن المادة مشمولة في رخصة المشاع الإبداعي للمقالة واستخدامك المقصود غير مسموح به بموجب اللوائح القانونية أو يتجاوز الاستخدام المسموح به، ستحتاج إلى الحصول على إذن مباشرة من صاحب حقوق الطبع والنشر. لعرض نسخة من هذه الرخصة، قم بزيارة http://creativecommo ns.org/licenses/by-nc-nd/4.0/.
© المؤلفون 2025
© المؤلفون 2025
قسم هندسة المعادن والمواد، المعهد الوطني للتكنولوجيا، Tiruchirappalli، تاميل نادو، الهند. قسم علوم الحاسوب والهندسة، معهد ب.س. عبد الرحمن كريسنت للعلوم والتكنولوجيا، تشيناي، تاميل نادو، الهند. قسم تطبيقات الحاسوب، المعهد الوطني للتكنولوجيا، Tiruchirappalli، تاميل نادو، الهند. البريد الإلكتروني: kselvakumar@nitt.edu
Journal: Scientific Reports, Volume: 15, Issue: 1
DOI: https://doi.org/10.1038/s41598-025-91282-8
PMID: https://pubmed.ncbi.nlm.nih.gov/40011613
Publication Date: 2025-02-26
DOI: https://doi.org/10.1038/s41598-025-91282-8
PMID: https://pubmed.ncbi.nlm.nih.gov/40011613
Publication Date: 2025-02-26
OPEN
An adaptive ensemble feature selection technique for modelagnostic diabetes prediction
Ensemble learning aggregates several models’ outputs to improve the overall model’s performance. Ensemble feature selection separating the appropriate features from the extra and non-essential features. In this paper, the main focus will be to expand the scope of Ensemble Learning to include Feature Selection. We will propose an Ensemble Feature Selection Method called AdaptDiabfor Diabetes Prediction that is Model-Agnostic. Our approach combines diverse feature selection techniques, such as filter and wrapper methods, harnessing their complementary strengths. We have used an adaptive combiner function, which dynamically selects the most informative features based on the characteristics of the ensemble members. We demonstrate the effectiveness of our proposed AdaptDiab method through empirical studies using various classification models. Empirical Results of Our Proposed Ensemble Feature Selection Model outperforms traditional methods. This paper contributes to Ensemble Learning Methods and provides a Practical and Better Framework for Feature selection.
Keywords Ensemble learning, Feature selection, Diabetes prediction, Multi-method, Model-agnostic
Diabetes is a primary global health concern with significant economic and societal burdens. Early detection and intervention are crucial for preventing severe complications and improving patient outcomes
Diabetes is a primary global health concern with significant economic and societal burdens. Early detection and intervention are crucial for preventing severe complications and improving patient outcomes
Additionally, irrelevant or redundant features can hinder the model’s identifying genuinely informative patterns. These challenges necessitate robust feature selection techniques to identify the most relevant features and improve the accuracy and generalizability of diabetes prediction models. Feature selection selects relevant and non-redundant features from an ample feature space. In many machine learning and pattern recognition applications, feature selection is used to select the optimal feature set from the feature space to train the learning model.
High-dimensional datasets with many features result in increased computational complexity, overfitting, and reduced generalization performance. Machine learning has emerged as a promising tool for predicting diabetes risk, allowing for preventative measures and better patient management. However, existing machine learning approaches encounter several challenges, including data quality issues, lack of interpretability, and limited generalizability
by leveraging the strength of numerous feature selection techniques as a synergistic method. In the ensemble feature selection method, multiple feature selection techniques are combined to produce an optimal subset of features using a combination of feature ranking that improves accuracy. The ensemble feature selection method ensures robustness through diversity, comprehensive exploration, noise reduction, and enhanced stability. In the first step of the ensemble method, a set of different feature selectors is chosen, and each selector provides a sorted order of features. The second step aggregates the selected subsets of features using different aggregation techniques. This research investigates the effectiveness of the model-agnostic AdaptDiab architecture in improving the performance of diabetes prediction models compared to traditional feature selection techniques.
Related works
The quality of data used for training machine learning models significantly impacts their accuracy. Issues like missing values, imbalanced datasets, and noisy data can hinder model performance. The approach proposed
Feature selection plays a crucial role in enhancing the performance of classification tasks. By selecting a subset of relevant features, researchers have observed significant improvements in model accuracy
Several feature selection techniques have been established to achieve this goal, each with strengths and limitations. Filter methods like chi-square
To overcome the limitations of individual techniques, researchers have explored ensemble feature selection methods that combine the strengths of multiple approaches. These methods have been shown to improve robustness and reduce bias compared to a single technique
In conclusion, feature selection offers a powerful tool for improving classification performance. While various techniques exist, each with advantages and disadvantages, the field actively explores ensemble methods for even more robust and effective feature selection.
Preprocessing
Data preprocessing is an essential step in the data analysis pipeline that plays a vital role in enhancing the quality and reliability of the dataset for subsequent modeling tasks. It involves a series of operations designed to clean, transform, and organize raw data to make it suitable for analysis by machine learning algorithms. The real-world datasets are often noisy, incomplete, or contain irrelevant information, which can adversely impact the performance of predictive models. The primary objectives of preprocessing are to address these challenges, improve data quality, and create a more conducive environment for accurate and meaningful model training.
These are the following methods that we used for preprocessing:
(1)) Replacing null values with mean: Missing values in a dataset can cause issues during model training, leading to biased results and reduced accuracy. Filling null values with the mean ensures that missing data does not disrupt the overall statistical characteristics of the feature. This approach maintains data integrity and prevents the loss of valuable information.
(2) Handling Outliers: Outliers can distort statistical measures, leading to biased model training and compromised generalization. Outliers can skew data distribution and adversely affect specific models’ performance. Removing outliers based on the IQR ensures a more robust and representative dataset.
The lower (Q1) and upper (Q3) quartiles are calculated for a feature Xi. The IQR is then determined as
(3) Normalization: Features with varying scales can lead to biased model training, as certain features may dominate the learning process. Normalization ensures that features with different scales contribute equally to the model training process. It improves convergence and stability in algorithms sensitive to input features’ scale.
(3) Normalization: Features with varying scales can lead to biased model training, as certain features may dominate the learning process. Normalization ensures that features with different scales contribute equally to the model training process. It improves convergence and stability in algorithms sensitive to input features’ scale.
For a feature
where
(4) Oversampling with SMOTE
(4) Oversampling with SMOTE
SMOTE generates synthetic instances for the minority class by interpolating between existing cases. Given a minority instance
where
Replacing missing values with the remaining data’s mean ensures a complete ensemble-based feature selection analysis dataset. It allows the ensemble feature selection methods to evaluate features based on their distribution within the diabetic and non-diabetic populations. Also, it leads to a more accurate selection of features that discriminate between the two groups. IQR-based outlier removal helps identify and eliminate outliers that might disproportionately influence the choice of features by ensemble feature selection algorithms. This approach ensures ensemble feature selection focuses on the core trends within the diabetic and non-diabetic populations, leading to a more robust selection of features representing most patients. For example, an unusually high number of pregnancies for a single data point might be an outlier. It shouldn’t unduly influence the selection of features related to pregnancy as a risk factor. The Pima Indian Medical Association dataset
Replacing missing values with the remaining data’s mean ensures a complete ensemble-based feature selection analysis dataset. It allows the ensemble feature selection methods to evaluate features based on their distribution within the diabetic and non-diabetic populations. Also, it leads to a more accurate selection of features that discriminate between the two groups. IQR-based outlier removal helps identify and eliminate outliers that might disproportionately influence the choice of features by ensemble feature selection algorithms. This approach ensures ensemble feature selection focuses on the core trends within the diabetic and non-diabetic populations, leading to a more robust selection of features representing most patients. For example, an unusually high number of pregnancies for a single data point might be an outlier. It shouldn’t unduly influence the selection of features related to pregnancy as a risk factor. The Pima Indian Medical Association dataset
By incorporating these preprocessing steps, the research aims to ensure a clean, balanced, and appropriately scaled dataset, thereby mitigating potential issues that could impact the performance of machine learning models during training and evaluation.
Materials and methods
Dataset
We use various materials and methods to analyze diabetes prediction thoroughly. The dataset we use in this study is the Pima Indian Medical Association Indians diabetes dataset
The glucose value ranges from 0 to 199 (the non-diabetic range is lower). The pregnancies have no missing values. The values of skin thickness and Insulin require imputation. The values of DBF range from 0.078 to 2.42 and need imputation. The dataset contains no categorical variables. Most features have skewed distributions, indicating the need for scaling or transformation for better model performance.
Feature selection
Feature selection is an essential step in machine learning that involves choosing relevant subsets of features from all the features to improve model performance, interpretability, and efficiency. Feature selection techniques are broadly classified into filter, wrapper, and embedded. In this experiment, we will use four feature selection filter types: ANOVA F-Score
ANOVA
ANOVA stands for anomaly detection of variance. It is also referred to as F-statistics.ANOVA is a statistical technique used to compare the mean values of two groups of participants. An ANOVA F-score determines the significance of specific features associated with a target variable. ANOVA (Anomaly detection of variance) is beneficial for classifying tasks that search for features that show significant deviation across classes.
The ANOVA F-Score for a feature
Where, MSR= Mean Square due to Regression, MSE=Mean Square due to Error, and F is ANOVA F-Score.
In the context of feature selection, higher ANOVA F- scores demonstrate significant differences in mean across classes. A higher ANOVA F-score indicates more significant variability between class means than withinclass variability, showing that a particular feature is essential for classification.
Fisher score
Fisher’s score or discriminant analysis is a statistical tool mainly used for binary classification tasks. It assesses the discriminative power of individual features by evaluating the variance ratio between classes and within classes. The goal is to identify features that maximize the separation between class means while minimizing the spread within each class.
The Fisher Score for feature
Where, Fi is the Fisher Score for feature
The numerator represents the squared difference between the means of the two classes, while the denominator is the sum of the variances within each class. The larger the Fisher Score, the better the feature discriminates between the two classes. Features with higher Fisher Scores are considered more relevant for classification tasks and are often selected for inclusion in predictive models.
Variance threshold
Variance Threshold involves removing features with low variance. Eliminating these low-variance features aims to improve model performance and computational efficiency.
For a feature
Vari is the variance of feature
The variance thresholding method involves setting a predefined threshold (
Remove feature
The variance threshold is beneficial in scenarios where features with slight variation do not contribute significantly to the model’s predictive power and may introduce noise.
The variance threshold is beneficial in scenarios where features with slight variation do not contribute significantly to the model’s predictive power and may introduce noise.
Point biserial
The Point Biserial Correlation Coefficient is a statistical measure that assesses the relationship between binary and continuous variables. The Point Biserial Correlation Coefficient ranges
For a binary target variable
Where,
The magnitude of
Classification models
This section provides an insightful overview of 5 diverse classification algorithms we used in our research, each with unique strengths and applications. These algorithms have been chosen to explore our dataset and proposed ensemble feature selection technique and compare it with traditional feature selection techniques. The five chosen classification algorithms are Gaussian Naive Bayes, Logistic Regression, Random Forest, Gradient Boosting, and MultiLayer Perceptron. Logistic Regression’s interpretability makes it a valuable benchmark for evaluation. SVMs are robust to high-dimensional datasets and effectively handle overlapping data points using kernel methods. It Highlights how feature selection techniques improve model performance by reducing irrelevant features, which is critical for SVM to avoid overfitting. Gradient Boosting Demonstrates robustness by enhancing the performance of a highly complex and adaptive model. The chosen models represent a mix of linear (LR) and non-linear (SVM, RF, GBM), ensuring the generalizability of ensemble feature selection across varied learning paradigms. This classification algorithm array ensures a thorough evaluation of our proposed ensemble feature selection technique. The subsequent sections delve into each classification model’s specific methodologies and results, providing an understanding of their contributions to the overall predictive framework.
Gaussian Naive Bayes
Gaussian Naive Bayes is a probabilistic classification algorithm based on Bayes’ theorem, which calculates the probability of a hypothesis given the observed evidence. It is designed explicitly for datasets with continuous features, assuming that the values of each feature follow a Gaussian (normal) distribution within each class.
The probability of an instance
Where,
Gaussian Naive Bayes is chosen for the following reasons: (1) Assumption of feature independence, (2) Simplicity and Interpretability, and (3) Robustness to noisy data.
By incorporating Gaussian Naive Bayes in the ensemble of classification models, the research aims to provide insights into the adaptability and effectiveness of the proposed feature selection methodology.
Logistic regression
Logistic Regression is a widely used linear model for binary classification tasks. The model estimates the probability that an instance belongs to a particular class and makes predictions based on a logistic function. The sigmoid function is used to transform the output of a linear combination of features into a probability between 0 and 1 :
The logistic regression model is trained by optimizing these coefficients to maximize the likelihood of the observed outcomes.
Logistic Regression was selected as one of the classification models for evaluating the proposed ensemble feature selection technique for several reasons, such as linear decision boundary, interpretability, sensitivity to feature changes, and benchmark for simplicity. The analysis with Logistic Regression contributes to understanding how the ensemble approach influences both linear and non-linear models, emphasizing the versatility of the feature selection technique.
Random forest
Random Forest is an ensemble learning algorithm that builds many decision trees during training and merges their predictions to improve accuracy and robustness. It is known for its versatility, ability to handle complex relationships, and resistance to overfitting.
The Random Forestalgorithm combines the predictions of multiple decision trees. For a binary classification task, the probability of an instance belonging to class 1 can be expressed as an average over all the individual trees:
Random Forest was included as one of the classification models for evaluating the proposed ensemble feature selection technique due to the following considerations: Ensemble nature, robustness and generalization, feature importance, non-linearity, and interaction. Incorporating Random Forest into the ensemble of classification models enhances the research’s comprehensiveness, enabling a thorough examination of the proposed feature selection methodology’s performance across different learning paradigms and model complexities.
Gradient boosting
Gradient Boosting is an ensemble learning algorithm that builds a series of weak learners (typically decision trees) sequentially, with each tree compensating for the errors of its predecessors. It is a powerful and flexible algorithm known for its high predictive accuracy and ability to handle complex relationships in the data.
For a binary classification task, the prediction of an instance belonging to class 1 in a Gradient boosting model can be expressed as:
Gradient Boosting was chosen as one of the classification models to evaluate the proposed ensemble feature selection technique for the following reasons: sequential nature, ensemble characteristics, and handling nonlinearity. The model minimizes a loss function during training, and each subsequent tree is trained to correct the errors made by the previous trees. This analysis contributes to the broader assessment of the feature selection technique’s applicability across different ensemble learning paradigms.
Multilayer perceptron
A Multilayer Perceptron is an artificial neural network consisting of multiple layers of nodes, including input, hidden, and output layers. MLPscan learns complex non-linear relationships in data, making them suitable for various applications, including classification tasks.
For a binary classification task, the output of an MLP can be expressed as follows:
Where,
Multilayer Perceptron (MLP) was included in the ensemble of classification models for evaluating the proposed ensemble feature selection technique due to several key factors: non-linearity and complexity, representation learning, adaptability to high dimensional data, and benchmark for deep-learning models. By incorporating Multilayer Perceptron into the ensemble of classification models, the research aims to comprehensively evaluate the proposed feature selection methodology across diverse neural network architectures, offering insights into its adaptability and efficacy in deep learning.
Proposed architecture
AdaptDiab – Adaptive Diabetes Prediction Feature Selection Tool In this research, we introduce anAdaptDiab algorithm to enhance the effectiveness of feature selection algorithms. Many traditional feature selection approaches rely on a single algorithm, which may overlook important information in the data. In contrast, the AdaptDiabarchitecture presented here combines the outputs of different feature selection techniques to create a collaborative decision-making process that leverages the strengths of various methods, as shown iFig. . 1.
The ensemble approach is versatile, adaptive, and robust. Ensemble learning combines predictions from several models to enhance forecasting accuracy and reliability. The goal is to reduce model errors or biases using an ensemble’s collective intelligence. Ensemble buildings can be classified as homogeneous and heterogeneous ensemble techniques
Fig. 1. The proposed architecture of the AdaptDiab Technique.
heterogeneous ensemble combines the result of different feature selection methods. The heterogeneous approach takes account of the strengths and weaknesses of the individual techniques.
Our proposed approach combines the power of both homogeneous and heterogeneous ensemble techniques by splitting the processed data into subsets, applying feature selection algorithms on them similar to the homogenous ensemble feature selection technique, and using different types of feature selection algorithms on the same data identical to the heterogenous ensemble feature selection technique.
The AdaptDiab splits processed data into three subsets using a random shuffle. Four feature selection techniques, ANOVA F-score, fisher score, variance threshold, and Point biserial, select features from 3 data subsets. The combiner function in the AdaptDiab architecture is used to aggregate the results from all individual feature selection algorithms applied to different subsets of data. This combiner function produces the final selected features using the AdaptDiab technique.
The combiner function in AdaptDiab’s architecture works based on the principle of assigning weights to each feature selection algorithm, and these weights determine the contribution of each feature selection technique to the results of the combined ensemble feature selection algorithm. The weights for each feature selection algorithm are assigned using mutual information.
Mutual information between two random variables is a non-negative value, which measures the dependency between the variables. It equals zero if two random variables are independent; higher values mean higher dependency. This mutual information is used to find the dependency between each feature selected using the individual feature selection algorithm and the target variable.
The combiner function assigns a mutual information score for each feature. The average of these mutual information scores obtained from each feature selected is the mutual information score of that particular feature selection algorithm. The average of all these mutual information scores from each feature selection algorithm processed that particular data subset is the mutual information score of that specific data subset. Based on this average mutual information score, weightage is given to results obtained from each data subset, and based on this weightage, the combiner function in the AdaptDiab architecture selects features from the features proposed by different feature selection algorithms from different data subsets.
Results and discussion
The evaluation was divided into two stages. The first focused on assessing the feature relevance; thus, we compared the performance of several classification algorithms using all features selected by existing feature selection algorithms with the performance achieved when we used subsets of relevant features chosen by theAdaptDiab approach.
In the second stage, the stability of the subset of relevant features was calculated. We calculate stability to measure the consistent performance of the tool across different data subsets, robustness, and interpretation. Stability metrics like the Jaccard Index help ensure that your model is not overfitting or excessively sensitive to the particularities of a specific dataset, which is especially important in real-world applications.
Performance
Our proposed AdaptDiab technique selects a feature subset from the whole feature set. As mentioned in section “Preprocessing”, we train our models in these features. First, we train it on the entire feature set, then on individual feature subsets selected by individual feature selection methods, and then on the feature subset selected by our proposed feature selection tool. We calculate the models’ performance on each feature subset.
Table 1 shows the accuracy score of all the models on each feature subset. It indicates that models that use features selected by our AdaptDiab technique outperform features selected by other individual feature selection techniques in model performance.
Figure 2 shows the plot for comparing accuracy scores of different feature selection techniques in the Gaussian Naive Bayes model. The plot shows that the proposed AdaptDiab approach performs better than other feature selection techniques.
| Models | ANOVA F-Score | Fisher Score | Variance Threshold | Point Biserial | AdaptDiab |
| Gaussian Naive Bayes | 76 | 75 | 75 | 75 | 79 |
| Logistic Regression | 76 | 76 | 76 | 75 | 80 |
| Random Forest | 75 | 66 | 66 | 66 | 78 |
| Gradient Boosting | 77 | 75 | 76 | 75 | 80 |
| Multilayer Perceptron | 77 | 76 | 78 | 75 | 81 |
Table 1. Shows the comparison of the average accuracy scores of different models.
Gaussian Naive Bayes
Fig. 2. Comparison of FS techniques in the Gradient Naive Bayes model.
Logistic Regression
Fig. 3. Comparison of FS techniques in the Logistic Regression model.
Fig. 4. Comparison of FS techniques in the Random Forest model.
Figure 3 shows the plot for comparing the accuracy scores of different feature selection techniques in the Logistic Regression model. The plot shows that the proposed AdaptDiab approach performs better than other feature selection techniques.
Figure 4 shows the plot for comparing the accuracy scores of different feature selection techniques in the Random Forest model. The plot shows that the proposed AdaptDiab approach performs better than other feature selection techniques.
Figure 5 shows the plot for comparing the accuracy scores of different feature selection techniques in the Gradient Boosting model. The plot shows that the proposed AdaptDiab approach performs better than other feature selection techniques.
Figure 6 shows the plot for comparing the accuracy scores of different feature selection techniques in the Multilayer Perceptron model. The plot shows that the proposed AdaptDiab approach performs better than other feature selection techniques.
Gradient Boosting
Fig. 5. Comparison of FS techniques in the Gradient Boosting model.
Multilayer Perceptron
Fig. 6. Comparison of FS techniques in the Multilayer Perceptron model.
ANOVA F-score technique might favor features with high variance, which could be informative for some models like Gaussian naive Bayes but lead to potentially irrelevant features for other models like a random forest. By combining diverse feature techniques, AdaptDiab can capture various informative features, including those with high and low variance but with interaction effects with other features. It shows our proposed technique’s consistent performance across multiple models.
The logistic regression model thrives on features that effectively separate classes. Point Biserial’s strength lies in identifying features that distinguish between classes. By combining different techniques, AdaptDiab selects a mixture of features that capture class separability and potentially informative features with a more complex relationship to diabetes. This broader selection could contribute to the consistent performance of our ensemble feature selection across various models, including Logistic Regression.
The random forest model is known for handling complex interactions between features and feature importance scores. Variance threshold techniques might remove features with subtle variations that could hold valuable information for capturing complex interactions, potentially explaining its lower performance in Random Forest than other models. Our approach might better identify these subtle variations and interaction effects.
The Gradient boosting model performs well with diverse features, including those with lower individual importance. Some techniques, like Fisher Score or ANOVA F-Score, might prioritize features with high individual variance, potentially missing features that contribute within the boosting framework. By combining methods, our approach might more likely capture this broader range of features, including those that are less prominent individually but contribute to the boosting process. It could explain why our AdaptDiabperforms well in Gradient Boosting compared to some individual techniques.
The tool is handy in real-world diabetes prediction applications, where datasets are often noisy and highdimensional. By consistently selecting the most critical features across different models, AdaptDiab ensures better generalization and reduces overfitting, making it highly applicable in healthcare settings. This ability to outperform existing methods across multiple models makes AdaptDiab a powerful tool for developing reliable and interpretable diabetes prediction systems.
In conclusion, our proposed AdaptDiab approach demonstrates consistent and superior performance in feature selection across various machine learning models for diabetes prediction compared to individual feature selection techniques. This improvement can be attributed to several factors. The ensemble approach mitigates the limitations of individual techniques by leveraging their diverse strengths. It avoids biases towards specific feature types, explores complex feature interactions, and potentially reduces the impact of noisy data.
The consistently high accuracy scores achieved byAdaptDiab across models like Gaussian Naive Bayes, Logistic Regression, Random Forest, Gradient Boosting, and Multilayer Perceptron strongly support its effectiveness.
Stability
Jaccard coefficient
Mathematically, the Jaccard index
Where,
The Jaccard index ranges from 0 to 1 , where
In summary, the Jaccard index quantitatively measures the similarity between sets. It is a valuable tool for assessing stability in feature selection algorithms, clustering methods, or any scenario where comparing the overlap between different subsets of elements is relevant.
The subset of features generated to support the classification of epileptiform events was evaluated to determine AdaptDiab’s reliability. First, the AdaptDiab method was used ten times to create relevant features with ten random samples from the dataset. Then, the ten subsets generated were compared according to the Jaccard index to determine their difference. For ten executions, the AdaptDiab method obtained the same subset of relevant features, which means that the stability measured by the Jaccard index is perfect in
This work demonstrates that the ensemble feature selection method selects the same relevant features (
Unstable feature selection methods can lead to highly variable sets of features depending on the specific data sample used. This variability can hinder the model’s generalizability, meaning it might perform well in the particular training data but not on unseen data. The stability of our approach helps mitigate this issue by consistently selecting a core set of informative features, leading to models that are likely to perform well on new data. When the AdaptDiab consistently identifies the same features, it strengthens our confidence in their importance for classifying epileptiform events.
In summary, the high stability of our AdaptDiabtechnique ensures reliable feature selection, reduces variability in model performance, and increases our confidence in the identified features for accurate classification of epileptiform events. This stability is a significant advantage of our approach compared to methods that might exhibit high variability in feature selection.
Unlike traditional feature selection methods that may favor specific models or metrics, AdaptDiab consistently enhances the performance of five distinct machine learning models across all evaluation metrics.
Conclusion and future work
In this paper, we have introduced AdaptDiab, an ensemble of feature selection, which combines subsets of features selected by different filters, ANOVA F-score, Fisher score, variance threshold, and Point biserial that yields an optimal subset of features. To evaluate the performance ofAdaptDiab, we have used different classifiers, Gaussian naive Bayes, Logistic Regression, Random forest, Gradient boosting, and Multilayer perception on the Pima Indian Medical Association Indians diabetic dataset. From our average classification accuracy (ACA) analysis, it can be observed that the proposed AdaptDiab technique mostly overcomes the local optimal problem of the individual filters, especially for high-dimensional datasets. The excellent stability achieved by the AdaptDiabtechnique shows consistency in feature selection, robustness to variation, generalizability, and reduced overfitting.
AdaptDiab can be used for Improved Diagnosis and Screening, Personalized Treatment Plans, Integration into Clinical Decision Support Systems, and Educational and Training Use. Its model-agnostic nature makes AdaptDiab applicable to diverse datasets, ensuring its utility in large-scale healthcare systems or other complex data domains. AdaptDiab reduces false positives/negatives by improving predictive accuracy, avoiding unnecessary medical tests or treatments, and saving resources. While designed for diabetes classification, AdaptDiab has potential applications in other fields like agriculture (predicting crop diseases), material science (selecting critical parameters in experimental studies), and finance (identifying key factors influencing credit risk).
Future work will explore methods for feature interpretation, visualization, and domain-specific validation to understand the underlying factors driving predictive performance. Investigate the role of ensemble diversity in the ensemble feature selection technique and its impact on performance and stability.
Data availability
The dataset used in this study was already available in the Internet resources.https://www.kaggle.com/datasets/ uciml/pima-indians-diabetes-database.
Received: 8 October 2024; Accepted: 19 February 2025
Published online: 26 February 2025
Published online: 26 February 2025
References
- Centers for Disease Control and Prevention. National Diabetes Statistics Report (2023). https://www.cdc.gov/diabetes/php/datare search/?CDC_AAref_Val=https://www.cdc.gov/diabetes/data/statistics-report/index.html
- AlZu’bi, S. Diabetes monitoring system in smart health cities based on Big Data intelligence. Future Internet (2023).
- Hao, J., Wang, C. & Yang, G. Annealing genetic GAN for imbalanced web data learning. IEEE Trans. Multim. (2021). https://doi. org/10.1109/TMM.2021.3120642.
- Jiang, Z., Zhao, L. & Lu, Y. A semi-supervised resampling method for class imbalanced learning. Elsevier Expert Syst. Appl. (2023). https://doi.org/10.1016/j.eswa.2023.119733.
- Hongfang, Z. A diabetes prediction model based on Boruta feature selection and ensemble learning. BMC Bioinform. (2023).
- Francesco & Prendin Machine Learning-Based Feature Selection Techniques for Diabetes Prediction (Current Medical Research and Opinion, 2021).
- Chen, C., Zhou, K., Wang, Z., Zhang, Q. & Xiao, R. All answers are in the images: A review of deep learning for cerebrovascular segmentation. Comput. Med. Imaging Graph. 107, 102229. https://doi.org/10.1016/j.compmedimag.2023.102229 (2023).
- Han & Kamber. Feature Selection for Knowledge Discovery and Data Mining (MIT Press, 1999) Chap. 6.
- Salton & McGill. Introduction to Information Retrieval (McGraw-Hill, Chap. 11, 2005).
- Aha, D.W. & Bankert, R.L. A Comparative Evaluation of Sequential Feature Selection Algorithms (1996).
- Kuhn, M. & Johnson, K. Feature Engineering and Selection: A Practical Approach for Predictive Models, Chap. 11 (2021).
- Härdle, W.K. & Prastyo, D.D. Embedded Predictor Selection for Default Risk Calculation: A Southeast Asian Industry Study, Chap. 7.
- Zou, H. & Hastie, T. Regularization and variable selection via the elastic net (2004).
- Saeys et al. Ensembles for Feature Selection: A Review and Future Trends (Springer, 2016).
- Mohsen & Moshki. Scalable feature selection in high-dimensional data based on GRASP. Appl. Artif. Intell. (2015).
- Chawla, N.V. SMOTE: Synthetic minority over-sampling technique. J. Artif. Intell. (2002).
- UCI Machine Learning Repository. https://archive.ics.uci.edu/dataset/34/diabetes
- Keselman, H.J., Kowalchuk, R.K., Laureen, L.L., Petoskey, M.D., Keselman, J.C. & Levin, J.R. An Analysis of Their ANOVA, MANOVA (2002).
- Hastie, T., Tibshirani, R. & Friedman, J. The Elements of Statistical Learning (2009).
- Guyon & Elisseeff. An introduction to variable and feature selection. J. Mach. Learn. Res. (2003).
- Glass, V. & Hopkins, K.D. Statistical methods in education and psychology. Gene (1995).
- Seijo-Pardo, B., Porto-Díaz, I., Bolón-Canedo, V. & Alonso-Betanzos, A. Ensemble feature selection: Homogeneous and heterogeneous approaches. Knowl.-Based Syst. 118 (2017).
- Jaccard, P. ‘Etude comparative de la distribution florale dans une portion des alpes et des jura’ (1901).
Acknowledgements
Nil.
Author contributions
Natarajan K, Dhanalakshmi Baskaran, and Selvakumar Kamalanathan Authors are done equal contribution on this research work.
Funding
No funding was provided for this research work.
Declarations
Ethics approval and consent to participate
This work was approved by the “NIT Tiruchirappalli.” All procedures performed in this study followed the ethical standards of the institution and national research committee, as well as its later amendments or comparable ethical standards. Also, informed Consent was obtained from all participants before their inclusion in the study.
Consent for publication
The dataset used in this study was benchmark data. Hence, no issues cover identifiable information such as images, personal details, or any other information that could potentially identify a participant.
Competing interests
The authors declare no competing interests.
Additional information
Correspondence and requests for materials should be addressed to S.K.
Reprints and permissions information is available at www.nature.com/reprints.
Publisher’s note Springer Nature remains neutral with regard to jurisdictional claims in published maps and institutional affiliations.
Reprints and permissions information is available at www.nature.com/reprints.
Publisher’s note Springer Nature remains neutral with regard to jurisdictional claims in published maps and institutional affiliations.
Open Access This article is licensed under a Creative Commons Attribution-NonCommercial-NoDerivatives 4.0 International License, which permits any non-commercial use, sharing, distribution and reproduction in any medium or format, as long as you give appropriate credit to the original author(s) and the source, provide a link to the Creative Commons licence, and indicate if you modified the licensed material. You do not have permission under this licence to share adapted material derived from this article or parts of it. The images or other third party material in this article are included in the article’s Creative Commons licence, unless indicated otherwise in a credit line to the material. If material is not included in the article’s Creative Commons licence and your intended use is not permitted by statutory regulation or exceeds the permitted use, you will need to obtain permission directly from the copyright holder. To view a copy of this licence, visit http://creativecommo ns.org/licenses/by-nc-nd/4.0/.
© The Author(s) 2025
© The Author(s) 2025
Department of Metallurgical and Materials Engineering, National Institute of Technology, Tiruchirappalli, Tamilnadu, India. Department of Computer Science and Engineering, B.S. Abdur Rahman Crescent Institute of Science and Technology, Chennai, Tamilnadu, India. Department of Computer Applications, National Institute of Technology, Tiruchirappalli, Tamilnadu, India. email: kselvakumar@nitt.edu