DOI: https://doi.org/10.1515/econ-2022-0080
تاريخ النشر: 2024-01-01
تقييم أداء تأثير الانتقال الاقتصادي للمنظمات غير الحكومية البيئية: أدلة من الصين
تم الاستلام في 15 ديسمبر 2023؛ تم القبول في 23 فبراير 2024
الملخص
في هذه المقالة، يتم تحليل تجربة اقتصادية طبيعية في الصين ويتم اقتراح تقييم أداء تأثير النقل الاقتصادي للوائح البيئية غير الرسمية المفروضة من خلال قناة المنظمات غير الحكومية البيئية (ENGOs). وقد وُجد أن المنظمات غير الحكومية البيئية لها تأثير سلبي كبير على نسبة الموقع الاقتصادي الإجمالية لستة صناعات ملوثة رئيسية. يظهر تأثير النقل الاقتصادي من المنظمات غير الحكومية البيئية تباينًا صناعيًا وإقليميًا، حيث يكون التأثير أقوى بين الصناعات السهلة النقل وفي المناطق الموجهة نحو السوق. الآلية الأساسية هي المنظمات غير الحكومية البيئية، حيث يمكن أن تحفز اللوائح البيئية غير الرسمية الشركات على تعزيز استثماراتها في الحوكمة البيئية، مما يؤدي في النهاية إلى طرد هذه الصناعات الملوثة اقتصاديًا.
1 المقدمة
2 مراجعة الأدبيات والآلية النظرية
2.1 مراجعات الأدبيات
2.2 الآليات النظرية
يمارس ضغطًا سياسيًا على المسؤولين الحكوميين المحليين فيما يتعلق بالقضايا البيئية. على مدى العشرين عامًا الماضية، درس العلماء بشكل موسع دور المنظمات غير الحكومية البيئية في القوانين والسياسات البيئية. على الصعيد العالمي، يمكن أن تؤدي آثار التلوث على صحة الإنسان إلى طلب قوي من الجمهور على السياسات البيئية والطاقة من أجل تسريع العمل الحكومي وتحسين المساءلة (Grano، 2012). تمتلك المنظمات غير الحكومية البيئية العديد من الوسائل، مثل وسائل الإعلام، للتأثير على إدارة البيئة والسياسات، وتسليط الضوء على الحاجة إلى تنفيذ القوانين، وتمثيل مصالح الفئات الضعيفة.
إصدار توجيهات جديدة وبدء حركات اجتماعية (Li et al.، 2018a،b). في هذا الصدد، أكدت النظرية المعرفية على أهمية المواقف والمعتقدات والأيديولوجيا والقيم الشخصية في دفع سلوك الشركات. بشكل خاص، عندما تكون الشركات موجودة في مجتمع يدعو إلى بيئة مستدامة، قد تميل إلى تنفيذ تدابير مماثلة لتعزيز التماسك الاجتماعي وإزالة الحواجز بينها (Sun et al.، 2019).
استكشاف طرق إبداعية للاستفادة من الحجم والسرعة والأفكار المبتكرة في الحوكمة المؤسسية لزيادة الجهود التنظيمية. تحتاج المنظمات غير الحكومية البيئية أيضًا إلى التركيز على أدوار الشركات في حماية البيئة في مراحل مختلفة من دورة حياة المنتج، بدءًا من مصادر المواد إلى التصنيع، والتجزئة، واستخدام المستهلك. يتم إجبار معظم الشركات على تقليل شدة الأثر البيئي لكل وحدة إنتاج، بشكل رئيسي من خلال الأجهزة الموفرة للطاقة والممارسات الموفرة للطاقة التي تشجع عليها المنظمات غير الحكومية البيئية (داوفرني وليستر، 2012).
3 المنهجية
3.1 النموذج
3.2 الصناعات الملوثة
يتم حساب شدة كل شركة. عادةً ما يتم قياس شدة التلوث ككمية التلوث المنبعثة لكل وحدة من الإنتاج أو الإيرادات.
3.3 نقل الصناعات
التنظيمات وكذلك منطقة وسط الصين. بمجرد تعزيز اللوائح البيئية في المناطق المجاورة، قد تقوم الشركات الملوثة في تلك الأماكن بالانتقال إلى المناطق المحلية، مما يحول هذه المناطق إلى ملاذات للتلوث. ومع ذلك، لم تحظَ تأثيرات الانتقال الاقتصادي للمنظمات البيئية غير الحكومية باهتمام كبير في الأوساط الأكاديمية حتى الآن. على العكس من ذلك، يهدف هذا المقال إلى سد هذه الفجوة البحثية من خلال فحص تجريبي. بعد تعريف الصناعات الملوثة المعنية بالمنظمات البيئية غير الحكومية كما هو موضح أعلاه، نركز بعد ذلك على مؤشر الانتقال للصناعات الملوثة. اعتمدت الدراسات السابقة على نسبة الموقع للصناعات الملوثة أو حصة قيمة الإنتاج لصناعات التلوث في منطقة ما من إجمالي إنتاج البلاد كمقياس للصناعات الملوثة. تعكس هذه المؤشرات جزئيًا مستوى تطوير بعض الصناعات الملوثة في منطقة معينة. حيث نهدف إلى تحديد ما إذا كان انتقال الصناعات الملوثة يتأثر بتطور المنظمات البيئية غير الحكومية، فإن مؤشرات الصناعة والنمو تفشل في عكس ما إذا كانت هذه الصناعات قد انتقلت أم لا. في النهاية، اخترنا نسبة موقع التوظيف، مما يدل على منطقة الدراسة كمنطقة.
3.4 المتغيرات التفسيرية
تاريخ التأسيس، حجم المنظمة (عدد الأفراد)، ومجال العمل، وتحدد مكان تسجيل ENGO على مستوى المقاطعة-المدينة-المقاطعة. مع هذه البيانات، يمكننا جمع المعلومات ذات الصلة عن كل ENGO يدويًا ثم تجميع تلك البيانات إلى مستوى المقاطعة-المدينة والحصول على بيانات ENGO على مستويين إداريين. يجب ملاحظة أن البيانات المتاحة حاليًا شاملة نسبيًا، على الرغم من أنها ليست مثالية. تشمل البيانات ما إذا كانت هناك أي ENGOs (engo)، عدد ENGOs (engodata)، وعدد موظفي ENGO (engopop).
3.5 الملخص والبيانات
المتغيرات التابعة: نسبة الموقع للتوظيف للست صناعات ملوثة في منطقة (poll_loc
من الصين، لذا نضيف 1 إلى كل نقطة بيانات ونتخذ لوغاريتمها.
4 نتائج
4.1 الانحدار المرجعي
| متغير | ملاحظات | معنى | الانحراف المعياري | من | ماكس |
| المتغير التابع | |||||
| موقع الاقتراع | 527 | 1.067 | 0.544 | 0.003 | 3.128 |
| موقع_الاستطلاع1 | ٥٢٧ | 1.078 | 0.961 | 0.002 | 7.709 |
| موقع الاقتراع 2 | 510 | 0.928 | 0.740 | 0.005 | 5.439 |
| موقع الاستطلاع 3 | ٤٩٣ | 0.840 | 0.887 | 0.000 | 3.831 |
| موقع الاقتراع 4 | 527 | 0.967 | 0.342 | 0.043 | ٢.٦١٩ |
| موقع الاستطلاع 5 | 510 | 1.060 | 0.756 | 0.012 | 6.985 |
| موقع الاقتراع 6 | 527 | 1.172 | 0.747 | 0.185 | 10.348 |
| المتغير التفسيري الرئيسي | |||||
| إنغوداتا | 527 | 3.154 | 6.564 | 0 | 61 |
| إنغوبوب | 527 | ٢.٩٧٧ | ٢.٤٩٦ | 0 | 8.226 |
| إنينغوبوب | 527 | ٢.٩٧٧ | ٢.٤٩٦ | 0 | 8.226 |
| إنينغودا | 527 | 0.897 | 0.911 | 0 | ٣.١٢٧ |
| متغير التحكم | |||||
| Inpgdp | 527 | 8.815 | 1.218 | ٣.٧٦٩ | 11.300 |
| Inpgdp2 | 527 | 79.193 | ٢٠٫٦٧٣ | ٢٢٫٧٤٣ | 127.699 |
| الهند | 527 | ٤٥.٣١٠ | 8.193 | 19.262 | 60.133 |
| إنكاب_لاب | 527 | 0.806 | 0.454 | 0.254 | 3.351 |
| استثمار أجنبي مباشر | 527 | 2.301 | 2.356 | 0.001 | ١٣.٦٥٢ |
| إندين | 527 | ٥.٢٦٩ | 1.464 | 0.723 | 8.245 |
| في | ٥٢٧ | 0.128 | 0.081 | 0.037 | 0.521 |
في العمود (2)، نضيف متغيرات تحكم أخرى. تظهر نتائج التقدير أنه عند التحكم في تأثيرات الزمن الثابتة وتأثيرات المنطقة الثابتة، بغض النظر عن العوامل الأخرى، فإن معاملات المتغير التفسيري الأساسي (lnengodata) هي -0.014 و -0.012 على التوالي، وهي سلبية بشكل كبير، مما يشير إلى أنه عندما يزيد engodata بنسبة نقطة مئوية، ينخفض poll_loc بحوالي
مع وجود تنظيمات بيئية أقل صرامة. في هذه المقالة، نجد أن الصناعات الملوثة تتجمع في المناطق التي تكون فيها المنظمات غير الحكومية أضعف، بينما في المناطق التي تكون فيها المنظمات البيئية غير الحكومية ناضجة نسبيًا، يتم تقليل أهمية الصناعة الملوثة بشكل كبير. السبب المحتمل هو أنه في منطقة تطورت فيها المنظمات البيئية غير الحكومية، تحت تأثير هذه المنظمات، عزز السكان وعيهم البيئي وزادوا من احتياجاتهم لجودة البيئة. إذا كانت هناك مؤسسات ملوثة في الجوار، فسيتفاعل السكان مع الحكومة من خلال وسائل مثل حماية حقوقهم والإبلاغ، مما يدفع الحكومة إلى اتخاذ تدابير إدارة بيئية أكثر صرامة. تحت ضغط حماية البيئة، يجب على المؤسسات الملوثة أن تختار الانتقال إلى مناطق أخرى.
| سيارة كهربائية | DV: موقع الاقتراع | |||
| (1) | (2) | (3) | (4) | |
| إنينغودا | -0.014*** (0.004) | -0.012*** (0.004) | ||
| Inengopop | -0.028*** (0.008) | -0.028*** (0.008) | ||
| Inpgdp | 0.613** (0.242) | 0.644*** (0.237) | ||
| Inpgdp2 | -0.039*** (0.009) | -0.039*** (0.009) | ||
| صناعة | -0.008* (0.004) | -0.009** (0.004) | ||
| إنكاب_لاب | 0.090* (0.052) | 0.102** (0.052) | ||
| استثمار أجنبي مباشر | -0.021*** (0.008) | -0.021*** (0.008) | ||
| إندين | 0.172 (0.211) | 0.194 (0.211) | ||
| في | -2.498*** (0.588) | -2.504*** (0.584) | ||
| أثر ثابت للمنطقة | ي | ي | ي | ي |
| أثر ثابت زمني | ي | ي | ي | ي |
| اختبار F | ٣.٥٧١ | ٥.٢٨٦ | ٣.٦٦٥ | ٥.٥٢٧ |
| (
|
[0.000] | [0.000] | [0.000] | [0.000] |
|
|
0.112 | 0.212 | 0.115 | 0.219 |
4.2 مناقشة قائمة على المنطقة
يؤدي ذلك إلى انخفاض في معامل الموقع للصناعات الملوثة الإجمالية في المنطقة. تُظهر الأعمدة (3) و(4) تأثير المنظمات البيئية غير الحكومية على الصناعات الملوثة في وسط غرب الصين. تُظهر نتائج التقدير أن المعاملات من النموذجين ليست ذات دلالة إحصائية ولا تختلف عن النموذجين السابقين، مما يشير إلى أن المنظمات البيئية غير الحكومية لا تقلل بشكل كبير من معامل الموقع للصناعات الملوثة في هذه المناطق. ويعود ذلك إلى أن المنظمات البيئية غير الحكومية في شرق الصين ناضجة نسبيًا وقد دفعت الصناعات الملوثة إلى وسط غرب الصين. في شرق الصين، تتبع العلاقة بين مستوى التنمية الاقتصادية ومعامل الموقع للصناعات الملوثة منحنى مقلوب على شكل حرف U ذو دلالة إحصائية، بينما يوجد مثل هذا المنحنى أيضًا في وسط غرب الصين، إلا أنه ليس ذا دلالة إحصائية. بعض المتغيرات الضابطة الأخرى ليست ذات دلالة إحصائية، لكن علامات المعاملات تتوافق بشكل أساسي مع تلك الناتجة عن الانحدار المرجعي.
4.3 اختبار المتانة
| سيارة كهربائية | DV: موقع الاقتراع | |||
| شرقي | الوسط الغربي | |||
| (1) | (2) | (3) | (4) | |
| إنينغودا | -0.008** (0.003) | 0.010 (0.016) | ||
| Inengopop | -0.016** (0.006) | -0.031 (0.033) | ||
| Inpgdp | 1.089*** (0.295) | 1.187*** (0.287) | 0.402 (0.355) | 0.246 (0.356) |
| Inpgdp2 | -0.048*** (0.013) | -0.051*** (0.013) | -0.021 (0.014) | -0.013 (0.013) |
| صناعة | 0.003 (0.006) | 0.001 (0.006) | -0.016*** (0.006) | -0.016*** (0.006) |
| إنكاب_لاب | 0.047 (0.048) | 0.063 (0.049) | 0.151 (0.098) | 0.118 (0.101) |
| استثمار أجنبي مباشر | -0.004 (0.011) | -0.005 (0.011) | -0.019 (0.013) | -0.022* (0.012) |
| إندين | -0.061 (0.181) | -0.069 (0.180) | 0.924** (0.464) | 0.941** (0.464) |
| في | 0.947 (1.669) | 0.682 (1.678) | -2.753*** (0.731) | -3.016*** (0.742) |
|
|
187 | 187 | ٣٤٠ | ٣٤٠ |
| أثر ثابت للمنطقة | ي | ي | ي | ي |
| أثر ثابت زمني | ي | ي | ي | ي |
| اختبار F | ٣.٤١٥ | ٣.٤٥٩ | ٣.٦٦٠ | 3.686 |
| (
|
[0.000] | [0.000] | [0.000] | [0.000] |
|
|
0.350 | 0.353 | 0.274 | 0.275 |
الصناعات من المنطقة الشرقية وقد أصبحت ملاذًا للصناعات الملوثة. نتائج التقدير للمتغيرات الضابطة الأخرى تتماشى مع نتائج التقدير من الانحدار المرجعي والانحدار الإقليمي السابق، لذا لن يتم تكرارها هنا.
4.4 مناقشة قائمة على الصناعة
أثر سلبي على نسب الموقع للصناعات الثلاث التالية: صناعة الورق، تصنيع الألياف الكيميائية، وصهر ومعالجة المعادن الحديدية.
4.5 مناقشة الاندماج الداخلي
| سيارة كهربائية | DV: موقع الاقتراع | |||||
| العينة الكاملة (1) | شرقي (2) | الوسط الغربي (3) | العينة الكاملة (4) | شرقي (5) | الوسط الغربي (6) | |
| إنينغودا | -0.009** | -0.008** | 0.040 | |||
| Inengopop | -0.016** | -0.021*** | 0.028 | |||
| Inpgdp | 0.773*** | 1.089*** | 0.489 | 1.187*** | 0.815*** | 0.317 |
| Inpgdp2 | (0.011) | -0.048*** | -0.042** | -0.051*** | -0.058*** | -0.028 |
| صناعة | -0.003 | 0.003 | -0.009 | 0.001 | -0.004 | -0.011 |
| إنكاب_لاب | 0.075 | 0.047 | 0.116 | 0.063 | 0.085* | 0.108 |
| استثمار أجنبي مباشر | (0.007) | -0.004 | 0.003 | -0.005 | -0.016** | -0.004 |
| إندين | 0.108 | -0.061 | 1.010** | -0.069 | 0.128 | 0.863* |
| في | (0.748) | 0.947 | -2.062* | 0.682 | -1.399* | -2.280** |
|
|
٤٥٩ | 187 | 272 | 187 | ٤٥٩ | 272 |
| أثر ثابت للمنطقة | ي | ي | ي | ي | ي | ي |
| أثر ثابت زمني | ي | ي | ي | ي | ي | ي |
| اختبار F | 3.135 | ٣.٤١٥ | ٣.٠٤٧ | ٣.٤٥٩ | 3.324 | ٣.٦٨٧ |
| (
|
[0.000] | [0.000] | [0.000] | [0.000] | [0.000] | [0.000] |
|
|
0.196 | 0.350 | 0.295 | 0.353 | 0.203 | 0.276 |
قد لا يتمكن نموذج DID المستمر من استخدام اختبارات الاتجاه المتوازي التقليدية.
لا يمكن اختباره مباشرة. وبناءً عليه، فإن اختبارات الدواء الوهمي يصعب تنفيذها لأنها غالبًا ما تعتمد على القدرة على تحديد نقطة زمنية معالجة زائفة ثم التحقق من وجود تأثير العلاج قبل وبعد تلك النقطة الزمنية.
4.6 الصلاحية الخارجية
| سيارة كهربائية | DV | |||||||
| موقع_الاستطلاع1 (1) | poll_loc2 (2) | poll_loc3 (3) | poll_loc4 (4) | poll_loc5 (5) | poll_loc6 (6) | |||
| إنينغودا | -0.010 (0.008) | -0.013* (0.007) | -0.020** (0.010) | -0.005 (0.004) | -0.038*** (0.008) | -0.009 (0.010) | ||
| Inpgdp | 0.823* (0.461) | -0.246 (0.411) | 0.281 (0.612) | -0.065 (0.226) | -1.118** (0.471) | 1.796*** (0.548) | ||
| Inpgdp2 | -0.064*** | 0.030* | -0.003 | (0.008) | 0.035* | -0.089*** (0.020) | ||
| صناعة | -0.011 | -0.002 | -0.002 | -0.002 | -0.002 | -0.011 (0.010) | ||
| إنكاب_لاب | -0.103 | -0.214** | 0.227* | 0.038 | 0.213** | 0.058 (0.117) | ||
| الاستثمار الأجنبي المباشر | -0.018 | -0.010 | -0.030 |
|
-0.025* (0.015) | 0.008 (0.018) | ||
| إندين | (0.402) | -0.546 | -0.834* | -0.068 (0.396) | -0.015 (0.478) | |||
| في | -3.987*** | 6.750*** | 2.539* |
|
1.829 (1.128) | -3.587*** (1.330) | ||
|
|
527 | 510 | ٤٩٣ | 510 | 527 | |||
| أثر ثابت للمنطقة | ي | ي | ي | ي | ي | ي | ||
| أثر ثابت زمني | ي | ي | ي | ي | ي | |||
| اختبار F | ٢.٩٣١ | 3.051 | 1.080 | ٢.١٣٨ | ٣.٨١٧ | |||
| (
|
[0.000] | [0.000] | [0.311] | [0.045] | [0.000] | |||
|
|
0.101 | 0.163 | ||||||
| سيارة كهربائية | DV | |||||
| موقع الاستطلاع 1 (1) | poll_loc2 (2) | poll_loc3 (3) | poll_loc4 (4) | poll_loc5 (5) | poll_loc6 (6) | |
| Inengopop | -0.023 (0.015) | -0.009*** (0.03) | -0.016** (0.08) | -0.012 (0.008) | -0.072*** (0.015) | -0.016 (0.018) |
| Inpgdp | 0.854* (0.452) | -0.388 (0.405) | 0.057 (0.602) | -0.054 (0.221) | -0.935** (0.462) | 1.844*** (0.538) |
| Inpgdp2 | -0.064*** (0.016) | 0.035** (0.017) | 0.005 (0.026) | 0.014* (0.008) | 0.029 (0.019) | -0.091*** (0.020) |
| صناعة | -0.012 (0.008) | -0.003 (0.007) | -0.003 (0.010) | -0.002 (0.004) | -0.004 (0.008) | -0.012 (0.010) |
| إنكاب_لاب | -0.093 | -0.216** | 0.223* | 0.043 | 0.243** | 0.065 |
| استثمار أجنبي مباشر | -0.018 | -0.012 | -0.033* | -0.011 | -0.023 | 0.009 |
| إندين | 0.311 | -0.511 | -0.782 | 0.331* | -0.047 | -0.012 |
| في | -3.987*** | 6.633*** | 2.352* | 1.620*** | 1.898* | -3.565*** |
|
|
527 | 510 | ٤٩٣ | ٥٢٧ | 510 | 527 |
| أثر ثابت للمنطقة | ي | ي | ي | ي | ي | ي |
| أثر ثابت زمني | ي | ي | ي | ي | ي | ي |
| اختبار F | ٢.٩٦٥ | 3.913 | 0.940 | 1.309 | 2.182 | 3.814 |
| (
|
[0.000] | [0.000] | [0.343] | [0.1320] | [0.041] | [0.000] |
|
|
0.131 | 0.171 | 0.049 | 0.062 | 0.١٠٣ | 0.162 |
تحليل الآلية 5
| سيارة كهربائية | DV: موقع الاقتراع | |||
| (1) | (2) | (3) | (4) | |
| إنينغودا | 0.057 (0.047) | 0.024 (0.017) | 0.005 (0.009) | -0.000 (0.010) |
| إيني
|
-0.009** (0.004) | |||
| إنسيتياي
|
-0.004** (0.002) | |||
| Inind_ei
|
-0.004** (0.002) | |||
| إنثراي
|
-0.001* (0.000) | |||
| ن | ٣٧٢ | ٣٧٢ | ٣٧٢ | ٣٧٢ |
| متغير التحكم | ي | ي | ي | ي |
| أثر ثابت للمنطقة | ي | ي | ي | ي |
| أثر ثابت زمني | ي | ي | ي | ي |
| اختبار F | 3.372 | ٣.٢٨٣ | ٣.١٥٤ | ٣.٠٦٨ |
| (
|
[0.000] | [0.000] | [0.000] | [0.000] |
|
|
0.214 | 0.211 | 0.206 | 0.202 |
تمت إضافة، لم تعد المعاملات الأصلية على engodata ذات دلالة إحصائية، بينما أصبحت معاملات تفاعلاتها سلبية بشكل كبير. أولاً، تم استخدام اللوغاريتم الطبيعي لإجمالي الاستثمار البيئي في كل محافظة لقياس الاستثمار في الحوكمة البيئية (lnei).
يتم استخدام استثمار الحوكمة البيئية الصناعية لقياس استثمار الحوكمة البيئية (lnind_ei)، العمود (3) يكشف عن تأثير التفاعل بين engodata واستثمار الحوكمة البيئية الصناعية: كلا المعاملين يساويان -0.004 عند مستوى دلالة
| سيارة كهربائية | DV: موقع الاقتراع | |||
| (1) | (2) | (3) | (4) | |
| Inengopop | -0.028 (0.051) | -0.032 (0.040) | -0.006 (0.014) | -0.016 (0.017) |
| إيني
|
-0.003* (0.001) | |||
| إنسيديي
|
-0.002** (0.000) | |||
| Inind_ei
|
-0.007** (0.003) | |||
| إنثراي
|
-0.004** (0.002) | |||
| ن | ٣٧٢ | ٣٧٢ | ٣٧٢ | ٣٧٢ |
| متغير التحكم | ي | ي | ي | ي |
| أثر ثابت للمنطقة | ي | ي | ي | ي |
| أثر ثابت زمني | ي | ي | ي | ي |
| اختبار F | ٣.٤٦٥ | ٣.٥٠٣ | ٣.٥٨٣ | ٣.٤٢٨ |
| (
|
[0.000] | [0.000] | [0.000] | [0.000] |
|
|
0.209 | 0.210 | 0.213 | 0.207 |
6 الاستنتاجات
يتم نقل الصناعة من؛ ثانياً، الإحصائيات المتعلقة بالمنظمات غير الحكومية البيئية غير مكتملة، مما يؤدي إلى أخطاء في القياس في المنظمات غير الحكومية البيئية. يمكن أن تبدأ الاتجاهات التالية للبحث الإضافي من العلاقة الثنائية لنقل الصناعة، مثل قياس نقل الصناعة من خلال الشركات المدرجة التي تستثمر في مناطق مختلفة. في الوقت نفسه، يمكن استخدام دراسات الحالة وطرق أخرى لدراسة التأثير المحدد للمنظمات غير الحكومية البيئية على نقل الصناعة.
References
Bebbington, A. (2004). NGOs and uneven development: geographies of development intervention. Progress in Human Geography, 28(6), 725-745.
Betsill, M. M., & Corell, E. (2008). NGO diplomacy: The Influence of Nongovernmental Organizations in International Environmental Negotiations. Cambridge, MA: MIT Press.
Chen, W., Shen, Y., Wang, Y., & Wu, Q. (2018). The effect of industrial relocation on industrial land use efficiency in China: A spatial econometrics approach. Journal of Cleaner Production, 205, 525-535.
Chen, Z., Xie, S., & Siquan, Z. (2000). The extent of marketization of economic systems in China. Nova Publishers.
Dauvergne, P., & Lister, J. (2012). Big brand sustainability: Governance prospects and environmental limits. Global Environmental Change, 22(1), 36-45.
Dechezleprêtre, A., & Sato, M. (2017). The impacts of environmental regulations on competitiveness. Review of Environmental Economics and Policy, 11(2), 183-206.
Féres, J., & Reynaud, A. (2012). Assessing the impact of formal and informal regulations on environmental and economic performance of Brazilian manufacturing firms. Environmental Resource Economics, 52(1), 65-85.
Gidron, B. (2014). Market-oriented social enterprises employing people with disabilities: A participants’ perspective. Journal of Social Entrepreneurship, 5(1), 60-76.
Grano, S. A. (2012). Green activism in Red China: The role of Shanghai’s ENGOs in influencing environmental politics. Journal of Civil Society, 8(1), 39-61.
Gunningham, N., Kagan, R. A., & Thornton, D. (2004). Social license and environmental protection: why businesses go beyond compliance. Law & Social Inquiry, 29(2), 307-341.
Hasan, M. A., Nahiduzzaman, K. M., & Aldosary, A. S. (2018). Public participation in EIA: A comparative study of the projects run by government and non-governmental organizations. Environmental Impact Assessment Review, 72, 12-24.
Heyes, A., Lyon, T. P., & Martin, S. (2018). Salience games: Private politics when public attention is limited. Journal of Environmental Economics and Management, 88(3), 396-410.
Hopkins, M. S., Kruschwitz, N., Haanaes, K., Kong, M. T., Arthur, D., & Reeves, M. (2011). Sustainability: The ’embracers’ seize advantage. MIT Sloan Management Review, 52(3), 23-35.
Levinson, A., & Taylor, M.S. (2008). Unmasking the pollution haven effect. International Economic Review, 49(1), 223-254
Li, G., He, Q., Shao, S., & Cao, J. (2018a). Environmental non-governmental organizations and urban environmental governance: Evidence from China. Journal of Environmental Management, 206(1), 1296-1307.
Li, G., Shao, S., & Cao, J. (2018b). Environmental non-governmental organizations and urban environmental governance: Evidence from China. Journal of Environmental Management, 206(1), 1296-1307.
Li, K., Yuan, W., Li, J., & Ai, H. (2021). Effects of time-dependent environmental regulations on air pollution: Evidence from the Changsha-Zhuzhou-Xiangtan region, China. World Development, 138, 105267.
Li, M., & Wang, Q. (2020). Does industrial relocation alleviate environmental pollution? A mathematical economics analysis. Environment, Development and Sustainability, 22, 4673-4698.
Li, R., & Ramanathan, R. (2018). Exploring the relationships between different types of environmental regulations and environmental performance: Evidence from China. Journal of Cleaner Production, 196, 1329-1340.
Lister, J. (2011). Corporate social responsibility and the state: International approaches to forest co-regulation. UBC Press.
Liu, H. (2009). Goal decomposition and structure optimization of marine industry development of Shandong Province. China Population, Resources and Environment, 19(3), 140-145.
Lu, Y. (2007). Environmental civil society and governance in China. International Journal of Environmental Studies, 64(1), 59-69.
MacDonald, C. (2008). Green, Inc: An environmental insider reveals how a good cause has gone bad. Rowman & Littlefield.
Mani, M., & Wheeler, D. (1998). In search of pollution havens? Dirty industry in the world economy, 1960 to 1995. The Journal of Environment & Development, 7(8), 215-247.
McCarthy, J., & Zen, Z. (2010). Regulating the oil palm boom: Assessing the effectiveness of environmental governance approaches to agroindustrial pollution in Indonesia. Law & Policy, 32(1), 153-179.
McGuire, M. (1982). Regulation, factor rewards, and international trade. Journal of Public Economics, 17(3), 335-353.
Otsuki T., Wilson J., & Sewadeh M. (2004). Saving two in a billion: Quantifying the trade effect of European food safety standards on African exports. Food Policy, 26(5), 495-513.
Pargal, S., Hettige, H., Singh, M., & Wheeler, D. (1997). Formal and informal regulation of industrial pollution: Comparative evidence from Indonesia and the United States. The World Bank Economic Review, 11(3), 433-450.
Pargal, S., & Wheeler, D. (1996). Informal regulation of industrial pollution in developing countries. Journal of Political Economy, 104(6), 1314-1327.
Partelow, S, Winkler, K. J., & Thaler, G. M. (2020) Environmental nongovernmental organizations and global environmental discourse. PLoS ONE, 15(5), e0232945.
Sharghi, M., Jeong, H., & Afshin, H. (2024). Evaluation of environmental and economic compatibility of different types of segment linings based on the structural performance with some aggravating factors. Tunnelling and Underground Space Technology, 144, 105567.
Sun, D., Zeng, S., Chen, H., Meng, X., & Jin, Z. (2019). Monitoring effect of transparency: How does government environmental disclosure facilitate corporate environmentalism? Business Strategy and the Environment, 28(8), 1594-1607.
Walter, I., & Ugelow, J. L. (1979). Environmental policies in developing countries. Ambio, 8, 102-109.
Wang, M., & Liu, Q. (2009). Analyzing China’s NGO development system. The China Nonprofit Review, 1(1), 5-35.
Wu, H. (2023). Evaluating the role of renewable energy investment resources and green finance on the economic performance: Evidence from OECD economies. Resources Policy, 80, 103149.
Wu, H., Guo, H., Zhang, B., & Bu, M. (2017). Westward movement of new polluting firms in China: Pollution reduction mandates and location choice. Journal of Comparative Economics 45(1), 119-138.
Yin, J., Zheng, M., & Chen, J. (2015). The effects of environmental regulation and technical progress on CO2 Kuznets curve: An evidence from China. Energy Policy, 77(2), 97-108.
Young, N. (2001). Searching for Civil Society: 250 NGOs in China. Hong Kong: China Development Brief.
Yu, J., & Chen, K. (2018). Does nonprofit marketization facilitate or inhibit the development of civil society? A comparative study of China and the USA. VOLUNTAS: International Journal of Voluntary and Nonprofit Organizations, 29(5), 925-937.
Zhang, C., & Guo, Y. Q. (2015). Can pollution-intensive industry transfer achieve win-win development in economy and environment? From the perspective of environmental regulation. Journal of Finance Economics, 41(1), 96-108.
Zhang, C., Zhou, B., Lv, M. Y., & Liu, X. (2017). Has West China development directly or indirectly brought pollution haven? China Population, Resources and Environment, 27(4), 95-101.
Zhang, Y., Imeni, M., & Edalatpanah, S. A. (2023). Environmental dimension of corporate social responsibility and earnings persistence: An exploration of the moderator roles of operating efficiency and financing cost. Sustainability, 15(20), 14814.
- # They are co-first authors.
- Corresponding author: Ji Luo, School of Economics & Management, Shanghai Polytechnic University, Shanghai, 201209, China, e-mail: kaoyongdui@sohu.com
Guangqin Li: School of International Trade & Economics, Anhui University of Finance & Economics, Bengbu, 233030, China
Siyan Liu: Guiyang Central Sub-branch, The People’s Bank of China, Guiyang, 550027, China
- Corresponding author: Ji Luo, School of Economics & Management, Shanghai Polytechnic University, Shanghai, 201209, China, e-mail: kaoyongdui@sohu.com
- *, **, and *** represent
, and significant level, respectively. - *, **, and *** represent 10%, 5%, and 1% significant level, respectively.
DOI: https://doi.org/10.1515/econ-2022-0080
Publication Date: 2024-01-01
Performance Evaluation of Economic Relocation Effect for Environmental Non-Governmental Organizations: Evidence from China
received December 15, 2023; accepted February 23, 2024
Abstract
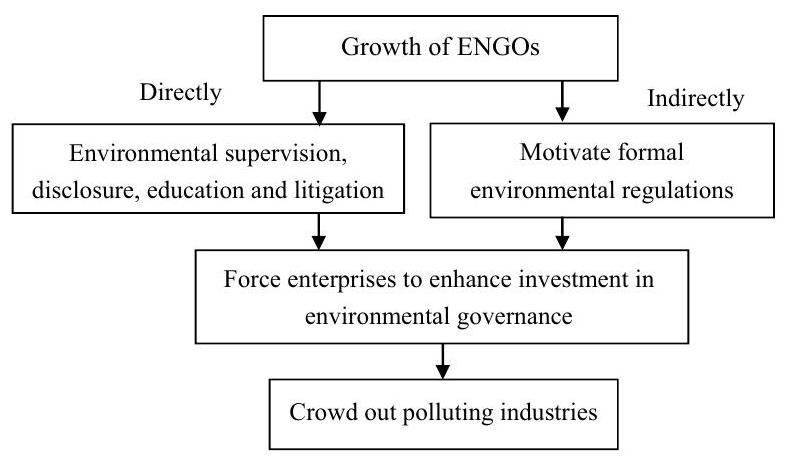
In this article, an economic natural experiment in China is analyzed and the performance evaluation of the economic relocation effect of informal environmental regulations imposed through the channel of environmental nongovernmental organizations (ENGOs) is suggested. ENGOs are found to have a significantly negative impact on the overall economic location quotient of six major polluting industries. The economic relocation effect from ENGOs exhibits industrial and regional heterogeneity, as the effect is stronger among easy-to-relocate industries and in market-oriented areas. The underlying mechanism is the ENGOs, as informal environmental regulations could motivate firms to enhance their investment in environmental governance, ultimately crowding out these economically polluting industries.
1 Introduction
2 Literature Review and Theoretical Mechanism
2.1 Literature Reviews
2.2 Theoretical Mechanisms
putting political pressure on local government officials with respect to environmental issues. Over the past 20 years, scholars have extensively studied the role of ENGOs on environmental laws and policies. Globally, the effects of pollution on human health can result in a strong public demand for environmental and energy policies in order to accelerate governmental action and improve accountability (Grano, 2012). ENGOs have many means, such as media, to influence environmental governance and policies, highlight the need for implementation of laws, and represent the interests of vulnerable populations.
issuing new guidance and initiating social movements (Li et al., 2018a,b). In this regard, cognitive theory has emphasized the importance of attitudes, beliefs, ideology, and personal values in driving corporate behavior. Specially, when the firms are situated in a community that advocates for a sustainable environment, they may tend to implement similar measures to strengthen social cohesion and remove the barriers among themselves (Sun et al., 2019).
explore creative ways to leverage the scale, speed, and innovative ideas of corporate governance to increase regulatory efforts. ENGOs also need to focus on the roles of companies in protecting the environment at different stages of the product life cycle, ranging from material sourcing to manufacturing, retailing, and consumer use. Most companies are forced to decrease the intensity of environmental impact per unit of output, mainly through energy-efficient appliances and energy-conserving practices encouraged by ENGOs (Dauvergne & Lister, 2012).
3 Methodology
3.1 Model
3.2 Polluting Industries
intensity of each firm is calculated. Pollution intensity is typically measured as the amount of pollution released per unit of production or revenue.
3.3 Industrial Relocation
regulations as well as to Midwest China. Once environmental regulations in adjacent regions are strengthened, polluting companies in those places may relocate to local areas, turning these areas into pollution havens. However, the economic relocation effect of ENGOs has not yet received much attention in academia. By contrast, this article aims to fill this research gap through an empirical examination. After defining the polluting industries of concern to ENGOs as above, we then focus on the relocation index for polluting industries. Previous studies have adopted the location quotient of polluting industries or the share of the output value of a region’s polluting industries in the output of the country as a measure of polluting industries. These indicators partly reflect the development level of certain polluting industries in a region. As we aim to determine whether the relocation of polluting industries is influenced by the development of ENGOs, industrial and growth indicators fail to reflect whether these industries have relocated or not. Ultimately, we chose the employment location quotient, denoting the study area as a region (
3.4 Explanatory Variables
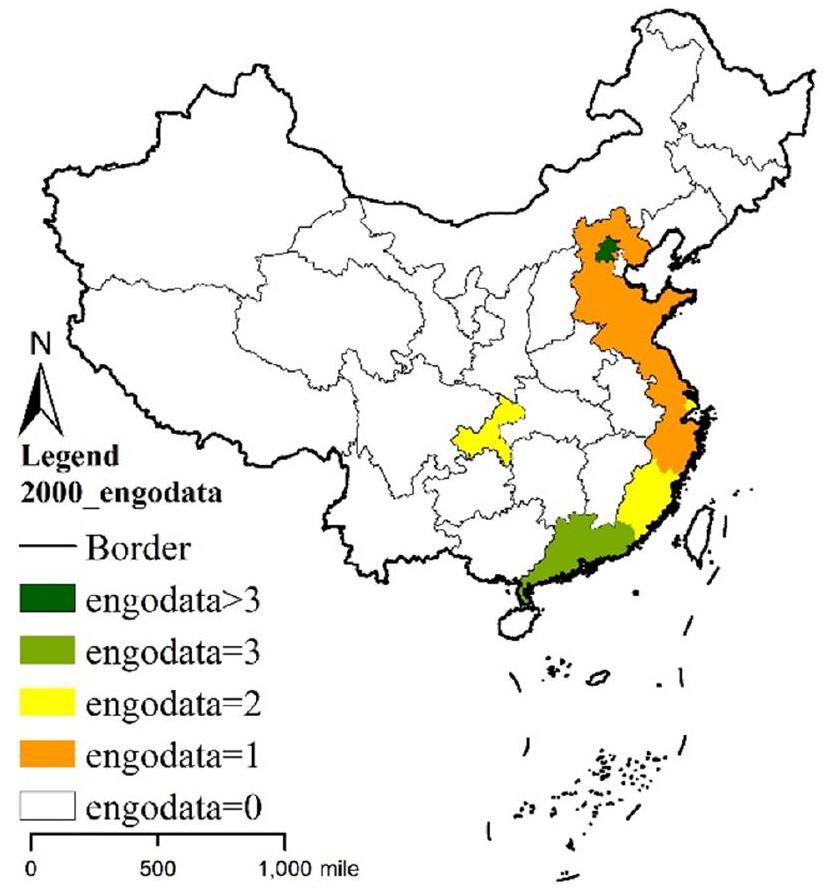
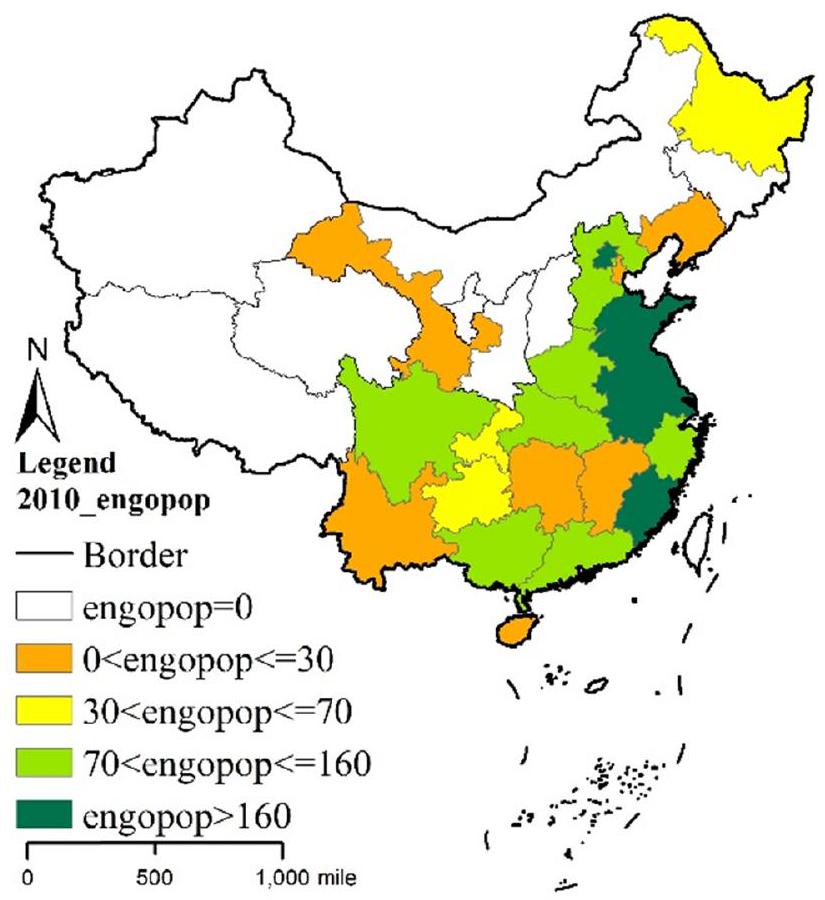
date of establishment, organization size (number of personnel), and business field, and identifies the ENGO’s registration place at the province-prefecture-county level. With these data, we can manually collect the relevant information on each ENGO and then pool those data to the provinceprefecture level and obtain two-administrative-level ENGO data. It should be noted that the data currently available are relatively comprehensive, although they are not perfectly so. The data include whether there are any ENGOs (engo), the number of ENGOs (engodata), and the number of ENGO employees (engopop).
3.5 Summary and Data
Dependent variables: the employment location quotient for the six polluting industries in a region (poll_loc
of China, so we add 1 to each data point and take its logarithm.
4 Results
4.1 Benchmark Regression
| Variable | Obs. | Mean | Std. dev. | Min | Max |
| Dependent variable | |||||
| poll_loc | 527 | 1.067 | 0.544 | 0.003 | 3.128 |
| poll_loc1 | 527 | 1.078 | 0.961 | 0.002 | 7.709 |
| poll_loc2 | 510 | 0.928 | 0.740 | 0.005 | 5.439 |
| poll_loc3 | 493 | 0.840 | 0.887 | 0.000 | 3.831 |
| poll_loc4 | 527 | 0.967 | 0.342 | 0.043 | 2.619 |
| poll_loc5 | 510 | 1.060 | 0.756 | 0.012 | 6.985 |
| poll_loc6 | 527 | 1.172 | 0.747 | 0.185 | 10.348 |
| Key explanatory variable | |||||
| engodata | 527 | 3.154 | 6.564 | 0 | 61 |
| engopop | 527 | 2.977 | 2.496 | 0 | 8.226 |
| Inengopop | 527 | 2.977 | 2.496 | 0 | 8.226 |
| Inengodata | 527 | 0.897 | 0.911 | 0 | 3.127 |
| Control variable | |||||
| Inpgdp | 527 | 8.815 | 1.218 | 3.769 | 11.300 |
| Inpgdp2 | 527 | 79.193 | 20.673 | 22.743 | 127.699 |
| ind | 527 | 45.310 | 8.193 | 19.262 | 60.133 |
| Incap_lab | 527 | 0.806 | 0.454 | 0.254 | 3.351 |
| fdi | 527 | 2.301 | 2.356 | 0.001 | 13.652 |
| Inden | 527 | 5.269 | 1.464 | 0.723 | 8.245 |
| en | 527 | 0.128 | 0.081 | 0.037 | 0.521 |
column (2), we add in other control variables. The estimation results show that when controlling for time-fixed effects and region-fixed effects, regardless of other factors, the coefficients on the core explanatory variable (lnengodata) are -0.014 and -0.012 , respectively, which are significantly negative, indicating that when engodata increases by a percentage point, poll_loc drops by approximately
with laxer environmental regulations. In this article, we find that polluting industries gather in areas where NGOs are weaker, while in areas where ENGOs are relatively mature, the importance of the polluting industry is significantly reduced. The possible reason is that in an area where the ENGOs have developed, under the influence of ENGOs, residents have strengthened their environmental awareness and raised their needs for environmental quality. If there are polluting enterprises around, the residents will react to the government through means such as safeguarding their rights and reporting, so that the government can adopt more stringent environmental management measures. Under the pressure of environmental protection, polluting enterprises must choose to relocate to other areas.
| EV | DV: poll_loc | |||
| (1) | (2) | (3) | (4) | |
| Inengodata | -0.014*** (0.004) | -0.012*** (0.004) | ||
| Inengopop | -0.028*** (0.008) | -0.028*** (0.008) | ||
| Inpgdp | 0.613** (0.242) | 0.644*** (0.237) | ||
| Inpgdp2 | -0.039*** (0.009) | -0.039*** (0.009) | ||
| indstr | -0.008* (0.004) | -0.009** (0.004) | ||
| Incap_lab | 0.090* (0.052) | 0.102** (0.052) | ||
| fdi | -0.021*** (0.008) | -0.021*** (0.008) | ||
| Inden | 0.172 (0.211) | 0.194 (0.211) | ||
| en | -2.498*** (0.588) | -2.504*** (0.584) | ||
| Region-fixed effect | Y | Y | Y | Y |
| Time-fixed effect | Y | Y | Y | Y |
| F-test | 3.571 | 5.286 | 3.665 | 5.527 |
| (
|
[0.000] | [0.000] | [0.000] | [0.000] |
|
|
0.112 | 0.212 | 0.115 | 0.219 |
4.2 Region-based Discussion
leads to a decline in the location quotient of total polluting industries in the region. Columns (3) and (4) show the impact of ENGOs on polluting industries in midwestern China. The estimation results show that the coefficients from the two models are neither significant nor different from the previous two, indicating that ENGOs do not significantly reduce the location quotient of polluting industries in these areas. This is caused by the fact that ENGOs in East China are relatively mature and have pushed the polluting industries into midwestern China. In East China, the relationship between the level of economic development and the location quotient of polluting industries follows a significant inverted U-shaped curve, whereas such a curve also exists in midwestern China, it is not significant. Some other control variables are not significant, but the signs on the coefficients are basically consistent with those from the benchmark regression.
4.3 Robustness Check
| EV | DV: poll_loc | |||
| Eastern | Midwestern | |||
| (1) | (2) | (3) | (4) | |
| Inengodata | -0.008** (0.003) | 0.010 (0.016) | ||
| Inengopop | -0.016** (0.006) | -0.031 (0.033) | ||
| Inpgdp | 1.089*** (0.295) | 1.187*** (0.287) | 0.402 (0.355) | 0.246 (0.356) |
| Inpgdp2 | -0.048*** (0.013) | -0.051*** (0.013) | -0.021 (0.014) | -0.013 (0.013) |
| indstr | 0.003 (0.006) | 0.001 (0.006) | -0.016*** (0.006) | -0.016*** (0.006) |
| Incap_lab | 0.047 (0.048) | 0.063 (0.049) | 0.151 (0.098) | 0.118 (0.101) |
| fdi | -0.004 (0.011) | -0.005 (0.011) | -0.019 (0.013) | -0.022* (0.012) |
| Inden | -0.061 (0.181) | -0.069 (0.180) | 0.924** (0.464) | 0.941** (0.464) |
| en | 0.947 (1.669) | 0.682 (1.678) | -2.753*** (0.731) | -3.016*** (0.742) |
|
|
187 | 187 | 340 | 340 |
| Region-fixed effect | Y | Y | Y | Y |
| Time-fixed effect | Y | Y | Y | Y |
| F-test | 3.415 | 3.459 | 3.660 | 3.686 |
| (
|
[0.000] | [0.000] | [0.000] | [0.000] |
|
|
0.350 | 0.353 | 0.274 | 0.275 |
industries from the eastern region and has become a refuge for polluting industries. The estimation results for the other control variables are in line with the estimation results from the benchmark regression and the previous regional regression, so they are not repeated here.
4.4 Industry-based Discussion
negative impact on the location quotients of the following three industries: papermaking, chemical fiber manufacturing, and the smelting and processing of ferrous metals.
4.5 Endogeneity Discussion
| EV | DV: poll_loc | |||||
| Entire sample (1) | Eastern (2) | Midwestern (3) | Entire sample (4) | Eastern (5) | Midwestern (6) | |
| Inengodata | -0.009** | -0.008** | 0.040 | |||
| Inengopop | -0.016** | -0.021*** | 0.028 | |||
| Inpgdp | 0.773*** | 1.089*** | 0.489 | 1.187*** | 0.815*** | 0.317 |
| Inpgdp2 | (0.011) | -0.048*** | -0.042** | -0.051*** | -0.058*** | -0.028 |
| indstr | -0.003 | 0.003 | -0.009 | 0.001 | -0.004 | -0.011 |
| Incap_lab | 0.075 | 0.047 | 0.116 | 0.063 | 0.085* | 0.108 |
| fdi | (0.007) | -0.004 | 0.003 | -0.005 | -0.016** | -0.004 |
| Inden | 0.108 | -0.061 | 1.010** | -0.069 | 0.128 | 0.863* |
| en | (0.748) | 0.947 | -2.062* | 0.682 | -1.399* | -2.280** |
|
|
459 | 187 | 272 | 187 | 459 | 272 |
| Region-fixed effect | Y | Y | Y | Y | Y | Y |
| Time-fixed effect | Y | Y | Y | Y | Y | Y |
| F-test | 3.135 | 3.415 | 3.047 | 3.459 | 3.324 | 3.687 |
| (
|
[0.000] | [0.000] | [0.000] | [0.000] | [0.000] | [0.000] |
|
|
0.196 | 0.350 | 0.295 | 0.353 | 0.203 | 0.276 |
the continuous DID model may not be able to use traditional parallel trend tests.
cannot be directly tested. Accordingly, placebo tests are difficult to perform because they often rely on being able to define a spurious processing time point and then check for the presence of a treatment effect before and after that time point.
4.6 External Validity
| EV | DV | |||||||
| poll_loc1 (1) | poll_loc2 (2) | poll_loc3 (3) | poll_loc4 (4) | poll_loc5 (5) | poll_loc6 (6) | |||
| Inengodata | -0.010 (0.008) | -0.013* (0.007) | -0.020** (0.010) | -0.005 (0.004) | -0.038*** (0.008) | -0.009 (0.010) | ||
| Inpgdp | 0.823* (0.461) | -0.246 (0.411) | 0.281 (0.612) | -0.065 (0.226) | -1.118** (0.471) | 1.796*** (0.548) | ||
| Inpgdp2 | -0.064*** | 0.030* | -0.003 | (0.008) | 0.035* | -0.089*** (0.020) | ||
| indstr | -0.011 | -0.002 | -0.002 | -0.002 | -0.002 | -0.011 (0.010) | ||
| Incap_lab | -0.103 | -0.214** | 0.227* | 0.038 | 0.213** | 0.058 (0.117) | ||
| fdi | -0.018 | -0.010 | -0.030 |
|
-0.025* (0.015) | 0.008 (0.018) | ||
| Inden | (0.402) | -0.546 | -0.834* | -0.068 (0.396) | -0.015 (0.478) | |||
| en | -3.987*** | 6.750*** | 2.539* |
|
1.829 (1.128) | -3.587*** (1.330) | ||
|
|
527 | 510 | 493 | 510 | 527 | |||
| Region-fixed effect | Y | Y | Y | Y | Y | Y | ||
| Time-fixed effect | Y | Y | Y | Y | Y | |||
| F-test | 2.931 | 3.051 | 1.080 | 2.138 | 3.817 | |||
| (
|
[0.000] | [0.000] | [0.311] | [0.045] | [0.000] | |||
|
|
0.101 | 0.163 | ||||||
| EV | DV | |||||
| poll_loc1 (1) | poll_loc2 (2) | poll_loc3 (3) | poll_loc4 (4) | poll_loc5 (5) | poll_loc6 (6) | |
| Inengopop | -0.023 (0.015) | -0.009*** (0.03) | -0.016** (0.08) | -0.012 (0.008) | -0.072*** (0.015) | -0.016 (0.018) |
| Inpgdp | 0.854* (0.452) | -0.388 (0.405) | 0.057 (0.602) | -0.054 (0.221) | -0.935** (0.462) | 1.844*** (0.538) |
| Inpgdp2 | -0.064*** (0.016) | 0.035** (0.017) | 0.005 (0.026) | 0.014* (0.008) | 0.029 (0.019) | -0.091*** (0.020) |
| indstr | -0.012 (0.008) | -0.003 (0.007) | -0.003 (0.010) | -0.002 (0.004) | -0.004 (0.008) | -0.012 (0.010) |
| Incap_lab | -0.093 | -0.216** | 0.223* | 0.043 | 0.243** | 0.065 |
| fdi | -0.018 | -0.012 | -0.033* | -0.011 | -0.023 | 0.009 |
| Inden | 0.311 | -0.511 | -0.782 | 0.331* | -0.047 | -0.012 |
| en | -3.987*** | 6.633*** | 2.352* | 1.620*** | 1.898* | -3.565*** |
|
|
527 | 510 | 493 | 527 | 510 | 527 |
| Region-fixed effect | Y | Y | Y | Y | Y | Y |
| Time-fixed effect | Y | Y | Y | Y | Y | Y |
| F-test | 2.965 | 3.913 | 0.940 | 1.309 | 2.182 | 3.814 |
| (
|
[0.000] | [0.000] | [0.343] | [0.1320] | [0.041] | [0.000] |
|
|
0.131 | 0.171 | 0.049 | 0.062 | 0.103 | 0.162 |
5 Mechanism Analysis
| EV | DV: poll_loc | |||
| (1) | (2) | (3) | (4) | |
| Inengodata | 0.057 (0.047) | 0.024 (0.017) | 0.005 (0.009) | -0.000 (0.010) |
| Inei
|
-0.009** (0.004) | |||
| Incityei
|
-0.004** (0.002) | |||
| Inind_ei
|
-0.004** (0.002) | |||
| Inthr_ei
|
-0.001* (0.000) | |||
| N | 372 | 372 | 372 | 372 |
| Control variable | Y | Y | Y | Y |
| Region-fixed effect | Y | Y | Y | Y |
| Time-fixed effect | Y | Y | Y | Y |
| F test | 3.372 | 3.283 | 3.154 | 3.068 |
| (
|
[0.000] | [0.000] | [0.000] | [0.000] |
|
|
0.214 | 0.211 | 0.206 | 0.202 |
added, the original coefficients on engodata are no longer significant, while the coefficients of its interactions become significantly negative. First, the natural logarithm of the total environmental investment in each province was used to measure the investment in environmental governance (lnei).
industrial environmental governance investment is used to measure environmental governance investment (lnind_ei), column (3) reveals the interaction effect between engodata and investment in industrial environmental governance: both coefficients are equal to -0.004 at a significance level of
| EV | DV: poll_loc | |||
| (1) | (2) | (3) | (4) | |
| Inengopop | -0.028 (0.051) | -0.032 (0.040) | -0.006 (0.014) | -0.016 (0.017) |
| Inei
|
-0.003* (0.001) | |||
| Incityei
|
-0.002** (0.000) | |||
| Inind_ei
|
-0.007** (0.003) | |||
| Inthr_ei
|
-0.004** (0.002) | |||
| N | 372 | 372 | 372 | 372 |
| Control variable | Y | Y | Y | Y |
| Region-fixed effect | Y | Y | Y | Y |
| Time-fixed effect | Y | Y | Y | Y |
| F test | 3.465 | 3.503 | 3.583 | 3.428 |
| (
|
[0.000] | [0.000] | [0.000] | [0.000] |
|
|
0.209 | 0.210 | 0.213 | 0.207 |
6 Conclusions
industry is transferred from; Second, the statistics on ENGOs are not complete, leading to measurement errors in ENGOs. The next direction for further research can start from the bilateral relationship of industrial transfer, such as measuring industrial transfer through listed companies investing in different regions. At the same time, case studies and other methods can be used to study the specific impact of ENGOs on industrial transfer.
References
Bebbington, A. (2004). NGOs and uneven development: geographies of development intervention. Progress in Human Geography, 28(6), 725-745.
Betsill, M. M., & Corell, E. (2008). NGO diplomacy: The Influence of Nongovernmental Organizations in International Environmental Negotiations. Cambridge, MA: MIT Press.
Chen, W., Shen, Y., Wang, Y., & Wu, Q. (2018). The effect of industrial relocation on industrial land use efficiency in China: A spatial econometrics approach. Journal of Cleaner Production, 205, 525-535.
Chen, Z., Xie, S., & Siquan, Z. (2000). The extent of marketization of economic systems in China. Nova Publishers.
Dauvergne, P., & Lister, J. (2012). Big brand sustainability: Governance prospects and environmental limits. Global Environmental Change, 22(1), 36-45.
Dechezleprêtre, A., & Sato, M. (2017). The impacts of environmental regulations on competitiveness. Review of Environmental Economics and Policy, 11(2), 183-206.
Féres, J., & Reynaud, A. (2012). Assessing the impact of formal and informal regulations on environmental and economic performance of Brazilian manufacturing firms. Environmental Resource Economics, 52(1), 65-85.
Gidron, B. (2014). Market-oriented social enterprises employing people with disabilities: A participants’ perspective. Journal of Social Entrepreneurship, 5(1), 60-76.
Grano, S. A. (2012). Green activism in Red China: The role of Shanghai’s ENGOs in influencing environmental politics. Journal of Civil Society, 8(1), 39-61.
Gunningham, N., Kagan, R. A., & Thornton, D. (2004). Social license and environmental protection: why businesses go beyond compliance. Law & Social Inquiry, 29(2), 307-341.
Hasan, M. A., Nahiduzzaman, K. M., & Aldosary, A. S. (2018). Public participation in EIA: A comparative study of the projects run by government and non-governmental organizations. Environmental Impact Assessment Review, 72, 12-24.
Heyes, A., Lyon, T. P., & Martin, S. (2018). Salience games: Private politics when public attention is limited. Journal of Environmental Economics and Management, 88(3), 396-410.
Hopkins, M. S., Kruschwitz, N., Haanaes, K., Kong, M. T., Arthur, D., & Reeves, M. (2011). Sustainability: The ’embracers’ seize advantage. MIT Sloan Management Review, 52(3), 23-35.
Levinson, A., & Taylor, M.S. (2008). Unmasking the pollution haven effect. International Economic Review, 49(1), 223-254
Li, G., He, Q., Shao, S., & Cao, J. (2018a). Environmental non-governmental organizations and urban environmental governance: Evidence from China. Journal of Environmental Management, 206(1), 1296-1307.
Li, G., Shao, S., & Cao, J. (2018b). Environmental non-governmental organizations and urban environmental governance: Evidence from China. Journal of Environmental Management, 206(1), 1296-1307.
Li, K., Yuan, W., Li, J., & Ai, H. (2021). Effects of time-dependent environmental regulations on air pollution: Evidence from the Changsha-Zhuzhou-Xiangtan region, China. World Development, 138, 105267.
Li, M., & Wang, Q. (2020). Does industrial relocation alleviate environmental pollution? A mathematical economics analysis. Environment, Development and Sustainability, 22, 4673-4698.
Li, R., & Ramanathan, R. (2018). Exploring the relationships between different types of environmental regulations and environmental performance: Evidence from China. Journal of Cleaner Production, 196, 1329-1340.
Lister, J. (2011). Corporate social responsibility and the state: International approaches to forest co-regulation. UBC Press.
Liu, H. (2009). Goal decomposition and structure optimization of marine industry development of Shandong Province. China Population, Resources and Environment, 19(3), 140-145.
Lu, Y. (2007). Environmental civil society and governance in China. International Journal of Environmental Studies, 64(1), 59-69.
MacDonald, C. (2008). Green, Inc: An environmental insider reveals how a good cause has gone bad. Rowman & Littlefield.
Mani, M., & Wheeler, D. (1998). In search of pollution havens? Dirty industry in the world economy, 1960 to 1995. The Journal of Environment & Development, 7(8), 215-247.
McCarthy, J., & Zen, Z. (2010). Regulating the oil palm boom: Assessing the effectiveness of environmental governance approaches to agroindustrial pollution in Indonesia. Law & Policy, 32(1), 153-179.
McGuire, M. (1982). Regulation, factor rewards, and international trade. Journal of Public Economics, 17(3), 335-353.
Otsuki T., Wilson J., & Sewadeh M. (2004). Saving two in a billion: Quantifying the trade effect of European food safety standards on African exports. Food Policy, 26(5), 495-513.
Pargal, S., Hettige, H., Singh, M., & Wheeler, D. (1997). Formal and informal regulation of industrial pollution: Comparative evidence from Indonesia and the United States. The World Bank Economic Review, 11(3), 433-450.
Pargal, S., & Wheeler, D. (1996). Informal regulation of industrial pollution in developing countries. Journal of Political Economy, 104(6), 1314-1327.
Partelow, S, Winkler, K. J., & Thaler, G. M. (2020) Environmental nongovernmental organizations and global environmental discourse. PLoS ONE, 15(5), e0232945.
Sharghi, M., Jeong, H., & Afshin, H. (2024). Evaluation of environmental and economic compatibility of different types of segment linings based on the structural performance with some aggravating factors. Tunnelling and Underground Space Technology, 144, 105567.
Sun, D., Zeng, S., Chen, H., Meng, X., & Jin, Z. (2019). Monitoring effect of transparency: How does government environmental disclosure facilitate corporate environmentalism? Business Strategy and the Environment, 28(8), 1594-1607.
Walter, I., & Ugelow, J. L. (1979). Environmental policies in developing countries. Ambio, 8, 102-109.
Wang, M., & Liu, Q. (2009). Analyzing China’s NGO development system. The China Nonprofit Review, 1(1), 5-35.
Wu, H. (2023). Evaluating the role of renewable energy investment resources and green finance on the economic performance: Evidence from OECD economies. Resources Policy, 80, 103149.
Wu, H., Guo, H., Zhang, B., & Bu, M. (2017). Westward movement of new polluting firms in China: Pollution reduction mandates and location choice. Journal of Comparative Economics 45(1), 119-138.
Yin, J., Zheng, M., & Chen, J. (2015). The effects of environmental regulation and technical progress on CO2 Kuznets curve: An evidence from China. Energy Policy, 77(2), 97-108.
Young, N. (2001). Searching for Civil Society: 250 NGOs in China. Hong Kong: China Development Brief.
Yu, J., & Chen, K. (2018). Does nonprofit marketization facilitate or inhibit the development of civil society? A comparative study of China and the USA. VOLUNTAS: International Journal of Voluntary and Nonprofit Organizations, 29(5), 925-937.
Zhang, C., & Guo, Y. Q. (2015). Can pollution-intensive industry transfer achieve win-win development in economy and environment? From the perspective of environmental regulation. Journal of Finance Economics, 41(1), 96-108.
Zhang, C., Zhou, B., Lv, M. Y., & Liu, X. (2017). Has West China development directly or indirectly brought pollution haven? China Population, Resources and Environment, 27(4), 95-101.
Zhang, Y., Imeni, M., & Edalatpanah, S. A. (2023). Environmental dimension of corporate social responsibility and earnings persistence: An exploration of the moderator roles of operating efficiency and financing cost. Sustainability, 15(20), 14814.
- # They are co-first authors.
- Corresponding author: Ji Luo, School of Economics & Management, Shanghai Polytechnic University, Shanghai, 201209, China, e-mail: kaoyongdui@sohu.com
Guangqin Li: School of International Trade & Economics, Anhui University of Finance & Economics, Bengbu, 233030, China
Siyan Liu: Guiyang Central Sub-branch, The People’s Bank of China, Guiyang, 550027, China
- Corresponding author: Ji Luo, School of Economics & Management, Shanghai Polytechnic University, Shanghai, 201209, China, e-mail: kaoyongdui@sohu.com
- *, **, and *** represent
, and significant level, respectively. - *, **, and *** represent 10%, 5%, and 1% significant level, respectively.