DOI: https://doi.org/10.1038/s41598-024-56056-8
PMID: https://pubmed.ncbi.nlm.nih.gov/38443485
تاريخ النشر: 2024-03-05
تقييم جودة المياه الجوفية باستخدام مؤشر جودة المياه وتحليل المكونات الرئيسية في كتلة أشنيرا، منطقة أغرا، ولاية أتر برديش، شمال الهند
الملخص
يعد التقييم النوعي والكمّي للمياه الجوفية أحد الجوانب المهمة لتحديد ملاءمة المياه الصالحة للشرب. لذلك، تم إجراء الدراسة الحالية لتقييم جودة المياه الجوفية لكتلة أتشنييرا في مدينة تاج، أغرا، الهند، حيث تعتبر المياه الجوفية مصدرًا مهمًا للمياه. تم جمع 50 عينة من المياه الجوفية وتحليلها للكاتيونات الرئيسية مع بعض العناصر النزرة المهمة. كما درست هذه الدراسة إمكانية تطبيق مؤشر جودة المياه الجوفية (GWOI) وتحليل المكونات الرئيسية (PCA) لتحديد المذاب الجيوكيميائي الرئيسي المسؤول عن أصل وإطلاق المذاب الجيوكيميائي في المياه الجوفية. تؤكد النتائج أن الغالبية العظمى من عينات المياه الجوفية المجمعة كانت قلوية في طبيعتها. كانت تباينات تركيز الأنيونات في عينات المياه الجوفية المجمعة تتفاوت في التسلسل كما،
ترتبط جودة الحياة بجودة المياه التي نستهلكها. من بين جميع موارد المياه، تعتبر المياه الجوفية واحدة من أهم موارد مياه الشرب
المواد والأساليب
منطقة الدراسة وجيولوجيتها
جمع العينات والتحليل الهيدروكيميائي
حساب مؤشر جودة المياه للعينات
حساب الوزن النوعي (Wn)
حساب تصنيف جودة المياه الجوفية
| المتغيرات (ملغ/لتر)* | معايير BIS، 10500 | معايير منظمة الصحة العالمية |
|
|
1-1.5 | 1.5 |
| تا | ٢٠٠-٦٠٠ | ٥٠٠ |
| الضريبة المقتطعة عند المصدر | ٥٠٠-٢٠٠٠ | 1000 |
|
|
٢٥٠-١٠٠٠ | ٢٥٠ |
|
|
– | ٢٠٠ |
|
|
– | 12 |
|
|
٢٠٠-٤٠٠ | ٢٥٠ |
|
|
٤٥ | 50 |
|
|
30-100 | 50 |
|
|
75-200 | ٢٠٠ |
| ث | ٢٠٠-٦٠٠ | ٥٠٠ |
| درجة الحموضة | 6.5-8.5 | ٨.٥ |
تحليل المكونات الرئيسية (PCA)
الإحصائيات المستخدمة وتحليل البيانات
النتائج والمناقشة
الهيدروكيمياء للمياه الجوفية في كتلة أتشنيرا، أغرا
| نطاق مؤشر جودة المياه | جودة المياه |
|
|
ماء غير صالح |
|
|
ماء رديء |
|
|
فقير بشكل معتدل |
|
|
ماء صالح للشرب |
|
|
مياه صالحة للشرب |
| المعلمات (ملغ/لتر) | حد أدنى | الحد الأقصى | معنى | SD |
|
|
0.910 | ٢.٤٦٠ | 1.628 | 0.46 |
| تا | ١٨٧٫٠٠ | ٤٩٣.٨٠ | ٣٢٦٫٢٨٠ | ٩٨.٤٧ |
| تي دي | ٨٠١.٢٠ | ٢٠٦٥.٦٠ | ١٣٢٧.٣٦٠ | ٣٩١.٨٥ |
|
|
226.20 | 814.20 | ٤٤٦٫٥٤٠ | 186.95 |
|
|
165.00 | 680.00 | ٣٤٣.٤٠٠ | ١٥٢.٨١ |
|
|
١٢٫٢٠٠ | 67.200 | ٢٩٫٠٨٠ | 15.218 |
|
|
٣٧.٢٠٠ | ١١٤.٢٠ | 60.340 | ٢٢.٣٨٧ |
|
|
٤٫٦٠٠ | ١١٫٠٠٠ | ٧.٠٢٠ | 2.304 |
|
|
6.840 | ٣٢٫٦٠٠ | ١٣.٤٦٤ | 8.137 |
|
|
64.000 | ١٦٠٫٨٠٠ | 82.420 | ٢٨.٥٩ |
| ث | 155.80 | ٤٨٥٫٨٠٠ | 241.700 | 100.32 |
| درجة الحموضة | 8.008 | 8.960 | 8.499 | 0.29 |
التوصيف الجيوكيميائي لكتلة أتشنيرا
| المنطقة (الهند) | تركيز الفلورايد (جزء في المليون) | مصادر أيونات الفلورايد | المراجع |
| أغرا | 0.91-2.67 | جيولوجيا الصخور الحاملة للفلوريد في المياه الجوفية | العمل الحالي |
| أغرا | 0.14-4.88 | وجدت في الصخور التي تحتوي على معادن الفلورايد التي تتفاعل مع الماء | ٥٧ |
| أوناو | 0.06-1.83 | بسبب النشاط الزراعي ورماد الطوب | ٤٤ |
| واراناسي | 0.28-2.01 | جيولوجي | ٤٥ |
| فرقة | 0.32-3.5 | من معادن الفلورايد | ٤٦ |
| سونبهدرا | 0.08-6.7 | يحدث بسبب أسباب طبيعية بشكل رئيسي نتيجة تفاعل الصخور مع الماء | ٤٧ |
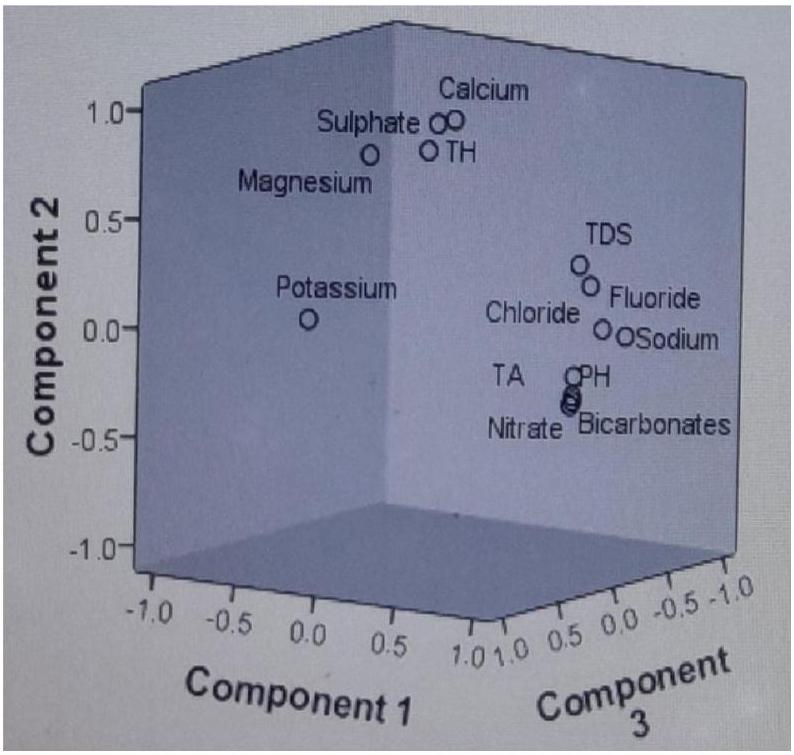
تحليل المكونات الرئيسية (PCA)
| معامل (جزء في المليون) | مكون | ||
| 1 | 2 | ٣ | |
| مصفوفة المكونات
|
|||
|
|
. 823 | . 186 | -. 143 |
| تا | . 853 | . 125 | . 265 |
| الضريبة المقتطعة عند المصدر | . 740 | . 614 | . ١٢٢ |
|
|
. 792 | . 492 | . 052 |
|
|
. 938 | . 170 | -. 189 |
|
|
-. 435 | . 213 | . 810 |
|
|
. 840 | -. 004 | . 210 |
| NO3- | . 780 | -. 129 | . 033 |
|
|
-. 440 | . ٨٣٣ | . 256 |
|
|
-. 158 | . 943 | -. 150 |
| ث | -. 220 | . 933 | -. 076 |
| درجة الحموضة (بلا وحدات) | . 764 | -. 165 | . 015 |
تحليل الارتباط لكتلة أتشنيرا
| المعلمات | درجة الحموضة | الضريبة المقتطعة عند المصدر | تا | ث |
|
|
|
|
|
|
|
|
|
| درجة الحموضة | 1 | 0.389 | 0.542 | -0.21 | -0.194 | -0.47 | 0.77 | -0.303 | -0.556 | 0.484 | 0.433 | 0.64 | 0.508 |
| الضريبة المقتطعة عند المصدر | 0.389 | 1 | 0.718 | 0.349 | 0.459 | 0.202 | 0.73 | -0.124 | 0.028 | 0.973 | 0.527 | 0.65 | 0.642 |
| تا | 0.542 | 0.718 | 1 | -0.101 | -0.146 | -0.167 | 0.783 | -0.188 | -0.182 | 0.659 | 0.55 | 0.60 | 0.977 |
| ث | -0.21 | 0.349 | -0.1 | 1 | 0.944 | 0.884 | -0.004 | 0.233 | 0.59 | 0.223 | -0.316 | 0.047 | -0.248 |
|
|
-0.194 | 0.459 | -0.15 | 0.944 | 1 | 0.802 | 0.029 | 0.153 | 0.55 | 0.385 | -0.255 | 0.097 | -0.276 |
|
|
-0.47 | 0.202 | -0.17 | 0.884 | 0.802 | 1 | -0.31 | 0.53 | 0.546 | 0.037 | -0.417 | -0.3 | -0.283 |
|
|
0.778 | 0.73 | 0.78 | -0.004 | 0.029 | -0.313 | 1 | -0.489 | -0.126 | 0.761 | 0.666 | 0.83 | 0.759 |
|
|
-0.303 | -0.124 | -0.19 | 0.233 | 0.153 | 0.53 | -0.49 | 1 | 0.007 | -0.213 | -0.316 | -0.31 | -0.266 |
|
|
-0.556 | 0.028 | -0.18 | 0.59 | 0.55 | 0.546 | -0.12 | 0.007 | 1 | -0.102 | -0.382 | -0.18 | -0.178 |
|
|
0.484 | 0.973 | 0.659 | 0.223 | 0.385 | 0.037 | 0.76 | -0.213 | -0.102 | 1 | 0.593 | 0.70 | 0.597 |
|
|
0.433 | 0.527 | 0.55 | -0.316 | -0.255 | -0.417 | 0.66 | -0.316 | -0.382 | 0.593 | 1 | 0.63 | 0.568 |
|
|
0.642 | 0.654 | 0.607 | 0.047 | 0.097 | -0.3 | 0.83 | -0.312 | -0.184 | 0.705 | 0.635 | 1 | 0.516 |
|
|
0.508 | 0.642 | 0.977 | -0.248 | -0.276 | -0.283 | 0.76 | -0.266 | -0.178 | 0.597 | 0.568 | 0.516 | 1 |
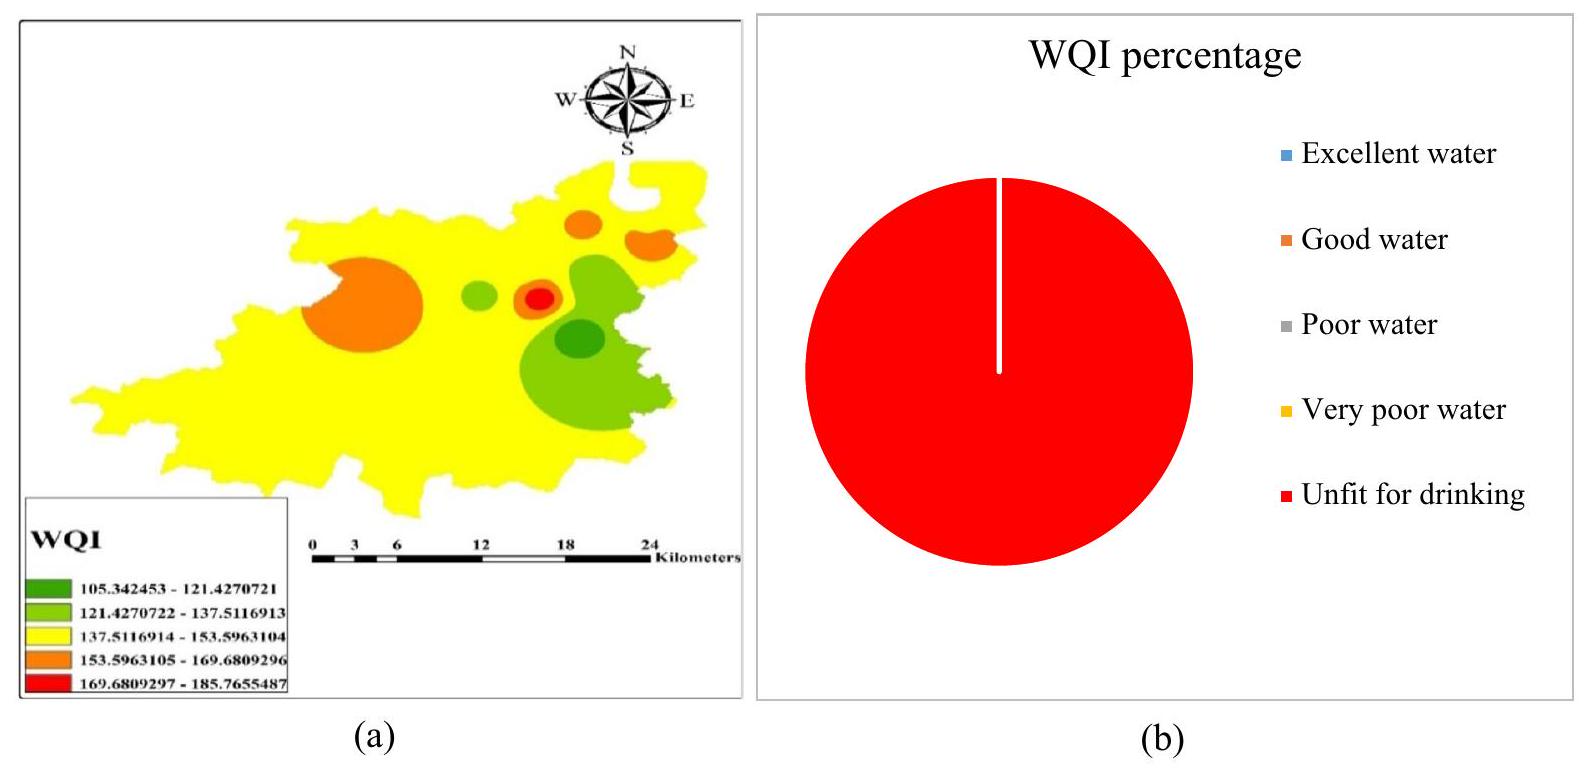
WOI والتوزيع المكاني
| المصادر | الظروف التي تساهم في إطلاق الفلورايد |
| أصل جيولوجي | من معادن الفلورايد مثل الكريولايت، الفلورايد الممتص على معادن الطين |
| من صنع الإنسان | استخراج المعادن من خلال أنشطة التعدين، ومخلفات الأسمدة الفوسفاتية |
| درجة الحموضة | تركيز عالٍ من الفلورايد في المياه الجوفية يرجع إلى ظاهرة التسرب التي تعززها درجة الحموضة العالية للمياه. |
| المادة العضوية | زيادة محتوى الفلورايد في المياه الصالحة للشرب مع زيادة محتوى المواد العضوية |
| ظروف الأكسدة والاختزال | تركيز الفلورايد العالي يؤثر على جودة البيئة |
| تركيز الأيونات | توجد كميات قليلة من الكاتيونات (مثل الصوديوم والبوتاسيوم والكالسيوم) والأنيونات (مثل البيكربونات) مع تركيز عالٍ من الفلورايد في الماء. |
| الظروف المناخية | شبه جاف إلى جاف |
| رقم التسلسل | اسم القرية | مؤشر جودة المياه (WQI) | جودة المياه |
| 1 | أرسينا | 158.115 | غير صالح للشرب |
| 2 | بيارة | 164.838 | غير صالح للشرب |
| ٣ | جانوتا | ١٤٠٫٢٩٤ | غير صالح للشرب |
| ٤ | كوكاثالا | ١٢٢.٣٤٩ | غير صالح للشرب |
| ٥ | لوه كاريلا | 162.857 | غير صالح للشرب |
| ٦ | رايبه | 185.866 | غير صالح للشرب |
| ٧ | ماهور | 99.323 | جودة رديئة |
| ٨ | رونكاتا | 152.101 | غير صالح للشرب |
| 9 | سيهتا | 124.867 | غير صالح للشرب |
| 10 | أشهرنا | 131.918 | غير صالح للشرب |
دراسة مقارنة بين المناطق الريفية والحضرية باستخدام معايير جودة المياه
الاستنتاجات
توفر البيانات
نُشر على الإنترنت: 05 مارس 2024
References
- Ali, S. et al. Qualitative assessment of ground water using the water quality index from a part of Western Uttar Pradesh, North India. Desalin. Water Treat. 252, 332-338 (2022).
- Rao, Q., Qiu, Y. & Li, J. Water quality assessment and variation trends analysis of the min river sea-entry section, China. Water Air Soil Pollut. 230, 1-11 (2019).
- Ali, S. et al. Health risk assessment due to fluoride contamination in groundwater of Bichpuri, Agra, India: A case study. Model. Earth Syst. Environ. 8, 299-307 (2022).
- Takdastan, A. et al. Neuro-fuzzy inference system Prediction of stability indices and Sodium absorption ratio in Lordegan rural drinking water resources in west Iran. Data Brief. 18, 255-261 (2018).
- Shams, M., Mohammadi, A. & Sajadi, S. A. Evaluation of corrosion and scaling potential of water in rural water supply distribution networks of Tabas, Iran. World Appl. Sci. J. 17, 1484-1489 (2012).
- Faraji, H. et al. Correlation between fluoride in drinking Water and its levels in breast milk in Golestan Province, Northern Iran. Iran. J. Public Health 43, 1664-1668 (2014).
- Ramakrishnaiah, C. R. et al. Assessment of water quality index for the groundwater in Tumkur Taluk, Karnataka State, India. J. Chem. 6, 523-530 (2009).
- Berman, J. WHO: Waterborne disease is world’s leading killer. VOA News 29, 66 (2009).
- Malik, A. et al. Water-borne diseases, cost of illness and willingness to pay for diseases interventions in rural communities of developing countries. Iran. J. Public Health 41, 39-49 (2012).
- Khan, S. U. et al. Optimizing fluoride removal and energy consumption in a batch reactor using electrocoagulation: A smart treatment technology. In Smart Cities-Opportunities and Challenges: Select Proceedings of ICSC 2019 vol. 58, 767-778 (2020).
- Rokni, L. et al. Effect of persistent organic pollutants on human health in South Korea: A review of the reported diseases. Sustainable 15, 10851 (2023).
- Ali, S. et al. Spatial analysis and probabilistic risk assessment of exposure to fluoride in drinking water using GIS and Monte Carlo simulation. Environ. Sci. Pollut. Res. 29, 5881-5890 (2022).
- Wang, X. et al. Watershed scale spatiotemporal nitrogen transport and source tracing using dual isotopes among surface water, sediments and groundwater in the Yiluo River Watershed, Middle of China. Sci. Total Environ. 833, 155180 (2022).
- Gibert, O. et al. Removal of nitrate from groundwater by nano-scale zero-valent iron injection pulses in continuous-flow packed soil columns. Sci. Total Environ. 810, 152300 (2022).
- Wang, X. et al. Spatiotemporal changes of nitrate retention at the interface between surface water and groundwater: Insight from watershed scale in an elevated nitrate region. Hydrol. Process. 37, 14856 (2023).
- Jafarzade, N. et al. Viability of two adaptive fuzzy systems based on fuzzy c means and subtractive clustering methods for modeling Cadmium in groundwater resources. Heliyon 9(8), 66 (2023).
- Singh, P. K. et al. Qualitative assessment of surface water of West Bokaro Coalfield, Jharkhand by using water quality index method. Int. J. Chem. Technol. Res. 5, 2351-2356 (2013).
- Zhang, Q. et al. Groundwater quality assessment using a new integrated-weight water quality index (IWQI) and driver analysis in the Jiaokou Irrigation District, China. Ecotoxicol. Environ. Saf. 212, 111992 (2021).
- Dash, S. & Kalamdhad, A. S. Hydrochemical dynamics of water quality for irrigation use and introducing a new water quality index incorporating multivariate statistics. Environ. Earth Sci. 80, 1-21 (2021).
- Abbasnia, A. et al. Evaluation of groundwater quality using water quality index and its suitability for assessing water for drinking and irrigation purposes: Case study of Sistan and Baluchistan province (Iran). Hum. Ecol. Risk Assess. 25, 988-1005 (2019).
- Rad Fard, M. et al. Protocol for the estimation of drinking water quality index (DWQI) in water resources: Artificial neural network (ANFIS) and Arc-Gis. Methods X 6, 1021-1029 (2019).
- Thanh Giao, N. et al. Spatiotemporal analysis of surface water quality in Dong Thap province, Vietnam using water quality index and statistical approaches. Water 13, 336 (2021).
- Radfard, M. et al. Drinking water quality and arsenic health risk assessment in Sistan and Baluchestan, Southeastern Province, Iran. Hum. Ecol. Risk Assess. 25, 949-965 (2018).
- Abbasnia, A. et al. Groundwater quality assessment for irrigation purposes based on irrigation water quality index and its zoning with GIS in the villages of Chabahar, Sistan and Baluchistan, Iran. Data Brief. 19, 623-631 (2018).
- Taloor, A. K. et al. Spring water quality and discharge assessment in the Basantar watershed of Jammu Himalaya using geographic information system (GIS) and water quality Index (WQI). Groundw Sustain Dev. 10, 100364 (2020).
- Badeenezhad, A. et al. Estimation of the groundwater quality index and investigation of the affecting factors their changes in Shiraz drinking groundwater, Iran. Groundw. Sustain. Dev. 11, 100435 (2020).
- Uddin, M. G. et al. A review of water quality index models and their use for assessing surface water quality. Ecol. Indic. 122, 107218 (2021).
- Verma, P. et al. Assessment of groundwater quality status by using water quality index (WQI) and geographic information system (GIS) approaches: A case study of the Bokaro district, India. Appl. Water. Sci. 10, 1-16 (2020).
- Chakraborty, B. et al. Geospatial assessment of groundwater quality for drinking through water quality index and human health risk index in an upland area of Chota Nagpur Plateau of West Bengal, India. In Spatial Modeling and Assessment of Environmental Contaminants: Risk Assessment and Remediation 327-358 (2021).
- Verma, S. & Sinha, A. Appraisal of groundwater arsenic on opposite banks of River Ganges, West Bengal, India, and quantification of cancer risk using Monte Carlo simulations. Environ. Sci. Pollut. Res. 30, 25205-25225 (2023).
- Chakrabarty, S. & Sarma, H. P. Heavy metal contamination of drinking water in Kamrup district, Assam, India. Environ. Monit. Assess. 179, 479-486 (2011).
- Mazhar, S. N. & Ahmad, S. Assessment of water quality pollution indices and distribution of heavy metals in drinking water in Ramganga aquifer, Bareilly District Uttar Pradesh, India. Groundw. Sustain. Dev. 10, 100304 (2020).
- Singh, K. K. et al. Understanding urban groundwater pollution in the Upper Gangetic Alluvial Plains of northern India with multiple industries and their impact on drinking water quality and associated health risks. Groundw. Sustain. Dev. 21, 100902 (2023).
- Gopal, B. & Chauhan, M. River Yamuna from source to Delhi: Human impacts and approaches to conservation. Restor. River Yamuna 66, 45-69 (2007).
- Rice, E. W., Bridgewater, L. & Association, A. P. H. Standard Methods for the Examination of Water and Wastewater Vol. 10 (American Public Health Association Washington, 2012).
- Balan, I. et al. An assessment of groundwater quality using water quality index in Chennai, Tamil Nadu, India. Chron. Young Sci. 3, 146-146 (2012).
- Brown, R. M. et al. A water quality index-Crashing the psychological barrier. In Indicators of Environmental Quality: Proceedings of a symposium held during the AAAS Meeting in Philadelphia, Pennsylvania, December 26-31, 1971 173-182 (Springer, 1972).
- WHO, G. Guidelines for drinking-water quality. World Health Organ. 216, 303-304 (2011).
- BIS, I., 10500: Indian Standard Drinking Water-Specification (Second Revision), (Bureau of Indian Standards, 2012).
- Tyagi, S. et al. Water quality assessment in terms of water quality index. J. Am. Water Resour. Assoc. 1, 34-38 (2013).
- Benkov, I. et al. Principal component analysis and the water quality index-A powerful tool for surface water quality assessment: A case study on Struma River Catchment, Bulgaria. Water 15, 1961 (2023).
- Shokry, A. et al. Groundwater quality index based on PCA: Wadi El-Natrun, Egypt. J. Afr. Earth Sci. 172, 103964 (2020).
- Edmunds, W. M. & Smedley, P. L. Groundwater geochemistry and health: An overview. Geol. Soc. Lond. Spec. Publ. 113, 91-105 (1996).
- Ansari, J. A. & Umar, R. Evaluation of hydrogeochemical characteristics and groundwater quality in the quaternary aquifers of Unnao District, Uttar Pradesh, India. Hydro Res. 1, 36-47 (2019).
- Chaurasia, A. K. et al. A groundwater quality assessment using water quality index (WQI) in parts of Varanasi District, Uttar Pradesh, India. J. Geol. Soc. India 92, 76-82 (2018).
- Singh, S. Fluoride contamination in groundwater in some villages of Banda District, Uttar Pradesh, India. Int. J. Innov. Sci. Res. Technol. 3, 66 (2016).
- Dey, S., & Raju, N. J. Hydrogeochemical assessment to explore the extent, nature and source of fluoride contamination within the groundwaters of the Panda River Basin, Sonbhadra District, Uttar Pradesh, India. In Geostatistical and Geospatial Approaches for the Characterization of Natural Resources in the Environment: Challenges, Processes and Strategies 221-229 (Springer, 2016).
- Reddy, A. G. S. Geochemical evaluation of nitrate and fluoride contamination in varied hydrogeological environs of Prakasam district, southern India. Environ. Earth Sci. 71, 4473-4495 (2014).
- Liu, Z. et al. Eutrophication causes analysis under the influencing of anthropogenic activities in China’s largest fresh water lake (Poyang Lake): Evidence from hydrogeochemistry and reverse simulation methods. J. Hydrol. 625, 130020 (2023).
- Liu, Z. et al. Multi-methods to investigate spatiotemporal variations of nitrogen-nitrate and its risks to human health in China’s largest fresh water lake (Poyang Lake). Sci. Total. Environ. 863, 160975 (2023).
- Kaiser, H. F. The application of electronic computers to factor analysis. Educ. Psychol. Meas. 20, 141-151 (1960).
- Khan, S. M. M. N. & Ravikumar, A. Role of alkalinity for the release of fluoride in the groundwater of Tiruchengode Taluk, Namakkal District, Tamilnadu, India. Chem. Sci. Trans. 2, S302-S308 (2013).
- Patolia, P. & Sinha, A. Fluoride contamination in Gharbar Village of Dhanbad District, Jharkhand, India: source identification and management. Arab. J. Geosci. 10, 1-10 (2017).
- Jha, P. K. & Tripathi, P. Arsenic and fluoride contamination in groundwater: A review of global scenarios with special reference to India. Groundw. Sustain. Dev. 13, 100576 (2021).
- Kumar, M. et al. Scenario, perspectives and mechanism of arsenic and fluoride co-occurrence in the groundwater: A review. Chemosphere 249, 126126 (2020).
- Ali, S. et al. Physico-chemical characterization of groundwater in terms of Water Quality Index (WQI) for urban areas of Agra, North India. Appl. Ecol. Environ. Sci. 10, 409-416 (2022).
- Ali, S. et al. Investigation and mapping of fluoride-endemic areas and associated health risk-A case study of Agra, Uttar Pradesh, India. Hum. Ecol. Risk Assess. 23, 590-604 (2017).
- Kim, S. et al. Co-contamination of arsenic and fluoride in the groundwater of unconsolidated aquifers under reducing environments. Chemosphere 87, 851-856 (2012).
- Hossain, S. et al. Geochemical processes controlling fluoride enrichment in groundwater at the western part of Kumamoto area, Japan. Water Air Soil Pollut. 227, 1-14 (2016).
- Currell, M. et al. Controls on elevated fluoride and arsenic concentrations in groundwater from the Yuncheng Basin, China. Appl. Geochem. 26, 540-552 (2011).
- Bhattacharya, P. et al. Distribution and mobility of arsenic in the Rio Dulce alluvial aquifers in Santiago del Estero Province, Argentina. Sci. Total Environ. 358, 97-120 (2006).
- Deng, Y. et al. Isotope and minor element geochemistry of high arsenic groundwater from Hangjinhouqi, the Hetao Plain, Inner Mongolia. Appl. Geochem. 24, 587-599 (2009).
- Kim, K. & Jeong, G. Y. Factors influencing natural occurrence of fluoride-rich groundwaters: A case study in the southeastern part of the Korean Peninsula. Chemosphere 58, 1399-1408 (2005).
- Amini, M. et al. Statistical modeling of global geogenic fluoride contamination in groundwaters. Environ. Sci. Technol. 42, 36623668 (2008).
- Gomez, M. L. et al. Arsenic and fluoride in a loess aquifer in the central area of Argentina. Environ. Geol. 57, 143-155 (2009).
شكر وتقدير
مساهمات المؤلفين
المصالح المتنافسة
معلومات إضافية
معلومات إعادة الطباعة والتصاريح متاحة علىwww.nature.com/reprints.
ملاحظة الناشر: تظل شركة سبرينجر ناتشر محايدة فيما يتعلق بالمطالبات القضائية في الخرائط المنشورة والانتماءات المؤسسية.
© المؤلف(ون) 2024
قسم العلوم التطبيقية، كلية أناند للهندسة، أغرا، أتر برديش، الهند. قسم علوم البيئة والهندسة، IIT(ISM)، دهنباد، جهارخاند، الهند. قسم الهندسة المدنية، جامعة GLA، ماثورا، الهند. قسم العلوم التطبيقية (الرياضيات)، مجموعة مؤسسات جي. إل. باجاج، ماثورا، الهند. قسم الرياضيات والحوسبة، معهد مدهف للتكنولوجيا والعلوم، غوالير، الهند. قسم الهندسة الميكانيكية، كلية أناند الهندسية، أغرا، الهند. قسم هندسة الصحة البيئية، جامعة نيشابور للعلوم الطبية، نيشابور، إيران. قسم علوم البيئة والهندسة، جامعة SRM-AP، أمارافاتي، أندرا براديش، الهند. قسم العلوم التطبيقية، معهد بونديلخاند للهندسة والتكنولوجيا (BIET)، جانسي، الهند. معهد البحث والتطوير، جامعة دوي تان، دا نانغ، فيتنام. كلية الهندسة والتكنولوجيا، جامعة دوي تان، دا نانغ، فيتنام. البريد الإلكتروني:mohammadia3@nums.ac.ir; mehdifattahi@duytan.edu.vn
DOI: https://doi.org/10.1038/s41598-024-56056-8
PMID: https://pubmed.ncbi.nlm.nih.gov/38443485
Publication Date: 2024-03-05
Groundwater quality assessment using water quality index and principal component analysis in the Achnera block, Agra district, Uttar Pradesh, Northern India
Abstract
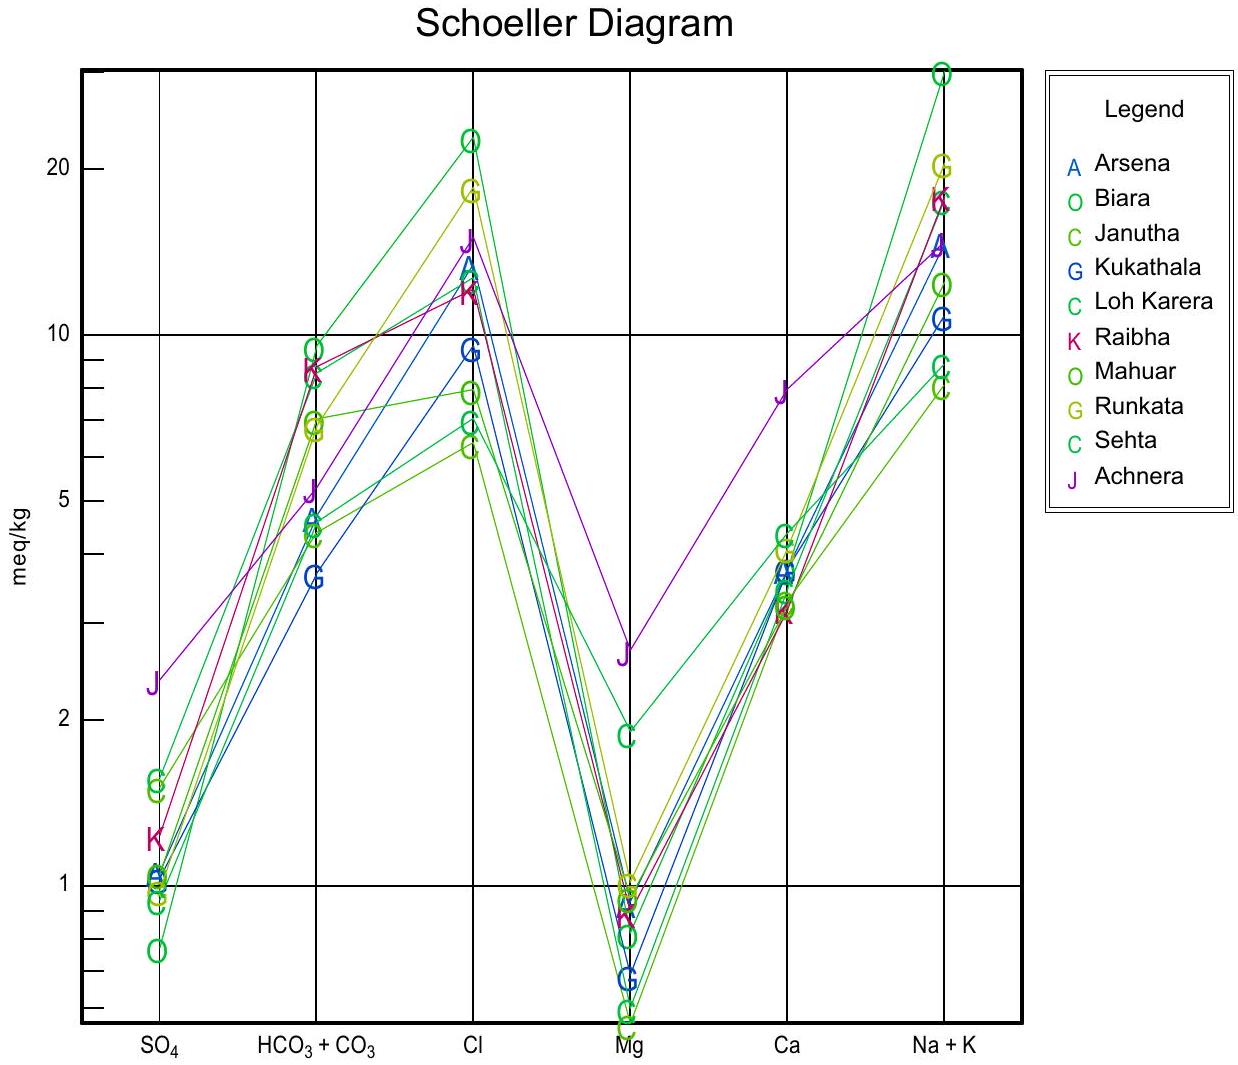
The qualitative and quantitative assessment of groundwater is one of the important aspects for determining the suitability of potable water. Therefore, the present study has been performed to evaluate the groundwater quality for Achhnera block in the city of Taj, Agra, India, where groundwater is an important water resource. The groundwater samples, 50 in number were collected and analyzed for major ions along with some important trace element. This study has further investigated for the applicability of groundwater quality index (GWOI), and the principal component analysis (PCA) to mark out the major geochemical solutes responsible for origin and release of geochemical solutes into the groundwater. The results confirm that, majority of the collected groundwater samples were alkaline in nature. The variation of concentration of anions in collected groundwater samples were varied in the sequence as,
Quality of life is associated with quality of water we consume. Out of all water resource, groundwater is one of the important drinking water resources
Materials and methods
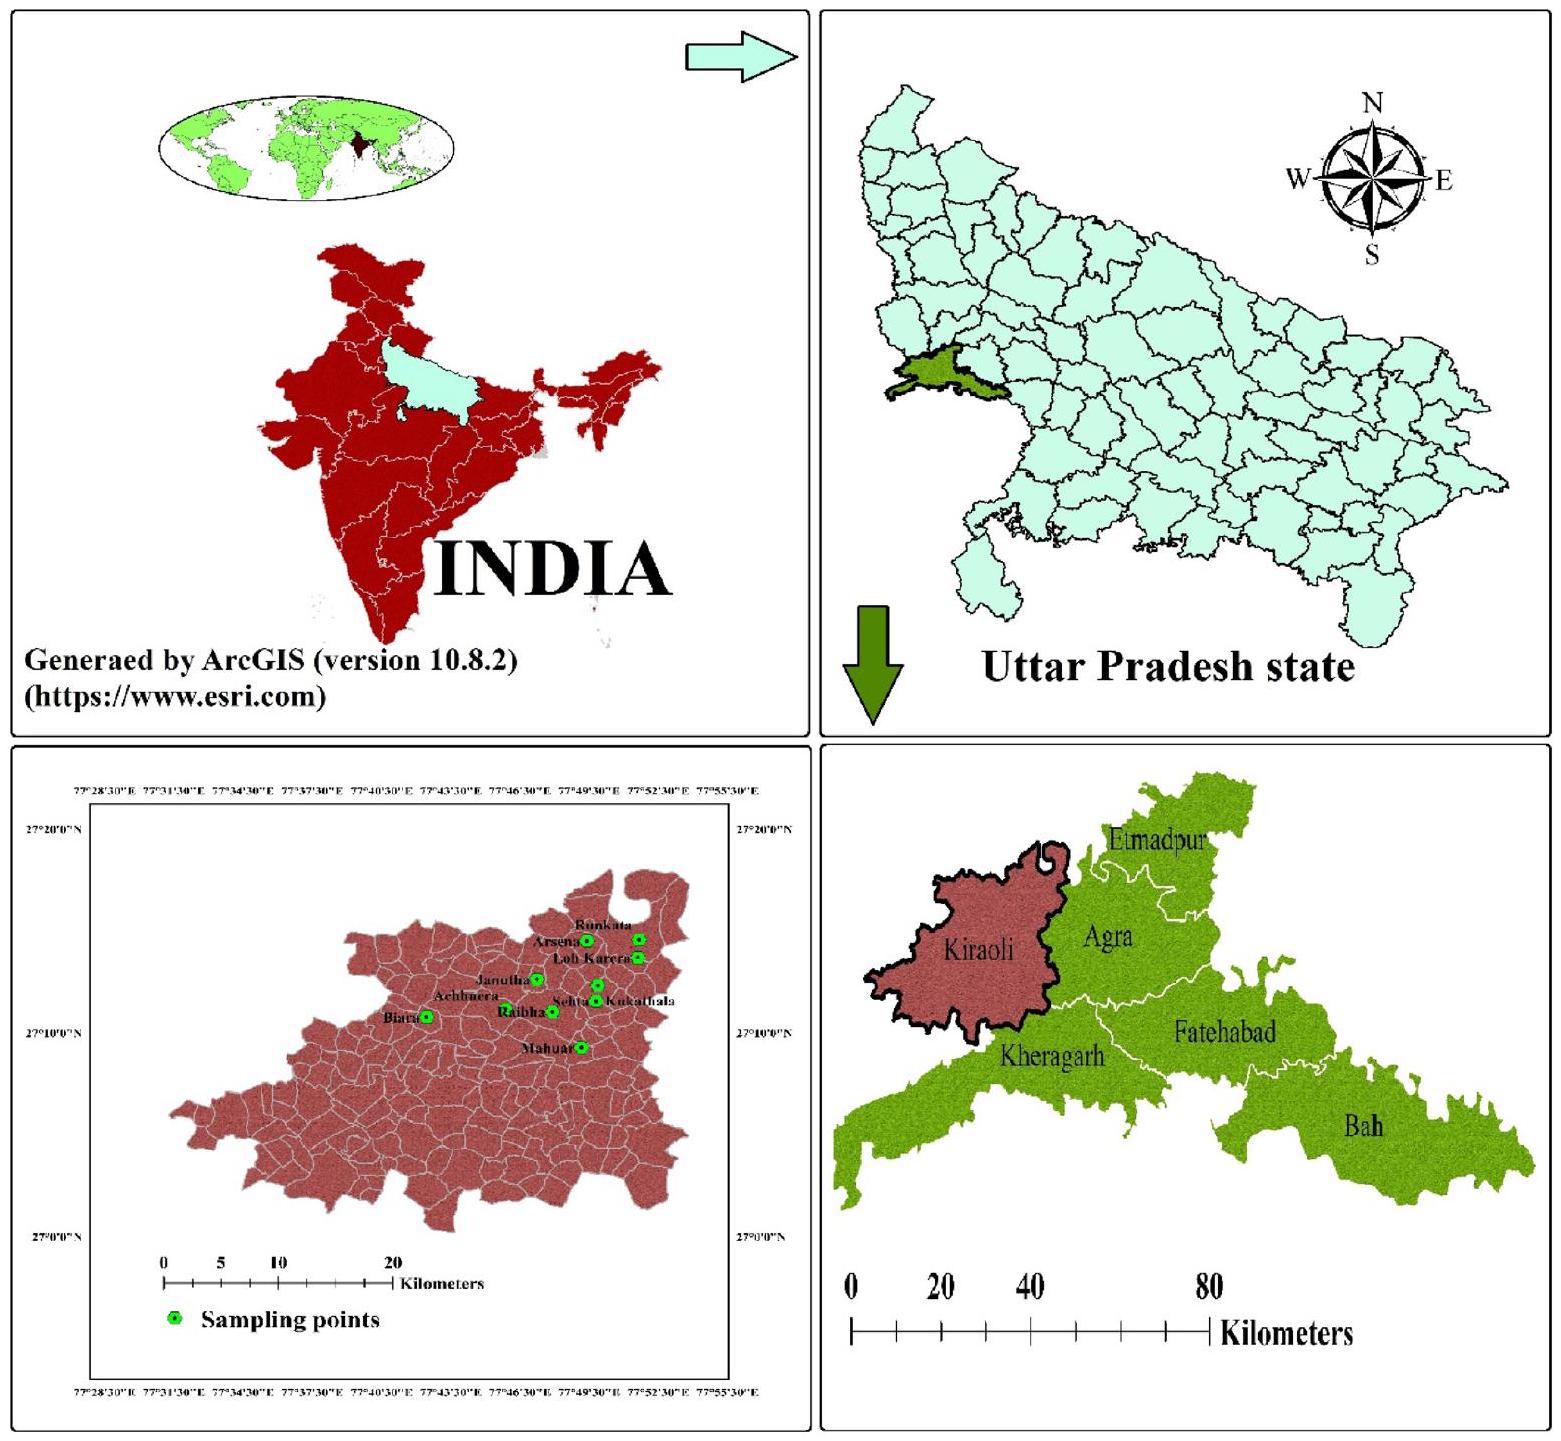
Study area and its geology
Sample collection and hydro-geochemical analysis
Calculation of the WQI of the samples
Calculation of the unit weight (Wn)
Calculation of groundwater quality rating
| Variables (mg/L)* | BIS, 10500 standards | WHO standards |
|
|
1-1.5 | 1.5 |
| TA | 200-600 | 500 |
| TDS | 500-2000 | 1000 |
|
|
250-1000 | 250 |
|
|
– | 200 |
|
|
– | 12 |
|
|
200-400 | 250 |
|
|
45 | 50 |
|
|
30-100 | 50 |
|
|
75-200 | 200 |
| TH | 200-600 | 500 |
| pH | 6.5-8.5 | 8.5 |
Principal component analysis (PCA)
Statistics used and Data analysis
Result and discussion
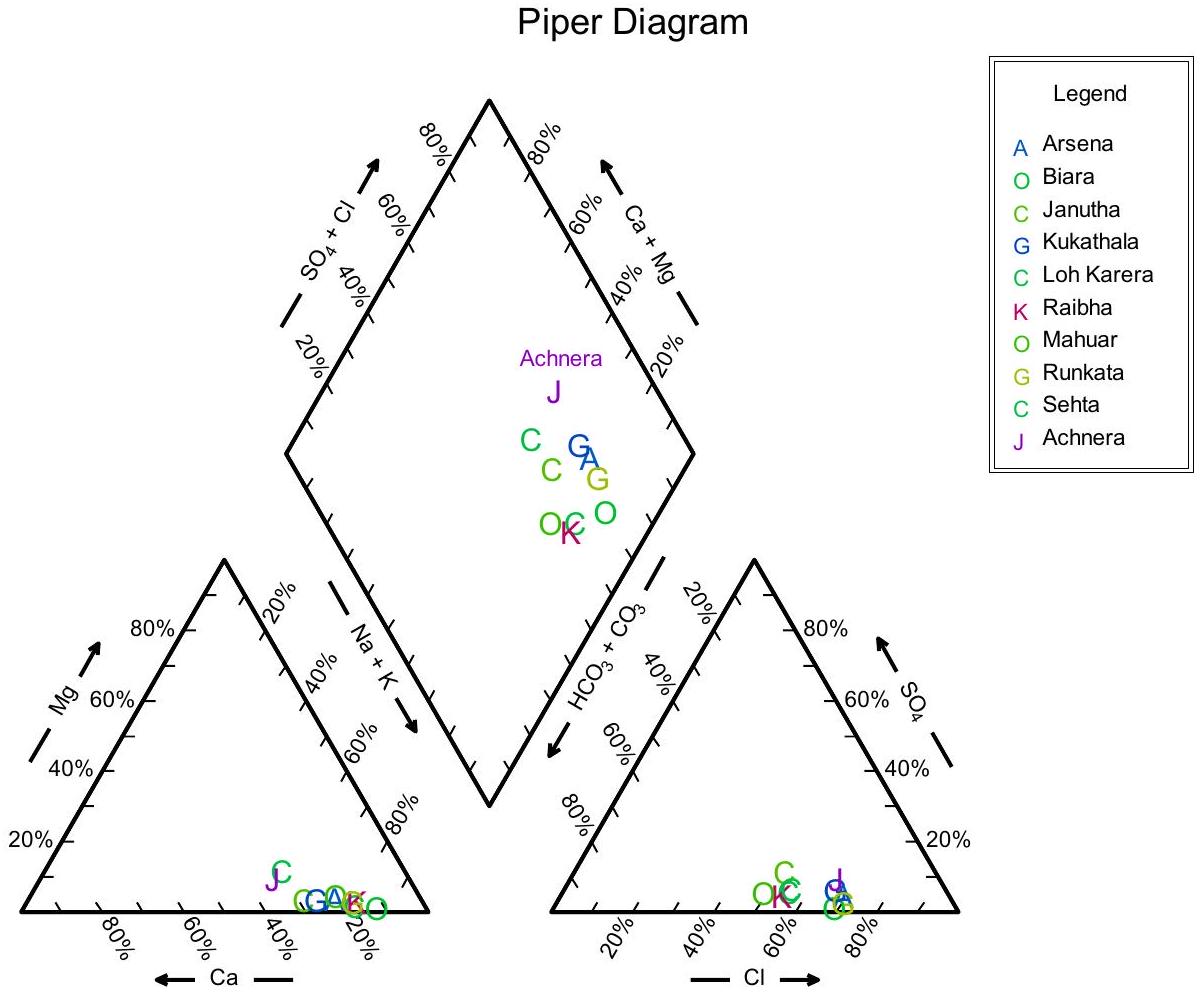
Hydrochemistry of groundwater of Achhnera block, Agra
| WQI range | Water quality |
|
|
Unfit water |
|
|
Poor water |
|
|
Moderately poor |
|
|
Palatable water |
|
|
Potable water |
| Parameters (mg/L) | Minimum | Maximum | Mean | SD |
|
|
0.910 | 2.460 | 1.628 | 0.46 |
| TA | 187.00 | 493.80 | 326.280 | 98.47 |
| TD | 801.20 | 2065.60 | 1327.360 | 391.85 |
|
|
226.20 | 814.20 | 446.540 | 186.95 |
|
|
165.00 | 680.00 | 343.400 | 152.81 |
|
|
12.200 | 67.200 | 29.080 | 15.218 |
|
|
37.200 | 114.20 | 60.340 | 22.387 |
|
|
4.600 | 11.000 | 7.020 | 2.304 |
|
|
6.840 | 32.600 | 13.464 | 8.137 |
|
|
64.000 | 160.800 | 82.420 | 28.59 |
| TH | 155.80 | 485.800 | 241.700 | 100.32 |
| pH | 8.008 | 8.960 | 8.499 | 0.29 |
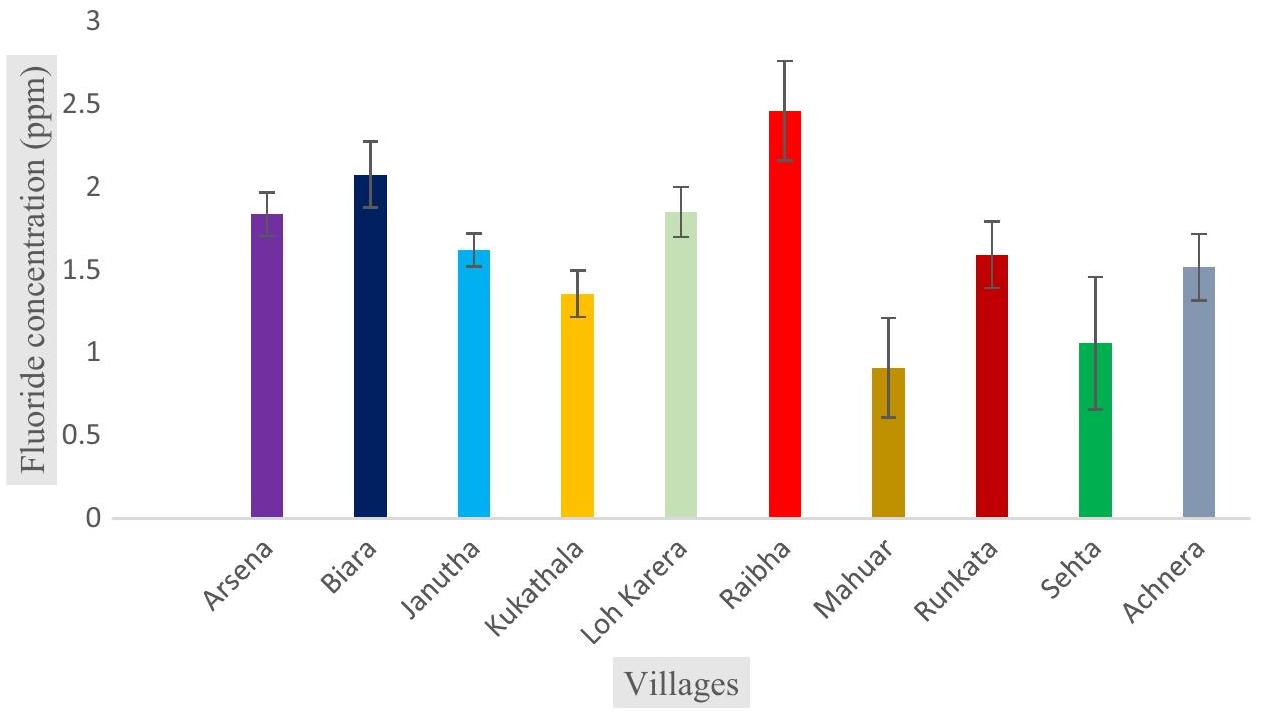
Geochemical characterization of Achhnera block
| Area (India) | Concentration of fluoride (ppm) | Sources of fluoride ions | References |
| Agra | 0.91-2.67 | Geogenic and rocks of fluoride bearing minerals in groundwater | Present work |
| Agra | 0.14-4.88 | Found in rocks bearing fluoride minerals which interact with water | 57 |
| Unnao | 0.06-1.83 | Due to agricultural activity and Brick ash | 44 |
| Varanasi | 0.28-2.01 | Geogenic | 45 |
| Banda | 0.32-3.5 | From fluoride minerals | 46 |
| Sonbhadra | 0.08-6.7 | Occurring due to natural causes mainly due to rock-water interaction | 47 |
Principal component analysis (PCA)
| Parameter (ppm) | Component | ||
| 1 | 2 | 3 | |
| Component matrix
|
|||
|
|
. 823 | . 186 | -. 143 |
| TA | . 853 | . 125 | . 265 |
| TDS | . 740 | . 614 | . 122 |
|
|
. 792 | . 492 | . 052 |
|
|
. 938 | . 170 | -. 189 |
|
|
-. 435 | . 213 | . 810 |
|
|
. 840 | -. 004 | . 210 |
| NO3- | . 780 | -. 129 | . 033 |
|
|
-. 440 | . 833 | . 256 |
|
|
-. 158 | . 943 | -. 150 |
| TH | -. 220 | . 933 | -. 076 |
| pH (unitless) | . 764 | -. 165 | . 015 |
Correlation analysis of Achhnera block
| Parameters | pH | TDS | TA | TH |
|
|
|
|
|
|
|
|
|
| pH | 1 | 0.389 | 0.542 | -0.21 | -0.194 | -0.47 | 0.77 | -0.303 | -0.556 | 0.484 | 0.433 | 0.64 | 0.508 |
| TDS | 0.389 | 1 | 0.718 | 0.349 | 0.459 | 0.202 | 0.73 | -0.124 | 0.028 | 0.973 | 0.527 | 0.65 | 0.642 |
| TA | 0.542 | 0.718 | 1 | -0.101 | -0.146 | -0.167 | 0.783 | -0.188 | -0.182 | 0.659 | 0.55 | 0.60 | 0.977 |
| TH | -0.21 | 0.349 | -0.1 | 1 | 0.944 | 0.884 | -0.004 | 0.233 | 0.59 | 0.223 | -0.316 | 0.047 | -0.248 |
|
|
-0.194 | 0.459 | -0.15 | 0.944 | 1 | 0.802 | 0.029 | 0.153 | 0.55 | 0.385 | -0.255 | 0.097 | -0.276 |
|
|
-0.47 | 0.202 | -0.17 | 0.884 | 0.802 | 1 | -0.31 | 0.53 | 0.546 | 0.037 | -0.417 | -0.3 | -0.283 |
|
|
0.778 | 0.73 | 0.78 | -0.004 | 0.029 | -0.313 | 1 | -0.489 | -0.126 | 0.761 | 0.666 | 0.83 | 0.759 |
|
|
-0.303 | -0.124 | -0.19 | 0.233 | 0.153 | 0.53 | -0.49 | 1 | 0.007 | -0.213 | -0.316 | -0.31 | -0.266 |
|
|
-0.556 | 0.028 | -0.18 | 0.59 | 0.55 | 0.546 | -0.12 | 0.007 | 1 | -0.102 | -0.382 | -0.18 | -0.178 |
|
|
0.484 | 0.973 | 0.659 | 0.223 | 0.385 | 0.037 | 0.76 | -0.213 | -0.102 | 1 | 0.593 | 0.70 | 0.597 |
|
|
0.433 | 0.527 | 0.55 | -0.316 | -0.255 | -0.417 | 0.66 | -0.316 | -0.382 | 0.593 | 1 | 0.63 | 0.568 |
|
|
0.642 | 0.654 | 0.607 | 0.047 | 0.097 | -0.3 | 0.83 | -0.312 | -0.184 | 0.705 | 0.635 | 1 | 0.516 |
|
|
0.508 | 0.642 | 0.977 | -0.248 | -0.276 | -0.283 | 0.76 | -0.266 | -0.178 | 0.597 | 0.568 | 0.516 | 1 |
WOI and spatial distribution
| Sources | Conditions contributing to fluoride release |
| Geogenic origin | From fluoride minerals like cryolite, adsorbed fluoride on clay minerals |
| Anthropogenic (Manmade) | Extraction of mineral through activities of mining, phosphate fertilizer effluents |
| pH | High concentration of fluoride in groundwater is due to phenomena of leaching which is favored by high pH of water |
| Organic matter | Increase the content of fluoride in potable water with a higher organic matter content |
| Redox conditions | High fluoride concentration affects the quality of environment |
| Concentration of ions | Few cations (Na, K, Ca, etc.) and anions (Bicarbonates) are found with high concentration of fluoride in water |
| Climatic conditions | Semi-arid to arid |
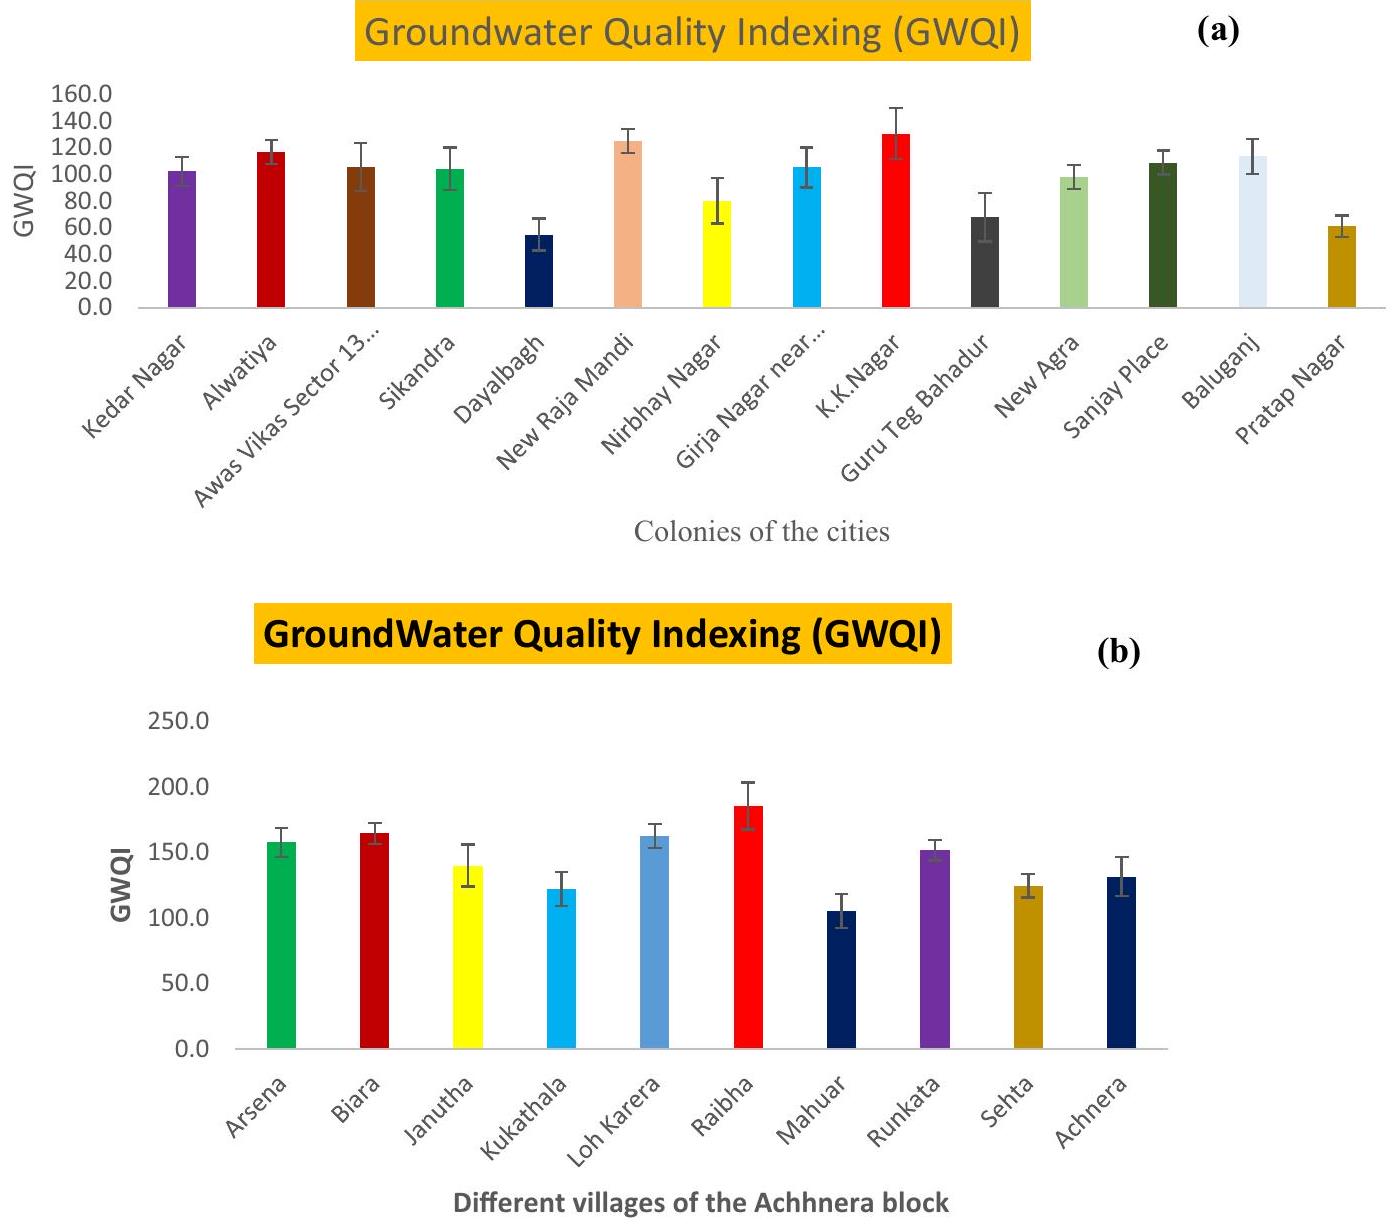
| S. no | Name of village | Water quality indexing (WQI) | Water quality |
| 1 | Arsena | 158.115 | Unfit for drinking |
| 2 | Biara | 164.838 | Unfit for drinking |
| 3 | Janutha | 140.294 | Unfit for drinking |
| 4 | Kukathala | 122.349 | Unfit for drinking |
| 5 | Loh Karera | 162.857 | Unfit for drinking |
| 6 | Raibha | 185.866 | Unfit for drinking |
| 7 | Mahuar | 99.323 | Poor quality |
| 8 | Runkata | 152.101 | Unfit for drinking |
| 9 | Sehta | 124.867 | Unfit for drinking |
| 10 | Achhnera | 131.918 | Unfit for drinking |
Comparative study of the rural and urban areas using water quality parameters
Conclusions
Data availability
Published online: 05 March 2024
References
- Ali, S. et al. Qualitative assessment of ground water using the water quality index from a part of Western Uttar Pradesh, North India. Desalin. Water Treat. 252, 332-338 (2022).
- Rao, Q., Qiu, Y. & Li, J. Water quality assessment and variation trends analysis of the min river sea-entry section, China. Water Air Soil Pollut. 230, 1-11 (2019).
- Ali, S. et al. Health risk assessment due to fluoride contamination in groundwater of Bichpuri, Agra, India: A case study. Model. Earth Syst. Environ. 8, 299-307 (2022).
- Takdastan, A. et al. Neuro-fuzzy inference system Prediction of stability indices and Sodium absorption ratio in Lordegan rural drinking water resources in west Iran. Data Brief. 18, 255-261 (2018).
- Shams, M., Mohammadi, A. & Sajadi, S. A. Evaluation of corrosion and scaling potential of water in rural water supply distribution networks of Tabas, Iran. World Appl. Sci. J. 17, 1484-1489 (2012).
- Faraji, H. et al. Correlation between fluoride in drinking Water and its levels in breast milk in Golestan Province, Northern Iran. Iran. J. Public Health 43, 1664-1668 (2014).
- Ramakrishnaiah, C. R. et al. Assessment of water quality index for the groundwater in Tumkur Taluk, Karnataka State, India. J. Chem. 6, 523-530 (2009).
- Berman, J. WHO: Waterborne disease is world’s leading killer. VOA News 29, 66 (2009).
- Malik, A. et al. Water-borne diseases, cost of illness and willingness to pay for diseases interventions in rural communities of developing countries. Iran. J. Public Health 41, 39-49 (2012).
- Khan, S. U. et al. Optimizing fluoride removal and energy consumption in a batch reactor using electrocoagulation: A smart treatment technology. In Smart Cities-Opportunities and Challenges: Select Proceedings of ICSC 2019 vol. 58, 767-778 (2020).
- Rokni, L. et al. Effect of persistent organic pollutants on human health in South Korea: A review of the reported diseases. Sustainable 15, 10851 (2023).
- Ali, S. et al. Spatial analysis and probabilistic risk assessment of exposure to fluoride in drinking water using GIS and Monte Carlo simulation. Environ. Sci. Pollut. Res. 29, 5881-5890 (2022).
- Wang, X. et al. Watershed scale spatiotemporal nitrogen transport and source tracing using dual isotopes among surface water, sediments and groundwater in the Yiluo River Watershed, Middle of China. Sci. Total Environ. 833, 155180 (2022).
- Gibert, O. et al. Removal of nitrate from groundwater by nano-scale zero-valent iron injection pulses in continuous-flow packed soil columns. Sci. Total Environ. 810, 152300 (2022).
- Wang, X. et al. Spatiotemporal changes of nitrate retention at the interface between surface water and groundwater: Insight from watershed scale in an elevated nitrate region. Hydrol. Process. 37, 14856 (2023).
- Jafarzade, N. et al. Viability of two adaptive fuzzy systems based on fuzzy c means and subtractive clustering methods for modeling Cadmium in groundwater resources. Heliyon 9(8), 66 (2023).
- Singh, P. K. et al. Qualitative assessment of surface water of West Bokaro Coalfield, Jharkhand by using water quality index method. Int. J. Chem. Technol. Res. 5, 2351-2356 (2013).
- Zhang, Q. et al. Groundwater quality assessment using a new integrated-weight water quality index (IWQI) and driver analysis in the Jiaokou Irrigation District, China. Ecotoxicol. Environ. Saf. 212, 111992 (2021).
- Dash, S. & Kalamdhad, A. S. Hydrochemical dynamics of water quality for irrigation use and introducing a new water quality index incorporating multivariate statistics. Environ. Earth Sci. 80, 1-21 (2021).
- Abbasnia, A. et al. Evaluation of groundwater quality using water quality index and its suitability for assessing water for drinking and irrigation purposes: Case study of Sistan and Baluchistan province (Iran). Hum. Ecol. Risk Assess. 25, 988-1005 (2019).
- Rad Fard, M. et al. Protocol for the estimation of drinking water quality index (DWQI) in water resources: Artificial neural network (ANFIS) and Arc-Gis. Methods X 6, 1021-1029 (2019).
- Thanh Giao, N. et al. Spatiotemporal analysis of surface water quality in Dong Thap province, Vietnam using water quality index and statistical approaches. Water 13, 336 (2021).
- Radfard, M. et al. Drinking water quality and arsenic health risk assessment in Sistan and Baluchestan, Southeastern Province, Iran. Hum. Ecol. Risk Assess. 25, 949-965 (2018).
- Abbasnia, A. et al. Groundwater quality assessment for irrigation purposes based on irrigation water quality index and its zoning with GIS in the villages of Chabahar, Sistan and Baluchistan, Iran. Data Brief. 19, 623-631 (2018).
- Taloor, A. K. et al. Spring water quality and discharge assessment in the Basantar watershed of Jammu Himalaya using geographic information system (GIS) and water quality Index (WQI). Groundw Sustain Dev. 10, 100364 (2020).
- Badeenezhad, A. et al. Estimation of the groundwater quality index and investigation of the affecting factors their changes in Shiraz drinking groundwater, Iran. Groundw. Sustain. Dev. 11, 100435 (2020).
- Uddin, M. G. et al. A review of water quality index models and their use for assessing surface water quality. Ecol. Indic. 122, 107218 (2021).
- Verma, P. et al. Assessment of groundwater quality status by using water quality index (WQI) and geographic information system (GIS) approaches: A case study of the Bokaro district, India. Appl. Water. Sci. 10, 1-16 (2020).
- Chakraborty, B. et al. Geospatial assessment of groundwater quality for drinking through water quality index and human health risk index in an upland area of Chota Nagpur Plateau of West Bengal, India. In Spatial Modeling and Assessment of Environmental Contaminants: Risk Assessment and Remediation 327-358 (2021).
- Verma, S. & Sinha, A. Appraisal of groundwater arsenic on opposite banks of River Ganges, West Bengal, India, and quantification of cancer risk using Monte Carlo simulations. Environ. Sci. Pollut. Res. 30, 25205-25225 (2023).
- Chakrabarty, S. & Sarma, H. P. Heavy metal contamination of drinking water in Kamrup district, Assam, India. Environ. Monit. Assess. 179, 479-486 (2011).
- Mazhar, S. N. & Ahmad, S. Assessment of water quality pollution indices and distribution of heavy metals in drinking water in Ramganga aquifer, Bareilly District Uttar Pradesh, India. Groundw. Sustain. Dev. 10, 100304 (2020).
- Singh, K. K. et al. Understanding urban groundwater pollution in the Upper Gangetic Alluvial Plains of northern India with multiple industries and their impact on drinking water quality and associated health risks. Groundw. Sustain. Dev. 21, 100902 (2023).
- Gopal, B. & Chauhan, M. River Yamuna from source to Delhi: Human impacts and approaches to conservation. Restor. River Yamuna 66, 45-69 (2007).
- Rice, E. W., Bridgewater, L. & Association, A. P. H. Standard Methods for the Examination of Water and Wastewater Vol. 10 (American Public Health Association Washington, 2012).
- Balan, I. et al. An assessment of groundwater quality using water quality index in Chennai, Tamil Nadu, India. Chron. Young Sci. 3, 146-146 (2012).
- Brown, R. M. et al. A water quality index-Crashing the psychological barrier. In Indicators of Environmental Quality: Proceedings of a symposium held during the AAAS Meeting in Philadelphia, Pennsylvania, December 26-31, 1971 173-182 (Springer, 1972).
- WHO, G. Guidelines for drinking-water quality. World Health Organ. 216, 303-304 (2011).
- BIS, I., 10500: Indian Standard Drinking Water-Specification (Second Revision), (Bureau of Indian Standards, 2012).
- Tyagi, S. et al. Water quality assessment in terms of water quality index. J. Am. Water Resour. Assoc. 1, 34-38 (2013).
- Benkov, I. et al. Principal component analysis and the water quality index-A powerful tool for surface water quality assessment: A case study on Struma River Catchment, Bulgaria. Water 15, 1961 (2023).
- Shokry, A. et al. Groundwater quality index based on PCA: Wadi El-Natrun, Egypt. J. Afr. Earth Sci. 172, 103964 (2020).
- Edmunds, W. M. & Smedley, P. L. Groundwater geochemistry and health: An overview. Geol. Soc. Lond. Spec. Publ. 113, 91-105 (1996).
- Ansari, J. A. & Umar, R. Evaluation of hydrogeochemical characteristics and groundwater quality in the quaternary aquifers of Unnao District, Uttar Pradesh, India. Hydro Res. 1, 36-47 (2019).
- Chaurasia, A. K. et al. A groundwater quality assessment using water quality index (WQI) in parts of Varanasi District, Uttar Pradesh, India. J. Geol. Soc. India 92, 76-82 (2018).
- Singh, S. Fluoride contamination in groundwater in some villages of Banda District, Uttar Pradesh, India. Int. J. Innov. Sci. Res. Technol. 3, 66 (2016).
- Dey, S., & Raju, N. J. Hydrogeochemical assessment to explore the extent, nature and source of fluoride contamination within the groundwaters of the Panda River Basin, Sonbhadra District, Uttar Pradesh, India. In Geostatistical and Geospatial Approaches for the Characterization of Natural Resources in the Environment: Challenges, Processes and Strategies 221-229 (Springer, 2016).
- Reddy, A. G. S. Geochemical evaluation of nitrate and fluoride contamination in varied hydrogeological environs of Prakasam district, southern India. Environ. Earth Sci. 71, 4473-4495 (2014).
- Liu, Z. et al. Eutrophication causes analysis under the influencing of anthropogenic activities in China’s largest fresh water lake (Poyang Lake): Evidence from hydrogeochemistry and reverse simulation methods. J. Hydrol. 625, 130020 (2023).
- Liu, Z. et al. Multi-methods to investigate spatiotemporal variations of nitrogen-nitrate and its risks to human health in China’s largest fresh water lake (Poyang Lake). Sci. Total. Environ. 863, 160975 (2023).
- Kaiser, H. F. The application of electronic computers to factor analysis. Educ. Psychol. Meas. 20, 141-151 (1960).
- Khan, S. M. M. N. & Ravikumar, A. Role of alkalinity for the release of fluoride in the groundwater of Tiruchengode Taluk, Namakkal District, Tamilnadu, India. Chem. Sci. Trans. 2, S302-S308 (2013).
- Patolia, P. & Sinha, A. Fluoride contamination in Gharbar Village of Dhanbad District, Jharkhand, India: source identification and management. Arab. J. Geosci. 10, 1-10 (2017).
- Jha, P. K. & Tripathi, P. Arsenic and fluoride contamination in groundwater: A review of global scenarios with special reference to India. Groundw. Sustain. Dev. 13, 100576 (2021).
- Kumar, M. et al. Scenario, perspectives and mechanism of arsenic and fluoride co-occurrence in the groundwater: A review. Chemosphere 249, 126126 (2020).
- Ali, S. et al. Physico-chemical characterization of groundwater in terms of Water Quality Index (WQI) for urban areas of Agra, North India. Appl. Ecol. Environ. Sci. 10, 409-416 (2022).
- Ali, S. et al. Investigation and mapping of fluoride-endemic areas and associated health risk-A case study of Agra, Uttar Pradesh, India. Hum. Ecol. Risk Assess. 23, 590-604 (2017).
- Kim, S. et al. Co-contamination of arsenic and fluoride in the groundwater of unconsolidated aquifers under reducing environments. Chemosphere 87, 851-856 (2012).
- Hossain, S. et al. Geochemical processes controlling fluoride enrichment in groundwater at the western part of Kumamoto area, Japan. Water Air Soil Pollut. 227, 1-14 (2016).
- Currell, M. et al. Controls on elevated fluoride and arsenic concentrations in groundwater from the Yuncheng Basin, China. Appl. Geochem. 26, 540-552 (2011).
- Bhattacharya, P. et al. Distribution and mobility of arsenic in the Rio Dulce alluvial aquifers in Santiago del Estero Province, Argentina. Sci. Total Environ. 358, 97-120 (2006).
- Deng, Y. et al. Isotope and minor element geochemistry of high arsenic groundwater from Hangjinhouqi, the Hetao Plain, Inner Mongolia. Appl. Geochem. 24, 587-599 (2009).
- Kim, K. & Jeong, G. Y. Factors influencing natural occurrence of fluoride-rich groundwaters: A case study in the southeastern part of the Korean Peninsula. Chemosphere 58, 1399-1408 (2005).
- Amini, M. et al. Statistical modeling of global geogenic fluoride contamination in groundwaters. Environ. Sci. Technol. 42, 36623668 (2008).
- Gomez, M. L. et al. Arsenic and fluoride in a loess aquifer in the central area of Argentina. Environ. Geol. 57, 143-155 (2009).
Acknowledgements
Author contributions
Competing interests
Additional information
Reprints and permissions information is available at www.nature.com/reprints.
Publisher’s note Springer Nature remains neutral with regard to jurisdictional claims in published maps and institutional affiliations.
© The Author(s) 2024
Department of Applied Sciences, Anand Engineering College, Agra, Uttar Pradesh, India. Department of Environmental Science and Engineering, IIT(ISM), Dhanbad, Jharkhand, India. Department of Civil Engineering, GLA University, Mathura, India. Department of Applied Science (Mathematics), G.L. Bajaj Group of Institutions, Mathura, India. Department of Mathematics and Computing, Madhav Institute of Technology and Science, Gwalior, India. Department of Mechanical Engineering, Anand Engineering College, Agra, India. Department of Environmental Health Engineering, Neyshabur University of Medical Sciences, Neyshabur, Iran. Department of Environment Science and Engineering, SRM University-AP, Amaravati, Andhra Pradesh, India. Department of Applied Science, Bundelkhand Institute of Engineering and Technology (BIET), Jhansi, India. Institute of Research and Development, Duy Tan University, Da Nang, Vietnam. School of Engineering and Technology, Duy Tan University, Da Nang, Vietnam. email: mohammadia3@nums.ac.ir; mehdifattahi@duytan.edu.vn