تكلفة الرعاية لمرض الزهايمر والخرف المرتبط به في الولايات المتحدة: من 2016 إلى 2060 Cost of care for Alzheimer’s disease and related dementias in the United States: 2016 to 2060

المجلة: npj Aging، المجلد: 10، العدد: 1
DOI: https://doi.org/10.1038/s41514-024-00136-6
PMID: https://pubmed.ncbi.nlm.nih.gov/38331952
تاريخ النشر: 2024-02-08

تكلفة الرعاية لمرض الزهايمر والخرف المرتبط به في الولايات المتحدة: من 2016 إلى 2060

أريندام ناندي ناثانيال كونتس جانينا بروكير سابرينا مالك سيمياو تشين راشيل هان جيسيكا كلستي بنجامين سيليغمان دانيال تورترس دانيال فيغو وديفيد إي. بلوم

الملخص

يمكن أن تفرض الرعاية الطبية ورعاية طويلة الأمد لمرض الزهايمر والخرف المرتبط به (ADRDs) عبئًا اقتصاديًا كبيرًا على الأفراد والمجتمعات. قمنا بتقدير تكلفة الرعاية لكل فرد من ADRDs في الولايات المتحدة في عام 2016 وتوقعنا التكاليف الإجمالية المستقبلية للرعاية خلال الفترة من 2020 إلى 2060. استنادًا إلى منهجية تم نشرها سابقًا، استخدمنا بيانات المسح الصحي والتقاعد الأمريكي (2010-2016) لتقدير تكاليف الرعاية الرسمية وغير الرسمية. في عام 2016، كانت التكلفة المقدرة لكل مريض من الرعاية الرسمية هي (فترة الثقة 95% [CI]: )، وتم تقييم تكلفة الرعاية غير الرسمية من حيث تكلفة الاستبدال والأجور المفقودة كانت و ، على التوالي. كانت تكلفة الرعاية الرسمية الإجمالية وتكلفة الرعاية الرسمية بالإضافة إلى تكلفة الرعاية غير الرسمية باستخدام طرق تكلفة الاستبدال والأجور المفقودة مليار ( نطاق عدم اليقين [UR]: مليار)، مليار ( مليار)، و مليار ( مليار)، على التوالي، في عام 2020. وكان من المتوقع أن تزيد إلى تريليون ( مليار- تريليون)، تريليون ( تريليون)، و تريليون ( تريليون)، على التوالي، في عام 2060. npj Aging (2024)10:13؛https://doi.org/10.1038/s41514-024-00136-6

مقدمة

من المتوقع أن ينمو عدد الأشخاص الذين تبلغ أعمارهم 65 عامًا فأكثر في الولايات المتحدة من 55 مليونًا في عام 2020 إلى 94 مليونًا في مع تقدم العمر في السكان، ستزداد بشكل كبير عبء مرض الزهايمر والخرف المرتبط به (ADRDs). تمثل ADRDs مجموعة من الحالات المرتبطة التي تتميز بالتدهور العصبي التدريجي، بما في ذلك مرض الزهايمر، والخرف الوعائي، والخرف مع أجسام ليوي، والخرف الجبهي الصدغي. يُقدّر أن 6.5 مليون أمريكي مسن – يعيش تقريبًا ثلاثة أرباعهم الذين تزيد أعمارهم عن 75 عامًا – يعانون من خرف الزهايمر في بحلول عام 2060، من المتوقع أن يرتفع هذا الرقم إلى 13.8 مليون شخص يمكن أن تؤثر اضطرابات الخرف المرتبطة بالعمر بشكل كبير على الإدراك، أي وظائف الدماغ مثل التعلم والذاكرة والتفكير؛ تتداخل مع الأنشطة اليومية مثل الاستحمام والمشي أو الأكل؛ وتؤدي إلى خلل نفسي عصبي، بما في ذلك القلق والهذيان والذهان، وفي النهاية الموت. .
في عام 2013، نشر هيرد وآخرون دراسة نقدية تقدر تكلفة مرض الخرف في الولايات المتحدة، مما مكن البلاد من فهم العبء الاقتصادي المرتبط بشكل أفضل ودعم جهود السياسات لعلاج الأمراض التنكسية العصبية بشكل أكثر فعالية. . قدر هيرد وآخرون أنه في عام 2010 كانت تكاليف الرعاية الطبية المباشرة ورعاية غير الرسمية للخرف في الولايات المتحدة تتراوح بين مليار و مليار، اعتمادًا على المنهجية المستخدمة لتقييم الرعاية غير الرسمية في عام 2015، قام هيرد وآخرون بتوسيع دراستهم من خلال التنبؤ بالتكاليف المحتملة في المستقبل، مما ساعد الأمة على فهم كيف يمكن أن تنمو شدة التهديد مع مرور الوقت إذا لم يتم التعامل معه. إذا ظل معدل انتشار الخرف عند مستواه في عام 2010، فمن المتوقع أن تزيد التكلفة الإجمالية للرعاية السنوية إلى مليار بحلول عام 2040، أو إلى تريليون بواسطة .
بعد ذلك، انتشرت دراسات أخرى حول تكلفة المرض. جمعية الزهايمر، التي تنشر تقديرات سنوية لتكلفة الرعاية الطبية المباشرة استنادًا إلى بيانات من مصادر متنوعة، بما في ذلك مسح المستفيدين الحاليين من ميديكير والدراسات المنشورة حول انتشار المرض. ، وقدرت أن التكلفة الإجمالية للرعاية المباشرة ستزداد من مليار في 2015 إلى تريليون في عام 2050 (دولار أمريكي 2015) تتوافر تقديرات إضافية، مع اختلافات كبيرة في مكونات التكلفة، ومجموعات الدراسة، والتقنيات التحليلية، والنتائج. .
تهدف هذه الدراسة إلى تحديث وبناء على التحليلات التي أجراها هيرد وآخرون لتحفيز موجة جديدة من العمل بشأن الأمراض التنكسية العصبية المرتبطة بالشيخوخة في بلد يتقدم في العمر بسرعة. التقديرات الوطنية للتكاليف المباشرة وغير المباشرة تعتمد بشكل أساسي على بيانات من عام 2010 أو ما قبله، وحتى الدراسات الإقليمية الأصغر تعتمد على بيانات قديمة الآن منذ عقد من الزمن. تعتبر التقديرات الأحدث ضرورية للبحث وصنع السياسات، خاصةً بالنظر إلى التغيرات في مشهد رعاية الأمراض التنكسية العصبية المرتبطة بالخرف بسبب إقرار قانون الرعاية الميسرة في عام 2010 وقانون مشروع الزهايمر الوطني. حسب علمنا، لم تستخدم سوى دراسة واحدة بيانات وطنية حتى عام 2016 لتقدير التكلفة الحالية للرعاية المتعلقة بالخرف من جيب المريض. . علاوة على ذلك، فإن دراسات التوقعات المستقبلية من هيرد وآخرين لا تقيس عدم اليقين بشكل منهجي وأحيانًا تكتفي بالإبلاغ عن تقديرات نقطية فقط. تتيح التوقعات الدقيقة للعبء الاقتصادي المستقبلي للأمراض التنكسية العصبية المرتبطة بالشيخوخة، المستندة إلى أحدث البيانات والتي تأخذ في الاعتبار عدم اليقين بشكل كافٍ، لصانعي السياسات وأصحاب المصلحة الاستثمار بشكل مناسب في البحث والتطوير للعلاجات وابتكارات الرعاية الفعالة من حيث التكلفة للتخفيف من هذا العبء الاقتصادي المحتمل على المجتمع. .
في هذه الدراسة، قمنا بتقدير التكاليف المباشرة وغير المباشرة لرعاية الأمراض التنكسية العصبية في الولايات المتحدة على فترات خمس سنوات من 2020 إلى 2060، متبعين نفس المنهجية التي استخدمها هيرد وآخرون، باستخدام أحدث البيانات المتاحة ودمج عدم اليقين. نحن
استخدمت بيانات طولية وطنية من 2010-2016 لتقدير تكلفة الرعاية لكل فرد لاضطرابات الخرف المعتمدة على هذه المنهجية المنشورة سابقًا. وتكاليف إجمالية متوقعة حتى عام 2060، مع الأخذ في الاعتبار عدم اليقين.

النتائج

تقدم الجدول 1 تكلفة الرعاية الرسمية وغير الرسمية لاضطرابات الخرف المرتبطة بالعمر لكل مريض في عام 2016 بالدولار الأمريكي لعام 2020. كانت التكلفة المقدرة للرعاية الرسمية لكل مريض هي ( : ). كانت تكلفة الرعاية غير الرسمية لكل مريض مقدرة من حيث تكلفة الاستبدال والأجور المفقودة و ، على التوالي. كانت التكاليف الإجمالية لكل مريض بما في ذلك الرعاية الرسمية وغير الرسمية من حيث تكلفة الاستبدال والأجور المفقودة و 43,869 دولار أمريكي (95% CI: 40,246 دولار أمريكي – 47,591 دولار أمريكي) على التوالي.
بالنظر فقط إلى أولئك الذين أبلغوا عن تكاليف غير صفرية، كانت التكلفة المقدرة لكل مريض للرعاية الرسمية في عام 2016 هي ( CI: ). كانت التكاليف الإجمالية لكل مريض بما في ذلك الرعاية الرسمية وغير الرسمية من حيث تكلفة الاستبدال والأجور المفقودة و ( : ) على التوالي.
تقدم الشكل 1 والجداول 2 و3 و4 التوقعات المستقبلية لتكاليف الرعاية (بالدولار الأمريكي لعام 2020). في سيناريو الحالة الأساسية، كانت التكلفة الإجمالية السنوية للرعاية الرسمية لاضطرابات الخرف المرتبطة بالشيخوخة تقدر بـ مليار (نطاق عدم اليقين 95% [UR]: 179-213 مليار دولار) في عام 2020
الجدول 1. تكلفة الرعاية الرسمية وغير الرسمية لاضطرابات الخرف المرتبطة بالأعمار لكل مريض في الولايات المتحدة، 2016.
نوع الإنفاق تكلفة رعاية الأمراض التنكسية العصبية في الولايات المتحدة (2020 دولار أمريكي)
تقدير فترة الثقة 95%
من جيبك
الرعاية الصحية المنزلية 185 ١٠٨ ٢٧١
دار رعاية المسنين 7203 6155 8263
الإجمالي (أ) 7943 6878 9078
إنفاق ميديكير:
وكالات الرعاية الصحية المنزلية 964 759 1191
دار رعاية المسنين 1505 ١٣٩٥ 1618
الإجمالي (ب) ٤٣٦٥ ٣٩٧٤ 4794
الرعاية المنزلية الرسمية:
إجمالي 7220 5687 8917
أقل: ميديكير والنفقات الشخصية 1149 935 1381
الإجمالي الصافي (ج) 6071 ٤٧٤٤ 7554
رعاية دور المسنين:
إجمالي 18,406 ١٧,٠٥٧ 19,791
أقل: ميديكير والنفقات الشخصية 8708 7587 9825
الإجمالي الصافي (د) 9698 8453 10,912
إجمالي الرعاية المشتراة في السوق ( ) ٢٨٠٧٨ ٢٥,٨٩٣ ٣٠,٤٣٣
الرعاية غير الرسمية: تكلفة الاستبدال (E) ٣٦,٦٦٧ ٣٤٠٢٥ ٣٩,٤٧٣
إجمالي الرعاية المشتراة في السوق بالإضافة إلى وقت الرعاية المقدر وفقًا لتكلفة الاستبدال ) ٦٤٧٤٥ 61,740 67,909
الرعاية غير الرسمية: تكلفة الأجر المفقود (F) 15,792 ١٢٩٨٠ 18,713
إجمالي الرعاية المشتراة في السوق بالإضافة إلى وقت الرعاية الذي يتم تقييمه بتكلفة الأجر المفقود ) ٤٣,٨٦٩ ٤٠٢٤٦ ٤٧,٥٩١
وكان من المتوقع أن يرتفع إلى تريليون ( UR: مليار- تريليون) بحلول عام 2060. تم تقدير تكلفة الرعاية الرسمية وغير الرسمية (طريقة الاستبدال) لزيادة من مليار (95% UR: مليار) في 2020 إلى تريليون (95% UR: تريليون) في عام 2060. تم تقدير تكلفة الرعاية الرسمية وغير الرسمية (طريقة الأجور المفقودة) لزيادة من مليار (95% UR: مليار) في 2020 إلى تريليون (95% نطاق الثقة: 1.3-3.5 تريليون دولار) في عام 2060.
بافتراض معدل تضخم سنوي لتكاليف الرعاية بنسبة 4%، ستزداد تكاليف الرعاية الرسمية، والرعاية الرسمية وغير الرسمية (طريقة الاستبدال)، والرعاية الرسمية وغير الرسمية (طريقة الأجور المفقودة) إلى تريليون (95% UR: تريليون)، تريليون (95% UR: تريليون)، و تريليون ( UR: تريليون)، على التوالي، في عام 2060. مع تكاليف الرعاية السنوية والتضخم معدل نمو أقل لعبء الأمراض التنكسية العصبية، ستكون هذه التكاليف الإجمالية تريليون ( UR: مليار- تريليون)، تريليون (95% UR: تريليون)، و تريليون (95% UR: تريليون)، على التوالي، في عام 2060. من المتوقع أن تكون التكاليف الإجمالية في جميع السيناريوهات الأخرى أقل من الحالة الأساسية.
بالنظر إلى ارتفاع تكاليف دور رعاية المسنين لكل فرد (1.95 مرة من الحالة الأساسية، كما هو موضح في جدول الملحق التكميلي S1)، تم تقدير التكاليف السنوية الإجمالية للرعاية الرسمية، والرعاية الرسمية وغير الرسمية (طريقة الاستبدال)، وتكاليف الرعاية الرسمية وغير الرسمية (طريقة الأجور المفقودة) في عام 2020 بـ مليار ( 286 مليار دولار – 351 مليار دولار)، 573 مليار دولار (95% نطاق موثوقية: 520 – 628 مليار دولار)، و428 مليار دولار (95% نطاق موثوقية: 377 – 480 مليار دولار). مع معدل تضخم سنوي قدره 3%، من المتوقع أن تزيد هذه التكاليف إلى تريليون ( UR: تريليون)، تريليون (95% UR: تريليون)، و تريليون (95% UR: تريليون) في عام 2060. بالنظر إلى معدلات تضخم تكلفة الرعاية البديلة، ستزداد (لـ التضخم) أو تقليل (للتضخم بنسبة 2%) هذه التوقعات وفقًا لذلك.

نقاش

تشكل رعاية اضطرابات الخرف المرتبطة بالعمر عبئًا اقتصاديًا كبيرًا في الولايات المتحدة قد يتضاعف أكثر من مرتين في العقدين القادمين. أنفق الأمريكيون مليار في التكاليف الطبية المباشرة للأمراض التنكسية العصبية في عام 2020، وما يصل إلى تم استهلاك مليار من وقت مقدمي الرعاية. وفقًا لهذه التقديرات، فإن الرعاية الرسمية لاضطرابات الخرف المرتبطة بالأمراض التنكسية العصبية تشكل تقريبًا 5% من إجمالي إنفاق الرعاية الصحية في الولايات المتحدة، وستشكل نسبة أكبر بكثير إذا حصل المرضى على المزيد من الدعم الرسمي المدفوع في المنزل بدلاً من الاعتماد على الرعاية غير الرسمية. تُعتبر التكاليف المقدرة للأمراض التنكسية العصبية أكبر من تلك الخاصة بحالات الأولوية الأخرى، مثل مرض الانسداد الرئوي المزمن، ومقارنة بما يُعتبر من أكبر التهديدات الصحية العامة، مثل جميع أشكال ارتفاع مستويات السكر في الدم. .
مع الزيادات السريعة في متوسط العمر المتوقع وشيخوخة السكان في العقود الأخيرة، أصبحت الأمراض التنكسية العصبية المرتبطة بالشيخوخة تهديدًا كبيرًا للصحة العالمية. إذا استمر الوضع الراهن، فإن العبء العالمي لهذه الأمراض سيتضاعف ثلاث مرات بحلول عام 2050، مما يؤدي إلى فقدان 115.8 مليون سنة من الحياة المعدلة حسب الإعاقة كل عام. من المتوقع أن تزيد التكلفة المباشرة وغير المباشرة العالمية (طريقة الأجور المفقودة) لرعاية مرضى الخرف من تريليون في 2020 إلى تريليون في وجدنا أن الولايات المتحدة تساهم – وستستمر في المساهمة – بشكل كبير في العبء الاقتصادي العالمي للأمراض التنكسية العصبية المرتبطة بالشيخوخة.
كانت تقديراتنا لتكلفة الفرد أقل من تقديرات هيرد وآخرين. ، التي استندت إليها منهجيتنا. تعود الاختلافات بشكل رئيسي إلى البيانات الأحدث. تعريفنا للأمراض المرتبطة بالخرف يختلف قليلاً عن تعريف الخرف المستخدم في دراستهم. لم يتم تضمين قانون الرعاية الميسرة، الذي تم تمريره في عام 2010 والذي قلل منذ ذلك الحين من تكاليف الرعاية، وفجوات التغطية، ومعدلات التضخم الطبي، في دراسة هورد وآخرون، التي استخدمت بيانات من 2000 إلى 2008. استخدمت دراسة حديثة بيانات مطالبات ميديكير من 2006-2015 لتقدير متوسط التكلفة السنوية لمستفيد ميديكير بـ لمرض الزهايمر و لخرف عام (2015 دولار أمريكي)، وكلاهما أقل من تقدير هيرد وآخرون لتكلفة ميديكير (2010 دولار أمريكي) لكل خرف
الشكل 1 التكلفة المتوقعة لرعاية اضطرابات الخرف الرسمية وغير الرسمية في الولايات المتحدة، من 2020 إلى 2060.
مريض . أظهرت دراسة أخرى في عام 2020 استخدمت بيانات مطالبات ميديكير أنه من عام 2011 إلى 2016، انخفضت تكلفة الرعاية لمدة 30 يومًا لزيارات قسم الطوارئ تحت ميديكير بـ .
توقعاتنا المستقبلية للتكاليف تقع ضمن نطاق التكاليف المقدرة من قبل ثلاث دراسات أخرى. قدّر هيرد وآخرون أنه إذا ظلت معدلات انتشار الخرف كما هي في بيانات ADAMS، فإن التكلفة المباشرة، والتكلفة الإجمالية باستخدام طريقة الأجر المفقود للتكاليف غير المباشرة، والتكلفة الإجمالية باستخدام طريقة الاستبدال للتكاليف غير المباشرة ستزداد إلى مليار، مليار، و مليار، على التوالي، بحلول عام 2040 (بالدولار الأمريكي لعام 2010). قام المؤلفون بإجراء عدة تحليلات حساسية أحادية الاتجاه لالتقاط التغيرات المحتملة في الانتشار، بما في ذلك تلك الناتجة عن الأمراض المصاحبة. بالمقارنة، قمنا بإجراء تحليل عدم اليقين الاحتمالي الذي التقط عدم اليقين في نمو انتشار المرض في المستقبل، وتوقعات السكان، والتكاليف وتضخم التكاليف، بالإضافة إلى تحليلات حساسية أحادية الاتجاه. كانت تقديراتنا المقابلة لعام 2040 هي مليار، مليار، و تريليون، على التوالي، مع نطاقات عدم اليقين الكبيرة بنسبة 95% لكل منهما (بالدولار الأمريكي لعام 2020). تم تعديل هذه التقديرات downward للتضخم (مؤشر أسعار المستهلك لمكتب إحصاءات العمل الأمريكي) ) ومعبر عنها بالدولار الأمريكي لعام 2010 ستكون مليار، مليار، و تريليون، على التوالي. توقع زيسيموبولوس وآخرون أن ترتفع التكاليف المباشرة وغير المباشرة إلى تريليون في بينما توقعت جمعية الزهايمر أن ترتفع التكاليف المباشرة إلى تريليون في عام 2050 (2015 دولار أمريكي، أو 1 تريليون دولار أمريكي في عام 2010) . بالمقارنة، فإن توقعاتنا لعام 2050 للتكلفة المباشرة المعبر عنها بالدولار الأمريكي لعام 2010 كان مليار، في حين أن التكلفة الإجمالية، بما في ذلك التكاليف المباشرة وغير المباشرة، تراوحت بين تريليون إلى تريليون. يمكن أن تُعزى هذه الاختلافات إلى الفروق في البيانات الأساسية والمنهجية.
تتمتع نتائجنا بتداعيات سياسية هامة. من المتوقع أن تفرض الأمراض التنكسية العصبية عبئًا اقتصاديًا متزايدًا بسرعة في العقود القادمة، ولكن يمكن أن تساعد الاستثمارات الفعالة في البحث والوقاية والرعاية في التخفيف من ذلك. إلى الحد الذي يتلقى فيه الناس العلاجات والدعم الأكثر فعالية المتاحة، أو يمنعون أو يؤخرون ظهور المرض من خلال تغييرات في وقت مبكر من الحياة، أو يحصلون على الوصول إلى علاجات جديدة تعدل من عملية المرض، ستنخفض التكاليف طويلة الأجل للرعاية المتعلقة بأمراض الخرف المرتبطة بالشيخوخة (ADRDs) حيث سيعاني عدد أقل من الناس من التدهور التدريجي. بدلاً من ذلك، سيتقدم الناس في السن بشكل جيد في أماكنهم وسيحتاجون إلى خدمات أقل كثافة، على الرغم من زيادة عمر السكان في السنوات القادمة. التعاون بين القطاعين العام والخاص في
الولايات المتحدة ضرورية لتعبئة الاستثمارات اللازمة لتجنب الأعباء الإنسانية والاقتصادية للأمراض التنكسية العصبية. .
تثير الأعباء الصحية والاقتصادية للأمراض التنكسية العصبية أيضًا قضايا هامة تتعلق بالعدالة. العديد من عوامل الخطر للأمراض التنكسية العصبية مرتبطة بالتمييز الهيكلي (مثل نقص الوصول إلى التعليم أو الأطعمة المغذية)، لذا ستتركز الأعباء بشكل متزايد بين أولئك الذين هم بالفعل في أصعب الظروف المالية. في الولايات المتحدة، يُقدّر انتشار الخرف بين الأشخاص الذين تتراوح أعمارهم بين 65 عامًا وما فوق بـ و بين السكان السود والهسبانيين، على التوالي، مقارنةً بـ 7% بين البيض الأكثر ثراءً من المتوقع أن يرتفع عدد الأمريكيين من السود والآسيويين وجزر المحيط الهادئ والأمريكيين من أصل إسباني الذين يعيشون مع اضطرابات الخرف (65 عامًا فأكثر) من 2020 إلى 2060 بمعدل 3 و4.7 و5.4 مرات، على التوالي، مقارنة بزيادة قدرها 1.7 مرة بين البيض غير من أصل إسباني. علاوة على ذلك، فإن ما يقرب من ثلثي مرضى الزهايمر في الولايات المتحدة هم من النساء، ويعيش 10 ملايين امرأة (ثلثا مقدمي الرعاية) مع مرضى الزهايمر أو يقدمون الرعاية لهم. .
يتطلب الأمر استثمارًا لمعالجة هذه الفجوات الصحية والاقتصادية في الولايات المتحدة. كما أن الانتباه إلى عبء الأمراض التنكسية العصبية (ADRDs) مهم أيضًا لمعالجة التمييز القائم على العمر كنوع من التمييز ومجال من مجالات العدالة الصحية. غالبًا ما تحظى الحالات التي تشكل أعلى عبء مرضي في مرحلة الطفولة أو في فئة السكان في سن العمل بأكبر قدر من الانتباه والاستثمار، بينما تُهمل الحالات التي تؤثر على كبار السن. .
لدراستنا قيود. الأهم من ذلك، أننا لم نربط بين مستجيبي HRS وسجلات Medicare الفردية وقدمنا تقديرات للنفقات المغطاة من Medicare استنادًا إلى تقديرات هيرد وآخرين. بينما من غير المحتمل أن تختلف تغطية ميديكير كنسبة من التكلفة الإجمالية بشكل كبير بين بياناتهم وبياناتنا، فإن أي اختلاف قد يقلل من دقة تقديراتنا. لقد اعتبرنا سيناريو الوضع الراهن مع نمو ثابت في عبء المرض وتكلفة الفرد، ودون تغييرات في بروتوكول علاج ADRDs أو بنية الرعاية. بالإضافة إلى ذلك، افترضنا أيضًا أن نسب مرضى ADRD الذين يتلقون رعاية رسمية وغير رسمية، فضلاً عن مدة الرعاية، ستظل دون تغيير في المستقبل. على الرغم من أننا قمنا بتغيير المدخلات بشكل منهجي في تحليل عدم اليقين الاحتمالي، إلا أنها قد لا تعكس بالكامل التطورات المستقبلية في التدخلات الوقائية والعلاجية أو الابتكارات في الرعاية التي قد تغير عبء أنماط الرعاية.
الجدول 2. التكلفة المستقبلية المتوقعة لرعاية اضطرابات الخرف الرسمية وغير الرسمية في الولايات المتحدة.
سنة إجمالي الرعاية المشتراة في السوق (مليارات دولار أمريكي 2020) إجمالي الرعاية المشتراة في السوق بالإضافة إلى وقت الرعاية المقدر وفقًا لتكلفة الاستبدال (مليارات الدولارات الأمريكية لعام 2020) إجمالي الرعاية المشتراة في السوق بالإضافة إلى وقت الرعاية المقدر بتكاليف الأجور المفقودة (مليارات دولار أمريكي لعام 2020)
حالة الأساس (3% تضخم سنوي في التكاليف)
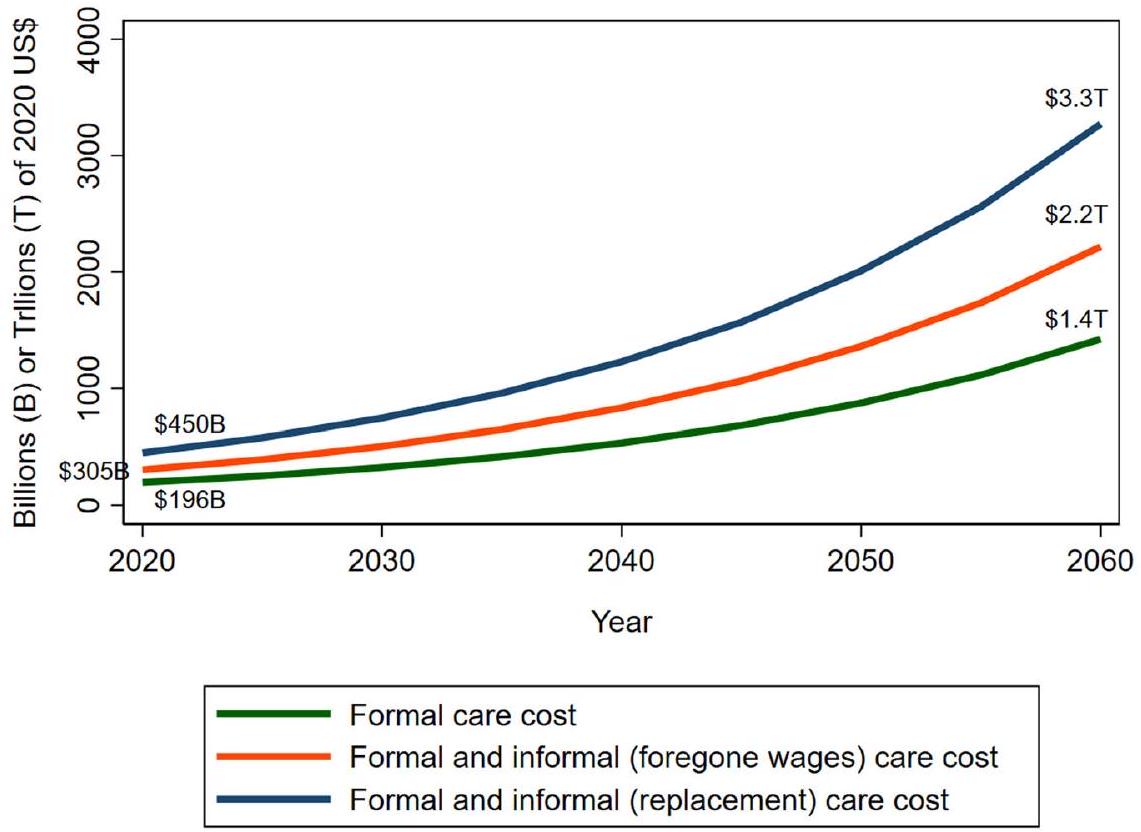
٢٠٢٠ 196 (179-213) 450 (424-478) 305 (278-333)
٢٠٢٥ 252 (184-326) 580 (430-740) 393 (288-508)
٢٠٣٠ ٣٢٥ (٢٣٣-٤٣٠) 746 (542-979) 506 (363-671)
٢٠٣٥ 417 (293-566) 959 (677-1292) 650 (456-878)
2040 535 (364-748) 1229 (842-1699) 833 (567-1160)
2045 683 (450-988) 1570 (1046-2247) 1064 (702-1532)
٢٠٥٠ 875 (558-1295) 2010 (1293-2945) 1362 (867-2009)
٢٠٥٥ 1115 (677-1714) 2562 (1571-3911) 1736 (1055-2664)
٢٠٦٠ 1424 (837-2238) 3271 (1936-5120) ٢٢١٧ (١٣١١-٣٤٨٧)
مع تضخم سنوي في التكاليف بنسبة 2%
٢٠٢٠ 189 (173-204) 433 (410-457) ٢٩٤ (٢٦٩-٣١٩)
٢٠٢٥ 231 (170-296) 531 (398-672) 360 (265-463)
٢٠٣٠ ٢٨٣ (٢٠٦-٣٦٩) 651 (480-838) ٤٤١ (٣٢٢-٥٧٦)
٢٠٣٥ 346 (249-457) 796 (579-1043) 539 (387-712)
2040 422 (297-570) 971 (692-1296) 658 (464-886)
2045 ٥١٣ (٣٥٥-٧١٣) 1179 (822-1622) 799 (553-1105)
٢٠٥٠ 625 (422-879) 1436 (978-1998) 973 (655-1364)
٢٠٥٥ 757 (494-1099) 1740 (1142-2503) 1179 (769-1707)
٢٠٦٠ 919 (586-1352) 2113 (1355-3094) 1432 (915-2105)
مع تضخم سنوي في التكاليف بنسبة 4%
٢٠٢٠ 204 (185-223) ٤٦٨ (٤٣٧-٥٠١) 317 (287-349)
2025 275 (199-359) 632 (464-815) 429 (311-558)
٢٠٣٠ 372 (262-503) 855 (608-1147) 580 (408-783)
٢٠٣٥ ٥٠٢ (٣٤٢-٧٠٢) 1154 (793-1602) 782 (532-1088)
2040 677 (441-980) 1555 (1022-2234) 1054 (689-1520)
2045 908 (568-1370) 2087 (1318-3131) 1414 (883-2130)
٢٠٥٠ 1223 (731-1905) 2810 (1691-4343) 1904 (1137-2955)
٢٠٥٥ 1640 (923-2668) 3768 (2134-6117) 2553 (1439-4144)
٢٠٦٠ 2203 (1184-3709) 5062 (2738-8450) ٣٤٣٠ (١٨٥٤-٥٧٧٢)
نطاقات عدم اليقين بنسبة 95% موجودة بين قوسين.
بالإضافة إلى تكلفة الرعاية الرسمية وقيمة الرعاية غير الرسمية، قد يكون لاضطرابات الخرف المرتبطة بالشيخوخة آثار أوسع على التكاليف الاجتماعية والماكرو اقتصادية. قد تؤدي الزيادة في نفقات علاج اضطرابات الخرف وانخفاض المشاركة في قوة العمل بسبب الوفيات والاعتلالات إلى تقليل النمو الاقتصادي على المدى الطويل. نظرًا لعدم توفر البيانات، فإن تحليلنا لا يشمل هذه التكاليف الإضافية. يجب أن تستخدم الدراسات المستقبلية تقنيات النمذجة التي يمكن أن تأخذ في الاعتبار بشكل أفضل هذه الأنواع الأخرى من التكاليف الاجتماعية. أخيرًا، لجعل تقديراتنا قابلة للمقارنة مع تقديرات هيرد وآخرين، استخدمنا نماذج الانحدار العادي. قد تنتج النماذج الخطية المعممة أو تقنيات أخرى تقديرات أكثر دقة للمتغيرات التكلفة التي لها توزيع منحرف.

الطرق

بيانات

استخدمنا بيانات من مسح طولي تمثيلي على المستوى الوطني للأفراد الذين تتراوح أعمارهم بين 50 عامًا وما فوق: مسح الصحة والتقاعد
الجدول 3. تحليل الحساسية مع انخفاض معدل نمو عبء الأمراض التنكسية العصبية.
سنة رعاية شاملة إجمالي الرعاية المشتراة إجمالي الرعاية المشتراة
تم شراؤه في في السوق في السوق
سوق وقت رعاية إضافي بالإضافة إلى وقت الرعاية
(مليارات 2020 مُقدَّر وفقًا لـ مُقدَّر بالتخلي
دولار أمريكي تكلفة الاستبدال تكاليف الأجور (مليارات)
(مليارات من دولارات الولايات المتحدة 2020) من عام 2020 (دولار أمريكي)
الحالة الأساسية مع نمو عبء أقل بنسبة 40%
٢٠٢٠ 195 (178-212) 448 (421-475) 303 (276-331)
٢٠٢٥ 243 (177-314) 559 (415-712) 378 (277-489)
٢٠٣٠ 303 (218-401) 697 (508-913) 473 (340-624)
٢٠٣٥ 378 (267-511) 869 (618-1165) ٥٨٩ (٤١٥-٧٩٢)
2040 470 (322-651) 1080 (746-1482) 732 (502-1011)
2045 581 (387-831) 1336 (898-1892) 905 (606-1292)
٢٠٥٠ 722 (466-1053) 1658 (1083-2397) 1124 (724-1634)
٢٠٥٥ 891 (555-1345) 2048 (1283-3073) 1388 (863-2087)
٢٠٦٠ 1103 (662-1702) 2535 (1538-3878) 1718 (1039-2646)
مع خفض نمو العبء التضخم السنوي للتكاليف
٢٠٢٠ 187 (172-203) 431 (408-454) 292 (267-317)
2025 ٢٢٣ (١٦٤-٢٨٥) 511 (383-646) 347 (255-445)
٢٠٣٠ 265 (193-343) 608 (451-781) 412 (301-536)
٢٠٣٥ 314 (227-412) 721 (527-937) ٤٨٨ (٣٥٣-٦٤٠)
2040 371 (263-496) 852 (612-1125) 578 (411-771)
2045 437 (306-597) 1004 (710-1356) 680 (477-929)
٢٠٥٠ 515 (353-713) 1184 (822-1621) 803 (547-1107)
٢٠٥٥ 605 (405-859) 1391 (938-1958) 943 (630-1337)
٢٠٦٠ 712 (467-1025) 1637 (1081-2333) 1109 (730-1595)
مع نمو عبء أقل بنسبة 40% وارتفاع تكاليف سنوي بنسبة 4%
٢٠٢٠ 202 (183-222) 465 (435-497) 315 (285-346)
2025 265 (192-346) 609 (447-786) 413 (300-538)
٢٠٣٠ 348 (245-469) 799 (570-1071) 542 (382-730)
٢٠٣٥ 455 (311-633) 1046 (721-1445) 709 (484-982)
2040 594 (390-856) 1366 (906-1953) 925 (609-1326)
2045 773 (489-1156) 1777 (1132-2636) 1204 (763-1798)
٢٠٥٠ 1009 (610-1553) 2318 (1414-3543) 1571 (950-2414)
٢٠٥٥ 1311 (755-2107) 3012 (1744-4802) 2041 (1176-3273)
٢٠٦٠ 1707 (932-2822) ٣٩٢٣ (٢١٦٦-٦٤١٤) 2658 (1466-4389)
نطاقات عدم اليقين بنسبة 95% موجودة بين قوسين.
(HRS). بدأت الاستطلاعات في عام 1992 وتغطي حوالي 20,000 فرد يتم مقابلتهم مرة كل عامين. يجمع HRS بيانات حول جوانب مختلفة من الشيخوخة، بما في ذلك الصحة والإعاقة، والوصول إلى الرعاية الصحية والإنفاق، والإسكان، والأصول، والتوظيف. تشكل مجموعة فرعية من 856 من المشاركين في HRS الذين كانوا في سن 70 وما فوق في 2000-2002 دراسة الشيخوخة والديموغرافيات والذاكرة (ADAMS). جمعت ADAMS بيانات سريرية متعمقة حول الحالة الإدراكية والخرف للمشاركين في أربع موجات من 2001 إلى تم استخدام هذه البيانات سابقًا لتقدير انتشار الخرف وفحص رعايته والتكاليف المرتبطة به. حصلت استبيانات HRS وADAMS على موافقة أخلاقية من مجلس المراجعة المؤسسية بجامعة ميتشيغان. استخدمنا بيانات ثانوية متاحة للجمهور ومجهولة المصدر من HRS وADAMS، ولم تكن هناك حاجة للحصول على موافقة أخلاقية منفصلة لدراستنا.

احتمالية الأمراض التنكسية العصبية و تكلفة الرعاية

استخدمنا منهجية هيرد وآخرون لتقدير احتمال حدوث اضطرابات الإدراك المرتبطة بالعمر استنادًا إلى بيانات HRS من 2010 إلى 2016 كالتالي
أ. ناندي وآخرون
الجدول 4. تحليل الحساسية مع تكاليف دور رعاية المسنين المرتفعة.
سنة إجمالي الرعاية المشتراة في السوق (مليارات دولار أمريكي 2020) إجمالي الرعاية المشتراة في السوق بالإضافة إلى وقت الرعاية المقدر وفقًا لتكلفة الاستبدال (مليارات الدولارات الأمريكية لعام 2020) إجمالي الرعاية المشتراة في السوق بالإضافة إلى وقت الرعاية الذي يُقدّر بتكاليف الأجور المفقودة (مليارات الدولارات الأمريكية لعام 2020)
الحالة الأساسية مع تكاليف دور رعاية المسنين المرتفعة
٢٠٢٠ 318 (286-351) 573 (520-628) 428 (377-480)
٢٠٢٥ 410 (296-534) 737 (538-959) ٥٥١ (٣٩٥-٧٢٥)
٢٠٣٠ 527 (375-704) 950 (679-1265) 709 (501-956)
٢٠٣٥ 678 (473-924) 1220 (852-1665) 911 (630-1252)
2040 869 (587-1222) 1564 (1063-2184) 1168 (783-1645)
2045 1109 (726-1613) 1997 (1316-2895) 1491 (974-2179)
٢٠٥٠ 1420 (901-2110) 2557 (1632-3784) 1910 (1199-2850)
٢٠٥٥ 1810 (1094-2793) 3259 (1975-5011) 2434 (1465-3773)
٢٠٦٠ 2312 (1351-3648) 4162 (2440-6537) 3108 (1820-4916)
مع ارتفاع تكاليف دور رعاية المسنين وارتفاع التضخم السنوي بنسبة 2%
٢٠٢٠ 306 (276-336) ٥٥١ (٥٠٣-٦٠٠) 412 (364-460)
٢٠٢٥ 375 (273-485) 675 (496-871) 504 (364-662)
٢٠٣٠ 460 (333-602) 828 (601-1085) 618 (442-822)
٢٠٣٥ 562 (402-748) 1012 (725-1344) 756 (535-1014)
2040 686 (479-932) 1235 (869-1665) 922 (639-1260)
2045 833 (572-1163) 1500 (1034-2085) 1120 (765-1570)
٢٠٥٠ 1014 (681-1432) 1826 (1230-2567) 1364 (905-1934)
٢٠٥٥ 1230 (797-1794) ٢٢١٤ (١٤٣٨-٣٢١٣) 1653 (1065-2424)
٢٠٦٠ 1493 (948-2206) ٢٦٨٨ (١٧٠٦-٣٩٦٤) 2007 (1264-2974)
مع ارتفاع تكاليف دور رعاية المسنين وارتفاع التضخم السنوي بنسبة 4%
٢٠٢٠ ٣٣١ (٢٩٥-٣٦٧) 596 (538-657) 445 (389-502)
٢٠٢٥ 447 (320-588) 805 (582-1056) 601 (428-798)
٢٠٣٠ 604 (422-823) 1088 (764-1477) 813 (564-1114)
٢٠٣٥ 816 (553-1145) 1469 (996-2060) ١٠٩٧ (٧٣٦-١٥٤٦)
2040 1099 (714-1603) 1978 (1291-2866) 1477 (954-2153)
2045 1475 (917-2236) 2656 (1664-4005) 1983 (1228-3028)
٢٠٥٠ 1986 (1183-3110) 3575 (2141-5573) 2670 (1572-4191)
٢٠٥٥ 2663 (1494-4350) 4793 (2697-7804) 3579 (1994-5869)
٢٠٦٠ 3578 (1909-6053) 6440 (3456-10810) 4809 (2584-8135)
نطاقات عدم اليقين بنسبة 95% موجودة بين قوسين.
مقارنةً ببيانات HRS 2000-2008 في دراستهم أولاً، استخدمنا بيانات ADAMS لتقدير نموذج بروبيت المرتب الذي يحدد ما إذا كان المستجيب يعاني من اضطرابات الإدراك المرتبطة بالشيخوخة (ADRDs)، أو يعاني من ضعف إدراكي ولكن ليس من ADRDs، أو لا يعاني من أي منهما. تضمنت المتغيرات المساعدة في هذا الانحدار مؤشرات كانت متاحة أيضًا في بيانات HRS الكاملة: العمر، الجنس، مستوى التعليم، قيود الأنشطة اليومية (مثل الأكل والاستحمام)، قيود الأنشطة اليومية الآلية (مثل إعداد الوجبات أو إدارة المال)، ودرجات الاختبارات الإدراكية مثل تحديد التاريخ الحالي، العد التنازلي من 20، تسمية الكلمات، تحديد نائب الرئيس الأمريكي الحالي، واسترجاع الكلمات الفوري. تم استخدام المعاملات المقدرة في هذا الانحدار للتنبؤ باحتمالية وجود ADRDs لجميع المستجيبين في HRS.
بعد ذلك، قمنا بتقدير نموذج الانحدار التالي لكل مستجيب في HRS:
أين يشير إلى تكلفة الرعاية الطبية للفرد في السنة (2010-2016). بناءً على هيرد وآخرون، قمنا بتضمين الأفراد الذين تتراوح أعمارهم بين 70 عامًا وما فوق فقط في تحليلنا. احتمالية الإصابة بالخرف المقدرة، ، هو من الانحدار السابق، و يشمل عمر المستجيب، الجنس، دخل الأسرة، متغيرات تصنيفية للتعليم وعدد الأطفال لدى المستجيب، ومجموعة من المتغيرات الثنائية للعرق الأبيض أو اللاتيني وما إذا كان المستجيب قد تعرض من قبل لسكتة دماغية، أو مرض رئوي، أو داء السكري، أو مرض قلبي، أو ارتفاع ضغط الدم، أو السرطان، أو حالات نفسية، أو التهاب المفاصل. تم الحصول على الأخطاء المعيارية للتقديرات من خلال 2000 محاكاة bootstrap لكل نموذج. نحن نبلغ عن معامل التقدير. (بالإضافة إلى فترة الثقة تم الحصول عليها من عملية التمهيد)، والتي تقيس تكلفة الرعاية لكل مريض المنسوبة إلى اضطرابات الخرف المرتبطة بالأمراض. تم إجراء التحليل بشكل منفصل لكل فئة تكلفة (مثل التكلفة الرسمية وغير الرسمية)، كما هو موضح في ما يلي.

التكلفة الرسمية للرعاية المشتراة في السوق

تشمل التكاليف الرسمية النفقات من الجيب (OOP) والتكاليف التي تغطيها ميديكير ومصادر أخرى لرعاية المرافق، ورعاية المنزل الرسمية، ورعاية دور المسنين. تشمل تكاليف OOP النفقات على الإقامة في دور المسنين، والإقامة في المستشفيات، وزيارات الأطباء، وزيارات الأسنان، والجراحة الخارجية، ورعاية الصحة المنزلية، وخدمات خاصة أخرى، والأدوية الموصوفة، وخدمات الأسنان. استخدمنا بيانات HRS المبلغ عنها ذاتيًا حول الليالي التي قضيت في دور المسنين ودمجناها مع بيانات Genworth لعام 2019 حول الأسعار الليلية لتقدير إجمالي تكاليف دور المسنين المدفوعة من الجيب ومن خلال ميديكير ومصادر أخرى. تشمل الرعاية الصحية المنزلية الرسمية الخدمات المقدمة من وكالة ومساعدي الرعاية الصحية المنزلية الذين يتم توظيفهم مباشرة من قبل المريض عندما يواجه الفرد صعوبة في نشاط (أنشطة أساسية مثل الاستحمام أو الأكل) أو نشاط أداتي (أنشطة أكثر تعقيدًا مثل إدارة الشؤون المالية أو استخدام وسائل النقل العامة) من أنشطة الحياة اليومية. استخدمنا بيانات HRS حول ساعات الرعاية المنزلية مع بيانات تكلفة الوحدة من Genworth لتقدير التكلفة الإجمالية للرعاية المنزلية. .
هارد وآخرون تعهدوا بربط مستجيبي HRS (موجات 2000-2008) بسجلات Medicare الخاصة بهم ونجحوا في ذلك تقريبًا الحالات. لتجاوز التعقيد والاحتمالية العالية لعدم اكتمال عملية الربط في موجات HRS من 2010 إلى 2016، افترضنا نفس معدلات التغطية لبرنامج ميديكير كما تم تقديرها في دراسة هيرد وآخرون. افترضنا أن ميديكير غطت إجمالي الرعاية الصحية المنزلية و تكلفة رعاية دور المسنين. يُقدّر أن 57% من نفقات ميديكير جاءت من دور المسنين ورعاية الصحة المنزلية، واستخدمنا هذه النسبة لاستقراء وتوقع إجمالي تكاليف ميديكير. .

تكلفة الرعاية غير الرسمية، أو تكلفة مقدمي الرعاية

عندما يقدم شخص غير مرتبط بوكالة، مثل أحد أفراد الأسرة، رعاية غير رسمية، هناك أيضًا تكلفة. استخدمنا نهجين لتقدير تكلفة الرعاية غير الرسمية: تكلفة الاستبدال والأجور المفقودة. سمح لنا نهج تكلفة الاستبدال بتقدير تكلفة استبدال مقدم الرعاية غير الرسمي بمقدم رعاية محترف لنفس عدد الساعات. استخدمنا بيانات Genworth لعام 2019 لتكلفة الرعاية المنزلية لمرضى الخرف المرتبط بأمراض الزهايمر. جمعنا هذه البيانات مع الساعات التي قضاها مقدم الرعاية غير الرسمي في بيانات HRS من 2010 إلى 2016 للحصول على تقدير لتكلفة استبدال مقدم الرعاية المحترف.
قدرت طريقة الأجر المتخلى عنه تكلفة الفرصة لمساعدة فرد يعاني من اضطرابات الخرف المرتبطة بالعمر، حيث البديل هو كسب أجر في السوق. قمنا بحساب تكلفة الفرصة كالساعات التي يقضيها مقدم الرعاية في مساعدة مريض يعاني من اضطرابات الخرف المرتبطة بالعمر مضروبة في الأجر السوقي الذي كان يمكن لمقدم الرعاية كسبه. حصلنا على الأجور من مسح السكان الحالي بشكل منفصل حسب الخصائص الديموغرافية لمقدمي الرعاية – العمر، الجنس، ومستوى التعليم – وقمنا بتعديلها إلى دولار أمريكي 2020 باستخدام مؤشر أسعار المستهلك من مكتب إحصاءات العمل الأمريكي. .
كانت بيانات وقت الرعاية متاحة من HRS 2010-2016. لكل مستجيب تلقى مساعدة من فرد غير محترف، قمنا باستخراج عدد الساعات سنويًا من المساعدة المستلمة. لم تجمع HRS ساعات للرعاة الذين قدموا المساعدة أقل من مرة في الأسبوع، وقمنا بتقدير القيم لهذه الملاحظات في كل عام بناءً على الخصائص المبلغ عنها للرعاة: الجنس، العلاقة بالمستجيب، وعدد الأيام في الأسبوع/الشهر من الرعاية. قمنا بتقدير البيانات المفقودة لخصائص الرعاة الديموغرافية، التعليم، الساعات، والأجور وفقًا لعملية منهجية مشابهة لتلك التي استخدمها هيرد وآخرون. يوفر الملحق الإضافي تفاصيل إضافية حول حسابات التكلفة غير الرسمية.

التوقعات المستقبلية

قمنا بمحاكاة التكلفة المستقبلية لرعاية الأمراض التنكسية العصبية المرتبطة بالشيخوخة (ADRDs) من خلال دمج التقديرات لتكلفة كل مريض كما تم مناقشته سابقًا مع التوقعات المستقبلية لانتشار ADRDs والتضخم في تكاليف الرعاية الطبية. حصلنا على بيانات عام 2019 حول انتشار ADRDs من دراسة العبء العالمي للأمراض (GBD) التابعة لمعهد قياس الصحة والتقييم، والتي شملت جميع الأمراض ضمن ADRDs باستثناء الخرف الوعائي. قمنا بتقدير الانتشار النسبي للخرف الوعائي من بيانات ADAMS وضبطنا تقديرات GBD للأعلى. . قمنا بحساب معدل النمو السنوي المتوسط لانتشار الأمراض التنكسية العصبية المرتبطة بالشيخوخة (ADRDs) في الولايات المتحدة خلال الفترة من 2010 إلى 2019 استنادًا إلى بيانات GBD، وافترضنا أن عبء هذه الأمراض سينمو بنفس المعدل في المستقبل. ثم تم دمج معدل الانتشار المستقبلي المتوقع مع بيانات السكان من مكتب التعداد السكاني الأمريكي (2020) وآفاق السكان العالمية (النسخة المتوسطة) للأمم المتحدة لتقدير عدد مرضى ADRDs من 2020 إلى افترضنا أن التكلفة الرسمية وغير الرسمية لرعاية مرضى الاضطرابات المعرفية المرتبطة بالشيخوخة ستنمو بمعدل سنوي قدره ، وهو معدل التضخم السنوي المتوسط لرعاية الصحة في الولايات المتحدة خلال 2010-2020 معدل التضخم الطبي في الولايات المتحدة عادة ما يكون أعلى من معدل التضخم السنوي العام (الذي يستهدفه بنك الاحتياطي الفيدرالي عند .
قمنا بتحديد عدم اليقين المحيط بهذه المعلمات من خلال تحليل عدم اليقين المنهجي. قمنا بتغيير معدل النمو السنوي لانتشار الأمراض التنكسية العصبية، ومعدل تضخم الرعاية الصحية، وتوقعات السكان ضمن نطاق محدد مسبقًا من للقيمة الأولية، والتكلفة المقدرة للرعاية الرسمية وغير الرسمية في عام 2016 ضمن فترة الثقة. قمنا بسحب 10,000 عينة عشوائية من التوزيع الموحد المشترك لهذه المعلمات وحسبنا التكلفة المستقبلية المتوقعة للرعاية على مدى خمس سنوات من 2020 إلى 2060. نحن نبلغ عن القيم المتوسطة مع تتراوح عدم اليقين من هذه المحاكاة العشر آلاف حسب السنة.

تحليل الحساسية

بالإضافة إلى التقاط عدم اليقين في قيم المعلمات بشكل منهجي، قمنا بإجراء عدة تحليلات حساسية أحادية الاتجاه من خلال تغيير معلمات النموذج. أولاً، تميل بيانات النفقات الطبية إلى أن تكون مشوهة نحو اليمين، حيث يعاني بعض المرضى من نفقات أكبر بكثير (شاذة) مقارنة بالبقية. على سبيل المثال، أقل من من بين المستجيبين في بيانات HRS لدينا، يوجد لديهم قيم غير صفرية لبعض المؤشرات مثل النفقات الشخصية ونفقات دور رعاية المسنين الإجمالية. قد تنتج الانحدارات الخطية تقديرات غير دقيقة من مثل هذه البيانات المنحرفة. بينما الغرض الأساسي من دراستنا هو تقديم تقديرات محدثة قابلة للمقارنة مع دراسة هورد وآخرين الذين استخدموا نماذج انحدار خطي مماثلة على بيانات HRS القديمة، فقد أخذنا أيضًا في الاعتبار العينة الفرعية من مستجيبي HRS الذين لديهم قيم غير صفرية. قمنا بتكرار تحليلنا لكل متغير من متغيرات النفقات – فقط بين أولئك الذين أبلغوا عن قيم إيجابية. نحن نقدم هذه التقديرات فقط من حيث نصيب الفرد لعام 2016، ولا نقدم تقديرات إجمالية أو توقعات مستقبلية.
ثانيًا، نسبت الأبحاث الحديثة حوالي من جميع حالات الخرف إلى عوامل الخطر القابلة للتعديل مثل نقص النشاط البدني
النشاط، التدخين، استهلاك الكحول المفرط، والتعرض لتلوث الهواء . قد تقلل الأدوية الجديدة والمستقبلية التي تهدف إلى إبطاء التدهور المعرفي المرتبط بالخرف من العبء المستقبلي للأمراض التنكسية العصبية المرتبطة بالخرف. لقد اعتبرنا سيناريو يتم فيه تقليل معدل النمو السنوي الأساسي للأمراض التنكسية العصبية المرتبطة بالخرف بـ . ثالثًا، نظرنا في سيناريوهين إضافيين مع و معدلات التضخم السنوية لتكاليف الرعاية (بدلاً من كما في الحالة الأساسية). لقد نظرنا أيضًا في سيناريوهين آخرين من خلال دمج معدل النمو المنخفض لعبء الأمراض التنكسية العصبية والتغيرات في معدلات التضخم.
أخيرًا، تشير الأبحاث السابقة إلى أن نظام المسح الصحي قد يقلل من تقدير مدة الوقت الذي يقضيه المستجيبون في مرافق التمريض الماهرة. في دراسة هيرد وآخرون، أفاد المشاركون في HRS 2008 الذين تتراوح أعمارهم بين 65 عامًا وما فوق أنهم قضوا في المتوسط 9.6 ليالٍ في دار رعاية خلال السنة التي سبقت الاستطلاع، وهو ما كان أقل من تقدير مراكز خدمات Medicare وMedicaid (CMS) لعام 2007 الذي قدر بـ 13.8 ليلة قضيت في دور الرعاية. لم يقم هيرد وآخرون بتعديل تقديراتهم لهذه الفجوة، على الأرجح لأن نسبة المستجيبين في دراسة HRS الذين يعيشون في دور رعاية المسنين كانت مشابهة لتلك الموجودة في مصادر بيانات أخرى مثل التعداد السكاني الأمريكي لعام 2000.
وفقًا لـ Hurd وآخرون قمنا بمقارنة متوسط مدة الإقامة في دور رعاية المسنين المبلغ عنها في دراسة HRS مع بيانات من CMS. أفاد كبار السن في بيانات HRS 2010 بأنهم قضوا في المتوسط 6.4 ليالٍ في دور الرعاية سنويًا، وهو ما كان تقريبًا نصف التقديرات المماثلة من بيانات CMS. لتفسير هذا الاختلاف، اعتبرنا سيناريو إضافيًا حيث تم تعديل نفقات دور رعاية المسنين لكل فرد، والتي تغطيها Medicare، والإجمالي، للأعلى بعامل 1.95. يناقش الملحق الإضافي المزيد من المقارنات بين HRS ومصادر بيانات أخرى والأسباب المنطقية لهذا التعديل للأعلى.

توفر البيانات

بيانات دراسة الصحة والتقاعد (HRS) متاحة للجمهور من موقع HRShttps://hrs.isr.umich.edu/.

توافر الشيفرة

الكود متاح من المؤلف المراسل عند الطلب المعقول.
تاريخ الاستلام: 9 أكتوبر 2023؛ تاريخ القبول: 9 يناير 2024؛
نُشر على الإنترنت: 08 فبراير 2024

REFERENCES

  1. United Nations, Department of Economic and Social Affairs, Population Division. World Population Prospects. 2019. https://population.un.org/wpp/Publications/ (accessed April 6, 2022).
  2. Alzheimer’s Association. 2022 Alzheimer’s Disease Facts and Figures: 2022. https://www.alz.org/media/Documents/alzheimers-facts-and-figures.pdf (accessed April 22, 2022).
  3. Rajan, K. B. et al. Population estimate of people with clinical Alzheimer’s disease and mild cognitive impairment in the United States (2020-2060). Alzheimers Dement 17, 1966-1975 (2021).
  4. Tarawneh, R. & Holtzman, D. M. The clinical problem of symptomatic Alzheimer disease and mild cognitive impairment. Cold Spring Harb. Perspect. Med. 2, a006148 (2012).
  5. Deb, A., Thornton, J. D., Sambamoorthi, U. & Innes, K. Direct and indirect cost of managing alzheimer’s disease and related dementias in the United States. Expert. Rev. Pharmacoecon Outcomes Res. 17, 189-202 (2017).
  6. Hurd, M. D., Martorell, P., Delavande, A., Mullen, K. J. & Langa, K. M. Monetary Costs of Dementia in the United States. N. Engl. J. Med. 368, 1326-1334 (2013).
  7. Hurd, M. D., Martorell, P. & Langa, K. Future Monetary Costs of Dementia in the United States under Alternative Dementia Prevalence Scenarios. J. Popul. Ageing 8, 101-112 (2015).
  8. Zissimopoulos, J., Crimmins, E. & St Clair, P. The Value of Delaying Alzheimer’s Disease Onset. Forum Health Econ. Policy 18, 25-39 (2014).
  9. Alzheimer’s Association. 2020 Alzheimer’s disease facts and figures. Alzheimer Dementia 16, 391-460 (2020).
  10. Alzheimer’s Association. Changing the Trajectory of Alzheimer’s Disease: How a Treatment by 2025 Saves Lives and Dollars (Alzheimer’s Association, 2015).
  11. Burke, L. G., Burke, R. C., Epstein, S. K., Orav, E. J. & Jha, A. K. Trends in Costs of Care for Medicare Beneficiaries Treated in the Emergency Department From 2011 to 2016. JAMA Network Open 3, e208229 (2020).
  12. Pyenson, B. et al. The Real-World Medicare Costs of Alzheimer Disease: Considerations for Policy and Care. J. Manag. Care Spec. Pharm. 25, 800-809 (2019).
  13. Rattinger, G. B. et al. Dementia severity and the longitudinal costs of informal care in the Cache County population. Alzheimers Dement 11, 946-954 (2015).
  14. Yang, Z. & Levey, A. Gender Differences: A Lifetime Analysis of the Economic Burden of Alzheimer’s Disease. Womens Health Issues 25, 436-440 (2015).
  15. Zhu, C. W. et al. Health-care use and cost in dementia caregivers: Longitudinal results from the Predictors Caregiver Study. Alzheimers Dement 11, 444-454 (2015).
  16. Joyce, A. T. et al. Burden of illness among commercially insured patients with Alzheimer’s disease. Alzheimers Dement 3, 204-210 (2007).
  17. Kuo, T.-C., Zhao, Y., Weir, S., Kramer, M. S. & Ash, A. S. Implications of comorbidity on costs for patients with Alzheimer disease. Med. Care 46, 839-846 (2008).
  18. Goldfeld, K. S., Stevenson, D. G., Hamel, M. B. & Mitchell, S. L. Medicare expenditures among nursing home residents with advanced dementia. Arch. Intern. Med. 171, 824-830 (2011).
  19. Bharmal, M. F. et al. Incremental Dementia-Related Expenditures in a Medicaid Population. Am. J. Geriatr. Psychiatry 20, 73-83 (2012).
  20. Suehs, B. T. et al. The clinical and economic burden of newly diagnosed Alzheimer’s disease in a medicare advantage population. Am. J. Alzheimers Dis. Other Demen. 28, 384-392 (2013).
  21. Kelley, A. S., McGarry, K., Gorges, R. & Skinner, J. S. The Burden of Health Care Costs in the Last 5 Years of Life. Ann Intern. Med. 163, 729-736 (2015).
  22. Zhu, C. W. et al. Medicare Utilization and Expenditures Around Incident Dementia in a Multiethnic Cohort. J. Gerontol. A Biol. Sci. Med. Sci. 70, 1448-1453 (2015).
  23. Lin, P.-J., Zhong, Y., Fillit, H. M., Chen, E. & Neumann, P. J. Medicare Expenditures of Individuals with Alzheimer’s Disease and Related Dementias or Mild Cognitive Impairment Before and After Diagnosis. J. Am. Geriatr. Soc. 64, 1549-1557 (2016).
  24. Yang, Z., Zhang, K., Lin, P.-J., Clevenger, C. & Atherly, A. A Longitudinal Analysis of the Lifetime Cost of Dementia. Health Serv. Res. 47, 1660-1678 (2012).
  25. Deb, A., Sambamoorthi, U., Thornton, J. D., Schreurs, B. & Innes, K. Direct medical expenditures associated with Alzheimer’s and related dementias (ADRD) in a nationally representative sample of older adults – an excess cost approach. Aging Ment Health 22, 619-624 (2018).
  26. Fishman, P. et al. Cost of Dementia in Medicare Managed Care: A Systematic Literature Review. Am. J. Manag. Care 25, e247-e253 (2019).
  27. David, K., Guterman, S.& Bandeali, F. The Affordable Care Act and Medicare: How the Law Is Changing the Program and the Challenges That Remain (Commonwealth Fund, 2015).
  28. Oney, M., White, L. & Coe, N. B. Out-of-pocket costs attributable to dementia: A longitudinal analysis. J. Am. Geriatrics Soc. https://doi.org/10.1111/jgs. 17746 (2022).
  29. Bloom, D. E., Counts, N., Nandi, A., Tortorice, D.& Vigo, D. How to address Alzheimer’s disease and support healthier ageing (World Economic Forum, 2022). https://www.weforum.org/agenda/2022/02/this-is-how-to-address-a-global-alzheimers-disease/ (accessed March 25, 2022).
  30. Bloom, D. et al. Addressing Alzheimer’s disease and related dementias to realise the promise of the UN’s ‘Decade of Healthy Ageing’ (VoxEU, 2021). https://voxeu.org/ article/alzheimer-s-and-un-s-decade-healthy-ageing (accessed May 14, 2021).
  31. Counts, N., Nandi, A., Seligman, B. & Tortorice, D. Dementia Storm on the Horizon: The rising incidence of dementia around the world calls for global collaboration and decisive financing. Finance Dev. 58, 54-57 (2021).
  32. Hartman, M., Martin, A. B., Washington, B., Catlin, A. & The, N. H. E. A. T. National Health Care Spending In 2020: Growth Driven By Federal Spending In Response To The COVID-19 Pandemic. Health Affairs 41, 13-25 (2022).
  33. Zafari, Z., Li, S., Eakin, M. N., Bellanger, M. & Reed, R. M. Projecting Long-term Health and Economic Burden of COPD in the United States. Chest 159, 1400-1410 (2021).
  34. Dall, T. M. et al. The Economic Burden of Elevated Blood Glucose Levels in 2017: Diagnosed and Undiagnosed Diabetes, Gestational Diabetes Mellitus, and Prediabetes. Diabetes Care 42, 1661-1668 (2019).
  35. Nandi, A. et al. Global and regional projections of the economic burden of Alzheimer’s disease and related dementias from 2019 to 2050: A value of statistical life approach. eClinicalMedicine 51, 101580 (2022).
  36. Jia, J. et al. The cost of Alzheimer’s disease in China and re-estimation of costs worldwide. Alzheimers Dement 14, 483-491 (2018).
  37. US Bureau of Labor Statistics. CPI Inflation Calculator. 2022. https://www.bls.gov/ data/inflation_calculator.htm (accessed April 23, 2022).
  38. Livingston, G. et al. Dementia prevention, intervention, and care: 2020 report of the Lancet Commission. Lancet 396, 413-446 (2020).
  39. Chen, C. & Zissimopoulos, J. M. Racial and ethnic differences in trends in dementia prevalence and risk factors in the United States. Alzheimer Dementia 4, 510-520 (2018).
  40. Matthews, K. A. et al. Racial and ethnic estimates of Alzheimer’s disease and related dementias in the United States (2015-2060) in adults aged years. Alzheimers Dement 15, 17-24 (2019).
  41. Alzheimer’s Association. Women and Alzheimer’s. Alzheimer’s Disease and Dementia. 2022. https://alz.org/alzheimers-dementia/what-is-alzheimers/women-and-alzheimer-s (accessed April 23, 2022).
  42. Mikton, C., de la Fuente-Núñez, V., Officer, A. & Krug, E. Ageism: a social determinant of health that has come of age. Lancet 397, 1333-1334 (2021).
  43. Chen, S., Kuhn, M., Prettner, K. & Bloom, D. E. The global macroeconomic burden of road injuries: estimates and projections for 166 countries. Lancet Planet. Health 3, e390-e398 (2019).
  44. Langa, K. M. et al. The Aging, Demographics, and Memory Study: study design and methods. Neuroepidemiology 25, 181-191 (2005).
  45. Okura, T. & Langa, K. M. Caregiver Burden and Neuropsychiatric Symptoms in Older Adults with Cognitive Impairment: The Aging, Demographics, and Memory Study (ADAMS). Alzheimer Dis. Assoc. Disord. 25, 116-121 (2011).
  46. Crimmins, E. M., Kim, J. K., Langa, K. M. & Weir, D. R. Assessment of Cognition Using Surveys and Neuropsychological Assessment: The Health and Retirement Study and the Aging, Demographics, and Memory Study. J. Gerontol. Ser. B 66B, i162-i171 (2011).
  47. Brookmeyer, R. et al. National estimates of the prevalence of Alzheimer’s disease in the United States. Alzheimer Dementia 7, 61-73 (2011).
  48. Sonnega, A. et al. Cohort Profile: the Health and Retirement Study (HRS). Int. J. Epidemiol. 43, 576-585 (2014).
  49. Genworth. Cost of Long Term Care by State. 2022. https://www.genworth.com/ aging-and-you/finances/cost-of-care.html (accessed April 22, 2022).
  50. Bureau of Labor Statistics. Consumer Price Index (CPI) Databases: U.S. Bureau of Labor Statistics. 2022. https://www.bls.gov/cpi/data.htm (accessed June 9, 2022).
  51. Institute for Health Metrics and Evaluation. Global Burden of Diseases Results Tool. GBD Results Tool. 2019. http://ghdx.healthdata.org/gbd-results-tool.
  52. US Census Bureau. U.S. Census Bureau QuickFacts: United States. 2022. https:// www.census.gov/quickfacts/fact/table/US/PST045221 (accessed April 22, 2022).
  53. US Bureau of Labor Statistics. Medical care in U.S. city average, all urban consumers, not seasonally adjusted. 2022. https://data.bls.gov/ (accessed May 10, 2023).
  54. Nianogo, R. A. et al. Risk Factors Associated With Alzheimer Disease and Related Dementias by Sex and Race and Ethnicity in the US. JAMA Neurol. 79, 584-591 (2022).
  55. Lima, J. C., Ogarek, J. & Mor, V. Untapped Potential – Using the HRS-Medicare Linked Files to Study the Changing Nursing Home Population. Med. Care 56, 216-219 (2018).
  56. Centers for Medicare & Medicaid Services. Nursing Home Data Compendium 2015 (Centers for Medicare & Medicaid Services, 2015).
  57. US Census Bureau. The Older Population: 2010 (US Department of Commerce, 2011).

شكر وتقدير

قدمت مجموعة دافوس للتعاون في مرض الزهايمر دعمًا ماليًا من خلال عقد مع Data for Decisions، LLC، لإجراء البحث الذي يستند إليه هذا المخطوط. لم يكن للممولين أي دور في تصميم الدراسة أو تحليلها أو إعداد المخطوط. يعرب المؤلفون عن شكرهم لجورج فريدنبرغ، ودرو هولزابفل، وأرنو برنيرت، وميغان جاكسون، وأليسا كورتزمان، وجيمس ك. هاميت، وليزا أ. روبنسون، ومايكل هورد، وباكو مارتوريل، والمشاركين في سلسلة من الندوات عبر الإنترنت على تعليقاتهم المفيدة. كما نشكر باكو مارتوريل ومايكل هورد لمشاركتهما رموز الكمبيوتر الخاصة بهما.

مساهمات المؤلفين

صمم DEB وAN الدراسة. جمع SM وJB وAN البيانات وأجروا التحليل. كتب AN وSM وJB النسخة الأولى من المخطوطة. قام جميع المؤلفين بتقييم المنهجية والنتائج بشكل نقدي وراجعوا وحرروا المخطوطة. وافق جميع المؤلفين على النسخة النهائية من المخطوطة.

المصالح المتنافسة

A.N. و D.T. و D.E.B. يقدمون استشارات لـ J.K. الذي يعمل في Data for Decisions, LLC، والتي تشمل عملاءها GSK و Merck و Pfizer. لم تمول هذه الكيانات البحث في هذه المخطوطة. قام B.S. بأعمال استشارية تطوعية لصالح Ceresti Health، التي لم تمول البحث في هذه المخطوطة. جميع المؤلفين الآخرين يعلنون عدم وجود تضارب في المصالح.
لا تمثل هذه المنشورة آراء وزارة شؤون المحاربين القدامى أو الحكومة الأمريكية.

معلومات إضافية

معلومات إضافية النسخة الإلكترونية تحتوي على مواد إضافية متاحة فيhttps://doi.org/10.1038/s41514-024-00136-6.
يجب توجيه المراسلات والطلبات للحصول على المواد إلى أريندام ناندي.
معلومات إعادة الطباعة والإذن متاحة علىhttp://www.nature.com/إعادة طباعة
ملاحظة الناشر: تظل شركة سبرينغر ناتشر محايدة فيما يتعلق بالمطالبات القضائية في الخرائط المنشورة والانتماءات المؤسسية.
الوصول المفتوح هذه المقالة مرخصة بموجب رخصة المشاع الإبداعي النسب 4.0 الدولية، التي تسمح بالاستخدام والمشاركة والتكيف والتوزيع وإعادة الإنتاج بأي وسيلة أو صيغة، طالما أنك تعطي الائتمان المناسب للمؤلفين الأصليين والمصدر، وتوفر رابطًا لرخصة المشاع الإبداعي، وتوضح ما إذا تم إجراء تغييرات. الصور أو المواد الأخرى من طرف ثالث في هذه المقالة مشمولة في رخصة المشاع الإبداعي الخاصة بالمقالة، ما لم يُشار إلى خلاف ذلك في سطر الائتمان للمواد. إذا لم تكن المادة مشمولة في رخصة المشاع الإبداعي الخاصة بالمقالة وكان استخدامك المقصود غير مسموح به بموجب اللوائح القانونية أو يتجاوز الاستخدام المسموح به، فسيتعين عليك الحصول على إذن مباشرة من صاحب حقوق الطبع والنشر. لعرض نسخة من هذه الرخصة، قم بزيارة http:// creativecommons.org/licenses/by/4.0/.
© المؤلف(ون) 2024

  1. مجلس السكان، 1 ساحة داغ همرشولد، نيويورك، NY 10017، الولايات المتحدة الأمريكية. ثقة الصحة الواحدة، واشنطن العاصمة، الولايات المتحدة الأمريكية. مكتب مفوض الصحة والصحة العقلية لمدينة نيويورك، نيويورك، الولايات المتحدة الأمريكية. مؤسسة بروكينغز، واشنطن العاصمة، الولايات المتحدة الأمريكية. بيانات للقرارات، ذ.م.م، وaltham، ماساتشوستس، الولايات المتحدة الأمريكية. جامعة هايدلبرغ، هايدلبرغ، ألمانيا. قسم البيولوجيا الجزيئية والخلوية ومركز علوم الدماغ، جامعة هارفارد، كامبريدج، ماساتشوستس، الولايات المتحدة الأمريكية. قسم الطب الشيخوخي، قسم الطب، كلية ديفيد غيفن للطب، جامعة كاليفورنيا، لوس أنجلوس، كاليفورنيا، الولايات المتحدة الأمريكية. مركز أبحاث وتعليم ورعاية المسنين، نظام الرعاية الصحية في إدارة المحاربين القدامى في لوس أنجلوس الكبرى، لوس أنجلوس، كاليفورنيا، الولايات المتحدة الأمريكية. كلية الصليب المقدس، ووستر، ماساتشوستس، الولايات المتحدة الأمريكية. جامعة كولومبيا البريطانية، فانكوفر، كولومبيا البريطانية V6T 1Z4، كندا. مدرسة هارفارد تي. إتش. تشان للصحة العامة، بوسطن، ماساتشوستس، الولايات المتحدة الأمريكية. البريد الإلكتروني:anandi@popcouncil.org

Journal: npj Aging, Volume: 10, Issue: 1
DOI: https://doi.org/10.1038/s41514-024-00136-6
PMID: https://pubmed.ncbi.nlm.nih.gov/38331952
Publication Date: 2024-02-08

Cost of care for Alzheimer’s disease and related dementias in the United States: 2016 to 2060

Arindam Nandi , Nathaniel Counts , Janina Bröker , Sabrina Malik , Simiao Chen , Rachael Han , Jessica Klusty , Benjamin Seligman , Daniel Tortorice , Daniel Vigo and David E. Bloom

Abstract

Medical and long-term care for Alzheimer’s disease and related dementias (ADRDs) can impose a large economic burden on individuals and societies. We estimated the per capita cost of ADRDs care in the in the United States in 2016 and projected future aggregate care costs during 2020-2060. Based on a previously published methodology, we used U.S. Health and Retirement Survey (2010-2016) longitudinal data to estimate formal and informal care costs. In 2016, the estimated per patient cost of formal care was (95% confidence interval [CI]: ), and informal care cost valued in terms of replacement cost and forgone wages was and , respectively. Aggregate formal care cost and formal plus informal care cost using replacement cost and forgone wage methods were billion ( uncertainty range [UR]: billion), billion ( billion), and billion ( billion), respectively, in 2020 . These were projected to increase to trillion ( billion- trillion), trillion ( trillion), and trillion ( trillion), respectively, in 2060. npj Aging (2024)10:13; https://doi.org/10.1038/s41514-024-00136-6

INTRODUCTION

The population of those aged 65 years and higher in the United States is projected to grow from 55 million in 2020 to 94 million in . With population aging, the burden of Alzheimer’s disease and related dementias (ADRDs) will also grow substantially. ADRDs represent a related set of conditions marked by progressive neurodegeneration, including Alzheimer’s disease, vascular dementia, dementia with Lewy bodies, and frontotemporal dementia. An estimated 6.5 million older Americans-almost three quarters of whom are older than 75-lived with Alzheimer’s dementia in . By 2060, this figure is projected to grow to 13.8 million people . ADRDs can severely affect cognition, i.e., functions of the brain such as learning, memory, and reasoning; interfere with activities of daily living such as bathing, walking, or eating; and lead to neuropsychological dysfunctions, including anxiety, delirium, and psychosis, and eventual death .
In 2013, Hurd et al. published a critical study estimating the cost of illness of dementia in the United States, which enabled the country to better understand the associated economic burden and support policy efforts to more effectively treat ADRDs . Hurd et al. estimated that in 2010 the direct medical care and informal caregiving costs for dementia in the United States ranged between billion and billion, depending upon the methodology used for valuing informal care . In 2015, Hurd et al. built on their study by forecasting potential future costs, helping the nation to understand how the magnitude of the threat may grow over time if left unaddressed . If the prevalence rate of dementia remained at its 2010 level, the aggregate annual care cost is estimated to increase to billion by 2040 , or to trillion by .
Subsequently, other cost of illness studies proliferated. The Alzheimer’s Association, which publishes annual estimates of the direct medical care cost based on data from various sources, including the Medicare Current Beneficiary Survey and published studies of disease prevalence , estimated that aggregate direct care cost would increase from billion in 2015 to trillion in 2050 (2015 US$) . Further estimates abound, with substantial variations in cost components, study cohorts, analytical techniques, and findings .
This study seeks to update and build on the analyses conducted by Hurd et al. to motivate a next wave of action on ADRDs in a rapidly aging country. National estimates of direct and indirect cost are based primarily on data from 2010 or earlier, and even smaller regional studies are based on data that are now a decade old . Newer estimates are necessary for research and policymaking, especially considering the changed ADRDs care landscape due to the passage of the Affordable Care Act in 2010 and the National Alzheimer’s Project Act in . To the best of our knowledge, only one study has used national data up to 2016 to estimate the current out-of-pocket cost of dementia care . Furthermore, future projection studies from Hurd et al. and others do not systematically quantify uncertainty and sometimes only report point estimates . An accurate forecast of the future economic burden of ADRDs, projected based on the most recent data and adequately incorporating uncertainty, enables policymakers and stakeholders to invest appropriately in research and development for therapeutics and cost-effective care innovations to mitigate this potential economic toll on society .
In this study, we projected the direct and indirect costs of ADRDs care in the United States in five-year intervals from 2020 to 2060, following the same methodology as Hurd et al., using the most recently available data and incorporating uncertainty. We
used national longitudinal data from 2010-2016 to estimate the per capita care cost for ADRDs based on this previously published methodology and projected aggregate costs through 2060, accounting for uncertainty.

RESULTS

Table 1 presents the per patient cost of formal and informal ADRDs care in 2016 in 2020 US$. The estimated per patient cost of formal care was ( : ). The per patient cost of informal care valued in terms of replacement cost and forgone wages was and , respectively. Total per patient costs including formal and informal care in terms of replacement cost and foregone wages were and US$43,869 (95% CI: US$40,246-US$47,591), respectively.
Considering only those who reported non-zero costs, the estimated per patient cost of formal care in 2016 was ( CI: ). Total per patient costs including formal and informal care in terms of replacement cost and foregone wages were and ( : ) respectively.
Figure 1 and Tables 2, 3, and 4 present the future projections of care cost (2020 US$). Under the base case scenario, the annual aggregate formal care cost for ADRDs was an estimated billion (95% uncertainty range [UR]: $179-$213 billion) in 2020
Table 1. Per patient cost of ADRDs formal and informal care in the United States, 2016.
Spending type Cost of ADRDs care in the United States (2020 US$)
Estimate 95% confidence interval
Out-of-pocket:
Home health care 185 108 271
Nursing home 7203 6155 8263
Total (A) 7943 6878 9078
Medicare spending:
Home health care agencies 964 759 1191
Nursing home 1505 1395 1618
Total (B) 4365 3974 4794
Formal home care:
Total 7220 5687 8917
Less: Medicare and OOP 1149 935 1381
Net total (C) 6071 4744 7554
Nursing home care:
Total 18,406 17,057 19,791
Less: Medicare and OOP 8708 7587 9825
Net total (D) 9698 8453 10,912
Total care purchased in the marketplace ( ) 28,078 25,893 30,433
Informal care: replacement cost (E) 36,667 34,025 39,473
Total care purchased in the marketplace plus caregiving time valued according to replacement cost ( ) 64,745 61,740 67,909
Informal care: Foregone wage cost (F) 15,792 12,980 18,713
Total care purchased in the marketplace plus caregiving time valued at foregone wage cost ( ) 43,869 40,246 47,591
and was projected to increase to trillion ( UR: billion- trillion) by 2060. Aggregate formal and informal care (replacement method) cost was estimated to increase from billion (95% UR: billion) in 2020 to trillion (95% UR: trillion) in 2060. Aggregate formal and informal care (foregone wages method) cost was estimated to increase from billion (95% UR: billion) in 2020 to trillion (95% UR: $1.3-$3.5 trillion) in 2060.
Assuming an annual cost of care inflation rate of 4%, formal care, formal and informal care (replacement method), and formal and informal care (foregone wages method) costs would rise to trillion (95% UR: trillion), trillion (95% UR: trillion), and trillion ( UR: trillion), respectively, in 2060 . With annual cost of care inflation and lower growth rate of ADRDs burden, these aggregate costs would be trillion ( UR: billion- trillion), trillion (95% UR: trillion), and trillion (95% UR: trillion), respectively, in 2060. Projected aggregate costs in all other scenarios would be lower than in the base case.
Considering higher per capita nursing home costs ( 1.95 times the base case, presented in Supplementary Appendix Table S1), annual aggregate formal care, formal and informal care (replacement method), and formal and informal care (foregone wages method) costs in 2020 were estimated to be billion ( UR: $286–$351 billion), $573 billion (95% UR: $520-$628 billion), and $428 billion (95% UR: $377-$480 billion. With a 3% annual inflation rate, these costs were projected to increase to trillion ( UR: trillion), trillion (95% UR: trillion), and trillion (95% UR: trillion) in 2060. Considering alternative cost of care inflation rates would increase (for inflation) or reduce (for 2% inflation) these projections accordingly.

DISCUSSION

ADRDs care poses a substantial economic burden in the United States that may more than double in the next two decades. Americans spent billion in direct medical costs for ADRDs in 2020, and as much as another billion in caregiver time was consumed. According to these estimates, formal care for ADRDs therefore comprised almost 5% of all health care spending in the United States and would make up a much larger proportion if patients received more formal paid home-based supports rather than relying on informal caregiving . Estimated costs for ADRDs are larger than for other priority conditions, such as chronic obstructive pulmonary disorder, and comparable to what are considered some of the greatest public health threats, such as all forms of elevated blood glucose levels .
With rapid increases in life expectancy and population aging in recent decades, ADRDs have become a major global health threat. If the current status quo continued, the global burden of ADRDs would triple by 2050, resulting in 115.8 million disability-adjusted life years lost every year . The global direct and indirect cost (foregone wages method) of dementia care is projected to increase from trillion in 2020 to trillion in . We found that the United States contributes-and will continue to contributesubstantially to the global economic burden of ADRDs.
Our per capita cost estimates were lower than those of Hurd et al. , on which our methodology was based. The differences are mainly attributable to newer data. Our definition of ADRDs differed slightly from the definition of dementia used in their study. The Affordable Care Act, which was passed in 2010 and has since reduced care costs, coverage gaps, and medical inflation rates, was not captured in the Hurd et al. study, which used 2000-2008 data . A recent study used Medicare claims data from 2006-2015 to estimate an average annual Medicare beneficiary cost of for Alzheimer’s disease and for general dementia (2015 US$), both of which are lower than the Hurd et al. estimated Medicare cost of (2010 US$) per dementia
Fig. 1 Projected cost of ADRDs formal and informal care in the United States, 2020 to 2060.
patient . Another 2020 study used Medicare claims data and found that from 2011 to 2016, the 30-day care cost of emergency department visits under Medicare reduced by .
Our future cost projections are within the range of costs estimated by three other studies . Hurd et al. estimated that if dementia prevalence rates stayed the same as in the ADAMS data, the direct cost, total cost with foregone wage method for indirect cost, and total cost with replacement method for indirect cost would grow to billion, billion, and billion, respectively, by 2040 (2010 US$). The authors conducted several one-way sensitivity analyses to capture potential changes in prevalence, including those due to comorbidities. In comparison, we conducted a probabilistic uncertainty analysis that captured uncertainties in future disease prevalence growth, population projections, and cost and cost inflation, along with one-way sensitivity analyses. Our corresponding estimates for 2040 were billion, billion, and trillion, respectively, with large 95% uncertainty ranges for each (2020 US$). These estimatesadjusted downward for inflation (Consumer Price Index of the U.S. Bureau of Labor Statistics ) and expressed in 2010 US$-would be billion, billion, and trillion, respectively. Zissimopoulos et al. projected direct and indirect cost to rise to trillion in , while the Alzheimer’s Association projected direct cost to rise to trillion in 2050 (2015 US$, or $1 trillion in 2010 US$) . In comparison, our 2050 projection of direct cost expressed in 2010 US was billion, while total cost, including direct and indirect costs, ranged from trillion to trillion. These variations can be attributed to differences in underlying data and methodology.
Our findings have important policy implications. ADRDs are projected to impose a fast-growing economic burden in the coming decades, but effective investments in research, prevention, and care could mitigate this . To the extent that people receive the most effective treatments and supports available, prevent or delay onset through changes earlier in life, or get access to new therapies that modify the disease process, the longterm costs of care for ADRDs will decrease as fewer people experience progressive degeneration. Instead, people will age well in place and require less intensive services, despite increasing population age in the coming years. Public-private collaboration in
the United States is necessary to mobilize the necessary investment to avert the human and economic tolls of ADRDs .
The health and economic burdens of ADRDs also raise important equity issues. Many risk factors for ADRDs are associated with structural discrimination (e.g., lack of access to education or nutritious foods), so the burdens will be increasingly concentrated among those already in the most challenging financial situations. In the United States, dementia prevalence among those aged 65 years and older is estimated to be and among Black and Hispanic populations, respectively, as compared with 7% among wealthier Whites . In 2020 to 2060, the number of Black, Asian and Pacific Islander, and Hispanic Americans living with ADRDs (65 and older) is estimated to increase 3, 4.7, and 5.4 times, respectively, as compared with a 1.7 times increase among non-Hispanic Whites . Furthermore, almost two-thirds of Alzheimer’s patients in the United States are women, and 10 million women (two-thirds of caregivers) live with or provide care for Alzheimer’s patients .
Investment is required to address these health and economic inequities in the United States. Attention to the ADRDs burden is also important for addressing ageism as a form of discrimination and a domain of health equity. Frequently, conditions that comprise the highest disease burden in childhood or in the working-age population receive the most attention and investment, whereas conditions that affect older adults are often neglected .
Our study has limitations. Most importantly, we did not link HRS respondents with individual Medicare records and approximated Medicare-covered expenses based on Hurd et al.’s estimates . While it is unlikely that Medicare coverage as a share of total cost differed substantially between their and our data, any difference may reduce the accuracy of our estimates. We considered a status quo scenario with a constant growth of disease burden and per capita cost and with no changes in ADRDs treatment protocol or care infrastructure. In addition, we also assumed that the proportions of ADRD patients that receive formal and informal care, as well as the duration of caregiving will remain unchanged in the future. Although we systematically varied inputs in probabilistic uncertainty analysis, they may not fully capture future developments in preventive and therapeutic interventions or care innovations that may change disease burden of caregiving patterns.
Table 2. Projected future cost of ADRDs formal and informal care in the United States.
Year Total care purchased in the marketplace (billions of 2020 US$) Total care purchased in the marketplace plus caregiving time valued according to replacement cost (billions of 2020 US$) Total care purchased in the marketplace plus caregiving time valued at foregone wage costs (billions of 2020 US$)
Base case (3% annual cost inflation)
2020 196 (179-213) 450 (424-478) 305 (278-333)
2025 252 (184-326) 580 (430-740) 393 (288-508)
2030 325 (233-430) 746 (542-979) 506 (363-671)
2035 417 (293-566) 959 (677-1292) 650 (456-878)
2040 535 (364-748) 1229 (842-1699) 833 (567-1160)
2045 683 (450-988) 1570 (1046-2247) 1064 (702-1532)
2050 875 (558-1295) 2010 (1293-2945) 1362 (867-2009)
2055 1115 (677-1714) 2562 (1571-3911) 1736 (1055-2664)
2060 1424 (837-2238) 3271 (1936-5120) 2217 (1311-3487)
With 2% annual cost inflation
2020 189 (173-204) 433 (410-457) 294 (269-319)
2025 231 (170-296) 531 (398-672) 360 (265-463)
2030 283 (206-369) 651 (480-838) 441 (322-576)
2035 346 (249-457) 796 (579-1043) 539 (387-712)
2040 422 (297-570) 971 (692-1296) 658 (464-886)
2045 513 (355-713) 1179 (822-1622) 799 (553-1105)
2050 625 (422-879) 1436 (978-1998) 973 (655-1364)
2055 757 (494-1099) 1740 (1142-2503) 1179 (769-1707)
2060 919 (586-1352) 2113 (1355-3094) 1432 (915-2105)
With 4% annual cost inflation
2020 204 (185-223) 468 (437-501) 317 (287-349)
2025 275 (199-359) 632 (464-815) 429 (311-558)
2030 372 (262-503) 855 (608-1147) 580 (408-783)
2035 502 (342-702) 1154 (793-1602) 782 (532-1088)
2040 677 (441-980) 1555 (1022-2234) 1054 (689-1520)
2045 908 (568-1370) 2087 (1318-3131) 1414 (883-2130)
2050 1223 (731-1905) 2810 (1691-4343) 1904 (1137-2955)
2055 1640 (923-2668) 3768 (2134-6117) 2553 (1439-4144)
2060 2203 (1184-3709) 5062 (2738-8450) 3430 (1854-5772)
95% uncertainty ranges are in parentheses.
Beyond the cost of formal care and the value of informal caregiving, ADRDs may have broader societal and macroeconomic cost implications. Reduction in savings and capital formation due to ADRDs treatment expenditure and lower labor force participation due to mortality and morbidity may reduce long-term economic growth . Due to lack of data, our analysis does not capture these additional costs. Future studies should use modeling techniques that can better account for these other types of societal costs. Finally, to make our estimates comparable to Hurd et al., we used ordinary least squares regression models. Generalized linear models or other techniques may produce more precise estimates for cost variables that have a skewed distribution.

METHODS

Data

We used data from a nationally representative longitudinal survey of individuals aged 50 and older: the Health and Retirement Survey
Table 3. Sensitivity analysis with lower growth rate of ADRDs burden.
Year Total care Total care purchased Total care purchased
purchased in the in the marketplace in the marketplace
marketplace plus caregiving time plus caregiving time
(billions of 2020 valued according to valued at foregone
US$) replacement cost wage costs (billions
(billions of 2020 US$) of 2020 US$)
Base case with 40% lower burden growth
2020 195 (178-212) 448 (421-475) 303 (276-331)
2025 243 (177-314) 559 (415-712) 378 (277-489)
2030 303 (218-401) 697 (508-913) 473 (340-624)
2035 378 (267-511) 869 (618-1165) 589 (415-792)
2040 470 (322-651) 1080 (746-1482) 732 (502-1011)
2045 581 (387-831) 1336 (898-1892) 905 (606-1292)
2050 722 (466-1053) 1658 (1083-2397) 1124 (724-1634)
2055 891 (555-1345) 2048 (1283-3073) 1388 (863-2087)
2060 1103 (662-1702) 2535 (1538-3878) 1718 (1039-2646)
With lower burden growth and annual cost inflation
2020 187 (172-203) 431 (408-454) 292 (267-317)
2025 223 (164-285) 511 (383-646) 347 (255-445)
2030 265 (193-343) 608 (451-781) 412 (301-536)
2035 314 (227-412) 721 (527-937) 488 (353-640)
2040 371 (263-496) 852 (612-1125) 578 (411-771)
2045 437 (306-597) 1004 (710-1356) 680 (477-929)
2050 515 (353-713) 1184 (822-1621) 803 (547-1107)
2055 605 (405-859) 1391 (938-1958) 943 (630-1337)
2060 712 (467-1025) 1637 (1081-2333) 1109 (730-1595)
With 40% lower burden growth and 4% annual cost inflation
2020 202 (183-222) 465 (435-497) 315 (285-346)
2025 265 (192-346) 609 (447-786) 413 (300-538)
2030 348 (245-469) 799 (570-1071) 542 (382-730)
2035 455 (311-633) 1046 (721-1445) 709 (484-982)
2040 594 (390-856) 1366 (906-1953) 925 (609-1326)
2045 773 (489-1156) 1777 (1132-2636) 1204 (763-1798)
2050 1009 (610-1553) 2318 (1414-3543) 1571 (950-2414)
2055 1311 (755-2107) 3012 (1744-4802) 2041 (1176-3273)
2060 1707 (932-2822) 3923 (2166-6414) 2658 (1466-4389)
95% uncertainty ranges are in parentheses.
(HRS). The surveys started in 1992 and cover approximately 20,000 individuals who are interviewed once every two years. The HRS collects data on various aspects of aging, including health and disability, health care access and spending, housing, assets, and employment. A subset of 856 HRS respondents who were age 70 and older in 2000-2002 form the Aging, Demographics, and Memory Study (ADAMS). ADAMS collected in-depth clinical data on cognitive status and dementia of the participants in four waves from 2001 to . These data have been used previously to estimate the prevalence of dementia and examine its care and associated costs . HRS and ADAMS surveys received ethics clearance from the University of Michigan Institutional Review Board . We used publicly available and anonymized secondary data from HRS and ADAMS, and no separate ethics clearance was necessary for our study.

The probability of ADRDs and cost of care

We used the methodology of Hurd et al. to estimate the probability of ADRDs based on the HRS 2010-2016 data as
A. Nandi et al.
Table 4. Sensitivity analysis with higher nursing home costs.
Year Total care purchased in the marketplace (billions of 2020 US$) Total care purchased in the marketplace plus caregiving time valued according to replacement cost (billions of 2020 US$) Total care purchased in the marketplace plus caregiving time valued at foregone wage costs (billions of 2020 US$)
Base case with higher nursing home costs
2020 318 (286-351) 573 (520-628) 428 (377-480)
2025 410 (296-534) 737 (538-959) 551 (395-725)
2030 527 (375-704) 950 (679-1265) 709 (501-956)
2035 678 (473-924) 1220 (852-1665) 911 (630-1252)
2040 869 (587-1222) 1564 (1063-2184) 1168 (783-1645)
2045 1109 (726-1613) 1997 (1316-2895) 1491 (974-2179)
2050 1420 (901-2110) 2557 (1632-3784) 1910 (1199-2850)
2055 1810 (1094-2793) 3259 (1975-5011) 2434 (1465-3773)
2060 2312 (1351-3648) 4162 (2440-6537) 3108 (1820-4916)
With higher nursing home costs and 2% annual cost inflation
2020 306 (276-336) 551 (503-600) 412 (364-460)
2025 375 (273-485) 675 (496-871) 504 (364-662)
2030 460 (333-602) 828 (601-1085) 618 (442-822)
2035 562 (402-748) 1012 (725-1344) 756 (535-1014)
2040 686 (479-932) 1235 (869-1665) 922 (639-1260)
2045 833 (572-1163) 1500 (1034-2085) 1120 (765-1570)
2050 1014 (681-1432) 1826 (1230-2567) 1364 (905-1934)
2055 1230 (797-1794) 2214 (1438-3213) 1653 (1065-2424)
2060 1493 (948-2206) 2688 (1706-3964) 2007 (1264-2974)
With higher nursing home costs and 4% annual cost inflation
2020 331 (295-367) 596 (538-657) 445 (389-502)
2025 447 (320-588) 805 (582-1056) 601 (428-798)
2030 604 (422-823) 1088 (764-1477) 813 (564-1114)
2035 816 (553-1145) 1469 (996-2060) 1097 (736-1546)
2040 1099 (714-1603) 1978 (1291-2866) 1477 (954-2153)
2045 1475 (917-2236) 2656 (1664-4005) 1983 (1228-3028)
2050 1986 (1183-3110) 3575 (2141-5573) 2670 (1572-4191)
2055 2663 (1494-4350) 4793 (2697-7804) 3579 (1994-5869)
2060 3578 (1909-6053) 6440 (3456-10810) 4809 (2584-8135)
95% uncertainty ranges are in parentheses.
compared with the HRS 2000-2008 data in their study . First, we used the ADAMS data to estimate an ordered probit model that a respondent had ADRDs, had cognitive impairment but not ADRDs, or had neither. The covariates of this regression included indicators that were also available in the full HRS data: age, sex, schooling attainment, activities of daily living (such as eating and bathing) limitations, instrumental activities of daily living (such as preparing meals or managing money) limitations, and scores on cognitive tests such as identification of the current date, backward counting from 20, word naming, identification of the current U.S. vice president, and immediate word recall. The estimated coefficients of this regression were used to predict the probability of ADRDs for all respondents in the HRS.
Next, we estimated the following regression model for each HRS respondent:
where denotes the cost of medical care for individual in year (2010-2016). Following Hurd et al., we included only individuals aged 70 years and above in our analysis . The estimated probability of dementia, , is from the previous regression, and includes respondent age, sex, household income, categorical variables for education and number of children of the respondent, and a set of binary variables for White or Hispanic and if the respondent has ever had a stroke, lung disease, diabetes, heart disease, hypertension, cancer, psychological conditions, and arthritis. Standard errors of the estimates were obtained through 2000 bootstrap simulations of each model. We report the estimated coefficient (along with confidence interval obtained from bootstrapping), which measures the per patient cost of care attributable to ADRDs. Analysis was conducted separately for each costiy category (e.g., formal and informal cost), described in the following.

Formal cost of care purchased in the market

Formal cost includes out-of-pocket (OOP) spending and costs covered by Medicare and other sources for facility care, formal home care, and nursing home care. OOP costs include expenditure on nursing home stays, hospital stays, doctor visits, dental visits, outpatient surgery, home health care, other special services, prescription drugs, and dental services. We used self-reported HRS data on nights spent at nursing homes and combined them with Genworth’s 2019 data on nightly rates to estimate total nursing home costs paid OOP and through Medicare and other sources . Formal home health care includes services provided by an agency and home health aides directly hired by the patient when an individual has difficulty with an activity (basic activities such as bathing or eating) or instrumental activity (more complex activities such as managing finances or using public transportation) of daily living. We used HRS data on hours of home care combined with Genworth unit cost data to estimate the total cost of home care .
Hurd et al. undertook to link HRS (2000-2008 waves) respondents with their Medicare records and were successful in approximately of the cases. To circumvent the complexity and likely incompleteness of the linking process in the 2010-2016 waves of HRS, we assumed the same coverage rates of Medicare as estimated in the Hurd et al. study. We assumed that Medicare covered of total home health care and of nursing home care cost. An estimated 57% of Medicare expenses came from nursing homes and home health care, and we used this ratio to extrapolate and project total Medicare costs .

Informal cost of care, or the caregiver cost

When a person unaffiliated with an agency, such as a family member, provides informal care, there is also a cost. We used two approaches to estimate the informal cost of caregiving: replacement cost and foregone wages. The replacement cost method allowed us to estimate the cost of replacing an informal caregiver with a professional caregiver for the same number of hours. We used Genworth 2019 data for the cost of in-home caregiving for ADRDs. We combined these data with the hours spent by the informal caregiver in the 2010-2016 HRS data to obtain an estimate of professional caregiver replacement cost.
The foregone wage approach estimated the opportunity cost of helping an individual with ADRDs, where the alternative is earning a market wage. We calculated opportunity cost as hours spent by a caregiver helping an ADRD patient multiplied by the market wage that the caregiver could have earned. We obtained wages from the Current Population Survey separately by caregiver demographic characteristics-age, sex, and level of educationand adjusted to 2020 US$ using the consumer price index of the U.S. Bureau of Labor Statistics .
Caregiving time data were available from HRS 2010-2016. For each respondent who received help from a nonprofessional individual, we extracted the number of hours per year of help received. The HRS did not collect hours for caregivers who helped less than once per week, and we imputed values for these observations in each year based on reported caregiver characteristics: sex, relationship to respondent, and number of days per week/month of care. We imputed missing data for caregivers’ demographic traits, education, hours, and wages following a systematic process similar to that of Hurd et al. . The Supplementary Appendix provides additional details of informal cost calculations.

Future projections

We simulated future cost of ADRDs care by combining estimates for per patient cost as discussed previously with future projections of ADRDs prevalence and medical cost inflation. We obtained 2019 data on ADRDs prevalence from the Global Burden of Diseases (GBD) study of the Institute for Health Metrics and Evaluation, which included all diseases within ADRDs except vascular dementia . We estimated the relative prevalence of vascular dementia from the ADAMS data and adjusted the GBD estimates upward . We calculated the average annual growth rate of ADRDs prevalence in the United States during 2010-2019 from the GBD data and assumed that the ADRDs burden will grow at the same rate into the future. The projected future prevalence rate was then combined with population data from the U.S. Census Bureau (2020) and the World Population Prospects (medium variant) of the United Nations to project the number of ADRDs patients from 2020 to . We assumed that the formal and informal per patient cost of ADRDs care will grow at an annual rate of , which was the average annual medical care inflation rate in the United States during 2010-2020 . The medical inflation rate in the United States is typically higher than the overall annual inflation rate (targeted by the Federal Reserve Bank at .
We quantified uncertainty surrounding these parameters through a systematic uncertainty analysis. We varied the annual growth rate of ADRDs prevalence, health care inflation rate, population projections within a prespecified range of of the initial value, and the estimated formal and informal cost of care in 2016 within a confidence interval. We drew 10,000 random samples from the joint uniform distribution of these parameters and computed the projected quinquennial future cost of care from 2020 to 2060. We report the mean values with uncertainty ranges from these 10,000 simulations by year.

Sensitivity analysis

In addition to systematically capturing uncertainty in the parameter values, we conducted several one-way sensitivity analyses by varying the parameters of the model. First, medical expenditure data tend to be right skewed, with some patients having substantially larger (outlier) expenses as compared with the rest. For example, fewer than of HRS respondents in our data have non-zero values for some indicators such as out-ofpocket and total nursing home expenditure. Linear regression may produce imprecise estimates from such skewed data. While the primary purpose of our study is to provide updated estimates that are comparable to Hurd et al. who used similar linear regression models on older HRS data, we also considered the subsample of HRS respondents with non-zero values. We repeated our analysis for each expenditure variable – only among those who reported positive values. We report these estimates only in per capita terms for 2016, and do not present aggregate estimates or future projections.
Second, recent research has attributed about of all dementia cases to modifiable risk factors such as lack of physical
activity, smoking, excessive alcohol consumption, and exposure to air pollution . New and future drugs for slowing dementiarelated cognitive decline may also reduce the future burden of ADRDs. We considered a scenario in which the base case annual growth rate of ADRDs is reduced by . Third, we considered two additional scenarios with and annual inflation rates of cost of care (instead of as in the base case). We also considered two more scenarios by combining the lower growth rate of ADRDs burden and variations in inflation rates.
Finally, previous research suggests that the HRS may underreport the duration of time spent by respondents in skilled nursing facilities . In Hurd et al.’s study, HRS 2008 respondents aged 65 years and above reported spending 9.6 nights on average in a nursing home during the year preceding the survey, which was lower than the Centers for Medicare & Medicaid Services (CMS) based 2007 estimate of 13.8 nights spent in nursing homes . Hurd et al. did not adjust their estimates for this discrepancy, presumably because the proportion of HRS respondents living in nursing homes was similar to that in other sources of data such as the 2000 U.S. Census.
Following Hurd et al. , we compared the reported average duration of nursing home stays in the HRS with data from CMS . Older adults in our HRS 2010 data reported spending 6.4 nights in nursing homes on average per year, which was almost half of comparable estimates from CMS data . To account for this difference, we considered an additional scenario where per capita out-of-pocket, Medicare-covered, and total nursing home expenditure were adjusted upwards by a factor of 1.95. The Supplementary Appendix further discusses comparisons between HRS and other data sources data and the rationale for this upward adjustment.

DATA AVAILABILITY

The Health and Retirement Study (HRS) data are publicly available from the HRS website https://hrs.isr.umich.edu/.

CODE AVAILABILITY

Code is available from the corresponding author on reasonable request.
Received: 9 October 2023; Accepted: 9 January 2024;
Published online: 08 February 2024

REFERENCES

  1. United Nations, Department of Economic and Social Affairs, Population Division. World Population Prospects. 2019. https://population.un.org/wpp/Publications/ (accessed April 6, 2022).
  2. Alzheimer’s Association. 2022 Alzheimer’s Disease Facts and Figures: 2022. https://www.alz.org/media/Documents/alzheimers-facts-and-figures.pdf (accessed April 22, 2022).
  3. Rajan, K. B. et al. Population estimate of people with clinical Alzheimer’s disease and mild cognitive impairment in the United States (2020-2060). Alzheimers Dement 17, 1966-1975 (2021).
  4. Tarawneh, R. & Holtzman, D. M. The clinical problem of symptomatic Alzheimer disease and mild cognitive impairment. Cold Spring Harb. Perspect. Med. 2, a006148 (2012).
  5. Deb, A., Thornton, J. D., Sambamoorthi, U. & Innes, K. Direct and indirect cost of managing alzheimer’s disease and related dementias in the United States. Expert. Rev. Pharmacoecon Outcomes Res. 17, 189-202 (2017).
  6. Hurd, M. D., Martorell, P., Delavande, A., Mullen, K. J. & Langa, K. M. Monetary Costs of Dementia in the United States. N. Engl. J. Med. 368, 1326-1334 (2013).
  7. Hurd, M. D., Martorell, P. & Langa, K. Future Monetary Costs of Dementia in the United States under Alternative Dementia Prevalence Scenarios. J. Popul. Ageing 8, 101-112 (2015).
  8. Zissimopoulos, J., Crimmins, E. & St Clair, P. The Value of Delaying Alzheimer’s Disease Onset. Forum Health Econ. Policy 18, 25-39 (2014).
  9. Alzheimer’s Association. 2020 Alzheimer’s disease facts and figures. Alzheimer Dementia 16, 391-460 (2020).
  10. Alzheimer’s Association. Changing the Trajectory of Alzheimer’s Disease: How a Treatment by 2025 Saves Lives and Dollars (Alzheimer’s Association, 2015).
  11. Burke, L. G., Burke, R. C., Epstein, S. K., Orav, E. J. & Jha, A. K. Trends in Costs of Care for Medicare Beneficiaries Treated in the Emergency Department From 2011 to 2016. JAMA Network Open 3, e208229 (2020).
  12. Pyenson, B. et al. The Real-World Medicare Costs of Alzheimer Disease: Considerations for Policy and Care. J. Manag. Care Spec. Pharm. 25, 800-809 (2019).
  13. Rattinger, G. B. et al. Dementia severity and the longitudinal costs of informal care in the Cache County population. Alzheimers Dement 11, 946-954 (2015).
  14. Yang, Z. & Levey, A. Gender Differences: A Lifetime Analysis of the Economic Burden of Alzheimer’s Disease. Womens Health Issues 25, 436-440 (2015).
  15. Zhu, C. W. et al. Health-care use and cost in dementia caregivers: Longitudinal results from the Predictors Caregiver Study. Alzheimers Dement 11, 444-454 (2015).
  16. Joyce, A. T. et al. Burden of illness among commercially insured patients with Alzheimer’s disease. Alzheimers Dement 3, 204-210 (2007).
  17. Kuo, T.-C., Zhao, Y., Weir, S., Kramer, M. S. & Ash, A. S. Implications of comorbidity on costs for patients with Alzheimer disease. Med. Care 46, 839-846 (2008).
  18. Goldfeld, K. S., Stevenson, D. G., Hamel, M. B. & Mitchell, S. L. Medicare expenditures among nursing home residents with advanced dementia. Arch. Intern. Med. 171, 824-830 (2011).
  19. Bharmal, M. F. et al. Incremental Dementia-Related Expenditures in a Medicaid Population. Am. J. Geriatr. Psychiatry 20, 73-83 (2012).
  20. Suehs, B. T. et al. The clinical and economic burden of newly diagnosed Alzheimer’s disease in a medicare advantage population. Am. J. Alzheimers Dis. Other Demen. 28, 384-392 (2013).
  21. Kelley, A. S., McGarry, K., Gorges, R. & Skinner, J. S. The Burden of Health Care Costs in the Last 5 Years of Life. Ann Intern. Med. 163, 729-736 (2015).
  22. Zhu, C. W. et al. Medicare Utilization and Expenditures Around Incident Dementia in a Multiethnic Cohort. J. Gerontol. A Biol. Sci. Med. Sci. 70, 1448-1453 (2015).
  23. Lin, P.-J., Zhong, Y., Fillit, H. M., Chen, E. & Neumann, P. J. Medicare Expenditures of Individuals with Alzheimer’s Disease and Related Dementias or Mild Cognitive Impairment Before and After Diagnosis. J. Am. Geriatr. Soc. 64, 1549-1557 (2016).
  24. Yang, Z., Zhang, K., Lin, P.-J., Clevenger, C. & Atherly, A. A Longitudinal Analysis of the Lifetime Cost of Dementia. Health Serv. Res. 47, 1660-1678 (2012).
  25. Deb, A., Sambamoorthi, U., Thornton, J. D., Schreurs, B. & Innes, K. Direct medical expenditures associated with Alzheimer’s and related dementias (ADRD) in a nationally representative sample of older adults – an excess cost approach. Aging Ment Health 22, 619-624 (2018).
  26. Fishman, P. et al. Cost of Dementia in Medicare Managed Care: A Systematic Literature Review. Am. J. Manag. Care 25, e247-e253 (2019).
  27. David, K., Guterman, S.& Bandeali, F. The Affordable Care Act and Medicare: How the Law Is Changing the Program and the Challenges That Remain (Commonwealth Fund, 2015).
  28. Oney, M., White, L. & Coe, N. B. Out-of-pocket costs attributable to dementia: A longitudinal analysis. J. Am. Geriatrics Soc. https://doi.org/10.1111/jgs. 17746 (2022).
  29. Bloom, D. E., Counts, N., Nandi, A., Tortorice, D.& Vigo, D. How to address Alzheimer’s disease and support healthier ageing (World Economic Forum, 2022). https://www.weforum.org/agenda/2022/02/this-is-how-to-address-a-global-alzheimers-disease/ (accessed March 25, 2022).
  30. Bloom, D. et al. Addressing Alzheimer’s disease and related dementias to realise the promise of the UN’s ‘Decade of Healthy Ageing’ (VoxEU, 2021). https://voxeu.org/ article/alzheimer-s-and-un-s-decade-healthy-ageing (accessed May 14, 2021).
  31. Counts, N., Nandi, A., Seligman, B. & Tortorice, D. Dementia Storm on the Horizon: The rising incidence of dementia around the world calls for global collaboration and decisive financing. Finance Dev. 58, 54-57 (2021).
  32. Hartman, M., Martin, A. B., Washington, B., Catlin, A. & The, N. H. E. A. T. National Health Care Spending In 2020: Growth Driven By Federal Spending In Response To The COVID-19 Pandemic. Health Affairs 41, 13-25 (2022).
  33. Zafari, Z., Li, S., Eakin, M. N., Bellanger, M. & Reed, R. M. Projecting Long-term Health and Economic Burden of COPD in the United States. Chest 159, 1400-1410 (2021).
  34. Dall, T. M. et al. The Economic Burden of Elevated Blood Glucose Levels in 2017: Diagnosed and Undiagnosed Diabetes, Gestational Diabetes Mellitus, and Prediabetes. Diabetes Care 42, 1661-1668 (2019).
  35. Nandi, A. et al. Global and regional projections of the economic burden of Alzheimer’s disease and related dementias from 2019 to 2050: A value of statistical life approach. eClinicalMedicine 51, 101580 (2022).
  36. Jia, J. et al. The cost of Alzheimer’s disease in China and re-estimation of costs worldwide. Alzheimers Dement 14, 483-491 (2018).
  37. US Bureau of Labor Statistics. CPI Inflation Calculator. 2022. https://www.bls.gov/ data/inflation_calculator.htm (accessed April 23, 2022).
  38. Livingston, G. et al. Dementia prevention, intervention, and care: 2020 report of the Lancet Commission. Lancet 396, 413-446 (2020).
  39. Chen, C. & Zissimopoulos, J. M. Racial and ethnic differences in trends in dementia prevalence and risk factors in the United States. Alzheimer Dementia 4, 510-520 (2018).
  40. Matthews, K. A. et al. Racial and ethnic estimates of Alzheimer’s disease and related dementias in the United States (2015-2060) in adults aged years. Alzheimers Dement 15, 17-24 (2019).
  41. Alzheimer’s Association. Women and Alzheimer’s. Alzheimer’s Disease and Dementia. 2022. https://alz.org/alzheimers-dementia/what-is-alzheimers/women-and-alzheimer-s (accessed April 23, 2022).
  42. Mikton, C., de la Fuente-Núñez, V., Officer, A. & Krug, E. Ageism: a social determinant of health that has come of age. Lancet 397, 1333-1334 (2021).
  43. Chen, S., Kuhn, M., Prettner, K. & Bloom, D. E. The global macroeconomic burden of road injuries: estimates and projections for 166 countries. Lancet Planet. Health 3, e390-e398 (2019).
  44. Langa, K. M. et al. The Aging, Demographics, and Memory Study: study design and methods. Neuroepidemiology 25, 181-191 (2005).
  45. Okura, T. & Langa, K. M. Caregiver Burden and Neuropsychiatric Symptoms in Older Adults with Cognitive Impairment: The Aging, Demographics, and Memory Study (ADAMS). Alzheimer Dis. Assoc. Disord. 25, 116-121 (2011).
  46. Crimmins, E. M., Kim, J. K., Langa, K. M. & Weir, D. R. Assessment of Cognition Using Surveys and Neuropsychological Assessment: The Health and Retirement Study and the Aging, Demographics, and Memory Study. J. Gerontol. Ser. B 66B, i162-i171 (2011).
  47. Brookmeyer, R. et al. National estimates of the prevalence of Alzheimer’s disease in the United States. Alzheimer Dementia 7, 61-73 (2011).
  48. Sonnega, A. et al. Cohort Profile: the Health and Retirement Study (HRS). Int. J. Epidemiol. 43, 576-585 (2014).
  49. Genworth. Cost of Long Term Care by State. 2022. https://www.genworth.com/ aging-and-you/finances/cost-of-care.html (accessed April 22, 2022).
  50. Bureau of Labor Statistics. Consumer Price Index (CPI) Databases: U.S. Bureau of Labor Statistics. 2022. https://www.bls.gov/cpi/data.htm (accessed June 9, 2022).
  51. Institute for Health Metrics and Evaluation. Global Burden of Diseases Results Tool. GBD Results Tool. 2019. http://ghdx.healthdata.org/gbd-results-tool.
  52. US Census Bureau. U.S. Census Bureau QuickFacts: United States. 2022. https:// www.census.gov/quickfacts/fact/table/US/PST045221 (accessed April 22, 2022).
  53. US Bureau of Labor Statistics. Medical care in U.S. city average, all urban consumers, not seasonally adjusted. 2022. https://data.bls.gov/ (accessed May 10, 2023).
  54. Nianogo, R. A. et al. Risk Factors Associated With Alzheimer Disease and Related Dementias by Sex and Race and Ethnicity in the US. JAMA Neurol. 79, 584-591 (2022).
  55. Lima, J. C., Ogarek, J. & Mor, V. Untapped Potential – Using the HRS-Medicare Linked Files to Study the Changing Nursing Home Population. Med. Care 56, 216-219 (2018).
  56. Centers for Medicare & Medicaid Services. Nursing Home Data Compendium 2015 (Centers for Medicare & Medicaid Services, 2015).
  57. US Census Bureau. The Older Population: 2010 (US Department of Commerce, 2011).

ACKNOWLEDGEMENTS

The Davos Alzheimer’s Collaborative provided financial support through a contract with Data for Decisions, LLC, to conduct the research on which this manuscript is based. The funders had no role in study design, analysis, or preparation of the manuscript. The authors are grateful to George Vradenburg, Drew Holzapfel, Arnaud Bernaert, Megan Jackson, Alissa Kurzman, James K. Hammitt, Lisa A. Robinson, Michael Hurd, Paco Martorell, and participants in a series of webinars for helpful comments. We additionally thank Paco Martorell and Michael Hurd for sharing their computer codes.

AUTHOR CONTRIBUTIONS

DEB and AN designed the study. SM, JB, and AN collected the data and conducted the analysis. AN, SM, and JB wrote the first version of the manuscript. All authors critically evaluated the methodology and results and reviewed and edited the manuscript. All authors approved the final version of the manuscript.

COMPETING INTERESTS

A.N., D.T., and D.E.B. consult for and J.K. is employed by Data for Decisions, LLC, whose clients include GSK, Merck, and Pfizer. These entities did not fund the research in this manuscript. B.S. has done pro bono advisory work for Ceresti Health, which did not fund the research in this manuscript. All other authors declare no conflict of
interest. This publication does not represent the views of the Department of Veterans Affairs or the U.S. Government.

ADDITIONAL INFORMATION

Supplementary information The online version contains supplementary material available at https://doi.org/10.1038/s41514-024-00136-6.
Correspondence and requests for materials should be addressed to Arindam Nandi.
Reprints and permission information is available at http://www.nature.com/ reprints
Publisher’s note Springer Nature remains neutral with regard to jurisdictional claims in published maps and institutional affiliations.
Open Access This article is licensed under a Creative Commons Attribution 4.0 International License, which permits use, sharing, adaptation, distribution and reproduction in any medium or format, as long as you give appropriate credit to the original author(s) and the source, provide a link to the Creative Commons license, and indicate if changes were made. The images or other third party material in this article are included in the article’s Creative Commons license, unless indicated otherwise in a credit line to the material. If material is not included in the article’s Creative Commons license and your intended use is not permitted by statutory regulation or exceeds the permitted use, you will need to obtain permission directly from the copyright holder. To view a copy of this license, visit http:// creativecommons.org/licenses/by/4.0/.
© The Author(s) 2024

  1. The Population Council, 1 Dag Hammarskjold Plaza, New York, NY 10017, USA. One Health Trust, Washington, DC, USA. Office of the Commissioner of Health & Mental Hygiene for the City of New York, New York, NY, USA. The Brookings Institution, Washington, DC, USA. Data for Decisions, LLC, Waltham, MA, USA. University of Heidelberg, Heidelberg, Germany. Department of Molecular and Cellular Biology and The Center for Brain Science, Harvard University, Cambridge, MA, USA. Division of Geriatric Medicine, Department of Medicine, David Geffen School of Medicine, University of California, Los Angeles, CA, USA. Geriatrics Research, Education, and Clinical Center, Greater Los Angeles VA Health Care System, Los Angeles, CA, USA. College of the Holy Cross, Worcester, MA, USA. University of British Columbia, Vancouver, BC V6T 1Z4, Canada. Harvard T.H. Chan School of Public Health, Boston, MA, USA. email: anandi@popcouncil.org