تناول النشا المقاوم يسهل فقدان الوزن لدى البشر من خلال إعادة تشكيل ميكروبيوم الأمعاء Resistant starch intake facilitates weight loss in humans by reshaping the gut microbiota

المجلة: Nature Metabolism، المجلد: 6، العدد: 3
DOI: https://doi.org/10.1038/s42255-024-00988-y
PMID: https://pubmed.ncbi.nlm.nih.gov/38409604
تاريخ النشر: 2024-02-26

تناول النشا المقاوم يسهل فقدان الوزن لدى البشر من خلال إعادة تشكيل ميكروبيوم الأمعاء

تاريخ الاستلام: 8 يناير 2023
تاريخ القبول: 17 يناير 2024
تاريخ النشر على الإنترنت: 26 فبراير 2024
(D) تحقق من التحديثات

هوا تينغ لي لي زانغ ، جون لي ، تشيان وو ، لينغ لينغ تشيان ، جون شينغ ، يوي تشيونغ ني® ، بيتيا كوفاتشيفا-داتشاري ، روي يوان ، شوانغ بو ليو ، لي شين ، مينغ ليانغ زانغ ، بين شينغ ، بينغ لي ، كانغ كانغ © ، ليانغ وو ، تشي تشين فنج ، شياو شيو لونغ ، شياولين وانغ ، يان لي لي ، يوروي يي ، جيان بينغ يي (1) ، يوقيان باو © ، يوي ليانغ تشاو ، قوه وانغ شو® ، شين يوي ليو® ، جياني باناجيوتوس ، آيمين شو & ويبينغ جيا®

الملخص

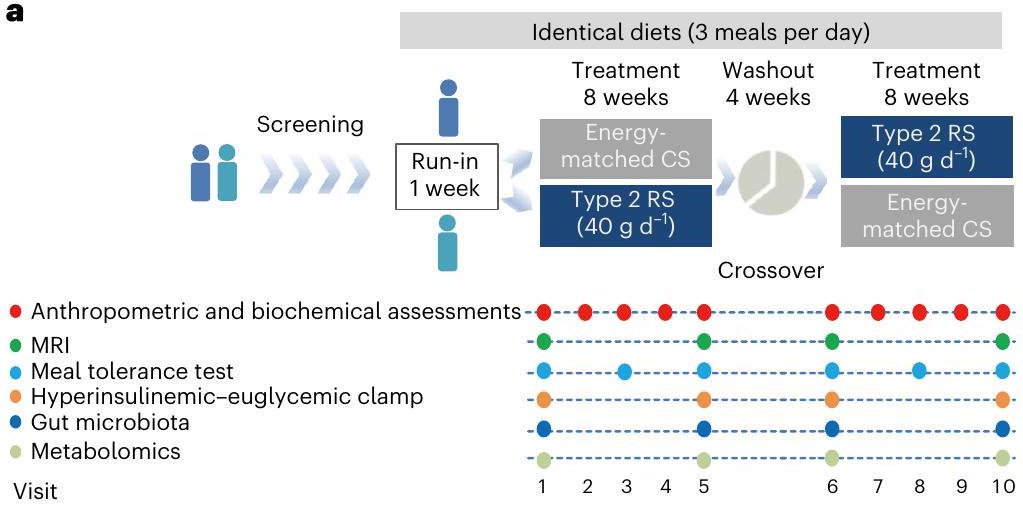
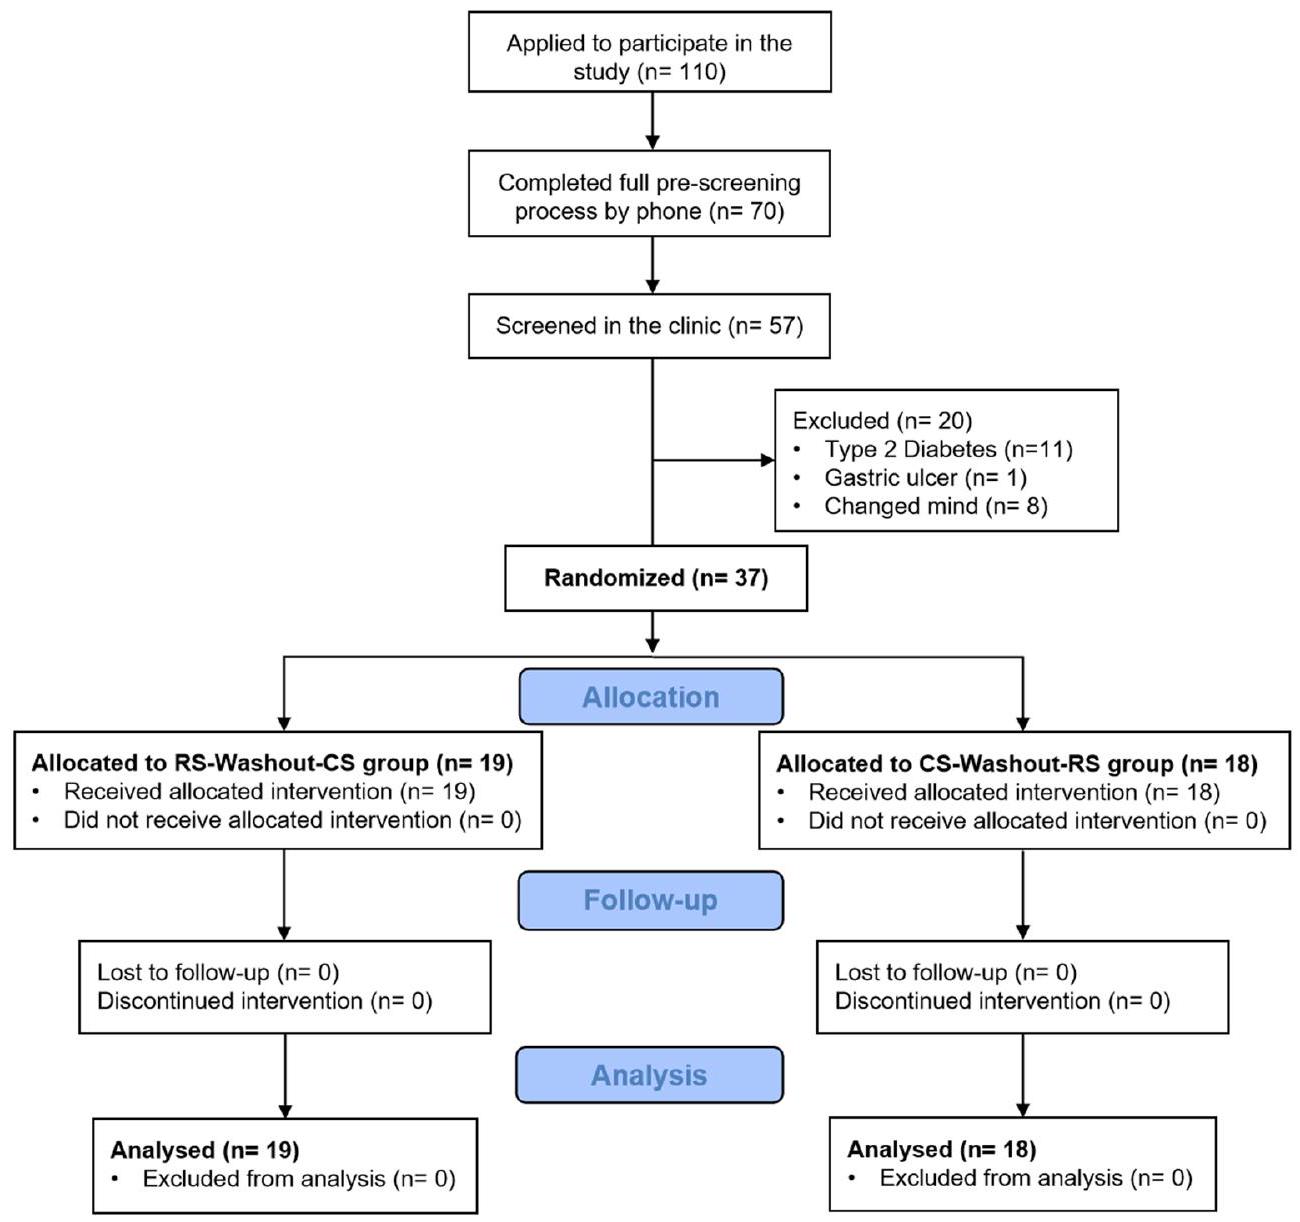
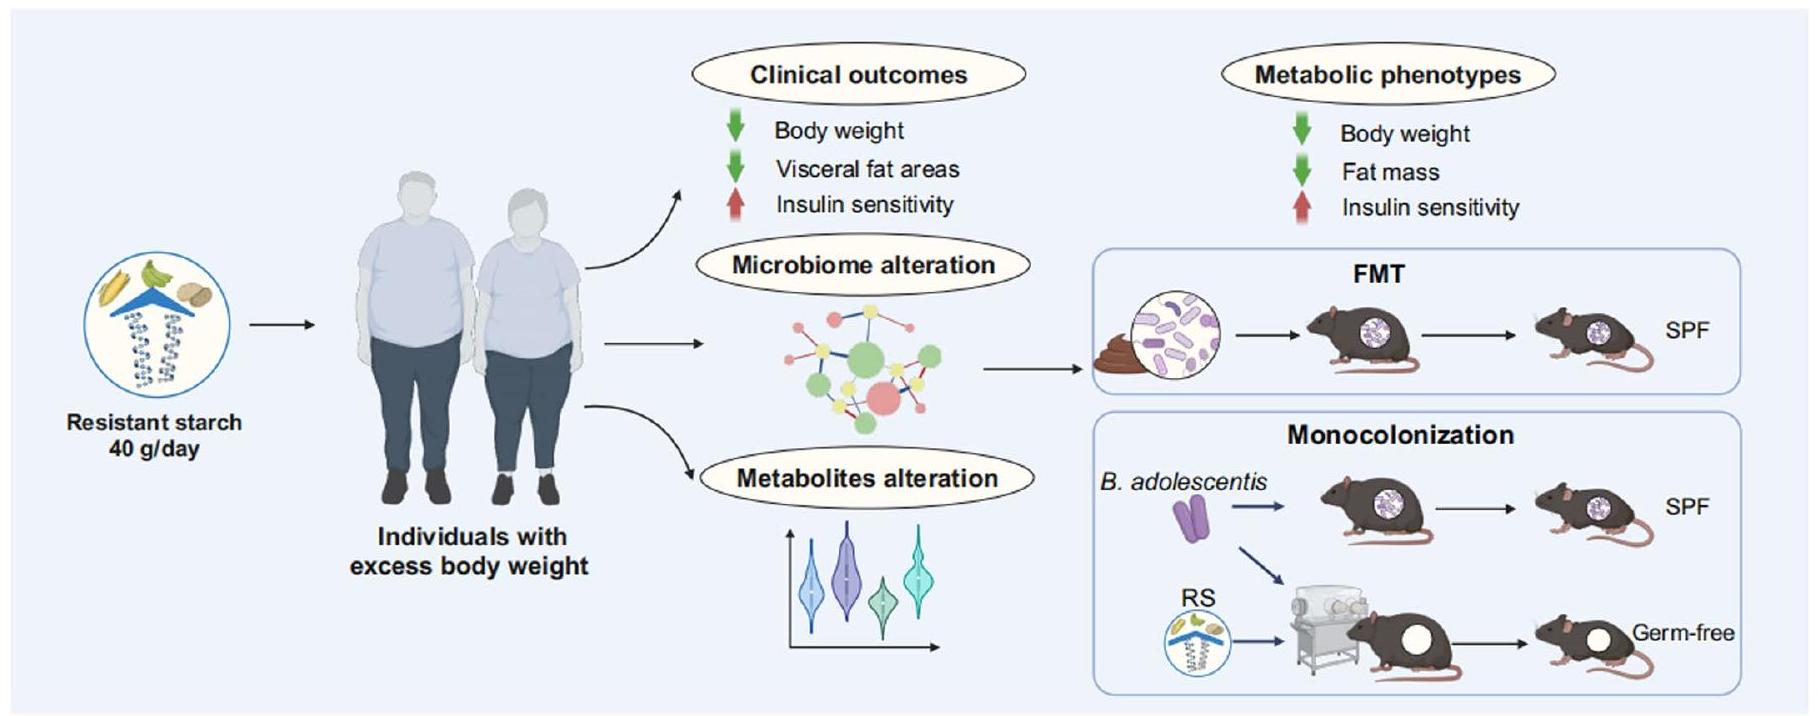
تشير الأدلة الناشئة إلى أن تعديل ميكروبيوم الأمعاء بواسطة الألياف الغذائية قد يقدم حلولًا للاضطرابات الأيضية. في تجربة عشوائية محكومة بالدواء الوهمي بتصميم متقاطع (ChiCTR-TTRCC-13003333) شملت 37 مشاركًا يعانون من زيادة الوزن أو السمنة، نختبر ما إذا كان النشا المقاوم (RS) كمكمل غذائي يؤثر على النتائج المتعلقة بالسمنة. هنا، نوضح أن مكملات RS لمدة 8 أسابيع يمكن أن تساعد في تحقيق فقدان الوزن (متوسط -2.8 كجم) وتحسين مقاومة الأنسولين لدى الأفراد ذوي الوزن الزائد. ترتبط فوائد RS بتغيرات في تركيب ميكروبيوم الأمعاء. تحمي مكملات بيفيدوبكتيريوم أدوليسنتيس، وهو نوع مرتبط بشكل ملحوظ بتخفيف السمنة لدى المشاركين في الدراسة، الفئران الذكور من السمنة الناتجة عن النظام الغذائي. من الناحية الميكانيكية، تؤدي التغيرات التي يسببها RS في ميكروبيوم الأمعاء إلى تغيير في ملف الأحماض الصفراوية، وتقليل الالتهاب من خلال استعادة الحاجز المعوي، وتثبيط امتصاص الدهون. نوضح أن RS يمكن أن يسهل فقدان الوزن على الأقل جزئيًا من خلال B. أدوليسنتيس وأن ميكروبيوم الأمعاء ضروري لعمل RS.

نظرًا لوباء السمنة العالمي الحالي، يتم توجيه الأبحاث نحو استراتيجيات جديدة للوقاية من السمنة وتقليل الوزن. هذا أمر حاسم لأن السمنة تسهم بشكل كبير في الأمراض المصاحبة مثل السكري وأمراض القلب والأوعية الدموية – الأسباب الرئيسية للوفاة العالمية. على العكس، فإن فقدان الوزن يقلل من هذه الأمراض المصاحبة، مما يبرز أهمية إدارة الوزن في الوقاية من هذه الحالات وعلاجها. .
لقد تم التعرف بشكل متزايد على ميكروبيوم الأمعاء كمنظم مهم لفيزيولوجيا المضيف والفيزيولوجيا المرضية . على وجه التحديد، أفادت الدراسات السابقة أن ميكروبيوم الأمعاء ينظم الالتهاب، وتخزين الدهون، واستقلاب الجلوكوز . على الرغم من أن نتائج زراعة الميكروبات البرازية (FMT) من متبرعين أصحاء إلى الأفراد الذين يعانون من السمنة كانت غير متسقة أو قصيرة الأجل ، فإن دمج
التدخل الغذائي مع FMT يمكن أن يؤدي إلى تغييرات إيجابية في ميكروبيوم المستلمين وتحسين النتائج السريرية . وبالتالي، قد يكون التلاعب العقلاني بميكروبيوم الأمعاء من خلال التدخلات الغذائية استراتيجية واعدة لمكافحة السمنة .
تزيد البريبايوتيك، بما في ذلك البوليسكاريد، والأوليجوسكاريد، وغيرها من الألياف الغذائية القابلة للتخمر، من كمية ميكروبيوم الأمعاء المفيد، وخاصة بعض أنواع بيفيدوبكتيريوم ولبتوباكيلوس. تقلل هذه البكتيريا من أعداد مسببات الأمراض، وتقوي الحاجز المعوي، وتخفف من الاستجابة الالتهابية . علاوة على ذلك، يمكن تصميم الوجبات الخفيفة التي تحتوي على تحضيرات ألياف مختلفة لتغيير الوظائف المرتبطة بعناصر معينة من الميكروبيوم ; ومع ذلك، كانت معظم دراسات البريبايوتيك قائمة على الارتباطات دون إثبات رابط سببي بين تعديل ميكروبيوم الأمعاء و
الآثار المفيدة الملحوظة على الأيض . تعتبر الرؤى من كل من التجارب البشرية والدراسات الميكانيكية في الحيوانات الجنوطوبية ضرورية لإثبات السببية بين التغيرات في الميكروبيوم والاستجابات البيولوجية للمضيف. علاوة على ذلك، تعتبر هذه الدراسات حيوية لفهم الآليات التي تربط التغيرات في الميكروبيوم بالمزايا الفسيولوجية للبريبايوتيك أو غيرها من الألياف الغذائية القابلة للتخمر .
يشير RS إلى نوع من الألياف الغذائية القابلة للتخمر التي لا يمكن هضمها بواسطة الأميلاز البشري في الأمعاء الدقيقة وتتحرك إلى القولون، حيث تخضع للتخمر بواسطة ميكروبيوم الأمعاء . أظهرت الدراسات في القوارض أن RS يمكن أن يؤدي إلى انخفاض في إجمالي دهون الجسم، وخاصة الدهون الحشوية، على عكس تغذية النشا القابل للهضم . تؤدي الأنظمة الغذائية منخفضة البروتين وعالية الكربوهيدرات إلى أفضل النتائج الأيضية عندما يتكون مكون الكربوهيدرات من RS في الفئران ; ومع ذلك، أظهرت البيانات البشرية أنه لم يكن هناك تأثير على الوزن الكلي للأفراد الذين يعانون من متلازمة الأيض بعد تناول RS لفترة تتراوح بين 4 إلى 12 أسبوعًا . كانت الأنظمة الغذائية منخفضة الدهون المدعمة بـ RS لها آثار مفيدة على المضيفين، لكن الأنظمة الغذائية عالية الدهون خففت من تخمر RS والآثار المفيدة . قد يكون هذا تفسيرًا محتملاً لسبب عدم تأثير RS على الوزن في التجارب السريرية الموصوفة أعلاه، حيث لم يكن لدى تلك التجارب السريرية معدل امتثال مرتفع للنظام الغذائي . علاوة على ذلك، فإن هذا يشير إلى الدور الحيوي لميكروبيوم الأمعاء المرتبط بـ RS في الآثار العلاجية لـ RS؛ ومع ذلك، لا يزال من غير الواضح إمكانيات RS كمكون غذائي وظيفي وقابل للتكيف لعلاج السمنة لدى البشر وتعديل الفوائد الأيضية من خلال التغيرات في ميكروبيوم الأمعاء المرتبطة بـ RS. وبالتالي، فإن تجربة قوية في الأفراد البدينين ضرورية لتأكيد الادعاءات حول تأثير RS على جوانب فسيولوجية متنوعة لدى المستهلكين والجرعة المطلوبة . علاوة على ذلك، يجب استخدام نهج متعدد الأوميات ونماذج حيوانات جنوطوبية لربط تأثير RS على المجتمع الميكروبي المعوي واستقلاب المضيف بشكل منهجي وميكانيكي .
هنا قمنا بإجراء تجربة سريرية عشوائية متقاطعة في الأفراد ذوي الوزن الزائد للتحقيق في تأثير RS كمكمل غذائي على السمنة وأنماط الأيض الأخرى. كانت التجربة دراسة تغذية تقدم أنظمة غذائية متوازنة ومتساوية الطاقة. تم إجراء تحليلات الميتاجينوميات والميتابولوميات لتقييم تأثير RS على تركيب ووظيفة ميكروبيوم الأمعاء. بالإضافة إلى ذلك، قمنا بتحليل تأثير ميكروبيوم الأمعاء المعدل بواسطة RS المنقول من متبرعين بشريين مختارين إلى الفئران المعالجة بالمضادات الحيوية على سمنة المضيف واستقلاب الجلوكوز، كما استكشفنا الآليات الكامنة وراء المزايا الأيضية التي يمنحها ميكروبيوم الأمعاء من خلال RS.

النتائج

يسهل تدخل RS فقدان الوزن

كانت التحقيق تجربة عشوائية محكومة بالدواء الوهمي، مزدوجة التعمية، بتصميم متقاطع (ChiCTR-TTRCC-13003333)، تشمل 37 مشاركًا (متوسط العمر سنة). كان لدى المشاركين مؤشر كتلة الجسم (BMI) و/أو محيط الخصر المتزايد ( للرجال و للنساء). لم يكن لدى أي منهم اضطرابات مزمنة، أو علاجات جارية تؤثر على استقلاب الجلوكوز أو
استخدام حديث للمضادات الحيوية أو البروبيوتيك (خلال 3 أسابيع). شملت مدة الدراسة التي استمرت 20 أسبوعًا فترتين من التدخل لمدة 8 أسابيع، واحدة لكل من الذرة عالية الأميلوز (HAM-RS2) (RS، ، تحتوي على 40 جرام RS) والنشا الضابط (CS) (AMIOCA) ( ، 72 جرام، أميليوبكتين، تحتوي على 0 جرام RS، مع إمداد طاقة متساوي) وفترة غسيل مدتها 4 أسابيع بين التدخلات (الشكل 1a). تم تخصيص المشاركين في الدراسة عشوائيًا إلى مجموعتين: (1) RS-Washout-CS أو (2) CS-Washout-RS. تم توفير النشا كمسحوق في أكياس مسبقة التعبئة ليتم خلطها مع 300 مل من الماء. تناول كل مشارك كيسًا واحدًا مرتين في اليوم، قبل الوجبات. طوال التجربة، التي تشمل فترة التحضير، وفترتين من التدخل وفترة الغسيل المتداخلة، قدمنا نظامًا غذائيًا متوازنًا ومتساوي الطاقة (ثلاث وجبات في اليوم)، وفقًا للإرشادات الصينية والأمريكية للوقاية وإدارة البالغين الذين يعانون من زيادة الوزن والسمنة (التفاصيل في بروتوكول الدراسة من المعلومات التكميلية) . لم يظهر المشاركون أي اختلاف في تخطي الوجبات أو استهلاك النشا بين تدخلات RS وCS، مما يشير إلى عدم وجود اختلاف في الامتثال الغذائي بين تدخلات RS وCS. باستثناء الاختلافات في تناول الألياف الغذائية (RS مقابل CS، جرام مقابل كانت الطاقة الإجمالية المستهلكة ونسبة المغذيات الكبيرة مشابهة خلال فترات التدخل RS أو CS (الجدول التكميلي 1). في المجموع، أنهى 37 مشاركًا، بما في ذلك 22 ذكرًا و15 أنثى، الدراسة وتم تضمينهم في التحليلات (الجدول 1 والشكل الممتد 1). أُجريت الدراسة في شنغهاي، الصين من 3 يوليو 2013 إلى 14 أكتوبر 2016 ولم تُبلغ عن أي آثار جانبية معوية، مثل الغثيان أو القيء أو الانتفاخ أو زيادة حركة الأمعاء أو تغيير في تكرار البراز.
قمنا بمقارنة التغيرات الفعلية في المعايير الأنثروبومترية والمؤشرات البيوكيميائية بين التدخلات (RS مقابل CS) والتغير داخل المجموعة قبل وبعد التدخل باستخدام نموذج مختلط خطي تم تعديله حسب ترتيب التدخل (الجدول 1 والجدول التكميلي 2). كان الوزن الجسماني الناتج الأساسي قد انخفض بشكل كبير بعد تدخل RS، وكان التغير المطلق الصافي بعد تدخل RS بالنسبة لتدخل CS هو -2.81 كجم. إلى )، في حين لم يُلاحظ أي تغيير كبير بعد تدخل CS (الشكل 1ب). علاوة على ذلك، انخفضت كتلة الدهون ومحيط الخصر بشكل كبير بعد تدخل RS مقارنة بتدخل CS (الشكل 1ج، د). خلال فترة تدخل RS، انخفض وزن الجسم ومحيط الخصر وكتلة الدهون لدى المشاركين بشكل كبير اعتبارًا من الأسبوع الثاني. كانت مناطق الدهون الحشوية (VFA) ومناطق الدهون تحت الجلد (SFA)، التي تم قياسها بواسطة التصوير بالرنين المغناطيسي البطني (MRI)، أقل بعد استهلاك RS مقارنة بتلك التي تلت استهلاك CS ( و ، على التوالي؛ الشكل 1e-g). بغض النظر عما إذا كان في مجموعة RS-Washout-CS أو مجموعة CS-Washout-RS، لوحظت انخفاضات كبيرة في وزن الجسم وغيرها من النتائج المتعلقة بالسمنة بعد تدخل RS (جميع في مجموعة RS-Washout-CS، أظهرت النتائج المتعلقة بالسمنة عودة إلى مستويات الخط الأساسي بعد فترة الغسيل (الجدول التكميلي 3 والشكل البياني الممتد 2a-e). علاوة على ذلك، أظهر تحليل التباين ثنائي الاتجاه (ANOVA) أن
الشكل 1| تخفيف السمنة بعد تدخل RS لمدة 8 أسابيع في الأفراد ذوي الوزن الزائد. أ، مخطط التجربة السريرية. بعد التسجيل، فترة العشوائية وفترة التحضير، استهلك المشاركون إما RS أو CS بالتناوب ويفصل بينهما فترة غسل. خلال التجربة بأكملها، تم تزويد جميع المشاركين بأنظمة غذائية متطابقة. يتم عرض التقييمات في كل زيارة في المخطط. ب-د، تدخل RS قلل بشكل كبير من الوزن (ب)، الكتلة الدهنية (ج) ومحيط الخصر (د). هـ، و، تغيير VFA و SFA تم تقييمه بواسطة التصوير بالرنين المغناطيسي. ز، تصوير بالرنين المغناطيسي البطني التمثيلي للمشاركين قبل (يسار) وبعد (يمين) تدخل RS لمدة 8 أسابيع. التصوير بالرنين المغناطيسي الخام (أعلى) والمحدد (أسفل) عند مستوى السرة. الأصفر يمثل SFA والأحمر يمثل VFA. ح، تغيير GIR تم تقييمه بواسطة قفل هايبر إنسولينيك-يوغليكي. ط، تغيير مستوى TNF في المصل. مستويات. ج، تغيير في مستوى IL-1 في المصل المستويات. ك، الإخراج اليومي للدهون البرازية، بما في ذلك NEFA و TG و TC بعد التدخلات التي استمرت 8 أسابيع مع RS أو CS.I، تغيير في مصل الدم
فرق كبير في وزن الجسم ونتائج السمنة المرتبطة (كتلة الدهون، محيط الخصر و VFA) على التدخل ( ولم يكن هناك تأثير ملحوظ للترتيب أو تفاعل ترتيب التدخل. أظهرت هذه النتائج أن تدخل RS لمدة 8 أسابيع قلل من الدهون البطنية لدى الأفراد ذوي الوزن الزائد.
علاوة على ذلك، تحسنت قدرة الجسم على تحمل الجلوكوز بشكل ملحوظ بعد تدخل RS (الشكل 2f، g من البيانات الموسعة). كانت تركيزات الأنسولين بعد 120 دقيقة من اختبار تحمل الوجبة (MTT) لدى المشاركين بعد
كانت تدخلات RS أقل بكثير من تلك التي حدثت بعد تدخل CS (الشكل 2h من البيانات الموسعة)؛ ومع ذلك، لم يُحدث تدخل CS أي اختلافات في مستويات الجلوكوز والأنسولين مقارنة بالقيم الأساسية (الشكل 2f,h من البيانات الموسعة). قمنا أيضًا بتقييم حساسية الأنسولين من خلال استخدام مشبك هايبر أنسولينيك-يوغليكي ووجدنا أن معدل ضخ الجلوكوز (GIR) قد زاد بشكل كبير بعد تدخل RS (مع زيادة متوسطة قدرها إلى 2.10) مقارنة بتدخل CS ( ) (الشكل 1h)، مما يوضح
e

د
ج

ف
ح
أنا
ج
ك
أنا
م
الجدول 1 | ملخص المعايير السريرية لمشاركي الدراسة قبل وبعد تدخل CS أو RS
المعلمات السريرية CSOW CS 8W RS OW RS 8W قيمة P قيمة P قيمة P قيمة P
مؤشرات مرتبطة بالسمنة
وزن الجسم (كجم) 0.328 0.339 <0.001 <0.001
مؤشر كتلة الجسم (BMI) ) 0.361 0.422 <0.001 <0.001
FM (كجم) 0.486 0.136 <0.001 <0.001
FFM (كجم) 0.999 0.999 0.011 0.029
TBW (كجم) 0.999 0.999 0.101 0.155
نسبة الدهون 0.999 0.999 0.101 0.117
محيط الخصر (سم) 0.731 0.999 <0.001 <0.001
محيط الورك (سم) 0.999 0.372 <0.001 <0.001
نسبة الخصر إلى الورك 0.999 0.999 <0.001 0.01
VFA ( ) 0.999 0.999 <0.001 <0.001
SFA ( ) 0.999 0.999 <0.001 0.004
المعلمات الأنثروبومترية
العمر (بالسنوات)
الجنس (ذكر:أنثى) 22:15
ضغط الدم الانقباضي (مم زئبق) 0.999 0.999 0.999 0.918
ضغط الدم الانبساطي ( مم زئبق ) 0.999 0.999 0.999 0.342
إنزيمات الكبد ووظيفة الكلى
ALT ( ) 16.80 (12.30, 29.00) ٢٠.٠٠ (١٠.٢٨، ٣٠.٢٥) 16.00 (12.00، 30.00) 15.00 (12.00, 22.50) 0.999 0.999 0.432 0.041
AST ( ) 18.60 (17.20، 22.00) 19.76 (16.03, 24.80) 19.00 (17.00، 22.50) 17.00 (14.50، 21.00) 0.999 0.999 0.058 0.022
GGT ( ) ٢٤.٨٠ (١٧.٥٠، ٣٥.٠٠) 25.20 (18.17, 34.26) 25.00 (18.00, 36.00) ٢١.٠٠ (١٦.٠٠، ٣٥.٥٠) 0.999 0.999 0.033 0.03
خبز ) 0.999 0.999 0.999 0.149
0.999 0.999 0.999 0.809
ملفات الدهون
TC (ممول) ) 0.999 0.999 0.008 0.146
تي جي ( ) 1.09 (0.86, 1.68) 1.23 (0.80, 1.52) 1.04 (0.85, 1.64) 1.01 (0.79، 1.38) 0.999 0.999 0.999 0.559
HDL-C (مللي مول) ) 0.999 0.999 0.999 0.456
LDL-C (مللي مول) ) 0.999 0.999 0.424 0.482
السيتوكينات الإفرازية
A-FABP ( ) ٣٥.٤٩ (٣٠.٧١، ٤٤.٨٢) ٣٦.٨٣ (٢٣.٣٥، ٤٦.٩٩) ٣٧.٤٧ (٢٩.٣٣، ٤٧.٨١) 31.12 (23.74, 45.12) 0.999 0.999 0.072 0.12
أديبونيكتين ) 9.34 (7.49, 13.86) 9.38 (7.01, 12.39) 9.21 (7.04, 13.13) 10.46 (7.38, 13.68) 0.999 0.999 0.376 0.038
FGF21 ( ) 167.61 (99.71, 211.00) 172.07 (104.63, 237.70) 188.46 (113.19, 224.07) 151.74 (51.62, 216.98) 0.999 0.999 <0.001 0.002
عوامل مرتبطة بالالتهاب
TNF ( ) 0.70 (0.60، 0.81) 0.68 (0.55، 0.86) 0.70 (0.55، 0.82) 0.66 (0.45، 0.72) 0.999 0.999 0.053 0.014
IL-1 ( ) 0.18 (0.13، 0.24) 0.17 (0.10، 0.27) 0.16 (0.11، 0.26) 0.11 (0.06، 0.17) 0.999 0.999 <0.001 0.046
MCP-1 ( ) 673.56 (535.55, 865.83) 630.62 (516.20, 768.22) 626.85 (513.23, 816.09) 631.97 (498.41, 822.20) 0.999 0.999 0.999 0.925
IL-10 ( ) 1.72 (1.58، 2.07) 1.62 (1.49، 1.79) 1.66 (1.52، 1.95) 1.58 (1.48، 1.91) 0.999 0.999 0.999 0.146
IL-6 ( ) 1.08 (0.65, 1.85) 1.12 (0.57, 1.64) 1.08 (0.77, 1.58) 1.05 (0.71, 1.49) 0.999 0.999 0.999 0.689
FM، كتلة الدهون؛ FFM، الكتلة الخالية من الدهون؛ TBW، إجمالي ماء الجسم؛ SBP، ضغط الدم الانقباضي؛ DBP، ضغط الدم الانبساطي؛ ALT، ألانين ترانسأميناز؛ AST، أسبارتات ترانسأميناز؛ GGT، ي-جلوتاميل
تُعبر كمتوسط الانحراف المعياري أو الوسيط (نطاق الربيع الربعي (IQR)). تم تقييم الفروق في المتغيرات الأساسية قبل تدخلات RS و CS باستخدام نموذج مختلط خطي تم تعديله بواسطة

تم تقييم النتائج بين تدخل RS و CS باستخدام نموذج مختلط خطي تم تعديله حسب ترتيب التدخل.
تحسن ملحوظ في حساسية الأنسولين. علاوة على ذلك، لوحظ زيادة كبيرة في مستويات الأديبونيكتين في المصل بعد تدخل RS (الشكل 2i من البيانات الموسعة). بالإضافة إلى ذلك، بعد تدخل RS، لم يكن هناك فرق كبير في إفراز الأنسولين في المرحلة الأولى أو المرحلة الثانية مقارنةً بتدخل CS (الجدول التكميلي 4). تشير جميع هذه النتائج إلى أن تدخل RS لمدة 8 أسابيع قد حسن من تحمل الجلوكوز وحساسية الأنسولين لدى الأفراد ذوي الوزن الزائد.
للتحقيق في الآلية المحتملة التي من خلالها يسهل RS فقدان الوزن، قمنا بتحديد التغيرات في الاستجابة الالتهابية المزمنة منخفضة الدرجة وهضم الدهون المعوية، والتي ترتبط ارتباطًا وثيقًا بالسمنة. مستويات السيتوكينات المؤيدة للالتهابات مثل عامل نخر الورم في المصل (TNF) والإنترلوكين (IL)- كانت النتائج أقل بشكل ملحوظ في المشاركين في الدراسة بعد استهلاك RS مقارنة باستهلاك CS ( و على التوالي)، على الرغم من عدم وجود فرق كبير في مادة جذب المونوسيتات
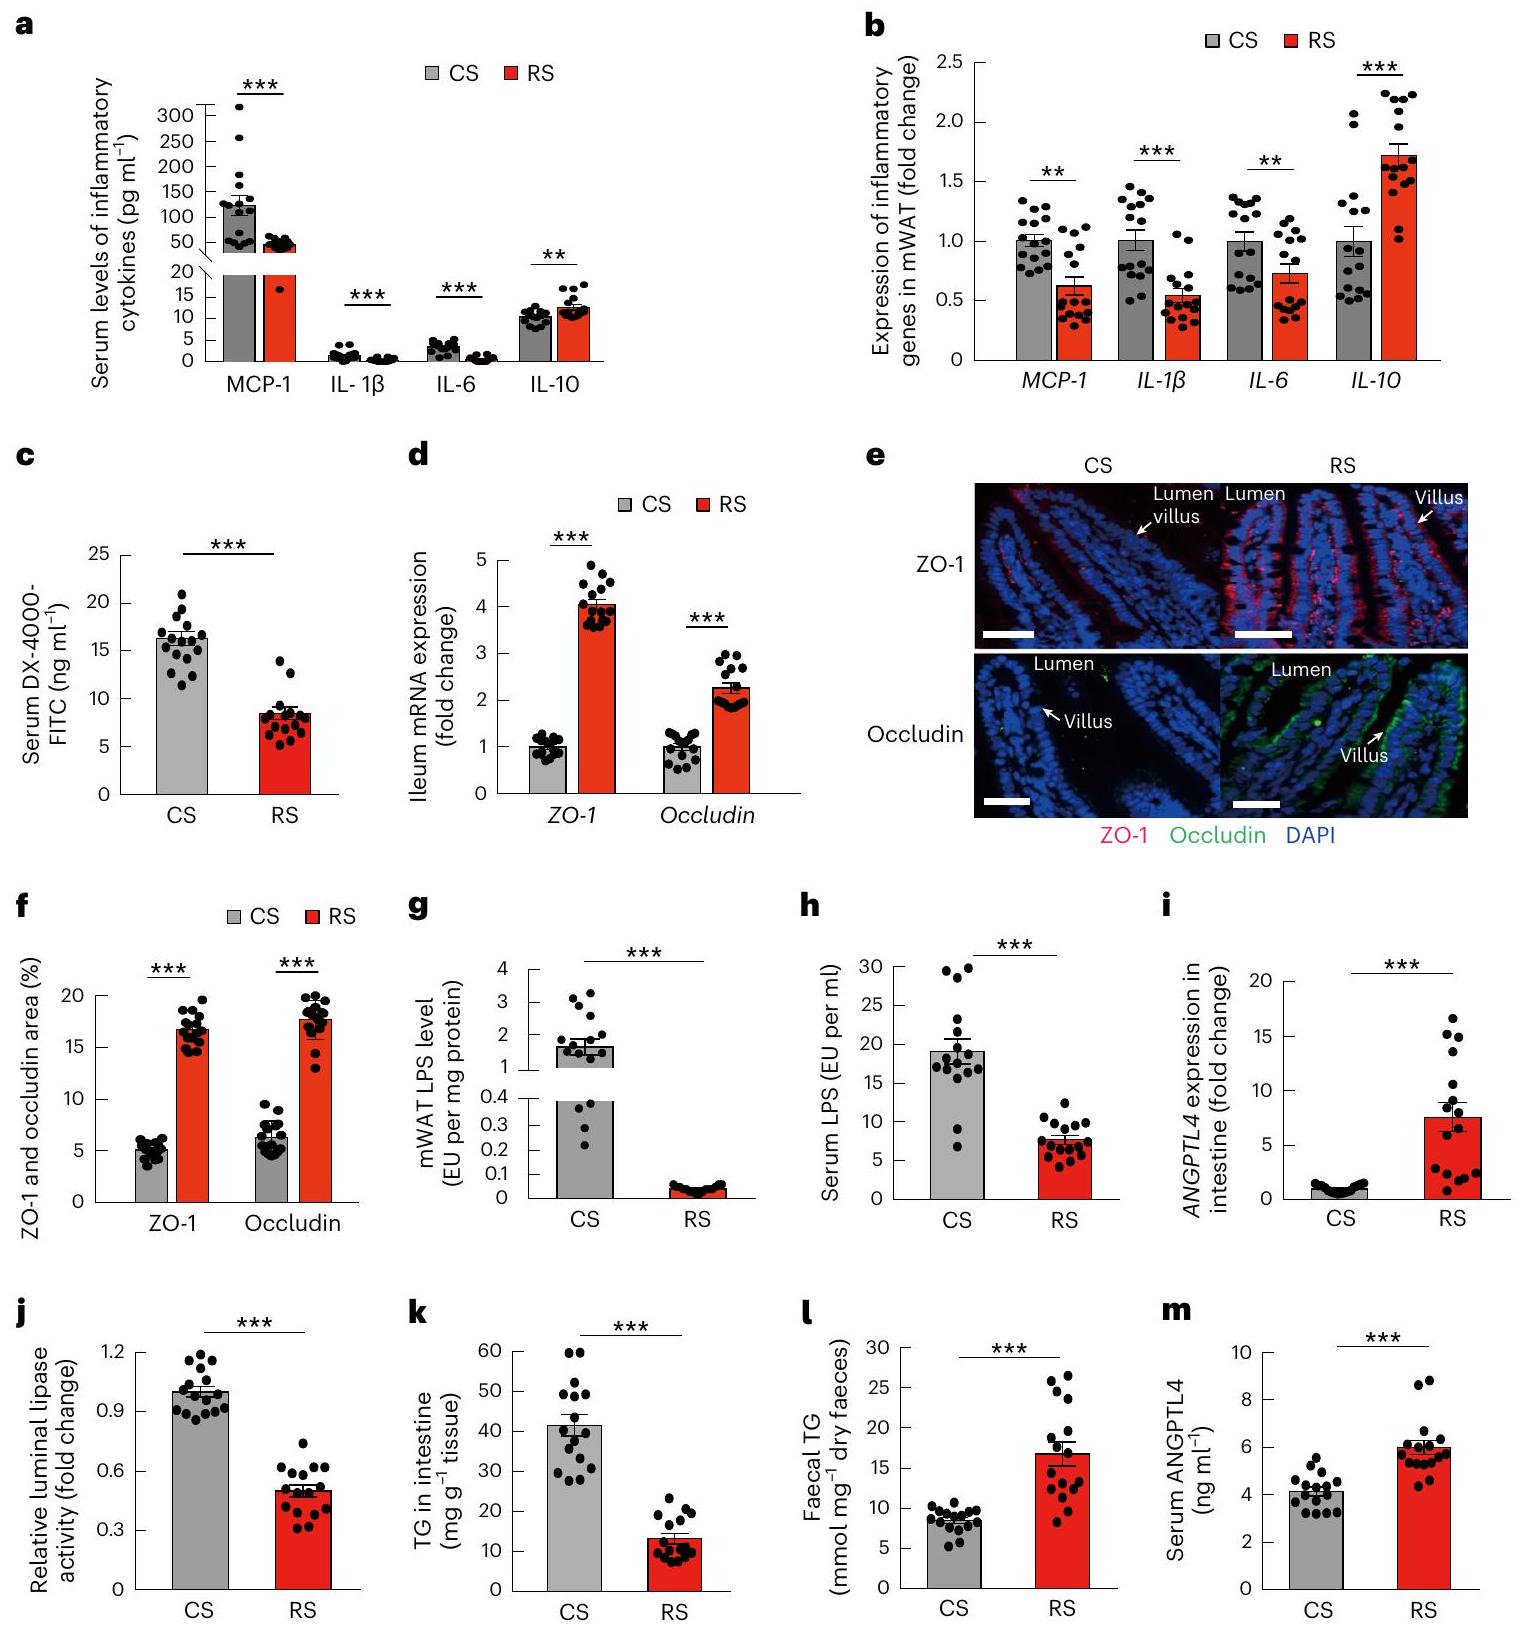
تمت ملاحظة البروتين-1 (MCP-1) وIL-10 وIL-6 خلال استهلاك RS وCS (الشكل 1i وj والجدول 1). علاوة على ذلك، قمنا بقياس الدهون البرازية لمشاركي الدراسة ووجدنا أن الإخراج اليومي للأحماض الدهنية غير الاستيرية (NEFA) والدهون الثلاثية (TGs) والكوليسترول الكلي (TC) كان أعلى بشكل ملحوظ بعد استهلاك RS مقارنة باستهلاك CS (الشكل 1k). نظرًا لعدم وجود فرق كبير في تناول الدهون خلال استهلاك RS وCS (الجدول التكميلي 1)، تشير هذه النتائج إلى أن تدخل RS قد يقلل من امتصاص الدهون من النظام الغذائي. كانت مستويات أنجيوبوينتين-مثل 4 (ANGPTL4)، وهو ارتباط محتمل بين الأمعاء وعمليات الأيض الدهنية، قد زادت بشكل ملحوظ في المشاركين في الدراسة بعد استهلاك RS مقارنة باستهلاك CS (الشكل 11). انخفض عامل نمو الألياف 21 (FGF21) في المصل، والذي تم الإبلاغ عن زيادته في حالة السمنة، بشكل ملحوظ بعد استهلاك RS (الشكل 1m) .

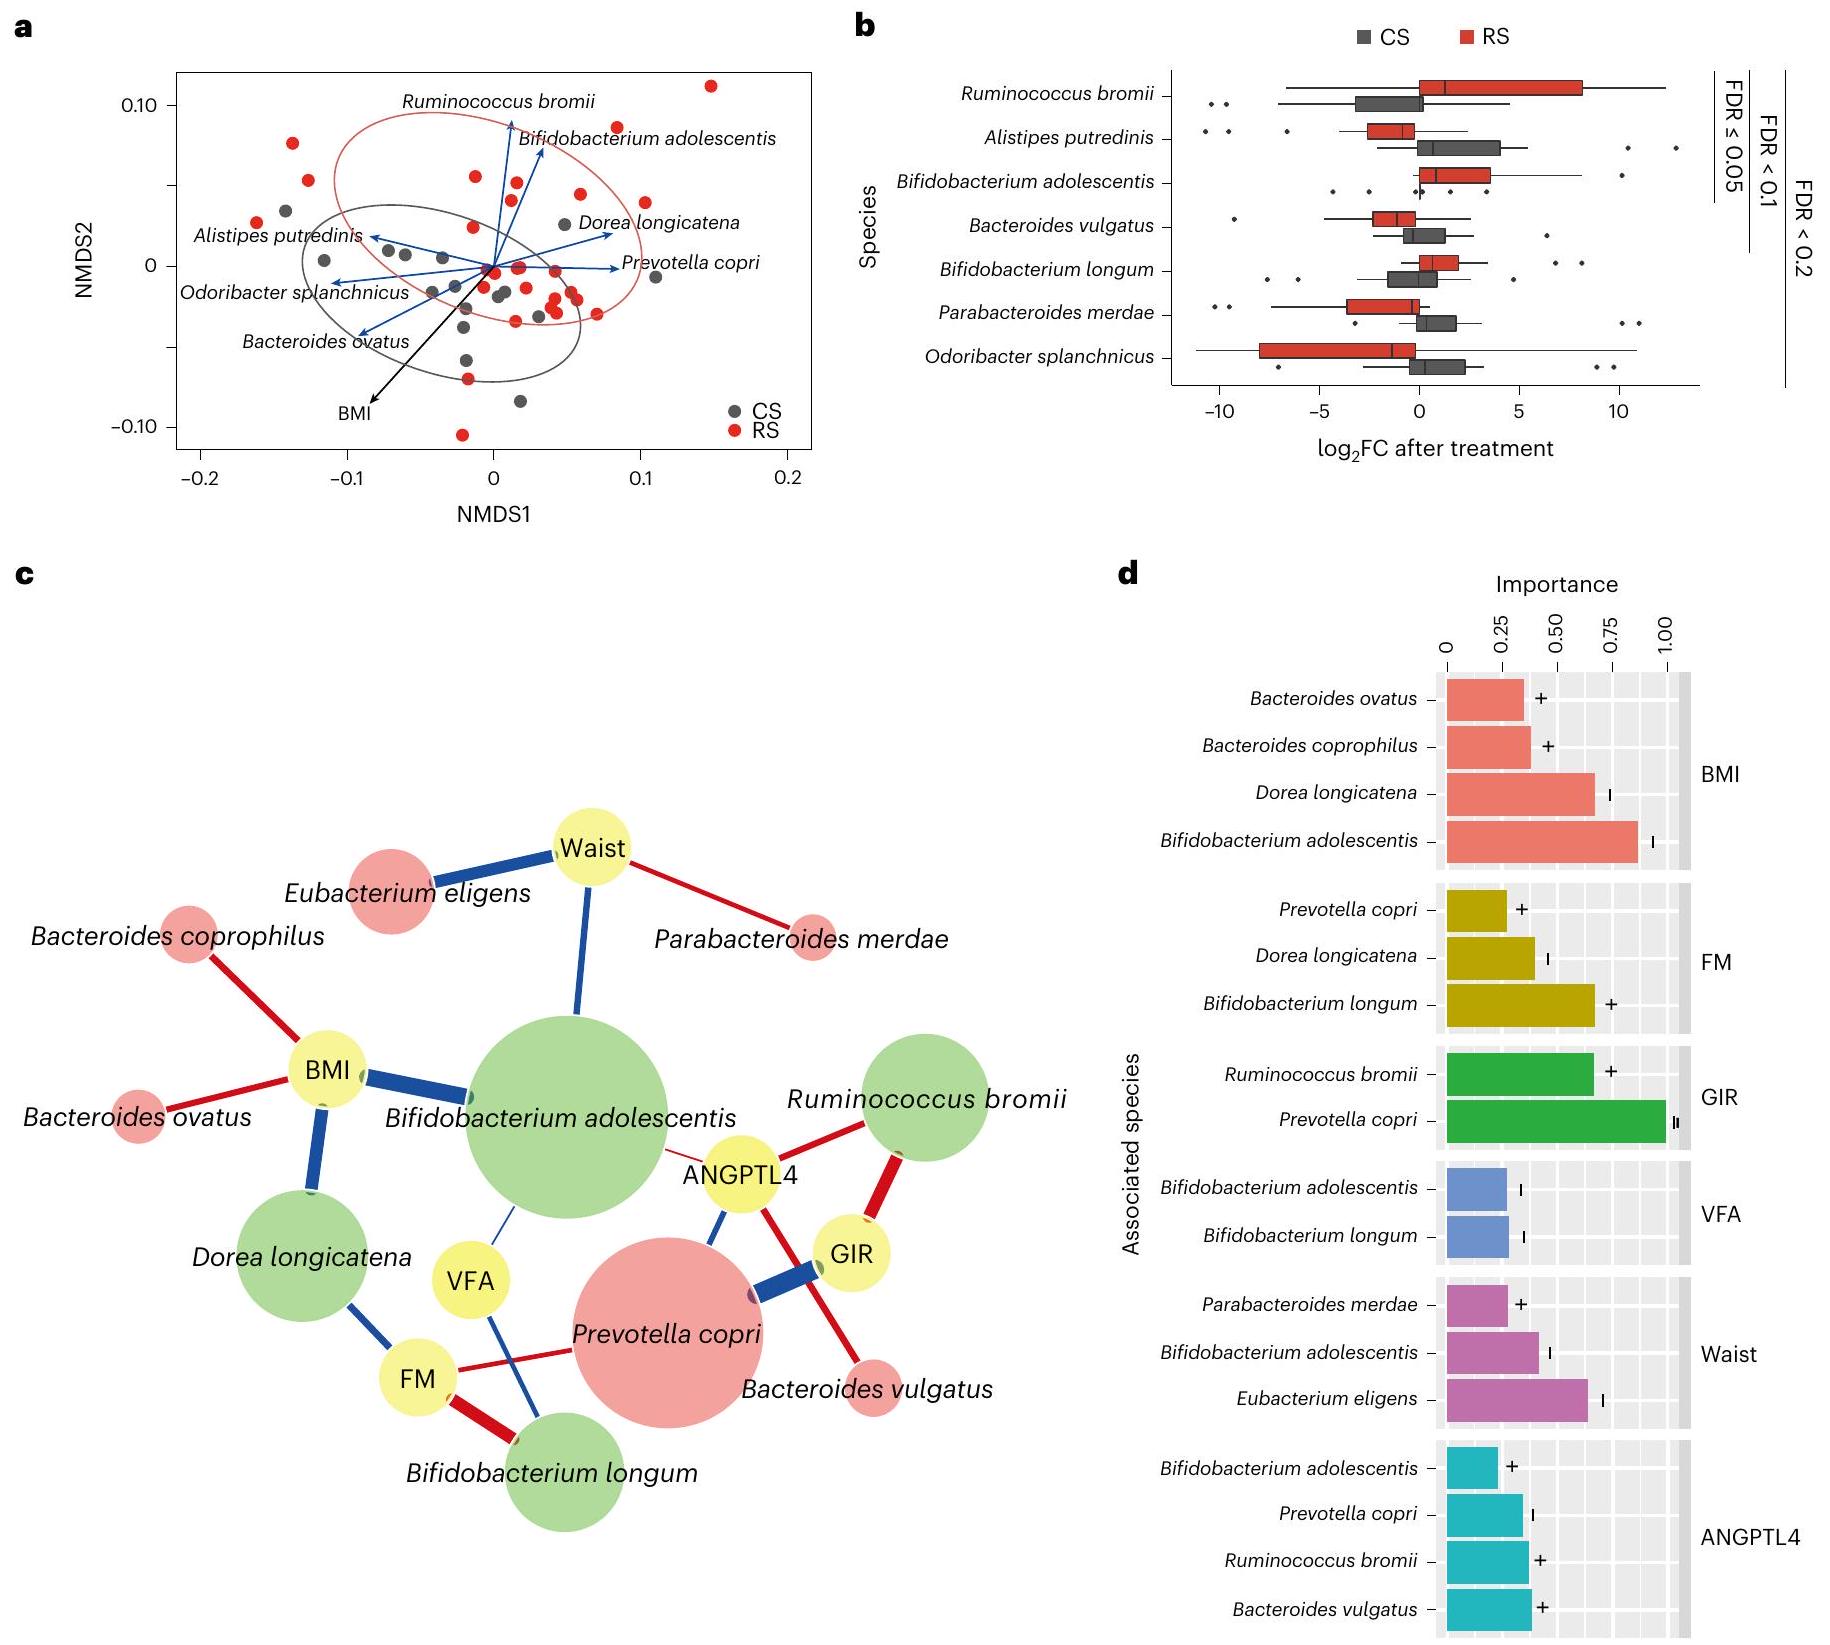
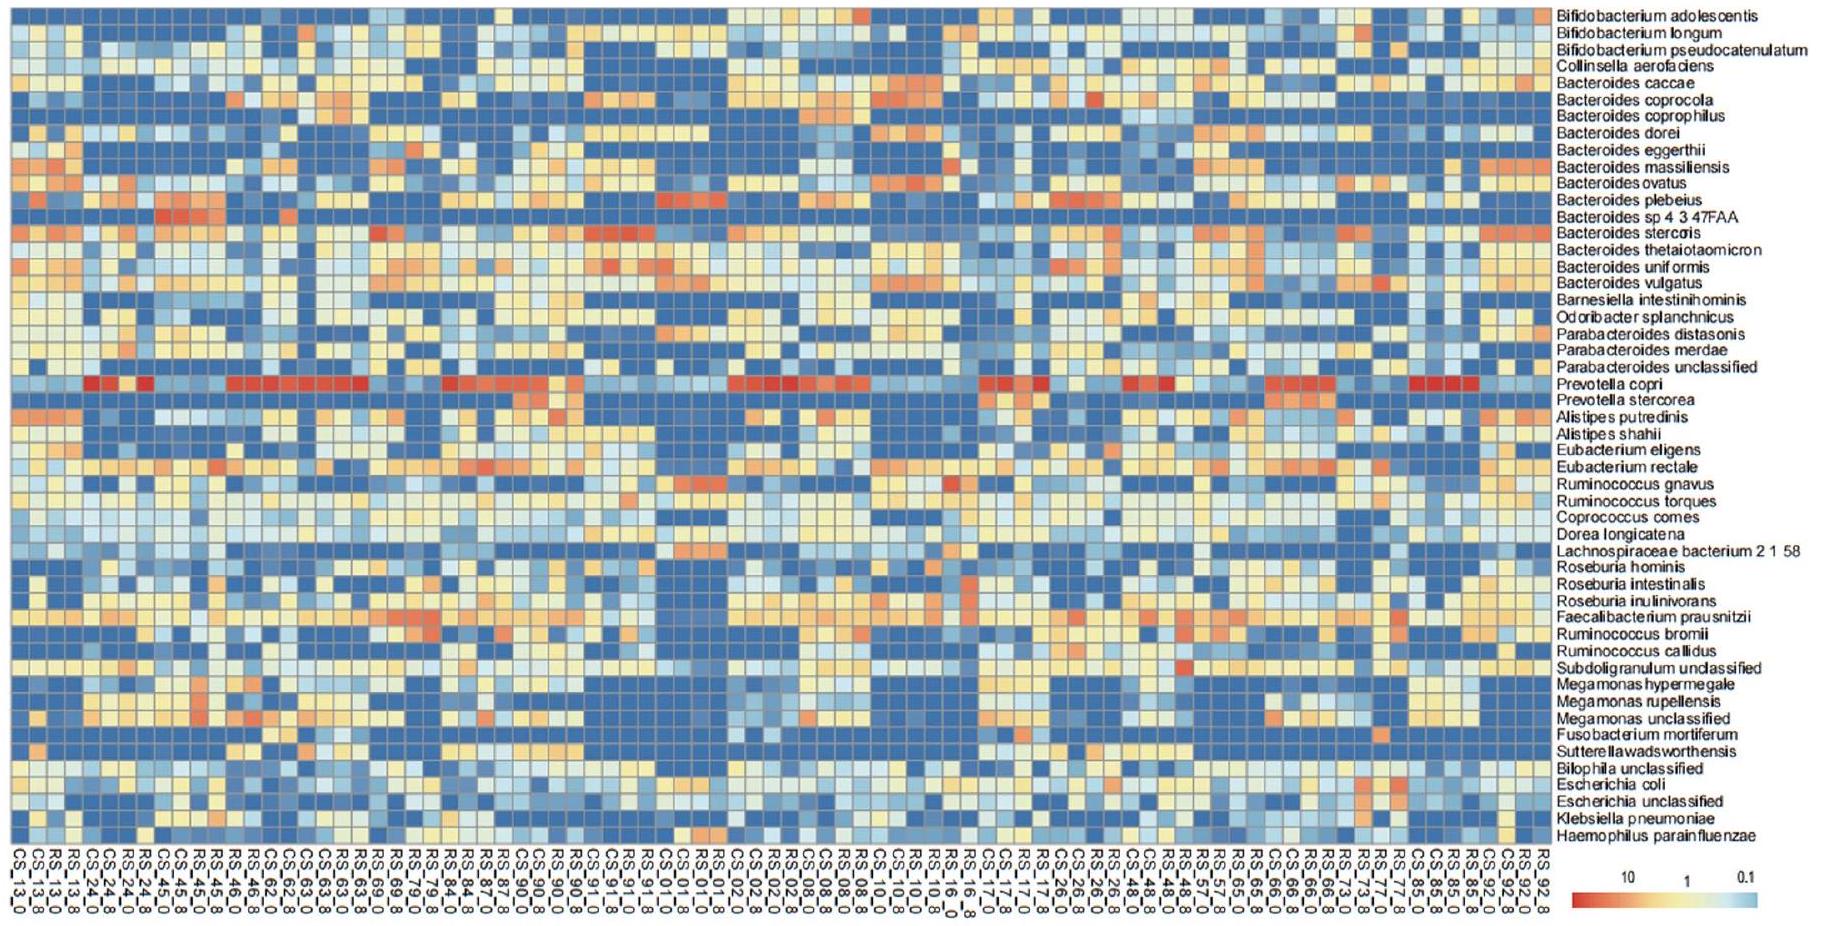
تدخل RS يعيد تشكيل ميكروبيوم الأمعاء

لتحقيق ديناميات ميكروبيوم الأمعاء خلال التدخلات، تم إجراء تسلسل ميتاجينومي بالأسلوب الشامل. كان متوسط الإنتاج لكل عينة 5.74 (انحراف معياري 0.87) Gbp. كشفت ملفات التصنيف على مستوى الأنواع بناءً على أعلى 50 نوعًا من حيث متوسط الوفرة عبر العينات أن Prevotella copri وBacteroides stercoris وFaecalibacterium prausnitzii كانت الأكثر انتشارًا عبر العينات. كانت الأنواع الأخرى موجودة بوفرة أقل بكثير (بمتوسط 1.1% لكل نوع) لمعظم العينات (الشكل 3a من البيانات الموسعة). لتقييم مدى تغير تركيب ميكروبيوم الأمعاء استجابة لتدخل RS، قمنا بحساب مسافة Bray-Curtis بناءً على ملف تنوع الأنواع (كنسبة تغيير في الوفرة بعد التدخل الذي استمر 8 أسابيع) بين العينات باستخدام الإجراءات التالية. كان ملف تنوع الأنواع مكونًا من نسبة تغيير ( ) في الوفرة بعد العلاج لكل نوع. تم تطبيع قيم نسبة التغيير لتتراوح بين 0 و1 مع مجموع يساوي واحد في كل عينة. قمنا أيضًا بحساب مسافة Bray-Curtis بناءً على هذا الملف من تنوع الأنواع. كما هو موضح في مخطط التحجيم متعدد الأبعاد غير المترابط (NMDS) بناءً على مسافة Bray-Curtis، تم فصل عينات RS وCS إلى حد ما، مما يشير إلى أنماط تغير مختلفة بشكل ملحوظ في الميكروبيوم بعد تدخلات RS وCS، على التوالي ( مع اختبار Adonis من VEGAN) (الشكل 2a). تشير هذه النتيجة إلى أن تدخل RS يؤثر على الديناميات ويعيد تشكيل تركيب ميكروبيوم الأمعاء. لم يكن هناك فرق كبير في التركيب الميكروبي بين خط الأساس لتدخل CS وRS (الشكل 3b-e من البيانات الموسعة). وجدنا أن سبعة أنواع كانت مرتبطة بشكل كبير (معدل الاكتشاف الخاطئ (FDR) المعدل بواسطة Benjamini-Hochberg (BH) ) مع ملفات التغير الكلي (لكل من عينات RS وCS) (الشكل 2a). وجدنا أن مؤشر كتلة الجسم (BMI) كان مرتبطًا بشكل كبير ( مع اختبار envfit في حزمة R VEGAN) مع ملفات التغير التصنيفي الكلي (الشكل 2a)، مما يشير إلى أن التغير في وزن الجسم مرتبط بإعادة هيكلة ميكروبيوم الأمعاء.
لتحديد بصمة ميكروبيوم الأمعاء المرتبطة بتدخل RS، قمنا بمقارنة التغيرات في وفرة كل نوع بعد علاجات RS وCS (كنسبة تغيير في الوفرة بعد التدخل الذي استمر 8 أسابيع). أظهرت النتائج أن ثلاثة أنواع، Bifidobacterium adolescentis وBifidobacterium longum وRuminococcus bromii، قد زادت بشكل ملحوظ بعد تدخل RS لكنها ظلت مستقرة أو انخفضت بعد تدخل CS. على العكس، انخفضت أربع أنواع، بما في ذلك Alisipes putredinis وBacteroides vulgatus وOdoribacter splanchnicus وParabacteroides merdae ( , BH FDR مع اختبار Wilcoxon ذو الرتبة الموقعة) بعد علاج RS لكنها ظلت مستقرة أو زادت بعد علاج CS. من بين الأنواع المذكورة، كانت R. bromii وA. putredinis وB. adolescentis هي الأنواع الأكثر تغيرًا بشكل ملحوظ بعد تدخل RS مقارنة بتدخل CS (FDR ) (الشكل 2b والجدول التكميلي 5). لم تتغير الأنواع الأخرى القابلة للتحلل بشكل ملحوظ بعد تدخل RS في هذه الدراسة (الجدول التكميلي 6) .
لتحديد الأنواع المرتبطة بفوائد تدخل RS، قمنا بالتحقيق في ارتباط 12 نوعًا (FDR < 0.3 عبر اختبار Wilcoxon ذو الرتبة المجمعة) مع ستة معلمات متغيرة بشكل كبير للمضيف، بما في ذلك BMI وكتلة الدهون ومحيط الخصر وVFA وGIR ومستويات ANGPTL4 في المصل. قام نموذج خطي عام بتحديد العلاقة بين تغير وفرة الأنواع وتغير الظواهر. تم وصف قوة العلاقة بين الأنواع والظواهر من خلال أهمية المتغيرات في النموذج الخطي بناءً على اختيار النموذج باستخدام معيار معلومات أكايك المصحح (AIC)، الذي حدد الجودة النسبية/الوزن للنموذج الإحصائي المستخدم للبيانات المعطاة. تعكس أهمية المتغير الدعم العام لجميع نماذج الانحدار الخطي الممكنة الموزونة أو نسبة الأوزان الإجمالية لجميع نماذج الانحدار الخطي الممكنة التي تحتوي على هذا المتغير. من بين 12 نوعًا ذات وفرة مختلفة، كان B. adolescentis له أكثر الارتباطات تكرارًا مع الظواهر المختلفة (إجمالي عدد الروابط مع الظواهر) (الشكل 2c). من بين الظواهر، كان BMI وGIR لهما أقوى ارتباط (أهمية متوسطة للأنواع المرتبطة) مع الميكروبات المعوية (الشكل 2d). على مستوى الأنواع الفردية، وجدنا أن زيادة وفرة R. bromii بعد مكملات RS كانت مرتبطة بزيادة في GIR (أهمية 0.67 مع ). مع الزيادة الملحوظة المذكورة أعلاه في . bromii، تشير نتائجنا إلى أن . bromii قد تكون نوعًا رئيسيًا في الاستجابة لتدخل RS، بما يتماشى مع دراسة سابقة . قد تلعب B. adolescentis دورًا حاسمًا في تخفيف السمنة، كما يتضح من ارتباطها القوي مع انخفاض BMI ومحيط الخصر وVFA (أهمية 0.87 و0.47 و0.27 على التوالي؛ ). كما أن زيادة وفرتها كانت مرتبطة أيضًا بزيادة مستويات ANGPTL4 في المصل (أهمية 0.252، )، مما يشير إلى تأثير محتمل على عمليات الأيض الدهنية. كأهم المحللات RS، تم استكشاف وجود R. bromii وB. adolescentis في خط الأساس وعلاقتهما بالنتائج الرئيسية. انخفضت كتلة الدهون لدى الأفراد الإيجابيين لـ B. adolescentis بشكل أكبر وزادت مستويات ANGPTL4 لديهم بشكل أكبر بعد تدخل RS (كلاهما )، مما يوضح أن التركيب الأولي لميكروبيوم الأمعاء، وخاصة . adolescentis، كان مرتبطًا ارتباطًا وثيقًا بفوائد RS (الشكل 4 من البيانات الموسعة). من بين أهم عشرة مسارات متعلقة بالأيض في موسوعة جينات كيوتو (KEGG) التي اختلفت فيها الوفرة بين تدخل RS وCS، انخفضت مسارات أيض حمض اللينوليك (ko00591) وتحلل البيسفينول (ko00363) خلال علاج RS، بينما زادت بشكل ملحوظ في علاج CS (FDR لكلا المسارين) (الشكل 5 من البيانات الموسعة).

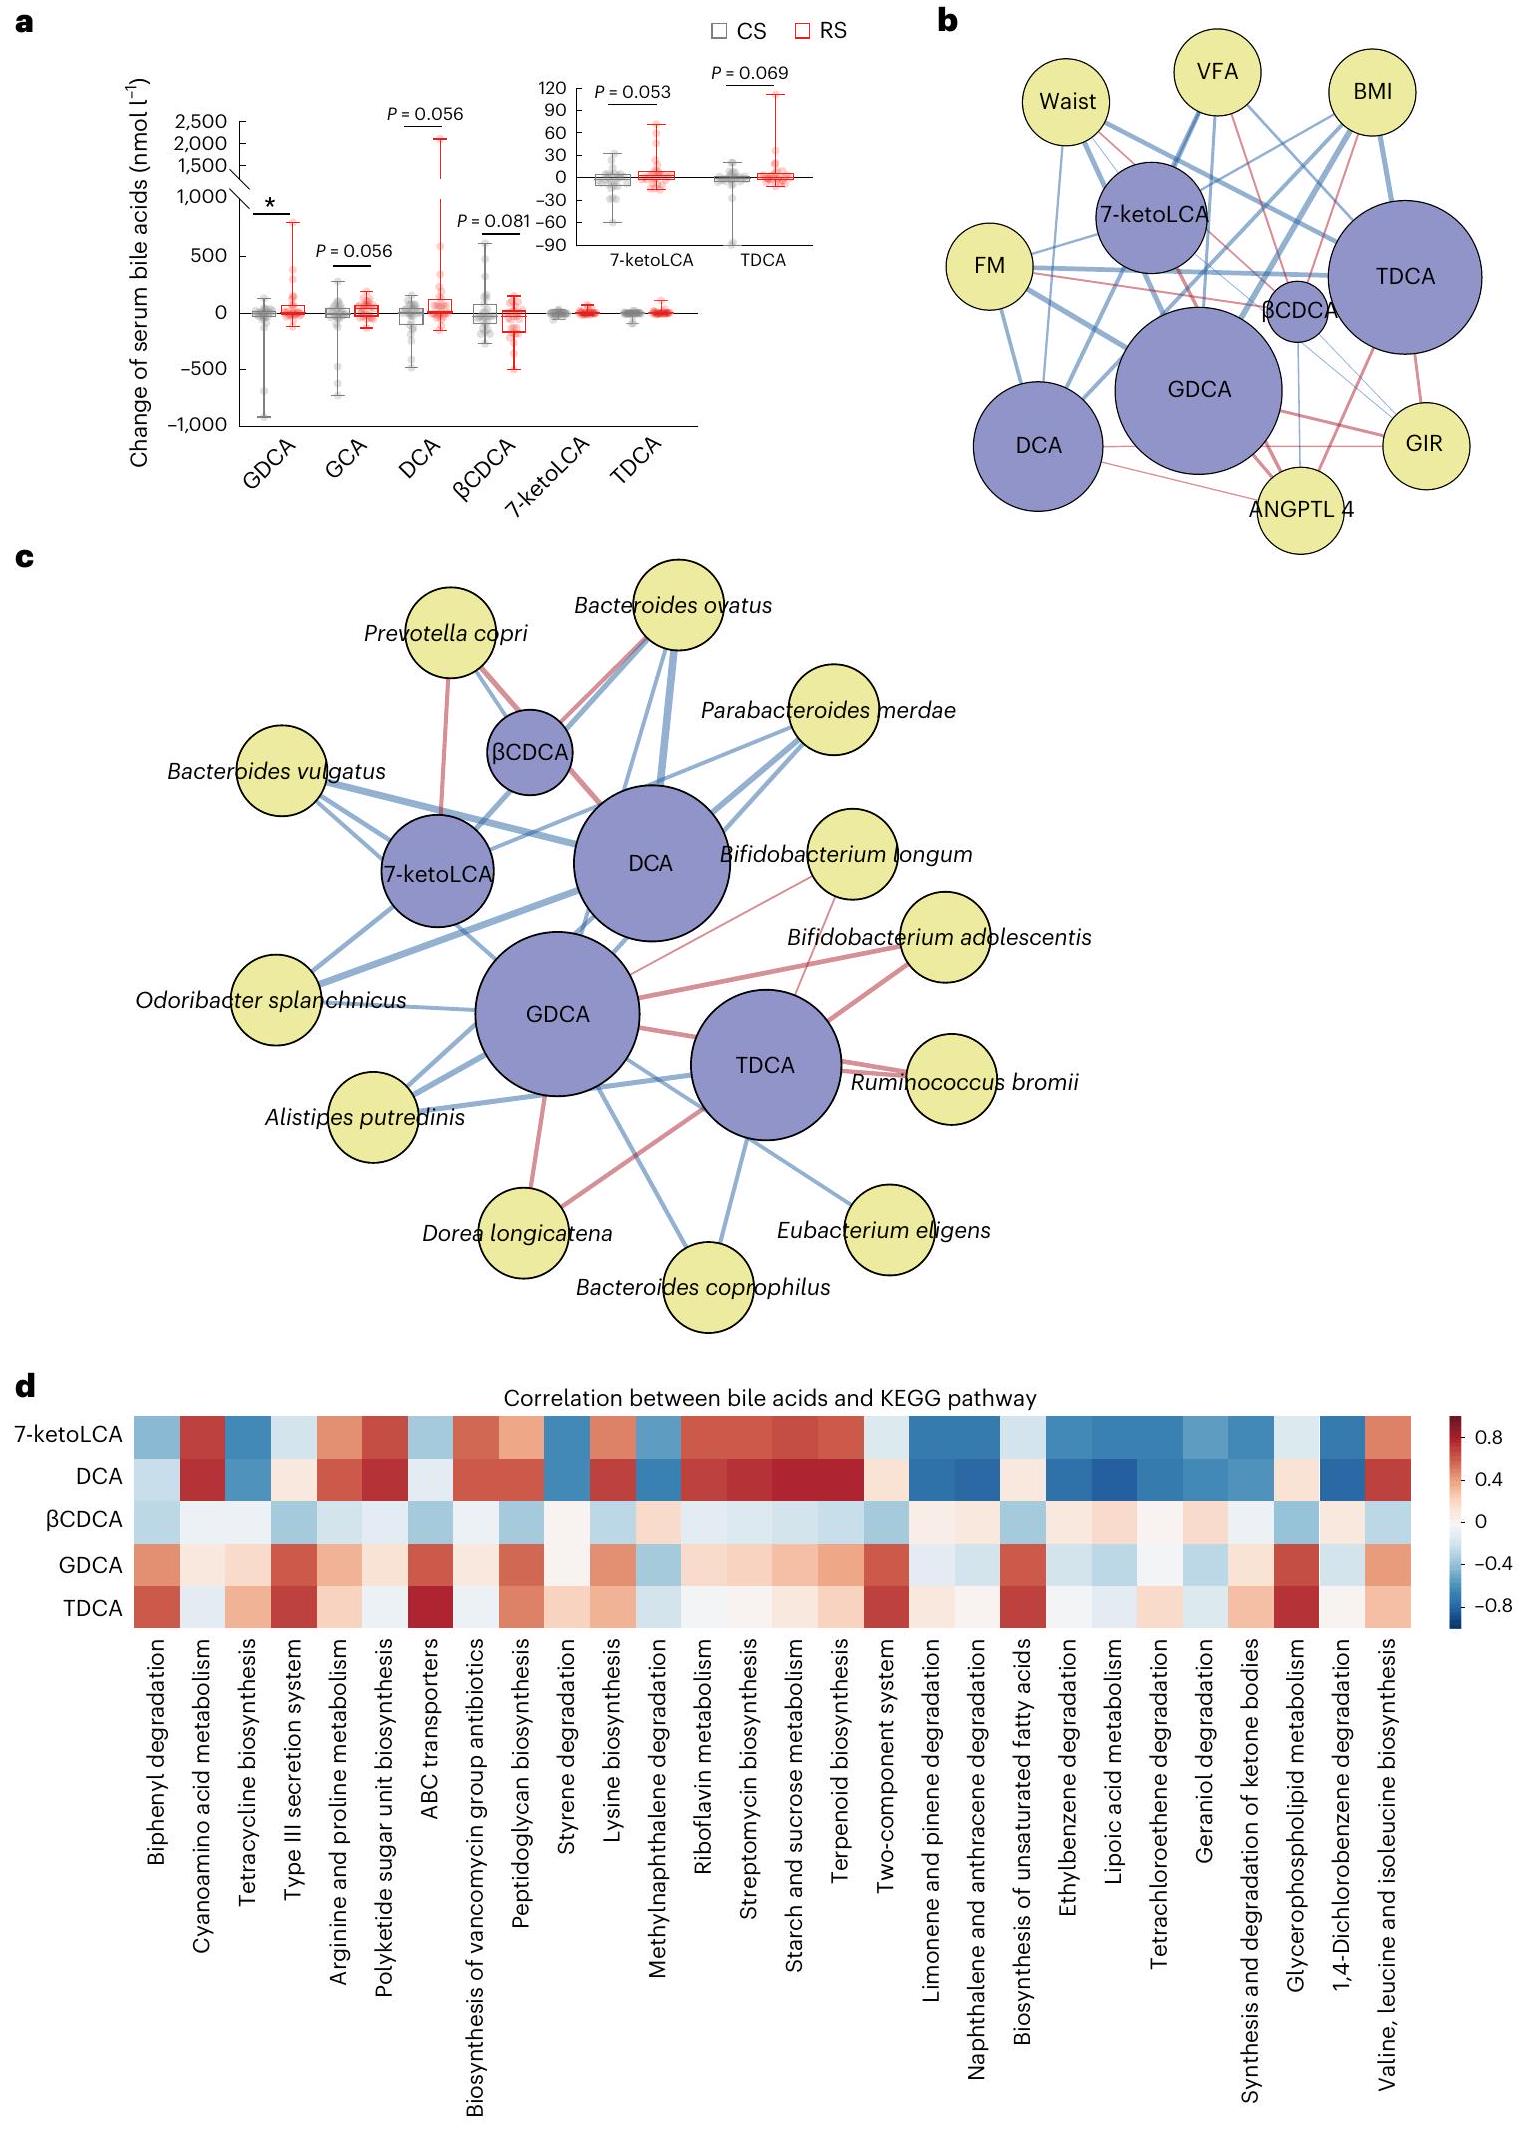
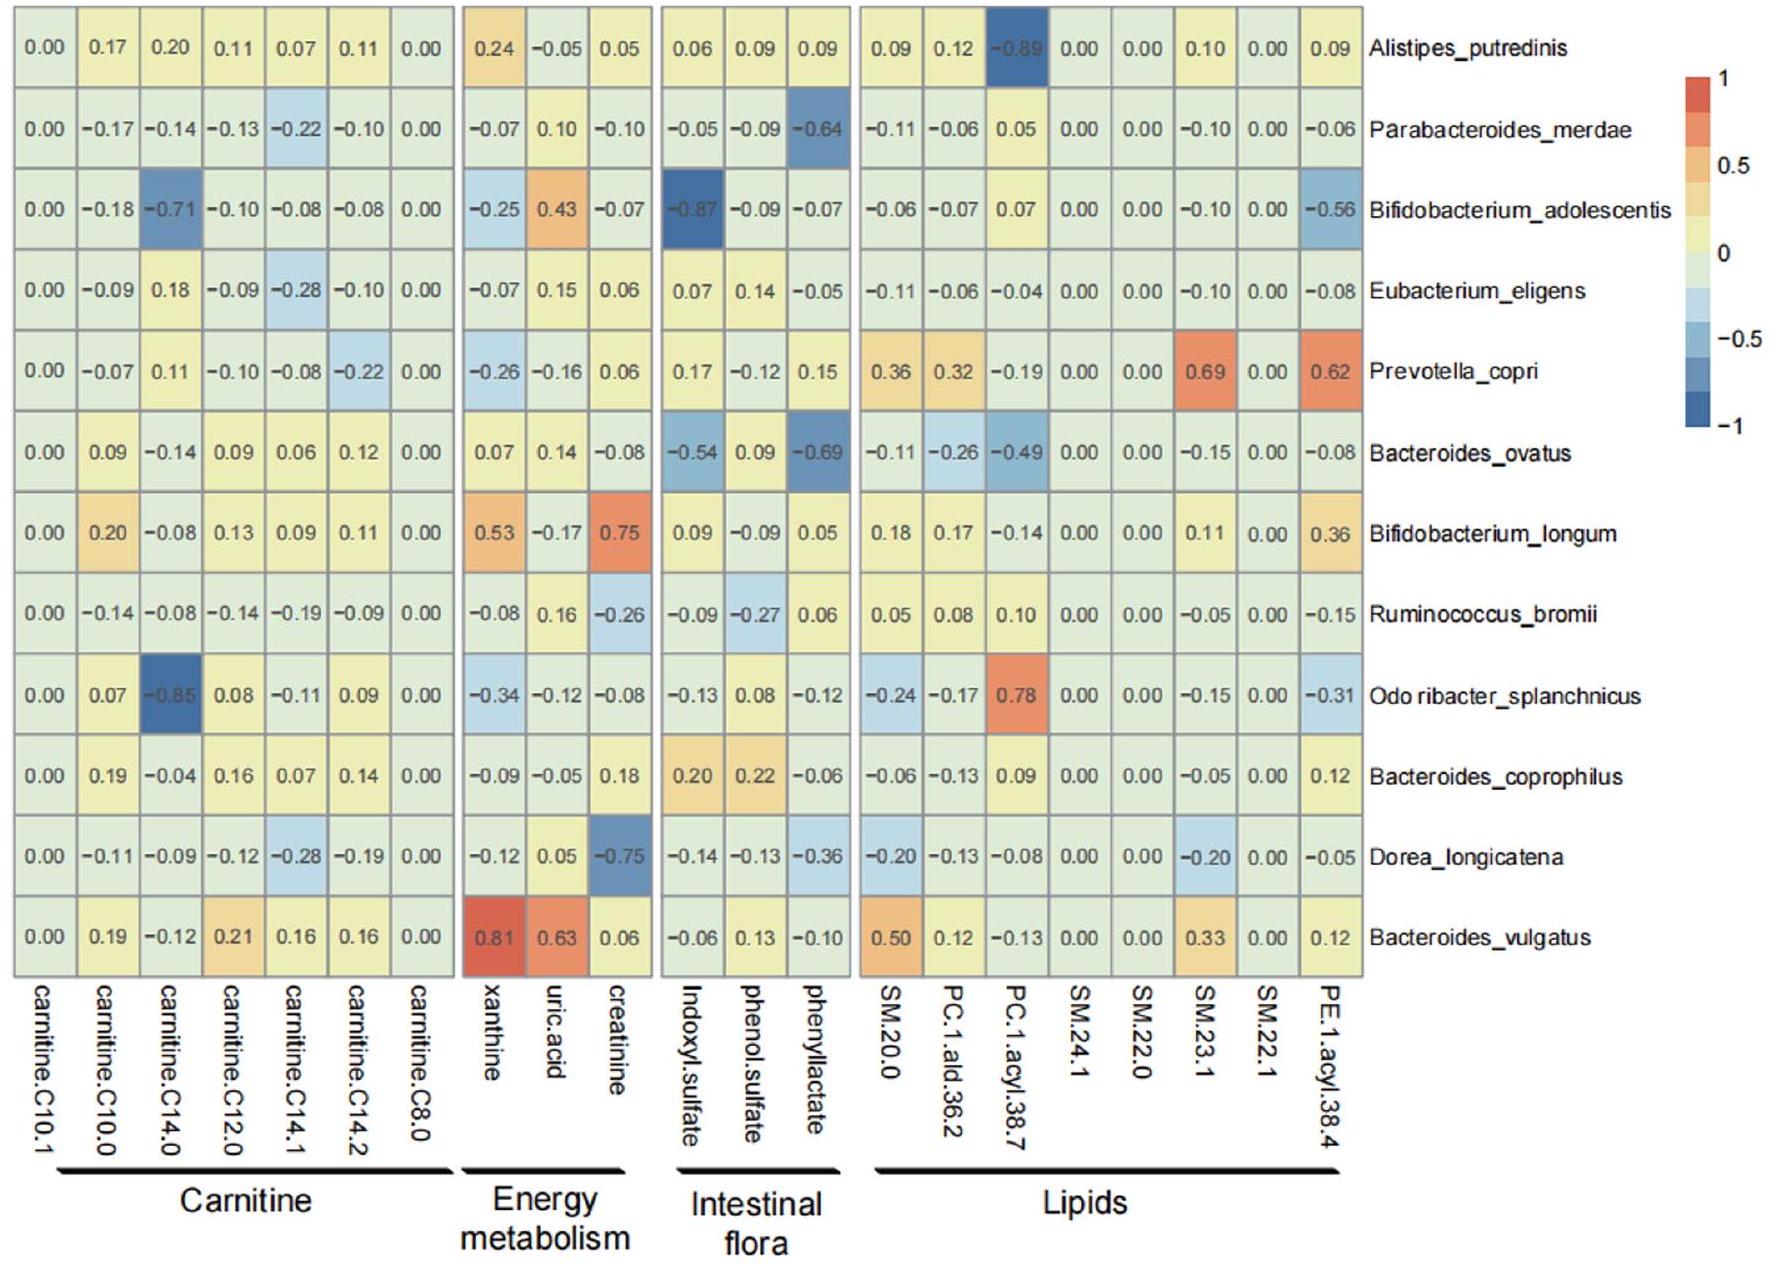
ارتباط ميكروبيوم الأمعاء المتغير بسبب RS مع المستقلبات

بينما لا يزال غير واضح كيف تساهم التغيرات في ميكروبيوم الأمعاء في الفوائد للمضيف، فإن آلية محتملة هي من خلال إنتاج مستقلبات متغيرة . لذلك، قمنا أيضًا بإجراء تحليل مستقلبات غير مستهدف في مصل المشاركين في الدراسة. انخفضت المستقلبات المرتبطة بالسمنة في المصل، مثل الكارنيتين والميثيونين , بعد تدخل RS مقارنة بتدخل CS (الجدول التكميلي 7). استخدمنا نموذجًا خطيًا عامًا للتحقيق في العلاقة بين الميكروبات المعوية وتغير المستقلبات في المصل خلال تدخل RS. كانت تغيرات B. adolescentis خلال تدخل RS مرتبطة سلبًا بتغير الكارنيتين في المصل وعمليات الأيض للطاقة والمستقلبات الدهنية (أهمية متوسطة 0.15؛ اختبار فيشر المدمج ; الشكل البياني الممتد 6a). على النقيض من ذلك، كان التحول في B. vulgatus خلال تدخل RS مرتبطًا إيجابيًا بالتحول في المستقلبات من عملية التمثيل الغذائي للطاقة، بما في ذلك الزانثين وحمض اليوريك ( ; الشكل البياني الممتد 6a).
نظرًا لأن أحماض الصفراء هي مستقبِلات إشارات هامة تربط بين ميكروبات الأمعاء والمضيف، قمنا بإجراء تحليل كمي لملفات أحماض الصفراء. كان حمض الجلايكوديسوكسيكوليك (GDCA) هو الحمض الصفراوي الوحيد الذي أظهر فرقًا ذا دلالة إحصائية بين تدخل RS وCS. كانت أحماض الصفراء الأخرى، مثل حمض الجلايكوشوليك (GCA) وحمض الديوكسيكوليك (DCA) وحمض 7-كيتوليكوليك (7-ketoLCA) وحمض التاوروديوكسيكوليك
الشكل 2 | ارتباط ميكروبيوم الأمعاء استجابةً لعلاج RS مع الأنماط الظاهرة للمضيف. أ، NMDS للعينات بناءً على التغير (تغير مضاعف بعد التدخل) في وفرة الأنواع. تحيط الدوائر الحمراء والرمادية (مع CI) بعينات RS وCS، على التوالي. الأنواع والأنماط الظاهرة المرتبطة بالتوزيع العام بشكل كبير (تم تعديل FDR باستخدام وظيفة envfit في حزمة VEGANR) تم تمييزها بالأسهم (الأزرق، الأنواع؛ الأسود، النمط الظاهر) حيث تعكس طول الأسهم قوة الارتباط. ب، سبع أنواع ذات ملفات تغير مختلفة بشكل كبير ( , BH FDR باستخدام اختبار ويلكوكسون المزدوج الجوانب) بين تدخلات RS وCS. تشير الرسوم البيانية للصندوق إلى الوسيط وIQR. تمتد الشعيرات إلى IQR. ج، شبكة الارتباط بين ميكروبات الأمعاء والأنماط الظاهرة للمضيف. تم استخدام 12 نوعًا مختلفًا في التغيرات ( , BH FDR باستخدام اختبار ويلكوكسون المزدوج الجوانب) بين مجموعات RS وCS كمتنبئين في نموذج الانحدار. لون العقدة
يعكس إما النمط الظاهر (الأصفر)، الأنواع ذات الوفرة المتزايدة (الأخضر) أو الأنواع ذات الوفرة المتناقصة (الأحمر) استجابةً لـ RS. لون الخط المتصل يعكس إما الارتباط الإيجابي (الأحمر) أو الارتباط السلبي (الأزرق) بين الميكروبات والأنماط الظاهرة. عرض الخط المتصل يعكس قوة الارتباط الخطي الإحصائي (أهمية نموذج متوسط) بين تغير الوفرة (تغير مضاعف بعد التدخل) وتغير الأنماط الظاهرة (تغير مضاعف بعد التدخل). الأهمية هي الأوزان المجمعة لـ AIC للنماذج الخطية العامة التي تحتوي على مثل هذه المتغيرات خلال اختيار النموذج. حجم عقدة الأنواع يعكس تأثيرها العام على جميع الأنماط الظاهرة. د، ملخص لأهمية الأنواع المرتبطة بكل نمط ظاهر. في أ-د، تم اختيار 27 فردًا قبل وبعد RS و16 فردًا قبل وبعد CS بشكل عشوائي من جميع المشاركين للتحليل الميتاجينومي.
(TDCA) أظهر ميلًا للزيادة، بينما -حمض الكينوديوكسيكوليك ( ) كان مستوى يميل إلى الانخفاض بعد تدخل RS (الجدول التكميلي 8 والشكل 3a). من خلال تحليل الارتباط، تم التمييز أن أحماض الصفراء الثانوية GDCA وTDCA كانت لها أقرب ارتباط مع الأنماط الظاهرة الأيضية. كان تغير GDCA وTDCA
مرتبطًا سلبًا مع الأنماط الظاهرة المتعلقة بالسمنة، بينما كان مرتبطًا إيجابيًا مع حساسية الأنسولين ومستويات ANGPTL4 (الشكل 3b). كان تغير GDCA وTDCA بعد علاج RS مرتبطًا بشكل كبير وإيجابي بأربعة أنواع، بما في ذلك B. adolescentis وB. longum وDorea longicatena وR. bromii،
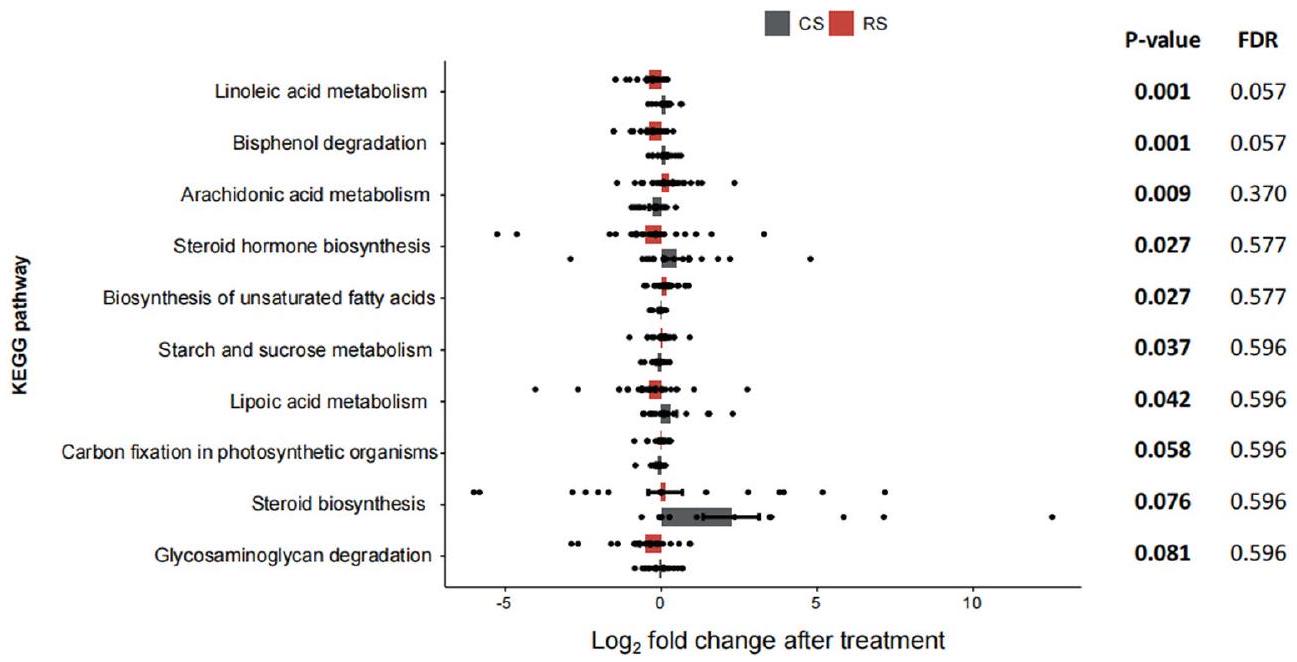
بينما كان مرتبطًا سلبًا مع ثمانية أنواع أخرى، بما في ذلك A. putredinis وBacteroides coprophilus وBacteroides ovatus وB. vulgatus وEubacterium eligens وO. splanchnicus وP. merdae وP. copri (الشكل 3c). بالإضافة إلى ذلك، حددنا بعض المسارات الميكروبية المرتبطة بقوة بتغير عدة مستقلبات، بما في ذلك GDCA وTDCA، CDCA وDCA و7-ketoLCA (الشكل 3d). تشير نتائجنا إلى أن ميكروبات الأمعاء المتأثرة بـ RS تزيد من إنتاج أحماض الصفراء الثانوية، مما قد يؤدي إلى تخفيف السمنة ومقاومة الأنسولين. لتحديد ما إذا كانت الأنواع مرتبطة بتمثيل أحماض الصفراء، قمنا بالتحقيق في الارتباط بين ميكروبيوم الأمعاء وإنزيم هيدروكسي الصفراء (BSH؛ K01442)، الذي يعد حارس بوابة تمثيل أحماض الصفراء وتواصل المضيف-الميكروبيوم . كشفت نتائجنا عن انخفاض كبير في وفرة جين BSH داخل مستوى المجتمع الميكروبي في الأمعاء في تدخل RS مقارنة بتدخل CS ( , اختبار ويلكوكسون للرتب المجمعة). وجدنا أن التعبير عن كان مرتبطًا بشكل كبير مع B. vulgatus ( ; الجدول التكميلي 9).
تعتبر الأحماض الدهنية قصيرة السلسلة (SCFAs)، التي يتم إنتاجها بشكل أساسي من تخمر الألياف الغذائية بواسطة الميكروبات المعوية، تلعب دورًا هامًا في الحفاظ على صحة الأمعاء والتمثيل الغذائي . لذلك، قمنا بإجراء تحليل مستهدف للتمثيل الأيضي للتحقيق في التغيرات في الأحماض الدهنية قصيرة السلسلة في البراز والدورة الدموية بعد علاجات RS وCS. وجدنا أن تركيزات الأحماض الدهنية قصيرة السلسلة في البراز من الإيزوبوتيرات والفاليرات انخفضت بشكل كبير بعد تدخل RS مقارنة بتدخل CS، بينما لم تختلف الأحماض الدهنية قصيرة السلسلة الأخرى في البراز، بما في ذلك الأسيتات والبروبيونات والبيوتيرات والهيكسانوات بشكل كبير بعد تدخل RS (الشكل البياني الممتد 6b-g). لم يكن هناك فرق كبير في مستويات الأحماض الدهنية قصيرة السلسلة في الدورة الدموية بين تدخلات RS وCS (الجدول التكميلي 10).

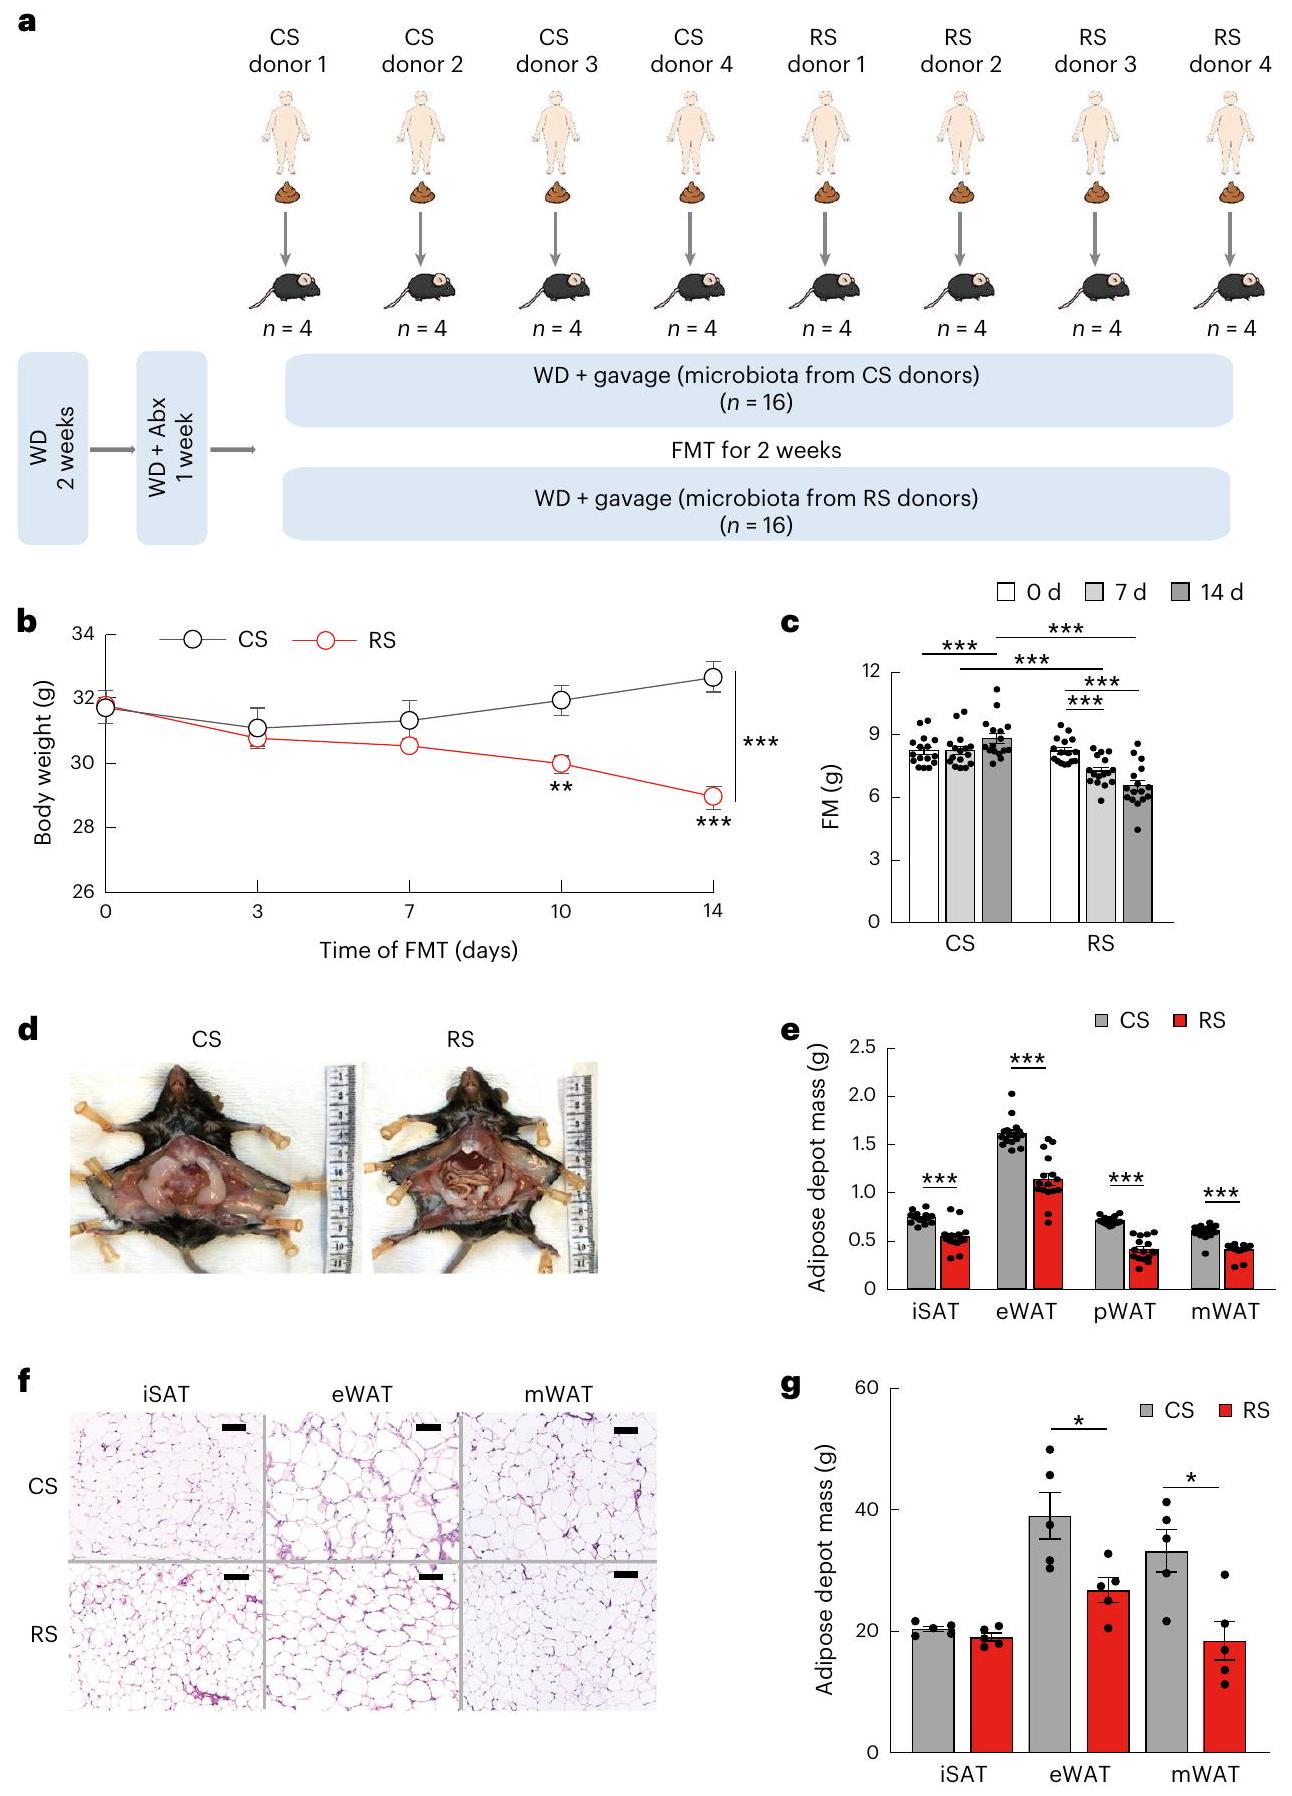
ميكروبات الأمعاء المعاد تشكيلها بواسطة RS تخفف السمنة في الفئران

للتحقيق في إمكانية ميكروبات الأمعاء المرتبطة بـ RS لتحفيز تحسينات في سمنة البطن للمضيف وعمليات التمثيل الغذائي للجلوكوز، قمنا بإجراء زراعة ميكروبية في الفئران المعالجة بالمضادات الحيوية التي تتغذى على نظام غذائي غربي، باستخدام عينات من المتبرعين البشريين بعد تدخل RS أو CS (مع تغييرات في وزن الجسم بعد التدخل تقترب من متوسط المجموعة المعنية؛ لكل مجموعة) (الشكل 4a). لاحظنا اتجاهًا متسقًا من التغيرات الناتجة عن RS بين المتبرعين والفئران التي تتلقى زراعة ميكروبية (الشكل البياني الممتد 7a). بعد أسبوعين من زراعة الميكروبات، كان وزن الجسم وكتلة الدهون للفئران التي تلقت ميكروبات RS أقل من تلك التي تلقت ميكروبات CS ( ) (الشكل 4b,c). كانت نسبة كتلة مستودع الأنسجة الدهنية البيضاء في الفئران المستعمرة بميكروبات RS أقل بكثير من تلك التي استعمِرت بميكروبات CS (الشكل 4d,e). أظهر التحليل النسيجي لـ eWAT وmWAT حجمًا مخفضًا بشكل كبير للخلايا الدهنية في الفئران المستعمرة بميكروبات RS (الشكل 4f,g). أشار نظام مراقبة الحيوانات المعملية الشامل إلى أن المجموعتين من الفئران لم تظهر اختلافات كبيرة في استهلاك الطاقة، ونسبة تبادل التنفس، الإنتاج، الاستهلاك، النشاط وتناول الطعام (الشكل البياني الممتد 7b-g). كانت حساسية الجلوكوز في هذه الفئران قد تحسنت جزئيًا على الأقل من خلال زراعة ميكروبات الأمعاء من البشر بعد
تدخل RS (الشكل البياني الممتد 7h,i). كانت مستويات الأديبونيكتين في الدورة الدموية في الفئران المستعمرة بميكروبات RS أعلى بشكل كبير من تلك المستعمرة بميكروبات CS (الشكل البياني الممتد 7j). تشير هذه النتائج إلى أن التغيرات الناتجة عن RS في ميكروبات الأمعاء قد تكون كافية لتخفيف السمنة وتحسين عمليات التمثيل الغذائي للجلوكوز في المضيف.

ميكروبات الأمعاء المعاد تشكيلها بواسطة RS تستعيد حاجز الأمعاء

يتماشى مع نتائج التجارب السريرية، فإن ميكروبات الأمعاء المعدلة بواسطة RS قد خففت الالتهاب الجهازي. بعد أسبوعين من زراعة الميكروبات، كانت مستويات MCP-1 وIL-1 وIL-6 في الفئران المستعمرة بميكروبات RS أقل بكثير من تلك المستعمرة بميكروبات CS (جميع ) (الشكل 5a). زادت مستويات السيروم لعامل مضاد الالتهاب IL-10 في الفئران المستعمرة بميكروبات RS (الشكل 5a). في الأنسجة الدهنية المساريقية، كان تعبير و أقل بكثير، بينما كان تعبير أعلى في الفئران التي تلقت ميكروبات RS مقارنة بتلك التي تلقت ميكروبات CS (الشكل 5b).
الالتهاب الأيضي، الذي قد يُعزى إلى زيادة اختراق الليبوساكاريد (LPS) من الأمعاء إلى الدورة الدموية، يعد عاملًا محوريًا في الالتهاب المزمن الناتج عن السمنة لتحقيق كيفية تفاعل الميكروبيوم المعوي المعدل بواسطة RS مع الإندوتوكسيميا الأيضية، درسنا أيضًا نفاذية الأمعاء في الفئران المستعمرة بميكروبيوم من متبرعين بشريين بعد تدخلات RS وCS. تم إعطاء الفئران عن طريق الفم محلول الدكستران المسمى بالفلوريسئين إيزوثيوسيانات (DX-4000-FITC) بعد فترة صيام مدتها 6 ساعات، وبعد ذلك تم جمع عينات المصل عبر الوريد الذيل. تم تحديد تركيز DX-4000-FITC في المصل باستخدام مطياف الفلورية. كانت نفاذية الأمعاء أقل بشكل ملحوظ في الفئران المستعمرة بميكروبيوم RS مقارنة بتلك المستعمرة بميكروبيوم CS (الشكل 5c). يتم تنظيم نفاذية الأمعاء بواسطة الوصلات الضيقة المعوية التي تمنع غزو مسببات الأمراض ومنتجات البكتيريا. قمنا بتقييم تأثير التغيرات في ميكروبيوتا الأمعاء الناتجة عن RS على مستويات التعبير عن البروتينات الرئيسية في الوصلات الضيقة في الأمعاء، بروتين زونا أوكلودنس (ZO-1) وأوكلاودين. كانت تعبيرات جينات ZO-1 وأوكلاودين مرتفعة بشكل ملحوظ في الفئران التي تلقت ميكروبيوتا RS مقارنة بتلك التي تلقت ميكروبيوتا CS (الشكل 5d-f). علاوة على ذلك، في الفئران التي استعمرت بميكروبيوتا الأمعاء من المتبرعين بعد تدخل RS، أدى استعادة حاجز الأمعاء إلى تقليل كبير في مستويات LPS في كل من الأنسجة الدهنية المساريقية والدورة الدموية (الشكل 5g,h). تشير هذه النتائج إلى أن أحد التأثيرات المفيدة للميكروبيوتا المتغيرة هو منع اختراق LPS من خلال الحفاظ على حاجز الأمعاء.

الميكروبيوم المعوي المعدل بواسطة RS يقلل من امتصاص الدهون

أظهرت دراستنا السريرية زيادة ملحوظة في مستويات ANGPTL4 الدائرة والدهون البرازية لدى المشاركين بعد استهلاك RS مقارنة باستهلاك CS. للتحقق مما إذا كانت الزيادة في ANGPTL4 منظمة بواسطة ميكروبيوتا RS، قمنا بقياس مستويات تعبير ANGPTL4 في اللفائفي للفئران من تجارب زراعة الميكروبات. مقارنة بالفئران المستعمرة بميكروبيوتا CS، كانت الفئران المستعمرة بميكروبيوتا RS لديها تعبير أعلى بشكل ملحوظ عن ANGPTL4 في اللفائفي (الشكل 5i). ANGPTL4 هو مثبط داخلي لإنزيم ليباز البروتين الدهني.
الشكل 3 | الأحماض الصفراوية تتوسط التفاعل بين ميكروبيوم الأمعاء والأنماط الظاهرية للمضيف. أ، التغير النسبي في مستويات الأحماض الصفراوية في المصل التي تم تقييمها في المشاركين بعد تدخل RS أو CS لمدة 8 أسابيع. تُعرض البيانات كرسوم بيانية على شكل صندوق وخطوط. الخط الأفقي في منتصف كل صندوق يشير إلى القيمة الوسيطة، والحدود العليا والسفلى للصناديق تمثل النسب المئوية 75 و 25، والخطوط تشير إلى أدنى وأعلى القيم. بواسطة نموذج خطي مختلط. ب، شبكة الارتباط بين الأحماض الصفراوية والظواهر المضيفة. ج، شبكة الارتباط بين ميكروبات الأمعاء والظواهر المضيفة، على التوالي. لون العقد يعكس إما الأحماض الصفراوية (أزرق)، أو الظاهرة (أصفر في ب)، أو الميكروبات (أصفر في ج). لون الخط المتصل يعكس إما الارتباط الإيجابي (أحمر) أو الارتباط السلبي (أزرق).
بين أحماض الصفراء والأنماط الظاهرية أو بين أحماض الصفراء والميكروبات. عرض الخط المتصل يعكس قوة الارتباط الخطي الإحصائي (أهمية متوسطة النموذج) بين تغير أحماض الصفراء (تغير مضاعف بعد التدخل) وتغير الأنماط الظاهرية (تغير مضاعف بعد التدخل) أو بين تغير الوفرة (تغير مضاعف بعد التدخل) وتغير أحماض الصفراء (تغير مضاعف بعد التدخل). الأهمية هي مجموع أوزان AIC لنماذج الانحدار الخطي العام التي تحتوي على مثل هذه المتغيرات خلال اختيار النموذج. حجم العقدة لأحماض الصفراء يعكس تأثيرها العام على جميع الأنماط الظاهرية أو الميكروبات. د، تحليل مسار KEGG يظهر العلاقة بين تغير أحماض الصفراء وتغير وفرة مسار KEGG.
(LPL) وأيضًا الليباز البنكرياسي، الذي يعمل كليباز معوي رئيسي وجدنا أن الفئران التي استعمرت بميكروبات RS كانت لديها نشاط إنزيم الليباز المعوي أقل بشكل ملحوظ مقارنة بالفئران التي تلقت ميكروبات CS (الشكل 5j). وفقًا لانخفاض نشاط إنزيم الليباز المعوي، أظهرت الفئران المستعمرة بميكروبات RS مستويات أقل من TG في اللفائفي ومستويات أعلى من TG في
كانت مستويات ANGPTL4 المتداولة مرتفعة بشكل ملحوظ في الفئران المستعمرة بميكروبيوتا RS مقارنة بالفئران المستعمرة بميكروبيوتا CS. تشير هذه النتائج إلى أن التغيرات التي تسببها RS في ميكروبيوتا الأمعاء كانت قادرة على تقليل امتصاص الدهون من خلال تعديل ANGPTL4 المعوي.
الشكل 4 | ميكروبيوم الأمعاء المتأثر بـ RS يخفف السمنة. أ، مخطط توضيحي لزراعة البراز. عينات البراز من المتبرعين البشر بعد تدخل RS أو CS لمدة 8 أسابيع ( تم زرعها في فئران C57BL/6 المعالجة بالمضادات الحيوية (Abx). تم إطعام الفئران نظام غذائي غربي مشع لمدة أسبوعين قبل وأثناء 14 يومًا من الاستعمار. لكل مجموعة). ب، ج، تغييرات في وزن الجسم وكتلة الدهون بعد زراعة الميكروبات. د، صور تمثيلية للدهون الحشوية في الفئران التي تم استعمارها لمدة 14 يومًا مع الميكروبات من متبرعي RS أو CS. هـ، كتلة مخزن الدهون بما في ذلك الدهون تحت الجلد الإربية (iSAT)، eWAT، pWAT وmWAT في الفئران.
تم استعمارها لمدة 14 يومًا مع الميكروبيوتا. صور تمثيلية وبيانات قياس لشرائح ملونة بالهيماتوكسيلين والإيوزين من iSAT و eWAT و mWAT في مجموعتين من الفئران المستعمرة مع ميكروبيوتا CS (في الأعلى) أو RS (في الأسفل). مقياس الرسم، تم إعادة إنتاج البيانات في ثلاث تجارب مستقلة. تُعرض البيانات كمتوسط تم تحديد الدلالة باستخدام اختبار الطالب ذو الطرفين المزدوج. -اختبار ( ) واختبار ت student’s ذو الطرفين غير المتزاوج -اختبار ( اختبار ويلكوكسون للرتب المجموع غير المعلمي ذو الجانبين (غير موزع بشكل طبيعي). و .

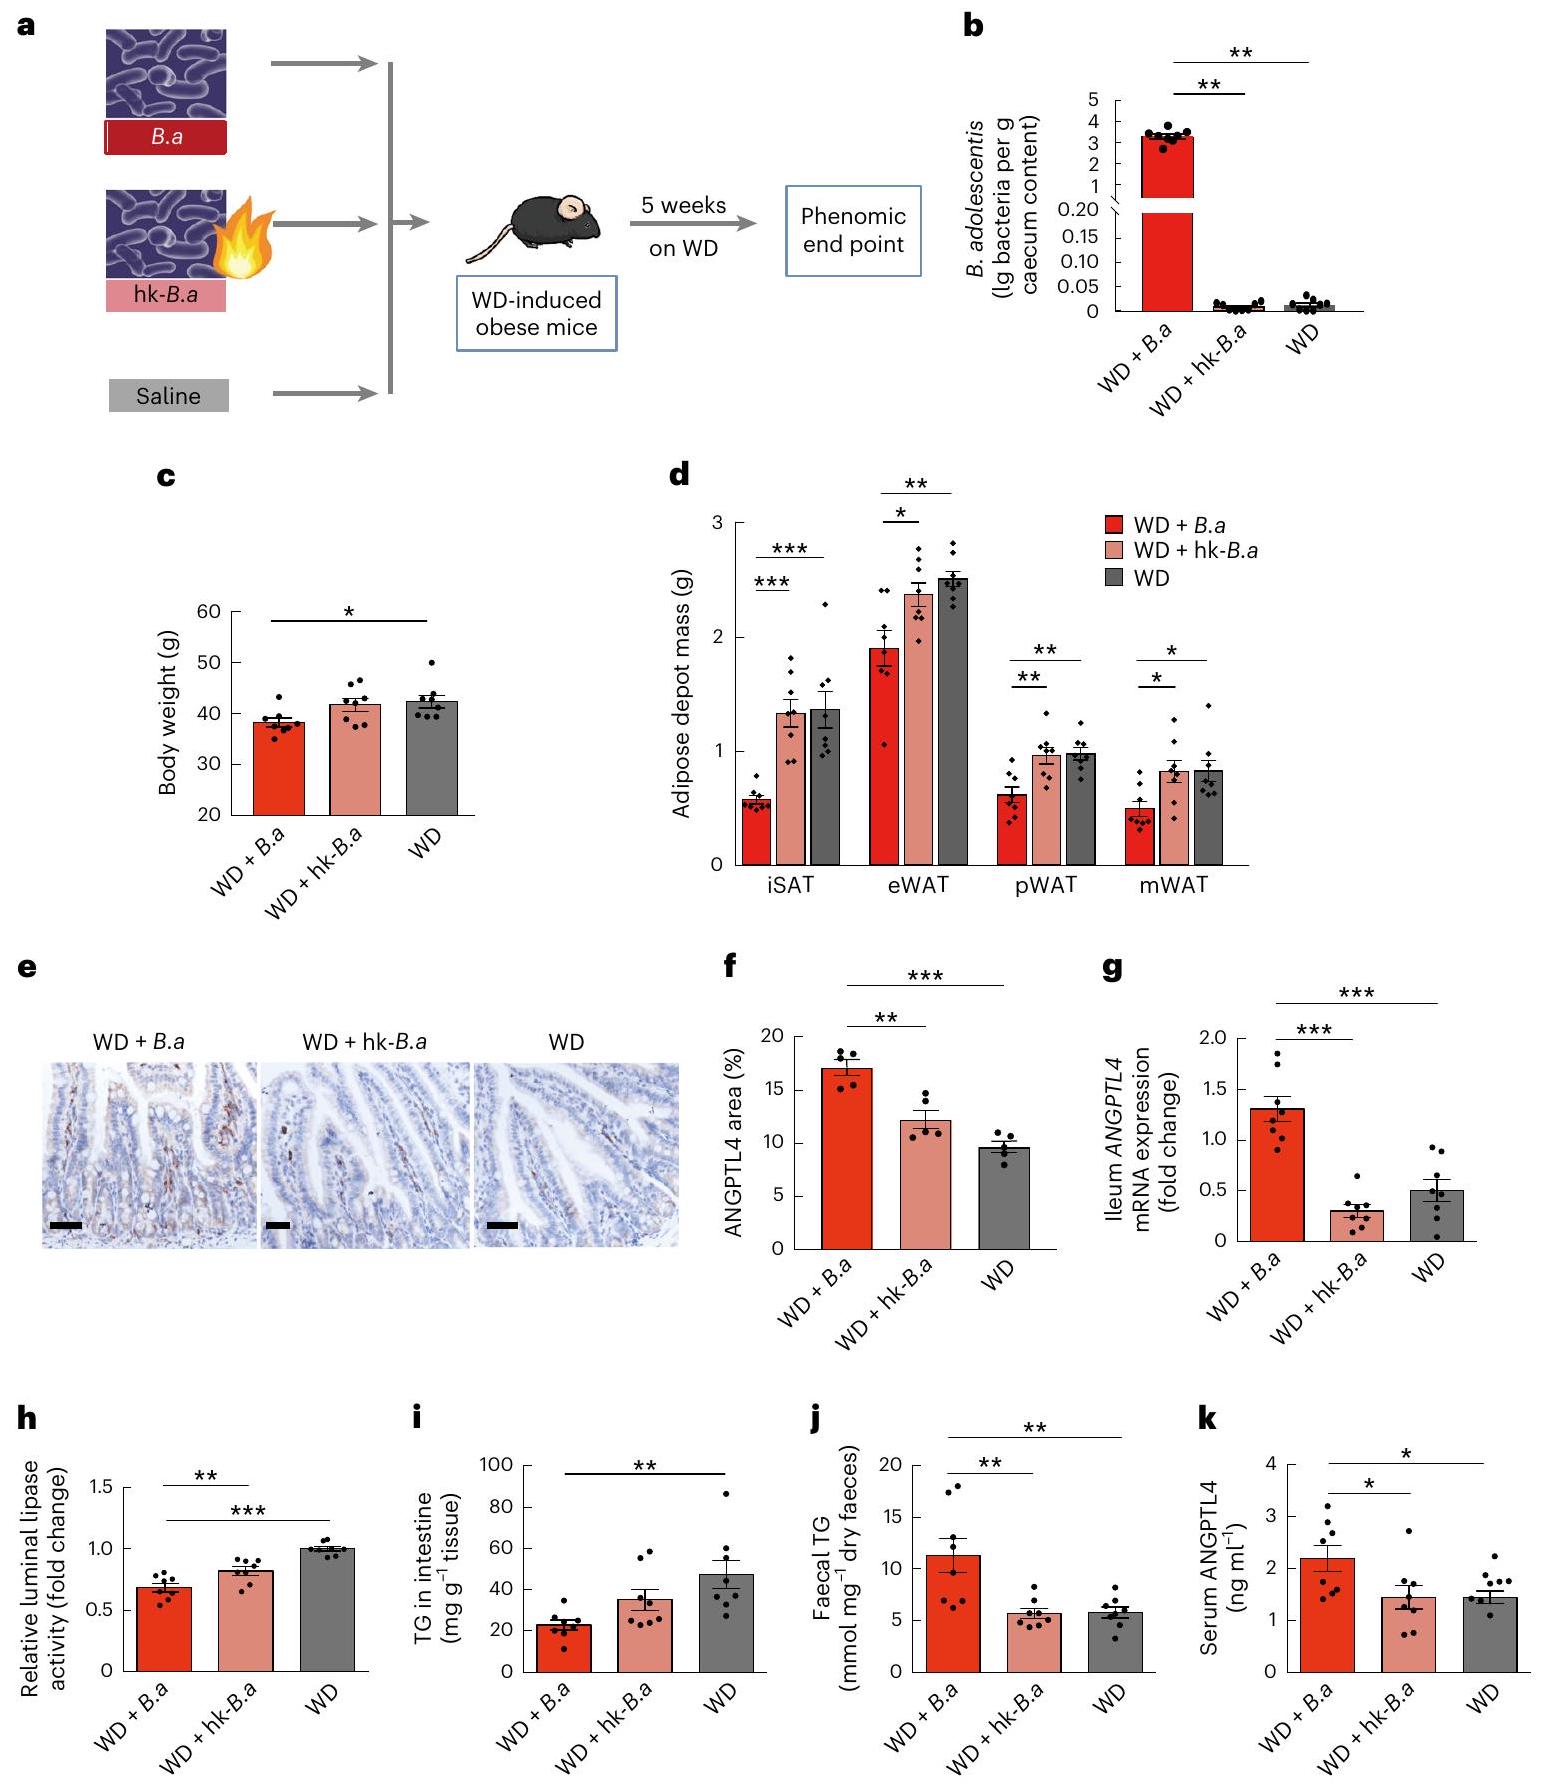
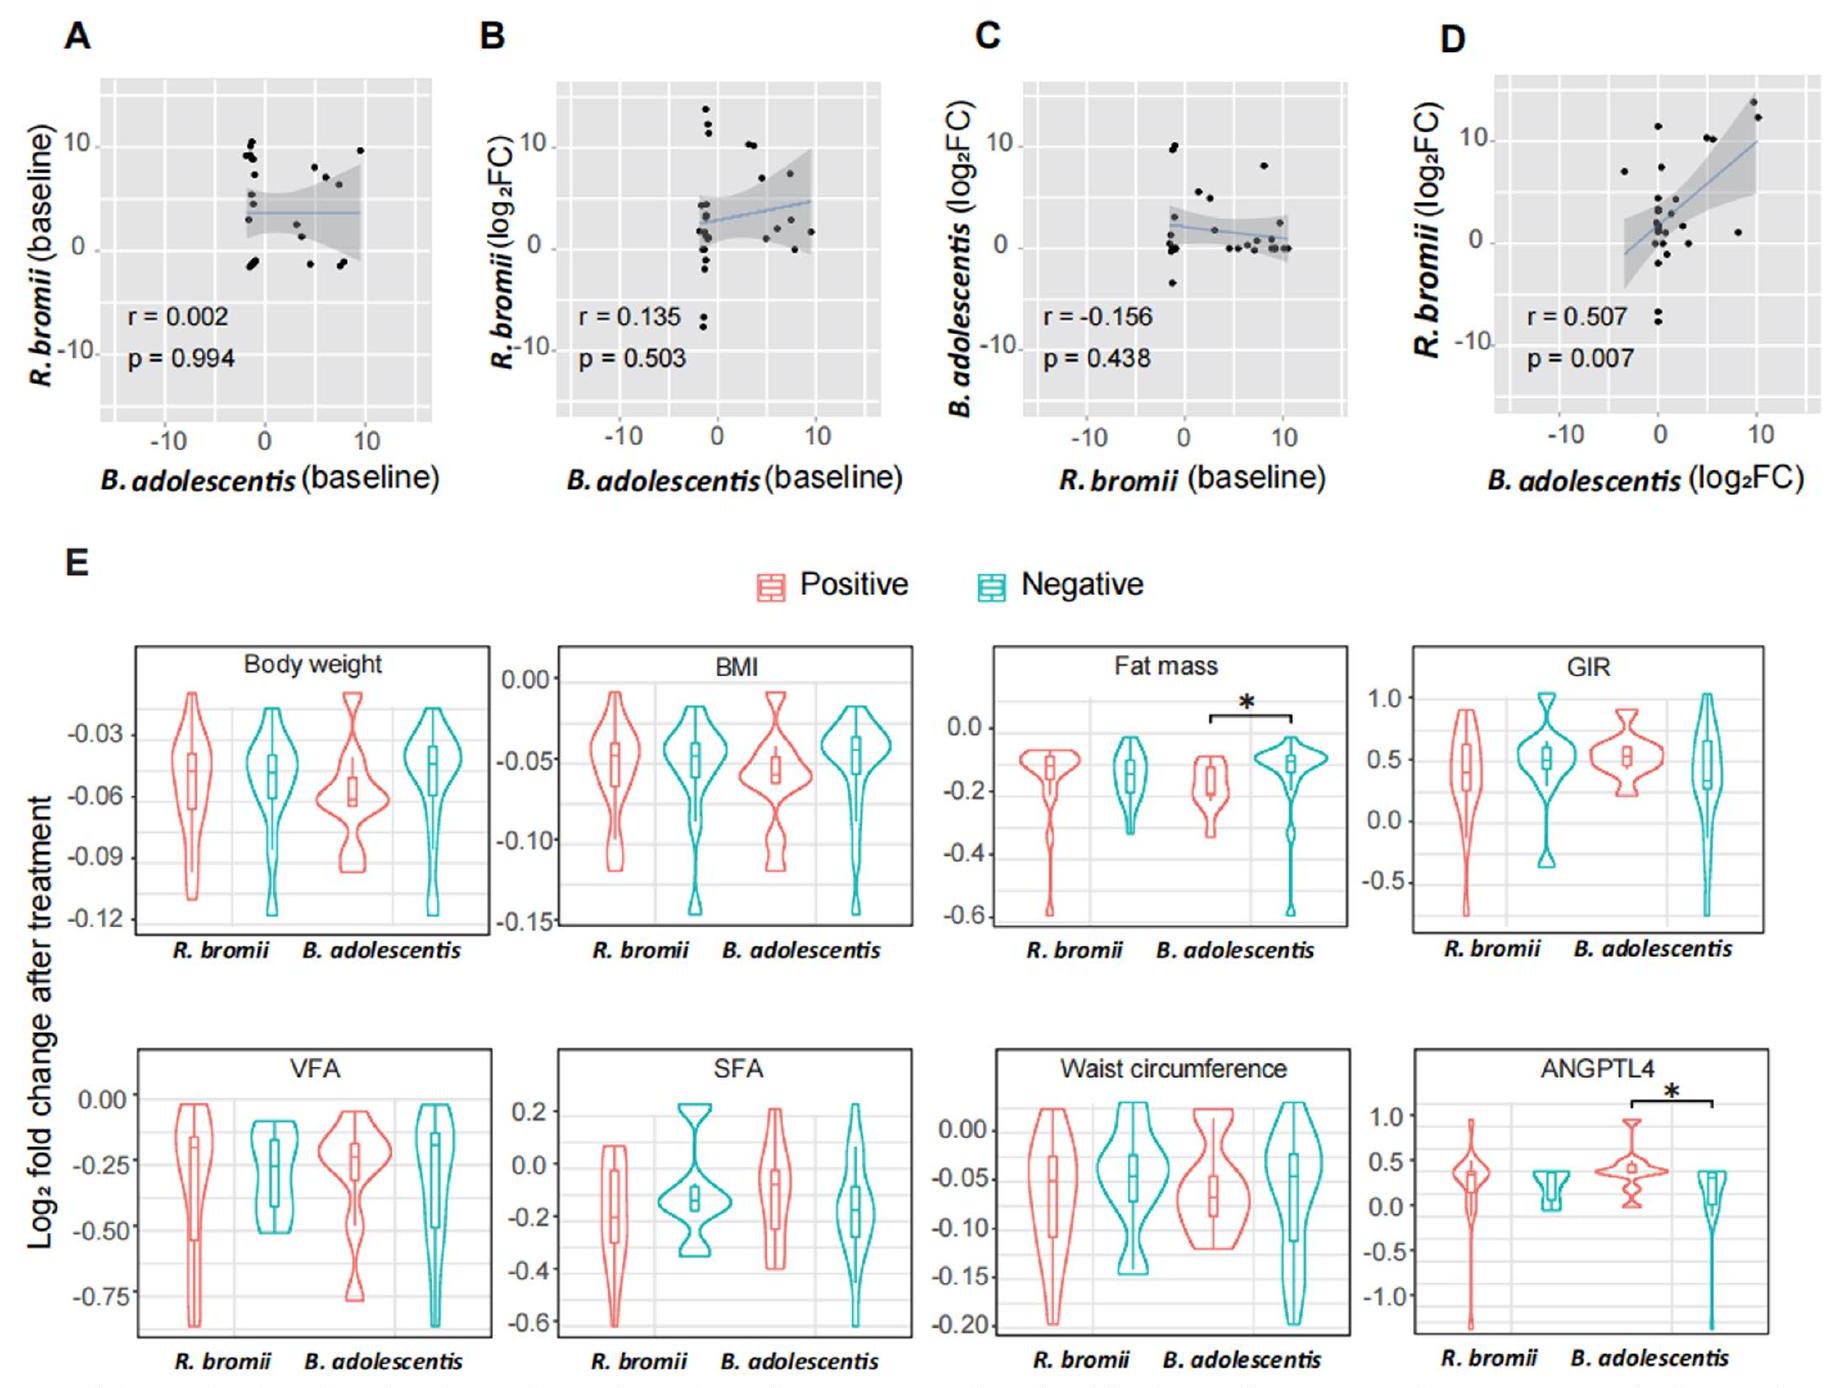
آثار ب. أدوليسنتيس على السمنة

الزيادة في كان المراهقون الذين يعانون من RS مرتبطين بشكل قوي بتخفيف السمنة البطنية. بناءً على ذلك، قمنا بمزيد من التحقيق في العلاقة السببية المحتملة بين تم تقسيم الفئران عشوائيًا إلى ثلاث مجموعات، تشرب ماء معقم مدعوم ببكتيريا B. adolescentis الحية، أو B. adolescentis الميتة بالحرارة، أو محلول ملحي لمدة 5 أسابيع (الشكل 6 أ، ب).
تزويد مياه الشرب ببكتيريا B. adolescentis الحية خفف بشكل كبير من زيادة وزن الجسم (الشكل 6c) والسمنة (الشكل 6d) في الفئران التي تم تغذيتها بنظام غذائي غربي. قمنا بمزيد من التحقيق فيما إذا كان تنظم بكتيريا ب. أدوليسنتيس تعبير ANGPTL4 في الأمعاء. بالمقارنة مع الفئران التي تم إعطاؤها ماء شرب مضاف إليه بكتيريا ب. أدوليسنتيس الميتة، كان تعبير ANGPTL4 وإفرازه في اللفائفي أعلى بشكل ملحوظ في الفئران التي تم إعطاؤها ماء شرب مضاف إليه بكتيريا حية. . المراهقين (الشكل 6e-g).
الشكل 5 | الميكروبات المعوية المتأثرة بـ RS تستعيد حاجز الأمعاء وتقلل من امتصاص الدهون. تم تقسيم الفئران ومعالجتها كما في الشكل 4 لكل مجموعة). أ، مستويات السيروم من السيتوكينات الالتهابية في الفئران التي استعمرت بميكروبيوتا من متبرعين RS أو CS. ب، تعبير الجينات الالتهابية في mWAT وفي الفئران التي استعمرت بميكروبيوتا من متبرعين RS أو CS. ج، نفاذية الأمعاء في الجسم الحي. د، تعبير ZO-1 و occludin في اللفائفي. هـ، تم تصور المواقع والمستويات لـ ZO-1 (أحمر) و occludin (أخضر) في الزغابات المعوية بواسطة التألق المناعي والتلوين المضاد باستخدام 4،6-diamidino-2-phenylindole (DAPI) (أزرق). تظهر الصور التمثيلية لكل مجموعة (مقياس، ).
تم إجراء التحليل الكمي للمنطقة الملونة إيجابياً لـ ZO-1 و occludin بواسطة برنامج ImageJ وتم حسابه كنسبة مئوية من إجمالي مساحة الآفة. مستويات في الموات وفي الدورة الدموية (المصل). i، مستويات التعبير عن ANGPTL4 في اللفائفي. j، النشاط النسبي لإنزيم الليباز في تجويف الأمعاء. مستويات TG في اللفائفي. 1، مستويات TG في البراز. م، مستويات ANGPTL4 في المصل. تم تكرار البيانات في ثلاث تجارب مستقلة. تُعرض البيانات كمتوسط. تم تحديد الدلالة باستخدام اختبار الطالب غير المتزاوج ذو الطرفين -اختبار (موزع طبيعياً) أو اختبار ويلكوكسون غير المعلمي ذو الجانبين (غير موزع طبيعياً). و 0.001 و .
يتماشى مع تجربتنا السريرية، كانت B. adolescentis مرتبطة بشكل إيجابي بمستويات ANGPTL4 في المصل. الفئران التي تتلقى العيش كان لدى الفئران من نوع B. adolescentis نشاط إنزيم الليباز اللمعي منخفض بشكل ملحوظ (الشكل 6h). وبالمثل، كانت مستويات TG في اللفائفي منخفضة ومستويات TG في البراز مرتفعة (الشكل 6i,j). كما كانت مستويات ANGPTL4 المتداولة مرتفعة بشكل ملحوظ في الفئران المعالجة بـ B. adolescentis الحية (الشكل 6k). تشير نتائجنا إلى أن . adolescentis، واحدة من الأنواع الرئيسية التي تحفزها RS، قد تحمي الفئران من السمنة الناتجة عن النظام الغذائي من خلال التأثير على ANGPTL4 المعوي. بالإضافة إلى ذلك، انخفض مستوى FGF21 بشكل ملحوظ في المشاركين بعد تدخل RS، مما يشير إلى تحسين حساسية FGF21
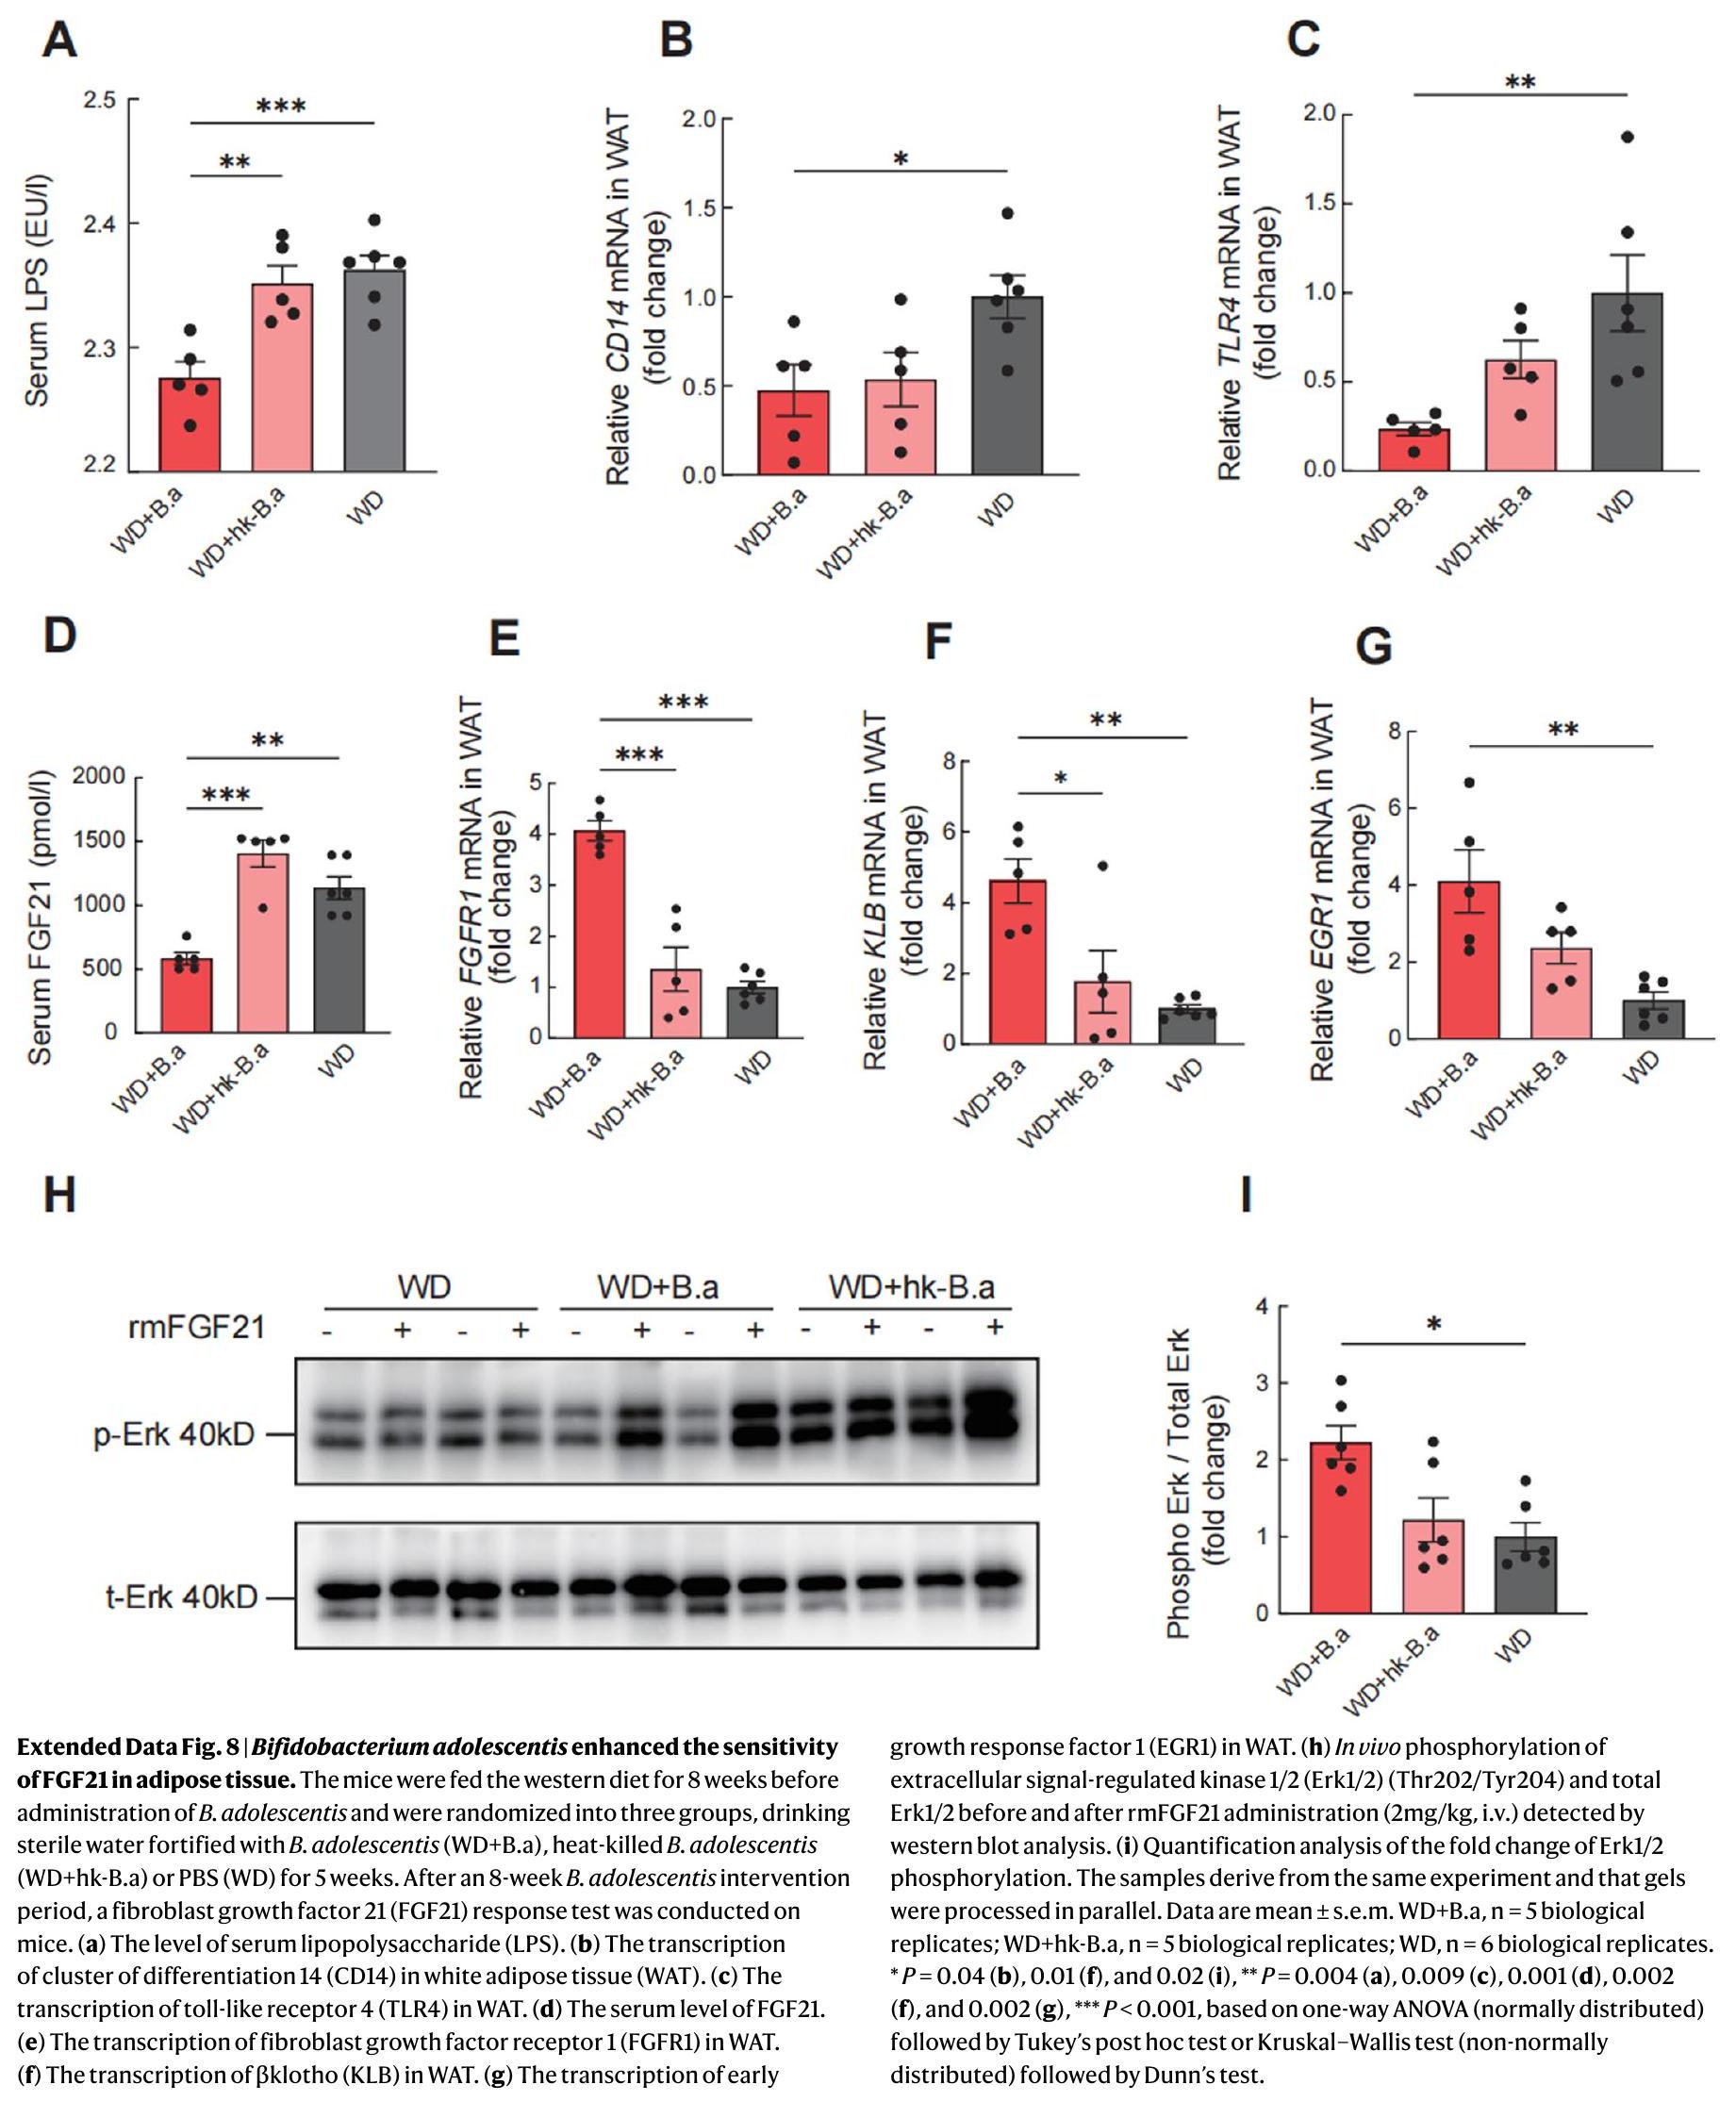
(الشكل 1م). وجدنا أن العلاج بـ B. adolescentis في الفئران زاد من الحساسية لـ FGF21 في الأنسجة الدهنية من خلال قمع مسار LPS-TLR4-NF-кB (بيانات موسعة الشكل 8).
قمنا أيضًا بإجراء تحليل مستهدف للميتابولوميات في الفئران التي تم تربيتها تقليديًا والمعالجة بـ B. adolescentis (الشكل البياني الموسع 9a-c). الأحماض الصفراوية الأولية، بما في ذلك التاور. حمض الموريكوليك (T) أدى تدخل B. adolescentis إلى انخفاض كبير في حمض MCA وحمض التوروشينوديوكسيكوليك (TCDCA) وحمض التوروشوليك (TCA)، وزيادة كبيرة في حمض التوروليثوكوليك الثانوي (Extended Data Fig. 9a). فيما يتعلق بالأحماض الدهنية قصيرة السلسلة، كانت البراز
شكل. ب. أدوليسنتيس تحمي من السمنة الناتجة عن النظام الغذائي وتؤثر على ANGPTL4 المعوي والدائري. أ، مخطط توضيحي لاستراتيجية مكملات ب. أدوليسنتيس (ب.أ). تم تزويد الفئران C57BL/6 السمنة الناتجة عن النظام الغذائي بمياه شرب تحتوي على بكتيريا حية (WD + ب.أ) أو بكتيريا ب. أدوليسنتيس الميتة بالحرارة (WD + hk-ب.أ) أو محلول ملحي (WD) لمدة 5 أسابيع. ب، وفرة . تم قياس الكمية من المراهقين بواسطة qPCR باستخدام البرايمرات المحددة في محتوى الأمعاء الغليظة بين ثلاث مجموعات. c-k، المعايير التي تم قياسها في المجموعات الثلاث بعد 5 أسابيع من العلاج: وزن الجسم (c). كتلة مخازن الدهون بما في ذلك iSAT و eWAT و pWAT و mWAT (d). تم تصور المواقع ومستويات ANGPTL4 في اللفائفي للفئران بواسطة صبغة المناعية (مقياس الشريط، )
(هـ). تم عرض صور تمثيلية لكل مجموعة. ANGPTL4 المساحة كنسبة مئوية من إجمالي مساحة الغشاء المخاطي في اللفائفي (ف). مستويات تعبير mRNA لـ ANGPTL4 في اللفائفي (ج). نشاط الليباز المعوي النسبي (ح). مستويات TG في اللفائفي (ط). مستويات TG في البراز ( مستويات السيروم ANGPTL4 ( ). النسخ البيولوجية لكل مجموعة (ب-د، ج-ك). تم إعادة إنتاج البيانات في ثلاث تجارب مستقلة. تُعرض البيانات كمتوسط تم تحديد الدلالة الإحصائية بواسطة تحليل التباين الأحادي (الموزع بشكل طبيعي) تلاه اختبار توكي بعد ذلك أو اختبار كروسكال-واليس (غير الموزع بشكل طبيعي) تلاه اختبار دُن. ، و 0.05 و و ، و 0.003 و .
انخفضت مستويات الإيزوبيوتيرات والفاليرات بشكل كبير بعد تدخل ب. أدوليسنتيس (الشكل 9b من البيانات الموسعة). بالإضافة إلى ذلك، انخفضت مستويات الأحماض الأمينية المتفرعة السلسلة (BCAAs) في المصل، بما في ذلك الفالين والليوسين، بشكل كبير بعد تدخل المراهقين (الشكل 9c من البيانات الموسعة).

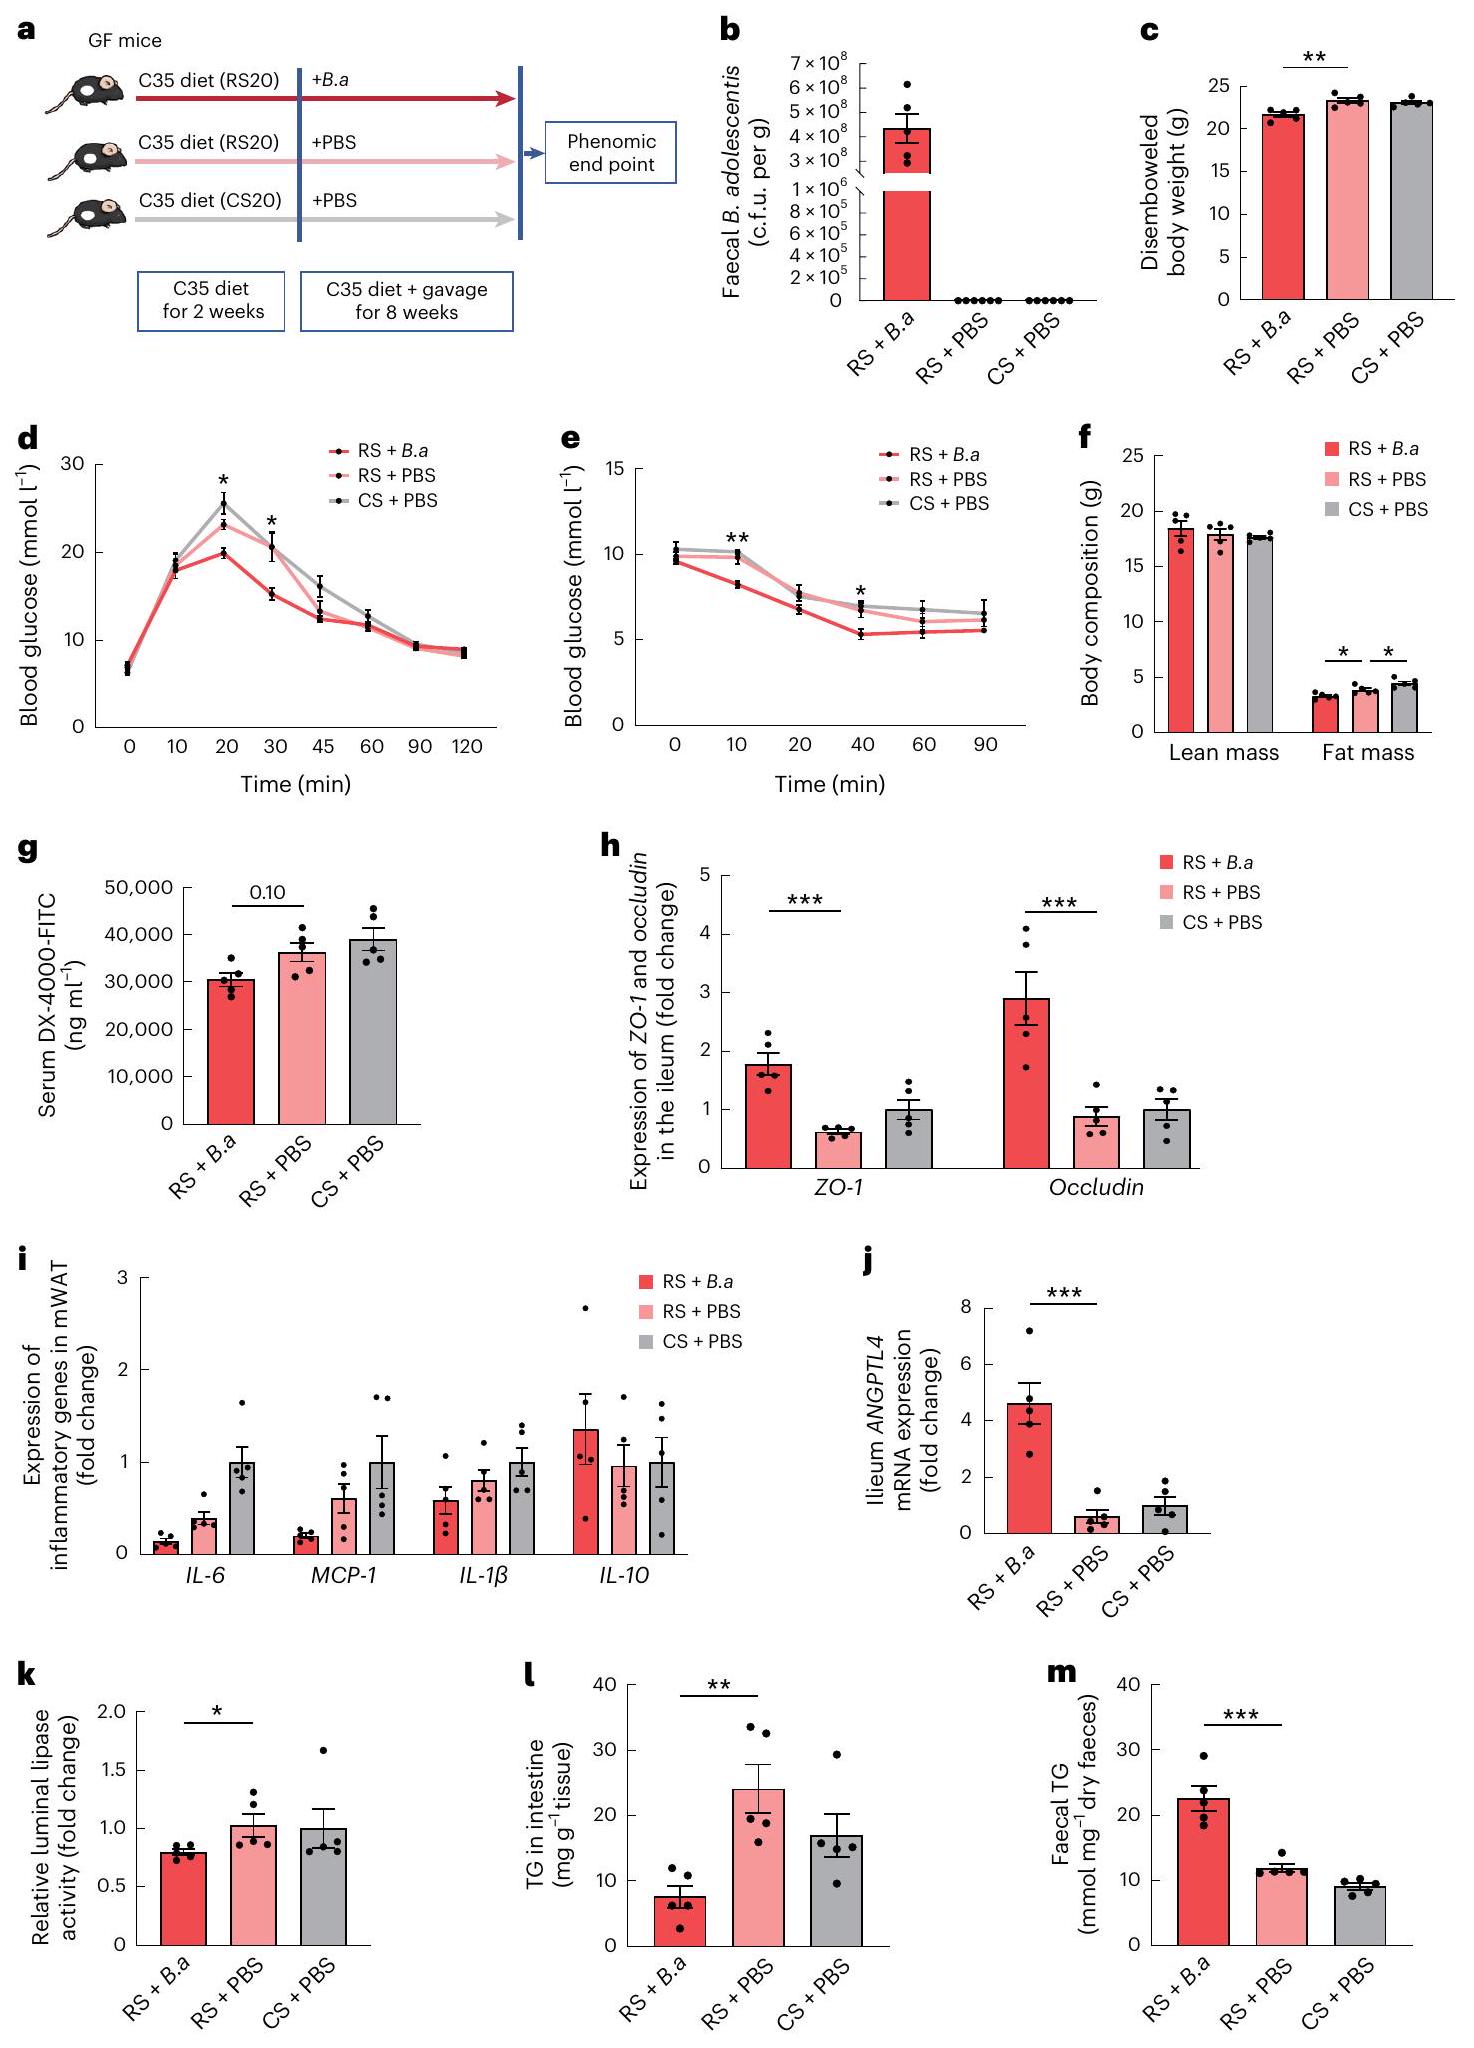
يساعد RS في فقدان الوزن جزئيًا من خلال B. adolescentis

لاستكشاف ما إذا كانت آثار RS تعتمد على ميكروبيوتا الأمعاء، قمنا بإجراء تدخلات RS و CS في الفئران الخالية من الجراثيم (الشكل 7a). تم إطعام الفئران الذكور الخالية من الجراثيم نظام غذائي C35 (35% من الكربوهيدرات المستمدة من RS أو 20% CS) لمدة 10 أسابيع. في هذه الأثناء، تم علاج هذه الفئران
مع PBS أو B. adolescentis الحية لمدة 8 أسابيع. حيث زادت محتويات الأمعاء وسمك اللمعة بشكل ملحوظ بعد تغذية RS، تم استخدام وزن الجسم المقطوع بشكل شائع لتقييم تأثير فقدان الوزن. على عكس تأثير الحماية الذي يوفره RS ضد السمنة الناتجة عن النظام الغذائي في بيئة تقليدية لم يُظهر علاج RS أي تغيير ملحوظ في وزن الجسم المقطوع الأمعاء، وتحمل الجلوكوز، وحساسية الأنسولين مقارنة بعلاج CS في الفئران الخالية من الجراثيم (الشكل 7c-f). لمزيد من التحقيق في تأثيرات RS مع وبدون B. adolescentis، قمنا بإطعام الفئران الخالية من الجراثيم بـ RS مع . المراهقين. أظهرت هذه الفئران انخفاضًا كبيرًا في وزن الجسم المقطوع وكتلة الدهون، بالإضافة إلى تحسين في تحمل الجلوكوز وحساسية الأنسولين مقارنة بالفئران التي لا تحتوي على B. adolescentis (الشكل 7c-f). قلل B. adolescentis من نفاذية الأمعاء وزاد من إنتاج ANGPTL4 في الفئران الخالية من الجراثيم، وهو ما يتماشى مع اكتشافنا في بيئة تقليدية (الشكل ). أظهرت الفئران الخالية من الجراثيم التي تم تغذيتها بـ B. adolescentis انخفاضًا في نشاط الليباز اللمعي ومستويات TG في اللفائفي، إلى جانب زيادة مستويات TG في البراز (الشكل 71، م). أشارت هذه النتائج إلى أن ميكروبيوم الأمعاء كان ضروريًا في تأثير RS في الحماية من السمنة الناتجة عن النظام الغذائي. لعبت RS دورًا في تسهيل فقدان الوزن، على الأقل جزئيًا، من خلال . المراهقين عن طريق تقليل الالتهاب من خلال استعادة حاجز الأمعاء وتعديل إنتاج ANGPTL4 في الأمعاء، مما يعيق امتصاص الدهون.
بالإضافة إلى ذلك، كانت مستويات السيروم من الأحماض الصفراوية الأولية في الفئران الخالية من الجراثيم أعلى من تلك في البيئة التقليدية وكانت مستويات الأحماض الصفراوية الثانوية نسبياً .GCA، وهو حمض صفراوي مقترن، وDCA، وهو حمض صفراوي ثانوي، يظهران ميلاً للزيادة بعد تدخل RS في البشر. زادت مستويات GCA وDCA بشكل ملحوظ بعد تدخل المراهقين في الفئران الخالية من الجراثيم. الأحماض الصفراوية الأولية، بما في ذلك T انخفضت مستويات MCA و TCDCA و TCA بشكل كبير بعد تدخل B. adolescentis في الفئران الخالية من الجراثيم (الشكل 9d من البيانات الموسعة). كما انخفضت مستويات BCAAs في المصل والإيزوبيوتيرات في البراز بعد تدخل B. adolescentis (الشكل 9e,f من البيانات الموسعة).

نقاش

تم إجراء هذه التجربة التي تم التحكم فيها بواسطة دواء وهمي، وكانت مزدوجة التعمية وتصميمها متقاطع، على أفراد يعانون من زيادة الوزن. وجدنا أن مكملات RS، بالتزامن مع حميات متوازنة ومتساوية في الطاقة، قللت بشكل كبير من الوزن وزادت من حساسية الأنسولين لدى البشر. أعادت معالجة RS تشكيل بنية الميكروبيوم وغيرت المستقلبات. تلعب ميكروبات الأمعاء دورًا رئيسيًا في فعالية RS لفقدان الوزن. منع الاستعمار الأحادي للفئران بواسطة B. adolescentis، المرتبط بفوائد RS لدى البشر، السمنة الناتجة عن النظام الغذائي في الفئران. من الناحية الآلية، أثرت التغيرات التي أحدثها RS في ميكروبات الأمعاء على استقلاب الأحماض الصفراوية، وقللت الالتهاب من خلال استعادة حاجز الأمعاء، وأعاقت امتصاص الدهون عن طريق تعديل ANGPTL4 وزادت من حساسية FGF21 (الشكل البياني الممتد 10). لعب RS دورًا في تسهيل فقدان الوزن على الأقل جزئيًا من خلال . المراهقين. بشكل محدد، توفر هذه الدراسة أدلة على أن RS ( ، النوع 2) كمكمل غذائي لمدة 8 أسابيع يمكن أن يساعد في تحقيق فقدان الوزن لدى الأفراد الذين يعانون من زيادة الوزن. في هذه الدراسة الغذائية، قدمنا للمشاركين نظامًا غذائيًا أساسيًا طوال فترة الدراسة. كانت الأنظمة الغذائية الأساسية متوازنة ومتساوية في الطاقة. لم يؤثر على وزن الجسم أو محتوى الدهون على مدى فترة 8 أسابيع، كما لوحظ بعد علاج CS. في التجارب السابقة التي استخدمت RS، كانت كمية RS المستهلكة غير كافية نسبيًا (نسبة الدهون: الألياف أو تناول الدهون العالية (نسبة الدهون إلى الكربوهيدرات) أدى ذلك إلى تقليل مقاومة الأنسولين أو نسبة الدهون دون فقدان الوزن. لم تصف تجارب أخرى نظامًا غذائيًا أساسيًا وكان تناول الدهون إما مرتفعًا جدًا أو لم يتم تقييمه. تؤدي الحميات الغنية بالدهون إلى تغييرات في الميكروبيوم المعوي تؤدي إلى تدهور صحة الأمعاء. في العلاجات المعتمدة على الميكروبيوم، تعتبر الحمية الأساسية ضرورية للفعالية. “. في القوارض، فإن الحميات منخفضة الدهون (18% من الطاقة) المدعمة بالألياف المقاومة لها تأثيرات مفيدة على المضيفين، ولكن الحميات عالية الدهون ( للطاقة) خففت تخمير RS والتأثيرات المفيدة . كـ تم اعتبارها جرعة مرتفعة نسبيًا يمكن تقديمها دون آثار سلبية الدهون
محتوى النظام الغذائي اليومي مهم لتأثير RS. قدمت دراستنا توصية غذائية فعالة باستخدام RS كمكمل. مع نظام غذائي متوازن يحتوي على 25-30% من الدهون، والذي قد يساعد في تحقيق فقدان وزن كبير. لقد مكننا تصميم النظام الغذائي والالتزام الجيد من التخفيف من تأثير المتغيرات المربكة الكبيرة المعروفة بتأثيراتها على الميكروبيوم المعوي والميتابولوم.
تمثل هذه الدراسة واحدة من القلائل التي تُبلغ عن توقيع ميكروبيوتا محدد بعد تدخل RS2. تشمل المجموعات التصنيفية التي تتزايد عادةً بعد استهلاك RS2 R. bromii و B. adolescentis و Faecalibacterium prausnitzii و Eubacterium rectale. . البكتيريا بروماي، التي تعمل كمحلل رئيسي لـ RS2، تم إثراؤها خلال التدخلات السابقة لـ RS2 في هذه الدراسة، زادت بشكل ملحوظ أعداد R. bromii و B. adolescentis بعد تدخل RS في الأفراد ذوي الوزن الزائد. زادت وفرة كان هناك ارتباط قوي بين B. adolescentis وانخفاض مؤشر كتلة الجسم (BMI) والدهون الحشوية (VFA)، مما يشير إلى دوره في فوائد فقدان الوزن الناتجة عن RS. أظهر المشاركون الذين لديهم B. adolescentis في ميكروبيوم الأمعاء لديهم في البداية انخفاضًا أكبر في كتلة الدهون بعد علاج RS. علاوة على ذلك، نقلنا التأثيرات المفيدة لـ RS على سمنة المضيف وعمليات التمثيل الغذائي للجلوكوز في الفئران من خلال زراعة الميكروبات البشرية، مما يعزز فرضيتنا بأن التغيرات التي يسببها RS في الميكروبات يمكن أن تؤدي إلى نتائج مفيدة للمضيف. بالإضافة إلى ذلك، كانت ميكروبات الأمعاء ضرورية في فوائد RS، وهو ما تم التحقق منه من خلال تدخل RS في الفئران الخالية من الجراثيم.
إنتاج المستقلبات المشتقة من الميكروبيوتا مرتبط بوظيفة البروبيوتيك. أحماض الصفراء هي مستقلبات إشارات هامة تربط ميكروبات الأمعاء بالمضيف. في هذا السياق، تم زيادة حمض الصفراء الثانوي، GDCA، بشكل ملحوظ بعد علاج RS، بينما أظهرت أحماض الصفراء الثانوية الأخرى، مثل DCA و7-ketoLCA وTDCA، ميلاً للزيادة. وقد تم الإبلاغ عن أن أحماض الصفراء الثانوية تحسن من تنكس الكبد الدهني وتزيد من حساسية الأنسولين. تقوم BSH بإزالة الاقتران من أحماض الصفراء في دراستنا، انخفضت وفرة جين BSH وأظهرت ارتباطًا كبيرًا مع B. vulgatus. وقد برز تثبيط نشاط BSH كنهج محتمل مفيد لتنظيم توازن الدهون والطاقة، مما أدى إلى زيادة في الأحماض الصفراوية المقترنة. في مجموعتنا، أظهرت الأحماض الصفراوية المقترنة، بما في ذلك GCA وGDCA وTDCA، اتجاهًا متزايدًا بعد علاج RS. يتماشى ذلك مع النتائج في البشر، حيث زادت GCA وDCA بشكل كبير بعد تدخل B. adolescentis في الفئران الخالية من الجراثيم. تعتبر GCA وDCA من المحفزات لمستقبل FXR ومستقبل البروتين G المرتبط بتاكيدا 5 (TGR5)، على التوالي، والتي تُعرف بأنها مستقبلات تنظم استقلاب الجلوكوز والدهون والطاقة. انخفض مستوى السيروم من الأحماض الأمينية المتفرعة السلسلة (BCAAs)، بما في ذلك الفالين والليوسين، بشكل ملحوظ بعد تدخل بكتيريا B. adolescentis في كل من البيئة التقليدية والبيئة الخالية من الجراثيم. كما انخفضت مستويات السيروم من الأحماض الأمينية المتفرعة السلسلة بعد تدخل RS في المشاركين الذين يعانون من مرض الكبد الدهني غير الكحولي (NAFLD). الإيزوبوتيرات البرازية، منتج ميكروبي من تحلل البروتينات للفالين ، انخفض بعد تدخل RS في دراستنا.
تم تعديل التفاعل بين تنظيم الطاقة والالتهاب بواسطة الميكروبيوم المعوي، مما أثر على نفاذية الأمعاء وولد عوامل مؤيدة للالتهاب أظهرت تأثيرات متغيرة على الصحة الأيضية. يتم الحفاظ على سلامة الغشاء المخاطي المعوي من خلال الوصلات الضيقة بين الخلايا، التي تعد من المنظمين الأساسيين لنفاذية الأمعاء. ارتفعت مستويات بروتينات الوصل الضيق، الأوكلاودين و ZO-1، في اللفائفي وانخفضت مستويات LPS المتداولة في الفئران التي تلقت ميكروبيوم مستحث بواسطة RS، مما يشير إلى آلية إضافية لحماية الحاجز المعوي بواسطة ميكروبيوم الأمعاء المعدل بواسطة RS. كانت الالتهابات المزمنة منخفضة الدرجة وتنشيط جهاز المناعة متورطة في تطور السمنة ومقاومة الأنسولين. يمكن أن يؤثر إدارة الوزن من خلال الميكروبيوم المعوي أيضًا من خلال تعديل البروتينات الإفرازية المعنية في استخدام الطاقة والتوازن الداخلي. من الجدير بالذكر أن تحليل الميتاجينوميات أظهر أن الزيادة في وفرة B. adolescentis بعد علاج RS كانت مرتبطة بشكل إيجابي مع ANGPTL4 في المصل. ANGPTL4
الشكل 7| تأثيرات RS في الفئران الخالية من الجراثيم مع وبدون B. adolescentis.
رسم تخطيطي لاستراتيجية مكملات B. adolescentis (B.a). تلقيح فموي لـ B. adolescentis أو PBS في الفئران الخالية من الجراثيم (GF) على أنظمة غذائية مع بروتين، 45% دهون و35% كربوهيدرات مستمدة (من 20% CS أو 20% RS والباقي من المالتوديكسترين) لمدة 8 أسابيع. وفرة من . تم قياس B. adolescentis كإجمالي عدد الصفائح في محتوى الأمعاء الغليظة. وحدة تشكيل المستعمرات (c.f.u.). ج، وزن الجسم بعد إزالة الأعضاء. د، منحنيات ارتفاع الجلوكوز لاختبارات تحمل الجلوكوز داخل البطن (GTTs). هـ، منحنيات ارتفاع الجلوكوز لاختبارات تحمل الأنسولين داخل البطن (ITTs). و، تركيبة كتلة الجسم. ز، بعد 8 أسابيع من مكملات B. adolescentis، تم تحديد نفاذية الأمعاء في الجسم الحي بواسطة
قياس تركيزات مصل DX-4000-FITC بعد ساعة من إعطائه عن طريق الفم. h، تعبير ZO-1 و occludin في اللفائفي. i، تعبير الجينات الالتهابية في الماوات. j، مستويات تعبير mRNA لـ ANGPTL4 في اللفائفي. k، نشاط الليباز المعوي النسبي. l، مستويات TG في اللفائفي. m، مستويات TG في البراز. البيانات هي متوسط س.م. التكرارات البيولوجية لكل مجموعة). و 0.03 (د) ، و ، و0.004 (أنا) ، استنادًا إلى تحليل التباين الأحادي (الموزع بشكل طبيعي) يليه اختبار دانيه أو اختبار كروسكال-واليس (غير الموزع بشكل طبيعي) يليه اختبار دُن. يشير إلى المقارنة بين RS و RS .
لقد حظيت باهتمام كبير فيما يتعلق بميكروبات الأمعاء. أظهرت الفئران الخالية من الجراثيم زيادة في تعبير ANGPTL4 المعوي مقارنة بالفئران التي تربى بشكل تقليدي. يساهم انخفاض مستويات ANGPTL4 في زيادة تراكم الدهون عند التحويل التقليدي من خلال زيادة نشاط LPL في الأنسجة الدهنية. أدى استعمار الفئران الخالية من الجراثيم ببكتيريا Bacteroides thetaiotaomicron المنتجة للأسيتات أو Methanobrevibacter smithii المنتجة للميثان إلى انخفاض تعبير ANGPTL4 في الأمعاء، بينما أدى استعمارها بالبكتيريا المنتجة للبيوتيرات Clostridium tyrobutyricum إلى زيادة ملحوظة في تعبير ANGPTL4 في الأمعاء. تفسير محتمل لهذه النتيجة هو أن تعديل ANGPTL4 المعوي يعتمد على تركيبة ميكروبات الأمعاء، التي تحدد مزيج المستقلبات الميكروبية المتكونة، جنبًا إلى جنب مع توفير الركيزة. باستخدام FMT، لاحظنا أن التغيرات التي يسببها RS في ميكروبيوم الأمعاء قللت من امتصاص الدهون من خلال تعديل ANGPTL4 المعوي. علاوة على ذلك، أدى استعمار الفئران البدينة الناتجة عن النظام الغذائي، التي تم تربيتها في بيئات تقليدية وخالية من الجراثيم، بواسطة B. adolescentis إلى زيادة ملحوظة في مستويات ANGPTL4 المعوي. وبالتالي، قد يكون تعديل نشاط الليباز البنكرياسي عبر ANGPTL4، وهو منظم رئيسي لامتصاص الدهون، من خلال تعديل ميكروبيوم الأمعاء، وسيلة حاسمة لتغيير تخزين الدهون في الجسم. يمكن أن يخفف مكمل B. adolescentis من NAFLD من خلال تعزيز حساسية FGF21 في الكبد. كشفت نتائجنا أيضًا أن العلاج بـ B. adolescentis زاد من حساسية FGF21 في الأنسجة الدهنية من خلال قمع مسار LPS-TLR4-NF-кB. أظهرت العديد من التجارب السريرية لبدائل ومقلدات FGF21 تحسينات في ملفات الدهون، وزيادة في الأديبونيكتين، وانخفاض في وزن الجسم. تم الكشف عن أن عكس مقاومة FGF21 الناتجة عن السمنة في الأنسجة الدهنية يمكن أن يكون نهجًا بديلاً لعلاج السمنة والأمراض المرتبطة بها. .
القيود الرئيسية للدراسة كانت حجم العينة الصغير نسبيًا ومعايير الإدراج الصارمة للمشاركين، مما يحد من تعميم النتائج. تحليلنا المعتمد على قاعدة البيانات والمستند إلى الأنواع، بينما يقدم معلومات شاملة ومفصلة بشكل جيد للتعيينات التصنيفية، يواجه أيضًا قيودًا مثل استبعاد التسلسلات التي يصعب تصنيفها وتجاهل التنوع الوظيفي على مستوى السلالات. نحن نعترف بأن دمج الجينومات المجمعة من الميتاجينوم يمكن أن يعزز فهمنا لعلم البيئة الميكروبية وقد يحسن تحديد العلامات الحيوية القوية للترجمة السريرية. يتطلب تعميم نتائجنا الأوسع مزيدًا من التحقق في مجموعات أكبر وأكثر تنوعًا. ستحتاج الدراسات المستقبلية إلى إيلاء اهتمام خاص للديناميات الفردية والاستجابات الوظيفية للميكروبات في مكملات RS. إن الفهم العميق للتفاعل بين الأحماض الصفراوية المعدلة بواسطة RS والميكروبات المعوية وتأثيرها على استقلاب المضيف يستحق مزيدًا من التحقيقات. على الرغم من أن قابلية التطبيق على مجموعات سكانية أخرى لا تزال غير مؤكدة، فإن دراستنا تقدم الدليل على أن RS ( يساعد النوع 2) كمكمل غذائي في تسهيل فقدان الوزن لدى الأفراد الذين يعانون من زيادة الوزن. كما توفر دراستنا تصميمًا غذائيًا فعالًا مع RS للتخفيف من تأثير المتغيرات المربكة الرئيسية التي تؤثر على ميكروبيوم الأمعاء. كان تغيير ميكروبيوتا الأمعاء المدفوع بـ RS ضروريًا لتأثيره. لعبت ميكروبيوتا الأمعاء دورًا محوريًا في آلية فقدان الوزن هذه، مما قد يؤثر على السمنة من خلال التفاعلات مع الالتهاب منخفض الدرجة وتنظيم البروتينات الإفرازية المتعلقة بتوازن الطاقة. من خلال تصميم التداخل، وجدنا أن الوزن قد استعيد خلال فترة الغسيل. استعادة الوزن هي واحدة من أكبر التحديات في علاج فقدان الوزن، والتي تحدث بعد التوقف عن تناول الأدوية، مثل ناهضات GLP-1 وحتى بعد جراحة السمنة. قد يكون الالتزام طويل الأمد بنمط غذائي غني بالألياف القابلة للتخمر (RS) للحفاظ على تركيبة الميكروبيوم أمرًا حاسمًا للحفاظ على الوزن. نظرًا لأن الألياف القابلة للتخمر تحدث بشكل طبيعي في الأطعمة ويمكن أيضًا إضافتها إلى الحميات اليومية، فإن نتائجنا توفر نمط حياة عملي لعلاج السمنة والاضطرابات الأيضية المرتبطة بها. قد يمثل تعديل تركيبة الميكروبات المعوية من خلال النظام الغذائي استراتيجية لتعديل توازن الطاقة لدى المضيف لتعزيز الصحة.

طرق

المشاركون في الدراسة

كانت معايير الإدراج هي (1) العمر من 18 إلى 55 عامًا و (2) زيادة الوزن أو السمنة، كما هو محدد بمؤشر كتلة الجسم أو محيط الخصر في الرجال و في النساء كانت معايير الاستبعاد هي المرض الحاد، استخدام المضادات الحيوية أو مكملات البروبيوتيك خلال الثلاثة أسابيع السابقة، تشخيص فرط نشاط الغدة الدرقية أو قصور الغدة الدرقية، السكري، العلاج الحالي بالكورتيكوستيرويدات الجهازية أو الأدوية التي تؤثر على استقلاب الجلوكوز، والمشاركة في تجارب سريرية أخرى خلال الأربعة أسابيع التي تسبق الدراسة.
تمت الموافقة على هذه الدراسة من قبل لجنة الأخلاقيات في مستشفى الشعب السادس في شنغهاي وتوافقت مع إعلان هلسنكي. تم الحصول على موافقة خطية مستنيرة من جميع المشاركين. تم إيداع تسجيل كامل للتجربة السريرية في السجل الصيني للتجارب السريرية (ChiCTR-TTRCC 13003333) (الشكل البياني الموسع 1).

البروتوكول العام للتجربة السريرية

تم تقديم بروتوكول الدراسة المفصل إلى المنصة العامة لإدارة التجارب السريرية الصينية وهو متاح في المعلومات التكميلية. استهلك الأفراد الذين يعانون من زيادة الوزن إما النشا المقاوم المستمد من الذرة (HAM-RS2، نشا الذرة Hi-Maize 260، 22000B00، المقدم من Ingredion) أو نشا الذرة المتطابق في الطاقة (AMIOCA cornstarch، 04400110، المقدم أيضًا من Ingredion) بالتناوب لمدة 8 أسابيع مع فترة غسيل مدتها 4 أسابيع. قام باحث مستقل بإجراء عملية التوزيع العشوائي وتخصيص المشاركين إلى مخططات التدخل CS-Washout-RS أو RS-Washout-CS بنسبة تخصيص 1:1. تم إنتاج جدول التوزيع العشوائي بواسطة SAS PROC PLAN في برنامج SAS. تم تعبئة RS وCS في أكياس مغلقة متطابقة مع مظهر متطابق، وكان المشاركون والباحثون غير مدركين لتخصيص المجموعات خلال فترة التعمية المزدوجة. كان مصمم البحث هو الشخص الوحيد الذي يعرف بجدول التوزيع العشوائي، بينما كان المشاركون والباحثون والموظفون السريريون ومقيّمو النتائج غير مدركين له. تم رفع التعمية خلال تحليل المعلومات الحيوية لاستكشاف الآلية المحتملة التي من خلالها منح ميكروبيوم الأمعاء الفوائد الفسيولوجية للنشا المقاوم.
خلال هذه الدراسة الغذائية، تلقى المشاركون نظامًا غذائيًا موحدًا، وفقًا للإرشادات الصينية والأمريكية للوقاية والسيطرة على البالغين الذين يعانون من زيادة الوزن والسمنة. . كان جميع المشاركين إما نشطين قليلاً أو يعيشون حياة خاملة. النظام الغذائي المقدم الوزن المثالي للجسم (الوزن المثالي للجسم (كجم) = الطول (سم) – 105) يوميًا، مع 50-60% كربوهيدرات، 25-30% دهون و15-20% بروتين. تم السماح للمشاركين بثمرة واحدة من الفاكهة يوميًا ونُصحوا بتجنب المشروبات أو الوجبات الخفيفة ذات السكر الزائد. قاموا بتدوين يوميات تسجل استهلاكهم الغذائي على مدى 24 ساعة متتالية (يومين من أيام الأسبوع ويوم واحد من عطلة نهاية الأسبوع) في البداية وعند بداية ونهاية كل فترة تدخل، مع ملاحظة أي انحرافات غذائية. قام أخصائي تغذية مدرب بتقييم استهلاك النشويات والالتزام بالنظام الغذائي خلال الزيارات. أظهرت بيانات النظام الغذائي متوسط استهلاك السعرات الحرارية ونسب المغذيات الكبيرة المماثلة في فترات التدخل RS وCS (الجدول التكميلي 1).
حضر المشاركون المعهد للزيارات (V) 1-10 (الشكل 1a). في بداية ونهاية كل تدخل (V1، V5، V6 وV10)، خضع المشاركون لعملية تثبيت الأنسولين العالي مع مستوى سكر الدم الطبيعي، واختبار تحمل الجلوكوز، ومسح الرنين المغناطيسي، وجمع العينات. تم إجراء تقييمات أنثروبومترية وكيميائية حيوية في كل زيارة. كانت النتيجة الرئيسية هي وزن الجسم، وكانت النتائج الثانوية تشمل VFA وSFA، ودهون الجسم، ومحيط الخصر، وملفات الدهون، وحساسية الأنسولين، والميتابولوم، والميكروبيوم المعوي.

التقييمات الأنثروبومترية والبيوكيميائية

بعد صيام ليلي لمدة لا تقل عن 10 ساعات، تم إجراء اختبار قياسات الجسم وجمع العينات (الدم الوريدي، البول والبراز) في الصباح وفقًا لبروتوكول الدراسة.
تم تخزين عينات المصل بعد الطرد المركزي في حتى قياس AST و ALT و GGT و HDL-C و LDL-C والأنسولين مصل A-FABP (AIS، HKU، 31030)، أديبونيكتين (AIS، HKU، 31010)، السيتوكينات الالتهابية (Ebiosciense، TNF ، BMS223HS؛ MCP-1، BMS281؛ IL-1 ،
تم قياس BMS224HS؛ IL-6، BMS213HS؛ IL-10، BMS215HS)، ANGPTL4 (BioVendor، RD191073200R) و FGF21 (AIS، HKU، 31180) بواسطة اختبار الامتزاز المناعي المرتبط بالإنزيم (ELISA). تم قياس مستويات LPS في المصل من خلال اختبار حساسية lysate amebocyte limulus (LAL) (Hycult Biotechnology، MAK109).

تجربة MTT

لتقييم استقلاب الجلوكوز، تم جمع عينات دم متسلسلة في كل من حالات الصيام وبعد الوجبة لإجراء اختبارات مخبرية بعد تناول وجبة قياسية (315.2 كيلو كالوري، بما في ذلك 68.4 جرام من الكربوهيدرات و10.4 جرام من البروتين) (شركة الصين للنفط والمواد الغذائية).

تثبيت الأنسولين العالي-السكر الطبيعي

تم تقييم حساسية الأنسولين من خلال تثبيت الأنسولين في حالة سكر الدم الطبيعي. تم الحفاظ على مستويات الأنسولين عند حوالي من خلال تسريب مستمر للأنسولين. للحفاظ على تركيز الجلوكوز في البلازما عند مستويات القاعدة، تم إجراء تسريب جلوكوز متغير وفقًا لمبدأ التغذية الراجعة السلبية. تم تنفيذ تقنية تثبيت الجلوكوز كما تم وصفها سابقًا. .

استخراج وتسلسل الحمض النووي من البراز

تم جمع عينات البراز من خلال أنبوب يحتوي على مثبت للحمض النووي (STRATEC Molecular) وتم تخزينها في تم استخراج الحمض النووي الجينومي البرازي من كل من البشر والفئران الذين تلقوا زراعة ميكروبيوم من متبرعين بشريين باستخدام مجموعة PSP Spin Stool DNA (STRATEC Molecular، 1038100) وفقًا لتعليمات الشركة المصنعة. تم اختيار مستخلصات الحمض النووي البرازي من 86 عينة (27 عينة قبل وبعد RS و16 عينة قبل وبعد CS) بشكل عشوائي من جميع المشاركين للتسلسل الميتاجينومي باستخدام تقنية الشوتغن. تم استخدام HiSeq 1500 لتسلسل الشوتغن الميتاجينومي بزوج من الأطراف بطول 100 قاعدة للعينات البشرية في مركز العلوم الجينومية بجامعة هونغ كونغ. تم استخدام منصة Illumina Novaseq 6000 لتسلسل بزوج من الأطراف بطول 150 قاعدة لعينات الفئران في Novogene. تم تخزين التسلسلات الخام في أرشيف قراءة التسلسل بالمركز الوطني للتكنولوجيا الحيوية (NCBI) (معرف المشروع PRJNA414688).

تحليل الميتاجينوميات

مراقبة الجودة لبيانات الميتاجينوم. استخدمنا سلسلة من خطوات مراقبة الجودة لإزالة القراءات/الأسس ذات الجودة المنخفضة كما تم وصفه سابقًا. . باختصار، تمت إزالة جميع تسلسلات البرايمر/الموصلات/الروابط الخاصة بإلومينا وتمت إزالة المناطق ذات الجودة المنخفضة (درجة الجودة تم تقليم القراءات. بعد ذلك، قمنا بخرائط جميع القراءات إلى الجينوم البشري باستخدام BWA v.0.7.4 (المرجع 52). تم إزالة القراءات التي تحتوي على >95% تطابق و90% تغطية كملوثات من الحمض النووي البشري.
تصنيف وتوصيف وظيفي. تم تحديد انتماءات التصنيف للقراءات بواسطة MetaPhlAn قمنا بتقطير أعلى 50 نوعًا من الأنواع الأكثر وفرة بناءً على متوسط الوفرة عبر جميع العينات (متوسط وفرة أدنى > 0.3%)، والتي شكلت من إجمالي الوفرة النسبية في كل عينة في المتوسط. كانت نسبة القراءات غير المصنفة هي (يعني س.د.) عبر جميع العينات. للتغلب على التحيز المحتمل الناتج عن الاختلافات الأساسية بين الأفراد داخل المجموعات ولتسهيل المقارنات بين المجموعات، قمنا بمقارنة أنماط التباين على مستوى المجتمع (استنادًا إلى التغير النسبي في وفرة الأنواع)، بدلاً من الهياكل المجتمعية الخام بين مجموعتين (استنادًا إلى الوفرة النسبية للأنواع). قمنا بحساب الـ بوفرة بعد العلاج لكل نوع. تم تطبيع قيم التغير النسبي (داخل جميع العينات في كل مجموعة) لتتراوح بين 0 و 1 وتم إعادة قياسها لجعل مجموع التغير النسبي المطبع يساوي واحدًا. كما قمنا بحساب مسافة براى-كورتيس بناءً على ملف التغير النسبي المطبع لوفرة الأنواع.
تم اختبار الأنواع المتنوعة بشكل مختلف بعد العلاج باستخدام RS أو CS باستخدام اختبار ويلكوكسون للرتب الموقعة، مع حد FDR قدره 0.2. تم تحليل ترتيب NMDS استنادًا إلى براي-كورتيس المنظم.
تم إجراء عدم التشابه في تغيير وفرة الأنواع على مستوى الأنواع، كما هو موضح أعلاه، باستخدام حزمة R VEGAN تم إجراء تصور الشبكة بواسطة Cytoscape 3 (المرجع 55).
إدبا-أود تم اعتماد تجميعات جديدة من الصفر مع -حجم المير يتراوح من 20 إلى 100 قاعدة. تم وصف الطريقة للتعليق الوظيفي وحساب الوفرة لمسارات KEGG في خادم على الإنترنت قمنا بتطويره. . باختصار، ميتا جين مارك تم استخدامه لتوقع الجينات الميكروبية. تم ربط قراءات الميتاجينوم مع القطع المجمعة للحصول على مستويات وفرة الحمض النووي على مستوى الجينات مع قراءات لكل كيلوباز لكل مليون (RPKM) من القراءات المربوطة. استخدمنا KOBAS لإضافة تعليقات على الأشكال المتماثلة ومسارات KEGG استنادًا إلى الجينات المعلّمة. سكريبتات من خوادمنا المنشورة تم استخدامها لحساب RPKM المجمع لكل مسار.
تحليلات ارتباط الميتاجينوميات. تم إجراء نمذجة خطية عامة باستخدام حزمة R glmulti. بالنسبة لكل نمط ظاهري، كانت المتغيرات المستجيبة هي نسبة التغير في النمط الظاهري؛ وكانت المتغيرات المستقلة من مجموعة فرعية من نسبة التغير لـ 12 نوعًا مع FDR. في التحليل المتنوع بشكل مختلف باستخدام اختبار ويلكوكسون لمجموع الرتب. بدأت النماذج الخطية من ‘الظاهرة ، توليد جميع النماذج الممكنة للوصول إلى أفضل نموذج مع اختيارات الميزات. تم حساب أهمية متغير نوع معين كنسبة من الأوزان/الاحتمالات الإجمالية للنماذج التي تحتوي على المتغير خلال اختيار النموذج التلقائي بناءً على AIC المصحح. يعكس هذا المؤشر الأهمية الدعم العام لجميع النماذج الخطية الموزونة الممكنة. تم اعتبار التأثيرات الرئيسية فقط في النماذج الخطية العامة. تم حساب قيمة متغير نوع معين باستخدام طريقة فيشر للجمع بين القيمة بين أفضل عشرة نماذج.
لتحديد العلاقة بين (1) الأنماط الظاهرة والمواد الأيضية، (2) ميكروبات الأمعاء ومواد الدم الأيضية و(3) مسارات ميكروبات الأمعاء ومواد الدم الأيضية، اعتمدنا على تحليل التمييز باستخدام المربعات الصغرى الجزئية (PLS-DA) باستخدام حزمة mixOmics. في R. تم تعيين عدد المكونات إلى 2 وتم تقدير عدد الميزات لكل مكون بناءً على تحسين المعلمات الفائقة.

تحليل الميتابولوميات لعينات مصل الإنسان

تم قياس بيانات الميتابولوميات غير المستهدفة في المصل من خلال نظام HPLC من شيمادزو بروميننس (شيمادزو) متصل بجهاز LTQ Orbitrap Velos (ثيرمو فيشر ساينتيفيك) في مختبر كاس الرئيسي لعلوم الفصل في الكيمياء التحليلية. كانت تفاصيل ظروف التحليل كما هو موصوف في دراسة سابقة. تمت عملية قياس ملفات أحماض الصفراء بواسطة Metabo-Profile .

تحليل الميتابولوميات لعينات البراز البشرية

تم قياس بيانات الميتابولوميات لعينات البراز البشري بواسطة GC-TOF-MS (جهاز كروماتوغرافيا الغاز Agilent 6890 N متصل بجهاز LECO Pegasus HT TOFMS). تفاصيل ظروف التحليل كما تم وصفها في دراسة سابقة. .

تقييم الدهون البرازية

تم استخراج الدهون البرازية من براز المشاركين بعد تدخلات RS أو CS لمدة 8 أسابيع باستخدام طرق منشورة. تم تحميض حوالي 100 ملغ من البراز المجفف بالتجميد بـ الإيثانول و حمض الهيدروكلوريك 8N، ثم تم الاحتفاظ به في حمام مائي عند لمدة 40 دقيقة. تم استخراج الأحماض الدهنية بعد ذلك باستخدام إيثر ثنائي الإيثيل و الإيثر البترولي. بعد تصفية طبقة الإيثر-الدهون العليا، تم جمع محلول الإيثر النقي واحتفظ به في مبخر دوار لمدة ساعة واحدة عند تم إعادة إذابة الأحماض الدهنية في الإيثانول وتم قياس NEFA و TC و TG بعد ذلك باستخدام اختبارات إنزيمية (Jiancheng، A042-1-1، A111-1-1 و A110-1-1، على التوالي).

نموذج الفأر

وافقت اللجنة المعنية باستخدام الحيوانات الحية للتعليم والبحث في جامعة هونغ كونغ ولجنة أخلاقيات الحيوانات في مستشفى الشعب السادس في شنغهاي على إجراءات التجارب الحيوانية. تم تربية ذكور الفئران الصحية من سلالة C57BL/6J بشكل تقليدي في
منشأة حواجز خالية من مسببات الأمراض المحددة في أقفاص ذات تهوية فردية بحد أقصى أربعة فئران لكل قفص، مع وصول حر إلى الطعام والماء تحت دورة ضوء وظلام صارمة مدتها 12 ساعة عند درجة حرارة مضبوطة. ) و الرطوبة. بالنسبة لتجارب FMT، تم تغذية ذكور الفئران C57BL/6J المعالجة بالمضادات الحيوية (GemParmatech، N000013) التي تبلغ من العمر 10 أسابيع بنظام غذائي غربي (Research Diet، D12451) لمدة أسبوعين قبل وأثناء الاستعمار. لإعطاء B. adolescentis للفئران التي تم تربيتها تقليديًا، تم تغذية ذكور تبلغ من العمر ثمانية أسابيع بنفس الطريقة لمدة 8 أسابيع قبل . إدارة ب. أدوليسنتيس. للتدخل مع ب. أدوليسنتيس في الفئران التي تعيش في بيئة خالية من الجراثيم، تم الاحتفاظ بفئران ذكرية من سلالة C57BL/6J بعمر 5 أسابيع في عوازل (GemParmatech، N000295) وتم تغذيتها بنظام غذائي C35 (45% دهون، 20% بروتين و35% كربوهيدرات مستمدة من أو 20% من CS، و80% المتبقية من المالتوديكسترين) لمدة 10 أسابيع. في هذه الأثناء، تم تلقيح الفئران عن طريق الفم بـ . المراهقين أو PBS لمدة 8 أسابيع المتبقية.

تجربة FMT

تم إعطاء الفئران المعالجة بالمضادات الحيوية والتي تعاني من نقص في الميكروبيوم جرعة يومية عن طريق الفم مع كوكتيل المضادات الحيوية (أمبيسيلين نيوميسين ميترونيدازول وفانكومايسين ) لمدة 7 أيام، تليها فترة غسل بالمضادات الحيوية لمدة 4 أيام قبل زراعة البراز. بالنسبة لزراعة البراز، تم إعداد عينات البراز الطازجة والعملية اللاحقة في الفئران كما تم وصفه سابقًا .
تم قياس وزن الجسم كل 3 أو 4 أيام. تم جمع عينات البراز قبل وبعد زراعة البراز وتم تخزينها على الفور في حتى يتم إجراء مزيد من التحليل. تم تحديد تكوين الجسم باستخدام جهاز تحليل تكوين الجسم Minispec LF90 (Bruker). تم الوصول إلى نفاذية الأمعاء في الجسم الحي، واختبارات تحمل الجلوكوز، واختبارات تحمل الأنسولين، واستهلاك الأكسجين في الجسم بالكامل من خلال نظام شامل لمراقبة الحيوانات المخبرية (Columbus Instruments). . تم تحديد كتلة الدهون في الأنسجة الدهنية البيضاء تحت الجلد الإربي، والإبيديديمال، وحول الكلى، والميزنتيري بعد الوفاة من خلال قياسات الوزن الرطب. تم جمع الدم والأنسجة المختلفة لإجراء تقييمات كيميائية حيوية إضافية. لم يكن هناك إخفاء للمحققين عن تخصيصات المجموعات ولم يتم استبعاد أي من الفئران.

سلالة بكتيرية

تم شراء سلالة B. adolescentis E 298 b (النوع c) (رقم DSMZ 20086) من DSMZ. تم إعداد وسط الثقافة وفقًا لموقع DSMZ و . تم زراعة B. adolescentis في محطة عمل لاهوائية (Gene Science AG300). تم زراعة B. adolescentis لاهوائيًا في وسط DSMZ 58 المعقم الذي يحتوي على كازين بيبتون (هضم تريبتك، سيغما-ألدريتش)، مستخلص الخميرة (سيغما-ألدريتش)، مستخلص اللحم (سيغما-ألدريتش)، باكتو سويوتون (BD)، جلوكوز (سيغما-ألدريتش)، , , تويين , سيستين-

(سيغما-ألدريتش)، محلول ملحي و

ريزازورين (سيغما-ألدريتش). تم مراقبة نقاء الثقافات من خلال صبغة جرام وتم عد c.f.u. عن طريق زراعة تخفيفات متسلسلة على أطباق الأجار. إدارة B. adolescentis تم جمع B. adolescentis من خلال الطرد المركزي عند لمدة 30 دقيقة عند ، تلاها غسيل مزدوج بمحلول PBS معقم ثم أعيد تعليقها في 2 مل من PBS معقم لاهوائي يحتوي على غليسرول، محققًا c.f.u. لكل مل. تم حفظ هذا التعليق عن طريق التخزين عند . قبل إضافة مياه الشرب للفئران، تم إذابة مخزون B. adolescentis الحي عند وتم تخفيفه في 100 مل من الماء المعقم. في المتوسط، حصلت كل فأر على الأقل على c.f.u. في اليوم. تم قتل B. adolescentis حراريًا عند تحت ضغط 225 كيلوباسكال لمدة 15 دقيقة. تم إجراء اختبارات تأكيد الحية عن طريق الزراعة، مما أظهر أن B. adolescentis المقتول حراريًا لم ينمو، بينما نمت B. adolescentis الحية بشكل جيد. تم تغيير مياه الشرب يوميًا في المجموعات الثلاث خلال التجربة. بالإضافة إلى ذلك، تم علاج الفئران GF بمحلول PBS أو c.f.u. من B. adolescentis الحية في

PBS معقم لاهوائي عن طريق التغذية ثلاث مرات في الأسبوع لمدة 8 أسابيع.

التحليلات الكيميائية الحيوية والمناعية في الفئران تم قياس مستويات TC وTG في المصل بالإضافة إلى TG داخل الكبد والأمعاء والبراز من خلال التحليل الإنزيمي (مختبر ستانبيو، 2100430 و1100430). تم قياس NEFA في المصل من خلال التحليل الإنزيمي (روش داياغنوستكس). تم قياس الأديبونيكتين في المصل (AIS، HKU، 32010)، ANGPTL4 (أبكام، ab210577)، جزيئات المصل الالتهابية (eBioscience، MCP-1، BMS6005؛ IL-1

, BMS6002؛ IL-6، BMS603-2؛ IL-10، BMS614INST) وFGF21 (Immunodiagnostics Limited، 32180) باستخدام ELISA. تم قياس مستويات LPS في الأنسجة الدهنية البيضاء الميزنتيرية والمصل من خلال اختبار LAL (Hycult Biotechnology، HIT302).

تحليل الميتابولوميات لعينات الفئران تحليل الأحماض الأمينية. تم قياس الأحماض الأمينية المستهدفة باستخدام مجموعة اشتقاق Waters AccQ-Tag مع المصل بواسطة جهاز Nexera X2 ultra HPLC المزود بنظام ثلاثي رباعي 8050 (شيمادزو). تفاصيل الحالة التحليلية كما هو موضح في دراسة سابقة
. تحليل أحماض الصفراء. تم تحليل أحماض الصفراء المستهدفة بواسطة نظام Vanquish UPLC-Q Exactive (ثيرمو فيشر العلمية). تم استخراج أحماض الصفراء في عينة المصل ( ) بواسطة ميثانول يحتوي على معايير داخلية. تم إجراء اكتشاف القمة والتكامل باستخدام Trancefinder (ثيرمو فيشر). تم استخدام النتائج التي تم قياسها بواسطة منحنى القياس لتحليل الميزات. تفاصيل إعداد العينة والحالات التحليلية موضحة كما هو في دراسة سابقة
. تحليل SCFA. لتحضير العينة، تم خلط المصل مع أسيتونيتريل يحتوي على المعيار الداخلي حمض البوتيريك-d7. بعد الخلط والطرد المركزي، تم سحب السائل العلوي للتحليل اللاحق. بالنسبة لعينة البراز، تم خلط 40 ملغ من البراز مع كرة طحن مع من الأسيتونيتريل الذي يحتوي على مستخلص المعيار الداخلي، المعيار الداخلي حمض البوتيريك-d7
. بعد الطحن والطرد المركزي، تم سحب السائل العلوي للتحليل اللاحق. لأغراض القياس التحليلي، تم استخدام جهاز Agilent 5977A المزود بنظام كروماتوغرافيا الغاز الكتلي (GCMS) (Agilent) لتحليل SCFA. تم اعتماد عمود DB-FFAP ( , Agilent) لفصل GC. كانت درجة الحرارة الأولية هي وتم الحفاظ عليها لمدة 1 دقيقة، ثم زادت إلى عند ، ثم ارتفعت فورًا إلى عند وتم الحفاظ عليها لمدة دقيقتين. تم الحفاظ على معدل تدفق غاز الهيليوم الناقل عند . كانت درجات حرارة المحقن، مصدر الأيونات، الرباعي والواجهة هي و ، على التوالي. تم تنفيذ وضع مراقبة الأيونات المختارة من خلال اكتشاف الجزيئات المؤينة عند لحمض الأسيتيك وحمض الإيزوبيوتيريك، لحمض البروبيونيك و

لأحماض SCFA الأخرى. تم إجراء اكتشاف القمة والتكامل باستخدام التحليل الكمي (Agilent). تم استخدام النتائج التي تم قياسها بواسطة منحنى القياس لتحليل الميزات. تم إجراء جميع ملفات الميتابولوميات في الفئران في مختبر CAS الرئيسي لعلوم الفصل الكيميائي.

اختبار استجابة FGF21 بعد فترة تدخل B. adolescentis لمدة 8 أسابيع، تم إجراء اختبار استجابة FGF21 في الفئران التي تم تربيتها تقليديًا. تحت التخدير العام، تم أخذ خزعة دهنية تحت الجلد وتم تجميدها بسرعة في النيتروجين السائل. بعد ذلك، تم حقن

FGF21 الفأري المعاد تركيبه أو مركبة عبر الوريد عبر الوريد الأجوف السفلي. بعد 15 دقيقة، تم أخذ خزعة دهنية تحت الجلد الثانية لتقييم التعبير الجيني وفوسفاتة Erk1/2.

اختبارات PCR الكمية
تم استخراج RNA الكلي من عينات الأنسجة بواسطة TRIzol (Invitrogen) وتم تحويله عكسيًا إلى DNA مكمل باستخدام إنزيم النسخ العكسي ImProm-II (Promega). تم إجراء تفاعلات PCR الكمي مع النسخ العكسي (RT-qPCR) باستخدام مجموعة خلط SYBR Green (QIAGEN) على نظام Light Cycler 480 (روش)، وتم تطبيع النتائج باستخدام GAPDH الفأري. تم إدراج البرايمرات لكل جين وB. adolescentis في الجدول التكميلي 11.

الفحص النسيجي

تم معالجة مقاطع الأمعاء الدقيقة بأجسام مضادة ZO-1 أو أوكلودين (أبكام، تخفيف 1:500، ab96587؛ تخفيف، ab216327)، تلاها حضانة مع أجسام مضادة ثانوية مرتبطة بألكس فلور-596 أو FITC (تقنيات الحياة) وصبغ مضاد مع DAPI. تم معالجة مقاطع الأمعاء الدقيقة بأجسام مضادة ANGPTL4 (بروتين تك، تخفيف 1:500، 18374-1-AP)، تلاها حضانة مع أجسام مضادة ثانوية موسومة بإنزيم البيروكسيداز (DAKO)، تم تطويرها بواسطة DAB وفقًا لتوصيات الشركة المصنعة. تم اختيار خمسة مجالات عشوائية من مناطق مختلفة من المقاطع الفردية لقياس الصور. تم استخدام برنامج ImageJ لتحليل شدة الصبغة الإيجابية، والتي تمثل كنسبة مئوية من إجمالي مساحة الآفة أو الزغابات في كل مجال.

نشاط الليباز اللميني

تم خلط مزيج المحتوى اللميني من الأمعاء الدقيقة مع PBS بارد جدًا، وتم خلطه جيدًا، ثم تم الطرد المركزي عند عند لمدة 10 دقائق. تم جمع السائل العلوي وتخفيفه في PBS لقياس نشاط الليباز عبر مجموعة اختبار نشاط الليباز (سيغما، MAK109) وفقًا لبروتوكول الشركة المصنعة.

التحليل الغربي

تم استخراج بروتينات WAT باستخدام محلول تحلل يحتوي على مثبطات البروتياز (ST505، بييوتيم) ومثبطات الفوسفاتاز (P1082، بييوتيم). تم فصل عينات البروتين بواسطة SDS-PAGE (8%) وتم نقلها إلى أغشية بولي فينيليدين فلوريد. تم إجراء التحليل الغربي باستخدام إنزيم كيناز البروتين المنظم للإشارة الخارجية 1/2 (Erk1/2) (Cell Signalling Technology، تخفيف 1:1000، 9102) وErk1/2 الفوسفوري (Thr202/ Tyr204) (Cell Signalling Technology، تخفيف 1:1000، 9101). تم اكتشاف التفاعل المناعي باستخدام التصوير الشعاعي المعزز للومضات الكيميائية (Millipore). تم إجراء قياس الشريط باستخدام برنامج ImageJ.

التحليل الإحصائي

خطة التحليل الإحصائي لهذه الدراسة متاحة في المعلومات التكميلية. سهل EpiData v.3.1 إدخال البيانات السريرية والتوثيق. تم استخدام التحليلات الإحصائية ما لم يُذكر خلاف ذلك، باستخدام برنامج SPSS v. 17 وR v.3.3.2. تم تقديم البيانات السريرية الموزعة بشكل طبيعي كمتوسط تم تقديم البيانات غير الموزعة بشكل طبيعي، التي تم التحقق منها بواسطة اختبار كولموغوروف-سميرنوف، كوسائط ونطاقات interquartile. تم تحليل تأثيرات التدخل على النتائج باستخدام نموذج مختلط خطي تم تعديله حسب العمر والجنس وترتيب التدخل، مع تعديل بونفيروني لتصحيح الاختبارات المتعددة. في الدراسات الحيوانية، تم تقييم توزيع البيانات وتساوي التباين باستخدام اختبار شابيرو-ويلك واختبار ليفين. بالنسبة للمقارنات بين مجموعتين، تم استخدام اختبار ستودنت غير المتزاوج ذو الطرفين. تم تطبيق اختبار -test (الموزع طبيعياً) أو اختبار ويلكوكسون للرتب (غير الموزع طبيعياً). بين المجموعات المتعددة، تم استخدام تحليل التباين الأحادي (الموزع طبيعياً) يليه اختبار توكي بعد ذلك أو اختبار كروسكال-واليس (غير الموزع طبيعياً) يليه اختبار دان. في الدراسة السريرية، استناداً إلى الأدبيات والبيانات الأولية، تم تقدير التغير المتوقع في وزن الجسم والانحراف المعياري له بعد تدخل RS كـ اختبار ذو طرفين بمستوى دلالة 0.05 و تطلبت القوة الحد الأدنى من حجم العينة 31. تم دعوة سبعة وثلاثين مشاركًا للتعويض عن المتوقع التخلي بعد التوزيع العشوائي. بالنسبة للدراسات الحيوانية، تم تقدير أحجام العينات بناءً على الأبحاث السابقة وتباين الاختبارات. ذو جانبين القيم < 0.05 اعتُبرت ذات دلالة إحصائية.

ملخص التقرير

معلومات إضافية حول تصميم البحث متاحة في ملخص تقارير مجموعة نيتشر المرتبط بهذه المقالة.

توفر البيانات

يمكن الوصول إلى بيانات المرضى على مستوى الفرد بموافقة لجنة إدارة البيانات من المؤسسات وليست متاحة للجمهور. ستقوم لجنة إدارة البيانات بمراجعة جميع الطلبات ومنح الوصول (إذا كانت ناجحة). سيكون من الضروري وجود اتفاقية نقل بيانات رسمية عند الموافقة. بشكل عام، سيتم الرد على جميع الطلبات للوصول إلى البيانات في غضون شهر واحد. جميع البيانات المشتركة ستكون مجهولة الهوية. تم إيداع بيانات التسلسل الميتاجينومي الخام في أرشيف تسلسل NCBI تحت معرف الوصول PRJNA414688 وهي متاحة للجمهور اعتبارًا من تاريخ النشر. أي معلومات إضافية مطلوبة لإعادة تحليل البيانات المبلغ عنها في هذه الورقة متاحة من جهة الاتصال الرئيسية W.J.wpjia@sjtu.edu.cnعند الطلب. يتم توفير بيانات المصدر مع هذه الورقة.

توفر الشيفرة

لم يتم استخدام أي كود مخصص في هذه الورقة. جميع الأكواد والأدوات المتاحة للجمهور التي تم استخدامها لتحليل البيانات تم الإبلاغ عنها والإشارة إليها في الأساليب.

References

  1. Waxman, A. & World Health, A. WHO global strategy on diet, physical activity and health. Food Nutr. Bull. 25, 292-302 (2004).
  2. Torres-Fuentes, C., Schellekens, H., Dinan, T. G. & Cryan, J. F. The microbiota-gut-brain axis in obesity. Lancet Gastroenterol. Hepatol. 2, 747-756 (2017).
  3. Backhed, F. et al. The gut microbiota as an environmental factor that regulates fat storage. Proc. Natl Acad. Sci. USA 101, 15718-15723 (2004).
  4. Turnbaugh, P. J. et al. An obesity-associated gut microbiome with increased capacity for energy harvest. Nature 444, 1027-1031 (2006).
  5. Kootte, R. S. et al. Improvement of insulin sensitivity after lean donor feces in metabolic syndrome is driven by baseline intestinal microbiota composition. Cell Metab. 26, 611-619 e616 (2017).
  6. de Groot, P. et al. Donor metabolic characteristics drive effects of faecal microbiota transplantation on recipient insulin sensitivity, energy expenditure and intestinal transit time. Gut 69, 502-512 (2020).
  7. Carmody, R. N. & Bisanz, J. E. Roles of the gut microbiome in weight management. Nat. Rev. Microbiol. 21, 535-550 (2023).
  8. Gibson, G. R. et al. Expert consensus document: The International Scientific Association for Probiotics and Prebiotics (ISAPP) consensus statement on the definition and scope of prebiotics. Nat. Rev. Gastroenterol. Hepatol. 14, 491-502 (2017).
  9. Delannoy-Bruno, O. et al. Evaluating microbiome-directed fibre snacks in gnotobiotic mice and humans. Nature 595, 91-95 (2021).
  10. Bindels, L. B., Delzenne, N. M., Cani, P. D. & Walter, J. Towards a more comprehensive concept for prebiotics. Nat. Rev. Gastroenterol. Hepatol. 12, 303-310 (2015).
  11. Englyst, H. N. & Cummings, J. H. Digestion of the polysaccharides of some cereal foods in the human small intestine. Am. J. Clin. Nutr. 42, 778-787 (1985).
  12. Higgins, J. A. Resistant starch and energy balance: impact on weight loss and maintenance. Crit. Rev. Food Sci. Nutr. 54, 1158-1166 (2014).
  13. Wali, J. A. et al. Impact of dietary carbohydrate type and protein-carbohydrate interaction on metabolic health. Nat. Metab. 3, 810-828 (2021).
  14. Robertson, M. D. et al. Insulin-sensitizing effects on muscle and adipose tissue after dietary fiber intake in men and women with metabolic syndrome. J. Clin. Endocrinol. Metab. 97, 3326-3332 (2012).
  15. Johnston, K. L., Thomas, E. L., Bell, J. D., Frost, G. S. & Robertson, M. D. Resistant starch improves insulin sensitivity in metabolic syndrome. Diabet. Med. 27, 391-397 (2010).
  16. Maki, K. C. et al. Resistant starch from high-amylose maize increases insulin sensitivity in overweight and obese men. J. Nutr. 142, 717-723 (2012).
  17. Coate, K. C. & Huggins, K. W. Consumption of a high glycemic index diet increases abdominal adiposity but does not influence adipose tissue pro-oxidant and antioxidant gene expression in C57BL/6 mice. Nutr. Res. 30, 141-150 (2010).
  18. Charrier, J. A. et al. High fat diet partially attenuates fermentation responses in rats fed resistant starch from high-amylose maize. Obesity 21, 2350-2355 (2013).
  19. DeMartino, P. & Cockburn, D. W. Resistant starch: impact on the gut microbiome and health. Curr. Opin. Biotechnol. 61, 66-71 (2020).
  20. Chen, C., Lu, F. C. & Department of Disease Control Ministry of Health, PR China. The guidelines for prevention and control of overweight and obesity in Chinese adults. Biomed. Environ. Sci. 17, 1-36 (2004).
  21. Jensen, M. D. et al. 2013 AHA/ACC/TOS guideline for the management of overweight and obesity in adults: a report of the American College of Cardiology/American Heart Association Task Force on Practice Guidelines and The Obesity Society. Circulation 129, S102-S138 (2014).
  22. Cox, A. J., West, N. P. & Cripps, A. W. Obesity, inflammation, and the gut microbiota. Lancet Diabetes Endocrinol. 3, 207-215 (2015).
  23. Martinez-Guryn, K. et al. Small intestine microbiota regulate host digestive and absorptive adaptive responses to dietary lipids. Cell Host Microbe 23, 458-469 (2018).
  24. Geng, L., Lam, K. S. L. & Xu, A. The therapeutic potential of FGF21 in metabolic diseases: from bench to clinic. Nat. Rev. Endocrinol. 16, 654-667 (2020).
  25. Baxter, N. T. et al. Dynamics of human gut microbiota and short-chain fatty acids in response to dietary interventions with three fermentable fibers. mBio 10, e02566-18 (2019).
  26. Kadyan, S., Sharma, A., Arjmandi, B. H., Singh, P. & Nagpal, R. Prebiotic potential of dietary beans and pulses and their resistant starch for aging-associated gut and metabolic health. Nutrients 14, 1726 (2022).
  27. Vital, M. et al. Metagenomic insights into the degradation of resistant starch by human gut microbiota. Appl. Environ. Microbiol. 84, e01562-18 (2018).
  28. Krautkramer, K. A., Fan, J. & Backhed, F. Gut microbial metabolites as multi-kingdom intermediates. Nat. Rev. Microbiol. 19, 77-94 (2021).
  29. Heianza, Y. et al. Changes in gut microbiota-related metabolites and long-term successful weight loss in response to weight-loss diets: the POUNDS Lost trial. Diabetes Care 41, 413-419 (2018).
  30. Adams, S. H. Emerging perspectives on essential amino acid metabolism in obesity and the insulin-resistant state. Adv. Nutr. 2, 445-456 (2011).
  31. Foley, M. H., O’Flaherty, S., Barrangou, R. & Theriot, C. M. Bile salt hydrolases: gatekeepers of bile acid metabolism and host-microbiome crosstalk in the gastrointestinal tract. PLoS Pathog. 15, e1007581 (2019).
  32. Mattijssen, F. et al. Angptl4 serves as an endogenous inhibitor of intestinal lipid digestion. Mol. Metab. 3, 135-144 (2014).
  33. Higgins, J. A. et al. Resistant starch and exercise independently attenuate weight regain on a high fat diet in a rat model of obesity. Nutr. Metab. 8, 49 (2011).
  34. Wahlstrom, A., Sayin, S. I., Marschall, H. U. & Backhed, F. Intestinal crosstalk between bile acids and microbiota and its impact on host metabolism. Cell Metab. 24, 41-50 (2016).
  35. Upadhyaya, B. et al. Impact of dietary resistant starch type 4 on human gut microbiota and immunometabolic functions. Sci. Rep. 6, 28797 (2016).
  36. Ravussin, Y. et al. Responses of gut microbiota to diet composition and weight loss in lean and obese mice. Obesity 20, 738-747 (2012).
  37. Zhang, L. et al. Metabolic phenotypes and the gut microbiota in response to dietary resistant starch type 2 in normal-weight subjects: a randomized crossover trial. Sci. Rep. 9, 4736 (2019).
  38. Bendiks, Z. A., Knudsen, K. E. B., Keenan, M. J. & Marco, M. L. Conserved and variable responses of the gut microbiome to resistant starch type 2. Nutr. Res. 77, 12-28 (2020).
  39. Golden, J. M. et al. Ursodeoxycholic acid protects against intestinal barrier breakdown by promoting enterocyte migration via EGFR- and COX-2-dependent mechanisms. Am. J. Physiol. Gastrointest. Liver Physiol. 315, G259-G271 (2018).
  40. Quintero, P. et al. Bile acid supplementation improves established liver steatosis in obese mice independently of glucagon-like peptide-1 secretion. J. Physiol. Biochem. 70, 667-674 (2014).
  41. Nie, B. et al. Specific bile acids inhibit hepatic fatty acid uptake in mice. Hepatology 56, 1300-1310 (2012).
  42. Schneider, K. M., Albers, S. & Trautwein, C. Role of bile acids in the gut-liver axis. J. Hepatol. 68, 1083-1085 (2018).
  43. Ni, Y. et al. Resistant starch decreases intrahepatic triglycerides in patients with NAFLD via gut microbiome alterations. Cell Metab. 35, 1530-1547 (2023).
  44. Jaskiewicz, J. et al. Catabolism of isobutyrate by colonocytes. Arch. Biochem. Biophys. 327, 265-270 (1996).
  45. Oliphant, K. & Allen-Vercoe, E. Macronutrient metabolism by the human gut microbiome: major fermentation by-products and their impact on host health. Microbiome 7, 91 (2019).
  46. Dijk, W. & Kersten, S. Regulation of lipoprotein lipase by Angptl4. Trends Endocrinol. Metab. 25, 146-155 (2014).
  47. Long, X. et al. Bifidobacterium adolescentis alleviates liver steatosis and steatohepatitis by increasing fibroblast growth factor 21 sensitivity. Front. Endocrinol. 12, 773340 (2021).
  48. Geng, L. et al. Exercise alleviates obesity-induced metabolic dysfunction via enhancing FGF21 sensitivity in adipose tissues. Cell Rep. 26, 2738-2752 (2019).
  49. van Baak, M. A. & Mariman, E. C. M. Mechanisms of weight regain after weight loss – the role of adipose tissue. Nat. Rev. Endocrinol. 15, 274-287 (2019).
  50. Jia, W. et al. Association of serum retinol-binding protein 4 and visceral adiposity in Chinese subjects with and without type 2 diabetes. J. Clin. Endocrinol. Metab. 92, 3224-3229 (2007).
  51. Li, J. et al. Probiotics modulated gut microbiota suppresses hepatocellular carcinoma growth in mice. Proc. Natl Acad. Sci. USA 113, E1306-E1315 (2016).
  52. Li, H. & Durbin, R. Fast and accurate short read alignment with Burrows-Wheeler transform. Bioinformatics 25, 1754-1760 (2009).
  53. Segata, N. et al. Metagenomic microbial community profiling using unique clade-specific marker genes. Nat. Methods 9, 811-814 (2012).
  54. Dixon, P. VEGAN, a package of functions for community ecology. J. Vegetation Sci. 14, 927-930 (2003).
  55. Shannon, P. et al. Cytoscape: a software environment for integrated models of biomolecular interaction networks. Genome Res. 13, 2498-2504 (2003).
  56. Peng, Y., Leung, H. C., Yiu, S. M. & Chin, F. Y. IDBA-UD: a de novo assembler for single-cell and metagenomic sequencing data with highly uneven depth. Bioinformatics 28, 1420-1428 (2012).
  57. Ni, Y., Li, J. & Panagiotou, G. COMAN: a web server for comprehensive metatranscriptomics analysis. BMC Genomics 17, 622 (2016).
  58. Zhu, W., Lomsadze, A. & Borodovsky, M. Ab initio gene identification in metagenomic sequences. Nucleic Acids Res. 38, e132 (2010).
  59. Xie, C. et al. KOBAS 2.0: a web server for annotation and identification of enriched pathways and diseases. Nucleic Acids Res. 39, W316-W322 (2011).
  60. Rohart, F., Gautier, B., Singh, A. & Le Cao, K. A. mixOmics: an package for ‘omics feature selection and multiple data integration. PLoS Comput. Biol. 13, e1005752 (2017).
  61. Liu, R. et al. Gut microbiome and serum metabolome alterations in obesity and after weight-loss intervention. Nat. Med. 23, 859-868 (2017).
  62. Xie, G. et al. Dysregulated hepatic bile acids collaboratively promote liver carcinogenesis. Int J. Cancer 139, 1764-1775 (2016).
  63. Xie, G. et al. Profiling of serum bile acids in a healthy Chinese population using UPLC-MS/MS. J. Proteome Res. 14, 850-859 (2015).
  64. Lan, K. et al. Key role for the 12 -hydroxy group in the negative ion fragmentation of unconjugated c24 bile acids. Anal. Chem. 88, 7041-7048 (2016).
  65. Zhao, L. et al. High throughput and quantitative measurement of microbial metabolome by gas chromatography/mass spectrometry using automated alkyl chloroformate derivatization. Anal. Chem. 89, 5565-5577 (2017).
  66. Govers, M. J. & Van der Meet, R. Effects of dietary calcium and phosphate on the intestinal interactions between calcium, phosphate, fatty acids, and bile acids. Gut 34, 365-370 (1993).
  67. Cho, K. D., Han, C. K. & Lee, B. H. Loss of body weight and fat and improved lipid profiles in obese rats fed apple pomace or apple juice concentrate. J. Med. Food 16, 823-830 (2013).
  68. Wong, C. M. et al. Adropin is a brain membrane-bound protein regulating physical activity via the NB-3/Notch signaling pathway in mice. J. Biol. Chem. 289, 25976-25986 (2014).
  69. Zhang, Y. et al. Gut microbiome-related effects of berberine and probiotics on type 2 diabetes (the PREMOTE study). Nat. Commun. 11, 5015 (2020).
  70. Haarman, M. & Knol, J. Quantitative real-time PCR assays to identify and quantify fecal Bifidobacterium species in infants receiving a prebiotic infant formula. Appl. Environ. Microbiol. 71, 2318-2324 (2005).

شكر وتقدير

نشكر الطاقم الطبي والمشاركين في الدراسة الذين شاركوا في التجربة. يشكر المؤلفون J. Wu و R. Zeng على الاقتراحات القيمة. تم دعم هذا العمل من قبل البرنامج الوطني الرئيسي للبحث والتطوير في الصين (2022YFA1004804)، التخصص السريري الرئيسي في بلدية شنغهاي، مركز شنغهاي للأبحاث للأمراض الغدد الصماء والتمثيل الغذائي (2022ZZO1002) ومؤسسة العلوم الطبيعية الوطنية في الصين (NSFC) لمشروع البحث المشترك الدولي (الإقليمي) الرئيسي (81220108006) إلى W.J.; صندوق العلماء الشباب المتميزين من NSFC (82022012)، صندوق NSFC العام (82270907)، البرنامج الرئيسي من NSFC (92357305)، فريق البحث المبتكر من الجامعات المحلية عالية المستوى في شنغهاي (SHSMU-ZDCX20212700)، برنامج العلماء في هونغ كونغ (XJ2013035) وبرنامج المئتين من كلية الطب بجامعة جياو تونغ في شنغهاي إلى H.L.; مجلس منح الأبحاث في هونغ كونغ (AOE/M/707-18) إلى A.X.; إجراءات ماري سكلودوفسكا-كوري والشبكات التدريبية المبتكرة (H2O2O-MSCA-ITN-2O18 813781) إلى G.P.، DFG بموجب استراتيجية التميز في ألمانيا (EXC 2051) رقم المشروع 390713860 إلى G.P. و Y.N.; برنامج البحث الأساسي في شنتشن (JCYJ20190808182402941) وبرنامج البحث الأساسي والتطبيقي الرئيسي في قوانغدونغ (2019BO3O3O2005) إلى J.L.; المؤسسة الرئيسية من NSFC (21934006)، برنامج البحث الاستراتيجي ذي الأولوية (B) من
الأكاديمية الصينية للعلوم (XDB38020200) إلى G.X.; جمعية تعزيز الابتكار للشباب التابعة للأكاديمية الصينية للعلوم (2021186) إلى X. Liu.; وجامعة بوليتكنك هونغ كونغ (POO42740) إلى P.L.

مساهمات المؤلفين

W.J.، A.X.، G.P.، H.L. و X. Liu قاموا بتصميم المشروع. H.L.، L.Z.، J.L. و Q.W. أداروا الدراسة. H.L.، L.Z. و L.Q. قاموا بالتشخيصات السريرية، وتجنيد المشاركين، وأجروا التدخلات. L.S. دعم الدراسة كأخصائي تغذية سريرية. L.Z.، L.Q. و L.W. جمعوا العينات والأنماط الظاهرة السريرية. G.P.، J.L.، Y.N.، K.K. و J.H. قاموا بإجراء تحليلات المعلومات الحيوية. X. Liu.، G.X.، P.K.-D.، X.W.، Y.L. و Y.Y. قاموا بإجراء تحليل ملامح الأيض والبيانات. L.Z.، Q.W.، L.Q.، X. Long.، M.Z.، Q.F.، R.Y.، S.L. و Y.Z. أجروا تجارب على الحيوانات. B.S. و P.L. قاموا بإجراء تحليل الصور الطبية. H.L.، L.Z.، J.L. و Q.W. كتبوا المخطوطة. W.J.، A.X.، G.P.، P.K.-D.، J.Y. و Y.B. راجعوا وحرروا المخطوطة. تم النظر بعناية في المساهمات ومعايير التأليف في هذا التعاون متعدد المناطق.

المصالح المتنافسة

يعلن المؤلفون عدم وجود مصالح متنافسة.

معلومات إضافية

البيانات الموسعة متاحة لهذا البحث فيhttps://doi.org/10.1038/s42255-024-00988-y.
معلومات إضافية النسخة الإلكترونية تحتوي على مواد إضافية متاحة فيhttps://doi.org/10.1038/s42255-024-00988-y.
يجب توجيه المراسلات والطلبات للحصول على المواد إلى هويتنج لي، شينيو ليو، جياني باناجيوت، آيمين شيو أو ويبينغ جيا.
معلومات مراجعة الأقران تشكر مجلة Nature Metabolism المراجعين المجهولين على مساهمتهم في مراجعة هذا العمل. المحرر الرئيسي: يانينا-ياسمين بيش، بالتعاون مع فريق Nature Metabolism.
معلومات إعادة الطباعة والتصاريح متاحة علىwww.nature.com/reprints.
ملاحظة الناشر: تظل شركة سبرينجر ناتشر محايدة فيما يتعلق بالمطالبات القضائية في الخرائط المنشورة والانتماءات المؤسسية.
الوصول المفتوح هذه المقالة مرخصة بموجب رخصة المشاع الإبداعي النسب 4.0 الدولية، التي تسمح بالاستخدام والمشاركة والتكيف والتوزيع وإعادة الإنتاج بأي وسيلة أو صيغة، طالما أنك تعطي الائتمان المناسب للمؤلفين الأصليين والمصدر، وتوفر رابطًا لرخصة المشاع الإبداعي، وتوضح ما إذا تم إجراء تغييرات. الصور أو المواد الأخرى من طرف ثالث في هذه المقالة مشمولة في رخصة المشاع الإبداعي الخاصة بالمقالة، ما لم يُشار إلى خلاف ذلك في سطر الائتمان للمواد. إذا لم تكن المادة مشمولة في رخصة المشاع الإبداعي الخاصة بالمقالة وكان استخدامك المقصود غير مسموح به بموجب اللوائح القانونية أو يتجاوز الاستخدام المسموح به، فستحتاج إلى الحصول على إذن مباشرة من صاحب حقوق الطبع والنشر. لعرض نسخة من هذه الرخصة، قم بزيارةhttp://creativecommons. org/licenses/by/4.0/.
مختبر شنغهاي الرئيسي لمرض السكري، قسم الغدد الصماء والتمثيل الغذائي، معهد شنغهاي للسكري، المركز السريري لمرض السكري في شنغهاي، مستشفى الشعب السادس في شنغهاي التابع لجامعة جياو تونغ الطبية، شنغهاي، الصين. المختبر الرئيسي للدولة للتكنولوجيا الحيوية الصيدلانية، جامعة هونغ كونغ، منطقة هونغ كونغ الإدارية الخاصة، الصين. قسم الطب، جامعة هونغ كونغ، منطقة هونغ كونغ الإدارية الخاصة، الصين. قسم الطب، جامعة شنغهاي جياو تونغ، كلية الطب، شنغهاي، الصين. قسم الأمراض المعدية والصحة العامة، جامعة مدينة هونغ كونغ، منطقة هونغ كونغ الإدارية الخاصة، الصين. قسم ديناميات الميكروبيوم، معهد لايبنيز لأبحاث المنتجات الطبيعية وعلم الأحياء المعدية – معهد هانس كنول، يينا، ألمانيا. مجموعة التميز توازن الميكروكون، جامعة فريدريش شيلر يينا، يينا، ألمانيا. معهد البيولوجيا الجزيئية للعدوى، جامعة وورزبورغ، وورزبورغ، ألمانيا. كلية علوم وتكنولوجيا الغذاء، جامعة المحيط في شنغهاي، شنغهاي، الصين. قسم التغذية السريرية، مستشفى الشعب السادس في شنغهاي التابع لمدرسة الطب بجامعة شنغهاي جياو تونغ، شنغهاي، الصين. قسم علوم الحاسوب والهندسة، جامعة جياو تونغ بشنغهاي، شنغهاي، الصين. قسم الحوسبة، جامعة بوليتكنك هونغ كونغ، هونغ كونغ، منطقة إدارية خاصة، الصين. كلية التصميم، جامعة بوليتكنك هونغ كونغ، هونغ كونغ، منطقة إدارية خاصة، الصين. مختبر المفاتيح لعلوم الفصل في الكيمياء التحليلية، معهد داليان للفيزياء الكيميائية، الأكاديمية الصينية للعلوم، داليان، الصين. مركز أبحاث الأمراض الأيضية، جامعة تشنغتشو، مستشفى تشنغتشو المركزي التابع لجامعة تشنغتشو، تشنغتشو، الصين. كلية الصحة العامة، جامعة جياو تونغ بشنغهاي، كلية الطب، شنغهاي، الصين. كلية العلوم البيولوجية، جامعة فريدريش شيلر، يينا، ألمانيا. قسم علم الأحياء الدقيقة، كلية لي كا شينغ للطب، جامعة هونغ كونغ، منطقة هونغ كونغ الإدارية الخاصة، الصين. ساهم هؤلاء المؤلفون بالتساوي: هويتنج لي، لي تشانغ، جون لي، تشيان وو. البريد الإلكتروني: huarting99@sjtu.edu.cn; liuxy2012@dicp.ac.cn; Gianni.Panagiotou@hki-jena.de; amxu@hku.hk; wpjia@sjtu.edu.cn
الشكل البياني الممتد 1|مخطط CONSORT. يوضح مخطط تدفق CONSORT الإجراءات الخاصة بالتسجيل، وتخصيص التدخل، والمتابعة، وتحليل البيانات للدراسة. RS، النشا المقاوم؛ CS، النشا الضابط.
الشكل البياني الممتد 2 | انظر الصفحة التالية للتعليق.
الشكل 2 من البيانات الموسعة | تحسين السمنة وعمليات الأيض للغلوكوز بعد تدخل RS لمدة 8 أسابيع لدى الأفراد ذوي الوزن الزائد.
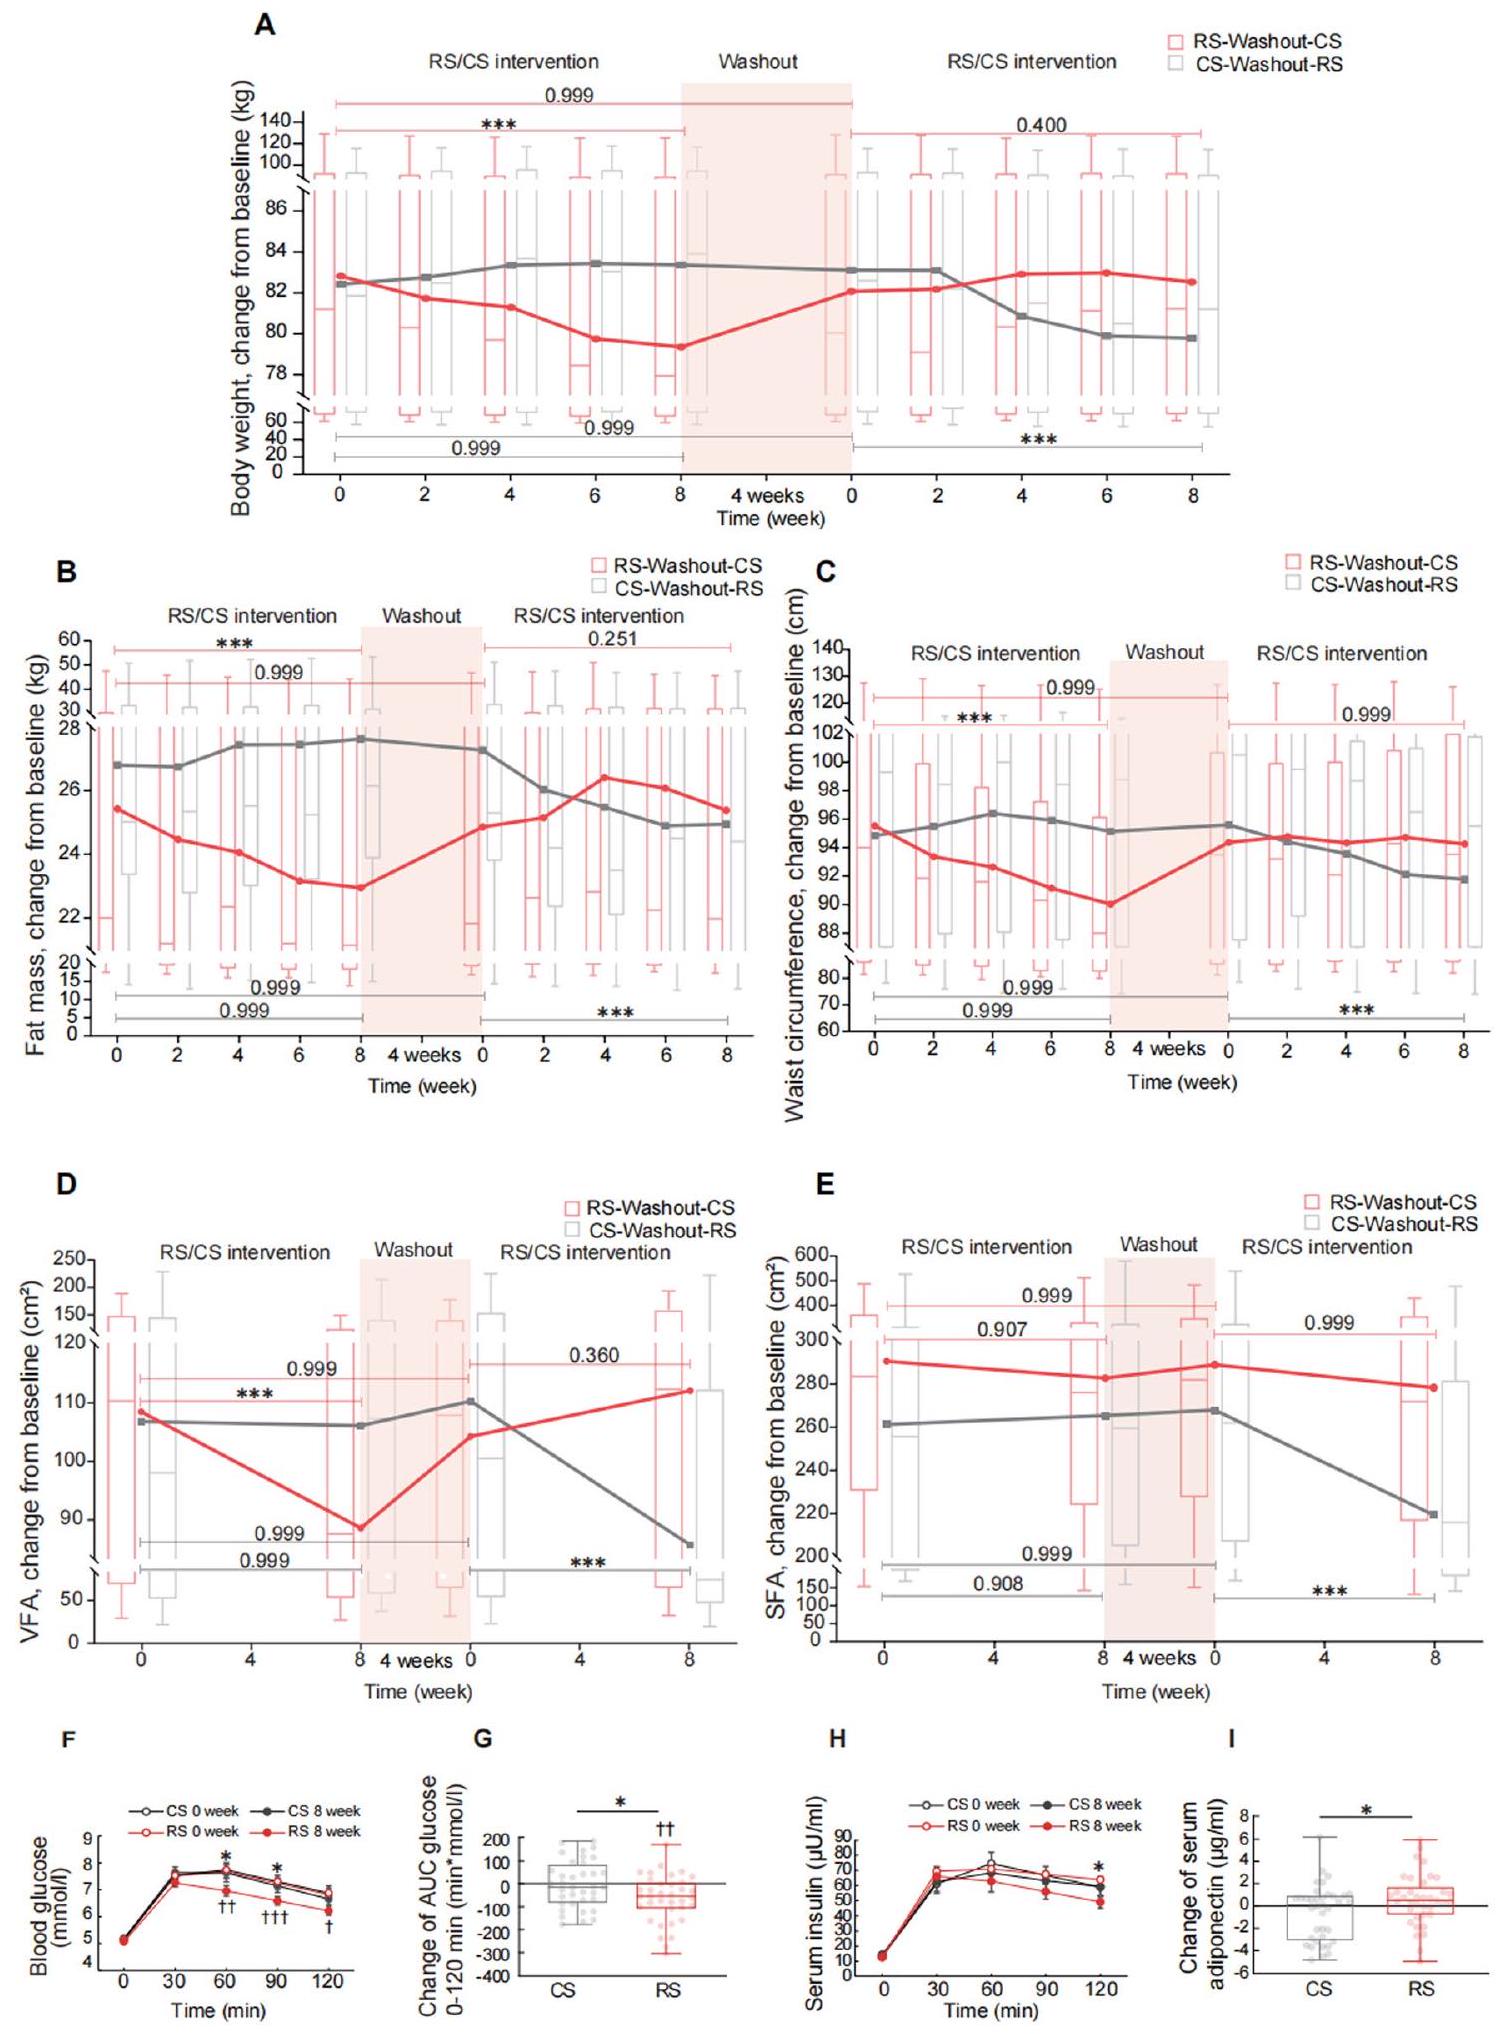
(أ-هـ) مخططات الصندوق (مع الوسيط) تظهر التغيرات الديناميكية في (أ) وزن الجسم، (ب) كتلة الدهون، و(ج) محيط الخصر كل أسبوعين من التدخل، بالإضافة إلى (د) الدهون الحشوية (VFA) و(هـ) منطقة الدهون تحت الجلد (SFA) كل 4 أسابيع من التدخل. الخطوط تربط بين متوسطات النتائج في نقاط زمنية مختلفة. الخط الأفقي يمثل نتائج تحليل النموذج المختلط الخطي متبوعًا باختبار بونفيروني الذي تم إجراؤه لمقارنة النقاط النهائية المتصلة. مجموعة RS-Washout-CS، الأفراد. مجموعة CS-Washout-RS، أفراد. . (f-h) تم إجراء اختبارات تحمل الوجبات الموحدة (MTT) في البداية (الأسبوع 0) وبعد تدخل RS أو CS لمدة 8 أسابيع. ( مستوى الجلوكوز في الدم. (غ) تغيير المساحة تحت المنحنى (AUC) وتحليل مستوى الجلوكوز في الدم.
(ح) مستوى الأنسولين في المصل. (ط) تغيير مستوى الأديبونيكتين في المصل الذي تم تقييمه بواسطة ELISA في الأشخاص قبل وبعد تدخل RS أو CS لمدة 8 أسابيع. أفراد لكل مجموعة، و الأفراد لكل مجموعة. تُعبر البيانات عن المتوسط s.e.m (f, h). تُعرض البيانات كرسوم بيانية على شكل صناديق وأهداب (g, i). الخط الأفقي في منتصف كل صندوق يشير إلى القيمة الوسيطة، والحدود العليا والسفلى للصناديق تمثل النسب المئوية 75 و 25، والأهداب تشير إلى أدنى وأعلى القيم. و ، و0.038 (i)، للاختلاف بين تدخل RS وCS بواسطة نموذج مختلط خطي تم تعديله حسب ترتيب التدخل و و 0.001 للفارق قبل وبعد تدخل RS (RS OW مقابل RS 8W) بواسطة نموذج مختلط خطي تم تعديله حسب ترتيب التدخل متبوعًا باختبار بونفيروني.

أ


الملخص

مجموعة RS-Washout-CS باستخدام طريقة مسافة براى-كورتيس. (د) تنوع بيتا لمجموعة CS-Washout-RS باستخدام طريقة مسافة Unifrac الموزونة. (هـ) تنوع بيتا لمجموعة RS-Washout-CS باستخدام طريقة مسافة Unifrac الموزونة. جميع مخططات تنوع بيتا استخدمت التحجيم متعدد الأبعاد غير المترية (NMDS) بناءً على الملف التكويني لوفرة الأنواع. تدعم نتائج ANOSIM القابلية للمقارنة الأساسية للتراكيب الميكروبية. ).

الشكل 5 من البيانات الموسعة | أفضل 10 مسارات KEGG المتعلقة بالتمثيل الغذائي بين تدخل RS و CS. يتم تقديم البيانات بواسطة تغير الطي بعد العلاج، والذي يُعبر عنه كمتوسط س.م. (27 فردًا قبل وبعد RS و
16 فردًا قبل وبعد CS). تم تقييم الفروق الإحصائية بين التدخلات باستخدام اختبار ويلكوكسون للرتب المجمعة ذو الجانبين، مع تم تعديلها لمقارنات متعددة باستخدام طريقة بنجاميني-هوشبرغ.
أ

الشكل 6 من البيانات الموسعة | الميتابولوميات المضيفة استجابةً لعلاج RS.
(أ) قوة الارتباط الخطي (أهمية معيار أكايكي للمعلومات المتوسطة [AIC]) بين تغير وفرة الأنواع (التغير النسبي بعد التدخل) وتغير (التغير النسبي بعد التدخل) للمواد الأيضية الدائرة. الأهمية هي الأوزان المجمعة لمعيار AIC للنماذج الخطية التي تحتوي على هذا المتغير خلال اختيار النموذج. (ب-ز) تغييرات الأحماض الدهنية قصيرة السلسلة في البراز بعد تدخل RS أو CS لمدة 8 أسابيع. أفراد لكل
مجموعة). (ب) أسيتات. (ج) بروبيونات. (د) بيوتيرات. (هـ) إيزوبيوتيرات. (و) فاليرات. (ز) هيكسانوات. البيانات معبّر عنها كوسيط مع نطاق ربعي. ، ** (هـ) للاختلاف بين تدخل RS و CS بواسطة نموذج مختلط خطي تم تعديله حسب ترتيب التدخل و للفارق قبل وبعد تدخل RS (RS 0 W مقابل RS 8W) بواسطة نموذج مختلط خطي تم تعديله حسب ترتيب التدخل متبوعًا باختبار بونفيروني.
الشكل البياني الممتد 7| انظر الصفحة التالية للتعليق.
الشكل 7 من البيانات الموسعة | تغيير الأنواع الميكروبية، وعمليات الأيض للطاقة، وعمليات الأيض للجلوكوز بعد زراعة البراز. (أ) تم إجراء تسلسل الميتاجينوم الكامل للجينوم لعينة محتوى الأعور من الفئران التي تلقت خليط البراز المأخوذ من المتبرعين بعد تدخل RS أو CS. تم عرض الأنواع التي تظهر اتجاهًا مشابهًا للتغيرات الناتجة عن RS بين المتبرعين والفئران التي تلقت زراعة الميكروبات البرازية (FMT). يتم تقديم البيانات على أنها . تم تعريف RS/CS كنسبة وفرة الميكروبات النسبية بعد تدخل RS (زراعة ميكروبات من متبرعين RS للفئران) إلى تلك بعد تدخل CS (زراعة ميكروبات من متبرعين CS للفئران). (ب-ي) تم تجميع الفئران ومعالجتها كما هو موضح في الشكل 4 ( التكرارات البيولوجية لكل مجموعة). (ب) طاقة لمدة 24 ساعة
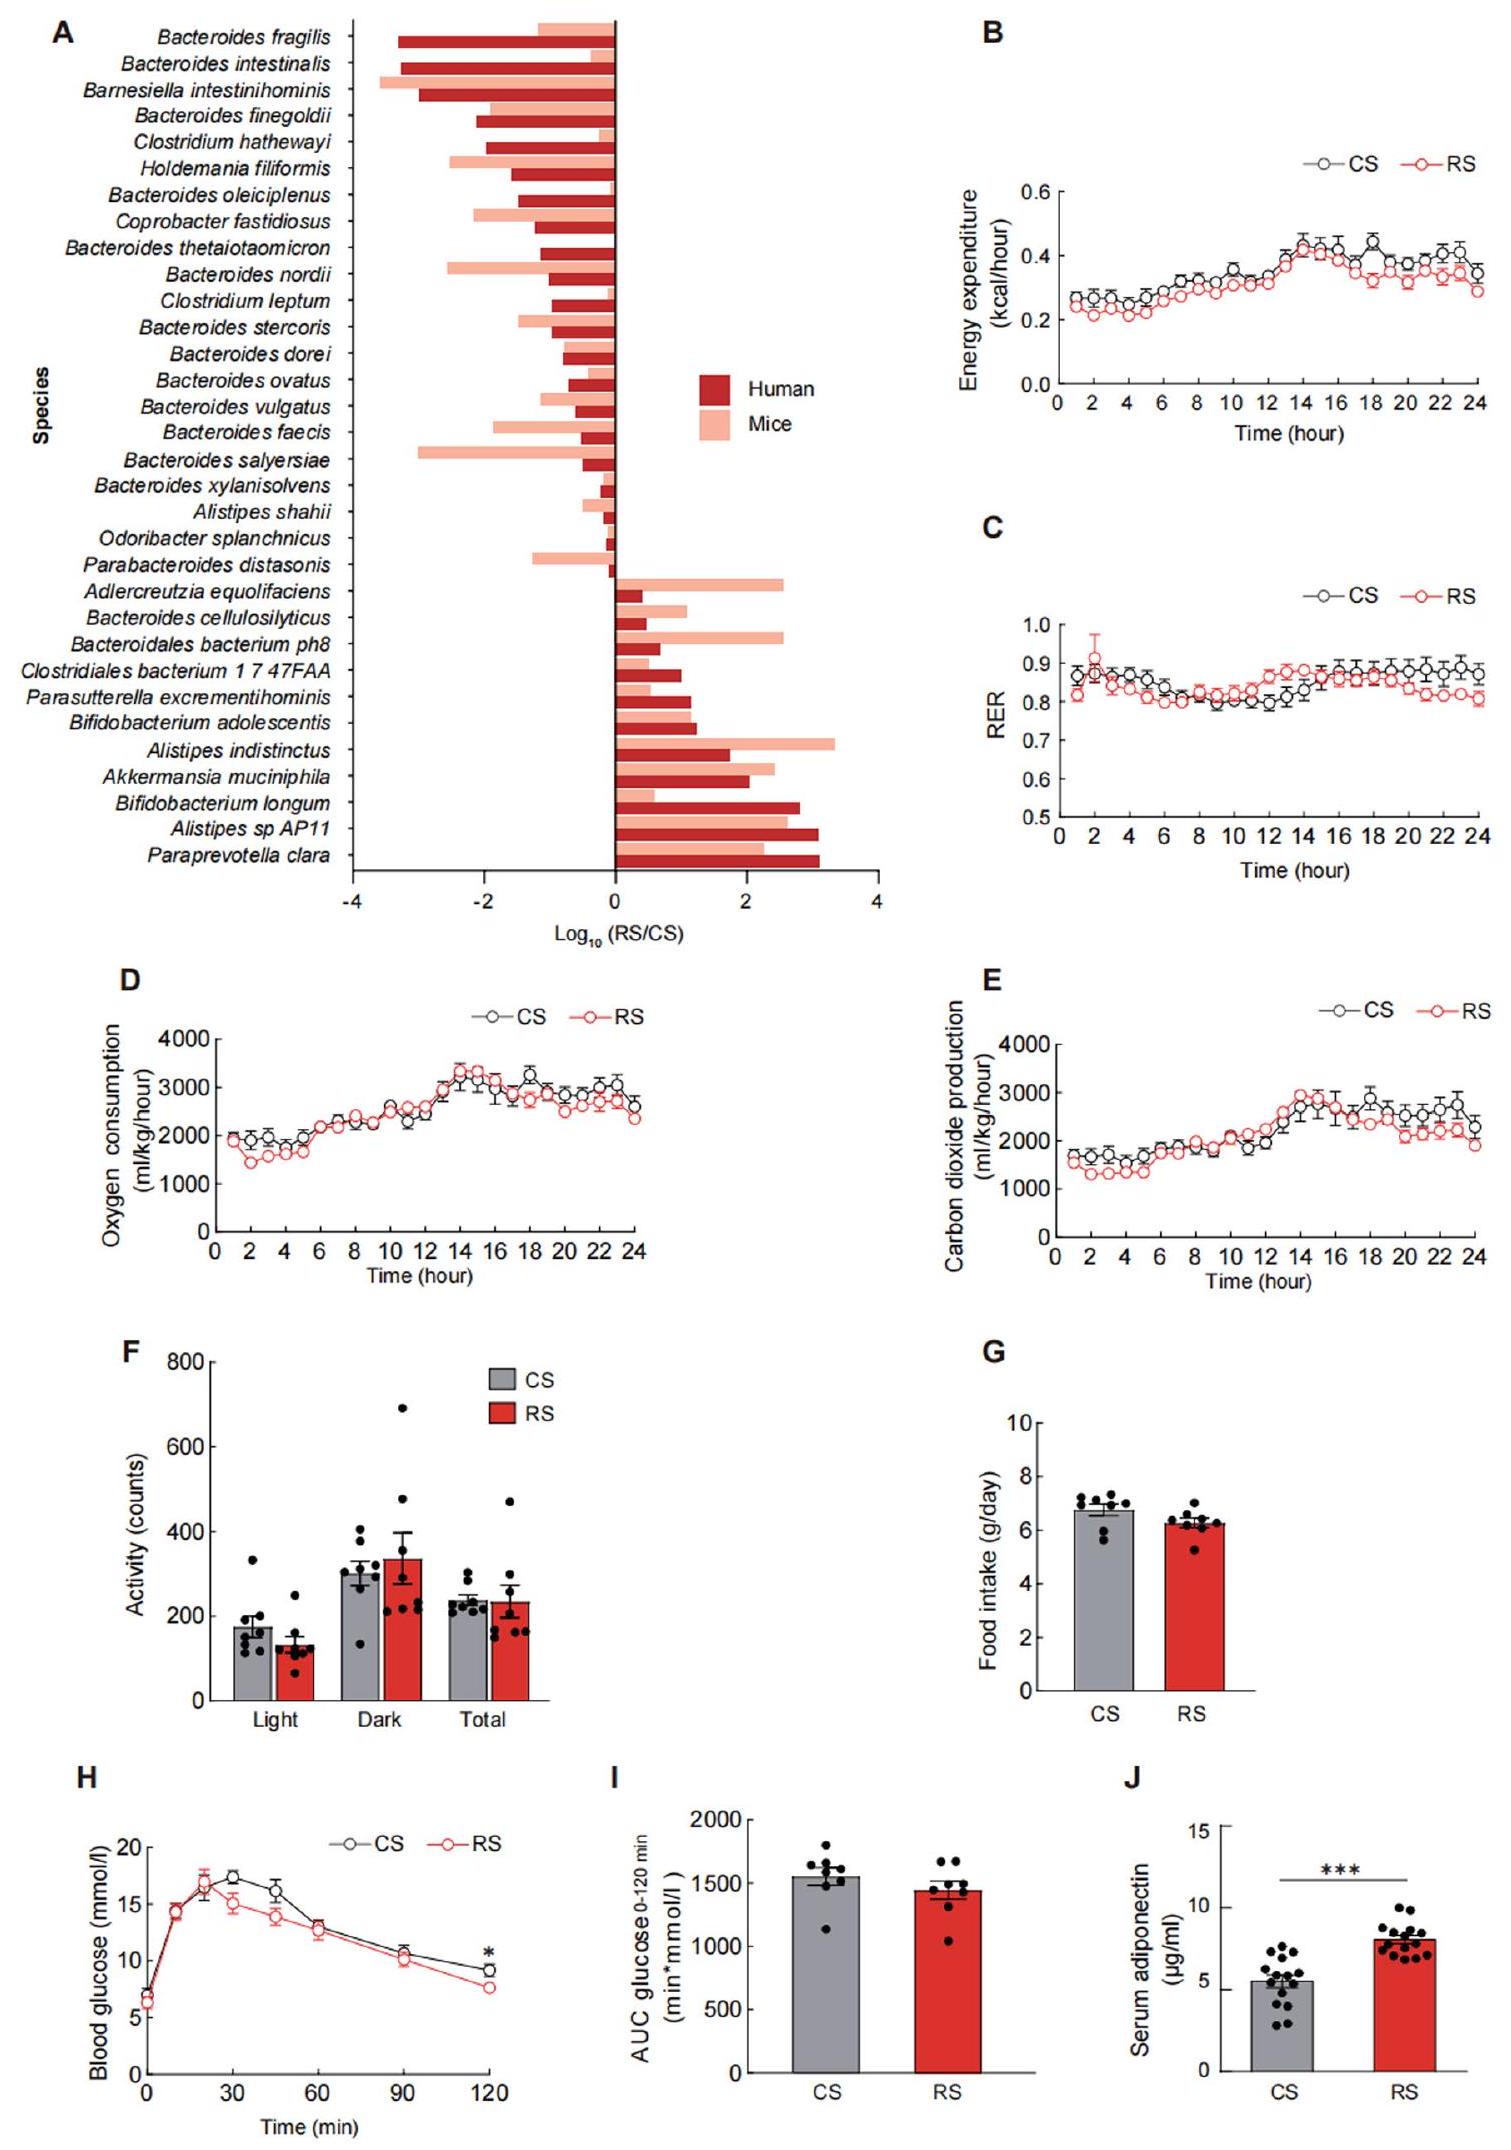
تم قياس (أ) الإنفاق، (ب) نسبة تبادل التنفس (RER)، (ج) استهلاك الأكسجين، (د) إنتاج ثاني أكسيد الكربون، (هـ) النشاط، و(و) تناول الطعام باستخدام نظام مراقبة الحيوانات المعملية الشامل في نهاية التجربة. (ز) تم إجراء اختبار تحمل الجلوكوز (GTT) في الفئران المستعمرة بالميكروبيوتا من متبرعي RS أو CS. (ح) تحليل المساحة تحت المنحنى (AUC) لاختبار GTT. (ط) تم قياس مستويات الأديبونيكتين في المصل في نهاية زراعة الميكروبيوتا البرازية. التكرارات البيولوجية لكل مجموعة). تم إعادة إنتاج البيانات في ثلاث تجارب مستقلة. تُعرض البيانات كمتوسط تم تحديد الدلالة باستخدام اختبار t لطلاب ذو طرفين. ، و .
الشكل 9 من البيانات الموسعة | أدت الإضافة إلى بكتيرويدس أدوليسنتيس إلى تغيير المستقلبات في الفئران. ملف تعريف الميتابولوم (أ-ج) تم تجميع الفئران SPF ومعالجتها كما في الشكل 7 من البيانات الموسعة (WD+B.a، ن = 5 تكرارات بيولوجية؛ WD+hk-B.a، التكرارات البيولوجية؛ WD، التكرارات البيولوجية). و (د-و) تم تجميع الفئران الخالية من الجراثيم ومعالجتها كما هو موضح في الشكل 7 ( التكرارات البيولوجية لكل مجموعة). (أ) مستويات GCA، DCA، TDCA، T MCA و TCDCA و TCA و TLCA في المصل.
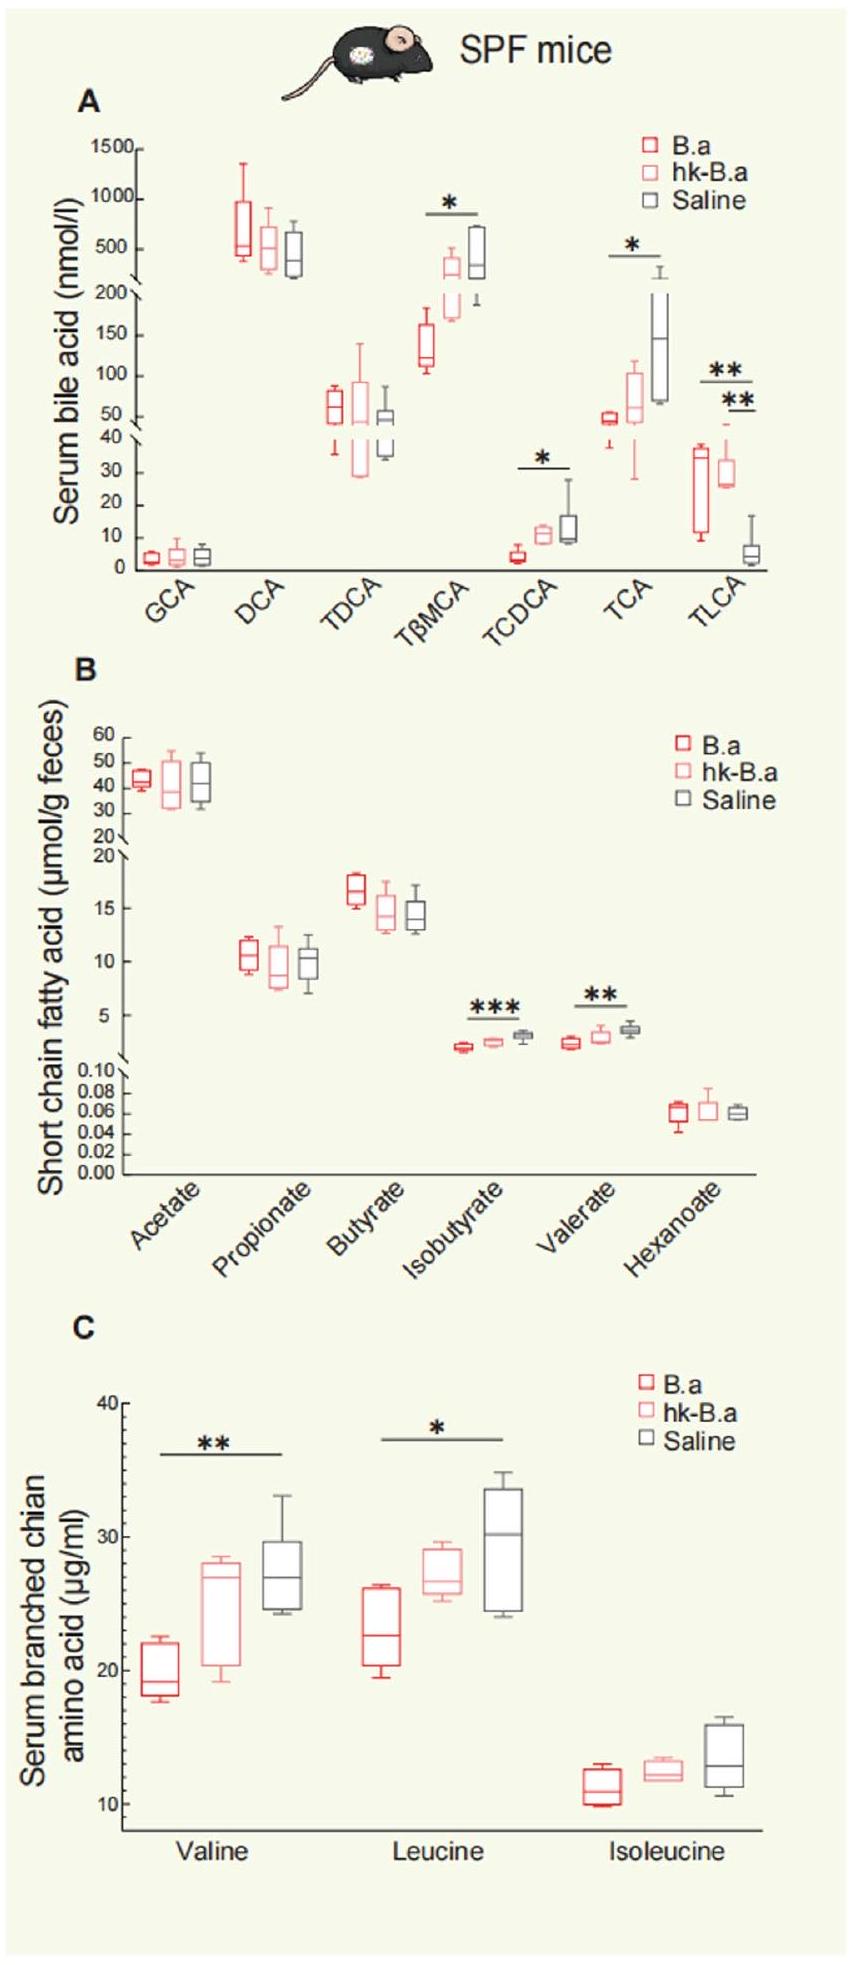
(ب) مستويات الأحماض الدهنية قصيرة السلسلة في البراز. (ج) مستويات الفالين، الإيزوليوسين، والليوسين في المصل.
(د) مستويات GCA، DCA، T MCA و TCDCA و TCA في مصل الفئران الخالية من الجراثيم.
(هـ) مستويات الأحماض الدهنية قصيرة السلسلة في براز الفئران الخالية من الجراثيم. (و) مستويات الفالين، الإيزوليوسين، والليوسين في مصل الفئران الخالية من الجراثيم. تُعرض البيانات على شكل مخططات صندوقية مع خطوط.
تشير الخطوط الأفقية في منتصف كل صندوق إلى القيمة الوسيطة، بينما تمثل الحدود العليا والسفلى للصناديق النسب المئوية 75 و25، وتدل الشعيرات على أدنى وأعلى القيم. تم التحليل باستخدام تحليل التباين الأحادي (ANOVA) متبوعًا باختبار توكي بعد الاختبار (في الأشكال a-c) واختبار t غير المتزاوج ثنائي الاتجاه لستودنت (في الأشكال d-f). ، و و ، و ، و و و 0.005 (د)، *** . SPF، خالي من مسببات الأمراض المحددة؛ GCA، حمض الجليكوكوليك؛ DCA، حمض الديوكسيكوليك؛ TDCA، التوروديوكسيكولات؛ T MCA، الثور حمض الموريكوليك؛ TCDCA، حمض التوروشينوديوكسيكوليك؛ TCA، حمض التوروشوليك؛ TLCA، حمض التوروليثوكوليك.

الشكل 10 من البيانات الموسعة | يساعد تناول النشا المقاوم (RS) في فقدان الوزن لدى البشر من خلال إعادة تشكيل ميكروبيوم الأمعاء. رافق ذلك اتباع أنظمة غذائية متوازنة ومتساوية الطاقة، مما أدى إلى انخفاض واضح في وزن الجسم وتحسين حساسية الأنسولين، بالإضافة إلى تغيير في الميتاجينوميات والميتابولوميات. أظهرت زراعة ميكروبات البراز (FMT) أن فوائد RS كانت مرتبطة بتغيير تكوين ميكروبات الأمعاء. كانت استعمار الفئران بنوع B. adolescentis، الذي كان مرتبطًا ارتباطًا وثيقًا بفوائد RS لدى البشر، يحمي الفئران من السمنة الناتجة عن النظام الغذائي.
ميكانيكياً، أثرت التغيرات الناتجة عن RS في ميكروبيوم الأمعاء على المستقلبات الخاصة بميكروبيوم الأمعاء، وقللت من الالتهاب المزمن منخفض الدرجة من خلال تحسين سلامة الأمعاء، وأعاقت امتصاص الدهون عن طريق تعديل أنجيوبوينتين-مثل 4 (ANGPTL4)، وحسنت حساسية عامل نمو الألياف 21 (FGF21) في الأنسجة الدهنية. SPF، خالية من مسببات الأمراض المحددة؛ LPS، الليبوبوليسكاريد؛ BCAAs، الأحماض الأمينية ذات السلسلة المتفرعة؛ Erk1/2، كيناز الإشارة خارج الخلوية 1/2؛ FGFR1، مستقبل عامل نمو الألياف 1.بايو ريندر.كوم.

محفظة الطبيعة

ويبينغ جيا، إيمين شيو، جياني باناجيوتou
المؤلف(المؤلفون) المراسل(ون): هويتنج لي و شينيو ليو
آخر تحديث بواسطة المؤلف(ين): 4 يناير 2024

ملخص التقرير

تسعى Nature Portfolio إلى تحسين إمكانية تكرار العمل الذي ننشره. يوفر هذا النموذج هيكلًا للاتساق والشفافية في التقرير. لمزيد من المعلومات حول سياسات Nature Portfolio، يرجى الاطلاع على سياسات التحرير وقائمة مراجعة سياسة التحرير.

الإحصائيات

لجميع التحليلات الإحصائية، تأكد من أن العناصر التالية موجودة في أسطورة الشكل، أسطورة الجدول، النص الرئيسي، أو قسم الطرق.
مؤكد
حجم العينة بالضبط ( لكل مجموعة/شرط تجريبي، معطاة كرقم منفصل ووحدة قياس
بيان حول ما إذا كانت القياسات قد أُخذت من عينات متميزة أو ما إذا كانت نفس العينة قد تم قياسها عدة مرات
اختبار(ات) الإحصاء المستخدمة وما إذا كانت أحادية الجانب أو ثنائية الجانب
يجب أن تُوصف الاختبارات الشائعة فقط بالاسم؛ واصفًا التقنيات الأكثر تعقيدًا في قسم الطرق.
وصف لجميع المتغيرات المشتركة التي تم اختبارها
وصف لأي افتراضات أو تصحيحات، مثل اختبارات الطبيعية والتعديل للمقارنات المتعددة
X
وصف كامل للمعلمات الإحصائية بما في ذلك الاتجاه المركزي (مثل المتوسطات) أو تقديرات أساسية أخرى (مثل معامل الانحدار) والتباين (مثل الانحراف المعياري) أو تقديرات عدم اليقين المرتبطة (مثل فترات الثقة)
لاختبار الفرضية الصفرية، إحصائية الاختبار (على سبيل المثال، ) مع فترات الثقة، أحجام التأثير، درجات الحرية و قيمة ملحوظة أعطِ القيم كقيم دقيقة كلما كان ذلك مناسبًا.
لتحليل بايزي، معلومات حول اختيار القيم الأولية وإعدادات سلسلة ماركوف مونت كارلو
X لتصميمات هرمية ومعقدة، تحديد المستوى المناسب للاختبارات والتقارير الكاملة عن النتائج
تقديرات أحجام التأثير (مثل حجم تأثير كوهين) بيرسون )، مما يشير إلى كيفية حسابها
تحتوي مجموعتنا على الإنترنت حول الإحصائيات لعلماء الأحياء على مقالات تتناول العديد من النقاط المذكورة أعلاه.

البرمجيات والشيفرة

معلومات السياسة حول توفر كود الكمبيوتر
تم استخدام برنامج EpiData 3.1 لجمع البيانات وإدخالها وتوثيقها.
تم استخدام برنامج تحليل البيانات SPSS الإصدار 17، وR 3.3.2، وبرنامج Image J 1.54f لتحليل البيانات.
بالنسبة للمخطوطات التي تستخدم خوارزميات أو برامج مخصصة تكون مركزية في البحث ولكن لم يتم وصفها بعد في الأدبيات المنشورة، يجب أن تكون البرمجيات متاحة للمحررين والمراجعين. نحن نشجع بشدة على إيداع الشيفرة في مستودع مجتمعي (مثل GitHub). راجع إرشادات مجموعة Nature لتقديم الشيفرة والبرمجيات لمزيد من المعلومات.

بيانات

معلومات السياسة حول توفر البيانات
يجب أن تتضمن جميع المخطوطات بيانًا حول توفر البيانات. يجب أن يوفر هذا البيان المعلومات التالية، حيثما ينطبق:
  • رموز الانضمام، معرفات فريدة، أو روابط ويب لمجموعات البيانات المتاحة للجمهور
  • وصف لأي قيود على توفر البيانات
  • بالنسبة لمجموعات البيانات السريرية أو بيانات الطرف الثالث، يرجى التأكد من أن البيان يتماشى مع سياستنا.
يمكن الوصول إلى بيانات المرضى على مستوى الفرد بموافقة لجنة إدارة البيانات من المؤسسات وليست متاحة للجمهور. ستقوم لجنة إدارة البيانات بعد ذلك بمراجعة جميع الطلبات ومنحها (إذا كانت ناجحة). سيكون من الضروري وجود اتفاقية نقل بيانات رسمية عند الموافقة. بشكل عام، سيتم الرد على جميع هذه الطلبات للوصول إلى البيانات في غضون شهر واحد. ستكون جميع البيانات المشتركة غير محددة الهوية. تم الحصول على بيانات التسلسل الميتاجينومي الخام
تم إيداعها في أرشيف قراءة التسلسل التابع لمركز المعلومات البيولوجية الوطني تحت معرف الوصول PRJNA414688 وهي متاحة للجمهور اعتبارًا من تاريخ النشر. أي معلومات إضافية مطلوبة لإعادة تحليل البيانات المبلغ عنها في هذه الورقة متاحة من جهة الاتصال الرئيسية ويبينغ جيا.wpjia@sjtu.edu.cnعند الطلب.

البحث الذي يتضمن مشاركين بشريين، بياناتهم، أو مواد بيولوجية

معلومات السياسة حول الدراسات التي تشمل مشاركين بشريين أو بيانات بشرية. انظر أيضًا معلومات السياسة حول الجنس، الهوية/التقديم الجنسي، والتوجه الجنسي والعرق، والعرقية والعنصرية.
التقارير عن الجنس والنوع الاجتماعي كان هناك 37 شخصًا يعانون من زيادة الوزن أو السمنة أكملوا التجربة، بما في ذلك 22 ذكرًا و15 أنثى.
التقارير عن العرق أو الإثنية أو غيرها من التجمعات الاجتماعية ذات الصلة لم يتم إجراء أي تصنيف اجتماعي مُنشأ أو ذي صلة اجتماعية في اختيار المشاركين في الدراسة.
خصائص السكان كان متوسط عمر المشاركين سنوات (المتوسط تم استبعاد الأشخاص الذين يعانون من الحالات التالية من هذه الدراسة: المرض الحاد أو استخدام المضادات الحيوية قبل 3 أسابيع من الدراسة، فرط نشاط الغدة الدرقية أو قصور الغدة الدرقية المعروف، السكري المعروف، العلاج الحالي بالكورتيكوستيرويدات الجهازية أو الأدوية التي قد تؤثر على استقلاب الجلوكوز، المشاركة أو المشاركة في تجارب سريرية أخرى قبل 4 أسابيع من الدراسة.
التوظيف سيتم تجنيد المشاركين من خلال إعلانات عامة من شنغهاي، الصين، من يوليو 2013 إلى 2016. بمجرد تأكيد الأهلية، سيقوم طبيب بإبلاغ المشارك بالكامل عن التجربة. نظرًا لأن المشاركين قد أشاروا بأنفسهم إلى الدراسة، فقد يكون هذا قد تسبب في انحياز في الاختيار نحو الأشخاص الأكثر صحة. وبالتالي، قد لا يمكن تعميم نتائج الدراسة على جميع السكان الذين يعانون من زيادة الوزن.
رقابة الأخلاقيات تمت الموافقة على الدراسة من قبل لجنة الأخلاقيات في مستشفى الشعب السادس التابع لجامعة شنغهاي جياو تونغ، وفقًا لمبدأ إعلان هلسنكي.
يرجى ملاحظة أنه يجب أيضًا تقديم معلومات كاملة حول الموافقة على بروتوكول الدراسة في المخطوطة.

التقارير المتخصصة في المجال

يرجى اختيار الخيار أدناه الذي يناسب بحثك بشكل أفضل. إذا لم تكن متأكدًا، اقرأ الأقسام المناسبة قبل اتخاذ قرارك.
علوم الحياة العلوم السلوكية والاجتماعية العلوم البيئية والتطورية والبيئية
لنسخة مرجعية من الوثيقة بجميع الأقسام، انظرnature.com/documents/nr-reporting-summary-flat.pdf

تصميم دراسة العلوم الحياتية

يجب على جميع الدراسات الإفصاح عن هذه النقاط حتى عندما يكون الإفصاح سلبياً.
حجم العينة
دراسة بشرية: قمنا بتقدير قيمة التغير في وزن الجسم والانحراف المعياري لها على أنها بعد تدخل RS. مع مستوى دلالة اختبار ذو طرفين قدره 0.05 وقوة إحصائية من ، كانت حجم العينة الدنيا المحسوبة 31. للسماح بـ بعد الانسحاب بعد التوزيع العشوائي، تم دعوة 37 مشاركًا للمشاركة.
دراسة حيوانية: تم تقدير أحجام العينات من التجارب الحيوانية وفقًا للدراسات السابقة (PMID: 37872351، PMID: 36646754، PMID: 37365376) والتباين المعروف للاختبارات.
استثناءات البيانات لم يتم استبعاد أي بيانات من التحليل.
التكرار
دراسة بشرية: غير متاحة بسبب طبيعة التدخل الغذائي.
تم تكرار جميع التجارب الحيوانية ثلاث مرات بشكل مستقل. جميع النتائج قابلة للتكرار.
العشوائية قام باحث مستقل بإجراء العشوائية وتعيين المشاركين إلى نظام تدخل CS-washout-RS أو RS-washout-CS بنسبة تخصيص من سيتم إنشاء جدول العشوائية باستخدام SAS PROC PLAN في برنامج SAS. بالنسبة لجميع التجارب، تم تخصيص المشاركين والحيوانات البحثية عشوائيًا في مجموعات مختلفة.
عمى تم تعبئة RS و CS في أكياس محكمة الإغلاق كانت متطابقة في المظهر، ولم يكن المشاركون والمحققون على علم بمحتويات نشا الدراسة ونظام التوزيع العشوائي خلال فترة التعمية المزدوجة. فقط مصمم البحث كان يعرف نظام التوزيع العشوائي. كان المشاركون والمحققون والموظفون السريريون ومقيّمو النتائج غير مدركين لتسلسل التخصيص خلال جمع البيانات وتحليلها. تم رفع التعمية عندما تم إجراء التحليل البيوانفورماتيكي لاستكشاف الآلية المحتملة التي من خلالها يمنح ميكروبيوم الأمعاء الفوائد الفسيولوجية لـ RS. لم يكن المحققون معميين عن التجارب على الحيوانات حيث كان من الضروري معرفة علاج كل فأر للشخص الذي يتعامل مع الفئران. عند الإمكان، تم إجراء تحليل البيانات بشكل أعمى.

التقارير عن مواد وأنظمة وطرق محددة

نحتاج إلى معلومات من المؤلفين حول بعض أنواع المواد والأنظمة التجريبية والأساليب المستخدمة في العديد من الدراسات. هنا، يرجى الإشارة إلى ما إذا كانت كل مادة أو نظام أو طريقة مدرجة ذات صلة بدراستك. إذا لم تكن متأكدًا مما إذا كان عنصر القائمة ينطبق على بحثك، يرجى قراءة القسم المناسب قبل اختيار رد.
المواد والأنظمة التجريبية طرق
غير متوفر مشارك في الدراسة غير متوفر مشارك في الدراسة
أجسام مضادة X
تسلسل شريحة الكروماتين
تدفق الخلايا
علم الحفريات وعلم الآثار
تصوير الأعصاب باستخدام الرنين المغناطيسي
البيانات السريرية
البحث ذو الاستخدام المزدوج الذي يثير القلق

الأجسام المضادة

الأجسام المضادة المستخدمة أجسام مضادة ZO1 (Abcam، ab96587، تخفيف 1:500، أجسام مضادة متعددة النسائل للأرنب لبروتين ZO1)؛ أجسام مضادة أوكلودين (Abcam، ab216327، تخفيف 1:100، أجسام مضادة أحادية النسيلة للأرنب [EPR20992] لأوكلودين)؛ أجسام مضادة ANGPTL4 (Proteintech، 18374-1-AP، تخفيف 1:500، أجسام مضادة متعددة النسائل للأرنب لـ ANGPTL4)؛ أجسام مضادة Erk1/2 (Cell Signaling Technology، 9102، تخفيف 1:1000، أجسام مضادة متعددة النسائل للأرنب لـ Erk1/2)؛ pErk1/2 (Thr202/Tyr204) (Cell Signaling Technology، 9101، تخفيف 1:1000، أجسام مضادة متعددة النسائل للأرنب لـ p-Erk1/2)؛ أجسام مضادة ثانوية Rabbit IgG (H+L) (Thermo، 31460، تخفيف 1:2500).
التحقق تم التحقق من الأجسام المضادة ZO1 و Occludin في مختبرنا (الدورة الدموية 133، 2434-2446، 2016). تم التحقق من الأجسام المضادة Erk1/2 و pErk1/2 في مختبرنا (Front Endocrinol (Lausanne) 30:12:773340، 2021). تم التحقق من جسم ANGPTL4 المضاد على الموقع http://www.ptglab.com/Products/ANGPTL4-Antibody-18374-1-AP.htm#validation.

الحيوانات وغيرها من الكائنات البحثية

معلومات السياسة حول الدراسات التي تشمل الحيوانات؛ إرشادات ARRIVE الموصى بها للإبلاغ عن أبحاث الحيوانات، والجنس والنوع في البحث
الحيوانات المخبرية للتجربة المتعلقة بزراعة البراز، تم تربية ذكور الفئران من سلالة C57BL/6 بعمر عشرة أسابيع في بيئة تقليدية. بالنسبة لإعطاء بكتيريا B. adolescentis، تم تربية ذكور الفئران من سلالة C57BL/6 بعمر ثمانية أسابيع في بيئة تقليدية. تم تربية وصيانة ذكور الفئران الخالية من الجراثيم من سلالة C57BL/6J بعمر خمسة أسابيع في عوازل بلاستيكية خاصة. تم الاحتفاظ بجميع الحيوانات تحت دورات ضوء وظلام لمدة 12 ساعة عند درجة حرارة مضبوطة. درجات مئوية) ورطوبة تتراوح بين 60-70%، مع وصول حر إلى الطعام والماء.
الحيوانات البرية لم تتضمن الدراسة حيوانات برية.
التقارير عن الجنس نظرًا لأن إناث الفئران من سلالة C57BL/6J يُبلغ عن كونهن أكثر مقاومة للتأثيرات المسببة للسمنة لنظام الغذاء عالي الدهون (Int J Obes (Lond) 46(10):1749-1758، 2022)، تم استخدام ذكور الفئران من سلالة C57BL/6J في هذه الدراسة.
عينات تم جمعها من الميدان لم تتضمن الدراسة عينات تم جمعها من الميدان.
رقابة الأخلاقيات تمت الموافقة على إجراءات التجارب الحيوانية من قبل لجنة استخدام الحيوانات الحية للتعليم والبحث في جامعة هونغ كونغ ولجنة أخلاقيات الحيوانات في مستشفى الشعب السادس في شنغهاي التابع لكلية الطب بجامعة جياو تونغ في شنغهاي.
يرجى ملاحظة أنه يجب أيضًا تقديم معلومات كاملة حول الموافقة على بروتوكول الدراسة في المخطوطة.

البيانات السريرية

معلومات السياسة حول الدراسات السريرية
يجب أن تتوافق جميع المخطوطات مع إرشادات ICMJE لنشر الأبحاث السريرية ويجب أن تتضمن جميع التقديمات قائمة مراجعة CONSORT مكتملة.
تسجيل التجارب السريرية تم تسجيل هذه التجربة في السجل الصيني للتجارب السريرية كـ ChiCTR-TTRCC 13003333.
بروتوكول الدراسة تم إيداع بروتوكول الدراسة المفصل في المنصة العامة لإدارة التجارب السريرية الصينية (Resman) ويمكن العثور عليه في المعلومات التكميلية.
جمع البيانات تم استخدام استمارة جمع البيانات لجمع المعلومات خلال الدراسة. تم تخزين الملفات الأصلية في مستشفى الشعب السادس التابع لجامعة جياو تونغ في شنغهاي. تم إدخال جميع البيانات مرتين بواسطة موظفي الباحثين. بعد التحقق منها واعتبارها صحيحة في مراجعة عمياء، تم قفل قاعدة البيانات، ولا يمكن إجراء أي تعديل. تم تجنيد المشاركين من يوليو 2013 إلى أكتوبر 2016. تم جمع البيانات في المركز السريري للسكري في شنغهاي من يوليو 2013 إلى أكتوبر 2016.
النتائج كانت النتيجة الرئيسية هي تغيير وزن الجسم المقاس باستخدام محلل تكوين الجسم (تانيتا، TBF-410) بعد تدخل RS مقابل تدخل CS، وكانت النتائج الثانوية هي مساحة الدهون تحت الجلد ومساحة الدهون الحشوية التي تم تقييمها باستخدام جهاز التصوير بالرنين المغناطيسي السريري 3.0 تسلا (أرشيفا، نظام فيليبس الطبي)، وتحليل الدهون في الجسم بواسطة محلل تكوين الجسم، ومحيط الخصر بواسطة القياسات الأنثروبومترية، وملفات الدهون بواسطة التقييمات الكيميائية الحيوية، وحساسية الأنسولين بواسطة قفل الهيبرينسولينيك-يوغليكي.
مخزونات البذور تقرير عن مصدر جميع مخزونات البذور أو المواد النباتية الأخرى المستخدمة. إذا كان ذلك مناسبًا، يرجى ذكر مركز مخزون البذور ورقم الفهرس. إذا تم جمع عينات نباتية من الحقل، يرجى وصف موقع الجمع، التاريخ وإجراءات أخذ العينات.
أنماط جينية نباتية جديدة وصف الطرق التي تم من خلالها إنتاج جميع الأنماط الجينية النباتية الجديدة. يشمل ذلك تلك التي تم إنشاؤها من خلال الأساليب الجينية المتحولة، وتحرير الجينات، والطفرات المعتمدة على المواد الكيميائية/الإشعاع، والتهجين. بالنسبة لخطوط الجينات المتحولة، وصف طريقة التحويل، وعدد الخطوط المستقلة التي تم تحليلها، والجيل الذي أجريت عليه التجارب. بالنسبة لخطوط تحرير الجينات، وصف المحرر المستخدم، والتسلسل الداخلي المستهدف للتحرير، وتسلسل RNA الدليل المستهدف (إذا كان ذلك مناسبًا) وكيفية عمل المحرر.
المصادقة
تم تطبيقه.
وصف أي إجراءات تحقق لكل مخزون بذور مستخدم أو جينوتيب جديد تم إنشاؤه. وصف أي تجارب تم استخدامها لتقييم تأثير الطفرة، وحيثما ينطبق، كيف تم فحص التأثيرات الثانوية المحتملة (مثل إدخالات T-DNA في موقع ثانٍ، التباين، تحرير الجينات خارج الهدف).

  1. تظهر قائمة كاملة بالانتماءات في نهاية الورقة. -البريد الإلكتروني: huarting99@sjtu.edu.cn; liuxy2012@dicp.ac.cn; Gianni.Panagiotou@hki-jena.de; amxu@hku.hk; wpjia@sjtu.edu.cn
  2. مستويات ANGPTL4. م، تغيير في مستويات FGF21 في المصل. الأفراد ( ) ، الأفراد (e، f، i)، أفراد ( ) و الأفراد ( ) إما لـ RS أو CS. تم استخدام تحليل التباين المشترك (ANCOVA) المعدل بالقيمة الأساسية للمقارنة بين RS و CS في كل زيارة (ب-د). تُعرض البيانات كمتوسط ( فترة الثقة (CI). تُعرض البيانات كوسيط مع النطاق interquartile (IQR) (k). تم استخدام اختبار ويلكوكسون غير المعلمي لتقييم الأهمية بين التدخلين. *** تُعرض البيانات كرسوم بيانية من نوع صندوق وشعيرات مخطط الصندوق، الوسيط والرباعيات؛ الشعيرات، نطاق البيانات. و و للفارق بين المجموعات الذي تم تقييمه بواسطة النموذج المختلط الخطي المعدل حسب ترتيب التدخل. و للتغيير داخل المجموعة بواسطة نموذج خطي مختلط معدل للتدخل يليه اختبار بونفيروني.
  3. (ج) المؤلف(ون) 2024

Journal: Nature Metabolism, Volume: 6, Issue: 3
DOI: https://doi.org/10.1038/s42255-024-00988-y
PMID: https://pubmed.ncbi.nlm.nih.gov/38409604
Publication Date: 2024-02-26

Resistant starch intake facilitates weight loss inhumans by reshaping the gut microbiota

Received: 8 January 2023
Accepted: 17 January 2024
Published online: 26 February 2024
(D) Check for updates

Huating Li Lei Zhang , Jun Li , Qian Wu , Lingling Qian , Junsheng , Yueqiong Ni® , Petia Kovatcheva-Datchary , Rui Yuan , Shuangbo Liu , Li Shen , Mingliang Zhang , Bin Sheng , Ping Li , Kang Kang © , Liang Wu , Qichen Fang , Xiaoxue Long , Xiaolin Wang , Yanli Li , Yaorui Ye , Jianping Ye (1) , Yuqian Bao © , Yueliang Zhao , Guowang Xu® , Xinyu Liu® , Gianni Panagiotou , Aimin Xu & Weiping Jia®

Abstract

Emerging evidence suggests that modulation of gut microbiota by dietary fibre may offer solutions for metabolic disorders. In a randomized placebo-controlled crossover design trial (ChiCTR-TTRCC-13003333) in 37 participants with overweight or obesity, we test whether resistant starch (RS) as a dietary supplement influences obesity-related outcomes. Here, we show that RS supplementation for 8 weeks can help to achieve weight loss (mean -2.8 kg ) and improve insulin resistance in individuals with excess body weight. The benefits of RS are associated with changes in gut microbiota composition. Supplementation with Bifidobacterium adolescentis, a species that is markedly associated with the alleviation of obesity in the study participants, protects male mice from diet-induced obesity. Mechanistically, the RS-induced changes in the gut microbiota alter the bile acid profile, reduce inflammation by restoring the intestinal barrier and inhibit lipid absorption. We demonstrate that RS can facilitate weight loss at least partially through B. adolescentis and that the gut microbiota is essential for the action of RS.

Owing to the current global obesity epidemic, research is directed towards new obesity prevention and weight-reduction strategies. This is crucial because obesity significantly contributes to comorbidities such as diabetes and cardiovascular diseases-major global mortality causes. Conversely, weight loss mitigates these comorbidities, underscoring weight management’s importance in preventing and treating these conditions .
The gut microbiota has been increasingly recognized as an important regulator of host physiology and pathophysiology . Specifically, previous studies have reported that gut microbiota regulates inflammation, fat storage and glucose metabolism . Although the results of faecal microbial transplantation (FMT) from healthy donors to individuals with obesity were inconsistent or short-term , combining
dietary intervention with FMT could result in favourable alterations in the recipients’ microbiota and improvements in clinical outcomes . Thus, the rational manipulation of the gut microbiome by dietary interventions might be a promising anti-obesity strategy .
Prebiotics, including polysaccharides, oligosaccharides and other fermentable dietary fibres, increase the amount of beneficial gut microbiota, notably certain Bifidobacterium and Lactobacillus spp. These bacteria diminish pathogen populations, fortify the gut barrier and mitigate the inflammatory response . Moreover, snacks formulated with different fibre preparations could be tailored to alter functions associated with specific elements of the microbiome ; however, most prebiotic studies were based on correlations without establishing a causal link between the modulation of the gut microbiota and the
observed beneficial effects on metabolism . Insights from both human trials and mechanistic studies in gnotobiotic animals are crucial to establish the causality between microbiome alterations and host biological responses. Furthermore, these studies are vital to comprehend the mechanisms connecting microbiome changes to the physiological advantages of prebiotics or other fermentable dietary fibres .
RS refers to a kind of fermentable dietary fibre that cannot be digested by human amylases in the small intestine and moves into the colon, where it undergoes fermentation by gut microbiota . Studies in rodents have demonstrated RS could lead to a decrease in total body fat, particularly visceral fat, as opposed to digestible starch feeding . Diets low in protein and high in carbohydrate yield the most favourable metabolic outcomes when the carbohydrate component consists of RS in mice ; however, human data showed that there was no impact on the total body weight of individuals with metabolic syndrome after being fed RS for a duration spanning 4 to 12 weeks . Low-fat diets supplemented with RS had beneficial effects on the hosts, but high-fat diets attenuated the RS fermentation and the beneficial effects . This may be one possible explanation as to why RS seemingly had no impact on body weight in the clinical trials described above, as those clinical trials did not have a high compliance rate to the diet . Moreover, this implies RS-associated gut microbiota’s vital role in RS’s therapeutic effects; however, RS’s potential as a functional, adaptable food ingredient for obesity treatment in humans and the modulation of metabolic benefits by RS-related gut microbiome alterations remain unclear. Thus, a robust trial in obese individuals is essential to substantiate claims about RS’s impact on diverse physiological aspects in consumers and the required dosage . Moreover, multi-omics approaches and gnotobiotic animal models should be used to systematically and mechanistically connect the influence of RS on the gut microbial community and the host’s metabolism .
Here we performed a crossover, randomized clinical trial in individuals with excess body weight to investigate the effect of RS as a dietary supplement on obesity and other metabolic phenotypes. The trial is a feeding study providing isoenergetic and balanced background diets. Metagenomics and metabolomics analyses were conducted to assess RS’s impact on gut microbiota composition and function. Additionally, we analysed the influence of RS-modified gut microbiota transferred from selected human donors to antibiotic-treated mice on host adiposity and glucose metabolism, we also explored the mechanisms underlying the metabolic advantages conferred by gut microbiota through RS.

Results

RS intervention facilitates weight loss

The investigation was a placebo-controlled, double-blinded, crossover design intervention (ChiCTR-TTRCC-13003333), involving 37 participants (average age of years). The participants had a body mass index (BMI) and/or increased waist circumference ( for men and for women). None had chronic disorders, ongoing treatments impacting glucose metabolism or
recent use of antibiotics or probiotic (within 3 weeks). The 20-week study duration included two intervention periods of 8 weeks, with one each for high-amylose maize (HAM-RS2) (RS, , containing 40 g RS) and control starch (CS) (AMIOCA) ( , 72 g , amylopectin, containing 0 g RS, with equal energy supply) and a 4-week washout period between the interventions (Fig. 1a). Study participants were randomly allocated into two groups: (1) RS-Washout-CS or (2) CS-Washout-RS. Starch was provided as powder in pre-packaged sachets to be mixed with 300 ml water. Each participants consumed one sachet twice a day, before meals. Throughout the trial, encompassing the run-in, two interventions and the intervening washout period, we provided an isoenergetic and balanced background diet (three meals per day), according to the Chinese and American guidelines for prevention and management of adults with overweight and obesity (details in the study protocol of Supplementary Information) . Participants showed no difference in skipping meals or starch consumption between RS and CS interventions, suggesting that there was no difference in dietary compliance between the RS and CS intervention. Except for differences in dietary fibre intake (RS versus CS, g versus ), total energy consumed and percentage of macronutrients were similar during the RS or CS intervention periods (Supplementary Table 1). In total, 37 participants, including 22 male and 15 female participants finished the study and were incorporated into the analyses (Table 1 and Extended Data Fig. 1). The study was conducted in Shanghai, China from 3 July 2013 to 14 October 2016 and reported no gastrointestinal side effects, such as nausea, vomiting, bloating, increased bowel movement or change of stool frequency.
We compared the actual changes in anthropometric parameters and biochemical indices between the interventions (RS versus CS) and the within-group change before and after the intervention using the linear mixed model adjusted by intervention order (Table 1 and Supplementary Table 2). The primary outcome body weight was significantly decreased after the RS intervention and the net absolute change after RS intervention relative to CS intervention was -2.81 kg ( to ), whereas no significant change was observed after the CS intervention (Fig. 1b). Moreover, fat mass and waist circumference reduced significantly after the RS intervention compared with the CS intervention (Fig. 1c,d). During the RS intervention period, the body weight, waist circumference and fat mass of participants significantly decreased from week 2 onwards. Both visceral fat areas (VFA) and subcutaneous fat areas (SFA), measured by abdominal magnetic resonance imaging (MRI) were lower following the RS consumption compared with those following CS consumption ( and , respectively; Fig. 1e-g). Regardless of whether it was in the RS-Washout-CS group or the CS-Washout-RS group, significant reductions were observed in body weight and other obesity-related outcomes after the RS intervention (all ). In the RS-Washout-CS group, obesity-related outcomes showed a reversion to baseline levels after the washout period (Supplementary Table 3 and Extended Data Fig. 2a-e). Moreover, the two-way analysis of variance (ANOVA) showed
Fig. 1| Alleviation of obesity after the 8-week RS intervention in individuals with excess body weight. a, Diagram of the clinical trial. After enrolment, randomization and run-in period, participants consumed either RS or CS alternately and separated by a washout period. During the whole trial, all participants were provided with identical diets. The assessments at each visit are displayed in the diagram. b-d, RS intervention significantly reduced body weight (b), fat mass (c) and waist circumference (d). e,f, Change of VFA and SFA evaluated by MRI. g, Representative abdominal MRI of participants before (left) and after (right) the 8-week RS intervention. Raw (top) and marked (bottom) MRI at navel level. Yellow represents SFA and red represents VFA. h, Change of GIR evaluated by hyperinsulinemic-euglycemic clamp. i, Change of serum TNF levels. j, Change of serum IL-1 levels. k, Daily faecal lipid excretion, including NEFA, TG and TC after the 8-week interventions with RS or CS.I, Change of serum
significant difference in body weight and obesity-related outcomes (fat mass, waist circumference and VFA) on intervention ( ) and no significant order effect or intervention-order interaction. These results demonstrated that an 8 -week RS intervention reduced abdominal adiposity in individuals with excess body weight.
Furthermore, glucose tolerance improved significantly after the RS intervention (Extended Data Fig. 2f,g). The insulin concentrations at 120 min following a meal tolerance test (MTT) in participants after
the RS intervention were significantly lower than those after the CS intervention (Extended Data Fig. 2h); however, the CS intervention did not induce any differences in glucose and insulin levels compared with baseline values (Extended Data Fig. 2f,h). We further assessed insulin sensitivity by hyperinsulinemic-euglycemic clamp and found that the glucose infusion rate (GIR) was significantly increased after the RS intervention (with a median increase of to 2.10) compared to the CS intervention ( ) (Fig. 1h), demonstrating a
e

d
g

f
h
i
j
k
I
m
Table 1 | Summary of clinical parameters of the study participants before and after CS or RS intervention
Clinical parameters CSOW CS 8W RS OW RS 8W P value P value P value P value
Obesity-related indicators
Body weight (kg) 0.328 0.339 <0.001 <0.001
BMI ( ) 0.361 0.422 <0.001 <0.001
FM (kg) 0.486 0.136 <0.001 <0.001
FFM (kg) 0.999 0.999 0.011 0.029
TBW (kg) 0.999 0.999 0.101 0.155
Fat percentage 0.999 0.999 0.101 0.117
Waist circumference (cm) 0.731 0.999 <0.001 <0.001
Hip circumference (cm) 0.999 0.372 <0.001 <0.001
Waist-to-hip ratio 0.999 0.999 <0.001 0.01
VFA ( ) 0.999 0.999 <0.001 <0.001
SFA ( ) 0.999 0.999 <0.001 0.004
Anthropometric parameters
Age (years)
Sex (male:female) 22:15
SBP (mm Hg) 0.999 0.999 0.999 0.918
DBP ( mm Hg ) 0.999 0.999 0.999 0.342
Liver enzymes and renal function
ALT ( ) 16.80 (12.30, 29.00) 20.00 (10.28, 30.25) 16.00 (12.00, 30.00) 15.00 (12.00, 22.50) 0.999 0.999 0.432 0.041
AST ( ) 18.60 (17.20, 22.00) 19.76 (16.03, 24.80) 19.00 (17.00, 22.50) 17.00 (14.50, 21.00) 0.999 0.999 0.058 0.022
GGT ( ) 24.80 (17.50, 35.00) 25.20 (18.17, 34.26) 25.00 (18.00, 36.00) 21.00 (16.00, 35.50) 0.999 0.999 0.033 0.03
BUN ( ) 0.999 0.999 0.999 0.149
0.999 0.999 0.999 0.809
Lipid profiles
TC (mmoll ) 0.999 0.999 0.008 0.146
TG ( ) 1.09 (0.86, 1.68) 1.23 (0.80, 1.52) 1.04 (0.85, 1.64) 1.01 (0.79, 1.38) 0.999 0.999 0.999 0.559
HDL-C (mmoll ) 0.999 0.999 0.999 0.456
LDL-C (mmoll ) 0.999 0.999 0.424 0.482
Secretory cytokines
A-FABP ( ) 35.49 (30.71, 44.82) 36.83 (23.35, 46.99) 37.47 (29.33, 47.81) 31.12 (23.74, 45.12) 0.999 0.999 0.072 0.12
Adiponectin ( ) 9.34 (7.49, 13.86) 9.38 (7.01, 12.39) 9.21 (7.04, 13.13) 10.46 (7.38, 13.68) 0.999 0.999 0.376 0.038
FGF21 ( ) 167.61 (99.71, 211.00) 172.07 (104.63, 237.70) 188.46 (113.19, 224.07) 151.74 (51.62, 216.98) 0.999 0.999 <0.001 0.002
Inflammation-related factors
TNF ( ) 0.70 (0.60, 0.81) 0.68 (0.55, 0.86) 0.70 (0.55, 0.82) 0.66 (0.45, 0.72) 0.999 0.999 0.053 0.014
IL-1 ( ) 0.18 (0.13, 0.24) 0.17 (0.10, 0.27) 0.16 (0.11, 0.26) 0.11 (0.06, 0.17) 0.999 0.999 <0.001 0.046
MCP-1 ( ) 673.56 (535.55, 865.83) 630.62 (516.20, 768.22) 626.85 (513.23, 816.09) 631.97 (498.41, 822.20) 0.999 0.999 0.999 0.925
IL-10 ( ) 1.72 (1.58, 2.07) 1.62 (1.49, 1.79) 1.66 (1.52, 1.95) 1.58 (1.48, 1.91) 0.999 0.999 0.999 0.146
IL-6 ( ) 1.08 (0.65,1.85) 1.12 (0.57,1.64) 1.08 (0.77,1.58) 1.05 (0.71,1.49) 0.999 0.999 0.999 0.689
FM, fat mass; FFM, free fat mass; TBW, total body water; SBP, systolic blood pressure; DBP, diastolic blood pressure; ALT, alanine transaminase; AST, aspartate transaminase; GGT, y-glutamyl
are expressed as mean s.d. or median (interquartile range (IQR)). Differences in baseline variables before the RS and CS interventions were assessed using a linear mixed model adjusted by

in outcomes between the RS and CS intervention were assessed using a linear mixed model adjusted by intervention order.
significant improvement in insulin sensitivity. Furthermore, a significant increase in serum adiponectin levels was observed after the RS intervention (Extended Data Fig. 2i). In addition, after RS intervention, neither the first-phase nor the second-phase insulin secretion was significantly different from those after CS intervention (Supplementary Table 4). All these results indicated that the 8-week RS intervention improved glucose tolerance and insulin sensitivity in individuals with excess body weight.
To investigate the potential mechanism by which RS facilitates weight loss, we determined the changes in chronic, low-grade inflammatory response and intestinal lipid digestion, which are closely related to obesity . Levels of pro-inflammatory cytokines such as serum tumour necrosis factor (TNF) and interleukin (IL)- were found significantly lower in the study participants after RS consumption compared with CS consumption ( and , respectively), although no significant difference in monocyte chemoattractant
protein-1 (MCP-1), IL-10 and IL-6 were observed during RS and CS consumption (Fig. 1i, j and Table 1). Furthermore, we measured faecal lipids of the study participants and found that the daily excretion of faecal non-esterified fatty acid (NEFA), triglycerides (TGs) and total cholesterol (TC) were significantly higher following RS consumption compared with CS consumption (Fig. 1k). As there was no significant difference in fat intake during the RS and CS consumption (Supplementary Table 1), these results suggested that the RS intervention may decrease lipid absorption from the diet. Circulating levels of angiopoietin-like 4 (ANGPTL4), a potential connection between gut and lipid metabolism , were significantly increased in the study participants after the RS consumption compared with CS consumption (Fig.11).Serum fibroblast growth factor 21(FGF21), which was reported to increase in obese status, significantly reduced after RS consumption (Fig. 1m) .

RS intervention reshapes gut microbiota

To investigate the dynamics of the gut microbiota during the interventions, a shotgun metagenomic sequencing was conducted. The average throughput for each sample was 5.74 (s.d. 0.87) Gbp. Species-level taxonomic profiles based on the top 50 species by mean abundance across samples revealed that Prevotella copri,Bacteroides stercoris and Faecalibacterium prausnitzii, were the most prevalent across samples. The other species were present at a much lower abundance (on average 1.1% per species) for the majority of the samples (Extended Data Fig.3a). To evaluate the extent to which the composition of the gut microbiome was altered in response to the RS intervention, we calculated the BrayCurtis distance based on the profile of species variation (as fold change in abundance after the 8-week intervention) between samples using the following procedures. The profile of species variation was composed of fold change ( ) in abundance after treatment for each species. Fold change values were normalized ranging from 0 to 1 with the sum as one in each sample. We further calculated the Bray-Curtis distance based on this profile of species variation. As shown in the non-metric multidimensional scaling (NMDS) plot based on the Bray-Curtis distance, RS and CS samples were separated to a certain extent, indicating significantly different variation patterns in the microbiota after the RS and CS interventions, respectively ( with the Adonis test from VEGAN) (Fig. 2a). This finding thus suggests that the RS intervention influences the dynamics and restructures the composition of the gut microbiota. There was no significant difference in microbial composition between the baseline of CS and RS intervention (Extended Data Fig. 3b-e). We found that seven species were significantly correlated (Benjamini-Hochberg (BH) false discovery rate (FDR) adjusted ) with the overall variation profiles (for all RS and CS samples) (Fig. 2a). We found that BMI significantly correlated ( with the envfit test in R package VEGAN) with the overall taxonomic variation profiles (Fig. 2a), suggesting that the change in body weight is associated with the restructured gut microbiome.
To identify the gut microbiota signature associated with the RS intervention, we compared the changes in the abundance of each species after the RS and CS treatments (as a fold change in the abundance after the 8-week intervention). The results showed that three species, Bifidobacterium adolescentis,Bifidobacterium longum and Ruminococcus bromii, were significantly increased after the RS intervention but remained stable or decreased after the CS intervention. Conversely, four species, including Alisipes putredinis, Bacteroides vulgatus, Odoribacter splanchnicus and Parabacteroides merdae were decreased ( , BH FDR with a Wilcoxon signed-rank test) after the RS treatment but remained stable or increased after the CS treatment. Among the above, R. bromii, A. putredinis and B. adolescentis were the most significantly varied species after the RS intervention compared with the CS intervention (FDR ) (Fig. 2b and Supplementary Table 5). Other degrading species were not significantly varied after the RS intervention in this study (Supplementary Table 6) .
To identify species associated with RS intervention benefits, we investigated the correlation of 12 species (FDR < 0.3 via Wilcoxon rank-sum test) with six significantly altered parameters of the host, including BMI, fat mass, waist circumference, VFA, GIR and serum ANGPTL4 levels. A generalized linear model quantified the association between variation of species abundance and variation of the phenotypes. The strength of the association between the species and phenotypes was described by the importance of the variables in the linear model based on the model selection using corrected Akaike information criterion (AIC), which quantified the relative quality/weight of the statistical model used for given data. The importance of a variable reflects the overall support of all possible weighted linear models or the proportion of the total weights for all possible linear models containing this variable. Among the 12 species with differential abundance, B. adolescentis had the most frequent associations with the various phenotypes (total number of links with the phenotypes) (Fig. 2c). Among the phenotypes, BMI and GIR had the strongest association (average importance for the associated species) with the gut microbes (Fig. 2d). At the single species level, we found that the increased abundance of R. bromii after supplementation of RS was associated with an increase in GIR (importance 0.67 with ). Combined with the aforementioned significant increase in . bromii, our findings suggested that . bromii could be a key species in responding to the RS intervention, consistent with a previous study . B. adolescentis may play a crucial role in alleviating obesity, evident by its strong correlation with lower BMI, waist circumference and VFA (importance 0.87, 0.47 and 0.27 , respectively; ). Its abundance increases also positively correlated higher serum ANGPTL4 levels (importance 0.252, ), suggesting potential lipid metabolism effect. As primary RS degraders, the presence of R. bromii and B. adolescentis at baseline and their relationship with the key outcomes were explored. The fat mass of B. adolescentis-positive individuals decreased even more and their ANGPTL4 levels increased even more after RS intervention (both ), demonstrating that the initial composition of gut microbiota, especially . adolescentis, was closely correlated with the benefits of RS (Extended Data Fig. 4). Among the top ten metabolism-related Kyoto Encyclopaedia of Genes and Genomes (KEGG) pathways with the most differently varied abundances between the RS and CS intervention, the linoleic acid metabolism (ko00591) and bisphenol degradation (ko00363) pathways decreased during the RS treatment, whereas they increased significantly in the CS treatment (FDR for both pathways) (Extended Data Fig. 5).

Association of RS-altered gut microbiota with metabolites

While it remains unclear how changes in the gut microbiota contribute to benefits in the host, a possible mechanism is through altered metabolic production . Thus, we further performed non-targeted metabolomics profiling in the serum of study participants. Serum metabolites related to obesity, such as carnitine and methionine , were decreased after the RS intervention compared with CS intervention (Supplementary Table 7). We used a generalized linear model to investigate the relationship between gut microbes and serum metabolite variation during the RS intervention. The shift of B. adolescentis during the RS intervention negatively correlated with the shift of serum carnitine, energy metabolism and lipid metabolites (average importance 0.15; Fisher’s combined ; Extended Data Fig. 6a). In contrast, the shift of B. vulgatus during the RS intervention positively correlated with the shift of metabolites from energy metabolism, including xanthine and uric acid ( ; Extended Data Fig. 6a).
As bile acids are significant signalling metabolites linking gut microbiota with the host, we conducted quantitative analysis of bile acid profiles. Glycodesoxycholic acid (GDCA) was the only bile acid with a statistically significant difference between the RS and CS interventions. Other bile acids, such as glycocholic acid (GCA), deoxycholic acid (DCA), 7-ketolithocholic acid (7-ketoLCA) and taurodeoxycholic acid
Fig. 2 | The association of the gut microbiome in response to RS treatment with host phenotypes. a, NMDS of the samples based on the variation (fold change after intervention) profile of the species abundance. The red and grey circles surround (with CI) RS and CS samples, respectively. The species and phenotypes correlated with the overall ordination significantly (FDR adjusted with the envfit function in VEGANR package) are highlighted with arrows (blue, species; black, phenotype) where the length of the arrows reflects the strength of the association. b, Seven species with significantly different variation profiles ( , BH FDR with paired two-sided Wilcoxon signed-rank test) between the RS and CS interventions. Box-plots indicate the median and IQR. Whiskers extend to IQR. c, The association network between gut microbes and the host phenotypes. A total of 12 species with different variations ( , BH FDR with two-sided Wilcoxon rank-sum test) between the RS and CS groups were used as predictors in the regression model. Node colour
reflects either the phenotype (yellow), species with increased abundance (green) or species with decreased abundance (red) in response to RS. The colour of the connecting line reflects either the positive correlation (red) or negative correlation (blue) between microbes and the phenotypes. The width of the connecting line reflects the strength of the statistical linear correlation (model averaged importance) between the abundance variation (fold change after intervention) and the variation of the phenotypes (fold change after intervention). The importance is the summed AIC weights of the generalized linear models containing such variables during model selection. The node size of the species reflects its overall influence on all the phenotypes. d, Summary of the importance of the associated species for each phenotype. In a-d, 27 individuals before and after RS and 16 individuals before and after CS were randomly selected from all participants for metagenomic analysis.
(TDCA) exhibited a tendency to increase, whereas -chenodeoxycholic acid ( ) level tended to decrease after the RS intervention (Supplementary Table 8 and Fig. 3a). Through correlation analysis, it was discerned that the secondary bile acids GDCA and TDCA had the closest correlation with metabolic phenotypes. The change of GDCA and TDCA
was negatively correlated with obesity-related phenotypes, whereas positively correlated with insulin sensitivity and ANGPTL4 levels (Fig. 3b). The change of GDCA and TDCA after RS treatment was significantly and positively associated with four species, including B. adolescentis, B. longum, Dorea longicatena and R. bromii,
whereas negatively associated with another eight species, including A. putredinis, Bacteroides coprophilus, Bacteroides ovatus, B. vulgatus, Eubacterium eligens, O. splanchnicus, P. merdae and P. copri (Fig. 3c). Additionally, we identified some microbial pathways strongly associated with the variation of several metabolites, including GDCA, TDCA, CDCA, DCA and 7 -ketoLCA (Fig. 3d). Our results suggest that RS-influenced gut microbiota increases the production of secondary bile acids, which might lead to alleviation of obesity and insulin resistance. To determine whether the species were associated with bile acid metabolism, we investigated the association between gut microbiome and bile salt hydrolase (BSH; K01442), which is the gatekeeper of bile acid metabolism and host-microbiome crosstalk . Our results revealed a significant reduction in the abundance of the BSH gene within the gut microbial community level in the RS intervention compared with the CS intervention ( , Wilcoxon rank-sum test). We found that the expression of was significantly correlated with B. vulgatus ( ; Supplementary Table 9).
Short-chain fatty acids (SCFAs), primarily produced by gut microbial fermentation of dietary fibre, play an important role in the maintenance of gut and metabolic health . Therefore, we conducted targeted metabolomics to investigate the changes in faecal and circulating SCFAs after the RS and CS treatments. We found that faecal concentrations of isobutyrate and valerate significantly decreased after the RS intervention compared with the CS intervention, whereas other faecal SCFAs, including acetate, propionate, butyrate and hexanoate did not differ significantly after the RS intervention (Extended Data Fig. 6b-g). There was no significant difference in circulating levels of SCFAs between the RS and CS interventions (Supplementary Table 10).

RS-reshaped gut microbiota alleviates obesity in mice

To investigate the potential of the RS-related gut microbiota to trigger improvements in host abdominal obesity and glucose metabolism, we performed FMT in antibiotic-treated mice fed with a western diet, utilizing samples from human donors after RS or CS intervention (with changes in body weight post-intervention approximating the respective group average; per group) (Fig. 4a). We observed a consistent trend of RS-induced alterations between donors and mice receiving FMT (Extended Data Fig. 7a). Two weeks after FMT, the body weight and fat mass of the mice that received the RS microbiota were lower than those of mice receiving the CS microbiota ( ) (Fig. 4b,c). The depot mass percentage of epididymal white adipose tissue (eWAT), peri-renal white adipose tissue (pWAT) and mesenteric white adipose tissue (mWAT) in mice colonized with the RS microbiota was significantly lower than that of mice colonized with CS microbiota (Fig. 4d,e). Histological analysis of eWAT and mWAT presented a substantially reduced size of adipocytes in mice colonized with the RS microbiota (Fig.4f,g).A comprehensive laboratory animal monitoring system indicated that the two groups of mice did not show significant differences in energy consumption, respiratory exchange ratio, production, consumption, activity and food intake (Extended Data Fig. 7b-g). The glucose tolerance in these mice was at least partially improved by transplanting the gut microbiota from humans after the
RS intervention (Extended Data Fig. 7h,i). Circulating adiponectin levels in the mice colonized with the RS microbiota were significantly higher than in those colonized with the CS microbiota (Extended Data Fig. 7j). These results suggested that RS-induced changes in the gut microbiota could be sufficient to alleviate obesity and improve host glucose metabolism.

RS-reshaped gut microbiota restores gut barrier

Consistent with the clinical trial findings, RS-altered gut microbiota ameliorated systemic inflammation. Two weeks after FMT, circulating MCP-1, IL-1 and IL-6 levels in the mice colonized with RS microbiota were significantly lower than in those colonized with CS microbiota (all ) (Fig. 5a). Serum levels of the anti-inflammatory factor IL-10 in mice colonized with RS microbiota increased (Fig. 5a). In mesenteric adipose tissues, the expression of and was also significantly lower, whereas that of was higher in the mice receiving RS microbiota compared with those receiving CS microbiota (Fig. 5b).
Metabolic endotoxaemia, which may be attributable to the increased penetration of lipopolysaccharide (LPS) from the gut to circulation, serves as a pivotal factor in obesity-induced chronic inflammation . To investigate how RS-altered gut microbiota interact with metabolic endotoxaemia, we further studied the in vivo gut permeability in mice colonized with microbiota from human donors following RS and CS interventions. The mice were orally gavaged with fluorescein isothiocyanate-labelled dextran (DX-4000-FITC) after a 6 -h fasting period and subsequently, serum samples were collected via the tail vein. The concentration of DX-4000-FITC in the serum was determined using a fluorescence spectrophotometer. Intestinal permeability was significantly lower in mice colonized with RS microbiota compared with those colonized with CS microbiota (Fig. 5c). Gut permeability is regulated by intestinal tight junctions of that block the invasion of pathogens and bacterial products . We evaluated the effect of the RS-induced gut microbiota changes on the expression levels of the major tight junction proteins in the intestine, zona occludens protein (ZO-1) and occludin. The expressions of both ZO-1 and occludin genes were significantly increased in the mice that received the RS microbiota compared with those that received CS microbiota (Fig. 5d-f). Furthermore, in mice colonized with gut microbiota from donors after the RS intervention, restoration of the gut barrier led to a significant reduction in LPS levels in both mesenteric adipose tissue and circulation (Fig. 5g,h). These results suggested that one of the beneficial effects of the altered microbiota was to block LPS penetration by preserving the gut barrier.

RS-altered gut microbiota reduces lipid absorption

Our clinical study showed significantly increased circulating levels of ANGPTL4 and faecal lipids in participants after RS consumption compared with CS consumption. To investigate whether the increase in ANGPTL4 was regulated by the RS microbiota, we measured the levels of ANGPTL4 expression in the ileum of mice from the FMT experiments. Compared with mice colonized with CS microbiota, mice colonized with RS microbiota had significantly higher ileal ANGPTL4 expression (Fig. 5i). ANGPTL4 is an endogenous inhibitor of lipoprotein lipase
Fig. 3 | Bile acids mediate the interplay between the gut microbiome and host phenotypes. a, Fold change of serum bile acid levels evaluated in participants after an 8 -week RS or CS intervention. Data are presented as box-and-whisker plots. The horizontal line in the middle of each box indicates the median value, the top and bottom borders of the boxes represent the 75th and 25th percentiles and the whiskers denote the lowest and highest values. by mixed linear model. b, The association network between bile acids and the host phenotypes. c, The association network between gut microbes and the host phenotypes, respectively. Node colour reflects either the bile acids (blue), the phenotype (yellow in b), or the microbes (yellow in c). The colour of the connecting line reflects either the positive correlation (red) or negative correlation (blue)
between bile acids and phenotypes or between bile acids and microbes. The width of connecting line reflects the strength of the statistical linear association (model averaged importance) between the variation of bile acids (fold change after intervention) and the variation of the phenotypes (fold change after intervention) or between the abundance variation (fold change after intervention) and the variation of the bile acids (fold change after intervention). The importance is the summed AIC weights of the generalized linear models containing such variables during model selection. The node size of the bile acid reflects its overall influence on all the phenotypes or the microbes. d, KEGG pathway analysis showing the correlation between the variation of bile acids and the variation of KEGG pathway abundance.
(LPL) and also pancreatic lipase, which functions as the principal intestinal lipase . We found that the mice colonized with the RS microbiota had a significantly lower intestinal luminal lipase activity compared with mice that received CS microbiota (Fig. 5j). In accordance with the inhibited luminal lipase activity, mice colonized with RS microbiota exhibited lower TG levels in the ileum and higher TG levels in the
faeces than mice colonized with CS microbiota (Fig. 5k,l). Circulating ANGPTL4 levels were also significantly increased in mice colonized with RS microbiota compared with mice colonized with CS microbiota (Fig. 5m). These results indicated that RS-induced changes in the gut microbiota were able to reduce lipid absorption through modulating intestinal ANGPTL4.
Fig. 4 | RS-influenced gut microbiota alleviates obesity. a, Schematic diagram of FMT. Faecal samples from human donors after an 8 -week RS or CS intervention ( per intervention) were transplanted to antibiotic (Abx)-treated C57BL/6 mice. The mice were fed an irradiated western diet (WD) for 2 weeks before and during the 14 d of colonization ( per group). b,c, Body weight and fat mass changes after FMT. d, Representative photographs of visceral fat in mice colonized for 14 d with microbiota from RS or CS donors. e, Adipose depot mass including inguinal subcutaneous fat (iSAT), eWAT, pWAT and mWAT in mice
colonized for 14 d with microbiota.f,g, Representative images and quantification data of haematoxylin and eosin-stained sections of iSAT, eWAT and mWAT in the two groups of mice colonized with CS (top) or RS microbiota (bottom). Scale bar, . Data were reproduced in three independent experiments. Data are presented as mean s.e.m. Significance was determined by paired two-tailed Student’s -test ( ) and unpaired two-tailed Student’s -test ( ) (normally distributed) or nonparametric two-sided Wilcoxon rank-sum test (non-normally distributed). and .

Effects of B. adolescentis on obesity

The increase in . adolescentis caused by RS was strongly correlated with the alleviation of abdominal obesity. Given this, we further investigated the potential causal association between . adolescentis in the gut and host obesity in conventionally raised mice. Mice were randomized into three groups, drinking sterile water fortified with live B. adolescentis, heat-killed B. adolescentis or saline for 5 weeks (Fig. 6a,b).
Supplementing drinking water with live B. adolescentis significantly alleviated body weight gain (Fig. 6c) and adiposity (Fig. 6d) in mice fed a western diet. We further investigated whether . adolescentis regulated ANGPTL4 expression in the intestine. In comparison with mice given drinking water supplemented with heat-killed B. adolescentis, ileal ANGPTL4 expression and secretion were significantly higher in mice given drinking water supplemented with live . adolescentis (Fig. 6e-g).
Fig. 5 | RS-influenced gut microbiota restores gut barrier and reduces lipid absorption. Mice were grouped and treated as in Fig. 4 ( per group). a, Serum levels of inflammatory cytokines in mice colonized with microbiota from RS or CS donors. b, The expression of inflammatory genes in mWAT and in mice colonized with microbiota from RS or CS donors. c, Gut permeability in vivo. d, The expression of ZO-1 and occludin in the ileum. e, The localizations and levels of ZO-1 (red) and occludin (green) in intestinal villus were visualized by immunofluorescence and counterstaining with 4,6-diamidino-2-phenylindole (DAPI) (blue). Representative images of each group are shown (scale bar, ).
f, Quantitative analysis of the positive stained area of ZO-1 and occludin was performed by ImageJ software and calculated as the percentage of total lesion area. levels in mWAT and in circulation (serum). i, Expression levels of ANGPTL4 in the ileum.j, Relative intestinal luminal lipase activity. , TG levels in the ileum. 1, Faecal TG levels. m, Serum ANGPTL4 levels. Data were reproduced in three independent experiments. Data are presented as mean s.e.m. Significance was determined by unpaired two-tailed Student’s -test (normally distributed) or nonparametric two-sided Wilcoxon rank-sum test (non-normally distributed). and 0.001 and .
Consistent with our clinical trial, B. adolescentis positively correlated with serum ANGPTL4 levels. Mice receiving live . adolescentis had significantly decreased luminal lipase activity (Fig. 6h). Correspondingly, these mice had decreased ileal TG and increased faecal TG levels (Fig. 6i,j). Circulating ANGPTL4 levels were also significantly increased in the mice treated with live B. adolescentis (Fig. 6k). Our findings suggest that . adolescentis, one of the key species induced by RS, may protect mice against diet-induced obesity by affecting intestinal ANGPTL4. In addition, the level of FGF21 significantly decreased in the participants after RS intervention, indicating the improvement of FGF21 sensitivity
(Fig. 1m). We found that the treatment with B. adolescentis in mice increased the sensitivity to FGF21 in adipose tissue by suppressing the LPS-TLR4-NF-кB pathway (Extended Data Fig. 8).
We further conducted a targeted metabolomics analysis in conventionally raised mice treated with B. adolescentis (Extended Data Fig. 9a-c). The primary bile acids, including tauro- muricholic acid (T MCA), taurochenodeoxycholic acid (TCDCA) and taurocholic acid (TCA) significantly decreased and the secondary bile acid taurolithocholic acid significantly increased after B. adolescentis intervention (Extended Data Fig. 9a). Regarding SCFAs, the faecal
Fig. B. adolescentis protects against diet-induced obesity and affects intestinal and circulating ANGPTL4. a, Schematic diagram of B. adolescentis (B.a) supplementation strategy. WD-induced obese C57BL/6 mice were supplemented with drinking water with live (WD + B.a) or heat-killed B. adolescentis (WD + hk-B.a) or saline (WD) for 5 weeks. b, The abundance of . adolescentis quantified by qPCR using the specific primers in caecum content among three groups. c-k, Parameters measured in the three groups after 5 weeks of treatment: body weight (c). Adipose depot mass including iSAT, eWAT, pWAT and mWAT (d). The localizations and levels of ANGPTL4 in ileum of mice were visualized by immunohistochemistry staining (scale bar, )
(e). Representative images of each group were shown. ANGPTL4 area as a percentage of total ileal mucosa area (f). ANGPTL4 mRNA expression levels in the ileum (g). Relative intestinal luminal lipase activity (h). TG levels in the ileum (i). Faecal TG levels ( ). Serum ANGPTL4 levels ( ). biological replicates for each group (b-d,g-k). Data were reproduced in three independent experiments. Data are presented as mean s.e.m. Significance was determined by one-way ANOVA (normally distributed) followed by Tukey’s post hoc test or Kruskal-Wallis test (non-normally distributed) followed by Dunn’s test. , and 0.05 and and , and 0.003 and .
levels of isobutyrate and valerate also decreased significantly after B. adolescentis intervention (Extended Data Fig. 9b). In addition, the levels of serum branched-chain amino acids (BCAAs), including valine and leucine, significantly decreased after . adolescentis intervention (Extended Data Fig. 9c).

RS facilitates weight loss partially through B. adolescentis

To explore whether the effects of RS depend on gut microbiota, we carried out the RS and CS interventions in germ-free mice (Fig. 7a). Male germ-free mice were fed a C35 diet (35% carbohydrate sourced from RS or 20% CS) for 10 weeks. Meanwhile, these mice were treated
with PBS or live B. adolescentis for 8 weeks. As intestinal contents and the thickness of the lumen were significantly increased after RS feeding, the disembowelled body weight was commonly used to evaluate the effect of weight loss . Unlike the protecting effect of RS against diet-induced obesity in conventional environment , RS treatment showed no significant change on disembowelled body weight, glucose tolerance and insulin sensitivity compared with CS treatment in germ-free mice (Fig. 7c-f). To further investigated the effects of RS with and without B. adolescentis, we fed the germ-free mice with RS together with . adolescentis. These mice showed significant decrease in disembowelled body weight and fat mass, as well as the improvement on glucose tolerance and insulin sensitivity compared with mice without B. adolescentis (Fig. 7c-f).B. adolescentis reduced gut permeability and increased the intestinal production of ANGPTL4 in germ-free mice, which was consistent with our finding in a conventional environment (Fig. ). Germ-free mice gavaged with B. adolescentis exhibited reduced luminal lipase activity and ileum TG levels, alongside increased faecal TG levels (Fig. 71,m). These results indicated that gut microbiota was essential in the action of RS in protecting against diet-induced obesity. RS played the role in facilitating weight loss, at least partially, through . adolescentis via reducing inflammation by restoring the gut barrier and modulating ANGPTL4 production in the intestine, thereby impeding lipid absorption.
In addition, the serum levels of primary bile acids in germ-free mice were higher than those in the conventional environment and the levels of secondary bile acids were relatively .GCA, a conjugated bile acid and DCA, a secondary bile acid, exhibit a tendency to increase after RS intervention in humans. GCA and DCA significantly increased after . adolescentis intervention in germ-free mice. The primary bile acids, including T MCA, TCDCA and TCA significantly decreased after B. adolescentis intervention in germ-free mice (Extended Data Fig. 9d). The levels of serum BCAAs and faecal isobutyrate were decreased after B. adolescentis intervention (Extended Data Fig. 9e,f).

Discussion

This placebo-controlled, double-blinded and crossover-designed trial was conducted in individuals with excess body weight. We found that RS supplementation, coupled with isoenergetic and balanced diets, significantly reduced body weight and improved insulin sensitivity in humans. RS treatment reshaped the microbiome structure and altered metabolites. Gut microbiota plays a key role in RS’s efficacy for weight loss. Monocolonization of mice with B. adolescentis, linked to the benefits of RS in humans, prevented diet-induced obesity in mice. Mechanistically, the RS-induced changes in gut microbiota influenced bile acid metabolism, reduced inflammation through gut barrier restoration, inhibited lipid absorption by modulating ANGPTL4 and improved FGF21 sensitivity (Extended Data Fig. 10). RS played a role in facilitating weight loss at least partially through . adolescentis. Specifically, this study provides evidence that RS ( , type 2) as a dietary supplement for 8 weeks can help to achieve weight loss in individuals with excess body weight. In this feeding study, we provided the participants with a background diet throughout the study. The background diets, which were isoenergetic and balanced , did not influence body weight or fat content over an 8-week period, as observed following CS treatment. In previous trials using RS, relatively insufficient RS intake (fat:fibre ratio or high fat intake (fat:RS ratio resulted in reduction of insulin resistance or fat percentage without weight loss. Other trials did not prescribe a background diet and the fat intake was either too high or not assessed . High-fat diets induce changes in the intestinal microbiota that lead to impaired gut health . In microbiome-based therapies, a background diet is critical for efficacy . In rodents, low-fat diets (18% of energy) supplemented with RS have beneficial effects on the hosts, but high-fat diets ( of energy) attenuated RS fermentation and the beneficial effects . As was deemed to be a relatively high dose that could be delivered without adverse effects , the fat
content in the daily diet is important for the effect of RS. Our study provided an effective dietary recommendation using RS as a supplement ( with a balanced background diet containing 25-30% fat), which may help to achieve significant weight loss. The design of the background diet and good adherence enabled us to mitigate the influence of significant confounding variables known to have impacts on the gut microbiome and metabolome.
This study represents one of the few that reports a specific microbiota signature after RS2 intervention. The taxonomic groups commonly enriched post-RS2 consumption include R. bromii, B. adolescentis,Faecalibacterium prausnitzii and Eubacterium rectale. . bromii, which acts as primary RS2 degrader was enriched during previous RS2 interventions . In this study, R. bromii and B. adolescentis notably increased after RS intervention in individuals with excess body weight. The increased abundance of . adolescentis strongly correlated with decreased BMI and VFA, suggesting its role in RS’s weight-loss benefits. Participants with B. adolescentis in their gut microbiome at baseline exhibited a greater decrease in fat mass after RS treatment. Furthermore, we transmitted the beneficial effects of RS on host obesity and glucose metabolism in mice via human microbiota engraftment, reinforcing our hypothesis that RS-induced changes in the microbiota can drive beneficial host outcomes. Furthermore, gut microbiota was essential in the benefits of RS, which was verified through RS intervention in germ-free mice.
The production of microbiota-derived metabolites is involved in the function of prebiotics . Bile acids are significant signalling metabolites linking gut microbiota with the host . Herein, the secondary bile acid, GDCA, was significantly increased after RS treatment, other secondary bile acids, such as DCA, 7-ketoLCA and TDCA, exhibited a tendency to increase. Secondary bile acids have been reported to ameliorate hepatic steatosis and augment insulin sensitivity . BSH carries out bile acid deconjugation . In our study, the abundance of the BSH gene decreased and showed a significant correlation with B. vulgatus. Inhibiting BSH activity emerged as a potentially beneficial approach to regulate lipid and energy homoeostasis, leading to an increase in conjugated bile acids . In our cohort, conjugated bile acids, including GCA, GDCA and TDCA, demonstrated an increasing trend after RS treatment. Consistent with the findings in humans, GCA and DCA significantly increased after B. adolescentis intervention in germ-free mice. GCA and DCA are the agonists to FXR and Takeda G protein-coupled receptor 5 (TGR5), respectively, which are known receptors regulating glucose, lipid and energy metabolism . The serum level of BCAAs, including valine and leucine, significantly decreased after B. adolescentis intervention in both conventional and germ-free environment. Serum levels of BCAAs decreased after the RS intervention in participants with non-alcoholic fatty liver disease (NAFLD) . Faecal isobutyrate, a microbial product of the proteolysis of valine , decreased after RS intervention in our study.
The interplay between energy regulation and inflammation was modulated by the gut microbiome, influencing intestinal permeability and generating pro-inflammatory factors that exhibited variable effects on metabolic health . Integrity of the intestinal mucosa is maintained via intercellular tight junctions, which are essential regulators of intestinal permeability . The levels of the two tight junction proteins, occludin and ZO-1, elevated in the ileum and circulating LPS decreased in mice that received RS-induced microbiota, suggesting an additional mechanism of protecting the intestinal barrier by RS-altered gut microbiota. Chronic low-grade inflammation and immune system activation were involved in the development of obesity and insulin resistance . Weight management influenced by gut microbiome may also through modulation of secretory protein involved in energy utilization and homoeostasis . Notably, the metagenomics analysis demonstrated that the increased abundance of B. adolescentis after the RS treatment was positively associated with serum ANGPTL4. ANGPTL4
Fig. 7| Effects of RS in germ-free mice with and without B. adolescentis.
a, Schematic diagram of B. adolescentis (B.a) supplementation strategy. Orally inoculating B. adolescentis or PBS into germ-free (GF) mice on diets with protein, 45% fat and 35% carbohydrate sourced (from 20% CS or 20% RS and the remaining from maltodextrin) for 8 weeks. , Abundance of . adolescentis quantified as total plate count in caecum content. c.f.u., colony-forming unit. c, Disembowelled body weight. d, Glucose excursion curves of intraperitoneal glucose tolerance tests (GTTs). e, Glucose excursion curves of intraperitoneal insulin tolerance tests (ITTs).f, Body mass composition. g, After an 8-week B. adolescentis supplementation, in vivo gut permeability was determined by
measurement of serum concentrations of DX-4000-FITC at 1 h after oral gavage. h, Expression of ZO-1 and occludin in the ileum. i, Expression of inflammatory genes in mWAT. j, mRNA expression levels of ANGPTL4 in the ileum. k, Relative intestinal luminal lipase activity. I, TG levels in the ileum. m, Faecal TG levels. Data are mean s.e.m. ( biological replicates per group). and 0.03 (d), and , and 0.004 (I), based on one-way ANOVA (normally distributed) followed by Dunnett’s test or Kruskal-Wallis test (non-normally distributed) followed by Dunn’s test. indicates the comparison between RS and RS .
has garnered substantial interest in relation to the gut microbiota. Germ-free mice exhibited elevated intestinal ANGPTL4 expression in compared with mice raised conventionally . The reduction in ANGPTL4 levels contributes to increased fat accumulation upon conventionalization through increased LPL activity in adipose tissue . Colonization of germ-free mice with acetate-producing Bacteroides thetaiotaomicron or methane-producing Methanobrevibacter smithii, resulted in decreased intestinal ANGPTL4 expression, whereas colonization with the butyrate-producing bacteria Clostridium tyrobutyricum significantly elevated intestinal ANGPTL4 expression . A possible explanation for this result is that the modulation of intestinal ANGPTL4 is contingent on the gut microbiota composition, which determines the mixture of microbial metabolites formed, together with substrate provision . Using FMT, we observed that RS-induced changes in gut microbiota reduced lipid absorption through modulating intestinal ANGPTL4. Furthermore, colonization of diet-induced obese mice raised in both conventional and germ-free environments with B. adolescentis markedly elevated intestinal ANGPTL4 levels. Thus, manipulating pancreatic lipase activity via ANGPTL4, a key regulator of lipid absorption, through gut microbiota modulation, might be a crucial way to alter body fat storage. B. adolescentis supplementation could mitigate NAFLD by enhancing FGF21 sensitivity in the liver . Our results also revealed that treatment with B. adolescentis increased FGF21 sensitivity in adipose tissue by suppressing the LPS-TLR4-NF-кB pathway. Multiple clinical trials of FGF21 analogues and mimetics showed improved lipid profiles, increased adiponectin and decreased body weight . It was uncovered that the reversal of obesity-induced FGF21 resistance in adipose tissue could serve as an alternative approach for treating obesity and related diseases .
The main limitation of the study was its relatively small sample size and stringent inclusion criteria for participants, limiting result generalizability. Our database-dependent, taxon-based analysis, while offering comprehensive and well-annotated information for taxonomic assignments, also faces limitations such as discarding sequences that are difficult to classify and overlooking strain-level functional diversity. We acknowledge that integrating metagenome-assembled genomes could enhance our understanding of microbial ecology and potentially improve the identification of robust biomarkers for clinical translation. The broader generalizability of our results requires additional validation in larger and more diverse cohorts. Future studies will need to pay special attention to the individual dynamics and functional responses of microbiota in RS supplementation. The in-depth insight into the crosstalk between RS-altered bile acids and gut microbiota and its impact on host metabolism are warranted in further investigations. Although the applicability to other populations remains unconfirmed, our study provides the evidence that RS ( , type 2 ) as a dietary supplement facilitates weight loss in individuals with excess body weight. Our study also provides an effective dietary design along with RS to mitigate the influence of major confounding variables affecting the gut microbiome. Gut microbiota change driven by RS was essential for its effect. The gut microbiota played a pivotal role in this weight-loss mechanism, potentially modulating obesity through interactions with low-grade inflammation and regulation of energy-balance-related secretory proteins. Through the crossover design, we found that body weight was regained during the washout period. Weight regain is one of the biggest challenges of weight loss treatment, which occurs after stopping medication, such as GLP-1 agonists and even after bariatric surgery . Long-term adherence to an RS-rich dietary pattern to maintain the composition of the microbiome may be crucial for weight maintenance. As RS occurs naturally in foods and can also be added to daily diets, our findings provide a pragmatic lifestyle to treat obesity and its related metabolic disorders. Manipulating the gut microbial composition through diet may represent a strategy for modifying host energy balance to promote health.

Methods

Study participants

The inclusion criteria were (1) age 18-55 years and (2) overweight or obesity, as defined as BMI or waist circumference in men and in women . The exclusion criteria were acute illness, antibiotic or probiotic supplement use within 3 weeks previously, diagnosis of hyperthyroidism or hypothyroidism, diabetes, current systemic corticosteroid treatment or medications affecting glucose metabolism, and participation in other clinical trials within 4 weeks before the study.
This study was approved by the ethics committee of the Shanghai Sixth People’s Hospital and conformed with the Declaration of Helsinki. Written informed consent was obtained from all participants. Complete clinical trial registration was deposited in the Chinese Clinical Trial Registry (ChiCTR-TTRCC 13003333) (Extended Data Fig. 1).

General protocol of the clinical trial

The detailed study protocol was submitted to the Chinese Clinical Trial Management Public Platform and is available in the Supplementary Information. Individuals with excess body weight consumed either RS derived from maize (HAM-RS2, Hi-Maize 260 resistant starch, 22000B00, provided by Ingredion) or energy-matched CS (AMIOCA cornstarch, 04400110, also provided by Ingredion) alternately for 8 weeks and separated by a 4 -week washout period. An independent researcher performed the randomization and participant allocation to the CS-Washout-RS or RS-Washout-CS intervention schemes with at a 1:1 allocation ratio. The randomization schedule was produced by SAS PROC PLAN in SAS software. RS and CS were packaged in identical sealed bags with an identical appearance and participants and investigators were blinded to the group allocations during the double-blind period. Only the research designer was aware of the randomization scheme, whereas the participants, investigators, clinical staff and outcome assessors were blinded to it. The blinding was lifted during the bioinformatics analysis to explore the potential mechanism by which the gut microbiota conferred the physiological benefits of RS.
During this feeding study, participants received a uniform background diet, following the Chinese and American guidelines for the prevention and control of adults with overweight and obesity . All participants were either lightly active or led sedentary lives. The diet provided ideal body weight (ideal body weight ( kg ) = height (cm) – 105) daily, with 50-60% carbohydrate, 25-30% fat and 15-20% protein. Participants were permitted one item of fruit daily and advised against extra-sugary beverages or snacks. They maintained a diary recording three consecutive 24 -h dietary intake (two weekdays and one weekend day) at baseline and at the beginning and end of each intervention period, noting any dietary deviations. A trained dietician assessed starch consumption and dietary regimen adherence during visits. Diet data revealed similar average calorie intake and macronutrient percentages in the RS and CS intervention periods (Supplementary Table 1).
Participants attended the institute for visits (V) 1-10 (Fig. 1a). At the start and the end of each intervention (V1, V5, V6 and V10), participants had a hyperinsulinemic-euglycemic clamp, MTT, MRI scans and sample collections . Anthropometric and biochemical assessments were conducted at each visit. The primary outcome was body weight and secondary outcomes included VFA and SFA, body fat, waist circumference, lipid profiles, insulin sensitivity, metabolome and gut microbiome.

Anthropometric and biochemical assessments

After overnight fasting for at least 10 h , anthropometric test and samples (venous blood, urine and faeces) collection was conducted in the morning following the study protocol.
Serum samples after centrifugation were stored at until measuring AST, ALT, GGT, HDL-C, LDL-C and insulin . Serum A-FABP (AIS, HKU, 31030), adiponectin (AIS, HKU, 31010), inflammatory cytokines (Ebiosciense, TNF , BMS223HS; MCP-1, BMS281; IL-1 ,
BMS224HS; IL-6, BMS213HS; IL-10, BMS215HS), ANGPTL4 (BioVendor, RD191073200R) and FGF21 (AIS, HKU, 31180) were quantified by enzyme-linked immunosorbent assay (ELISA). Serum LPS levels were measured through sensitive limulus amoebocyte lysate (LAL) assay (Hycult Biotechnology, MAK109).

MTT experiment

To evaluate glucose metabolism, serial blood samples were collected in both fasting and postprandial states for laboratory tests following a standard meal ( 315.2 kcal , including 68.4 g carbohydrate and 10.4 g protein) (China Oil & Foodstuffs Corporation).

Hyperinsulinemic-euglycemic clamp

Insulin sensitivity was evaluated through a hyperinsulinemic-euglycemic clamp. Insulin levels were maintained at approximately through a prime-continuous infusion of insulin. To maintain the concentration of plasma glucose at basal levels, variable glucose infusion following a negative feedback principle was conducted. The glucose clamp technique was performed as previously described .

Faecal DNA extraction and sequencing

Faecal samples were collected through a tube with a DNA stabilizer (STRATEC Molecular) and stored at . Faecal genomic DNA from both humans and mice receiving FMT from human donors was extracted using PSP Spin Stool DNA kit (STRATEC Molecular, 1038100) following the manufacturer’s instructions. Faecal DNA extracts from 86 samples (27 samples before and after RS and 16 samples before and after CS) were randomly selected from all participants for shotgun metagenomic sequencing. HiSeq 1500 was used for 100-bp paired-end shotgun metagenomic sequencing for human samples at the Centre for Genomic Sciences, the University of Hong Kong. An Illumina platform Novaseq 6000 was used for 150-bp paired-end sequencing for mice samples at Novogene. Raw sequences were stored in the National Center for Biotechnology (NCBI) Sequence Read Archive (project ID PRJNA414688).

Metagenomics analysis

Quality control for metagenomic data. We used a series of quality control steps to remove low-quality reads/bases as described previously . In brief, all Illumina primer/adaptor/linker sequences were removed and low-quality regions (quality score ) and reads were trimmed. Subsequently, we mapped all reads to the human genome using BWA v.0.7.4 (ref. 52). Reads with >95% identity and 90% coverage were removed as human DNA contamination.
Taxonomy and functional profiling. Taxonomy affiliations for reads were determined by MetaPhlAn . We distilled the top 50 most-abundant species based on the average abundance across all samples (minimum average abundance > 0.3%), which accounted for of the total relative abundance in each sample on average. The proportion of unclassified reads was (mean s.d.) across all samples. To overcome potential bias from baseline differences between individuals within groups and to facilitate cross-group comparisons, we compared community-level variation patterns (based on the fold change in abundance of species), instead of raw community structures between two groups (based on the relative abundances of species). We calculated the in abundance after treatment for each species. Fold change values were normalized (within all samples in each group) ranging from 0 to 1 and further rescaled to make the sum of the normalized fold change as one. We further calculated the Bray-Curtis distance based on the profile of the normalized fold change of species abundance.
Differentially varied species after treatment with RS or CS were tested using a Wilcoxon signed-rank test, with an FDR cutoff of 0.2. The NMDS ordination analysis based on the normalized Bray-Curtis
dissimilarity of species-level abundance fold change, described above, was performed with R package VEGAN . Network visualization was performed by Cytoscape 3 (ref. 55).
IDBA-UD was adopted de novo assemblies with -mer size ranging from 20 to 100 bp. The method for functional annotation and abundance calculations for KEGG pathways is described in an online server that we developed . In brief, MetaGeneMark was used for microbial gene prediction. Metagenomic reads were mapped to assembled contigs to get gene-level DNA abundance levels with reads per kilobase per million (RPKM) mapped reads. We used KOBAS to annotate KEGG orthologues and pathways based on annotated genes. Scripts from our publish servers were used to calculate the aggregated RPKM for each pathway.
Metagenomics association analyses. Generalized linear modelling was performed using the R package glmulti. For each phenotype, the response variable was the fold change of the phenotype; the independent variables were from a subset of the fold change of 12 species with FDR in the differentially varied analysis using a Wilcoxon rank-sum test. The linear models started from ‘PHENOTYPE ‘, generating all possible models to reach a best model with feature selections. The importance for a particular species variable was calculated as the proportion of the total weights/probabilities for the models containing the variable during automatic model selection based on corrected AIC. This importance index reflects overall support of all possible weighted linear models. Only the main effects in the generalized linear models were considered. The value of a particular species variable was calculate using Fisher’s method to combine the value among the top ten models.
To quantify the association between (1) phenotypes and metabolites, (2) gut microbes and blood metabolites and (3) gut microbial pathways and blood metabolites, we adopted partial least-squares discriminant analysis (PLS-DA) using the mixOmics package in R. The number of components was set to 2 and number of features for each component was estimated based on hyperparameter optimization.

Metabolomics profiling of human serum samples

The serum untargeted metabolomics data were quantified through a Shimadzu Prominence HPLC system (Shimadzu) coupled to an LTQ Orbitrap Velos instrument (Thermo Fisher Scientific) at the CAS Key Laboratory of Separation Science for Analytical Chemistry. The details of analytical conditions were as described in a previous study . The quantitation of bile acid profiles was performed by Metabo-Profile .

Metabolomics profiling of human faecal samples

The metabolomics data of human faecal samples were quantified by GC-TOF-MS (Agilent 6890 N GC coupled with a LECO Pegasus HT TOFMS). The details of analytical condition as described in previous study .

Faecal lipid assessment

Faecal lipids were extracted from the faeces of participants after 8-week RS or CS interventions using published methods . Approximately 100 mg lyophilized faeces was acidified with ethanol and 8 N hydrochloric acid, then kept in a water bath at for 40 min . Fatty acids were subsequently extracted with diethyl ether and petroleum ether. After filtering the ether-fat upper phase, the clear ether solution was collected and kept in a rotary evaporator for 1 h at . Fatty acids were resolubilized in ethanol and NEFA, TC and TG were subsequently measured using enzymatic assays (Jiancheng, A042-1-1, A111-1-1 and A110-1-1, respectively).

Mouse model

The Committee on the Use of Live Animals for Teaching and Research of the University of Hong Kong and the Animal Ethics Committee of Shanghai Sixth People’s Hospital approved the animal experimental procedures. Healthy C57BL/6J male mice were conventionally raised in
a specific-pathogen-free barrier facility in individually ventilated cages with a maximum of four mice per cage, with free access to food and water under a strict 12 -h light-dark cycle at a controlled temperature ( ) and humidity. For FMT experiments, 10 -week-old male C57BL/6J antibiotic-treated mice (GemParmatech, N000013) were fed a WD (Research Diet, D12451) for 2 weeks before and during the colonization. For administrating of B. adolescentis to conventionally raised mice, eight-week-old males were similarly fed the WD for 8 weeks before . adolescentis administration. For the intervention of RS with B. adolescentis in mice housed in a GF environment, 5-week-old male C57BL/6J mice were kept in isolators (GemParmatech, N000295) and fed a C35 diet (45% fat, 20% protein and 35% carbohydrate sourced from or 20% CS, and the remaining 80% from maltodextrin) for 10 weeks. Meanwhile, the mice were orally inoculated with . adolescentis or PBS for the remaining 8 weeks.

FMT experiment

Antibiotic-treated mice with microbiota depletion were given daily oral gavage with a antibiotics cocktail (ampicillin , neomycin , metronidazole and vancomycin ) for 7 d , followed by a 4 -d antibiotic washout period before FMT. For FMT, the preparation of fresh stool samples and the subsequent operation in mice was conducted as previously described .
Body weight was measured every 3 or 4 d. Stool samples were collected before and after faecal transplantation and instantly stored at until further analysis. Body composition was determined with a Minispec LF90 Body Composition Analyzer (Bruker). In vivo gut permeability, GTTs, ITTs and whole-body oxygen consumption were accessed via a comprehensive laboratory animal monitoring system (Columbus Instruments) . Fat mass in inguinal subcutaneous, epididymal, peri-renal and mesenteric white adipose tissue was determined after death by wet weight measurements. Blood and various tissues were collected for further biochemical evaluations. The study did not blind investigators to group allocations and no mice were excluded.

Bacterial strain

B. adolescentis strain E 298 b (Variant c) (DSMZ no. 20086) was purchased from DSMZ. The culture medium was prepared according to the DSMZ website and . adolescentis was grown in an anaerobic workstation (Gene Science AG300). B. adolescentis was cultured anaerobically in sterilized DSMZ Medium 58 containing casein peptone (tryptic digest, Sigma-Aldrich), yeast extract (Sigma-Aldrich), meat extract (Sigma-Aldrich), bacto soytone (BD), glucose (Sigma-Aldrich), , , Tween , cysteine- (Sigma-Aldrich), salt solution and resazurin (Sigma-Aldrich). The purity of cultures was monitored by Gram staining and the c.f.u. was counted by plating serial dilutions on agar plates.

Administration of B. adolescentis

B. adolescentis was collected through centrifugation at for 30 min at , followed by a double washing with sterile PBS and subsequently resuspended in 2 ml anaerobic sterile PBS containing glycerol, achieving of c.f.u. per ml. This suspension was then preserved by storage at . Before supplementing the drinking water of mice, live B. adolescentis stock was thawed at and diluted in 100 ml autoclaved water. On average, each mouse received at least c.f.u. per day. B. adolescentis was heat-killed at under pressure of 225 kPa for 15 min . Viability confirmation tests were performed by culturing, showing that heat-killed B. adolescentis did not grow, whereas live . adolescentis grew well. Drinking water was changed daily in the three groups during the experiment. In addition, GF mice were treated with PBS or c.f.u. of live B. adolescentis in sterile anaerobic PBS by gavage three times per week for 8 weeks.

Biochemical and immunological assays in mice

Serum levels of TC and TG as well as intrahepatic, intestinal and faecal TG were measured by enzymatic analysis (Stanbio Laboratory, 2100430 and 1100430).Serum NEFA was measured by enzymatic analysis (Roche Diagnostics).Serum adiponectin (AIS, HKU, 32010), ANGPTL4 (Abcam, ab210577), inflammatory serum molecules (eBioscience, MCP-1, BMS6005; IL-1 , BMS6002; IL-6, BMS603-2; IL-10, BMS614INST) and FGF21 (Immunodiagnostics Limited, 32180) were measured using ELISA. LPS levels in mesenteric white adipose tissue and serum were measured by LAL assay (Hycult Biotechnology, HIT302).

Metabolomics profiling of mice samples

Amio acid profiling. Target amino acids were quantified using Waters AccQ-Tag derivation kit with serum by A Nexera X2 ultra HPLC equipped with a triple quadrupole 8050 (Shimadzu). The details of analytical condition as described in previous study .
Bile acid profiling. Target bile acids were analysed by A Vanquish UPLC-Q Exactive (Thermo Fisher Scientific) system. Bile acids in THE serum sample ( ) was extracted by methanol containing internal standards. Peak detection and integration were carried out by using Trancefinder (Thermo Fisher). The results quantified by the standard curve were used for feature analysis. The details of sample preparation and analytical conditions are as described in a previous study .
SCFA profiling. For sample pretreatment, serum was mixed with acetonitrile containing the internal standard butyric acid-d7. After vortexing and centrifuging, the supernatant was aspirated for subsequent analysis. For the faecal sample, 40 mg faecal with grinding ball was mixed with of acetonitrile containing internal standard extractant, internal standard Butyric-d7 acid . After grinding and centrifugation, the upper supernatant was aspirated for subsequent analysis.
For analytical measurement, an Agilent 5977A instrument equipped with an MSD gas chromatography mass spectrometry (GCMS) system (Agilent) was used for SCFA analysis. A DB-FFAP column ( , Agilent) was adopted for GC separation. The initial temperature was and maintained for 1 min , then increased to at , immediately raised to at and maintained for 2 min . The flow rate of helium carrier gas was kept at . The temperatures of the injector, ion source, quadrupole and interface were and , respectively. The selected ion monitoring mode was performed by detecting the protonated molecules at for acetic acid and isobutyric acid, for propionic acid and for other SCFAs. Peak detection and integration were performed using Quantitative Analysis (Agilent). The results quantified by the standard curve are used for feature analysis. All the metabolomic profiles in mice were performed at the CAS Key Laboratory of Separation Science for Analytical Chemistry.

FGF21 response test

After an 8-week B. adolescentis intervention period, an FGF21 response test was conducted in conventionally raised mice. Under general anaesthesia, a subcutaneous fat biopsy was taken and flash-frozen in liquid nitrogen. Subsequently, recombinant mouse FGF21 or a vehicle was intravenously injected via the inferior vena cava. At 15 min later, a second subcutaneous fat biopsy was taken to assess gene expression and Erk1/2 phosphorylation.

Quantitative PCR assays

The total RNA of tissue samples was extracted by TRIzol (Invitrogen) and reverse transcribed into complementary DNA using ImProm-II reverse transcriptase (Promega). Quantitative PCR with reverse transcription (RT-qPCR) reactions were performed using the Quantifast
SYBR Green master mix (QIAGEN) on a Light Cycler 480 system (Roche), normalized with mouse GAPDH. Primers for each gene and B. adolescentis are listed in Supplementary Table 11.

Histological examination

Ileum sections were treated with ZO-1 or occludin antibodies (Abcam, 1:500 dilution, ab96587; dilution, ab216327), followed by incubation with Alex Fluor-596 or FITC-conjugated secondary antibodies (Life Technologies) and counterstaining with DAPI. Ileum sections were treated with ANGPTL4 antibody (Proteintech, 1:500 dilution, 18374-1-AP), followed by incubation with horseradish peroxidase-labelled secondary antibodies (DAKO), developed by DAB following the manufacturer’s recommendations. Five random fields were selected from different regions of individual sections for image quantitation. ImageJ software was used to analyse the intensity of positive staining, represented as a percentage of the total area of the lesion or villi in every field.

Luminal lipase activity

The mixture of luminal content from the small intestine and ice-cold PBS was vortexed thoroughly, followed centrifugation at at for 10 min . Supernatants were collected and diluted in PBS for lipase activity measurement via lipase activity assay kit (Sigma, MAK109) following the manufacturer’s protocol.

Western blotting

WAT proteins were extracted using a lysis buffer containing protease inhibitors (ST505, Beyotime Biotechnology) and phosphatase inhibitors (P1082, Beyotime Biotechnology). Protein samples were resolved by SDS-PAGE (8%) and immunoblotted onto polyvinylidene difluoride membranes. Immunoblotting was conducted using extracellular signal-regulated protein kinase 1/2 (Erk1/2) (Cell Signalling Technology, 1:1,000 dilution, 9102) and phosphorylated Erk1/2 (Thr202/ Tyr204) (Cell Signalling Technology, 1:1,000 dilution, 9101). Immunoreactivity was detected using enhanced chemiluminescent autoradiography (Millipore). Band quantification was performed using ImageJ software.

Statistical analysis

The statistical analysis plan for this study is available in the Supplementary Information. EpiData v.3.1 facilitated clinical data entry and documentation. Statistical analyses unless otherwise stated, utilized SPSS v. 17 and R v.3.3.2 software. Normally distributed clinical data were presented as mean s.d. Non-normally distributed data, verified by the Kolmogorov-Smirnov test, were presented as medians and IQRs. The intervention’s effects on outcomes were analysed using a linear mixed model adjusted for age, sex and intervention order, with Bonferroni adjustment for multiple testing correction. In animal studies, data distribution and variance equality were assessed using a Shapiro-Wilk test and Levene’s test. For two-group comparisons, a two-tailed Student’s unpaired -test (normally distributed) or nonparametric Wilcoxon rank-sum test (non-normally distributed) was applied. Among multiple groups, a one-way ANOVA (normally distributed) followed by Tukey’s post hoc test or Kruskal-Wallis test (non-normally distributed) followed by Dunn’s test was used. In the clinical study, based on literature and preliminary data, the expected change in body weight and its s.d. after RS intervention was estimated as . A two-tailed test with a 0.05 significance level and power required a minimum sample size of 31 . Thirty-seven participants were invited to account for an expected dropout post-randomization. For animal studies, sample sizes were estimated based on previous research and assay variability. Two-sided values < 0.05 were deemed statistically significant.

Reporting summary

Further information on research design is available in the Nature Portfolio Reporting Summary linked to this article.

Data availability

Individual-level patient data are accessible with the consent of the Data Management Committee from the institutions and are not publicly available. The Data Management Committee will review all requests and grant access (if successful). A formal data transfer agreement will be required upon approval. Generally, all requests for access to data will be responded to within 1 month. All data shared will be de-identified. Raw metagenomic sequencing data have been deposited in the NCBI Sequence Read Archive under accession ID PRJNA414688 and are publicly available as of the date of publication. Any additional information required to reanalyse the data reported in this paper is available from the lead contact W.J. (wpjia@sjtu.edu.cn) upon request. Source data are provided with this paper.

Code availability

No custom code was used in this paper. All publicly available codes and tools used to analyse the data are reported and referenced in the Methods.

References

  1. Waxman, A. & World Health, A. WHO global strategy on diet, physical activity and health. Food Nutr. Bull. 25, 292-302 (2004).
  2. Torres-Fuentes, C., Schellekens, H., Dinan, T. G. & Cryan, J. F. The microbiota-gut-brain axis in obesity. Lancet Gastroenterol. Hepatol. 2, 747-756 (2017).
  3. Backhed, F. et al. The gut microbiota as an environmental factor that regulates fat storage. Proc. Natl Acad. Sci. USA 101, 15718-15723 (2004).
  4. Turnbaugh, P. J. et al. An obesity-associated gut microbiome with increased capacity for energy harvest. Nature 444, 1027-1031 (2006).
  5. Kootte, R. S. et al. Improvement of insulin sensitivity after lean donor feces in metabolic syndrome is driven by baseline intestinal microbiota composition. Cell Metab. 26, 611-619 e616 (2017).
  6. de Groot, P. et al. Donor metabolic characteristics drive effects of faecal microbiota transplantation on recipient insulin sensitivity, energy expenditure and intestinal transit time. Gut 69, 502-512 (2020).
  7. Carmody, R. N. & Bisanz, J. E. Roles of the gut microbiome in weight management. Nat. Rev. Microbiol. 21, 535-550 (2023).
  8. Gibson, G. R. et al. Expert consensus document: The International Scientific Association for Probiotics and Prebiotics (ISAPP) consensus statement on the definition and scope of prebiotics. Nat. Rev. Gastroenterol. Hepatol. 14, 491-502 (2017).
  9. Delannoy-Bruno, O. et al. Evaluating microbiome-directed fibre snacks in gnotobiotic mice and humans. Nature 595, 91-95 (2021).
  10. Bindels, L. B., Delzenne, N. M., Cani, P. D. & Walter, J. Towards a more comprehensive concept for prebiotics. Nat. Rev. Gastroenterol. Hepatol. 12, 303-310 (2015).
  11. Englyst, H. N. & Cummings, J. H. Digestion of the polysaccharides of some cereal foods in the human small intestine. Am. J. Clin. Nutr. 42, 778-787 (1985).
  12. Higgins, J. A. Resistant starch and energy balance: impact on weight loss and maintenance. Crit. Rev. Food Sci. Nutr. 54, 1158-1166 (2014).
  13. Wali, J. A. et al. Impact of dietary carbohydrate type and protein-carbohydrate interaction on metabolic health. Nat. Metab. 3, 810-828 (2021).
  14. Robertson, M. D. et al. Insulin-sensitizing effects on muscle and adipose tissue after dietary fiber intake in men and women with metabolic syndrome. J. Clin. Endocrinol. Metab. 97, 3326-3332 (2012).
  15. Johnston, K. L., Thomas, E. L., Bell, J. D., Frost, G. S. & Robertson, M. D. Resistant starch improves insulin sensitivity in metabolic syndrome. Diabet. Med. 27, 391-397 (2010).
  16. Maki, K. C. et al. Resistant starch from high-amylose maize increases insulin sensitivity in overweight and obese men. J. Nutr. 142, 717-723 (2012).
  17. Coate, K. C. & Huggins, K. W. Consumption of a high glycemic index diet increases abdominal adiposity but does not influence adipose tissue pro-oxidant and antioxidant gene expression in C57BL/6 mice. Nutr. Res. 30, 141-150 (2010).
  18. Charrier, J. A. et al. High fat diet partially attenuates fermentation responses in rats fed resistant starch from high-amylose maize. Obesity 21, 2350-2355 (2013).
  19. DeMartino, P. & Cockburn, D. W. Resistant starch: impact on the gut microbiome and health. Curr. Opin. Biotechnol. 61, 66-71 (2020).
  20. Chen, C., Lu, F. C. & Department of Disease Control Ministry of Health, PR China. The guidelines for prevention and control of overweight and obesity in Chinese adults. Biomed. Environ. Sci. 17, 1-36 (2004).
  21. Jensen, M. D. et al. 2013 AHA/ACC/TOS guideline for the management of overweight and obesity in adults: a report of the American College of Cardiology/American Heart Association Task Force on Practice Guidelines and The Obesity Society. Circulation 129, S102-S138 (2014).
  22. Cox, A. J., West, N. P. & Cripps, A. W. Obesity, inflammation, and the gut microbiota. Lancet Diabetes Endocrinol. 3, 207-215 (2015).
  23. Martinez-Guryn, K. et al. Small intestine microbiota regulate host digestive and absorptive adaptive responses to dietary lipids. Cell Host Microbe 23, 458-469 (2018).
  24. Geng, L., Lam, K. S. L. & Xu, A. The therapeutic potential of FGF21 in metabolic diseases: from bench to clinic. Nat. Rev. Endocrinol. 16, 654-667 (2020).
  25. Baxter, N. T. et al. Dynamics of human gut microbiota and short-chain fatty acids in response to dietary interventions with three fermentable fibers. mBio 10, e02566-18 (2019).
  26. Kadyan, S., Sharma, A., Arjmandi, B. H., Singh, P. & Nagpal, R. Prebiotic potential of dietary beans and pulses and their resistant starch for aging-associated gut and metabolic health. Nutrients 14, 1726 (2022).
  27. Vital, M. et al. Metagenomic insights into the degradation of resistant starch by human gut microbiota. Appl. Environ. Microbiol. 84, e01562-18 (2018).
  28. Krautkramer, K. A., Fan, J. & Backhed, F. Gut microbial metabolites as multi-kingdom intermediates. Nat. Rev. Microbiol. 19, 77-94 (2021).
  29. Heianza, Y. et al. Changes in gut microbiota-related metabolites and long-term successful weight loss in response to weight-loss diets: the POUNDS Lost trial. Diabetes Care 41, 413-419 (2018).
  30. Adams, S. H. Emerging perspectives on essential amino acid metabolism in obesity and the insulin-resistant state. Adv. Nutr. 2, 445-456 (2011).
  31. Foley, M. H., O’Flaherty, S., Barrangou, R. & Theriot, C. M. Bile salt hydrolases: gatekeepers of bile acid metabolism and host-microbiome crosstalk in the gastrointestinal tract. PLoS Pathog. 15, e1007581 (2019).
  32. Mattijssen, F. et al. Angptl4 serves as an endogenous inhibitor of intestinal lipid digestion. Mol. Metab. 3, 135-144 (2014).
  33. Higgins, J. A. et al. Resistant starch and exercise independently attenuate weight regain on a high fat diet in a rat model of obesity. Nutr. Metab. 8, 49 (2011).
  34. Wahlstrom, A., Sayin, S. I., Marschall, H. U. & Backhed, F. Intestinal crosstalk between bile acids and microbiota and its impact on host metabolism. Cell Metab. 24, 41-50 (2016).
  35. Upadhyaya, B. et al. Impact of dietary resistant starch type 4 on human gut microbiota and immunometabolic functions. Sci. Rep. 6, 28797 (2016).
  36. Ravussin, Y. et al. Responses of gut microbiota to diet composition and weight loss in lean and obese mice. Obesity 20, 738-747 (2012).
  37. Zhang, L. et al. Metabolic phenotypes and the gut microbiota in response to dietary resistant starch type 2 in normal-weight subjects: a randomized crossover trial. Sci. Rep. 9, 4736 (2019).
  38. Bendiks, Z. A., Knudsen, K. E. B., Keenan, M. J. & Marco, M. L. Conserved and variable responses of the gut microbiome to resistant starch type 2. Nutr. Res. 77, 12-28 (2020).
  39. Golden, J. M. et al. Ursodeoxycholic acid protects against intestinal barrier breakdown by promoting enterocyte migration via EGFR- and COX-2-dependent mechanisms. Am. J. Physiol. Gastrointest. Liver Physiol. 315, G259-G271 (2018).
  40. Quintero, P. et al. Bile acid supplementation improves established liver steatosis in obese mice independently of glucagon-like peptide-1 secretion. J. Physiol. Biochem. 70, 667-674 (2014).
  41. Nie, B. et al. Specific bile acids inhibit hepatic fatty acid uptake in mice. Hepatology 56, 1300-1310 (2012).
  42. Schneider, K. M., Albers, S. & Trautwein, C. Role of bile acids in the gut-liver axis. J. Hepatol. 68, 1083-1085 (2018).
  43. Ni, Y. et al. Resistant starch decreases intrahepatic triglycerides in patients with NAFLD via gut microbiome alterations. Cell Metab. 35, 1530-1547 (2023).
  44. Jaskiewicz, J. et al. Catabolism of isobutyrate by colonocytes. Arch. Biochem. Biophys. 327, 265-270 (1996).
  45. Oliphant, K. & Allen-Vercoe, E. Macronutrient metabolism by the human gut microbiome: major fermentation by-products and their impact on host health. Microbiome 7, 91 (2019).
  46. Dijk, W. & Kersten, S. Regulation of lipoprotein lipase by Angptl4. Trends Endocrinol. Metab. 25, 146-155 (2014).
  47. Long, X. et al. Bifidobacterium adolescentis alleviates liver steatosis and steatohepatitis by increasing fibroblast growth factor 21 sensitivity. Front. Endocrinol. 12, 773340 (2021).
  48. Geng, L. et al. Exercise alleviates obesity-induced metabolic dysfunction via enhancing FGF21 sensitivity in adipose tissues. Cell Rep. 26, 2738-2752 (2019).
  49. van Baak, M. A. & Mariman, E. C. M. Mechanisms of weight regain after weight loss – the role of adipose tissue. Nat. Rev. Endocrinol. 15, 274-287 (2019).
  50. Jia, W. et al. Association of serum retinol-binding protein 4 and visceral adiposity in Chinese subjects with and without type 2 diabetes. J. Clin. Endocrinol. Metab. 92, 3224-3229 (2007).
  51. Li, J. et al. Probiotics modulated gut microbiota suppresses hepatocellular carcinoma growth in mice. Proc. Natl Acad. Sci. USA 113, E1306-E1315 (2016).
  52. Li, H. & Durbin, R. Fast and accurate short read alignment with Burrows-Wheeler transform. Bioinformatics 25, 1754-1760 (2009).
  53. Segata, N. et al. Metagenomic microbial community profiling using unique clade-specific marker genes. Nat. Methods 9, 811-814 (2012).
  54. Dixon, P. VEGAN, a package of functions for community ecology. J. Vegetation Sci. 14, 927-930 (2003).
  55. Shannon, P. et al. Cytoscape: a software environment for integrated models of biomolecular interaction networks. Genome Res. 13, 2498-2504 (2003).
  56. Peng, Y., Leung, H. C., Yiu, S. M. & Chin, F. Y. IDBA-UD: a de novo assembler for single-cell and metagenomic sequencing data with highly uneven depth. Bioinformatics 28, 1420-1428 (2012).
  57. Ni, Y., Li, J. & Panagiotou, G. COMAN: a web server for comprehensive metatranscriptomics analysis. BMC Genomics 17, 622 (2016).
  58. Zhu, W., Lomsadze, A. & Borodovsky, M. Ab initio gene identification in metagenomic sequences. Nucleic Acids Res. 38, e132 (2010).
  59. Xie, C. et al. KOBAS 2.0: a web server for annotation and identification of enriched pathways and diseases. Nucleic Acids Res. 39, W316-W322 (2011).
  60. Rohart, F., Gautier, B., Singh, A. & Le Cao, K. A. mixOmics: an package for ‘omics feature selection and multiple data integration. PLoS Comput. Biol. 13, e1005752 (2017).
  61. Liu, R. et al. Gut microbiome and serum metabolome alterations in obesity and after weight-loss intervention. Nat. Med. 23, 859-868 (2017).
  62. Xie, G. et al. Dysregulated hepatic bile acids collaboratively promote liver carcinogenesis. Int J. Cancer 139, 1764-1775 (2016).
  63. Xie, G. et al. Profiling of serum bile acids in a healthy Chinese population using UPLC-MS/MS. J. Proteome Res. 14, 850-859 (2015).
  64. Lan, K. et al. Key role for the 12 -hydroxy group in the negative ion fragmentation of unconjugated c24 bile acids. Anal. Chem. 88, 7041-7048 (2016).
  65. Zhao, L. et al. High throughput and quantitative measurement of microbial metabolome by gas chromatography/mass spectrometry using automated alkyl chloroformate derivatization. Anal. Chem. 89, 5565-5577 (2017).
  66. Govers, M. J. & Van der Meet, R. Effects of dietary calcium and phosphate on the intestinal interactions between calcium, phosphate, fatty acids, and bile acids. Gut 34, 365-370 (1993).
  67. Cho, K. D., Han, C. K. & Lee, B. H. Loss of body weight and fat and improved lipid profiles in obese rats fed apple pomace or apple juice concentrate. J. Med. Food 16, 823-830 (2013).
  68. Wong, C. M. et al. Adropin is a brain membrane-bound protein regulating physical activity via the NB-3/Notch signaling pathway in mice. J. Biol. Chem. 289, 25976-25986 (2014).
  69. Zhang, Y. et al. Gut microbiome-related effects of berberine and probiotics on type 2 diabetes (the PREMOTE study). Nat. Commun. 11, 5015 (2020).
  70. Haarman, M. & Knol, J. Quantitative real-time PCR assays to identify and quantify fecal Bifidobacterium species in infants receiving a prebiotic infant formula. Appl. Environ. Microbiol. 71, 2318-2324 (2005).

Acknowledgements

We thank the medical staff and study participants who took part in the trial. The authors thank J. Wu and R. Zeng for valuable suggestions. This work was supported by the National Key Research and Development Program of China (2022YFA1004804), Shanghai Municipal Key Clinical Specialty, Shanghai Research Center for Endocrine and Metabolic Diseases (2022ZZO1002) and National Natural Science Foundation of China (NSFC) major international (regional) joint research project (81220108006) to W.J.; Excellent Young Scientists Fund of NSFC (82022012), General Fund of NSFC (82270907), Major Program of NSFC (92357305), Innovative Research Team of High-level Local Universities in Shanghai (SHSMU-ZDCX20212700), Hong Kong Scholars Program (XJ2013035) and Two Hundred Program from Shanghai Jiao Tong University School of Medicine to H.L.; Hong Kong Research Grant Council (AOE/M/707-18) to A.X.; Marie Sklodowska-Curie Actions and Innovative Training Networks (H2O2O-MSCA-ITN-2O18 813781) to G.P., DFG under Germany’s Excellence Strategy (EXC 2051) project ID 390713860 to G.P. and Y.N.; Shenzhen Basic Research Program (JCYJ20190808182402941) and Guangdong Basic and Applied Research Major Program (2019BO3O3O2005) to J.L.; Key foundation of NSFC (21934006), Strategic Priority Research Program (B) of
the Chinese Academy of Sciences (XDB38020200) to G.X.; the Youth Innovation Promotion Association of the Chinese Academy of Sciences (2021186) to X. Liu.; and The Hong Kong Polytechnic University (POO42740) to P.L.

Author contributions

W.J., A.X., G.P., H.L. and X. Liu conceived and designed the project. H.L., L.Z., J.L. and Q.W. managed the study. H.L., L.Z. and L.Q. made clinical diagnoses, recruited participants and performed interventions. L.S. supported the study as a clinical nutritionist. L.Z., L.Q. and L.W. collected samples and clinical phenotypes. G.P., J.L., Y.N., K.K. and J.H. performed bioinformatics analyses. X. Liu., G.X., P.K.-D., X.W., Y.L. and Y.Y. performed metabolomics profiling and data analysis. L.Z., Q.W., L.Q., X. Long., M.Z., Q.F., R.Y., S.L. and Y.Z. conducted animal experiments. B.S. and P.L. performed medical image analysis. H.L., L.Z., J.L. and Q.W. wrote the manuscript. W.J., A.X., G.P., P.K.-D., J.Y. and Y.B. reviewed and edited the manuscript. The contributions and authorship criteria have been carefully considered in this multi-region collaboration.

Competing interests

The authors declare no competing interests.

Additional information

Extended data is available for this paper at https://doi.org/10.1038/s42255-024-00988-y.
Supplementary information The online version contains supplementary material available at https://doi.org/10.1038/s42255-024-00988-y.
Correspondence and requests for materials should be addressed to Huating Li, Xinyu Liu, Gianni Panagiotou, Aimin Xu or Weiping Jia.
Peer review information Nature Metabolism thanks the anonymous reviewers for their contribution to the peer review of this work. Primary Handling Editor: Yanina-Yasmin Pesch, in collaboration with the Nature Metabolism team.
Reprints and permissions information is available at www.nature.com/reprints.
Publisher’s note Springer Nature remains neutral with regard to jurisdictional claims in published maps and institutional affiliations.
Open Access This article is licensed under a Creative Commons Attribution 4.0 International License, which permits use, sharing, adaptation, distribution and reproduction in any medium or format, as long as you give appropriate credit to the original author(s) and the source, provide a link to the Creative Commons licence, and indicate if changes were made. The images or other third party material in this article are included in the article’s Creative Commons licence, unless indicated otherwise in a credit line to the material. If material is not included in the article’s Creative Commons licence and your intended use is not permitted by statutory regulation or exceeds the permitted use, you will need to obtain permission directly from the copyright holder. To view a copy of this licence, visit http://creativecommons. org/licenses/by/4.0/.
Shanghai Key Laboratory of Diabetes Mellitus, Department of Endocrinology and Metabolism, Shanghai Diabetes Institute, Shanghai Clinical Center for Diabetes, Shanghai Sixth People’s Hospital Affiliated to Shanghai Jiao Tong University School of Medicine, Shanghai, China. State Key Laboratory of Pharmaceutical Biotechnology, The University of Hong Kong, Hong Kong S.A.R., China. Department of Medicine, The University of Hong Kong, Hong Kong S.A.R., China. Department of Medicine, Shanghai Jiao Tong University School of Medicine, Shanghai, China. Department of Infectious Diseases and Public Health, City University of Hong Kong, Hong Kong S.A.R., China. Department of Microbiome Dynamics, Leibniz Institute for Natural Product Research and Infection Biology – Hans Knöll Institute, Jena, Germany. Cluster of Excellence Balance of the Microverse, Friedrich Schiller University Jena, Jena, Germany. Institute for Molecular Infection Biology, University of Wurzburg, Wurzburg, Germany. College of Food Science and Technology, Shanghai Ocean University, Shanghai, China. Department of Clinical Nutrition, Shanghai Sixth People’s Hospital Affiliated to Shanghai Jiao Tong University School of Medicine, Shanghai, China. Department of Computer Science and Engineering, Shanghai Jiao Tong University, Shanghai, China. Department of Computing, The Hong Kong Polytechnic University, Hong Kong S.A.R., China. School of Design, The Hong Kong Polytechnic University, Hong Kong S.A.R., China. CAS Key Laboratory of Separation Science for Analytical Chemistry, Dalian Institute of Chemical Physics, Chinese Academy of Sciences, Dalian, China. Metabolic Disease Research Center, Zhengzhou University Affiliated Zhengzhou Central Hospital, Zhengzhou, China. School of Public Health, Shanghai Jiao Tong University School of Medicine, Shanghai, China. Faculty of Biological Sciences, Friedrich Schiller University, Jena, Germany. Department of Microbiology, Li Ka Shing Faculty of Medicine, The University of Hong Kong, Hong Kong S.A.R., China. These authors contributed equally: Huating Li, Lei Zhang, Jun Li, Qian Wu. e-mail: huarting99@sjtu.edu.cn; liuxy2012@dicp.ac.cn; Gianni.Panagiotou@hki-jena.de; amxu@hku.hk; wpjia@sjtu.edu.cn
Extended Data Fig. 1|CONSORT diagram. CONSORT flow diagram illustrating the procedures for enrolment, intervention allocation, follow-up and data analysis of the study. RS, resistant starch; CS, control starch.
Extended Data Fig. 2 | See next page for caption.
Extended Data Fig. 2 | Improvement of obesity and glucose metabolism after the 8-week RS intervention in individuals with excess body weight.
(a-e) Boxplots (with median) showing the dynamic changes of (a) body weight, (b) fat mass, and (c) waist circumference at every 2 weeks of intervention, as well as (d) visceral fat (VFA) and (e) subcutaneous fat area (SFA) at every 4 weeks of intervention. Lines connect the means of outcomes at different time pointes. The horizontal line represents the outcomes of the linear mixed model analysis followed by Bonferroni’s test conducted to compare the connected endpoints. RS-Washout-CS group, individuals. CS-Washout-RS group, individuals. . (f-h) Standardized meal tolerance tests (MTT) were performed at baseline ( 0 week) and after 8 -week RS or CS intervention. ( ) Blood glucose. (g) Change of area under curve (AUC) and analysis of blood glucose.
(h) Serum insulin. (i) Change of serum adiponectin level evaluated by ELISA in subjects before and after 8 -week RS or CS intervention. For individuals per group, and for individuals per group. Data are expressed as mean s.e.m (f, h). Data are shown as box-and-whisker plots (g, i). The horizontal line in the middle of each box indicates the median value, the top and bottom borders of the boxes represent the 75th and 25th percentiles, and the whiskers denote the lowest and highest values. and , and 0.038 (i), for the difference between RS and CS intervention by linear mixed model adjusted by intervention order and and 0.001 for the difference before and after RS intervention (RS OW vs. RS 8W) by linear mixed model adjusted by intervention order followed by Bonferroni’s test.

A


Abstract

RS-Washout-CS group using the Bray-Curtis distance method. (d) Beta-diversity for the CS-Washout-RS group using the weighted-Unifrac distance method. (e) Beta-diversity for the RS-Washout-CS group using the weighted-Unifrac distance method. All the beta-diversity plots used Non-metric multidimensional scaling (NMDS) based on the compositional profile of the species abundance. The ANOSIM results support the baseline comparability of microbial compositions ( ).

Extended Data Fig. 5 | Top 10 metabolism-related KEGG pathways between RS and CS intervention. Data are presented by the fold change after treatment, which are expressed as mean s.e.m ( 27 individuals before and after RS and
16 individuals before and after CS). Statistical differences between interventions were assessed using two-sided Wilcoxon rank-sum test, with adjusted for multiple comparisons using the Benjamini-Hochberg method.
A

Extended Data Fig. 6 | Host metabolomics in response to RS treatment.
(a) The strength of the linear correlation (model averaged Akaike information criterion [AlC] importance) between the species abundance variation (fold change after intervention) and the variation (fold change after intervention) of the circulating metabolites. The importance is the summed AIC weights of the linear models containing such variable during model selection. (b-g) Changes of faecal SCFAs after the 8-week RS or CS intervention ( individuals per
group). (b) Acetate. (c) Propionate. (d) Butyrate. (e) Isobutyrate. (f) Valerate. (g) Hexanoate. Data are expressed as median with interquartile range. , ** (e) for the difference between RS and CS intervention by linear mixed model adjusted by intervention order and for the difference before and after RS intervention (RS 0 W vs. RS 8W) by linear mixed model adjusted by intervention order followed by Bonferroni’s test.
Extended Data Fig. 7| See next page for caption.
Extended Data Fig. 7|Change of microbial species, energy metabolism, and glucose metabolism after FMT. (a) Whole-genome shotgun metagenomic sequencing was performed for caecum content samples from mice receiving faecal slurry collected from donors collected after RS or CS intervention. Species showing a similar trend of RS-induced alterations between donors and mice receiving faecal microbial transplantation (FMT) were shown. Data are presented as . RS/CS was defined as the ratio of relative microbial abundance after RS intervention (FMT from RS donors for mice) to that after CS intervention (FMT from CS donors for mice). (b-i) Mice were grouped and treated as in Fig. 4 ( biological replicates per group). (b) 24-hour energy
expenditure, (c) respiratory exchange ratio (RER), (d) oxygen consumption, (e) carbon dioxide production, (f) activity, and (g) food intake were measured using the comprehensive laboratory animal monitoring system at the end of the experiment. (h) Glucose tolerance test (GTT) was performed in mice colonized with microbiota from RS or CS donors. (i) Area under the curve (AUC) analysis of GTT. (j) Serum adiponectin levels were measured at the end of faecal microbiota transplantation ( biological replicates per group). Data were reproduced in three independent experiments. Data are presented as mean s.e.m. Significance was determined by two-tailed Student’s t-test. , and .
Extended Data Fig. 9 | Supplementation with Bacteroides adolescentis altered metabolites in mice. Metabolomics profile of (a-c) SPF mice were grouped and treated as in Extended Data Fig. 7 (WD+B.a, n = 5 biological replicates; WD+hk-B.a, biological replicates; WD, biological replicates). and (d-f) germ-free mice were grouped and treated as in Fig. 7 ( biological replicates per group). (a) Levels of GCA, DCA, TDCA, T MCA, TCDCA, TCA, and TLCA in serum.
(b) Levels of SCFAs in faeces. (c) Levels of valine, isoleucine, and leucine in serum.
(d) Levels of GCA, DCA, T MCA, TCDCA, and TCA in serum of germ-free mice.
(e) Levels of SCFAs in faeces of germ-free mice. (f) Levels of valine, isoleucine, and leucine in serum of germ-free mice. Data are presented as box-and-whisker plots.
The horizontal line in the middle of each box indicates the median value, the top and bottom borders of the boxes represent the 75th and 25th percentiles, and the whiskers denote the lowest and highest values. Analysed by one-way ANOVA followed by Tukey’s post hoc test (in a-c) and two-tailed Student’s unpaired t-test (in d-f). , and and , and , and and and 0.005 (d), *** . SPF, specific pathogen-free; GCA, glycocholic acid; DCA, deoxycholic acid; TDCA, taurodeoxycholate; T MCA, tauro muricholic acid; TCDCA, taurochenodeoxycholic acid; TCA, taurocholic acid; TLCA, taurolithocholic acid.

Extended Data Fig. 10 | RS intake facilitates weight loss in humans by reshaping the gut microbiota. Resistant starch (RS, ) accompanied with isoenergetic and balanced diets led to an obvious reduction in body weight and improvement of insulin sensitivity, as well as alteration in metagenomics and metabolomics. Faecal microbiota transplantation (FMT) showed benefits of RS were associated with the reshaped gut microbiota composition. Monocolonization of mice with B. adolescentis, which was closely correlated with the benefits of RS in human protected mice from diet-induced obesity.
Mechanistically, the RS-induced changes in the gut microbiota influenced metabolites of gut microbiome, reduced chronic low-grade inflammation by improving intestinal integrity, inhibited lipid absorption by modulating angiopoietin-like 4 (ANGPTL4), and improved the sensitivity of fibroblast growth factor 21 (FGF21) in adipose tissue. SPF, specific-pathogen-free; LPS, lipopolysaccharide; BCAAs, branched-chain amino acids; Erk1/2, extracellular signal-regulated kinase1/2; FGFR1, fibroblast growth factor receptor 1. Created with BioRender.com.

natureportfolio

Weiping Jia, Aimin Xu, Gianni Panagiotou,
Corresponding author(s): Huating Li and Xinyu Liu
Last updated by author(s): Jan 4, 2024

Reporting Summary

Nature Portfolio wishes to improve the reproducibility of the work that we publish. This form provides structure for consistency and transparency in reporting. For further information on Nature Portfolio policies, see our Editorial Policies and the Editorial Policy Checklist.

Statistics

For all statistical analyses, confirm that the following items are present in the figure legend, table legend, main text, or Methods section.
Confirmed
The exact sample size ( ) for each experimental group/condition, given as a discrete number and unit of measurement
A statement on whether measurements were taken from distinct samples or whether the same sample was measured repeatedly
The statistical test(s) used AND whether they are one- or two-sided
Only common tests should be described solely by name; describe more complex techniques in the Methods section.
A description of all covariates tested
A description of any assumptions or corrections, such as tests of normality and adjustment for multiple comparisons
X
A full description of the statistical parameters including central tendency (e.g. means) or other basic estimates (e.g. regression coefficient) AND variation (e.g. standard deviation) or associated estimates of uncertainty (e.g. confidence intervals)
For null hypothesis testing, the test statistic (e.g. ) with confidence intervals, effect sizes, degrees of freedom and value noted Give values as exact values whenever suitable.
For Bayesian analysis, information on the choice of priors and Markov chain Monte Carlo settings
X For hierarchical and complex designs, identification of the appropriate level for tests and full reporting of outcomes
X Estimates of effect sizes (e.g. Cohen’s , Pearson’s ), indicating how they were calculated
Our web collection on statistics for biologists contains articles on many of the points above.

Software and code

Policy information about availability of computer code
Data collection EpiData 3.1 was used for data entry and documentation.
Data analysis SPSS version 17, R 3.3.2 and Image J 1.54f software were used for data analysis.
For manuscripts utilizing custom algorithms or software that are central to the research but not yet described in published literature, software must be made available to editors and reviewers. We strongly encourage code deposition in a community repository (e.g. GitHub). See the Nature Portfolio guidelines for submitting code & software for further information.

Data

Policy information about availability of data
All manuscripts must include a data availability statement. This statement should provide the following information, where applicable:
  • Accession codes, unique identifiers, or web links for publicly available datasets
  • A description of any restrictions on data availability
  • For clinical datasets or third party data, please ensure that the statement adheres to our policy
Individual-level patient data can be accessible with the consent of Data Management Committee from institutions and are not publicly available. The Data Management Committee will then review all the requests and grant (if successful). A formal data transfer agreement will be required upon approval. Generally, all these requests for access to the data will be responded to within 1 month. All data shared will be de-identified. Raw metagenomic sequencing data have been
deposited in NCBI Sequence Read Archive under accession ID PRJNA414688 and are publicly available as of the date of publication. Any additional information required to reanalyze the data reported in this paper is available from the lead contact Weiping Jia (wpjia@sjtu.edu.cn) upon request.

Research involving human participants, their data, or biological material

Policy information about studies with human participants or human data. See also policy information about sex, gender (identity/presentation), and sexual orientation and race, ethnicity and racism.
Reporting on sex and gender There were 37 subjects with overweight or obese who completed the trial, including 22 male and 15 female subjects.
Reporting on race, ethnicity, or other socially relevant groupings No socially constructed or socially relevant categorization was made in the selection of study participants.
Population characteristics The average age of the subjects was years (mean SD). Subjects with the following conditions were excluded from this study: acute illness or using the antibiotics 3 weeks prior to the study, known hyperthyroidism or hypothyroidism, known diabetes, current treatment with systemic corticosteroids or medications that may affect glucose metabolism, participating or have participated in other clinical trials 4 weeks before the study.
Recruitment Participants will be recruited by public advertisements from Shanghai, China, from July 2013 to 2016. Once eligibility is confirmed, a physician will fully inform the participant about the experiment. As participants self-referred to the study, this may have caused a selection bias towards healthier persons. Consequently, the study results may not be generalized to the entire population living with excess body weight.
Ethics oversight The study was approved by the Ethics Committee of Shanghai Jiao Tong University Affiliated Sixth People’s Hospital, following the principle of the Declaration of Helsinki.
Note that full information on the approval of the study protocol must also be provided in the manuscript.

Field-specific reporting

Please select the one below that is the best fit for your research. If you are not sure, read the appropriate sections before making your selection.
Life sciences Behavioural & social sciences Ecological, evolutionary & environmental sciences
For a reference copy of the document with all sections, see nature.com/documents/nr-reporting-summary-flat.pdf

Life sciences study design

All studies must disclose on these points even when the disclosure is negative.
Sample size
Human study: We estimated the change value of body weight and its standard deviation as after RS intervention. With a two-tailed test significance level of 0.05 and a statistical power of , the calculated minimum sample size was 31 . To allow for a dropout after randomization, a total of 37 participants were invited for participation.
Animal study: The sample sizes of animal experiments were estimated according to previous studies (PMID: 37872351, PMID: 36646754, PMID: 37365376) and the known variability of the assays.
Data exclusions No data were excluded from the analysis.
Replication
Human study: N/A due to the nature of an dietary intervention.
All the animal experiments were repeated three times independently. All results are reproducible.
Randomization An independent researcher performed the randomization and assigned participants to a CS-washout-RS or RS-washout-CS intervention scheme with an allocation ration of . The randomization schedule will be generated using SAS PROC PLAN in SAS software. For all experiments, participants and research animals were randomly allocated into different groups.
Blinding RS and CS were packaged in sealed bags that were identical in appearance, and participants and investigators were unaware of the contents of the study starch and the randomization scheme during the double-blind period. Only the research designer knew the randomization scheme. Participants, investigators, clinical staff and outcome assessors were blinded to the allocation sequence during data collection and analysis. The blinding was lifted when the bioinformatics analysis were conducted to explore the potential mechanism by which the gut microbiota confers the physiological benefits of RS. The investigators were not blinded to animal experiments as the treatment of each mouse would need to be known to the person handling the mice. When feasible, data analysis was performed blind.

Reporting for specific materials, systems and methods

We require information from authors about some types of materials, experimental systems and methods used in many studies. Here, indicate whether each material, system or method listed is relevant to your study. If you are not sure if a list item applies to your research, read the appropriate section before selecting a response.
Materials & experimental systems Methods
n/a Involved in the study n/a Involved in the study
X Antibodies
ChIP-seq
Flow cytometry
Palaeontology and archaeology
MRI-based neuroimaging
Clinical data
Dual use research of concern

Antibodies

Antibodies used ZO1 antibody (Abcam, ab96587, 1:500 dilution, Rabbit polyclonal to ZO1 tight junction protein) ; Occludin antibody (Abcam, ab216327, 1:100 dilution, Rabbit monoclonal [EPR20992] to Occludin); ANGPTL4 antibody (Proteintech, 18374-1-AP, 1: 500 dilution, Rabbit polyclonal to ANGPTL4); Erk1/2 antibody ( Cell Signaling Technology, 9102, 1:1000 dilution, Rabbit polyclonal to Erk1/2), pErk1/2 (Thr202/Tyr204) (Cell Signaling Technology, 9101, 1:1000 dilution, Rabbit polyclonal to p- Erk1/2); Rabbit IgG (H+L) secondary antibody (Thermo, 31460, 1: 2500 dilution).
Validation The ZO1 antibody and Occludin antibody were validated in our laboratory (Circulation 133, 2434-2446, 2016). The Erk1/2 and pErk1/2 antibody were validated in our laboratory (Front Endocrinol (Lausanne) 30:12:773340, 2021). The ANGPTL4 antibody was validated on the website http://www.ptglab.com/Products/ANGPTL4-Antibody-18374-1-AP.htm#validation.

Animals and other research organisms

Policy information about studies involving animals; ARRIVE guidelines recommended for reporting animal research, and Sex and Gender in Research
Laboratory animals For FMT experiment, ten-week-old male C57BL/6 mice were raised in conventional environment. For administrating of B. adolescentis, eight-week-old male C57BL/6 mice were raised in conventional environment. Five-week-old male germ-free male C57BL/6J mice were bred and maintained in special plastic isolators. All animals were kept under 12h light-dark cycles at a controlled temperature ( degrees centigrade) and 60-70% humidity, with free access to food and water.
Wild animals The study did not involve wild animals.
Reporting on sex As female C57BL/6J mice are reported to be more resistant to the obesogenic effects of HFD (Int J Obes (Lond) 46(10):1749-1758, 2022), male C57BL/6J mice were used in this study.
Field-collected samples The study did not involve samples collected from field.
Ethics oversight Animal experimental procedures were approved by the Committee on the Use of Live Animals for Teaching and Research of the University of Hong Kong and Animal Ethics Committee of the Shanghai Sixth People’s Hospital Affiliated to Shanghai Jiao Tong University School of Medicine.
Note that full information on the approval of the study protocol must also be provided in the manuscript.

Clinical data

Policy information about clinical studies
All manuscripts should comply with the ICMJE guidelines for publication of clinical research and a completed CONSORT checklist must be included with all submissions.
Clinical trial registration This trial was registered at Chinese Clinical Trial Registry as ChiCTR-TTRCC 13003333.
Study protocol The detailed study protocol was deposited in Chinese clinical trial management public platform (Resman) and can be found in Supplementary Information.
Data collection The CRF was used to collect information during the study. Original files were stored in Shanghai Jiao Tong University Affiliated Sixth People’s Hospital. All data were double-entered by researcher staff. After establishing and regarding as correct in blind review, the database was locked, and no alteration can be made. Participants were recruited from July 2013 to October 2016. Data was collected in Shanghai Clinical Center for Diabetes from July 2013 to October 2016.
Outcomes The primary outcome was change of body weight measured with the body composition analyzer (Tanita, TBF-410) after RS intervention vs. CS intervention, and the secondary outcomes were subcutaneous fat area and visceral fat area assessed using the 3.0 T clinical MRI scanner (Archiva, Philips Medical System), body fat analysis by body composition analyzer, waist circumference by anthropometric measurement, lipid profiles by biochemical assessments, and insulin sensitivity by hyperinsulinemic-euglycemic clamp.
Seed stocks Report on the source of all seed stocks or other plant material used. If applicable, state the seed stock centre and catalogue number. If plant specimens were collected from the field, describe the collection location, date and sampling procedures.
Novel plant genotypes Describe the methods by which all novel plant genotypes were produced. This includes those generated by transgenic approaches, gene editing, chemical/radiation-based mutagenesis and hybridization. For transgenic lines, describe the transformation method, the number of independent lines analyzed and the generation upon which experiments were performed. For gene-edited lines, describe the editor used, the endogenous sequence targeted for editing, the targeting guide RNA sequence (if applicable) and how the editor
Authentication
was applied.
Describe any authentication procedures for each seed stock used or novel genotype generated. Describe any experiments used to assess the effect of a mutation and, where applicable, how potential secondary effects (e.g. second site T-DNA insertions, mosiacism, off-target gene editing) were examined.

  1. A full list of affiliations appears at the end of the paper. -mail: huarting99@sjtu.edu.cn; liuxy2012@dicp.ac.cn; Gianni.Panagiotou@hki-jena.de; amxu@hku.hk; wpjia@sjtu.edu.cn
  2. ANGPTL4 levels. m, Change of serum FGF21 levels. individuals ( ), individuals (e,f,i), individuals ( ) and individuals ( ) for either RS or CS. Analysis of covariance (ANCOVA) adjusted by baseline value was used for comparison between RS and CS at each visit (b-d). Data are shown as mean ( confidence interval (CI)).*** . Data are shown as median with IQR (k). Nonparametric Wilcoxon rank-sum test was used to evaluate the significance between the two interventions. *** . Data are shown as box-and-whisker plots ( ). Box plot, median and quartiles; whiskers, data range. and and for the between-group difference assessed by the linear mixed model adjusted for intervention order. and for the withingroup change by mixed linear model adjusted for intervention followed by Bonferroni’s test.
  3. (c) The Author(s) 2024