تنويع دورة المحاصيل يزيد من إنتاج الغذاء، يقلل من انبعاثات غازات الدفيئة الصافية ويحسن صحة التربة Diversifying crop rotation increases food production, reduces net greenhouse gas emissions and improves soil health

المجلة: Nature Communications، المجلد: 15، العدد: 1
DOI: https://doi.org/10.1038/s41467-023-44464-9
PMID: https://pubmed.ncbi.nlm.nih.gov/38172570
تاريخ النشر: 2024-01-03

تنويع دورة المحاصيل يزيد من إنتاج الغذاء، يقلل من انبعاثات غازات الدفيئة الصافية ويحسن صحة التربة

تاريخ الاستلام: 4 سبتمبر 2023
تم القبول: 14 ديسمبر 2023
نُشر على الإنترنت: 03 يناير 2024
(أ) التحقق من التحديثات

شياولين يانغ جينران شياو تايشينغ دو شياوتانغ جو (ب) يانتاي غان © سيان لونغ لونغ شيا (i) يانجون شين (i) ستيفن باكنكا © تامو س. ستينهاوس كادامبوت هـ. م. سيديك (1) شاو تشونغ كانغ © وكلاوس باتر باخ-باهل

الملخص

تواجه الإنتاجية الغذائية العالمية تحديات في تحقيق التوازن بين الحاجة إلى زيادة الغلات والاستدامة البيئية. تقدم هذه الدراسة تجربة ميدانية لمدة ست سنوات في سهل شمال الصين، توضح فوائد تنويع الزراعة الأحادية التقليدية للحبوب (القمح والذرة) مع المحاصيل النقدية (البطاطا الحلوة) والبقوليات (الفول السوداني وفول الصويا). تزيد الدورات المتنوعة من الغلة المعادلة بنسبة تصل إلى تقليل انبعاثات بواسطة ، وتحسين توازن غازات الدفيئة في النظام من خلال . علاوة على ذلك، فإن تضمين البقوليات في دورات المحاصيل يحفز الأنشطة الميكروبية في التربة، ويزيد من مخزونات الكربون العضوي في التربة بنسبة 8%، ويعزز صحة التربة (المؤشر عليها بالخصائص الفيزيائية والكيميائية والبيولوجية المختارة) بواسطة يمكن أن يؤدي الاعتماد الواسع النطاق على أنظمة الزراعة المتنوعة في سهل شمال الصين إلى زيادة إنتاج الحبوب بـ عندما يتبع القمح والذرة المحاصيل البديلة في الدورة الزراعية ودخل المزارع بواسطة بينما تعود بالفائدة على البيئة. تقدم هذه الدراسة مثالاً على ممارسات إنتاج الغذاء المستدام، مع التأكيد على أهمية تنويع المحاصيل من أجل مرونة الزراعة على المدى الطويل وصحة التربة.

إنتاج غذاء أكثر تغذية لتخفيف الجوع في العالم مع حماية البيئة تعد تحديًا كبيرًا للبشرية. يتجلى هذا التحدي بشكل أكبر في البلدان والمناطق ذات الكثافة السكانية العالية حيث تكون الموارد الزراعية محدودة. لقد أدى اعتماد أنظمة إنتاج الغذاء التقليدية المكثفة على المدخلات الرئيسية من المواد الكيميائية الزراعية الاصطناعية، مثل الأسمدة والمبيدات، إلى زيادة كبيرة في إنتاج الغذاء منذ ‘الثورة الخضراء’، ولكن هذه
لقد أصدرت الأنظمة أيضًا كميات كبيرة من غازات الدفيئة (GHG) وتسببت في تدهور البيئة على سبيل المثال، زادت إنتاجية المحاصيل في الصين بنسبة 74% في الثلاثين عامًا الماضية (1986-2016)، لكن هذا جاء مع زيادة في استخدام الأسمدة الصناعية في عام 2019، بلغت انبعاثات غازات الدفيئة المرتبطة بإنتاج الغذاء في الصين 2.4 -معادل ( -eq) ، مع حوالي المنبعثة خلال مرحلة إنتاج المحاصيل فقدان خصوبة التربة الذي قد يحدث جنبًا إلى جنب
مع intensification إنتاج المحاصيل مما يزيد من تعقيد إنتاج الغذاء ويعرضه لمخاطر المناخ ومخاوف الصحة البيئية .
مفاهيم مبتكرة مثل أنظمة الزراعة المتكاملة مع دورات زراعية متنوعة ظهرت لتلبية هذه التحديات في إنتاج الغذاء واستدامة البيئة. تقدم هذه الأنظمة مجموعة من المحاصيل الغذائية لتلبية طلب المستهلكين على الغذاء النباتي الصحي. -اتجاه غذائي متزايد في البلدان ذات الدخل المرتفع والمتوسط العلوي -بينما توفر منتجات زراعية أخرى مثل أعلاف الحيوانات، والألياف الصناعية، أو الوقود الحيوي متعدد الأغراض علاوة على ذلك، تساعد أنظمة إنتاج الغذاء المتكاملة في زيادة دخل المزارعين وتقديم فوائد اجتماعية واقتصادية. ومع ذلك، لا يُعرف الكثير عن كيفية تحقيق أنظمة الزراعة المتنوعة من المحاصيل النقدية والبقوليات للأهداف الثلاثة – زيادة إنتاج الغذاء، وتقليل الأثر البيئي، وتحسين صحة التربة.
في هذا السياق، أجرينا دراسة ميدانية لمدة 6 سنوات (2016-2022) في سهل شمال الصين – سلة غذاء الصين – واحدة من أكثر المناطق زراعة في العالم، حيث يهيمن إنتاج المحاصيل على زراعة القمح الشتوي البسيط (Triticum aestivum L.) وزراعة الذرة الصيفية (Zea mays L.) في نظام زراعة مزدوج (قمح-ذرة، WM؛ محصولان في السنة) الذي يحتل من الأراضي القابلة للزراعة في المنطقة، مما يوفر حوالي من إجمالي الحبوب الغذائية في الصين . كان الهدف المحدد من دراسة الحالة هو تقييم شامل لعدة أنظمة زراعية متنوعة من حيث إنتاج الغذاء، وتوازن غازات الدفيئة، وفوائد صحة التربة، ودخل المزارعين. قمنا باختبار أنظمة زراعية متنوعة مختلفة، تتضمن المحاصيل النقدية، والبقوليات، والحبوب الأخرى، أو الأعلاف ضمن نظام القمح-الذرة التقليدي. كانت مؤشرات الأداء الرئيسية التي تم التحقيق فيها هي: (i) الكتلة الحيوية للنبات، وعوائد الحبوب والبروتين، وصافي دخل المزارعين؛ (ii) تدفقات غازات الدفيئة من التربة، وتخزين الكربون (C) في التربة، والانبعاثات الصافية لغازات الدفيئة؛ و (iii) معايير صحة التربة بما في ذلك درجة حموضة التربة، والكثافة الظاهرية، ومحتوى الماء في التربة، والنيتروجين الكلي (TN)، والكربون العضوي المذاب (DOC)، ونيتروجين النترات في التربة. ) ، الأمونيوم – ،
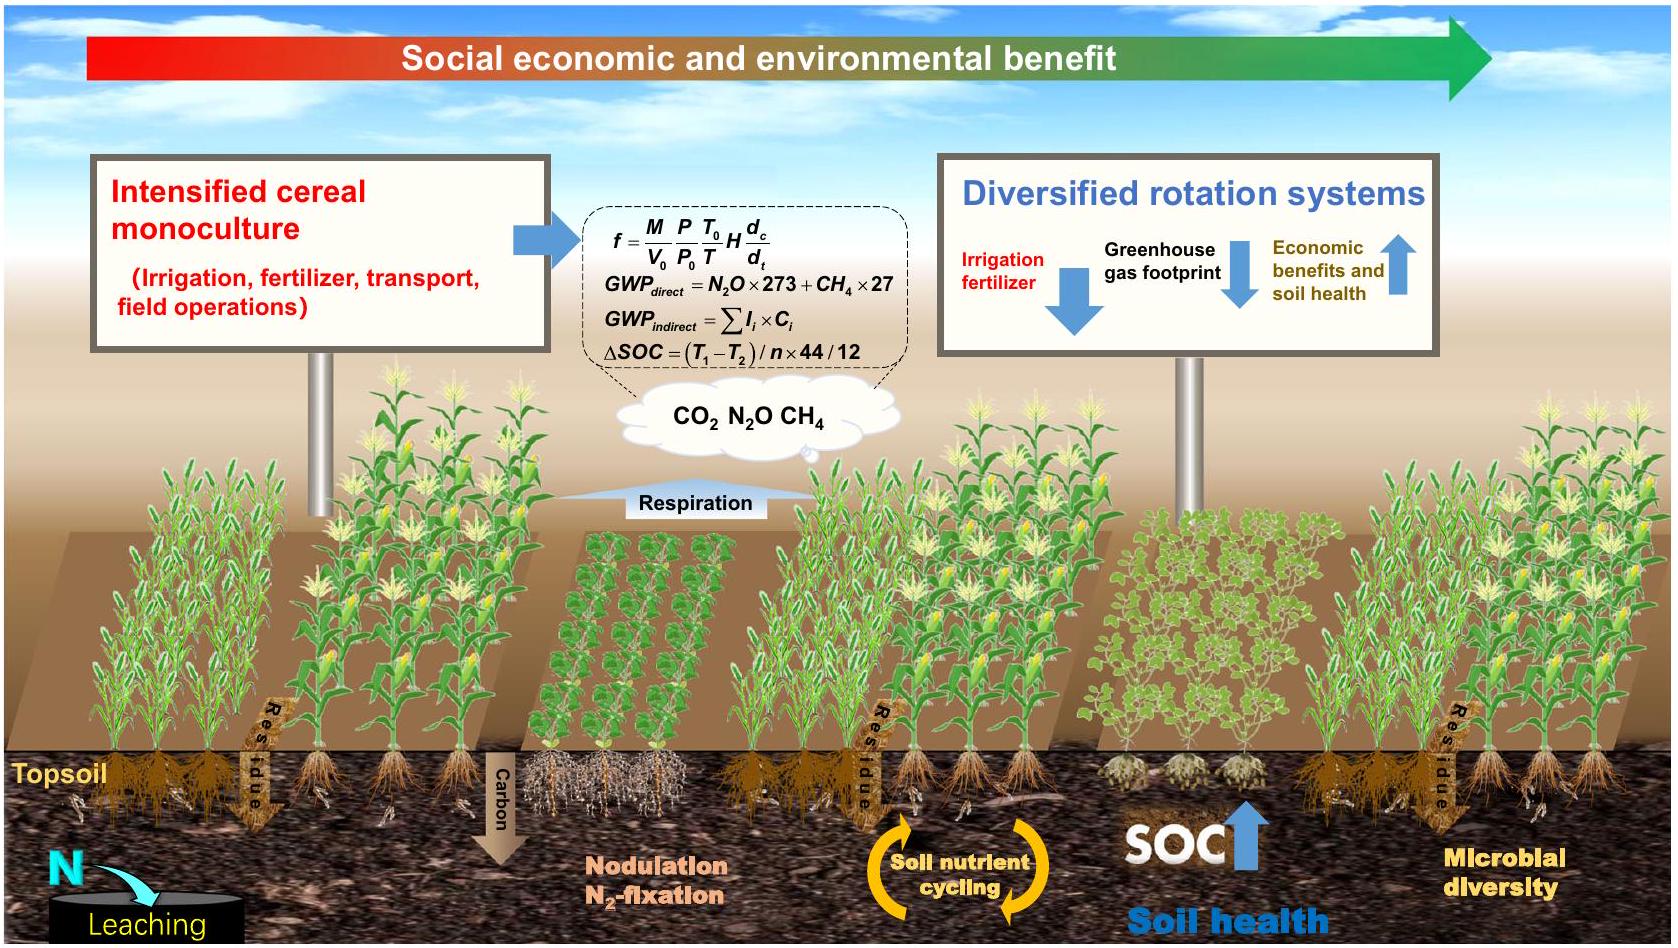
الفوسفور المتاح (AP)، الكربون في الكتلة الحيوية الميكروبية (MBC)، النيتروجين في الكتلة الحيوية الميكروبية (MBN)، وتركيب وتنوع المجتمع الميكروبي. هذه القياسات مكنتنا من اختبار الفرضيات التالية: (أ) أن نظام المحاصيل النقدية المتنوع يزيد من صافي دخل المزارعين دون jeopardizing غلات المحاصيل، (ب) أن الأنظمة المتنوعة من البقوليات تقلل من انبعاثات غازات الدفيئة على مستوى الحقل، و (ج) أن دمج الدورات المتنوعة يزيد من إنتاج الغذاء، ويقلل من انبعاثات غازات الدفيئة، ويعود بالنفع على صحة التربة (الشكل 1). تظهر نتائجنا أن (أ) النتائج الإرشادية من الأنظمة المتنوعة التي تم تصميمها واختبارها والتحقق من صحتها حديثًا يمكن أن توجه سهل شمال الصين في إنشاء نظام أكثر استدامة للحفاظ على أو زيادة إنتاج الحبوب والبروتين مع تقليل الأضرار على البيئة ونظم التربة البيئية، و (ب) أن النتائج من مثل هذه المنطقة المنتجة للغذاء بشكل مكثف قد توفر دليلاً للدول/المناطق ذات البيئات الزراعية المماثلة لتتبعها على نطاق أوسع.

النتائج

تزيد دورات المحاصيل المتنوعة من إنتاجية النظام البيئي

المحاصيل الغذائية التي تم تقييمها في الدراسة تنتمي إلى عائلات جنسية مختلفة؛ وبالتالي، تم تحويل إنتاج كل محصول إلى إنتاج ‘معادل’ للقمح من أجل مقارنة متوافقة (مفصل في الطرق). البطاطا الحلوة (Ipomoea batatas L.) دورة القمح الشتوي والذرة الصيفية (SpWM) زادت من العائد السنوي المكافئ بنسبة 38% مقارنة بزراعة القمح الشتوي والذرة الصيفية التقليدية التي حققت سنويًا (الشكل 2أ). أدت دورات المحاصيل المتنوعة مع البطاطا الحلوة (SpWM) والفول السوداني (Arachis hypogea L.) (PWM) أو فول الصويا (Glycine max L.) (SWM) إلى زيادة كبيرة في الفائدة الاقتصادية السنوية (الدخل الصافي) مقارنةً بشاهد القمح الشتوي – الذرة الصيفية (الشكل 2ب)، مع البطاطا الحلوة زيادة دوران القمح الشتوي والذرة الصيفية وزبدة الفول السوداني دورة القمح الشتوي والذرة الصيفية وفول الصويا زيادة دوران القمح الشتوي والذرة الصيفية بنسبة 13-22% بروتين
الشكل 1 | توضيح تخطيطي لدمج النظام من القضايا إلى النتائج. في سهل شمال الصين – منطقة دراسة الحالة، يتطلب الزراعة الأحادية التقليدية للحبوب (مثل زراعة القمح والذرة مرتين في السنة، أي زراعة محصولين من الحبوب في السنة) مدخلات من المواد الكيميائية الزراعية الاصطناعية والري في إنتاج الغذاء، مما يتسبب في انبعاثات كبيرة من غازات الدفيئة؛ في المقابل، أنظمة الدوران المتنوعة مع المحاصيل النقدية و
يمكن لمحاصيل البقوليات الحفاظ على غلات المحاصيل، وزيادة دخل المزارعين، وتقليل انبعاثات غازات الدفيئة بسبب العملية البيولوجية التركيز على البقوليات كبديل جزئي للمدخلات النيتروجينية الاصطناعية. يمكن أن تعزز دورات المحاصيل التي تشمل البقوليات صحة التربة من خلال تحفيز الأنشطة الميكروبية في التربة، وزيادة احتجاز الكربون، وتعزيز دورات المغذيات.
الشكل 2 | إنتاجية النظام الزراعي. إنتاجية نظام الدورة بالكامل: العائد المكافئ للقمح، الفائدة الاقتصادية – الدخل الصافي، و عائد البروتين. إنتاجية WM التي تسبقها محاصيل بديلة في الدورة الزراعية: محصول الحبوب السنوي، الفائدة الاقتصادية، و عائد البروتين. في تظهر الشريط الأسود داخل مخططات الكمان النسب المئوية 25 و 75، بينما تمثل الشعيرات التي تتجاوز الشريط النسب المئوية 95 و 5، والنقطة البيضاء الداخلية تشير إلى الوسيط. تكشف المنطقة على شكل كمان عن توزيع البيانات. الخطوط المتقطعة في هي القيم الأساسية لدوران WM، وأشرطة الخطأ هي الانحراف المعياري للقيمة السنوية المجمعة على القمح الشتوي والذرة الصيفية. في الأشكال من (أ) إلى (ب)، تم إجراء تحليل التباين الأحادي مع اختبار ما بعد hoc لتحديد الفروق المهمة. مختلف
تدل الحروف الصغيرة على الفروق المهمة بين الدورانات في . بالضبط القيم: في في في و في . في و اليوان الصيني (اعتبارًا من مايو 2023). . اختصارات العلاج: WM القمح الشتوي – الذرة الصيفية (حالة التحكم)، SpWM البطاطا الحلوة دورة القمح الشتوي – الذرة الصيفية، فول سوداني PWM دورة القمح الشتوي – الذرة الصيفية، فول الصويا SWM دورة القمح الشتوي – الذرة الصيفية، الذرة الربيعية SmWM دورة القمح الشتوي – الذرة الصيفية، رايجرس – سورغم دورة القمح الشتوي والذرة الصيفية. يتم توفير بيانات المصدر كملف بيانات المصدر.
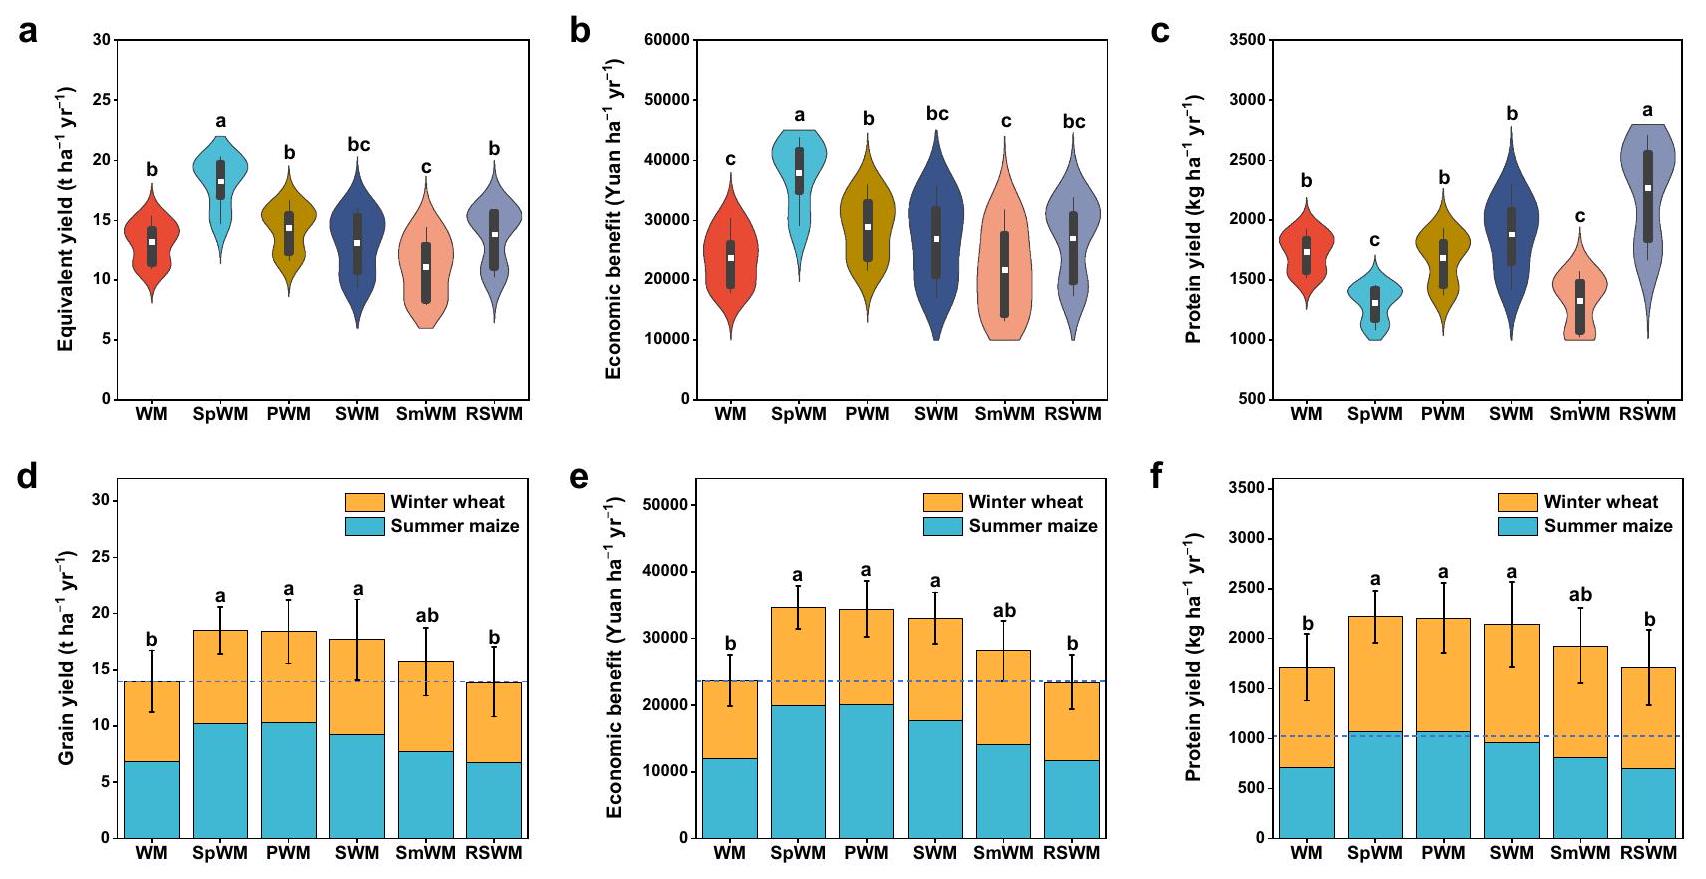
تفاوت العائد بين أنظمة الدوران، مع دوران الجاودار (Lolium multiflorum L.)-الدخن (Sorghum bicolor L.) (RSWM) وفول الصويا دورة القمح الشتوي والذرة الصيفية التي تحقق أعلى إنتاجية من البروتين بمعدل 2274 على التوالي، كونها أعلى من دورة القمح الشتوي – الذرة الصيفية (الشكل 2ج). عشب الجاودار – الذرة الحلوة دورة القمح الشتوي والذرة الصيفية، مع أربعة محاصيل في سنتين، أنتجت أكبر كمية من الكتلة الحيوية فوق الأرض للماشية، بينما فول الصويا نظام دوران القمح الشتوي والذرة الصيفية أنتج أكبر كمية من البروتين للتغذية البشرية. بالمقابل، كان النظام المعتمد بالكامل على الحبوب (أي، الذرة الربيعية دورة القمح الشتوي – الذرة الصيفية (SmWM) قللت من العائد المكافئ بـ وعائد البروتين بواسطة مقارنةً بشهادة القمح الشتوي والذرة الصيفية.
أثرت المحاصيل السابقة في الدورة بشكل كبير على إنتاجية الحبوب (الشكل 2د)، والدخل الصافي (الشكل 2هـ)، وإنتاج البروتين (الشكل 2و) لمحاصيل القمح الشتوي والذرة الصيفية اللاحقة مع استمرار الدورة. كانت دورات المحاصيل المتنوعة مع البطاطا الحلوة والفول السوداني وفول الصويا لها تأثير إيجابي على إنتاجية القمح الشتوي والذرة الصيفية اللاحقة. في المتوسط، أظهرت دورات القمح الشتوي والذرة الصيفية التي سبقتها محاصيل غير حبوب زيادة في إنتاجية الحبوب، والفائدة الاقتصادية، وإنتاج البروتين بنسبة ، و على التوالي، مقارنةً بزراعة القمح الشتوي والذرة الصيفية كنمط زراعي أحادي.

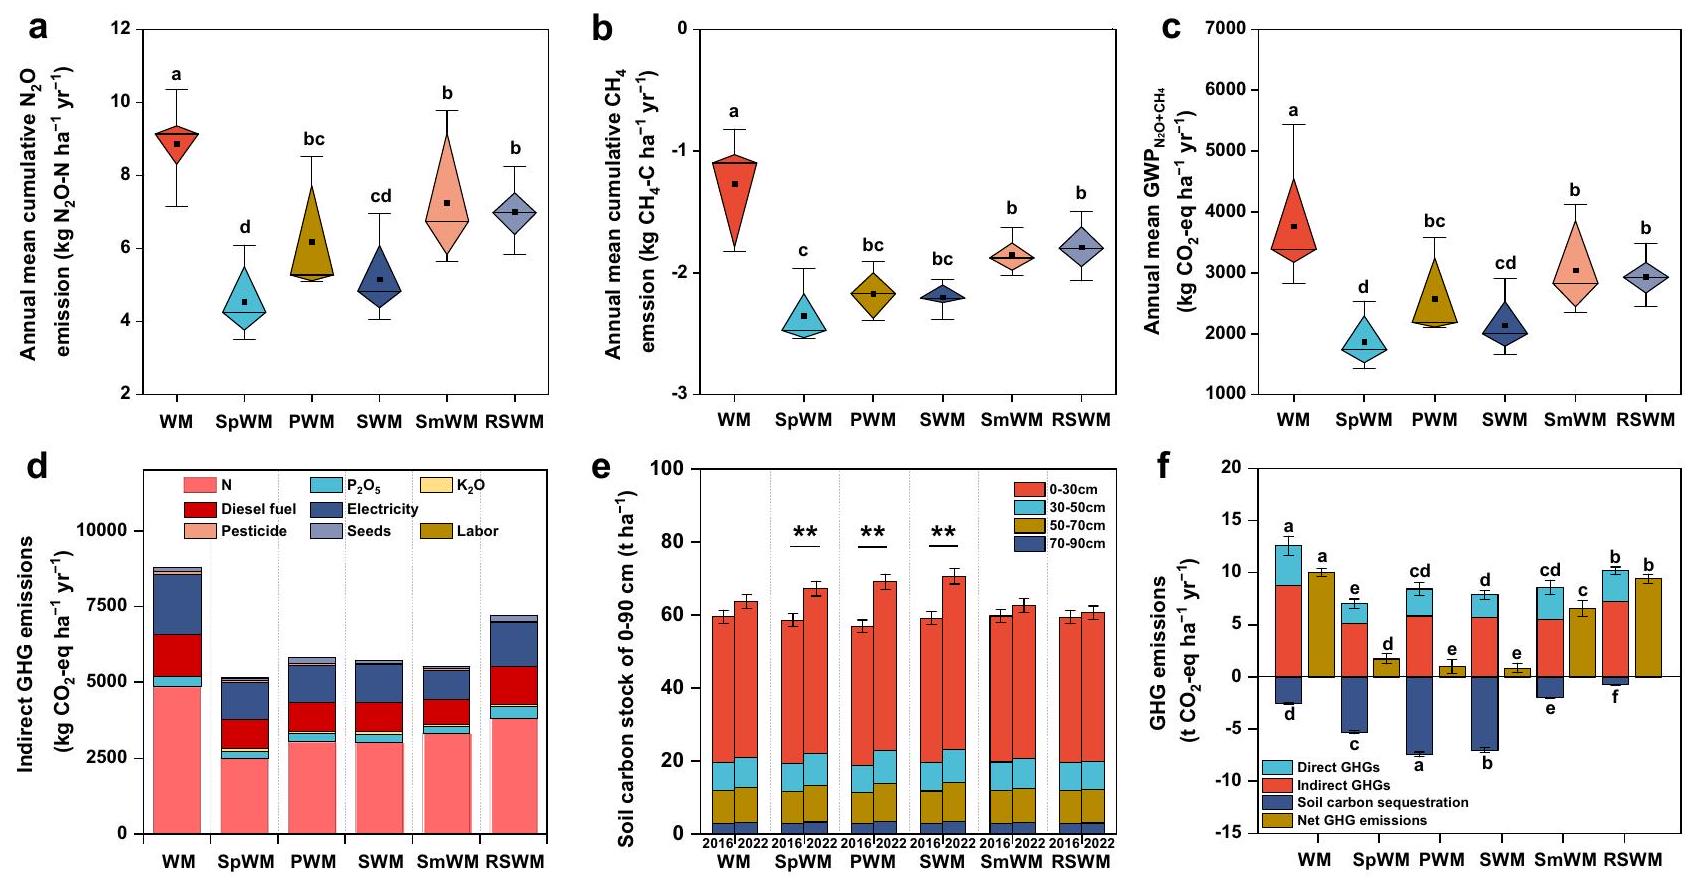
تقلل دورات المحاصيل المتنوعة من انبعاثات غازات الدفيئة الصافية

تفاوتت كميات الري التكميلي والأسمدة المطبقة على كل دورة بينها، كما فعلت و تم قياس الانبعاثات أسبوعيًا من أكتوبر 2016 إلى أكتوبر 2022 (الأشكال التكميلية S1-2). وقد أدت دورات المحاصيل المتنوعة إلى تقليل التراكم السنوي بشكل كبير. الانبعاثات مقارنة بالقمح والذرة
التحكم الذي كان في (الجدول S1، الشكل 3أ)، ينخفض بمقدار ، و في الفول السوداني دورة القمح والذرة، فول الصويا دورة القمح والذرة، والبطاطا الحلوة دورة القمح والذرة، على التوالي. تلقت هذه الدورات مع الفول السوداني وفول الصويا والبطاطا الحلوة جرعة مخفضة من سماد النيتروجين مقارنةً بالتحكم في القمح والذرة (الجدول S1). كانت تربة جميع دورات المحاصيل، بما في ذلك القمح والذرة، تعمل كمصارف صافية للغلاف الجوي. . ومع ذلك، زادت دورات المحاصيل المتنوعة من قوة الامتصاص بـ فوق القمح-الذرة (الشكل 3ب). كان التحكم في القمح-الذرة لديه أعلى إمكانات الاحترار العالمي السنوي (GWP) للتربة و تدفقات ( ، الشكل 3ج). الدورات التي تشمل الحبوب (عشب الجاودار – الذرة الحلوة دورة القمح والذرة وذرة الربيع دورة القمح والذرة و ، على التوالي، انبعاثات غازات الدفيئة أقل من دوران القمح والذرة، بينما كانت الدورات التي تشمل البقوليات (الفول السوداني، فول الصويا) أو البطاطا الحلوة تحتوي على ، و “، على التوالي، كانت لها انبعاثات غازات دفيئة أقل من دوران القمح والذرة. بالإضافة إلى انبعاثات غازات الدفيئة المباشرة على مستوى الحقل، كانت الانبعاثات غير المباشرة المرتبطة باستخدام المواد الكيميائية الزراعية والري هي الأعلى لدورة القمح والذرة ( ) و أقل للدورات مع البطاطا الحلوة والفول السوداني وفول الصويا والذرة الربيعية (الشكل 3د).
مخزونات الكربون في التربة (SOC) في زادت الطبقة بشكل كبير من 2016 إلى 2022 لجميع العلاجات، لكن حجم التغيير اختلف بين أنظمة الدوران. بعد ست سنوات من بدء التجربة (في 2022)، زادت الفول السوداني كانت دورة القمح والذرة هي الأعلى في احتجاز الكربون في التربة )، تليها فول الصويا قمح-ذرة ) و البطاطا الحلوة قمح-ذرة )، بينما يعتبر الجاودار-الدخن الحلو قمح-ذرة، ذرة ربيعية دورة القمح والذرة، وكانت دورات القمح والذرة لها معدلات احتجاز كربون أقل بشكل ملحوظ ) (الشكل 3e). احتجاز الكربون في التربة يعوض إجمالي غازات الدفيئة
الشكل 3 | انبعاثات غازات الدفيئة (GHG) المباشرة وغير المباشرة في دورات المحاصيل المتنوعة. أ المتوسط السنوي انبعاثات؛ الانبعاثات؛ ج. تأثير الاحتباس الحراري ; انبعاثات غازات الدفيئة غير المباشرة؛ e التغيرات في مخزون الكربون في التربة في عمق؛ انبعاثات غازات الدفيئة الصافية. في الأشكال المربعة الماسية من (أ) إلى (ج)، تظهر المثلثات التي تمتد من النسب المئوية 25 و75 وتلتقي عند الوسيط. تشير المربعات الصغيرة إلى المتوسطات. تمتد خطوط الشوكة إلى الحد الأدنى والحد الأقصى. في و تمثل أشرطة الخطأ في كل عمود الانحراف المعياري لمجموعات الملف الكامل لثلاث تكرارات. في ، و تم إجراء تحليل التباين الأحادي (ANOVA) باتجاه واحد مع اختبار ثنائي الجانب واختبار ما بعد hoc للتحقق من الدلالة الإحصائية؛ وتدل الحروف الصغيرة المختلفة على وجود فروق دالة.
بين الدورات في . بالضبط القيم: في و . في ، ** يدل على تغييرات كبيرة في مخزون الكربون في التربة في طبقة التربة بين 2016 و 2022 في ( لـ SpWM، لـ PWM و SWM). اختصارات العلاج: WM القمح الشتوي – الذرة الصيفية (حالة التحكم)، SpWM البطاطا الحلوة دورة القمح الشتوي والذرة الصيفية، فول سوداني PWM دورة القمح الشتوي – الذرة الصيفية، فول الصويا SWM دورة القمح الشتوي – الذرة الصيفية، الذرة الربيعية SmWM دورة القمح الشتوي – الذرة الصيفية، رايجرس – سورغم دورة القمح الشتوي والذرة الصيفية. يتم توفير بيانات المصدر كملف بيانات المصدر.
انبعاثات بواسطة في الدورات مع البطاطا الحلوة والفول السوداني وفول الصويا و في الذرة الربيعية قمح-ذرة، عشب الجاودار-سرغوم حلو دورات القمح والذرة ودورات القمح والذرة (الشكل 3f). وبالتالي، كانت دورة القمح والذرة لديها أكبر صافي انبعاثات غازات الدفيئة totaling ، وأن الدورات المتنوعة مع البطاطا الحلوة وفول الصويا والفول السوداني خفضت انبعاثات غازات الدفيئة الصافية بـ ، ، و ، على التوالي، مقارنة بالقمح-الذرة ( ).

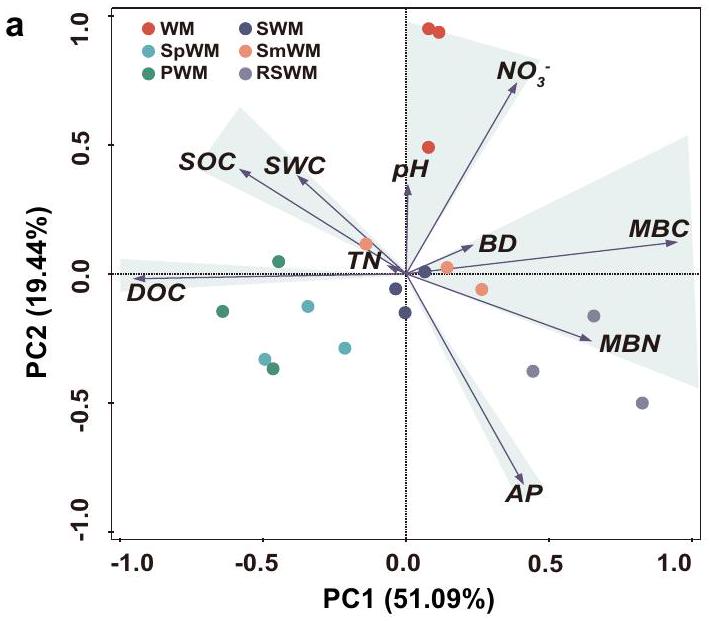
تساهم دورات المحاصيل المتنوعة في تعزيز صحة التربة وتنوع الميكروبات

غالبًا ما يتم تجاهل صحة التربة في تقييم أنظمة إنتاج المحاصيل الغذائية. في الدراسة الحالية، استخدمنا طريقة تقييم صحة التربة من كورنيل (CSHA) وطبقنا تحليل المكونات الرئيسية (PCA) لتقييم كيفية تأثير تنويع المحاصيل على صحة التربة. تم حساب درجة صحة التربة لكل دورة بناءً على مؤشرات رئيسية (مفصلة في الطرق). أظهر تحليل المكونات الرئيسية أن أول مكونين رئيسيين كانا يمثلان من نسبة التباين التراكمي (%) و ) في صحة التربة (الشكل 4أ)، مع تجميع مؤشرات صحة التربة المقاسة في مجموعات متميزة. في نهاية الدراسة التي استمرت 6 سنوات، كانت الفول السوداني كانت دورة القمح والذرة هي الأعلى في درجة صحة التربة (59.5)، تليها فول الصويا. دورة القمح والذرة (56.8) والبطاطا الحلوة دورة القمح والذرة (52.9) (الشكل 4ب)، حيث كانت أعلى بنسبة 41-59% من دورة القمح والذرة (33.2).
أظهر الفحص الدقيق لمؤشرات التربة التي ساهمت في درجات صحة التربة أن التربة في زراعة الفول السوداني كان لتناوب القمح والذرة تركيز أعلى من الكربون العضوي في التربة بنسبة 6.5% الكربون العضوي الذائب (DOC) الأعلى ولكن نسبة ن أقل إجمالاً و تركيز الفوسفور المتاح (AP) أقل من القمح والذرة (الشكل S3). كانت هذه التغييرات نتيجة تقليل سماد النيتروجين ( ) وكفاءات استخدام المغذيات الأعلى المرتبطة بالمحاصيل في الدورات المتنوعة. عشب الجاودار-الحلو
دُخن كان لتناوب القمح والذرة أقل نسبة من الكربون العضوي في التربة (SOC) والكربون العضوي الذائب (DOC) بسبب إزالة العلف لصنع السيلاج خلال موسم النمو، مما حفز النشاط الميكروبي في التربة، مما أدى إلى أعلى نسبة من الكتلة الحيوية الميكروبية (MBC) (الشكل S3).
تم تحديد تركيبة وتنوع مجتمع الميكروبات في التربة – كمؤشر على الآلية البيولوجية لصحة التربة – في عامي 2016 و2022 لتقييم التغيرات التراكمية بعد 6 سنوات من التجارب الدورية. وأظهر أن تنويع دورات المحاصيل كان له تأثيرات إيجابية (الشكل 5). على سبيل المثال، زاد مؤشر شانون – وهو مؤشر شائع لقياس تنوع الميكروبات مع الأخذ في الاعتبار عدد الأنواع والوفرة النسبية لكل نوع في عينة – بشكل كبير بواسطة في دورات المحاصيل مع البطاطا الحلوة والفول السوداني وفول الصويا، لكنها لم تتغير في دورة القمح-الذرة أو الذرة الربيعية المعتمدة على المحاصيل الحشائشية. قمح – ذرة ونجيل الجاودار – دُخن حلو أنظمة القمح والذرة من 2016 إلى 2022 (الشكل 5أ). أدت إضافة البقوليات مثل الفول السوداني أو فول الصويا في الدورات الزراعية إلى زيادة غنى وحدات التصنيف الضريبية التشغيلية (OTU) لمجتمع البكتيريا (الشكل S4أ-و) ومؤشر شانون لمجتمع الفطريات، وشاوا 1، وغنى وحدات التصنيف الضريبية (OTU). ) مقارنة بالقمح والذرة (الشكل S4g-I). العديد من مؤشرات صحة التربة ديناميكية وقد تتغير أسبوعياً أو موسمياً أو سنوياً. ومع ذلك، بعد 6 سنوات من ‘تغذية الدوران’، كانت التربة في الدورات التي تحتوي على البطاطا الحلوة والفول السوداني وفول الصويا لديها قيم أعلى بشكل ملحوظ لمؤشر تشاو 1، ومقدر التغطية المعتمد على الوفرة (ACE)، وغنى المجتمع، مقارنة بزراعة الذرة الربيعية الأحادية. نظام القمح-الذرة (الشكل 5ب-د).
تحليلات التكرار، التي توضح ارتباط الخصائص الفيزيائية والكيميائية للتربة ودورات المحاصيل في المجتمعات البكتيرية (الشكل 5e) والفطرية (الشكل 5f)، وجدت أن أول مجموعتين من المكونات تفسران (بكتيري) و (الفطري) من التباين الكلي في المجتمعين، على التوالي. كانت العلاقة
معقد، لكن كان من الواضح أن تركيبة المجتمعات البكتيرية والفطرية قد تغيرت من 2016 إلى 2022. كانت الدورات مع البطاطا الحلوة والفول السوداني وفول الصويا لها تركيبات مجتمعية بكتيرية مميزة عن الأنظمة الثلاثة الأخرى (الشكل 5e)، في حين أن الدورات المتنوعة الخمس المدروسة كانت لها تركيبات مجتمعية فطرية مختلفة بشكل ملحوظ عن التحكم في القمح والذرة (الشكل 5f). أثرت 6 سنوات من التغذية الدورية على الخصائص الفيزيائية والكيميائية للتربة بشكل تفاعلي مع المجتمعات الميكروبية في التربة. كانت المجتمعات البكتيرية للدورات مع البطاطا الحلوة والفول السوداني وفول الصويا مرتبطة ارتباطًا وثيقًا بالكربون العضوي في التربة والفوسفات المتاح، في حين أن تلك الخاصة بالقمح والذرة الربيعية… قمح-ذرة، وعشب الجاودار-دخن حلو كانت دورات القمح والذرة مرتبطة ارتباطًا وثيقًا بالنيتروجين الكلي وكتلة الكربون الميكروبية. على النقيض من ذلك، كانت الدورات مع البطاطا الحلوة والفول السوداني وفطريات فول الصويا مرتبطة بالكربون العضوي في التربة ودرجة الحموضة والمادة العضوية الذائبة.

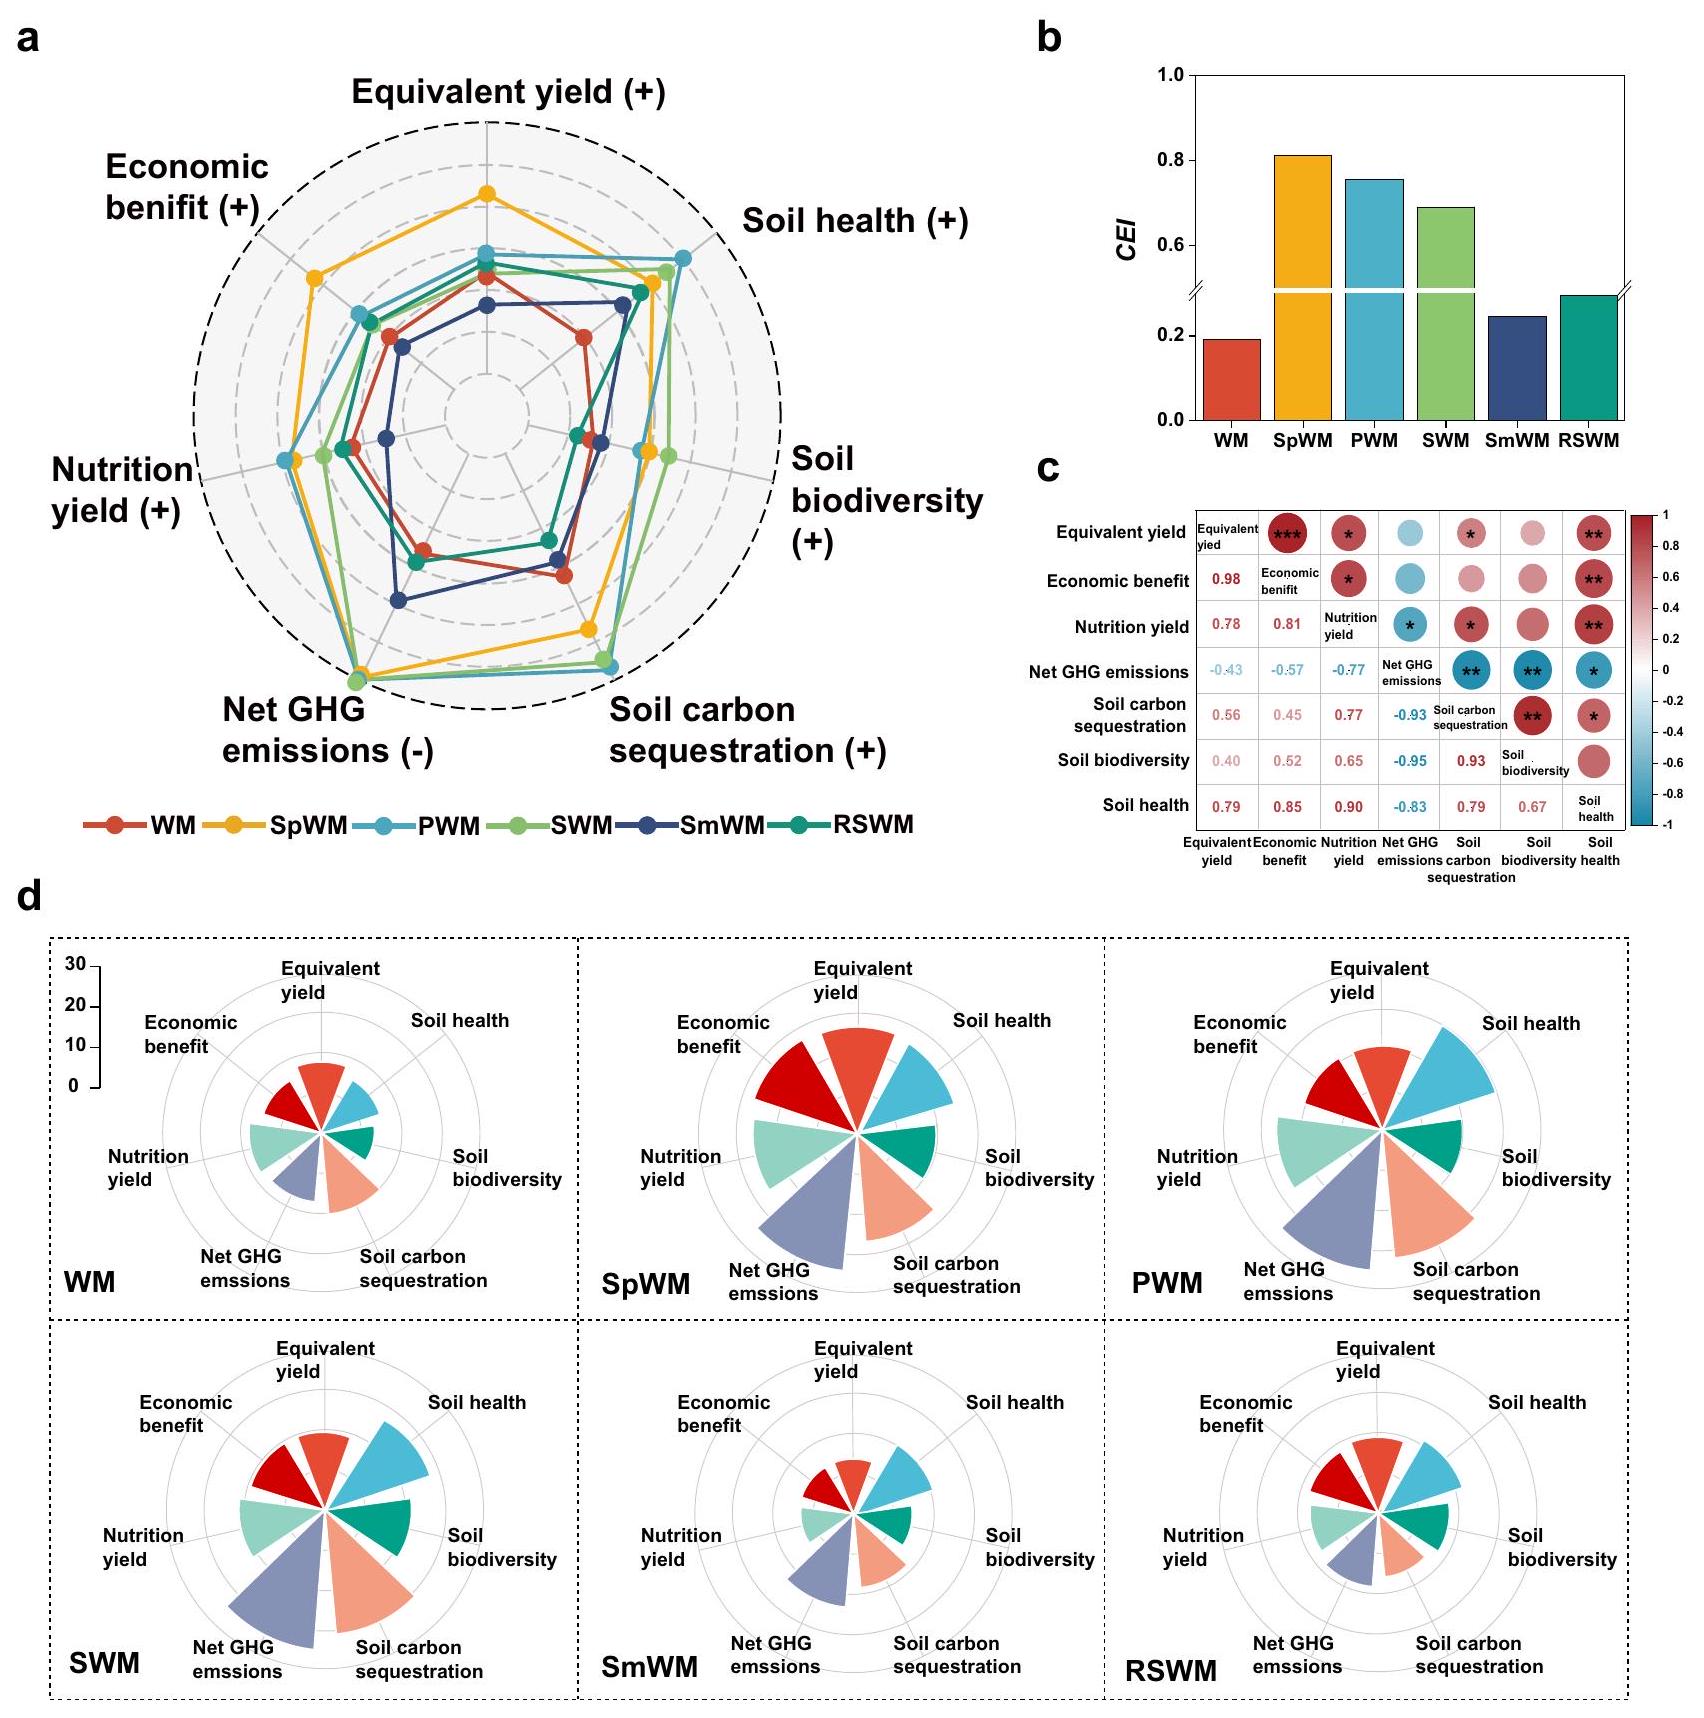
تقييمات متعددة الوظائف لدورات المحاصيل المتنوعة

استخدمنا مفهوم مؤشر التقييم الشامل (CEI) لتقييم التآزر والمقايضات بين دورات المحاصيل المختلفة المتعلقة بالعائد، والقيمة الغذائية، ومؤشرات التربة (الصحة، احتجاز الكربون، التنوع الميكروبي)، وانبعاثات غازات الدفيئة الصافية، والفائدة الاقتصادية (المعادلات 11-20 في الطرق) (الشكل 6 أ، د). أظهرت النتائج أن دورة القمح والذرة كانت لديها الأدنى القيمة، بمتوسط 0.19 (الشكل 6ب)، بينما البطاطا الحلوة كانت دورة القمح والذرة هي الأعلى في قيمة مؤشر كفاءة الاستخدام (CEI) حيث بلغت 0.81، تليها الفول السوداني. دورة القمح والذرة بنسبة 0.75 ، وفول الصويا دورة القمح والذرة بنسبة 0.69. كانت الدورات المتنوعة مع البطاطا الحلوة والفول السوداني وفول الصويا القيم تزيد عن ثلاثة أضعاف مقارنة بالقمح والذرة، وكانت أعلى بشكل ملحوظ من الذرة الربيعية المعتمدة على الحبوب. قمح-ذرة وعشب الجاودار-دخن حلو تدوير القمح والذرة (0.25-0.29). حدثت علاقات مهمة بين المؤشرات الرئيسية عبر أنظمة التدوير (الشكل 6c). كانت صحة التربة مرتبطة إيجابيًا مع محصول المحاصيل ( الفوائد الاقتصادية ) ، ودرجة التغذية ( )، لكنه كان مرتبطًا سلبًا بانبعاثات غازات الدفيئة الصافية ( كانت صحة التربة مرتبطة أيضًا بشكل إيجابي مع احتجاز الكربون في التربة ) وتنوع الكائنات الحية في التربة ( )، مما يساهم بشكل كبير في التوازن مقابل انبعاثات غازات الدفيئة الصافية ( ).
الشكل 4 | تقييم صحة التربة لأنظمة الدوران المختلفة. أ تحليل المكونات الرئيسية (PCA) للقيم الذاتية للعشر خصائص رئيسية للتربة، بما في ذلك الكربون العضوي في التربة (SOC)، الكربون العضوي المذاب (DOC)، النيتروجين الكلي (TN)، ، توافر P (AP)، pH، الكتلة الحيوية الميكروبية N (MBN)، الكتلة الحيوية الميكروبية الكربونية (MBC)، الكثافة الظاهرة (BD)، ومحتوى الماء في التربة (SWC). تم تطبيع كل خاصية من خصائص التربة كعنصر فردي في تقييم صحة التربة (CSHA) للمساهمة في الدرجة العامة لصحة التربة. درجة CSHA لكل دورة. تمثل الشعيرات في كل عمود الانحراف المعياري لثلاث تكرارات؛ والدوائر هي نقاط البيانات المقابلة للرسم البياني العمودي، تم إجراء تحليل التباين الأحادي (ANOVA) ذو الاتجاه الواحد مع اختبار جانبي واختبار بعدي لاختبار الدلالة بين العلاجات المختلفة.

نقاش

أظهرت الأدلة التجريبية من تجربة الحقل التي استمرت 6 سنوات تأثيرات إيجابية كبيرة لدورات المحاصيل المتنوعة على وظائف وخدمات النظام البيئي الزراعي المختلفة. استنادًا إلى نتائج الدراسة ومساحة زراعة المحاصيل المزدوجة ، قدرنا أن أنظمة الزراعة المتنوعة يمكن أن تقلل من صافي -انبعاثات -eq مليون طن سنويًا، تعويضًا عن من انبعاثات غازات الدفيئة السنوية المرتبطة بنظام الغذاء في الصين (1.9 مليار طن في 2020 كما تم الإبلاغ عنه من قبل ” ). السبب الرئيسي وراء هذا الانخفاض هو تراجع استخدام الأسمدة النيتروجينية الاصطناعية بمقدار 3.6 مليون طن. يمكن أن يستفيد المزارعون في منطقة سهل شمال الصين من زيادة بنسبة 20% في الدخل الصافي السنوي، ما يعادل 84 مليار يوان ( مليار دولار أمريكي) إجمالاً. علاوة على ذلك، ستزيد هذه التناوبات المتنوعة من درجات تقييم صحة التربة في كورنيل بـ ، بسبب زيادة معدلات احتجاز الكربون مقارنة بدورة القمح الشتوي والذرة الصيفية. علاوة على ذلك، قد تزيد غلات القمح والذرة بـ ما يعادل 73.5 مليون طن سنويًا إذا تم زراعته بعد محاصيل بديلة مثل البطاطا الحلوة أو فول الصويا أو الفول السوداني؛ مما سيوفر حوالي 36.1 مليون طن من الكتلة الحيوية الإضافية من القش سنويًا للاستخدامات البديلة، مثل العلف أو الطاقة الحيوية أو تعزيز مخزونات الكربون في التربة.
ستضيف الفوائد الثلاثية الأبعاد (عائدات الحبوب والبروتين، انبعاثات غازات الدفيئة، وصحة التربة) لتنويع المحاصيل في نظام دوران القمح الشتوي والذرة الصيفية في سهل شمال الصين ‘جدة اجتماعية’ كبيرة للتحدي المتمثل في توفير العناصر الغذائية الأساسية للطعام دون التأثير سلبًا على صحة التربة. إن هذه الجدة الاجتماعية تتجاوز بكثير الفوائد الزراعية لتنويع المحاصيل التي يتم التعرف عليها على نطاق واسع في جميع أنحاء العالم. على سبيل المثال، تظهر الدراسات طويلة الأمد في أمريكا الشمالية أن التنويع الدائري يزيد من عائدات المحاصيل، ويقلل من تأثير الظروف الجوية السلبية على إنتاجية النظام البيئي. ويعزز من قوة النظام تظهر الدراسات في أوروبا وأفريقيا أن التنوع على نطاق الحقل له تفاعل بديل مع التسميد مما يؤدي إلى زيادة الغلات عند استخدام كميات منخفضة من الأسمدة النيتروجينية. تظهر عدة دراسات صينية تنفذ تنويع المحاصيل بأشكال أو مقاييس مختلفة أن المزارعين يمكنهم اعتماد استراتيجيات متعددة لزيادة مرونة الزراعة والاقتصاد.
تدل الحروف الصغيرة المختلفة على مجموعات مختلفة بشكل ملحوظ من دورات المحاصيل في . الخط الأحمر المتقطع مع النسب الحمراء هو خط الأساس لدوران القمح الشتوي. الخط الأسود المتقطع مع النسب السوداء هو خط الأساس لعام 2016. اختصارات العلاج: WM القمح الشتوي – الذرة الصيفية (حالة التحكم)، SpWM البطاطا الحلوة دورة القمح الشتوي – الذرة الصيفية، فول سوداني PWM دورة القمح الشتوي – الذرة الصيفية، فول الصويا SWM دورة القمح الشتوي والذرة الصيفية، ذرة الربيع SmWM دورة القمح الشتوي – الذرة الصيفية، رايجرس – سورغم دورة القمح الشتوي والذرة الصيفية. يتم توفير بيانات المصدر كملف بيانات المصدر.
الشكل 5 | تنوع مجتمع الميكروبات في التربة وخصائص التربة استجابةً للدورة الزراعية. أ مؤشر شانون؛ ب تشاو 1؛ ج مؤشر ACE؛ د غنى OTU المقاس في ست دورات زراعية من 2016 إلى 2022؛ هـ تحليل التكرار (RDA) لـ OTU البكتيرية وخصائص التربة؛ RDA من OTU الفطريات وخصائص التربة. تمثل القيم النسبية في الألف إلى الدال الزيادة من 2016 إلى 2022؛ النقطة هي القيمة المتوسطة، وخطوط الشفافية على كل نقطة هي الانحرافات المعيارية لثلاث تكرارات. في الألف إلى الدال، تم إجراء تحليل التباين الأحادي مع اختبار ما بعد hoc لتحديد الفروق المهمة بين المعالجات. تشير الحروف الصغيرة المختلفة أسفل الأعمدة إلى الفروق المهمة بين الدورات في الرسوم البيانية و عرض تحليل التكرار مع نقاط ملونة مثلثات تشير إلى الدوران، المتجهات

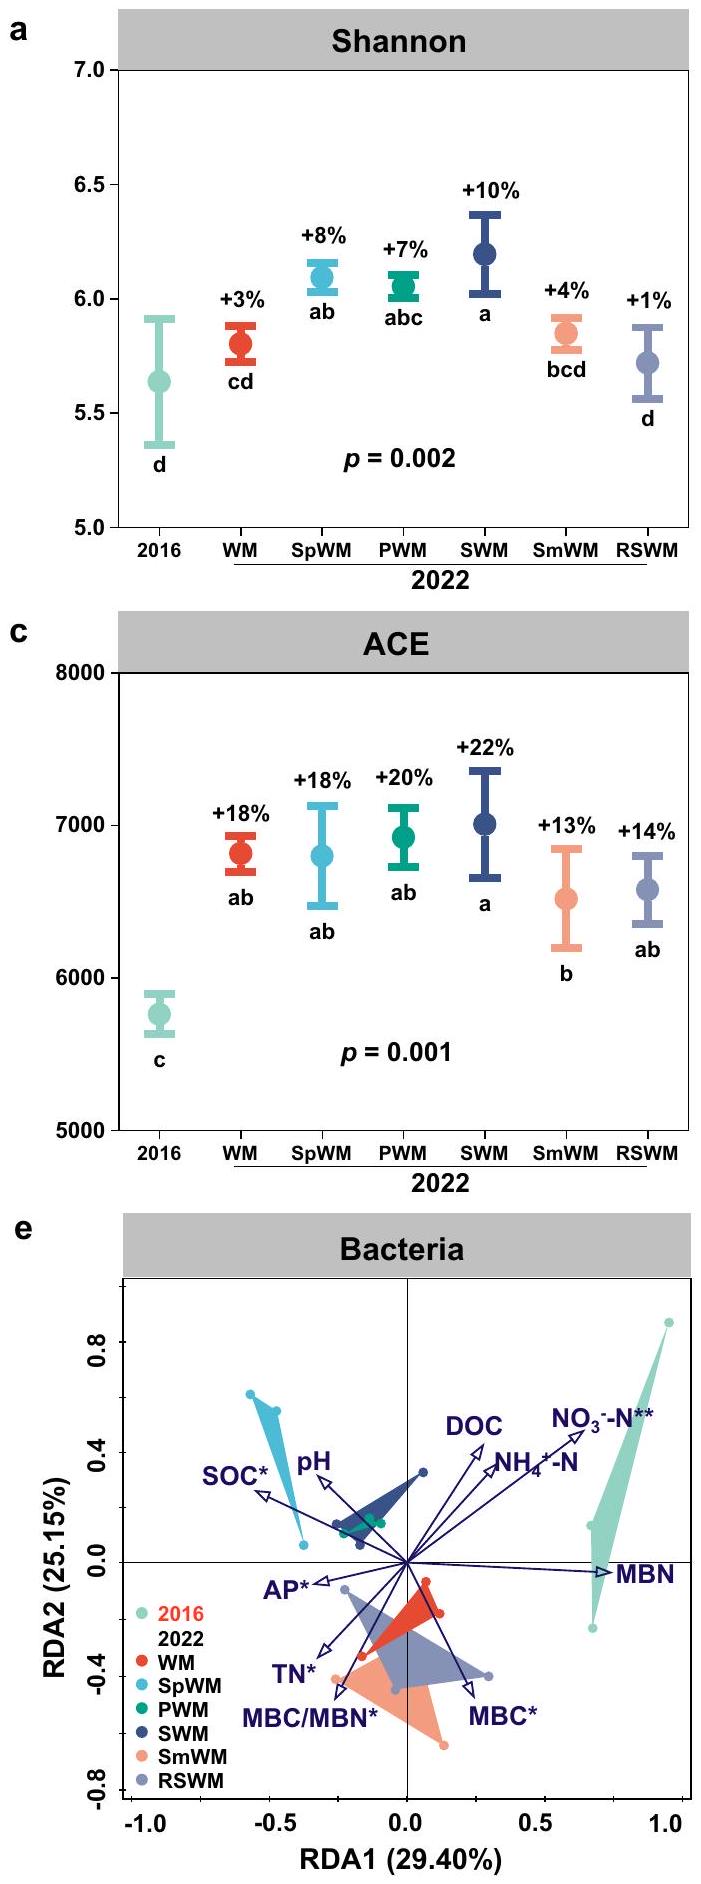
تشير إلى خصائص التربة بما في ذلك الكربون العضوي في التربة (SOC) ، الكربون العضوي المذاب (DOC) ، النيتروجين الكلي (TN) ، المتوفر P (AP)، pH، الكربون الحيوي الميكروبي (MBC)، النيتروجين الحيوي الميكروبي (MBN)، ونسبة MBC إلى MBN. اختصارات المعالجة: WM القمح الشتوي – الذرة الصيفية (حالة التحكم)، SpWM البطاطا الحلوة دورة القمح الشتوي – الذرة الصيفية، فول سوداني PWM دورة القمح الشتوي – الذرة الصيفية، فول الصويا SWM دورة القمح الشتوي – الذرة الصيفية، الذرة الربيعية SmWM دورة القمح الشتوي – الذرة الصيفية، رايجرس – سورغم دورة القمح الشتوي والذرة الصيفية. يتم توفير بيانات المصدر كملف بيانات المصدر.
الشكل 6 | تقييمات شاملة لأنظمة الدوران المختلفة. أ خريطة رادارية لتحليل الأهداف المتعددة لتقييم الوظائف المختلفة للدورات؛ ب مؤشر التقييم الشامل (CEI، المعادلات 15-24 في الطريقة، المواد التكميلية)؛ ج العلاقة التآزرية والتبادلية بين المتغيرات الرئيسية عبر دورات المحاصيل المختلفة؛ د، مخططات روز نايتنجيل لتحليل الأهداف المتعددة لتقييم الوظائف التفصيلية لكل دورة محصول. ، القيم مُعَيارَة. المتغيرات الإيجابية، (-)، المتغيرات السلبية. العائد المعادل يعيد التعبير عن عائد المحصول كعائد معادل لعائد حبوب القمح؛ الفائدة الاقتصادية تشير إلى عائد المحصول مضروبًا في سعره في السوق ناقص التكلفة القابلة للاستهلاك؛ عائد التغذية يشمل 17 مكونًا غذائيًا لكل محصول مثل البروتين الخام، محتوى الدهون، العناصر الكبرى والصغرى، والفيتامينات. يشير احتجاز الكربون في التربة إلى التغيرات في
مخزون الكربون في التربة في طبقة 0-90 سم من أكتوبر 2016 إلى أكتوبر 2022؛ تشير انبعاثات غازات الدفيئة الصافية إلى ميزانيات غازات الدفيئة الصافية بما في ذلك الانبعاثات المباشرة وغير المباشرة لغازات الدفيئة مطروحًا منها تخزين الكربون في التربة؛ يتم تمثيل تنوع التربة بواسطة مؤشر شانون لمجتمعات البكتيريا والفطريات؛ يتم حساب درجة صحة التربة من 10 مؤشرات باستخدام مصفوفة تقييم صحة التربة في كورنيل (CSHA) مجتمعة مع تحليل المكونات الرئيسية (PCA). . اختصارات العلاج: WM القمح الشتوي – الذرة الصيفية (حالة التحكم)، SpWM البطاطا الحلوة دورة القمح الشتوي – الذرة الصيفية، فول سوداني PWM دورة القمح الشتوي – الذرة الصيفية، فول الصويا SWM دورة القمح الشتوي – الذرة الصيفية، الذرة الربيعية SmWM دورة القمح الشتوي – الذرة الصيفية، راي جراس – سورغم دورة القمح الشتوي والذرة الصيفية. يتم توفير بيانات المصدر كملف بيانات المصدر.
فوائد بشكل عام، يوفر تنويع المحاصيل نهجًا شاملاً للنظم لتعزيز إنتاجية النظام البيئي الزراعي وقدرته على التكيف مع المناخات المتغيرة في جميع أنحاء العالم.
عامل رئيسي في تصميم أنظمة الزراعة المتنوعة هو ضمان زيادة احتجاز الكربون في التربة – حيث يلعب ذلك دورًا حاسمًا في صحة التربة، وفي التخفيف من تغير المناخ وتحقيق الحياد الكربوني. وجدنا أن الدورات المتنوعة مع السكر
لقد زادت البطاطا والفول السوداني وفول الصويا بشكل كبير من كربون التربة بعد 6 سنوات من تغذية الدورة الزراعية مقارنة بنظام زراعة القمح الشتوي والذرة الصيفية التقليدي. لقد أظهر إدخال البطاطا الحلوة والبقوليات في هذه الدورات الزراعية تحفيز نمو الميكروبات وزيادة كفاءة استخدام الكربون. وروجت لتشكيل معقدات الكربون المرتبطة بالمعادن في التربة ذات الاستقرار العالي المركبات القابلة للتغير من هذه المحاصيل الدوارة هي السائدة
مصدر للمنتجات الميكروبية التي تؤثر على الكربون العضوي المستقر بقدرة عالية على استقرار الكربون علاوة على ذلك، تسلط نتائجنا الضوء على وجود علاقة وثيقة بين صحة التربة وعائد التغذية، مما يبرز الترابط بين كلا البعدين واعتمادهما على الممارسات الزراعية. .
جانب ملحوظ في الدراسة هو أننا قمنا بقياس تركيزات الكربون العضوي في التربة حتى عمق 90 سم. غالبًا ما يركز الباحثون على طبقات التربة السطحية. عند دراسة حالة الكربون العضوي في التربة، قد يتم إخفاء بعض تأثيرات المعالجة، خاصة في المحاصيل ذات كتل الجذور المختلفة في أعماق التربة المتنوعة. وجدنا أن الكربون العضوي في طبقة التربة المخصصة من إجمالي SOC، طبقة محسوبة لـ ، و الطبقة المحسوبة تُبرز نتائجنا أهمية مخزونات الكربون في الطبقات تحت السطحية عند تقييم تخزين الكربون في التربة من أجل تقدير أكثر دقة لمساهمات احتجاز الكربون في التربة في التخفيف من تغير المناخ.
خفض انبعاثات غازات الدفيئة دون تقليل غلة المحاصيل هو تحدٍ كبير للزراعة العالمية. وجدنا أن الزراعة القائمة على البقوليات (الفول السوداني قمح-ذرة، فول الصويا دورات القمح والذرة قللت بشكل كبير انبعاثات بواسطة مقارنةً بدورة القمح والذرة التقليدية المعتمدة على الحبوب، مع زيادة ملحوظة في إنتاجية النظام (محاصيل الحبوب والبروتين). تعمل المحاصيل البقولية على تحسين دورة النيتروجين في التربة. ، ولكن قد يزيد أيضًا الانبعاثات، تحديدًا بعد دمج المتبقيات . ومع ذلك، تتطلب زراعة البقوليات كمية أقل بكثير من الأسمدة مقارنة بمحاصيل الحبوب مثل الذرة أو القمح. لذلك، كانت دورات الزراعة المعتمدة على البقوليات مع الفول السوداني وفول الصويا تتطلب 37% أقل من الأسمدة مقارنة بالقمح والذرة التقليديين، مما يفسر الانخفاض العام في انبعاثات دورات المحاصيل القائمة على البقوليات حيث كانت الأسمدة النيتروجينية المصدر الرئيسي لـ الانبعاثات في دراستنا ظل إنتاج الأسمدة النيتروجينية غير العضوية هو المساهم الأكثر أهمية في إجمالي انبعاثات غازات الدفيئة (حوالي 36-39%). وبالمثل، وجدنا أن الدورات المتنوعة مع البطاطا الحلوة وفول الصويا والفول السوداني قد خفضت بشكل كبير انبعاثات غازات الدفيئة الصافية بنسبة 75-92% مقارنة بالقمح والذرة، والذرة الربيعية. قمح-ذرة، وعشب الجاودار-دخن حلو أنظمة القمح والذرة. في دراسة في غرب كندا، أدت زراعة الحبوب بالتناوب مع البقوليات إلى تقليل انبعاثات غازات الدفيئة الصافية بنسبة 17-35% مقارنة بال monocultures الحبوب. بسبب تحسين امتصاص النيتروجين المرتبط بتعادل النيتروجين العضوي المنطلق من بقايا البقوليات في أوروبا، أدى زيادة إنتاج البقوليات من خلال إدخال البقوليات في دورات الحبوب إلى تحسين فعّال للبروتين النباتي مع تقليل الآثار البيئية. في حزام الذرة في الولايات المتحدة، حافظت أنظمة الذرة وفول الصويا المتنوعة على غلات الذرة أو زادتها بينما قللت من خسائر النيتروجين إلى البيئة. .
تقديم المحاصيل ذات الجذور الضحلة مثل البطاطا الحلوة والبقوليات السنوية في تناوب مع المحاصيل ذات الجذور العميقة مثل القمح الشتوي يمكّن من استخدام مغذيات التربة عبر منطقة الجذور بأكملها، مما يحسن كفاءة استخدام المغذيات ويقلل من فقدان مغذيات التربة من خلال الترشيح. كما أن التناوب بين المحاصيل ذات الجذور العميقة والضحلة يعزز توزيع الجذور، ويزيد من مسامية التربة ونفاذيتها، ويقلل من كثافة التربة. ويحسن من استقرار تجمعات التربة لتثبيت علاوة على ذلك، فإن خلطات المحاصيل المتنوعة تغير من جودة وكمية المادة العضوية التي تدخل التربة كأوراق نباتية، مما يعزز استقرار المركبات المشتقة من الميكروبات التي توفر تغذية إيجابية لنمو النباتات. يمكن أن تعزز المجتمعات الميكروبية المميزة المرتبطة بخليط المحاصيل المتنوعة دورة الكربون في التربة. في دراستنا، زادت دورات المحاصيل المتنوعة من البقوليات والحبوب والبطاطا الحلوة والحبوب بشكل كبير -تنوع مجتمعات البكتيريا والفطريات في التربة بعد 6 سنوات من الدورة الزراعية. أدى التنوع الفطري المتزايد إلى زيادة عدد الأنواع، بينما نتج عن زيادة مؤشر تنوع شانون في مجتمع البكتيريا تغييرات في الوفرة النسبية لبعض الأنواع. تحفز المحاصيل المتنوعة أنشطة مجتمع البكتيريا في منطقة الجذور. حيث إن بقايا الجذور والمستخلصات النباتية من المحاصيل الدوارة توفر تنوعًا أكبر من الركائز الكربونية للبقايا، مما يدعم نمو مجموعة متنوعة من الكائنات الدقيقة في التربة. وجدنا أن التناوب مع البطاطا الحلوة والفول السوداني وفول الصويا كان له تأثير كبير
زيادة تنوع المجتمع الفطري مقارنة بالقمح الشتوي والذرة الصيفية، مما يشكل ملفات مغذيات التربة مع ركائز كربونية مختلفة أثرت على تنوع الميكروبات. علاوة على ذلك، فإن دورات المحاصيل المتنوعة قد تقلل من تلوث التربة بالمواد الكيميائية الزراعية بسبب انخفاض استخدام الأسمدة النيتروجينية الاصطناعية والمبيدات الحشرية، مما يفضل البيئات الميكروبية في التربة. أظهرت دراسات أخرى التأثير الإيجابي للدورات المتنوعة على صحة التربة. كانت غلة الذرة ومحتوى الكربون العضوي في الدورات المتنوعة أكثر مرونة من تلك الموجودة في الزراعة الأحادية. مما قد يزيد من القدرة على التكيف مع تغير المناخ تعتبر النظم الإيكولوجية الزراعية المتنوعة بديلاً اقتصاديًا قابلاً للتطبيق عن دورات الذرة وفول الصويا التقليدية في منطقة الغرب الأوسط. ، مع المحاصيل الغطائية، والنباتات المعمرة، والحبوب الصغيرة التي تعزز صحة التربة بنسبة 32-49% وإنتاجية المحاصيل بـ .
جديد هذه الدراسة هو دوراتها الزراعية المتنوعة للغاية، حيث تحل المحاصيل النقدية والبقوليات محل زراعة الحبوب الأحادية، مع تدوير المحاصيل ذات الجذور الضحلة مع المحاصيل ذات الجذور العميقة. يؤثر ذلك بشكل إيجابي على خدمات النظام البيئي ووظائفه، مما يعوض جزئيًا عن الخدمات الأقل في دورات الحبوب الأقل تنوعًا. تقدم تنويع المحاصيل فوائد كبيرة في تقليل انبعاثات غازات الدفيئة وله تأثير تآزري على إنتاج الكتلة الحيوية للنباتات والبروتين، وصحة التربة، وتنوع المجتمع الميكروبي. قلل التنويع من مدخلات المحاصيل، وخاصة الأسمدة النيتروجينية وكميات الري، مما يقلل من التكاليف البيئية مع زيادة دخل المزارعين. وبالتالي، يمكن أن تكون دورات المحاصيل المتنوعة استراتيجية فعالة لإنتاج الغذاء المستدام في المناطق حول العالم ذات البيئات المشابهة لسهول شمال الصين.
تشير الأدلة العلمية المقدمة في هذه الدراسة إلى إمكانيات كبيرة في إبلاغ وتعزيز السياسات الحالية وأنظمة الحوافز لتحسين الانتقال الأخضر لأنظمة الزراعة في الصين. على وجه التحديد، وضعت الصين أهدافًا لتعزيز إنتاج فول الصويا (الذي بدأ في عام 2019)، وتنفيذ خطة عمل لتحقيق عدم زيادة في استخدام الأسمدة والمبيدات (التي أُطلقت في عام 2015)، وتطوير استراتيجيات لتقليل انبعاثات غازات الدفيئة الزراعية بهدف نهائي يتمثل في تحويل الأنظمة الزراعية إلى ‘منعدمة الانبعاثات’ بحلول عام 2060. عند تصميم أنظمة زراعية متنوعة وفعالة، من المهم مراعاة الظروف البيئية المحلية لتحقيق توازن في استخدام الأراضي لإنتاج الغذاء مع الوظائف الأخرى للنظام البيئي. إن تحسين تكوين المحاصيل أمر أساسي – من خلال التخطيط الاجتماعي والاقتصادي والبيئي ضمن إطار معقد من مؤشرات متنوعة لضمان الاستدامة على المدى الطويل. نوصي بأن يكون تطوير واعتماد أنظمة زراعية متنوعة اعتبارًا رئيسيًا في وضع السياسات الزراعية وأولوية قصوى في اتخاذ القرارات على مستوى المزرعة، حيث إنها ضرورية لتحقيق مرونة إنتاج الغذاء على المدى الطويل، والحفاظ على صحة التربة، وضمان الاستدامة البيئية. نظرًا لأن تقلب المناخ سيزداد، تظل التقييمات متعددة السنوات لاستدامة أنظمة الإنتاج الزراعي مؤقتة، ويجب السعي للحصول على تمويل لمواقع مراقبة إضافية للرصد على المدى الطويل.

طرق

تم إنشاء التجربة الميدانية في أكتوبر 2016 في محطة لوانتشينغ للأنظمة الزراعية التابعة للأكاديمية الصينية للعلوم. ; الارتفاع، 50.1 م) في مقاطعة لوانتشينغ، مقاطعة خبي (الشكل S5a)، والذي يمثل الإنتاج الزراعي وظروف المناخ في سهل شمال الصين. تشهد المنطقة التجريبية مناخًا دافئًا، معتدلًا، شبه رطب، مناخًا موسميًا مع فترة خالية من الصقيع تبلغ 200 يوم. كانت درجة الحرارة الجوية السنوية المتوسطة على مدى العشرين عامًا الماضية، وكان متوسط هطول الأمطار السنوي على مدار الـ 62 عامًا الماضية (الشكل S5b). الشكل S5c يعرض متوسط هطول الأمطار الشهري ودرجات حرارة الهواء من 2016 إلى 2020. كان موقع التجربة يحتوي على تربة طينية مع تربة رملية طينية في الطبقات السطحية، وطين خفيف/متوسط في عمق، وطين خفيف تحت 80 سم. طبقة التربة قبل بدء التجربة تحتوي على الكثافة الظاهرية
سعة الحقل نقطة الذبول إجمالي SOC، الفوسفور المتاح، و البوتاسيوم المتاح. قبل التجربة، كانت المحاصيل الغذائية الأساسية في نفس الحقول هي القمح والذرة المزروعة في نظام زراعة مزدوجة لمدة 12 شهرًا الذي يحظى بشعبية في المنطقة. منذ بداية التجربة، تم إدارة المواقع باستخدام تقنيات الري والبذر المحسّنة، مع إعادة جميع المخلفات إلى التربة خلال سنة القمح الشتوي والذرة الصيفية.
تضمن التجربة ثمانية محاصيل: الحبوب القمح الشتوي (الصنف كينونغ 2009)، الذرة الصيفية (الصنف جوندان 20)، والذرة الربيعية (الصنف جوندان 20)؛ البقوليات فول الصويا (الصنف شيدو 12) والفول السوداني (الصنف جيهوا 4)؛ المحاصيل النقدية/العلفية: البطاطا الحلوة (الصنف شانغشو 19)، عشب الجاودار (الصنف دونغمو 70) والدخن (الصنف جينتيانزا 3). كان هناك خمسة دورات زراعية متنوعة مصممة حديثًا: [البطاطا الحلوة دورة القمح الشتوي والذرة الصيفية (SpWM، دورة مدتها سنتان)؛ الفول السوداني دورة القمح الشتوي والذرة الصيفية (PWM، دورة مدتها سنتان)؛ فول الصويا دورة القمح الشتوي – الذرة الصيفية (SWM، دورة مدتها سنتان)؛ عشب الجاودار – الذرة الحلوة دورة القمح الشتوي والذرة الصيفية (RSWM، دورة مدتها سنتان)؛ الذرة الربيعية نظام دوران القمح الشتوي والذرة الصيفية (SpWM، دورة مدتها سنتان)]. كان نظام زراعة القمح الشتوي والذرة الصيفية المهيمن إقليمياً (WM، دورة مدتها سنة واحدة) هو التحكم. ‘ يدل على تناوب المحاصيل عبر السنوات و ‘-‘ يدل على تناوب المحاصيل داخل السنة. على عكس القمح الشتوي الصافي – الذرة الصيفية، تضمنت التناوبات البديلة فترات راحة لجزء من سنواتها غير القمح الشتوي – الذرة الصيفية (الشكل S6).
تم تكرار كل دورة ثلاث مرات، مما أسفر عن إنشاء 18 قطعة أرض باستخدام تصميم كتلة عشوائية كاملة (الشكل S6). تم تكرار جميع الدورات على قطعها المعنية من أكتوبر 2016 إلى أكتوبر 2022. أكملت دورة زراعة القمح الشتوي والذرة الصيفية المزدوجة ست دورات، بينما أكملت الدورات الخمس الأخرى ثلاث دورات. تسرد الجدول التكميلية S1 الكميات الإجمالية للمدخلات، بما في ذلك النيتروجين والفوسفور والبوتاسيوم، والري، والديزل للحراثة، والكهرباء للري، والمبيدات، والبذور، والعمالة لكل محصول في كل دورة. توضح البيانات التكميلية 1 كميات وتوقيتات الأسمدة والري لكل محصول في كل دورة في كل عام. تم تطبيق النيتروجين الأساسي (على شكل يوريا) عن طريق البث وحرثه (بعمق 20 سم) في التربة قبل الزراعة. تم إجراء التسميد العلوي للنيتروجين في مراحل النمو الرئيسية بكميات محددة ملخصة في البيانات التكميلية 1.

العائد المكافئ والفائدة الاقتصادية

تم حصاد المحاصيل عند النضج باستخدام آلة حصاد تقليدية مزودة بنظام وزن آلي، والذي قاس إجمالي محصول كل قطعة أرض. بعد التجفيف بالهواء إلى محتوى رطوبة ثابت. تم تسجيل غلات القمح والذرة تم وزن عائد الكتلة الحيوية من السورغم (الوزن الطازج) لكل قطعة أرض لتمثيل رطوبة السيلاج من ( المادة الجافة تم تحديد المادة الجافة لبرسيم الجاودار في عينة فرعية بعد التجفيف عند حتى الوزن الثابت تم الحصول على محصول البطاطا الحلوة (الوزن الطازج) عن طريق وزن الدرنات الجذرية الطازجة التي تم حصادها من كل قطعة أرض باستخدام آلة حصاد ذات صف واحد. تم جمع جميع القرون الناضجة في كل قطعة لتحديد محصول الفول السوداني بدقة. تم استخدام عشرة نباتات فول سوداني متجانسة للتحقيق في عدد القرون لكل نبات. تم تجفيف جميع قرون الفول السوداني المحصودة في الهواء إلى محتوى مائي يقارب وتم وزنه لحساب عائد القرون . بعد حصاد كل قطعة أرض، تم تنظيف بذور فول الصويا ووزنها، مع تعديل غلة الحبوب إلى محتوى الرطوبة .
لإجراء مقارنات العائد بين منتجات المحاصيل المختلفة، تم حساب العوائد المعادلة لست دورات زراعية من خلال ضرب عائد المحصول في سعر السوق بالنسبة لسعر القمح الشتوي في نفس السنة. تم تحديد العائد المكافئ لكل نظام زراعي، والفائدة الاقتصادية، وعائد البروتين على النحو التالي:
أين العائد المكافئ للمحصول في السنة سعر القمح سعر القمح الشتوي في السنة معدل وفقًا لمؤشر أسعار المستهلكين الوطني في الصين (CPI، اليوان النسبي)، الفائدة الاقتصادية هو محصول السنة مضروبًا في سعره المقابل باليوان الصيني ناقص تكاليف إنتاج المحاصيل (يوان ) ، سنة معينة، هو إجمالي محتوى البروتين في المحصول ، و تركيز البروتين لكل كيلوجرام من محصول المحاصيل (%) المشار إليه من الدراسات السابقة . (للمقارنة، تم استخدام سعر الصرف التالي: يوان صيني و 1 تم جمع كل مؤشر لدورة زراعية واحدة عبر المحاصيل ضمن دورة زراعية واحدة. تم استخدام مؤشر أسعار المستهلك لضبط أسعار المحاصيل عبر السنوات لإزالة التضخم أو الانكماش كمصدر للتباين بين الحالات في سنوات مختلفة. تسرد الجدول S2 أسعار المحاصيل وقيم مؤشر أسعار المستهلك للسنوات والمحاصيل الفردية، بينما يسرد الجدول S3 محتوى البروتين لكل محصول.

تدفق الغاز وانبعاثات غازات الدفيئة الصافية

غازات الدفيئة في التربة و تم قياس التدفقات باستخدام طريقة الغرفة الثابتة تم إدخال إطارات بلاستيكية مع أخاديد مانعة لتسرب الماء بعمق 5 سم في التربة بين صفوف المحاصيل، وغرف ( ) تم وضعها على قمة الإطارات أثناء القياسات. لقياسات التدفق، تم أخذ عينات الغاز ( تم أخذ عينات (لكل عينة) بين الساعة 9:00 و10:00 صباحًا في فترات زمنية محددة. ، وبعد 36 دقيقة من إغلاق الحجرة) باستخدام محاقن بلاستيكية سعة 100 مل متصلة بصمام ثلاثي الاتجاهات. تم جمع عينات الغاز تقريبًا كل 7 أيام من الزراعة حتى الحصاد، مع قياسات أكثر تكرارًا (كل 3 أيام) بعد تطبيق سماد النيتروجين وأحداث الهطول. تم تسجيل درجة حرارة الهواء في رأس الحجرة باستخدام مقياس حرارة. تم تحليل عينات الغاز باستخدام جهاز كروماتوغرافيا الغاز (Agilent 7890 A، Agilent Inc.، الولايات المتحدة الأمريكية) مزود بكاشف لهب-أيون لتقدير في وكاشف لالتقاط الإلكترون لقياس في تم ضبط درجة حرارة العمود على . تم فصلها باستخدام عمود بوراباك كيو وتم الكشف عنها بواسطة كاشف التأين اللهبي. تم اكتشافه بواسطة كاشف التقاط الإلكترون الدقيق ). كان الغاز الحامل عالي النقاء (99.999%) مع سرعة تدفق غاز تطهير ( في ) تم استخدامه لتجنب التداخل مع . تم حساب تدفق الغاز باستخدام الطريقة الخطية. التربة و تُظهر الأشكال S1 و S2 التدفقات لكل دورة على مدار 6 سنوات.
للانبعاثات الصافية من غازات الدفيئة ( -يساوي في التقدير، أخذنا في الاعتبار انبعاثات غازات الدفيئة غير المباشرة من مدخلات المحاصيل من تقييم دورة الحياة، المباشرة و انبعاثات من التربة، وتغيرات في مخزون الكربون في التربة من خلال تجربة استمرت 6 سنوات. تم تحديد حدود النظام في تقييم دورة الحياة من التصنيع والتخزين وتسليم المدخلات الخارجية مثل الأسمدة إلى حصاد المحاصيل، بما في ذلك تغيير تخزين الكربون في التربة (الشكل S7). تم استبعاد الانبعاثات المحتملة المتعلقة باللوجستيات لنقل أو تصدير أو تسويق منتجات الحبوب خارج بوابة المزرعة لأنها اعتبرت خارج حدود النظام.
تنتج انبعاثات غازات الدفيئة غير المباشرة (CE) من تصنيع وتخزين ونقل وتوصيل المدخلات الزراعية، مثل الأسمدة. ، المبيدات الحشرية، والديزل، والكهرباء إلى بوابة المزرعة، كما يلي:
أين هي انبعاثات غازات الدفيئة غير المباشرة لمحصول واحد ضمن دورة زراعية معينة، هو مقدار الـ الإدخال (الجدول S1)، و هو المعادل -معاملات انبعاث -eq (انظر الجدول S4 لتصنيع وتخزين وتوصيل المدخلات الزراعية).
مباشر و تم حساب التدفقات من التربة من أكتوبر 2016 إلى أكتوبر 2022 على النحو التالي:
أين هو تدفقات انبعاثات غازات الدفيئة و انبعاثات هو الكتلة الجزيئية للغاز المحدد ( لـ و لـ هو الحجم المولي لغاز مثالي، هو درجة حرارة الغاز المثالي، و هي درجة حرارة الهواء والضغط في الغرفة في وقت أخذ العينة، هو الضغط الجوي القياسي، هو ارتفاع الغرفة، ) هو ميل منحنى الانحدار الخطي لتغير تركيزات غازات الفضاء العلوي خلال أوقات إغلاق الحجرة، و 60 هو تم حساب إجمالي انبعاثات غازات الدفيئة خلال كل فترة نمو المحاصيل وفترة السكون باستخدام الاستيفاء الخطي. .
تراكمي و تم حساب الانبعاثات خلال موسم نمو كل محصول أو فترة السكون على النحو التالي:
أين هو الانبعاث التراكمي لأحد الغازين من قطعة تجريبية واحدة ( ) على مدى فترة محددة، هو تدفق انبعاث الغاز هو وقت العينة بالأيام، هو أخذ عينات من الرسم، و24 هو معامل التحويل بين الساعات والأيام (ساعة يوم) ).
إمكانات الاحترار العالمي (GWP) للتربة الموسمية و الانبعاثات، مع دمج نتائج المعادلة (7) وإعادة التعبير عنها في -يساوي ، تم حسابه على أنه:
التغير السنوي في مخزون SOC ; تم تقدير (من أكتوبر 2016 إلى أكتوبر 2022) لكل دورة زراعية على النحو التالي:
أين و هي القيم الإجمالية لتخزين الكربون في التربة في طبقة التربة في أكتوبر 2016 وأكتوبر 2022، على التوالي، هو عدد سنوات فترة الدراسة، و هو معامل التحويل من درجة مئوية إلى .
كانت انبعاثات غازات الدفيئة الصافية تساوي مجموع الانبعاثات غير المباشرة (CE) والمباشرة (GWP من و انبعاثات غازات الدفيئة مطروحًا منها احتجاز الكربون في التربة عندما كان الكربون في التربة هو المصب، تم حسابه على النحو التالي:

الخصائص الفيزيائية والكيميائية للتربة، تنوع الميكروبات وتقييم صحة التربة

عينات التربة تم جمع العينات (العمق) في بداية التجربة (أكتوبر 2016) وفي نهاية حصاد الذرة الصيفية في أكتوبر 2022 لقياس الخصائص الفيزيائية والكيميائية للتربة: بما في ذلك درجة حموضة التربة، والكثافة الظاهرية، ومحتوى الماء في التربة، والنيتروجين الكلي (TN)، والكربون العضوي المذاب (DOC)، ونترات التربة- نترات الأمونيوم -N)، الفوسفور المتاح (AP)، وكتلة الكائنات الدقيقة من الكربون والنيتروجين (MBC وMBN، على التوالي).
تم قياس pH التربة في تعليق بنسبة 1:5 (وزن/حجم) من التربة: الماء كما وصفه مكلاين. تم تحديد TN باستخدام طريقة كيلدال المعدلة تم تحديد MBC و MBN باستخدام طريقة التبخير والاستخراج بالكلوروفورم تركيزات DOC المستخرجة من التربة المعالجة بالبخار وغير المعالجة بالبخار
تم تحديد العينات باستخدام محلل TOC متعدد 3100 N/C (Analytik Jena، ألمانيا). تم استخدام بروتوكول بريمنر القياسي المعدل لاستخراج التربة و استخدام تم قياسها باستخدام مقياس الطيف الضوئي UV-1800 (أدوات مابادا، شنغهاي، الصين). تم تحديد تركيزات الفوسفور المتاح في التربة باستخدام ( الرقم الهيدروجيني 8.5 ) وطريقة الكروماتوغرافيا اللونية الزرقاء للموليبدينوم .
تركيزات الكربون العضوي في التربة (SOC) في تم قياس طبقات التربة (0-10، 10-20، 20-30، 30-50، 50-70، و70-90 سم) بعد كل حصاد للمحاصيل من أكتوبر 2016 إلى أكتوبر 2022، في عينات تم جمعها بواسطة مثقاب من خمسة مواقع عشوائية لكل قطعة. تم دمج عينات التربة من كل عمق أخذ عينة داخل قطعة، وتجفيفها في لمدة 24 ساعة، منخول (2 مم)، تم معالجته مسبقًا بحمض الهيدروكلوريك 0.5 م لإزالة الكربونات ، وتم طحنها باستخدام مطحنة الكرة. تم تحديد تركيزات SOC باستخدام محلل Vario Macro CNS (Elementar، ألمانيا). تم قياس الكثافة الظاهرية للتربة في جميع طبقات التربة حتى عمق 0.9 متر في جميع المواقع باستخدام الطريقة الج gravimetric. .
تم جمع عينات التربة أيضًا قبل بدء التجربة (أكتوبر 2016) وعند الحصاد النهائي لذرة الصيف (أكتوبر 2022) لتسلسل الحمض النووي وقياسات تركيب وتنوع المجتمع الميكروبي. تم وضع عينات فرعية لتسلسل الحمض النووي على الفور على الثلج الجاف وتخزينها في حتى استخراج الحمض النووي، بينما تم أخذ العينات الفرعية الأخرى إلى المختبر للتحليل الكيميائي. تم استخراج الحمض النووي من التربة من 0.5 جرام من التربة المجففة بالتجميد باستخدام مجموعة عزل الحمض النووي Powersoil (مختبرات مو بايو، كارلسباد، كاليفورنيا، الولايات المتحدة الأمريكية) وفقًا لبروتوكول الشركة المصنعة. تم تقييم جودة الحمض النووي وفقًا لـ و نسب الامتصاص باستخدام مقياس الطيف NanoDrop ND2000 (NanoDrop، ND2000، Thermo Scientific، 111 ويلمنجتون، ديلاوير) ثم تم تخزينها في لإجراء مزيد من التحليل في علم الأحياء الجزيئي.
أزواج البرايمر – باركود – 515F/806R -GTGCCAGCMGCCGCGGTAA-3’/5′-GCACTACHVGGGTWTCTAAT-3′)-تم استخدامها لتضخيم منطقة V3 + V4 من جين 16 S rRNA البكتيري “، مما يوفر معلومات تصنيفية دقيقة مع وجود تحيزات قليلة بين مختلف الأنواع البكتيرية. البرايمرات-ITS1 ( -CTTGGTCATTTAGAGGAAGTAA- ) و ITS2 ( -TGCGTTCTTCATC-GATGC-3′)-تم استخدامها لتضخيم منطقة ITS1 من جين الرنا الريباسي الفطري. تم إجراء تفاعل البوليميراز المتسلسل في خليط (حجم نهائي، ) تتضمن قالب الحمض النووي ) ، من كل برايمر بريمكس إكس تاك (تاكارا بيولوجي) ماء معقم. كانت ظروف الدورة الحرارية كما يلي: إنكار أولي لمدة 3 دقائق عند ست دورات لمسة هدف مدتها 45 ثانية في من 65 إلى ، 70 ثانية عند ، تليها 22 دورة من 45 ثانية عند في في مع إطالة نهائية لـ تم إجراء تسلسل عالي الإنتاجية مشفر بالتاج لجينات 16 S و ITS من منتجات PCR المنقاة والمقدرة بواسطة شركة Magigene (بكين، الصين) باستخدام منصة Illumina MiSeq.
تمت معالجة التسلسلات الخام باستخدام خط أنابيب الرؤى الكمية في علم البيئة الميكروبية (QIIME) (الإصدار 2.1) تم إعادة أخذ عينات وحدات التصنيف الضريبية التشغيلية (OTUs) بناءً على الحد الأدنى من أعداد التسلسل لتصحيح جهد العينة قبل التحليل الإضافي. تم تجميع OTUs باستخدام حد قطع التشابه باستخدام خط أنابيب UPARSE (الإصدار 7.1) تم إجراء التعيين التصنيفي باستخدام وحدات التشغيل (OTUs) مع SILVA (16S) و Unite (ITS).
تمت caracterization التنوع الألفا بواسطة ستة مؤشرات (شانون-ويفر، تشاو1، ACE، الغنى، سيمبسون، وبييلou)، تم حسابها باستخدام أعداد OTU للبكتيريا والفطريات. (انظر المعلومات التكميلية للحسابات التفصيلية).
تقييم صحة التربة في كورنيل (CSHA) مُدمج مع تحليل المكونات الرئيسية (PCA) تم استخدامه لتحديد درجات الصحة للتربة المأخوذة عيناتها في عامي 2016 و2022، مما سمح بمقارنة التغيرات في صحة التربة لكل قطعة بعد 6 سنوات من ‘تغذية الدوران’. المؤشرات العشر للتربة (الخصائص الفيزيائية: الكثافة الظاهرة، محتوى الماء في التربة؛ الخصائص الكيميائية: الرقم الهيدروجيني للتربة، النيتروجين الكلي، الكربون العضوي في التربة، الكربون العضوي الذائب، -N، AP؛ الخصائص البيولوجية: MBC و MBN) تم تطبيعها كأفراد
درجات CSHA . كانت أوزان درجات CSHA الفردية مستندة إلى تحليل المكونات الرئيسية (PCA) لجميع مؤشرات التربة (الجدول S5)، والتي تمثل مجموع المتجهات الذاتية المستمدة من أول ثلاثة مكونات رئيسية، التي تم اختيارها بناءً على نقطة الانعطاف من مخطط Scree وقطع كايسر (القيم الذاتية >1) (الشكل S8). كانت هذه المكونات الثلاثة الرئيسية الأولى تمثل ، و من إجمالي تباين البيانات، مع تباين تراكمي قدره تم حساب الدرجة الإجمالية لصحة التربة (%) كمتوسط مرجح لجميع درجات CSHA الفردية، وتم حسابها على النحو التالي:
أين هو درجة CSHA لكل مؤشر تربة فردي، و هو عامل الوزن لكل مؤشر تربة (الجدول S5).

الإنتروبيا-توبسيس لتقييم الوظائف المتعددة لدورات المحاصيل المتنوعة

ال تم تحديده باستخدام إنتاج المحاصيل، والعائد الغذائي (المفصل في المعادلات 1-5 في طرق SI)، والفائدة الاقتصادية، وصحة التربة، وتخزين الكربون، والتنوع الميكروبي، وانبعاثات غازات الدفيئة الصافية استنادًا إلى طريقة Entropy-TOPSIS (تقنية تفضيل الطلب بناءً على التشابه مع حل مثالي).
إن طريقة إنتروبي-توبسيس هي أداة تحليل قرار متعددة الأهداف لتحديد الحل الأكثر قابلية للتطبيق من مجموعة من الخيارات. تحدد الحلول المثالية الأكثر إيجابية وسلبية لمشكلة ما، حيث يمثل الحل الأكثر قابلية للتطبيق الحل الذي هو الأكثر إيجابية والأبعد عن الحل المثالي السلبي. تم اختيار طريقة وزن الإنتروبيا كوسيلة موضوعية لتحديد وزن المؤشر لتجاوز تأثير العوامل الذاتية الناتجة عن طريقة دلفي أو عملية التحليل الهرمي عند تحديد وزن مؤشر التقييم لطريقة TOPSIS التقليدية. ثم يتم استخدام وزن المؤشر لحساب ترتيب التقييم الشامل لكل دورة زراعية باستخدام TOPSIS:
(1) تطبيع المؤشرات:
أين هو القيمة المعيارية لـ الفهرس في دورة المحاصيل (تشمل المؤشرات الإيجابية العائد المكافئ، الفائدة الاقتصادية، عائد التغذية، تنوع التربة بما في ذلك البكتيريا والفطريات، درجة صحة التربة، وتخزين الكربون في التربة؛ المؤشر السلبي هو صافي انبعاثات غازات الدفيئة). هو القيمة المتوسطة من ثلاث تكرارات مقاسة لـ الفهرس في دورة المحاصيل، و و هي القيم القصوى والدنيا لمؤشر واحد، على التوالي.
(2) احسب قيمة الانتروبيا لكل مؤشر تقييم:
أين و . عندما يتم تعديله على النحو التالي:
(3) احسب وزن الإنتروبيا ( ) من مؤشر التقييم:
(4) بناء مصفوفة قرار موزونة ومُعَيارَة ) باستخدام المصفوفة المعنونة وأوزان كل مؤشر :
(5) حدد متجه الحل المثالي الإيجابي والمتجه الحل المثالي السلبي استخدام الحل المثالي الإيجابي وحل المثال السلبي :
(6) احسب المسافة الإقليدية بين كل مؤشر والحلول المثالية الإيجابية والسلبية.
(7) احسب مؤشر التقييم الشامل من كل دورة زراعية. يتم حساب القرب بين كائن التقييم والمخطط الأمثل على النحو التالي:

التحليل الإحصائي

تم إجراء التحليلات الإحصائية باستخدام برنامج SPSS الإصدار 21 (حلول المنتجات والخدمات الإحصائية من IBM) و R الإصدار 4.3.1. تم استخدام اختبار كولموغوروف-سميرنوف لاختبار التوزيع الطبيعي، تلاه تحليل التباين (ANOVA) لتحديد الأهمية الإحصائية للاختلافات بين القيم المتوسطة. تم إجراء مقارنات بعد الاختبار باستخدام اختبار الفرق الأقل دلالة (LSD) عند مستوى احتمال 5%. تم حساب مصفوفة الارتباط للمؤشرات لكل دورة باستخدام الطريقة الكلاسيكية لبيرسون وتم تصورها باستخدام حزمة Performance Analytics في R 4.3.1 وR Studio 1.8.0. تم استخدام تحليل المكونات الرئيسية (PCA) لحساب القيم الذاتية وتصنيف كل مؤشر تربة في كل دورة باستخدام حزمة vegan، وتم تصورها باستخدام حزمة ggplot2 في R 4.3.1. تم حساب مؤشرات تنوع مجتمع الميكروبات في التربة باستخدام حزم vegan و picante، وتم تصورها باستخدام R 4.3.1. تم إنتاج خريطة رادارية توضح أداء التحليل متعدد الأهداف لتقييم الوظائف المختلفة لكل دورة زراعية، وتم تصورها باستخدام حزم ggradar. تم استخدام مخطط وردة نايتنجيل لتقييم وظائف كل دورة زراعية، وتم تصورها باستخدام حزمة ggplot2.
النتائج المقدمة في الورقة تم اشتقاقها بشكل أساسي من تجربة ميدانية استمرت 6 سنوات أجريت في محطة أبحاث لوانتشينغ، وهي موقع تمثيلي نموذجي لأنظمة الإنتاج والخصائص البيئية في سهل شمال الصين. ستضمن التجارب متعددة المواقع التأثيرات المكانية والزمانية لدورات المحاصيل المتنوعة على إنتاجية النظام، والتأثيرات البيئية، والأداء الاجتماعي والاقتصادي. علاوة على ذلك، فإن الظروف الجوية بين السنوات متغيرة للغاية، وقد تتفاقم هذه الحالة في المستقبل. وبالتالي، سيكون من المفيد إجراء مراقبة طويلة الأجل في مواقع متعددة لتقليل
عدم اليقين المرتبط بالأحداث الجوية المتطرفة وتغير المناخ.

ملخص التقرير

معلومات إضافية حول تصميم البحث متاحة في ملخص تقارير مجموعة نيتشر المرتبط بهذه المقالة.

توفر البيانات

القراءات الخام من تسلسل إيلومينا الموصوفة في هذه الدراسة متاحة في NCBI تحت رقم الوصول SRR26083954-26083974 (16 S rRNA) و SRR26083997-26084017 (ITS). تم إيداع مجموعة البيانات التي تم إنشاؤها في هذه الدراسة في قاعدة البيانات تحت رمز الوصول على Figshare فيhttps://doi.org/10.6084/m9.figshare.24793563تم توفير بيانات المصدر مع هذه الورقة.

توفر الشيفرة

نصوص الشيفرة المستخدمة في هذه الدراسة متاحة على:https://figshare.com/s/5c07d2ac7c8dc4a5b678.

References

  1. Webb, P. et al. The urgency of food system transformation is now irrefutable. Nat. Food 1, 584-585 (2020).
  2. Gerten, D. et al. Feeding ten billion people is possible within four terrestrial planetary boundaries. Nat. Sustain. 3, 200-208 (2020).
  3. Beerling, D. J. et al. Potential for large-scale removal via enhanced rock weathering with croplands. Nature 583, 242-248 (2020).
  4. Cui, Z. L. et al. Pursuing sustainable productivity with millions of smallholder farmers. Nature 555, 363-366 (2018).
  5. Garnett, T. et al. Sustainable intensification in agriculture: Premises and policies. Science 341, 33-34 (2013).
  6. Gu, B. J. et al. Cost-effective mitigation of nitrogen pollution from global croplands. Nature 613, 77-84 (2023).
  7. National Bureau of Statistics of China. Agriculture. China Statistical Yearbook – 2021. (China Statistics Press, Beijing, China, 2021).
  8. Liu, G., Zhang, F. & Deng, X. Z. Half of the greenhouse gas emissions from China’s food system occur during food production. Commun. Earth Environ. 4, 161 (2023).
  9. Friedlingstein, P. et al. Global carbon budget 2021. Earth Syst. Sci. Data 14, 1917-2005 (2022).
  10. Cumming, G. S. et al. Implications of agricultural transitions and urbanization for ecosystem services. Nature 515, 50-57 (2014).
  11. Marris, E. A world without soil: The past, present, and precarious future of the earth beneath our feet. Nature 601, 503-504 (2022).
  12. Xu, H. G. et al. Ensuring effective implementation of the post-2020 global biodiversity targets. Nat. Ecol. Evol. 5, 411-418 (2021).
  13. Wang, B. et al. Sources of uncertainty for wheat yield projections under future climate are site-specific. Nat. Food 1, 720-728 (2020).
  14. Shi, Y. et al. Building social resilience in North Korea can mitigate the impacts of climate change on food security. Nat. Food 3, 499-511 (2022).
  15. Suweis, S., Carr, J. A., Maritan, A., Rinaldo, A. & D’Odorico, P. Resilience and reactivity of global food security. Proc. Natl Acad. Sci. USA 112, 6902-6907 (2015).
  16. Tilman, D. et al. Future threats to biodiversity and pathways to their prevention. Nature 546, 73-81 (2017).
  17. Chai, Q. et al. Integrated farming with intercropping increases food production while reducing environmental footprint. Proc. Natl Acad. Sci. USA 118, e2106382118 (2021).
  18. Xie, W. et al. Crop switching can enhance environmental sustainability and farmer incomes in China. Nature 616, 300-305 (2023).
  19. Guo, Y. X. et al. Air quality, nitrogen use efficiency and food security in China are improved by cost-effective agricultural nitrogen management. Nat. Food 1, 648-658 (2020).
  20. Lucas, E., Guo, M. & Guillén-Gosálbez, G. Low-carbon diets can reduce global ecological and health costs. Nat. Food 4, 394-406 (2023).
  21. Ray, D. K., Ramankutty, N., Mueller, N. D., West, P. C. & Foley, J. A. Recent patterns of crop yield growth and stagnation. Nat. Commun. 3, 1293 (2012).
  22. Ranganathan, J., Daniels, R. J. R., Chandran, M. D. S., Ehrlich, P. R. & Daily, G. C. Sustaining biodiversity in ancient tropical countryside. Proc. Natl Acad. Sci. USA 105, 17852-17854 (2008).
  23. Crippa, M. et al. Food systems are responsible for a third of global anthropogenic GHG emissions. Nat. Food 2, 198-209 (2021).
  24. Yang, X. L. et al. Diversified crop rotations enhance groundwater and economic sustainability of food production. Food Energy Secur. 10, e311 (2021).
  25. Liu, Z. J. et al. Patterns and causes of winter wheat and summer maize rotation area change over the North China Plain. Environ. Res. Lett. 17, 044056 (2022).
  26. FAO. FAOSTAT. (2023). https://www.fao.org/faostat/en/#data/EM/ visualize, last access: 19 Jul 2023.
  27. Bowles, T. M. et al. Long-term evidence shows that crop-rotation diversification increases agricultural resilience to adverse growing conditions in North America. One Earth 2, 284-293 (2020).
  28. Li, J. X. et al. Diversifying crop rotation improves system robustness. Agron. Sustain. Dev. 39, 38 (2019).
  29. Giller, K. E. The food security conundrum of sub-Saharan Africa. Glob. Food Secur. 26, 100431 (2020).
  30. Hijbeek, R. et al. Do organic inputs matter – a meta-analysis of additional yield effects for arable crops in Europe. Plant Soil 411, 293-303 (2017).
  31. Mhlanga, B., Ercoli, L., Pellegrino, E., Onofri, A. & Thierfelder, C. The crucial role of mulch to enhance the stability and resilience of cropping systems in southern Africa. Agron. Sustain. Dev. 41, 29 (2021).
  32. MacLaren, C. et al. Long-term evidence for ecological intensification as a pathway to sustainable agriculture. Nat. Sustain. 5, 770-779 (2022).
  33. Lin, B. B. Resilience in agriculture through crop diversification: adaptive management for environmental change. BioScience 61, 183-193 (2011).
  34. Robertson, G. P., Paul, E. A. & Harwood, R. R. Greenhouse gases in intensive agriculture: contributions of individual gases to the radiative forcing of the atmosphere. Science 289, 1922-1925 (2000).
  35. Powlson, D. S. et al. Limited potential of no-till agriculture for climate change mitigation. Nat. Clim. Change 4, 678-683 (2014).
  36. Liu, K., Bandara, M., Hamel, C., Knight, J. D. & Gan, Y. T. Intensifying crop rotations with pulse crops enhances system productivity and soil organic carbon in semi-arid environments. Field Crops Res. 248, 107657 (2020).
  37. Chenu, C. et al. Increasing organic stocks in agricultural soils: knowledge gaps and potential innovations. Soil Tillage Res. 188, 41-52 (2019).
  38. Drinkwater, L. E., Wagoner, P. & Sarrantonio, M. Legume-based cropping systems have reduced carbon and nitrogen losses. Nature 396, 262-265 (1998).
  39. Montgomery, D. R. & Biklé, A. Soil health and nutrient density: beyond organic vs. conventional farming. Front. Sustain. Food Syst. 5, 417 (2021).
  40. Guinet, M., Nicolardot, B. & Voisin, A.-S. Nitrogen benefits of ten legume pre-crops for wheat assessed by field measurements and modelling. Eur. J. Agron. 120, 126151 (2020).
  41. Abdalla, M. et al. A critical review of the impacts of cover crops on nitrogen leaching, net greenhouse gas balance and crop productivity. Glob. Change Biol. 25, 2530-2543 (2019).
  42. Olesen, J. E. et al. Challenges of accounting nitrous oxide emissions from agricultural crop residues. Glob. Change Biol. 00, 1-10 (2023).
  43. Gan, Y. T. et al. Improving farming practices reduces the carbon footprint of spring wheat production. Nat. Commun. 5, 5012 (2014).
  44. Ma, B. L., Liang, B. C., Biswas, D. K., Morrison, M. J. & McLaughlin, N. . The carbon footprint of maize production as affected by nitrogen fertilizer and maize-legume rotations. Nutr. Cycl. Agroecosyst. 94, 15-31 (2012).
  45. Karlsson, H., Ahlgren, S., Strid, I. & Hansson, P.-A. Faba beans for biorefinery feedstock or feed? Greenhouse gas and energy balances of different applications. Agric. Syst. 141, 138-148 (2015).
  46. Plaza-Bonilla, D., Nolot, J.-M., Raffaillac, D. & Justes, E. Innovative cropping systems to reduce N inputs and maintain wheat yields by inserting grain legumes and cover crops in southwestern France. Eur. J. Agron. 82, 331-341 (2017).
  47. Roesch-McNally, G. E., Arbuckle, J. G. & Tyndall, J. C. Barriers to implementing climate resilient agricultural strategies: The case of crop diversification in the U.S. Corn Belt. Glob. Environ. Change 48, 206-215 (2018).
  48. Shah, K. K., Modi, B., Pandey, H. P., Subedi, A. & Shrestha, J. Diversified crop rotation: an approach for sustainable agriculture production. Adv. Agric. 2021, 1-9 (2021).
  49. Liang, J. P. & Shi, W. J. Cotton/halophytes intercropping decreases salt accumulation and improves soil physicochemical properties and crop productivity in saline-alkali soils under mulched drip irrigation: a three-year field experiment. Field Crops Res. 262, 108027 (2021).
  50. Hazra, K. K. et al. Diversification of maize-wheat cropping system with legumes and integrated nutrient management increases soil aggregation and carbon sequestration. Geoderma 353, 308-319 (2019).
  51. Mooshammer, M. et al. Microbial feedbacks on soil organic matter dynamics underlying the legacy effect of diversified cropping systems. Soil Biol. Biochem. 167, 108584 (2022).
  52. Dias, T., Dukes, A. & Antunes, P. M. Accounting for soil biotic effects on soil health and crop productivity in the design of crop rotations. J. Sci. Food Agric. 95, 447-454 (2015).
  53. Garbeva, P., Veen, J. A. V. & Elsas, J. D. V. Microbial diversity in soil: Selection of microbial populations by plant and soil type and implications for disease suppressiveness. Annu. Rev. Phytopathol. 42, 243-270 (2004).
  54. Selim, M. M. A review of advantages, disadvantages and challenges of crop rotations. Egypt. J. Agron. 41, 1-10 (2019).
  55. Garland, G. et al. Crop cover is more important than rotational diversity for soil multifunctionality and cereal yields in European cropping systems. Nat. Food 2, 28-37 (2021).
  56. Yang, Y. H. et al. Optimizing crop rotation increases soil carbon and reduces GHG emissions without sacrificing yields. Agric. Ecosyst. Environ. 342, 108220 (2023).
  57. Jarecki, M. et al. Long-term trends in corn yields and soil carbon under diversified crop rotations. J. Environ. Qual. 47, 635-643 (2018).
  58. Baldwin-Kordick, R. et al. Comprehensive impacts of diversified cropping on soil health and sustainability. Agroecol. Sustain. Food Syst. 46, 331-363 (2022).
  59. Chahal, I., Hooker, D. C., Deen, B., Janovicek, K. & Van Eerd, L. L. Long-term effects of crop rotation, tillage, and fertilizer nitrogen on soil health indicators and crop productivity in a temperate climate. Soil Tillage Res. 213, 105121 (2021).
  60. Fang, Q., Zhang, X. Y., Chen, S. Y., Shao, L. & Sun, H. Selecting traits to increase winter wheat yield under climate change in the North China Plain. Field Crops Res. 207, 30-41 (2017).
  61. da Silva, P. C. G. et al. No-tillage and crop rotation increase crop yields and nitrogen stocks in sandy soils under agroclimatic risk. Field Crops Res. 258, 107947 (2020).
  62. Hu, Z. Y. et al. Italian ryegrass-rice rotation system for biomass production and cadmium removal from contaminated paddy fields. J. Soils Sediment. 20, 874-882 (2020).
  63. Song, D. G. et al. Influence of planting distance and density on the yield and photosynthetic traits of sweet potato (Ipomoea balatas L.) under an intercropping system with walnut (Juglans regia) saplings. Soil Tillage Res. 196, 104484 (2020).
  64. Zhao, J. H. et al. The impacts of soil tillage combined with plastic film management practices on soil quality, carbon footprint, and peanut yield. Eur. J. Agron. 148, 126881 (2023).
  65. Liu, X. B. et al. Yield response of continuous soybean to one-season crop disturbance in a previous continuous soybean field in Northeast China. Field Crops Res. 138, 52-56 (2012).
  66. Alam, M. K., Bell, R. W. & Biswas, W. K. Decreasing the carbon footprint of an intensive rice-based cropping system using conservation agriculture on the Eastern Gangetic Plains. J. Clean. Prod. 218, 259-272 (2019).
  67. Wang, S. Q. et al. Diversified crop rotations reduce groundwater use and enhance system resilience. Agric. Water Manag. 276, 108067 (2023).
  68. Groot, J. C. J. & Yang, X. L. Trade-offs in the design of sustainable cropping systems at a regional level: a case study on the North China Plain. FASE 9, 14 (2022).
  69. Zheng, X. H. et al. Quantification of fluxes from soil-plant systems may be biased by the applied gas chromatograph methodology. Plant Soil 311, 211-234 (2008).
  70. Huang, J. X., Chen, Y. Q., Sui, P. & Gao, W. S. Estimation of net greenhouse gas balance using crop- and soil-based approaches: Two case studies. Sci. Total Environ. 456-457, 299-306 (2013).
  71. IPCC. Climate change 2021: The physical science basis. Contribution of working group i to the sixth assessment report of the intergovernmental panel on climate change. (ed. Masson-Delmotte, V. P. Z. A.) (Cambridge University Press, Cambridge, United Kingdom and New York, NY, USA, 2021). https://www.ipcc.ch/report/sixth-assessment-report-working-group-i/.
  72. Mclean, E. O. Soil pH and Lime Requirement. in Methods of Soil Analysis: Part 2 Chemical and Microbiological Properties, 9.2.2, Second Edition (ed. Page, A. L.) 199-224 (American Society of Agronomy, Inc. and Soil Science Society of America, Inc., Madison, Wisconsin, USA, 1982).
  73. Bremner, J. M. & Shaw, K. Denitrification in soil. I. Methods. Investig. J. Agric. Sci. 51, 22-39 (1958).
  74. Ladd, J. N. & Amato, M. Relationship between microbial biomass carbon in soils and absorbance ( 260 nm ) of extracts of fumigated soils. Soil Biol. Biochem. 21, 457-459 (1989).
  75. Bremner, J. M. Inorganic forms of nitrogen. in Methods of Soil Analysis: Part 2 Chemical and Microbiological Properties (ed. Norman, A. G.) 1179-1237 (American Society of Agronomy Madison, 1965).
  76. Olsen, S. R. & Sommers, L. E. Phosphorus. in Methods of Soil Analysis: Part 2 Chemical and Microbiological Properties, 9.2.2, 2nd Edition (ed. Page, A. L.) 403-430 (American Society of Agronomy, Inc. and Soil Science Society of America, Inc., 1982).
  77. Harris, D., Horwáth, W. R. & van Kessel, C. Acid fumigation of soils to remove carbonates prior to total organic carbon or CARBON-13 isotopic analysis. Soil Sci. Soc. Am. J. 65, 1853-1856 (2001).
  78. Grossman, R. B. & Reinsch, T. G. 2.1 Bulk density and linear extensibility. in Methods of Soil Analysis: Part 4 Physical Methods (eds. Dane, J. H. & Topp, G. C.) 201-228 (Soil Science Society of America, Inc., 2002).
  79. Caporaso, J. G. et al. QIIME allows analysis of high-throughput community sequencing data. Nat. Methods 7, 335-336 (2010).
  80. Edgar, R. C. UPARSE: Highly accurate OTU sequences from microbial amplicon reads. Nat. Methods 10, 996-998 (2013).
  81. Gugino, B. K. et al. Cornell Soil Health Assessment Training Manual, Edition 1.2, (Cornell University Press, Cornell University, 2007).
  82. Idowu, O. J. et al. Farmer-oriented assessment of soil quality using field, laboratory, and VNIR spectroscopy methods. Plant Soil 307, 243-253 (2008).
  83. Moebius-Clune, B. N. et al. Comprehensive Assessment of Soil Health – The Cornell Framework, Edition 3.2, (Cornell University Press, Cornell University, 2016).
  84. Chang, T. T., Feng, G., Paul, V., Adeli, A. & Brooks, J. P. Chapter Three – Soil health assessment methods: Progress, applications and comparison. in Adv. Agron., Vol. 172 (ed. Sparks, D. L.) 129-210 (Academic Press, 2022).
  85. Congreves, K. A., Hayes, A., Verhallen, E. A. & Van Eerd, L. L. Longterm impact of tillage and crop rotation on soil health at four temperate agroecosystems. Soil Tillage Res. 152, 17-28 (2015).
  86. Wang, H. D. et al. Multi-objective optimization of water and fertilizer management for potato production in sandy areas of northern China based on TOPSIS. Field Crops Res. 240, 55-68 (2019).
  87. Chen, Y., Zhu, M. K., Lu, J. L., Zhou, Q. & Ma, W. B. Evaluation of ecological city and analysis of obstacle factors under the background of high-quality development: Taking cities in the Yellow River Basin as examples. Ecol. Indic. 118, 106771 (2020).
  88. Liu, X. G., Peng, Y. L., Yang, Q. L., Wang, X. K. & Cui, N. B. Determining optimal deficit irrigation and fertilization to increase mango yield, quality, and WUE in a dry hot environment based on TOPSIS. Agric. Water Manag. 245, 106650 (2021).
  89. Delgado, A. & Romero, I. Environmental conflict analysis using an integrated grey clustering and entropy-weight method: A case study of a mining project in Peru. Environ. Modell. Softw. 77, 108-121 (2016).
  90. Chen, C. W., Wang, J. H., Wang, J. C. & Shen, Z. H. Developing indicators for sustainable campuses in Taiwan using fuzzy Delphi method and analytic hierarchy process. J. Clean. Prod. 193, 661-671 (2018).
  91. R Core Team. R: A language and environment for statistical computing. in Computing (R foundation for statistical computing, Vienna, Austria, 2014).

شكر وتقدير

نشكر J.Z. و N.Q. و P.H. و F.L. و Y.C. و R.C. من جامعة الزراعة الصينية على مساهماتهم في العمل الميداني، والدكتور Y.S. على مساعدته في تحليل تنوع الميكروبات في التربة. تم تمويل هذا العمل بشكل مشترك من قبل المؤسسة الوطنية للعلوم الطبيعية في الصين (رقم المنحة 32071975 لـ X.Y.، 52239002 لـ T.D. و 41830751 لـ X.J.)، وبرنامج البحث والتطوير الرئيسي في مقاطعة خبي في الصين (20326411D-1 لـ X.Y.) ومركز بايونير للبحث في المستقبل الزراعي المستدام (LandCRAFT) (رقم منحة DNRF P2 لـ K.B.B.).

مساهمات المؤلفين

صمم X.Y. و S.K. و T.D. و X.J. الدراسة. صمم X.Y. التجربة الميدانية. سهل X.Y. و J.X. و S.L. و L.X. و Y.S. جمع البيانات. قام X.Y. و J.X. و X.J. و K.B.B. بتحليل البيانات. كتب X.Y. و X.J. و K.B.B. و Y.G. و K.H.M.S. المخطوطة. قام Y.G. و K.H.M.S. و S.P. و T.S.S. بتحسين وتنقيح الكتابات. ناقش جميع المؤلفين النتائج وساهموا في المخطوطة النهائية.

المصالح المتنافسة

يعلن المؤلفون عدم وجود مصالح متنافسة.

معلومات إضافية

معلومات إضافية النسخة الإلكترونية تحتوي على
المواد التكميلية متاحة على
https://doi.org/10.1038/s41467-023-44464-9.
يجب توجيه المراسلات والطلبات للحصول على المواد إلى شياولين يانغ، تايشينغ دو، شياوتانغ جو أو يانتاي غان.
معلومات مراجعة الأقران تشكر مجلة Nature Communications باوجينغ غو، روبرت ريس وفينغ زو على مساهمتهم في مراجعة هذا العمل. يتوفر ملف مراجعة الأقران.
معلومات إعادة الطباعة والتصاريح متاحة على
http://www.nature.com/reprints
ملاحظة الناشر: تظل شركة سبرينغر ناتشر محايدة فيما يتعلق بالمطالبات القضائية في الخرائط المنشورة والانتماءات المؤسسية.
الوصول المفتوح هذه المقالة مرخصة بموجب رخصة المشاع الإبداعي النسب 4.0 الدولية، التي تسمح بالاستخدام والمشاركة والتكيف والتوزيع وإعادة الإنتاج بأي وسيلة أو صيغة، طالما أنك تعطي الائتمان المناسب للمؤلفين الأصليين والمصدر، وتوفر رابطًا لرخصة المشاع الإبداعي، وتوضح إذا ما تم إجراء تغييرات. الصور أو المواد الأخرى من طرف ثالث في هذه المقالة مشمولة في رخصة المشاع الإبداعي الخاصة بالمقالة، ما لم يُشار إلى خلاف ذلك في سطر الائتمان للمواد. إذا لم تكن المادة مشمولة في رخصة المشاع الإبداعي الخاصة بالمقالة وكان استخدامك المقصود غير مسموح به بموجب اللوائح القانونية أو يتجاوز الاستخدام المسموح به، فستحتاج إلى الحصول على إذن مباشرة من صاحب حقوق الطبع والنشر. لعرض نسخة من هذه الرخصة، قم بزيارةhttp://creativecommons.org/رخصة/بواسطة/4.0/.
© المؤلفون 2024

  1. المختبر الوطني الرئيسي للاستخدام الفعال لموارد المياه الزراعية، بكين 100083، الصين. كلية موارد المياه والهندسة المدنية، جامعة الزراعة الصينية، بكين 100083، الصين. مدرسة الزراعة والغابات الاستوائية، جامعة هاينان، هايكو 570228، الصين. كلية علوم الحياة والبيئة، جامعة ونتشو، ونتشو، تشجيانغ 325035، الصين. الـ مجموعة BC للتربة، مرتفعات تالوس، كيلونا، كولومبيا البريطانية، كندا. المختبر الوطني الرئيسي للتربة والزراعة المستدامة، معهد علوم التربة، الأكاديمية الصينية للعلوم، نانجينغ 210008، الصين. المختبر الرئيسي لموارد المياه الزراعية، مركز أبحاث الموارد الزراعية، معهد الوراثة وعلم الأحياء التنموي، الأكاديمية الصينية للعلوم، شيجياتشوانغ 050022، الصين. قسم الهندسة البيولوجية والبيئية، قاعة رايلي-روب، جامعة كورنيل، إيثاكا، نيويورك 14853، الولايات المتحدة الأمريكية. معهد الزراعة بجامعة أستراليا الغربية، جامعة أستراليا الغربية، بيرث، WA 6001، أستراليا. لاند-كرافت، قسم الزراعة البيئية، جامعة آرهوس، آرهوس، الدنمارك. معهد الأرصاد الجوية وبحوث المناخ، بحوث البيئة الجوية (IMK-IFU)، معهد كارلسروه للتكنولوجيا (KIT)، غارميش-بارتنكيرشن، ألمانيا. البريد الإلكتروني:yangxiaolin429@cau.edu.cn; دوتايسينغ@cau.edu.cn; juxt@cau.edu.cn; gary.gan@wzu.edu.cn

Journal: Nature Communications, Volume: 15, Issue: 1
DOI: https://doi.org/10.1038/s41467-023-44464-9
PMID: https://pubmed.ncbi.nlm.nih.gov/38172570
Publication Date: 2024-01-03

Diversifying crop rotation increases food production, reduces net greenhouse gas emissions and improves soil health

Received: 4 September 2023
Accepted: 14 December 2023
Published online: 03 January 2024
(A) Check for updates

Xiaolin Yang , Jinran Xiong , Taisheng Du , Xiaotang Ju (B ) , Yantai Gan © , Sien , Longlong Xia (i) , Yanjun Shen (i) , Steven Pacenka © , Tammo S. Steenhuis , Kadambot H. M. Siddique (1) , Shaozhong Kang © & Klaus Butterbach-Bahl

Abstract

Global food production faces challenges in balancing the need for increased yields with environmental sustainability. This study presents a six-year field experiment in the North China Plain, demonstrating the benefits of diversifying traditional cereal monoculture (wheat-maize) with cash crops (sweet potato) and legumes (peanut and soybean). The diversified rotations increase equivalent yield by up to , reduce emissions by , and improve the system’s greenhouse gas balance by . Furthermore, including legumes in crop rotations stimulates soil microbial activities, increases soil organic carbon stocks by 8%, and enhances soil health (indexed with the selected soil physiochemical and biological properties) by . The large-scale adoption of diversified cropping systems in the North China Plain could increase cereal production by when wheat-maize follows alternative crops in rotation and farmer income by while benefiting the environment. This study provides an example of sustainable food production practices, emphasizing the significance of crop diversification for long-term agricultural resilience and soil health.

Producing more nutritious food to alleviate world hunger while safeguarding the environment is a significant challenge for humanity. The challenge is much pronounced in highly-populated countries and regions where agricultural resources are limited. Conventional intensified food production systems’ reliance on major inputs of synthetic agrochemicals, such as fertilizers and pesticides, have boosted food production significantly since the ‘Green Revolution’, but these
systems have also emitted great amounts of greenhouse gases (GHG) and caused environmental degradation . For instance, China’s crop production has increased by 74% in the past 30 years (1986-2016), but this came with a increase in synthetic fertilizer use . In 2019, China’s GHG emissions associated with food production reached 2.4 -equivalent ( -eq) , with about emitted during the crop production stage . The loss of soil fertility which may go along
with the intensification of crop production further complicates food production and exposes it to climate risks and environmental health concerns .
Innovative concepts like integrated farming systems with diversified crop rotations have emerged to address these food production and environmental sustainability challenges. These systems offer a range of food crops to meet consumer demand for plant-based, healthy food -an increasing dietary trend in high and upper-middleincome countries -while providing other agricultural products such as animal feed, industrial fiber, or multi-purpose biofuels . Moreover, integrated food production systems help increase farmers’ income and deliver socio-economic benefits . However, little is known about how cash-crop and legume-diversified cropping systems can achieve the triple goals-increasing food yields, reducing environmental footprint, and benefiting soil health.
In this context, we conducted a 6-year (2016-2022) field study in the North China Plain-the food basket of China-one of the most intensively cultivated regions in the world, where crop production is dominated by simple winter wheat (Triticum aestivum L.) and summer maize (Zea mays L.) double cropping (wheat-maize, WM; two crops 1 year) which occupies of the area’s arable land, delivering about of China’s total cereal food . The specific objective of the case study was to asses comprehensively several diversified cropping systems in terms of food production, GHG balance, soil health benefits, and farmers’ income. We tested various diversified cropping systems, incorporating cash-crops, legumes, other cereals, or forages into the conventional wheat-maize system. Major performance metrics investigated were: (i) plant biomass, grain and protein yields, and farmers’ net incomes; (ii) soil GHG fluxes, soil carbon (C) sequestration, and net GHG emissions; and (iii) soil health parameters including soil pH, bulk density, soil water content, total nitrogen (TN), dissolved organic carbon (DOC), soil nitrate-N ( ), ammonium- ,
available phosphorus (AP), microbial biomass carbon (MBC), microbial biomass nitrogen (MBN), and microbial community composition and diversity. These measurements enabled us to test the hypotheses that (a) cash-crop diversified system increases farmers’ net income without jeopardizing crop yields, (b) legume diversified systems reduce field scale GHG emissions, and (c) integrating diversified rotations increases food production, reduces GHG emissions, and benefits soil health (Fig. 1). Our results demonstrate that (a) instructive findings from newly designed, tested, and validated diversified systems could guide the North China Plain in establishing a more sustainable system to maintain or increase grain and protein production with reducing the damage to the environment and soil ecosystems, and (b) the results from such a representatively intensive food producing region may provide a guide for the countries/regions with similar agricultural environments to follow on an expanded scale.

Results

Diversified crop rotations increase ecosystem productivity

The food crops evaluated in the study are from different genera families; thus, the yield of each crop was converted to the ‘equivalent’ product yield to wheat for a compatible comparison (detailed in Methods). The sweet potato (Ipomoea batatas L.) winter wheat-summer maize rotation (SpWM) increased the annual equivalent yield by 38% compared to the conventional winter wheat-summer maize double-cropping which yielded annually (Fig. 2a). Rotations diversified with sweet potato (SpWM), peanut (Arachis hypogea L.) (PWM), or soybean (Glycine max L.) (SWM) significantly increased the annual economic benefit (net income) compared to the winter wheat-summer maize control (Fig. 2b), with sweet potato winter wheat-summer maize rotation increasing , and peanut winter wheat-summer maize rotation and soybean winter wheat-summer maize rotation increasing by 13-22% ( ). Protein
Fig. 1 | Schematic illustration of system integration from issues to outcomes. In the North China Plain-the case study area, traditional cereal monoculture (such as wheat-maize double-cropping, i.e., two cereal crops per year) requires inputs of synthetic agrichemicals and irrigation in food production, causing large greenhouse gas (GHG) emissions; in contrast, rotation systems diversified with cash and
legume crops can maintain crop yields, increase farmers’ income, and reduce GHG emissions due to the biological fixation by legumes partly substituting for synthetic N inputs. Legume-included rotations can also enhance soil health by stimulating soil microbial activities, increasing carbon sequestration, and enhancing nutrient cycles.
Fig. 2 | Agroecosystem productivity. The entire rotation system productivity: equivalent yield to wheat, economic benefit – net income, and protein yield. The productivity of WM preceded by alternative crops in rotation: annual grain yield, e economic benefit, and protein yield. In , the black bar within violin plots shows the 25 and 75 percentiles, the whiskers beyond the bar represent 95 and 5 percentiles, and the inner white dot indicates the median. The violin shaped area reveals the data distribution. The dashed lines in are the baseline values of the WM rotation, and the error bars are the standard deviation of annual value summed over winter wheat and summer maize. In a-f, one-way ANOVA with two-sided and post-hoc test was conducted to determine significant differences. Different
lowercase letters denote significant differences between the rotations at . The exact values: in in in and in . In and Chinese Yuan (as of May, 2023). For . Treatment abbreviations: WM winter wheat-summer maize (control case), SpWM sweet potato winter wheat-summer maize rotation, PWM peanut winter wheat-summer maize rotation, SWM soybean winter wheat-summer maize rotation, SmWM spring maize winter wheat-summer maize rotation, RSWM ryegrass-sorghum winter wheat-summer maize rotation. Source data are provided as a Source Data file.
yield varied among the rotation systems, with ryegrass (Lolium multiflorum L.)-sorghum (Sorghum bicolor L.) rotation (RSWM) and soybean winter wheat-summer maize rotation having the highest protein yields at 2274 and , respectively, being higher than winter wheat-summer maize rotation (Fig. 2c). The ryegrass-sweet sorghum winter wheat-summer maize rotation, with four crops in 2 years, produced the most aboveground biomass for livestock, while the soybean winter wheat-summer maize rotation produced the most protein for human nutrition. In contrast, an entirely cereal-based system (i.e., spring maize winter wheat-summer maize rotation, SmWM) decreased equivalent yield by and protein yield by compared to the winter wheat-summer maize control.
The preceding crops in rotation significantly affected grain yield (Fig. 2d), net income (Fig. 2e), and protein yield (Fig. 2f) of the succeeding winter wheat-summer maize crops as the rotation continued. The diversified crop rotations with sweet potato, peanut, and soybean had a positive carryover effect on the productivity of the succeeding winter wheat and summer maize. On average, winter wheat-summer maize preceded by non-cereal crops in rotation showed increased grain yield, economic benefit, and protein yield by , and , respectively, as compared to the winter wheat-summer maize cereal monoculture.

Diversified crop rotations reduce net GHG emissions

The amounts of supplementary irrigation and fertilizers applied to each rotation varied among them, as did the and emissions measured weekly from October 2016 to October 2022 (Supplementary Figs. S1-2). The diversified crop rotations significantly reduced annual cumulative emissions compared to the wheat-maize
control which was at (Table S1, Fig. 3a), decreasing by , and in the peanut wheat-maize rotation, soybean wheat-maize rotation, and sweet potato wheat-maize rotation, respectively. These rotations with peanut, soybean, and sweet potato received a reduced dosage of N fertilizer as compared to the wheat-maize control (Table S1). The soils of all crop rotations, including wheat-maize, acted as net sinks for atmospheric . However, the diversified crop rotations increased the sink strength by above wheat-maize (Fig. 3b). The wheat-maize control had the highest annual global warming potential (GWP) for soil and fluxes ( , Fig. 3c). The cereal-including rotations (ryegrass-sweet sorghum wheat-maize rotation and spring maize wheat-maize rotation) had and , respectively, lower GWPs than wheat-maize rotation, while the rotations including legumes (peanut, soybean) or sweet potato had , and , respectively, lower GWPs than wheat-maize rotation. Besides fieldscale direct GHG emissions, indirect GHG emissions associated with the use of agrochemicals and irrigation were highest for wheat-maize rotation ( ) and lower for rotations with sweet potato, peanut, soybean and spring maize (Fig. 3d).
The soil carbon stocks (SOC) in the layer significantly increased from 2016 to 2022 for all treatments, but the magnitude of the change differed among rotation systems. Six years after the initiation of the experiment (in 2022), the peanut wheat-maize rotation had the highest soil C sequestration ( ), followed by soybean wheat-maize ( ) and sweet potato wheat-maize ( ), while ryegrass-sweet sorghum wheat-maize, spring maize wheat-maize rotation, and wheat-maize rotations had significantly lower C sequestration rates ( ) (Fig. 3e). Soil C sequestration offset total GHG
Fig. 3 | Direct and indirect greenhouse gas (GHG) emissions in the diversified crop rotations. a Annual mean emissions; emissions; c GWP ; d indirect GHG emissions; e changes in soil carbon stock in the depth; net GHG emissions. In a-c, diamond box plots show triangles spanning 25 and 75 percentiles meeting at the median. Small squares indicate means. Whisker lines extend to the minimum and maximum. In and , error bars in each column represent the standard deviation of whole-profile sums of three replicates. In , and , one-way ANOVA with two-sided and post-hoc test was conducted for statistical significance; different lowercase letters denote significant differences
between the rotations at . The exact values: in and . In , ** denotes significant changes in soil carbon stock in the soil layer between 2016 and 2022 at ( for SpWM, for PWM and SWM). Treatment abbreviations: WM winter wheat-summer maize (control case), SpWM sweet potato winter wheat-summer maize rotation, PWM peanut winter wheat-summer maize rotation, SWM soybean winter wheat-summer maize rotation, SmWM spring maize winter wheat-summer maize rotation, RSWM ryegrass-sorghum winter wheat-summer maize rotation. Source data are provided as a Source Data file.
emissions by in the rotations with sweet potato, peanut, and soybean and in the spring maize wheat-maize, ryegrass-sweet sorghum wheat-maize and wheat-maize rotations (Fig. 3f). Consequently, wheat-maize rotation had the largest net GHG emissions totaling , and the diversified rotations with sweet potato, soybean and peanut lowered net GHG emissions by , , and , respectively, as compared to wheat-maize ( ).

Diversified crop rotations enhance soil health and microbial diversity

Soil health is often disregarded in the assessment of food crop production systems. In the present study, we used the Cornell Soil Health Assessment (CSHA) scoring method and applied Principal Component Analysis (PCA) to evaluate how crop diversification influenced soil health. A soil health score was calculated for each rotation based on key indicators (detailed in Methods). The PCA revealed that the first two principal components accounted for of the cumulative percent variability ( and ) in soil health (Fig. 4a), with the measured soil health indicators clustered in distinct groups. At the end of the 6-year study, the peanut wheat-maize rotation had the highest soil health score (59.5), followed by soybean wheat-maize rotation (56.8) and sweet potato wheat-maize rotation (52.9) (Fig. 4b), being 41-59% higher than wheat-maize (33.2).
A closer examination of the soil indicators that contributed to soil health scores revealed that the soil in the peanut wheat-maize rotation had a 6.5% higher SOC concentration and higher dissolved organic carbon (DOC) but lower total N and lower available P (AP) concentration than wheat-maize (Fig. S3). These changes were due to reduced N fertilizer ( ) and associated higher nutrient use efficiencies by crops in the diversified rotations. The ryegrass-sweet
sorghum wheat-maize rotation had the lowest SOC and DOC due to the removal of forage for silage during the growing season, which stimulated soil microbial activity, leading to the highest MBC (Fig. S3).
Soil microbial community composition and diversity-an indicator of the biological mechanism of soil health-were determined in 2016 and 2022 to evaluate the cumulative changes after 6 years’ rotational experimentation. It showed that the diversification of crop rotations had positive effects (Fig. 5). For example, the Shannon index -a popular index for quantifying microorganism diversity taking into account the number of species and relative abundance of each species in a sample-significantly increased by in the rotations with sweet potato, peanut, and soybean rotations, but did not change in wheat-maize or the graminaceous crop-based spring maize wheat-maize and ryegrass-sweet sorghum wheat-maize systems from 2016 to 2022 (Fig. 5a). Inclusion of the legumes peanut or soybean in rotations increased bacterial community operational taxonomic units (OTU) richness (Fig. S4a-f) and fungal community Shannon index, Chao 1, and OTU richness ( ) compared to wheat-maize (Fig. S4g-I). Many of the soil health indicators are dynamic and may change weekly, seasonally, or annually. However, after 6 years of ‘rotation nourishment,’ soils in the rotations with sweet potato, peanut, and soybean had significantly higher values for Chao 1, abundance-based coverage estimator (ACE), and community richness, compared to the cereal monoculture spring maize wheat-maize system (Fig. 5b-d).
Redundancy analyses, depicting the association of soil physiochemical properties and crop rotations in the bacterial (Fig. 5e) and fungal (Fig. 5f) communities, found that the first two sets of components explained (bacterial) and (fungal) of the total variation in the two communities, respectively. The relationship was
complex, but it was evident that bacterial and fungal community composition changed from 2016 to 2022. The rotations with sweet potato, peanut, and soybean had distinct bacterial community compositions from the other three systems (Fig. 5e), whereas the five studied diversified rotations had fungal community compositions distinctly different from the wheat-maize control (Fig. 5f). The 6 years of rotational nourishment affected soil physiochemical properties interactively with soil microbial communities. The rotations with sweet potato, peanut, and soybean bacterial communities were closely associated with SOC and AP, whereas those of wheat-maize, spring maize wheat-maize, and ryegrass-sweet sorghum wheat-maize rotations were closely associated with TN and microbial biomass carbon (MBC). In contrast, the rotations with sweet potato, peanut, and soybean fungal communities were associated with SOC, pH, and DOC.

Multiple functions assessments of diversified crop rotations

We used the comprehensive evaluation index concept (CEI) to assess the synergies and trade-offs of the different crop rotations related to yield, nutritional value, soil-related indicators (health, C sequestration, microbial biodiversity), net GHG emissions, and economic benefit (Eqs. 11-20 in Methods) (Fig. 6a, d). The results showed that the wheat-maize rotation had the lowest value, averaging 0.19 (Fig. 6b), while the sweet potato wheat-maize rotation had the highest CEI value of 0.81 , followed by peanut wheat-maize rotation of 0.75 , and soybean wheat-maize rotation of 0.69 . The diversified rotations with sweet potato, peanut, and soybean had values more than triple relative to wheat-maize and were significantly higher than the cereal-based spring maize wheat-maize and ryegrass-sweet sorghum wheat-maize rotations (0.25-0.29). Significant relationships occurred among the key indicators across the rotation systems (Fig. 6c). Soil health was positively corelated with crop yield ( ), economic benefits ( ), and nutrition score ( ), but was negatively correlated with net GHG emissions ( ). Soil health was also positively correlated with soil carbon sequestration ( ) and soil biodiversity ( ), contributing substantially to the tradeoff against net GHG emissions ( ).
Fig. 4 | Soil health assessment for different rotation systems. a Principal component analysis (PCA) for eigenvalues of the ten key soil properties, including soil organic carbon (SOC), dissolved organic carbon (DOC), total nitrogen (TN), , available P (AP), pH, microbial biomass N (MBN), microbial biomass carbon (MBC), bulk density (BD), and soil water content (SWC). Each soil property was normalized as an individual CSHA (Cornell Soil Health Assessment) contributor to the overall soil health score. CSHA score for each rotation. In , the whiskers in each column represent the standard deviation of three replications; circles are the corresponding data points for the bar chart, . One-way ANOVA with two-sided and post-hoc test was conducted for the significance test among different treatments.

Discussion

The empirical evidence from the 6-year field experiment demonstrated significant positive impacts of diversified crop rotations on various agroecosystem functions and services. Based on the study’s findings and double-cropping planted area , we estimated that diversified cropping systems could reduce net -eq emissions by million tonnes annually, offsetting of the annual GHG emissions associated with China’s food system ( 1.9 billion tonnes in 2020 reported by ). The primary reason behind this reduction is the decrease in synthetic N fertilizer use by 3.6 million tonnes. Farmers in the North China Plain region could benefit from 20% increases in annual net income, equivalent to 84 billion Yuan ( US billion) in total. Moreover, these diversified rotations will increase Cornell Soil Health Assessment scores by , due to increased C sequestration rates compared to the winter wheat-summer maize rotation. Furthermore, wheat and maize yields may increase by , equivalent to 73.5 million tonnes per year if planted following alternative crops such as sweet potato, soybean or peanuts; this would make about 36.1 million tonnes of additional straw biomass available annually for alternative uses, such as feed, bioenergy, or enhancing soil carbon stocks.
The three-dimensional benefits (grain and protein yields, GHG emissions, and soil health) of crop diversification in the winter wheat-summer maize rotation system on the North China Plain will add significant ‘social novelty’ to the challenge of bringing essential food nutrients to dining tables without adversely affecting soil health. The social novelty is far beyond the agricultural benefits of crop diversification that are broadly recognized worldwide. For example, long-term studies in North America show that rotational diversification increases crop yields, reduces the impact of adverse weather on ecosystem productivity , and enhances system robustness . Studies in Europe and Africa demonstrate that field-scale diversity has a substitutive interaction with fertilization leading to increased yields at low N fertilizer doses . Several Chinese studies implementing crop diversification in various forms or scales show that farmers can adopt multiple strategies to increase farming resilience and economic
Different lowercase letters denote significantly different groups of crop rotations at . The red dashed line with red percentages is the baseline of the WM rotation. The black dashed line with black percentages is the baseline of 2016. Treatment abbreviations: WM winter wheat-summer maize (control case), SpWM sweet potato winter wheat-summer maize rotation, PWM peanut winter wheat-summer maize rotation, SWM soybean winter wheat-summer maize rotation, SmWM spring maize winter wheat-summer maize rotation, RSWM ryegrass-sorghum winter wheat-summer maize rotation. Source data are provided as a Source Data file.
Fig. 5 | Soil microbe community diversity and soil properties in response to rotation. a Shannon Index; b Chao 1; c ACE index; d OTU richness measured in the six crop rotations from 2016 to 2022; e Redundancy analysis (RDA) of bacterial OTU and soil properties; RDA of fungal OTU and soil properties. The percentage values in a-d represent the increment from 2016 to 2022; dot is the mean value, whisper line bars on each dot are the standard deviations for three replications. In a-d, oneway ANOVA with two-sided and post-hoc test was conducted to determine significant differences among treatments. Different lowercase letters below pillars indicate significant differences between rotations at . Charts and show redundancy analysis with colored dots and triangles indicating rotation, vectors

indicating soil properties including soil organic carbon (SOC), dissolved organic carbon (DOC), total nitrogen (TN), available P (AP), pH, microbial biomass carbon (MBC), microbial biomass N (MBN), and the MBC to MBN ratio. Treatment abbreviations: WM winter wheat-summer maize (control case), SpWM sweet potato winter wheat-summer maize rotation, PWM peanut winter wheat-summer maize rotation, SWM soybean winter wheat-summer maize rotation, SmWM spring maize winter wheat-summer maize rotation, RSWM ryegrass-sorghum winter wheat-summer maize rotation. Source data are provided as a Source Data file.
Fig. 6 | Comprehensive assessments of the different rotation systems. a radar map of multiple objective analysis to assess the various functions of the rotations; b comprehensive evaluation index (CEI, Eqs. 15-24 in Method, supplementary material); c synergy and trade-off relationship among the key variables across the different crop rotations; d, Nightingale Rose Charts of multiple objectives analysis to assess the detailed functions 1for each crop rotation. In , values are normalized. , positive variables, (-), negative variables. Equivalent yield re-expresses crop yield as equivalent to the grain yield of wheat; Economic benefit denotes the crop yield multiplied by its market price minus consumable cost; Nutrition yield includes 17 nutritional components of each crop such as crude protein, fat content, macroand micro-elements, and vitamins . Soil carbon sequestration denotes changes in
soil carbon stock in the 0-90 cm layer from October 2016 to October 2022; Net GHG emissions denotes the net GHG budgets including direct and indirect GHG emissions minus soil carbon sequestration; Soil biodiversity is represented by the Shannon Index of bacterial and fungal communities; Soil health score is calculated from 10 indicators using the overall Cornell Soil Health Assessment (CSHA) matrix combined with PCA . Treatment abbreviations: WM winter wheat-summer maize (control case), SpWM sweet potato winter wheat-summer maize rotation, PWM peanut winter wheat-summer maize rotation, SWM soybean winter wheat-summer maize rotation, SmWM spring maize winter wheat-summer maize rotation, RSWM ryegrass-sorghum winter wheat-summer maize rotation. Source data are provided as a Source Data file.
benefits . Overall, cropping diversification offers a comprehensive systems’ approach to enhance agroecosystem productivity and adaptability to changing climates worldwide.
A major factor in designing diversified cropping systems is to ensure an increase in soil C sequestration-as this plays a crucial role for soi health, in climate change mitigation and achieving C neutrality . We found that the diversified rotations with sweet
potato, peanut and soybean significantly increased soil C after 6 years of rotation nourishment compared to the traditional winter wheat-summer maize double-cropping system. Introducing sweet potatoes and legumes into these rotations has been shown to stimulate microbial growth, increased C use efficiency , and promoted the formation of highly stable mineral-associated soil C complexes . Labile litter compounds from these rotational crops are the dominant
source of microbial products that affect stable SOC with a high capacity for C stabilization . Furthermore, our findings highlight a close correlation between soil health and nutrition yield, underscoring the interconnectedness of both dimensions and their reliance on agricultural practices .
A noteworthy aspect of the study is that we measured SOC concentrations to 90 cm depth. Researchers often focus on topsoil layers when studying SOC status, potentially masking some treatment effects, especially in crops with different root masses at various soil depths. We found that SOC in the soil layer accounted for of the total SOC, layer accounted for , and layer accounted for . Our results highlight the importance of subsoil C stocks when assessing soil C storage for a more precise estimation of the contributions of soil C sequestration in mitigating climate change.
Lowering GHG emissions without reducing crop yields is a major challenge for global agriculture. We found that the legume-based (peanut wheat-maize, soybean wheat-maize) rotations significantly reduced emissions by compared to the conventional cereal-based wheat-maize rotation while significantly increasing system productivity (grain and protein yields). Legume crops improve soil N cycling , but may also increase emissions, specifically following residue incorporation . However, legume cultivation requires significantly less fertilizer than cereal crops such as maize or wheat. Therefore, the legume-based rotations with peanut and soybean required 37% less fertilizer than conventional wheat-maize, explaining the overall reduction in emissions for the legume-based rotations as N fertilizers were the main source of emissions in our study . The manufacture of inorganic N fertilizer remained the most significant contributor to total GHG emissions (about 36-39%). Similarly, we found that the diversified rotations with sweet potato, soybean, and peanut significantly reduced net GHG emissions by 75-92% compared to the wheat-maize, spring maize wheat-maize, and ryegrass-sweet sorghum wheat-maize systems. In a study in Western Canada, cereals rotated with legumes decreased net GHG emissions by 17-35% compared to cereal monocultures due to improved N uptake associated with organic N mineralization released from legume residues . In Europe, increasing legume production by introducing legumes into cereal rotations effectively improved plant-based protein while reducing environmental impacts . In the US corn belt, diversified maize and soybean systems maintained or increased maize yields while reducing N losses to the environment .
Introducing shallow-rooted crops like sweet potato and annual legumes in rotation with deep-rooted crops such as winter wheat enables the use of soil nutrients across the entire rooting zone, improving nutrient use efficiency and reducing soil nutrient losses through leaching. Alternating deep- and shallow-rooted crops also enhances root distribution, increases soil porosity and permeability, reduces soil bulk density , and improves soil aggregate stability to anchor . Furthermore, diversified crop mixtures alter the quality and quantity of organic matter entering the soil as plant litter, enhancing the stabilization of microbial-derived compounds that provide positive feedback for plant growth. The distinct microbial communities associated with diverse crop mixtures can promote soil C cycling . In our study, diversified legume-cereal and sweet potato-cereal rotations significantly increased the -diversity of soil bacterial and fungal communities after 6 years of rotation. The increased fungal diversity resulted from a higher number of species, while the increased Shannon’s diversity index in the bacterial community resulted from changes in the relevant abundance of certain species. Diverse crops stimulate bacterial community activities in the rhizosphere , as the residue root exudates and plant litter from rotational crops provide a greater diversity of residue carbon substrates, supporting the growth of diverse soil microorganisms . We found that the rotations with sweet potato, peanut, and soybean significantly
increased fungal community diversity compared to winter wheat-summer maize, shaping soil nutrient profiles with different carbon substrates that impacted microbial diversity. Moreover, diversified crop rotations potentially reduce soil agrochemical contamination due to decreased application of synthetic N fertilizer and herbicides, favoring soil microenvironments . Other studies have demonstrated the positive influence of diversified rotations on soil health. Maize yields and SOC content in diversified rotations were more resilient than those found in monoculture , potentially increasing adaptability to climate change . Diversified agroecosystems are considered an economically viable alternative to business-asusual maize-soybean rotations in the Midwest , with cover crops, perennials, and small grain cereals enhancing soil health by 32-49% and crop productivity by .
The novelty of this study is its highly diversified crop rotations, with cash crops and legumes replacing cereal monocultures, together with rotating shallow-rooted crops with deep-rooted crops. It positively affects ecosystem services and functions, partly compensating for the lower services in less diversified cereal-based rotations. Crop diversification offers significant benefits in reducing GHG emissions and has a synergistic effect on plant biomass and protein production, soil health, and microbial community biodiversity. Diversification reduced crop inputs, particularly N fertilizer and irrigation amounts, minimizing environmental costs while increasing farmers’ incomes. Thus, diversified crop rotations can serve as an effective strategy for sustainable food production in areas worldwide with environments similar to the North China Plain.
The scientific evidence presented in this study holds significant potential for informing and reinforcing current policies and incentive schemes to improve the green transition of farming systems in China. Specifically, China set objectives to promote soybean production (initiated in 2019), implement an action plan for zero increase in fertilizer and pesticide use (launched in 2015), and develop strategies to reduce agricultural GHG emissions with the ultimate goal of transforming agricultural systems into zero ’emitters’ by 2060. When designing effective diversified cropping systems, it is important to consider local environmental conditions to balance land use for food production with the other functions of an ecosystem. Optimizing crop configuration is essential-through social, economic, and environmental dimensional planning within a complex framework of various indicators to ensure long-term sustainability. We recommend that developing and adopting diversified cropping systems should be a key consideration in agricultural policy setting and a top priority for onfarm decision-making, as they are critical for achieving long-term food production resilience, maintaining soil health, and ensuring environmental sustainability. Given that climate variability will increase, multiyear assessments of the sustainability of agricultural production systems remain tentative, and funding should be sought for additional observation sites for long-term monitoring.

Methods

The field experiment was established in October 2016 at the Luancheng Agro-Ecosystem Station of the Chinese Academy of Sciences ( ; altitude, 50.1 m ) in Luancheng County, Hebei Province (Fig. S5a), which represents the agricultural production and climate conditions of the North China Plain. The experimental area experiences a warm, temperate zone, semi-humid, monsoon climate with a frost-free period of 200 days. The annual mean air temperature was over the last 20 years, and the annual average precipitation was over the last 62 years (Fig. S5b). Fig. S5c presents the average monthly precipitation and air temperatures from 2016 to 2020. The experimental site had loam soil with sandy loam in the surface layers, light/medium loam at depth, and light clay below 80 cm . The soil layer before the experiment start has bulk density,
field capacity, wilting point, total SOC, available phosphorous, and available potassium. Prior to the experiment, the core food crops on the same fields were wheat and maize grown in a 12-month double-cropping system that is popular regionally. From the start of the experiment, the sites were managed with optimized irrigation and seeding techniques, with all residues returned to the soil during the winter wheat-summer maize year.
The experiment comprised eight crops: cereals winter wheat (cv. Kenong 2009), summer maize (cv. Jundan 20), and spring maize (cv. Jundan 20); legumes soybean (cv. Shidou 12) and peanut (cv. Jihua 4); cash/forage: sweet potato (cv. Shangshu 19), ryegrass (cv. Dongmu 70) and sorghum (cv. Jintianza 3). There were five newly designed diversified crop rotations: [sweet potato winter wheat-summer maize rotation (SpWM, 2-year cycle); peanut winter wheat-summer maize rotation (PWM, 2-year cycle); soybean winter wheat-summer maize rotation (SWM, 2-year cycle); ryegrass-sweet sorghum winter wheat-summer maize rotation (RSWM, 2-year cycle); spring maize winter wheat-summer maize rotation (SpWM, 2-year cycle)]. The regionally dominant winter wheat-summer maize double-cropping system (WM, 1 -year cycle) was the control. ‘ denotes crop rotation across years and ‘-‘ denotes crop rotation within a year. Unlike pure winter wheat-summer maize, the alternative rotations included fallow seasons for parts of their non-winter wheat-summer maize years (Fig. S6).
Each rotation was replicated three times, resulting in 18 plots established using a randomized complete block design (Fig. S6). All cycles were repeated on their respective plots from October 2016 to October 2022. The winter wheat-summer maize double-cropping control rotation completed six cycles, while the other five rotations completed three rotation cycles. Supplementary Table S1 lists the total amounts of inputs, including N, P, K, irrigation, diesel for tillage, electricity for irrigation, pesticide, seeds, and labor for each crop in each rotation. Supplementary Data 1 details fertilizer and irrigation amounts and timings for each crop in each rotation in each year. Basal N applications (as urea) were broadcast and plowed ( 20 cm depth) into the soil before seeding. Topdressing of N was performed at the key growth stages with specific amounts summarized in Supplementary Data 1.

Equivalent yield and economic benefit

Crops were harvested at maturity with a conventional combine harvester with an automated weighing system, which measured the total crop yield of each plot. After air-drying to a constant moisture content , wheat and maize grain yields were recorded . Sorghum biomass yield (fresh weight) per plot was weighed to represent silage moisture of ( dry matter) . Ryegrass dry matter was determined in sub-sample after drying at until constant weight . Sweet potato yield (fresh weight) was obtained by weighing the fresh root tubers harvested from each plot using a single row harvester . All mature pods in each plot were collected to determine peanut yield accurately. Ten uniform peanut plants were used for investigating the pod numbers per plant. All harvested peanut pods were air-dried to a water content of approximately and weighed to calculate the pod yield . After harvesting each plot, soybean seeds were cleaned and weighed, with the grain yields adjusted to moisture content .
For yield comparisons among different crop products, the equivalent yields of the six crop rotations were calculated by multiplying the crop yield by the market price relative to that of winter wheat in the same year . Each cropping system’s equivalent yield, economic benefit, and protein yield were determined as follows:
where is equivalent yield of crop at year , wheat price is price of winter wheat in year adjusted for China National Consumer Price Index (CPI, relative Yuan), economic benefit is within-year crop yield multiplied by its corresponding price in Chinese Yuan minus crop production costs (Yuan ), is a given year, is total protein content of crop , and is protein concentration per kg crop product (%) referred from previous studies . (For comparison, the following exchange rate was used: Chinese Yuan and 1 Yuan in May 2023.) Each indicator for one crop rotation was summed across the crops within one crop rotation cycle. The CPI was used to adjust crop prices across years to eliminate inflation or deflation as a source of variability between cases in different years. Table S2 lists the crop prices and CPI values for individual years and crops, and Table S3 lists each crop’s protein content.

Gas flux and net GHG emissions

Soil GHG and fluxes were measured using the static chamber method . Plastic frames with water-sealing grooves were inserted 5 cm into the soil between crop rows, and chambers ( ) were placed on top of the frames during measurements. For flux measurements, gas samples ( per sample) were taken between 9:00 and 10:00 am at specific time intervals ( , and 36 min after chamber closure) using 100 mL plastic syringes attached to a threeway stopcock. Gas samples were collected about once every 7 days from sowing to harvest, with more frequent measurements (every 3 days) after N fertilizer application and precipitation events. The headspace air temperature in the chamber was recorded with a thermometer. Gas samples were analyzed using a gas chromatograph (Agilent 7890 A, Agilent Inc., USA) equipped with a flame-ionization detector for measuring at and an electron capture detector for measuring at . The column temperature was set to . was separated with a Porapak Q column and detected by the flame-ionization detector. was detected by a micro electron capture detector ( ). The carrier gas was high-purity (99.999%) with a flow velocity of . A purge gas ( in ) was used to avoid interference with . The gas flux was calculated using the linear approach. Soil and fluxes for each rotation across the 6 years are illustrated in Figs S1 and S2.
For the net GHG emissions ( -eq ) estimation, we considered indirect GHG emissions of crop inputs from a life cycle assessment, direct and emissions from the soil, and changes in soil carbon stock from during the 6 -year experiment. The system boundary in the life cycle assessment was set from manufacture, storage, and delivery of external inputs such as fertilizer to crop harvest, including soil carbon storage change (Fig. S7). Potential emissions related to the logistics of transporting, exporting, or marketing grain products beyond the farm gate were excluded as they were considered outside the system boundary.
Indirect GHG emissions (CE) result from manufacturing, storing, transporting, and delivering agricultural inputs, such as fertilizer ( , , pesticides, diesel, and electricity to the farm gate, as follows:
where is the indirect GHG emissions for one crop within a given rotation, is the amount of the input (Table S1), and is the corresponding -eq emission coefficients (see Table S4 for the manufacture, storage, and delivery of agricultural inputs).
Direct and fluxes from soil were calculated from October 2016 to October 2022, as follows:
where is GHG emission fluxes of and emissions, is the molecular mass of the specified gas ( for and for is the molar volume of an ideal gas, is the ideal gas temperature, and are the air temperature and pressure in the chamber at the sampling time, is the standard air pressure, is the height of chamber, ) is the slope of the linear regression curve for the change of headspace gas concentrations during times of chamber closure, and 60 is . Total GHG emissions during each crop growth and fallow period were calculated using linear interpolation .
Cumulative and emissions during each crop’s growing season or fallow period were calculated as:
where is the cumulative emission of one of the two gases from one experimental plot ( ) over a specified period, is the gas emission flux is the sampling time in days, is the sampling from the plot, and 24 is the conversion coefficient between hours and days (h day ).
The global warming potential (GWP) of seasonal soil and emissions, combining Eq. (7) results and re-expressed in -eq , was calculated as:
The annual change in SOC stock ( ; ) from October 2016 to October 2022 was estimated for each crop rotation, as follows:
where and are the total soil carbon storage values in the soil layer in October 2016 and October 2022, respectively, is the number of years of the study period, and is the conversion coefficient from C into .
Net GHG emissions were equal to the sum of indirect (CE) and direct (GWP of and ) GHG emissions minus soil carbon sequestration ( ) when soil carbon was the sink, calculated as follows:

Soil physiochemical properties, microbial diversity and soil health scoring

Soil samples ( depth) were collected at the beginning of the experiment (October 2016) and at the end of the summer maize harvest in October 2022 to measure soil physicochemical properties: including soil pH, bulk density, soil water content, total nitrogen (TN), dissolved organic carbon (DOC), soil nitrate- , ammonium-N ( -N), available phosphorus (AP), and microbial biomass carbon and nitrogen (MBC and MBN, respectively).
Soil pH was measured in a 1:5 (w/v) soil: water suspension as described by McLean . TN was determined using the modified Kjeldahl method . MBC and MBN were determined using the chloroform fumigation and extraction method . DOC concentrations extracted from fumigated and unfumigated soil
samples were determined using a Multi 3100 N/C TOC analyzer (Analytik Jena, Germany). A modified Bremner’s standard protocol was used to extract soil and using , measured with a UV-1800 spectrophotometer (Mapada Instruments, Shanghai, China). Soil available P concentrations were determined using ( pH 8.5 ) and the molybdenum-blue colorimetric method .
Soil organic carbon (SOC) concentrations in the soil layer (0-10, 10-20, 20-30, 30-50, 50-70, and 70-90 cm increments) were measured after each crop harvest from October 2016 to October 2022, in samples collected by auger at five random locations per plot. Soil samples from each sampling depth within a plot were combined, dried at for 24 h , sieved ( 2 mm ), pretreated with 0.5 M HCl to remove carbonates , and ball-milled. SOC concentrations were determined using a vario Macro CNS Analyzer (Elementar, Germany). Soil bulk density in all soil layers down to 0.9 m in all plots was measured using the gravimetric method .
Soil samples were also collected before the start of the experiment (October 2016) and at the final summer maize harvest (October 2022) for DNA sequencing and microbial community composition and diversity measurements. Subsamples for DNA sequencing were immediately placed on dry ice and stored at until DNA extraction, while the other subsamples were taken to the laboratory for chemical analysis. Soil DNA was extracted from 0.5 g freeze-dried soil using the Powersoil DNA Isolation Kit (Mo Bio Laboratories, Carlsbad, CA, USA) according to the manufacturer’s protocol. DNA quality was assessed according to the and absorbance ratios using a NanoDrop ND2000 spectrophotometer (NanoDrop, ND2000, Thermo Scientific, 111 Wilmington, DE) and then stored at for further molecular biology analysis.
Primer pairs-barcode-515F/806 R ( -GTGCCAGCMGCCGCGGTAA-3’/5′-GCACTACHVGGGTWTCTAAT-3′)-were used to amplify the V3 + V4 region of the bacterial 16 S rRNA gene , yielding accurate taxonomic information with few biases among various bacterial taxa. Primers-ITS1 ( -CTTGGTCATTTAGAGGAAGTAA- ) and ITS2 ( -TGCGTTCTTCATC-GATGC-3′)-were used to amplify the ITS1 region of the fungal rRNA gene. The PCR was carried out in a mixture (final volume, ) comprising DNA template ( ), of each primer, Premix Ex Taq (Takara Biotechnology), and sterilized water. Thermal-cycling conditions were as follows: initial denaturation of 3 min at , six touchdown cycles of 45 s at from 65 to , 70 s at , followed by 22 cycles of 45 s at at at , with a final elongation of for 10 min . Tag-encoded highthroughput sequencing of the 16 S and ITS genes from purified and quantified PCR products was performed by the Magigene Company (Beijing, China) using the Illumina MiSeq platform.
Raw sequences were quality processed using the Quantitative Insights into Microbial Ecology (QIIME) pipeline (version 2.1) . Resampling operational taxonomic units (OTUs) was based on the minimum sequence numbers to correct the sampling effort before further analysis. The OTUs were clustered with a similarity cutoff using the UPARSE pipeline (version 7.1) . Taxonomic assignment was carried out using OTUs with SILVA (16 S) and Unite (ITS).
Alpha diversity was characterized by six indices (Shannon-Weaver, Chao1, ACE, Richness, Simpson, and Pielou), calculated using the OTU numbers for bacteria and fungi. (see Supplementary Information for detailed calculations).
The Cornell Soil Health Assessment (CSHA) combined with principal component analysis (PCA) was used to determine health scores for soils sampled in 2016 and 2022, which allowed comparing each plot’s changes in soil health after 6 years of ‘rotation nourishment’. The ten soil indicators (physical attributes: bulk density, soil water content; chemical attributes: soil pH, TN, SOC, DOC, -N, AP; biological attributes: MBC and MBN) were normalized as individual
CSHA scores . The weights of individual CSHA scores were based on PCA of all soil indicators (Table S5), representing the sum of the eigenvectors derived from the first three principal components, which were selected based on the inflection point from a Scree plot and Kaiser’s cut-off (eigenvalues >1) (Fig. S8). These first three principal components accounted for , and of the data’s total variation, with a cumulative variance of , capturing most of the variation among the soil indicators. The soil health overall score (%) was computed as a weighted average of all individual CSHA scores, calculated as follows:
where is the CSHA score for each individual soil indicator, and is the weighting factor for each soil indicator (Table S5).

Entropy-TOPSIS for multiple function assessment of diversified crop rotations

The was determined using crop yield, nutritional yield (detailed in Eqs. 1-5 in SI Methods), economic benefit, soil health, C sequestration, microbial biodiversity, and net GHG emissions based on Entropy-TOPSIS (Technique for Order Preference by Similarity to an Ideal Solution).
Entropy-TOPSIS is a multi-objective decision analysis tool for identifying the most feasible solution from a set of options. It defines the most positive and negative ideal solutions of a problem, with the most feasible solution representing the solution that is the most positive and furthest from the negative ideal solution . The entropy weight method was selected as an objective determination of the index weight to overcome the influence of subjective factors caused by the Delphi method or the analytic hierarchy process when determining the weight of the evaluation index of the traditional TOPSIS method. The index weight is then used to calculate the comprehensive evaluation rank of each crop rotation using TOPSIS:
(1) Normalize the indicators:
where is the normalized value of the th index in the th crop rotation (positive indicators include equivalent yield, economic benefit, nutrition yield, soil biodiversity including bacteria and fungi, soil health score, and soil carbon sequestration; negative indicator is net GHG emissions), is the average value from three measured replications of the th index in the th crop rotation, and and are the maximum and the minimum values of a single index, respectively.
(2) Calculate the entropy value of each evaluation index:
where and . When is modified as follows:
(3) Calculate the entropy weight ( ) of the evaluation index:
(4) Construct a weighted normalized decision matrix ( ) using the normalized matrix and the weights of each index :
(5) Determine the positive ideal solution vector and the negative ideal solution vector using the positive ideal solution and the negative ideal solution :
(6) Calculate the Euclidean distance between each index and the positive and negative ideal solutions.
(7) Calculate the comprehensive evaluation index of each crop rotation. The proximity between the evaluation object and the optimal scheme is calculated as follows:

Statistical analysis

Statistical analyses were conducted in SPSS version 21 software (IBM’s Statistical Product and Service Solutions) and R version 4.3.1 . The Kolmogorov-Smirnov test was used for testing normal distribution, followed by an analysis of variance (ANOVA) to determine the statistical significance of differences between mean values. Post-hoc comparisons were conducted using the least significant difference (LSD) test at the 5% probability level. The correlation matrix of indicators for each rotation was calculated with Pearson’s classic method and visualized using the Performance Analytics package in R 4.3.1 and R Studio 1.8.0. Principal component analysis (PCA) was used to calculate the eigenvalues and classify each soil indicator in each rotation using the vegan package, visualized using the ggplot2 package in R 4.3.1. The -diversity indexes of the soil microbial community were calculated using the vegan and picante packages, visualized using R 4.3.1. A radar map illustrating the performance of the multiple objective analysis was produced to assess the various functions of each rotation, visualized using ggradar packages. A Nightingale Rose Chart was used to assess the functions of each crop rotation, visualized using ggplot2 package.
The results presented in the paper were derived predominantly from a 6-year field experiment undertaken at the Luancheng research station, a typical representative site for production systems and environmental characteristics in the North China Plain. Multi- location experiments will ensure the spatiotemporal effects of diversified crop rotations on system productivity, environmental impacts, and socioeconomic performance. Moreover, inter-annual weather conditions are highly variable, and this may intensify in the future. Thus, longer term monitoring at multiple sites would be valuable for reducing the
uncertainty associated with extreme weather events and climate change.

Reporting summary

Further information on research design is available in the Nature Portfolio Reporting Summary linked to this article.

Data availability

The raw reads from Illumina sequencing described in this study, are available at NCBI under the accession no. SRR26083954-26083974 (16 S rRNA) and SRR26083997-26084017 (ITS). The dataset generated in this study has been deposited in the database under accession code on Figshare at https://doi.org/10.6084/m9.figshare.24793563. Source data are provided with this paper.

Code availability

Code scripts used in this study are available at: https://figshare.com/s/ 5c07d2ac7c8dc4a5b678.

References

  1. Webb, P. et al. The urgency of food system transformation is now irrefutable. Nat. Food 1, 584-585 (2020).
  2. Gerten, D. et al. Feeding ten billion people is possible within four terrestrial planetary boundaries. Nat. Sustain. 3, 200-208 (2020).
  3. Beerling, D. J. et al. Potential for large-scale removal via enhanced rock weathering with croplands. Nature 583, 242-248 (2020).
  4. Cui, Z. L. et al. Pursuing sustainable productivity with millions of smallholder farmers. Nature 555, 363-366 (2018).
  5. Garnett, T. et al. Sustainable intensification in agriculture: Premises and policies. Science 341, 33-34 (2013).
  6. Gu, B. J. et al. Cost-effective mitigation of nitrogen pollution from global croplands. Nature 613, 77-84 (2023).
  7. National Bureau of Statistics of China. Agriculture. China Statistical Yearbook – 2021. (China Statistics Press, Beijing, China, 2021).
  8. Liu, G., Zhang, F. & Deng, X. Z. Half of the greenhouse gas emissions from China’s food system occur during food production. Commun. Earth Environ. 4, 161 (2023).
  9. Friedlingstein, P. et al. Global carbon budget 2021. Earth Syst. Sci. Data 14, 1917-2005 (2022).
  10. Cumming, G. S. et al. Implications of agricultural transitions and urbanization for ecosystem services. Nature 515, 50-57 (2014).
  11. Marris, E. A world without soil: The past, present, and precarious future of the earth beneath our feet. Nature 601, 503-504 (2022).
  12. Xu, H. G. et al. Ensuring effective implementation of the post-2020 global biodiversity targets. Nat. Ecol. Evol. 5, 411-418 (2021).
  13. Wang, B. et al. Sources of uncertainty for wheat yield projections under future climate are site-specific. Nat. Food 1, 720-728 (2020).
  14. Shi, Y. et al. Building social resilience in North Korea can mitigate the impacts of climate change on food security. Nat. Food 3, 499-511 (2022).
  15. Suweis, S., Carr, J. A., Maritan, A., Rinaldo, A. & D’Odorico, P. Resilience and reactivity of global food security. Proc. Natl Acad. Sci. USA 112, 6902-6907 (2015).
  16. Tilman, D. et al. Future threats to biodiversity and pathways to their prevention. Nature 546, 73-81 (2017).
  17. Chai, Q. et al. Integrated farming with intercropping increases food production while reducing environmental footprint. Proc. Natl Acad. Sci. USA 118, e2106382118 (2021).
  18. Xie, W. et al. Crop switching can enhance environmental sustainability and farmer incomes in China. Nature 616, 300-305 (2023).
  19. Guo, Y. X. et al. Air quality, nitrogen use efficiency and food security in China are improved by cost-effective agricultural nitrogen management. Nat. Food 1, 648-658 (2020).
  20. Lucas, E., Guo, M. & Guillén-Gosálbez, G. Low-carbon diets can reduce global ecological and health costs. Nat. Food 4, 394-406 (2023).
  21. Ray, D. K., Ramankutty, N., Mueller, N. D., West, P. C. & Foley, J. A. Recent patterns of crop yield growth and stagnation. Nat. Commun. 3, 1293 (2012).
  22. Ranganathan, J., Daniels, R. J. R., Chandran, M. D. S., Ehrlich, P. R. & Daily, G. C. Sustaining biodiversity in ancient tropical countryside. Proc. Natl Acad. Sci. USA 105, 17852-17854 (2008).
  23. Crippa, M. et al. Food systems are responsible for a third of global anthropogenic GHG emissions. Nat. Food 2, 198-209 (2021).
  24. Yang, X. L. et al. Diversified crop rotations enhance groundwater and economic sustainability of food production. Food Energy Secur. 10, e311 (2021).
  25. Liu, Z. J. et al. Patterns and causes of winter wheat and summer maize rotation area change over the North China Plain. Environ. Res. Lett. 17, 044056 (2022).
  26. FAO. FAOSTAT. (2023). https://www.fao.org/faostat/en/#data/EM/ visualize, last access: 19 Jul 2023.
  27. Bowles, T. M. et al. Long-term evidence shows that crop-rotation diversification increases agricultural resilience to adverse growing conditions in North America. One Earth 2, 284-293 (2020).
  28. Li, J. X. et al. Diversifying crop rotation improves system robustness. Agron. Sustain. Dev. 39, 38 (2019).
  29. Giller, K. E. The food security conundrum of sub-Saharan Africa. Glob. Food Secur. 26, 100431 (2020).
  30. Hijbeek, R. et al. Do organic inputs matter – a meta-analysis of additional yield effects for arable crops in Europe. Plant Soil 411, 293-303 (2017).
  31. Mhlanga, B., Ercoli, L., Pellegrino, E., Onofri, A. & Thierfelder, C. The crucial role of mulch to enhance the stability and resilience of cropping systems in southern Africa. Agron. Sustain. Dev. 41, 29 (2021).
  32. MacLaren, C. et al. Long-term evidence for ecological intensification as a pathway to sustainable agriculture. Nat. Sustain. 5, 770-779 (2022).
  33. Lin, B. B. Resilience in agriculture through crop diversification: adaptive management for environmental change. BioScience 61, 183-193 (2011).
  34. Robertson, G. P., Paul, E. A. & Harwood, R. R. Greenhouse gases in intensive agriculture: contributions of individual gases to the radiative forcing of the atmosphere. Science 289, 1922-1925 (2000).
  35. Powlson, D. S. et al. Limited potential of no-till agriculture for climate change mitigation. Nat. Clim. Change 4, 678-683 (2014).
  36. Liu, K., Bandara, M., Hamel, C., Knight, J. D. & Gan, Y. T. Intensifying crop rotations with pulse crops enhances system productivity and soil organic carbon in semi-arid environments. Field Crops Res. 248, 107657 (2020).
  37. Chenu, C. et al. Increasing organic stocks in agricultural soils: knowledge gaps and potential innovations. Soil Tillage Res. 188, 41-52 (2019).
  38. Drinkwater, L. E., Wagoner, P. & Sarrantonio, M. Legume-based cropping systems have reduced carbon and nitrogen losses. Nature 396, 262-265 (1998).
  39. Montgomery, D. R. & Biklé, A. Soil health and nutrient density: beyond organic vs. conventional farming. Front. Sustain. Food Syst. 5, 417 (2021).
  40. Guinet, M., Nicolardot, B. & Voisin, A.-S. Nitrogen benefits of ten legume pre-crops for wheat assessed by field measurements and modelling. Eur. J. Agron. 120, 126151 (2020).
  41. Abdalla, M. et al. A critical review of the impacts of cover crops on nitrogen leaching, net greenhouse gas balance and crop productivity. Glob. Change Biol. 25, 2530-2543 (2019).
  42. Olesen, J. E. et al. Challenges of accounting nitrous oxide emissions from agricultural crop residues. Glob. Change Biol. 00, 1-10 (2023).
  43. Gan, Y. T. et al. Improving farming practices reduces the carbon footprint of spring wheat production. Nat. Commun. 5, 5012 (2014).
  44. Ma, B. L., Liang, B. C., Biswas, D. K., Morrison, M. J. & McLaughlin, N. . The carbon footprint of maize production as affected by nitrogen fertilizer and maize-legume rotations. Nutr. Cycl. Agroecosyst. 94, 15-31 (2012).
  45. Karlsson, H., Ahlgren, S., Strid, I. & Hansson, P.-A. Faba beans for biorefinery feedstock or feed? Greenhouse gas and energy balances of different applications. Agric. Syst. 141, 138-148 (2015).
  46. Plaza-Bonilla, D., Nolot, J.-M., Raffaillac, D. & Justes, E. Innovative cropping systems to reduce N inputs and maintain wheat yields by inserting grain legumes and cover crops in southwestern France. Eur. J. Agron. 82, 331-341 (2017).
  47. Roesch-McNally, G. E., Arbuckle, J. G. & Tyndall, J. C. Barriers to implementing climate resilient agricultural strategies: The case of crop diversification in the U.S. Corn Belt. Glob. Environ. Change 48, 206-215 (2018).
  48. Shah, K. K., Modi, B., Pandey, H. P., Subedi, A. & Shrestha, J. Diversified crop rotation: an approach for sustainable agriculture production. Adv. Agric. 2021, 1-9 (2021).
  49. Liang, J. P. & Shi, W. J. Cotton/halophytes intercropping decreases salt accumulation and improves soil physicochemical properties and crop productivity in saline-alkali soils under mulched drip irrigation: a three-year field experiment. Field Crops Res. 262, 108027 (2021).
  50. Hazra, K. K. et al. Diversification of maize-wheat cropping system with legumes and integrated nutrient management increases soil aggregation and carbon sequestration. Geoderma 353, 308-319 (2019).
  51. Mooshammer, M. et al. Microbial feedbacks on soil organic matter dynamics underlying the legacy effect of diversified cropping systems. Soil Biol. Biochem. 167, 108584 (2022).
  52. Dias, T., Dukes, A. & Antunes, P. M. Accounting for soil biotic effects on soil health and crop productivity in the design of crop rotations. J. Sci. Food Agric. 95, 447-454 (2015).
  53. Garbeva, P., Veen, J. A. V. & Elsas, J. D. V. Microbial diversity in soil: Selection of microbial populations by plant and soil type and implications for disease suppressiveness. Annu. Rev. Phytopathol. 42, 243-270 (2004).
  54. Selim, M. M. A review of advantages, disadvantages and challenges of crop rotations. Egypt. J. Agron. 41, 1-10 (2019).
  55. Garland, G. et al. Crop cover is more important than rotational diversity for soil multifunctionality and cereal yields in European cropping systems. Nat. Food 2, 28-37 (2021).
  56. Yang, Y. H. et al. Optimizing crop rotation increases soil carbon and reduces GHG emissions without sacrificing yields. Agric. Ecosyst. Environ. 342, 108220 (2023).
  57. Jarecki, M. et al. Long-term trends in corn yields and soil carbon under diversified crop rotations. J. Environ. Qual. 47, 635-643 (2018).
  58. Baldwin-Kordick, R. et al. Comprehensive impacts of diversified cropping on soil health and sustainability. Agroecol. Sustain. Food Syst. 46, 331-363 (2022).
  59. Chahal, I., Hooker, D. C., Deen, B., Janovicek, K. & Van Eerd, L. L. Long-term effects of crop rotation, tillage, and fertilizer nitrogen on soil health indicators and crop productivity in a temperate climate. Soil Tillage Res. 213, 105121 (2021).
  60. Fang, Q., Zhang, X. Y., Chen, S. Y., Shao, L. & Sun, H. Selecting traits to increase winter wheat yield under climate change in the North China Plain. Field Crops Res. 207, 30-41 (2017).
  61. da Silva, P. C. G. et al. No-tillage and crop rotation increase crop yields and nitrogen stocks in sandy soils under agroclimatic risk. Field Crops Res. 258, 107947 (2020).
  62. Hu, Z. Y. et al. Italian ryegrass-rice rotation system for biomass production and cadmium removal from contaminated paddy fields. J. Soils Sediment. 20, 874-882 (2020).
  63. Song, D. G. et al. Influence of planting distance and density on the yield and photosynthetic traits of sweet potato (Ipomoea balatas L.) under an intercropping system with walnut (Juglans regia) saplings. Soil Tillage Res. 196, 104484 (2020).
  64. Zhao, J. H. et al. The impacts of soil tillage combined with plastic film management practices on soil quality, carbon footprint, and peanut yield. Eur. J. Agron. 148, 126881 (2023).
  65. Liu, X. B. et al. Yield response of continuous soybean to one-season crop disturbance in a previous continuous soybean field in Northeast China. Field Crops Res. 138, 52-56 (2012).
  66. Alam, M. K., Bell, R. W. & Biswas, W. K. Decreasing the carbon footprint of an intensive rice-based cropping system using conservation agriculture on the Eastern Gangetic Plains. J. Clean. Prod. 218, 259-272 (2019).
  67. Wang, S. Q. et al. Diversified crop rotations reduce groundwater use and enhance system resilience. Agric. Water Manag. 276, 108067 (2023).
  68. Groot, J. C. J. & Yang, X. L. Trade-offs in the design of sustainable cropping systems at a regional level: a case study on the North China Plain. FASE 9, 14 (2022).
  69. Zheng, X. H. et al. Quantification of fluxes from soil-plant systems may be biased by the applied gas chromatograph methodology. Plant Soil 311, 211-234 (2008).
  70. Huang, J. X., Chen, Y. Q., Sui, P. & Gao, W. S. Estimation of net greenhouse gas balance using crop- and soil-based approaches: Two case studies. Sci. Total Environ. 456-457, 299-306 (2013).
  71. IPCC. Climate change 2021: The physical science basis. Contribution of working group i to the sixth assessment report of the intergovernmental panel on climate change. (ed. Masson-Delmotte, V. P. Z. A.) (Cambridge University Press, Cambridge, United Kingdom and New York, NY, USA, 2021). https://www.ipcc.ch/report/sixth-assessment-report-working-group-i/.
  72. Mclean, E. O. Soil pH and Lime Requirement. in Methods of Soil Analysis: Part 2 Chemical and Microbiological Properties, 9.2.2, Second Edition (ed. Page, A. L.) 199-224 (American Society of Agronomy, Inc. and Soil Science Society of America, Inc., Madison, Wisconsin, USA, 1982).
  73. Bremner, J. M. & Shaw, K. Denitrification in soil. I. Methods. Investig. J. Agric. Sci. 51, 22-39 (1958).
  74. Ladd, J. N. & Amato, M. Relationship between microbial biomass carbon in soils and absorbance ( 260 nm ) of extracts of fumigated soils. Soil Biol. Biochem. 21, 457-459 (1989).
  75. Bremner, J. M. Inorganic forms of nitrogen. in Methods of Soil Analysis: Part 2 Chemical and Microbiological Properties (ed. Norman, A. G.) 1179-1237 (American Society of Agronomy Madison, 1965).
  76. Olsen, S. R. & Sommers, L. E. Phosphorus. in Methods of Soil Analysis: Part 2 Chemical and Microbiological Properties, 9.2.2, 2nd Edition (ed. Page, A. L.) 403-430 (American Society of Agronomy, Inc. and Soil Science Society of America, Inc., 1982).
  77. Harris, D., Horwáth, W. R. & van Kessel, C. Acid fumigation of soils to remove carbonates prior to total organic carbon or CARBON-13 isotopic analysis. Soil Sci. Soc. Am. J. 65, 1853-1856 (2001).
  78. Grossman, R. B. & Reinsch, T. G. 2.1 Bulk density and linear extensibility. in Methods of Soil Analysis: Part 4 Physical Methods (eds. Dane, J. H. & Topp, G. C.) 201-228 (Soil Science Society of America, Inc., 2002).
  79. Caporaso, J. G. et al. QIIME allows analysis of high-throughput community sequencing data. Nat. Methods 7, 335-336 (2010).
  80. Edgar, R. C. UPARSE: Highly accurate OTU sequences from microbial amplicon reads. Nat. Methods 10, 996-998 (2013).
  81. Gugino, B. K. et al. Cornell Soil Health Assessment Training Manual, Edition 1.2, (Cornell University Press, Cornell University, 2007).
  82. Idowu, O. J. et al. Farmer-oriented assessment of soil quality using field, laboratory, and VNIR spectroscopy methods. Plant Soil 307, 243-253 (2008).
  83. Moebius-Clune, B. N. et al. Comprehensive Assessment of Soil Health – The Cornell Framework, Edition 3.2, (Cornell University Press, Cornell University, 2016).
  84. Chang, T. T., Feng, G., Paul, V., Adeli, A. & Brooks, J. P. Chapter Three – Soil health assessment methods: Progress, applications and comparison. in Adv. Agron., Vol. 172 (ed. Sparks, D. L.) 129-210 (Academic Press, 2022).
  85. Congreves, K. A., Hayes, A., Verhallen, E. A. & Van Eerd, L. L. Longterm impact of tillage and crop rotation on soil health at four temperate agroecosystems. Soil Tillage Res. 152, 17-28 (2015).
  86. Wang, H. D. et al. Multi-objective optimization of water and fertilizer management for potato production in sandy areas of northern China based on TOPSIS. Field Crops Res. 240, 55-68 (2019).
  87. Chen, Y., Zhu, M. K., Lu, J. L., Zhou, Q. & Ma, W. B. Evaluation of ecological city and analysis of obstacle factors under the background of high-quality development: Taking cities in the Yellow River Basin as examples. Ecol. Indic. 118, 106771 (2020).
  88. Liu, X. G., Peng, Y. L., Yang, Q. L., Wang, X. K. & Cui, N. B. Determining optimal deficit irrigation and fertilization to increase mango yield, quality, and WUE in a dry hot environment based on TOPSIS. Agric. Water Manag. 245, 106650 (2021).
  89. Delgado, A. & Romero, I. Environmental conflict analysis using an integrated grey clustering and entropy-weight method: A case study of a mining project in Peru. Environ. Modell. Softw. 77, 108-121 (2016).
  90. Chen, C. W., Wang, J. H., Wang, J. C. & Shen, Z. H. Developing indicators for sustainable campuses in Taiwan using fuzzy Delphi method and analytic hierarchy process. J. Clean. Prod. 193, 661-671 (2018).
  91. R Core Team. R: A language and environment for statistical computing. in Computing (R foundation for statistical computing, Vienna, Austria, 2014).

Acknowledgements

We thank J.Z., N.Q., P.H., F.L., Y.C. and R.C. from China Agricultural University for field work contributions, and Dr. Y.S. for assisting the analysis of soil microbial diversity. This work was financed jointly by the National Natural Science Foundation of China (Grant No. 32071975 to X.Y., 52239002 to T.D. and 41830751 to X.J.), the Hebei Province Key Research and Development Program of China (20326411D-1 to X.Y.) and Pioneer Center for Research in Sustainable Agricultural Futures (LandCRAFT) (DNRF grant number P2 to K.B.B.).

Author contributions

X.Y., S.K., T.D., and X.J. designed the study. X.Y. designed the field experiment. X.Y., J.X., S.L., L.X. and Y.S. facilitated data collection. X.Y., J.X., X.J. and K.B.B. do the data analysis. X.Y., X.J., K.B.B., Y.G. and K.H.M.S. wrote the manuscript. Y.G., K.H.M.S., S.P. and T.S.S. improved and revised the writings. All authors discussed the results and contributed to the final manuscript.

Competing interests

The authors declare no competing interests.

Additional information

Supplementary information The online version contains
supplementary material available at
https://doi.org/10.1038/s41467-023-44464-9.
Correspondence and requests for materials should be addressed to Xiaolin Yang, Taisheng Du, Xiaotang Ju or Yantai Gan.
Peer review information Nature Communications thanks Baojing Gu, Robert Rees and Feng Zhou for their contribution to the peer review of this work. A peer review file is available.
Reprints and permissions information is available at
http://www.nature.com/reprints
Publisher’s note Springer Nature remains neutral with regard to jurisdictional claims in published maps and institutional affiliations.
Open Access This article is licensed under a Creative Commons Attribution 4.0 International License, which permits use, sharing, adaptation, distribution and reproduction in any medium or format, as long as you give appropriate credit to the original author(s) and the source, provide a link to the Creative Commons licence, and indicate if changes were made. The images or other third party material in this article are included in the article’s Creative Commons licence, unless indicated otherwise in a credit line to the material. If material is not included in the article’s Creative Commons licence and your intended use is not permitted by statutory regulation or exceeds the permitted use, you will need to obtain permission directly from the copyright holder. To view a copy of this licence, visit http://creativecommons.org/ licenses/by/4.0/.
© The Author(s) 2024

  1. State Key Laboratory of Efficient Utilization of Agricultural Water Resources, Beijing 100083, China. College of Water Resources & Civil Engineering, China Agricultural University, Beijing 100083, China. School of Tropical Agriculture and Forestry, Hainan University, Haikou 570228, China. College of Life and Environmental Sciences, Wenzhou University, Wenzhou, Zhejiang 325035, China. The BC-Soil Group, Tallus Heights, Kelowna, BC, Canada. State Key Laboratory of Soil and Sustainable Agriculture, Institute of Soil Science, Chinese Academy of Sciences, Nanjing 210008, China. Key Laboratory of Agricultural Water Resources, Centre for Agricultural Resources Research, Institute of Genetics and Developmental Biology, Chinese Academy of Sciences, Shijiazhuang 050022, China. Department of Biological and Environmental Engineering, Riley-Robb Hall, Cornell University, Ithaca, NY 14853, USA. The UWA Institute of Agriculture, The University of Western Australia, Perth, WA 6001, Australia. Land-CRAFT, Department of Agroecology, Aarhus University, Aarhus, Denmark. Institute of Meteorology and Climate Research, Atmospheric Environmental Research (IMK-IFU), Karlsruhe Institute of Technology (KIT), Garmisch Partenkirchen, Germany. e-mail: yangxiaolin429@cau.edu.cn; dutaisheng@cau.edu.cn; juxt@cau.edu.cn; gary.gan@wzu.edu.cn