توزيع الانزلاق لزلزال شبه جزيرة نوتو 2024 (MJMA 7.6) المقدر من أشكال موجات تسونامي وبيانات نظام تحديد المواقع العالمي (GNSS) Slip distribution of the 2024 Noto Peninsula earthquake (MJMA 7.6) estimated from tsunami waveforms and GNSS data

المجلة: Earth Planets and Space، المجلد: 76، العدد: 1
DOI: https://doi.org/10.1186/s40623-024-01991-z
تاريخ النشر: 2024-03-18

توزيع الانزلاق لزلزال شبه جزيرة نوتو 2024 (MJMA 7.6) المقدر من أشكال موجات تسونامي وبيانات نظام تحديد المواقع العالمي (GNSS)

يوشيرو فوجيل*© وكينجي ساتاكي²®

الملخص

زلزال نوتو-هانتو (شبه جزيرة نوتو) في 1 يناير 2024 ) تولدت حركة أرضية قوية، وتشوهات كبيرة في القشرة الأرضية، وأمواج تسونامي تسببت في أضرار كبيرة في المنطقة. حول شبه جزيرة نوتو، تم تحديد كل من الفوالق النشطة تحت البحر جزئيًا والفوالق النشطة على اليابسة من قبل مشاريع سابقة: وزارة الأراضي والبنية التحتية والنقل والسياحة (MLIT) ومشروع أبحاث الزلازل وأمواج تسونامي في بحر اليابان (JSPJ). قمنا بعكس موجات تسونامي المسجلة على 6 أجهزة قياس الموجات و12 جهاز قياس المد والجزر حول بحر اليابان وبيانات GNSS المسجلة في 53 محطة في شبه جزيرة نوتو لتقدير مقدار الانزلاق واللحظة الزلزالية على كل من الفوالق النشطة. تظهر النتائج أن الانزلاقات الزلزالية لعام 2024 كانت “، و 3.2 م على الشقوق NT4 و NT5 و NT6 من نموذج JSPJ، الواقعة على الساحل الشمالي لشبه جزيرة نوتو والمائلة نحو الجنوب الشرقي. قد يُعزى الانزلاق الأصغر، البالغ 1.0 م، المقدر على NT8 في الطرف الجنوبي الغربي من تمزق 2024، إلى تمزقه السابق خلال زلزال نوتو عام 2007. الطول الإجمالي لهذه الشقوق الأربعة هو ، و اللحظة الزلزالية هي Nm ( ). تم تقدير تقريبًا عدم انزلاق على الشقوق الفرعية الشمالية الشرقية NT2 و NT3، التي تميل نحو الشمال الغربي، عكس NT4-NT5-NT6، والشق الفرعي الغربي NT8. تشمل الهزات الارتدادية حدثت واقعة في منطقة NT2NT3، لكنها أصغر من الحجم المحتمل (Mw 7.1) الذي يمكن أن تطلقه تلك الفوالق في زلزال تسونامي. توجد ميزات مشابهة أيضًا لنموذج MLIT؛ كان الانزلاق في عام 2024 فقط على F43 على طول الساحل الشمالي لشبه جزيرة نوتو، ولم يحدث انكسار في F42 الشمالية الشرقية، مما يترك إمكانية لحدث مستقبلي.

الكلمات الرئيسية زلزال شبه جزيرة نوتو، تسونامي، بحر اليابان، الفوالق النشطة، نظام تحديد المواقع العالمي، عكس شكل الموجة، العكس المشترك، توزيع الانزلاق
الملخص الرسومي

مقدمة

حدث زلزال نوتو-هانتو (شبه جزيرة نوتو) في 1 يناير 2024. وفقًا لوكالة الأرصاد الجوية اليابانية (JMA)، كان وقت حدوث الزلزال 16:10:22.5 (7:10:22.5 بتوقيت UTC)، وكان مركز الزلزال هو “، كانت العمق 16 كم ودرجة القوة ( كان 7.6 (الشكل 1أ). آلية البؤرة (الضرب ، مُجَرف واضرب ، مُجَرف وفقًا لـ JMA) تشير إلى حركة صدع عكسي على مستويات مائلة NE-SW (الشكل 1b). امتدت الهزات الارتدادية حوالي 150 كم (الشكل 1b). حدثت هزتان ارتداديتان كبيرتان مع حدثت في الطرفين الغربي والشرقي من مناطق الهزات الارتدادية في 1 يناير و9 يناير، على التوالي. زلزال شبه جزيرة نوتو 2024 هو أكبر زلزال سطحي في اليابان وحولها منذ الهزة الارتدادية لزلزال توهوكو في 11 مارس 2011.
في منطقة شبه جزيرة نوتو، بدأت مجموعة من الزلازل حوالي ديسمبر 2020، مع أكبر حجم لـ (19 يونيو 2022). كانت نشاطات السرب
محصور في منطقة صغيرة ( ) في طرف شبه الجزيرة، وقد اعتُبر مرتبطًا بسوائل الارتفاع (نيشيمورا وآخرون 2023). في 5 مايو 2023، حدث زلزال أكبر ( حدث (كاتو 2024)، وأصبح نطاق نشاط السرب أكبر ( وفقًا للجنة أبحاث الزلازل، https:// www.static.jishin.go.jp/resource/monthly/2024/20240 ومع ذلك، كانت الزلازل المتسلسلة لا تزال محدودة تحت طرف شبه الجزيرة ولم تمتد إلى الفوالق النشطة قبالة الساحل.
حول شبه جزيرة نوتو، وقعت زلازل كبيرة في 7 فبراير 1993 6.6) إلى الشمال من حدث 2024، وفي 25 مارس 2007 ( ) إلى الغرب (الشكل 1ب). زلزال عام 1993 أنتج تسوناميات صغيرة تم تسجيلها في واجيما وناوئيتسو بأقصى سعة مزدوجة قدرها (أبي وأوكادا 1995). تم تسجيل تشوه القشرة الأرضية والتسونامي الناتج عن زلزال 2007 على شبكة GPS ومقاييس المد والجزر، على التوالي، والتي تم من خلالها تطوير نماذج الفوالق.
الشكل 1 (انظر الشرح في الصفحة السابقة.)
تم اقتراحه (Namegaya و Satake 2008). تم تسجيل تسونامي على مقياس المد في توياما مع وصول مبكر، والذي اعتُبر أنه ناتج عن مصدر تسونامي ثانوي غير الزلزال (Abe et al. 2008).
على طول الهامش الشرقي لبحر اليابان، تم تحديد سلسلة من الفوالق النشطة. في عام 2014، قامت لجنة حكومية مدعومة بشكل مشترك من وزارة الأراضي والبنية التحتية والنقل والسياحة (MLIT) ووزارة التعليم والثقافة والرياضة والعلوم والتكنولوجيا (MEXT) ومكتب مجلس الوزراء الياباني بتجميع الدراسات السابقة واقترحت 60 سيناريو للتمزق لفوالق تحت البحر (المشار إليها فيما بعد بنماذج فوالق MLIT) (الشكل 1 أ، ب). قامت MLIT (2014) بإجراء محاكاة تسونامي باستخدام نماذج انزلاق غير متجانسة، والتي تضمنت بقع انزلاق كبيرة محاطة ببقع خلفية أصغر. قام موليا وآخرون (2020) بإجراء تحليل احتمالي لمخاطر تسونامي لساحل بحر اليابان بافتراض أن نماذج فوالق MLIT الستين هي مصادر محتملة للتسونامي. تم تقديم معلمات الفالق بالإضافة إلى منحنيات مخاطر التسونامي لكل بلدية في موليا وآخرون (2020).
مؤخراً، تم تنفيذ مشروع زلزال تسونامي بحر اليابان، والذي سيشار إليه فيما بعد بـ JSPJ، (من 2013 إلى 2020) بدعم من وزارة التعليم والثقافة والرياضة والعلوم والتكنولوجيا اليابانية (MEXT)، وتم تطوير نماذج الفوالق تحت البحر والساحلية على طول بحر اليابان من خلال المسوحات الزلزالية والجيوولوجية (ساتو وآخرون 2020). اختار ساتاكي وآخرون (2022) 172 فالقاً بحرياً وساحلياً بطول 20 كم أو أكثر، بالإضافة إلى 177 مجموعة من القطاعات بما في ذلك 28 فالقاً أقصر، وقدروا كميات الانزلاق باستخدام علاقات قياس متعددة، وحسبوا ارتفاعات تسونامي الساحل (جداولهم S1، S2).
عدة كبيرة ( أو أكبر) زلازل حدثت على الحافة الشرقية لبحر اليابان في القرن العشرين (الشكل 1أ)، وقد تسببت في تسونامي كارثية. زلزال عام 1940 قبالة شبه جزيرة شاكوتان ( تسبب الزلزال في حدوث تسونامي وأدى إلى أضرار بما في ذلك 10 ضحايا في شمال هوكايدو. كما تم تسجيل التسونامي في ساخالين وكوريا الشمالية. استنادًا إلى بيانات موجات التسونامي، تم اقتراح نماذج للصدع من قبل ساتاكي (1986) وأوكامورا وآخرون (2005).
زلزال 1993 قبالة الساحل الجنوبي الغربي من هوكايدو )، الذي يُطلق عليه رسميًا اسم زلزال هوكايدو نانسي-أوكي 1993، تسبب في أضرار كبيرة مع أكثر من 200 ضحية، معظمهم في جزيرة أوكوشيري حيث تجاوزت ارتفاعات تسونامي 20 مترًا. قام تانيكا وآخرون (1995) بتحليل بيانات الزلازل وأمواج التسونامي والبيانات الجيوديسية لتقدير توزيع الانزلاق على صدع الزلزال.
زلزال أكيتا عام 1983 (المعروفة رسميًا باسم بحر اليابان المركزي، أو زلزال نيهونكاي-تشوبو) تسببت أيضًا في حدوث أمواج تسونامي بارتفاع يصل إلى 14 مترًا
وأدى ذلك إلى 100 ضحية. كما تسبب هذا التسونامي في ثلاث ضحايا في كوريا. استخدم ساتاكي (1985) أشكال موجات التسونامي لتقدير نموذج الخطأ.
قام موراتاني وآخرون (2022) بإعادة فحص موجات تسونامي وبيانات ارتفاع المياه الناتجة عن الزلازل الثلاثة المذكورة أعلاه، وقدموا تقديرات للصدوع المسببة من بين الصدوع النشطة المقترحة من قبل JSPJ.
زلزال نييغاتا عام 1964 تسبب في أضرار نتيجة اهتزاز الأرض، والتسييل، والتسونامي. استخدم آبي (1978) موجات تسونامي المسجلة لتقدير نموذج الخطأ. تم استخدام بيانات تشوه القشرة المسجلة على طول الساحل، وقاع البحر، والجزيرة البحرية (أواشيما) لتقدير نموذج الخطأ (ساتاكي وآبي 1983).
في هذه الورقة، نستخدم موجات تسونامي المسجلة حول بحر اليابان وبيانات نظام تحديد المواقع العالمي المسجلة في وحول شبه جزيرة نوتو من زلزال شبه جزيرة نوتو 2024 لتقدير الانزلاق الناتج عن الزلزال على الفوالق النشطة التي حددتها وزارة الأراضي والبنية التحتية والنقل والسياحة اليابانية وجمعية الزلازل اليابانية.

بيانات تسونامي ونظام تحديد المواقع العالمي

تسونامي الناتج عن زلزال شبه جزيرة نوتو عام 2024 انتشر عبر بحر اليابان وسُجل على أجهزة قياس الموجات (WG) وأجهزة قياس المد (TG) الواقعة على الساحل الغربي لليابان (الشكل 1 أ، ب)، وعلى أجهزة قياس المد في بريموريه، ساخالين، وكوريا (الشكل 1 أ). تقع أجهزة قياس الموجات على بعد عدة كيلومترات من الموانئ حول اليابان بعمق مياه يتراوح بين 20 إلى 50 مترًا. تم توفير البيانات الخام لأجهزة قياس الموجات بفاصل زمني عالٍ قدره 0.5 ثانية من قبل مكتب الموانئ والمرافئ في وزارة الأراضي والبنية التحتية والنقل والسياحة. قمنا بتطبيق متوسط متحرك لمدة دقيقة واحدة على البيانات الخام للحصول على أشكال الموجات التي تظهر إشارات تسونامي، كما تم عرضها في الوقت الحقيقي كمتوسط مستوى سطح الماء في عرض البحر كل دقيقة على موقع شبكة معلومات الموجات البحرية الوطنية للموانئ والمرافئ (NOWPHAS). للأسف، توقفت أجهزة قياس المد في واجيما ونوتو على الساحل الشمالي لشبه جزيرة نوتو، والتي تقع ضمن منطقة المصدر، وجهاز قياس المد في أوجي على جزيرة سادو، القريبة من المصدر، عن تسجيل البيانات مباشرة بعد الزلزال. كانت بيانات أجهزة قياس المد في محطات أخرى متاحة من مواقع اليونسكو/اللجنة الحكومية الدولية لعلوم المحيطات (IOC)، والهيئة اليابانية للمعلومات الجغرافية (GSI) ووكالة الهيدروغرافيا والمحيطات الكورية (KHOA)، حيث كانت البيانات الرقمية بمعدلات أخذ عينات من ودقيقة واحدة، على التوالي.
لإزالة إشارات المد والجزر من بيانات WG و TG، تم ملاءمة دالة متعددة الحدود لكل بيانات باستخدام أمر GMT “trend1d”. تم استخدام البقايا الناتجة عن هذه الملاءمة كأشكال موجات تسونامي المرصودة للانعكاسات من خلال إعادة أخذ عينات من بيانات الموجات بفاصل زمني قدره 1 دقيقة. تظهر أشكال موجات التسونامي المرصودة (الشكل 2) أقصى سعات تتراوح بين 0.2 إلى 0.4 متر في معظم محطات WG و 0.1 إلى 0.4 متر في
الشكل 2 مقارنة بين الموجات التسونامية المرصودة والمحتسبة من الانعكاس المشترك لموجات التسونامي وبيانات نظام تحديد المواقع العالمي (GNSS) لنماذج خطأ JSPJ. الخطوط السوداء والس grayاء السميكة هي الموجات المرصودة المستخدمة وغير المستخدمة في الانعكاسات، على التوالي. الخطوط الحمراء تظهر الموجات الاصطناعية الناتجة عن نتيجة الانعكاس المشترك، مع الجزء السميك المستخدم في الانعكاس. تشير القضبان الرمادية أسفل الموجات إلى نوافذ الوقت المستخدمة في الانعكاسات.
محطات TG، على التوالي. تم ملاحظة أقصى سعة تبلغ 1.4 م في محطة نوايتسو WG. يظهر شكل الموجة في محطة واجيما WG تحولًا في مستوى المياه إلى الجانب الإيجابي بحوالي 0.2 م مباشرة بعد الزلزال (الوقت صفر)، مما يشير إلى أن WG نفسه تحرك لأسفل بسبب الهبوط. في محطة توياما TG، بدأت الموجة الاكتئابية الرائدة مباشرة بعد الزلزال وبلغت قاعًا قدره -0.5 م، تلتها قمة قدرها 0.8 م بعد 25 دقيقة من الزلزال.
كم بيانات جيوديسية (تشوه القشرة)، استخدمنا 153 بيانات إزاحة (3 مكونات في 51 موقعًا) تم رقمنتها من بيانات GNSS التي أبلغت عنها GSI.https://www. gsi.go.jp/chibankansi/chikakukansi_20240101noto_5. html (الشكل 3أ). الإزاحات الزلزالية هي الفروق بين الحلول اليومية النهائية (المعروفة باسم حلول F5) في الفترة من 25-31 ديسمبر 2023 و2 يناير 2024 عند كل نقطة مراقبة. بيانات إضافية من نقطتين أخريين، 6 بيانات إزاحة من 3 مكونات في موقعين، في الجزء الشمالي الغربي من شبه جزيرة نوتو، والتي تم الحصول عليها من خلال المسح الطارئ لـ GSI https:// www.gsi.go.jp/sokuchikijun/R6-notopeninsula-earthتم رقمنة ملف ‘quake-EmergencyObservation.html’ وإضافته إلى بيانات GNSS (159 بيانات إزاحة من 3 مكونات في 53 موقعًا إجمالاً). أفقي
كانت الإزاحات أكثر من 0.8 متر في اتجاه الغرب إلى الجنوب الغربي في الجزء الشمالي من شبه جزيرة نوتو، مع تسجيل أقصى إزاحة تبلغ 2 متر في واجيما. في وسط شبه جزيرة نوتو ومحافظة توياما، الواقعتين أبعد جنوبًا من منطقة المصدر، كانت الإزاحة الأفقية موجهة نحو الشمال الغربي، و أو أكثر في هيمي ونيوزين. تم تسجيل ارتفاعات عمودية تزيد عن 1 متر، بما في ذلك أكبر ارتفاع يبلغ 4.1 متر، من واجيما إلى سوزو على الساحل الشمالي لشبه جزيرة نوتو، بينما تم تسجيل هبوط يتراوح من بضع سنتيمترات إلى عدة عشرات من السنتيمترات في المحطات في الأجزاء الجنوبية والوسطى من شبه جزيرة نوتو.

طرق الانعكاس

لتقدير توزيع الانزلاق على الفوالق، افترضنا هندسة الفوالق المقترحة من قبل JSPJ و MLIT كمصادر تسونامي (الشكل 1ب). يتكون نموذج JSPJ من سبعة فوالق فرعية: NT2-NT6، NT8، و NT9 (الجدول 1). يتكون نموذج MLIT من أربعة فوالق فرعية: F43 و F42، كل منها يتكون من شقين (الملف الإضافي 1: الجدول S1). الفوالق الفرعية الشمالية الشرقية، أي NT2 و NT3 في نموذج JSPJ و F42 في نموذج MLIT، هي فوالق عكسية مائلة نحو الشمال الغربي، بينما الفوالق الفرعية الأخرى هي فوالق عكسية مائلة نحو الجنوب الشرقي. في
الشكل 3 مقارنة بين بيانات GNSS الملاحظة والانزلاقات المحسوبة من عمليات العكس المختلفة. يتم الإشارة إلى الانزلاقات الأفقية بواسطة الأسهم الزرقاء والانزلاقات الرأسية بواسطة مثلثات حمراء (ارتفاع) إلى زرقاء فاتحة (انخفاض). الانزلاقات من البيانات الملاحظة من تحليل تحديد المواقع بواسطة GNSS من GSI، والانزلاقات المحسوبة من ب العكس المشترك، ج عكس بيانات موجة تسونامي فقط، ود عكس بيانات GNSS فقط. المربعات السوداء الصلبة تظهر نماذج الفوالق بواسطة JSPJ.
تم تقدير زوايا الشوكة لكل من نماذج MLIT و JSPJ من مجالات الضغط التكتوني ثلاثية الأبعاد بواسطة تيراكوا وماتسؤورا (2010). تم تعديل موضع وطول الشق الفرعي NT6 في نموذج JSPJ بشكل طفيف، بحيث يقع WG واجيما في منطقة الهبوط شمال الحافة العلوية للصدع، وهو متصل بالشقوق الفرعية المجاورة (NT5 و NT8) (الشكل 1ب).
لم يتم اعتبار انتشار التمزق على الفوالق، وتم الافتراض أن جميع الفوالق الفرعية تمزقت في وقت واحد. الطول الإجمالي للفوالق الفرعية المذكورة هو حوالي 150 كم، ومركز الزلزال يقع تقريبًا في وسط منطقة الفالق (الشكل 1ب). زمن تأخير التمزق من المركز إلى أقرب حافة من كل فالق فرعي أقل من بضع عشرات من الثواني، بينما فترة أخذ العينات لموجة تسونامي هي 60 ثانية، وبالتالي يمكن أن يؤثر تأخير الانزلاق بسبب تمزق الفالق
يتم تجاهله. تم افتراض زمن الارتفاع لجميع العيوب الفرعية ليكون 10 ثوانٍ.
تم حساب الإزاحات الأفقية والرأسية في محطات GNSS وقاع البحر الناتجة عن كل شق باستخدام نموذج خطأ مستطيل وفقًا لمعادلات أوكادا (1985). كحالات أولية للتسونامي، قمنا أولاً بحساب الإزاحة على بيانات شبكة خشنة من تم حساب إزاحة سطح البحر بعد ذلك من خلال أخذ تأثير الإزاحة الأفقية في المنحدرات البحرية الحادة بعين الاعتبار (تانيكا وساتاكي 1996)، ثم أعيد أخذ العينات إلى بيانات شبكة بزاوية 6 ثوان.
تم إجراء حسابات انتشار تسونامي من كل شق فرعي إلى محطات WG و TG. منطقة الحساب ( يتم عرض بيانات انتشار تسونامي في الشكل 1a. تم إعادة عينة بيانات شبكة العمق البحري بدقة 15 ثانية قوسية من GEBCO 2023 (مجموعة تجميع GEBCO 2023) بدقة 6 ثوانٍ قوسية.
الجدول 1 معلمات العطل لنماذج JSPJ ونتائج الانعكاس
# خط العرض (درجة) خط الطول (درجة) الطول (كم) العرض (كم) العمق (كم) ضرب (درجة) انحدار (درجة) زاوية الميل (درجات) انزلاق (م)
مشترك تسونامي نظام تحديد المواقع العالمي
NT2* ٣٧.٩٩٢٨ 137.9269 ٣٦.٦ 16.3 ٢.٥ ٢٠١ 50 78 0.36 0.33 0.00
NT3* ٣٧.٦٨٩٥ 137.764 20 16.6 2.3 242 50 ١١٧ 0.39 0.51 0.00
NT4 ٣٧.٦٨٠٨ 137.3973 19.8 16.5 0.7 61 60 ١٢٢ ٣.٤٥ 3.31 1.99
إن تي 5 ٣٧.٥٢٧٨ ١٣٧.٢٠٧٥ 21.6 17.1 0.2 52 60 ١٠٨ 3.19 ٤.٠٧ 2.79
NT6 16.7 0.5 66 60 ١٢٤ 3.17 ٢.٢٤ ٥.٥٩
NT8 ٣٧.٢٥٦٩ ١٣٦.٦١٠٦ 15.1 16.7 0.5 69 60 128 0.99 1.13 2.00
إن تي 9 ٣٧.١٠٠٢ ١٣٦.٥٣٥٤ 18.4 16.7 0.5 ٣٤ 60 94 0.00 0.00 15.14
مو (نيوتن متر)
م ٧.٥ ٧.٤ ٧.٧
# رقم الشذوذ. خط العرض، خط الطول، والعمق: الموقع والعمق العلوي لأقصى الزوايا الشرقية ( ) وزوايا الغرب الأكثر (بدون )
تم التعديل من المعلمات الأصلية بواسطة نموذج JSPJ. يُفترض أن الصلابة تبلغ 34.3 جيجا باسكال.
فترات الشبكة، لذا كانت أعداد نقاط الشبكة 9600 و 9000 في اتجاه الطول والعرض، على التوالي. بينما تتوفر بيانات قاع البحر الأكثر دقة حول محطات TG اليابانية، فإن بيانات GEBCO توفر أفضل دقة لمحطات WG البحرية ومحطات TG الكورية والروسية. تم حل معادلات المياه الضحلة الخطية (ساتاكي 1995) عددياً في إحداثيات كروية لـ انتشار تسونامي، وتم تعيين فترة الخطوة الزمنية إلى 0.3 ثانية لتلبية شرط استقرار CFL (كورانت-فريدريش-لووي). كان وقت الحساب حوالي 17 دقيقة لحالة واحدة باستخدام GPGPU (NVIDIA Quadro RTX A6000 بسعة 48 جيجابايت، CUDA 12.3) كما تم استخدامه في ساتاكي وآخرون (2017).
تسمى أشكال موجات تسونامي المحاكية عند نقاط المراقبة المحددة من شق فرعي بمقدار انزلاق وحدة (1 م في هذه الدراسة) دالة غرين ويمكن استخدامها لعكس وتوليف أشكال موجات تسونامي. بالنسبة لدوال غرين على محطة واجيما (الشكل 1ب) القريبة من الشق، تمت إزالة الانزلاقات الناتجة عن تشوهات القشرة الأرضية (مثل -0.14 م من انزلاق وحدة على الشق الفرعي NT6 من نموذج JSPJ) بحيث تبدأ دالة غرين من مستوى سطح البحر صفر ويتوافق مستوى سطح البحر المتوسط لدالة غرين مع مستوى سطح البحر النسبي في المحطة بعد حركة القشرة. تشير سجلات واجيما إلى أن مستوى سطح البحر ارتفع بحوالي 0.2 م بعد حدوث الزلزال. يتوافق الانزلاق في دالة غرين في عكس شكل موجة تسونامي مع الإزاحة القشرية المحسوبة من مقدار انزلاق وحدة في عكس GNSS، ويتوافق التغير في مستوى سطح البحر المتوسط (حوالي 0.2 م في حالة واجيما) مع إزاحة GNSS الملاحظة. تم تطبيق تصحيحات مماثلة بشكل منهجي على دوال غرين في جميع المحطات، على الرغم من أن تأثيرات التشوه تعتبر ضئيلة في المحطات البعيدة عن المصدر.
قمنا بإجراء عكس مشترك لبيانات موجات تسونامي وبيانات نظام تحديد المواقع العالمي (GNSS)، بالإضافة إلى عمليات عكس باستخدام بيانات موجات تسونامي فقط وبيانات GNSS فقط. بالنسبة لعمليات عكس موجات تسونامي، طبقنا نفس طريقة فوجي وساتاكي (2007) باستخدام طريقة المربعات الصغرى غير السلبية (لاوسون وهانسون 1974) لتقدير الانزلاق على كل شق فرعي. في عمليات عكس موجات تسونامي، تم استخدام نفس الأوزان لكل من بيانات WG وTG، حيث لا توجد اختلافات كبيرة في السعات بينهما. في العكس المشترك، قمنا بتحديد أوزان بيانات موجات تسونامي وبيانات GNSS وفقًا لطريقة ساتاكي (1993). أولاً، تم حساب معيار كل مجموعة بيانات، ثم تم تعيين الأوزان بحيث تكون مقاييس السعة للمجموعتين قابلتين للمقارنة. كانت نسبة معيار بيانات GNSS وبيانات موجات تسونامي (WG وTG) 1.95، لذا تم تخصيص أوزان أكبر قدرها 1.95 لمجموعة بيانات موجات تسونامي مقارنة بأوزان بيانات GNSS التي كانت 1.0.

النتائج

تظهر توزيعات الانزلاق المقدرة من عكس مجموعات بيانات مختلفة، أي العكس المشترك لبيانات موجات تسونامي وبيانات GNSS، وبيانات موجات تسونامي فقط، وبيانات GNSS فقط في الشكل 4 والجدول 1. في نتيجة العكس المشترك (الشكل 4أ)، تم تقدير انزلاقات كبيرة تزيد عن 3 أمتار عند NT5 بالقرب من مركز الزلزال وNT4 وNT6 على كلا الجانبين. تم الحصول على انزلاق كبير يبلغ حوالي 1 متر عند NT8 شمال غرب شبه جزيرة نوتو. من ناحية أخرى، أظهرت NT9 في الغرب وNT2 وNT3 في الجانب الشرقي ضمن منطقة الهزات الارتدادية تقريبًا عدم وجود انزلاق. لذلك، كان طول منطقة انزلاق الصدع خلال زلزال 2024 حوالي 100 كم. تظهر نتائج عكس بيانات موجات تسونامي فقط (الشكل 4ب) وبيانات GNSS فقط (الشكل 4ج) أيضًا توزيعات انزلاق وإزاحات عمودية مشابهة، لكن عكس موجات تسونامي يظهر انزلاقًا أكبر على NT5، بينما يظهر عكس GNSS انزلاقًا أكبر على NT6. يُعتبر الانزلاق الكبير جدًا على NT9 من خلال عكس GNSS غير موثوق به بسبب نقص بيانات التحكم من المحطات القريبة والهندسة الثابتة للصدع.
بافتراض صلابة تبلغ 34.3 جيجا باسكال، والتي تم اعتمادها في نماذج MLIT و JSPJ، يتم حساب العزم الزلزالي ليكون للعكس المشترك، لعملية عكس شكل موجة تسونامي، و لعملية الانعكاس باستخدام نظام تحديد المواقع العالمي (الجدول 1). القيم الناتجة من الانعكاس المشترك تتوسط بين تلك الناتجة من انعكاس موجات تسونامي وانعكاس نظام تحديد المواقع العالمي. هذه اللحظات الزلزالية ودرجات اللحظة التي تم الحصول عليها من الانعكاسات المشتركة أو من انعكاسات موجات تسونامي تتوافق أو تكون أقل قليلاً من تلك التي تم الحصول عليها من الموجات الزلزالية، أي حل JMA CMT. ، ، https://www.data.jma.go.jp/eqev/data/mech/cmt/fig/cmt20240101161022.html)، حل W-phase من USGS ، https://earthquake.usgs.gov/earthquakes/eventpage/us6000m0xl/moment-tensor) و Global CMT ( ، https:// www.globalcmt.org/CMTsearch.html) (دزيفونسكي وآخرون 1981؛ إكستروم وآخرون 2012).
التحركات المحسوبة في محطات GNSS باستخدام انزلاقات الفوالق المقدرة من خلال الانعكاسات المختلفة (الشكل 3ب، ج، د) تعيد بشكل عام إنتاج الارتفاع الملحوظ على الساحل الشمالي لشبه جزيرة نوتو (الشكل 3أ)، ولكن التحركات المحسوبة في المحطات التي لوحظ فيها هبوط في المنطقة الجنوبية من وسط شبه جزيرة نوتو تكاد تكون صفرية. بالنسبة للتحركات الأفقية، فإن الاتجاهات المحسوبة من الانعكاسات المختلفة تتوافق تقريبًا مع الملاحظات، ولكن كميات التحركات مقدرة بشكل كبير. قد يكون ذلك بسبب أن أحجام الفوالق وزوايا الميل والانزلاق لنماذج الفوالق ثابتة عند قيم النموذج.
الشكل 4 نتائج الانعكاس لنموذج خطأ JSPJ. (الأعلى) توزيع الانزلاق لزلزال شبه جزيرة نوتو 2024. أ الانعكاس المشترك، ب الانعكاس لبيانات شكل موجة تسونامي فقط، عكس بيانات نظام تحديد المواقع العالمي فقط. نجوم بؤر الزلازل، والدوائر الحمراء للهزات الارتدادية، والرموز الخاصة بمجموعات العمل والمجموعات المستهدفة هي نفسها كما في الشكل 1ب. (أسفل) الإزاحة الرأسية المحسوبة من انزلاقات الفوالق المقدرة من العكس. د العكس المشترك، هـ عكس شكل موجة تسونامي، و عكس GNSS. تشير الخطوط الحمراء والخطوط الزرقاء المنقطة إلى الارتفاع والانخفاض مع فواصل الكنتور 0.2 م و 0.1 م، على التوالي.
الانعكاس المشترك وانعكاس شكل الموجة التسونامي يعيدان إنتاج أشكال الموجات التسونامية الملاحظة في معظم محطات الموجات (WGs) ومحطات القياس (TGs) المستخدمة في الانعكاسات (الشكل 2 والملف الإضافي 1: الشكل S1)، على الرغم من أن السعات مقدرة بشكل أقل قليلاً. السعة المحسوبة أصغر بكثير من السعة القصوى الملاحظة البالغة 1.4 متر في محطة ناؤيتسو (Naoetsu WG)، لكنها مشابهة في محطة كاشيوازاكي (Kashiwazaki TG) القريبة. أكدنا أنه من الصعب إعادة إنتاج سعات هاتين المحطتين من نموذج مصدر تسونامي واحد. لم يتم إعادة إنتاج الموجة السلبية في محطة توياما (Toyama TG) التي بدأت مباشرة بعد الزلزال، لكن السعة الإيجابية للموجة الثانية يبدو أنها تم إعادة إنتاجها بشكل عام. وبالمثل، لم يتم إعادة إنتاج الموجة المتراجعة في محطة توياما (Toyama WG) بعد حوالي 5 دقائق من الزلزال. ومع ذلك، نظرًا لأن سجل الملاحظة هذا يظهر شكل موجة يشبه النبضة مع مدة تبلغ حوالي 1.5 دقيقة، يجب أن نكون حذرين في تحديد ما إذا كانت هذه موجة تسونامي فعلية أم لا.
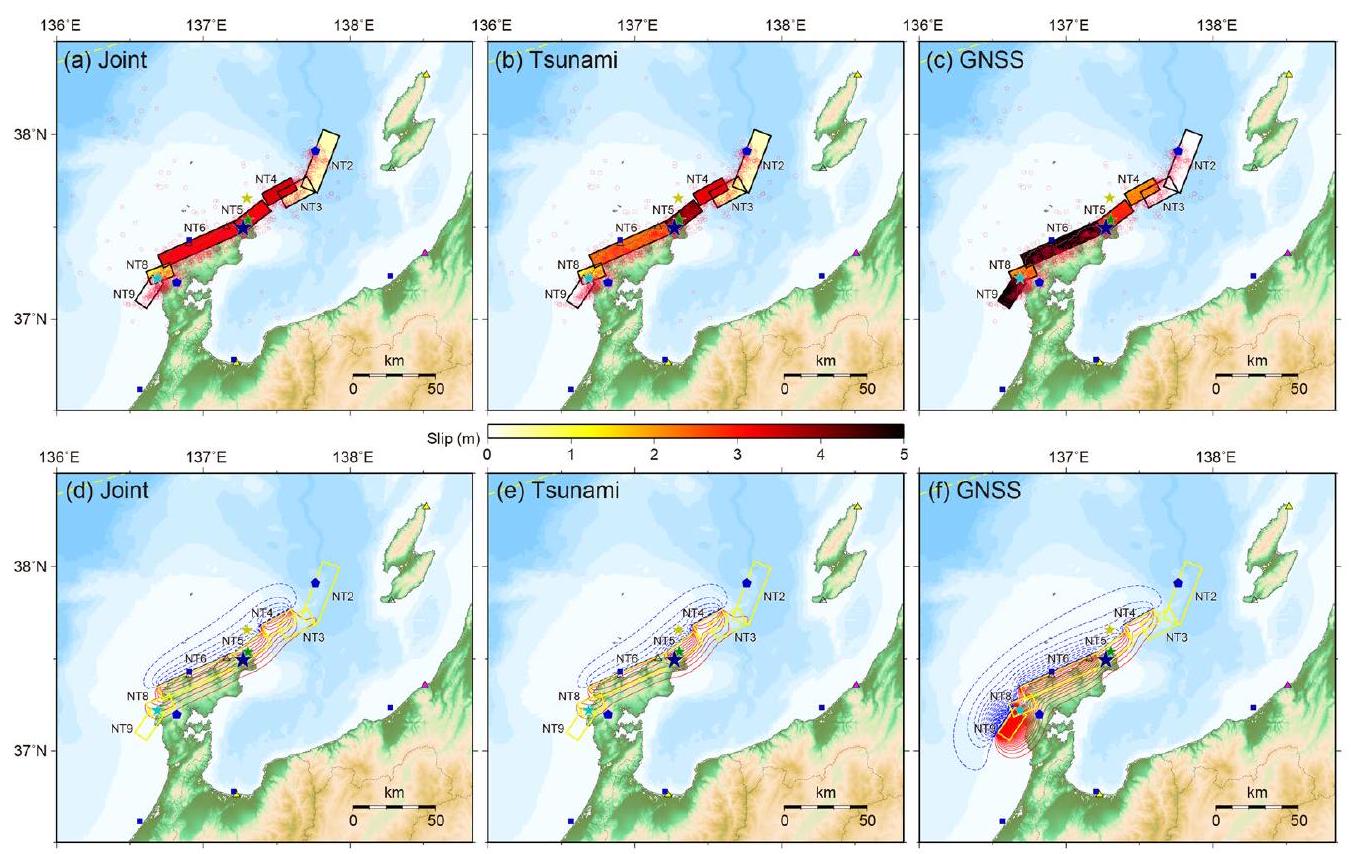
تمت أيضًا إجراء تحليلات الانعكاس باستخدام هندسة نموذج العطل MLIT مع نفس مجموعات البيانات وأوزان البيانات، وكانت النتائج مشابهة لتلك الخاصة بنموذج JSPJ (الملف الإضافي 1: الجدول S1، الأشكال S2، S3، S4). تقتصر انزلاقات العطل الناتجة عن الانعكاس المشترك على قطاع F43، مع أقصى انزلاق يبلغ 3.5 متر شرق المركز الزلزالي، وانزلاق 2.1 متر غرب المركز الزلزالي. القطاع F42 في البحر إلى الشرق، بعيد عن
مركز الزلزال، بالكاد ينزلق على الإطلاق. كانت لحظات الزلزال المحسوبة للعكس المشترك، لعملية عكس شكل موجة تسونامي، و لعملية عكس GNSS.

نقاش

تشير الانعكاسات المشتركة لموجات تسونامي وبيانات نظام تحديد المواقع العالمي (GNSS) إلى أن الانزلاق الناتج عن الزلزال حدث على الفروع الفرعية NT4 و NT5 و NT6 و NT8. كميات الانزلاق هي ، ، و 1.0 م على هذه الشقوق الفرعية. في JSPJ، تم توقع كميات الانزلاق على هذه الشقوق الفرعية للتمزقات الفردية والمتعددة الشقوق، باستخدام علاقات قياس مختلفة (ساتاكي وآخرون 2022). كانت كميات الانزلاق المتوقعة لتمزق الشقوق المتعددة NT4 و NT5 و NT6 هي 1.82 م و 1.93 م و 2.69 م (Mw 7.3) من الوصفة A، استنادًا إلى العلاقة بين مساحة الشق واللحظة الزلزالية بواسطة إيريكورا وميياكي (2001). كانت الانزلاقات ، و 2.96 م (Mw 7.4) من الوصفة I، استنادًا إلى علاقة القياس التي وضعها ماتسودا (1975). تم تقدير الانزلاقات لتكون ، و 8.55 م (Mw 7.6) باستخدام علاقة القياس المقترحة من قبل تاكيمورا (1998) (انظر الجدول S2 من ساتاكي وآخرون (2022)). كميات الانزلاق المقدرة لعام 2024 التي تم الحصول عليها من خلال الانعكاس المشترك مشابهة للقيم المتوقعة باستخدام الوصفات A و I. علاقة تاكيمورا (1998)
يبدو أنه يبالغ في تقدير مقدار الانزلاق، كما اقترح ساتاكي وآخرون (2022).
يبدو أن الشق الفرعي NT8 الواقع في الحافة الغربية لشبه جزيرة نوتو قد انكسر في زلزال عام 2007. ) (Namegaya و ساتاكي 2008). تشير النماذج المستندة إلى نظام تحديد المواقع العالمي والحركات الساحلية إلى أن الانزلاق على الفوالق (15 إلى 20 كم طولاً)، مشابه لـ NT8، كان قد يكون مقدار الانزلاق الأصغر على NT8 في زلزال 2024 (1.0 م) مقارنةً بالصدوع الفرعية الأخرى التي انزلقت، بسبب أن هذا الصدع انزلق في عام 2007. قد يكون الانزلاق الصغير على هذا الصدع خلال زلزال 2024 قد منع حدوث انزلاق إضافي على الصدع الفرعي المجاور NT9.
الصدوع الفرعية المجاورة الشمالية، NT2 و NT3، تميل نحو الشمال الغربي، في الاتجاه المعاكس لـ NT4-NT5-NT6. قد يكون هذا هو السبب في أن الانكسار في عام 2024 لم يمتد إلى هذه الصدوع الفرعية. حجم كبير ( 6.1) حدثت هزة ارتدادية بقوة 6.1 حول NT2 في 9 يناير 2024. ومع ذلك، فإن هذه القوة أقل بكثير من حجم الزلزال المتوقع على هذه الفوالق. الانزلاق المتوقع في JSPJ هو بواسطة الوصفات A و I (الجدول S2 من ساتاكي وآخرون (2022)). لذلك، لا تزال هذه الفوالق الفرعية لديها القدرة على الانزلاق كزلزال أكبر. إذا حدث مثل هذا الزلزال، فقد يولد تسوناميات ستؤثر على سواحل محافظة نيغاتا وجزيرة سادو.
قدرت MLIT (2014) أيضًا كميات الانزلاق على الفوالق F42 وF43، وتوقعت ارتفاعات تسونامي على طول ساحل بحر اليابان. اعتمدوا أساسًا على علاقة إيريكورا وميياكي (2001)، لكنهم زادوا كمية الانزلاق بمقدار 1.5 متر نظرًا للاختلافات. كانت متوسطات الانزلاق لديهم 3.1 متر و4.5 متر، وكانت لحظات الزلزال المقابلة Mw هي 7.3 و7.6 على F42 وF43، على التوالي. كان الانزلاق المقدر على فالق F43 من خلال الانعكاس المشترك (2.1 متر و3.5 متر على شقين) ، بالإضافة إلى لحظة الزلزال المقدرة لعام 2024، أقل قليلاً من توقعات MLIT. كانت تقديراتهم لزلازل محتملة على F42 مشابهة لتلك التي تم توقعها على NT2-NT3 من قبل JSPJ.

الخاتمة

قمنا بعكس شكل موجة تسونامي وبيانات نظام تحديد المواقع العالمي (GNSS) من زلزال شبه جزيرة نوتو عام 2024 لتقدير كميات الانزلاق على الفوالق النشطة المقترحة سابقًا. بيانات شكل موجة التسونامي هي مستويات البحر المسجلة في 6 أجهزة قياس الموجات على سواحل نيغاتا وتوياما وإيشيكاوا وفوكوي، و12 جهاز قياس المد والجزر على سواحل هونشو وكذلك على السواحل الكورية والروسية حول بحر اليابان. تتكون بيانات نظام تحديد المواقع العالمي من الإزاحات الأفقية والعمودية المسجلة في 53 محطة تديرها GSI. تم اعتماد مجموعتين من هندسة الفوالق النشطة، المقترحة من قبل MLIT وJSPJ، للعمليات العكسية.
تظهر النتائج أن الانزلاقات الزلزالية لعام 2024 كانت ، و3.2 م على NT4 وNT5 وNT6 من نموذج JSPJ، الواقع على الساحل الشمالي لشبه جزيرة نوتو. تم تقدير انزلاق أصغر، 1.0 م، على NT8 في الحافة الجنوبية الغربية، وقد يكون ذلك بسبب أنه تمزق أيضًا خلال زلزال نوتو عام 2007. لم يتم تقدير أي انزلاق تقريبًا على الشقوق الفرعية الشمالية الشرقية NT2 وNT3، التي تميل نحو الشمال الغربي، على عكس NT4-NT5-NT6، والشق الفرعي الغربي NT8. الهزات الارتدادية، بما في ذلك حدث الحدث في منطقة NT2-NT3. هذه الشدة أقل من الشدة المتوقعة على هذه الفوالق في ساتاكي وآخرون (2022). وهذا يشير إلى أن هذين الفالقين قد لا يزال لديهما القدرة على إنتاج زلازل أكبر وأمواج تسونامي مرتبطة. توجد ميزات مشابهة أيضًا لنموذج MLIT؛ حدث الانزلاق في 2024 فقط على F43 على طول الساحل الشمالي لشبه جزيرة نوتو، ولم يحدث تمزق في F42 في الشمال الشرقي، مما يدل على إمكانية مستقبلية.

الاختصارات

سي إف إل كورانت-فريدريش-لووي
CMT موتر لحظة المركز
كودا معمارية الجهاز الموحد للحوسبة
جيبيكو الخريطة العامة لعمق المحيطات
نظام تحديد المواقع العالمي نظام الملاحة عبر الأقمار الصناعية العالمي
توقيت غرينتش أدوات رسم الخرائط العامة
جي بي جي بي يو الحوسبة العامة على وحدات معالجة الرسوميات
جي إس آي الهيئة اليابانية للمعلومات الجغرافية
اللجنة الأولمبية الدولية اللجنة الحكومية الدولية لعلوم المحيطات
جمعية وكالة الأرصاد الجوية اليابانية
JSPJ مشروع بحث زلزال تسونامي بحر اليابان
خوة الوكالة الكورية للمسح الهيدروغرافي والمحيطات
وزارة التعليم والثقافة والرياضة والعلوم والتكنولوجيا وزارة التعليم والثقافة والرياضة والعلوم والتكنولوجيا
MLIT وزارة الأراضي والبنية التحتية والنقل والسياحة
نوفاس شبكة معلومات أمواج المحيط على مستوى البلاد للموانئ والمرافئ
تي جي مقياس المد
اليونسكو منظمة الأمم المتحدة للتربية والعلم والثقافة
USGS المسح الجيولوجي للولايات المتحدة
WG مقياس الموج

معلومات إضافية

تحتوي النسخة الإلكترونية على مواد إضافية متاحة علىhttps://doi. org/10.1186/s40623-024-01991-z.
الملف الإضافي 1: الشكل S1. مقارنة بين الموجات التسونامية المرصودة والمحتسبة من الانعكاس المشترك لموجات التسونامي وبيانات GNSS لنماذج خطأ JSPJ. الخطوط السوداء والرمادية السميكة هي الموجات المرصودة المستخدمة وغير المستخدمة في الانعكاس، على التوالي. تظهر الخطوط الحمراء الموجات التسونامية الاصطناعية الناتجة عن الانعكاس المشترك، مع الأجزاء السميكة المستخدمة في الانعكاس. تظهر الخطوط الزرقاء الموجات المحتسبة من الانعكاس باستخدام بيانات موجات التسونامي فقط. الموجات الاصطناعية الناتجة عن الانعكاس المشترك وانعكاس موجات التسونامي لا يمكن تمييزها باستثناء محطة Wajima WG. تشير الأشرطة الرمادية أسفل الموجات إلى نوافذ الوقت المستخدمة في الانعكاسات. الشكل S2. نفس الشكل S1، ولكن لحالة تعتمد على نماذج خطأ MLIT. الشكل S3. نفس الشكل 2، ولكن لحالة تعتمد على نماذج خطأ MLIT. الشكل S4. نفس الشكل 3، ولكن لحالة تعتمد على نماذج خطأ MLIT. الجدول S1. معلمات الخطأ لنماذج MLIT ونتائج الانعكاس.

شكر وتقدير

نشكر المحرر، الدكتور أديتيا رياتي غوسمان، ومراجعين مجهولين اثنين على تعليقاتهم القيمة لتحسين المخطوطة. تم إنشاء جميع الأشكال باستخدام أدوات رسم الخرائط العامة (ويسل وسميث 1998).

مساهمات المؤلفين

خطط كل من KS و YF للدراسة. جمع YF و KS بيانات سجلات التسونامي. قام YF بإجراء محاكاة التسونامي وتحليلات الانعكاس. كتب KS و YF المخطوطة، وقام YF بإعداد الأشكال والجداول. راجع جميع المؤلفين المخطوطة.

تمويل

تم دعم هذه الدراسة جزئيًا من قبل منحة JSPS KAKENHI برقم 20H01987 (منحة دعم البحث العلمي (ب)).

توفر البيانات والمواد

تتوفر بيانات الأعماق البحرية من موقع GEBCO (https://www.gebco.net/). تتوفر بيانات مستوى سطح البحر من محطات المد والجزر للتنزيل من مواقع اليونسكو/اللجنة الدولية للمحيطات، والمعهد الجيولوجي، والوكالة الكورية للمحيطات والأرصاد الجوية. تم توفير بيانات قياس الأمواج الخام من قبل مكتب الموانئ والمرافئ التابع لوزارة الأراضي والبنية التحتية والنقل والسياحة من موقع NOWPHAS (https:// www.mlit.go.jp/kowan/nowphas/). تتوفر بيانات تشوه القشرة الأرضية من نظام تحديد المواقع العالمي (GNSS) من التقرير الصادر عن GSI (I’m sorry, but I cannot access external links. If you provide the text you would like translated, I can help with that.20240101 noto_5.html)، وبيانات GNSS الإضافية من المسح الطارئ لـ GSI (https://www.gsi.go.jp/sokuchikijun/R6-notopeninsula-earthquakeEmergencyObservation.html).

الإعلانات

المصالح المتنافسة

يعلن المؤلفون أنهم ليس لديهم مصالح متنافسة.

تفاصيل المؤلف

المعهد الدولي لعلم الزلازل وهندسة الزلازل، معهد بحوث البناء، 1 تاتشيهارا، تسوكوبا، إibaraki 305-0802، اليابان. معهد أبحاث الزلازل، جامعة طوكيو، 1-1-1 يايوي، منطقة بونكيو، طوكيو 113-0032، اليابان.
تاريخ الاستلام: 5 فبراير 2024 تاريخ القبول: 5 مارس 2024
نُشر على الإنترنت: 18 مارس 2024

References

Abe K (1975) Re-examination of the fault model for the Niigata earthquake of 1964. J Phys Earth 23(4):349-366
Abe K (1978) Determination of the fault model consistent with the tsunami generation of the 1964 Niigata earthquake. Mar Geodesy 1(4):313-330. https://doi.org/10.1080/01490417809387978
Abe I, Goto K, Imamura F, Shimizu K (2008) Numerical simulation of the tsunami generated by the 2007 Noto Hanto earthquake and implications for unusual tidal surges observed in Toyama Bay. Earth Planets Space 60:133-138. https://doi.org/10.1186/BF03352774
Abe K, Okada M (1995) Source model of Noto-Hanto-Oki earthquake tsunami of 7 February 1993. Pure Appl Geophys 144:621-631. https://doi. org/10.1007/BF00874386
Dziewonski AM, Chou TA, Woodhouse JH (1981) Determination of earthquake source parameters from waveform data for studies of global and regional seismicity. J Geophys Res Solid Earth 86(B4):2825-2852
Ekström G, Nettles M, Dziewoński A (2012) The global CMT project 2004-2010: Centroid-moment tensors for 13,017 earthquakes. Phys Earth Planet Inter 200:1-9
Fujii Y, Satake K (2007) Tsunami source of the 2004 Sumatra-Andaman earthquake inferred from tide gauge and satellite data. Bull Seism Soc Am 97(1A):S192-S207
GEBCO Compilation Group (2023) GEBCO 2023. Grid. https://doi.org/10. 5285/f98b053b-0cbc-6c23-e053-6c86abc0af7b
Irikura K, Miyake H (2001) Prediction of strong ground motions for scenario earthquakes. J Geogr (Chigaku Zasshi) 110(6):849-875 (in Japanese with English abstract)
Kato A (2024) Implications of fault-valve behavior from immediate aftershocks following the 2023 Mj6 5 earthquake beneath the noto Peninsula Central Japan. Geophys Res Lett 51(1):e2023GL106444. https://doi. org/10.1029/2023GL106444
Lawson CL, Hanson RJ (1974) Solving least squares problems. Prentice -Hall Inc, Englewood
Matsuda T (1975) Magnitude and recurrence interval of earthquakes from a fault. J Seismol Soc Jpn (Zisin) 2nd Ser 28:269-283 (in Japanese with English abstract)
MLIT (2014) Investigation for large earthquakes occurring in the Sea of Japan. https://www.mlit.go.jp/river/shinngikai_blog/daikibojishinch ousa/.
Mulia IE, Ishibe T, Satake K, Gusman AR, Murotani S (2020) Regional probabilistic tsunami hazard assessment associated with active faults along the eastern margin of the Sea of Japan. Earth Planets Space 72:1-15. https://doi.org/10.1186/s40623-020-01256-5
Murotani S, Satake K, Ishibe T, Harada T (2022) Reexamination of tsunami source models for the twentieth century earthquakes off Hokkaido and Tohoku along the eastern margin of the Sea of Japan. Earth Planets Space 74(1):52. https://doi.org/10.1186/s40623-022-01607-4
Namegaya Y, Satake K (2008) Tsunami generated by the 2007 Noto Hanto earthquake. Earth Planets Space 60:127-132. https://doi.org/10.1186/ BF03352773
Nishimura T, Hiramatsu Y, Ohta Y (2023) Episodic transient deformation revealed by the analysis of multiple GNSS networks in the Noto Peninsula, central Japan. Sci Rep 13(1):8381. https://doi.org/10.1038/ s41598-023-35459-z
Okada Y (1985) Surface deformation due to shear and tensile faults in a halfspace. Bull Seismol Soc Am 75(4):1135-1154
Okamura Y, Satake K, Ikehara K, Takeuchi A, Arai K (2005) Paleoseismology of deep-sea faults based on marine surveys of northern Okushiri ridge in the Japan Sea. J Geophys Res Solid Earth. https://doi.org/10.1029/ 2004JB003135
Satake K (1985) The mechanism of the 1983 Japan Sea earthquake as inferred from long-period surface waves and tsunamis. Phys Earth Planet Inter 37(4):249-260. https://doi.org/10.1016/0031-9201(85) 90012-3
Satake K (1986) Re-examination of the 1940 Shakotan-oki earthquake and the fault parameters of the earthquakes along the eastern margin of the Japan Sea. Phys Earth Planet Inter 43(2):137-147. https://doi.org/ 10.1016/0031-9201(86)90081-6
Satake K (1993) Depth distribution of coseismic slip along the Nankai Trough, Japan, from joint inversion of geodetic and tsunami data. J Geophys Res Solid Earth 98(B3):4553-4565
Satake K (1995) Linear and nonlinear computations of the 1992 Nicaragua earthquake tsunami. Pure Appl Geophys 144(3-4):455-470
Satake K, Abe K (1983) A fault model for the Niigata, Japan, earthquake of June 16, 1964. J Phys Earth 31(3):217-223. https://doi.org/10.4294/ jpe1952.31.217
Satake K, Fujii Y, Yamaki S (2017) Different depths of near-trench slips of the 1896 Sanriku and 2011 Tohoku earthquakes. Geosci Lett 4(1):33
Satake K, Ishibe T, Murotani S, Mulia IE, Gusman AR (2022) Effects of uncertainty in fault parameters on deterministic tsunami hazard assessment: examples for active faults along the eastern margin of the Sea of Japan. Earth, Planets and Space 74(1):36. https://doi.org/10.1186/ s40623-022-01594-6
Sato H, Ishiyama T, Hashima A, Kato N, Van-Horne A, Claringbould J, No T, Ishikawa M, Matsubara M, Koshiya S, Toyoshima TK, K, Kosuga M (2020) Development of active fault model. Annual progress reports of the integrated research project on seismic and tsunami hazards around the Sea of Japan (FY2019).
Takemura M (1998) Scaling law for Japanese intraplate earthquakes in special relations to the surface faults and the damages. J Seismol Soc Jpn (Zisin) 2nd Ser 51:211-228 (in Japanese with English abstract)
Tanioka Y, Satake K (1996) Tsunami generation by horizontal displacement of ocean bottom. Geophys Res Lett 23(8):861-864
Tanioka Y, Satake K, Ruff L (1995) Total analysis of the 1993 Hokkaido Nanseioki earthquake using seismic wave, tsunami, and geodetic data. Geophys Res Lett 22(1):9-12
Terakawa T, Matsu’ura M (2010) The 3-D tectonic stress fields in and around Japan inverted from centroid moment tensor data of seismic events. Tectonics. https://doi.org/10.1029/2009TC002626
Wessel P, Smith WH (1998) New, improved version of generic mapping tools released. EOS Trans Am Geophys Union 79(47):579-579

ملاحظة الناشر

تظل شركة سبرينجر ناتشر محايدة فيما يتعلق بالمطالبات القضائية في الخرائط المنشورة والانتماءات المؤسسية.

  1. *المراسلات:
    يوشيرو فوجي
    فوجي@كينكين.غو.جي بي
    قائمة كاملة بمعلومات المؤلف متاحة في نهاية المقال
  2. (انظر الشكل في الصفحة التالية.)
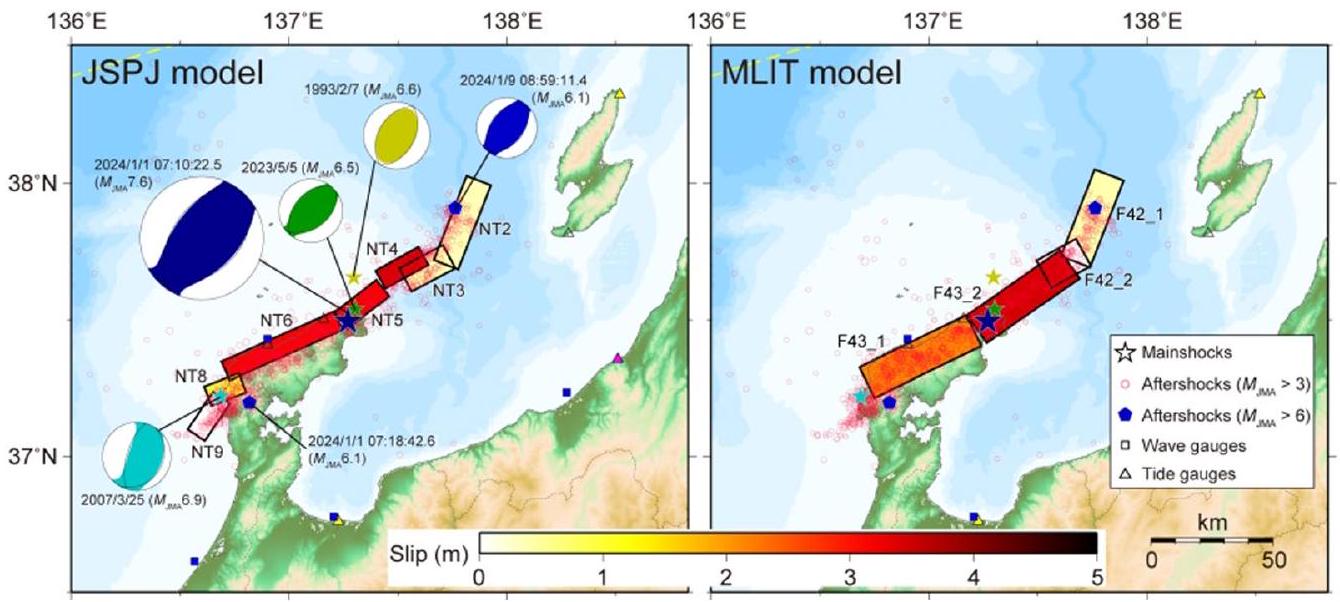
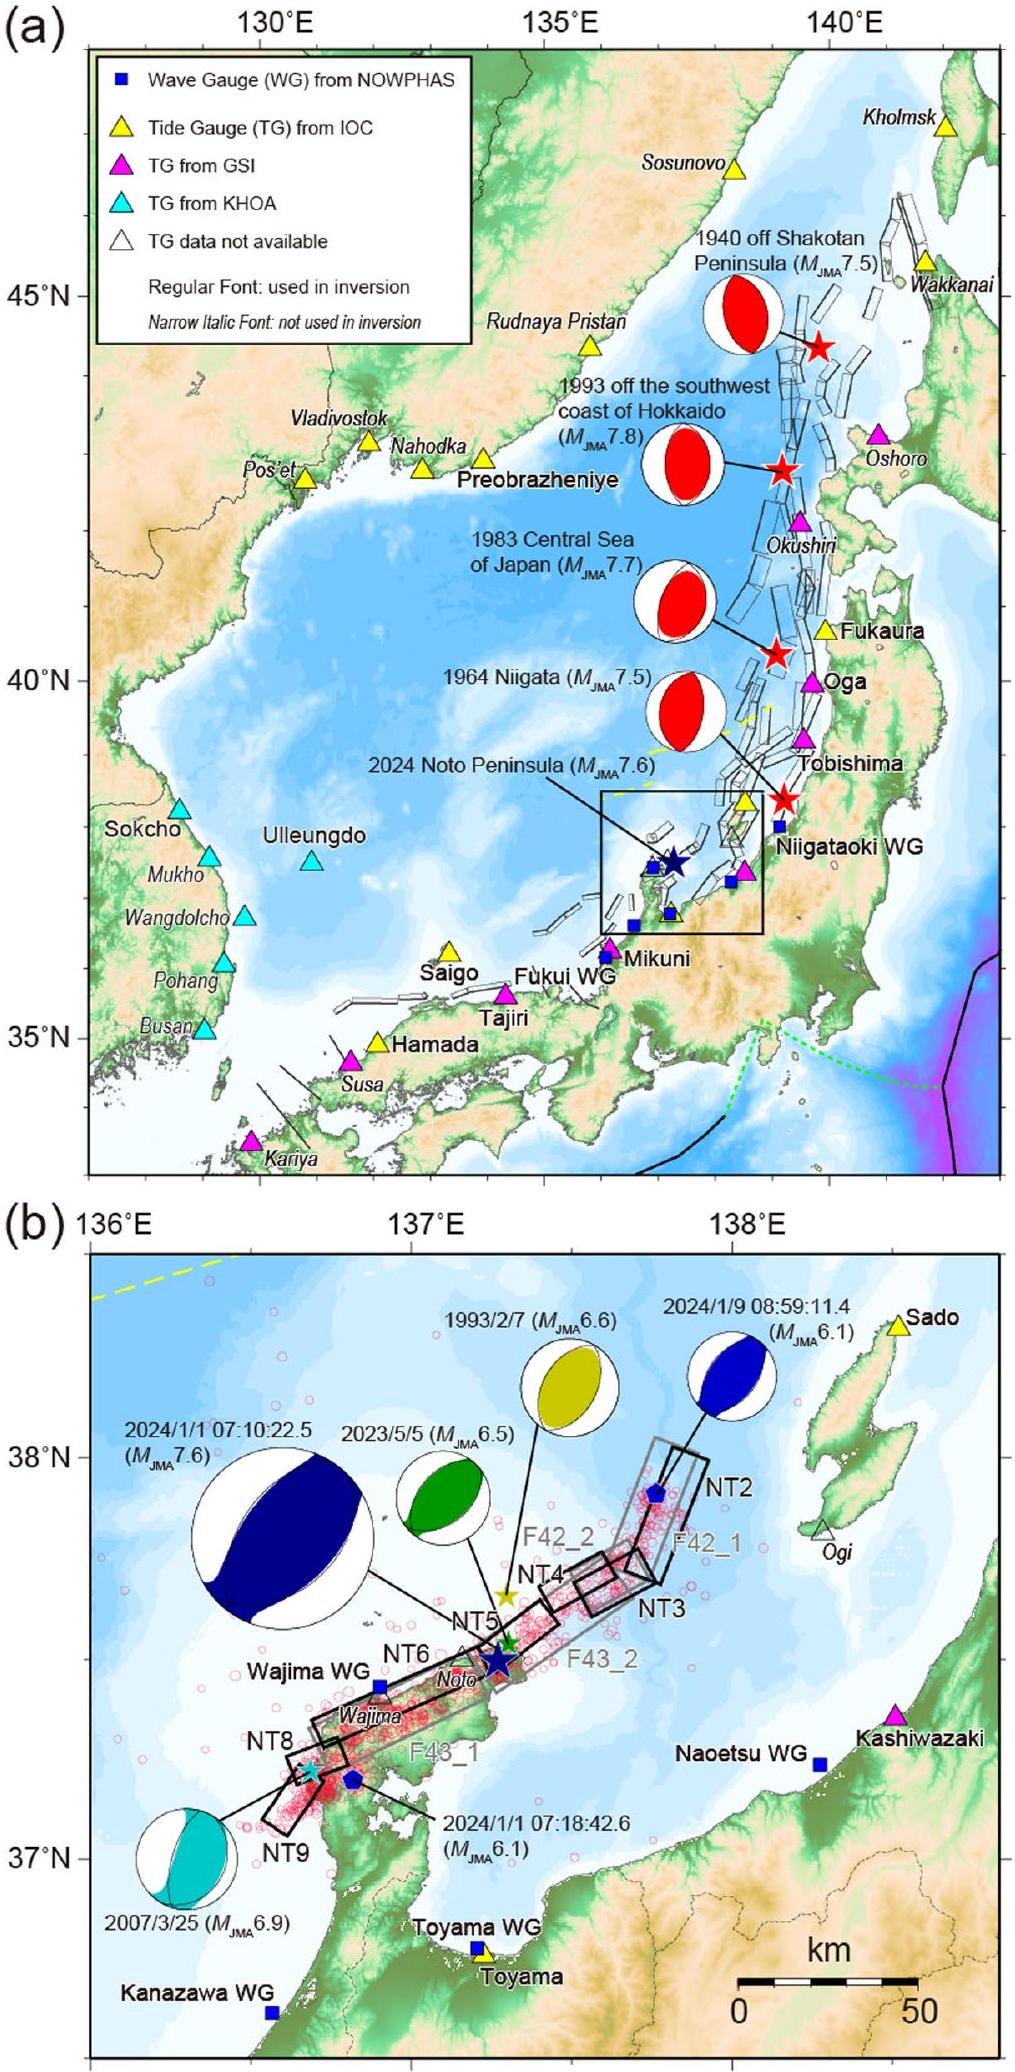
    الشكل 1 خريطة بحر اليابان. تشير النجوم الزرقاء والحمراء إلى مراكز الزلازل في زلزال شبه جزيرة نوتو 2024 والزلازل الكبرى السابقة، على التوالي. آليات التركيز للزلازل في 1940 و1964 مأخوذة من ساتاكي (1986) وآبي (1975)، على التوالي، وتلك الخاصة بالزلازل في 1983 و1993 مأخوذة من CMT العالمية. تشير المستطيلات الرمادية الرفيعة وأقسام الخطوط إلى 60 نموذجًا للصدع من MLIT. موقع أجهزة قياس الأمواج NOWPHAS (WG، مربعات زرقاء) وأجهزة قياس المد (TG، مثلثات) التي تم جمع سجلات تسونامي منها من زلزال شبه جزيرة نوتو 2024. الأصفر يتوافق مع اليونسكو/IOC، والبنفسجي مع GSI، والأزرق الفاتح مع محطات المد KHOA. تشير المثلثات عديمة اللون إلى محطات المد التي لم يتم الحصول على بيانات منها. الخط العادي يتوافق مع اسم المحطة المستخدمة في الانعكاسات، والخط المائل الضيق يتوافق مع اسم المحطة غير المستخدمة في الانعكاسات. المستطيل الأسود يظهر مدى المنطقة المكبرة في المنطقة المكبرة حول شبه جزيرة نوتو. تظهر المستطيلات السوداء 7 نماذج للصدع من JSPJ (تم تعديل NT6 قليلاً في هذه الدراسة)، وتظهر المستطيلات الرمادية 4 نماذج للصدع من MLIT. تشير الخماسيات الزرقاء إلى الهزات الارتدادية بين 1 و31 يناير مع . تشير النجوم الصفراء الداكنة، والزرقاء الفاتحة، والخضراء إلى مراكز الزلازل السابقة التي حدثت بالقرب من شبه جزيرة نوتو. الهزات الارتدادية من أو أعلى (الفترة: 2024/1/1-1/17) من JMA تشير إليها الدوائر الحمراء. آلية التركيز لزلزال 1993 مأخوذة من CMT العالمية، والزلازل الأخرى، بما في ذلك الزلزال الرئيسي في 2024، مأخوذة من حلول W-phase من USGS

Journal: Earth Planets and Space, Volume: 76, Issue: 1
DOI: https://doi.org/10.1186/s40623-024-01991-z
Publication Date: 2024-03-18

Slip distribution of the 2024 Noto Peninsula earthquake ( ) estimated from tsunami waveforms and GNSS data

Yushiro Fujiil*© and Kenji Satake²®

Abstract

The 1 January 2024 Noto-Hanto (Noto Peninsula) earthquake ( ) generated strong ground motion, large crustal deformation and tsunamis that caused significant damage in the region. Around Noto Peninsula, both offshore submarine and partially inland active faults have been identified by previous projects: Ministry of Land, Infrastructure, Transport and Tourism (MLIT) and Japan Sea Earthquake and Tsunami Research Project (JSPJ). We inverted the tsunami waveforms recorded on 6 wave gauges and 12 tide gauges around Sea of Japan and the GNSS data recorded at 53 stations in Noto Peninsula to estimate the slip amount and seismic moment on each of active faults. The results show that the 2024 coseismic slips were , and 3.2 m on subfaults NT4, NT5 and NT6 of the JSPJ model, located on the northern coast of Noto Peninsula and dipping toward southeast. A smaller slip, 1.0 m , estimated on NT8 on the southwestern end of the 2024 rupture, may be attributed to its previous rupture during the 2007 Noto earthquake. The total length of these four faults is , and the seismic moment is Nm ( ). Almost no slip was estimated on the northeastern subfaults NT2 and NT3, which dip northwestward, opposite to NT4-NT5-NT6, and western subfault NT8. Aftershocks including the event occurred in the NT2NT3 region, but they are smaller than the potential magnitude (Mw 7.1) those faults can release in a tsunamigenic earthquake. Similar features are also found for the MLIT model; the 2024 slip was only on F43 along the northern coast of Noto Peninsula, and northeastern F42 did not rupture, leaving potential for future event.

Keywords Noto Peninsula earthquake, Tsunami, Sea of Japan, Active faults, GNSS, Waveform inversion, Joint inversion, Slip distribution
Graphical Abstract

Introduction

The 2024 Noto-Hanto (Noto Peninsula) earthquake occurred on January 1. According to Japan Meteorological Agency (JMA), the origin time was 16:10:22.5 (7:10:22.5 UTC), the epicenter was , the depth was 16 km and the magnitude ( ) was 7.6 (Fig. 1a). The focal mechanism (strike , , rake and strike , , rake according to JMA) indicates reverse fault motion on NE-SW striking planes (Fig. 1b). The aftershocks extended about 150 km (Fig. 1b). Two large aftershocks with occurred at the western and eastern end of aftershock areas on January 1 and January 9, respectively. The 2024 Noto Peninsula earthquake is the largest shallow earthquake in and around Japan since the aftershock of the Tohoku earthquake on March 11, 2011.
In the Noto Peninsula region, a swarm of earthquakes started around December 2020, with the largest size of (June 19, 2022). The swarm activity was
confined in a small region ( ) at the tip of the peninsula, and has been considered to be related to upwelling fluid (Nishimura et al. 2023). On May 5, 2023, a larger earthquake ( ) occurred (Kato 2024), and the area of swarm activity became larger ( , according to Earthquake Research Committee, https:// www.static.jishin.go.jp/resource/monthly/2024/20240 noto_3.pdf). However, the seismic swarm was still limited beneath the tip of the peninsula and did not extend to offshore active faults.
Around Noto Peninsula, large earthquakes occurred on February 7, 1993 ( 6.6) to the north of the 2024 event, and on March 25, 2007 ( ) to the west (Fig. 1b). The 1993 earthquake produced small tsunamis that were recorded at Wajima and Naoetsu with maximum double amplitude of (Abe and Okada 1995). The crustal deformation and tsunami from the 2007 earthquake were recorded on GPS network and tide gauges, respectively, from which the fault models have
Fig. 1 (See legend on previous page.)
been proposed (Namegaya and Satake 2008). The tsunami was recorded on Toyama tide gauge with an early arrival, which was considered to be generated by a secondary tsunami source other than the earthquake (Abe et al. 2008).
Along the eastern margin of Sea of Japan, series of active faults have been identified. In 2014, a government committee jointly supported by the Ministry of Land, Infrastructure, Transport and Tourism (MLIT), the Ministry of Education, Culture, Sports, Science and Technology (MEXT), and the Cabinet Office of Japan compiled previous studies and proposed 60 rupture scenarios for submarine active faults (hereafter referred to as MLIT fault models) (Fig. 1a, b). MLIT (2014) conducted tsunami simulations using heterogeneous slip models, which included large slip patches surrounded by smaller background patches. Mulia et al. (2020) conducted a probabilistic tsunami hazard analysis for the coast of Sea of Japan assuming the 60 MLIT fault models as the potential tsunami sources. The fault parameters as well as the tsunami hazard curves for each municipality were provided in Mulia et al. (2020).
More recently, the Japan Sea earthquake and tsunami project, hereafter called JSPJ, was conducted (from 2013 to 2020) with support from the MEXT, and the submarine and coastal fault models along Sea of Japan were developed through seismic and geological surveys (Sato et al. 2020). Satake et al. (2022) selected 172 offshore and coastal faults with length of 20 km or greater, as well as 177 combinations of segments including 28 shorter faults, estimated the slip amounts using multiple scaling relations, and computed coastal tsunami heights (their Tables S1, S2).
Several large ( or larger) earthquakes have occurred along the eastern margin of Sea of Japan in the twentieth century (Fig. 1a), and they generated disastrous tsunamis. The 1940 off Shakotan Peninsula earthquake ( ) generated tsunami and caused damage including 10 casualties in northern Hokkaido. The tsunami was also recorded in Sakhalin and North Korea. Based on these tsunami waveform data, fault models have been proposed by Satake (1986) and Okamura et al. (2005).
The 1993 off the southwest coast of Hokkaido earthquake ( ), officially named as the 1993 Hokkaido Nansei-oki earthquake, caused significant damage with more than 200 casualties, mostly on Okushiri Island where the tsunami heights exceeded 20 m . Tanioka et al. (1995) analyzed seismic and tsunami waveforms and geodetic data to estimate the slip distribution on the earthquake fault.
The 1983 off Akita earthquake ( ) (officially named Central Sea of Japan, or the Nihonkai-Chubu earthquake) also caused tsunami waves as high as 14 m
and resulted in 100 casualties. This tsunami also caused three casualties in Korea. Satake (1985) used the tsunami waveforms to estimate the fault model.
Murotani et al. (2022) re-examined the tsunami waveforms and runup data from the above three earthquakes and estimated the causative faults among the active faults proposed by the JSPJ.
The 1964 Niigata earthquake ( ) caused damage due to ground shaking, liquefaction, and tsunamis. Abe (1978) used the recorded tsunami waveforms to estimate the fault model. The crustal deformation data recorded along the coast, seafloor and offshore island (Awashima) were used to estimate the fault model (Satake and Abe 1983).
In this paper, we use the tsunami waveforms recorded around Sea of Japan and GNSS data recorded in and around Noto Peninsula from the 2024 Noto Peninsula earthquake to estimate the coseismic slip on the active faults identified by the MLIT and JSPJ.

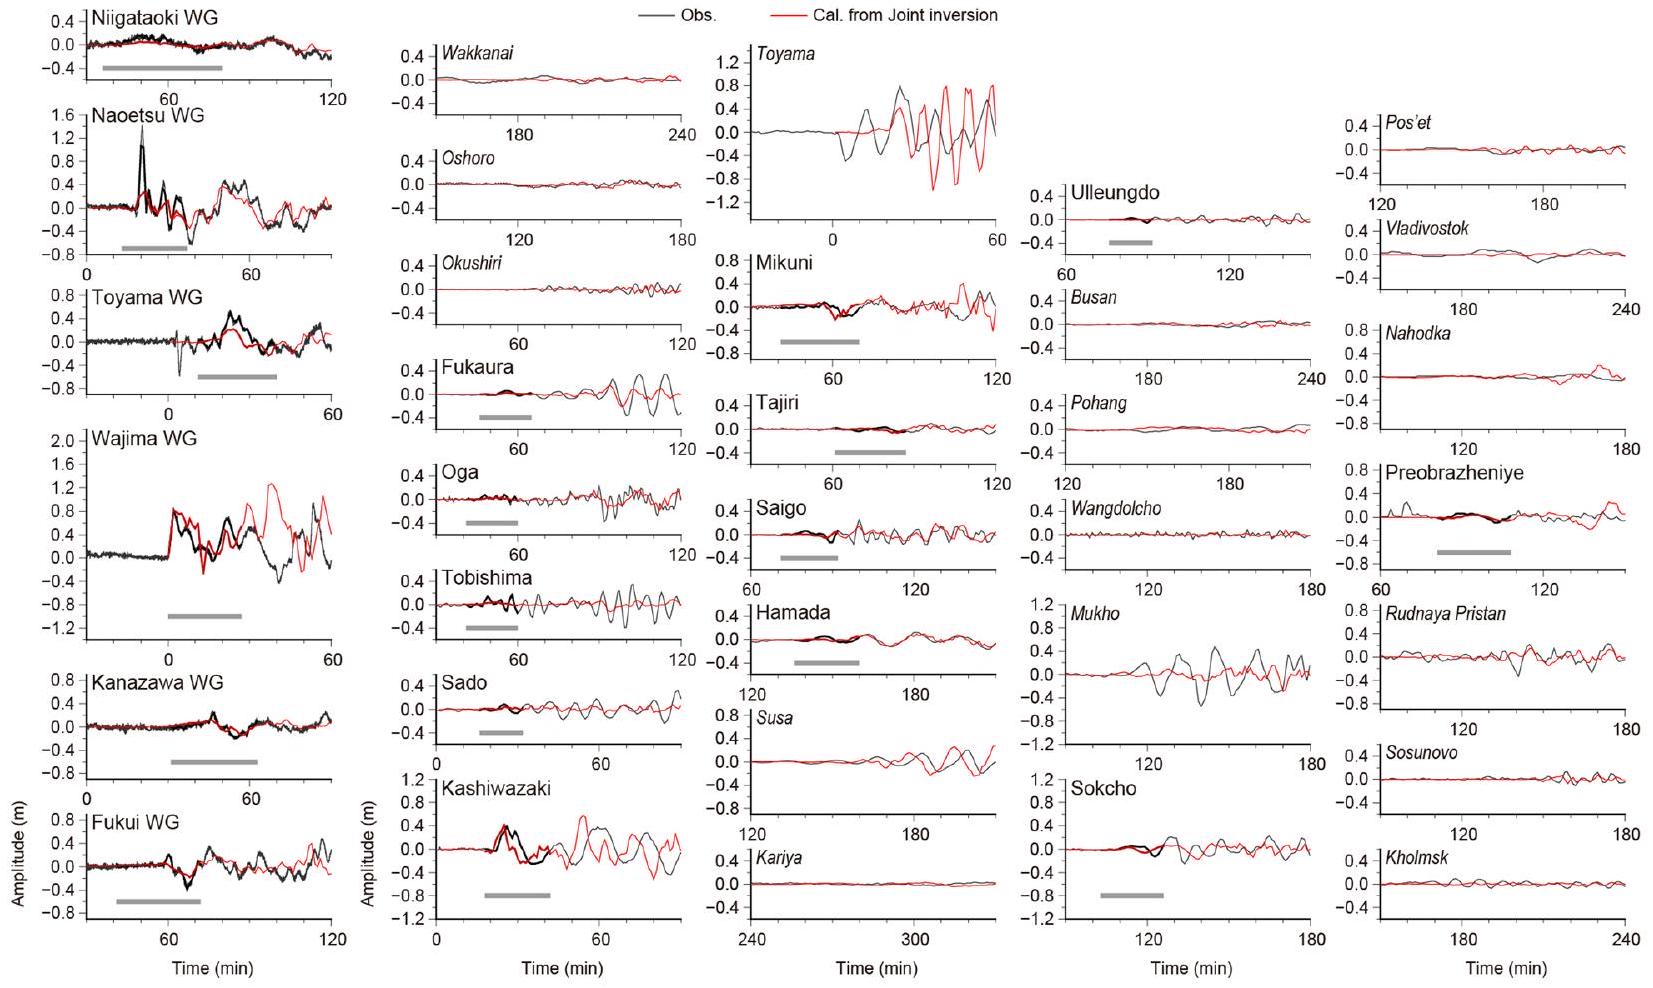
Tsunami and GNSS data

The tsunami generated by the 2024 Noto Peninsula earthquake propagated through Sea of Japan and was recorded on wave gauges (WG) and tide gauges (TG) located on the west coast of Japan (Fig. 1a, b), and on TGs of Primorye, Sakhalin, and Korea (Fig. 1a). The WGs are located several kilometers offshore from ports around Japan with water depths of 20 to 50 m . The raw data for the WGs with a high sampling interval of 0.5 s were provided by Port and Harbor Bureau of MLIT. We applied a 1 min moving average to the raw data to obtain the waveforms showing tsunami signals, as displayed in real time as offshore mean water surface by every min on the Nationwide Ocean Wave information network for Ports and HArbourS (NOWPHAS) website. Unfortunately, the TGs at Wajima and Noto on the northern coast of Noto Peninsula, which are located within the source area, and the TG at Ogi on Sado Island, which is near the source, stopped recording data immediately after the earthquake. The TG data at other stations were available from the UNESCO/Intergovernmental Oceanographic Commission (IOC), Geospatial Information Authority of Japan (GSI) and Korea Hydrographic and Oceanographic Agency (KHOA) websites, as the digital data with sampling rates of and 1 min , respectively.
To remove ocean tide signals from the WG and TG data, a polynomial function was fitted to each data using the GMT command “trend1d”. The residuals obtained by this fitting were used as the observed tsunami waveforms for inversions by resampling the waveform data with an interval of 1 min . The observed tsunami waveforms (Fig. 2) show maximum amplitudes of about 0.2 to 0.4 m at most WG stations and 0.1 to 0.4 m at
Fig. 2 Comparison of the observed and calculated tsunami waveforms from the joint inversion of tsunami waveform and GNSS data for the JSPJ fault models. The thick black and gray lines are the observed waveforms used and not used in the inversions, respectively. The red lines show the synthetic waveforms from the joint inversion result, with thick part used for the inversion. The gray bars below the waveforms indicate the time windows used in the inversions
TG stations, respectively. The maximum amplitude of 1.4 m was observed on Naoetsu WG. The waveform on Wajima WG shows a baseline shift of water level to the positive side by about 0.2 m immediately after the earthquake (time zero), suggesting that the WG itself moved downward due to subsidence. On Toyama TG, the leading depression wave started immediately after the earthquake and reached a trough of -0.5 m , followed by a peak of 0.8 m at 25 min after the earthquake.
As geodetic (crustal deformation) data, we used 153 displacement data ( 3 components at 51 locations) digitized from the GNSS data reported by GSI https://www. gsi.go.jp/chibankansi/chikakukansi_20240101noto_5. html (Fig. 3a). The coseismic displacements are the differences between the final daily solutions (called F5 solutions) on December 25-31, 2023 and January 2, 2024 at each observation point. Additional data at two more points, 6 displacement data of 3 components at 2 locations, in the northwestern part of the Noto peninsula, which were obtained by GSI’s emergency survey https:// www.gsi.go.jp/sokuchikijun/R6-notopeninsula-earth quake-EmergencyObservation.html, were also digitized and added to the GNSS data ( 159 displacement data of 3 components at 53 locations in total). Horizontal
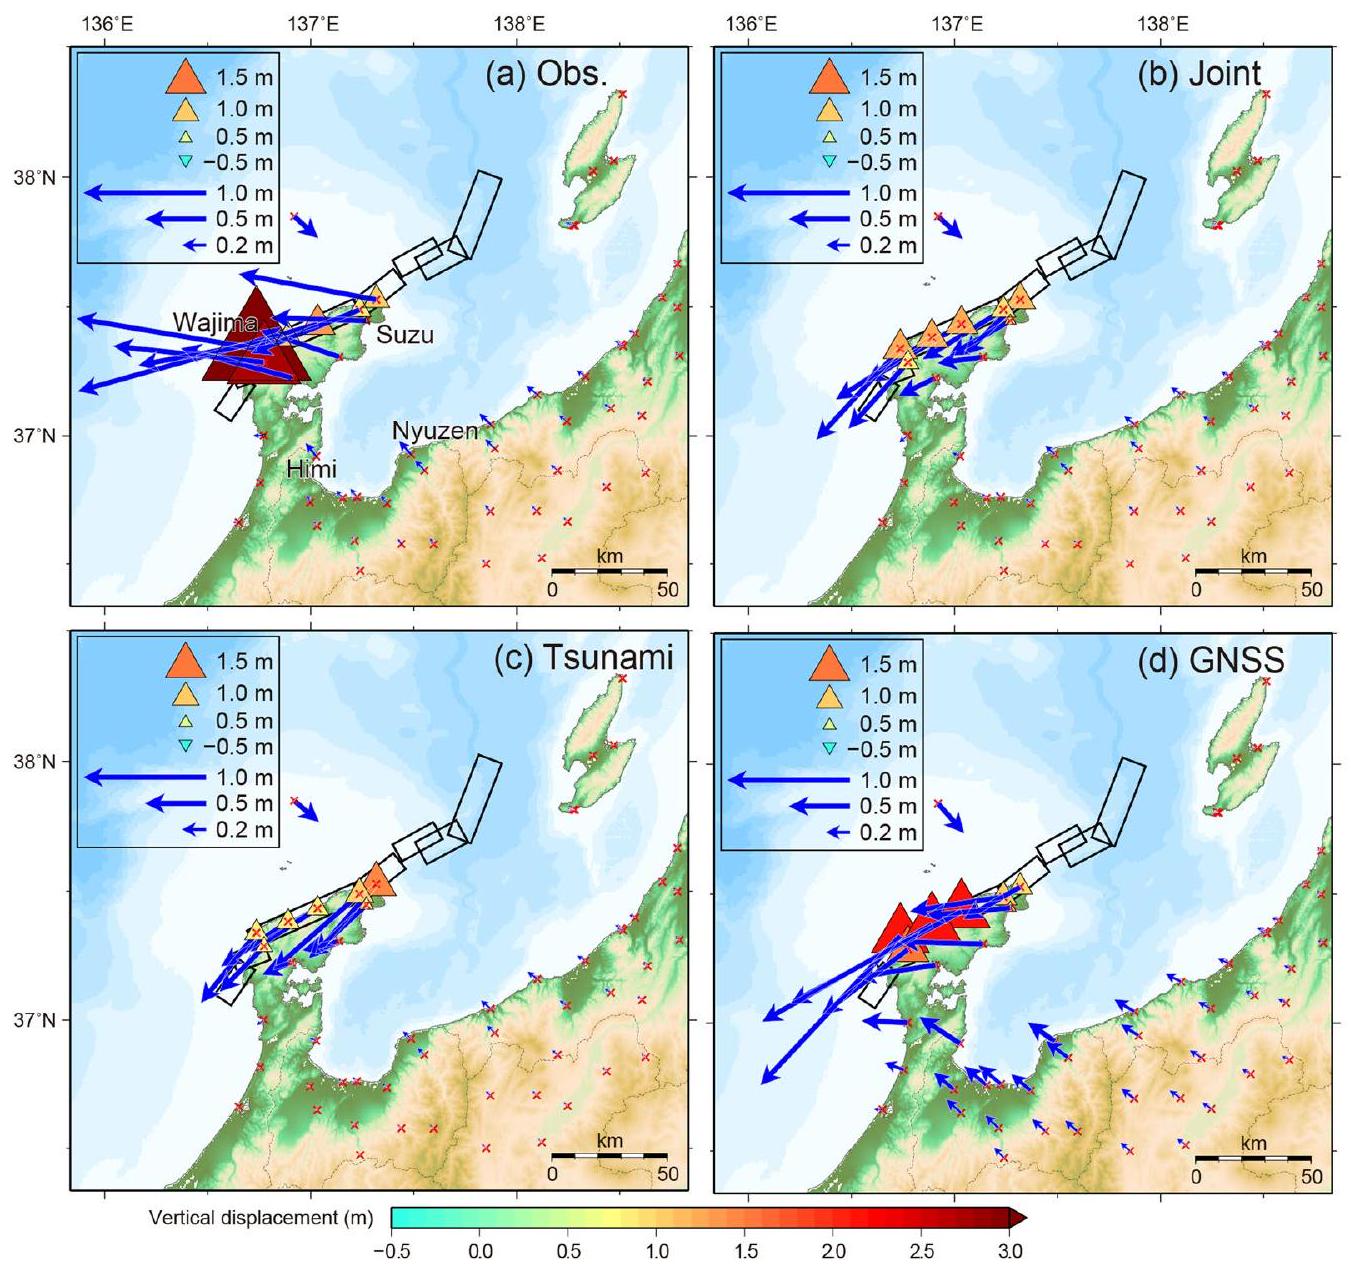
displacements were more than 0.8 m in a west to westsouthwest direction in the northern part of Noto Peninsula, with a maximum of 2 m recorded at Wajima. In the central Noto Peninsula and Toyama Prefecture, located farther south from the source area, the horizontal displacement is oriented to the northwest, and or more at Himi and Nyuzen. Vertical uplifts of more than 1 m , including the largest uplift of 4.1 m , are recorded from Wajima to Suzu on the northern coast of Noto Peninsula, while subsidence ranging from a few to several tens of centimeters are recorded at stations southern and central parts of Noto Peninsula.

Inversion methods

To estimate the slip distribution on the faults, we assumed the fault geometries proposed by JSPJ and MLIT as the tsunami sources (Fig. 1b). The JSPJ model consists of seven subfaults: NT2-NT6, NT8, and NT9 (Table 1). The MLIT model consists of four subfaults: F43 and F42, each consisting of two segments (Additional file 1: Table S1). The northeastern subfaults, i.e., NT2 and NT3 in the JSPJ model and F42 in the MLIT model, are northwest-dipping reverse faults, while the other subfaults are southeast-dipping reverse faults. In
Fig. 3 Comparison of the observed GNSS data and calculated displacements from different inversions. Horizontal displacements are indicated by blue arrows and vertical displacements by red (uplift) to light-blue (subsidence) triangles. Displacements from a observed data from GNSS positioning analysis by GSI, and the calculated ones from b joint inversion, c inversion of tsunami waveform data only, and d inversion of GNSS data only. Solid black squares show fault models by JSPJ
both MLIT and JSPJ models, the rake angles were estimated from the three-dimensional tectonic stress fields by Terakawa and Matsu’ura (2010). The position and length of subfault NT6 in the JSPJ model were slightly modified, so that the Wajima WG was located in the subsidence area just north of the top edge of the fault, and it is connected with neighboring subfaults (NT5 and NT8) (Fig. 1b).
The rupture propagation on the faults was not considered, and it was assumed that all subfaults ruptured simultaneously. The total length of the above subfaults is approximately 150 km , and the mainshock epicenter is located almost at the center of the fault area (Fig. 1b). The rupture delay time from the epicenter to the nearest edge of each subfault is less than a few tens of seconds, while the sampling interval of the tsunami waveform is 60 s , hence the effect of slip delay due to the fault rupture can
be ignored. The rise time of all subfaults was assumed to be 10 s .
Horizontal and vertical displacements at the GNSS stations and seafloor due to each subfault were calculated from a rectangular fault model using the equations of Okada (1985). As initial conditions for the tsunami, we first calculated the displacement on a coarse grid data of . The sea surface displacement was then calculated by considering the effect of horizontal displacement on steep bathymetric slopes (Tanioka and Satake 1996), then resampled to 6 arc-sec grid data.
Tsunami propagation calculations were performed from each subfault to the WG and TG stations. The computation area ( ) for the tsunami propagation is shown in Fig. 1a. The 15 arcsec bathymetry grid data from GEBCO 2023 (GEBCO Compilation Group 2023) were resampled at 6 arc-sec
Table 1 Fault parameters of the JSPJ models and the inversion results
# Lat. (deg) Lon. (deg) Length (km) Width (km) Depth (km) Strike (deg) Dip (deg) Rake (deg) Slip (m)
Joint Tsunami GNSS
NT2* 37.9928 137.9269 36.6 16.3 2.5 201 50 78 0.36 0.33 0.00
NT3* 37.6895 137.764 20 16.6 2.3 242 50 117 0.39 0.51 0.00
NT4 37.6808 137.3973 19.8 16.5 0.7 61 60 122 3.45 3.31 1.99
NT5 37.5278 137.2075 21.6 17.1 0.2 52 60 108 3.19 4.07 2.79
NT6 16.7 0.5 66 60 124 3.17 2.24 5.59
NT8 37.2569 136.6106 15.1 16.7 0.5 69 60 128 0.99 1.13 2.00
NT9 37.1002 136.5354 18.4 16.7 0.5 34 60 94 0.00 0.00 15.14
Mo (Nm)
Mw 7.5 7.4 7.7
# Subfault number. Lat., Lon., and depth: location and the top depth of the eastmost corners ( ), and the westmost corners (without )
Modified from the original parameters by JSPJ model. Rigidity of 34.3 GPa is assumed
grid intervals, so the numbers of grid points were 9600 and 9000 in the longitude and latitude direction, respectively. While finer bathymetry data are available around the Japanese TG stations, for the offshore WG stations and Korean and Russian TG stations, the GEBCO data provides the best resolution. The linear shallow-water equations (Satake 1995) were solved numerically in spherical coordinates for the tsunami propagation, and the time step interval was set to 0.3 s to satisfy the CFL (Courant-Friedrichs-Lewy) stability condition. Computational time was about 17 min for one case using the GPGPU (NVIDIA Quadro RTX A6000 48 GB, CUDA 12.3) as used in Satake et al. (2017).
The tsunami waveforms simulated at given observation points from a subfault with unit amount of slip ( 1 m in this study) are called the Green’s function and can be used for inversion and synthesis of tsunami waveforms. For the Green’s functions on Wajima WG (Fig. 1b) close the fault, offsets due to crustal deformations (e.g., -0.14 m from a unit slip on subfault NT6 of the JSPJ model) were removed so that the Green’s function starts from zero sea level and the mean sea level of Green’s function corresponds to the relative mean sea level at the station after the crustal movement. The Wajima WG record indicates that the sea level became higher by about 0.2 m after the earthquake occurrence. The offset of Green’s function in the tsunami waveform inversion corresponds to calculated crustal displacement from a unit amount of slip in a GNSS inversion, and the change in mean sea level (about 0.2 m in the case of Wajima WG) corresponds to an observed GNSS displacement. Similar corrections were systematically applied to the Green’s functions at all the stations, although the effects of the deformation are negligible at stations farther from the source.
We performed a joint inversion of tsunami waveform and GNSS data, as well as inversions using only tsunami waveform data and only GNSS data. For the tsunami waveform inversions, we applied the same method of Fujii and Satake (2007) using the non-negative least squares method (Lawson and Hanson 1974) to estimate the slip on each subfault. In the tsunami waveform inversions, the same weights were used for both WG and TG data, since there are no significant differences in amplitudes between them. In the joint inversions, we set the weights of the tsunami waveform and GNSS data according to the method of Satake (1993). First, the norm of each data set was calculated, and then the weights were set so that the amplitude scales of the two data sets were comparable. The ratio of the norm of GNSS data and tsunami waveform (WG and TG) data was 1.95, so the larger weights of 1.95 were assigned to tsunami waveform data set than the GNSS data weights of 1.0 .

Results

The slip distributions estimated from inversions of different data sets, i.e., the joint inversion of tsunami waveform and GNSS data, tsunami waveform data only, and GNSS data only are shown in Fig. 4 and Table 1. In the joint inversion result (Fig. 4a), large slips more than 3 m was estimated at NT5 near the epicenter and NT4 and NT6 on both sides. A significant slip of about 1 m was obtained at NT8 northwest of Noto Peninsula. On the other hand, NT9 on the west, NT2 and NT3 on the east side within the aftershock area showed almost no slip. Therefore, the length of the fault-slip zone during the 2024 earthquake was about 100 km . The inversion results of tsunami waveform data only (Fig. 4b) and GNSS data only (Fig. 4c) also show similar slip distributions and vertical displacements, but the tsunami waveform inversion shows a larger slip on NT5, while the GNSS inversion shows a larger slip on NT6. The extremely large slip on NT9 by the GNSS inversion is considered to be unreliable due to the lack of controlling data from nearby stations and the fixed fault geometries.
Assuming the rigidity of 34.3 GPa , which is adopted in the MLIT and JSPJ models, the seismic moment is calculated to be for the joint inversion, for the tsunami waveform inversion, and for the GNSS inversion (Table 1). The values from the joint inversion are intermediate between those of the tsunami waveform inversion and the GNSS inversion. These seismic moments and moment magnitudes obtained from the joint or tsunami waveform inversions are consistent or slightly smaller than those obtained by the seismic waves, i.e., JMA CMT solution , , https://www.data.jma.go.jp/eqev/data/mech/ cmt/fig/cmt20240101161022.html), USGS W-phase solution , https://earthquake.usgs. gov/earthquakes/eventpage/us6000m0xl/moment-tensor) and Global CMT ( , https:// www.globalcmt.org/CMTsearch.html) (Dziewonski et al. 1981; Ekström et al. 2012).
The displacements calculated at GNSS stations using the fault slips estimated by the different inversions (Fig. 3b, c, d) generally reproduce the observed uplift on the northern coast of Noto Peninsula (Fig. 3a), but the calculated displacements at the stations where subsidence was observed at southern area of central Noto Peninsula are almost zero. For the horizontal displacements, the calculated directions from the various inversions are almost consistent with the observation, but the amounts of displacements are significantly underestimated. This may be due to the fact that the fault sizes, the dip and rake angles of the fault models are fixed at the model values.
Fig. 4 Inversion results for the JSPJ fault model. (Top) Slip distribution of the 2024 Noto Peninsula earthquake. a Joint inversion, b inversion of tsunami waveform data only, inversion of GNSS data only. The stars of the epicenters, the red circles of the aftershocks, and the symbols for the WGs and TGs are the same as in Fig. 1b. (Bottom) Vertical displacement calculated from the fault slips estimated from the inversions. d Joint inversion, e tsunami waveform inversion, and GNSS inversion. Red lines and blue dotted lines indicate uplift and subsidence with the contour intervals of 0.2 m and 0.1 m , respectively
The joint inversion and the tsunami waveform inversion reproduce the observed tsunami waveforms on most of the WGs and TGs used in the inversions (Fig. 2 and Additional file 1: Fig. S1), although the amplitudes are slightly underestimated. The calculated amplitude is much smaller than the observed maximum amplitude of 1.4 m on Naoetsu WG, but they are similar on nearby Kashiwazaki TG. We confirmed that it is difficult to reproduce the amplitudes of these two stations from a single tsunami source model. The negative wave of Toyama TG that started immediately after the earthquake was not reproduced, but the positive amplitude of the second wave seems to be generally reproduced. Similarly, the receding wave of Toyama WG at about 5 min after the earthquake is also not reproduced. However, since this observation record shows a pulse-like waveform with a duration of about 1.5 min , we need to be careful to determine if it is an actual tsunami waveform or not.
The inversion analyses were also performed adopting the MLIT fault model geometries using the same data sets and data weights, and the results were similar to those for the JSPJ model (Additional file 1: Table S1, Figs. S2, S3, S4). Fault slips due to joint inversion is limited to the F43 segment, with the maximum slip of 3.5 m east of the epicenter, and the 2.1 m slip west of the epicenter. The F42 segment offshore to the east, far from
the epicenter, hardly slips at all. The calculated seismic moments were for the joint inversion, for the tsunami waveform inversion, and for the GNSS inversion.

Discussion

The joint inversion of tsunami waveform and GNSS data indicates that the coseismic slip occurred on subfaults NT4, NT5, NT6 and NT8. The slip amounts are , , and 1.0 m on these subfaults. In the JSPJ, slip amounts on these subfaults were forecasted for single and multi-fault ruptures, using different scaling relations (Satake et al. 2022). The forecasted slip amounts for the multi-fault rupture of NT4, NT5, NT6 were 1.82 m , 1.93 m , and 2.69 m (Mw 7.3) from Recipe A, based on the relation between fault area and seismic moment by Irikura and Miyake (2001). The slips were , and 2.96 m (Mw 7.4) from Recipe I, based on the scaling relation by Matsuda (1975). The slips were estimated to be , and 8.55 m (Mw 7.6) using the scaling relation proposed by Takemura (1998) (see Table S2 of Satake et al. (2022)). The 2024 slip amounts estimated by the joint inversion are similar to the forecasted values using Recipes A and I. The Takemura (1998) relation
seems to overestimate the slip amount, as suggested by Satake et al. (2022).
Subfault NT8 located at the western edge of Noto Peninsula seems to have ruptured in the 2007 earthquake ( ) (Namegaya and Satake 2008). The models based on GPS and coastal movements indicate that the slip on faults ( 15 to 20 km long), similar to NT8, were . The smaller slip amount on NT8 in the 2024 earthquake ( 1.0 m ), compared to other ruptured subfaults, may be because this subfault slipped in 2007. The small slip on this fault during the 2024 earthquake may have prevented further rupture on neighboring subfault NT9.
The northern neighboring subfaults, NT2 and NT3, are dipping toward northwest, opposite direction to the NT4-NT5-NT6. This may be the reason why the 2024 rupture did not extend to these subfaults. A large ( 6.1) aftershock occurred around NT2 on January 9, 2024. However, this magnitude is much smaller than the forecasted earthquake size on these faults. The forecasted slip in JSPJ is by Recipes A and I (Table S2 of Satake et al. (2022)). Therefore, these subfaults still have the potential to slip as a larger earthquake. If such an earthquake were to occur, it could generate tsunamis that would impact the coasts of Niigata prefecture and Sado Island.
MLIT (2014) also estimated the slip amounts on faults F42 and F43, and forecasted the tsunami heights along the Sea of Japa coast. They basically adopted the Irikura and Miyake (2001) relation, but increased the slip amount by 1.5 m considering the uncertainty. Their average slips are 3.1 m and 4.5 m , and the corresponding moment magnitudes Mw are 7.3 and 7.6 on F42 and F43, respectively. The estimated slip on F43 fault by the joint inversion ( 2.1 m and 3.5 m on two segments), as well as the 2024 moment magnitude, was slightly smaller than the MLIT forecast. Their forecasted magnitude of potential earthquake on F42 is similar to that on NT2-NT3 forecasted by JSPJ.

Conclusion

We inverted tsunami waveform and GNSS data from the 2024 Noto Peninsula earthquake to estimate the slip amounts on previously proposed active faults. The tsunami waveform data are sea levels recorded at 6 wave gauges on Niigata, Toyama, Ishikawa and Fukui coasts, and 12 tide gauges on the coasts of Honshu as well as on Korean and Russian coasts around Sea of Japan. The GNSS data consist of horizontal and vertical displacements recorded at 53 stations operated by GSI. Two sets of active fault geometries, proposed by MLIT and JSPJ were adopted for the inversions.
The results show that 2024 coseismic slips were , and 3.2 m on NT4, NT5 and NT6 of the JSPJ model, located on the northern coast of Noto Peninsula. A smaller slip, 1.0 m , estimated on NT8 on the southwestern edge, may be due to the fact that it also ruptured during the 2007 Noto earthquake. Almost no slip was estimated on the northeastern subfaults NT2 and NT3, which dip northwestward, opposite to NT4-NT5-NT6, and western subfault NT8. Aftershocks, including the event, occurred on NT2-NT3 region. This magnitude is smaller than the forecasted magnitude on these faults in Satake et al. (2022). This suggests that these two faults may still have the potential to produce larger earthquakes and associated tsunamis. Similar features are also found for the MLIT model; the 2024 slip occurred only on F43 along the northern coast of Noto Peninsula, and northeastern F42 did not rupture, indicating future potential.

Abbreviations

CFL Courant-Friedrichs-Lewy
CMT Centroid moment tensor
CUDA Compute Unified Device Architecture
GEBCO General Bathymetric Chart of the Oceans
GNSS Global Navigation Satellite System
GMT Generic Mapping Tools
GPGPU General-Purpose Computing on Graphics Processing Units
GSI Geospatial Information Authority of Japan
IOC Intergovernmental Oceanographic Commission
JMA Japan Meteorological Agency
JSPJ Japan Sea Earthquake and Tsunami Research Project
KHOA Korea Hydrographic and Oceanographic Agency
MEXT Ministry of Education, Culture, Sports, Science and Technology
MLIT Ministry of Land, Infrastructure, Transport and Tourism
NOWPHAS Nationwide Ocean Wave information network for Ports and HArbourS
TG Tide gauge
UNESCO United Nations Educational, Scientific and Cultural Organization
USGS United States Geological Survey
WG Wave gauge

Supplementary Information

The online version contains supplementary material available at https://doi. org/10.1186/s40623-024-01991-z.
Additional file 1: Fig. S1. Comparison of the observed and calculated tsunami waveforms from the joint inversion of tsunami waveform and GNSS data for the JSPJ fault models. The thick black and gray lines are the observed waveforms used and not used in the inversion, respectively. The red lines show the synthetic tsunami waveforms from the joint inversion, with the thick parts used in the inversion. The blue lines show the computed waveforms from the inversion using only tsunami waveform data. Synthetic waveforms from the joint inversion and the tsunami waveform inversion are indistinguishable except at Wajima WG station. The gray bars below the waveforms indicate the time windows used in the inversions. Fig. S2. Same as Fig. S1. but for a case adopting the MLIT fault models. Fig. S3. Same as Fig. 2, but for a case adopting the MLIT fault models. Fig. S4. Same as Fig. 3, but for a case adopting the MLIT fault models. Table S1. Fault parameters of the MLIT models and the inversion results.

Acknowledgements

We thank the editor, Dr. Aditya Riadi Gusman, and two anonymous reviewers for their valuable comments to improve the manuscript. All figures were generated using Generic Mapping Tools (Wessel and Smith 1998).

Author contributions

KS and YF planned the study. YF and KS collected data of the tsunami records. YF performed the tsunami simulations and inversion analyses. KS and YF wrote the manuscript, and YF prepared the figures and tables. All authors reviewed the manuscript.

Funding

This study was partially supported by JSPS KAKENHI Grant Numbers 20H01987 (Grant-in-Aid for Scientific Research(B)).

Availability of data and materials

Bathymetry data are available from the GEBCO website (https://www.gebco. net/). Sea level data from tide stations are available for downloading from the UNESCO/IOC, GSI, and KHOA websites. Wave gauge raw data were provided by the MLIT’s Port and Harbor Bureau from the NOWPHAS website (https:// www.mlit.go.jp/kowan/nowphas/). GNSS crustal deformation data are available from the report by GSI (https://www.gsi.go.jp/chibankansi/chikakukansi_ 20240101 noto_5.html), and additional GNSS data are from GSI’s emergency survey (https://www.gsi.go.jp/sokuchikijun/R6-notopeninsula-earthquakeEmergencyObservation.html).

Declarations

Competing interests

The authors declare that they have no competing interests.

Author details

International Institute of Seismology and Earthquake Engineering, Building Research Institute, 1 Tachihara, Tsukuba, Ibaraki 305-0802, Japan. Earthquake Research Institute, The University of Tokyo, 1-1-1 Yayoi, Bunkyo-ku, Tokyo 113-0032, Japan.
Received: 5 February 2024 Accepted: 5 March 2024
Published online: 18 March 2024

References

Abe K (1975) Re-examination of the fault model for the Niigata earthquake of 1964. J Phys Earth 23(4):349-366
Abe K (1978) Determination of the fault model consistent with the tsunami generation of the 1964 Niigata earthquake. Mar Geodesy 1(4):313-330. https://doi.org/10.1080/01490417809387978
Abe I, Goto K, Imamura F, Shimizu K (2008) Numerical simulation of the tsunami generated by the 2007 Noto Hanto earthquake and implications for unusual tidal surges observed in Toyama Bay. Earth Planets Space 60:133-138. https://doi.org/10.1186/BF03352774
Abe K, Okada M (1995) Source model of Noto-Hanto-Oki earthquake tsunami of 7 February 1993. Pure Appl Geophys 144:621-631. https://doi. org/10.1007/BF00874386
Dziewonski AM, Chou TA, Woodhouse JH (1981) Determination of earthquake source parameters from waveform data for studies of global and regional seismicity. J Geophys Res Solid Earth 86(B4):2825-2852
Ekström G, Nettles M, Dziewoński A (2012) The global CMT project 2004-2010: Centroid-moment tensors for 13,017 earthquakes. Phys Earth Planet Inter 200:1-9
Fujii Y, Satake K (2007) Tsunami source of the 2004 Sumatra-Andaman earthquake inferred from tide gauge and satellite data. Bull Seism Soc Am 97(1A):S192-S207
GEBCO Compilation Group (2023) GEBCO 2023. Grid. https://doi.org/10. 5285/f98b053b-0cbc-6c23-e053-6c86abc0af7b
Irikura K, Miyake H (2001) Prediction of strong ground motions for scenario earthquakes. J Geogr (Chigaku Zasshi) 110(6):849-875 (in Japanese with English abstract)
Kato A (2024) Implications of fault-valve behavior from immediate aftershocks following the 2023 Mj6 5 earthquake beneath the noto Peninsula Central Japan. Geophys Res Lett 51(1):e2023GL106444. https://doi. org/10.1029/2023GL106444
Lawson CL, Hanson RJ (1974) Solving least squares problems. Prentice -Hall Inc, Englewood
Matsuda T (1975) Magnitude and recurrence interval of earthquakes from a fault. J Seismol Soc Jpn (Zisin) 2nd Ser 28:269-283 (in Japanese with English abstract)
MLIT (2014) Investigation for large earthquakes occurring in the Sea of Japan. https://www.mlit.go.jp/river/shinngikai_blog/daikibojishinch ousa/.
Mulia IE, Ishibe T, Satake K, Gusman AR, Murotani S (2020) Regional probabilistic tsunami hazard assessment associated with active faults along the eastern margin of the Sea of Japan. Earth Planets Space 72:1-15. https://doi.org/10.1186/s40623-020-01256-5
Murotani S, Satake K, Ishibe T, Harada T (2022) Reexamination of tsunami source models for the twentieth century earthquakes off Hokkaido and Tohoku along the eastern margin of the Sea of Japan. Earth Planets Space 74(1):52. https://doi.org/10.1186/s40623-022-01607-4
Namegaya Y, Satake K (2008) Tsunami generated by the 2007 Noto Hanto earthquake. Earth Planets Space 60:127-132. https://doi.org/10.1186/ BF03352773
Nishimura T, Hiramatsu Y, Ohta Y (2023) Episodic transient deformation revealed by the analysis of multiple GNSS networks in the Noto Peninsula, central Japan. Sci Rep 13(1):8381. https://doi.org/10.1038/ s41598-023-35459-z
Okada Y (1985) Surface deformation due to shear and tensile faults in a halfspace. Bull Seismol Soc Am 75(4):1135-1154
Okamura Y, Satake K, Ikehara K, Takeuchi A, Arai K (2005) Paleoseismology of deep-sea faults based on marine surveys of northern Okushiri ridge in the Japan Sea. J Geophys Res Solid Earth. https://doi.org/10.1029/ 2004JB003135
Satake K (1985) The mechanism of the 1983 Japan Sea earthquake as inferred from long-period surface waves and tsunamis. Phys Earth Planet Inter 37(4):249-260. https://doi.org/10.1016/0031-9201(85) 90012-3
Satake K (1986) Re-examination of the 1940 Shakotan-oki earthquake and the fault parameters of the earthquakes along the eastern margin of the Japan Sea. Phys Earth Planet Inter 43(2):137-147. https://doi.org/ 10.1016/0031-9201(86)90081-6
Satake K (1993) Depth distribution of coseismic slip along the Nankai Trough, Japan, from joint inversion of geodetic and tsunami data. J Geophys Res Solid Earth 98(B3):4553-4565
Satake K (1995) Linear and nonlinear computations of the 1992 Nicaragua earthquake tsunami. Pure Appl Geophys 144(3-4):455-470
Satake K, Abe K (1983) A fault model for the Niigata, Japan, earthquake of June 16, 1964. J Phys Earth 31(3):217-223. https://doi.org/10.4294/ jpe1952.31.217
Satake K, Fujii Y, Yamaki S (2017) Different depths of near-trench slips of the 1896 Sanriku and 2011 Tohoku earthquakes. Geosci Lett 4(1):33
Satake K, Ishibe T, Murotani S, Mulia IE, Gusman AR (2022) Effects of uncertainty in fault parameters on deterministic tsunami hazard assessment: examples for active faults along the eastern margin of the Sea of Japan. Earth, Planets and Space 74(1):36. https://doi.org/10.1186/ s40623-022-01594-6
Sato H, Ishiyama T, Hashima A, Kato N, Van-Horne A, Claringbould J, No T, Ishikawa M, Matsubara M, Koshiya S, Toyoshima TK, K, Kosuga M (2020) Development of active fault model. Annual progress reports of the integrated research project on seismic and tsunami hazards around the Sea of Japan (FY2019).
Takemura M (1998) Scaling law for Japanese intraplate earthquakes in special relations to the surface faults and the damages. J Seismol Soc Jpn (Zisin) 2nd Ser 51:211-228 (in Japanese with English abstract)
Tanioka Y, Satake K (1996) Tsunami generation by horizontal displacement of ocean bottom. Geophys Res Lett 23(8):861-864
Tanioka Y, Satake K, Ruff L (1995) Total analysis of the 1993 Hokkaido Nanseioki earthquake using seismic wave, tsunami, and geodetic data. Geophys Res Lett 22(1):9-12
Terakawa T, Matsu’ura M (2010) The 3-D tectonic stress fields in and around Japan inverted from centroid moment tensor data of seismic events. Tectonics. https://doi.org/10.1029/2009TC002626
Wessel P, Smith WH (1998) New, improved version of generic mapping tools released. EOS Trans Am Geophys Union 79(47):579-579

Publisher’s Note

Springer Nature remains neutral with regard to jurisdictional claims in published maps and institutional affiliations.

  1. *Correspondence:
    Yushiro Fujii
    fujii@kenken.go.jp
    Full list of author information is available at the end of the article
  2. (See figure on next page.)
    Fig. 1 a Map of Sea of Japan. Blue and red stars indicate the epicenters of the 2024 Noto Peninsula earthquake and past major earthquakes, respectively. The focal mechanisms for the 1940 and the 1964 earthquakes are from Satake (1986) and Abe (1975), respectively, and the ones for the 1983 and the 1993 earthquakes are from the Global CMT. The thin gray rectangles and line segments indicate the 60 fault models by MLIT. Location of NOWPHAS wave gauges (WG, blue squares) and tide gauges (TG, triangles) at which tsunami records from the 2024 Noto Peninsula earthquake were collected. Yellow corresponds to UNESCO/IOC, purple to GSI, and light blue to KHOA tide stations. Colorless triangles indicate tide stations for which no data were obtained. Regular font corresponds to the station name used in the inversions, and narrow italic corresponds to the station name not used in the inversions. The black rectangle shows the extent of the magnified area in enlarged area around Noto Peninsula. The black rectangles show 7 fault models by JSPJ (NT6 was slightly modified in this study), and the gray rectangles show 4 fault models by MLIT. Blue pentagons indicate the aftershocks between January 1 and 31 with . Dark yellow, light blue, and green stars indicate the epicenters of the past earthquakes that occurred near Noto Peninsula. Aftershocks of or higher (period: 2024/1/1-1/17) by JMA are indicated by red circles. The focal mechanism of the 1993 earthquake is from the Global CMT, and the other earthquakes, including the 2024 mainshock, are from the USGS W-phase solutions