توزيع الميكروبلاستيك تحت السطح في المحيط The distribution of subsurface microplastics in the ocean

المجلة: Nature، المجلد: 641، العدد: 8061
DOI: https://doi.org/10.1038/s41586-025-08818-1
PMID: https://pubmed.ncbi.nlm.nih.gov/40307520
تاريخ النشر: 2025-04-30

توزيع الميكروبلاستيك تحت السطح في المحيط

https://doi.org/10.1038/s41586-025-08818-1
تاريخ الاستلام: 28 سبتمبر 2023
تم القبول: 20 فبراير 2025
نُشر على الإنترنت: 30 أبريل 2025
الوصول المفتوح
تحقق من التحديثات

شياي زهاو كارين ف. كفالي ليكسين زو إريك ر. زتلر ماتياس إجر تريسي ج. مينسر ليندا أ. أمارال-زيتلر لوران ليبرتون هيلغ نييمان ريوتا ناكاجيما مارتن ثيل ريان ب. بوس لويزا غالغاني وآرون ستوبينز

الملخص

تلوث البلاستيك البحري هو قضية عالمية، مع وجود جزيئات البلاستيك الدقيقة ( ) تهيمن على عدد البلاستيك المقاس على الرغم من أنه يمكن العثور على الميكروبلاستيك في جميع أنحاء عمود الماء المحيطي ، تجمع معظم الدراسات الجسيمات البلاستيكية الدقيقة من المياه السطحية (أقل من حوالي العمق) باستخدام شباك الصيد . وبالتالي، فإن فهمنا لتوزيع الميكروبلاستيك عبر أعماق المحيطات محدود أكثر. هنا نقوم بتجميع بيانات ملف العمق من 1,885 محطة تم جمعها بين عامي 2014 و2024 لتقديم رؤى حول التوزيع وآليات النقل المحتملة للطبقات السفلية (أسفل حوالي العمق، الذي لا يتم عادةً أخذه بعين الاعتبار في الممارسات التقليدية ) الميكروبلاستيك في عمود الماء المحيطي. نجد أن وفرة الميكروبلاستيك تتراوح من إلى جزيئات لكل متر مكعب. يؤثر حجم الميكروبلاستيك على توزيعها؛ وفرة الميكروبلاستيك الصغيرة إلى ) ينخفض تدريجياً مع العمق، مما يشير إلى توزيع أكثر توازناً وعمر أطول في عمود الماء مقارنة بالميكروبلاستيك الأكبر حجماً إلى التي تميل إلى التركيز في الطبقات المتدرجة. تمتد مناطق تراكم منتصف الدوامة إلى المحيط تحت السطحي ولكنها تتركز في أعلى 100 متر وتتكون بشكل أساسي من جزيئات البلاستيك الدقيقة الأكبر. تشير تحليلاتنا إلى أن جزيئات البلاستيك الدقيقة تشكل جزءًا قابلًا للقياس من إجمالي الكربون العضوي الجزيئي، حيث تزداد من 0.1% عند 30 متر إلى في على الرغم من أن دراستنا تؤسس معيارًا عالميًا، فإن نتائجنا تبرز أن نقص التوحيد القياسي يخلق عدم يقين كبير، مما يجعل من الصعب تعزيز فهمنا لتوزيع الميكروبلاستيك وتأثيره على البيئة المحيطية.

تلوث البلاستيك البحري هو قضية عالمية حيث يدخل 9-14 مليون طن متري من البلاستيك إلى المحيط سنويًا الميكروبلاستيك تسيطر على الأعداد المقاسة من البلاستيك وتشكل تهديدات خطيرة لصحة المحيطات على مستوى العالم تركز معظم الدراسات على المياه السطحية، حيث يتم جمع الميكروبلاستيك من العمق العلوي 15-50 سم باستخدام شباك الجر. . ومع ذلك، توجد الجسيمات البلاستيكية الدقيقة بأشكال متنوعة بخصائص معقدة تؤثر على تفاعلاتها مع البيئة (الصندوق 1)، مما يشكل في النهاية توزيعها ثلاثي الأبعاد نتيجة لذلك، توجد الجسيمات البلاستيكية الدقيقة في جميع أنحاء عمود الماء، من السواحل إلى المحيط المفتوح، عبر جميع خطوط العرض. على الرغم من ذلك، فإن هناك نقصًا في تجميع المعرفة الحالية وأولويات البحث المتعلقة بالميكروبلاستيك عبر أعماق المحيط.
عمود الماء في المحيط، الذي يوفر أكبر موطن حجمي على الأرض، يلعب دورًا حيويًا في الدورة البيوجيوكيميائية. . يساهم المحيط بحوالي من الإنتاج الأولي الصافي العالمي،
يعمل كمصرف رئيسي لثاني أكسيد الكربون الناتج عن الأنشطة البشرية ويسهل نقل الجسيمات وتوزيعها بينما تنتقل الجسيمات البحرية والميكروبلاستيك عبر عمود الماء، تؤثر تفاعلاتها مع العمليات البيوجيوكيميائية على سلوكها وتأثيرها على النظم البيئية البحرية. بما في ذلك دورة الكربون في المحيط لذلك، فإن فهم توزيع وتأثيرات الميكروبلاستيك المحتملة في عمود الماء أمر ضروري.
لتعزيز فهم توزيع الميكروبلاستيك، هنا نقوم بتجميع بيانات ملف العمق من 1,885 محطة تم جمعها بين عامي 2014 و2024 (الشكل 1أ)، موضحين أنماط التوزيع حسب الحجم ونوع البوليمر، وتقييم آليات النقل المحتملة. نحن نفحص نماذج توزيع الميكروبلاستيك الحالية ونبرز التحديات البحثية والأولويات (الجدول 1) لتعزيز المعرفة بتوزيعات الميكروبلاستيك تحت السطحية وتأثيراتها في المحيط.

الصندوق 1

تعقيد الميكروبلاستيك في البيئة الطبيعية

الميكروبلاستيك تشكل مجموعة معقدة من الملوثات ذات مجموعة واسعة من الخصائص الفيزيائية والكيميائية والبيولوجية، بما في ذلك الحجم، الشكل، الكثافة، اللون، الكيمياء وتركيب الأغشية الحيوية. تنبع هذه الخصائص المتنوعة من كل من عمليات تصنيع البلاستيك والتحولات الطبيعية. تحدد التركيبة الكيميائية والبنية الدقيقة للبلاستيك الخصائص الأساسية مثل نوع المادة، الشكل، الحجم، الكثافة ومقاومة الضغوط البيئية مثل الحرارة والأشعة فوق البنفسجية. بالإضافة إلى ذلك، فإن الإضافات البلاستيكية تعدل هذه الخصائص بشكل أكبر. .
في البيئات الطبيعية، يتم إنتاج الميكروبلاستيك الثانوي من خلال تفتت الحطام البلاستيكي الأكبر ويخضع لعدة عوامل فيزيائية (مثل، ضوء الشمس، الحرارة، الرياح والأمواج) و
التحولات البيولوجية (على سبيل المثال، التجزئة عن طريق العض، الابتلاع والتلوث البيولوجي) “، مما يزيد من تنوعها. هذه التعقيدات تعقد بشكل كبير تقنيات أخذ العينات والتحليل (الجدول البياني الموسع 1)، مما يخلق تحديات في مقارنة أو تجميع بيانات الميكروبلاستيك عبر دراسات مختلفة. تصنف الدراسات الميدانية عادةً الميكروبلاستيك إلى فئات منفصلة (انظر الشكل). الحجم والشكل والكثافة هي عوامل رئيسية تؤثر على نقل ومصير الميكروبلاستيك البيئي. علاوة على ذلك، تؤثر خصائص مثل اللون وخصائص السطح وامتصاص السموم البيئية والإضافات على المخاطر البيئية التي تشكلها الميكروبلاستيك. بيولوجيًا، تستضيف الميكروبلاستيك مجتمعات ميكروبية متنوعة، بما في ذلك الأنواع غير الأصلية، والجراثيم المحتملة، والجينات المقاومة للمضادات الحيوية، مما يشكل ما يُشار إليه بـ “البلاستي سفير”. .
الصندوق 1 الشكل 1|تعقيد الميكروبلاستيك في البيئة الطبيعية. تختلف الميكروبلاستيك في الخصائص الفيزيائية (الحجم، الشكل، الكثافة، خصائص السطح)، والخصائص الكيميائية (نوع البوليمر، الإضافات، التركيب الجزيئي، المواد الكيميائية الممتصة)، والخصائص البيولوجية (الميكروبيوم المرتبط بالبلاستيك، ‘البلاستي سفير’). هذه العوامل، التي تتشكل من خلال التصنيع والتأثيرات البيئية،
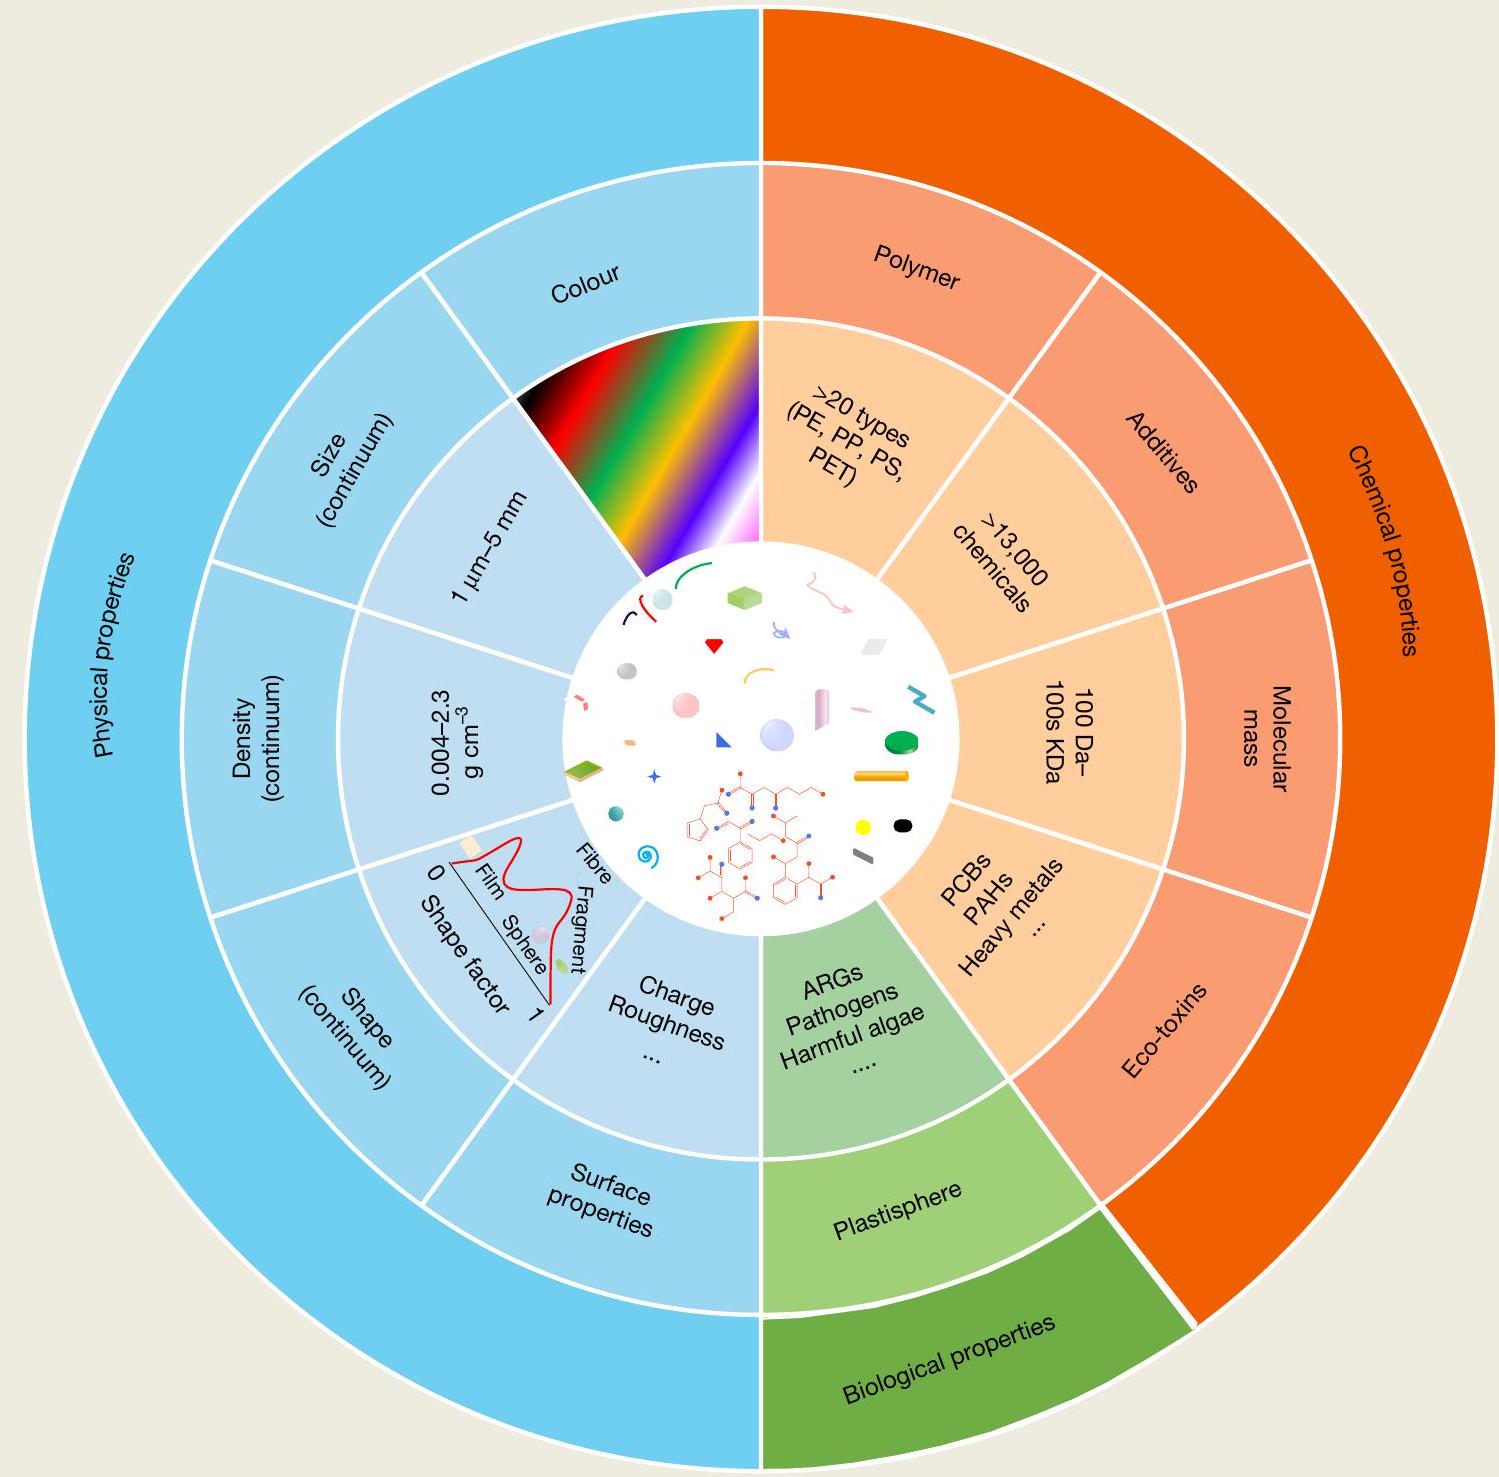
تعقيد قياسات الميكروبلاستيك وتأثيرها على البيئة. ARGs، جينات مقاومة المضادات الحيوية؛ PAHs، الهيدروكربونات العطرية متعددة الحلقات؛ PCBs، ثنائي الفينيل متعدد الكلور؛ PE، بولي إيثيلين؛ PP، بولي بروبيلين؛ PS، بولي ستيرين؛ PET، بولي إيثيلين تيريفثاليت.
الشكل 1 | ملاحظات عن الميكروبلاستيك تحت السطح في المحيط. أ، محطات المراقبة العالمية للميكروبلاستيك البحري التي تم جمعها من خلال سحب الشباك السطحية (نقاط برتقالية؛ البيانات من المراجع 2، 5، 89، 124)، على عمق واحد تحت السطح باستخدام تقنيات مختلفة (نقاط زرقاء فاتحة)، من أعماق مائية متعددة (نقاط زرقاء داكنة)، ومن فخاخ الرواسب (مثلثات حمراء). تمثل الخطوط الصفراء الصلبة الحدود المتوقعة لمناطق التقارب البحرية، حيث تتجمع الحطام البلاستيكي العائم. . ب، الاتجاهات العرضية في الجزيئات البلاستيكية الكبيرة المعدلة، الموجودة ضمن عمق الحاوية (خط أزرق فاتح، بيانات الميكروبلاستيك تحت السطحية المجمعة عند عمق واحد في المراجع 55، 77-86) وتلك الميكروبلاستيك العائمة على سطح البحر ( ، الخط البرتقالي؛ البيانات من المرجع 5). يتم هنا اعتبار اتجاهات الخطوط الملونة فقط (للقيم الدقيقة،

عدم اليقين في طرق قياس الميكروبلاستيك

تتراوح وفرة الميكروبلاستيك في عمود الماء المبلغ عنها عبر ثمانية أوامر من الحجم (الجدول التكميلي 1). يجب ملاحظة أن بعض هذه التباينات تنشأ من عدم التناسق في طرق الجمع والتحليل (الجدول البياني الموسع 1 والجدولان التكميليان 2 و3). كما أن الخصائص الفيزيائية والكيميائية والبيولوجية للميكروبلاستيك المتقدم في العمر تعقد القياسات أكثر (الصندوق 1).
تشير المناطق الملونة المظللة إلى انحراف معياري من 1,000 تجربة مونت كارلو التي استخدمت متنبئين متنوعين لنماذج الجمع العامة (GAMs). ج، د، ملفات عمق وفرة الميكروبلاستيك (جزيئات لكل ) لوحظ في المناطق القريبة من الشاطئ (ج؛ بيانات من المراجع 33، 67-70، 72، 103، 126-130) وفي المياه المفتوحة ( ; بيانات من المراجع. ) المياه مع ملاءمات الانحدار اللوغاريتمي (الخطوط المتقطعة) بين وفرة الميكروبلاستيك وعمق المياه للدراسات الفردية. الأس exponent ، المعروف أيضًا بالميل، يوفر معلومات عن معدل تغير الوفرة على طول تدرجات العمق. الحد الأدنى لحجم الجسيمات لكل دراسة في cand موجود في الجدول التكميلي 3. المعادلات الخطية المقابلة موضحة في الجدول التكميلي 4.
as كل فئة بلاستيكية تتطلب أساليب أخذ عينات وتحليل مخصصة . على سبيل المثال، قد يساهم استخدام 19 حجم مسام مختلف من الشبكات والفلاتر (الجدول التكميلي 3) في اختلافات ملحوظة في الوفرة المبلغ عنها؛ حيث تلتقط أحجام المسام الأصغر المزيد من الجسيمات، حيث عادة ما تزداد أعداد الميكروبلاستيك مع انخفاض الحجم، متبعة قانون القوة التقريبي . هذا التأثير واضح في جهود أخذ العينات المتوازية، حيث أن العينات المجمعة في نفس الموقع والعمق ولكن باستخدام مقابل الشبكات أسفرت عن

تحليل

الجدول 1 | الفهم الحالي، رؤى العملية وأولويات البحث للميكروبلاستيك تحت السطح
المعرفة الحالية ومستوى الثقة رؤى العملية الفجوات الرئيسية ومستوى الأولوية
التوزيع
التوزيع المكاني:
– الميكروبلاستيك يتخلل عمود الماء (H)
– وفرة أعلى في المياه القريبة من الشاطئ مقارنة بالمياه البعيدة (M)
– تنخفض وفرة الميكروبلاستيك الكبير بشكل حاد مع العمق
– توزيع متساوٍ للميكروبلاستيك الصغير
– الحد الأقصى تحت السطح يحدث في الطبقة الباثيبلاجية
– نسبة البلاستيك-C:POC تزداد مع العمق
– القرب من المصادر الأرضية، عمق المياه الضحل والأنشطة البيولوجية العالية قد تساهم في تركيزات عالية في المياه القريبة من الشاطئ
– مع صغر حجم الجسيمات، يحدد الحجم إلى حد كبير نقلها ومصيرها
– الميكروبلاستيك الصغير، بغض النظر عن كثافتها، يغرق بسرعات متقاربة
– البلاستيك-C غير القابل للتحلل يغير نظام الكربون البحري، خاصة في أعماق البحار
– قد تساهم الاختلافات في إمكانيات التحلل للبوليمرات ومصادر البلاستيك المختلفة في الاختلافات المكانية في توزيع البوليمرات
– زمن احتباس الجسيمات في الطبقات المتمايزة يزداد بشكل تربيعي مع حجم الجسيمات
– قد تؤدي الطبقات الموسمية إلى
تحسين توصيف الجسيمات:
– تحديد الحجم، الشكل، الكثافة، اللون والتوقيع الكيميائي وفقًا لتوزيع مستمر (H)
– تقدير الكثافة في الموقع للميكروبلاستيك، بما في ذلك البلاستيك وأي مواد حيوية/غير حيوية على سطحه (M)
– تطوير طرق لتقدير أعمار البلاستيك وتركيب الكربون (M)
توزيع البوليمر:
– البوليمرات العائمة تهيمن بشكل عام (L)
– البوليمرات الكثيفة أكثر انتشارًا في المياه البعيدة والأعمق (M)
– بوليمرات محددة تختلف بين المياه القريبة من الشاطئ والبعيدة (M)
تضخ الميكروبلاستيك الكبير إلى أعماق أعمق
– التجمعات البحرية هي ناقل مهم لنقل الميكروبلاستيك إلى المياه الأعمق
تحديد المعلمات الرئيسية لآليات النقل البيولوجية والفيزيائية:
– دراسة الهيكل الفيزيائي للبيوفيلم المرتبط بالميكروبلاستيك، مثل السماكة، الخشونة، عدد الخلايا والكتلة الحيوية (L)
– تقدير معدلات الغرق للميكروبلاستيك ذي الصلة البيئية المستعمر بواسطة البيوفيلم، المدمج في الثلج البحري والكرات البرازية (H)
– قياس تأثير المعادن البيولوجية على التدفق العمودي للبلاستيك (H)
– دراسة التغيرات في الميكروبيوم للثلج البحري المحمل بالبلاستيك أثناء انتقاله عبر عمود الماء (L)
– استكشاف كفاءة النقل للغمر الفيزيائي مثل التغيرات الموسمية في تمايز المياه والدوامات (M)
العمليات التي تتوسطها البيولوجيا:
– البيوفيلم وحده نادرًا ما يمكنه غمر الميكروبلاستيك إلى قاع البحر
– تم تأكيد تدفق الميكروبلاستيك مع ملف قانون القوة (L)
– الكرات البرازية والوزن المعدني هي وسيلة فعالة لتصدير الميكروبلاستيك إلى أعماق البحار
تحسين النموذج:
– تطوير معلمات ميكروبلاستيك ذات صلة بيئية بناءً على التجارب والملاحظات، مع التركيز بشكل خاص على نسب البلاستيك-C:الكربون العضوي في تدفقات الجسيمات، معدلات غرق الجسيمات، معدلات إعادة التمعدن ومعدلات ابتلاع العوالق (H)
– إنشاء مجموعات بيانات موحدة لتقييم أداء النموذج (H)
– تحسين المعلمات الميكانيكية لتفتيت البلاستيك الحيوي وغير الحيوي (H)
– تحسين تقديرات المصادر والمصارف لتقييد ميزانية الميكروبلاستيك العالمية (H)
يوفر هذا الجدول تقييمًا منظمًا للحالة الحالية للمعرفة حول الميكروبلاستيك تحت السطح، ملخصًا الرؤى الرئيسية حول سلوكها والعمليات المرتبطة بها. يتضمن نظرة عامة على الفهم الحالي، تصنيفًا نوعيًا (عالي (H)، متوسط (M) أو منخفض (L)) لمدى فهم كل موضوع، أسئلة رئيسية غير محلولة وفجوات بحثية حرجة. بالإضافة إلى ذلك، يخصص مستويات الأولوية (عالية (H)، متوسطة (M) أو منخفضة (L)) للتحقيقات المستقبلية على مدى السنوات القادمة.
5-6 أوامر من الاختلافات في وفرة الميكروبلاستيك . كما أن التقنيات التحليلية تؤدي إلى اختلافات. يعتمد اختيار العينات المدعوم بالمجهر يليه التعرف الكيميائي – وهي طريقة تم تطبيقها في 70% من الدراسات – بشكل كبير على خبرة المحققين وتصبح غير موثوقة للميكروبلاستيك الصغير . على سبيل المثال، كشفت دراسة تستخدم التصوير بالأشعة تحت الحمراء الدقيقة ( -FTIR) القادرة على تحديد جزيئات البوليمر حتى (مرجع 27)، عن 2-3 أوامر من الميكروبلاستيك أكثر في نوى الجليد البحري في القطب الشمالي مقارنة بالتقديرات السابقة المعتمدة على المجهر الضوئي . قد تنجم التباينات أيضًا عن أخذ عينات فرعية بدلاً من تحليل العينة الكاملة. يمكن أن يؤدي استقراء النتائج من العينات الفرعية إلى إدخال تحيزات تصل إلى (المراجع 29،30). هذه الشكوك المنهجية تعيق حاليًا التقدير الدقيق لتوزيع الميكروبلاستيك في البيئة. تعتبر جهود البحث التي تهدف إلى تعزيز دقة الملاحظة في عمود الماء، مع استخدام طرق متسقة، ضرورية في تحسين فهمنا لمخزون الميكروبلاستيك البحري، سواء تم قياسه بالعدد أو بالكتلة.

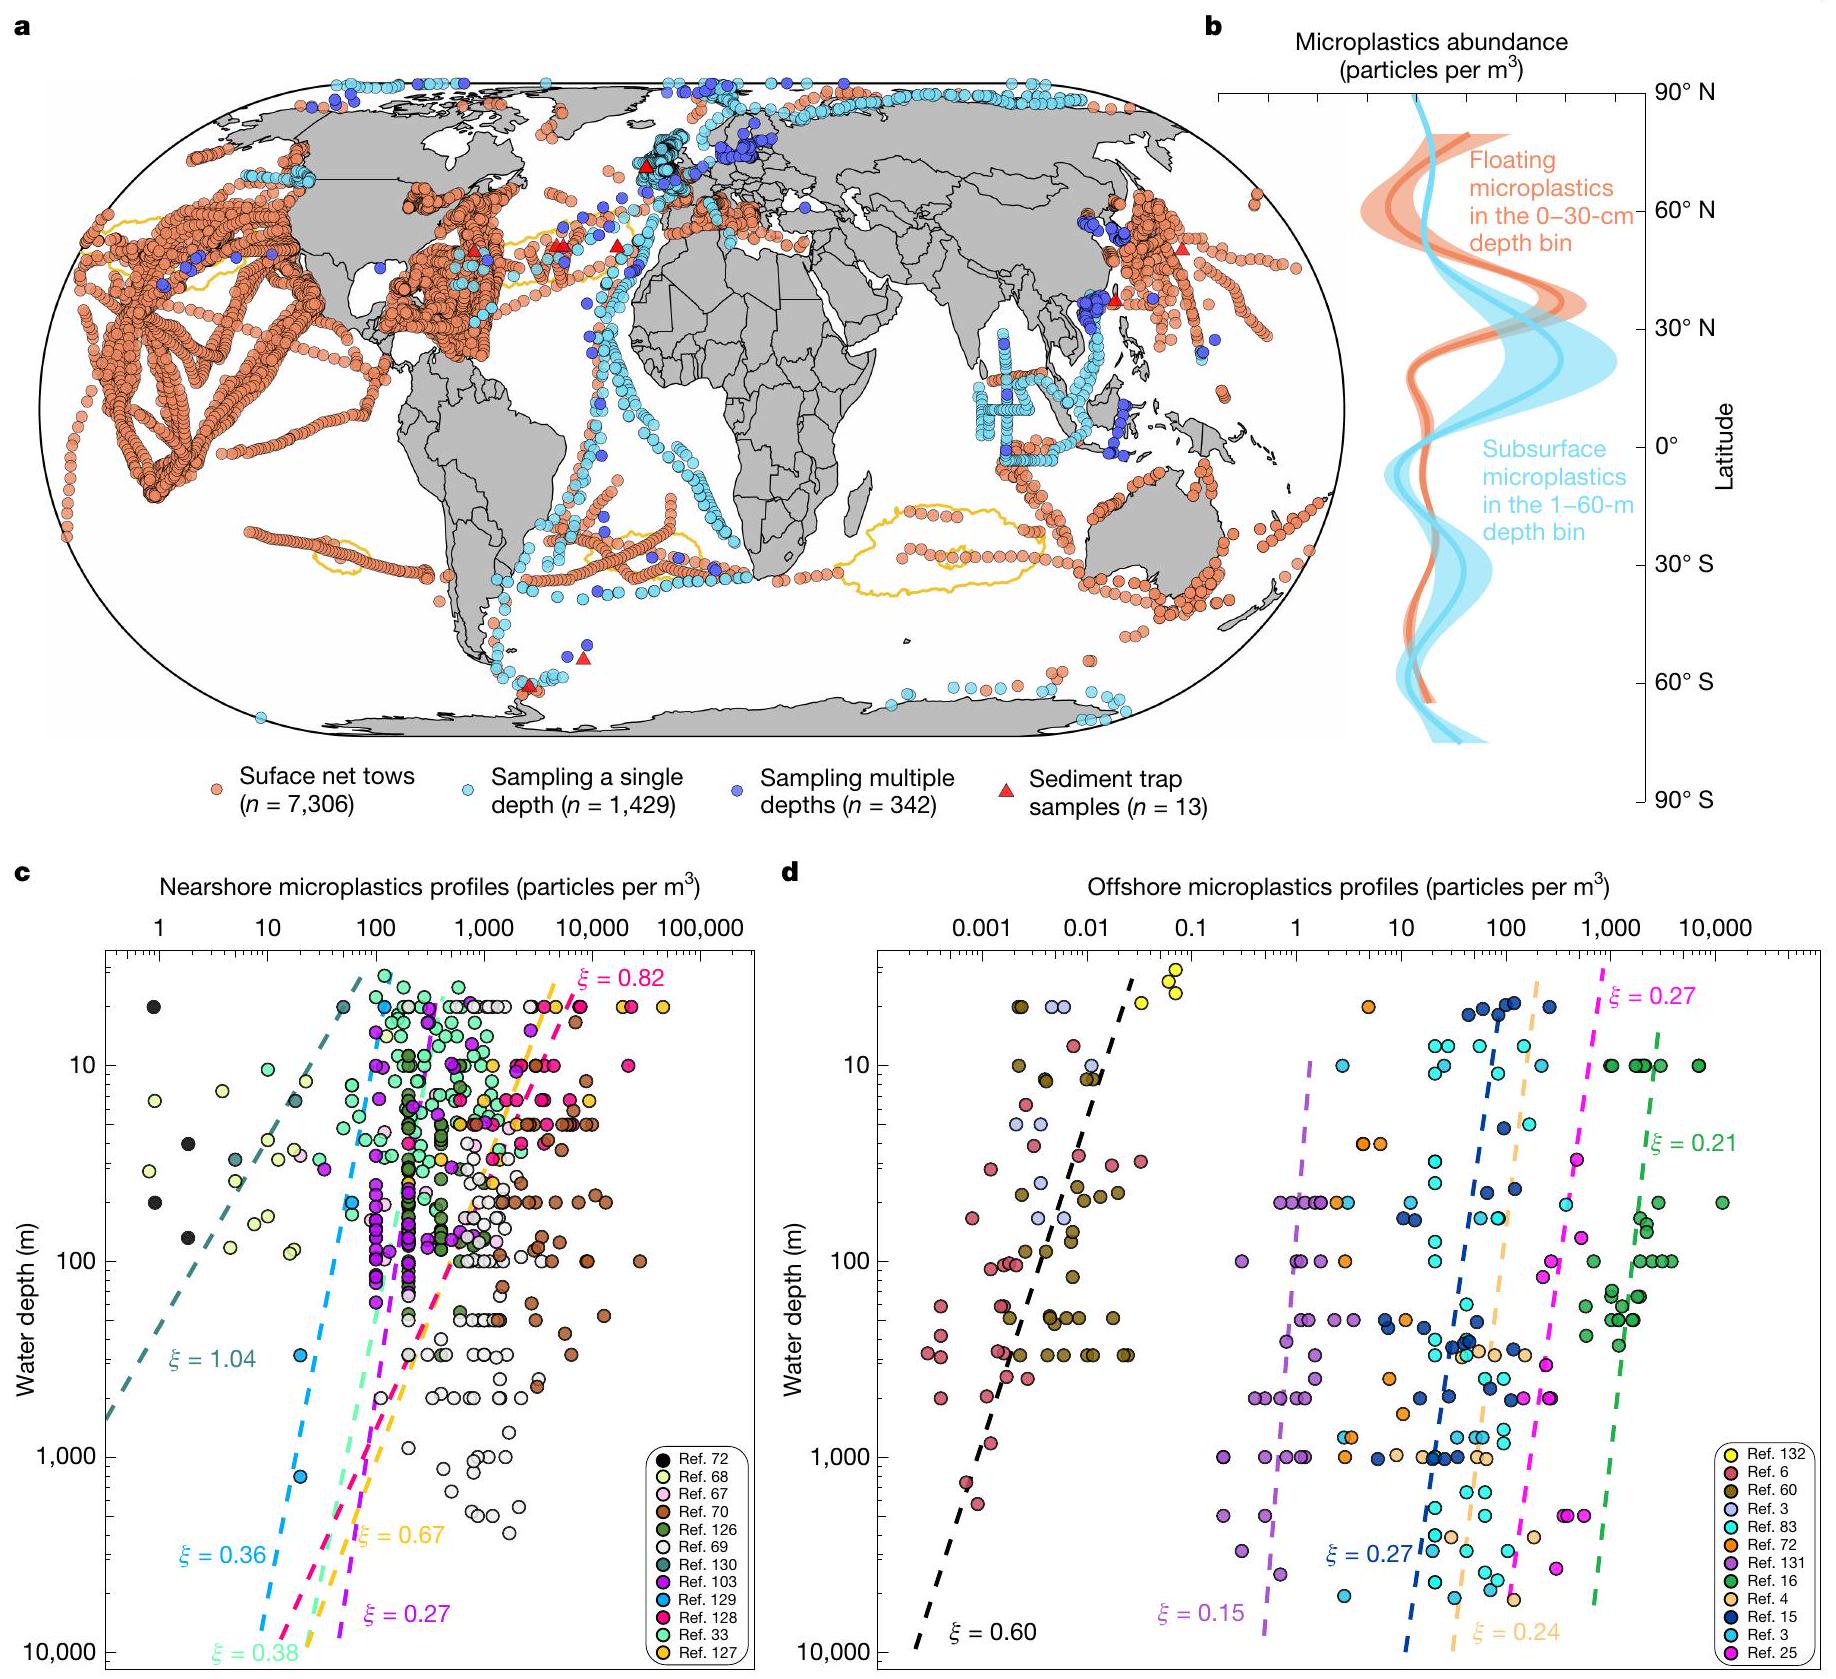
الميكروبلاستيك يتخلل مياه المحيط

يكشف تلخيصنا أن أخذ عينات الميكروبلاستيك تحت السطح يتركز في المحيطات الأطلسية والأطلسية-القطبية (الشكل 1a). في المياه بين 1 م و 60 م، يمكن أن تصل وفرة الميكروبلاستيك الكبير، المحددة عند عمق واحد وممثلة بالنقاط الزرقاء الفاتحة في الشكل 1a، إلى 800 جزيء لكل (مرجع 31)، بوسيط 0.49 جزيء لكل (الشكل البياني الممتد 1). مقارنة وفرة الميكروبلاستيك في كسور الحجم المتشابهة ( ; الطرق)، تكشف عن أنماط عرضية متسقة بين الميكروبلاستيك تحت السطح ( ) والميكروبلاستيك العائم (الوسيط: 0.02 جزيء لكل ; الأعلى 0.5 م؛ المرجع 6)، حيث يصل كلاهما إلى ذروتهما في المناطق شبه الاستوائية (الشكل 1b). ومع ذلك، فإن أعداد الميكروبلاستيك تحت السطح عند العمق أعلى بشكل ملحوظ من تلك الموجودة على السطح ( ، الشكل البياني الممتد 1).
على الرغم من الشكوك، تشير القياسات من الدراسات التي تجمع عينات عند أعماق متعددة لكل محطة (الوسيط 205 جزيء لكل ; النطاق إلى جزيء لكل ، ممثلة بالنقاط الزرقاء الداكنة في الشكل 1a) إلى أن عمود الماء يمثل خزانًا رئيسيًا من
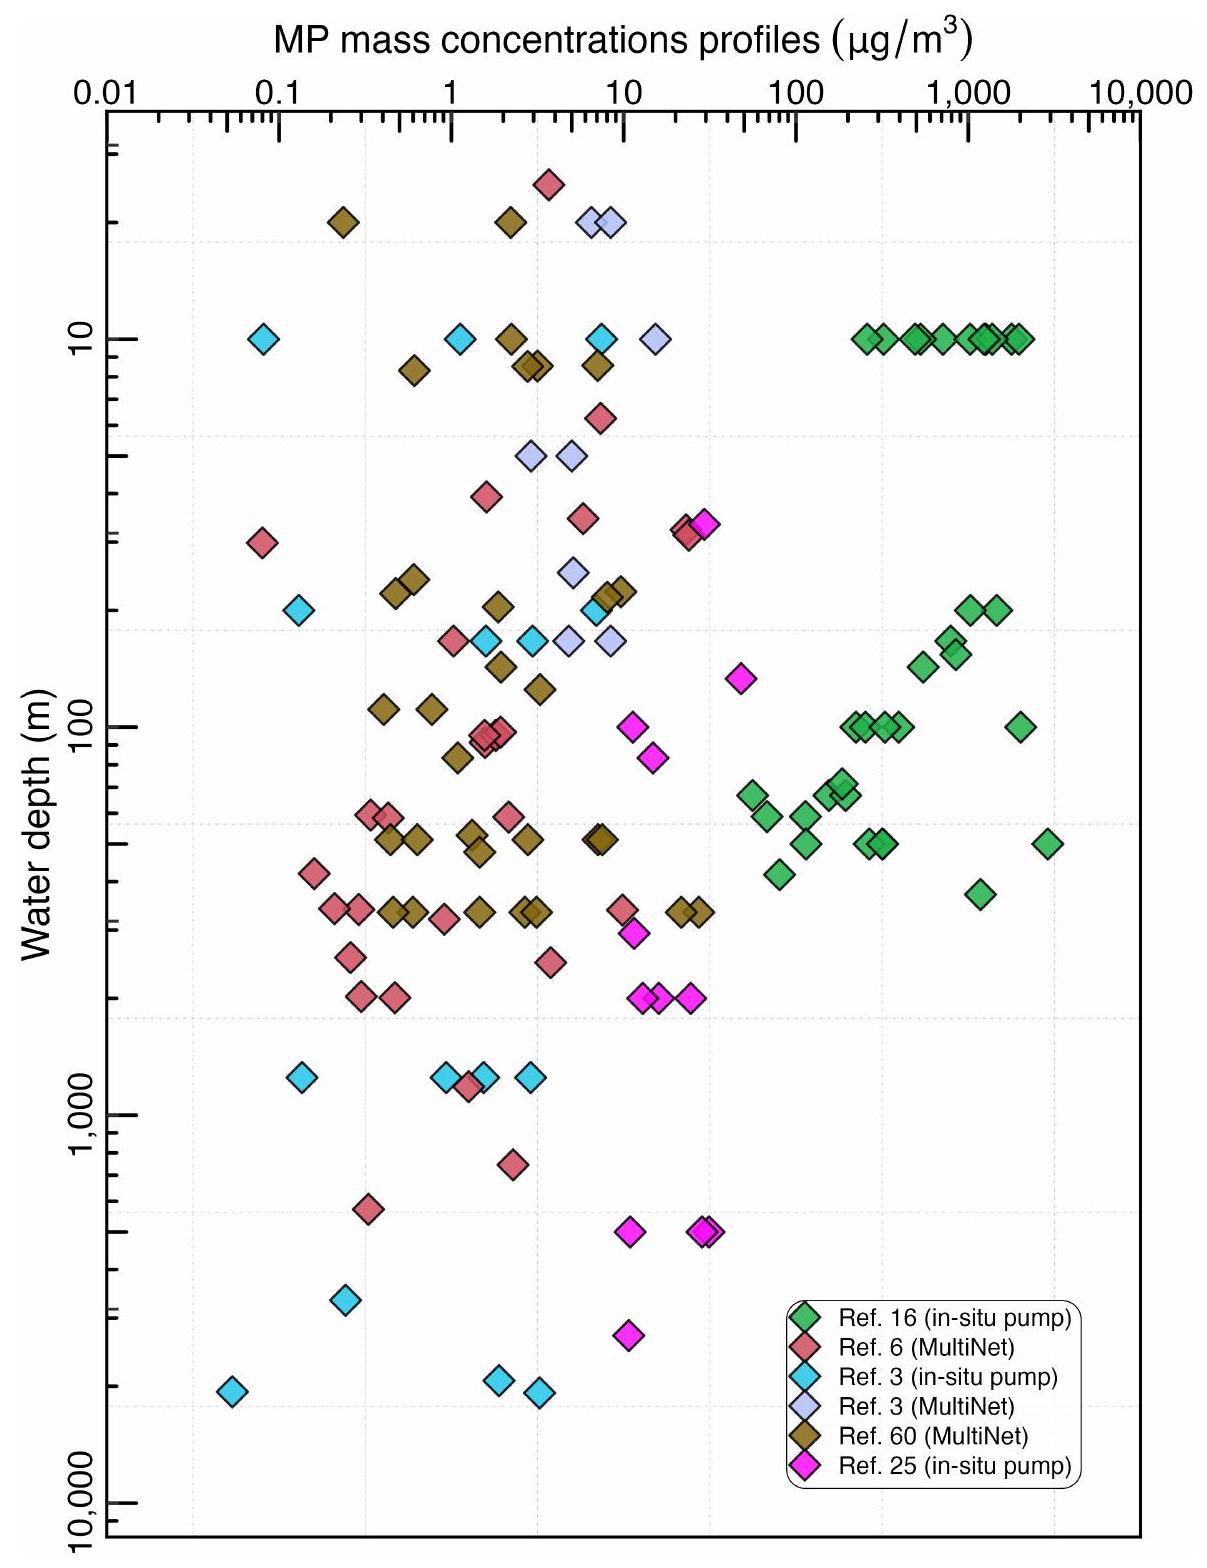
الميكروبلاستيك. تم ملاحظة وفرة عالية باستمرار في المياه العميقة، بما في ذلك أكثر من 1,100 جزيء لكل عند في مقطع عرضي شمال-جنوب عبر المحيط الأطلسي، جزيء لكل عند 2,000 م في الدوامة شبه الاستوائية في المحيط الهادئ الشمالي، جزيء لكل عند في القطب الشمالي ، و 13,500 جزيء لكل عند 6,800 م في خندق ماريانا . على طول الساحل الكوري وحده، يُقدّر أن هناك 3.13 تريليون ميكروبلاستيك بحجم موجودة في عمود الماء . وهذا يمثل جزءًا صغيرًا ولكنه ملحوظ من 171 تريليون بلاستيك عائم في نفس نطاق الحجم الذي لوحظ عالميًا، معظمها من الميكروبلاستيك . في المحيط الأطلسي، يبلغ متوسط الميكروبلاستيك من فئة الحجم في أعلى 200 م 2,200 جزيء لكل ، مع كتلة مقدرة تتراوح بين 11.6-21.1 مليون طن متري. هذه الكتلة قابلة للمقارنة مع إجمالي إدخال البلاستيك في فئة الحجم (17-47 مليون طن متري) إلى مياه الأطلسي والرواسب من 1950-2015 المقدرة في المرجع 16. ومع ذلك، فإن هذه التقديرات تخضع لقدر كبير من عدم اليقين بسبب دقة الملاحظة الخشنة، والفيزياء البحرية المبسطة وعدم التناسق المنهجي.

أنماط توزيع الميكروبلاستيك تحت السطح

تم تصنيف مواقع أخذ العينات على أنها “قريبة من الشاطئ” (داخل 200 ميل بحري من الشاطئ) و”بعيدة عن الشاطئ” (أكثر من 200 ميل بحري) . تراوحت وفرة الميكروبلاستيك من إلى جزيئات لكل بالقرب من الشاطئ ومن إلى جزيئات لكل بعيدًا عن الشاطئ. على الرغم من احتمال التقليل من التقديرات في الدراسات القريبة من الشاطئ باستخدام طرق مدعومة بالمجهر، فإن الوسيط القريب من الشاطئ (500 جزيء لكل ) يزيد عن 30 مرة أعلى من الوسيط البعيد عن الشاطئ (16 جزيء لكل ) حيث غالبًا ما كانت تستخدم طرق متقدمة (الجداول التكميلية 2 و3). يتماشى هذا الوسيط القريب من الشاطئ مع القيم من مناطق تراكم البلاستيك البعيدة عن الشاطئ التي تم تأكيدها عبر -FTIR التصوير (على سبيل المثال، 400 جزيء لكل في دوامة شمال المحيط الهادئ شبه الاستوائية و250 جزيء لكل في دوامة جنوب المحيط الأطلسي شبه الاستوائية ). تتطابق الوفرة العالية بالقرب من الشاطئ مع التوقعات السابقة والملاحظات الميدانية ، مما يشير إلى أن المناطق الساحلية قد تعمل كمناطق تراكم البلاستيك على غرار الدوامات البعيدة عن الشاطئ . عوامل مثل القرب من المصادر الأرضية والمياه الضحلة القريبة من الشاطئ حيث تسحب الاضطرابات البلاستيك إلى الأسفل من المحتمل أن تسهم في هذه الملاحظة.
تتناقص وفرة الميكروبلاستيك عمومًا مع عمق المياه (الشكل 1c، d). تظهر المياه القريبة من الشاطئ انخفاضًا أكثر حدة في الوفرة مقارنة بالمياه البعيدة عن الشاطئ ; الشكل التمديدي 2 والجدول التكميلية 4)، مع انخفاض الوفرة بنسبة تصل إلى 1000 مرة (الشكل 1c). من المحتمل أن يكون هذا الانخفاض الحاد ناتجًا عن الإنتاجية المعدنية والبيولوجية العالية في المياه الساحلية، مما يعزز معدلات غرق الميكروبلاستيك المتجمع . تساهم الدياتومات، السائدة في النظم البيئية الساحلية، في توفير الهياكل السيليسية (الكثافة ) التي توجد غالبًا على سطح الميكروبلاستيك، مما يزيد من تأثيرها ك ballast . وبالمثل، تضيف ترسبات الكالسيت (الكثافة ) المرتبطة بالميكروبلاستيك المتأثر بالبيولوجيا وزنًا، مما يسرع من غرقها . معًا، تعزز هذه العوامل النقل العمودي الفعال للميكروبلاستيك في المياه القريبة من الشاطئ. تتفق هذه النتائج مع النماذج التي تتنبأ بالغرق السريع للميكروبلاستيك في المناطق الساحلية ذات الإنتاجية البيولوجية العالية مع تدفق قوي للأسفل، مثل شرق آسيا . على العكس من ذلك، قد يؤدي انخفاض الإنتاجية في المياه البعيدة عن الشاطئ إلى تقليل كفاءة النقل العمودي ، مما يسهم في الفروق الملحوظة في معدلات تدهور الوفرة. بالإضافة إلى ذلك، نظرًا لقربها من مصادر البلاستيك الساحلية، قد تؤدي آثار التخفيف على مستويات الميكروبلاستيك (الناجمة عن المدخلات الساحلية والنهرية) في المياه الساحلية أيضًا إلى هذا الانخفاض السريع في التركيز. القياسات المباشرة لتدفق الميكروبلاستيك العمودي نادرة وتعيق الاختلافات المنهجية الرؤى الواضحة (الجدول التكميلية 5). يجب أن تستكشف الأبحاث المستقبلية آليات النقل العمودي في النظم البيئية ذات الإنتاجية البيولوجية المتنوعة، مع دمج قياسات التركيز مع تحليل ملف التدفق لتحسين فهم العمليات التي تنقل الميكروبلاستيك إلى الأسفل، على غرار دراسة الكربون العضوي الجزيئي .
تظهر ملفات وفرة الميكروبلاستيك البعيدة عن الشاطئ التي تقل عن انخفاضًا تدريجيًا (ضمن ترتيب واحد من حيث الحجم) مع العمق (الشكل 1d)، مما يعني توزيعًا نسبيًا متساويًا في عمود الماء . تشير النماذج أيضًا إلى انتشار موحد للميكروبلاستيك الصغير في عمود الماء، يتصرف بشكل مختلف عن الجزيئات الكبيرة ، مع سرعات غرق تتراوح من إلى ، بغض النظر عن البلاستيك العائم أو الكثيف . حتى أن التأثيرات البيولوجية تغير بشكل طفيف سرعات استقرار الميكروبلاستيك الصغير بسبب مساحة سطحها المحدودة . يدعم انخفاض بمقدار ترتيبين من حيث الحجم في وفرة الميكروبلاستيك الكبير إلى مع العمق في المياه البعيدة عن الشاطئ أيضًا هذا التوزيع المعتمد على الحجم (الشكل 1d). تظهر النماذج والملاحظات أنه، مقارنة بالميكروبلاستيك الصغير، تميل الميكروبلاستيك الكبيرة إما للبقاء على سطح البحر أو الوصول بسرعة إلى قاع البحر، مما يؤدي إلى انخفاض سريع في الوفرة على طول تدرجات العمق .
الملاحظات طويلة الأمد ضرورية لفهم ملفات وفرة الميكروبلاستيك وتدفقات العمود. من الضروري التقاط كل من الخصائص المنفصلة (مثل البوليمرات واللون) والمستمرة (مثل الحجم والشكل والكثافة) للميكروبلاستيك لتوضيح آليات إعادة التوزيع الفيزيائية والبيولوجية . تختلف العمليات الفيزيائية، مثل التراص الموسمي والانغماس المدفوع بالدوامات، في المقاييس الزمنية والمكانية وتظل غير مفهومة بشكل جيد. نادرًا ما تم دراسة العوامل البيولوجية، مثل الهيكل الفيزيائي (على سبيل المثال، السماكة والكتلة الحيوية والكثافة ) للأغشية الحيوية المرتبطة بالميكروبلاستيك عبر الأعماق. كيف تتفاعل الميكروبلاستيك مع التجمعات البحرية (المكونة من الميكروبات والمواد العضوية وغير العضوية ) خلال انتقالها عبر عمود الماء، بما في ذلك عوامل مثل سرعات الغرق وقوة التماسك للتجمعات المحملة بالبلاستيك، يتطلب أيضًا أبحاثًا مستقبلية.
تُبلغ النتائج عمومًا كعدادات، لذا فإن قياسات كتلة الميكروبلاستيك في عمود الماء محدودة. تتفاوت تركيزات كتلة الميكروبلاستيك بنسبة تصل إلى خمسة أوامر من حيث الحجم (الشكل التمديدي 3)، ويرجع ذلك جزئيًا إلى الاختلافات المنهجية. في دوامة شمال المحيط الهادئ شبه الاستوائية، تكون تركيزات الكتلة للميكروبلاستيك الصغيرة والكبيرة المأخوذة في نفس الوقت متقاربة عند أعماق ضحلة (الشكل التمديدي 3)، لكن نسبة الكتلة للميكروبلاستيك الصغيرة إلى الكبيرة تزداد مع العمق ، مما يبرز الأهمية المتزايدة للميكروبلاستيك الصغيرة عند أعماق أكبر.

تراص الكثافة المحتفظة بالميكروبلاستيك الكبيرة

يخلق التراص العمودي للكثافة في المحيط، المدفوع بتدرجات الحرارة و/أو الملوحة، خطوط بيكنوكلاين، حيث تتغير كثافة الماء بشكل حاد . هذه الخطوط البيكنوكلاين شائعة في المحيط وغالبًا ما ترتبط بأنشطة بيولوجية مكثفة وتركيزات مرتفعة من الجسيمات، مثل تراكم الثلج البحري . تظهر الملاحظات في كل من المياه القريبة من الشاطئ والمياه البعيدة عن الشاطئ زيادة في الميكروبلاستيك داخل طبقات البيكنوكلاين مقارنة بتلك الموجودة أعلاها. تشير تجميعاتنا إلى أن الوفرة المرتفعة في الطبقات المتراصة مرتبطة في الغالب بالميكروبلاستيك الكبيرة بدلاً من الصغيرة (الشكل 2a). يؤثر التراص على استقرار الجسيمات من خلال مزيج من الطفو، الانتشار واللزوجة، مما يبطئ الغرق عن طريق زيادة السحب وكبح الحركة العمودية، موجهًا الجسيمات على طول خطوط الإيزوبيكنوكلاين . يعتمد ما إذا كان التراص يؤثر على حركة الجسيمات على مقياس طول التراص ( )، المسافة التي تتغير فيها كثافة الماء، والتي تتراوح من إلى 1 مم. تتأثر الجسيمات الأكبر من ، مثل الميكروبلاستيك الكبيرة، بشكل كبير، بينما لا تتأثر الميكروبلاستيك الصغيرة إلى حد كبير . تتعرض الجسيمات ذات الأشكال غير المنتظمة التي تخضع لإعادة توجيه ناتجة عن التراص لمزيد من التباطؤ . نتيجة لذلك، تتعرض الميكروبلاستيك الكبيرة وغير المنتظمة لزمن استقرار مطول وتتركز عند خطوط البيكنوكلاين. تم أيضًا ملاحظة عدم تراكم الميكروبلاستيك الصغيرة عند واجهات الكثافة في نظام مائي عذب . تتفق نتائجنا أيضًا مع دراسة نموذجية تحدد تراكمًا بارزًا للميكروبلاستيك الكبيرة عند خطوط البيكنوكلاين، مقارنة بالميكروبلاستيك الصغيرة، في المحيط المفتوح
الشكل 2 | التوزيع العمودي للميكروبلاستيك على طول تدرجات عمق المياه كدالة لحجم الجسيمات، التراص الكثافي وموقع أخذ العينات. أ، العلاقة بين وفرة الميكروبلاستيك داخل طبقات البيكنوكلاين وتلك الموجودة فوق طبقات البيكنوكلاين كدالة لفئة حجم الميكروبلاستيك: الميكروبلاستيك الصغيرة (مثلثات ذهبية؛ المراجع 3، 33، 56) والميكروبلاستيك الكبيرة (نقاط بنية؛ المراجع 3، 56، 67-72). تمثل الخطوط المنقطة نسب وفرة الميكروبلاستيك داخل طبقات البيكنوكلاين إلى تلك الموجودة فوق طبقات البيكنوكلاين. يرجى الرجوع إلى الطرق لتصنيف الميكروبلاستيك الكبيرة والصغيرة. ب، مخططات الصندوق والشوكة لقياسات وفرة الميكروبلاستيك الصغيرة والكبيرة
المحيط . إن التحقيق الإضافي في الميكروبلاستيك في خطوط البيكنوكلاين وغيرها من الطبقات المتميزة، مثل الحد الأقصى للكلوروفيل العميق وطبقات النيفلوييد القاعية، أمر ضروري لفهم ليس فقط النقل ولكن أيضًا التعرض المحتمل للحياة البحرية.

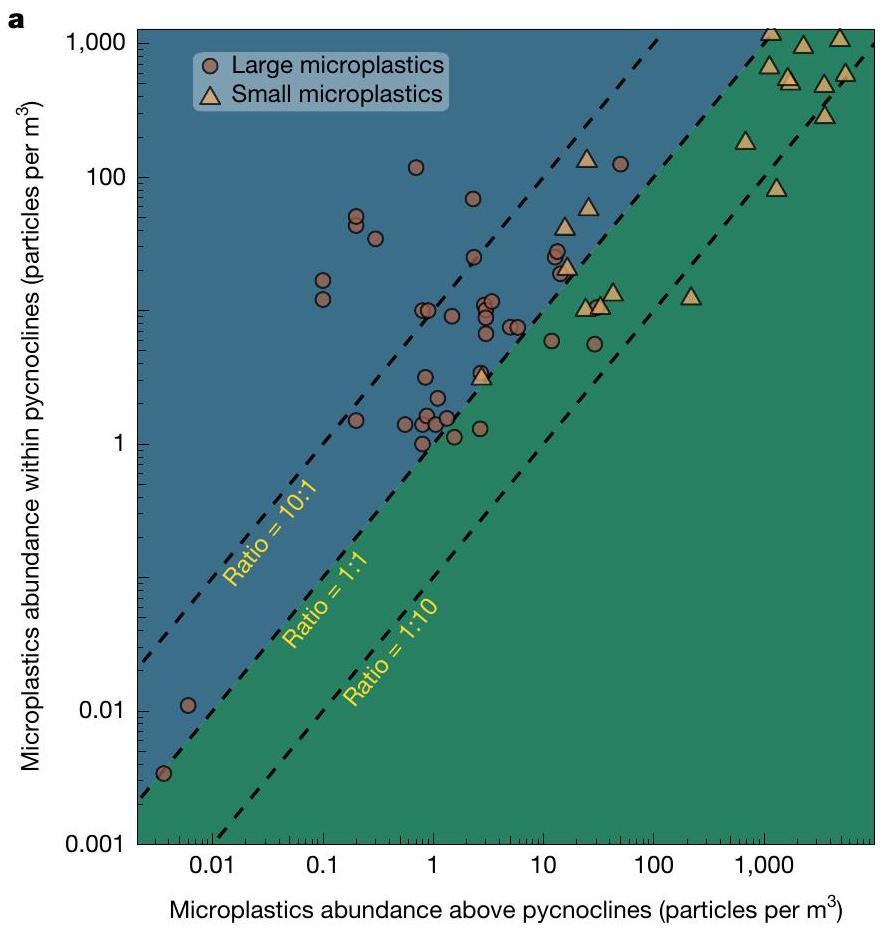
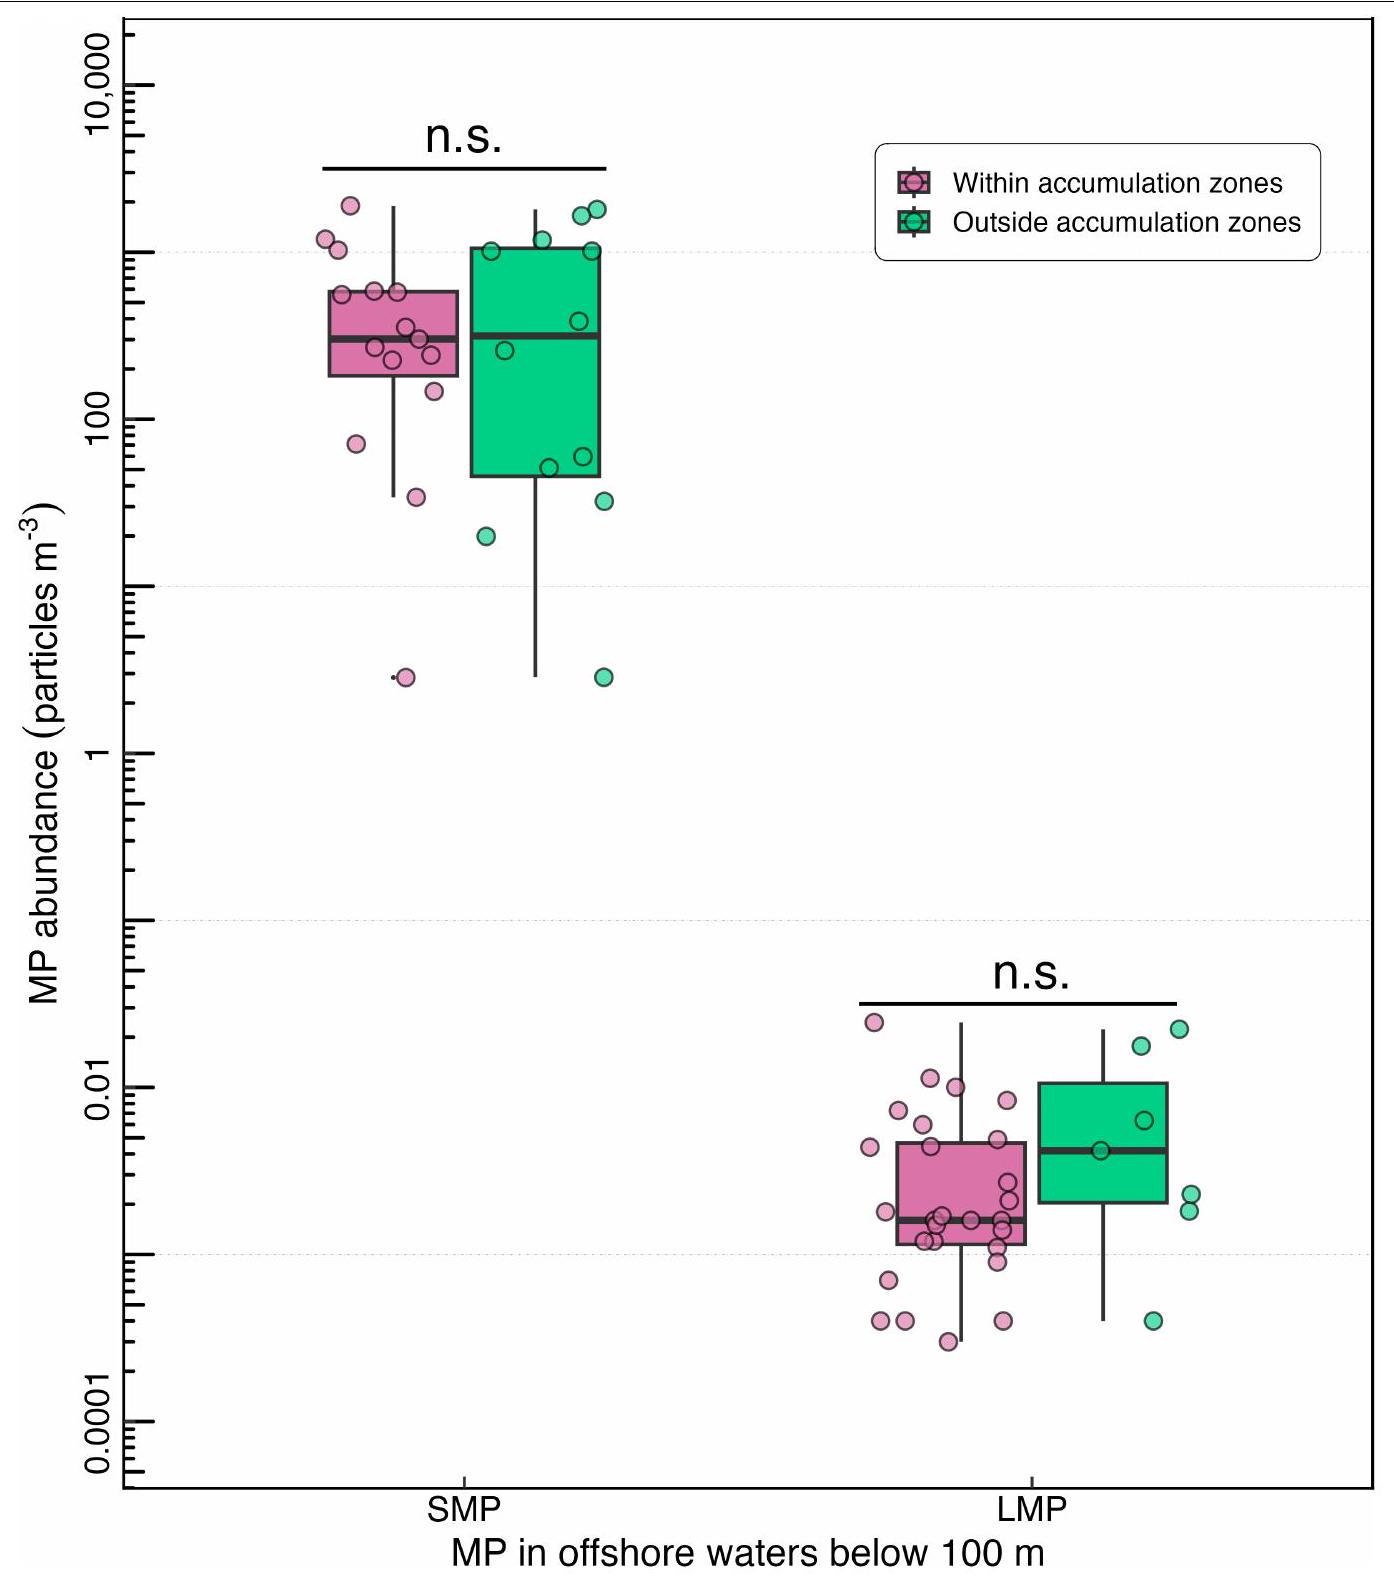
التمديد العمودي لمناطق تراكم الميكروبلاستيك

الميكروبلاستيك الكبير، العائم على سطح البحر العمق) وموجودة في المياه تحت السطحية (بيانات من المراجع 55، 77-86 تم جمعها عند عمق واحد بين 1 م و 60 م)، تصل إلى ذروتها في الوفرة عند خطوط العرض المتوسطة (نماذج إضافية عامة (GAMs)، ؛ الشكل 1ب والشكل الإضافي 1). ومع ذلك، فإن توزيعها يختلف على طول التدرجات العرضية. كما لوحظت وفرة مرتفعة في نطاق العمق فوق و تتوافق الزيادة في الكثافات عند خطوط العرض العالية مع نتائج النمذجة، مما يشير إلى أن التيارات تحت السطحية تحمل الميكروبلاستيك إلى المناطق القطبية. تشير الملاحظات إلى أن المحيط الأطلسي هو أكبر مصدر للميكروبلاستيك تحت السطح الذي تم جمعه في المياه القطبية. “. بالإضافة إلى المدخلات من التدفقات المحيطية، هناك مصادر أخرى مثل التسليم الجوي والأنهار (على سبيل المثال، تدفقات الأنهار الأوراسية) ) من خطوط العرض المنخفضة يمكن أن تساهم أيضًا في الكميات الملحوظة من الميكروبلاستيك في العروض الشمالية العالية.
تراكم الجزيئات البلاستيكية الكبيرة تتطابق الأعماق في المناطق المتوسطة العرض مع مناطق تلاقي البلاستيك التي تم رصدها بواسطة شباك السطح. ونماذج عالمية ، مما يشير إلى أن هذه المناطق تمتد أعمق. تؤكد المحاكاة ثلاثية الأبعاد لنقل الميكروبلاستيك في المحيط العالمي أيضًا على استمرار مناطق تجمع الميكروبلاستيك شبه الاستوائية عند أعماق مائية معينة، مما يظهر أن هيكل هذه المناطق التراكمية في الدوامات يبقى واضحًا حتى عمق 16 مترًا ويختفي عند 60 مترًا (مرجع 87). تقترح نماذج أخرى أن

داخل وخارج مناطق التراكم المعروفة في أعلى 100 متر من عمود الماء (الطرق). مجموعات البيانات مأخوذة من المراجع. ، التي أخذت عينات من الميكروبلاستيك عند أعماق متعددة في كل محطة (ممثلة بالنقاط الزرقاء الداكنة في الشكل 1a). تمثل الخطوط السوداء العريضة الأفقية داخل الصناديق الملونة وسطاء الصندوق، بينما تشير أعلى وأسفل الصناديق إلى النسب المئوية 25 و75. تشير الشعيرات إلى أكبر وأصغر القيم المقاسة ضمن 1.5 نطاق ربعي من الصندوق. تشير النجمة إلى وجود فرق ذو دلالة إحصائية بين الميكروبلاستيك الصغير والميكروبلاستيك الكبير ( ). ‘NS’ تشير إلى عدم وجود فرق ( ).
تتبع الجزيئات البلاستيكية العائمة في أعلى 10 أمتار من عمود الماء نمط السطح، مع تركيزات عالية في دوامات المحيط الوسطى. تحليلنا للميكروبلاستيك الكبير المقاس في أعماق متعددة في كل محطة في الدوائر الاستوائية الفرعية يدعم أيضًا هذه النتيجة. ضمن الـ 100 متر العليا، فإن وفرة الميكروبلاستيك الكبير في مناطق التراكم أعلى بشكل ملحوظ من الخارج. ؛ الشكل 2ب). ومع ذلك، لا توجد هذه الفجوة تحت 100 متر (الشكل البياني الممتد 4). يمكن تفسير وجود بقع كبيرة من الميكروبلاستيك في المياه القريبة من السطح بشكل رئيسي من خلال مزيج من تيارات إكمان المدفوعة بالرياح والإقامة المطولة للميكروبلاستيك الكبير في العمود المائي العلوي. معًا، تمتد مناطق تراكم البلاستيكيات الدقيقة الكبيرة إلى عمود المياه المحيطية، مقيدة بشكل أساسي بالمياه القريبة من السطح؛ وهو نمط غير واضح مع البلاستيكيات الدقيقة الصغيرة. الجهود البحثية الإضافية ضرورية لتحديد الحدود تحت السطحية لمناطق التراكم، وتوصيف البلاستيكيات الدقيقة في كل طبقة، وتقييم تأثيراتها البيئية.

الكربون البلاستيكي يدخل حوض الكربون الجزيئي البحري

تشكل الحطام البلاستيكي مصدرًا للكربون الغريب (C) للأنظمة البيئية البحرية. وقد تم تقدير كربون الميكروبلاستيك تحت السطح من خلال حساب كتلة الجسيمات وضربها في في الصيغ الكيميائية للبوليمرات الشائعة تحليلنا يظهر أن نسبة الكربون الميكرو بلاستيكي إلى إجمالي الكربون العضوي الجزيئي (POC) تزداد مع العمق في الدوائر الاستوائية الفرعية. ; الشكل البياني الموسع 5). هذا لأن من المادة العضوية الجزيئية يتم إعادة معدنتها في الـ 500 متر العليا (المرجع 96)، مقارنة بالكربون البلاستيكي المستمر. يمكن أن تصل نسبة الميكروبلاستيك-كربون: المادة العضوية القابلة للذوبان إلى في ، مما يعكس التغيرات في التركيب الجزيئي العام. مع زيادة البلاستيك
من المتوقع أن يؤدي تسرب المواد إلى المحيط إلى إضافة كبيرة وطويلة الأمد من الكربون الميكرو بلاستيكي إلى مجموعة الكتلة العضوية القابلة للاستخدام في المحيط. يتم استخدام الكربون الميكرو بلاستيكي بواسطة الميكروبات البحرية جنبًا إلى جنب مع المستقلبات والحطام العضوي الذي تطلقه العمليات الميكروبية. يمكن أن تؤثر على الدورات البيوجيوكيميائية، مثل النترجة وإزالة النيتروجين . ومع ذلك، فإن تأثير البلاستيك-C على مجموعة المواد العضوية القابلة للذوبان في البحر قد تلقى اهتمامًا قليلاً، مما يستدعي المزيد من الاستكشاف، حيث أن المواد العضوية القابلة للذوبان في البحر مركزية لتخزين الكربون على المدى الطويل والدورات البيوجيوكيميائية. . بالإضافة إلى ذلك، يمكن أن تتداخل البلاستيك-C المنقوص تحديد الأعمار المعتمدة على تقليل نسبة المواد المشعة (المرجع 99). يمكن أن يجعل مساهمة 5% من البلاستيك-C عينات POC البحرية تبدو أكبر بحوالي 420 عامًا من عمرها الظاهر الحقيقي. يقدم البلاستيك-C تعقيدًا إضافيًا في تفسير أعماق المحيط التي تعاني بالفعل من الندرة. البيانات، مما يعقد فهمنا لدوران المحيطات، ودورة الكربون، وظروف المناخ في الماضي . هذا يتطلب المزيد من بيانات الكربون العضوي البلاستيكي وتعديلات على النماذج التي تتنبأ أو تفسر المحيطات العميقة المستويات.

مقارنة النماذج بالملاحظات

تستكشف المحاكاة بشكل متزايد نقل ومصير الميكروبلاستيك عند أعماق مختلفة باستخدام مجموعة متنوعة من الأطر والمعايير. (الشكل 3أ). فهم مدى تعكس هذه النماذج أنماط الميكروبلاستيك في عمود الماء المرصودة هو مفتاح لتوضيح آليات الانتشار وتحديد مصادر الخطأ وعدم اليقين في تقديرات الميكروبلاستيك تحت السطح.
في معظم النماذج، يتم التحكم في النقل العمودي للميكروبلاستيك بواسطة الخلط الناتج عن الرياح وعمليات النقل ثلاثية الأبعاد على نطاق واسع (الشكل 3أ). ومع ذلك، فإن الديناميات الفرعية (1-10 كم)، مثل النقل المدفوع بالدورات الهوائية – التي تعتبر حاسمة للنقل العمودي للجسيمات المحيطية الصغيرة. -نادراً ما يتم تحديدها كمعلمات إن تضمين الديناميات تحت المقياس في النماذج المستقبلية يمكن أن يحسن فهمنا لنقل الجزيئات البلاستيكية الصغيرة عمودياً وتنوعها.
وبالمثل، تشمل العمليات البيولوجية، بما في ذلك التلوث البيولوجي، وتكوين الثلج البحري وإنتاج كريات البراز – التي تعزز من غرق الميكروبلاستيك بفعل الجاذبية. -نادراً ما تؤخذ بعين الاعتبار . عند تضمينها، غالبًا ما يتم نمذجة هذه العمليات باستخدام معدلات إعادة التمعدن المعتمدة على درجة الحرارة ومعدلات الرعي الثابتة. ومع ذلك، فإن هناك اختلافات إقليمية في هيكل النظام البيئي التي تؤثر بشكل كبير على المعدلات، تُستبعد عمومًا. بالإضافة إلى ذلك، المعادن البيوجينية (على سبيل المثال، كربونات الكالسيوم، السيليكا المائية والسيلستيت)، المعروفة بأنها عوامل تحميل حاسمة تؤثر على التدفق المطلق للجسيمات الغارقة. تُهمل في جميع النماذج. تفترض النماذج عادةً أن الجسيمات الدقيقة البلاستيكية كروية وعائمة (الشكل 3أ)، على الرغم من الملاحظات التي تشير إلى وجود بلاستيك عائم وكثيف بأشكال متنوعة مع اختلافات كبيرة في نسب المساحة السطحية إلى الحجم. تسهم هذه المعلمات في الفجوات بين مخرجات النماذج والملاحظات. على سبيل المثال، على الرغم من أن الملاحظات تكشف عن وجود ذروات تحت السطح من الجسيمات الدقيقة البلاستيكية من الأعماق السطحية إلى الأعماق السحيقة. ، تشير بعض النماذج إلى أن معظم الميكروبلاستيك قد تصل فقط إلى أعماق تتراوح بين 150 مترًا إلى على نطاق عالمي أو ضمن أنظمة بحرية محددة وبالمثل، تشير النماذج إلى وجود محدود أو حتى غياب لنقل الجسيمات البلاستيكية الدقيقة إلى المناطق القطبية. .
تجعل القياسات النادرة وغير المؤكدة (المناقشة أدناه) للميكروبلاستيك تحت السطح من الصعب تقييم أداء النموذج بدقة والمعلمات الأخرى. على الرغم من هذه التحديات، تؤكد النماذج باستمرار على دور حجم الميكروبلاستيك في التأثير على توزيعها العمودي، مما يتماشى مع تحليلنا. (الشكل 1ب، ج). على سبيل المثال، في شمال المحيط الهادئ الشرقي، تتناقص أحجام الميكروبلاستيك نحو مركز الدوامة، وهو اتجاه توقعته النماذج وأكدته الملاحظات. وبالمثل، في البحر الأبيض المتوسط، تتنبأ النماذج بأن الجزيئات الدقيقة الصغيرة في عمود الماء تميل إلى الوصول إلى المحيط المفتوح، ويرجع ذلك أساسًا إلى الإزالة السريعة للجزيئات الدقيقة الكبيرة من البيئات الساحلية. .
تؤكد هذه النتائج على الحاجة إلى بيانات تجريبية متنوعة حول الميكروبلاستيك. يجب أن تشمل هذه البيانات، ولكن لا تقتصر على، معلومات موثوقة
قياسات الوفرة والخصائص، ومعدلات الغرق ذات الصلة البيئية، ومعدلات التلوث البيولوجي، ومعدلات الدمج والانفصال من الكتل، وسلامة الهيكل ومعدلات التحلل للكتل المحملة بالبلاستيك. ستكون البيانات حول اختيار وابتلاع جزيئات الميكروبلاستيك من العوالق، المصنفة حسب استراتيجية الرعي، ذات قيمة كبيرة لتحسين تقديرات نقل كريات البراز.

تركيب البوليمر للميكروبلاستيك تحت السطح

تم الكشف عن أكثر من 56 نوعًا من البوليمرات في مجموعة البيانات التي تم تصنيعها لدينا (الجدول التكميلي 6). تشكل البوليمرات العائمة نصف الإنتاج العالمي من البلاستيك ، وتسيطر على الميكروبلاستيك تحت السطح الذي تم تصنيعه في هذه الدراسة (الشكل 3ب). لكن الميكروبلاستيك تحت السطح الأكثر كثافة من مياه البحر أكثر وفرة في المياه البعيدة عن الشاطئ مقارنة بالمياه القريبة من الشاطئ ( ; الشكل 3ب)، ربما بسبب قابليتها الأعلى للتجزئة . عادةً ما تحتوي البوليمرات الكثيفة على درجات حرارة انتقال زجاجية أعلى ( ) من البلاستيك العائم. هو معلمة حاسمة تحتها يصبح البلاستيك صلبًا وهشًا، وفوقها يتحول إلى مطاطي أو لزج. تزيد هذه الخاصية من احتمال تآكل السطح في البوليمرات الكثيفة، مما يؤدي إلى تجزئتها إلى جزيئات أصغر . وُجد أن الميكروبلاستيك الكثيف يميل نحو أحجام أصغر مقارنةً بالعائمة في دوامة شمال المحيط الهادئ الاستوائية . بالنظر إلى ذلك، يمكن أن تسرع بعض العمليات من تجزئة البلاستيك الكثيف. الحاويات البلاستيكية الكثيفة المستندة إلى اليابسة (مثل زجاجات PET)، التي يمكن أن تستغرق سنوات للوصول إلى الدوامات البحرية ، تخضع لتآكل وتحلل مطول، مما يزيد من تجزئتها. وجدت دراسة في دوامة شمال المحيط الهادئ الاستوائية أن ما يقرب من نصف البلاستيكات ذات تواريخ الإنتاج المحددة تعود إلى القرن العشرين، مما يظهر استمرارًا لعقود وإمكانية إطلاق الميكروبلاستيك. تم ملاحظة زيادة كبيرة في البلاستيكات الكثيفة مثل النايلون والبوليستر، وغالبًا ما ترتبط بنشاط الصيد ، في المياه البعيدة عن الشاطئ و ; الشكل 3ج). قد تساهم تدفقات الميكروبلاستيك من الغلاف الجوي إلى المحيط، المقدرة ما بين 0.013 مليون طن متري إلى 25 مليون طن متري سنويًا ، مع كون البوليستر يشكل جزءًا كبيرًا من الميكروبلاستيك المحمول جواً .
وجد آخر ملحوظ هو الانخفاض الواضح في أجزاء البولي بروبيلين العائم المغمور في عمود الماء مقارنةً بالزيادة الواضحة في البولي إيثيلين في المياه البعيدة عن الشاطئ ( و ; الشكل 3ج)، مما يشير إلى إزالة أسرع للبولي بروبيلين. قد تساهم الاستقرار تحت الأشعة فوق البنفسجية في تجزئة البولي إيثيلين بشكل أقل وبقائه لفترة أطول في البحر، بينما يجعل الكربون الثالث في هيكل البولي بروبيلين أكثر عرضة للتحلل غير البيولوجي . وثقت تجارب التحلل الضوئي أن البولي بروبيلين يتجزأ وينتج الكربون العضوي المذاب بشكل أسرع من البولي إيثيلين في مياه البحر . تسلط هذه النتائج الضوء على الإمكانيات المتفاوتة للتحلل البيئي لمختلف البلاستيكات البحرية.

مصادر عدم اليقين واستراتيجيات التحسين

تنشأ عدم اليقين في تقدير الميكروبلاستيك تحت السطح في عمود مياه المحيط من عدة عوامل. أولاً، البيانات الملاحظة حول الميكروبلاستيك تحت السطح متواضعة وغير موزعة بشكل متساوٍ بسبب تحديات أخذ العينات والتحليل الذي يستغرق وقتًا طويلاً. مقارنةً بالبلاستيكات العائمة ، تظل البيانات حول البلاستيكات تحت السطح محدودة (الشكل 1أ). تؤكد التغيرات في تركيزات الميكروبلاستيك مع العمق على أهمية الحصول على عينات ذات دقة أعلى في العمق. ومع ذلك، يتطلب جمع الميكروبلاستيك على أعماق مختلفة أدوات متخصصة ليست دائمًا متاحة لمجتمع البحث (الجدول التكميلي 1). بالإضافة إلى ذلك، يتطلب الوقت على السفينة أخذ عينات كافية مع العمق، مما يخلق توازنًا بين تعظيم العمق مقابل دقة العينة الأفقية. تساهم هذه العوامل مجتمعة في ندرة البيانات الملاحظة، مما يسبب عدم اليقين في تقدير الأنماط العالمية. ثانيًا، تنشأ عدم اليقين من عدم اتساق منهجيات التحليل، كما هو موضح في
الشكل 3 | مقارنة بين مواصفات دراسات النمذجة وتركيبات البوليمر كدوال لمواقع أخذ العينات. أ، المعلمات المتاحة للنموذج لمحاكاة النقل والتوزيع والمصير للميكروبلاستيك في المحيط ثلاثي الأبعاد من المراجع 34-36، 45، 46، 61، 87، 95، 101. تم استخدام نماذج مختلفة، بما في ذلك نماذج المحيط لاغرانجيان وأويلر، ونماذج النظام الأرضي المترابطة، في الأبحاث بأهداف مختلفة. تتضمن هذه النماذج معلمات مختلفة تؤثر على نقل الميكروبلاستيك، مثل خصائص البلاستيك (على سبيل المثال، الحجم، الشكل والكثافة)، والعمليات الفيزيائية المحيطية (على سبيل المثال، الخلط، النقل والانتشار)، والعوامل البيولوجية (على سبيل المثال، التلوث البيولوجي، التجميع وكريات البراز)، بالإضافة إلى سيناريوهات إدخال البلاستيك والمقاييس المكانية. ب، نسب الميكروبلاستيك العائم والكثيف في المياه القريبة من الشاطئ والبعيدة عنها. تم تجميع البيانات
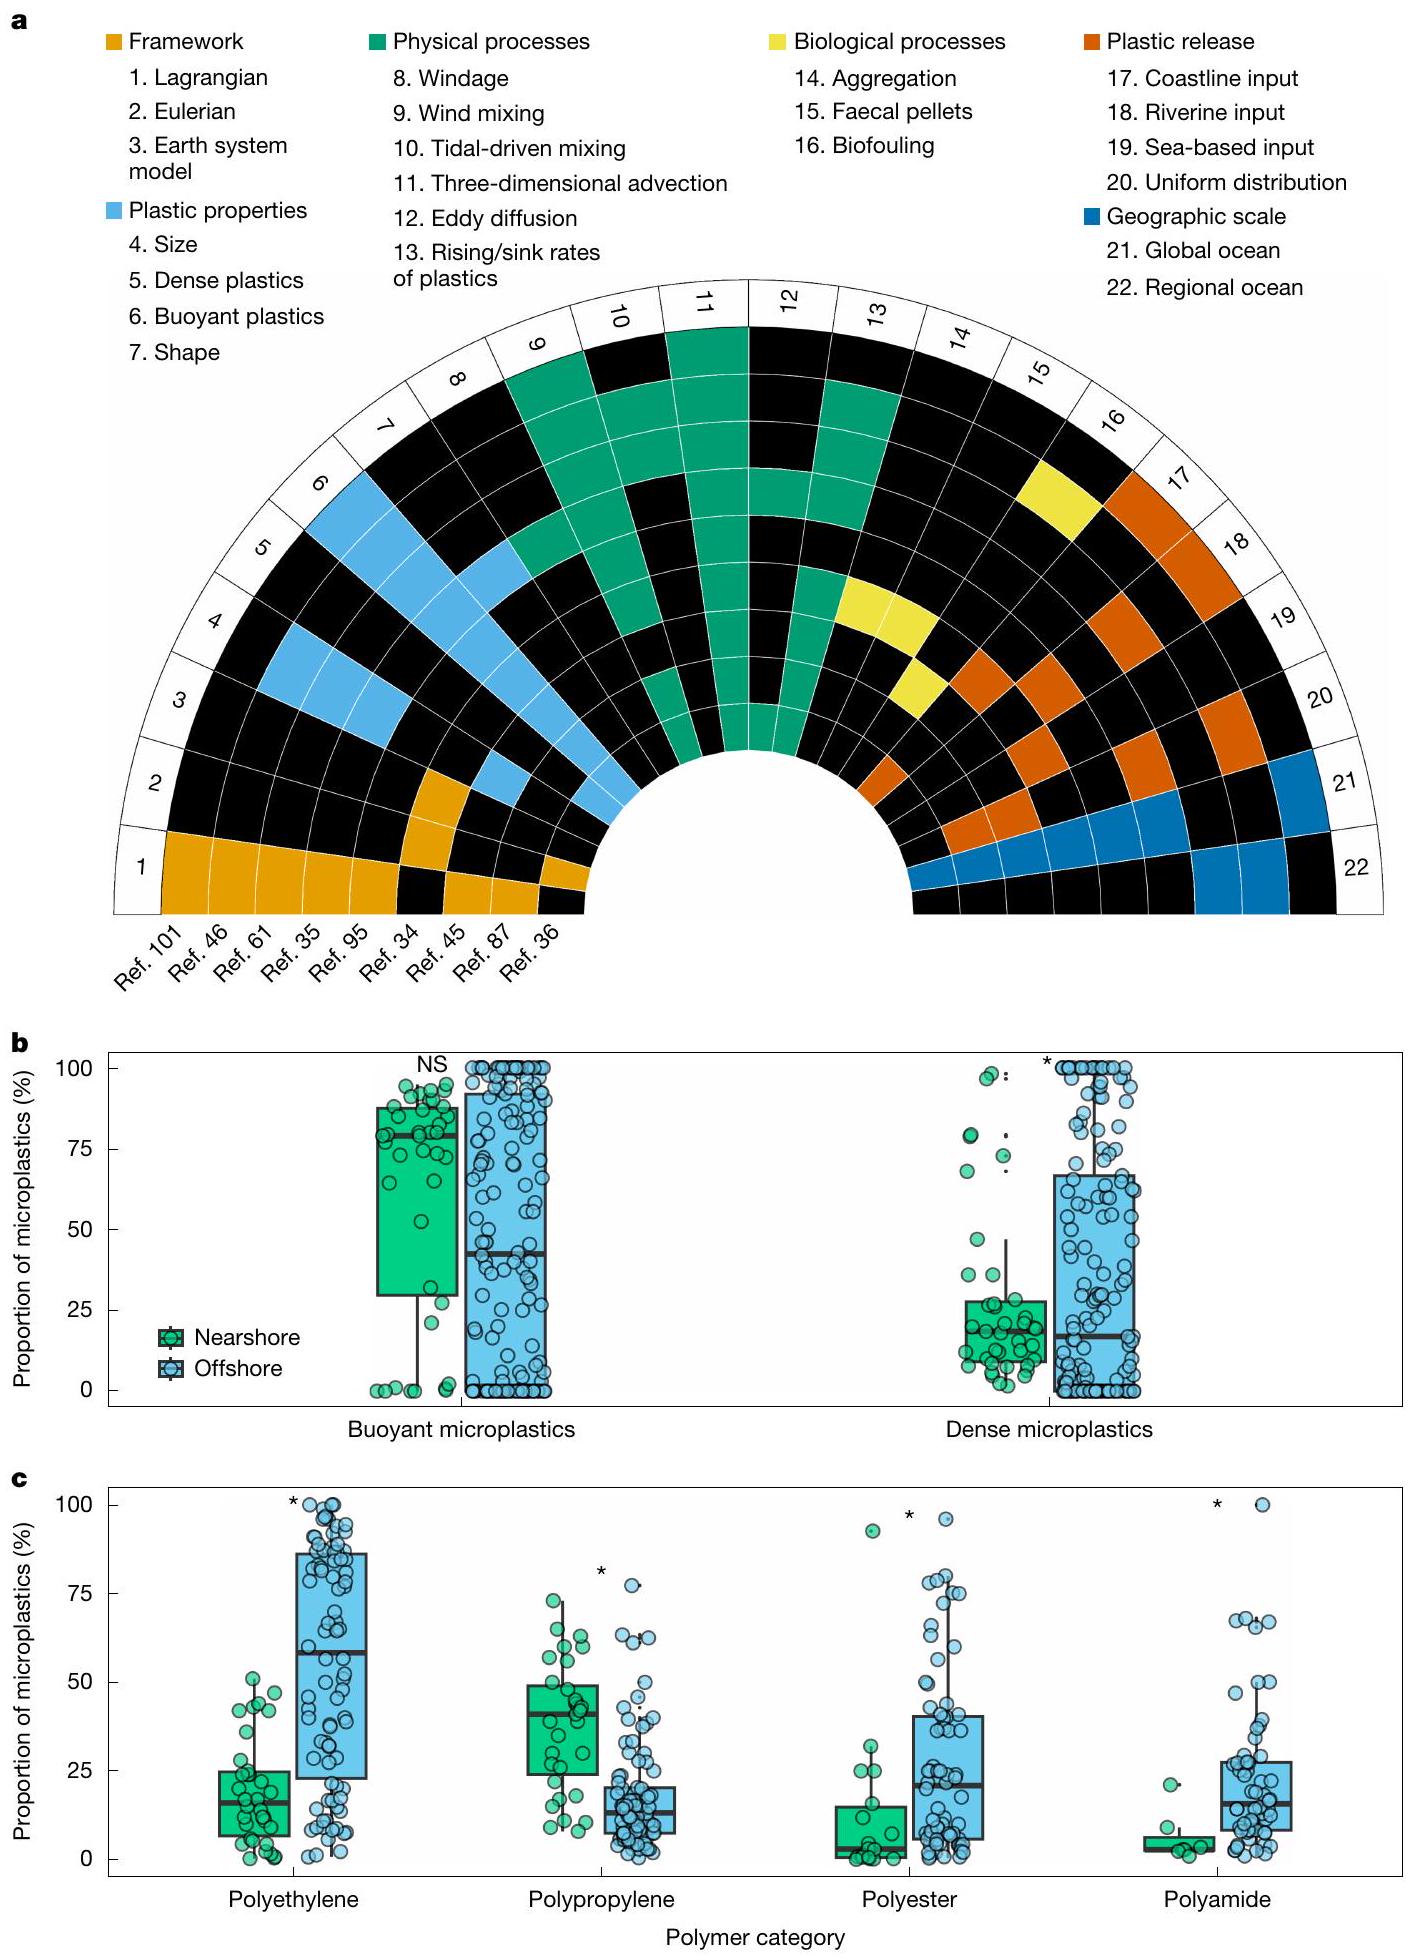
من 18 ورقة مراجعة من الأقران حول الميكروبلاستيك في عمود الماء التي قدمت تركيبات البوليمر . تُعرف البوليمرات ذات الكثافات الأقل من مياه البحر الطبيعية بأنها بوليمرات عائمة بينما البوليمرات الكثيفة لها كثافة أكبر من مياه البحر الطبيعية. ج، نسب الميكروبلاستيك من البولي إيثيلين، والبولي بروبيلين، والبوليستر، والبولي أميد في عمود الماء في المياه القريبة من الشاطئ والبعيدة عنها. تمثل الخطوط الأفقية السوداء العريضة داخل الصناديق الملونة وسطاء الصندوق، بينما تشير أعلى وأسفل الصناديق إلى النسب المئوية 25 و75. تشير الشعيرات إلى أكبر وأصغر القيم المقاسة ضمن 1.5 نطاق بين النسب من الصندوق. تشير النجمة إلى الفروق ذات الدلالة الإحصائية بين فئات البوليمر المختلفة ( ).
الجدول التكميلي 1، والجدولان التكميليان 2 و3. يمكن أن تؤدي الاختلافات في جمع العينات، والتنقية، وحدود حجم الجسيمات، وطرق تحديد البوليمر والتقديرات المقابلة إلى نتائج متباينة. علاوة على ذلك، فإن فقدان الجسيمات أو التلوث أثناء معالجة العينات والنقل يضعف أيضًا قوة النتائج. أخيرًا، تؤثر معالجة البيانات والتقارير على دقة وقابلية مقارنة تقديرات الميكروبلاستيك. تؤثر الاختلافات في طرق جمع الطيف والمكتبات بشكل كبير على دقة تحديد الميكروبلاستيك . التحدي الرئيسي في تقارير البيانات هو توفر مجموعات البيانات الأصلية المحدودة التي تفصل وفرة الميكروبلاستيك، والحجم ونوع البوليمر، مما يعيق توحيد البيانات للمقارنة ذات المعنى.
تعزيز جهود أخذ العينات وتوحيد المنهجيات هي خطوات حاسمة للتخفيف من عدم اليقين الحالي. التعاون بين التخصصات ومشاركة الموارد أمران أساسيان، نظرًا لتحديات أخذ العينات. يمكن أن تحسن الرحلات البحثية المشتركة، والتعاون بين المؤسسات المتعددة، وحملات أخذ العينات المستهدفة المنسقة، من التغطية المكانية ودقة العمق. أدت البرامج الأخيرة حول تلوث البلاستيك في الشعاب المرجانية والأنظمة البيئية للمياه العذبة إلى مجموعات بيانات متسقة من خلال جمع عينات عالمية وطرق موحدة . يمكن أن يستفيد التعاون بين العلماء الذين يركزون على أبحاث الجسيمات البحرية لتوحيد استراتيجيات أخذ العينات عبر مناطق متعددة بشكل كبير دراسات الميكروبلاستيك في عمود الماء. تقدم بروتوكولات البحث المعتمدة على الجسيمات البحرية ، مثل بروتوكولات التنظيف من المعادن النادرة، إجراءات فعالة لجمع العينات والحفاظ عليها. يمكن أن يعزز مشاركة كل من العينات الجديدة والأرشيفية من دقة العينات لتحليل الميكروبلاستيك. بالإضافة إلى ذلك، فإن تطوير تقنيات تعتمد على الكاميرات/أجهزة الاستشعار الضوئية على المنصات المستقلة سيمكن من المراقبة المستمرة عالية الدقة. لتحليل الميكروبلاستيك الموحد، نوصي باستخدام التصوير الكيميائي (على سبيل المثال، -تصوير FTIR) يتبعه تحليل بيانات شبه آلي مع مكتبات طيف مرجعية مفتوحة المصدر لتحديد الجسيمات الأصغر من في كل عينة دون أخذ عينات فرعية. يقلل هذا من التحيز البشري ويسمح بالتحديد الكفء والتقدير للميكروبلاستيك حتى . بالنسبة للميكروبلاستيك الكبير، -يمكن استخدام تقنية رامان/FTIR مع الفحص المجهري البصري لتحليل الجسيمات الفردية، دون الحاجة إلى إعداد عينة محدد أو مهارات متقدمة. بالإضافة إلى تحسين التغطية الملاحظة، من الضروري تحسين النماذج الحالية ودمج معلمات جديدة لتعزيز الثقة في التوقعات العالمية لتوزيعات الميكروبلاستيك عبر الأعماق.

الخاتمة

الميكروبلاستيك في المحيطات غالبًا ما يكون غير قابل للاسترداد ودائمًا توليدنا لملاحظات الميكروبلاستيك تحت السطح على مدى فترة 10 سنوات يخلق معيارًا عالميًا (الجدول 1). على الرغم من عدم اليقين في الملاحظات، فإن الوجود الكبير للميكروبلاستيك تحت السطح في كل من المياه القريبة من الشاطئ والبعيدة يؤكد أن عمود المياه في المحيط هو خزان حرج ولكنه غير موصوف للبلاستيك. تظهر الميكروبلاستيك الصغيرة انخفاضًا تدريجيًا في الوفرة مع العمق، مما يشير إلى توزيع أكثر تجانسًا وعمر أطول في عمود المياه، بينما يتم احتجاز الميكروبلاستيك الكبيرة بشكل أكثر فعالية بواسطة التدرج الطبقي. مناطق تراكم السطح في المياه البعيدة تمتد إلى المياه تحت السطحية لكنها تتكون أساسًا من جزيئات البلاستيك الدقيقة الكبيرة. تتماشى أنماط النقل المعتمدة على الحجم هذه مع النماذج الحالية. تشكل الوجود المستمر وتراكم الجسيمات البلاستيكية الصغيرة مخاطر على النظام البيئي البحري، حيث لا تزال هناك فجوات كبيرة في المعرفة. ، وقد تؤثر على الدورات البيوجيوكيميائية والقياسات النظيرية. يبرز هذا التحليل الحاجة الملحة إلى منهجيات متسقة، وتحقيقات على نطاق أدق، وتنسيق دولي أوسع لإقامة مراقبة شاملة وطويلة الأمد وتوقعات نموذجية أكثر دقة. ستساهم هذه الجهود في تحسين فهم انتشار الميكروبلاستيك ومصيره وتأثيراته، مما يساعد في صياغة سياسات واستراتيجيات إدارة فعالة.

المحتوى عبر الإنترنت

أي طرق، مراجع إضافية، ملخصات تقارير Nature Portfolio، بيانات المصدر، بيانات موسعة، معلومات إضافية، شكر وتقدير، معلومات مراجعة الأقران؛ تفاصيل مساهمات المؤلفين والمصالح المتنافسة؛ وبيانات توفر البيانات والرموز متاحة فيhttps://doi.org/10.1038/s41586-025-08818-1.
  1. تومسون، ر. س. وآخرون. عشرون عامًا من أبحاث تلوث الميكروبلاستيك – ماذا تعلمنا؟ العلوم 386، eadl2746 (2024).
  2. إريكسن، م. وآخرون. ضباب بلاستيكي متزايد، يُقدّر الآن بأكثر من 170 تريليون جزيء بلاستيكي عائم في محيطات العالم – حلول عاجلة مطلوبة. PLoS ONE 18، e0281596 (2023).
  3. تشاو، س. وآخرون. كميات كبيرة من الميكروبلاستيك الصغيرة تتخلل المحيط السطحي إلى أعماق الهاوية في دوامة المحيط الأطلسي الجنوبي. تغيرات عالمية في البيولوجيا 28، 2991-3006 (2022).
  4. تيكمان، م. ب. وآخرون. ربط الأطراف المفقودة لتلوث الميكروبلاستيك في القطب الشمالي: التوزيع من سطح البحر عبر عمود الماء إلى رواسب أعماق البحر في مرصد هاوسغارتن. علوم البيئة والتكنولوجيا 54، 4079-4090 (2020).
  5. إيزوبي، أ. وآخرون. مجموعة بيانات متعددة المستويات عن وفرة الميكروبلاستيك في المحيط العلوي للعالم وبحيرات لورينتيان العظمى. ميكروبلاست. نانوبلاست. 1، 16 (2021).
  6. إيجر، م.، سولو-غامباري، ف. وليبرتون، ل. أول دليل على تساقط البلاستيك من بقعة القمامة في شمال المحيط الهادئ. تقارير العلوم 10، 7495 (2020).
  7. فيلاروبيا-غوميز، ب.، كورنيل، س. إ. وفابريس، ج. تلوث البلاستيك البحري كتهديد لحدود الكوكب – القطعة العائمة في لغز الاستدامة. سياسة بحرية 96، 213-220 (2018).
  8. ريدي، س. ولاؤ، و. كسر موجة البلاستيك: تقييم شامل للطرق نحو وقف تلوث المحيطات بالبلاستيك (مؤسسة بيو الخيرية، 2020).
  9. لو، ك. ل. البلاستيك في البيئة البحرية. مراجعة سنوية لعلوم البحار 9، 205-229 (2017).
  10. ماكلويد، م.، أarp، هـ. ب. هـ.، تيكمان، م. ب. وجاهنكي، أ. التهديد العالمي من تلوث البلاستيك. ساينس 373، 61-65 (2021).
  11. أندرايدي، أ. ل. البلاستيك في الميكروبلاستيك: مراجعة. مجلة تلوث البحر. 119، 12-22 (2017).
  12. روتشمان، سي. إم. وآخرون. إعادة التفكير في الميكروبلاستيك كأحد أنواع الملوثات المتنوعة. الكيمياء البيئية والسمية 38، 703-711 (2019).
  13. فان سيبيل، إ. وآخرون. علم المحيطات الفيزيائية لنقل الحطام البحري العائم. رسائل البحث البيئي 15، 023003 (2020).
  14. كين، إ. أ. وآخرون. بؤر الميكروبلاستيك في قاع البحر التي تتحكم بها الدورة الدموية في أعماق البحار. ساينس 368، 1140-1145 (2020).
  15. روس، ب. س. وآخرون. التوزيع الواسع لألياف البوليستر في المحيط القطبي مدفوع بإدخالات الأطلسي. نات. كوميونيك. 12، 106 (2021).
  16. بابورتسافا، ك. ولامبيتي، ر. س. تركيزات عالية من البلاستيك مخفية تحت سطح المحيط الأطلسي. نات. كوم. 11، 4073 (2020).
  17. لال، د. الميكروكوزم المحيطي للجسيمات: تلعب المادة العالقة، حوالي 1 جرام في 100 طن من مياه البحر، دورًا حيويًا في كيمياء المحيطات. العلوم 198، 997-1009 (1977).
  18. الهيئة الحكومية الدولية المعنية بتغير المناخ: ملخص لصانعي السياسات. في تغير المناخ 2021: الأساس العلمي الفيزيائي (تحرير ماسون-ديلموتي، ف. وآخرون) (مطبعة جامعة كامبريدج، 2021).
  19. بويد، ب. و.، كلستري، هـ.، ليفي، م.، سيجل، د. أ. وويبر، ت. مضخات الجسيمات متعددة الأوجه تدفع احتجاز الكربون في المحيط. ناتشر 568، 327-335 (2019).
  20. جالووي، ت. س.، كول، م. وليwis، س. تفاعلات حطام الميكروبلاستيك في جميع أنحاء النظام البيئي البحري. نات. إيكول. إيفول. 1، 0116 (2017).
  21. زييرفوجل، ك. وآخرون. التفاعلات الميكروبية مع الميكروبلاستيك: رؤى حول دورة الكربون البلاستيكي في المحيط. الكيمياء البحرية 262، 104395 (2024).
  22. غالغاني، ل. وآخرون. الترحال إلى الأعماق: كيف يتم تصدير جزيئات الميكروبلاستيك من خلال مضخة الكربون البيولوجية في المحيط الأطلسي الشمالي. علوم البيئة والتكنولوجيا 56، 15638-15649 (2022).
  23. لو، ك. ل. وروخمان، س. م. تكشف التعاونيات واسعة النطاق عن مدى تلوث البلاستيك على مستوى العالم. ناتشر 169، 254-255 (2023).
  24. Koelmans، أ. أ. وآخرون. تقييم مخاطر جزيئات الميكروبلاستيك. نات. ريف. ماتير. 7، 138-152 (2022).
  25. تشاو، س.، مينسر، ت. ج.، ليبرتون، ل. وإيجر، م. الميكروبلاستيك العائم في دوامة شمال المحيط الهادئ شبه الاستوائية: مكون إنساني شائع من حوض الكربون العضوي الجزيئي. PNAS Nexus 2، pgadO7O (2023).
  26. برمبك، س. وآخرون. تقييم نقدي للطرق التحليلية لتحليل الميكروبلاستيك بشكل موحد وبتكلفة فعالة. تطبيقات الطيفية 74، 1012-1047 (2020).
  27. بيكن، I. وآخرون. الجليد البحري في القطب الشمالي هو مصب زمني مهم ووسيلة نقل للميكروبلاستيك. نات. كوم. 9، 1505 (2018).
  28. أوبارد، ر. و. وآخرون. الاحتباس الحراري يحرر إرث الميكروبلاستيك المجمد في جليد البحر القطبي. مستقبل الأرض 2، 315-320 (2014).
  29. روشر، ل. وآخرون. تلوث الميكروبلاستيك في مصب نهر فيزر والبحر الشمالي الألماني. التلوث البيئي. 288، 117681 (2021).
  30. أبل، س. م.، برمبك، س.، إنت-فين، إ.، براندت، أ. وجيردتس، ج. التعرف المنهجي على الميكروبلاستيك في الرواسب العميقة والهادلة لخندق كوريل كامتشاتكا. تلوث البيئة 269، 116095 (2021).
  31. كورتيين-جونز، و.، فان جينيب، س.، بينيكود، ج.، بن، إ. وتومسون، ر. س. وفرة وتركيب الميكروبلاستيك الاصطناعي على طول تدرج طولي يمر عبر الدوامة شبه الاستوائية في المحيط الأطلسي الشمالي. مجلة تلوث البحر. 185، 114371 (2022).
  32. مولازاده، م. وآخرون. دور الاضطراب في ترسيب الجسيمات الدقيقة العائمة بشكل طبيعي. العلوم. البيئة الكاملة 911، 168540 (2024).
  33. سونغ، ي. ك. وآخرون. التوزيع الأفقي والرأسي للميكروبلاستيك في المياه الساحلية الكورية. علوم البيئة والتكنولوجيا 52، 12188-12197 (2018).
  34. كفالي، ك.، بروي، أ. ف.، تشين، س.-ت.، لاندولفي، أ. وأوشليز، أ. المصيدة العالمية لجزيئات الميكروبلاستيك البيولوجية. ساي ريب. 10، 16670-1 (2020).
  35. كلينك، د.، بييتافين، أ. وليبرتون، ل. النقل المعتمد على الحجم للبلاستيك العائم المودل في المحيط العالمي. Front. Mar. Sci. 9، 903134 (2022).
  36. ماونتفورد، أ. وموراليس ماكيدا، م. النمذجة الأويلرية للتوزيع ثلاثي الأبعاد لسبعة أنواع شائعة من الميكروبلاستيك في المحيط العالمي. مجلة أبحاث الجيوفيزياء. المحيطات 124، 8558-8573 (2019).
  37. فان سيبيل، إ. وآخرون. جرد عالمي للقطع البلاستيكية الصغيرة العائمة. رسائل البحث البيئي 10، 124006 (2015).
  38. أمينبار، م. وآخرون. التوزيع المكاني للميكروبلاستيك في منطقة الارتفاع الساحلي: الانتشار في عرض البحر من المصادر الحضرية في نظام تيار هومبولت. تلوث البيئة. 343، 123157 (2024).
  39. كايل، ب.، كافان، إ. ل. وبريتن، ج. ل. التوفيق بين اعتماد سرعة غرق الجسيمات البحرية على الحجم. رسائل أبحاث الجيوفيزياء 48، e2020GL091771 (2021).
  40. أرمبروست، إ. ف. حياة الدياتومات في محيطات العالم. الطبيعة 459، 185-192 (2009).
  41. أمارال-زيتلر، ل. أ.، زيتلر، إ. ر. & مينسر، ت. ج. علم البيئة للبلستسفير. نات. ريف. ميكروبيول. 18، 139-151 (2020).
  42. أمارال-زيتلر، ل. أ.، زيتلر، إ. ر.، مينسر، ت. ج.، كلاسن، م. أ. وغاليجر، س. م. تأثيرات التلوث البيولوجي على كثافة البولي إيثيلين وغرقه في المياه الساحلية: نقطة تحول ماكرو/ميكرو؟ مياه البحث. 201، 117289 (2021).
  43. سون، إكس.-إف.، تشانغ، واي.، شيا، إم.-واي.، ماي، إل. وزينغ، إي. واي. كربونات الكالسيت تغمر الحطام البلاستيكي منخفض الكثافة في المحيطات المفتوحة. نات. كوميونيك. 15، 4837 (2024).
  44. إيجر، م. وآخرون. ندرة متغيرة مكانيًا من الميكروبلاستيك العائم في شمال المحيط الهادئ الشرقي. رسائل البحث البيئي 15، 114056 (2020).
  45. لوبيل، د. وآخرون. الخصائص العالمية لنزول البلاستيك الدقيق المتأثر بالتلوث البيولوجي. مجلة أبحاث الجيوفيزياء: المحيطات 126، e2020JC017098 (2021).
  46. فيشر، ر. وآخرون. نمذجة الميكروبلاستيك المتسخ تحت الماء ومساراته الرأسية. علوم الأحياء الجيولوجية 19، 2211-2234 (2022).
  47. راينكيوس، ج. ووانيك، ج. ج. أول دليل طويل الأمد على تلوث الميكروبلاستيك في شمال المحيط الأطلسي الاستوائي العميق. تلوث البيئة 305، 119302 (2022).
  48. راينكيوس، ج. وآخرون. وفرة وخصائص الألياف الدقيقة المكتشفة في مواد فخ الرواسب من المحيط الأطلسي الشمالي العميق شبه الاستوائي. العلوم. البيئة الكاملة 738، 140354 (2020).
  49. ألورالد، ج. وآخرون. تدفق الألياف الدقيقة الناتجة عن الأنشطة البشرية في نظام بيئي ساحلي في القارة القطبية الجنوبية: هل هي قمة جبل الجليد؟ مجلة تلوث البحر. 175، 113388 (2022).
  50. روولاندز، إ. وآخرون. التدفق العمودي للميكروبلاستيك، دراسة حالة في المحيط الجنوبي، جورجيا الجنوبية. مجلة تلوث البحر. 193، 115117 (2023).
  51. ماتيوس-كارديناس، أ.، ويلر، أ. ج. & ليم، أ. الميكروبلاستيك والميكروكريات السليلوزية في أعماق شمال الأطلسي وفي الشعاب المرجانية الباردة لوفيليا بيرتوسا. مجلة تلوث البحر. 206، 116741 (2024).
  52. تشانغ، إكس، ليو، زد، لي، دي، تشاو، واي وزانغ، واي. التيارات العكرة تنظم نقل واستقرار الميكروبلاستيك في وادٍ تحت البحر في أعماق المحيط. الجيولوجيا 52، 646-650 (2024).
  53. إيكنوي، ت.، ناكاجيما، ر.، أوسافوني، س.، سيسوانتو، إ. وهوندا، م. ج. تدفق عمودي للميكروبلاستيك في المحيط الهادئ العميق شبه الاستوائي: ملاحظات فخ الرواسب المثبتة ضمن دوامة إعادة تدوير كوروشي. علوم البيئة والتكنولوجيا. 58، 16121-16130 (2024).
  54. لام، ب. ج.، دوني، س. ج. & بيشوب، ج. ك. المضخة البيولوجية الديناميكية للمحيط: رؤى من تجميع عالمي للكربون العضوي الجسيمي، ، وملفات تركيز الأوبال من الطبقة المتوسطة. الدورات البيوجيوكيميائية العالمية 25، GB3009 (2011).
  55. إندرس، ك.، لنتز، ر.، ستيدمون، ك. أ. ونيلسن، ت. ج. وفرة وحجم وتركيب البوليمر للميكروبلاستيك البحري في المحيط الأطلسي وتوزيعها العمودي المودل. مجلة تلوث البحر. 100، 70-81 (2015).
  56. غونالان، ك. وآخرون. هل يؤثر تدرج عمود الماء على التوزيع العمودي للميكروبلاستيك؟ التلوث البيئي. 340، 122865 (2024).
  57. كوي، م.، نيس، إ. هـ. ف.، شيفر، م. وكويلمانس، أ. أ. التقلبات في المحيط: آثار التلوث البيولوجي على النقل العمودي للميكروبلاستيك. علوم البيئة والتكنولوجيا 51، 7963-7971 (2017).
  58. ديتمار، س.، روله، أ. س.، ألتمن، ك. وجيكل، م. سرعات الاستقرار لقطع الألياف والميكروبلاستيك الصغيرة. علوم البيئة والتكنولوجيا 58، 6359-6369 (2024).
  59. كايسر، د.، إستلمان، أ.، كوالسكي، ن.، غلوكزين، م. ووانيك، ج. ج. سرعة غرق الميكروبلاستيك دون المليمتر. مجلة تلوث البحر 139، 214-220 (2019).
  60. إيجر، م. وآخرون. التوزيع العائم للمواد البلاستيكية ) والأنظمة البحرية في الطبقة العليا من المحيط الأطلسي الشمالي. Sci. Rep. 12، 13465 (2022).
  61. أونيك، ف.، كاندورب، م. ل.، فان سيبيل، إ. ولوافكوتير، س. تأثير حجم الجسيمات والتفتت على نقل الميكروبلاستيك على نطاق واسع في البحر الأبيض المتوسط. علوم البيئة والتكنولوجيا 56، 15528-15540 (2022).
  62. هيدالغو-روز، ف.، غوتو، ل.، طومسون، ر. س. و ثيل، م. الميكروبلاستيك في البيئة البحرية: مراجعة للطرق المستخدمة للتعرف عليها وقياس كميتها. علوم البيئة والتكنولوجيا 46، 3060-3075 (2012).
  63. رايت، ر. ج.، إيرني-كاسولا، ج.، زادجيلوفيتش، ف.، لاتفا، م. وكريستي-أوليزا، ج. أ. الحطام البلاستيكي البحري: سطح جديد لاستعمار الميكروبات. علوم البيئة والتكنولوجيا 54، 11657-11672 (2020).
  64. تشاو، س.، زتلر، إ. ر.، أمارال-زتلر، ل. أ. و مينسر، ت. ج. السعة الاستيعابية الميكروبية وكتلة الكربون الحيوية للفضلات البلاستيكية البحرية. مجلة ISME 15، 67-77 (2021).
  65. دوست محمدي، أ.، ستوكير، ر. وأردكاني، أ. م. السباحة عند أعداد رينولدز المنخفضة في خطوط الكثافة. وقائع الأكاديمية الوطنية للعلوم في الولايات المتحدة الأمريكية 109، 3856-3861 (2012).
  66. ماكنتاير، س.، ألدرج، أ. ل. & غوتشالك، س. س. تراكم الكائنات البحرية الآن عند انقطاع الكثافة في عمود الماء. ليمنول. أوشنوجراف. 40، 449-468 (1995).
  67. أوراسجارفي، إ.، باككونن، م.، سيتالا، أ.، كويستينن، أ. وليهتينيمي، م. تتجمع الجسيمات البلاستيكية الدقيقة في طبقات رقيقة في بحر البلطيق المتمايز. تلوث البيئة 268، 115700 (2021).
  68. زوبكوف، م.، إسيوكوفا، إ.، زيوبين، أ. وساموسيف، إ. تباين محتوى الميكروبلاستيك في عمود الماء: الملاحظات باستخدام أداة أخذ عينات جديدة في بحر البلطيق المتمايز. مجلة تلوث البحر 138، 193-205 (2019).
  69. مانولانغ، سي. وا. وآخرون. التوزيع العمودي للميكروبلاستيك على طول البوابة الرئيسية لمسارات التدفق الإندونيسي. مجلة تلوث البحر. 199، 115954 (2024).
  70. تشو، ق. وآخرون. احتجاز الميكروبلاستيك في طبقات الهالوكلاين والعتامة في بحر البلطيق شبه المغلق. Front. Mar. Sci. 8، 761566 (2021).
  71. كارلوتي، ف. وآخرون. الميكروبلاستيك في طبقة الكلوروفيل القصوى على طول مقطع عرضي شمال-جنوب في البحر الأبيض المتوسط مقارنة بتركيزات العوالق الحيوانية. مجلة تلوث البحر. 196، 115614 (2023).
  72. تشوي، سي. أ. وآخرون. التوزيع العمودي والنقل البيولوجي للميكروبلاستيك البحري عبر عمود الماء الإبيبالاجي والميزوبالاجي. تقارير العلوم 9، 7843 (2019).
  73. أردكاني، أ. وستوكر، ر. ستراتليتس: حلول القوة النقطية عند أعداد رينولدز المنخفضة في سائل متدرج. فيز. ريف. ليتر. 105، 084502 (2010).
  74. ييك، ك. ي.، توريس، س. ر.، بيكوك، ت. و ستوكير، ر. زيادة سحب كرة تستقر في سائل متدرج عند أعداد رينولدز الصغيرة. مجلة ميكانيكا السوائل 632، 49-68 (2009).
  75. مروكوسكا، م. م. تأثير الطبقة الكثيفة على سلوك استقرار الجسيمات غير الكروية وتطور الذيل. تقارير علمية 10، 20595 (2020).
  76. تشانغ، م.، شو، د.، ليو، ل.، وي، ي. وغاو، ب. التمايز العمودي للميكروبلاستيك المتأثر بالتدرج الحراري في خزان عميق. علوم البيئة والتكنولوجيا 57، 6999-7008 (2023).
  77. لي، سي.، زو، إل.، وانغ، إكس.، ليو، ك. ولي، دي. التوزيع عبر المحيطات وأصل الميكروبلاستيك في المياه تحت السطحية لبحر الصين الجنوبي والمحيط الهندي الشرقي. العلوم. البيئة الكاملة 805، 150243 (2022).
  78. زدانوف، إ. وآخرون. اختلافات في مصير الميكروبلاستيك السطحي وتحت السطحي: دراسة حالة في المحيط الأطلسي المركزي. مجلة علوم البحار والهندسة 11، 210 (2023).
  79. تشانغ، س. وآخرون. خصائص توزيع الميكروبلاستيك في مياه البحر السطحية وتحت السطحية في القارة القطبية الجنوبية. العلوم. البيئة الكاملة 838، 156051 (2022).
  80. مورغانا، س. وآخرون. الميكروبلاستيك في القطب الشمالي: دراسة حالة مع عينات من المياه تحت السطحية والأسماك قبالة شمال شرق غرينلاند. تلوث البيئة. 242، 1078-1086 (2018).
  81. باخوموفا، س. وآخرون. تباين الميكروبلاستيك في المياه تحت السطحية من القطب الشمالي إلى القطب الجنوبي. تلوث البيئة. 298، 118808 (2022).
  82. لوشر، أ. ل.، تيريللي، ف.، أوكونور، آي. وأوفيسر، ر. الميكروبلاستيك في المياه القطبية في القطب الشمالي: القيم المبلغ عنها لأول مرة للجسيمات في عينات السطح وتحت السطح. ساي. ريب. 5، 14947 (2015).
  83. كانهاي، ل. د. ك. وآخرون. الميكروبلاستيك في المياه تحت السطحية لحوض القطب الشمالي المركزي. مجلة تلوث البحر. 130، 8-18 (2018).
  84. كانهاي، ل. د. ك.، أوفيسر، ر.، ليشيفسكا، أ.، طومسون، ر. سي. وأوكونور، آي. وفرة الميكروبلاستيك، التوزيع والتركيب على طول تدرج عرضي في المحيط الأطلسي. مجلة تلوث البحر. 115، 307-314 (2017).
  85. لوشر، أ. ل.، بيرك، أ.، أوكونور، I. وأوفيسر، R. تلوث الميكروبلاستيك في شمال شرق المحيط الأطلسي: أخذ عينات موثوقة وعشوائية. مجلة تلوث البحر. 88، 325-333 (2014).
  86. ياكوشيف، إ. وآخرون. توزيع الميكروبلاستيك في القطب الشمالي الأوراسي يتأثر بالمياه الأطلسية والأنهار السيبيرية. اتصالات. الأرض والبيئة. 2، 23 (2021).
  87. Wichmann، د.، Delandmeter، ب. و van Sebille، إ. تأثير التيارات القريبة من السطح على الانتشار العالمي للميكروبلاستيك البحري. J.Geophys. Res. Oceans 124، 6086-6096 (2019).
  88. برغمان، م. وآخرون. تلوث البلاستيك في القطب الشمالي. مراجعة الطبيعة: الأرض والبيئة 3، 323-337 (2022).
  89. إريكسن، م. وآخرون. تلوث البلاستيك في محيطات العالم: أكثر من 5 تريليون قطعة بلاستيك تزن أكثر من 250,000 طن عائمة في البحر. PLoS ONE 9، e111913 (2014).
  90. كوزار، أ. وآخرون. الحطام البلاستيكي في المحيط المفتوح. وقائع الأكاديمية الوطنية للعلوم في الولايات المتحدة الأمريكية 111، 10239-10244 (2014).
  91. لو، ك. ل. وآخرون. تراكم البلاستيك في دوامة شمال الأطلسي شبه الاستوائية. ساينس 329، 1185-1188 (2010).
  92. ليبريتون، ل.-م.، غرير، س. وبوريرو، ج. س. النمذجة العددية للحطام العائم في محيطات العالم. مجلة تلوث البحر 64، 653-661 (2012).
  93. ماكسيمينكو، ن.، هافنر، ج. ونييلر، ب. مسارات الحطام البحري المستمد من مسارات العوامات لاغرانجيان. مجلة تلوث البحر 65، 51-62 (2012).
  94. فان سيبيل، إ.، إنجلاند، م. هـ. وفرويدلاند، ج. أصل وديناميات وتطور بقع النفايات البحرية من العوامات السطحية الملاحظة. رسائل البحث البيئي 7، 044040 (2012).
  95. هاك، ت. وآخرون. التشتت ثلاثي الأبعاد لجزيئات “بلاستيكية” محايدة في نموذج عالمي للمحيط. Front. Anal. Sci. 2، 868515 (2022).
  96. كارل، د. م.، كناور، ج. أ. ومارتن، ج. هـ. تدفق الجسيمات العضوية في المحيط: مفارقة تحلل الجسيمات. ناتشر 332، 438-441 (1988).
  97. فكسما، أ. وآخرون. تحلل البولي إيثيلين وامتصاصه بواسطة الخميرة البحرية رودوتورولا موكيلاجينوزا. ISME Commun. 3، 68 (2023).
  98. سيلي، م. إ.، سونغ، ب.، باسي، ر. و هيل، ر. س. تؤثر الجسيمات البلاستيكية الدقيقة على المجتمعات الميكروبية الرسوبية ودورة النيتروجين. نات. كوميونيك. 11، 2372 (2020).
  99. ليبي، و. ف. تأريخ الكربون المشع: الطريقة تزداد استخدامًا من قبل علماء الآثار، وعلماء الجيولوجيا، وعلماء الأرصاد الجوية، وعلماء المحيطات. العلوم 133، 621-629 (1961).
  100. هيتون، ت. ج. وآخرون. الكربون المشع: مؤشر رئيسي لدراسة دينامو الأرض، نظام المناخ، دورة الكربون، والشمس. العلوم 374، eabd7096 (2021).
  101. باجون، ر. وآخرون. تأثير الأمواج على التوزيع ثلاثي الأبعاد للبلاستيك في المحيط. نشرة تلوث البحر. 187، 114533 (2023).
  102. ليما، I. D.، لام، P. J. ودوني، S. C. ديناميات تدفق الكربون العضوي الجزيئي في نموذج المحيط العالمي. علوم الأحياء الجيولوجية 11، 1177-1198 (2014).
  103. باجايف، أ.، خاتمولينا، ل. وتشوبارينكو، إ. الميكرو-نفايات البشرية في عمود مياه بحر البلطيق. مجلة تلوث البحر 129، 918-923 (2018).
  104. جاير، ر.، جامبيك، ج. ر. & لو، ك. ل. إنتاج واستخدام ومصير جميع البلاستيكات التي تم تصنيعها على الإطلاق. ساي. أدف. 3، e1700782 (2017).
  105. مين، ك.، كويفي، ج. د. وماثرز، ر. ت. تصنيف اتجاهات تدهور البيئة للنفايات البلاستيكية البحرية بناءً على الخصائص الفيزيائية والبنية الجزيئية. نات. كوميونيك. 11، 727 (2020).
  106. ماكسيمينكو، ن.، هافنر، ج.، كاماتشي، م. وماكفادين، أ. محاكاة عددية لانجراف الحطام الناتج عن تسونامي اليابان الكبير عام 2011 والتحقق منها مع التقارير الملاحظة. نشرة تلوث البحر. 132، 5-25 (2018).
  107. جينيب، س. ج. ف. وآخرون. في البحث عن مصادر النفايات البلاستيكية البحرية التي تلوث منطقة إيكو ريجون في جزيرة الفصح. ساي. ريب. 9، 19662 (2019).
  108. ليبريتون، ل. وآخرون. تساهم الدول الصناعية في صيد الأسماك بشكل كبير في تلوث البلاستيك العائم في دوامة شمال المحيط الهادئ الاستوائية. تقارير العلوم 12، 12666 (2022).
  109. ألين، د. وآخرون. الميكروبلاستيك والنانو بلاستيك في بيئة المحيط-الجو. مراجعة الطبيعة: الأرض والبيئة 3، 393-405 (2022).
  110. أورتيغا، د. إ. وكورتيس-أريا غادا، د. الميكروبلاستيك والنانو بلاستيك في الغلاف الجوي كناقلات للملوثات الهوائية الأولية – دراسة نظرية حول حالة بولي إيثيلين تيريفثاليت (PET). تلوث البيئة. 318، 120860 (2023).
  111. جيويرت، ب.، بلاسيمان، م. م. وماكلود، م. مسارات تحلل البوليمرات البلاستيكية العائمة في البيئة البحرية. علوم البيئة. العمليات. التأثيرات 17، 1513-1521 (2015).
  112. زو، ل.، تشاو، س.، بيطار، ت. ب.، ستوبينز، أ. ولي، د. الذوبان الضوئي للبلاستيكات الدقيقة العائمة إلى الكربون العضوي المذاب: المعدلات والتأثيرات الميكروبية. ج. مواد خطرة. 383، 121065 (2020).
  113. دلري، أ. وآخرون. التحلل الضوئي للبلاستيك تحت ظروف بحرية محاكاة. نشرة تلوث البحر. 187، 114544 (2023).
  114. دي فروند، هـ. وآخرون. ما الذي يحدد دقة التعرف على المواد الكيميائية عند استخدام الميكروسبيكتروسكوبي لتحليل الميكروبلاستيك؟ كيموسفير 313، 137300 (2023).
  115. بينهيرو، هـ. ت. وآخرون. تلوث البلاستيك في شعاب العالم المرجانية. ناتشر 619، 311-316 (2023).
  116. نفا، ف. وآخرون. الحطام البلاستيكي في البحيرات والخزانات. الطبيعة 619، 317-322 (2023).
  117. هارد، د. س. وسبنسر، د. و. (محرران) الجسيمات البحرية: التحليل والتوصيف سلسلة المونوغراف الجيولوجية المجلد 63 (AGU، 1991).
  118. برمبك، س.، لورينز، س.، راشر-فريزنهاوزن، ر. & جيردتس، ج. نهج آلي لتحليل الميكروبلاستيك باستخدام مجهر FTIR مع مصفوفة الطائرة البؤرية (FPA) وتحليل الصور. طرق التحليل 9، 1499-1511 (2017).
  119. كوغر، و. وآخرون. تصنيف الطيف للميكروبلاستيك يحتاج إلى مجتمع مفتوح المصدر: أوبن سبيسي لإنقاذ الموقف! تحليل. كيمياء. 93، 7543-7548 (2021).
  120. برمبك، س. وآخرون. نحو التعرف المنهجي على الميكروبلاستيك في البيئة: تقييم أداة برمجية جديدة مستقلة (siMPle) للتحليل الطيفي. تطبيقات الطيفية 74، 1127-1138 (2020).
  121. Materić، د.، هولزينجر، ر. ونيمان، هـ. النانو بلاستيك والميكروبلاستيك الفائق الدقة في بحر وادن الهولندي – الحطام البلاستيكي المخفي؟ Sci. Total Environ. 846، 157371 (2022).
  122. كوكولكا، ت.، بروسكوروسكي، ج.، موريه-فيرغسون، س.، ماير، د. و. & لو، ك. ل. تأثير خلط الرياح على التوزيع العمودي للحطام البلاستيكي العائم. رسائل أبحاث الجيوفيزياء 39، L07601 (2012).
  123. كول، م. وآخرون. تؤثر الجسيمات البلاستيكية الدقيقة على خصائص ومعدلات غرق كريات براز العوالق. علوم البيئة والتكنولوجيا 50، 3239-3246 (2016).
  124. بودان، ك. تقدير وفرة الميكروبلاستيك السطحي البحري العالمي: مراجعة منهجية للأدبيات. Sci. Total Environ. 832، 155064 (2022).
  125. ليبريتون، ل. حالة ومصير بقع النفايات المحيطية. مراجعة طبيعة الأرض والبيئة 3، 730-732 (2022).
  126. وانغ، إكس.، زو، إل.، ليو، ك. ولي، دي. انتشار ألياف الميكروبلاستيك في عمود المياه البحرية الهامشية قبالة جنوب شرق الصين. العلوم. البيئة الكاملة 804، 150138 (2022).
  127. دينغ، ج. وآخرون. الميكروبلاستيك في أنظمة الشعاب المرجانية من جزر شيشا في بحر الصين الجنوبي. علوم البيئة والتكنولوجيا 53، 8036-8046 (2019).
  128. داي، ز. وآخرون. حدوث الميكروبلاستيك في عمود الماء والرواسب في بحر داخلي تأثر بالأنشطة البشرية المكثفة. تلوث البيئة. 242، 1557-1565 (2018).
  129. كوردوفا، م. & هيرناوان، أ. الميكروبلاستيك في مياه سومبا، شرق نوسا تنغارا. في سلسلة مؤتمرات IOP: علوم الأرض والبيئة المجلد 162، 012023 (IOP، 2018).
  130. أوزتيكين، أ. وبات، ل. تلوث الميكرو بلاستيك في مياه البحر: دراسة أولية من ساحل ساركوم في سينوب على البحر الأسود الجنوبي. المجلة التركية لعلوم الأسماك والموارد المائية 17، 1431-1440 (2017).
  131. لي، د. وآخرون. تحليل النقل العمودي للميكروبلاستيك في المحيط الهادئ الغربي والمحيط الهندي الشرقي باستخدام تقنية ترشيح جديدة في الموقع. علوم البيئة والتكنولوجيا 54، 12979-12988 (2020).
  132. رايسر، ج. وآخرون. التوزيع العمودي للبلاستيك العائم في البحر: دراسة رصدية في دوامة شمال الأطلسي. علوم الأحياء الجيولوجية 12، 1249-1256 (2015).
  133. ويزينجر، هـ.، وانغ، ز. وهيلويغ، س. غوص عميق في المونومرات البلاستيكية، والإضافات، ومواد المعالجة. علوم البيئة والتكنولوجيا 55، 9339-9351 (2021).
ملاحظة الناشر: تظل شركة سبرينغر ناتشر محايدة فيما يتعلق بالمطالبات القضائية في الخرائط المنشورة والانتماءات المؤسسية.
الوصول المفتوح. هذه المقالة مرخصة بموجب رخصة المشاع الإبداعي للاستخدام غير التجاري بدون اشتقاقات 4.0، والتي تسمح بأي استخدام غير تجاري، ومشاركة، وتوزيع، وإعادة إنتاج في أي وسيلة أو صيغة، طالما أنك تعطي الائتمان المناسب للمؤلفين الأصليين والمصدر، وتوفر رابطًا لرخصة المشاع الإبداعي، وتوضح إذا قمت بتعديل المادة المرخصة. ليس لديك إذن بموجب هذه الرخصة لمشاركة المواد المعدلة المشتقة من هذه المقالة أو أجزاء منها. الصور أو المواد الأخرى من طرف ثالث في هذه المقالة مشمولة في رخصة المشاع الإبداعي للمقالة، ما لم يُشار إلى خلاف ذلك في سطر الائتمان للمادة. إذا لم تكن المادة مشمولة في رخصة المشاع الإبداعي للمقالة وكان استخدامك المقصود غير مسموح به بموجب اللوائح القانونية أو يتجاوز الاستخدام المسموح به، ستحتاج إلى الحصول على إذن مباشرة من صاحب حقوق الطبع والنشر. لعرض نسخة من هذه الرخصة، قم بزيارة http:// creativecommons.org/licenses/by-nc-nd/4.0/.
(ج) المؤلفون 2025

طرق

التصنيف

الميكروبلاستيك الصغيرة والكبيرة. تصنف تحليلاتنا الميكروبلاستيك إلى فئتين من حيث الحجم، صغيرة ( ) وكبيرة ( )، بناءً على تحليلات مختبرية سابقة وتحليلات ميدانية ، بالإضافة إلى نتائج النمذجة . تشير الأدلة التجريبية والنماذج الرياضية إلى أن العلاقة بين سرعة الاستقرار وحجم الجسيمات توصف بواسطة الانحدار الخطي التربيعي، على الرغم من تأثير شكل الجسيمات وكثافتها . بمجرد أن تنخفض الجسيمات البحرية الساقطة والميكروبلاستيك إلى أقل من ، تتقارب سرعات الاستقرار للبوليمرات البلاستيكية المختلفة، وعادة ما تختلف بأقل من ترتيب واحد من حيث الحجم (انظر الشكل 1 في المرجع 39، الشكل 2 في المرجع 59 والشكل 3 في المرجع 58). بالإضافة إلى ذلك، فإن الجسيمات التي تقل عن تتأثر أقل بالتدرج الكثافي الشامل، الذي يعيق عمومًا الحركة الرأسية للجسيمات . أظهرت العديد من الدراسات النمذجة حول النقل العمودي للميكروبلاستيك سلوكيات مميزة للجسيمات الأصغر من مقارنة بالجسيمات الكبيرة . أخيرًا، تؤكد الملاحظات الميدانية، باستخدام تقنيات التعرف المتقدمة مثل التصوير الكيميائي، أن الميكروبلاستيك الأصغر من يهيمن على الحطام البلاستيكي البحري عالميًا، حيث يمثل ما يصل إلى من إجمالي الجسيمات البلاستيكية .
استخدام ‘ كعمق مرجعي لمنطقة تراكم الميكروبلاستيك الكبير عند العمق. نحدد تراكم الميكروبلاستيك تحت السطح في نطاق العمق ، حيث تم جمع القياسات من مرجع واحد عند عمق واحد (موضحة كنقاط زرقاء فاتحة في الشكل 1a،b). تتوافق وفرة الميكروبلاستيك تحت السطح المرتفعة عند عمق في خطوط العرض المتوسطة مع مناطق التقارب السطحية الموثقة جيدًا عند سطح البحر داخل دوامات المناطق شبه الاستوائية . تعكس منطقة تراكم السطح هذه دراستنا، حيث تم جمع الميكروبلاستيك العائم من حجم مماثل عند عمق باستخدام شباك السطح (الشكل 1a،b). البيانات من نطاق غائبة بسبب الانقطاعات في جمع العينات على طول عمق الماء في الأدبيات. يشير هذا إلى أن مناطق تراكم البلاستيك تمتد من السطح إلى عمود الماء في المحيط. يُعزى وجود بقع من الميكروبلاستيك الكبير في المياه القريبة من السطح بشكل رئيسي إلى مزيج من تيارات إكمان المدفوعة بالرياح والإقامة المطولة في الطبقات العليا من الماء التي تمكنها الطفو القوي للبلاستيك الكبير الحجم .
للتحقيق فيما إذا كانت مجموعات البيانات من الدراسات التي تجمع الميكروبلاستيك تحت السطح من أعماق متعددة لكل محطة (نقاط زرقاء داكنة في الشكل 1a) يمكن أن تدعم اكتشافنا، نقارن وفرة الميكروبلاستيك عبر فئتين: (1) الميكروبلاستيك الكبير مقابل الصغير؛ و (2) الوفرة فوق أو تحت عمق الماء 100 م. اخترنا 100 م كحد أدنى للأسباب التالية: (1) الطبقة العليا هي حيث يحدث معظم الخلط المدفوع بالرياح ; و (2) الحد الأدنى لمنطقة الإضاءة الشمسية هو عند 100 م، وهو عمق يُستخدم عادة كمرجع لتقييم تدفق الكربون العضوي عبر مضخة الكربون البيولوجية في المحيط. تحت 100 م، يختلف استهلاك الجسيمات المرتبطة بالمواد العضوية بشكل كبير بين المقاطعات المحيطية . نظرًا لأن العمليات البيولوجية هي واحدة من الآليات الرئيسية للنقل العمودي للميكروبلاستيك، فإن استخدام 100 م كحد يسمح لنا بتقييد التغيرات في العوامل البيولوجية عند مقارنة وفرة الميكروبلاستيك.
مصطلح البحث. نعترف بإمكانية وجود سهو غير مقصود. لضمان الشمولية في استرجاع المقالات العلمية التي تحتوي على بيانات الميكروبلاستيك تحت السطح الكمية في عمود الماء المحيطي، تم بناء نمط البحث التالي لموقع ويب العلوم (www.webofscience.com):
TS=(microplastic$ أو microlitter أو “micro plastic$” أو “plastic particle$” أو “plastic fragments” أو “resin pellet$” أو “plastic particle$”) و TS = (subsurface$ أو subsurface$ أو vertical$ أو water column$) و marine أو ocean$ أو sea أو seawater أو coast$).
معايير الإدراج والاستبعاد للدراسات الأدبية حول الميكروبلاستيك تحت السطح. تُظهر تقديرات الميكروبلاستيك في عمود الماء تباينًا كبيرًا، ناتج بشكل أساسي عن منهجيات غير متسقة وأخطاء بشرية. لبناء مجموعة بيانات قوية، تركز هذه الدراسة حصريًا على الأبحاث التي تستهدف الميكروبلاستيك تحت السطح مع أعماق أخذ عينات محددة بوضوح.
طرق التعرف باستخدام الطيف، مثل رامان أو FTIR، تُستخدم على نطاق واسع وتقدم نهجًا قويًا لتحليل الميكروبلاستيك. يُعتبر التمييز البصري للجسيمات الأصغر من باستخدام المجهر الضوئي وحده غير موثوق به . تم استبعاد الدراسات التي تعتمد فقط على هذه الطريقة دون الطيف (على سبيل المثال، رامان أو FTIR) للبلاستيك الأصغر من . تم متابعة الدراسات التي تحتوي على أوصاف منهجية غير مكتملة – مثل تفاصيل مفقودة حول تقنيات التعرف، حجم مسام الفلتر أو مواصفات الشبكة – من خلال استفسارات عبر البريد الإلكتروني. تم استبعاد المقالات إذا لم يتم تقديم تفاصيل أساسية في الرد.
تتوفر المنهجيات التفصيلية في الجدول 1 من البيانات الموسعة، والجدول 2 والجدول 3 التكميلية.

جمع البيانات

لكل دراسة تفي بمعايير الإدراج، تم استخراج تفاصيل مثل حجم الشبكة، تركيز الميكروبلاستيك، توزيع حجم الجسيمات، إحداثيات أخذ العينات ووقت أخذ العينات في جدول بيانات. عندما لم تكن هذه المعلومات متاحة مباشرة، تم الحصول على البيانات من الخرائط والرسوم البيانية داخل المقالات باستخدام أداة ‘WebPlotDigitizer’ (https://github.com/ankitrohatgi/WebPlotDigitizer) لمعالجة فجوات البيانات. إذا لم توفر أي خرائط أو رسوم بيانية المعلومات المطلوبة، تم إرسال بريد إلكتروني إلى المؤلف المقابل. تم استبعاد المقالات إذا لم يتم تلقي رد مع البيانات اللازمة. مجموعة البيانات الكاملة متاحة للجمهور في ‘بيانات المصدر’.

تنسيق البيانات لمقارنة الميكروبلاستيك عند أعماق 1-60 م مع تلك العائمة عند سطح البحر

لإجراء مقارنات قوية بين الميكروبلاستيك في المياه تحت السطح وتلك الموجودة عند سطح البحر ضمن الطبقة العليا (مجموعة البيانات من المرجع 5)، تركز تحليلاتنا حصريًا على الميكروبلاستيك الكبير. يتم أخذ عينات الميكروبلاستيك العائم عند سطح البحر بشكل أساسي باستخدام شباك السطح بأحجام شبكة تتراوح من إلى (المرجع 5). لذلك، تم استخراج تركيزات الميكروبلاستيك في فئات الحجم فوق المجمعة في المياه القريبة من السطح من المقالات المراجعة بناءً على بيانات توزيع حجم البلاستيك لتسهيل المقارنات العالمية. تتكون مجموعة البيانات المنقحة من الميكروبلاستيك في المياه القريبة من السطح ( ) من ثلاث فئات حجم: ( ) من الجسيمات من الجسيمات ، و من الجسيمات . يتم تلخيص المعلومات التفصيلية حول فئة حجم الميكروبلاستيك في المياه القريبة من السطح ( ) في الجدول 2 التكميلية. تساعد هذه الطريقة أيضًا في تقليل التباينات في البيانات المجمعة من مشاريع مختلفة، حيث تشمل بعض المشاريع الميكروبلاستيك الليفي في تقديراتها بينما لا تشملها أخرى.

بناء نماذج توزيع وفرة الميكروبلاستيك

قمنا بتطبيق نموذجين GAMs لتحليل وفرة الميكروبلاستيك المعدلة في المياه القريبة من السطح ( ) وكثافات الميكروبلاستيك العائمة على طول تدرج خطوط العرض. لتحديد عدم اليقين في التنبؤ، استخدمنا محاكاة مونت كارلو مع 1,000 تكرار. في كل تكرار، قمنا بإعادة أخذ عينات من البيانات مع الاستبدال، وضبطنا نموذج GAM وتنبأنا بقيم الكثافة لـ 1,000 نقطة عرض متساوية. تم تكرار هذه العملية 1,000 مرة، مما أدى إلى توليد توزيع للتنبؤات. لكل خط عرض، قمنا بحساب المتوسط والانحراف المعياري للقيم المتوقعة لتقدير الاتجاهات المركزية وعدم اليقين. تضمن هذه الطريقة تنبؤات قوية مع تقديرات عدم اليقين عبر سيناريوهات إعادة أخذ العينات المختلفة.

دالة القوة للقيم الميكروبلاستيكية تحت السطح

تم بناء نموذج عمودي بسيط لتكرار ملفات الحطام البلاستيكي المرصودة في عمود الماء لكل دراسة. يعتمد هذا النموذج على العلاقة المقاسة بين كثافات الميكروبلاستيك وعمق الماء (الشكل 1c، d). في هذه الطريقة، يتم حساب كثافة الميكروبلاستيك كدالة لعمق الماء باستخدام المعادلة التالية: الكثافة ، حيث و تمثلان الميل والاعتراض لخط الانحدار المستمد من الرسم البياني اللوغاريتمي لكثافات الميكروبلاستيك المرصودة مقابل عمق الماء.

مقارنة بين الميكروبلاستيك-ك إلى إجمالي POC

تم قياس نسب الميكروبلاستيك-ك إلى إجمالي POC في كل من شمال المحيط الأطلسي وشمال المحيط الهادئ الفرعي . في شمال المحيط الهادئ، تم تقدير الميكروبلاستيك-ك من عينات مضخة في الموقع. تضمنت عملية التقدير حساب كتلة الجسيمات بناءً على كثافة البوليمر وحجمه (المحدد عبر -FTIR). ثم تم ضرب هذه الكتلة في نسبة محتوى الكربون ( ) من الصيغة الكيميائية لكل بوليمر. جاءت بيانات إجمالي POC من ثلاث محطات في شمال المحيط الهادئ. في اثنتين من هذه المحطات، تم تصفية العينات باستخدام مرشحات الألياف الزجاجية على 6 أعماق في أغسطس 2017 باستخدام مضخات في الموقع، مع حساب POC كفرق بين إجمالي الكربون وكربون الجسيمات غير العضوية . بالإضافة إلى ذلك، تم حساب إجمالي POC في محطة ALOHA بضرب إجمالي الكربون الجسيمي (TC) في نسبة POC:TC التجريبية (حوالي )، التي تم قياسها في محطة ALOHA . جاءت بيانات إجمالي الكربون الجسيمي في محطة ALOHA من عينات زجاجية عند 10 أعماق مختلفة (من 5 م إلى 350 م) تم جمعها في 16 نوفمبر 2018 خلال الرحلة KM 18-21 (http://hahana.soest. hawaii.edu/hot/hot_jgofs.html). في شمال المحيط الأطلسي، تم حساب الميكروبلاستيك-ك باستخدام بيانات من فخاخ الرواسب العائمة. تم تحديد كتلة البلاستيك في الفخاخ عبر كروماتوغرافيا الغاز التحليلية-الطيف الكتلي، مع محتوى الكربون بناءً على الصيغة الكيميائية لكل بوليمر. تم قياس POC من عينات تم تصفيتها على مرشحات GF/F المحترقة، والتي تعرضت لحمض الهيدروكلوريك المتصاعد لإزالة الكربونات. ثم تم تحليل المرشحات المجففة باستخدام محلل عنصري باستخدام معيار أسيتانيليد. لمزيد من التفاصيل حول الطريقة، يُشار إلى الدراسات . أخيرًا، تم بناء نموذج انحدار لوغاريتمي لتوقع العلاقة بين الميكروبلاستيك-ك وإجمالي POC كدالة لعمق الماء.

التحليل الإحصائي

نظرًا لأن مجموعات البيانات لم تكن موزعة بشكل طبيعي (اختبار كولموغوروف-سميرنوف) وافتقرت إلى تجانس التباينات (اختبار ليفين)، تم استخدام اختبار كروسكال-واليس، وهو طريقة غير معلمية، لإجراء مقارنات متعددة. عند وجود دلالة، تم إجراء مقارنات ثنائية باستخدام اختبار مان-ويتني-ويلكوك. تم تحديد الدلالة الإحصائية عند . بالإضافة إلى ذلك، تم استخدام حزم mgcv وMASS وboot
لتناسب نموذج GAM، وتشغيل محاكاة مونت كارلو وإجراء تحليل البوتستراب. تم إجراء جميع التحليلات الإحصائية والتصورات باستخدام برنامج (v.3.4.3، فريق تطوير النواة).

توفر البيانات

جميع البيانات التي تدعم نتائج هذه الدراسة متاحة على https:// doi.org/10.6084/m9.figshare. 28157324 (مرجع 137).
134. بويسلر، ك. أ.، بوي، ب. و.، بلاك، إ. إ. وسجل، د. أ. مقاييس مهمة لتقييم مضخة الكربون البيولوجية في المحيط. بروك. ناتل أكاد. ساي. الولايات المتحدة الأمريكية 117، 9679-9687 (2020).
135. سوبهاس، أ. ف.، أديكنز، ج. ف.، دونغ، س.، رولينز، ن. إ. وبيرلسون، و. م. نشاط أنزيم الكربونيك أنهيدراز للجسيمات الغارقة والمعلقة في شمال المحيط الهادئ. ليمنول. أوشنوجراف. 65، 637-651 (2020).
136. أومهاو، ب. ب. وآخرون. التغيرات الموسمية والمكانية في تدفقات الكربون والنيتروجين المقدرة باستخدام : عدم التوازن في دوامة المحيط الهادئ الاستوائية والفرعية. مار. كيم. 217، 103705 (2019).
137. تشاو، س. مجموعات البيانات للميكروبلاستيك المغمور في المحيط. فيغشير https://doi.org/ 10.6084/m9.figshare. 28157324 (2025).
الشكر والتقدير نشكر E. فان سيبيل على النصيحة. يتم الاعتراف بمصادر التمويل التالية: L.A.A.-Z. وE.R.Z. يعترفان بالدعم المالي من منظمة الأبحاث العلمية الهولندية (NWO) في إطار مشروع NWO جروت (OCENW. GROOT.2019.043)؛ H.N. يعترف بتمويل مجلس الأبحاث الأوروبي (ERC-CoG رقم المنحة 772923، مشروع VORTEX)؛ L.Z. وA.S. يعترفان بمؤسسة العلوم الوطنية الأمريكية (NSF EAGER OCE 2127669، NSF CBET 1910621)؛ L.Z. يعترف بمؤسسة العلوم الوطنية الصينية (NSFC 42206154)؛ M.T. يعترف ببرنامج الأبحاث والابتكار الخاص بالاتحاد الأوروبي هورايزون 2020، مشروع MINKE (تحت رقم اتفاقية المنحة 101008724)، وصندوق تحديات الأبحاث العالمية (NE/VO05448/1)، مشروع ‘تقليل آثار النفايات البلاستيكية في المحيط الهادئ الشرقي’ الذي تقوده جامعة إكستر، المملكة المتحدة؛ R.P.B. يعترف بمؤسسة غوردون وبيتي مور (#9208) ومنحة ستار-فرايدمان لعام 2018 للبحوث العلمية الواعدة.
مساهمات المؤلفين S.Z.: التصور (الرائد)، تنسيق البيانات (الرائد)؛ التحليل الرسمي (الرائد)؛ التحقق (الرائد)؛ الكتابة – المسودة الأصلية (الرائد)؛ الكتابة – المراجعة والتحرير (الرائد). K.F.K: التحقق (متساوي)؛ الكتابة – المراجعة والتحرير (متساوي). L.Z.: تنسيق البيانات (متساوي)؛ التحليل الرسمي (متساوي)؛ الكتابة – المراجعة والتحرير (داعم). E.R.Z.: التصور (متساوي)؛ التحقق (متساوي)؛ الكتابة – المراجعة والتحرير (متساوي). M.E.: التصور (متساوي)؛ التحقق (داعم)؛ الكتابة – المراجعة والتحرير (داعم). T.J.M.: التصور (متساوي)؛ التحقق (متساوي)؛ الكتابة – المراجعة والتحرير (داعم). L.A.A.-Z.: التصور (متساوي)؛ التحقق (متساوي)؛ الكتابة – المراجعة والتحرير (متساوي). L.L.: التحقق (متساوي)؛ الكتابة – المراجعة والتحرير (متساوي). H.N.: التحقق (داعم)؛ الكتابة – المراجعة والتحرير (داعم). R.N.: التحقق (داعم)؛ الكتابة – المراجعة والتحرير (داعم). M.T.: التحقق (داعم)؛ الكتابة – المراجعة والتحرير (متساوي). R.P.B.: التحقق (داعم)؛ الكتابة – المراجعة والتحرير (داعم). L.G.: التحقق (داعم)؛ الكتابة – المراجعة والتحرير (داعم). A.S.: التحقق (داعم)؛ الكتابة – المراجعة والتحرير (متساوي).
المصالح المتنافسة M.E. وL.L. يعملان في The Ocean Cleanup، وهي منظمة غير ربحية تهدف إلى تعزيز الفهم العلمي وتطوير الحلول للتخلص من البلاستيك في المحيطات.

معلومات إضافية

المعلومات التكميلية النسخة الإلكترونية تحتوي على مواد تكميلية متاحة على https://doi.org/10.1038/s41586-025-08818-1.
يجب توجيه المراسلات وطلبات المواد إلى شيي زهاو.
معلومات مراجعة الأقران الطبيعة تشكر المراجعين المجهولين على مساهمتهم في مراجعة الأقران لهذا العمل.
معلومات إعادة الطبع والتصاريح متاحة على http://www.nature.com/reprints.
الشكل الممتد. 1| تقديرات معدلة لقطع الميكروبلاستيك العائمة على سطح البحر (نقاط برتقالية) وفي المياه القريبة من السطح (نقاط زرقاء) على طول خطوط العرض. في مخططات الصندوق الهامشي، تمثل الخطوط الأفقية السوداء السميكة الوسيطات لكثافات الميكروبلاستيك؛ يمثل أعلى وأسفل الصناديق الملونة النسب المئوية 25 و75؛ وتشير الشعيرات إلى أكبر وأصغر القيم المقاسة ضمن 1.5 من النطاقات الربعية
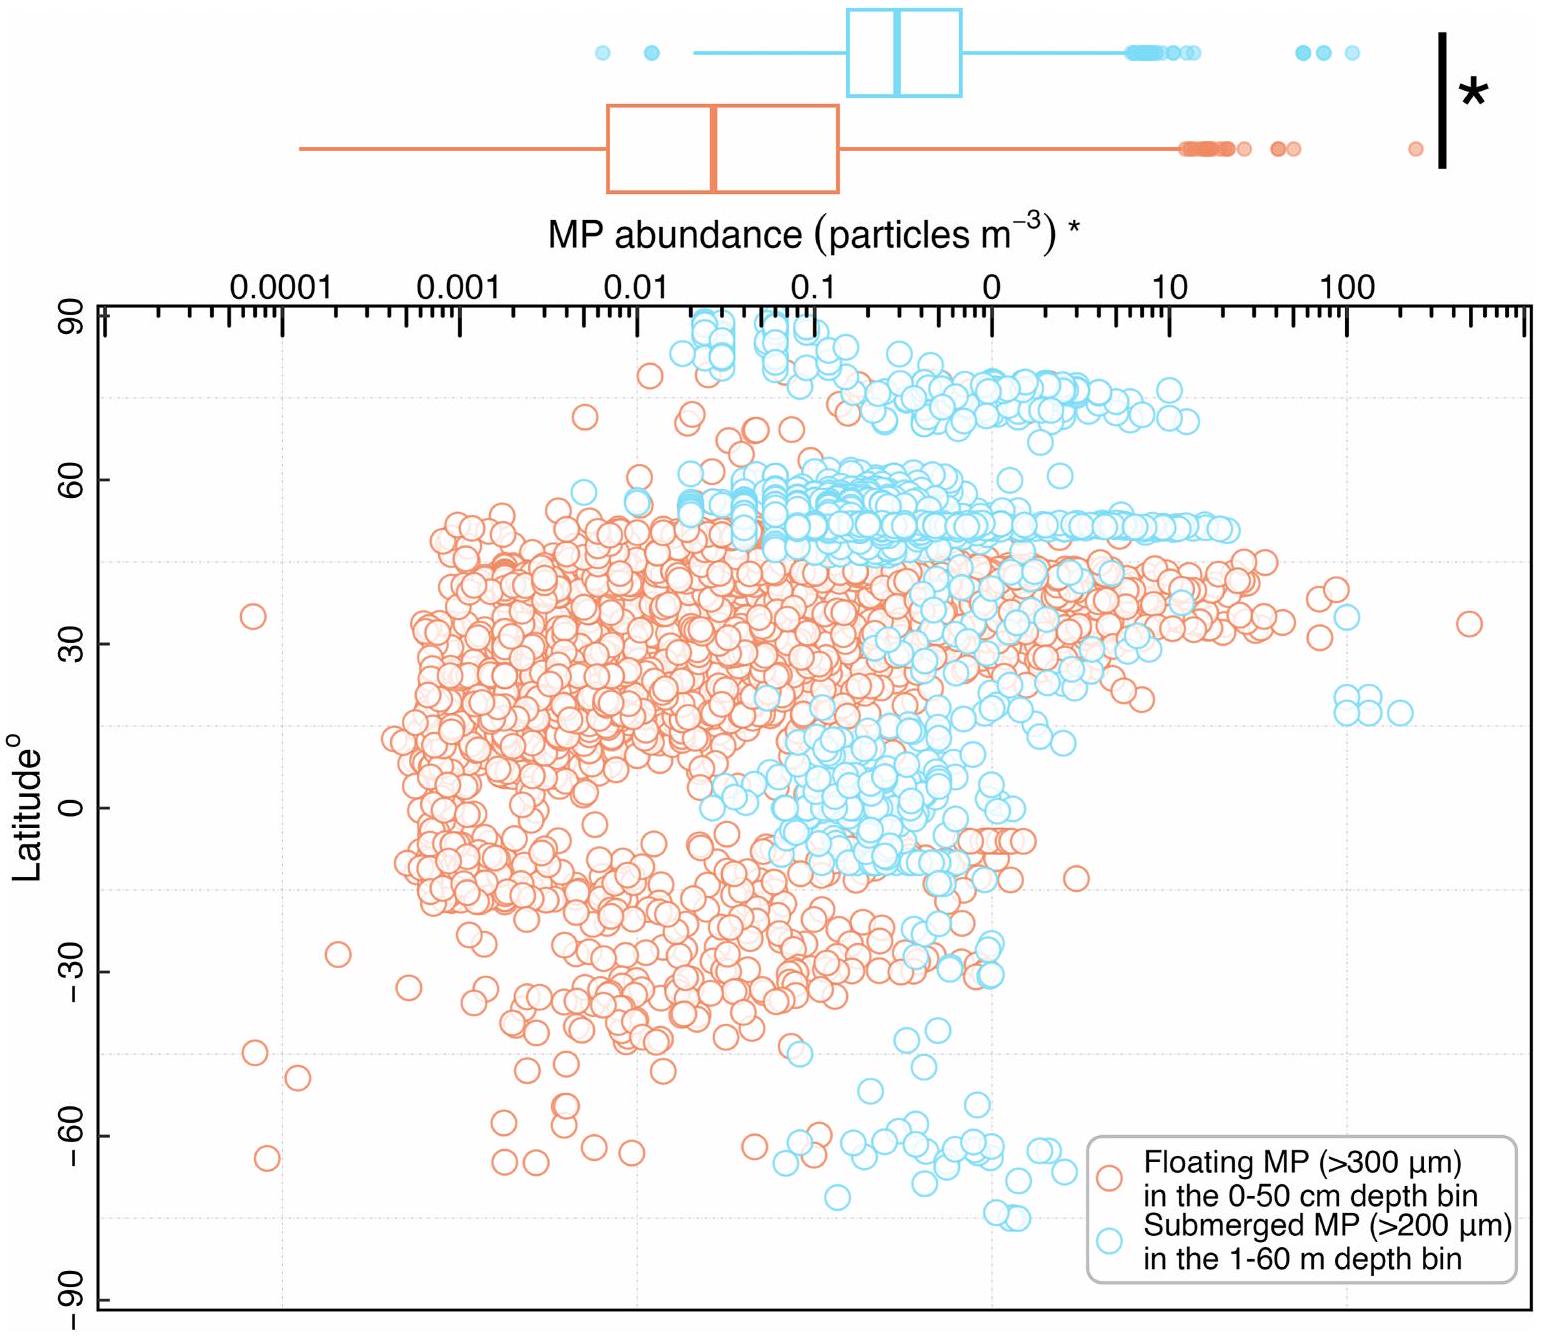
من الصندوق. تشير النجوم إلى الفروق ذات الدلالة الإحصائية بين فئتين (اختبار مان-ويتني-ويلكوك، p <.05). تتكون مجموعة البيانات المكررة للميكروبلاستيك في حاوية العمق ( ) من ثلاث فئات حجمية: 5.3% ( ) من الجسيمات الجسيمات الجسيمات للمزيد من التفاصيل، يرجى الرجوع إلى الطرق، الشكل 1 والجدول 2 في الملحق.
الشكل البياني الممتد 2 | انحدارات الانحدار اللوغاريتمي الخطي بين تركيزات الميكروبلاستيك وعمق المياه في المياه القريبة من الشاطئ (مخطط الصندوق البني) والمياه البعيدة عن الشاطئ (مخطط الصندوق الأزرق). يمثل الجزء العلوي والسفلي من الصناديق الملونة النسب المئوية 25 و75؛ وتشير الشعيرات إلى أكبر وأصغر القيم.
قيم مقاسة ضمن 1.5 نطاق ربعي من الصندوق. تشير النجوم إلى الفروق ذات الدلالة الإحصائية بين مجموعتين (اختبار مان-ويتني ويلكوكسون، ).
الشكل 3 من البيانات الموسعة | مقارنة تركيزات الكتلة من الميكروبلاستيك في عمود الماء التي تم جمعها باستخدام المضخة في الموقع وMultiNet في المحيط الأطلسي والمحيط الهادئ الشرقي. لكل عينة فلتر من المضخة في الموقع، تم استخدام تصوير FTIR لتحليل 1.8% (مرجع 10،
(مرجع 3) و (المرجع 25) للجسيمات. بالإضافة إلى ذلك، تم نشر المضخة في الموقع وMultiNet في وقت واحد لجمع الميكروبلاستيك في دوامة المحيط الأطلسي الجنوبي شبه الاستوائي. والدوامة شبه الاستوائية في شمال المحيط الهادئ الشرقي .
الشكل 4 من البيانات الموسعة | الكميات المقاسة من البلاستيكات الدقيقة الكبيرة والصغيرة داخل وخارج مناطق التراكم البحرية المتوقعة في عمود الماء أدناه تُظهر الوسائط في مخطط الصندوق بخطوط أفقية سوداء عريضة، بينما يمثل الجزء العلوي والسفلي من الصناديق الملونة
تمثل النسب المئوية 25 و75 على التوالي. تشير الخطوط إلى أكبر وأصغر القيم المقاسة ضمن 1.5 من نطاقات الربع من الصندوق. مجموعات البيانات مأخوذة من المراجع. لا توجد فروق إحصائية.

تحليل

الشكل البياني الموسع 5 | العلاقة بين النسب (%) من الكربون الدقيق إلى الكربون العضوي الجسيمي وعمق المياه في شمال المحيط الهادئ
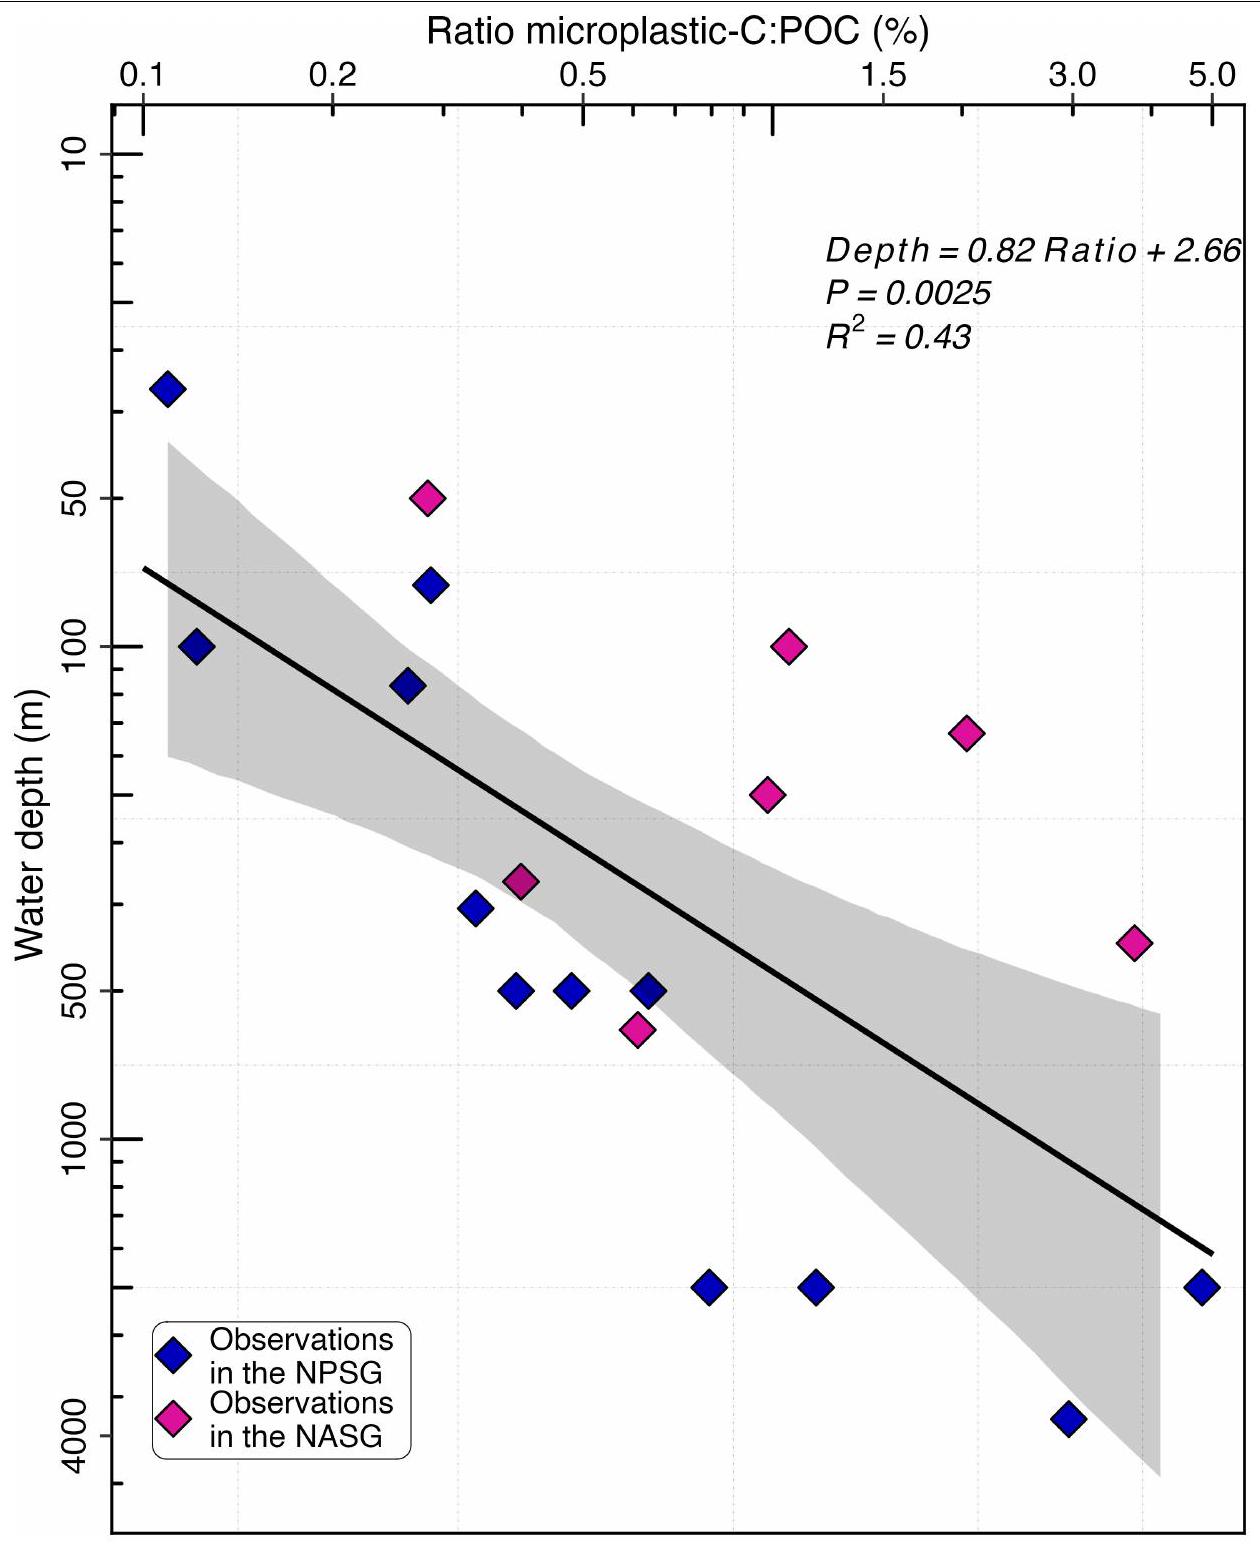
يمثل الخط الأسود ملاءمة الانحدار الخطي والمنطقة المظللة تمثل فترة الثقة المقدرة بواسطة 1000 مرة من تقنية البوتستراب. (ماس أزرق) وشمال الأطلسي (ألماس أرجواني) الدوائر شبه الاستوائية.
البيانات الموسعة الجدول 1 | الخطوات المنهجية الرئيسية في دراسة الميكروبلاستيك تحت السطح
الوصف في الأدبيات المزايا العيوب
معدات أخذ العينات
مضخة في الموقع مضخة مكلاين، مضخة ISP، مضخة البلانكتون
-حمل فلاتر بأحجام مسام مختلفة؛
-حجم عينة كبير؛
-دقة العمق (حتى 6000 متر);
-سهولة التحكم في التلوث
-انتقائي للجزيئات الصغيرة؛
-عملية تتطلب الكثير من العمالة وتستغرق وقتًا طويلاً؛
-زيادة التحديات التشغيلية خلال حالات البحر السلبية؛
-تكلفة عالية
مضخة غاطسة، مضخة بئر عميق، مضخة أثناء سير السفينة
-سهولة التشغيل؛
-حجم عينة كبير؛
-الفعالية من حيث التكلفة؛
-سهولة التحكم في التلوث
-عمق أخذ عينات محدود؛
-أحجام المسام/الشبكات الثابتة؛
-انتقائي للجزيئات الصغيرة؛
شبكة العوالق MOCNESS مولت نت
-حجم عينة كبير؛
-دقة العمق؛
-عملية تتطلب الكثير من العمالة وتستغرق وقتًا طويلاً؛
-انتقائي للجزيئات الكبيرة؛
-تكلفة عالية
جهاز أخذ عينات المياه بالجملة زجاجة نيسكين، جهاز أخذ عينات المياه ليمنوس، جهاز أخذ عينات المياه من الأكريليك
-دقة عمق كاملة ؛
-سهولة التشغيل
-سهولة التحكم في التلوث
-حجم عينة محدود
أنواع الفلاتر/الشبكات
فلتر الشاشة أنوديسك، فلتر بولي كربونات، فلتر نايلون، شبكة فولاذية مقاومة للصدأ، فلتر نيتروسيليلوز
-فعال لالتقاط الجسيمات الأكبر
-سهل غسل الجسيمات المحبوسة
-سعة احتفاظ محدودة للجزيئات الصغيرة
عرضة للاحتباس
مرشح العمق GF/A، GF/C، فلاتر الكوارتز
– قدرة أعلى على الاحتفاظ بجزيئات بأحجام مختلفة
– التعامل مع حجم مياه مرتفع نسبيًا
-مقاومة أعلى للاحتباس
-تُحتجز الجسيمات داخل الهيكل
التعرف الكيميائي
التصوير الكيميائي كاشف تلوريد الزئبق والكادميوم ذو العنصر الواحد، كاشف مصفوفة مستوى البؤرة
-دقة مكانية عالية (تصل إلى 11-20 )
-بدون تحيز بشري
-تحليل البيانات شبه الآلي
-يتطلب تحضير عينات دقيق
-تصفية حساسية السطح
-زيادة أوقات القياس مع زيادة مساحة الفلتر المصور
-تعقيد تحليل حجم كبير من الطيف
-يتطلب قدرة حسابية عالية
-أداة باهظة الثمن
فحص مدعوم بالمجهر يتبعه -تحديد FTIR/Raman تقنيات FTIR: الانعكاس الكلي المخفف – FTIR -FTIR/رامان ؛ -سهولة إعداد العينات والتحليل
-ينطبق فقط على الجسيمات ؛
-النتائج تعتمد إلى حد كبير على مستوى خبرة المؤدي
فحص مجهرى تحديد جزيئات البلاستيك من خلال الفحص البصري تحت المجهر
-سهولة قطع البلاستيك الكبيرة
-تكلفة منخفضة
-لم يتم توفير معلومات عن البوليمر
توضح هذه الجدول الطرق المستخدمة في مراحل قياس الميكروبلاستيك تحت السطح، بما في ذلك معدات أخذ العينات، وأنواع الفلاتر/الشبكات، والتحديد الكيميائي. كما تم تقديم المزايا والقيود لكل خطوة. حجم شبكة مضخة العوالق ثابت. شبكة متعددة الفتح والإغلاق مع نظام استشعار بيئي. مجمع بلانكتون المتعدد. يستخدم فلتر الشاشة شبكة لاحتجاز الجسيمات الأكبر من فتحات الشاشة؛ بينما يعتمد فلتر العمق على مصفوفة مسامية من وسائط العمق لالتقاط الجسيمات عبر عمق وسط الفلتر. -FTIR/Raman تعني أنظمة طيفية مدعومة بالميكروسكوب (طيفية الأشعة تحت الحمراء بتحويل فورييه/رامان). يمكن لجهاز MOCNESS وMultiNet أخذ عينات من أعماق متعددة، ولكن عمق العينة الأقصى عادة ما يكون محدودًا مقارنةً بمضخات الموقع. يمكن لجهاز أخذ عينات المياه بالجملة (مثل زجاجة نيسكين أو جهاز CTD Rosette) أن يسمح بجمع عينات المياه من أعماق دقيقة عبر عمود الماء.

  1. وكالة اليابان لعلوم البحار والأرض، يوكوسوكا، اليابان. أوتياروا أبحاث المحيط الأزرق، لور هوت، نيوزيلندا. المختبر الوطني الرئيسي لأبحاث المصبات والسواحل، جامعة شرق الصين العادية، شنغهاي، الصين. قسم العلوم البحرية والبيئية، جامعة نورث إيسترن، بوسطن، ماساتشوستس، الولايات المتحدة الأمريكية. معهد نيدرلاند الملكي لأبحاث البحر، دين بورغ، هولندا. تنظيف المحيط، روتردام، هولندا. إمباكتيفي، سانت غالن، سويسرا. كلية هارriet ويلكس الشرفية، جامعة فلوريدا أتلانتيك، بوكا راتون، فلوريدا، الولايات المتحدة الأمريكية. قسم علم البيئة للمياه العذبة والبحرية، معهد التنوع البيولوجي وديناميات النظام البيئي، جامعة أمستردام، أمستردام، هولندا. قسم علوم الأرض، كلية علوم الأرض، جامعة أوترخت، أوترخت، هولندا. كلية علوم البحر، الجامعة الكاثوليكية الشمالية، كوكيمبو، تشيلي. برنامج MarineGEO، مركز سميثسونيان للبحوث البيئية، إدج ووتر، ماريلاند، الولايات المتحدة الأمريكية. مركز علم البيئة والإدارة المستدامة للجزر المحيطية (ESMOI)، كوكيمبو، تشيلي. قسم البيولوجيا العضوية والتطورية، جامعة هارفارد، كامبريدج، ماساتشوستس، الولايات المتحدة الأمريكية. قسم التكنولوجيا الحيوية والكيمياء والصيدلة، جامعة سيينا، سيينا، إيطاليا. المركز الوطني لمستقبل التنوع البيولوجي (NBFC)، باليرمو، إيطاليا. قسم الكيمياء وعلم الأحياء الكيميائي، جامعة نورث إيسترن، بوسطن، ماساتشوستس، الولايات المتحدة الأمريكية. قسم الهندسة المدنية والبيئية، جامعة نورث إيسترن، بوسطن، ماساتشوستس، الولايات المتحدة الأمريكية. البريد الإلكتروني: szhao@jamstec.go.jp

Journal: Nature, Volume: 641, Issue: 8061
DOI: https://doi.org/10.1038/s41586-025-08818-1
PMID: https://pubmed.ncbi.nlm.nih.gov/40307520
Publication Date: 2025-04-30

The distribution of subsurface microplastics in the ocean

https://doi.org/10.1038/s41586-025-08818-1
Received: 28 September 2023
Accepted: 20 February 2025
Published online: 30 April 2025
Open access
Check for updates

Shiye Zhao , Karin F. Kvale , Lixin Zhu , Erik R. Zettler , Matthias Egger , Tracy J. Mincer , Linda A. Amaral-Zettler , Laurent Lebreton , Helge Niemann , Ryota Nakajima , Martin Thiel , Ryan P. Bos , Luisa Galgani & Aron Stubbins

Abstract

Marine plastic pollution is a global issue, with microplastics ( ) dominating the measured plastic count . Although microplastics can be found throughout the oceanic water column , most studies collect microplastics from surface waters (less than about depth) using net tows . Consequently, our understanding of the microplastics distribution across ocean depths is more limited. Here we synthesize depth-profile data from 1,885 stations collected between 2014 and 2024 to provide insights into the distribution and potential transport mechanisms of subsurface (below about depth, which is not usually sampled by traditional practices ) microplastics throughout the oceanic water column. We find that the abundances of microplastics range from to particles per cubic metre. Microplastic size affects their distribution; the abundance of small microplastics ( to ) decreases gradually with depth, indicating a more even distribution and longer lifespan in the water column compared with larger microplastics to that tend to concentrate at the stratified layers. Mid-gyre accumulation zones extend into the subsurface ocean but are concentrated in the top 100 m and predominantly consist of larger microplastics. Our analysis suggests that microplastics constitute a measurable fraction of the total particulate organic carbon, increasing from 0.1% at 30 m to at . Although our study establishes a global benchmark, our findings underscore that the lack of standardization creates substantial uncertainties, making it challenging to advance our comprehension of the distribution of microplastics and its impact on the oceanic environment.

Marine plastic pollution is a global issue , with 9-14 million metric tons of plastics entering the ocean annually . Microplastics dominate measured plastic counts and pose serious global threats to ocean health . Most studies focus on surface waters, collecting microplastics from the upper 15-50 cm using net tows . However, microplastics exist in various forms with complex properties that affect their interactions with the environment (Box 1), ultimately shaping their three-dimensional distribution . Consequently, microplastics are found throughout the water column, from the coastal to open ocean, across all latitudes . Despite this, a synthesis of current knowledge and research priorities regarding microplastics across ocean depths is lacking.
The water column of the ocean, providing the most voluminous habitat on Earth, has a vital role in biogeochemical cycling . The ocean contributes approximately of global net primary production,
serves as a major sink for anthropogenic carbon dioxide , and facilitates particle transport and distribution . As marine particles and microplastics transit the water column, their interactions with biogeochemical processes influence their behaviour and impact marine ecosystems , including the ocean’s carbon cycle . Therefore, understanding the distribution and potential impacts of microplastics throughout the water column is essential.
To advance understanding of the distribution of microplastics, here we synthesize depth-profile data from 1,885 stations collected between 2014 and 2024 (Fig. 1a), describing distribution patterns by size and polymer type, and assessing potential transport mechanisms. We examine existing microplastics distribution models and highlight research challenges and priorities (Table 1) for advancing knowledge of subsurface microplastics distributions and impacts in the ocean.

Box 1

Complexity of microplastics in the natural environment

Microplastics constitute a complex suite of contaminants with a wide array of physicochemical and biological characteristics, including size, shape, density, colour, chemistry and biofilm composition . These diverse properties arise from both plastic manufacturing processes and natural transformations. The chemical composition and structure of microplastics determine fundamental traits such as material type, shape, size, density and resistance to environmental stressors such as heat and ultraviolet radiation . In addition, plastic additives further modulate these properties .
In natural environments, secondary microplastics are generated through the fragmentation of larger plastic debris and undergo various physical (for example, sunlight, heat, wind and waves) and
biological (for example, fragmentation via biting, ingestion and biofouling) transformations , increasing their diversity. This complexity greatly complicates sampling and analysing techniques (Extended Data Table 1), creating challenges in comparing or synthesizing microplastic data across different studies. Field studies typically classify microplastics into discrete categories (see the figure). Size, shape and density are key factors influencing the transport and fate of environmental microplastics. Furthermore, characteristics such as colour, surface properties, eco-toxin sorption and additives influence the ecological risk posed by microplastics. Biologically, microplastics host diverse microbial communities, including nonnative species, potential pathogens and antibiotic-resistant genes, forming what is referred to as the ‘plastisphere’ .
Box 1 Fig. 1|Complexity of microplastics in the natural environment. Microplastics vary in physical (size, shape, density, surface properties), chemical (polymer type, additives, molecular structure, adsorbed chemicals), and biological (plastic-associated microbiome, the ‘plastisphere’) properties. These factors, shaped by manufacturing and environmental influences,
complicate the measurements of microplastics and influence their ecological impact.ARGs, antibiotic-resistant genes;PAHs, polycyclic aromatic hydrocarbons; PCBs, polychlorinated biphenyls; PE, polyethylene; PP, polypropylene; PS, polystyrene; PET, polyethylene terephthalate.
Fig.1|Observations of subsurface microplastics in the ocean. a, Global observation stations of marine microplastics collected through surface net tows (orange dots; data from refs. 2,5,89,124), at a single depth beneath the surface using various techniques (light blue dots), from multiple water depths (dark blue dots), and from sediment traps (red triangles). The solid yellow lines represent the predicted boundaries of the offshore convergence zones, where floating plastic debris accumulates . b, Latitudinal trends in the adjusted large microplastics, residing within the depth bin (light blue line, subsurface microplastic data collected at a single depth in refs.55,77-86) and those floating microplastics at the sea surface ( , orange line; data from ref. 5). Only the trends of coloured lines are considered here (for exact values,

Uncertainties in microplastic measurement methods

The reported abundance of water column microplastics spans eight orders of magnitude (Supplementary Table 1). It needs to be noted that some of this variation arises from inconsistencies in collection and analysis methods (Extended Data Table 1 and Supplementary Tables 2 and 3). The physicochemical and biological characteristics of aged microplastics further complicate measurements (Box 1),
refer to Supplementary Fig.1). The coloured shaded areas denote s.d. from 1,000 Monte Carlo runs that used varying predictors for the Generalized Additive Models (GAMs). c,d, Depth profiles of microplastic abundances (particles per ) observed in nearshore (c; data from refs. 33,67-70,72,103,126-130) and offshore ( ; data from refs. ) waters with the log-log regression fits (dashed lines) between microplastics abundances and water depth of individual studies. The exponent , also referred to as the slope, provides information on the rate of abundance change along the depth gradients. The lower particle size limit of each study in cand is presented in Supplementary Table 3. The corresponding linear regression equations are shown in Supplementary Table 4.
as each plastic category demands customized sampling and analysis approaches . For instance, the use of 19 different pore sizes of meshes and filters (Supplementary Table 3) may contribute to pronounced differences in reported abundances; smaller pore sizes capture more particles, as microplastics counts typically increase with decreasing size, following an approximate power law . This effect is evident in parallel sampling efforts, where samples collected at the same site and depth but using versus meshes yielded

Analysis

Table 1 | Current understanding, process insights and research priorities for subsurface microplastics
Current knowledge and confidence level Process insights Major gaps and priority level
Distribution
Spatial distribution:
– Microplastics permeating throughout the water column (H)
-Higher abundances in nearshore than offshore waters (M)
– Abundances of large microplastics decline sharply with depth
– An even distribution of small microplastics
– Subsurface maximum occurring in the bathypelagic layer
– Plastic-C:POC ratio increase with depth
– Proximity to terrestrial sources, shallow water depth and high biological activities may contribute to high concentrations in nearshore waters
– As particles get smaller, size largely determines their transport and fate
– Small microplastics, regardless of their densities, sink at comparable speeds
– The non-degradable plastic-C is changing the marine C system, especially in the deep sea
– Variations in the degradation potential of polymers and different plastic sources may contribute to spatial differences in polymer distribution
– Particle retention time in stratified layers increases quadratically with particle size
– Seasonal stratification may
Improving particle characterization:
-Define size, shape, density, colour and chemical signature following a continuous distribution (H)
– Estimate in situ density of microplastics, including plastic and any biotic/abiotic materials on its surface (M)
-Advance methods for quantifying plastic ages and carbon composition (M)
Polymer distribution:
– Buoyant polymers dominating overall (L)
– Dense polymers being more prevalent offshore and in deeper waters (M)
– Specific polymers differing between nearshore and offshore (M)
pump large microplastics into deeper depths
– Marine aggregates are an important vector to transport microplastics to the deeper waters
Defining key parameters of biological and physical transport mechanisms:
– Study the physical structure of microplastics-associated biofilm, such as thickness, roughness, cell number and biomass (L)
– Estimate sinking rates of environmentally relevant microplastics colonized by biofilm, incorporated into marine snow and faecal pellets (H)
– Quantify the effects of biogenic minerals on the vertical flux of plastics (H)
– Study the changes in microbiome of plastic-laden marine snow during their transit through the water column (L)
– Explore transport efficiency of physical subduction such as seasonal variations of water stratification and eddies (M)
Biologically mediated processes:
– Biofilm alone can rarely sink microplastics to the sea floor
– Microplastics flux with a power-law profile is confirmed (L)
– Faecal pellets and mineral ballast are an efficient shuttle to export microplastics to the deep sea
Model optimization:
– Developing environmentally relevant microplastic parameterizations based on experiments and observations, specifically focusing on plastic-C:organic-C ratios in particle fluxes, particle sinking rates, remineralization rates and zooplankton ingestion rates (H)
– Creation of standardized datasets from which to assess model performance (H)
– Improved mechanistic parameterizations of the biotic and abiotic fragmentation of plastics (H)
– Improved estimates of sources and sinks to constrain the global microplastics budget (H)
This table provides a structured assessment of the current state of knowledge on subsurface microplastics, summarizing key insights into their behaviour and associated processes. It includes an overview of current understanding, a qualitative ranking (high (H), medium (M) or low (L)) of how well each topic is understood, major unresolved questions and critical research gaps. In addition, it assigns priority levels (high (H), medium (M) or low (L)) for future investigations over the coming years.
5-6 orders of magnitude differences in microplastic abundances . Analytical techniques also drive discrepancies. Microscopy-aided preselection followed by chemical identification-a method applied in 70% of studies-relies heavily on the investigators’ experience and becomes unreliable for small microplastics . For instance, a study employing micro-Fourier transform infrared ( -FTIR) imaging, capable of identifying polymers particles down to (ref. 27), revealed 2-3 orders of magnitude more microplastics in Arctic sea-ice cores than earlier light-microscopy-based estimates . Variability may also result from subsampling rather than analysing the entire sample. Extrapolating results from subsamples can introduce biases of up to (refs. 29,30). These methodological uncertainties currently hinder accurate quantification of the distribution of microplastics in the environment. Research efforts aimed at enhancing observation resolution in the water column, while employing consistent methods, are crucial in refining our understanding of the marine microplastics standing stock, whether measured by count or by mass.

Microplastics permeating ocean waters

Our synthesis reveals that subsurface microplastics sampling is concentrated in the Atlantic and Atlantic-Arctic oceans (Fig. 1a). In waters between 1 m and 60 m , large microplastics abundances, determined at a single depth and represented by light blue dots in Fig. 1a, can reach up to 800 particles per (ref. 31), with a median of 0.49 particles per (Extended Data Fig. 1). Comparing microplastic abundances in comparable size fractions ( ; Methods), reveals consistent latitudinal patterns between subsurface microplastics ( ) and floating microplastics (median: 0.02 particles per ; upper 0.5 m ; ref. 6), both peaking in subtropical zones (Fig. 1b). However, subsurface microplastic counts at depth are approximately significantly higher than those at the surface ( , Extended Data Fig. 1).
Despite uncertainties, measurements from studies collecting samples at multiple depths per station (median 205 particles per ; range to particles per , represented by dark blue dots in Fig. 1a) suggest that the water column represents a major reservoir of
microplastics. High abundances have been consistently observed in deep waters, including over 1,100 particles per at in a North-South Atlantic transect particles per at 2,000 m in the North Pacific Subtropical Gyre particles per at in the Arctic , and 13,500 particles per at 6,800 m in the Mariana Trench . Along the Korean coast alone, an estimated 3.13 trillion microplastics sized are present in the water column . This accounts for a small but notable fraction of the 171 trillion floating plastics in the same size range observed globally, most of which are microplastics . In the Atlantic Ocean, microplastics of the size category in the top 200 m average 2,200 particles per , with an estimated mass of 11.6-21.1 million metric tons. This mass is comparable to the total input of plastic in the size category (17-47 million metric tons) into Atlantic waters and sediments from 1950-2015 estimated in ref.16. However, these estimates are subject to substantial uncertainty owing to coarse observation resolution, simplified ocean physics and methodological inconsistencies.

Subsurface microplastic distribution patterns

Sampling locations were categorized as ‘nearshore’ (within 200 nautical miles from shore) and ‘offshore’ (beyond 200 nautical miles) . Microplastic abundances ranged from to particles per nearshore and from to particles per offshore. Despite potential underestimation in nearshore studies using microscopy-aided methods, the median nearshore abundance (500 particles per ) is over 30 times higher than the median offshore abundance ( 16 particles per ) where advanced methods were often used (Supplementary Tables 2 and 3). This nearshore median aligns with values from offshore plastic accumulation zones confirmed via -FTIR imaging (for example, 400 particles per in the North Pacific Subtropical Gyre and 250 particles per in the South Atlantic Subtropical Gyre ). High nearshore abundances match previous predictions and field observations , suggesting that coastal regions may act as plastic accumulation zones akin to offshore gyres . Factors such as proximity to terrestrial sources and shallow nearshore waters where turbulence draws plastics downwards likely contribute to this observation.
Microplastic abundances generally decrease with water depth (Fig. 1c,d). Nearshore waters show a much steeper decrease in abundance compared with offshore waters ; Extended Data Fig. 2 and Supplementary Table 4), with abundances declining by up to a 1,000-fold (Fig.1c). This sharp decline probably results from the high mineral and biological productivity in coastal waters, which enhances the sinking rates of aggregated microplastics . Diatoms, dominant in coastal ecosystems, contribute siliceous frustules (density ) frequently found on the surface of microplastics, thereby increasing their ballast effect . Similarly, calcite precipitates (density ) associated with biofouled microplastics add weight, accelerating their sinking . Together, these factors promote efficient vertical transport of microplastics in nearshore waters. These findings agree with models predicting rapid sinking of microplastics in biological productive coastal zones with strong downwelling, such as in East Asia . Conversely, low productivity in offshore waters may cause less efficient vertical transport , contributing to the observed differences in abundance decay rates. In addition, owing to its proximity to coastal plastic sources, the dilution effects on microplastic levels (stemming from coastal and riverine inputs) in coastal waters could also cause this rapid concentration decline. Direct measurements of microplastic vertical flux are scarce and methodological variations hinder clear insights (Supplementary Table 5). Future research should explore vertical transport mechanisms in ecosystems with varying biological productivity, combining concentration measurements with flux-profile analysis to improve understanding of the processes that transfer microplastics downwards, analogous to the study of particulate organic carbon .
Abundance profiles of offshore microplastics smaller than show a gradual decrease (within one order of magnitude) with depth (Fig. 1d), implying a relatively even distribution throughout the water column . Models also suggest a uniform dispersion of small microplastics in the water column, behaving differently from large microparticles , with sinking speeds ranging from to , regardless of buoyant or dense plastics. Even biofouling minimally alters the settling velocities of small microplastics owing to their restricted surface area . A two-orders-of-magnitude decrease in the abundance of large microplastics to with depth in offshore waters also supports this size-dependent distribution (Fig. 1d). Models and observations show that, compared with small microplastics, large microplastics tend to either remain at the sea surface or quickly reach the sea floor, leading to a rapid decline in abundances along depth gradients .
Long-term observations are crucial to understanding microplastic abundance profiles and vertical fluxes. Capturing both discrete (such as polymers and colour) and continuous (such as size, shape and density) characteristics of microplastics is essential to elucidate physical and biological redistribution mechanisms . Physical processes, such as seasonal stratification and eddy-driven subduction, differ in temporal and spatial scales and remain poorly understood. Biological factors, such as the physical structure (for example, thickness, biomass and density ) of microplastic-attached biofilms across depths have rarely been studied. How microplastics interact with marine aggregates (composed of microbes, organic and inorganic matter ) during their transit through the water column, including factors such as sinking velocities and the cohesive strength of plastic-laden aggregates, also warrants future research.
Results are generally reported as counts, so measurements of the microplastic mass in the water column are limited. Microplastic mass concentrations vary by up to five orders of magnitude (Extended Data Fig. 3), partially attributed to methodological differences. In the North Pacific Subtropical Gyre, small and large microplastics concurrently sampled have comparable mass concentrations at shallow depths (Extended Data Fig. 3), but the ratio of small to large microplastic mass increases with depth , highlighting the growing significance of small microplastics at greater depths.

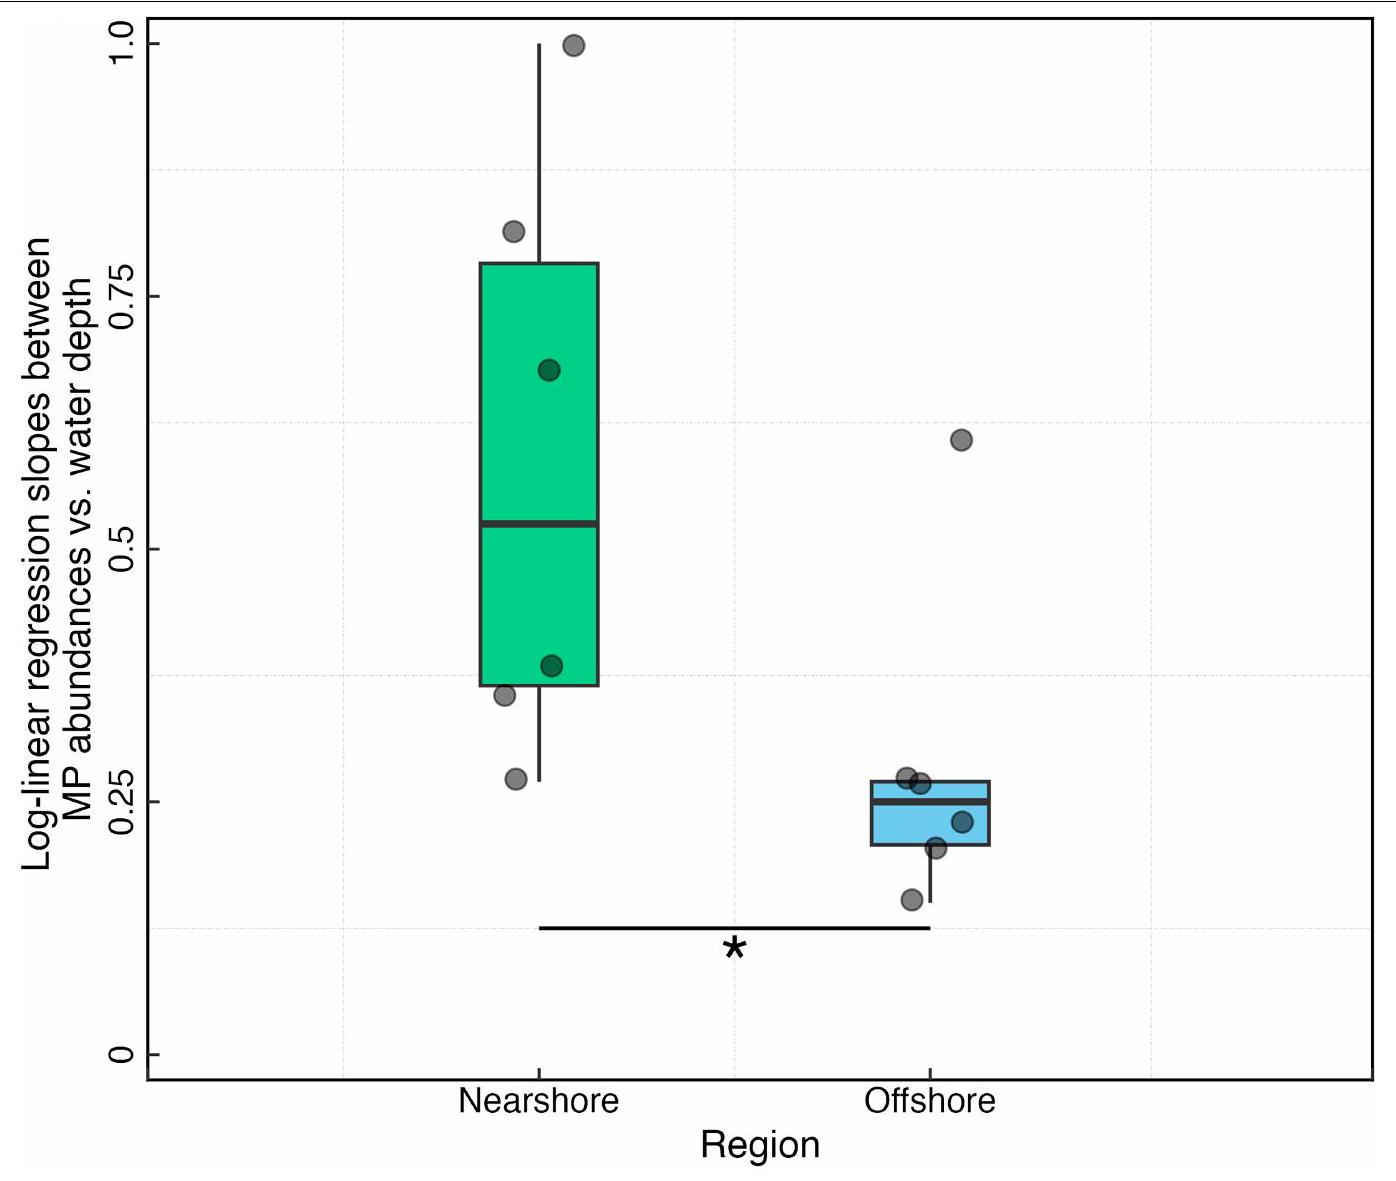
Density stratification retaining large microplastics

Vertical density stratification in the ocean, driven by temperature and/ or salinity gradients, creates pycnoclines, where the water density changes sharply . These pycnoclines are common in the ocean and are often associated with intense biological activities and elevated concentrations of particles, such as the accumulation of marine snow . Observations in both nearshore and offshore waters show increased microplastics within pycnocline layers compared with those above. Our synthesis suggests that the elevated abundances in stratified layers are mostly linked to large microplastics rather than small microplastics (Fig. 2a). Stratification affects particle settling through a combination of buoyancy, diffusion and viscosity, which slows sinking by increasing drag and suppressing vertical motion, directing particles along isopycnals . Whether stratification impacts a particle’s motion depends on the stratification length scale ( ), the distance over which water density changes, which ranges from to 1 mm . Particles larger than , such as large microplastics, are significantly affected, whereas smaller microplastics are largely unaffected . Irregular-shaped particles undergoing stratification-induced reorientation experience further deceleration . As a result, large and irregular microplastics experience prolonged settling times and concentrate at pycnoclines. The lack of small microplastic accumulation at density interfaces was also observed in a freshwater system . Our findings also agree with a model study that identifies a pronounced accumulation of large microplastics at pycnoclines, compared with small microplastics, in the open
Fig. 2 | Vertical distribution of microplastics along water-depth gradients as a function of particle size, density stratification and sampling location. a, Relationship between microplastic abundance within pycnocline layers and those above the pycnocline layers as a function of microplastics size category: small microplastics (gold triangles; refs. 3,33,56) and large microplastics (brown dots; refs. 3,56,67-72). Dashed lines represent ratios of microplastic abundances within pycnocline layers to those above the pycnocline layers. Refer to Methods for large and small microplastics classification.b, Box-andwhisker plots for the measured abundances of small and large microplastics
ocean . Further investigation into microplastics in pycnoclines and other distinct layers, such as the deep chlorophyll maximum and benthic nepheloid layers, is essential to understand not only transport but also the potential exposure of marine life.

Vertical extension of microplastic accumulation zones

Large microplastics, both floating at the sea surface ( depth) and present in subsurface waters (data from refs. 55,77-86 collected at a single depth between 1 m and 60 m ), peak in abundances at mid-latitudes (generalized additive models (GAMs), ; Fig. 1b and Extended Data Fig. 1). However, their distribution varies along the latitudinal gradients. Elevated abundances are also observed in the depth range above and . The increased abundances at high latitudes align with modelling results, suggesting that subsurface currents carry microplastics to the polar regions . Observations indicate that the Atlantic is the largest source of subsurface microplastics collected in Arctic waters . Besides the input by oceanic flows, other sources such as atmospheric delivery and rivers (for example, Eurasian river inflows ) from lower latitudes could also contribute to the pronounced microplastic abundances at high northern latitudes.
The accumulation of large microplastics at depths at mid-latitudes matches plastic convergence zones observed by surface net tows and global models , suggesting that these zones extend deeper. Three-dimensional simulations of microplastic transport in the global ocean also affirms the persistence of subtropical microplastic convergence zones at certain water depths, showing that the structure of these accumulation zones in the gyres remains discernible down to 16 m and disappears at 60 m (ref. 87). Other models suggest that

within and outside the well-known accumulation zones in the top 100 m of the water column (Methods). The datasets are from refs. , which sampled microplastics at multiple depths at each station (represented by dark blue dots in Fig. 1a). Bold black horizontal lines within the coloured boxes represent the boxplot medians, while the top and bottom of the boxes indicate the 25th and 75th percentiles. The whiskers indicate the largest and smallest measured values within 1.5 interquartile ranges from the box. The asterisk indicates a statistically significant difference between small microplastics and large microplastics ( ). ‘NS’ indicates no difference ( ).
buoyant microplastics in the top 10 m of the water column follow the surface pattern, with high concentrations in mid-ocean gyres . Our analysis of large microplastics measured at multiple depths at each station in the subtropical gyres also supports this finding. Within the top 100 m , large microplastic abundances in accumulation zones are significantly higher than outside ( ; Fig. 2b). However, this difference is not found below 100 m (Extended Data Fig. 4). The existence of large microplastic patches in the near-surface waters can be mainly explained by a combination of wind-driven Ekman currents and prolonged residence of large microplastics in the upper water column . Taken together, accumulation zones of large microplastics extend into the oceanic water column, primarily constrained to the near-surface waters; a pattern not evident with small microplastics. Further research efforts are essential to constrain the subsurface boundaries of accumulation zones, characterize microplastics in each layer and assess their ecological impacts.

Plastic-carbon entering marine particulate carbon pool

Plastic debris represents a source of allochthonous carbon (C) to marine ecosystems. Subsurface microplastic-C has been estimated by calculating particle mass and multiplying it by the in the chemical formulas of common polymers . Our analysis shows that the ratio of microplastic-C to total particulate organic carbon (POC) increases with depth in subtropical gyres ( ; Extended Data Fig. 5). This is because of particulate organic matter is remineralized in the upper 500 m (ref. 96), compared with persistent plastic-C. The microplastic-C:POC ratio can reach up to at , reflecting shifts in the overall particulate composition. With the increasing plastic
leakage into the ocean, substantial long-term addition of microplastic-C to the marine POC pool is anticipated. Microplastic-C, utilized by marine microbes alongside metabolites and organic debris released by microbial processes , can influence biogeochemical cycles, such as nitrification and denitrification . However, plastic-C altering the marine POC pool has received little attention, necessitating further exploration, as marine POC is central to long-timescale carbon sequestration and biogeochemical cycling . In addition, -depleted plastic-C can interfere with -based age determinations by reducing the fraction of radioactive (ref. 99). A 5% contribution of plastic-C could make marine POC samples appear approximately 420 years older than their true apparent age. Plastic-C introduces additional complexity to the interpretation of already scarce deep-ocean data, complicating our understanding of ocean circulation, carbon cycling and past climate conditions . This calls for more plastic-C data and adjustments to models that predict or interpret deep-ocean levels.

A comparison of models with observations

Simulations increasingly explore the transport and fate of microplastics at different depths utilizing a variety of frameworks and parameters (Fig. 3a). Understanding how well these models reflect observed water-column microplastic patterns is key to elucidating dispersal mechanisms and identifying sources of error and uncertainty in subsurface microplastic estimates.
In most models, vertical microplastic transport is governed by wind-induced mixing and large-scale three-dimensional advection processes (Fig. 3a). However, submesoscale (1-10 km) dynamics, such as eddy-driven advection-which are critical for the downwards transport of small oceanic particles -are rarely parameterized . Including submesoscale dynamics in future models could improve our understanding of small microplastic vertical transport and its variability.
Similarly, biological processes, including biofouling, marine snow formation and faecal pellet production-which enhance the gravitational sinking of microplastics -are rarely taken into account . When included, these processes are often modelled using temperature-dependent remineralization rates and constant grazing rates. However, regional variations in ecosystem structure , which significantly influence rates, are generally omitted. In addition, biogenic minerals (for example, calcium carbonate, hydrated silica and celestite), known to be critical ballasting factors driving the absolute flux of sinking particles , are overlooked in all models. Models commonly assume that microplastics are spherical and buoyant particles (Fig. 3a), despite observations of both buoyant and dense plastics of varying shapes with large differences in surface area to volume ratios. Such parameterizations contribute to discrepancies between model outputs and observations. For example, although observations reveal subsurface maxima of microplastics from epipelagic to abyssal depths , some models suggest that most microplastics might only reach depths ranging from 150 m to on a global scale or within specific marine regimes . Similarly, models indicate limited or even an absence of transport of microplastics to polar regions .
The sparse and uncertain measurements (discussed below) of subsurface microplastics makes it difficult to accurately evaluate the model performance and other parameterizations. Despite these challenges, models consistently emphasize the role of microplastic size in influencing their vertical distribution, aligning with our analysis (Fig.1b,c). For example, in the eastern North Pacific Ocean, microplastic sizes decrease towards the gyre centre, a trend predicted by models and confirmed by observations . Similarly, in the Mediterranean, models predict that small water-column microplastics tend to reach the open ocean, primarily owing to the fast removal of large microplastics from coastal environments .
These results underscore the need for diverse empirical data on microplastics. Such data should include, but not be limited to, reliable
measurements of abundance and characteristics, environmentally relevant sinking rates, biofouling rates, incorporation-detachment rates from aggregates, and the structural integrity and degradation rates of plastic-laden aggregates. Data on zooplankton microplastic particle selection and ingestion, categorized by grazing strategy, would also be invaluable to improving estimates of faecal pellet transport.

Polymer composition of subsurface microplastics

Over 56 polymer types have been detected in our synthesized dataset (Supplementary Table 6). Buoyant polymers, constituting half of global plastic production , dominate the subsurface microplastics synthesized in this study (Fig. 3b). But subsurface microplastics denser than seawater are more abundant offshore than nearshore ( ; Fig. 3b), probably owing to their higher fragmentation susceptibility . Dense polymers typically have higher glass transition temperatures ( ) than buoyant plastics. is a critical parameter below which plastic becomes rigid and brittle, and above which it turns rubbery or viscous. This property increases the likelihood of surface erosion in dense polymers, leading to their fragmentation into smaller particles . Dense microplastics were found to be skewed towards smaller size fractions compared with buoyant ones in the North Pacific Subtropical Gyre .Considering this, certain processes could further expedite the fragmentation of dense plastics. Land-based dense plastic containers (for example, PET bottles), which can take years to reach offshore gyres , undergo extended weathering and degradation, intensifying their fragmentation. A study in the North Pacific Subtropical Gyre found that almost half of the plastics with identified production dates dated back to the twentieth century, showing decades-long persistence and potential for microplastic release. A significant rise in dense plastics such as nylon and polyester, often linked to fishing activity , is noted offshore and ; Fig. 3c). The atmosphere-ocean influx of microplastics, estimated to range from 0.013 million metric tons to 25 million metric tons annually , may also contribute, with polyester comprising a significant fraction of airborne microplastics .
Another notable finding is the apparent decline in the portions of buoyant polypropylene submerged in the water column compared with the apparent increase in polyethylene offshore ( and ; Fig. 3c), indicating faster polypropylene removal. Ultraviolet stability may contribute to polyethylene fragmenting less and remaining longer at sea, whereas the tertiary carbon in the polypropylene backbone makes it more vulnerable to abiotic degradation . Photodegradation experiments have documented that polypropylene fragments and produces dissolved organic carbon faster than polyethylene in seawater . These findings highlight the varying environmental degradation potential of different marine plastics.

Uncertainty sources and improvement strategies

Uncertainties in quantifying subsurface microplastics in the ocean water column stem from several factors. First, observational data on subsurface microplastics are modest and unevenly distributed owing to sampling challenges and time-consuming analysis. Compared with floating plastics , data on subsurface plastics remain limited (Fig. 1a). Variations in microplastic concentrations with depth underline the importance of obtaining higher-resolution depth-resolved samples. However, collecting microplastics at different depths requires specialized tools that are not always accessible to the research community (Extended Data Table 1). In addition, ship time is required for sufficient sampling with depth, creating a trade-off between maximizing depth versus horizontal sample resolution. Collectively, these factors contribute to observational data paucity, causing the uncertainties in estimating global patterns. Second, uncertainties arise from inconsistent analysis methodologies, as highlighted in
Fig. 3 | Comparison between the specifications of modelling studies and polymer compositions as functions of sampling locations. a, The available model parameters for simulating the transport, distribution and fate of microplastics in the three-dimensional ocean from refs. 34-36,45,46,61,87,95,101. Various model frameworks, including Lagrangian and Eulerian ocean models, and coupled Earth system models, have been used in research with different aims. These models incorporate different parameters influencing microplastic transport, such as plastic properties (for example, size, shape and density), oceanic physical processes (for example, mixing, advection and diffusion), biological factors (for example, biofouling, aggregation and faecal pellets), as well as scenarios of plastic inputs and spatial scales. b, Proportions of buoyant and dense microplastics in nearshore and offshore waters. Data were compiled
from 18 peer-reviewed papers on water-column microplastics that provided polymer compositions . Polymers with densities lower than natural seawater are defined as buoyant polymers whereas dense polymers have a density greater than natural seawater. c, Proportions of polyethylene, polypropylene, polyester and polyamide microplastics in the water column in nearshore and offshore. Bold black horizontal lines within the coloured boxes represent the boxplot medians, while the top and bottom of the boxes indicate the 25th and 75th percentiles. The whiskers indicate the largest and smallest measured values within 1.5 interquartile ranges from the box. The asterisk indicates the statistically significant differences among different polymer categories ( ).
Extended Data Table 1, and Supplementary Tables 2 and 3. Differences in sample collection, purification, particle size limit, polymer identification approaches and corresponding extrapolation can lead to divergent results. Moreover, particle loss or contamination during sample preprocessing and transport further compromises result robustness. Finally, data processing and reporting influence the accuracy and comparability of microplastic determinations. Variations in spectral collection approaches and libraries significantly affect the accuracy of microplastic identification . The main challenge in data reporting is the limited availability of original datasets detailing microplastic abundance, size and polymer type, hindering data standardization for meaningful comparison.
Enhancing sampling efforts and harmonizing methodologies are crucial steps to mitigate the existing uncertainties. Interdisciplinary collaboration and resource-sharing are essential, given the sampling challenges. Joint research cruises, multi-institutional collaborations and coordinated, targeted sampling campaigns can improve spatial coverage and depth resolution. Recent programmes on plastic pollution in coral-reef and freshwater ecosystems have yielded consistent datasets through global sample collection and standardized methods . Collaboration between scientists focused on marine particles research to standardize sampling strategies across multiple regions can greatly benefit water-column microplastic studies. Established marine particulate research protocols , such as trace-metal clean protocols, offer efficient procedures for sample collection and preservation. Sharing both new and archived particulate samples can enhance sample resolution for microplastic analysis. In addition, developing camera/optical-sensor-based techniques on autonomous platforms would enable continuous, high-resolution monitoring. For harmonized microplastic analysis, we recommend employing chemical imaging (for example, -FTIR imaging) followed by semi-automated data analysis with open-source reference spectrum libraries to identify particles smaller than in each sample without subsampling. This minimizes human bias and allows for effective identification and quantification of microplastics down to . For large microplastics, -Raman/FTIR combined with visual microscopic inspection can be applied for single-particle analysis, requiring no specific sample preparation or advanced skills. Besides improving observational coverage, refining current models and incorporating new parameterizations are necessary to enhance confidence in global projections of microplastic distributions across depths.

Conclusion

Microplastics in the ocean are mostly irretrievable and persistent . Our synthesis of subsurface microplastic observations over a 10-year period generates a global benchmark (Table 1). Despite observational uncertainties, the substantial presence of subsurface microplastics in both nearshore and offshore waters underscores the ocean water column as a critical yet uncharacterized reservoir of plastics. Small microplastics show a gradual decrease in abundance with depth, suggesting a more uniform distribution and longer lifespan in the water column, whereas large microplastics are more effectively trapped by stratification. Offshore surface accumulation zones extend into subsurface waters but are primarily composed of large microplastics. Such size-dependent transport patterns align with existing models . The prolonged presence and accumulation of microplastics pose risks to the marine biome, where substantial knowledge gaps persist , and may impact biogeochemical cycles and isotopic measurements. This analysis highlights the urgent need for consistent methodologies, finer-scale investigations and broader international coordination to establish comprehensive, long-term monitoring and more accurate model projections. These efforts will improve understanding of microplastic dispersion, fate and impacts, aiding in formulating effective policies and management strategies.

Online content

Any methods, additional references, Nature Portfolio reporting summaries, source data, extended data, supplementary information, acknowledgements, peer review information; details of author contributions and competing interests; and statements of data and code availability are available at https://doi.org/10.1038/s41586-025-08818-1.
  1. Thompson, R. C. et al. Twenty years of microplastic pollution research-what have we learned? Science 386, eadl2746 (2024).
  2. Eriksen, M. et al. A growing plastic smog, now estimated to be over 170 trillion plastic particles afloat in the world’s oceans-urgent solutions required. PLoS ONE 18, e0281596 (2023).
  3. Zhao, S. et al. Large quantities of small microplastics permeate the surface ocean to abyssal depths in the South Atlantic Gyre. Glob. Change Biol. 28, 2991-3006 (2022).
  4. Tekman, M. B. et al. Tying up loose ends of microplastic pollution in the Arctic: distribution from the sea surface through the water column to deep-sea sediments at the HAUSGARTEN observatory. Environ. Sci. Technol. 54, 4079-4090 (2020).
  5. Isobe, A. et al. A multilevel dataset of microplastic abundance in the world’s upper ocean and the Laurentian Great Lakes. Microplast. Nanoplast. 1, 16 (2021).
  6. Egger, M., Sulu-Gambari, F. & Lebreton, L. First evidence of plastic fallout from the North Pacific Garbage Patch. Sci. Rep. 10, 7495 (2020).
  7. Villarrubia-Gómez, P., Cornell, S. E. & Fabres, J. Marine plastic pollution as a planetary boundary threat-the drifting piece in the sustainability puzzle. Mar. Policy 96, 213-220 (2018).
  8. Reddy, S. & Lau, W. Breaking the Plastic Wave: A Comprehensive Assessment of Pathways Towards Stopping Ocean Plastic Pollution (PEW Charitable Trusts, 2020).
  9. Law, K. L. Plastics in the marine environment. Ann. Rev. Mar. Sci. 9, 205-229 (2017).
  10. MacLeod, M., Arp, H. P. H., Tekman, M. B. & Jahnke, A. The global threat from plastic pollution. Science 373, 61-65 (2021).
  11. Andrady, A. L. The plastic in microplastics: a review. Mar. Pollut. Bull. 119, 12-22 (2017).
  12. Rochman, C. M. et al. Rethinking microplastics as a diverse contaminant suite. Environ. Toxicol. Chem. 38, 703-711 (2019).
  13. Van Sebille, E. et al. The physical oceanography of the transport of floating marine debris. Environ. Res. Lett. 15, 023003 (2020).
  14. Kane, I. A. et al. Seafloor microplastic hotspots controlled by deep-sea circulation. Science 368, 1140-1145 (2020).
  15. Ross, P. S. et al. Pervasive distribution of polyester fibres in the Arctic Ocean is driven by Atlantic inputs. Nat. Commun. 12, 106 (2021).
  16. Pabortsava, K. & Lampitt, R. S. High concentrations of plastic hidden beneath the surface of the Atlantic Ocean. Nat. Commun. 11, 4073 (2020).
  17. Lal, D. The oceanic microcosm of particles: suspended particulate matter, about 1 gram in 100 tons of seawater, plays a vital role in ocean chemistry. Science 198, 997-1009 (1977).
  18. IPCC: Summary for Policymakers. In Climate Change 2021: The Physical Science Basis (eds Masson-Delmotte, V. et al.) (Cambridge Univ. Press, 2021).
  19. Boyd, P. W., Claustre, H., Levy, M., Siegel, D. A. & Weber, T. Multi-faceted particle pumps drive carbon sequestration in the ocean. Nature 568, 327-335 (2019).
  20. Galloway, T. S., Cole, M. & Lewis, C. Interactions of microplastic debris throughout the marine ecosystem. Nat. Ecol. Evol. 1, 0116 (2017).
  21. Ziervogel, K. et al. Microbial interactions with microplastics: Insights into the plastic carbon cycle in the ocean. Mar. Chem. 262, 104395 (2024).
  22. Galgani, L. et al. Hitchhiking into the deep: how microplastic particles are exported through the biological carbon pump in the North Atlantic Ocean. Environ. Sci. Technol. 56, 15638-15649 (2022).
  23. Law, K. L. & Rochman, C. M. Large-scale collaborations uncover global extent of plastic pollution. Nature 169, 254-255 (2023).
  24. Koelmans, A. A. et al. Risk assessment of microplastic particles. Nat. Rev. Mater. 7, 138-152 (2022).
  25. Zhao, S., Mincer, T. J., Lebreton, L. & Egger, M. Pelagic microplastics in the North Pacific Subtropical Gyre: a prevalent anthropogenic component of the particulate organic carbon pool. PNAS Nexus 2, pgadO7O (2023).
  26. Primpke, S. et al. Critical assessment of analytical methods for the harmonized and cost-efficient analysis of microplastics. Appl. Spectrosc. 74, 1012-1047 (2020).
  27. Peeken, I. et al. Arctic sea ice is an important temporal sink and means of transport for microplastic. Nat. Commun. 9, 1505 (2018).
  28. Obbard, R. W. et al. Global warming releases microplastic legacy frozen in Arctic Sea ice. Earths Future 2, 315-320 (2014).
  29. Roscher, L. et al. Microplastic pollution in the Weser Estuary and the German North Sea. Environ. Pollut. 288, 117681 (2021).
  30. Abel, S. M., Primpke, S., Int-Veen, I., Brandt, A. & Gerdts, G. Systematic identification of microplastics in abyssal and hadal sediments of the Kuril Kamchatka Trench. Environ. Pollut. 269, 116095 (2021).
  31. Courtene-Jones, W., van Gennip, S., Penicaud, J., Penn, E. & Thompson, R. C. Synthetic microplastic abundance and composition along a longitudinal gradient traversing the subtropical gyre in the North Atlantic Ocean. Mar. Pollut. Bull. 185, 114371 (2022).
  32. Molazadeh, M. et al. The role of turbulence in the deposition of intrinsically buoyant MPs. Sci. Total Environ. 911, 168540 (2024).
  33. Song, Y. K. et al. Horizontal and vertical distribution of microplastics in Korean coastal waters. Environ. Sci. Technol. 52, 12188-12197 (2018).
  34. Kvale, K., Prowe, A. F., Chien, C.-T., Landolfi, A. & Oschlies, A. The global biological microplastic particle sink. Sci Rep. 10, 16670-1 (2020).
  35. Klink, D., Peytavin, A. & Lebreton, L. Size dependent transport of floating plastics modeled in the global ocean. Front. Mar. Sci. 9, 903134 (2022).
  36. Mountford, A. & Morales Maqueda, M. Eulerian modeling of the three-dimensional distribution of seven popular microplastic types in the global ocean. J. Geophys. Res. Oceans 124, 8558-8573 (2019).
  37. Van Sebille, E. et al. A global inventory of small floating plastic debris. Environ. Res. Lett. 10, 124006 (2015).
  38. Amenábar, M. et al. Spatial distribution of microplastics in a coastal upwelling region: offshore dispersal from urban sources in the Humboldt Current System. Environ. Pollut. 343, 123157 (2024).
  39. Cael, B., Cavan, E. L. & Britten, G. L. Reconciling the size-dependence of marine particle sinking speed. Geophys. Res. Lett. 48, e2020GL091771 (2021).
  40. Armbrust, E. V. The life of diatoms in the world’s oceans. Nature 459, 185-192 (2009).
  41. Amaral-Zettler, L. A., Zettler, E. R. & Mincer, T. J. Ecology of the plastisphere. Nat. Rev. Microbiol. 18, 139-151 (2020).
  42. Amaral-Zettler, L. A., Zettler, E. R., Mincer, T. J., Klaassen, M. A. & Gallager, S. M. Biofouling impacts on polyethylene density and sinking in coastal waters: a macro/micro tipping point? Water Res. 201, 117289 (2021).
  43. Sun, X.-F., Zhang, Y., Xie, M.-Y., Mai, L. & Zeng, E. Y. Calcite carbonate sinks low-density plastic debris in open oceans. Nat. Commun. 15, 4837 (2024).
  44. Egger, M. et al. A spatially variable scarcity of floating microplastics in the eastern North Pacific Ocean. Environ. Res. Lett. 15, 114056 (2020).
  45. Lobelle, D. et al. Global modeled sinking characteristics of biofouled microplastic. J. Geophys. Res. Oceans 126, e2020JC017098 (2021).
  46. Fischer, R. et al. Modelling submerged biofouled microplastics and their vertical trajectories. Biogeosciences 19, 2211-2234 (2022).
  47. Reineccius, J. & Waniek, J. J. First long-term evidence of microplastic pollution in the deep subtropical Northeast Atlantic. Environ. Pollut. 305, 119302 (2022).
  48. Reineccius, J. et al. Abundance and characteristics of microfibers detected in sediment trap material from the deep subtropical North Atlantic Ocean. Sci. Total Environ. 738, 140354 (2020).
  49. Alurralde, G. et al. Anthropogenic microfibres flux in an Antarctic coastal ecosystem: the tip of an iceberg? Mar. Pollut. Bull. 175, 113388 (2022).
  50. Rowlands, E. et al. Vertical flux of microplastic, a case study in the Southern Ocean, South Georgia. Mar. Pollut. Bull. 193, 115117 (2023).
  51. Mateos-Cárdenas, A., Wheeler, A. J. & Lim, A. Microplastics and cellulosic microparticles in North Atlantic deep waters and in the cold-water coral Lophelia pertusa. Mar. Pollut. Bull. 206, 116741 (2024).
  52. Zhang, X., Liu, Z., Li, D., Zhao, Y. & Zhang, Y. Turbidity currents regulate the transport and settling of microplastics in a deep-sea submarine canyon. Geology 52, 646-650 (2024).
  53. Ikenoue, T., Nakajima, R., Osafune, S., Siswanto, E. & Honda, M. C. Vertical flux of microplastics in the deep subtropical Pacific Ocean: moored sediment-trap observations within the Kuroshio Extension Recirculation Gyre. Environ. Sci. Technol. 58, 16121-16130 (2024).
  54. Lam, P. J., Doney, S. C. & Bishop, J. K. The dynamic ocean biological pump: Insights from a global compilation of particulate organic carbon, , and opal concentration profiles from the mesopelagic. Glob. Biogeochem. Cycles 25, GB3009 (2011).
  55. Enders, K., Lenz, R., Stedmon, C. A. & Nielsen, T. G. Abundance, size and polymer composition of marine microplastics in the Atlantic Ocean and their modelled vertical distribution. Mar. Pollut. Bull. 100, 70-81 (2015).
  56. Gunaalan, K. et al. Does water column stratification influence the vertical distribution of microplastics? Environ. Pollut. 340, 122865 (2024).
  57. Kooi, M., Nes, E. H. V., Scheffer, M. & Koelmans, A. A. Ups and downs in the ocean: effects of biofouling on vertical transport of microplastics. Environ. Sci. Technol. 51, 7963-7971 (2017).
  58. Dittmar, S., Ruhl, A. S., Altmann, K. & Jekel, M. Settling velocities of small microplastic fragments and fibers. Environ. Sci. Technol. 58, 6359-6369 (2024).
  59. Kaiser, D., Estelmann, A., Kowalski, N., Glockzin, M. & Waniek, J. J. Sinking velocity of sub-millimeter microplastic. Mar. Pollut. Bull. 139, 214-220 (2019).
  60. Egger, M. et al. Pelagic distribution of plastic debris ( ) and marine organisms in the upper layer of the North Atlantic Ocean. Sci. Rep. 12, 13465 (2022).
  61. Onink, V., Kaandorp, M. L., van Sebille, E. & Laufkötter, C. Influence of particle size and fragmentation on large-scale microplastic transport in the Mediterranean Sea. Environ. Sci. Technol. 56, 15528-15540 (2022).
  62. Hidalgo-Ruz, V., Gutow, L., Thompson, R. C. & Thiel, M. Microplastics in the marine environment: a review of the methods used for identification and quantification. Environ. Sci. Technol. 46, 3060-3075 (2012).
  63. Wright, R. J., Erni-Cassola, G., Zadjelovic, V., Latva, M. & Christie-Oleza, J. A. Marine plastic debris: a new surface for microbial colonization. Environ. Sci. Technol. 54, 11657-11672 (2020).
  64. Zhao, S., Zettler, E. R., Amaral-Zettler, L. A. & Mincer, T. J. Microbial carrying capacity and carbon biomass of plastic marine debris. ISME J. 15, 67-77 (2021).
  65. Doostmohammadi, A., Stocker, R. & Ardekani, A. M. Low-Reynolds-number swimming at pycnoclines. Proc. Natl Acad. Sci. USA 109, 3856-3861 (2012).
  66. MacIntyre, S., Alldredge, A. L. & Gotschalk, C. C. Accumulation of marines now at density discontinuities in the water column. Limnol. Oceanogr. 40, 449-468 (1995).
  67. Uurasjärvi, E., Pääkkönen, M., Setälä, O., Koistinen, A. & Lehtiniemi, M. Microplastics accumulate to thin layers in the stratified Baltic Sea. Environ. Pollut. 268, 115700 (2021).
  68. Zobkov, M., Esiukova, E., Zyubin, A. & Samusev, I. Microplastic content variation in water column: the observations employing a novel sampling tool in stratified Baltic Sea. Mar. Pollut. Bull. 138, 193-205 (2019).
  69. Manullang, C. Y. et al. Vertical distribution of microplastic along the main gate of Indonesian Throughflow pathways. Mar. Pollut. Bull. 199, 115954 (2024).
  70. Zhou, Q. et al. Trapping of microplastics in halocline and turbidity layers of the semienclosed Baltic Sea. Front. Mar. Sci. 8, 761566 (2021).
  71. Carlotti, F. et al. Microplastics in the maximum chlorophyll layer along a north-south transect in the Mediterranean Sea in comparison with zooplankton concentrations. Mar. Pollut. Bull. 196, 115614 (2023).
  72. Choy, C. A. et al. The vertical distribution and biological transport of marine microplastics across the epipelagic and mesopelagic water column. Sci. Rep. 9, 7843 (2019).
  73. Ardekani, A. & Stocker, R. Stratlets: low Reynolds number point-force solutions in a stratified fluid. Phys. Rev. Lett. 105, 084502 (2010).
  74. Yick, K. Y., Torres, C. R., Peacock, T. & Stocker, R. Enhanced drag of a sphere settling in a stratified fluid at small Reynolds numbers. J. Fluid Mech. 632, 49-68 (2009).
  75. Mrokowska, M. M. Influence of pycnocline on settling behaviour of non-spherical particle and wake evolution. Sci. Rep. 10, 20595 (2020).
  76. Zhang, M., Xu, D., Liu, L., Wei, Y. & Gao, B. Vertical differentiation of microplastics influenced by thermal stratification in a deep reservoir. Environ. Sci. Technol. 57, 6999-7008 (2023).
  77. Li, C., Zhu, L., Wang, X., Liu, K. & Li, D. Cross-oceanic distribution and origin of microplastics in the subsurface water of the South China Sea and Eastern Indian Ocean. Sci. Total Environ. 805, 150243 (2022).
  78. Zhdanov, I. et al. Differences in the fate of surface and subsurface microplastics: a case study in the Central Atlantic. J. Mar. Sci. Eng. 11, 210 (2023).
  79. Zhang, S. et al. Distribution characteristics of microplastics in surface and subsurface Antarctic seawater. Sci. Total Environ. 838, 156051 (2022).
  80. Morgana, S. et al. Microplastics in the Arctic: a case study with sub-surface water and fish samples off Northeast Greenland. Environ. Pollut. 242, 1078-1086 (2018).
  81. Pakhomova, S. et al. Microplastic variability in subsurface water from the Arctic to Antarctica. Environ. Pollut. 298, 118808 (2022).
  82. Lusher, A. L., Tirelli, V., O’Connor, I. & Officer, R. Microplastics in Arctic polar waters: the first reported values of particles in surface and sub-surface samples. Sci. Rep. 5, 14947 (2015).
  83. Kanhai, L. D. K. et al. Microplastics in sub-surface waters of the Arctic Central Basin. Mar. Pollut. Bull. 130, 8-18 (2018).
  84. Kanhai, L. D. K., Officer, R., Lyashevska, O., Thompson, R. C. & O’Connor, I. Microplastic abundance, distribution and composition along a latitudinal gradient in the Atlantic Ocean. Mar. Pollut. Bull. 115, 307-314 (2017).
  85. Lusher, A. L., Burke, A., O’Connor, I. & Officer, R. Microplastic pollution in the Northeast Atlantic Ocean: validated and opportunistic sampling. Mar. Pollut. Bull. 88, 325-333 (2014).
  86. Yakushev, E. et al. Microplastics distribution in the Eurasian Arctic is affected by Atlantic waters and Siberian rivers. Commun. Earth Environ. 2, 23 (2021).
  87. Wichmann, D., Delandmeter, P. & van Sebille, E. Influence of near-surface currents on the global dispersal of marine microplastic. J.Geophys. Res. Oceans 124, 6086-6096 (2019).
  88. Bergmann, M. et al. Plastic pollution in the Arctic. Nat. Rev. Earth Environ. 3, 323-337 (2022).
  89. Eriksen, M. et al. Plastic pollution in the world’s oceans: more than 5 trillion plastic pieces weighing over 250,000 tons afloat at sea. PLoS ONE 9, e111913 (2014).
  90. Cózar, A. et al. Plastic debris in the open ocean. Proc. Natl Acad. Sci. USA 111, 10239-10244 (2014).
  91. Law, K. L. et al. Plastic accumulation in the North Atlantic subtropical gyre. Science 329, 1185-1188 (2010).
  92. Lebreton, L.-M., Greer, S. & Borrero, J. C. Numerical modelling of floating debris in the world’s oceans. Mar. Pollut. Bull. 64, 653-661(2012).
  93. Maximenko, N., Hafner, J. & Niiler, P. Pathways of marine debris derived from trajectories of Lagrangian drifters. Mar. Pollut. Bull. 65, 51-62 (2012).
  94. Van Sebille, E., England, M. H. & Froyland, G. Origin, dynamics and evolution of ocean garbage patches from observed surface drifters. Environ. Res. Lett. 7, 044040 (2012).
  95. Huck, T. et al. Three-dimensional dispersion of neutral “plastic” particles in a global ocean model. Front. Anal. Sci. 2, 868515 (2022).
  96. Karl, D. M., Knauer, G. A. & Martin, J. H. Downward flux of particulate organic matter in the ocean: a particle decomposition paradox. Nature 332, 438-441 (1988).
  97. Vaksmaa, A. et al. Polyethylene degradation and assimilation by the marine yeast Rhodotorula mucilaginosa. ISME Commun. 3, 68 (2023).
  98. Seeley, M. E., Song, B., Passie, R. & Hale, R. C. Microplastics affect sedimentary microbial communities and nitrogen cycling. Nat. Commun. 11, 2372 (2020).
  99. Libby, W. F. Radiocarbon dating: the method is of increasing use to the archeologist, the geologist, the meteorologist, and the oceanographer. Science 133, 621-629 (1961).
  100. Heaton, T. J. et al. Radiocarbon: a key tracer for studying Earth’s dynamo, climate system, carbon cycle, and Sun. Science 374, eabd7096 (2021).
  101. Bajon, R. et al. Influence of waves on the three-dimensional distribution of plastic in the ocean. Mar. Pollut. Bull. 187, 114533 (2023).
  102. Lima, I. D., Lam, P. J. & Doney, S. C. Dynamics of particulate organic carbon flux in a global ocean model. Biogeosciences 11, 1177-1198 (2014).
  103. Bagaev, A., Khatmullina, L. & Chubarenko, I. Anthropogenic microlitter in the Baltic Sea water column. Mar. Pollut. Bull. 129, 918-923 (2018).
  104. Geyer, R., Jambeck, J. R. & Law, K. L. Production, use, and fate of all plastics ever made. Sci. Adv. 3, e1700782 (2017).
  105. Min, K., Cuiffi, J. D. & Mathers, R. T. Ranking environmental degradation trends of plastic marine debris based on physical properties and molecular structure. Nat. Commun. 11, 727 (2020).
  106. Maximenko, N., Hafner, J., Kamachi, M. & MacFadyen, A. Numerical simulations of debris drift from the Great Japan Tsunami of 2011 and their verification with observational reports. Mar. Pollut. Bull. 132, 5-25 (2018).
  107. Gennip, S. J. V. et al. In search for the sources of plastic marine litter that contaminates the Easter Island ecoregion. Sci. Rep. 9, 19662 (2019).
  108. Lebreton, L. et al. Industrialised fishing nations largely contribute to floating plastic pollution in the North Pacific subtropical gyre. Sci. Rep. 12, 12666 (2022).
  109. Allen, D. et al. Microplastics and nanoplastics in the marine-atmosphere environment. Nat. Rev. Earth Environ. 3, 393-405 (2022).
  110. Ortega, D. E. & Cortés-Arriagada, D. Atmospheric microplastics and nanoplastics as vectors of primary air pollutants-a theoretical study on the polyethylene terephthalate (PET) case. Environ. Pollut. 318, 120860 (2023).
  111. Gewert, B., Plassmann, M. M. & MacLeod, M. Pathways for degradation of plastic polymers floating in the marine environment. Environ. Sci. Process. Impacts 17, 1513-1521 (2015).
  112. Zhu, L., Zhao, S., Bittar, T. B., Stubbins, A. & Li, D. Photochemical dissolution of buoyant microplastics to dissolved organic carbon: rates and microbial impacts. J. Hazard. Mater. 383, 121065 (2020).
  113. Delre, A. et al. Plastic photodegradation under simulated marine conditions. Mar. Pollut. Bull. 187, 114544 (2023).
  114. De Frond, H. et al. What determines accuracy of chemical identification when using microspectroscopy for the analysis of microplastics? Chemosphere 313, 137300 (2023).
  115. Pinheiro, H. T. et al. Plastic pollution on the world’s coral reefs. Nature 619, 311-316 (2023).
  116. Nava, V. et al. Plastic debris in lakes and reservoirs. Nature 619, 317-322 (2023).
  117. Hurd, D. C. & Spencer, D. W. (eds) Marine Particles: Analysis and Characterization Geophysical Monograph Series Vol. 63 (AGU, 1991).
  118. Primpke, S., Lorenz, C., Rascher-Friesenhausen, R. & Gerdts, G. An automated approach for microplastics analysis using focal plane array (FPA) FTIR microscopy and image analysis. Anal. Methods 9, 1499-1511 (2017).
  119. Cowger, W. et al. Microplastic spectral classification needs an open source community: open specy to the rescue! Anal. Chem. 93, 7543-7548 (2021).
  120. Primpke, S. et al. Toward the systematic identification of microplastics in the environment: evaluation of a new independent software tool (siMPle) for spectroscopic analysis. Appl. Spectrosc. 74, 1127-1138 (2020).
  121. Materić, D., Holzinger, R. & Niemann, H. Nanoplastics and ultrafine microplastic in the Dutch Wadden Sea-the hidden plastics debris? Sci. Total Environ. 846, 157371 (2022).
  122. Kukulka, T., Proskurowski, G., Morét-Ferguson, S., Meyer, D. W. & Law, K. L. The effect of wind mixing on the vertical distribution of buoyant plastic debris. Geophys. Res. Lett. 39, L07601 (2012).
  123. Cole, M. et al. Microplastics alter the properties and sinking rates of zooplankton faecal pellets. Environ. Sci. Technol. 50, 3239-3246 (2016).
  124. Bohdan, K. Estimating global marine surface microplastic abundance: systematic literature review. Sci. Total Environ. 832, 155064 (2022).
  125. Lebreton, L. The status and fate of oceanic garbage patches. Nat. Rev. Earth Environ. 3, 730-732 (2022).
  126. Wang, X., Zhu, L., Liu, K. & Li, D. Prevalence of microplastic fibers in the marginal sea water column off southeast China. Sci. Total Environ. 804, 150138 (2022).
  127. Ding, J. et al. Microplastics in the coral reef systems from Xisha Islands of South China Sea. Environ. Sci. Technol. 53, 8036-8046 (2019).
  128. Dai, Z. et al. Occurrence of microplastics in the water column and sediment in an inland sea affected by intensive anthropogenic activities. Environ. Pollut. 242, 1557-1565 (2018).
  129. Cordova, M. & Hernawan, U. Microplastics in Sumba waters, East Nusa Tenggara. In IOP Conference Series: Earth and Environmental Science Vol. 162, 012023 (IOP, 2018).
  130. Oztekin, A. & Bat, L. Microlitter pollution in sea water: a preliminary study from Sinop Sarikum coast of the southern Black Sea. Turkish J. Fish. Aquat. Sci. 17, 1431-1440 (2017).
  131. Li, D. et al. Profiling the vertical transport of microplastics in the West Pacific Ocean and the East Indian Ocean with a novel in situ filtration technique. Environ. Sci. Technol. 54, 12979-12988 (2020).
  132. Reisser, J. et al. The vertical distribution of buoyant plastics at sea: an observational study in the North Atlantic Gyre. Biogeosciences 12, 1249-1256 (2015).
  133. Wiesinger, H., Wang, Z. & Hellweg, S. Deep dive into plastic monomers, additives, and processing aids. Environ. Sci. Technol. 55, 9339-9351(2021).
Publisher’s note Springer Nature remains neutral with regard to jurisdictional claims in published maps and institutional affiliations.
Open Access This article is licensed under a Creative Commons Attribution-NonCommercial-NoDerivatives 4.0 International License, which permits any non-commercial use, sharing, distribution and reproduction in any medium or format, as long as you give appropriate credit to the original author(s) and the source, provide a link to the Creative Commons licence, and indicate if you modified the licensed material. You do not have permission under this licence to share adapted material derived from this article or parts of it. The images or other third party material in this article are included in the article’s Creative Commons licence, unless indicated otherwise in a credit line to the material. If material is not included in the article’s Creative Commons licence and your intended use is not permitted by statutory regulation or exceeds the permitted use, you will need to obtain permission directly from the copyright holder. To view a copy of this licence, visit http:// creativecommons.org/licenses/by-nc-nd/4.0/.
(c) The Author(s) 2025

Methods

Categorization

Small and large microplastics. Our analysis categorizes microplastics into two size class, small ( ) and large ( ), based on previous laboratory and field analyses, as well as modelling results . Experimental evidence and mathematical models indicate that the relationship between settling velocity and particle size is described by quadratic linear regression, despite the influence of particle shape and density . Once marine sinking particles and microplastics decrease below , the settling velocities of different plastic polymers converge, typically differing by less than one order of magnitude (see Fig. 1 in ref. 39, Fig. 2 in ref. 59 and Fig. 3 in ref. 58). In addition, particles under are less affected by the omnipresent density stratification, which generally hinders particle vertical motion . Numerous modelling studies on the vertical transport of microplastics have demonstrated distinct behaviours for particles smaller than compared with large particles . Finally, field observations, using advanced identification techniques such as chemical imaging, further confirm that microplastics smaller than dominate marine plastic debris globally, accounting for up to of total plastic particles .
Using ‘ as the reference depth for large-microplastics accumulation zone at depth. We identify subsurface microplastic accumulation in the depth range, where measurements from one reference were collected at a single depth (shown as light blue dots in Fig. 1a,b). Elevated subsurface microplastic abundances at depth at mid-latitudes corresponds to well-documented surface convergence zones at the sea surface within subtropical gyres . This surface accumulation zone is reflected in our study, where floating microplastics of a comparable size fraction were collected at depth with surface net tows (Fig. 1a,b). Data from the range are absent owing to discontinuities in sample collections along the water depth in the literature. This indicates that plastic accumulation zones stretch from the surface into the ocean water column. The existence of patches of large microplastics in the near-surface waters is mainly attributed to a combination of wind-driven Ekman currents and prolonged residence in the upper water layers enabled by the strong buoyancy of large-sized plastics .
To investigate whether datasets from studies collecting subsurface microplastics from multiple depths per station (dark blue dots in Fig.1a) could support our finding, we compare the abundances of microplastics across two categories: (1) large versus small microplastics; and (2) abundances above or below the water depth of 100 m . We chose 100 m as the lower boundary for the following reasons: (1) the upper layer is where the majority of wind-driven mixing occurs ; and (2) the lower boundary of the sunlit euphotic zone is at 100 m , a depth typically used as a reference for assessing the POC flux via the ocean’s biological carbon pump. Below 100 m , the consumption of organic-matter-associated particles varies significantly between oceanic provinces . As biological processes are one of the main mechanisms for the vertical transport of microplastics, using 100 m as the boundary allows us to constrain variations in the biological factors when comparing microplastic abundances.
Search term. We acknowledge the possibility of inadvertent omissions. To ensure thoroughness in retrieving scientific articles containing quantitative subsurface microplastics data into the oceanic water column, the following search pattern was constructed for Web of Science (www.webofscience.com):
TS=(microplastic$ or microlitter or “micro plastic$” or “plastic particle$” or “plastic fragments” or “resin pellet$” or “plastic particle$”) and TS = (subsurface$ or subsurface$ or vertical$ or water column$) and marine or ocean$ or sea or seawater or coast$).
Inclusion and exclusion criteria for literature studies on subsurface microplastics. The estimates of microplastics in the water column show considerable variability, primarily stemming from inconsistent methodologies and human errors. To construct a robust dataset, this study focuses exclusively on research targeting subsurface microplastics with clearly defined sampling depths.
Spectroscopy identification methods, such as Raman or FTIR, are widely used and offer a robust approach for microplastic analysis. Visual differentiation of particles smaller than using optical microscopy alone is considered unreliable . Studies relying solely on this method without spectroscopy (for example, Raman or FTIR) for plastics smaller than were excluded. Studies with incomplete methodological descriptions-such as missing details on identification techniques, filter pore size or mesh specifications-were followed up with email enquiries. Articles were excluded if essential details were not provided in the response.
Detailed methodologies are available in Extended Data Table 1, and Supplementary Tables 2 and 3.

Data collection

For each study meeting the inclusion criteria, details such as mesh size, microplastic concentration, particle size distribution, sampling coordinates and sampling time were extracted into a spreadsheet. When this information was not directly available, data were obtained from maps and graphics within the articles using the ‘WebPlotDigitizer’ tool (https://github.com/ankitrohatgi/WebPlotDigitizer) to address data gaps. If no maps or graphics provided the required information, an email was sent to the corresponding author. Articles were excluded if no response was received with the necessary data. The complete dataset is publicly available in the ‘Source data’.

Curating data to compare microplastics at depths of 1-60 m with those floating at the sea surface

For robust comparisons between microplastics in subsurface waters and those at the sea surface within the upper layer (dataset from ref. 5), our analysis exclusively focuses on large microplastics. Floating microplastics at the sea surface are primarily sampled using surface net trawls with mesh sizes ranging from to (ref. 5). Therefore, microplastic concentrations in size fractions above collected in near-surface waters were extracted from reviewed articles based on plastic size distribution data to facilitate the global comparisons. This refined dataset of microplastics in near-surface waters ( ) comprises three size fractions: ( ) of particles of particles , and of particles . The detailed information on the size fraction of microplastics in near-surface waters ( ) is summarized in Supplementary Table 2. This approach also minimizes inconsistencies in the synthesized data collected from different projects, as some include fibrous microplastics in their estimates whereas others do not.

Building microplastic abundance distribution models

We fitted two GAMs to analyse the adjusted microplastic abundances in near-surface waters ( ) and the floating microplastic abundances along the latitude gradient. To quantify prediction uncertainty, we employed a Monte Carlo simulation with 1,000 iterations. In each iteration, we resampled the data with replacement, fitted a GAM and predicted density values for 1,000 equally spaced latitude points. This process was repeated 1,000 times, generating a distribution of predictions. For each latitude, we calculated the mean and standard deviation of the predicted values to estimate central tendencies and uncertainties. This approach ensures robust predictions with uncertainty estimates across various resampling scenarios.

Power-law function for subsurface microplastic abundance profiles

A simple vertical model was built to replicate the observed plastic debris profiles in the water column of each study. This model is based on the measured relationship between microplastic abundances and water depth (Fig. 1c,d). In this approach, microplastic abundance is calculated as a function of water depth using the following equation: Abundance , where and represent the slope and intercept of the regression line obtained from the log-log plot of observed microplastics abundances against water depth.

Comparison of microplastic-C to total POC

The ratios of microplastic-C to total POC were measured in both the North Atlantic and North Pacific Subtropical gyres . In the North Pacific, microplastic-C was estimated from in situ pump samples. The estimation process involved calculating particle mass based on polymer density and size (identified via -FTIR). This mass was then multiplied by the carbon content percentage ( ) of each polymer’s chemical formula. Total POC data came from three stations in the North Pacific. At two of these stations, samples were filtered using glass fibre filters at 6 depths in August 2017 using in situ pumps, with POC calculated as the difference between total carbon and particulate inorganic carbon . In addition, the total POC at ALOHA station was calculated by multiplying the total particulate carbon (TC) by the empirical POC:TC ratio (about ), which was measured at Station ALOHA . The total particulate carbon data at Station ALOHA were from bottle samples at 10 different depths (from 5 m to 350 m ) collected on 16 November 2018 during the cruise KM 18-21 (http://hahana.soest. hawaii.edu/hot/hot_jgofs.html). In the North Atlantic, microplastic-C was calculated using data from drifting sediment traps. Plastic mass in the traps was determined via pyrolysis gas chromatography-mass spectrometry, with carbon content based on each polymer’s chemical formula. POC was measured from aliquots filtered onto combusted GF/F filters, which were exposed to fuming hydrochloric acid to remove carbonates. The dried filters were then analysed with an elemental analyser using an acetanilide standard. For more details on the method, the reader is referred to studies . Finally, a log-log regression model is constructed to predict the relationship between microplastic-C and total POC as a function of water depth.

Statistical analysis

As the datasets were not normally distributed (Kolmogorov-Smirnov test) and lacked homogeneity of variances (Levene’s test), the KruskalWallis test, a non-parametric method, was used for multiple comparisons. When significant, pairwise comparisons were conducted with the Mann-Whitney-Wilcoxon test.Statistical significance was determined at . In addition, the mgcv, MASS and boot packages were used
to fit the GAM, run the Monte Carlo simulations and do the bootstrap analysis. All statistical analyses and visualizations were performed using software (v.3.4.3, Development Core Team).

Data availability

All data supporting the findings of this study are available at https:// doi.org/10.6084/m9.figshare. 28157324 (ref.137).
134. Buesseler, K. O., Boyd, P. W., Black, E. E. & Siegel, D. A. Metrics that matter for assessing the ocean biological carbon pump. Proc. Natl Acad. Sci. USA 117, 9679-9687 (2020).
135. Subhas, A. V., Adkins, J. F., Dong, S., Rollins, N. E. & Berelson, W. M. The carbonic anhydrase activity of sinking and suspended particles in the North Pacific Ocean. Limnol. Oceanogr. 65, 637-651 (2020).
136. Umhau, B. P. et al. Seasonal and spatial changes in carbon and nitrogen fluxes estimated using : disequilibria in the North Pacific tropical and subtropical gyre. Mar. Chem. 217, 103705 (2019).
137. Zhao, S. Datasets for submerged microplastics in the ocean. figshare https://doi.org/ 10.6084/m9.figshare. 28157324 (2025).
Acknowledgements We thank E. van Sebille for advice. The following funding sources are acknowledged: L.A.A.-Z. and E.R.Z. acknowledge the financial support from the Netherlands Organisation for Scientific Research (NWO) in the frame of an NWO Groot project (OCENW. GROOT.2019.043); H.N. acknowledges European Research Council funding (ERC-CoG grant number 772923, project VORTEX); L.Z. and A.S. acknowledge the United States of America National Science Foundation (NSF EAGER OCE 2127669, NSF CBET 1910621); L.Z. acknowledges the China National Science Foundation (NSFC 42206154); M.T. acknowledges the European Union’s Horizon 2020 research and innovation programme, MINKE project (under grant agreement number 101008724), and Global Challenges Research Fund (NE/VO05448/1), project ‘Reducing the Impacts of Plastic Waste in the Eastern Pacific Ocean’ led by the University of Exeter, UK; R.P.B. acknowledges the Gordon and Betty Moore Foundation (#9208) and 2018 Star-Friedman grant for promising scientific research.
Author contributions S.Z.: conceptualization (lead), data curation (lead); formal analysis (lead); validation (lead); writing—original draft (lead); writing—review and editing (lead). K.F.K: validation (equal); writing—review and editing (equal). L.Z.: data curation (equal); formal analysis (equal); writing—review and editing (supporting). E.R.Z.: conceptualization (equal); validation (equal); writing-review and editing (equal). M.E.: conceptualization (equal); validation (supporting); writing—review and editing (supporting). T.J.M.: conceptualization (equal); validation (equal); writing—review and editing (supporting). L.A.A.-Z.: conceptualization (equal); validation (equal); writing—review and editing (equal). L.L.: validation (equal); writingreview and editing (equal). H.N.: validation (supporting); writing—review and editing (supporting). R.N.: validation (supporting); writing—review and editing (supporting). M.T.: validation (supporting); writing-review and editing (equal). R.P.B.: validation (supporting); writing—review and editing (supporting). L.G.: validation (supporting); writing—review and editing (supporting). A.S.: validation (supporting); writing-review and editing (equal).
Competing interests M.E. and L.L. are employed by The Ocean Cleanup, a non-profit organization aimed at advancing scientific understanding and developing solutions to rid the oceans of plastic.

Additional information

Supplementary information The online version contains supplementary material available at https://doi.org/10.1038/s41586-025-08818-1.
Correspondence and requests for materials should be addressed to Shiye Zhao.
Peer review information Nature thanks the anonymous reviewers for their contribution to the peer review of this work.
Reprints and permissions information is available at http://www.nature.com/reprints.
Extended Data Fig. 1| Adjusted estimates of microplastic fragments floating on the sea surface (orange dots) and in near-surface (blue dots) waters along latitudes. In the marginal boxplots, bold black horizontal lines represent medians of microplastics abundances; top and bottom of colored boxes represent 25th and 75th percentiles; and whiskers indicate the largest and the smallest measured values within 1.5 interquartile
ranges from the box. Asterisks denote statistically significant differences between two categories (Mann-Whitney-Wilcoxon test, p <.05). This refined dataset of microplastics in the depth bin ( ) comprises three size fractions: 5.3% ( ) of particles of particles of particles . For more details, please refer to Methods, Fig. 1 and SI Table 2.
Extended Data Fig. 2 | Log-linear regression slopes between microplastics concentrations and water depth in nearshore (the brown boxplot) and offshore waters (the blue boxplot). Top and bottom of colored boxes represent 25th and 75th percentiles; and whiskers indicate the largest and the smallest
measured values within 1.5 interquartile ranges from the box. Asterisks denote statistically significant differences between two groups (Mann-WhitneyWilcoxon test, ).
Extended Data Fig. 3 | Comparison of the mass concentrations of water column microplastics collected with the in-situ pump and MultiNet at the Atlantic Ocean and the eastern North Pacific Ocean. For each filter sample from the in-situ pump, FTIR imaging were employed to analyze 1.8% (ref.10,
(ref.3) and (ref.25) of particles. In addition, the in-situ pump and MultiNet were deployed concurrently for collecting microplastics in the South Atlantic Subtropical Gyre and the eastern North Pacific Subtropical Gyre .
Extended Data Fig. 4 | The measured abundances of large and small microplastics within and outside the predicted offshore accumulation zones in the water column below . The boxplot medians are depicted by bold black horizontal lines, while the top and bottom of the colored boxes
represent the 25th and 75th percentiles, respectively. The whiskers indicate the largest and smallest measured values within 1.5 interquartile ranges from the box. The datasets are from refs. . No statistical differences are found.

Analysis

Extended Data Fig. 5 | Relationship between ratios (%) of microplastic-C to particulate organic carbon and water depth in the North Pacific
The black line represents the linear regression fit and the shade area represents the confidence interval estimated by 1000 times of bootstrap. (blue diamonds) and North Atlantic (purple diamonds) Subtropical Gyres.
Extended Data Table 1 | Key methodological steps in studying subsurface microplastics
Description in the literature Advantages Disadvantages
Sampling equipment
In-situ pump McLane pump, ISP pump, Plankton pump
-Holding filters of varying pore sizes;
-Large sample volume;
-Depth resolution (up to 6,000 m);
-Ease of controlling contamination
-Selective for small particles;
-Labor-intensive and time-consuming operation;
-Increased operational challenges during adverse sea states;
-High cost
Submersible pump, Borehole deepwell pump, Ship underway pump
-Ease of operation;
-Large sample volume;
-Cost-effectiveness;
-Ease of controlling contamination
-Limited sampling depth;
-Fixed pore/mesh sizes;
-Selective for small particles;
Plankton Net MOCNESS , MultNet
-Large sample volume;
-Depth resolution;
-Labor-intensive and time-consuming operation;
-Selective for large particles;
-High cost
Bulk water sampler Niskin bottle, Limnos water sampler, Plexiglass water sampler
-Full depth resolution ;
-Ease of operation
-Ease of controlling contamination
-Limited sample volume
Filter/mesh types
Screen filter Anodisc, Polycarbonate filter, Nylon filter, Stainless steel mesh, Cellulose nitrate filter)
-Efficient for capturing larger particles
-Easy to wash off the trapped particles
-Limited retention capacity for smaller particles
-Prone to clogging
Depth filter GF/A, GF/C, Quartz filters
– Higher retention capacity for particle of various sizes
– handle a relatively high volume of water
-Higher resistance to clogging
-Particle are entrapped within the structure
Chemical identification
Chemical imaging Single-element mercury cadmium telluride detector, Focal plane array detector
-High spatial resolution (down to 11-20 )
-Without human bias
-Semi-automated data analysis
-Requiring careful sample preparation
-Filter surface sensitivity
-Measurement times increasing with imaged filter area
-Complexity of analyzing large volume of spectra
-Requiring high computational capacity
-Instrument expensive
Microscopy-aided inspection following by -FTIR/Raman identification FTIR techniques : Attenuated total reflection-FTIR, -FTIR/Raman ; -Ease of sample preparation and analysis
-Only applied to particles ;
-Results largely depending on the experience level of the performer
Microscopic inspection Identifying plastic particles by visual inspection under microscopy
-Ease of large plastic fragments
-Low cost
-No polymer information provided
This table outlines the methods used at various stages of subsurface microplastic measurement, including sampling equipment, filter/mesh types, and chemical identification. The advantages and limitations of each step are also provided. The mesh size of plankton pump is fixed. Multiple Opening and Closing net with an Environmental Sensing System. Multiple Plankton Sampler. Screen filter utilizes a mesh screen to physically trap particles larger than the screen openings; Depth filter relies on a porous matrix of depth media to capture particles throughout the depth of the filter medium. -FTIR/Raman means microscope-supported spectrometric (Fourier-transform infrared spectroscopy/Raman) systems. MOCNESS and MultiNet can sample at multiple depths, its maximum sampling depth is typically limited compared to in situ pumps. Bulk water sampler (e.g., Niskin bottle CTD Rosette) can allow to collect water samples at precise depths throughout the water column.

  1. Japan Agency for Marine-Earth Science and Technology, Yokosuka, Japan. Aotearoa Blue Ocean Research, Lower Hutt, New Zealand. State Key Laboratory of Estuarine and Coastal Research, East China Normal University, Shanghai, China. Department of Marine and Environmental Sciences, Northeastern University, Boston, MA, USA. NIOZ Royal Netherlands Institute for Sea Research, Den Burg, The Netherlands. The Ocean Cleanup, Rotterdam, The Netherlands. Empaqtify, St Gallen, Switzerland. Harriet Wilkes Honors College, Florida Atlantic University, Boca Raton, FL, USA. Department of Freshwater and Marine Ecology, Institute for Biodiversity and Ecosystem Dynamics, University of Amsterdam, Amsterdam, The Netherlands. Department of Earth Sciences, Faculty of Geosciences, Utrecht University, Utrecht, The Netherlands. Facultad Ciencias del Mar, Universidad Catolica del Norte, Coquimbo, Chile. MarineGEO Program, Smithsonian Environmental Research Center, Edgewater, MD, USA. Centre for Ecology and Sustainable Management of Oceanic Island (ESMOI), Coquimbo, Chile. Department of Organismic and Evolutionary Biology, Harvard University, Cambridge, MA, USA. Department of Biotechnology, Chemistry and Pharmacy, University of Siena, Siena, Italy. National Biodiversity Future Center (NBFC), Palermo, Italy. Department of Chemistry and Chemical Biology, Northeastern University, Boston, MA, USA. Department of Civil and Environmental Engineering, Northeastern University, Boston, MA, USA. e-mail: szhao@jamstec.go.jp