توضيح التفاعلات الجزيئية بين الدواء والبوليمر في التشتت الصلب غير المتبلور من خلال نهج حسابي باستخدام محاكاة الديناميكا الجزيئية Elucidation of Molecular Interactions Between Drug–Polymer in Amorphous Solid Dispersion by a Computational Approach Using Molecular Dynamics Simulations
توضيح التفاعلات الجزيئية بين الدواء والبوليمر في التشتت الصلب غير المتبلور من خلال نهج حسابي باستخدام محاكاة الديناميكا الجزيئية
دياه ليا أوليفا (د) ، عدنان علي الشوفان، ساندرا ميغانتارا، توفيق محمد فقيه، عارف بوديمان‘قسم تحليل الأدوية والكيمياء الطبية، كلية الصيدلة، جامعة بادجادجاران، سوميدانغ، إندونيسيا؛ قسم الصيدلة والتكنولوجيا الصيدلانية، كلية الصيدلة، جامعة بادجادجاران، سوميدانغ، إندونيسيا؛ قسم الصيدلة، كلية الرياضيات والعلوم الطبيعية، جامعة إسلام باندونغ، باندونغ، إندونيسياالمراسلة: دياه ليا أوليفا، قسم تحليل الأدوية والكيمياء الطبية، كلية الصيدلة، جامعة بادجادجاران، جادة رايا باندونغ-سوميدانغ كم. 2I، سوميدانغ، 45363، إندونيسيا، البريد الإلكتروني diah.lia@unpad.ac.id
الملخص
المقدمة: يتم استخدام تشتت الأدوية غير المتبلورة بشكل متكرر لتعزيز الذوبانية والانحلال للأدوية ذات الذوبانية الضعيفة في الماء، مما يحسن من توافرها الحيوي الفموي. يمكن أن يمنع تشتت هذه الأدوية في مصفوفة البوليمر إعادة بلورتها. تلعب التفاعلات الجزيئية بين الدواء والبوليمر دورًا في تحسين معدل الذوبان، والذوبانية، والثبات الفيزيائي للدواء. الهدف: تهدف هذه الدراسة إلى التحقيق في تشكيل وتفاعلات تركيبة ريتونافير (RTV)/بولوكسايمر (PLX) غير المتبلورة باستخدام نهج حسابي عبر محاكاة الديناميكا الجزيئية (MD)، والتي تحاكي تبخر المذيب وطريقة التبريد بالانصهار. الطرق: تم تحليل قيمة الجذر التربيعي لمتوسط الانحراف (RMSD)، الجذر التربيعي لمتوسط التذبذب (RMSF)، دالة التوزيع الشعاعي (RDF)، نصف قطر الدوران (Rg)، مساحة السطح القابلة للوصول للمذيب (SASA)، وتفاعلات الروابط الهيدروجينية لتحديد آليات التفاعل بين RTV وPLX في التشتت الصلب غير المتبلور. النتائج: تم تشكيل روابط بي-ألكيل بين RTV وPLX بعد محاكاة تبخر المذيب، بينما تم ملاحظة تفاعلات الروابط الهيدروجينية بين RTV-PLX خلال محاكاة طريقة الانصهار. تشير هذه النتائج إلى نجاح تشكيل التشتت الصلب غير المتبلور (ASD) من RTV وPLX. كانت قيم RMSD التي تم الحصول عليها من طرق تبخر المذيب، التبريد بالانصهار-A، التبريد بالانصهار-B، والتبريد بالانصهار-C هي، و، على التوالي، بينما كانت قيم RMSF المتوسطة هي، و، على التوالي. يشير هذا إلى أن كبح الحركة الانتقالية لـ RTV من طريقة الانصهار يمكن أن يكون أقوى من تبخر المذيب بسبب التفاعلات الجزيئية بين RTV-PLX. الاستنتاج: ساعدت محاكاة MD في فهم آليات تشكيل وتفاعل تركيبات ASD التي كان من الصعب اكتشافها بواسطة الطرق التجريبية.
الكلمات المفتاحية: التشتت الصلب غير المتبلور، التفاعل الجزيئي، محاكاة الديناميكا الجزيئية، ريتونافير، بولوكسايمر
المقدمة
حواليمن مرشحي الأدوية الجدد ذات الذوبانية الضعيفة في الماء، مما يؤدي إلى توافر حيوي غير كافٍ عند إعطائها عن طريق الفم. للتغلب على هذه المشكلة، ظهرت عملية تحويل الأدوية إلى حالة غير متبلورة كاستراتيجية واعدة لتحسين ذوبانية الأدوية بسبب طاقتها الحرة الأعلى مقارنةً بنظيراتها البلورية. هذا يظهر أن الدواء في الحالة غير المتبلورة يمكن أن يولد محاليل مشبعة في الماء، مما يؤدي إلى تحسين التوافر الحيوي الفموي. ومع ذلك، فإن بلورة تركيبة الدواء غير المتبلور تحدث عادةً أثناء التخزين والانحلال بسبب عدم استقرارها الديناميكي الحراري.
يعتبر التشتت الصلب غير المتبلور (ASD) واحدة من الاستراتيجيات الواعدة لتثبيت الدواء غير المتبلور عن طريق توزيعه في مصفوفة البوليمر. لذلك، تم استخدام ASD على نطاق واسع من قبل صناعة الأدوية لتعزيز التوافر الحيوي الفموي للأدوية ذات الذوبانية الضعيفة. تلعب التفاعلات الجزيئية بين الأدوية والبوليمرات دورًا حاسمًا في تثبيت الدواء غير المتبلور في ASD، مما يقلل من حركة الجزيئات. يمكن أن يساهم البوليمر المناسب أيضًا في تثبيت الدواء غير المتبلور أثناء التخزين والحفاظ على محلوله المشبع. هذا يظهر الحاجة إلى فهم التفاعلات الجزيئية بين الأدوية والبوليمرات في ASD كشرط أساسي للتنبؤ بامتزاج حوامل الأدوية التي تساهم في تثبيت الدواء غير المتبلور.
حاليًا، تم استخدام المحاكيات الحاسوبية مثل الديناميكا الجزيئية (MD) على نطاق واسع في دراسات صياغة الأدوية. توفر محاكاة MD معلومات هيكلية تفصيلية على مستوى الذرة والتي غالبًا ما يكون من الصعب الحصول عليها تجريبيًا ولكن يمكن استخدامها للتنبؤ بامتزاج الدواء مع المساعدات. في أنظمة ASD، تعتبر محاكاة MD أدوات مهمة للتحقيق في أنماط تفاعلات الدواء-البوليمر، وامتزاج الدواء-البوليمر، وتشكيل ASD. باستخدام هذه المحاكيات، يمكن تطوير نموذج لزجاجات الدواء-المساعد وفهم خصائص ذوبانها/امتزاجها. على الرغم من أن الدراسات السابقة قد أفادت باستخدام محاكاة MD للتنبؤ بامتزاج الأدوية مع بعض الحوامل الصيدلانية، إلا أن التفاعلات الجزيئية الأساسية بين الأدوية والبوليمرات في أنظمة ASD، التي تحاكي طرق تبخر المذيب والانصهار، لم يتم التحقيق فيها. لذلك، تعتبر دراسة المقارنة لتفاعلات الدواء-البوليمر في نظام ASD باستخدام محاكاة MD من كلا الطريقتين مهمة كدليل لدراسة مختبرية تجريبية لاحقة.
تهدف هذه الدراسة إلى التحقيق في تشكيل نظام ASD وتفاعلات ريتونافير (RTV) – بولوكسايمر (PLX) في تركيبة ASD باستخدام نهج حسابي عبر محاكاة MD، التي تحاكي تبخر المذيب وطريقة التبريد بالانصهار. تم استخدام RTV كنموذج للدواء ذو الذوبانية الضعيفة بسبب ميله المنخفض لإعادة البلورة، والذي يصنف كفئة III وفقًا لتصنيف تايلور. أفادت دراسة سابقة أن RTV غير المتبلور يمكن تشكيله بواسطة طرق تبخر المذيب والتبريد بالانصهار. هذا يجعل من الضروري تقييم مقارنة تفاعلات RTV-البوليمر في نظام ASD عبر محاكاة MD. تحاكي هذه الطريقة تبخر المذيب وطريقة التبريد بالانصهار لتحديد إمكانيات البوليمرات في تعزيز الخصائص الصيدلانية للأدوية غير المتبلورة.
المواد والطرق
تحضير هيكل RTV وPLX
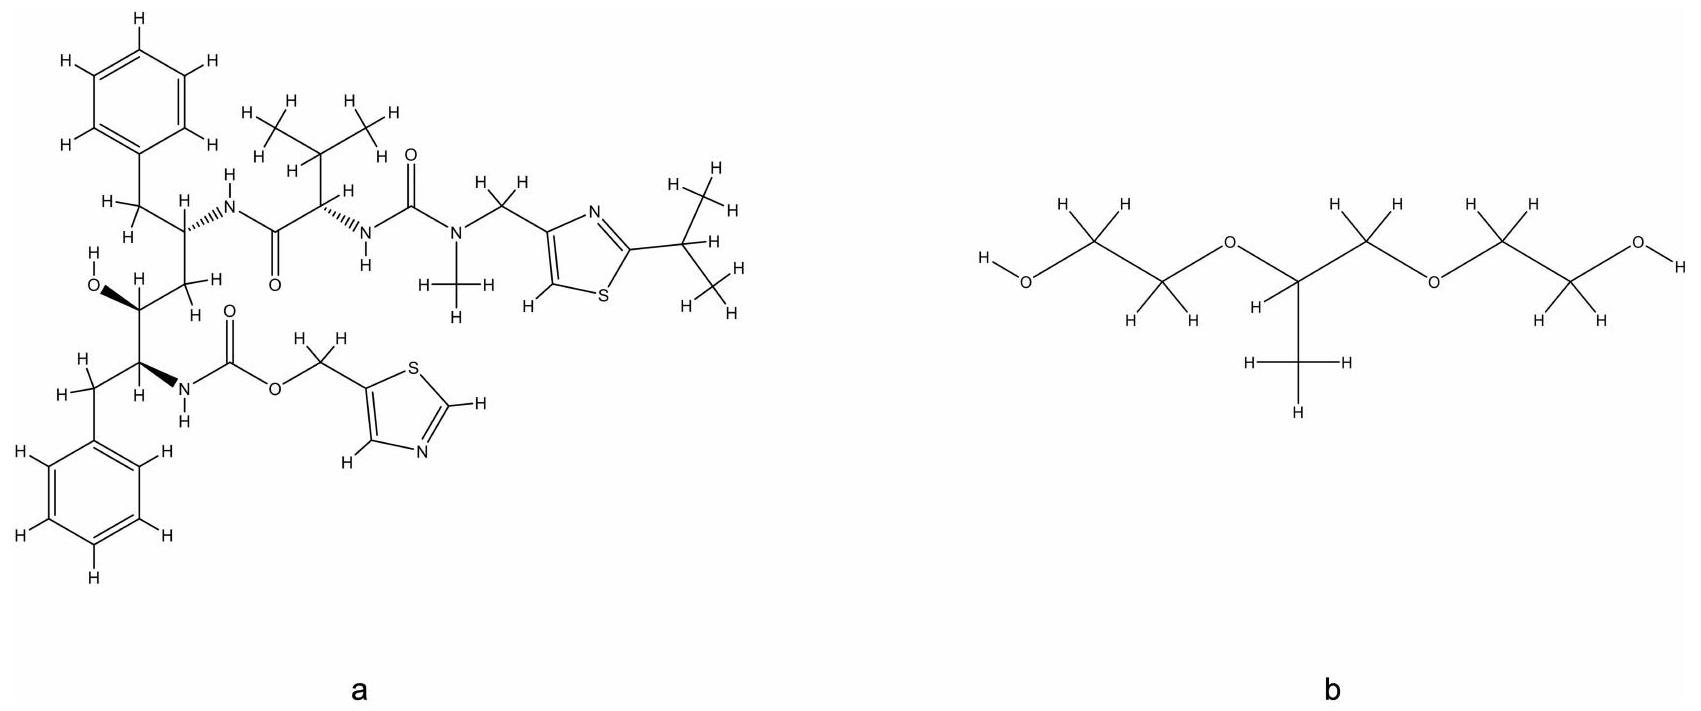
تم إجراء وصف وتحسين هياكل الربائط قبل استخدامها في عمليات MD. في هذه الدراسة، تضمنت الهياكل الجزيئية المستخدمة RTV وPLX، التي تم تنزيلها من PubChem (http://pubchem.ncbi.nlm.nih.gov) (الشكل 1). بعد ذلك، تم وصف الهياكل ثنائية الأبعاد (2D) باستخدام برنامج ChemDraw Professional 16.0 وتم الحصول على الهياكل ثلاثية الأبعاد (3D) عن طريق تحويل الهياكل ثنائية الأبعاد إلى ثلاثية الأبعاد باستخدام برنامج Chem3D 16.0. تم تحسين هيكل الربائط باستخدام GaussView 5.0.8 وGaussian 09 باستخدام طريقة نظرية الكثافة الوظيفية (DFT) مع مجموعات أساسية 6-31. تمت إضافة الهيكل المحسن إلى ذرات الهيدروجين القطبية وبيانات الشحنة الجزئية Gasteiger باستخدام برنامج AutoDock 4.2 مع MGLTools 1.5.6.
تحضير أنظمة التبريد بالانصهار
في طريقة التبريد بالانصهار، تم إنشاء النظام دون استخدام إضافة المذيبات. في هذه الدراسة، تم بناء نظام التبريد بالانصهار باستخدام جزيء واحد من RTV و25 جزيئًا من PLX، تم تشكيله بواسطة نقاط تنسيق ستة مع حجم صندوق المحاكاة ومسافة تحمل بين الجزيئات. تم إنشاء النظام باستخدام برنامج PACKMOL (التكوينات الأولية لمحاكاة MD عن طريق تحسين التعبئة).
تحضير أنظمة تبخر المذيب
تشمل طريقة تبخر المذيب إضافة مذيب الإيثانول في بناء النظام. في هذه الدراسة، تم بناء نظام تبخر المذيب باستخدام جزيء واحد من RTV، و25 جزيئًا من PLX، و1440 جزيئًا من الإيثانول، تم تشكيله بواسطة نقاط تنسيق ستة مع حجم صندوق محاكاة ومسافة تحمل 0.2 نانومتر بين الجزيئات. تم إنشاء نظام تبخر المذيب باستخدام برنامج PACKMOL (التكوين الأولي لـ MD
الشكل I (أ) هيكل ريتونافير (RTV)؛ (ب) هيكل بولوكسايمر (PLX).
محاكاة مع برنامج تحسين التعبئة. تم تحقيق توازن نظام المذيب الإيثانول لمدة 2fs قبل إضافة RTV و PLX.
محاكاة الديناميكا الجزيئية لأنظمة تبريد الذوبان
تم إجراء محاكاة MD على ثلاثة مجمعات من أنظمة تبريد الذوبان التي تم تشكيلها. تم تمييز هذه الأنظمة بمعدلات تبريد مختلفة، وهي (تبريد-الذوبان-A)، (تبريد-الذوبان-B)، و (تبريد-الذوبان-C) باستخدام برنامج Gromacs 2016.3 مع مجالات القوة الشائعة AMBER99SB-ILDN و AMBER (GAFF). تم إنشاء الطوبولوجيا والمعلمات الجزيئية لـ RTV و PLX باستخدام واجهة محلل بايثون Antechamber (ACPYPE). بعد ذلك، تم تحديد القوى الكهروستاتيكية على مسافات طويلة باستخدام طريقة شبكة جزيئات إيوالد. تم إجراء تحييد النظام عن طريق إضافة أيونات الصوديوم () وأيونات الكلوريد (). يتم استخدام منظمات الحرارة ومنظمات الضغط Berendsen خلال مرحلة التسخين، مع الحفاظ على الضغط عند 1 بار. في هذه المحاكاة، يتم استخدام مجموعة كانونية كبيرة لنمذجة الأنظمة الجزيئية. تحافظ المجموعة الكانونية الكبيرة على عدد الجسيمات الثابت ، والحجم ، ودرجة الحرارة طوال المحاكاة للتحقيق في حركة الجزيئات والخصائص الديناميكية الحرارية. تم الاستمرار في العملية مع عملية المحاكاة (تشغيل الإنتاج) مع خطوة زمنية قدرها 2 fs. شملت عملية تشغيل الإنتاج ضبط درجة الحرارة من إلى بمعدل تسخين قدره والحفاظ على درجة حرارة قدرها . تم تبريد النظام إلى درجة حرارة قدرها مع تغيير في معدل التبريد قدره ، و. تم إجراء محاكاة لمدة 500 نانو ثانية على جميع الأنظمة حتى وصلت إلى حالة مستقرة بناءً على تحليل الطاقة والضغط ودرجة الحرارة والانحراف المعياري الجذري (RMSD).
محاكاة الديناميكا الجزيئية لأنظمة تبخر المذيب
تم إجراء محاكاة MD على مجمعات معقدة من أنظمة تبخر المذيب التي تم تشكيلها باستخدام برنامج Gromacs 2016.3 مع مجالات القوة العامة AMBER99SB-ILDN و AMBER (GAFF). تم إنشاء الطوبولوجيا والمعلمات الجزيئية لـ RTV و PLX باستخدام واجهة محلل بايثون Antechamber (ACPYPE). تم تحديد القوى الكهروستاتيكية على مسافات طويلة باستخدام طريقة شبكة جزيئات إيوالد. تم إجراء تحييد النظام عن طريق إضافة أيونات الصوديوم () وأيونات الكلوريد (). يتم استخدام منظمات الحرارة ومنظمات الضغط Berendsen خلال مرحلة التسخين، مع الحفاظ على الضغط عند 1 بار. في هذه المحاكاة، يتم استخدام مجموعة كانونية كبيرة لنمذجة الأنظمة الجزيئية. تحافظ المجموعة الكانونية الكبيرة على عدد الجسيمات الثابت (N)، والحجم (V)، ودرجة الحرارة (T) طوال المحاكاة للتحقيق في حركة الجزيئات والخصائص الديناميكية الحرارية. شملت مرحلة التحضير لمحاكاة MD التخفيف، وتحقيق توازن درجة الحرارة، وتحقيق توازن الضغط، والتي استمرت مع
عملية المحاكاة (تشغيل الإنتاج) مع خطوة زمنية قدرها 2 fs. شملت عملية تشغيل الإنتاج ضبط درجة الحرارة من إلى بمعدل تسخين قدره والحفاظ على . بعد ذلك، تم تبريد النظام إلى درجة حرارة قدرها مع تغيير في معدل التبريد قدره . تم إجراء محاكاة لمدة 500 نانو ثانية على جميع الأنظمة حتى وصلت إلى حالة مستقرة بناءً على تحليل الطاقة والضغط ودرجة الحرارة والانحراف المعياري الجذري (RMSD).
تحليل نتائج محاكاة الديناميكا الجزيئية
تم حساب وتحليل الانحراف المعياري الجذري (RMSD)، والانحراف المعياري الجذري للتقلب (RMSF)، ودالة التوزيع الشعاعي (RDF)، ونصف قطر الدوران (Rg)، ومساحة السطح القابلة للوصول للمذيب (SASA)، وعدد الروابط الهيدروجينية للمجمعات. تم إجراء هذه الحسابات باستخدام وحدات Gromacs 2016.3. يتم تعريف RMSD بواسطة
حيث N هو عدد الذرات، وmi هو كتلة الذرة i، وt0 هو وقت بدء المحاكاة، وt هو الوقت، وri هو موضع الذرة i. تم إجراء هذا الحساب بعد إجراء التوافق باستخدام طريقة المربعات الصغرى. يتم تعريف RMSF بواسطة
حيث t هو الوقت، وT0 هو الوقت المرجعي للحساب، وT هو الوقت في النهاية، وri هو موضع الذرة i، و[ri]t هو الموضع المتوسط على مدى الزمن للذرة i. العلاقة بين RMSF وB-factor Bi هي
حيث RMSFi هو RMSF للذرة i. يتم تعريف RDF بواسطة
حيث هو المسافة بين زوج من الجسيمات، و هو العدد المتوسط لزوج الذرات الموجودة على مسافة بين r و هو الحجم الكلي للنظام، وN pairs هو عدد أزواج الذرات الفريدة. يتم تعريف Rg بواسطة
حيث mi هو كتلة الذرة i، وri هو موضع الذرة i. يتم تعريف SASA بواسطة
SASA لكل ذرة في تكوين RTV و PLX هو أكبر مساحة سطحية لها (محمي ) مطروحًا منها البقع المحمية بواسطة الذرات المجاورة القريبة (محمي ).
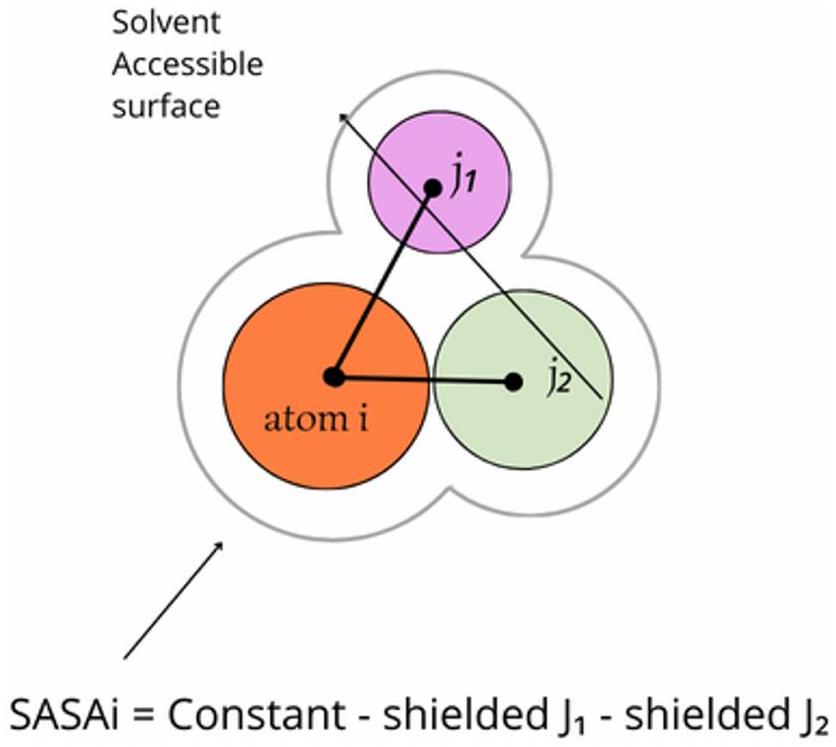
في سياق البوليمرات، يشير مصطلح SASAi إلى مساحة السطح القابلة للوصول للمذيب لذرة، والتي تتوافق مع مساحة السطح لكرية معزولة مركزة على تلك الذرة. بسبب وجود الروابط التساهمية في جميع الذرات داخل البوليمرات، يضمن ذلك أن الذرات لا تتعرض بالكامل للمذيب (الشكل 2).تم تقييم تكوين الروابط الهيدروجينية بناءً على قياسات المسافة والزوايا بين الذرة المانحة، وذرة المستقبل، وذرة الهيدروجين. تعتبر الروابط الهيدروجينية موجودة إذا تم استيفاء شرطين (الشكل التوضيحي التكميلي 1).أولاً، كانت المسافة بين الذرات المانحة والمستقبلة أقل من 0.30 نانومتر. ثانيًا، كانت الزاوية التي شكلتها ذرات الهيدروجين والمانحة والمستقبلة أقل من 30 درجة.
الشكل 2 شروط حساب مساحة السطح القابلة للوصول للمذيب (SASA). أعيد طبعها (تعديلها) بإذن من هوانغ إتش، سيميرلينغ سي. تقريب سريع للأزواج القابلة للوصول لمساحة السطح للمحاكاة الضمنية للمذيبات للبروتينات على وحدات المعالجة المركزية ووحدات معالجة الرسوميات. J Chem Theory Comput. 2018;14(11):5797-5814.حقوق الطبع والنشر 2023 الجمعية الكيميائية الأمريكية.
النتائج
وفقًا لدراسة سابقة، أظهر بلورة RTV ذروة انصهار عند ، بينما أظهر RTV غير المتبلور الذي تم تحضيره بواسطة تبخر المذيب وطريقة الذوبان حدث انتقال زجاجي عند و، على التوالي. بعد التسخين، لم يتم ملاحظة ذروة انصهار RTV، مما يشير إلى أنه يمكن تشكيل حالة غير متبلورة بواسطة تبخر المذيب وطريقة الذوبان.استنادًا إلى تصنيف تايلور، تم تصنيف RTV في الفئة الثالثة، التي كانت لها شكل غير متبلور مستقر.لذلك، يمكن أن يؤدي تحضير RTV والبوليمر باستخدام تبخر المذيب وطريقة الذوبان إلى تشكيل RTV في حالة غير متبلورة.
محاكاة حركات RTV و PLX
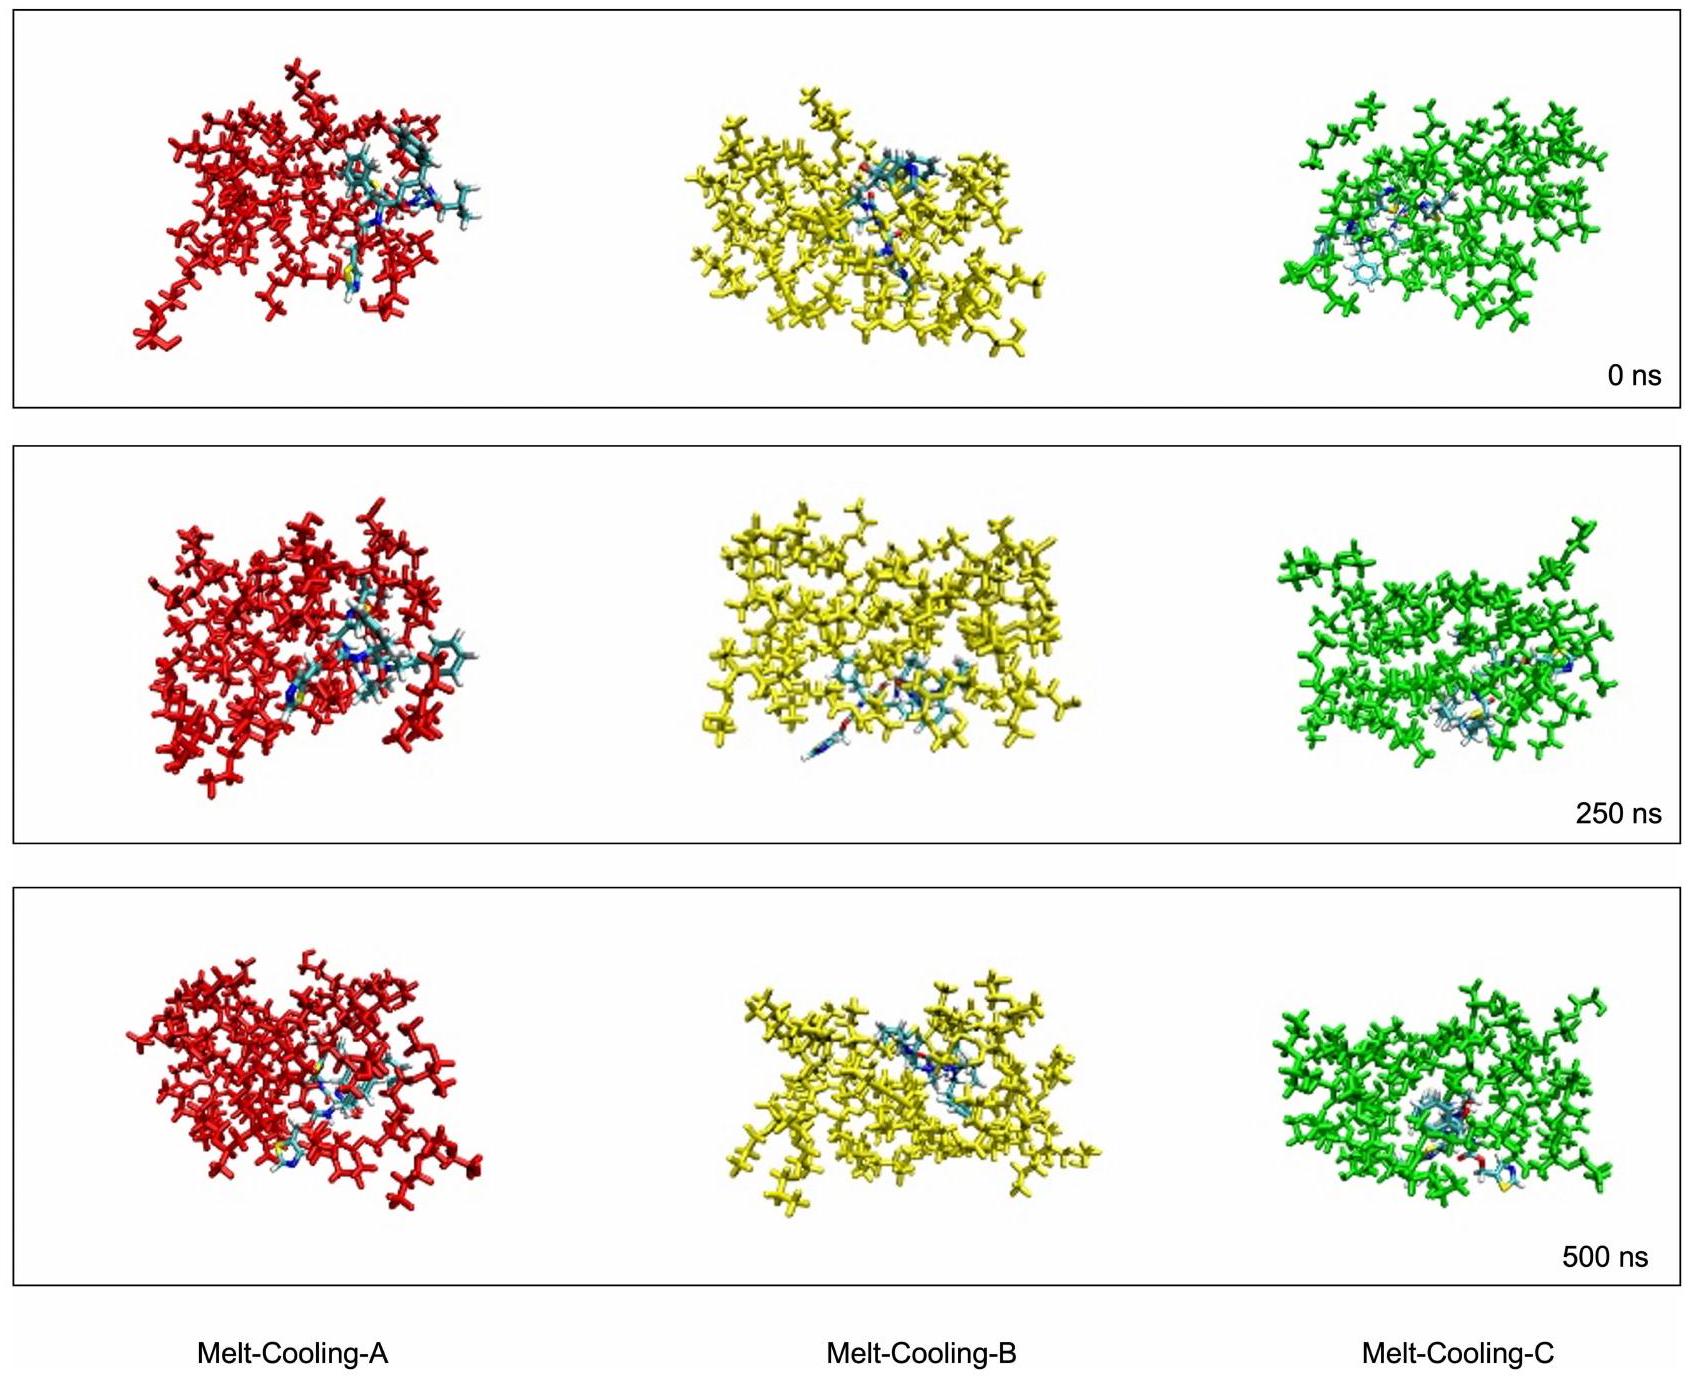
تم تحليل الحركات الجزيئية لكل من أنظمة مجمعات تبريد الذوبان-A و تبريد الذوبان-B و تبريد الذوبان-C باستخدام المسارات كما هو موضح في الشكل 3. تم استخراج المسارات في بداية المحاكاة عند 0 نانو ثانية وفي النهاية عند 500 نانو ثانية مع فواصل زمنية قدرها 50 نانو ثانية. استنادًا إلى تصور كل مسار، تم التنبؤ بأن PLX هو وكيل معقد جيد لجزيء RTV. عند 50 نانو ثانية، أظهرت محاكاة MD أن PLX يرتبط بجزيء RTV وكان مستقرًا حتى نهاية المحاكاة. في هذه الحالة، كانت مجموعة الأوكسي إيثيلين في هيكل PLX محبة للماء، مما سمح لها بالتفاعل مع العوامل الكارهة للماء مثل RTV. كما زاد PLX من قابلية ذوبان RTV في المرحلة المنصهرة وشكل محلولًا مستقرًا. علاوة على ذلك، عمل PLX كعامل واقي ضد تدهور RTV والأكسدة خلال عملية تبريد الذوبان. من خلال تشكيل معقد مع RTV، يمكن لـ PLX حماية الدواء من الأضرار الناجمة عن الحرارة والأكسجين خلال عملية التبريد. يمكن أن يعدل PLX أيضًا الخصائص الفيزيائية لمزيج الدواء، مما يؤثر على جوانب مختلفة من RTV مثل حجم الجسيمات، والتبلور، وقدرة إطلاق الدواء. وهذا يشير إلى أن PLX لديه القدرة على تحسين الخصائص الفيزيائية واستقرار RTV.تم اختيار PLX أيضًا في هذه الدراسة بناءً على الفحص الذي تم باستخدام الطريقة الحاسوبية (محاكاة الربط). أظهرت نتائج هذه الدراسة أن PLX لديه تفاعل جزيئي أفضل مع ريتونافير مقارنةً بالبوليمرات الأخرى (البيانات المقدمة في الجدول التكميلي 1).
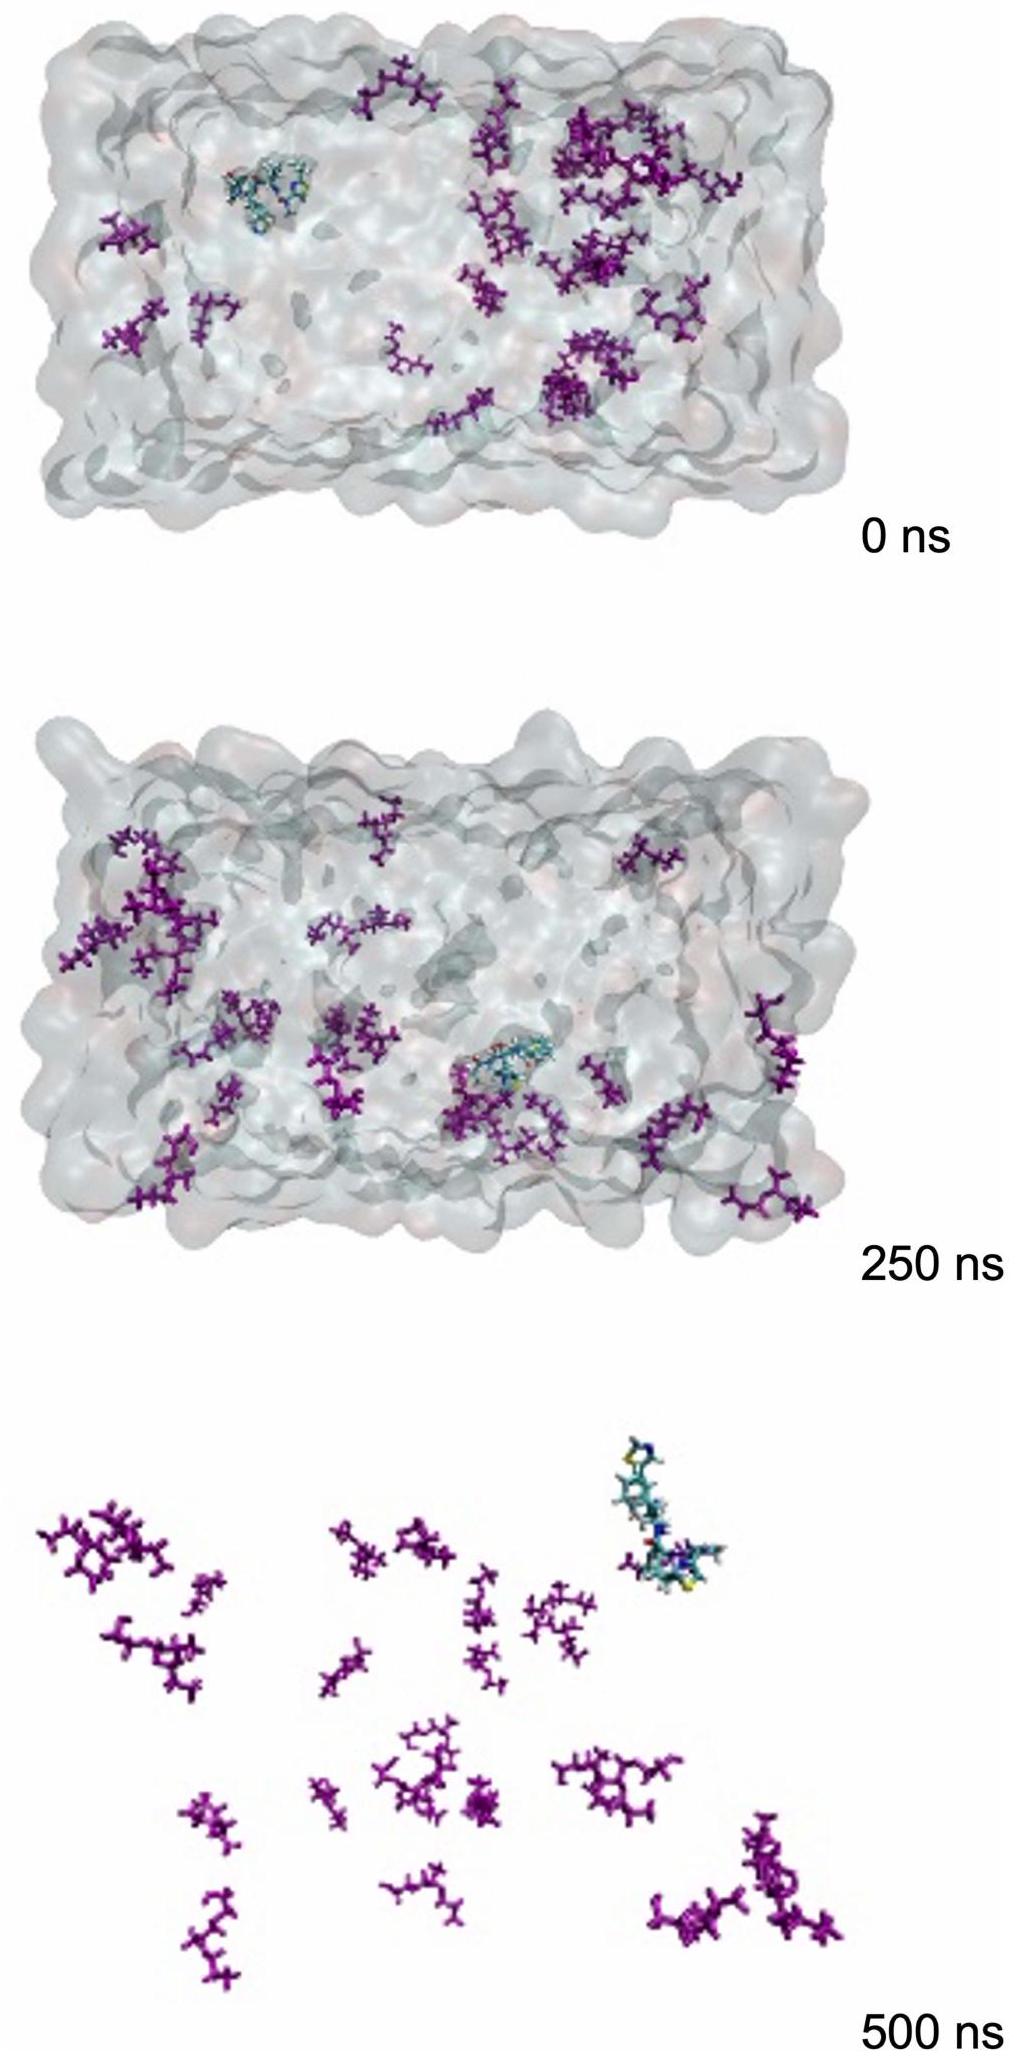
أظهر مركبا RTV و PLX فرقًا كبيرًا في طريقة تبخر المذيب باستخدام مذيب الإيثانول، من 0 نانوثانية حتى نهاية المحاكاة عند 500 نانوثانية، حيث لم يتمكنا من تشكيل مركب مثالي. علاوة على ذلك، تبخر مذيب الإيثانول عندما وصلت محاكاة الديناميكا الجزيئية إلى 200 نانوثانية إلى 500 نانوثانية، كما هو موضح في الشكل 4. حدثت هذه الظاهرة لأن التفاعلات الكيميائية بين RTV و PLX والإيثانول تداخلت مع تشكيل المركبات. يمكن أن تنتج هذه التفاعلات الجزيئية منتجات غير مرغوب فيها جديدة أو تدمر الهياكل المعقدة التي كان من المتوقع أن تتشكل. تتضمن طريقة تبخر المذيب تبخر المذيب لتشكيل مركب. ومع ذلك، فإن التبخر السريع
الشكل 3 الحركة الجزيئية لنظام المركب خلال محاكاة الديناميكا الجزيئية باستخدام طرق التبريد بالانصهار.
يمكن أن يؤثر تبخر الإيثانول على استقرار ودمج المركب. تم تشكيل بعض المركبات أيضًا عندما تبخر المذيب لكنها كانت غير مستقرة على المدى الطويل بسبب التغيرات أو الزيادة في درجة الحرارة.عندما تكون المركبات غير مستقرة، يمكن أن تتفكك أو تنفصل مرة أخرى إلى مكوناتها الأصلية مع مرور الوقت.
التغيرات الشكلية خلال عمليات الديناميكا الجزيئية
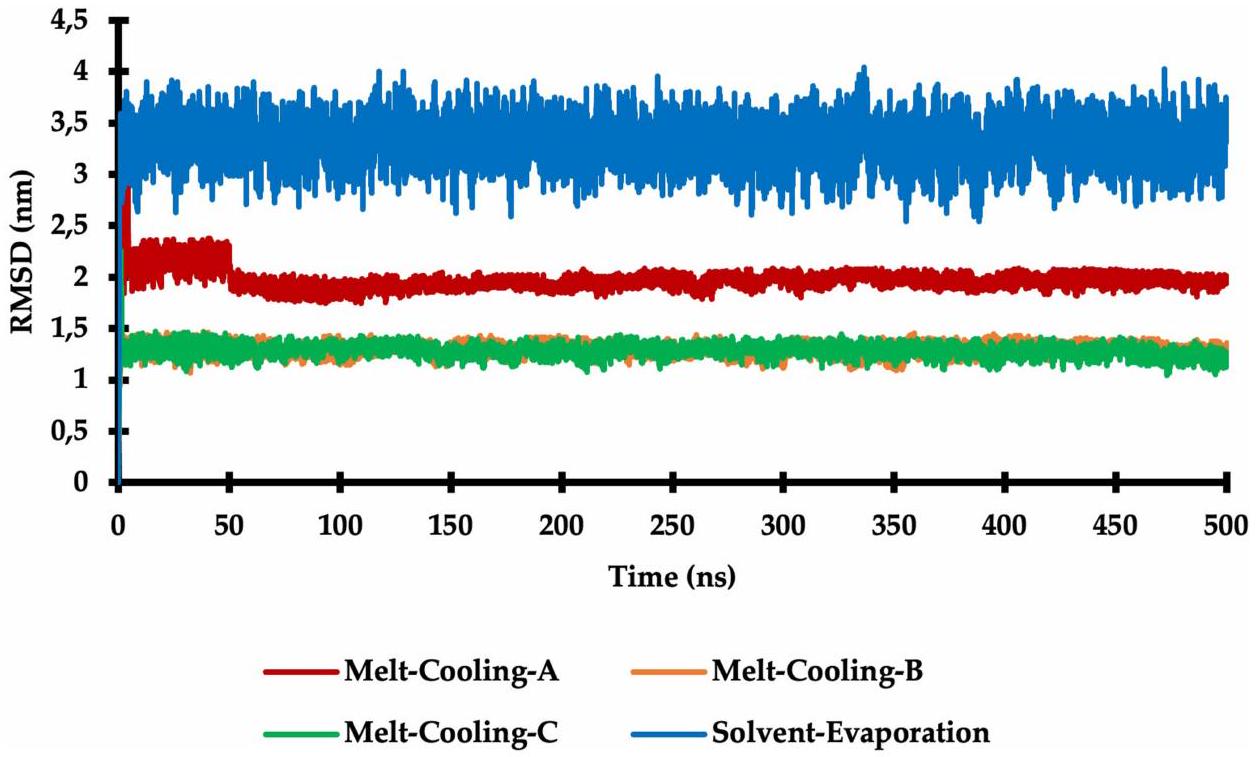
تم قياس RMSD لتأكيد التغيرات الهيكلية خلال محاكاة الديناميكا الجزيئية. تم استخدام RMSD كواحد من المقاييس المستخدمة للتحقق من ارتباط محاكاة الديناميكا الجزيئية مع الهيكل المرجعي. تم إجراء ذلك لمراقبة التغيرات الشكلية للجزيء خلال المحاكاة ومقارنتها مع الهيكل الأولي أو المرجعي. في هذه الدراسة، تم حساب قيم RMSD لأنظمة المركبات الأربعة RTV و PLX، وتمت ملاحظة التغيرات الشكلية من خلال رسم RMSD على مدار المحاكاة.يوضح الرسم البياني في الشكل 5 التغيرات الشكلية لمركبات RTV و PLX باستخدام طرق التبريد بالانصهار وتبخر المذيب خلال محاكاة الديناميكا الجزيئية. من خلال النظر في رسم RSMD، يمكننا تصوير استقرار المركب البوليمري الذي تم تشكيله خلال المحاكاة. يؤكد استقرار هذا المركب أن PLX مناسب لتشكيل مركب مع RTV.
تتضمن طريقة تبخر المذيب إزالة مذيب الإيثانول من النظام من خلال التبخر. تؤثر هذه العملية على الشكل الأولي للجزيء أو المركب الجزيئي لـ RTV و PLX. خلال تبخر المذيب، شهدت الجزيئات أو المركبات المذابة في المذيب تغييرات في التفاعلات. عندما يتم
الشكل 4 الحركة الجزيئية لنظام المركب خلال محاكاة الديناميكا الجزيئية باستخدام طرق تبخر المذيب.
إزالته، لم تعد التفاعلات مع المذيب موجودة، مما يؤثر على الاستقرار الشكلاني للجزيء أو المركب. تتجلى هذه الظاهرة من خلال متوسط قيمة RMSD من طريقة تبخر المذيب، والتي تقع ضمن نطاق, مما يشير إلى استقرار البوليمر المتكون خلال العملية. تتضمن هذه العملية
الشكل 5 مقارنة رسومات الانحراف المعياري الجذري (RMSD) لأنظمة المركبات خلال محاكاة الديناميكا الجزيئية.
أيضًا تغيير الظروف البيئية من محلول إلى مرحلة صلبة، مما يؤثر على التفاعلات بين الجزيئات أو المركبات مع البيئة المحيطة. في هذه الأثناء، تتضمن طريقة التبريد بالانصهار انصهار وتبريد نظام مركب. تحافظ هذه العملية على شكل أكثر استقرارًا للجزيء أو المركب لأنها لا تتضمن تغييرات كبيرة في البيئة والتفاعلات مع المذيب. لذلك، تميل التقلبات في مسافة التفاعل على رسم RMSD إلى أن تكون أصغر عند استخدام طريقة التبريد بالانصهار.
تم استخدام رسومات RMSF لفهم تقلبات الذرات في نظام خلال محاكاة الديناميكا الجزيئية. يقيس RMSF مدى تقلب مواقع الذرات في المحاكاة عن مواقعها المتوسطة على مدى فترة معينة. في هذه الحالة، تشمل عدة ذرات تم اعتبارها للإزاحة الكربون, الهيدروجين, الأكسجين, النيتروجين, الكبريت, والفوسفور. علاوة على ذلك، قدمت ملاحظات رسم RMSF رؤى حول درجة مرونة أو استقرار الذرات.في مركبات RTV و PLX، تظهر طريقة تبخر المذيب تقلبات كبيرة في إزاحة الذرات في رسم RMSF مقارنة بطريقة التبريد بالانصهار، كما هو موضح في الشكل 6. تنشأ هذه الظاهرة
الشكل 6 مقارنة رسومات تقلب الانحراف المعياري الجذري (RMSF) لأنظمة المركبات خلال محاكاة الديناميكا الجزيئية.
بسبب أن طريقة تبخر المذيب تتضمن تفاعلات مع المذيب في النظام، مما يؤثر على التفاعلات بين جزيئات RTV و PLX. تزداد إزاحة الذرات في طريقة تبخر المذيب بعد الوصول إلى 100 نانوثانية، بالتزامن مع ارتفاع درجة الحرارة داخل النظام. تؤثر هذه التفاعلات على الاستقرار والمرونة والشكل الأولي لجزيئات المركب بسبب التغيرات في البيئة والتفاعلات عند إزالة المذيب. في هذه الأثناء، تتضمن طريقة التبريد بالانصهار انصهار وتبريد الأنظمة المركبة. تقلل هذه العملية من اهتزازات الذرات وتقلل من أي تقلبات تحدث في النظام. تتضمن طريقة تبخر المذيب تغيير الظروف البيئية من حالة سائلة إلى حالة صلبة، مما يؤدي إلى حالة جافة. تسببت هذه التغييرات في زيادة تقلبات الذرات وأنتجت المزيد من التقلبات في رسم RMSF.
زيادة قابلية ذوبان RTV في وجود PLX
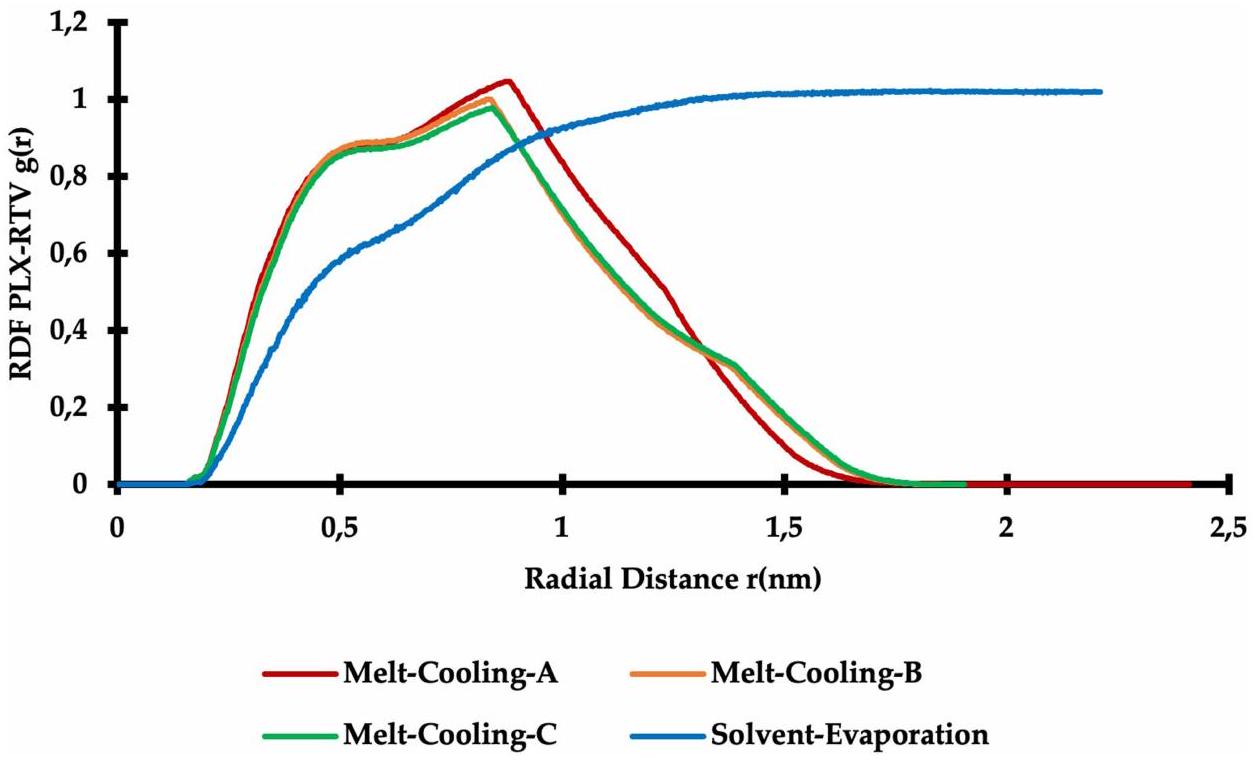
تم استخدام تحليل دالة التوزيع الشعاعي (RDF) لمركبات RTV و PLX باستخدام طرق التبريد بالانصهار وتبخر المذيب لفهم العلاقة المكانية بين الجزيئات في النظام. تصف RDF ميل بعض الجزيئات مثل الذرات أو الجزيئات للوجود على مسافة معينة من جزيء مرجعي. بشكل محدد، تقيس RDF الكثافة النسبية لجزيئات RTV و PLX على طول مسافة شعاعية من مرجع.تستخدم المسافة الشعاعية المعنية مركز RTV كنقطة الأصل وتقيس عدد مراكز جزيئات PLX عند نقاط محددة على طول المحور الشعاعي. في مركبات RTV و PLX، قدمت RDF معلومات حول التوزيع المكاني لـ PLX حول RTV والعكس صحيح. ساعد ذلك في فهم التفاعلات بين RTV و PLX، بما في ذلك الترتيب المكاني، والروابط الهيدروجينية المحتملة، وتشكيل الهياكل المعقدة.
يوضح الرسم البياني RDF في الشكل 7 أن معدل تشكيل المركبات بين RTV و PLX يؤدي إلى تفاعلات أقوى بين ذرات جزيئات PLX وذرات جزيئات RTV المجاورة عند استخدام عملية التبريد بالانصهار. يمكن ملاحظة هذه الظاهرة بسبب وجود قمم حادة ومسطحة عند نقاط معينة في محاكاة الديناميكا الجزيئية في رسم RDF لطريقة التبريد بالانصهار. علاوة على ذلك، تتضمن طريقة التبريد بالانصهار تبريد الخليط لتشكيل حالة صلبة من المركب. في الحالة الصلبة، يتم ترتيب جزيئات المركب بشكل منظم مما يحافظ على تفاعلاتها. كما تسمح هذه الطريقة بتشكيل مركبات RTV و PLX بشكل مباشر أثناء تبريد الخليط. وهذا يسمح لجزيئات مركب PLX و RTV بأن تكون منظمة بشكل صحيح ويمنع الأخطاء المحتملة أو التغييرات غير المرغوب فيها في هياكلها خلال عملية تبخر المذيب. بالإضافة إلى ذلك، يساعد ذلك في منع التدهور الذي قد يحدث في الهيكل الجزيئي للمركبات خلال هذه العملية. ومع ذلك، تتضمن طريقة تبخر المذيب تبخر المذيب لتشكيل المركبات. يمكن أن تؤدي هذه العملية إلى تشكيل تجمعات أكبر من الجزيئات المذابة في المذيب (الشكل 4). يمكن أن تتداخل هذه التجمعات الكبيرة مع RDF
الشكل 7 مقارنة رسومات دالة التوزيع الشعاعي (RDF) لأنظمة المركبات خلال محاكاة الديناميكا الجزيئية.
التحليل لأنهم لم يمثلوا التوزيع الحقيقي للجزيئات المعقدة. تميل طريقة الانصهار والتبريد إلى تجاوز هذه المشكلة من خلال تشكيل المعقد مباشرة في الحالة الصلبة. علاوة على ذلك، في طريقة تبخر المذيب، كان للمذيب وجود كبير في عملية تشكيل المعقد التي يمكن أن تؤثر على التفاعلات والتوزيع المكاني بين RTV و PLX. في طريقة الانصهار والتبريد، لم يكن هناك مذيب متورط بعد تبريد الخليط، مما يسمح لتحليل RDF بالتركيز أكثر على التفاعلات بين مكونات المعقد.
تغليف وكثافة معقدات RTV و PLX
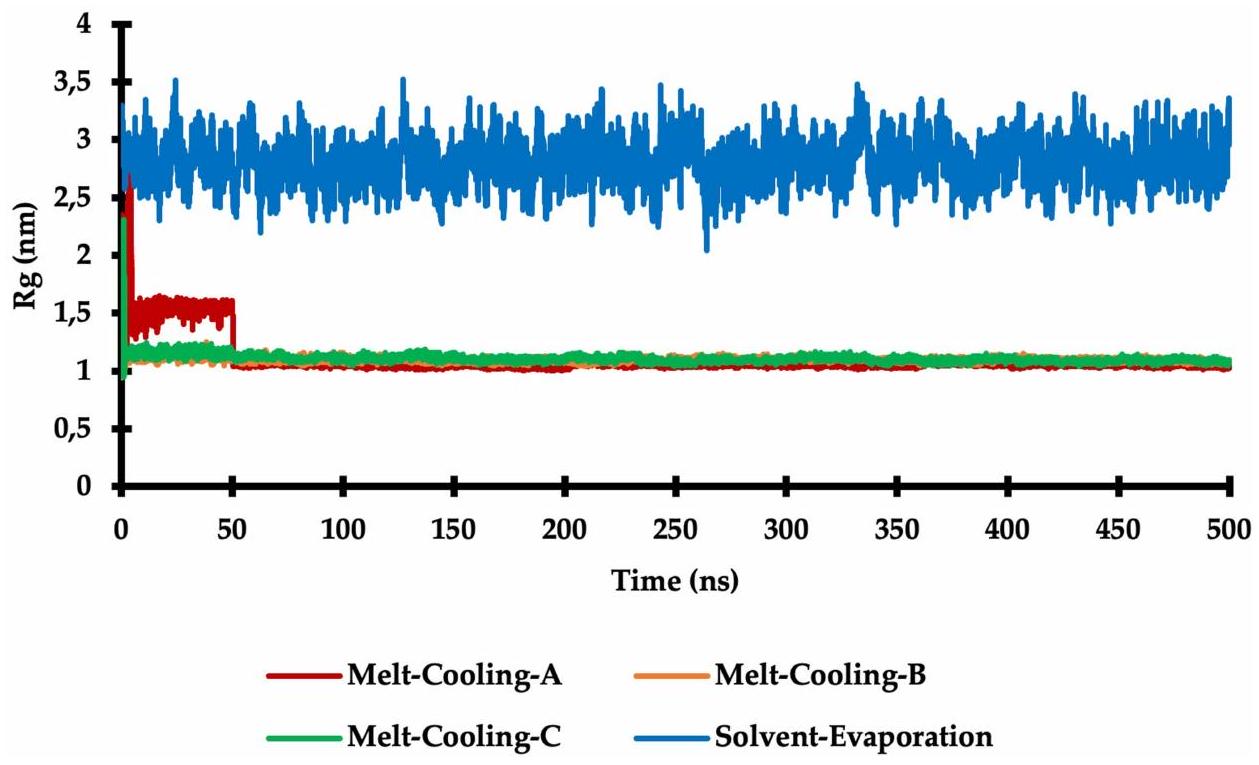
تم قياس نصف قطر الدوران (Rg) لنموذج الإدماج الجزيئي للتحقيق في التماسك في معقدات RTV و PLX. قاس Rg مدى تشتت الجزيئات في النظام، من خلال حساب المسافة المتوسطة لجزيئات PLX من مركز كتلة جزيء RTV. علاوة على ذلك، قدم Rg معلومات حول تكوين الجزيء، مما يشير إلى ما إذا كان الجزيء أكثر كثافة أو مفتوحًا. كما أظهر المزيد عن مرونة الجزيء، مما يشير إلى مدى سهولة تغيير الجزيء لشكله أو حركته. عندما كانت قيمة Rg منخفضة، يظهر تماسك نموذج الإدماج الجزيئي تكوينًا جيدًا في النظام خلال المحاكاة.
تظهر الشكل 8 تقلب Rg كدالة للوقت للنموذج المحاكى. عند Rg من 500 نانو ثانية، أظهرت معقدات RTV و PLX باستخدام طريقة الانصهار والتبريد مزيدًا من الاستقرار مقارنة بطريقة تبخر المذيب. تسمح طريقة الانصهار والتبريد بتشكيل معقدات RTV و PLX في الحالة الصلبة، والتي تمثل الحالة الفعلية مثل في تركيبات الأدوية المغلفة أو البلورية. في الحالة الصلبة، كان التوزيع المكاني لجزيئات المعقد أكثر تنظيمًا واستقرارًا، مما أدى إلى قياس دقيق لـ Rg بواسطة طريقة الانصهار والتبريد. كما تسمح طريقة الانصهار والتبريد بتشكيل المعقد مباشرة من خلال عملية تبريد الخليط. تتيح هذه العملية تحكمًا أدق في عوامل مثل درجة الحرارة والوقت ومعدل التبريد، والتي تؤثر على الهيكل وخصائص المعقد. في طريقة تبخر المذيب، يمكن أن يكون تأثير المذيب ومعلمات التبخر صعب التحكم فيه بدقة، مما يؤدي إلى قياس غير متسق لـ Rg.
تشمل عملية تبخر المذيب تبخر المذيب، مما يسبب تغييرات هيكلية في الأنظمة. تحدث هذه التغييرات بسبب التفاعلات مع المذيبات أو التغيرات في الحالات الفيزيائية، مثل زيادة تقلبات درجة الحرارة. في هذه الأثناء، تسمح طريقة الانصهار والتبريد بتشكيل المعقدات في حالة صلبة أكثر استقرارًا، مع تغييرات هيكلية قليلة أو معدومة. يوفر Rg أيضًا معلومات حول حركة ومرونة الجزيئات في المعقدات. تسمح طريقة الانصهار والتبريد بقياس Rg في حالة صلبة مستقرة، مما يعكس بشكل صحيح خصائص الديناميكا للمعقد. قد تؤثر طريقة تبخر المذيب على مرونة الجزيء.
الشكل 8 مقارنة لرسوم بيانية لنصف قطر الدوران (Rg) لنظام المعقد خلال محاكاة الديناميكا الجزيئية.
وحركة داخلية بسبب تأثير المذيب، مما يقلل من المعلومات التي يمكن الحصول عليها حول خصائص الديناميكا للأنظمة.
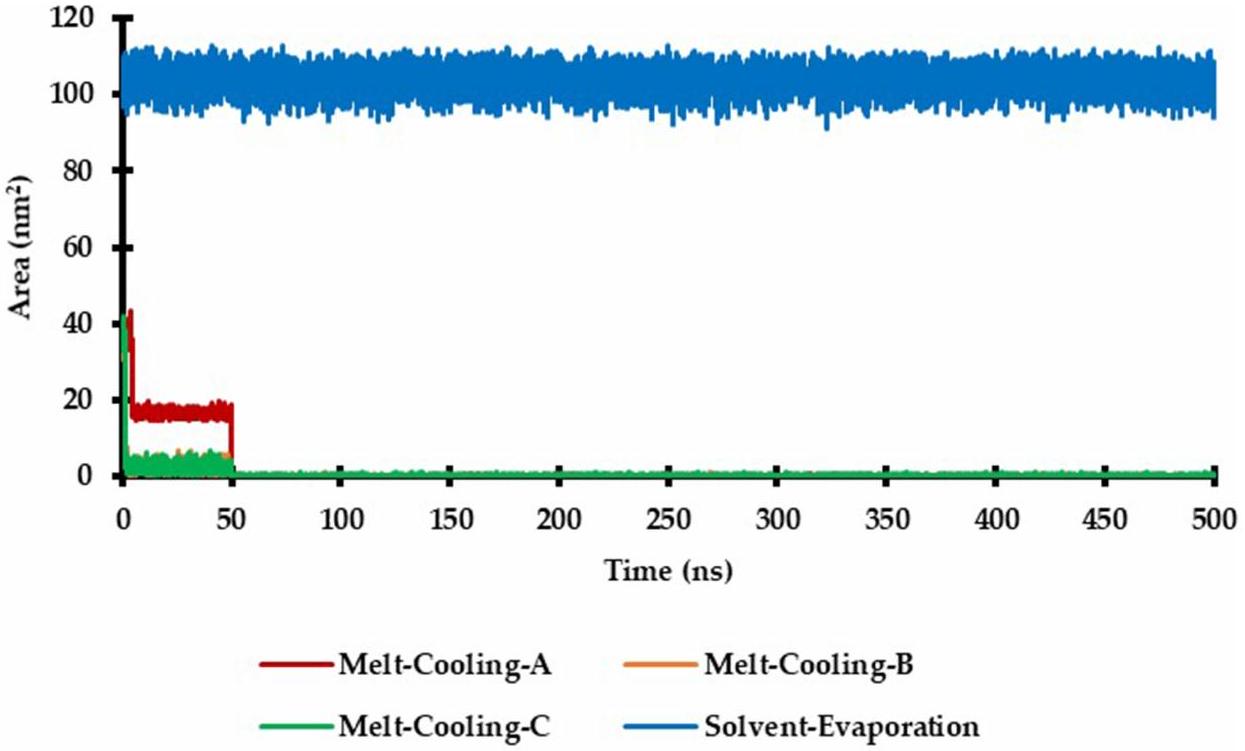
تم استخدام تحليل SASA لمعقدات RTV و PLX باستخدام طرق الانصهار والتبريد وتبخر المذيب لفهم تعرض سطح الجزيئات في المعقد للمذيبات أو البيئة المحيطة. يوفر SASA رؤى حول مساحة السطح المتاحة للمذيب، مما يعكس الخصائص الكارهة للماء والمحبة للماء للجزيئات داخل المعقد. بالنسبة لنظام تبخر المذيب، تم إجراء حساب SASA بشكل مستمر طوال فترة المحاكاة. ومع ذلك، في نموذج الانصهار والتبريد، تم إجراؤه فقط في البداية لتأكيد غياب المذيب. في طريقة الانصهار والتبريد، يتشكل المعقد في الحالة الصلبة مباشرة عن طريق تبريد الخليط. جعل تحليل SASA باستخدام طريقة الانصهار والتبريد من الممكن حساب مساحة سطح المعقد التي يمكن الوصول إليها بواسطة المذيب رقميًا. في هذه الأثناء، في طريقة تبخر المذيب، يتشكل معقد عن طريق تبخير المذيب. قدم تحليل SASA في هذه الطريقة معلومات حول مساحة سطح المعقد المعرضة أو المحمية من المذيب بعد التبخر.
تشير رسم بياني SASA في الشكل 9 إلى أن معقدات RTV و PLX التي تم تشكيلها باستخدام طريقة الانصهار والتبريد تظهر تعقيدًا أعلى مقارنة بنهج تبخر المذيب. في نظام تبخر المذيب، يُعتقد أن التقلبات في رسم بياني SASA تتأثر بشكل أساسي بإمكانية الوصول إلى المذيبات حول جزيئات RTV و PLX. علاوة على ذلك، تتضمن طريقة الانصهار والتبريد تشكيل المعقد في الحالة الصلبة مباشرة عن طريق تبريد الخليط. تتيح هذه العملية لجزيئات المعقد أن تكون مرتبة بشكل جيد وتحافظ على تفاعلاتها في الحالة الصلبة. بناءً على استقرار الهيكل الجزيئي للمعقد، قدمت طريقة الانصهار والتبريد استقرارًا أعلى لأن جزيئات المعقد كانت منظمة في الحالة الصلبة. في هذه الأثناء، تتضمن طريقة تبخر المذيب تبخير المذيب لتشكيل معقد. تؤثر هذه العملية على استقرار المعقد بناءً على طبيعة المذيب ودرجة الحرارة ومعدل التبخر وظروف أخرى. عندما كان للمذيب تفاعلات قوية مع جزيئات المعقد أو تسبب في تغييرات هيكلية كبيرة، يتأثر استقرار المعقد سلبًا.
قدرة ارتباط معقدات RTV و PLX
تعتبر الروابط الهيدروجينية واحدة من أهم أنواع التفاعلات بين الجزيئات في الكيمياء وعلم الأحياء. تساعد ملاحظة الروابط الهيدروجينية في معقدات RTV و PL على فهم التفاعلات بين هذه الجزيئات، مما يوفر رؤى حول الروابط الهيدروجينية المتكونة، واستقرار المعقدات، وأدوارها في التأثير على الهيكل والاستقرار والخصائص العامة للمعقدات. كما تحدد ملاحظات الروابط الهيدروجينية الأنماط المتكونة في المعقدات. تشير هذه الأنماط إلى نمط معين يتفاعل فيه ذرة هيدروجين من جزيء واحد مع
الشكل 9 مقارنة لرسوم بيانية لمساحة السطح القابلة للوصول للمذيب (SASA) لنظام المعقد خلال محاكاة الديناميكا الجزيئية.
ذرة تقبل الرابطة الهيدروجينية من جزيء آخر. يمكن أن يوفر تحديد نمط الرابطة الهيدروجينية السائد في معقد فهمًا أفضل للهيكل الجزيئي والتفاعلات المعنية. في محاكاة الديناميكا الجزيئية لمعقدات RTV و PLX، يمكن أيضًا استخدام ملاحظات الروابط الهيدروجينية للتحقق من النتائج التجريبية. من خلال مقارنة الروابط الهيدروجينية الملاحظة في المحاكاة مع البيانات التجريبية، من الممكن التحقق من دقة نموذج المحاكاة وقدرة إعادة إنتاج التفاعلات الجزيئية التي تحدث تحت الظروف التجريبية.
تظهر الشكل التوضيحي 2 أنه من خلال استخدام تقريبات ذرية مختلفة لجزيء بادر، بناءً على (1) إشارات لابلاس، (2) مقدار كثافة الإلكترون، و(3) نسبة كثافة الطاقة الحركية والجهدية، أظهرت مركبات RTV وPLX التي تم تشكيلها باستخدام طريقة الذوبان والتبريد وجودًا أكثر استقرارًا لروابط الهيدروجين، مقارنةً عندما تم استخدام طريقة تبخر المذيب. وذلك لأن طريقة الذوبان والتبريد تتضمن إذابة مزيج من مادة فعالة مثل RTV وحامل، وهو PLX عند درجات حرارة عالية، تليها تبريد سريع لتشكيل هيكل صلب. خلال عملية الذوبان والتبريد، تتشكل روابط الهيدروجين بشكل تلقائي بين جزيئات المركب بسبب وجود مجموعات هيدروكسيل في PLX ومجموعات وظيفية أخرى في RTV. تشمل المجموعات الوظيفية في RTV مجموعات عطرية، ومجموعات أميد، ومجموعات هيدروكسيل، ومجموعات أليفاتية. تسهل هذه المجموعات الوظيفية تشكيل روابط الهيدروجين، التي تلعب دورًا حاسمًا في استقرار المركب خلال عملية التبريد. كما تسمح هذه العملية بتشكيل روابط هيدروجين بكثافة أعلى وأكثر ثباتًا. ومع ذلك، تتضمن طريقة تبخر المذيب تخفيف المادة الفعالة في مذيب عضوي، مثل الإيثانول، الذي يتبخر للحصول على طبقة رقيقة من المادة الفعالة المترسبة. في هذه الطريقة، يعمل المذيب العضوي كحاجز بين المادة الفعالة والحامل. ومع ذلك، أدى إزالة المذيب العضوي إلى تعطيل روابط الهيدروجين التي تشكلت بين RTV وPLX خلال عملية تشكيل المركب.
تمت ملاحظة شغل روابط الهيدروجين في محاكاة الديناميكا الجزيئية لتحديد تكرار تشكيل روابط الهيدروجين بين RTV وPLX في النظام الجزيئي. يشير شغل روابط الهيدروجين إلى نسبة الوقت الذي تكون فيه روابط الهيدروجين موجودة في محاكاة الديناميكا الجزيئية، وتم دمج هذا الحساب في الديناميات الجزيئية المرئية (VMD، مجموعة الفيزياء الحيوية النظرية والحاسوبية في معهد بيكمان، جامعة إلينوي في أوربانا-شامبين). توفر هذه المعلومات فهمًا أفضل لقوة واستقرار التفاعلات بين الجزيئات. تظهر البيانات في الجدول 1 أن أنظمة مركبات RTV وPLX باستخدام طريقة الذوبان والتبريد أظهرت قدرات ربط واعدة، مع نسب شغل تبلغ (الذوبان والتبريد-A)، (الذوبان والتبريد-B)، و (الذوبان والتبريد-C). في حين أنه في طريقة تبخر المذيب، تم إذابة المادة الفعالة (RTV) والحامل (PLX) في المذيب العضوي الإيثانول. تمنع هذه المذيبات العضوية تفاعلات روابط الهيدروجين بين المادة الفعالة والحامل. كما أن المذيبات العضوية لها خصائص مختلفة عن الحوامل، مما يتداخل مع تشكيل روابط الهيدروجين المستقرة.
تستغرق عملية التجفيف في طريقة تبخر المذيب عادةً وقتًا أطول من طريقة الذوبان والتبريد. يسمح عملية التبخر البطيء بفرص للتفاعلات بين المذيبات العضوية، والمادة الفعالة، والحوامل، مما يمكن أن يتداخل مع تشكيل روابط الهيدروجين المتسقة. تنتج هذه الطريقة أيضًا تباينات أكبر في التركيزات في الأنظمة المركبة، مما يمكن أن يؤثر على توزيع المواد الفعالة والحوامل في الهيكل الصلب المتكون، وبالتالي تقليل إمكانية تشكيل روابط هيدروجين متسقة بين الجزيئات المركبة. علاوة على ذلك، فإن شغل روابط الهيدروجين هو مقياس لتكرار تشكيل روابط الهيدروجين في البوليمرات على مدى فترة من الزمن.
الجدول 1 نسبة شغل روابط الهيدروجين في نظام مركب خلال محاكاة الديناميكا الجزيئية
نظام مركب
شغل
عدد PLX
الذوبان والتبريد-A
77.94%
25
الذوبان والتبريد-B
58.43%
25
الذوبان والتبريد-C
72.44%
25
تبخر المذيب
1.39%
25
يعتمد شغل روابط الهيدروجين في البوليمرات على عدة عوامل، بما في ذلك تركيز البوليمر والظروف البيئية مثل درجة الحرارة والرطوبة. كلما زاد الشغل، زادت مرات تشكيل روابط الهيدروجين.
توصيف درجة انتقال الزجاج لمركبات RTV وPLX
تحليل Tg الزجاج هو وظيفة مهمة في فهم الخصائص الفيزيائية واستقرار أنظمة RTV وPLX التي تم إعدادها باستخدام طرق الذوبان والتبريد وطرق تبخر المذيب. Tg هي درجة الحرارة التي يتم ملاحظتها خلال الانتقال من الحالة الصلبة إلى الحالة غير المتبلورة، حيث يمر المادة العضوية أو البوليمر من خلال تغيير في الطور من هيكل منظم إلى هيكل عشوائي. في طريقة الذوبان والتبريد، يمكن أن يوفر تحليل Tg معلومات حول الحالة الصلبة لمركبات RTV وPLX المتكونة. في حين أن تحليل Tg في طريقة تبخر المذيب يوفر نظرة على الحالة الصلبة لمركبات RTV وPLX الناتجة. علاوة على ذلك، تشير درجة حرارة Tg المنخفضة إلى تأثير المذيبات العضوية المتبقية في الهيكل الصلب، مما يمكن أن يؤثر على استقرار وخصائص المركب الفيزيائية.
تمت ملاحظة علاقات معقدة عدة بين Tg والكثافة والحجم والضغط. العلاقة بين Tg والكثافة ليست دائمًا متسقة، حيث تتأثر بعوامل أخرى مثل التركيب والبنية الجزيئية. عندما يتم الوصول إلى Tg، يحدث تغيير في حجم المادة، والذي يميل إلى الزيادة بسبب الهيكل الجزيئي الأكثر عشوائية واتساعًا خلال انتقال Tg. علاوة على ذلك، يلعب الضغط دورًا كبيرًا في التأثير على Tg حيث يؤثر على التفاعلات بين الجزيئات وحركة الجزيئات في المادة. يظهر ذلك أن زيادة الضغط يمكن أن تحسن كثافة الجزيئات وتقوي الروابط بين الجزيئات لزيادة Tg. على العكس من ذلك، يمكن أن يؤدي انخفاض الضغط إلى تقليل كثافة الجزيئات وضعف الروابط بين الجزيئات، مما يقلل Tg.
استنادًا إلى الجدول 2، أظهرت مركبات RTV وPLX التي تم الحصول عليها باستخدام طريقة الذوبان والتبريد قيم Tg التي تلبي المتطلبات (فوق نقطة انصهار RTV). حدث ذلك لأن طريقة الذوبان والتبريد تضمنت إذابة مزيج من المادة الفعالة (RTV) والحامل (PLX) عند درجات حرارة عالية، تليها تبريد سريع لتشكيل هيكل صلب. يسمح هذا التبريد السريع بتشكيل تفاعلات جزيئية قوية، مثل روابط الهيدروجين، وروابط فان دير فال، أو التفاعلات الكارهة للماء، بين المكون النشط والحامل. تؤدي هذه التفاعلات الجزيئية القوية إلى هياكل مركبة مستقرة مع Tg تلبي المتطلبات. Tg هي درجة الحرارة عند الانتقال من الحالة الصلبة إلى الحالة غير المتبلورة. عندما تلبي Tg المتطلبات المحددة، فإنها تشير إلى أن مركبات RTV وPLX تتمتع باستقرار جيد ضد تغيرات درجة الحرارة. من خلال التبريد السريع، سمحت طريقة الذوبان والتبريد بتشكيل هيكل مضغوط ومنظم، مما وفر استقرارًا لتغيرات درجة الحرارة. يعزز الهيكل المنظم الروابط بين الجزيئات ويحافظ على الخصائص الفيزيائية للمركب عند درجات حرارة أعلى. في هذه الدراسة، تم اختيار RTV وPLX كمكونات في تشكيل المركب بسبب توافقهما في تشكيل هيكل مستقر. أظهر PLX، الذي تم استخدامه كحامل، قابلية ذوبان جيدة في RTV وكان قادرًا على تشكيل روابط بين الجزيئات قوية. علاوة على ذلك، سمحت وجود المواد الفعالة والحوامل التكميلية بتشكيل مركبات مستقرة مع Tg التي تتوافق مع المتطلبات (فوق نقطة انصهار RTV).
ديناميات التفاعلات الناتجة عن النظام المركب
في محاكاة الديناميكا الجزيئية، يمكن إجراء تحديد التفاعلات بطرق مختلفة، بما في ذلك تحليل الطاقة المحتملة بين الجزيئات الضيف والمضيف، وتحليل الترابط والتماسك بين المجموعات، بالإضافة إلى تحليل الحركات الجزيئية. من خلال فهم التفاعلات بين الجزيئات الضيف والمضيف في الأنظمة المركبة، يمكن الحصول على فهم معزز للنظام
الجدول 2 البيانات المميزة لنظام مركب خلال محاكاة الديناميكا الجزيئية
نظام مركب
Tg
الكثافة
الحجم
الضغط
الذوبان والتبريد-A
-2.11 بار
الذوبان والتبريد-B
0.49 بار
الذوبان والتبريد-C
3.18 بار
تبخر المذيب
0.73 بار
يمكن تحقيق خصائص وتنبؤات محسّنة لسلوك النظام. علاوة على ذلك، فإن تحديد التفاعلات مهم في محاكاة الديناميكا الجزيئية للأنظمة المعقدة، بما في ذلك فهم الخصائص الفيزيائية والكيميائية، وتصميم مضيف أكثر فعالية، وتوقع أداء النظام.
تظهر البيانات المقدمة في الجدول التكميلي 2 أن RTV كان له تفاعل قوي مع PLX خلال محاكاة الديناميكا الجزيئية باستخدام طريقة الانصهار والتبريد. تم اختيار RTV و PLX بسبب توافقهما الكيميائي الجيد والمجموعات الوظيفية التي يمكن أن تشكل روابط هيدروجينية بالإضافة إلى تفاعلات جزيئية أخرى. من المتوقع أن يسهل هذا التوافق التفاعلات القوية بين RTV و PLX خلال محاكاة الديناميكا الجزيئية. يحتوي RTV على مجموعات هيدروكسيل وأميد ومجموعات وظيفية أخرى يمكن أن تتفاعل مع مجموعات الهيدروكسيل على PLX. خلال محاكاة الديناميكا الجزيئية، تتفاعل هذه المجموعات مع بعضها البعض، وتشكل روابط هيدروجينية، وتساهم في استقرار المركب. من خلال التبريد السريع، سمحت طريقة الانصهار والتبريد بتشكيل روابط هيدروجينية بكثافة أعلى وكانت أكثر استقرارًا، مما يعزز التفاعلات بين RTV و PLX في المركب. خلال محاكاة الديناميكا الجزيئية باستخدام طريقة الانصهار والتبريد، قلل التبريد السريع من حركة الجزيئات في مركبات RTV و PLX. عززت هذه الحركة المحدودة التفاعلات الجزيئية وزادت من استقرار المركب. بالإضافة إلى ذلك، يمتلك RTV و PLX أحجام وأشكال هيكلية جزيئية مناسبة، بالإضافة إلى مجموعات وظيفية مناسبة، مما يمكّن من تفاعلات فعالة خلال محاكاة الديناميكا الجزيئية. وهذا يسمح بتفاعلات وثيقة بين كلا المركبين، مما يعزز الروابط والتفاعلات الجزيئية.
طاقة الربط الحرة لمركبات نظام RTV و PLX
في تحليل ميكانيكا الجزيئات منطقة السطح بواسون-بولتزمان (MM-PBSA)، تم تقييم كل تكوين جزيئي لأنظمة RTV و PLX باستخدام طرق الانصهار والتبريد والتبخر بالمذيب من خلال حساب الطاقة الكلية. يتكون هذا من مساهمات من الروابط التساهمية، والتفاعلات الكهروستاتيكية، وتفاعلات فان دير فال، وطاقة الذوبان. تتكون طريقة MM-PBSA من ثلاثة مكونات رئيسية، وهي ميكانيكا الجزيئات (MM)، وبواسون-بولتزمان (PB)، ومنطقة السطح.علاوة على ذلك، تم استخدام MM لحساب الطاقة الجزيئية المحتملة وMD للنظام. تم استخدام PB لنمذجة البيئة الكهربية وقياس التفاعلات بين الجزيئات والبيئة الكهربية. تم استخدام SA لتقدير تأثير الإنتروبيا المتضمن في عملية الربط الجزيئي.
تظهر البيانات المقدمة في الجدول 3 أن مركبات RTV و PLX باستخدام طريقة الانصهار والتبريد كانت لها طاقات ربط حرة جيدة، بقيم قدرها, و -125.18 لطريقة الانصهار والتبريد-A، وطريقة الانصهار والتبريد-B، وطريقة الانصهار والتبريد-C، على التوالي. تظهر هذه الظاهرة أن طريقة الانصهار والتبريد تتضمن عملية تبريد سريعة، مما يسمح بتشكيل تفاعلات جزيئية قوية بين RTV و PLX. في هذه الدراسة، تم اختيار RTV و PLX بناءً على ملاءمة تكامل جزيئاتها، مما سمح بتشكيل روابط قوية داخل المركب. كان كلا المركبين لهما قابلية ذوبان جيدة وألفة لبعضهما البعض، مما عزز تشكيل تفاعلات جزيئية قوية ومستقرة. يجب أن تتفاعل العديد من مجموعات مانحة للروابط الهيدروجينية على RTV، مثل مجموعات -OH و -NH، بشكل إيجابي مع مجموعات قبول الروابط الهيدروجينية -O- على هيكل PLX، مما ينطوي على أن الشبيه يبحث عن شبيه. يعزز هذا التفاعل التكميلي بين مجموعات مانحة للروابط الهيدروجينية ومجموعات قبول الروابط الهيدروجينية تشكيل روابط هيدروجينية مستقرة بين RTV و PLX خلال محاكاة الديناميكا الجزيئية، مما يساهم في الاستقرار العام وسلامة الهيكل للمركب. تنتج طريقة الانصهار والتبريد هيكل مركب كثيف ومنظم للحفاظ على تكوين جزيئي أكثر استقرارًا، مما يساهم في انخفاض طاقة الربط الحرة.
الجدول 3 طاقات الربط الحرة ومكوناتها المقابلة لنظام مركب خلال محاكاة الديناميكا الجزيئية
نظام مركب
Evdw (كج/مول)
Eele (كج/مول)
(كج/مول)
GNP (كج/مول)
GBind (كج/مول)
الانصهار والتبريد-A
-180.78
-37.45
110.55
-22.48
-130.16
الانصهار والتبريد-B
-184.99
-33.10
107.83
-23.35
-133.62
الانصهار والتبريد-C
-178.89
-41.48
118.32
-23.13
-125.18
التبخر بالمذيب
-10.57
-1.23
11.92
-2.97
-2.85
ملاحظات: مساهمة فان دير فال، Eele مساهمة كهروستاتيكية، مساهمة قطبية من إزالة الذوبان، مساهمة غير قطبية من إزالة الذوبان، طاقة الربط الحرة.
نقاش
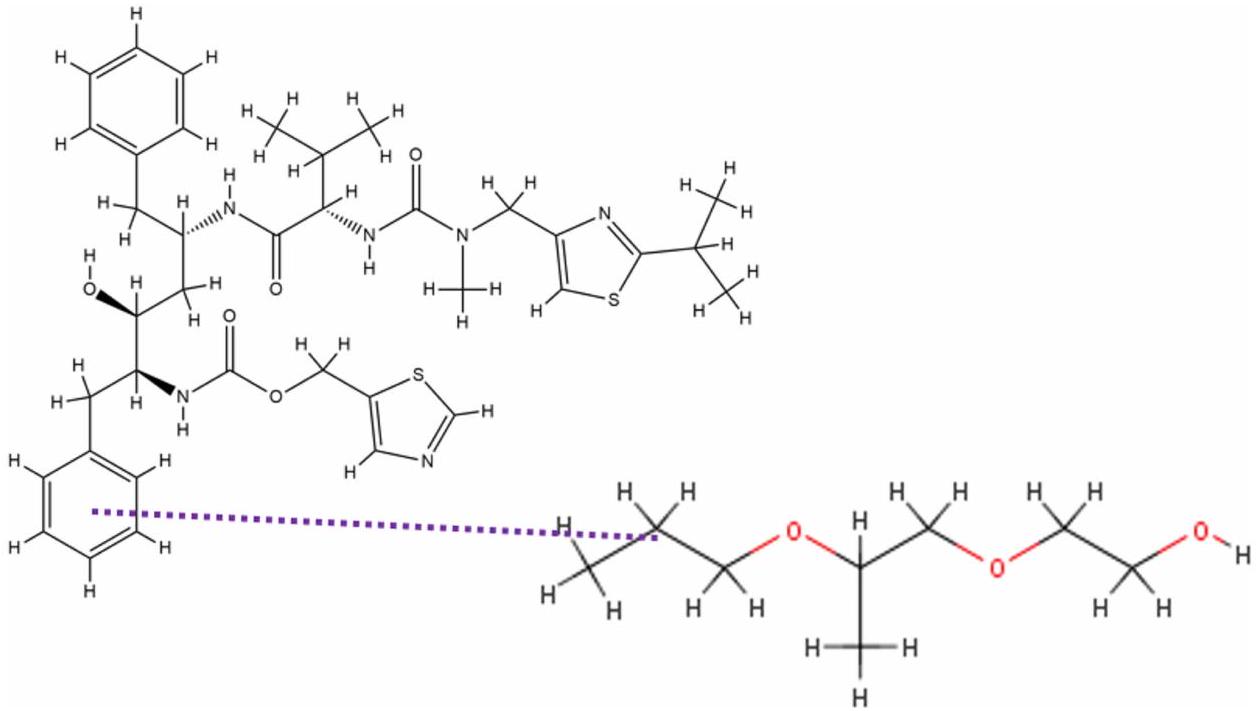
في هذه الدراسة، تم استخدام محاكاة الديناميكا الجزيئية لتقييم التفاعلات بين RTV و PLX بعد أن تم محاكاتها بواسطة طرق التبخر بالمذيب والانصهار والتبريد. يتم تقديم التفاعلات بين RTV و PLX خلال محاكاة طريقة التبخر بالمذيب في الشكل 10.
يوضح الشكل 10 أنه عندما فقد المذيب تمامًا عند 200 نانو ثانية في طريقة التبخر بالمذيب، لم يكن هناك تشكيل للروابط الهيدروجينية بين RTV و PLX. ومع ذلك، تم تشكيل روابط pi-alkyl بين RTV-PLX وتم الحصول على قيمة Tg قدرها، مما يشير إلى أن ASD من RTV-PLX قد تشكلت. أظهر تحليل RMSD أن الحركة الانتقالية لـ RTV قد انخفضت بشكل كبير خلال كلا عمليتي التبخر من خلال إضافة PLX، وهو ما يمكن أن يُعزى إلى التفاعلات الجزيئية بين RTV و PLX. بشكل محدد، يشير تحليل RMSD إلى قمع ملحوظ للحركة الانتقالية في وجود PLX، مما يشير إلى ارتباط أقوى أو تشكيل مركب بين الجزيئين.
عند، بعد التبريد (500 نانو ثانية) في طريقة الانصهار والتبريد بمعدل تبريد قدره، تفاعل RTV مع جزيئين من PLX وشكل 2 روابط هيدروجينية (الشكل 11). تم تشكيل الرابطة الهيدروجينية الأولى بين ذرة O على مجموعة الكربونيل لـ RTV وذرة H على مجموعة الهيدروكسيل لـ PLX. تم تشكيل رابطة هيدروجينية ثانية بين ذرة O على
الشكل 10 التفاعل الذي تم تشكيله بين RTV و PLX خلال محاكاة طريقة التبخر بالمذيب.
الشكل 11 التفاعل الذي تم تشكيله بين RTV و PLX خلال محاكاة طريقة الانصهار والتبريد-A.
مجموعة الكربونيل لـ RTV وذرة H على مجموعة الهيدروكسيل الأخرى لـ PLX. كانت قيمة Tg التي تم الحصول عليها من هذه الطريقة هي، مما يشير إلى أن ASD من RTV-PLX قد تشكلت.
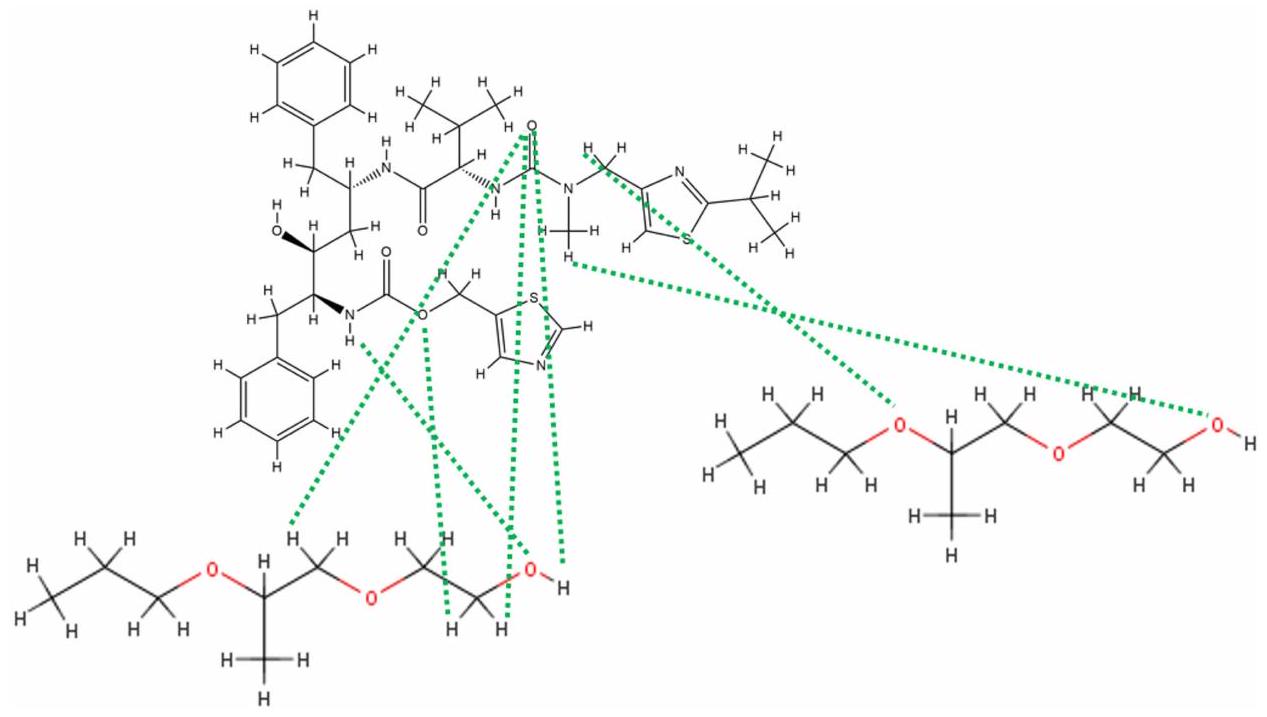
عند، بعد التبريد (500 نانو ثانية) في طريقة الانصهار والتبريد بمعدل تبريد قدرهتفاعل مع جزيئين من PLX وشكل 7 روابط هيدروجينية (الشكل 12). تم تشكيل الرابطة الهيدروجينية الأولى بين ذرة H لمجموعة الهيدروكربون لـ RTV وذرة O لمجموعة الهيدروكسيل لـ PLX. تم تشكيل رابطة هيدروجينية ثانية بين ذرة H لمجموعة الأميد لـ RTV وذرة O لمجموعة الكربونيل لـ PLX. تم تشكيل الرابطة الهيدروجينية الثالثة بين ذرة O لمجموعة الكربونيل لـ RTV وذرة H لمجموعة الهيدروكسيل من PLX الثانية. تم تشكيل الرابطة الهيدروجينية الرابعة بين ذرة O لمجموعة الكربونيل لـ RTV وذرة H لمجموعة الهيدروكربون من PLX الثانية. علاوة على ذلك، تم تشكيل الرابطة الهيدروجينية الخامسة بين ذرة O لمجموعة الكربونيل لـ RTV وذرة H لمجموعة هيدروكربونية أخرى من PLX الثانية. تم تشكيل الرابطة الهيدروجينية السادسة بين ذرة O لمجموعة الكربونيل الأخرى لـ RTV وذرة H لمجموعة الهيدروكربون من PLX الثانية. تم تشكيل الرابطة الهيدروجينية السابعة بين ذرة H لمجموعة الأمين لـ RTV وذرة O لمجموعة الهيدروكسيل من PLX الثانية. كانت قيمة Tg التي تم الحصول عليها من هذه الطريقة هي، مما يشير إلى تشكيل ASD من RTV-PLX.
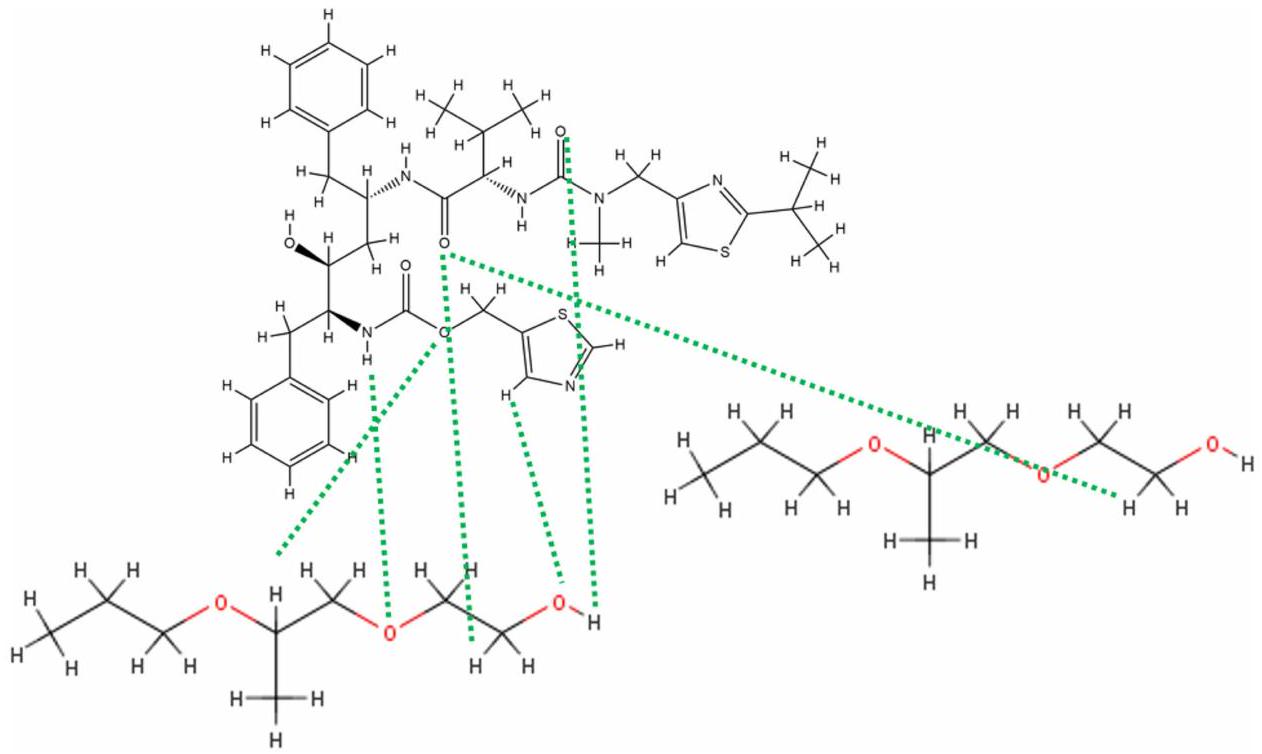
عند، بعد التبريد (500 نانو ثانية) في طريقة الانصهار والتبريد بمعدل تبريد قدرهتفاعل RTV مع جزيئين من PLX وشكل 6 روابط هيدروجينية (الشكل 13). تم تشكيل الرابطة الهيدروجينية الأولى بين ذرة الأكسجين لمجموعة الهيدروكسيل في RTV وذرة الهيدروجين لمجموعة الهيدروكربون في PLX. تم تشكيل الرابطة الهيدروجينية الثانية بين ذرة الأكسجين لمجموعة الكربونيل في RTV وذرة الهيدروجين لمجموعة الكربونيل في PLX الثاني. تم تشكيل الرابطة الهيدروجينية الثالثة بين ذرة الأكسجين لمجموعة الكربونيل في RTV وذرة الهيدروجين لمجموعة الهيدروكربون في PLX الثاني. تم تشكيل الرابطة الهيدروجينية الرابعة بين ذرة الأكسجين لمجموعة الكربونيل في RTV وذرة الهيدروجين لمجموعة الهيدروكربون في PLX الثاني. تم تشكيل الرابطة الهيدروجينية الخامسة بين ذرة الهيدروجين لمجموعة الهيدروكسيل في RTV وذرة الأكسجين لمجموعة الكربونيل في PLX الثاني. علاوة على ذلك، تم تشكيل رابطة هيدروجينية سادسة بين ذرة الهيدروجين على السيكلوبنتين RTV وذرة الأكسجين لمجموعة الهيدروكسيل في PLX الثاني. كانت قيمة Tg التي تم الحصول عليها من هذه الطريقة هيمؤشرًا على تشكيل ASD من RTV-PLX.
كانت قيم RMSD التي تم الحصول عليها من طرق تبخر المذيب، التبريد بالانصهار-A، التبريد بالانصهار-B، والتبريد بالانصهار-C، و على التوالي. يوفر تحليل RMSF معلومات حول التقلبات الذرية في كل جزيء. تؤدي عملية إزالة المذيب في طريقة تبخر المذيب إلى تقلبات ذرية أكبر مقارنة بطريقة التبريد بالانصهار. استنادًا إلى النتائج، كانت قيم RMSF المتوسطة التي تم الحصول عليها من طرق تبخر المذيب، والتبريد بالانصهار-A، والتبريد بالانصهار-B، والتبريد بالانصهار-C هي، و 1.07 ، على التوالي. تم استخدام تحليل RDF لوصف ميل جزيئات معينة مثل الذرات أو الجزيئات للوجود على مسافات محددة من جزيء مرجعي. بالمقارنة مع طريقة التبريد بالانصهار، فإن استخدام المذيب في مذيب-
الشكل 12 التفاعل الذي تم تشكيله بين RTV و PLX خلال محاكاة طريقة الذوبان والتبريد-B.
الشكل 13 التفاعل الذي تم تشكيله بين RTV و PLX خلال محاكاة طريقة الذوبان والتبريد.
تأثرت التفاعلات والترتيب المكاني بين RTV و PLX بطريقة التبخر. كانت قيم RDF المتوسطة التي تم الحصول عليها من طرق تبخر المذيب، والتبريد بالانصهار-A، والتبريد بالانصهار-B، والتبريد بالانصهار-C هي، و ، على التوالي. توفر قيم Rg معلومات حول ما إذا كانت الجزيئات أكثر كثافة أو انفتاحًا، حيث تشير قيم Rg المنخفضة إلى توافق جيد في النظام خلال المحاكاة. تتيح طريقة التبريد بالانصهار قياس Rg في حالة صلبة مستقرة مقارنةً بطريقة تبخر المذيب. في هذه الدراسة، كانت قيم Rg المتوسطة التي تم الحصول عليها من طرق تبخر المذيب، والتبريد بالانصهار-A، والتبريد بالانصهار-B، والتبريد بالانصهار-C هي ، و 1.11 نانومتر، على التوالي. تم استخدام تحليل SASA لمجمعات RTV و PLX لفهم تعرض سطح الجزيئات في المجمع للمذيبات أو البيئة المحيطة. كانت قيم SASA المتوسطة التي تم الحصول عليها من طرق تبخر المذيب، التبريد بالانصهار-A، التبريد بالانصهار-B، والتبريد بالانصهار-C هي، و على التوالي. علاوة على ذلك، ساعدت ملاحظة الروابط الهيدروجينية في فهم التفاعلات بين هذه الجزيئات وقدمت رؤى حول استقرار المعقدات.
الخاتمة
في الختام، تم التحقيق في ASD من RTV مع PLX باستخدام محاكاة الديناميكا الجزيئية. تم تأكيد صحة محاكاة الديناميكا الجزيئية، التي تحاكي طريقة تبخر المذيب وتبريد الانصهار، من خلال حساب قيم Tg لـ RTV/PLX ومقارنتها مع Tg التجريبية. أظهرت محاكاة الديناميكا الجزيئية لصيغة RTV/PLX غير المتبلورة أن الحركة الانتقالية لـ RTV كانت مكبوحة بسبب إضافة PLX خلال عملية تبخر المذيب وعملية التبريد. تم تشكيل روابط البايلك في RTV-PLX بعد إزالة المذيب بالكامل خلال طريقة تبخر المذيب. في الوقت نفسه، تم تشكيل تفاعلات الروابط الهيدروجينية بين RTV وPLX خلال محاكاة طريقة تبريد الانصهار. أثر معدل عملية التبريد على كمية تشكيل الروابط الهيدروجينية بين RTV وPLX. تلعب التفاعلات بين RTV وPLX أيضًا دورًا مهمًا في استقرار الأفلام غير المتبلورة. توفر هذه الدراسة رؤى أساسية في الدراسات الحاسوبية التي يمكن استخدامها كأداة قوية لتصميم صيغ غير متبلورة للأدوية ذات الذوبان الضعيف في الماء. تظهر النتائج أن الطريقة الحاسوبية لمحاكاة الديناميكا الجزيئية تمكن من تقييم التفاعلات بين الجزيئات بين الأدوية والبوليمرات. كما راقبت هذه الطريقة الديناميات والتفاعلات، مما سهل فحص البوليمر المناسب في صياغة ASD.
الشكر والتقدير
نود أن نشكر جامعة بادجادجاران على دعمها لهذا العمل وAPC.
تمويل
تم تمويل هذا البحث من قبل جامعة بادجادجاران (بحث بيانات المكتبة والإنترنت) لدياه ليا أوليفا رقم 1549/ UN6.3.1/PT.00/2023 في 27 مارس 2023.
الإفصاح
يعلن المؤلفون عدم وجود أي تضارب في المصالح في هذا العمل.
References
Budiman A, Megantara S, Raraswati P, Qoriah T. Solid dosage form development of glibenclamide with increasing the solubility and dissolution rate using cocrystallization. Intl J App Pharm. 2018;10(6):181-186. doi:10.22159/ijap.2018v10i6.29257
Kawabata Y, Wada K, Nakatani M, Yamada S, Onoue S. Formulation design for poorly water-soluble drugs based on biopharmaceutics classification system: basic approaches and practical applications. Int J Pharm. 2011;420(1):1-10. doi:10.1016/j.ijpharm.2011.08.032
Budiman A, Husni P, Alfauziah TQ, Alfauziah TQ. The development of glibenclamide-saccharin cocrystal tablet formulations to increase the dissolution rate of the drug. Intl J App Pharm. 2019;11(4):359-364. doi:10.22159/ijap.2019v11i4.33802
Hancock BC, Zografi G. Characteristics and significance of the amorphous state in pharmaceutical systems. J Pharm Sci. 1997;86(1):1-12. doi:10.1021/js9601896
Yu L. Amorphous pharmaceutical solids: preparation, characterization and stabilization. Adv Drug Deliv Rev. 2001;48(1):27-42. doi:10.1016/ S0169-409X(01)00098-9
Baghel S, Cathcart H, O’Reilly NJ. Polymeric amorphous solid dispersions: a review of amorphization, crystallization, stabilization, solid-state characterization, and aqueous solubilization of biopharmaceutical classification system class II drugs. J Pharm Sci. 2016;105(9):2527-2544. doi:10.1016/j.xphs.2015.10.008
Hancock BC, Parks M. What is the true solubility advantage for amorphous pharmaceuticals? Pharm Res. 2000;17(4):397-404. doi:10.1023/ A:1007516718048
Bogner RH, Murdande SB, Pikal MJ, Shanker RM. Solubility advantage of amorphous pharmaceuticals: II. application of quantitative thermodynamic relationships for prediction of solubility enhancement in structurally diverse insoluble pharmaceuticals. Pharm Res. 2010;27 (12):2704-2714. doi:10.1007/s11095-010-0269-5
Brouwers J, Brewster ME, Augustijns P. Supersaturating drug delivery systems: the answer to solubility-limited oral bioavailability? J Pharm Sci. 2009;98(8):2549-2572. doi:10.1002/jps. 21650
Okada H, Ueda K, Yasuda Y, et al. Correlation between drug dissolution and resistance to water-induced phase separation in solid dispersion formulations revealed by solid-state NMR spectroscopy. Int J Pharm. 2020;577:119086. doi:10.1016/j.ijpharm.2020.119086
Vasconcelos T, Marques S, Das Neves J, Sarmento B. Amorphous solid dispersions: rational selection of a manufacturing process. Adv Drug Deliv Rev. 2016;100:85-101. doi:10.1016/j.addr.2016.01.012
Janssens S, Van den Mooter G. Review: physical chemistry of solid dispersions. J Pharm Pharmacol. 2009;61(12):1571-1586. doi:10.1211/jpp/ 61.12.0001
Ueda K, Higashi K, Yamamoto K, Moribe K. The effect of HPMCAS functional groups on drug crystallization from the supersaturated state and dissolution improvement. Int J Pharm. 2014;464(1-2):205-213. doi:10.1016/j.jjpharm.2014.01.005
Barmpalexis P, Karagianni A, Kachrimanis K. Molecular simulations for amorphous drug formulation: polymeric matrix properties relevant to hot-melt extrusion. Eur J Pharm Sci. 2018;119:259-267. doi:10.1016/j.ejps.2018.04.035
Xiang TX, Anderson BD. Molecular dynamics simulation of amorphous indomethacin-poly(Vinylpyrrolidone) glasses: solubility and hydrogen bonding interactions. J Pharm Sci. 2013;102(3):876-891. doi:10.1002/jps. 23353
Gupta J, Nunes C, Vyas S, Jonnalagadda S. Prediction of solubility parameters and miscibility of pharmaceutical compounds by molecular dynamics simulations. J Phys Chem B. 2011;115(9):2014-2023. doi:10.1021/jp108540n
Huynh L, Grant J, Leroux JC, Delmas P, Allen C. Predicting the solubility of the anti-cancer agent docetaxel in small molecule excipients using computational methods. Pharm Res. 2008;25(1):147-157. doi:10.1007/s11095-007-9412-3
Yang H, Li ZS, Qian HJ, et al. Molecular dynamics simulation studies of binary blend miscibility of poly (3-hydroxybutyrate) and poly(ethylene oxide). Polymer. 2004;45(2):453-457. doi:10.1016/j.polymer.2003.11.021
Ma X, Higashi K, Fukuzawa K, et al. Computational approach to elucidate the formation and stabilization mechanism of amorphous formulation using molecular dynamics simulation and fragment molecular orbital calculation. Int J Pharm. 2022:615. doi:10.1016/j.jjpharm.2022.121477
Baird JA, Van Eerdenbrugh B, Taylor LS. A classification system to assess the crystallization tendency of organic molecules from undercooled melts. J Pharm Sci. 2010;99(9):3787-3806. doi:10.1002/jps. 22197
Budiman A, Aulifa DL. A comparative study of the pharmaceutical properties between amorphous drugs loaded-mesoporous silica and pure amorphous drugs prepared by solvent evaporation. Pharmaceuticals. 2022;15(6):730. doi:10.3390/ph15060730
Budiman A, Aulifa DL. Characterization of drugs with good glass formers in loaded-mesoporous silica and its theoretical value relevance with mesopores surface and pore-filling capacity. Pharmaceuticals. 2022;15(1):93. doi:10.3390/ph15010093
Huang H, Simmerling C. Fast pairwise approximation of solvent accessible surface area for implicit solvent simulations of proteins on CPUs and GPUs. J Chem Theory Comput. 2018;14(11):5797-5814. doi:10.1021/acs.jctc.8b00413
Kobayashi A, Nakajima M, Noguchi Y, Morikawa R, Matsuo Y, Takasu M. Molecular dynamics simulation of the complex of PDE5 and evodiamine. Life. 2023;13(2):578-592. doi:10.3390/life13020578
Budiman A, Kalina K, Aristawidya L, Al Shofwan AA, Rusdin A, Aulifa DL. Characterizing the impact of chitosan on the nucleation and crystal growth of ritonavir from supersaturated solutions. Polymers. 2023;15(5):1282. doi:10.3390/polym15051282
Khan AA, Mudassir J, Akhtar S, Murugaiyah V, Darwis Y. Freeze-dried lopinavir-loaded nanostructured lipid carriers for enhanced cellular uptake and bioavailability: statistical optimization, in vitro and in vivo evaluations. Pharmaceutics. 2019;11(2):97. doi:10.3390/pharmaceutics11020097
Arca HÇ, Mosquera-Giraldo LI, Dahal D, Taylor LS, Edgar KJ. Multidrug, anti-HIV amorphous solid dispersions: nature and mechanisms of impacts of drugs on each other’s solution concentrations. Mol Pharm. 2017;14(11):3617-3627. doi:10.1021/acs.molpharmaceut.7b00203
Siriwannakij N, Heimbach T, Serajuddin ATM. Aqueous dissolution and dispersion behavior of polyvinylpyrrolidone vinyl acetate-based amorphous solid dispersion of ritonavir prepared by hot-melt extrusion with and without added surfactants. J Pharm Sci. 2021;110 (4):1480-1494. doi:10.1016/j.xphs.2020.08.007
de Alvarenga BR, Moseson DE, Carneiro RL, Taylor LS. Impact of polymer type on thermal degradation of amorphous solid dispersions containing ritonavir. Mol Pharm. 2022;19(1):332-344. doi:10.1021/acs.molpharmaceut.1c00823
Zhao Y, Xie X, Zhao Y, et al. Effect of plasticizers on manufacturing ritonavir/copovidone solid dispersions via hot-melt extrusion: preformulation, physicochemical characterization, and pharmacokinetics in rats. Eur J Pharm Sci. 2019;127:60-70. doi:10.1016/j.ejps.2018.10.020
Muchtaridi M, Triwahyuningtyas D, Muhammad Fakih T, Megantara S, Choi SB. Mechanistic insight of -mangostin encapsulation in 2-hydro-xypropyl- -cyclodextrin for solubility enhancement. J Biomol Struct Dyn. 2023;1-10. doi:10.1080/07391102.2023.2214237
Farmer J, Kanwal F, Nikulsin N, Tsilimigras MCB, Jacobs DJ. Statistical measures to quantify similarity between molecular dynamics simulation trajectories. Entropy. 2017;19(12):646-662. doi:10.3390/e19120646
Ghahremanian S, Rashidi MM, Raeisi K, Toghraie D. Molecular dynamics simulation approach for discovering potential inhibitors against SARS-CoV-2: a structural review. J Mol Liq. 2022;354:118901-118912. doi:10.1016/j.molliq.2022.118901
He Q, Liu J, Zhang M, Zhai Z, Jiang B. Molecular dynamics simulation on the effect of self-resistance electric heating on carbon fiber surface chemical properties and Fiber/PP interfacial behavior. Polymers. 2022;14(5):1043. doi:10.3390/polym14051043
Genheden S, Ryde U. The MM/PBSA and MM/GBSA methods to estimate ligand-binding affinities. Expert Opin Drug Discov. 2015 ;10 (5):449-461. doi:10.1517/17460441.2015.1032936
Advances and Applications in Bioinformatics and Chemistry
Dovepress
انشر عملك في هذه المجلة
التقدمات والتطبيقات في المعلوماتية الحيوية والكيمياء هي مجلة دولية محكمة ومفتوحة الوصول تنشر مقالات في المجالات التالية: النمذجة الحيوية الحاسوبية؛ المعلوماتية الحيوية؛ الجينوميات الحاسوبية؛ النمذجة الجزيئية؛ نمذجة بنية البروتين والجينوميات الهيكلية؛ علم الأحياء النظامي؛ الكيمياء الحيوية الحاسوبية؛ الفيزياء الحيوية الحاسوبية؛ الكيمياء المعلوماتية وتصميم الأدوية؛ التنبؤ بـ ADME/Tox باستخدام الحاسوب. نظام إدارة المخطوطات بالكامل عبر الإنترنت ويشمل نظام مراجعة الأقران سريع وعادل، وهو سهل الاستخدام. زيارةhttp://www.dovepress.com/testimonials.phpلقراءة اقتباسات حقيقية من مؤلفين منشورين.
Elucidation of Molecular Interactions Between Drug-Polymer in Amorphous Solid Dispersion by a Computational Approach Using Molecular Dynamics Simulations
Diah Lia Aulifa (D) , Adnan Aly Al Shofwan , Sandra Megantara , Taufik Muhammad Fakih , Arif Budiman ‘Department of Pharmaceutical Analysis and Medicinal Chemistry, Faculty of Pharmacy, Universitas Padjadjaran, Sumedang, Indonesia; Department of Pharmaceutics and Pharmaceutical Technology, Faculty of Pharmacy, Universitas Padjadjaran, Sumedang, Indonesia; Department of Pharmacy, Faculty of Mathematics and Natural Sciences, Universitas Islam Bandung, Bandung, IndonesiaCorrespondence: Diah Lia Aulifa, Department of Pharmaceutical Analysis and Medicinal Chemistry, Faculty of Pharmacy, Universitas Padjadjaran, Jl. Raya Bandung-Sumedang Km. 2I, Sumedang, 45363, Indonesia, Email diah.lia@unpad.ac.id
Abstract
Introduction: Amorphous drug dispersion is frequently used to enhance the solubility and dissolution of poorly water-soluble drugs, thereby improving their oral bioavailability. The dispersion of these drugs into polymer matrix can inhibit their recrystallization. The inter-molecular interactions between drug and polymer plays a role in the improvement of the dissolution rate, solubility, and physical stability of drug. Aim: This study aims to investigate the formation and interactions of ritonavir (RTV)/poloxamer (PLX) amorphous formulation using a computational approach via molecular dynamics (MD) simulations, which mimicked solvent evaporation and melt-quenching method. Methods: TheRoot Mean Square Deviation (RMSD) value, Root Mean Square Fluctuation (RMSF), Radial Distribution Function (RDF), Radius of Gyration (Rg), Solvent Accessible Surface Area (SASA), and hydrogen bond interactions were analyzed to determine interaction mechanisms between RTV and PLX in amorphous solid dispersion. Results: The pi-alkyl bonds between RTV and PLX were formed after simulations of solvent evaporation, while the hydrogen bond interactions of RTV-PLX was observed during melt method simulations. These results indicate the successful formulation of amorphous solid dispersion (ASD) from RTV and PLX. The RMSD values obtained from the solvent evaporation, melt-cooling-A, melt-cooling-B, and melt-cooling-C methods were , and , respectively, while the average RMSF values were , and , respectively. This indicates that the suppression of translational motion of RTV from the melt method can be stronger than solvent evaporation caused by the intermolecular interactions of RTV-PLX. Conclusion: MD simulations helped in understanding the formation and interaction mechanisms of ASD formulations that were difficult to detect by experimental approaches.
Approximately of new drug candidates are poorly water-soluble, resulting in insufficient bioavailability when administered orally. To overcome this problem, drug amorphization has emerged as a promising strategy for improving drug solubility due to its higher free energy compared to crystalline counterparts. This shows that drug in amorphous state can generate supersaturated solutions in water, leading to the improvement of oral bioavailability. However, crystallization of amorphous drug formulation commonly occurs during storage and dissolution due to its thermodynamic instability.
Amorphous solid dispersion (ASD) is one of the promising strategies to stabilize amorphous drug by dispersing it into polymer matrix. Therefore, ASD has been widely used by the pharmaceutical industry to enhance the oral bioavailability of poorly soluble drugs. Intermolecular interactions between drugs and polymers play a critical role in the stabilization of amorphous drug in ASD, thereby reducing molecular mobility. A suitable polymer can also contribute to the stabilization of amorphous drug during storage and maintenance of its supersaturated solution. This shows the need to understand molecular interactions between drugs and polymers in ASD as a prerequisite for predicting the miscibility of drug-carriers that contribute to the stabilization of amorphous drug.
Currently, computational simulations such as molecular dynamics (MD) have been widely used in pharmaceutical formulation studies. MD simulations provide detailed atomic-level structural information that is often challenging to obtain experimentally but can be used to predict the miscibility of drug-excipient. In ASD systems, MD simulations are important tools to investigate drug-polymer interactions patterns, drug-polymer miscibility, and the formation of ASD. By using these simulations, a model of drug-excipient glasses and an understanding of their solubility/ miscibility properties can be developed. Although previous studies have reported the use of MD simulations to predict the miscibility of drugs with certain pharmaceutical carriers, the underlying molecular interactions between drugs and polymers in ASD systems, which mimicked solvent evaporation and melt-quenching methods, have not been investigated. Therefore, the comparison study of drug-polymer interactions in ASD system using MD simulations from both methods is important as a guideline for further experimental laboratory study.
This study aims to investigate the formation of ASD system and interactions of ritonavir (RTV) – poloxamer (PLX) in ASD formulation using a computational approach via MD simulations, which mimicked the solvent evaporation and the melt-quenching method. RTV was used as a model of the poorly water-soluble drug due to its low recrystallization tendency, categorized as class III according to Taylor’s classification. A previous study reported that amorphous RTV can be formed by solvent-evaporation and melt-cooling methods. This makes it necessary to evaluate the comparison of RTV-polymer interactions in ASD system via MD simulations. This approach mimicked solvent evaporation and melt-quenching method to determine the potential of polymers in enhancing the pharmaceutical properties of amorphous drugs.
Materials and Methods
RTV and PLX Structure Preparation
The description and optimization of ligand structures were carried out before being used in MD processes. In this study, molecular structures used included RTV and PLX, downloaded from PubChem (http://pubchem.ncbi.nlm.nih.gov) (Figure 1). Subsequently, two-dimensional (2D) structures were described using the ChemDraw Professional 16.0 program and three-dimensional (3D) structures were obtained by converting 2D structures into 3D using the Chem3D 16.0 program. The ligand structure was optimized with GaussView 5.0.8 and Gaussian 09 using the Density Functional Theory (DFT) method with 6-31 basis sets. The optimized structure was added to polar hydrogen atoms and Gasteiger partial charge data with the AutoDock 4.2 program with MGLTools 1.5.6.
Preparation of Melt-Cooling Systems
In the melt-cooling method, the system was made without using the addition of solvents. In this study, the melt-cooling system was built using 1 molecule of RTV and 25 molecules of PLX, formed by six-coordinate points with simulations box size of and a tolerance distance of between molecules. The system was created using the PACKMOL (Initial Configurations for MD Simulations by packing optimization) program.
Preparation of Solvent-Evaporation Systems
The solvent-evaporation method involves the addition of ethanol solvent in the system construction. In this study, a solvent-evaporation system was constructed using 1 molecule of RTV, 25 molecules of PLX, and 1440 molecules of ethanol, formed by six-coordinate points with a simulated box size of and a tolerance distance of 0.2 nm between molecules. The solvent-evaporation system was created using the PACKMOL (Initial configuration for MD
Figure I (a) The Structure of Ritonavir (RTV); (b) The Structure of Poloxamer (PLX).
Simulations with packing optimization) pro-gram. The constructed ethanol solvent system is equilibrated for a 2fs time step before adding RTV and PLX.
Molecular Dynamics Simulation of Melt-Cooling Systems
MD simulations were carried out on three melt-cooling system complexes that had been formed. These systems were characterized by different cooling rates, namely (Melt-Cooling-A), (Melt-Cooling-B), and (Melt-Cooling-C) using the Gromacs 2016.3 program with AMBER99SB-ILDN and AMBER (GAFF) common force fields. Topology and molecular parameterization of RTV and PLX were created using the Antechamber Python Parser interface (ACPYPE) program. Subsequently, long-distance electrostatic forces were determined using the Ewald Particle Mesh method. System neutralization was carried out by adding sodium ( ) and chloride ( ) ions. The preparation stage for MD simulations includes minimization, temperature equilibrium, and pressure equilibrium. Berendsen thermostats and barostats are used during the heating stage, with the pressure being maintained at 1 bar. In this simulation, a large canonical ensemble is used to model molecular systems. The large canonical ensemble maintains constant particle count , volume , and temperature throughout the simulation to investigate molecular motion and thermodynamic properties. The process was continued with simulations process (production run) with a 2 fs timestep. The production run process included setting the temperature from to with a heating rate of and maintained at a temperature of . The system was cooled down to a temperature of with a variation of the cooling rate of , and . Simulations for 500 ns were carried out on all systems until they reached a stable state based on analysis of energy, pressure, temperature, and Root Mean Square Deviation (RMSD).
Molecular Dynamics Simulation of Solvent-Evaporation Systems
MD simulations were carried out on complex solvent-evaporation systems that had been formed using the Gromacs 2016.3 program with AMBER99SB-ILDN and AMBER (GAFF) general force fields. The topology and molecular parameterization of RTV and PLX were created using the AnteChamber Python Parser interface (ACPYPE) program. Long-distance electrostatic forces were determined using the Ewald Particle Mesh method. System neutralization was carried out by adding sodium ( ) and chloride ( ) ions. Berendsen thermostats and barostats are used during the heating stage, with the pressure being maintained at 1 bar. In this simulation, a large canonical ensemble is used to model molecular systems. The large canonical ensemble maintains constant particle count (N), volume (V), and temperature (T) throughout the simulation to investigate molecular motion and thermodynamic properties. The preparation stage for MD simulations included minimization, temperature equilibrium, and pressure equilibrium, which was continued with
simulations process (production run) with a 2 fs timestep. The production run process included setting the temperature from to with a heating rate of and maintained at . Subsequently, the system was cooled down to a temperature of with a variation of cooling rate of . Simulations for 500 ns were carried out on all systems until they reached a stable state based on analysis of energy, pressure, temperature, and the RMSD.
Analysis of Molecular Dynamics Simulation Results
The root-mean-square deviation (RMSD), root-mean-square fluctuation (RMSF), radial distribution function (RDF), radius of gyration (Rg), solvent-accessible surface area (SASA), and number of hydrogen bonds were calculated and analyzed for the complexes. These calculations were performed using Gromacs 2016.3 modules. RMSD is defined by
where N is the number of atoms, mi is the mass of atom i , t 0 is the start time of the simulation, t is time, and ri is the position of atom i. This calculation was performed after fitting was done using the least-squares method. RMSF is defined by
where t is time, T 0 is the reference time for the calculation, T is time at the end, ri is position of atom i , and [ri]t is position averaged over time of atom i. The relationship between RMSF and B-factor Bi is
where RMSFi is the RMSF of atom i. RDF is defined by
where is the distance between a pair of particles, is the average number of atom pairs found at a distance between r and is the total volume of the system, and N pairs is the number of unique pairs of atoms. Rg is defined by
where mi is the mass of atom i , and ri is the position of atom i . SASA is defined by
The SASA of each atom in an RTV and PLX configuration is its maximum surface area ( shielded ) subtracting the patches shielded by close neighbor atoms ( shielded ).
In the context of polymers, the term SASAi refers to the solvent-accessible surface area of an atom, which corresponds to the surface area of an isolated sphere centered on that atom. Due to the presence of covalent bonds in all atoms within polymers, it ensures that atoms are never fully exposed to the solvent (Figure 2). Hydrogen bond formation was assessed based on measurements of the distance and angle between the donor atom, acceptor atom, and hydrogen atom. Hydrogen bonds are considered to exist if two conditions are satisfied (Supplementary Figure 1). Firstly, the distance between the donor and acceptor atoms was less than 0.30 nm . Secondly, the angle formed by the hydrogen, donor, and acceptor atoms was less than 30 degrees.
Figure 2 Conditions for Calculating Solvent-Accessible Surface Area (SASA). Reprinted (adapted) with permission from Huang H, Simmerling C. Fast Pairwise Approximation of Solvent Accessible Surface Area for Implicit Solvent Simulations of Proteins on CPUs and GPUs. J Chem Theory Comput. 2018;14(11):5797-5814. Copyright 2023 American Chemical Society.
Results
According to a previous study, RTV crystal showed a melting peak at , while amorphous RTV prepared by solvent evaporation and melt method showed a glass transition event at and , respectively. After heating, the melting peak of RTV was not observed, indicating that amorphous state can be formed by solvent evaporation and melt method. Based on Taylor’s classification, RTV was categorized in class III, which had a stable amorphous form. Therefore, the preparation of RTV and polymer using solvent evaporation and melt method can form RTV in amorphous state.
Molecular Simulating Motions of RTV and PLX
Molecular motions of each Melt-Cooling-A, Melt-Cooling-B, and Melt-Cooling-C complex system were analyzed using the paths as shown in Figure 3. The trajectories were extracted at the start of the simulations at 0 ns and at the end at 500 ns with 50 ns intervals. Based on the visualization of each pathway, PLX was predicted as a good complexing agent for RTV molecule. At 50 ns , the MD simulations showed that PLX bind to RTV molecule and was stable until the end of simulations. In this case, the oxyethylene moiety in PLX structure was hydrophilic, which allowed it to interact with hydrophobic agents such as RTV. PLX also increased the solubility of RTV in the molten phase and formed a stable solution. Furthermore, PLX acted as a protective agent against RTV degradation and oxidation during the melt-cooling process. By forming a complex with RTV, PLX can protect drug from damage caused by heat and oxygen during the cooling process. PLX can also modify the physical properties of drug mixture, thereby affecting various aspects of RTV such as particle size, crystallinity, and drug release ability. This indicates that PLX has the potential to improve the physical properties and stability of RTV. PLX was also selected in this study based on the screening conducted using in silico method (docking simulation). The results of this study showed that PLX has better molecular interaction with ritonavir compared to other polymers (data presented in Supplementary Table 1).
A significant difference was shown by RTV and PLX complexes in the solvent-evaporation method using ethanol solvent, from 0 ns to the end of simulations at 500 ns , as they were unable to form a perfect complex. Furthermore, the ethanol solvent evaporated when MD simulations reached 200 ns to 500 ns , as presented in Figure 4. This phenomenon occurred because the chemical interactions between RTV, PLX, and ethanol interfered with the formation of complexes. These molecular interactions can produce new unwanted products or destroy complex structures that were expected to form. The solvent-evaporation method involves evaporating the solvent to form a complex. However, the rapid
Figure 3 Molecular Motion of the Complex System During Molecular Dynamics Simulations using Melt-Cooling Methods.
evaporation of ethanol can affect the stability and integrity of the complex. Some complexes also formed when the solvent evaporated but were unstable in the long term due to changes or increase in temperature. When complexes are unstable, they can break down or separate back into their original components over time.
Conformational Changes During Molecular Dynamics Processes
RMSD was measured to confirm structural changes during MD simulations. RMSD was employed as one of the metrics used to check the correlation of MD simulations with the reference structure. This was carried out to monitor the conformational changes of the molecule during simulations and compare it with the initial or reference structure. In this study, the RMSD values of the four RTV and PLX complex systems were calculated, and the conformational changes were observed by plotting the RMSD over simulations. The graph in Figure 5 shows the conformational changes of RTV and PLX complexes using the melt-cooling and solvent evaporation methods during MD simulations. By considering the RSMD graph, we can depict the stability of the polymer complex formed during the simulation. This complex stability confirms that PLX is suitable for forming a complex with RTV.
The solvent-evaporation method involves the removal of ethanol solvent from the system through evaporation. This process affects the initial conformation of the molecule or molecular complex of RTV and PLX. During solventevaporation, the molecules or complexes dissolved in the solvent experienced changes in interactions. When the solvent
Figure 4 Molecular Motion of the Complex System During Molecular Dynamics Simulations using Solvent Evaporation Methods.
is removed, interactions with the solvent are no longer present, thereby affecting the conformational stability of the molecule or complex. This phenomenon is evidenced by the average RMSD value from the solvent-evaporation method, which falls within the range of , indicating the stability of the formed polymer during the process. This process
Figure 5 Comparison of the Root Mean Square Deviation (RMSD) Graphs of the Complex Systems During Molecular Dynamics Simulations.
also involves changing environmental conditions from a solution to a solid phase, which affects interactions between molecules or complexes with the surrounding environment. Meanwhile, the melt-cooling method involves melting and cooling of a complex system. This process maintains a more stable conformation of the molecule or complex because it does not involve significant changes in the environment and interactions with the solvent. Therefore, the fluctuations in interaction distance on the RMSD graph tend to be smaller when using the melt cooling method.
RMSF graphs were used to understand atomic fluctuations in a system during MD simulations. RMSF measures the extent to which the positions of atoms in simulations fluctuate from their average positions over a given period. In this case, several atoms considered for displacement include carbon , hydrogen , oxygen , nitrogen , sulfur , and phosphorus . Furthermore, RMSF chart observations provided insight into the degree of flexibility or stability of atoms. In the RTV and PLX complexes, the solvent evaporation method exhibits considerable atomic displacement fluctuations in the RMSF graph compared to the melt cooling approach, as shown in Figure 6. This phenomenon arises
Figure 6 Comparison of the Root Mean Square Fluctuation (RMSF) Graphs of the Complex Systems During Molecular Dynamics Simulations.
due to the solvent evaporation method involving interactions with the solvent in the system, thereby affecting the interactions between the RTV and PLX molecules. The displacement of atoms in the solvent evaporation method increases after reaching 100 ns , concurrent with the rise in temperature within the system. These interactions affect the stability, flexibility, and initial conformation of complex molecules due to variations in the environment and interactions when the solvent is removed. Meanwhile, the melt-cooling method involves melting and cooling of complex systems. This process attenuates atomic vibrations and reduces any fluctuations that occur in the system. The solventevaporation method involves changing environmental conditions from a liquid to a solid phase, resulting in a dry state. These changes caused an increase in atomic fluctuations and produced more fluctuations in the RMSF chart.
Increased Solubility of the RTV in the Presence of PLX
Radial distribution function (RDF) analysis of RTV and PLX complexes using the melt-cooling and solvent evaporation methods was used to understand the spatial relationship between the molecules in the system. RDF describes the tendency of certain particles such as atoms or molecules to exist at a certain distance from a reference particle. Specifically, RDF measured the relative density of RTV and PLX particles along a radial distance from a reference. The considered radial distance uses the RTV center as the origin and measures the number of PLX molecular centers at specific points along the radial axis. In RTV and PLX complexes, RDF provided information on the spatial distribution of PLX around RTV and vice versa. This assisted in understanding interactions between RTV and PLX, including spatial arrangement, possible hydrogen bonding, and formation of complex structures.
The RDF graph in Figure 7 shows that the rate of formation of complexes between RTV and PLX results in stronger interactions between PLX molecular atoms and the neighboring RTV molecular atoms when the melt-cooling process is used. This phenomenon can be observed due to the presence of sharp and flat peaks at certain points in the molecular dynamic simulation in the RDF graph of the melt-cooling method. Moreover, the melt-cooling method involves cooling the mixture to form a solid state of the complex. In solid state, the complex molecules are arranged orderly thereby conserving their interactions. The method also allows the formation of RTV and PLX complexes to occur directly while cooling the mixture. This allows the PLX and RTV complex molecules to be properly organized and prevents potential errors or unwanted changes in their structures during the solvent evaporation process. Additionally, it helps prevent degradation that may occur in the molecular structure of the complexes during this process. However, the solventevaporation method involves the evaporation of the solvent to form complexes. This process can lead to the formation of larger aggregates from the dissolved particles in the solvent (Figure 4). These large aggregates can interfere with RDF
Figure 7 Comparison of the Radial Distribution Function (RDF) Graphs of the Complex Systems During Molecular Dynamics Simulations.
analysis because they did not represent the true distribution of complex particles. The melt-cooling method tends to circumvent this problem by forming the complex directly in solid state. Furthermore, in the solvent-evaporation method, the solvent had a significant presence in the complex formation process that can affect interactions and spatial distribution between RTV and PLX. In the melt-cooling method, no solvent was involved after cooling the mixture, allowing RDF analysis to focus more on interactions between the complex components.
Packaging and Compactness of the RTV and PLX Complexes
Radius of gyration (Rg) of molecular inclusion model was measured to investigate cohesiveness in RTV and PLX complexes. The Rg measured how dispersed the particles were in the system, by calculating the average distance of the PLX particles from the center of mass of the RTV molecule. Furthermore, the Rg provided information about the conformation of a molecule, indicating whether a molecule was more compact or open. It also showed more about the flexibility of a molecule, indicating how easily a molecule can change shape or move. When the Rg value was low, the cohesiveness of molecular inclusion model shows good conformation in the system during simulations.
Figure 8 shows the fluctuation of the Rg as a function of time for the simulated model. At Rg of 500 ns , RTV and PLX complexes using the melt-cooling method exhibited more stability with the solvent-evaporation method. The meltcooling method allows the formation of RTV and PLX complexes in the solid state, which represents the actual state such as in encapsulated or crystalline drug formulations. In the solid state, the spatial distribution of complex molecules was more organized and stable, leading to the accurate measurement of Rg by the melt-cooling method. The melt-cooling method also allows the complex formation to occur directly through the process of cooling the mixture. This process allows for finer control of factors such as temperature, time, and cooling rate, which affect the structure and properties of the complex. In the solvent-evaporation method, the influence of the solvent and evaporation parameters can be difficult to control with precision, leading to the inconsistent measurement of the Rg.
The solvent-evaporation process involves the evaporation of the solvent, which causes structural changes to the systems. These changes occur due to interactions with solvents or variations in physical states, such as increased temperature variations. Meanwhile, the melt-cooling method allows the formation of complexes in a more stable solid state, with little or no significant structural change. Rg also provides information about the movement and flexibility of molecules in complexes. The melt-cooling method allows measurement of the Rg in a stable solid state, which properly reflected dynamics properties of the complex. The solvent-evaporation method may affect the flexibility of the molecule
Figure 8 Comparison of the Radius of Gyration (Rg) Graphs of the Complex System During Molecular Dynamics Simulations.
and internal movement due to the solvent effect, thereby reducing the information that can be obtained about dynamics properties of the systems.
The analysis of SASA analysis for RTV and PLX complexes using melt-cooling and solvent-evaporation methods was employed to understand the exposure of the surface of the molecules in the complex to solvents or the surrounding environment. SASA provides insights into the surface area accessible to the solvent, thereby reflecting the hydrophobic and hydrophilic characteristics of the molecules within the complex. For the solvent-evaporation system, the SASA calculation was continuously conducted throughout the simulation. However, in the melt-cooling model, it was performed only at the beginning to confirm the absence of solvent. In the melt-cooling method, the complex is formed in solid state directly by cooling the mixture. SASA analysis with the melt-cooling method made it possible to calculate the complex surface area that can be accessed by the solvent numerically. Meanwhile, in the solvent-evaporation method, a complex is formed by evaporating the solvent. SASA analysis in this method provided information about the surface area of the complex exposed or protected from the solvent after evaporation.
The SASA graph in Figure 9 indicates that the RTV and PLX complexes formed using the melt-cooling method exhibit higher complexity compared to the solvent-evaporation approach. In the solvent-evaporation system, the fluctuations in the SASA graph are believed to be primarily influenced by the accessibility of solvents around the RTV and PLX molecules. Furthermore, the melt-cooling method involves forming the complex in solid state directly by cooling the mixture. This process allows for well-ordered complex molecules and maintains their interactions in solid state. Based on the stability of the complex molecular structure, the melt-cooling method provided higher stability because the complex molecules were organized in solid state. Meanwhile, the solvent-evaporation method involves evaporating the solvent to form a complex. This process affects the stability of the complex based on the nature of the solvent, temperature, evaporation rate, and other conditions. When the solvent had strong interactions with complex molecules or caused significant structural changes, the stability of the complex is negatively affected.
RTV and PLX Complex Binding Ability
Hydrogen bonds are one of the most important types of intermolecular interactions in chemistry and biology. The observation of H-bonds in RTV and PL complexes helps to understand interactions between these molecules, thereby providing insight into the hydrogen bonds formed, the stability of complexes, and their roles in influencing the structure, stability, and overall properties of complexes. H-bond observations also identify the hydrogen bonding motifs formed in complexes. This motif refers to a particular pattern in which a hydrogen atom from one molecule interacts with
Figure 9 Comparison of the Solvent Accessible Surface Area (SASA) Graphs of the Complex System During Molecular Dynamics Simulations.
a hydrogen bond acceptor atom from another molecule. The identification of the dominant hydrogen bond motif in a complex can provide a better understanding of molecular structure and interactions involved. In MD simulations of RTV and PLX, the H-bond observations can also be used to validate experimental results. By comparing the hydrogen bonds observed in simulations with the experimental data, it is possible to verify the accuracy of simulations model and the re-production capacity of molecular interactions that occur under experimental conditions.
Supplementary Figure 2 demonstrates that by employing different atomic approximations for the Bader molecule, specifically based on (1) Laplacian signs, (2) the magnitude of the electron density, and (3) the ratio of the density of kinetic and potential energies, the RTV and PLX complexes formed using the melt-cooling method exhibited a more stable presence of hydrogen bonds, as opposed to when the solvent-evaporation approach was utilized. This is because the melt-cooling method involves melting a mixture of an active substance such as RTV and a carrier, namely PLX at high temperatures, followed by rapid cooling to form a solid structure. During the melt-cooling process, hydrogen bonds form spontaneously between the complex molecules due to the presence of hydroxyl groups in PLX and other functional groups in RTV. The functional groups in RTV include aromatic groups, amide groups, hydroxyl groups, and aliphatic groups. These functional groups facilitate the formation of hydrogen bonds, which play a crucial role in stabilizing the complex during the cooling process. This process also allows hydrogen bonds to form at a higher and more constant density. However, the solvent-evaporation method involves diluting the active substance in an organic solvent, such as ethanol, which is evaporated to obtain a thin layer of precipitated active substance. In this method, the organic solvent acts as a barrier between the active substance and the carrier. However, the removal of the organic solvent resulted in the disruption of the hydrogen bonds formed between RTV and PLX during the complex formation process.
Observation of hydrogen bond occupancy in the MD simulation was performed to determine the frequency of hydrogen bond formation between RTV and PLX in the molecular system. Hydrogen bond occupancy refers to the fraction of time during which hydrogen bonds are present in MD simulations, and this calculation was integrated into the visual molecular dynamics (VMD, Theoretical and Computational Biophysics group at the Beckman Institute, University of Illinois at Urbana-Champaign). This information provides a better understanding of the strength and stability of interactions between molecules. The data in Table 1 shows that RTV and PLX complex systems using the melt-cooling method exhibited promising binding capabilities, with occupancy percentages of (Melt-Cooling-A), (Melt-Cooling-B), and (Melt-Cooling-C). Meanwhile, in the solvent-evaporation method, the active substance (RTV) and carrier (PLX) were dissolved in the organic solvent ethanol. These organic solvents block the hydrogen bonding interactions between the active substance and the carrier. Organic solvents also had different properties from carriers, which interfere with the formation of stable hydrogen bonds.
The drying process in the solvent-evaporation method usually takes longer than the melt-cooling method. The slow evaporation process allows opportunities for interactions between organic solvents, active substances, and carriers, which can interfere with the formation of consistent hydrogen bonds. This method also produces greater concentration variations in complex systems, which can affect the distribution of active substances and carriers in solid matrix formed, thereby reducing the possibility of consistent hydrogen bonding between complex molecules. Furthermore, hydrogen bond occupancy is a measure of the frequency of hydrogen bond formation in polymers over a period of time. The
Table 1 Percentage of Hydrogen Bond Occupancy of a Complex System During Molecular Dynamics Simulations
Complex System
Occupancy
Number of PLX
Melt-Cooling-A
77.94%
25
Melt-Cooling-B
58.43%
25
Melt-Cooling-C
72.44%
25
Solvent-Evaporation
1.39%
25
hydrogen bond occupancy in polymers depends on several factors, including polymer concentration and environmental conditions such as temperature and humidity. The higher the occupancy, the more often hydrogen bonds are formed.
Characterization of Glass Transition Temperature of RTV and PLX Complexes
Glass Tg analysis is an important function in understanding the physical properties and stability of RTV and PLX systems that are prepared using melt-cooling and solvent-evaporation methods. Tg is the temperature observed during the transition from solid to amorphous state, where the organic material or polymer passes through a phase change from an ordered structure to a random structure. In the melt-cooling method, Tg analysis can provide information about solid state of RTV and PLX complexes formed. Meanwhile, in the solvent-evaporation method, Tg analysis provides insight into solid state of the resulting RTV and PLX complexes. Moreover, a low Tg temperature indicates the effect of organic solvents remaining in solid matrix, which can affect the stability and physical properties of the complex.
Several complex relationships were observed between Tg and density, volume, and pressure. The correlation between Tg and density is not always consistent, as it is influenced by other factors such as composition and molecular structure. When Tg is reached, there is a change in the volume of the substance, which tends to increase due to the more random and wider molecular structure during Tg transition. Furthermore, pressure plays a significant role in influencing Tg as it affects intermolecular interactions and the mobility of molecules in the material. This shows that increasing pressure can improve molecular density and strengthen intermolecular bonds to increase Tg. Conversely, a decrease in pressure can reduce molecular density and weaken intermolecular bonds, thereby reducing Tg .
Based on Table 2, the RTV and PLX complexes obtained using the melt-cooling method exhibited Tg values that fulfilled the requirements (above the melting point of RTV). This occurred because the melt-cooling method involved melting a mixture of the active substance (RTV) and carrier (PLX) at high temperatures, followed by rapid cooling to form a solid structure. This rapid cooling process allows the formation of strong molecular interactions, such as hydrogen bonds, van der Waals bonds, or hydrophobic interactions, between the active ingredient and the carrier. These strong molecular interactions result in stable complex structures with Tg that met the requirements. Tg is the temperature at the transition from solid state to amorphous state. When Tg meets the specified requirements, it indicates that RTV and PLX complexes have good stability against temperature changes. By rapid cooling, the melt-cooling method allowed the formation of a compact and ordered structure, which provided stability to temperature changes. The ordered structure strengthens the intermolecular bonds and maintains the physical properties of the complex at higher temperatures. In this study, RTV and PLX were selected as ingredients in complex formation because of their compatibility in forming a stable structure. PLX, which was used as a carrier, showed good solubility in RTV and was capable of forming strong intermolecular bonds. Furthermore, the presence of complementary active substances and carriers allowed the formation of stable complexes with Tg that complied with the requirements (above the melting point of RTV).
The Dynamics of the Interactions Formed from the Complex System
In MD simulations, identification of interactions can be carried out in various ways, including potential energy analysis between guest and host molecules, group correlation and cohesion analysis, as well as analysis of molecular motions. By comprehending interactions between guest and host molecules in complex systems, an enhanced understanding of system
Table 2 Characteristic Data of a Complex System During Molecular Dynamics Simulations
Complex System
Tg
Density
Volume
Pressure
Melt-Cooling-A
-2.11 bar
Melt-Cooling-B
0.49 bar
Melt-Cooling-C
3.18 bar
Solvent-Evaporation
0.73 bar
properties and improved predictions of system behavior can be achieved. Furthermore, the identification of interactions is important in MD simulations of complex systems, including understanding the physical and chemical properties, designing a more effective host, and predicting the performance of the system.
The data presented in Supplementary Table 2 show that RTV had a strong interaction with PLX during MD simulations using the melt-cooling method. RTV and PLX were selected due to their good chemical compatibility and functional groups that can form hydrogen bonds as well as other intermolecular interactions. This compatibility is predicted to facilitate strong interactions between RTV and PLX during MD simulations. RTV has hydroxyl, amide, and other functional groups that can interact with the hydroxyl groups on PLX. During MD simulations, these groups interact with each other, form hydrogen bonds, and contribute to the stability of the complex. By rapid cooling, the melt-cooling method allowed hydrogen bonds to form at a higher density and was more stable, thereby strengthening interactions between RTV and PLX in the complex. During MD simulations using the melt-cooling method, rapid cooling reduced molecular mobility in RTV and PLX complexes. This limited mobility strengthened the intermolecular interactions and increased the stability of the complex. Additionally, RTV and PLX possess suitable molecular structure sizes and shapes, as well as appropriate functional groups, which enable effective interactions during MD simulations. This allows close interactions between both complexes, thereby strengthening bonds and intermolecular interactions.
Binding Free Energy of RTV and PLX System Complexes
In the analysis of Molecular Mechanics Poisson-Boltzmann Surface Area (MM-PBSA), each molecular conformation of RTV and PLX systems using the melt-cooling and solvent-evaporation methods was assessed by calculating the total energy. This consists of contributions from covalent bonds, electrostatic interactions, van der Waals interactions, and solvation energy. The MM-PBSA method consists of three main components, namely Molecular Mechanics (MM), Poisson-Boltzmann (PB), and Surface Area. Furthermore, MM was used to calculate molecular potential energy and MD of the system. PB was used to model the electrolytic environment and measure interactions between molecules and the electrolytic environment. SA was used to estimate the entropy effect involved in molecular bonding process.
The data presented in Table 3 show that RTV and PLX complexes using the melt-cooling method had good bond-free energies, with values of , and -125.18 for melt-cooling-A, melt-cooling-B, and melt-cooling-C, respectively. This phenomenon shows that the melt-cooling method involves a rapid cooling process, allowing the formation of strong intermolecular interactions between RTV and PLX. In this study, RTV and PLX were selected based on the suitability of the complementarity of their molecules, which allowed the formation of strong bonds within the complex. Both complexes had good solubility and affinity for each other, which enhanced the formation of strong and stable molecular interactions. The numerous hydrogen-bond donor moieties on RTV, such as -OH and -NH groups, should favorably interact with the hydrogen-bond accepting-O- groups on the PLX backbone, involving like-seeks-like. This complementary interaction between the hydrogen-bond donor and acceptor groups enhances the formation of stable hydrogen bonds between RTV and PLX during the MD simulations, contributing to the overall stability and structural integrity of the complex. The melt-cooling method produces a dense and ordered complex structure to maintain a more stable molecular conformation, thereby contributing to low bond-free energy.
Table 3 The Free Binding Energies and Their Corresponding Components for a Complex System During Molecular Dynamics Simulations
Complex System
Evdw (kJ/mol)
Eele (kJ/mol)
(kJ/mol)
GNP (kJ/mol)
GBind (kJ/mol)
Melt-Cooling-A
-180.78
-37.45
110.55
-22.48
-130.16
Melt-Cooling-B
-184.99
-33.10
107.83
-23.35
-133.62
Melt-Cooling-C
-178.89
-41.48
118.32
-23.13
-125.18
Solvent-Evaporation
-10.57
-1.23
11.92
-2.97
-2.85
Notes: van der Waals contribution, Eele electrostatic contribution, polar con-tribution of desolvation, non-polar contribution of desolvation, binding-free energy.
Discussion
In this study, MD simulations were used to evaluate interactions between RTV and PLX after being simulated by solventevaporation and melt-cooling methods. Interactions between RTV and PLX during simulations of the solvent-evaporation method is presented in Figure 10.
Figure 10 shows that when the solvent was completely lost at 200 ns in the solvent-evaporation method, there was no formation of the hydrogen bonds between RTV and PLX. However, the pi-alkyl bonds of RTV-PLX were formed and Tg value of was also obtained, indicating that ASD of RTV-PLX was formed. The RMSD analysis demonstrated that the translational motion of RTV was significantly reduced during both evaporation processes by the addition of PLX, which can be attributed to the intermolecular interactions between RTV and PLX. Specifically, the RMSD analysis indicates a notable sup-pression of translational movement in the presence of PLX, suggesting a stronger binding or complex formation between the two molecules.
At , after cooling ( 500 ns ) in the Melt-Cooling method with a cooling rate of , RTV interacted with 2 PLX molecules and formed 2 hydrogen bonds (Figure 11). The first hydrogen bond was formed between the O atom on RTV carbonyl group and the H atom on PLX hydroxyl group. A second hydrogen bond was formed between the O atom on
Figure 10 The Interaction Formed Between RTV and PLX During the Simulation of the Solvent-Evaporation Method.
Figure 11 The Interaction Formed Between RTV and PLX During the Simulation of the Melt-Cooling-A Method.
RTV carbonyl group and the H atom on the other PLX hydroxyl group. Tg value obtained from this method was , indicating that ASD of RTV-PLX was formed.
At , after cooling ( 500 ns ) in the Melt-Cooling method with a cooling rate of interacted with 2 PLX molecules and formed 7 hydrogen bonds (Figure 12). The first hydrogen bond was formed between the H atom of RTV hydrocarbon group and the O atom of PLX hydroxyl group. A second hydrogen bond was formed between the H atom of the amide group of RTV and the O atom of the carbonyl group of PLX. The third hydrogen bond is formed between the O atom of RTV carbonyl group and the H atom of the hydroxyl group of the second PLX. The fourth hydrogen bond is formed between the O atom of RTV carbonyl group and the H atom of the hydrocarbon group of the second PLX. Furthermore, the fifth hydrogen bond was formed between the O atom of RTV carbonyl group and the H atom of another hydrocarbon group of the second PLX. The sixth hydrogen bond was formed between the O atom of the other carbonyl group of RTV and the H atom of the hydrocarbon group of the second PLX. The seventh hydrogen bond was formed between the H atom of the amine group of RTV and the O atom of the hydroxyl group of the second PLX. Tg value obtained from this method was , indicating the formation of ASD of RTV-PLX.
At , after cooling ( 500 ns ) in the Melt-Cooling method with a cooling rate of , RTV interacted with 2 PLX molecules and formed 6 hydrogen bonds (Figure 13). The first hydrogen bond was formed between the O atom of RTV hydroxyl group and the H atom of PLX hydrocarbon group. The second hydrogen bond is formed between the O atom of RTV carbonyl group and the H atom of the carbonyl group of the second PLX. The third hydrogen bond is formed between the O atom of RTV carbonyl group and the H atom of the hydrocarbon group of the second PLX. The fourth hydrogen bond is formed between the O atom of RTV carbonyl group and the H atom of the hydrocarbon group of the second PLX. The fifth hydrogen bond is formed between the H atom of RTV hydroxyl group and the O atom of the carbonyl group of the second PLX. Furthermore, a sixth hydrogen bond was formed between the H atom on cyclopentene RTV and the O atom of the hydroxyl group of the second PLX. Tg value obtained from this method was , indicating the formation of ASD of RTV-PLX.
The RMSD values obtained from the solvent-evaporation, melt-cooling-A, melt-cooling-B, and melt-cooling-C methods were , and , respectively. RMSF analysis provides information about the atomic fluctuations in each molecule. The solvent removal process in the solvent evaporation method leads to larger atomic fluctuations compared to the melt-cooling method. Based on the results, the average RMSF values obtained from the solvent evaporation, melt-cooling-A, melt-cooling-B, and melt-cooling-C methods were , and 1.07 , respectively. RDF analysis was used to describe the tendency of certain particles such as atoms or molecules to exist at specified distances from a reference particle. Compared to the melt-cooling method, the use of solvent in the solvent-
Figure 12 The Interaction Formed Between RTV and PLX During the Simulation of the Melt-Cooling-B Method.
Figure 13 The Interaction Formed Between RTV And PLX During the Simulation of the Melt-Cooling-C Method.
evaporation method influenced interactions and spatial arrangement between RTV and PLX. The average RDF values obtained from the solvent evaporation, melt-cooling-A, melt-cooling-B, and melt-cooling-C methods were , and , respectively. The Rg values provide information on whether a molecule is more compact or open, with the low Rg values indicating good conformation in the system during simulations. The melt-cooling method allows for the measurement of the Rg in a stable solid-state compared to the solvent-evaporation approach. In this study, the average Rg values obtained from the solvent-evaporation, melt-cooling-A, melt-cooling-B, and melt-cooling-C methods were , and 1.11 nm , respectively. SASA analysis of RTV and PLX complexes was used to understand the exposure of the surface of the molecules in the complex to solvents or the surrounding environment. The average SASA values obtained from the solvent-evaporation, melt-cooling-A, melt-cooling-B, and melt-cooling-C methods were , and , respectively. Furthermore, the observation of the H -bond helped to understand interactions between these molecules and provided insight into the stability of complexes.
Conclusion
In conclusion, ASD of RTV with PLX was investigated using MD simulations. The validity of MD simulations, which mimicked the solvent-evaporation and melt-cooling method was confirmed by calculating Tg values of RTV/PLX and compared with experimental Tg. MD simulations of RTV/PLX amorphous formulation showed that the translational motion of RTV was suppressed by the addition of PLX during the solvent-evaporation and the cooling process. The pialkyl bonds of RTV-PLX were formed after the solvent was completely removed during the solvent-evaporation method. Meanwhile, hydrogen bond interactions between RTV and PLX were formed during simulations of the melt-cooling method. The rate of the cooling process affected the amount of hydrogen bond formation between RTV and PLX. Interactions between RTV and PLX also play an important role in the stabilization of amorphous films. This study provides fundamental insight into in silico studies that can be used as a powerful tool to design amorphous formulations of poorly water-soluble drugs. The results show that a computational method of MD simulations enables the evaluation of the intermolecular interactions between drugs and polymers. Approach also monitored dynamics and interactions, which facilitated the screening of appropriate polymer in the formulation of ASD.
Acknowledgments
We would like to thank Universitas Padjadjaran for supporting this work and APC.
Funding
This research was funded by Universitas Padjadjaran (Riset Data Pustaka dan Daring) to Diah Lia Aulifa No. 1549/ UN6.3.1/PT.00/2023 on March 27, 2023.
Disclosure
The authors report no conflicts of interest in this work.
References
Budiman A, Megantara S, Raraswati P, Qoriah T. Solid dosage form development of glibenclamide with increasing the solubility and dissolution rate using cocrystallization. Intl J App Pharm. 2018;10(6):181-186. doi:10.22159/ijap.2018v10i6.29257
Kawabata Y, Wada K, Nakatani M, Yamada S, Onoue S. Formulation design for poorly water-soluble drugs based on biopharmaceutics classification system: basic approaches and practical applications. Int J Pharm. 2011;420(1):1-10. doi:10.1016/j.ijpharm.2011.08.032
Budiman A, Husni P, Alfauziah TQ, Alfauziah TQ. The development of glibenclamide-saccharin cocrystal tablet formulations to increase the dissolution rate of the drug. Intl J App Pharm. 2019;11(4):359-364. doi:10.22159/ijap.2019v11i4.33802
Hancock BC, Zografi G. Characteristics and significance of the amorphous state in pharmaceutical systems. J Pharm Sci. 1997;86(1):1-12. doi:10.1021/js9601896
Yu L. Amorphous pharmaceutical solids: preparation, characterization and stabilization. Adv Drug Deliv Rev. 2001;48(1):27-42. doi:10.1016/ S0169-409X(01)00098-9
Baghel S, Cathcart H, O’Reilly NJ. Polymeric amorphous solid dispersions: a review of amorphization, crystallization, stabilization, solid-state characterization, and aqueous solubilization of biopharmaceutical classification system class II drugs. J Pharm Sci. 2016;105(9):2527-2544. doi:10.1016/j.xphs.2015.10.008
Hancock BC, Parks M. What is the true solubility advantage for amorphous pharmaceuticals? Pharm Res. 2000;17(4):397-404. doi:10.1023/ A:1007516718048
Bogner RH, Murdande SB, Pikal MJ, Shanker RM. Solubility advantage of amorphous pharmaceuticals: II. application of quantitative thermodynamic relationships for prediction of solubility enhancement in structurally diverse insoluble pharmaceuticals. Pharm Res. 2010;27 (12):2704-2714. doi:10.1007/s11095-010-0269-5
Brouwers J, Brewster ME, Augustijns P. Supersaturating drug delivery systems: the answer to solubility-limited oral bioavailability? J Pharm Sci. 2009;98(8):2549-2572. doi:10.1002/jps. 21650
Okada H, Ueda K, Yasuda Y, et al. Correlation between drug dissolution and resistance to water-induced phase separation in solid dispersion formulations revealed by solid-state NMR spectroscopy. Int J Pharm. 2020;577:119086. doi:10.1016/j.ijpharm.2020.119086
Vasconcelos T, Marques S, Das Neves J, Sarmento B. Amorphous solid dispersions: rational selection of a manufacturing process. Adv Drug Deliv Rev. 2016;100:85-101. doi:10.1016/j.addr.2016.01.012
Janssens S, Van den Mooter G. Review: physical chemistry of solid dispersions. J Pharm Pharmacol. 2009;61(12):1571-1586. doi:10.1211/jpp/ 61.12.0001
Ueda K, Higashi K, Yamamoto K, Moribe K. The effect of HPMCAS functional groups on drug crystallization from the supersaturated state and dissolution improvement. Int J Pharm. 2014;464(1-2):205-213. doi:10.1016/j.jjpharm.2014.01.005
Barmpalexis P, Karagianni A, Kachrimanis K. Molecular simulations for amorphous drug formulation: polymeric matrix properties relevant to hot-melt extrusion. Eur J Pharm Sci. 2018;119:259-267. doi:10.1016/j.ejps.2018.04.035
Xiang TX, Anderson BD. Molecular dynamics simulation of amorphous indomethacin-poly(Vinylpyrrolidone) glasses: solubility and hydrogen bonding interactions. J Pharm Sci. 2013;102(3):876-891. doi:10.1002/jps. 23353
Gupta J, Nunes C, Vyas S, Jonnalagadda S. Prediction of solubility parameters and miscibility of pharmaceutical compounds by molecular dynamics simulations. J Phys Chem B. 2011;115(9):2014-2023. doi:10.1021/jp108540n
Huynh L, Grant J, Leroux JC, Delmas P, Allen C. Predicting the solubility of the anti-cancer agent docetaxel in small molecule excipients using computational methods. Pharm Res. 2008;25(1):147-157. doi:10.1007/s11095-007-9412-3
Yang H, Li ZS, Qian HJ, et al. Molecular dynamics simulation studies of binary blend miscibility of poly (3-hydroxybutyrate) and poly(ethylene oxide). Polymer. 2004;45(2):453-457. doi:10.1016/j.polymer.2003.11.021
Ma X, Higashi K, Fukuzawa K, et al. Computational approach to elucidate the formation and stabilization mechanism of amorphous formulation using molecular dynamics simulation and fragment molecular orbital calculation. Int J Pharm. 2022:615. doi:10.1016/j.jjpharm.2022.121477
Baird JA, Van Eerdenbrugh B, Taylor LS. A classification system to assess the crystallization tendency of organic molecules from undercooled melts. J Pharm Sci. 2010;99(9):3787-3806. doi:10.1002/jps. 22197
Budiman A, Aulifa DL. A comparative study of the pharmaceutical properties between amorphous drugs loaded-mesoporous silica and pure amorphous drugs prepared by solvent evaporation. Pharmaceuticals. 2022;15(6):730. doi:10.3390/ph15060730
Budiman A, Aulifa DL. Characterization of drugs with good glass formers in loaded-mesoporous silica and its theoretical value relevance with mesopores surface and pore-filling capacity. Pharmaceuticals. 2022;15(1):93. doi:10.3390/ph15010093
Huang H, Simmerling C. Fast pairwise approximation of solvent accessible surface area for implicit solvent simulations of proteins on CPUs and GPUs. J Chem Theory Comput. 2018;14(11):5797-5814. doi:10.1021/acs.jctc.8b00413
Kobayashi A, Nakajima M, Noguchi Y, Morikawa R, Matsuo Y, Takasu M. Molecular dynamics simulation of the complex of PDE5 and evodiamine. Life. 2023;13(2):578-592. doi:10.3390/life13020578
Budiman A, Kalina K, Aristawidya L, Al Shofwan AA, Rusdin A, Aulifa DL. Characterizing the impact of chitosan on the nucleation and crystal growth of ritonavir from supersaturated solutions. Polymers. 2023;15(5):1282. doi:10.3390/polym15051282
Khan AA, Mudassir J, Akhtar S, Murugaiyah V, Darwis Y. Freeze-dried lopinavir-loaded nanostructured lipid carriers for enhanced cellular uptake and bioavailability: statistical optimization, in vitro and in vivo evaluations. Pharmaceutics. 2019;11(2):97. doi:10.3390/pharmaceutics11020097
Arca HÇ, Mosquera-Giraldo LI, Dahal D, Taylor LS, Edgar KJ. Multidrug, anti-HIV amorphous solid dispersions: nature and mechanisms of impacts of drugs on each other’s solution concentrations. Mol Pharm. 2017;14(11):3617-3627. doi:10.1021/acs.molpharmaceut.7b00203
Siriwannakij N, Heimbach T, Serajuddin ATM. Aqueous dissolution and dispersion behavior of polyvinylpyrrolidone vinyl acetate-based amorphous solid dispersion of ritonavir prepared by hot-melt extrusion with and without added surfactants. J Pharm Sci. 2021;110 (4):1480-1494. doi:10.1016/j.xphs.2020.08.007
de Alvarenga BR, Moseson DE, Carneiro RL, Taylor LS. Impact of polymer type on thermal degradation of amorphous solid dispersions containing ritonavir. Mol Pharm. 2022;19(1):332-344. doi:10.1021/acs.molpharmaceut.1c00823
Zhao Y, Xie X, Zhao Y, et al. Effect of plasticizers on manufacturing ritonavir/copovidone solid dispersions via hot-melt extrusion: preformulation, physicochemical characterization, and pharmacokinetics in rats. Eur J Pharm Sci. 2019;127:60-70. doi:10.1016/j.ejps.2018.10.020
Muchtaridi M, Triwahyuningtyas D, Muhammad Fakih T, Megantara S, Choi SB. Mechanistic insight of -mangostin encapsulation in 2-hydro-xypropyl- -cyclodextrin for solubility enhancement. J Biomol Struct Dyn. 2023;1-10. doi:10.1080/07391102.2023.2214237
Farmer J, Kanwal F, Nikulsin N, Tsilimigras MCB, Jacobs DJ. Statistical measures to quantify similarity between molecular dynamics simulation trajectories. Entropy. 2017;19(12):646-662. doi:10.3390/e19120646
Ghahremanian S, Rashidi MM, Raeisi K, Toghraie D. Molecular dynamics simulation approach for discovering potential inhibitors against SARS-CoV-2: a structural review. J Mol Liq. 2022;354:118901-118912. doi:10.1016/j.molliq.2022.118901
He Q, Liu J, Zhang M, Zhai Z, Jiang B. Molecular dynamics simulation on the effect of self-resistance electric heating on carbon fiber surface chemical properties and Fiber/PP interfacial behavior. Polymers. 2022;14(5):1043. doi:10.3390/polym14051043
Genheden S, Ryde U. The MM/PBSA and MM/GBSA methods to estimate ligand-binding affinities. Expert Opin Drug Discov. 2015 ;10 (5):449-461. doi:10.1517/17460441.2015.1032936
Advances and Applications in Bioinformatics and Chemistry
Dovepress
Publish your work in this journal
Advances and Applications in Bioinformatics and Chemistry is an international, peer-reviewed open-access journal that publishes articles in the following fields: Computational biomodelling; Bioinformatics; Computational genomics; Molecular modelling; Protein structure modelling and structural genomics; Systems Biology; Computational Biochemistry; Computational Biophysics; Chemoinformatics and Drug Design; In silico ADME/Tox prediction. The manuscript management system is completely online and includes a very quick and fair peer-review system, which is all easy to use. Visit http://www.dovepress.com/testimonials.php to read real quotes from published authors.