DOI: https://doi.org/10.1038/s41598-025-87796-w
PMID: https://pubmed.ncbi.nlm.nih.gov/39863826
تاريخ النشر: 2025-01-25
تقارير علمية
مفتوح
توقع تغييرات استخدام الأراضي وتغطية الأرض من أجل إدارة الأراضي المستدامة باستخدام نمذجة CA-Markov وتقنيات نظم المعلومات الجغرافية
الملخص
تتناول هذه الدراسة القضية المهمة لتغيرات استخدام الأراضي والغطاء الأرضي السريعة في منطقة لاهور، والتي تعتبر حاسمة لدعم الإدارة البيئية والتخطيط المستدام لاستخدام الأراضي. فهم هذه التغيرات أمر بالغ الأهمية للتخفيف من الآثار البيئية السلبية وتعزيز التنمية المستدامة. الهدف الرئيسي هو تقييم التغيرات التاريخية في استخدام الأراضي والغطاء الأرضي من 1994 إلى 2024 وتوقع الاتجاهات المستقبلية لعامي 2034 و2044 باستخدام نموذج CA-Markov الهجين مع منهجيات نظم المعلومات الجغرافية. تم استخدام صور لاندسات من مستشعرات مختلفة (TM، OLI) للتصنيف الخاضع للإشراف، مما حقق دقة عالية (>90%). تم تحليل التغيرات التاريخية في استخدام الأراضي والغطاء الأرضي من 1994 إلى 2024، مما كشف عن تحولات كبيرة في لاهور. توسعت المنطقة المبنية بنسبة
المواد والأساليب منطقة الدراسة
الحصول على البيانات
المعالجة المسبقة لبيانات الاستشعار عن بعد
مؤشرات الاستشعار عن بعد (RSIs)
تصنيف الصور وتقييم الدقة
| قمر صناعي | نوع المستشعر | عدد الفرق | الدقة المكانية | الدقة الإشعاعية | تاريخ الاستحواذ | مصدر |
| لاندسات 5 | علامة تجارية مسجلة | ٧ | 30 م | 8 بت | 1994 و 2004 | |
| لاندسات 8 | أولي/تيرس | 11 | 30 م | 12 بت | 2014 | https://landsat.gsfc.nasa.gov/ |
| لاندسات 9 | أولي-2/تيرس-2 | 11 | 30 م | 14 بت | ٢٠٢٤ |
| مؤشرات | صيغة | مصدر |
| مؤشر الفرق النباتي المعدل (MNDVI) |
|
٤٦ |
| مؤشر البناء التفاضلي المعدل (MNDBI) |
|
٤٧ |
| مؤشر الفرق المائي المعدل (MNDWI) |
|
٤٨ |
| مؤشر التربة الجافة العارية (DBSI) |
|
٤٩ |
| فئات استخدام الأراضي | وصف |
| تراكم | سكني، تجاري وخدمات، صناعي، نقل، طرق، حضري مختلط، وأخرى حضرية |
| أرض قاحلة | المساحات المفتوحة، الأراضي العارية والتربة، الرمال، الكثبان، ومواقع الحفر |
| نباتات | الغابات المتساقطة الأوراق، الأراضي الحرجية المختلطة، النخيل، الصنوبريات، الشجيرات، حقول المحاصيل، الأراضي الزراعية، الغابات، الأشجار، وغيرها |
| المسطحات المائية | تشمل أيضًا شبكات الأنهار، والقنوات، والميزات الهيدرولوجية النشطة، والمجاري، والأنهار، والمناطق المغمورة بالمياه. |
من بيانات الحقيقة الأرضية المستمدة من الخرائط التاريخية، وصور الأقمار الصناعية عالية الدقة، وسجلات من المسوحات الميدانية. نظرًا لندرة البيانات الميدانية المباشرة من عام 1994، استخدمنا نقاط مرجعية تم الحصول عليها من الصور عالية الدقة وحققناها مع البيانات السابقة. بالإضافة إلى ذلك، قدمت مسح شبه مفصل تم إجراؤه في عام 2024 معلومات دقيقة حول اتجاهات التربة، والتضاريس، والميزات البيئية. تم استخدام هذه البيانات كمرجع موثوق للمنطقة البحثية بأكملها. استخدمنا نسبة 70:30 لنقاط التدريب والتحقق. تم جمع ما مجموعه 500 نقطة تحكم أرضية خلال مسح شبه مفصل تم إجراؤه في عام 2024، والذي غطى فئات أراضٍ متنوعة (المناطق المبنية، والنباتات، والأراضي القاحلة، والمسطحات المائية) لتعزيز دقة تصنيف استخدام الأراضي. وبالتالي، تم تقييم دقة كل صورة موسومة من خلال حساب قيم معاملات المنتج، والمستخدم، والإجمالي، ومعامل كابا، وتوضح المعادلات 1-4 العملية لحسابها. علاوة على ذلك، تم الاستفادة من دمج نظم المعلومات الجغرافية مع بيانات الاستشعار عن بعد ونموذج ماركوف، مما يبرز الفوائد التآزرية لدمج هذه التقنيات.
ما بعد المعالجة
تنبؤ بتغير استخدام الأراضي باستخدام نموذج CA-Markov الهجين (CA-MHM)
تنبؤ استخدام الأراضي وتغطية الأرض لعامي 2034 و2044
- تم استخدام CA-MHM لحساب مصفوفات احتمالات الانتقال للسنوات 1994 و2004 و2014 و2024.
- تم استخدام هذه المصفوفات الانتقالية لاحقًا لإنتاج سلسلة من مجموعات البيانات الاحتمالية الشرطية لمختلف أنواع الأراضي التي تمتد من 1994 إلى 2024.
- تم دمج مصفوفات الاحتمالات الانتقالية للفترات 1994-2004 و2004-2014 و2014-2024، جنبًا إلى جنب مع بيانات الاحتمالات الشرطية وخرائط تصنيف استخدام الأراضي والغطاء الأرضي لعامي 2014 و2024، باستخدام مشغلات CA-Markov الجغرافية.
- تم استخدام هذا التكامل لمحاكاة خرائط استخدام الأراضي وتغطية الأرض لعامي 2034 و2044.
تحقق من نموذج ماركوف
النتائج
تقييم دقة فئات استخدام الأراضي
تصنيف استخدامات الأراضي ونوع الغطاء الأرضي
| قيمة معامل كابا | مستوى الاتفاق |
|
|
اتفاق ضعيف |
|
|
اتفاق عادل |
|
|
اتفاق معتدل |
|
|
اتفاق كبير |
|
|
مثالي |
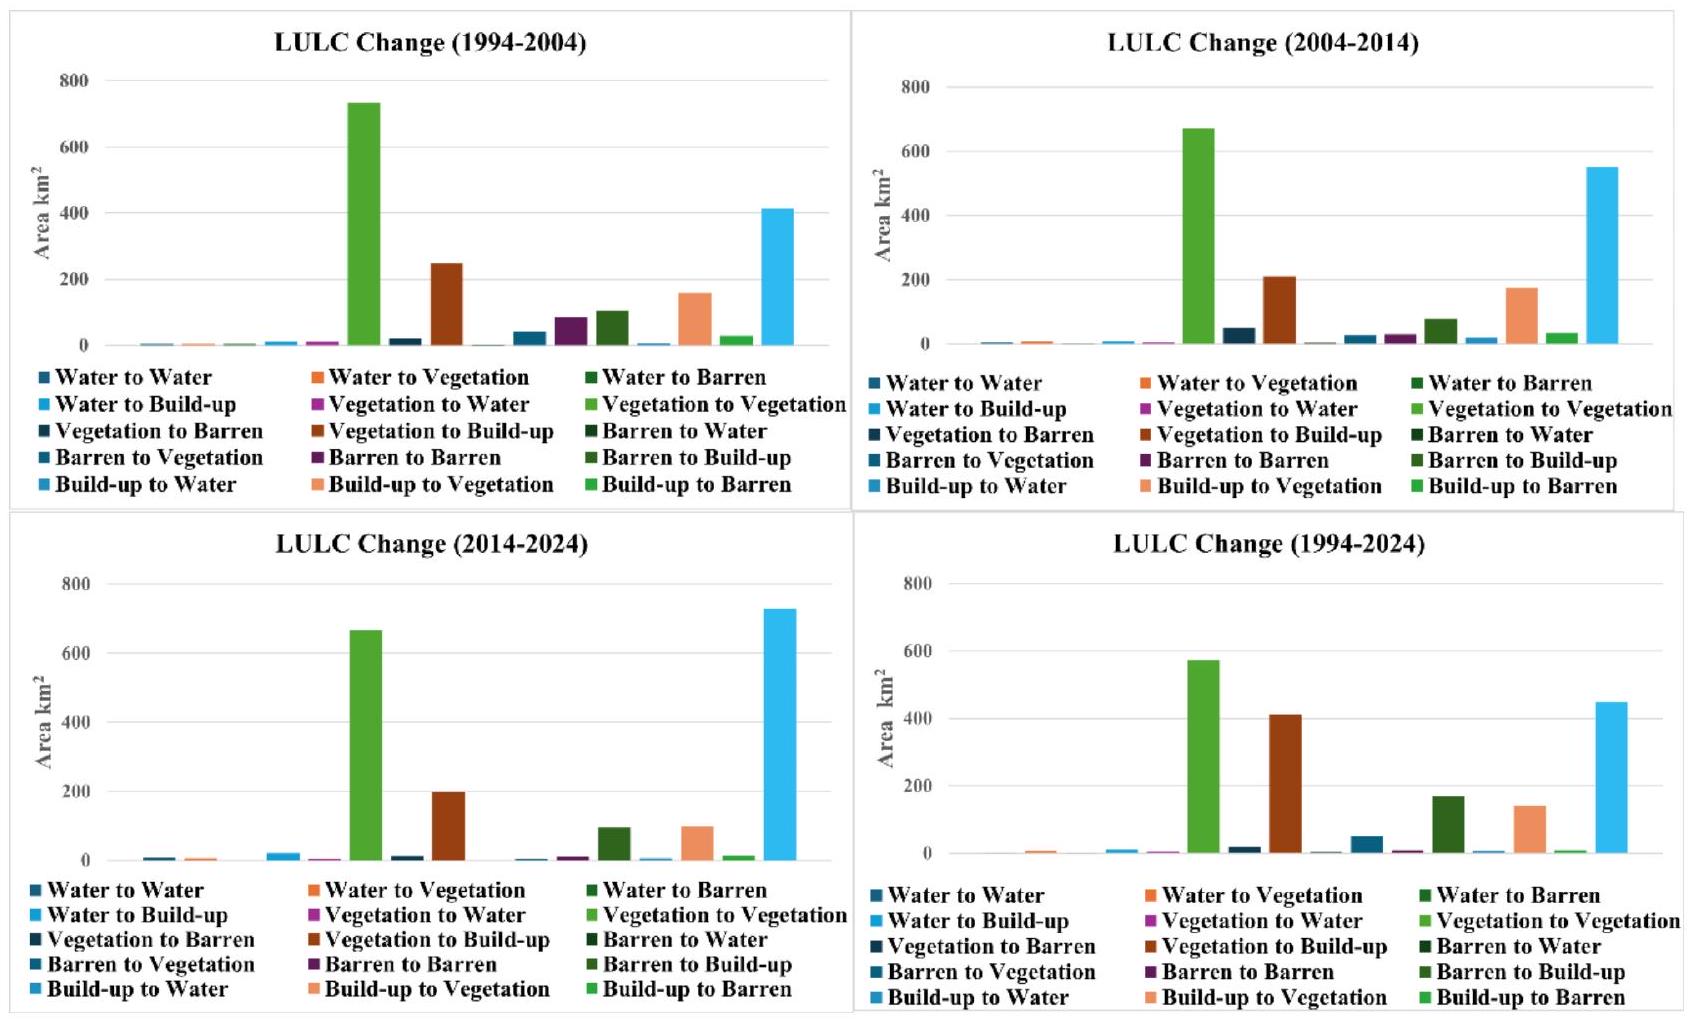
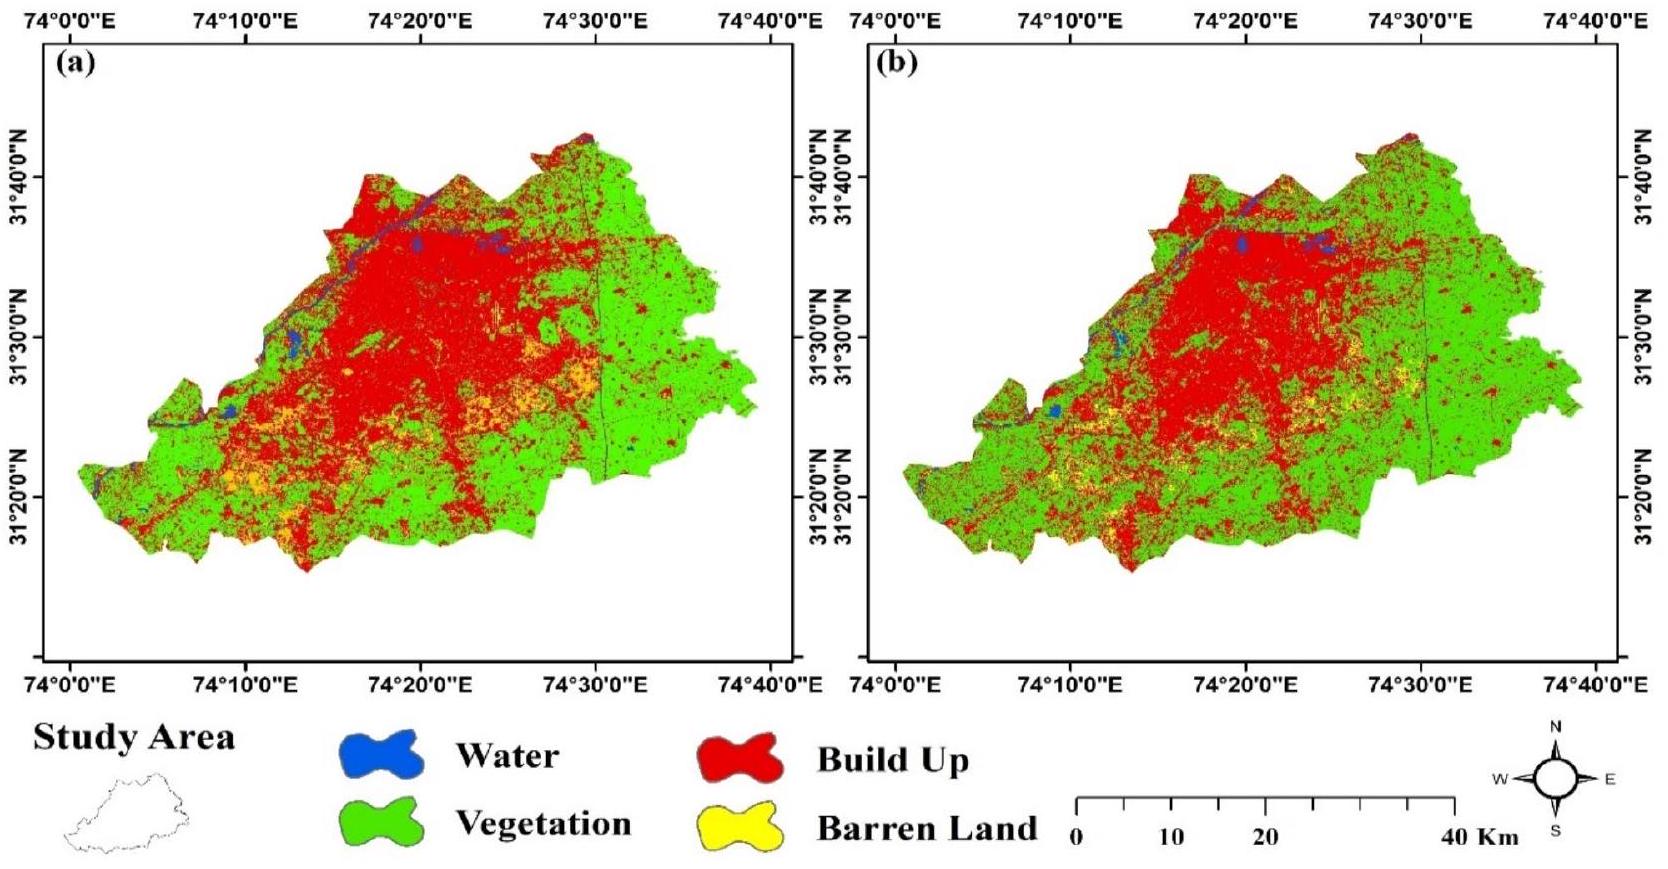
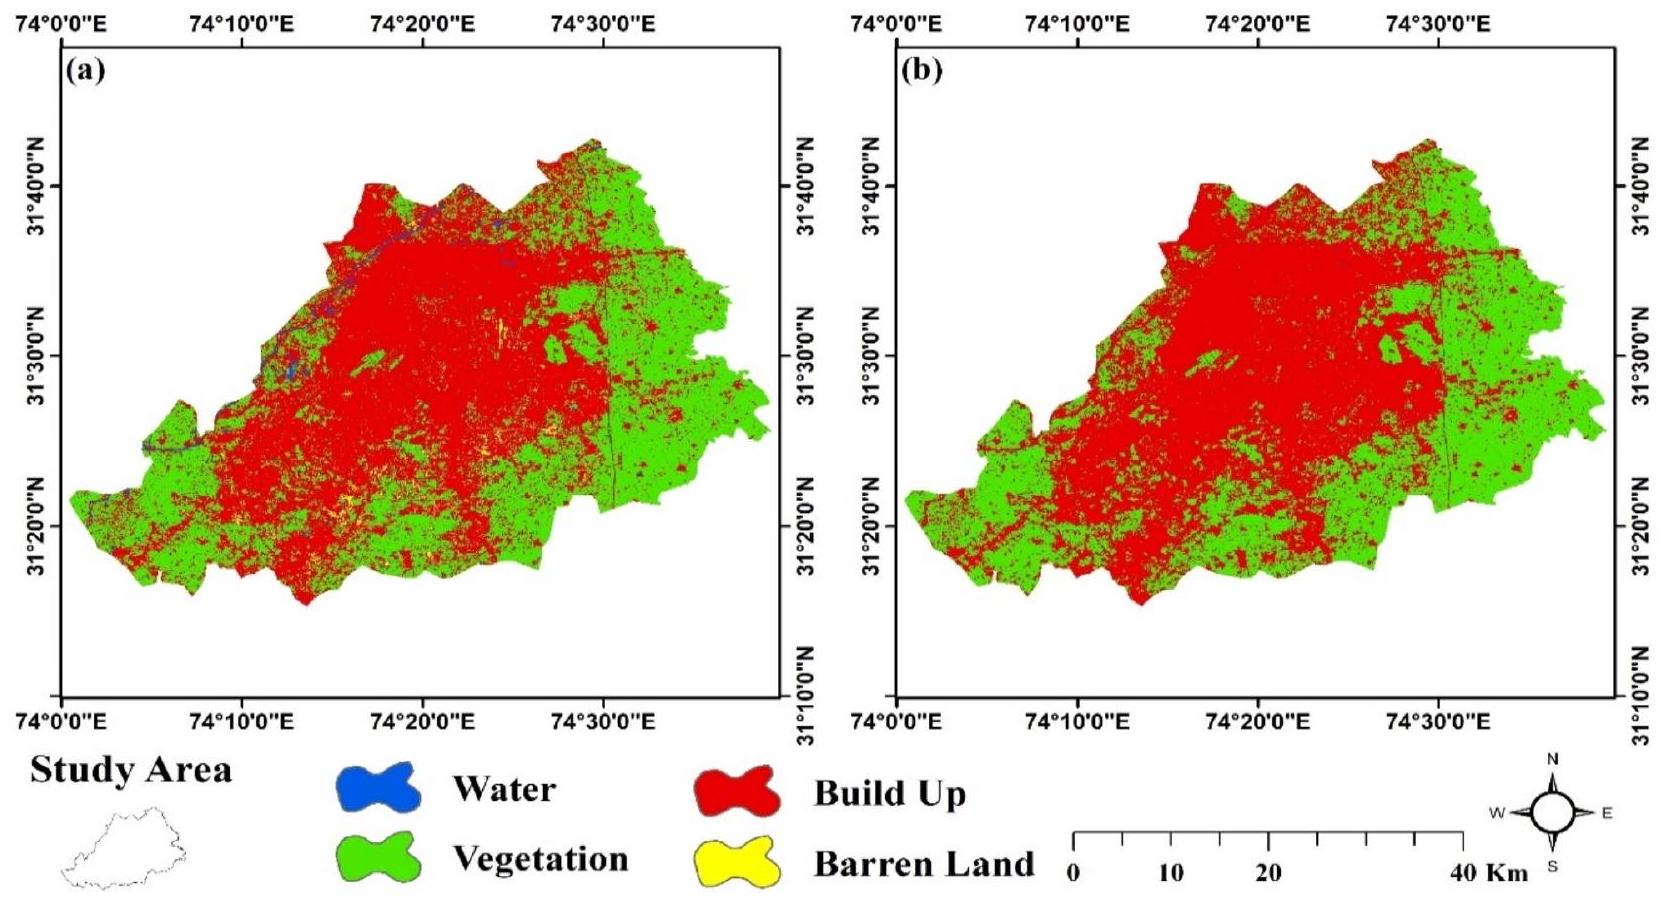
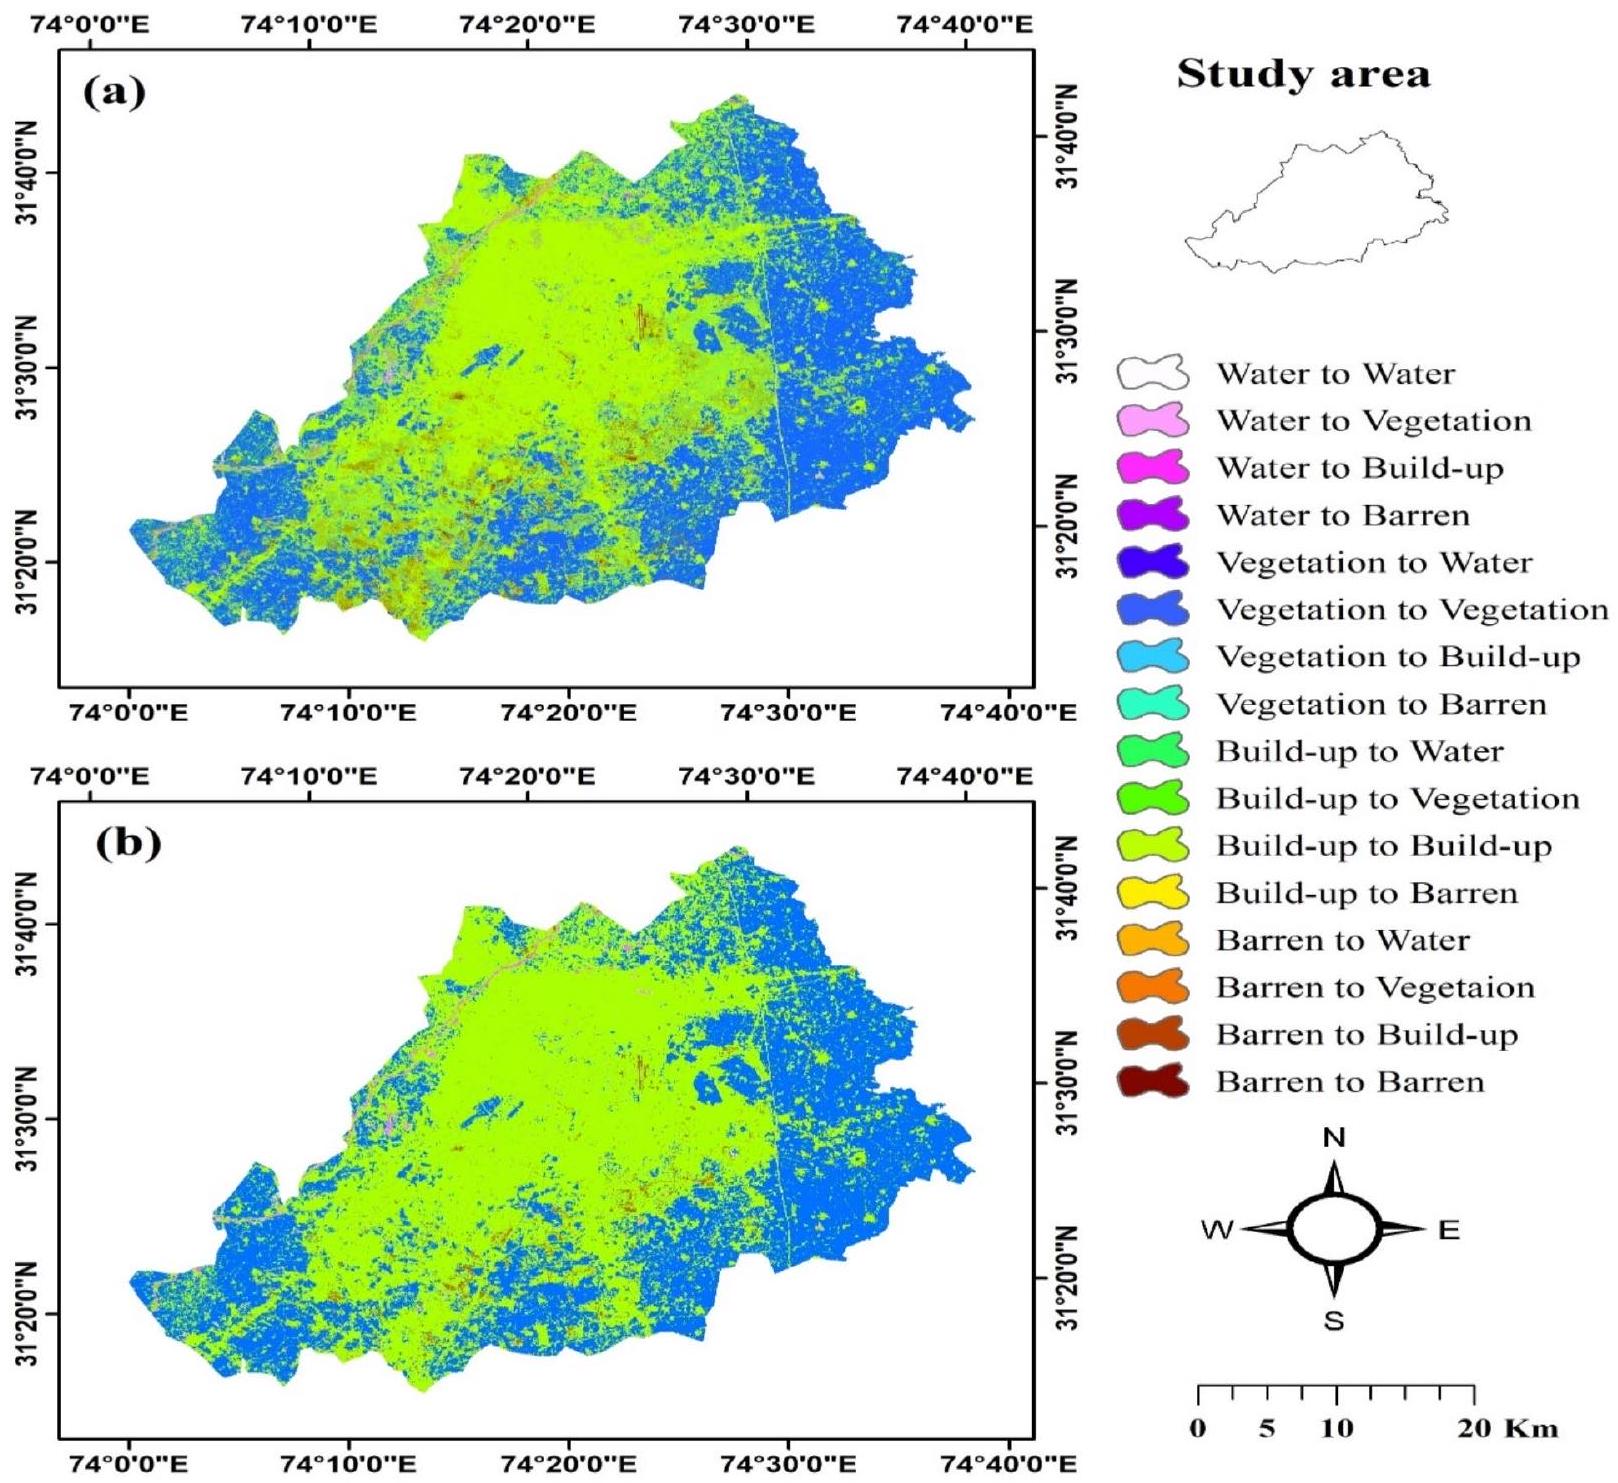
تغيرات استخدام الأراضي
ديناميات استخدام الأراضي
تحليل نموذج سلسلة ماركوف
تحقق من نموذج ماركوف
| فئات استخدام الأراضي | 1994 | 2004 | 2014 | 2024 | ||||
| منطقة | % | منطقة | % | منطقة | % | منطقة | % | |
| المسطحات المائية | 21.76 | 1.16 | ٢٣.١٨ | 1.23 | 30.24 | 1.61 | 19.19 | 1.02 |
| نباتات | ١٠١١.٠٦ | 53.9 | 936.37 | ٤٩.٩ | 899.73 | ٤٧.٩ | ٨١٢.٢٩ | ٤٣.٣ |
| أرض قاحلة | 235.07 | 12.5 | ١٣٨.٨٩ | 7.4 | ١٣١.٤٥ | ٧.٠٠ | ٧٦.٥٨ | ٤.٠٨ |
| تراكم | 608.65 | ٣٢.٤٣ | 778.11 | ٤١.٤ | 815.12 | ٤٣.٤ | 968.49 | ٥١.٦ |
| إجمالي | ١٨٧٦.٥٦ | 100 | ١٨٧٦.٥٦ | 100 | ١٨٧٦.٥٦ | 100 | ١٨٧٦.٥٦ | 100 |
تنبؤ المستقبل لفئات استخدام الأراضي
| تغيير في المساحة
|
||||
| فئات استخدام الأراضي |
|
|
|
|
| المسطحات المائية | 1.42 | 7.05 | -11.05 | -2.57 |
| نباتات | -74.7 | -٣٦.٦ | -87.4 | -198.7 |
| أرض قاحلة | -96.2 | -7.43 | -54.88 | -158.5 |
| تراكم | ١٦٩.٤ | 37 | 153.3 | ٣٥٩.٨ |
نقاش
| احتمالية التغيير من 1994 إلى 2004 | ||||
| فئات استخدام الأراضي | ماء | نباتات | عقيم | تراكم |
| ماء | 0.163148 | 0.136472 | 0.186141 | 0.514239 |
| نباتات | 0.010597 | 0.725359 | 0.019662 | 0.244382 |
| عقيم | 0.010592 | 0.177038 | 0.362716 | 0.449654 |
| تراكم | 0.010568 | 0.260249 | 0.048792 | 0.680391 |
| احتمالية التغيير من 2004 إلى 2014 | ||||
| فئات استخدام الأراضي | ماء | نباتات | عقيم | تراكم |
| ماء | 0.230096 | 0.367778 | 0.029309 | 0.372817 |
| نباتات | 0.005596 | 0.716502 | 0.05242 | 0.225482 |
| عقيم | 0.02845 | 0.1943 | 0.214223 | 0.563027 |
| تراكم | 0.025022 | 0.224315 | 0.043137 | 0.707527 |
| احتمالية التغيير من 2014 إلى 2024 | ||||
| فئات استخدام الأراضي | ماء | نباتات | عقيم | تراكم |
| ماء | 0.240017 | 0.147763 | 0.014021 | 0.598199 |
| نباتات | 0.005096 | 0.756188 | 0.013978 | 0.224738 |
| عقيم | 0.006281 | 0.043427 | 0.106769 | 0.843523 |
| تراكم | 0.00688 | 0.116256 | 0.016716 | 0.860148 |
| فئات استخدام الأراضي | 2024 الفعلي | توقعات 2024 | ||
| منطقة | نسبة مئوية | منطقة | نسبة مئوية | |
| ماء | 19.19746 | 1.0230 | 18.8675 | 1.0054 |
| نباتات | 812.2915 | ٤٣.٢٨٦ | 872.071 | ٤٦.٤٧١ |
| أرض قاحلة | 76.57944 | ٤.٠٨٠٨ | 60.0219 | 3.1985 |
| تراكم | 968.4986 | 51.610 | 925.606 | ٤٩.٣٢٤ |
الأعمال المتعلقة باستخدام الأراضي وتغطية الأرض
| فئات استخدام الأراضي | المتوقع 2034 | التغير 2024-2034 | المتوقع 2044 | التغير 2034-2044 | ||
|
|
% |
|
% | |||
| المسطحات المائية | 19.10 | 1.01 | -0.45 | 17.23 | 0.91 | -1.87 |
| النباتات | 751.47 | 40.04 | -23.28 | 695.18 | 37.04 | -56.29 |
| البناء | 15.34 | 0.81 | -23.69 | 7.84 | 0.41 | -7.50 |
| الأراضي القاحلة | 1090.62 | 58.11 | 47.06 | 1156.30 | 61.61 | 65.67 |
(LAI)، والانبعاثية. أظهرت النتائج أن تغيرات استخدام الأراضي أدت إلى انخفاض كبير في درجات حرارة الصيف وزيادة في درجات حرارة الشتاء. لوحظ تحسين أداء نموذج WRF مع استخدام بيانات استخدام الأراضي المحدثة
تحديد عدم اليقين
ممارسات إدارة الأراضي البيئية
ومن خلال دمج هذه الرؤى في تطوير السياسات، يمكن لصانعي القرار ضمان أن التوسع الحضري في لاهور يتم بطريقة مستدامة بيئيًا.
القيود والاتجاهات المستقبلية
الخاتمة والتوصيات
توفر البيانات
تاريخ الاستلام: 3 يوليو 2024؛ تاريخ القبول: 22 يناير 2025
تاريخ النشر على الإنترنت: 25 يناير 2025
References
- Hu, Y. et al. Land Use / Land Cover Change Detection and NDVI Estimation in Pakistan ‘s Land Use / Land Cover Change Detection and NDVI Estimation in Pakistan’s Southern Punjab Province. (2023). https://doi.org/10.3390/su15043572
- Haseeb, M., Tahir, Z., Mahmood, S. A., Batool, S. & Farooq, M. U. Spatial soil loss prediction impacted by long-term land use/land cover change: a case study of Swat District. Environ. Monit. Assess. 196, (2024).
- Abdul Athick, A. S. M. & Shankar, K. Data on land use and land cover changes in Adama Wereda, Ethiopia, on ETM+, TM and OLI- TIRS landsat sensor using PCC and CDM techniques. Data Br. 24, 103880 (2019).
- Zhu, L., Song, R., Sun, S., Li, Y. & Hu, K. Land use/land cover change and its impact on ecosystem carbon storage in coastal areas of China from 1980 to 2050. Ecol. Indic. 142, 109178 (2022).
- Wang, S. W., Munkhnasan, L. & Lee, W. K. Land use and land cover change detection and prediction in Bhutan’s high altitude city of Thimphu, using cellular automata and Markov chain. Environ. Challenges. 2, 100017 (2021).
- Kedia, S., Bhakare, S. P., Dwivedi, A. K., Islam, S. & Kaginalkar, A. Estimates of change in surface meteorology and urban heat island over northwest India: impact of urbanization. Urban Clim. 36, 100782 (2021).
- Khanal, N., Uddin, K. & Matin, M. A. Automatic detection of Spatiotemporal Urban expansion patterns by fusing OSM and Landsat Data in Kathmandu. (2019). https://doi.org/10.3390/rs11192296
- Mallupattu, P. K. & Sreenivasula Reddy, J. R. Analysis of land use/land cover changes using remote sensing data and GIS at an urban area, Tirupati, India. Sci. World J. 2013, 1-7 (2013).
- Hussain, S., Mubeen, M. & Karuppannan, S. Land use and land cover (LULC) change analysis using TM, ETM + and OLI Landsat images in district of Okara, Punjab, Pakistan. Phys. Chem. Earth Parts A/B/C. 126, 103117 (2022).
- Sahana, M., Ahmed, R. & Sajjad, H. Analyzing land surface temperature distribution in response to land use/land cover change using split window algorithm and spectral radiance model in Sundarban Biosphere Reserve, India. Model. Earth Syst. Environ. 2, 81 (2016).
- Yazdanpanah, M. et al. The impact of Livelihood assets on the Food Security of Farmers in Southern Iran during the COVID-19 pandemic. Int. J. Environ. Res. Public. Health 18, (2021).
- Ojima, D. S., Galvin, K. A. & Turner, B. L. The global impact of land-use change: to understand global change, natural scientists must consider the social context influencing human impact on environment. Bioscience 44, 300-304 (1994).
- Rane, N., Achari, A., Choudhary, S. & Giduturi, M. Effectiveness and Capability of Remote Sensing (RS) and Geographic Information Systems (GIS): A Powerful Tool for Land use and Land Cover (LULC) Change and Accuracy Assessment. 8, 286-295 (2023).
- Waleed, M. & Sajjad, M. Leveraging cloud-based computing and spatial modeling approaches for land surface temperature disparities in response to land cover change: evidence from Pakistan. Remote Sens. Appl. Soc. Environ. 25, 100665 (2022).
- Asif, M. et al. Modelling of land use and land cover changes and prediction using CA-Markov and Random Forest. Geocarto Int. 38, (2023).
- Zhao, Q. et al. Evaluation of Land Use Land Cover changes in response to Land Surface temperature with Satellite indices and Remote Sensing Data. Rangel. Ecol. Manag. 96, 183-196 (2024).
- Khan, R. et al. Monitoring land use land cover changes and its impacts on land surface temperature over Mardan and Charsadda Districts, Khyber Pakhtunkhwa (KP), Pakistan. Environ. Monit. Assess. 194, 409 (2022).
- Sadiq Khan, M., Ullah, S., Sun, T., Rehman, A. U. R. & Chen, L. Land-Use/Land-Cover Changes and Its Contribution to Urban Heat Island: A Case Study of Islamabad, Pakistan. Sustainability 12, (2020).
- Sarfo, A. K. & Karuppannan, S. Application of Geospatial Technologies in the COVID-19 fight of Ghana. Trans. Indian Natl. Acad. Eng. 5, 193-204 (2020).
- Mukherjee, S. et al. Aquatic eco-systems under influence of Climate Change and anthropogenic activities: potential threats and its mitigation strategies. in 307-331 (2022). https://doi.org/10.1002/9781119870562.ch14
- Kharazmi, R. et al. Monitoring and assessment of seasonal land cover changes using remote sensing: a 30-year (1987-2016) case study of Hamoun Wetland, Iran. Environ. Monit. Assess. 190, 356 (2018).
- Birhanu, A., Masih, I., van der Zaag, P., Nyssen, J. & Cai, X. Impacts of land use and land cover changes on hydrology of the Gumara catchment, Ethiopia. Phys. Chem. Earth Parts A/B/C. 112, 165-174 (2019).
- Choate, M., Rengarajan, R., Storey, J. & Lubke, M. Geometric calibration updates to Landsat 7 ETM + instrument for Landsat Collection 2 products. Remote Sens. 13, (2021).
- Zoungrana, B. J. B., Conrad, C., Thiel, M., Amekudzi, L. K. & Da, E. D. MODIS NDVI trends and fractional land cover change for improved assessments of vegetation degradation in Burkina Faso, West Africa. J. Arid Environ. 153, 66-75 (2018).
- Mozumder, C. & Tripathi, N. Geospatial scenario based modelling of urban and agricultural intrusions in Ramsar Wetland Deepor Beel in Northeast India using a multi-layer perceptron neural network. Int. J. Appl. Earth Obs Geoinf. 32, 92-104 (2014).
- Upadhaya, S. & Dwivedi, P. Conversion of forestlands to blueberries: assessing implications for habitat quality in Alabaha river watershed in Southeastern Georgia, United States. Land. use Policy. 89, 104229 (2019).
- Ouma, Y. O. et al. Land-Use Change Prediction in Dam Catchment Using Logistic Regression-CA, ANN-CA and Random Forest Regression and Implications for Sustainable Land-Water Nexus. Sustainability 16, (2024).
- Kumar, L. & Mutanga, O. Google Earth Engine applications since inception: usage, trends, and potential. Remote Sens. 10, 1-15 (2018).
- Avci, C., Budak, M., Yagmur, N. & Balcik, F. B. Comparison between random forest and support vector machine algorithms for LULC classification. Int. J. Eng. Geosci. 8, 1-10 (2023).
- Naghdyzadegan Jahromi, M. et al. Developing machine learning models for wheat yield prediction using ground-based data, satellite-based actual evapotranspiration and vegetation indices. Eur. J. Agron. 146, 126820 (2023).
- Sibanda, S. & Ahmed, F. Modelling historic and future land use/land cover changes and their impact on wetland area in Shashe sub-catchment, Zimbabwe. Model. Earth Syst. Environ. 7, 57-70 (2021).
- Hyandye, C. & Martz, L. W. A Markovian and cellular automata land-use change predictive model of the Usangu Catchment. Int. J. Remote Sens. 38, 64-81 (2017).
- Ganjirad, M. & Bagheri, H. Ecological Informatics Google Earth Engine-based mapping of land use and land cover for weather forecast models using landsat 8 imagery. Ecol. Inf. 80, 102498 (2024).
- Liping, C., Yujun, S. & Saeed, S. Monitoring and predicting land use and land cover changes using remote sensing and GIS techniques-A case study of a hilly area, Jiangle, China. PLoS One. 13, 1-23 (2018).
- Dey, N. N., Rakib, A., Kafy, A., Raikwar, V. & A.- Al & Geospatial modelling of changes in land use/land cover dynamics using multi-layer Perceptron Markov chain model in Rajshahi City, Bangladesh. Environ. Challenges. 4, 100148 (2021).
- Majumder, M. Introduction to Model Development for Prediction, Simulation and Optimization. (2023).
- Li, Y. et al. Dynamics of Land Use/Land Cover Considering Ecosystem Services for a dense-Population Watershed based on a hybrid dual-subject Agent and Cellular Automaton modeling Approach. Engineering https://doi.org/10.1016/j.eng.2023.10.015 (2024).
- Bashir, O. et al. Simulating Spatiotemporal Changes in Land Use and Land Cover of the North-Western Himalayan Region Using Markov Chain Analysis. Land 11, (2022).
- Belay, T. & Mengistu, D. A. Impacts of land use/land cover and climate changes on soil erosion in Muga watershed, Upper Blue Nile basin (Abay), Ethiopia. Ecol. Process. 10, 68 (2021).
- Amin, M. et al. Monitoring agricultural drought using geospatial techniques: a case study of thal region of Punjab, Pakistan.
. Water Clim. Chang. 11, 203-216 (2020). - Abbas, F. Analysis of a historical (1981-2010) temperature record of the Punjab Province of Pakistan. Earth Interact. 17, 1-23 (2013).
- Minallah, M. Retrieval of Land Surface temperature of Lahore through Landsat-8 TIRS Data. Int. J. Econ. Environ. Geol. 10, 70-77 (2019).
- Khokhar, M. F., Mehdi, H., Abbas, Z. & Javed, Z. Temporal assessment of NO2 pollution levels in urban centers of Pakistan by employing ground-based and satellite observations. Aerosol Air Qual. Res. 16, 1854-1867 (2016).
- Basheer, M. A. & Waseem, M. A. Spatiotemporal Analysis of Urban Growth and Land Surface temperature: a case study of Lahore, Pakistan. Int. Arch. Photogramm Remote Sens. Spat. Inf. Sci. – ISPRS Arch. 48, 25-29 (2022).
- Xue, J. & Su, B. Significant remote sensing vegetation indices: A review of developments and applications. J. Sensors (2017). (2017).
- Kumari, M. & Sarma, K. Changing trends of land surface temperature in relation to land use/cover around thermal power plant in Singrauli district, Madhya Pradesh, India. Spat. Inf. Res. 25, 769-777 (2017).
- Jaswal, S. & Thakur, P. Correlation between LST, NDVI and NDBI with reference to Urban Sprawling – A Case Study of Shimla city. Int. J. Multidiscip Res. 5, 1-14(2023).
- Haseeb, M. et al. Enhancing Carbon Sequestration through Afforestation: evaluating the impact of Land Use and Cover changes on Carbon Storage dynamics. Earth Syst. Environ. https://doi.org/10.1007/s41748-024-00414-z (2024).
- Zhao, H. & Chen, X. Use of normalized difference bareness index in quickly mapping bare areas from TM/ETM+. in Proceedings. 2005 IEEE International Geoscience and Remote Sensing Symposium, 2005. IGARSS ’05. vol. 3 1666-1668 (2005).
- Al-aarajy, K. H. A., Zaeen, A. A. & Abood, K. I. Supervised Classification Accuracy Assessment Using Remote Sensing and Geographic Information System. 13, 396-403 (2024).
- Selmy, S. A. H. et al. Detecting, Analyzing, and Predicting Land Use / Land Cover (LULC) Changes in Arid Regions Using Landsat Images, CA-Markov Hybrid Model, and GIS Techniques. (2023).
- Salvi, M., Acharya, U. R., Molinari, F. & Meiburger, K. M. The impact of pre- and post-image processing techniques on deep learning frameworks: a comprehensive review for digital pathology image analysis. Comput. Biol. Med. 128, 104129 (2021).
- Abdul Rahaman, S., Aruchamy, S., Balasubramani, K. & Jegankumar, R. Land use/land cover changes in semi-arid mountain landscape in Southern India: a geoinformatics based Markov chain approach. Int. Arch. Photogramm Remote Sens. Spat. Inf. Sci. ISPRS Arch. 42, 231-237 (2017).
- Firozjaei, M. K., Sedighi, A., Argany, M., Jelokhani-Niaraki, M. & Arsanjani, J. J. A geographical direction-based approach for capturing the local variation of urban expansion in the application of CA-Markov model. Cities 93, 120-135 (2019).
- Nouri, J., Gharagozlou, A., Arjmandi, R., Faryadi, S. & Adl, M. Predicting Urban Land Use Changes using a CA-Markov Model. Arab. J. Sci. Eng. 39, 5565-5573 (2014).
- Aliani, H., Malmir, M., Sourodi, M. & Kafaky, S. B. Change detection and prediction of urban land use changes by CA-Markov model (case study: Talesh County). Environ. Earth Sci. 78, 546 (2019).
- Ma, C., Zhang, G. Y., Zhang, X. C., Zhao, Y. J. & Li, H. Y. Application of Markov model in wetland change dynamics in Tianjin Coastal Area, China. Procedia Environ. Sci. 13, 252-262 (2012).
- Keshtkar, H. & Voigt, W. A spatiotemporal analysis of landscape change using an integrated Markov chain and cellular automata models. Model. Earth Syst. Environ. 2, 10 (2015).
- Mannan, A. et al. Application of land-use/land cover changes in monitoring and projecting forest biomass carbon loss in Pakistan. Glob Ecol. Conserv. 17, e00535 (2019).
- Laari, S. K. S. P. B., Szabó, S. & S. M. P. K. S. & Modelling of land use land cover change using earth observation data-sets of Tons River Basin, Madhya Pradesh, India. Geocarto Int. 33, 1202-1222 (2018).
- Eastman, J. R. Guide to GIS and Image Processing. (2009).
- Pan, S. et al. Runoff Responses to Climate and Land Use/Cover Changes under Future Scenarios. Water vol. 9 at (2017). https://do i.org/10.3390/w9070475
- McHugh, M. L. Interrater reliability: the kappa statistic. Biochem. Med. 22, 276-282 (2012).
- Jiang, Q. et al. Spatiotemporal analysis of land use and land cover (lulc) changes and precipitation trends in Shanghai. Appl. Sci. 10, 1-21 (2020).
- Zhang, G. et al. Rapid urbanization induced daily maximum wind speed decline in metropolitan areas: a case study in the Yangtze River Delta (China). Urban Clim. 43, 101147 (2022).
- Ovalle, A. G. C., Tristán, A. C., Amador-Nieto, J. A., Putri, R. F. & Zahra, R. A. Analysing the land use/land cover influence on land surface temperature in San Luis Potosí Basin, México using remote sensing techniques. IOP Conf. Ser. Earth Environ. Sci. 686, 12029 (2021).
- Zarin, T. & Esraz-Ul-Zannat, M. Assessing the potential impacts of LULC change on urban air quality in Dhaka city. Ecol. Indic. 154, 110746 (2023).
- Talukder, A., Mim, S. M., Ahmed, S., Syed, M. & Rahman, R. M. Machine learning and remote sensing technique for urbanization change detection in Tangail District. in Intelligent Sustainable Systems (eds Nagar, A. K., Jat, D. S. & Marín-Raventós, G.) (2022). & Mishra, D. K.) 241-249 (Springer Nature Singapore, Singapore.
- Hamad, R., Balzter, H. & Kolo, K. Predicting Land Use/Land Cover Changes Using a CA-Markov Model under Two Different Scenarios. Sustainability 10, (2018).
- Karimi, H., Jafarnezhad, J., Khaledi, J. & Ahmadi, P. Monitoring and prediction of land use/land cover changes using CA-Markov model: a case study of Ravansar County in Iran. Arab. J. Geosci. 11, 592 (2018).
الشكر والتقدير
مساهمات المؤلفين
التمويل
الإعلانات
المصالح المتنافسة
معلومات إضافية
معلومات إعادة الطبع والتصاريح متاحة علىwww.nature.com/reprints.
ملاحظة الناشر تظل Springer Nature محايدة فيما يتعلق بالمطالبات القضائية في الخرائط المنشورة والانتماءات المؤسسية.
© المؤلفون 2025
معهد علوم الفضاء، جامعة البنجاب، لاهور 54780، البنجاب، باكستان. مركز أبحاث الجبال المتكاملة، جامعة البنجاب، لاهور 54780، البنجاب، باكستان. قسم هندسة البرمجيات، كلية علوم الحاسوب والمعلومات، جامعة الملك سعود، الرياض 11543، المملكة العربية السعودية. قسم موارد المياه والهندسة البيئية، جامعة ننگرهار، جلال آباد، ننگرهار 2600، أفغانستان. مدرسة موارد الهندسة البيئية، جامعة شرق الصين للعلوم والتكنولوجيا، شنغهاي 200237، جمهورية الصين الشعبية. قسم مصايد الأسماك والحياة البرية وتربية الأحياء المائية، كلية موارد الغابات، جامعة ولاية ميسيسيبي، ولاية ميسيسيبي، MS 39762-9690، الولايات المتحدة الأمريكية. البريد الإلكتروني: mrhaseeb223@gmail.com; sajidjalwan@gmail.com
DOI: https://doi.org/10.1038/s41598-025-87796-w
PMID: https://pubmed.ncbi.nlm.nih.gov/39863826
Publication Date: 2025-01-25
scientific reports
OPEN
Predicting land use and land cover changes for sustainable land management using CA-Markov modelling and GIS techniques
Abstract
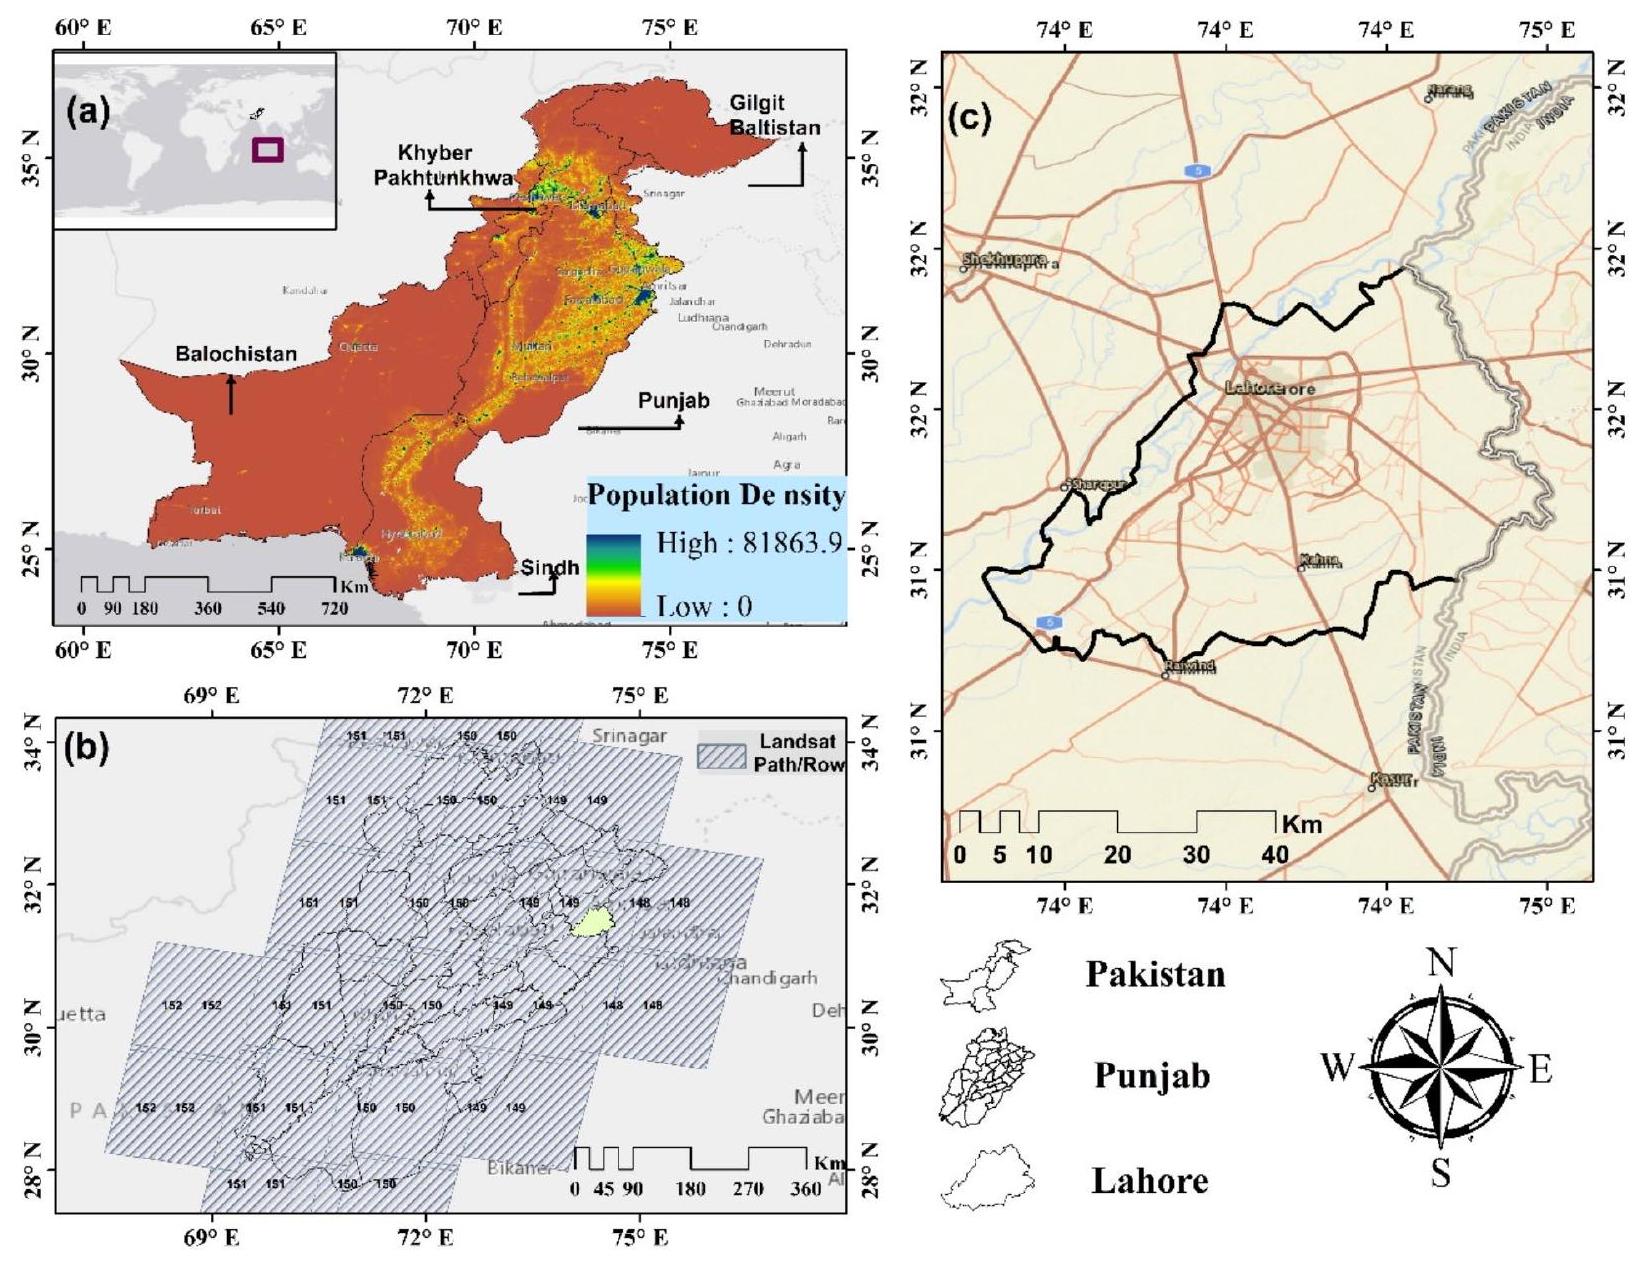
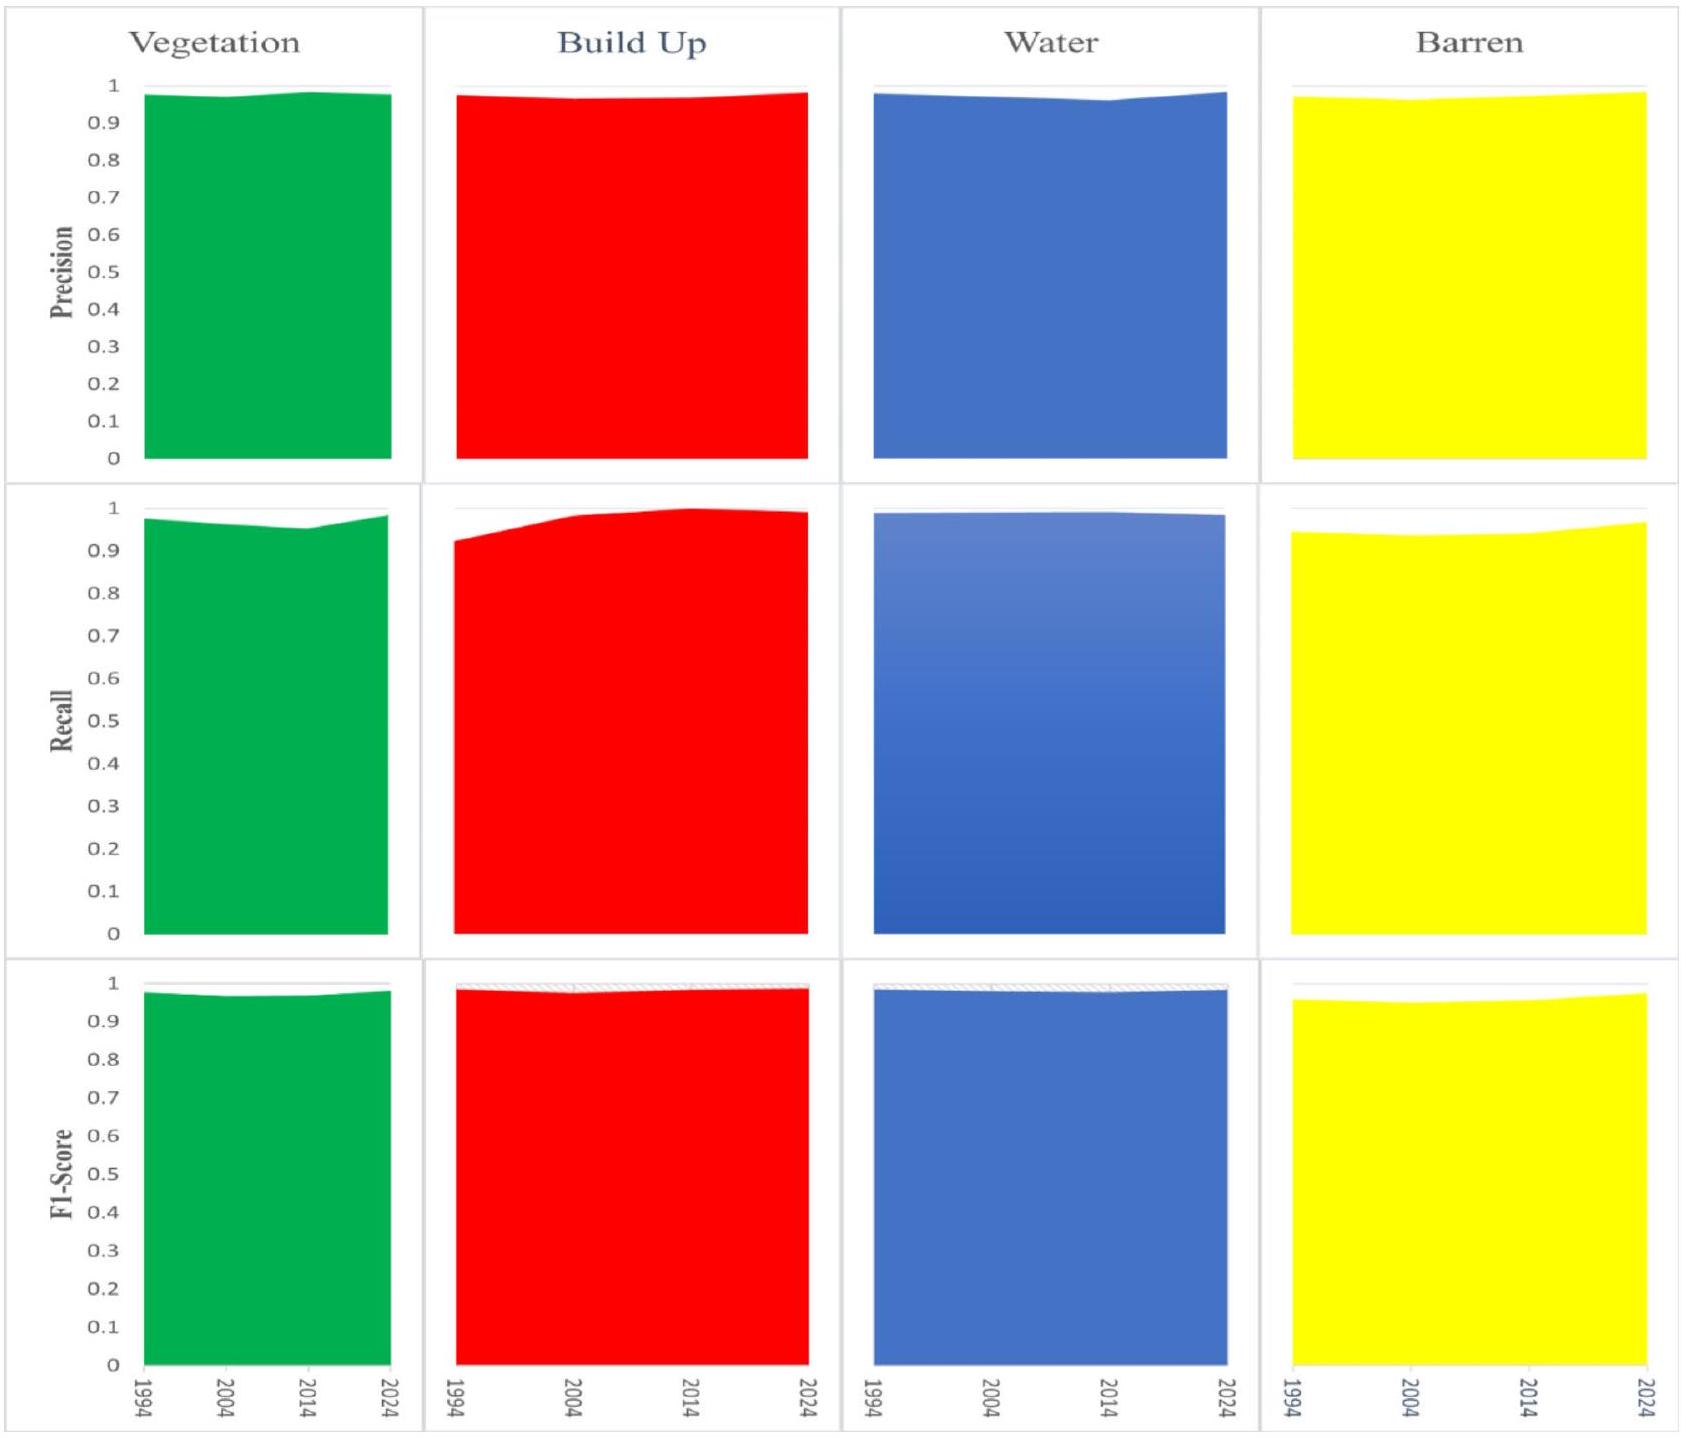
This study addresses the significant issue of rapid land use and land cover (LULC) changes in Lahore District, which is critical for supporting ecological management and sustainable land-use planning. Understanding these changes is crucial for mitigating adverse environmental impacts and promoting sustainable development. The main goal is to evaluate historical LULC changes from 1994 to 2024 and forecast future trends for 2034 and 2044 utilizing the CA-Markov hybrid model combined with GIS methodologies. Landsat images from various sensors (TM, OLI) were employed for supervised classification, attaining high accuracy (>90%). Historical LULC changes from 1994 to 2024 were analyzed, revealing significant transformations in Lahore. The build-up area expanded by
Materials and methods Study area
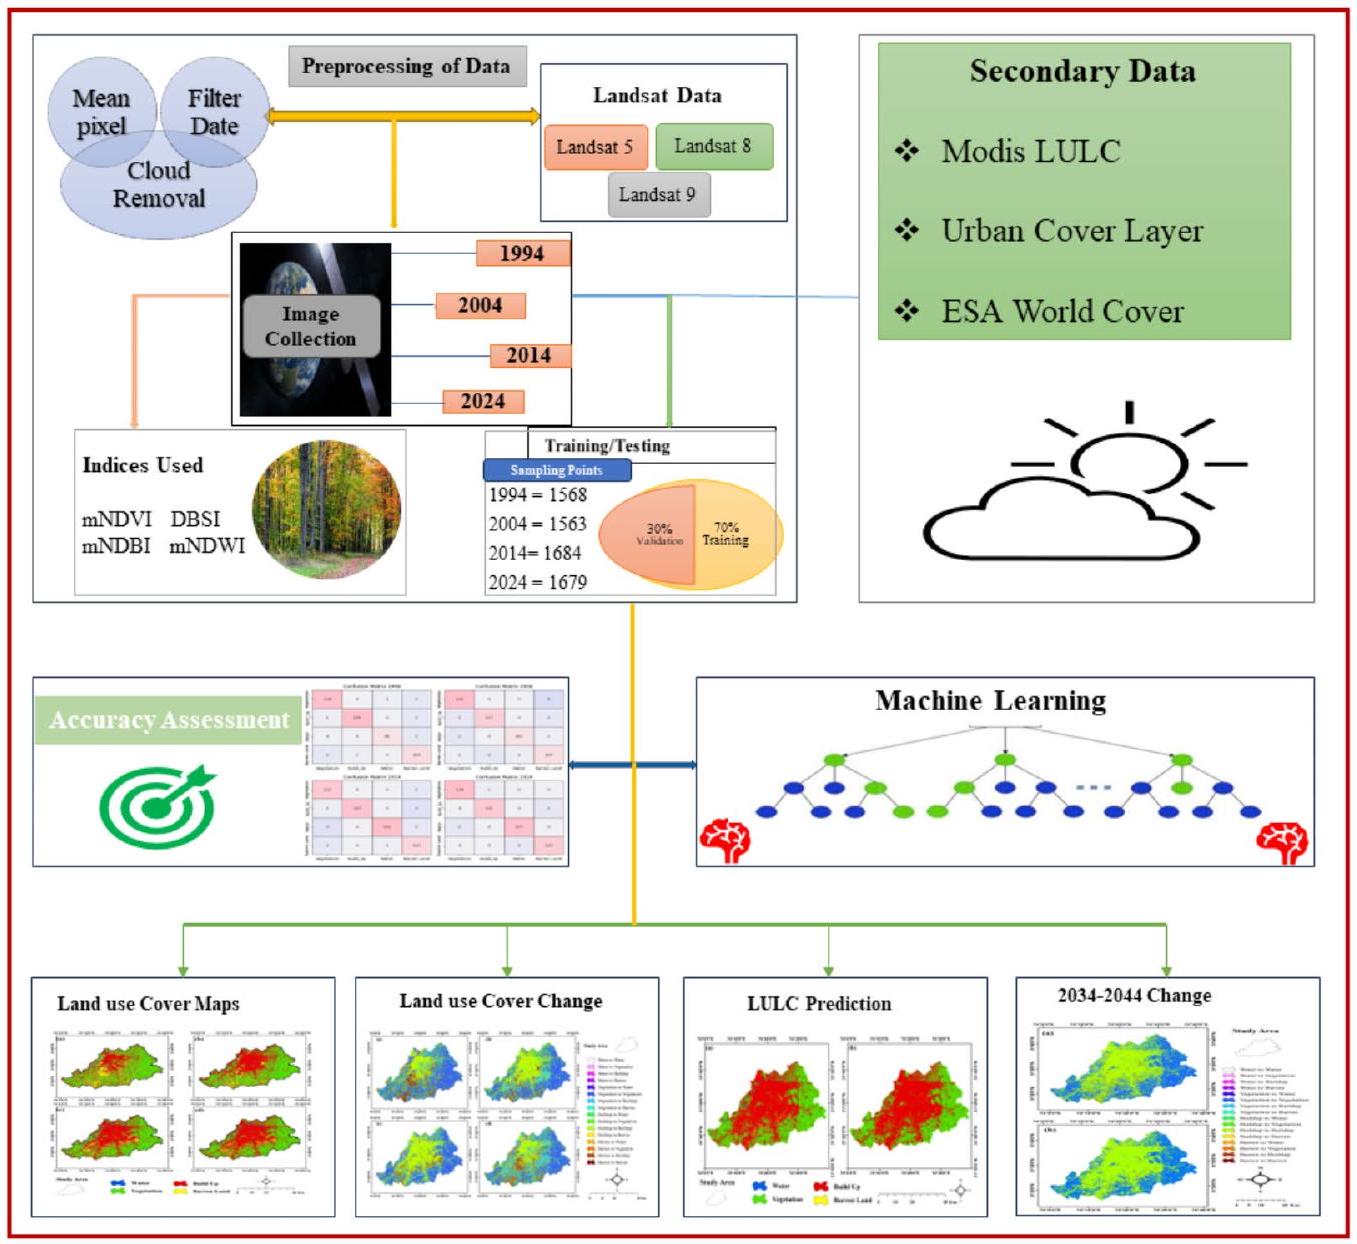
Data acquisition
Preprocessing of remote sensing data
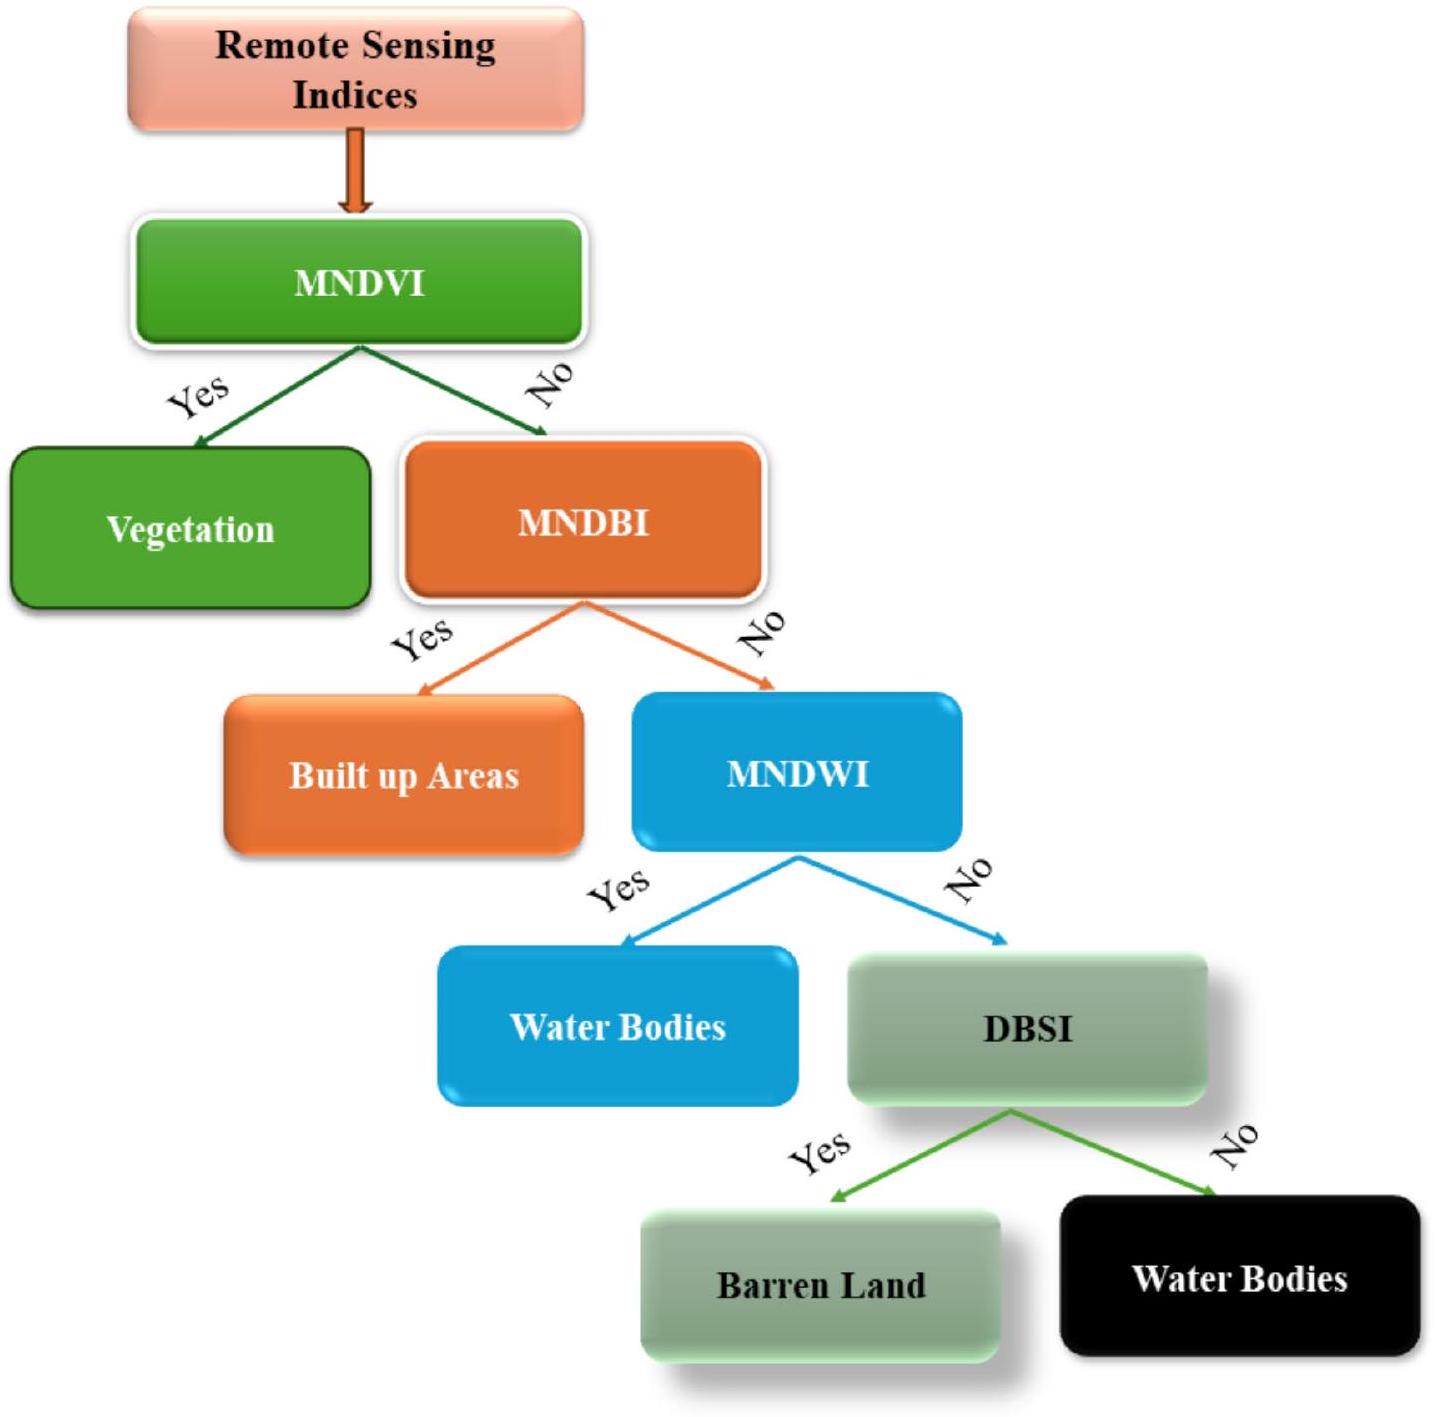
Remote sensing indices (RSIs)
Image classification and accuracy assessment
| Satellite | Sensor type | No of bands | Spatial resolution | Radiometric resolution | Acquisition date | Source |
| Landsat 5 | TM | 7 | 30 m | 8 bits | 1994 and 2004 | |
| Landsat 8 | OLI/TIRS | 11 | 30 m | 12 bits | 2014 | https://landsat.gsfc.nasa.gov/ |
| Landsat 9 | OLI-2/TIRS-2 | 11 | 30 m | 14 bits | 2024 |
| Indices | Formula | Source |
| Modified Normalized differential vegetation index (MNDVI) |
|
46 |
| Modified Normalized differential Buildup index (MNDBI) |
|
47 |
| Modified Normalized Difference Water Index (MNDWI) |
|
48 |
| Dry Bare soil Index (DBSI) |
|
49 |
| LULC Classes | Description |
| Build-up | Residential, commercial and services, industrial, transportation, roads, mixed urban, and other urban |
| Barren land | Open spaces, bare land and soils, sands, dunes, and excavation sites |
| Vegetation | Deciduous forests, mixed forest lands, palms, conifer, scrub, Crop fields, agricultural lands, forests, trees, and others |
| Water Bodies | River networks, canals, active hydrological features, channels, rivers, and waterlogged areas are also included |
of ground truth data derived from historical maps, high-resolution satellite imagery, and records from field surveys. Due to the scarcity of direct field data from 1994, we employed reference points obtained from highresolution images and corroborated them with previous data. Additionally, a semi-detailed survey conducted in 2024 provided precise information about soil trends, terrain, and environmental features. This data was used as a reliable reference for the entire research region. We employed a 70:30 ratio for training and validation points. A total of 500 ground control points were collected during a semi-detailed survey conducted in 2024, which covered various land classes (build-up areas, vegetation, barren land, and water bodies) to enhance the accuracy of the LULC classification. Consequently, the accuracy of each labeled image was assessed by calculating the values of the producer’s, user’s, overall, and Kappa coefficients, and Eqs. 1-4 outline the process for calculating them. Furthermore, the integration of GIS with remote sensing data and the Markov model was leveraged, highlighting the synergistic benefits of combining these technologies
Post processing
LULC change prediction using the CA-Markov Hybrid Model (CA-MHM)
LULC prediction for 2034 and 2044
- The CA-MHM was used to calculate transition probability matrices for the years 1994, 2004, 2014, and 2024.
- These transitional matrixes were subsequently utilized to produce a series of conditional probabilistic datasets for various land types spanning from 1994 to 2024.
- The transitional probability matrixes for the periods 1994-2004, 2004-2014, and 2014-2024, in conjunction with the conditional probabilistic data and LULC classification maps for 2014 and 2024, were combined using the CA-Markov geospatial operators.
- This integration was used to simulate LULC maps for 2034 and 2044.
Validation of the Markov model
Results
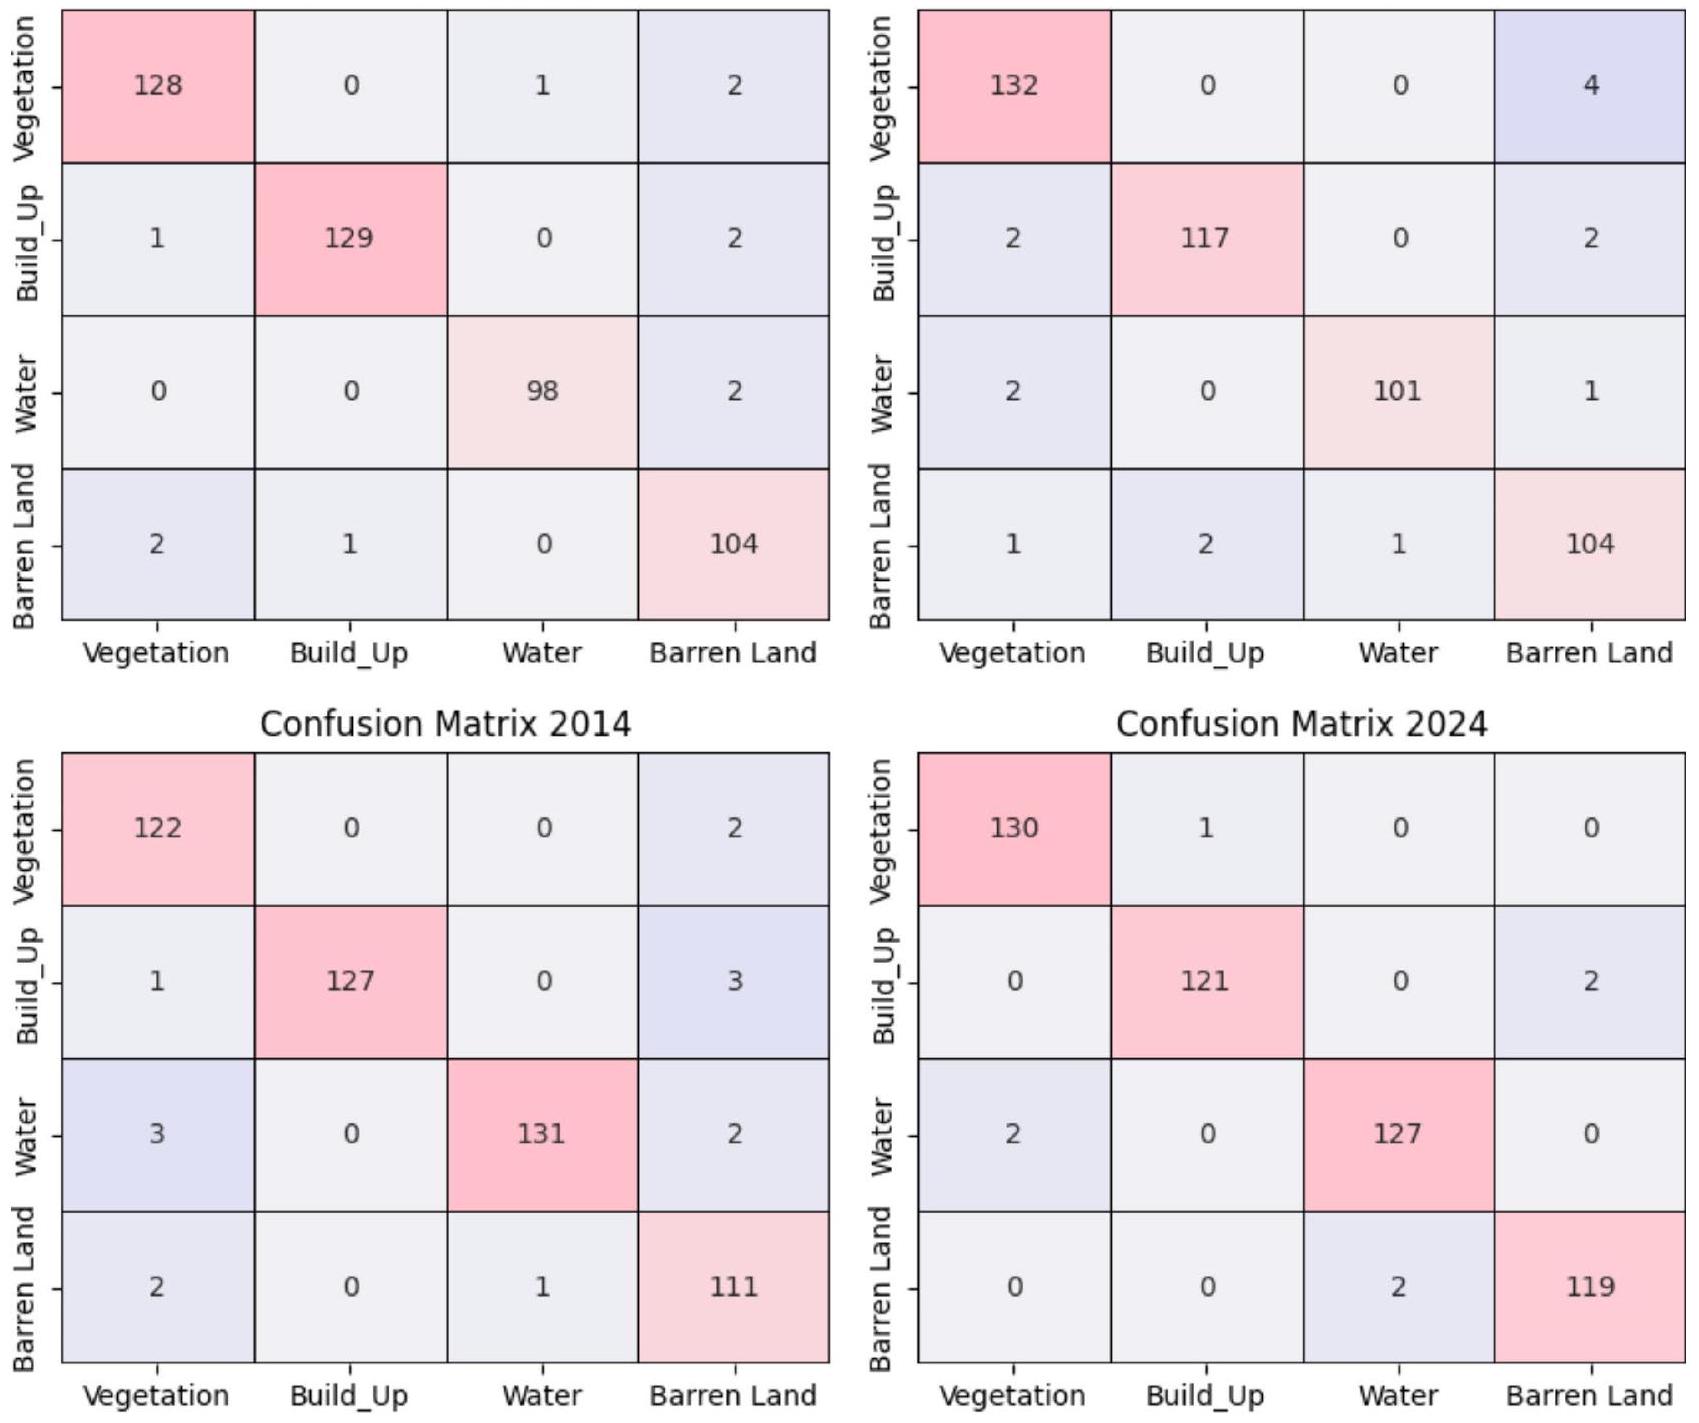
Accuracy assessment of LULC classes
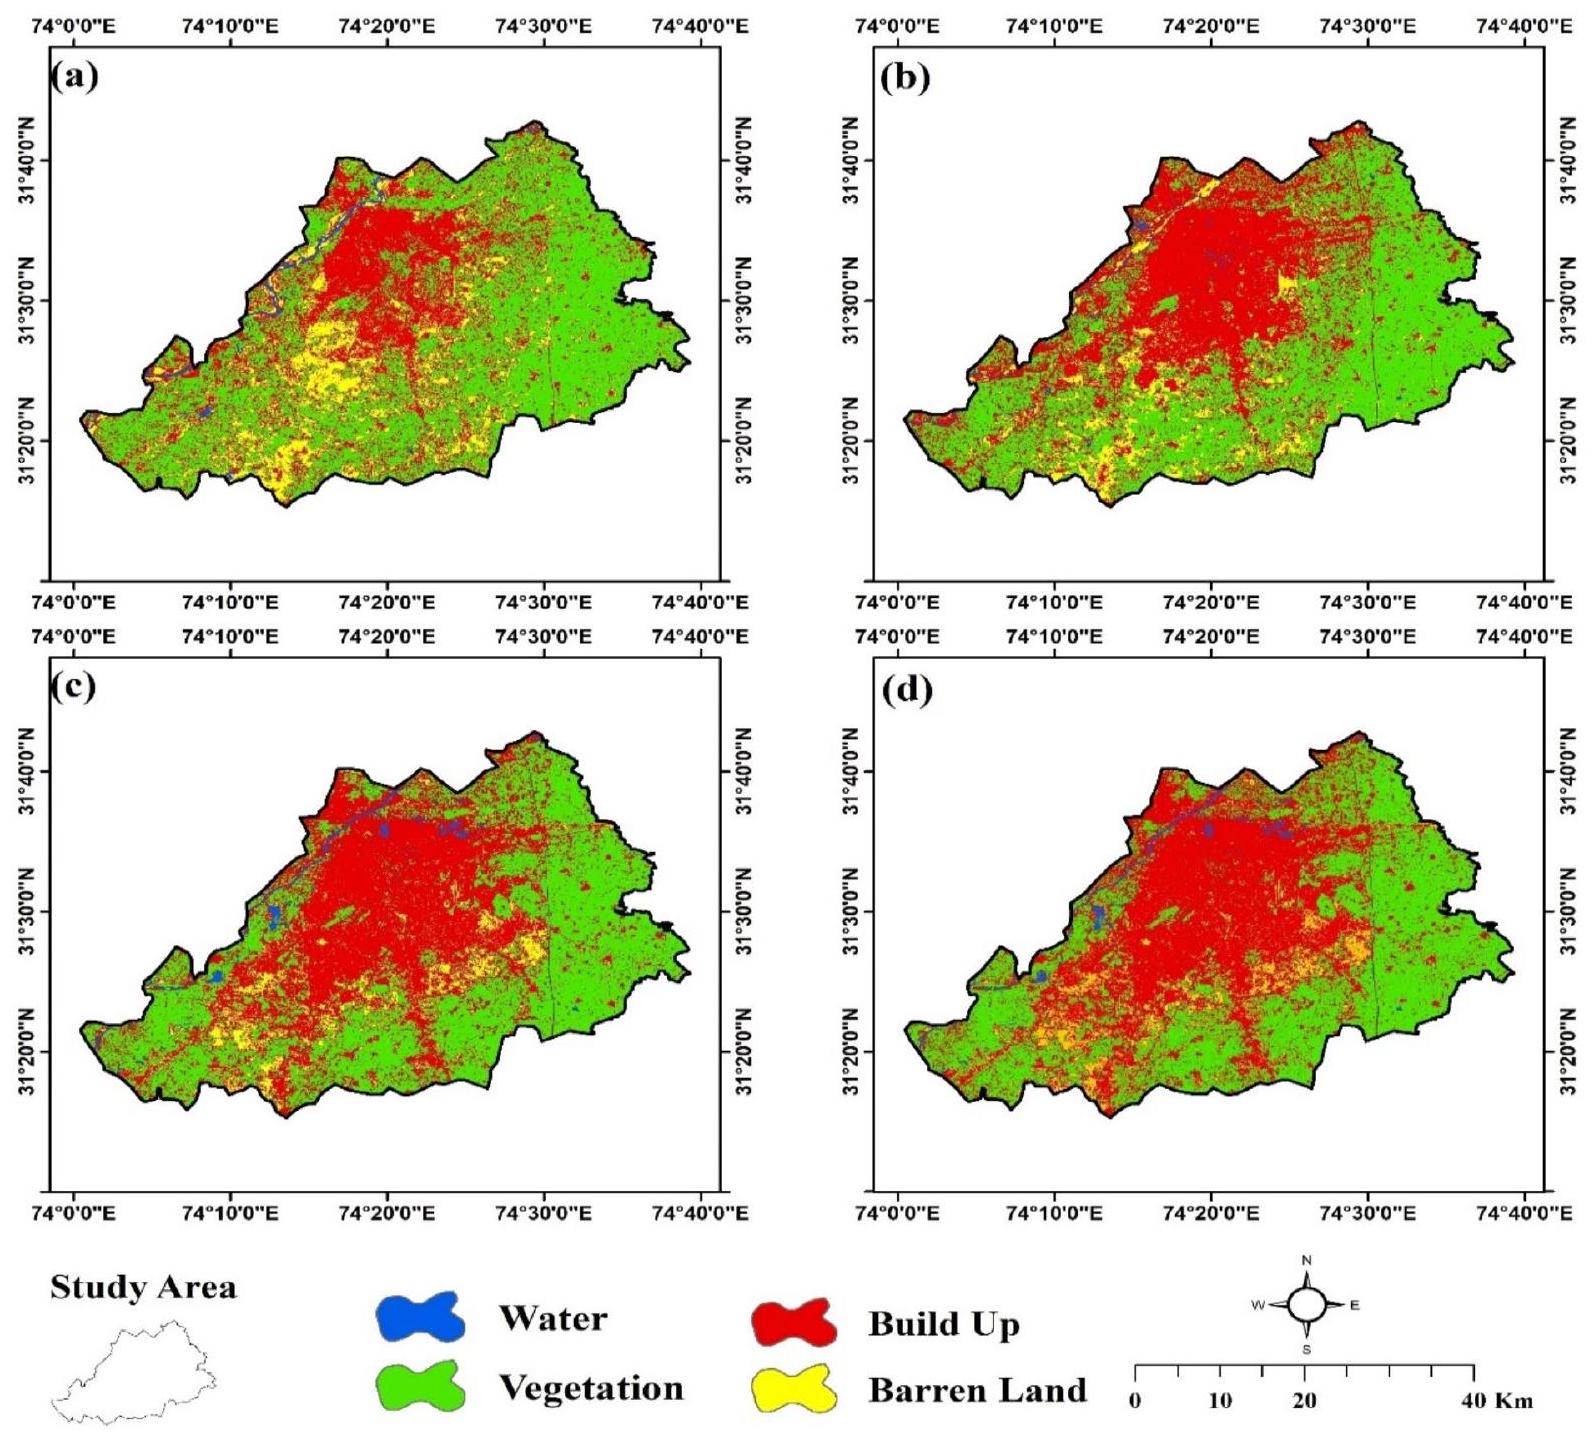
LULC classification
| Kappa Coefficient Value | Level of Agreement |
|
|
Poor Agreement |
|
|
Fair Agreement |
|
|
Moderate Agreement |
|
|
Substantial Agreement |
|
|
Perfect |
LULC changes
LULC dynamics
Markov chain model analysis
Validation of the Markov model
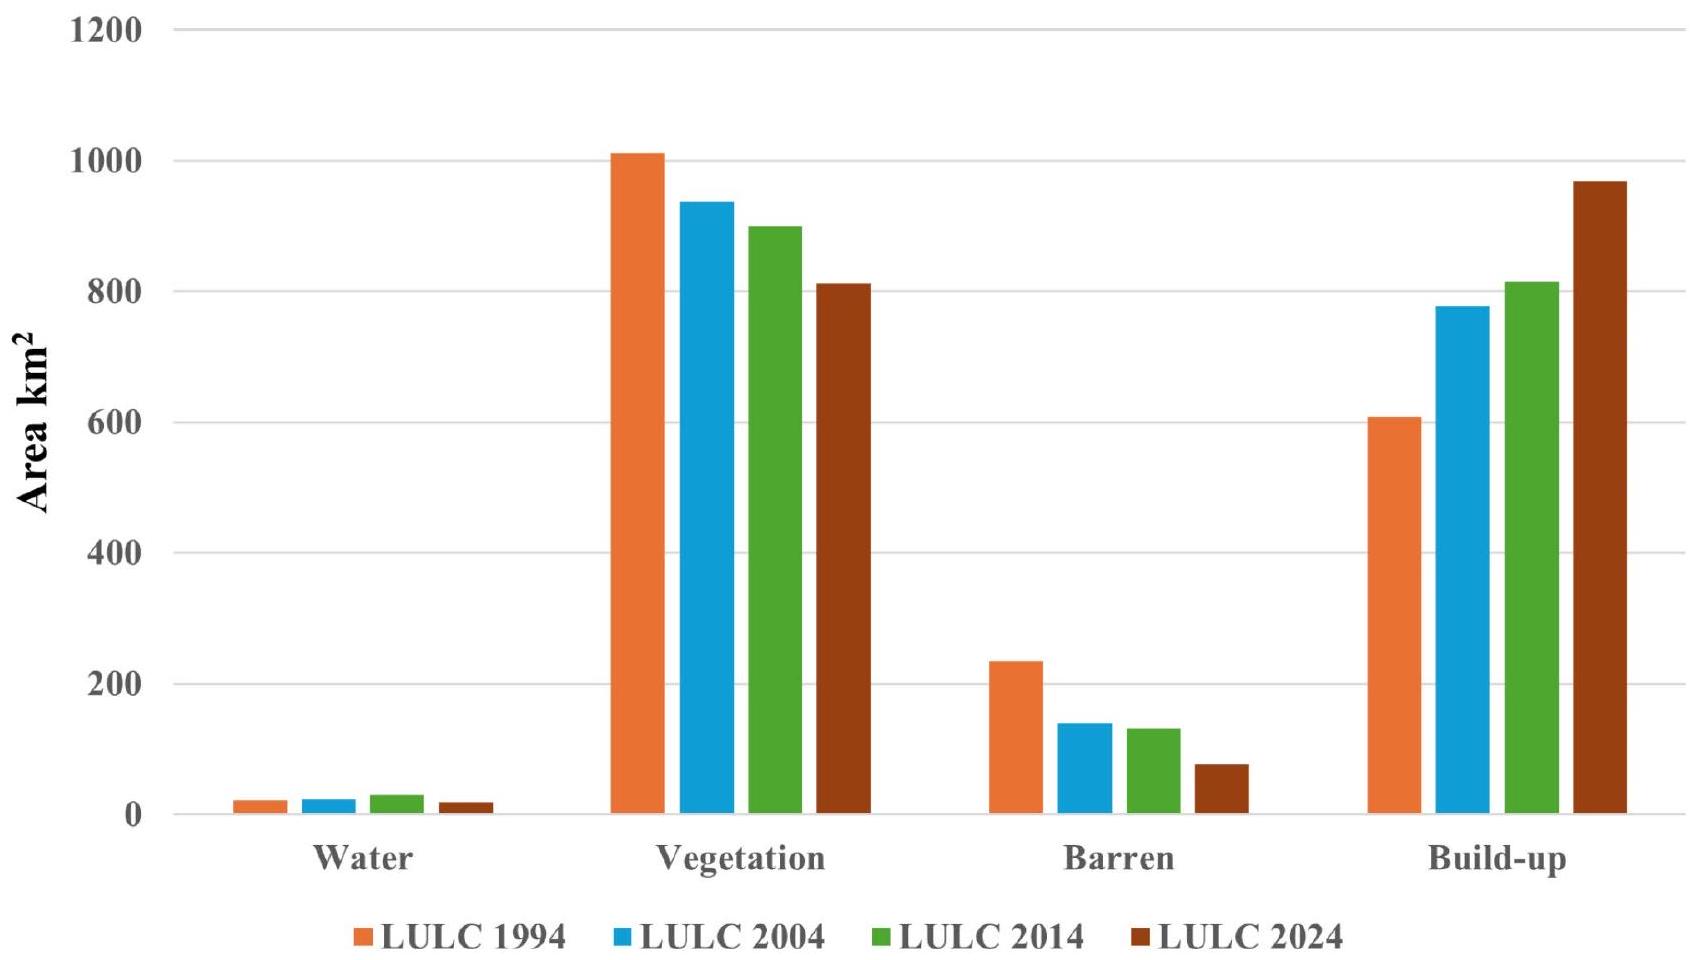
| LULC Classes | 1994 | 2004 | 2014 | 2024 | ||||
| Area | % | Area | % | Area | % | Area | % | |
| Water bodies | 21.76 | 1.16 | 23.18 | 1.23 | 30.24 | 1.61 | 19.19 | 1.02 |
| Vegetation | 1011.06 | 53.9 | 936.37 | 49.9 | 899.73 | 47.9 | 812.29 | 43.3 |
| Barren land | 235.07 | 12.5 | 138.89 | 7.4 | 131.45 | 7.00 | 76.58 | 4.08 |
| Build-up | 608.65 | 32.43 | 778.11 | 41.4 | 815.12 | 43.4 | 968.49 | 51.6 |
| Total | 1876.56 | 100 | 1876.56 | 100 | 1876.56 | 100 | 1876.56 | 100 |
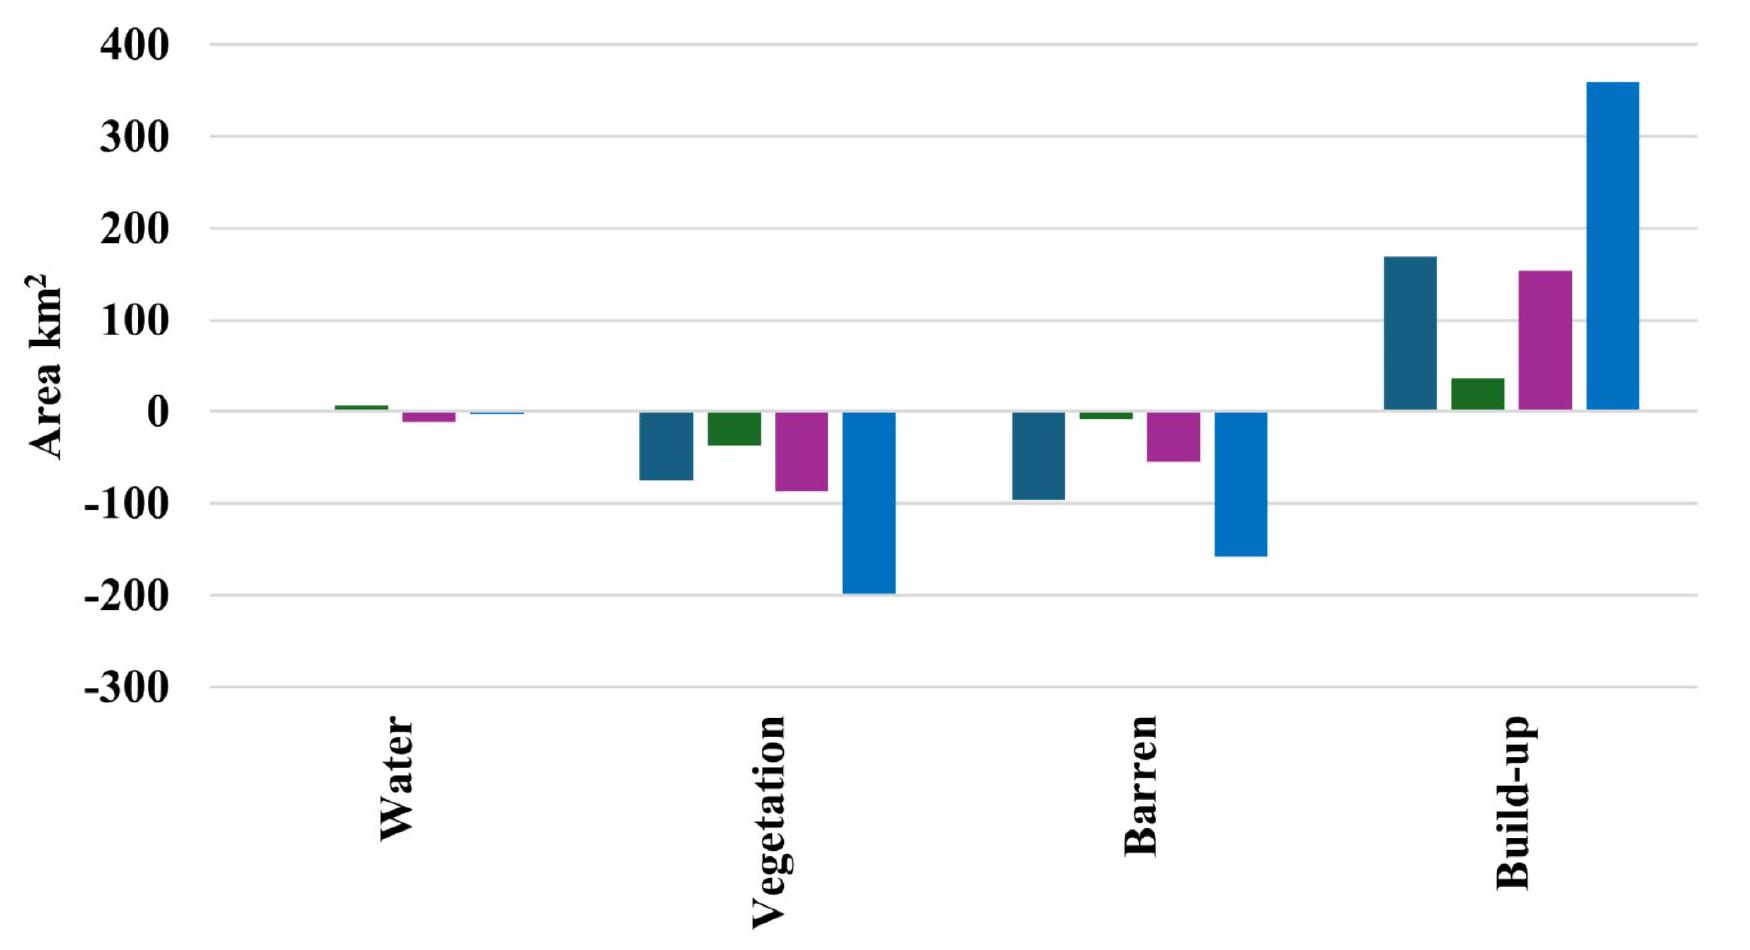
Future prediction of LULC classes
| Change in area
|
||||
| LULC Classes |
|
|
|
|
| Water bodies | 1.42 | 7.05 | -11.05 | -2.57 |
| Vegetation | -74.7 | -36.6 | -87.4 | -198.7 |
| Barren land | -96.2 | -7.43 | -54.88 | -158.5 |
| Build-up | 169.4 | 37 | 153.3 | 359.8 |
Discussion
| Probability of Changing from 1994 to 2004 | ||||
| LULC Classes | Water | Vegetation | Barren | Build-up |
| Water | 0.163148 | 0.136472 | 0.186141 | 0.514239 |
| Vegetation | 0.010597 | 0.725359 | 0.019662 | 0.244382 |
| Barren | 0.010592 | 0.177038 | 0.362716 | 0.449654 |
| Build-up | 0.010568 | 0.260249 | 0.048792 | 0.680391 |
| Probability of Changing from 2004-2014 | ||||
| LULC Classes | Water | Vegetation | Barren | Build-up |
| Water | 0.230096 | 0.367778 | 0.029309 | 0.372817 |
| Vegetation | 0.005596 | 0.716502 | 0.05242 | 0.225482 |
| Barren | 0.02845 | 0.1943 | 0.214223 | 0.563027 |
| Build-up | 0.025022 | 0.224315 | 0.043137 | 0.707527 |
| Probability of Changing from 2014-2024 | ||||
| LULC Classes | Water | Vegetation | Barren | Build-up |
| Water | 0.240017 | 0.147763 | 0.014021 | 0.598199 |
| Vegetation | 0.005096 | 0.756188 | 0.013978 | 0.224738 |
| Barren | 0.006281 | 0.043427 | 0.106769 | 0.843523 |
| Build-up | 0.00688 | 0.116256 | 0.016716 | 0.860148 |
| LULC Classes | Actual 2024 | Predicted 2024 | ||
| Area | %age | Area | %age | |
| Water | 19.19746 | 1.0230 | 18.8675 | 1.0054 |
| Vegetation | 812.2915 | 43.286 | 872.071 | 46.471 |
| Barren land | 76.57944 | 4.0808 | 60.0219 | 3.1985 |
| Build-up | 968.4986 | 51.610 | 925.606 | 49.324 |
Related work about LULC
| LULC Classes | Predicted 2034 | Change 2024-2034 | Predicted 2044 | Change 2034-2044 | ||
|
|
% |
|
% | |||
| Water bodies | 19.10 | 1.01 | -0.45 | 17.23 | 0.91 | -1.87 |
| Vegetation | 751.47 | 40.04 | -23.28 | 695.18 | 37.04 | -56.29 |
| Build-up | 15.34 | 0.81 | -23.69 | 7.84 | 0.41 | -7.50 |
| Barren land | 1090.62 | 58.11 | 47.06 | 1156.30 | 61.61 | 65.67 |
(LAI), and emissivity. Results showed that LULC changes led to a significant reduction in summer temperatures and an increase in winter temperatures. Improved performance of the WRF model was noted with the use of updated LULC data
Quantification of uncertainty
Ecological land management practices
and incorporating these insights into policy development, decision-makers can guarantee that Lahore’s urban expansion is conducted in an environmentally sustainable manner.
Limitations and future directions
Conclusion and recommendations
Data availability
Received: 3 July 2024; Accepted: 22 January 2025
Published online: 25 January 2025
References
- Hu, Y. et al. Land Use / Land Cover Change Detection and NDVI Estimation in Pakistan ‘s Land Use / Land Cover Change Detection and NDVI Estimation in Pakistan’s Southern Punjab Province. (2023). https://doi.org/10.3390/su15043572
- Haseeb, M., Tahir, Z., Mahmood, S. A., Batool, S. & Farooq, M. U. Spatial soil loss prediction impacted by long-term land use/land cover change: a case study of Swat District. Environ. Monit. Assess. 196, (2024).
- Abdul Athick, A. S. M. & Shankar, K. Data on land use and land cover changes in Adama Wereda, Ethiopia, on ETM+, TM and OLI- TIRS landsat sensor using PCC and CDM techniques. Data Br. 24, 103880 (2019).
- Zhu, L., Song, R., Sun, S., Li, Y. & Hu, K. Land use/land cover change and its impact on ecosystem carbon storage in coastal areas of China from 1980 to 2050. Ecol. Indic. 142, 109178 (2022).
- Wang, S. W., Munkhnasan, L. & Lee, W. K. Land use and land cover change detection and prediction in Bhutan’s high altitude city of Thimphu, using cellular automata and Markov chain. Environ. Challenges. 2, 100017 (2021).
- Kedia, S., Bhakare, S. P., Dwivedi, A. K., Islam, S. & Kaginalkar, A. Estimates of change in surface meteorology and urban heat island over northwest India: impact of urbanization. Urban Clim. 36, 100782 (2021).
- Khanal, N., Uddin, K. & Matin, M. A. Automatic detection of Spatiotemporal Urban expansion patterns by fusing OSM and Landsat Data in Kathmandu. (2019). https://doi.org/10.3390/rs11192296
- Mallupattu, P. K. & Sreenivasula Reddy, J. R. Analysis of land use/land cover changes using remote sensing data and GIS at an urban area, Tirupati, India. Sci. World J. 2013, 1-7 (2013).
- Hussain, S., Mubeen, M. & Karuppannan, S. Land use and land cover (LULC) change analysis using TM, ETM + and OLI Landsat images in district of Okara, Punjab, Pakistan. Phys. Chem. Earth Parts A/B/C. 126, 103117 (2022).
- Sahana, M., Ahmed, R. & Sajjad, H. Analyzing land surface temperature distribution in response to land use/land cover change using split window algorithm and spectral radiance model in Sundarban Biosphere Reserve, India. Model. Earth Syst. Environ. 2, 81 (2016).
- Yazdanpanah, M. et al. The impact of Livelihood assets on the Food Security of Farmers in Southern Iran during the COVID-19 pandemic. Int. J. Environ. Res. Public. Health 18, (2021).
- Ojima, D. S., Galvin, K. A. & Turner, B. L. The global impact of land-use change: to understand global change, natural scientists must consider the social context influencing human impact on environment. Bioscience 44, 300-304 (1994).
- Rane, N., Achari, A., Choudhary, S. & Giduturi, M. Effectiveness and Capability of Remote Sensing (RS) and Geographic Information Systems (GIS): A Powerful Tool for Land use and Land Cover (LULC) Change and Accuracy Assessment. 8, 286-295 (2023).
- Waleed, M. & Sajjad, M. Leveraging cloud-based computing and spatial modeling approaches for land surface temperature disparities in response to land cover change: evidence from Pakistan. Remote Sens. Appl. Soc. Environ. 25, 100665 (2022).
- Asif, M. et al. Modelling of land use and land cover changes and prediction using CA-Markov and Random Forest. Geocarto Int. 38, (2023).
- Zhao, Q. et al. Evaluation of Land Use Land Cover changes in response to Land Surface temperature with Satellite indices and Remote Sensing Data. Rangel. Ecol. Manag. 96, 183-196 (2024).
- Khan, R. et al. Monitoring land use land cover changes and its impacts on land surface temperature over Mardan and Charsadda Districts, Khyber Pakhtunkhwa (KP), Pakistan. Environ. Monit. Assess. 194, 409 (2022).
- Sadiq Khan, M., Ullah, S., Sun, T., Rehman, A. U. R. & Chen, L. Land-Use/Land-Cover Changes and Its Contribution to Urban Heat Island: A Case Study of Islamabad, Pakistan. Sustainability 12, (2020).
- Sarfo, A. K. & Karuppannan, S. Application of Geospatial Technologies in the COVID-19 fight of Ghana. Trans. Indian Natl. Acad. Eng. 5, 193-204 (2020).
- Mukherjee, S. et al. Aquatic eco-systems under influence of Climate Change and anthropogenic activities: potential threats and its mitigation strategies. in 307-331 (2022). https://doi.org/10.1002/9781119870562.ch14
- Kharazmi, R. et al. Monitoring and assessment of seasonal land cover changes using remote sensing: a 30-year (1987-2016) case study of Hamoun Wetland, Iran. Environ. Monit. Assess. 190, 356 (2018).
- Birhanu, A., Masih, I., van der Zaag, P., Nyssen, J. & Cai, X. Impacts of land use and land cover changes on hydrology of the Gumara catchment, Ethiopia. Phys. Chem. Earth Parts A/B/C. 112, 165-174 (2019).
- Choate, M., Rengarajan, R., Storey, J. & Lubke, M. Geometric calibration updates to Landsat 7 ETM + instrument for Landsat Collection 2 products. Remote Sens. 13, (2021).
- Zoungrana, B. J. B., Conrad, C., Thiel, M., Amekudzi, L. K. & Da, E. D. MODIS NDVI trends and fractional land cover change for improved assessments of vegetation degradation in Burkina Faso, West Africa. J. Arid Environ. 153, 66-75 (2018).
- Mozumder, C. & Tripathi, N. Geospatial scenario based modelling of urban and agricultural intrusions in Ramsar Wetland Deepor Beel in Northeast India using a multi-layer perceptron neural network. Int. J. Appl. Earth Obs Geoinf. 32, 92-104 (2014).
- Upadhaya, S. & Dwivedi, P. Conversion of forestlands to blueberries: assessing implications for habitat quality in Alabaha river watershed in Southeastern Georgia, United States. Land. use Policy. 89, 104229 (2019).
- Ouma, Y. O. et al. Land-Use Change Prediction in Dam Catchment Using Logistic Regression-CA, ANN-CA and Random Forest Regression and Implications for Sustainable Land-Water Nexus. Sustainability 16, (2024).
- Kumar, L. & Mutanga, O. Google Earth Engine applications since inception: usage, trends, and potential. Remote Sens. 10, 1-15 (2018).
- Avci, C., Budak, M., Yagmur, N. & Balcik, F. B. Comparison between random forest and support vector machine algorithms for LULC classification. Int. J. Eng. Geosci. 8, 1-10 (2023).
- Naghdyzadegan Jahromi, M. et al. Developing machine learning models for wheat yield prediction using ground-based data, satellite-based actual evapotranspiration and vegetation indices. Eur. J. Agron. 146, 126820 (2023).
- Sibanda, S. & Ahmed, F. Modelling historic and future land use/land cover changes and their impact on wetland area in Shashe sub-catchment, Zimbabwe. Model. Earth Syst. Environ. 7, 57-70 (2021).
- Hyandye, C. & Martz, L. W. A Markovian and cellular automata land-use change predictive model of the Usangu Catchment. Int. J. Remote Sens. 38, 64-81 (2017).
- Ganjirad, M. & Bagheri, H. Ecological Informatics Google Earth Engine-based mapping of land use and land cover for weather forecast models using landsat 8 imagery. Ecol. Inf. 80, 102498 (2024).
- Liping, C., Yujun, S. & Saeed, S. Monitoring and predicting land use and land cover changes using remote sensing and GIS techniques-A case study of a hilly area, Jiangle, China. PLoS One. 13, 1-23 (2018).
- Dey, N. N., Rakib, A., Kafy, A., Raikwar, V. & A.- Al & Geospatial modelling of changes in land use/land cover dynamics using multi-layer Perceptron Markov chain model in Rajshahi City, Bangladesh. Environ. Challenges. 4, 100148 (2021).
- Majumder, M. Introduction to Model Development for Prediction, Simulation and Optimization. (2023).
- Li, Y. et al. Dynamics of Land Use/Land Cover Considering Ecosystem Services for a dense-Population Watershed based on a hybrid dual-subject Agent and Cellular Automaton modeling Approach. Engineering https://doi.org/10.1016/j.eng.2023.10.015 (2024).
- Bashir, O. et al. Simulating Spatiotemporal Changes in Land Use and Land Cover of the North-Western Himalayan Region Using Markov Chain Analysis. Land 11, (2022).
- Belay, T. & Mengistu, D. A. Impacts of land use/land cover and climate changes on soil erosion in Muga watershed, Upper Blue Nile basin (Abay), Ethiopia. Ecol. Process. 10, 68 (2021).
- Amin, M. et al. Monitoring agricultural drought using geospatial techniques: a case study of thal region of Punjab, Pakistan.
. Water Clim. Chang. 11, 203-216 (2020). - Abbas, F. Analysis of a historical (1981-2010) temperature record of the Punjab Province of Pakistan. Earth Interact. 17, 1-23 (2013).
- Minallah, M. Retrieval of Land Surface temperature of Lahore through Landsat-8 TIRS Data. Int. J. Econ. Environ. Geol. 10, 70-77 (2019).
- Khokhar, M. F., Mehdi, H., Abbas, Z. & Javed, Z. Temporal assessment of NO2 pollution levels in urban centers of Pakistan by employing ground-based and satellite observations. Aerosol Air Qual. Res. 16, 1854-1867 (2016).
- Basheer, M. A. & Waseem, M. A. Spatiotemporal Analysis of Urban Growth and Land Surface temperature: a case study of Lahore, Pakistan. Int. Arch. Photogramm Remote Sens. Spat. Inf. Sci. – ISPRS Arch. 48, 25-29 (2022).
- Xue, J. & Su, B. Significant remote sensing vegetation indices: A review of developments and applications. J. Sensors (2017). (2017).
- Kumari, M. & Sarma, K. Changing trends of land surface temperature in relation to land use/cover around thermal power plant in Singrauli district, Madhya Pradesh, India. Spat. Inf. Res. 25, 769-777 (2017).
- Jaswal, S. & Thakur, P. Correlation between LST, NDVI and NDBI with reference to Urban Sprawling – A Case Study of Shimla city. Int. J. Multidiscip Res. 5, 1-14(2023).
- Haseeb, M. et al. Enhancing Carbon Sequestration through Afforestation: evaluating the impact of Land Use and Cover changes on Carbon Storage dynamics. Earth Syst. Environ. https://doi.org/10.1007/s41748-024-00414-z (2024).
- Zhao, H. & Chen, X. Use of normalized difference bareness index in quickly mapping bare areas from TM/ETM+. in Proceedings. 2005 IEEE International Geoscience and Remote Sensing Symposium, 2005. IGARSS ’05. vol. 3 1666-1668 (2005).
- Al-aarajy, K. H. A., Zaeen, A. A. & Abood, K. I. Supervised Classification Accuracy Assessment Using Remote Sensing and Geographic Information System. 13, 396-403 (2024).
- Selmy, S. A. H. et al. Detecting, Analyzing, and Predicting Land Use / Land Cover (LULC) Changes in Arid Regions Using Landsat Images, CA-Markov Hybrid Model, and GIS Techniques. (2023).
- Salvi, M., Acharya, U. R., Molinari, F. & Meiburger, K. M. The impact of pre- and post-image processing techniques on deep learning frameworks: a comprehensive review for digital pathology image analysis. Comput. Biol. Med. 128, 104129 (2021).
- Abdul Rahaman, S., Aruchamy, S., Balasubramani, K. & Jegankumar, R. Land use/land cover changes in semi-arid mountain landscape in Southern India: a geoinformatics based Markov chain approach. Int. Arch. Photogramm Remote Sens. Spat. Inf. Sci. ISPRS Arch. 42, 231-237 (2017).
- Firozjaei, M. K., Sedighi, A., Argany, M., Jelokhani-Niaraki, M. & Arsanjani, J. J. A geographical direction-based approach for capturing the local variation of urban expansion in the application of CA-Markov model. Cities 93, 120-135 (2019).
- Nouri, J., Gharagozlou, A., Arjmandi, R., Faryadi, S. & Adl, M. Predicting Urban Land Use Changes using a CA-Markov Model. Arab. J. Sci. Eng. 39, 5565-5573 (2014).
- Aliani, H., Malmir, M., Sourodi, M. & Kafaky, S. B. Change detection and prediction of urban land use changes by CA-Markov model (case study: Talesh County). Environ. Earth Sci. 78, 546 (2019).
- Ma, C., Zhang, G. Y., Zhang, X. C., Zhao, Y. J. & Li, H. Y. Application of Markov model in wetland change dynamics in Tianjin Coastal Area, China. Procedia Environ. Sci. 13, 252-262 (2012).
- Keshtkar, H. & Voigt, W. A spatiotemporal analysis of landscape change using an integrated Markov chain and cellular automata models. Model. Earth Syst. Environ. 2, 10 (2015).
- Mannan, A. et al. Application of land-use/land cover changes in monitoring and projecting forest biomass carbon loss in Pakistan. Glob Ecol. Conserv. 17, e00535 (2019).
- Laari, S. K. S. P. B., Szabó, S. & S. M. P. K. S. & Modelling of land use land cover change using earth observation data-sets of Tons River Basin, Madhya Pradesh, India. Geocarto Int. 33, 1202-1222 (2018).
- Eastman, J. R. Guide to GIS and Image Processing. (2009).
- Pan, S. et al. Runoff Responses to Climate and Land Use/Cover Changes under Future Scenarios. Water vol. 9 at (2017). https://do i.org/10.3390/w9070475
- McHugh, M. L. Interrater reliability: the kappa statistic. Biochem. Med. 22, 276-282 (2012).
- Jiang, Q. et al. Spatiotemporal analysis of land use and land cover (lulc) changes and precipitation trends in Shanghai. Appl. Sci. 10, 1-21 (2020).
- Zhang, G. et al. Rapid urbanization induced daily maximum wind speed decline in metropolitan areas: a case study in the Yangtze River Delta (China). Urban Clim. 43, 101147 (2022).
- Ovalle, A. G. C., Tristán, A. C., Amador-Nieto, J. A., Putri, R. F. & Zahra, R. A. Analysing the land use/land cover influence on land surface temperature in San Luis Potosí Basin, México using remote sensing techniques. IOP Conf. Ser. Earth Environ. Sci. 686, 12029 (2021).
- Zarin, T. & Esraz-Ul-Zannat, M. Assessing the potential impacts of LULC change on urban air quality in Dhaka city. Ecol. Indic. 154, 110746 (2023).
- Talukder, A., Mim, S. M., Ahmed, S., Syed, M. & Rahman, R. M. Machine learning and remote sensing technique for urbanization change detection in Tangail District. in Intelligent Sustainable Systems (eds Nagar, A. K., Jat, D. S. & Marín-Raventós, G.) (2022). & Mishra, D. K.) 241-249 (Springer Nature Singapore, Singapore.
- Hamad, R., Balzter, H. & Kolo, K. Predicting Land Use/Land Cover Changes Using a CA-Markov Model under Two Different Scenarios. Sustainability 10, (2018).
- Karimi, H., Jafarnezhad, J., Khaledi, J. & Ahmadi, P. Monitoring and prediction of land use/land cover changes using CA-Markov model: a case study of Ravansar County in Iran. Arab. J. Geosci. 11, 592 (2018).
Acknowledgements
Author contributions
Funding
Declarations
Competing interests
Additional information
Reprints and permissions information is available at www.nature.com/reprints.
Publisher’s note Springer Nature remains neutral with regard to jurisdictional claims in published maps and institutional affiliations.
© The Author(s) 2025
Institute of Space Science, University of Punjab, Lahore 54780, Punjab, Pakistan. Centre For Integrated Mountain Research, University of the Punjab, Lahore 54780, Punjab, Pakistan. Department of Software Engineering, College of Computer and Information Sciences, King Saud University, Riyadh 11543, Saudi Arabia. Department of Water Resources and Environmental Engineering, Nangarhar University, Jalalabad, Nangarhar 2600, Afghanistan. School of Resources and Environmental Engineering, East China University of Science and Technology, Shanghai 200237, People’s Republic of China. Department of Wildlife Fisheries and Aquaculture, College of Forest Resources, Mississippi State University, Mississippi State, MS 39762-9690, USA. email: mrhaseeb223@gmail.com; sajidjalwan@gmail.com