ثلاثة تقدمات تدريجية في درجة الحموضة في الطبقة القرنية للحفاظ على التوازن الداخلي للجلد Three stepwise pH progressions in stratum corneum for homeostatic maintenance of the skin
الطبقة القرنية هي الطبقة الخارجية من الجلد وتلعب دورًا حيويًا في وظيفة حاجز الجلد. تتكون من كيراتينوسيت ميت (خلايا قرنية) وتعرف بالحفاظ على سمكها من خلال التخلص من الخلايا، على الرغم من أن الآليات الدقيقة التي تحمي نضوج الطبقة القرنية وتوازنها لا تزال غير واضحة. اقترحت دراسات سابقة خارج الجسم وجود تدرج في درجة الحموضة من المحايد إلى الحمضي في الطبقة القرنية. هنا، نستخدم تصوير درجة الحموضة داخل الجسم بدقة خلية قرنية واحدة لإظهار أن الخلايا القرنية تمر فعليًا بعملية تمايز لتطوير ثلاث مناطق متميزة في الطبقة القرنية، كل منها بقيمة درجة حموضة مميزة. لقد حددنا منطقة سفلية حمضية معتدلة، ومنطقة وسطى حمضية، وطبقة علوية محايدة في الطبقة القرنية، حيث تلعب الوصلات الضيقة دورًا رئيسيًا في تطورها. يمكن للمنطقة المحايدة ذات الرقم الهيدروجيني العلوي تعديل رقمها الهيدروجيني وفقًا للبيئة الخارجية وتحتوي على رقم هيدروجيني محايد في ظروف الحالة الثابتة بفضل تأثير ميكروبيوتا الجلد. توفر المنطقة المتوسطة ذات الرقم الهيدروجيني الحمضي حاجزًا دفاعيًا ضد مسببات الأمراض. من خلال النمذجة الرياضية، نوضح تنشيط البروتياز المنظم للبيبتيداز المرتبطة بالكاليكريين على سطح الطبقة القرنية، مما يؤدي إلى تقشير مناسب للخلايا القرنية في عملية التقشر. تضيف هذه الدراسة معلومات حاسمة لفهمنا لكيفية الحفاظ على توازن الطبقة القرنية.
تعتمد الكائنات الحية متعددة الخلايا على الحواجز السطحية لتقسيم نفسها عن البيئات القاسية والمتطرفة والحفاظ على التوازن الداخلي.في الفقاريات الأرضية، يتم إغلاق سطح الجسم بواسطة الظهارة الحرشفية المتعددة الطبقات للجلد المعروفة باسم البشرة.انتقال الحياة من الماء إلى اليابسة في الفقاريات تسبب في ضغوط انتقائية أثرت على تشريح البشرة، وطور الفقاريات الأرضية حاجز واجهة الهواء-السائل، المعروف باسم الطبقة القرنية (SC)، كأعلى طبقة في بشرتها (الشكل 1أ).. المحكمة العليا يمتلك خصائص فريدة، حيث يمنع دخول الممرضات والمواد المسببة للحساسية (حاجز من الخارج إلى الداخل)، بالإضافة إلى تسرب الماء (حاجز من الداخل إلى الخارج)، على الرغم من أنه يتكون من طبقات من الكيراتينوسيتات غير الحية المنزوعة النواة (الكورنيوسيتات). كما يمكنه أيضًا الحفاظ على سمك محدد للموقع من خلال تقشير القشور (التقشير) يوميًا. علاوة على ذلك، يستضيف الطبقة القرنية ميكروبيوم الجلد الذي يلعب أدوارًا أساسية في تحفيز أنظمة المناعة الجلدية الفطرية والتكيفية.. هذه الخصائص هي نتيجة لآلية تحافظ على التوازن الداخلي في الخلايا الجذعية.
ومع ذلك، تظل الآليات الأساسية التي تحمي توازن الخلايا الجذعية غامضة.
ترتبط الخلايا القرنية معًا بواسطة الكورنيوديسموسومات، وتُغلق المسافات بين الخلايا بالدهون. تمتلئ المساحات داخل الخلايا القرنية بالبروتينات مثل خيوط الكيراتين والفيلاغرين، بالإضافة إلى منتجات تحللها.. يحتوي المجلس الأعلى الإنزيمات المسؤولة عن تخليق الدهون وتحلل البروتين، وتُنظم الأنشطة التحفيزية لهذه الإنزيمات بواسطةبالإضافة إلى ذلك، يتم إنتاج الخلايا القرنية من خلال نمط فريد من موت الخلايا لخلايا الكيراتين في الطبقة العليا من الطبقة الحبيبية (خلايا SG1، الشكل 1أ) يسمى الكورنيوبتوز.يتطلب فترة طويلة داخل الخلاياالارتفاع (المرحلة الأولى) يليه تحمض خلوي متحكم فيه
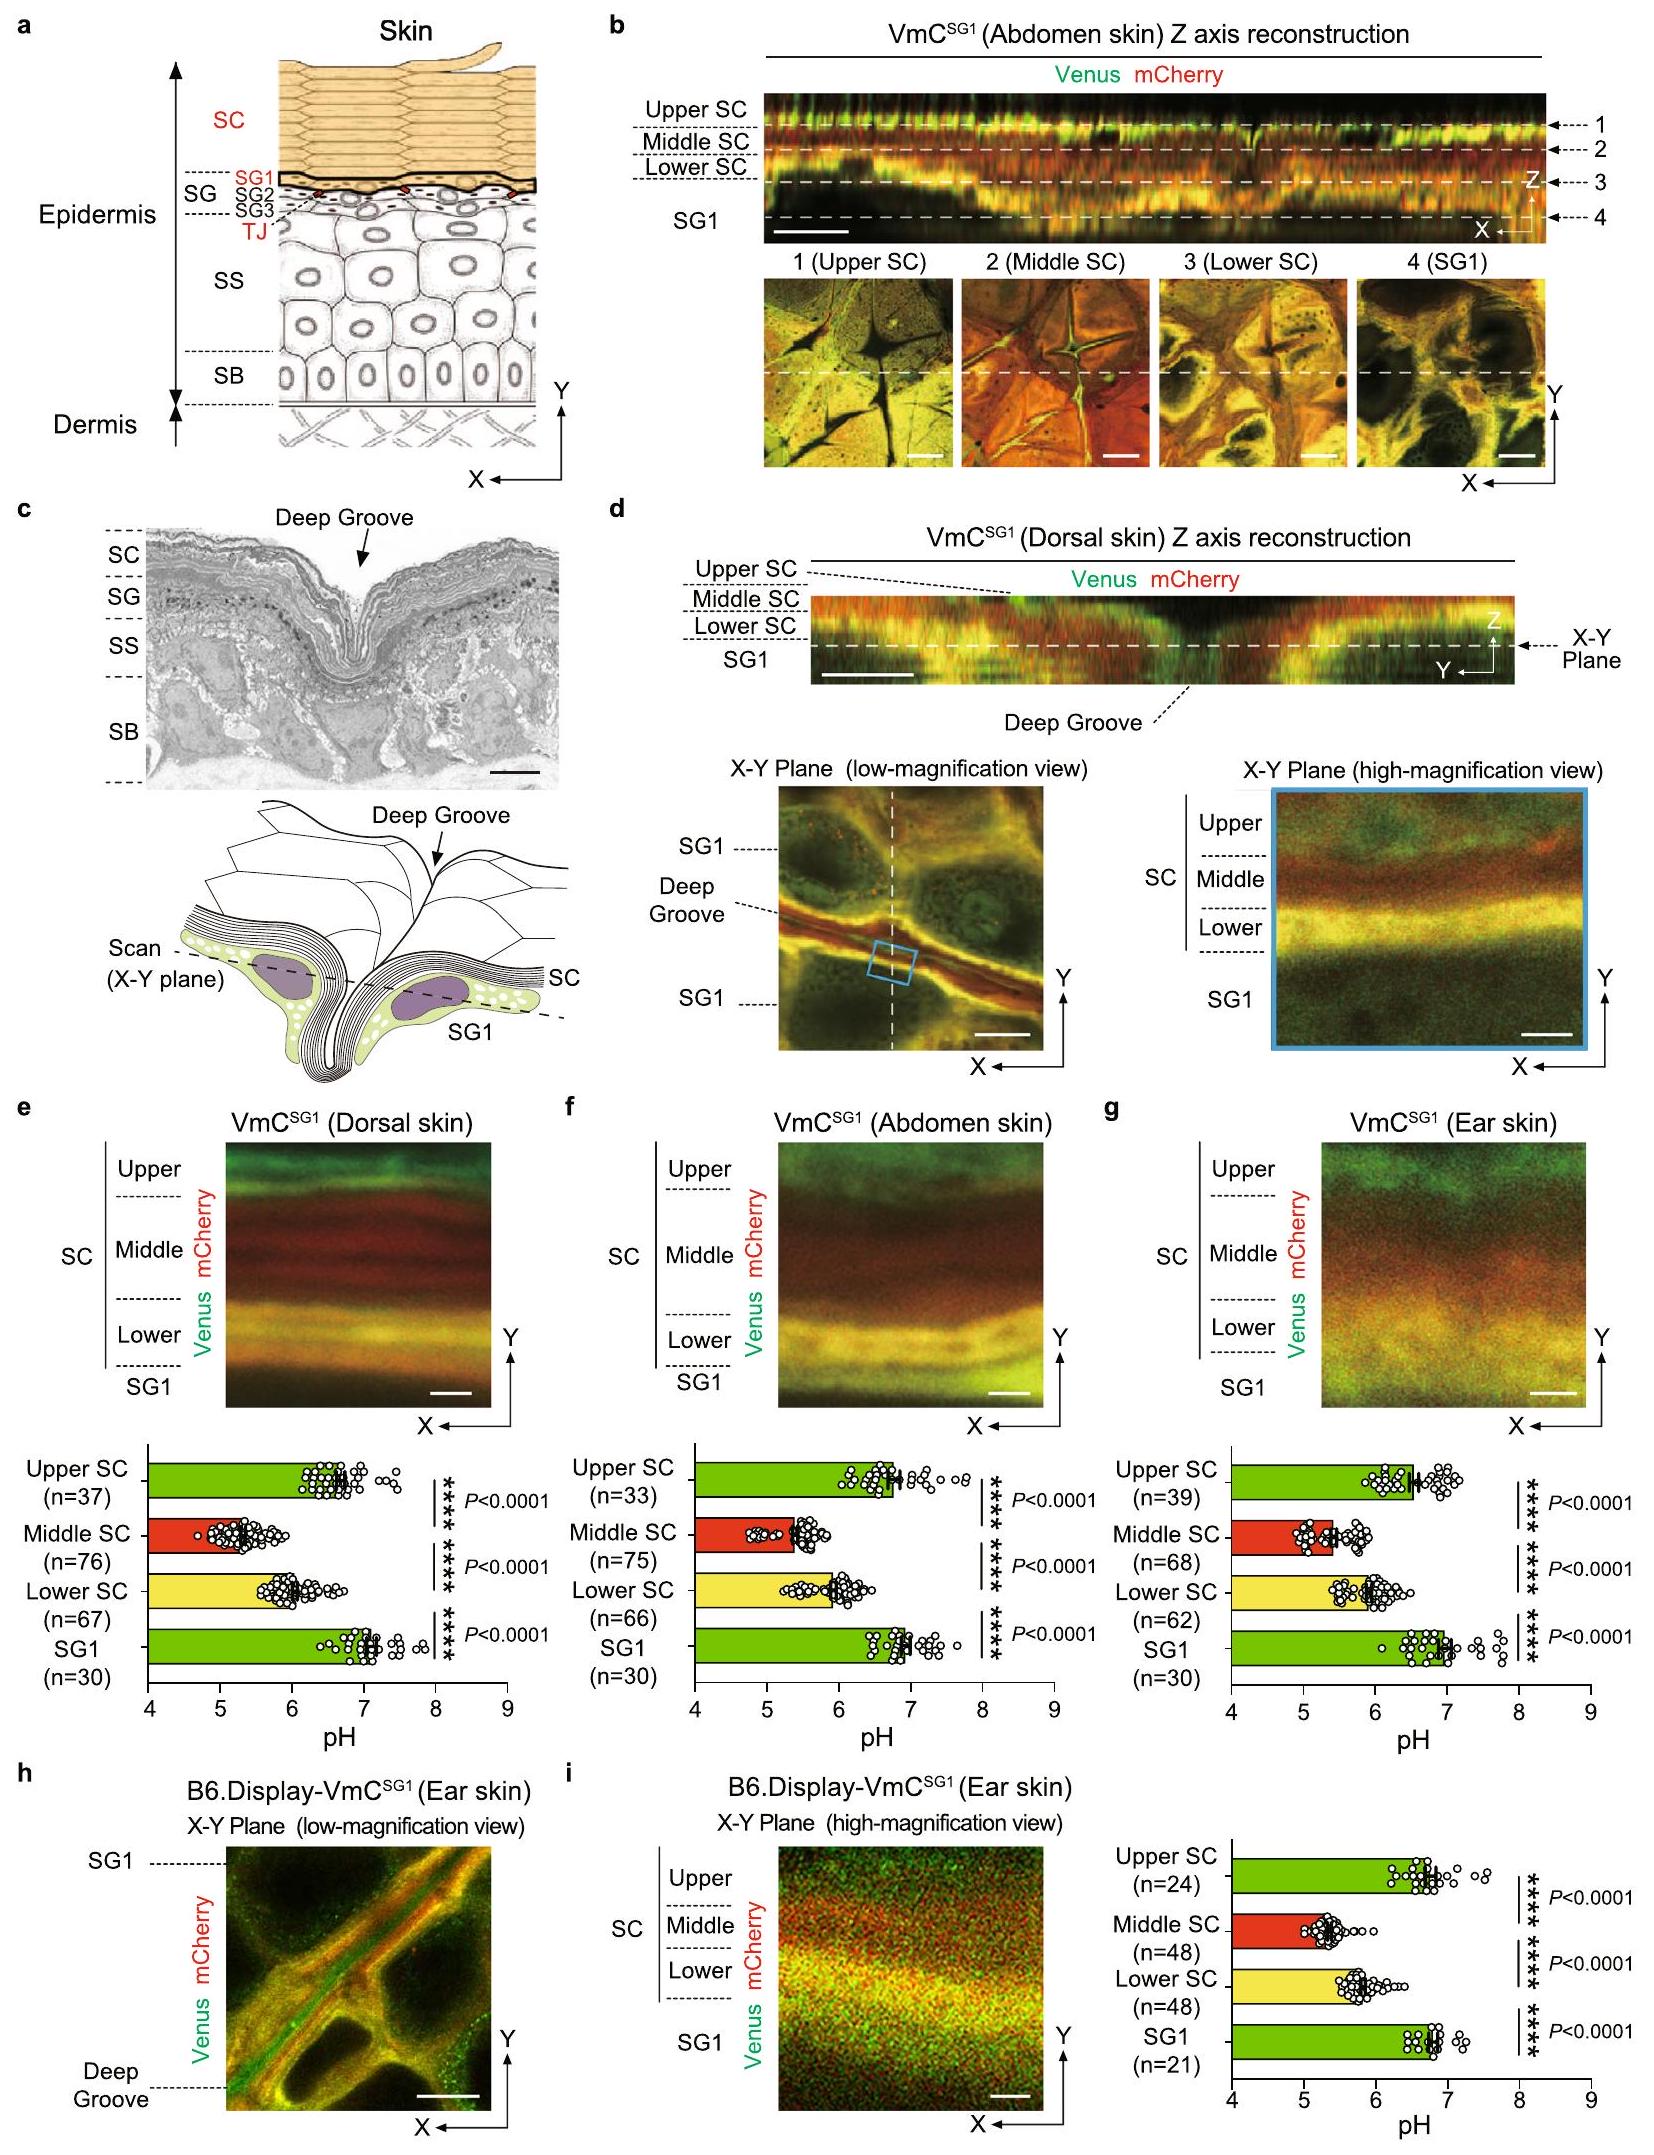
الشكل 1 | ثلاث مناطق SC-pH متدرجة محفوظة عبر أجزاء الجسم المختلفة. أ هيكل البشرة. تتكون البشرة من الطبقة القاعدية (SB) والطبقة الشوكية (SS) والطبقة الحبيبية (SG) والطبقة القرنية (SC). تتكون SG من SG1 و SG2 و SG3. تتشكل الوصلات الضيقة (TJs، باللون الأحمر) بين خلايا SG2 المجاورة. درست الدراسة الحالية توزيع pH وقيم pH داخل SC و SG1 (باللون البرتقالي). ب صور تمثيلية مجهرية ضوئية للطبقة العليا من بشرة جلد البطن منالفئران، كما لوحظ تحت صور مقطعية معاد تشكيلها (أعلى) وصور عالية التكبير في مستوى X-Y (أسفل). قضبان القياس، 5 (أعلى)، 10 (أسفل) صورة مجهر إلكتروني تمثيلي (أعلى) ومخطط لصورة مجهرية متداخلة في مستوى X-Y (أسفل) لثلم SC. شريط القياس، صور تمثيلية تمثيلية للطبقة العليا من البشرة في جلد الظهرالفئران، كما لوحظ تحت صور معاد تكوينها مقطعية Z (الأعلى) وتكبير منخفض (الأسفل-left) وعالي (الأسفل-right، المنطقة المحددة بالخطوط الزرقاء في اليسار) في مستوى X-Y. قضبان القياس، 5 (الأعلى)، 10 (الأسفل-left)، و1 (الأسفل-right). عالي- صور مجهرية مركبة لمناطق SC-pH في مستوى X-Y (الأعلى) من الظهرالبطني، وجلد الأذن منالفئران. قيم pH في كل منطقة SC-pH و SG1 (الأسفل) منظهرية، و30 موقعًا من أربعة حيوانات مستقلة بيولوجيًا، على التوالي،البطني، و 30 نقطة من أربعة حيوانات مستقلة بيولوجيًا، على التوالي)، وأذن، و 30 نقطة من أربعة حيوانات مستقلة بيولوجيًا، على التوالي) جلد. مقياس الرسم، ممثلمنخفض وتكبير عاليصور الطائرة المترافقة من جلد الأذن في B6.Display-VmCالفئران (يسار). قيم pH في كل منطقة SC-pH و SG1 (يمين،“، و 21 نقطة من ثلاثة حيوانات مستقلة بيولوجيًا، على التوالي). شريط القياس، و تُعرض البيانات كمتوسط SEM ويتم تجميعها من أربعة ( ) أو ثلاث تجارب ( ) أو تمثل على الأقل ثلاث تجارب مستقلة ( و ). ; تحليل التباين الأحادي كروسكال-واليس يليه اختبار دان بعد الاختبار (تم توفير بيانات المصدر كملف بيانات المصدر. (المرحلة الثانية)، مما ينشط DNases و proteases لإزالة العضيات مثل الميتوكوندريا دون التسبب في الالتهاباستنادًا إلى هذه النتائج، افترضنا أن SC-pH يؤثر على توازن SC.
استخدمت الدراسات السابقة طريقتين رئيسيتين لقياس توزيع الرقم الهيدروجيني لطبقة الجلد البشرية: تطبيق إلكترود الرقم الهيدروجيني على سطح الجلد قبل وبعد إزالة الشريط اللاصق المتتالي أو إجراء تصوير عمر الفلورسنت للهياكل الجلدية البشرية ثلاثية الأبعاد الملطخة بمؤشر الرقم الهيدروجيني المذاب في المذيبات العضوية باستخدام مجهر المسح ثنائي الفوتون.لقد تم الإبلاغ عن أن ملف SC-pH يظهر تدرجًا أحاديًا، يتراوح منفي طبقة الحبيبات (SG؛ الطبقة العليا من خلايا الكيراتين القابلة للحياة التي تقع تحت الطبقة القرنية) إلى pH 4.5-5.5 على سطح الطبقة القرنية. ومع ذلك، من المعروف أن إزالة الشريط تسبب التهاب الجلد، وقد تذوب المذيبات العضوية الدهون المحيطة بالخلايا القرنية، مما يمكن أن يؤثر على درجة حموضة الطبقة القرنية. وبالتالي، قد لا تعكس قياسات درجة حموضة الطبقة القرنية التي تم الإبلاغ عنها سابقًا قيم درجة حموضة الطبقة القرنية في حالة التوازن في الجسم الحي وتوزيعها. في الواقع، فإن إنزيمات الكاليكرين المرتبطة (KLKs) التي تبدأ عملية التقشر تظل غير نشطة عند درجة حموضة حمضية، وهذا لا يمكن أن يفسر بوضوح لماذا تنفذ KLKs عملية التقشر في الجزء العلوي.. علاوة على ذلك، بسبب وجود الميكروبات الجلدية على سطح الطبقة القرنيةمن غير المحتمل أن يكون السائل المنوي حمضيًا في الجسم الحي، حيث أن هذا النطاق من الرقم الهيدروجيني أقل ملاءمة لاستعمار البكتيريا المفيدة مقارنةً بالقيم المحايدة للرقم الهيدروجيني..
هنا، قمنا بإجراء تصوير كمي لدرجة الحموضة داخل الجسم في خلايا القرنية باستخدام فئران معدلة وراثيًا تعبر عن مؤشر درجة حموضة نسبي، مع الأخذ في الاعتبار توزيع درجة حموضة SC الدقيق. كان هدفنا توضيح توزيع درجة حموضة SC في الجسم وأهمية درجة الحموضة البيولوجية في توازن SC. الدراسات التي استخدمت قياسات سابقة لدرجة حموضة SC اقترحت أن SC تمتلك ملف تدرج محايد إلى حمضي رتيب وأن البيئة الدقيقة الحمضية تعزز الدفاع المضاد للميكروبات في الجلد.. ومع ذلك، في هذه الدراسة، وجدنا أن الخلايا القرنية تخضع للتمايز، مما يؤدي إلى تكوين مناطق حموضة ثلاثية المستويات؛ وهي: هذه العملية تولد مناطق حامضية منخفضة معتدلة (pH 6.0)، ومنطقة حامضية متوسطة (pH 5.4)، ومنطقة علوية قريبة من الحيادية (pH 6.7). تنشأ منطقة حموضة SC السفلية من الحموضة خلال المرحلة الثانية من الكورنيوبتوز. منطقة حموضة SC المتوسطة هي طبقة الحموضة التي تعمل كحاجز واقي ضد مسببات الأمراض. منطقة حموضة SC العلوية قابلة للتكيف بشكل مدهش؛ يمكنها تعديل حموضتها بناءً على الظروف الخارجية، حيث تظهر حموضة قريبة من الحيادية في حالة الاستقرار بفضل ميكروبيوتا الجلد. المناطق الثلاثية للحموضة مناسبة لتنظيم نشاط إنزيم البروتياز لتحفيز التقشر على سطح SC. تؤكد نتائجنا أن SC ليست مجرد طبقة من الكيراتينوسيت الميتة. بدلاً من ذلك، تتكون SC من ثلاث مناطق حموضة متميزة تساهم في تمايز SC، مما يحافظ على توازن SC.
النتائج
توليد فئران معدلة وراثيًا لقياس وتصوير درجة حموضة الخلايا القرنية
لتصوير توزيع وقيم pH في الجسم الحي، قمنا بإنشاء بروتينات اندماجية باستخدام مجسات حساسة لدرجة الحموضة مختلفة. استخدمنا فينوس. أو VenusH148G كأجهزة استشعار حساسة لدرجة الحموضة العالية وmCherry كجهاز استشعار حساس لدرجة الحموضة المنخفضةقمنا بتوليد فئران بلا شعر (HR) تعبر بشكل محدد عن هذه البروتينات المدمجة تحت موضع بروتين الأسبارتيك (SASP) في الجلد، مما يعبر عن هذه المجسات pH في طبقة خلايا SG1 (HR.SASP).و HR.SASP [VH148GmC ] الفئران، على التوالي [ الشكل التوضيحي التكميلي 1أ]). لذلك، فإن هذه الفئران متطابقة مع الفأر الناقص الجين الهجين SASP الموصوف سابقًاالذي لا يمتلك نمط ظاهري، باستثناء أن دمج Veuns-mcherry (VmC) أو فينوسإدخال كاسيت mCherry (VH 148 GmC) في موقع SASP. لتقييم ما إذا كانت فلورية فينوس-مCherry (VmC) وفيونوس-بروتينات -mCherry ( VH 148 GmC )، المعبر عنها في النخاع الشوكي الفأري، عكست تغييرات الرقم الهيدروجيني، قمنا بعزل خلايا SG1 من جلد الظهر لهذه الفئران وعرضناها لمخازن مختلفة من الرقم الهيدروجيني ( ) مع بروتونوفورات (نيجيريسين وفالينوميسين) التي قامت بتوازن الرقم الهيدروجيني داخل الخلايا مع الرقم الهيدروجيني للمحلول. تم تحليل شدة الفلورسنت لفيونوس، فيونوسH148G، وmCherry عند كل قيمة pH باستخدام المجهر الضوئي المجهري (الشكل التكميلي 1b-e). الاختلافات في ملفات فلورسنت فيونوس، فيونوسH148G، وmCherry استجابةً لتغيرات pH أنتجت منحنيات نسبية محددة لفلورسنت فيونوس/mCherry وفلورسنت فيونوسH148G/mCherry (الشكل التكميلي 1f، g). عندما تم تطبيع نسبة فلورسنت فيونوس/mCherry إلى القيمة المقابلة عند pH 8.0 (فيونوس/mCherry النسبي)، تداخلت منحنيات النسبة لفلورسنت فيونوس/mCherry المقاسة تحت قوتين ليزريتين (الشكل التكميلي 1f). بعد التطبيع، تداخلت أيضًا منحنيات النسبة لفلورسنت فيونوسH148G/mCherry المقاسة تحت قوتين ليزريتين (الشكل التكميلي 1g). تشير هذه النتائج إلى أن الرقم الهيدروجيني للخلايا القرنية وخلايا SG1 في كلا و VH148GmC يمكن حساب الفئران عن طريق استبدال نسبة فينوس/ميري و فينوسقيم المCherry، على التوالي، في المنحنيات النسبية التي تم إنشاؤها باستخدام خلايا SG1 المعزولة. علاوة على ذلك، كانت قيم pKa لـ VmC و VH148GmC حوالي 5.8 و 7.0، على التوالي (الشكل التكميلي 1f، g)، مما يشير إلى أن VmC أكثر ملاءمة لتصور تغييرات pH في الظروف الحمضية مقارنة بـ VH148GmC.
يتكون SC من ثلاث مناطق pH تدريجية عبر أجزاء مختلفة من الجسم
لرصد توزيع SC-pH في الفئران في الجسم الحي، قمنا بإجراء تصوير حيوي و الفئران عبر المجهر الضوئي التداخلي (الشكل 1أ). كشفت مقطع Z المعاد تشكيله أن SC من جلد الظهر يتكون من تقسيم ثلاثي الطبقات: الطبقة العليا – شبه محايدة، والطبقة الوسطى – حمضية، والطبقة السفلية – حمضية معتدلة. ومع ذلك، كان من الصعب تحديد درجة الحموضة في الخلايا القرنية الفردية (الشكل 1ب وفيلم إضافي 1). حيث أظهر الجلد تجاعيد مخططة (الشكل 1ج) وصورة المجهر الضوئي التداخلي في قدمت الصورة في المستوى X-Y دقة أعلى من القسم المعاد تكوينه المقطعي Z (الشكل 1ب)، لذا ركزنا على التجاعيد المضلعة في صورة المستوى X-Y (الشكل 1ج). هذه الطريقة مكنتنا من تصور SC-pH بدقة خلية قرنية واحدة (الشكل 1د، هـ). بالإضافة إلى جلد الظهر، أظهر جلد البطن والأذن والذيل وكف اليد في الفئران تقسيمًا ثلاثي الطبقات (الشكل 1و، ز، والشكل التكميلية 2أ-هـ).
بعد ذلك، قمنا بحساب قيمة الرقم الهيدروجيني لكل منطقة في SC منالفئران. كانت قيم pH في المناطق العليا والوسطى والسفلى من SC-pH وطبقة خلايا SG1 مختلفة بشكل ملحوظ، حيث تراوحت بين 6.58-6.77، 5.32-5.42، 5.92-6.04، و6.93-7.11، على التوالي (الشكل 1e-g). بشكل جماعي، كان لدى SC ثلاث مناطق SC-pH متدرجة، والتي تم الحفاظ عليها عبر مواقع الجسم المختلفة.
نظرًا لأن و مكنت الفئران من التصوير الحي لدرجة الحموضة بين الخلايا في الخلايا القرنية وأظهرت تقسيمًا ثلاثي المستويات، وتساءلنا عما إذا كانت درجة الحموضة خارج الخلايا في الخلايا القرنية تظهر تغييرات مماثلة في درجة الحموضة. للتحقيق في ذلك، قمنا بإنشاء فئران B6 التي تعبر بشكل محدد عن بروتين الاندماج Venus-mCherry على الجانب الخارجي من غشاء الخلية لبروتينات SG1 والخلايا القرنية (B6.SASPفئران [B6. عرض-VmCالفئران]) وأجريت تصوير pH تحت الجلد الحي. مشابه لـ و VH148GmC فئران، B6. عرض-VmCأظهرت الفئران تقسيمًا ثلاثي المستويات (الشكل 1h والفيلم التكميلي 2). كانت مناطق SC-pH العليا والوسطى والسفلى وطبقة خلايا SG1 لها قيم pH مختلفة بشكل ملحوظ [pH 6.76 ( CI 6.61-6.91)، 5.36 ( 5.30-5.41)، 5.82 (95% CI 5.76-5.88)، و 6.80 (تشير هذه النتائج إلى أن الرقم الهيدروجيني الخارجي للخلايا القرنية يتطابق مع الرقم الهيدروجيني الداخلي للخلايا القرنية.
يمكن أن يتم إخماد الفلورية في الزهرة بواسطة درجة الحموضة وكذلك بواسطة تركيز أيون الكلوريد.بينما لا يمكن إخماد الفلورية لـ EGFP بواسطةقمنا بإجراء تصوير داخلي حي لفئران HR التي تعبر عن EGFP في خلايا SG1الفئران). مشابه لـفئرانكانت الفئران تمتلك ثلاث مناطق متميزة من شدة EGFP في SC – العليا-عالية EGFP، الوسطى-منخفضة EGFP، والسفلى-عالية EGFP (الشكل التكميلي 3a) – مما يشير إلى أن توهين فلوريسcence فينوس لم يكن بسببالتغيرات. علاوة على ذلك، اكتشفنا تعبير بروتين EGFP فيالفئران و فينوس و تعبير mCherry فيالفئران من خلال تحليلات Western blot لعينات SC المأخوذة من تقشير الشريط (TS). كانت كميات EGFP وVenus وmCherry متشابهة من (الجزء العلوي من SC) إلى (الطبقة السطحية السفلية) عينات TS؛ ومع ذلك، انخفض مستوى الفيلاغرين نحو سطح الطبقة السطحية، مما يتماشى مع الملاحظات السابقة (الشكل التكميلي 3b) تشير هذه النتائج إلى أن التغيرات في فلورية Venus-mCherry داخل SC لم تكن ناتجة عن التحلل البروتيني ولكن بسبب التثبيط الناتج عن درجة الحموضة في SC.
تأتي منطقة SC-pH السفلية من الحموضة الناتجة عن الكورنيوبتوز، وتعتمد حموضة المناطق الثلاثة المتدرجة من SC-pH على الوصلات الضيقة.
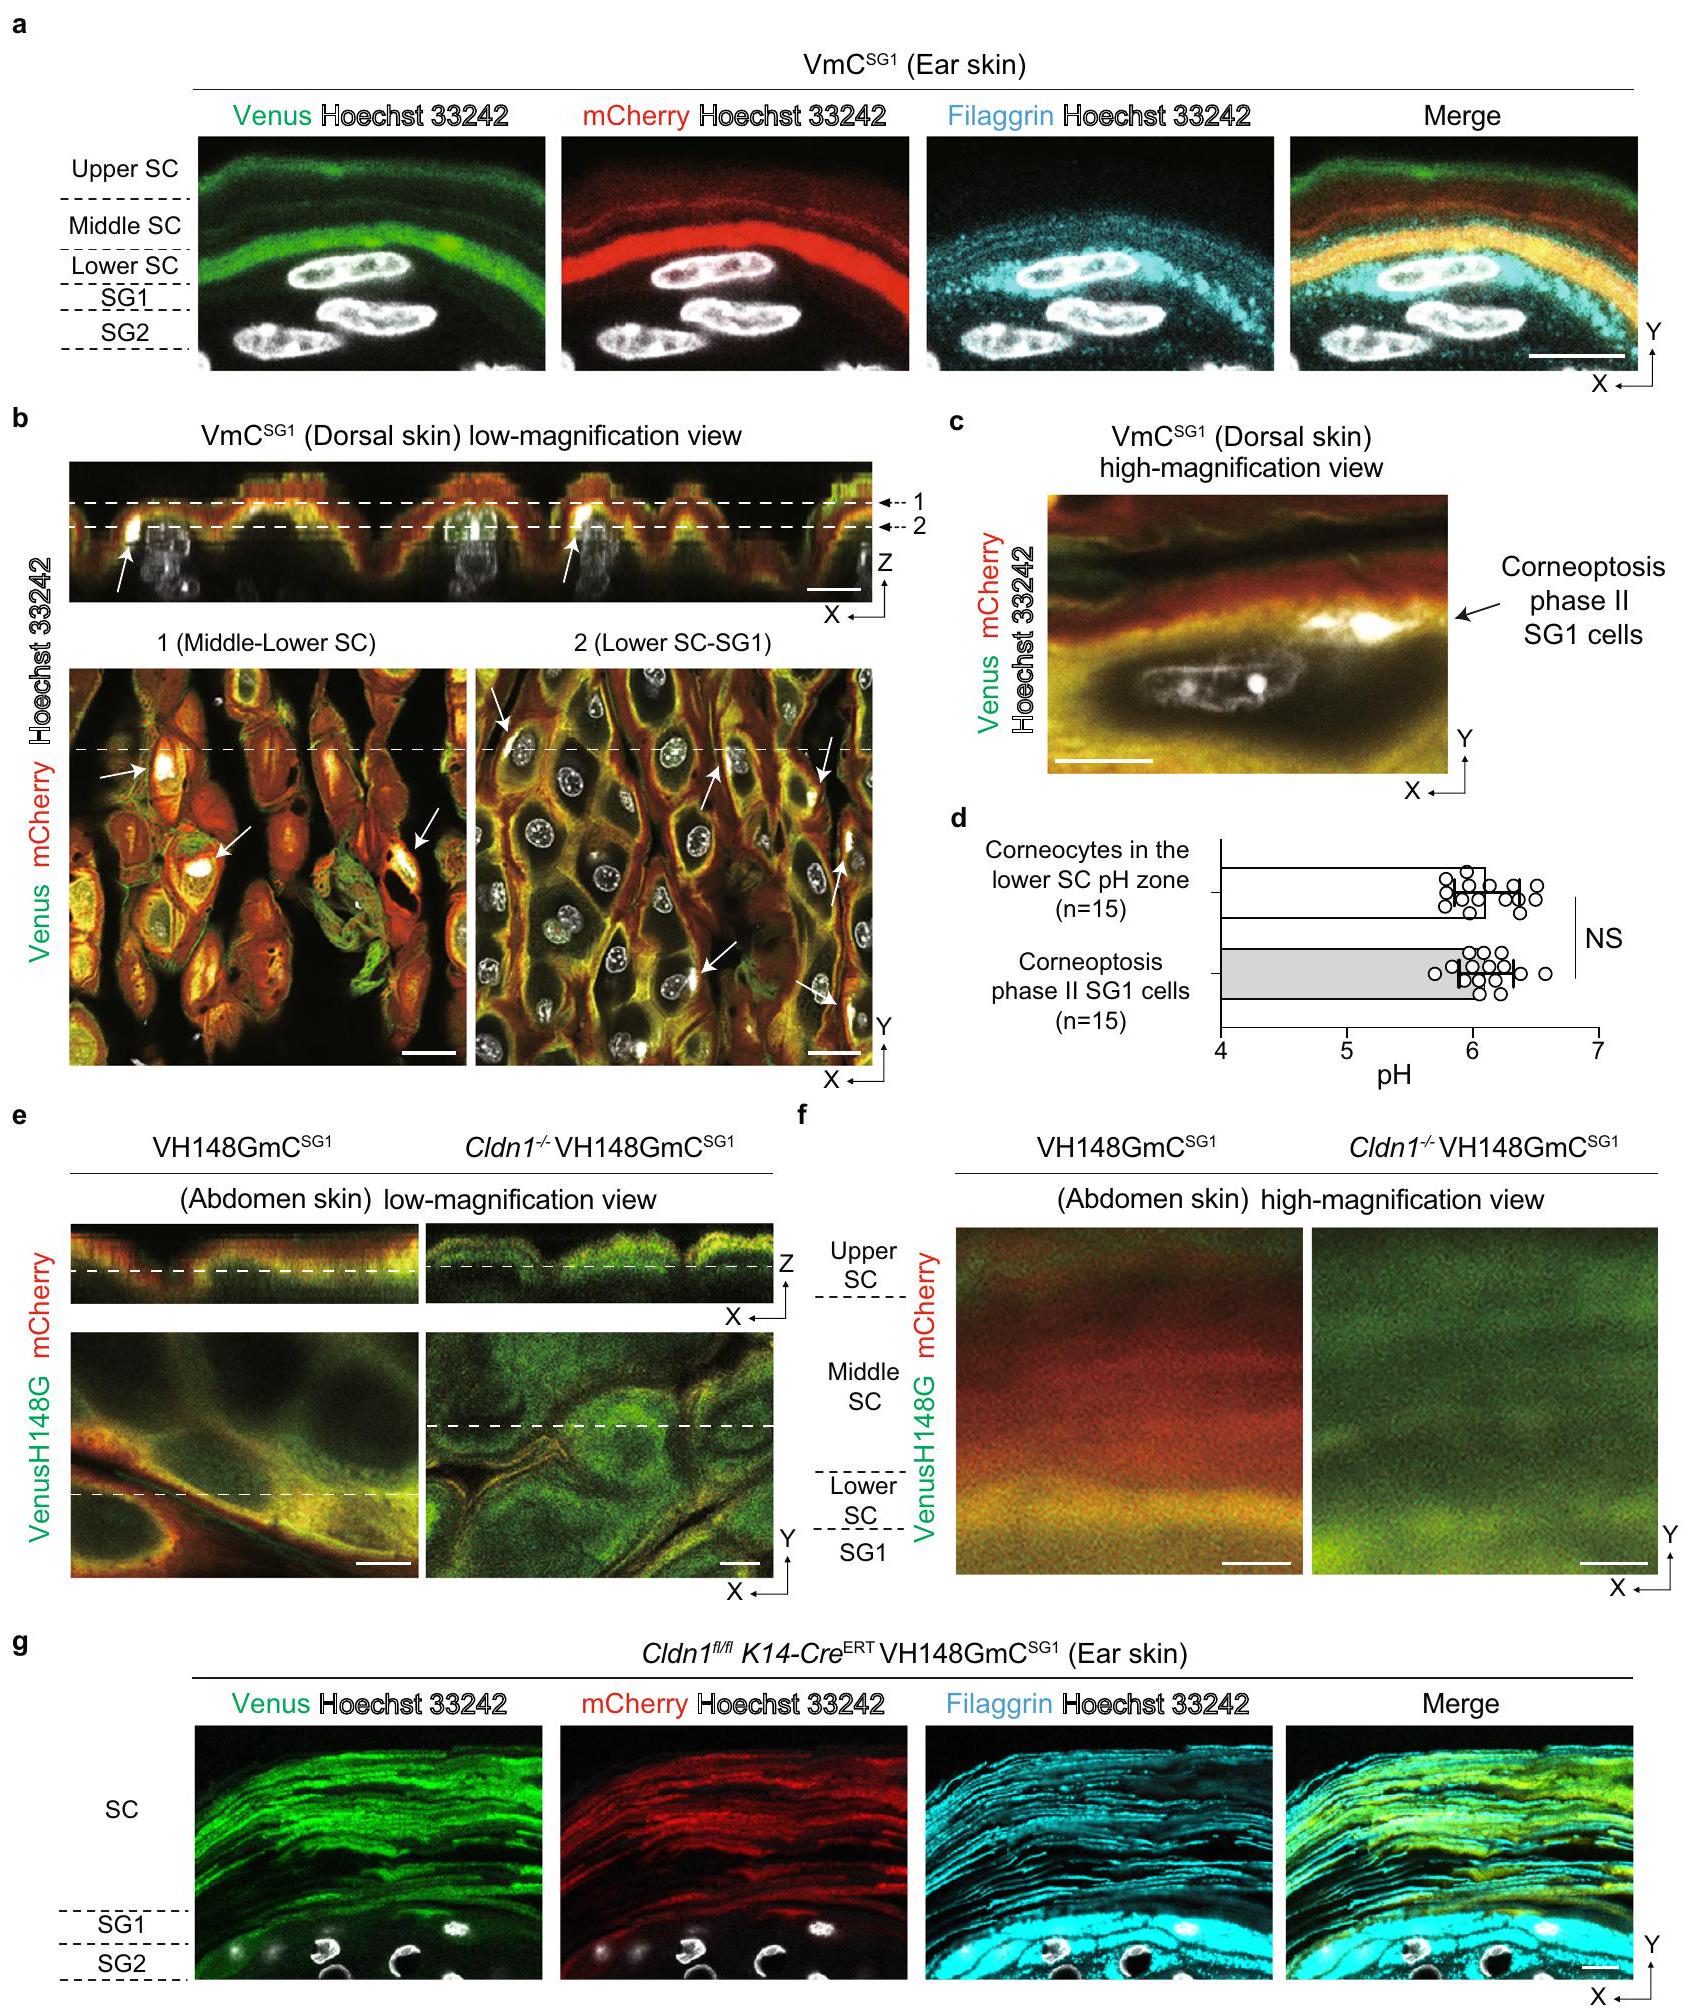
يُعرف أن الفيلاغرين موجود في منطقة الخلايا الكيراتينية السفلية، ثم يتحلل إلى عوامل الترطيب الطبيعية، مما يلعب دورًا حيويًا في ترطيب الجلد.لفحص توزيع الفيلاغرين ضمن مناطق SC-pH، قمنا بإجراء صبغ مناعة فلورية للفيلاغرين فيجلد الفأر. تم ملاحظة الفيلاغرين في غشاء الخلية للكورنيوسايت الموجود في منطقة SC-pH السفلى واختفى فوق منطقة SC-pH السفلى (الشكل 2a). تشير هذه النتيجة إلى أن منطقة SC-pH السفلى تت correspond إلى المنطقة السفلى من SC التي تم الإبلاغ عنها سابقًا، حيث يوجد الفيلاغرين.وأن الفيلاغرين يتحلل إلى عوامل الترطيب الطبيعية في منطقة الرقم الهيدروجيني المتوسطة للطبقة القرنية.
حيث تتشكل الخلايا القرنية من خلال موت خلايا SG1 (الكورنيوبتوزيس) وتصبح خلايا SG1 حمضية خلال المرحلة الثانية من الكورنيوبتوزيس.، ثم هدفنا بعد ذلك إلى تحديد موقع وقيمة الرقم الهيدروجيني لخلايا SG1 في المرحلة الثانية من الكورنيوبتوز. للقيام بذلك، قمنا بحقن Hoechst 33242 في جلد و تمت دراسة الفئران وأُجريت تصوير pH داخل الأنسجة في طبقة الجلد. كانت خلايا SG1 ذات السيتوبلازم الأصفر وصبغة نووية Hoechst 33242 (التي تت correspond إلى المرحلة الثانية من الكورنيوبتوز) موجودة في الطبقة السفلية من منطقة SC-pH السفلية (الشكل 2b و c، والشكل التكميلي 3c، والفيلم التكميلي 3). كان pH خلايا SG1 في المرحلة الثانية من الكورنيوبتوز مشابهًا لذلك الموجود في الكورنيوسيتات في منطقة SC-pH السفلية (الشكل 2d)، مما يشير إلى أن منطقة SC-pH السفلية تنشأ من الحموضة التي تحدث خلال المرحلة الثانية من الكورنيوبتوز.
في جلد الثدييات، يحتوي البشرة على نوعين من الحواجز الفيزيائية: الوصلات الضيقة (TJs) والطبقة القرنية (SC). تتشكل الوصلات الضيقة في الجانب القمي للخلايا الكيراتينية في الطبقة الثانية من الغدة الدهنية (الشكل 1أ) وتكون في اتصال مع خلايا SG1 لتعمل كحواجز بين السوائل.الفئران التي تفتقر إلى كلودين-1 (Cldn1 )، بروتين رباعي عبر الغشاء يشكل بروتينات الوصلات الضيقة، معروف بأنه يمتلك طبقة جلدية أكثر تماسكًا وسماكة، ويعاني من فقدان أكبر للماء عبر البشرة مقارنة بالفئران من النوع البري.من المعروف أن المرضى الذين يعانون من نقص كلودين-1 يصابون بالسمكية.اضطراب قرني وراثي يتميز بضعف تمايز الخلايا القرنية وسماكة نتيجة ضعف التقشر. علاوة على ذلك، فإن المرضى الذين يعانون من التهاب الجلد التأتبي (AD)، وهو مرض جلدي التهابي مزمن يؤدي إلى ارتفاع قيم pH السطحية للخلايا القرنية.لديهم تعبير منخفض بشكل ملحوظ لبروتين كلودين-1 في بشرتهماستنادًا إلى هذه التقارير، افترضنا أن التوزيعات والقيم لـ SC-pH قد تكون غير طبيعية في فئران Cldn1/. كما أن VH148GmCالفئران لديها حساسية أعلى للقيم المحايدة لدرجة الحموضة منالفئران، وCldn1تموت الفئران خلال يوم واحد من الولادة (بسبب فقدان الماء المفرط من البشرة)قمنا بفحص SC-pH لـ Cldn1 حديثي الولادةالفئران. لاحظنا غياب المناطق الثلاثة من مستويات الحموضة SC-pH المتدرجة، وكان مستوى الحموضة في SC بالكامل محايدًا (الشكل 2e، f)، مما يشير إلى أن حموضة المناطق السفلية والوسطى من SC-pH تتطلب وجود روابط ضيقة سليمة. بشكل جماعي، تشير هذه النتائج إلى أن منطقة SC-pH السفلية هي طبقة أساسية من ثلاث مناطق SC-pH متدرجة وأنها تتعطل بسبب تدمير الروابط الضيقة.
علاوة على ذلك، قمنا بفحص SC-pH الخاص بالجلد من نوع Cldn1.VH148GmCفئران (B6.Cldn1 K14-CreERT VH148GmC الفئران). مشابهة لـ Cldn1/ VH148GmC حديثي الولادةالفئران، كامل SC من البالغين B6.Cldn K14-CreERT VH148 أظهرت الفئران درجة حموضة محايدة وكانت أكثر سمكًا مقارنةً بـالفئران (الشكل التكميلي 3d، e). من المدهش أن صبغة المناعة الفلورية للفيلاجرين في B6.Cldn1 K14-CreERT VH148GmC أظهر جلد الفئران أن الفيلاغرين موزع مع تراكم على طول غشاء الخلية للكورنيوسايت وكان موجودًا في جميع أنحاء الطبقة القرنية (الشكل 2g). ومع ذلك، لم يكن بالإمكان اكتشاف مونومر الفيلاغرين في B6.Cldn1. K14-CreERT VH148GmC الفئران، كما تم تأكيده من خلال تحليلات Western blot لعينات SC المأخوذة من TS (الشكل التكميلي 3f). بدلاً من ذلك، تم الكشف عن أشرطة تقريبًا بحجم الفيلاغرين الثنائي والثلاثي والرباعي. بشكل جماعي، تشير هذه النتائج إلى أن نقص Cldn1 أدى إلى فقدان ثلاث مناطق SC-pH تدريجية وتراكم الفيلاغرين المعالج مسبقًا. تعتبر هذه الظروف المتأثرة بالوصلات الضيقة نتيجة لانخفاض مونومر الفيلاغرين وكبح إنتاج عامل الترطيب الطبيعي اللاحق، مما يؤدي إلى ضعف التقشر.
تتميز منطقة SC-pH العليا بخصائص مشابهة للتكيف وهي حساسة للتغيرات الخارجية في درجة الحموضة.
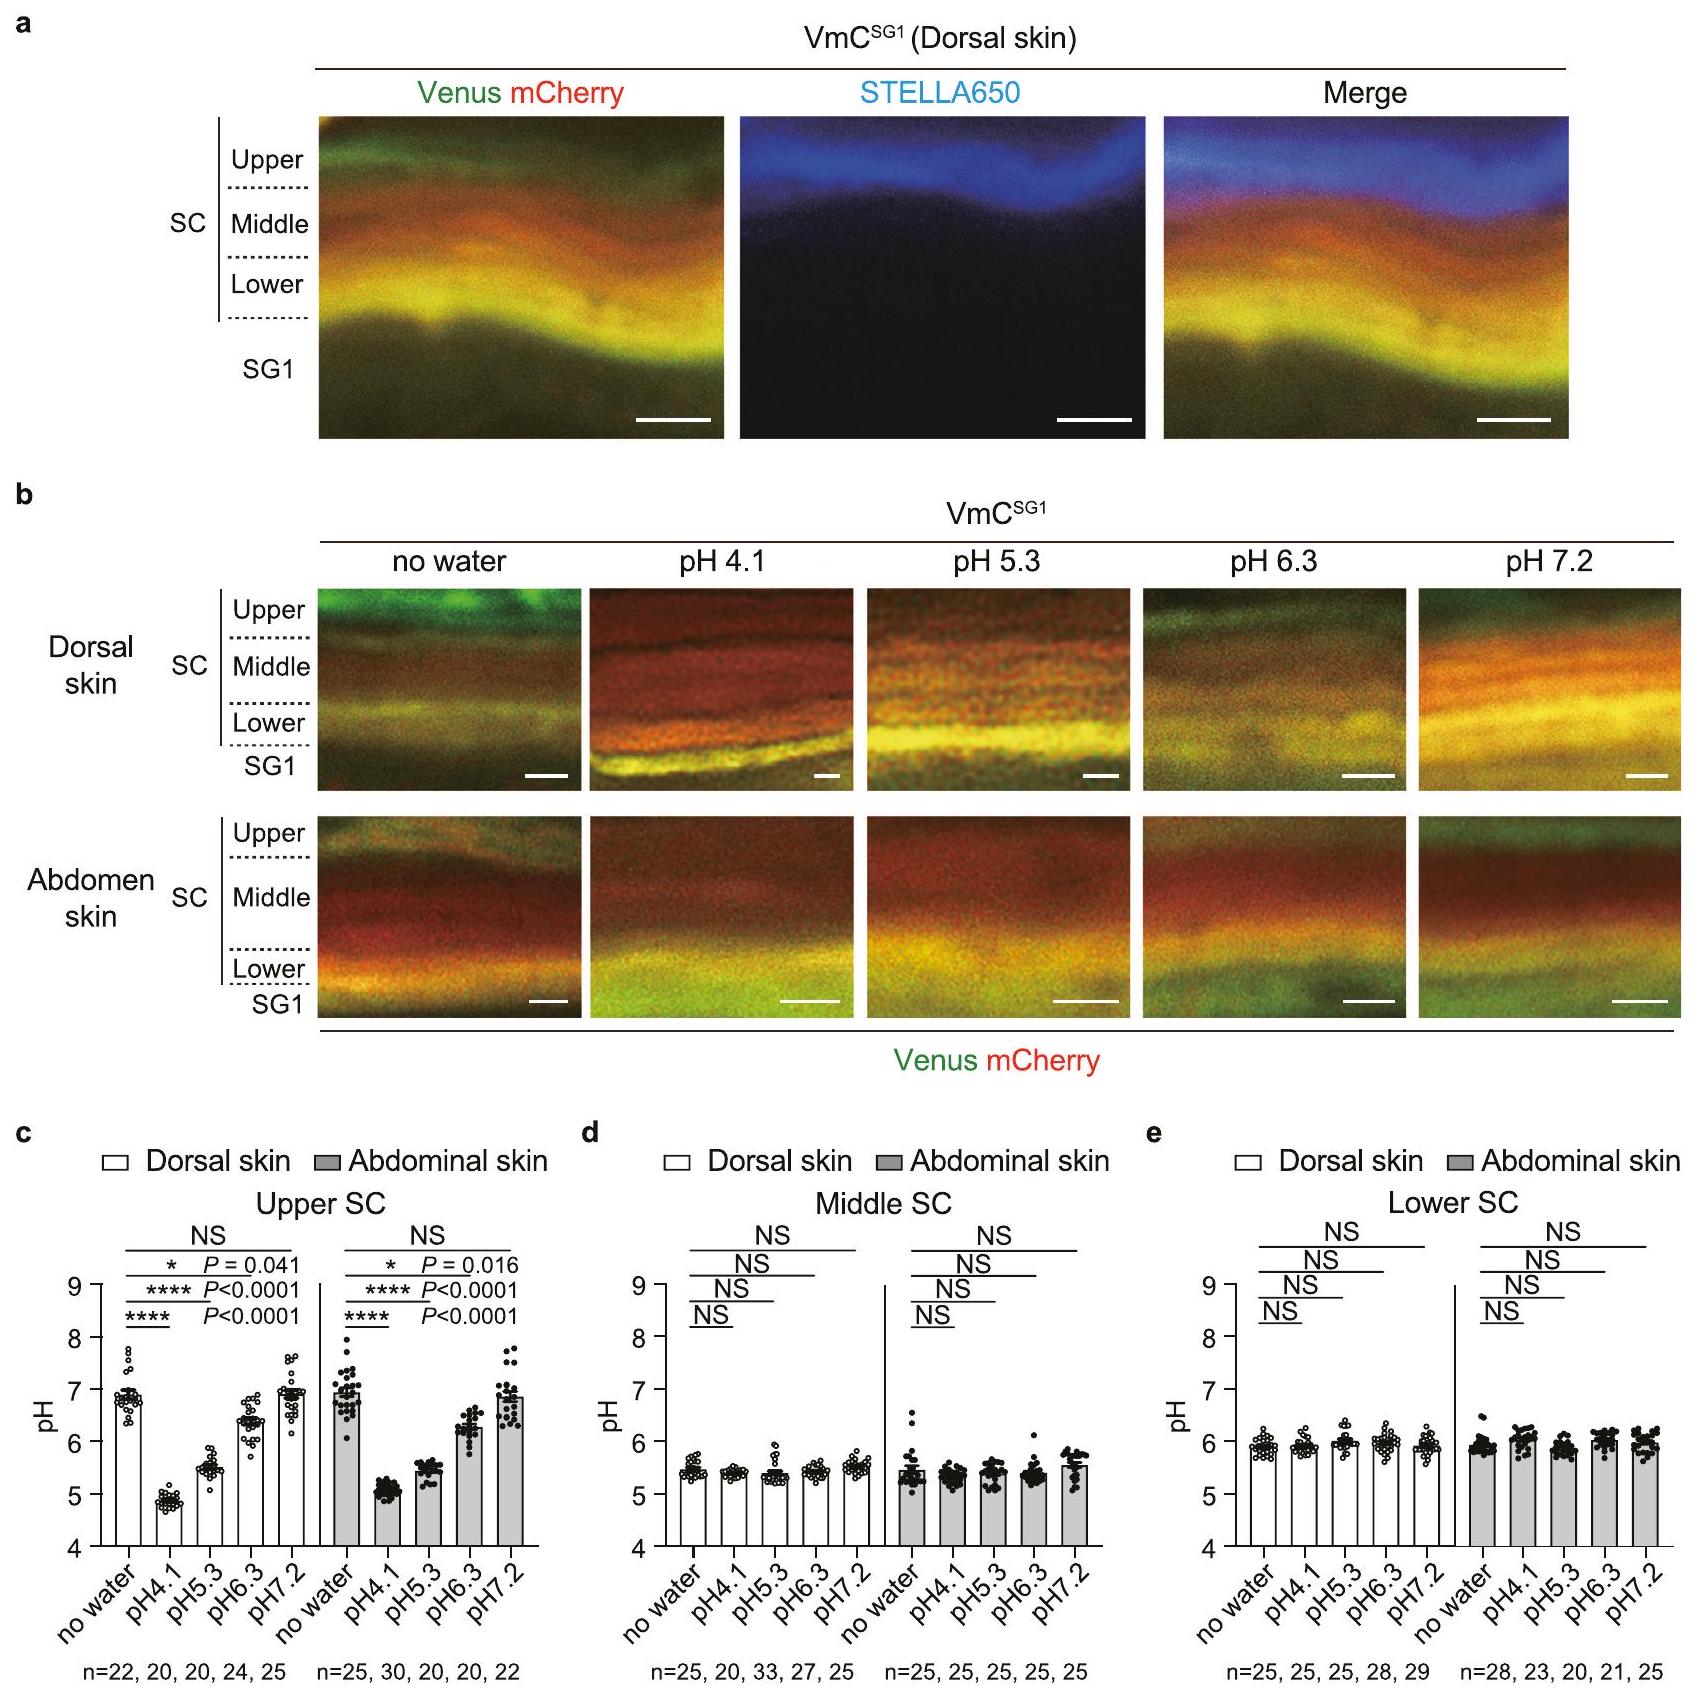
نظرًا لأن منطقة SC-pH المتوسطة الحموضة تتمايز أكثر إلى منطقة SC-pH العليا شبه المحايدة، قمنا بدراسة تأثير المحفزات الخارجية على تمايز مناطق pH. استخدمنا صبغة STELLA Fluor 650 (صبغة فلورية تتميز بثبات شدة فلوروسنتها عند; مذاب في محلول ملحي معزز بالفوسفات) يحتوي على ماء ميلي-كيو على سطح الجلد الظهري لـالفئران. تم ملاحظة إشارات STELLA Fluor 650 فقط في الطبقة العليا من SC، والتي تت correspond إلى منطقة SCpH العليا (الشكل 3a). كانت هذه النتيجة متسقة مع الملاحظات السابقة المستندة إلى مطيافية الكتلة للأيونات الثانوية بتقنية زمن الطيران (TOF-SIMS)، والتي اقترحت وجود منطقة سطحية سمحت بوجود أيونات سلبية (أي، البوتاسيومالتدفق والدفق. علاوة على ذلك، قمنا بتطبيق محاليل عازلة بقيم pH مختلفة ( ) إلى جلد الظهر والبطن من الفئران وقاسوا درجة الحموضة لكل منهاالمنطقة و SG1. في كل من الجلد الظهري والبطني، تغير الرقم الهيدروجيني في المنطقة العليا من SC-pH بشكل ملحوظ بعد معالجة العازل. بالمقابل، قدمت المناطق الوسطى والسفلى من SC-pH قيم pH مشابهة لتلك الموجودة في الفئران غير المعالجة (الشكل 3b، c). لذلك، تظهر المنطقة العليا من SC-pH خصائص مشابهة للتكيف ويمكنها تعديل الرقم الهيدروجيني الخاص بها وفقًا للتغيرات في الرقم الهيدروجيني الخارجي، على عكس المناطق السفلى والوسطى من SC-pH.
الشكل 2 | منطقة SC-pH السفلية تنشأ من الحموضة خلال الكورنيوبتوز، تعبر عن الفيلاغرين، وتتعطل بسبب اضطراب الوصلات الضيقة. أ تصوير المناعة الفلورية لجلد أذن الفأر منفئران مصورة لفيتامين (د)، ميري، وفيلاغرين. شريط القياس،صور مجهرية متداخلة تمثل مقطع Z المعاد تكوينه (الأعلى) وصور مجهرية بتكبير منخفض في مستوى X-Y (أسفل اليسار وأسفل اليمين) لجلد الظهرفئران تم حقنها بـ Hoechst 33242 (أبيض). الأسهم البيضاء تمثل خلايا SG1 ذات السيتوبلازم الأصفر (خلايا SG1 في مرحلة الكورنيوبتوز). مقياس الرسم، 10 (أعلى) و 20 (أسفل اليسار وأسفل اليمين)صور تمثيلية مجهرية متناهية الدقة لمستوى X-Y من جلد الظهرفئران تم حقنها بـ Hoechst 33242 (أبيض). مقياس الرسم،قيم الخلايا القرنية و
خلايا SG1 في مرحلة الكورنيوبتوزيس الثانية في منطقة SC-pH السفليةخلايا من ثلاثة حيوانات مستقلة بيولوجيًا، على التوالي). منخفض و تكبير عاليصور تمثيلية مستوية متحدة المحاور لجلد البطن لحديثي الولادة VH148GmCو Cldn1 VH148GmC فئران. شريط القياس، (هـ) و (ف). ج المجهر المناعي الفلوري لجلد الأذن من B6.Cldn K14-CreERT VH148GmC فئران لتصوير الزهرة، mCherry، والفيلاغرين. شريط القياس،تُعرض البيانات كمتوسط SEM ومجمعة من ثلاثة تجارب ( ) أو تمثل على الأقل ثلاثة تجارب مستقلة (أ-ج، هـ-و). غير ذات دلالة، اختبار مان-ويتني ثنائي الجانب (د). تم توفير بيانات المصدر كملف بيانات مصدر.
الشكل 3 | منطقة SC-pH العليا تظهر خاصية مشابهة للتكيف. أ صور مجهرية تمثيلية بتكبير عالٍ في مستوى X-Y لجلد الظهر لـفئران منقوعة في STELLA Fluor 650. تُظهر الصور المدمجة لكوكب الزهرة (الأخضر)، وmCherry (الأحمر)، وSTELLA Fluor 650 (الأزرق). شريط القياس،. ب صور تمثيلية مجهرية بتكبير عالٍ لمستوى X-Y لجلد الظهر والبطن من الفئران المعالجة مع أو بدون مجموعة متنوعة من العوازل الحمضية ( مقياس،. في المناطق العليا من SC-pH للجلد الظهري أو البطنيالفئران المعالجة بدون عازل (بدون ماء) ومخازن pH المختلفة، و 7.2)، و22 نقطة من ثلاثة حيوانات مستقلة بيولوجيًا، على التوالي).في مناطق SC-pH الوسطى الظهرية أو جلد البطنالفئران المعالجة بدون عازل (بدون ماء) ومخازن pH المختلفة، و 7.2 ) (، و 25 نقطة من ثلاثة حيوانات مستقلة بيولوجيًا، على التوالي). درجة الحموضة في مناطق SC-pH السفلية من جلد الظهر أو البطن منالفئران المعالجة بدون عازل (بدون ماء) ومخازن مختلفة من الرقم الهيدروجيني، و 7.2 ) (، و 25 نقطة من ثلاثة حيوانات مستقلة بيولوجيًا، على التوالي). تُعرض البيانات كمتوسط SEM ومجمعة من ثلاثة تجارب ( ) أو تمثل على الأقل ثلاث تجارب مستقلة (أ و ب). ، ; تم استخدام تحليل التباين أحادي الاتجاه كروسكال-واليس متبوعًا باختبار دان بعد الاختبار (ج-هـ). تم توفير بيانات المصدر كملف بيانات المصدر.
يتم تحييد درجة حموضة منطقة SC العليا بواسطة ميكروبات الجلد
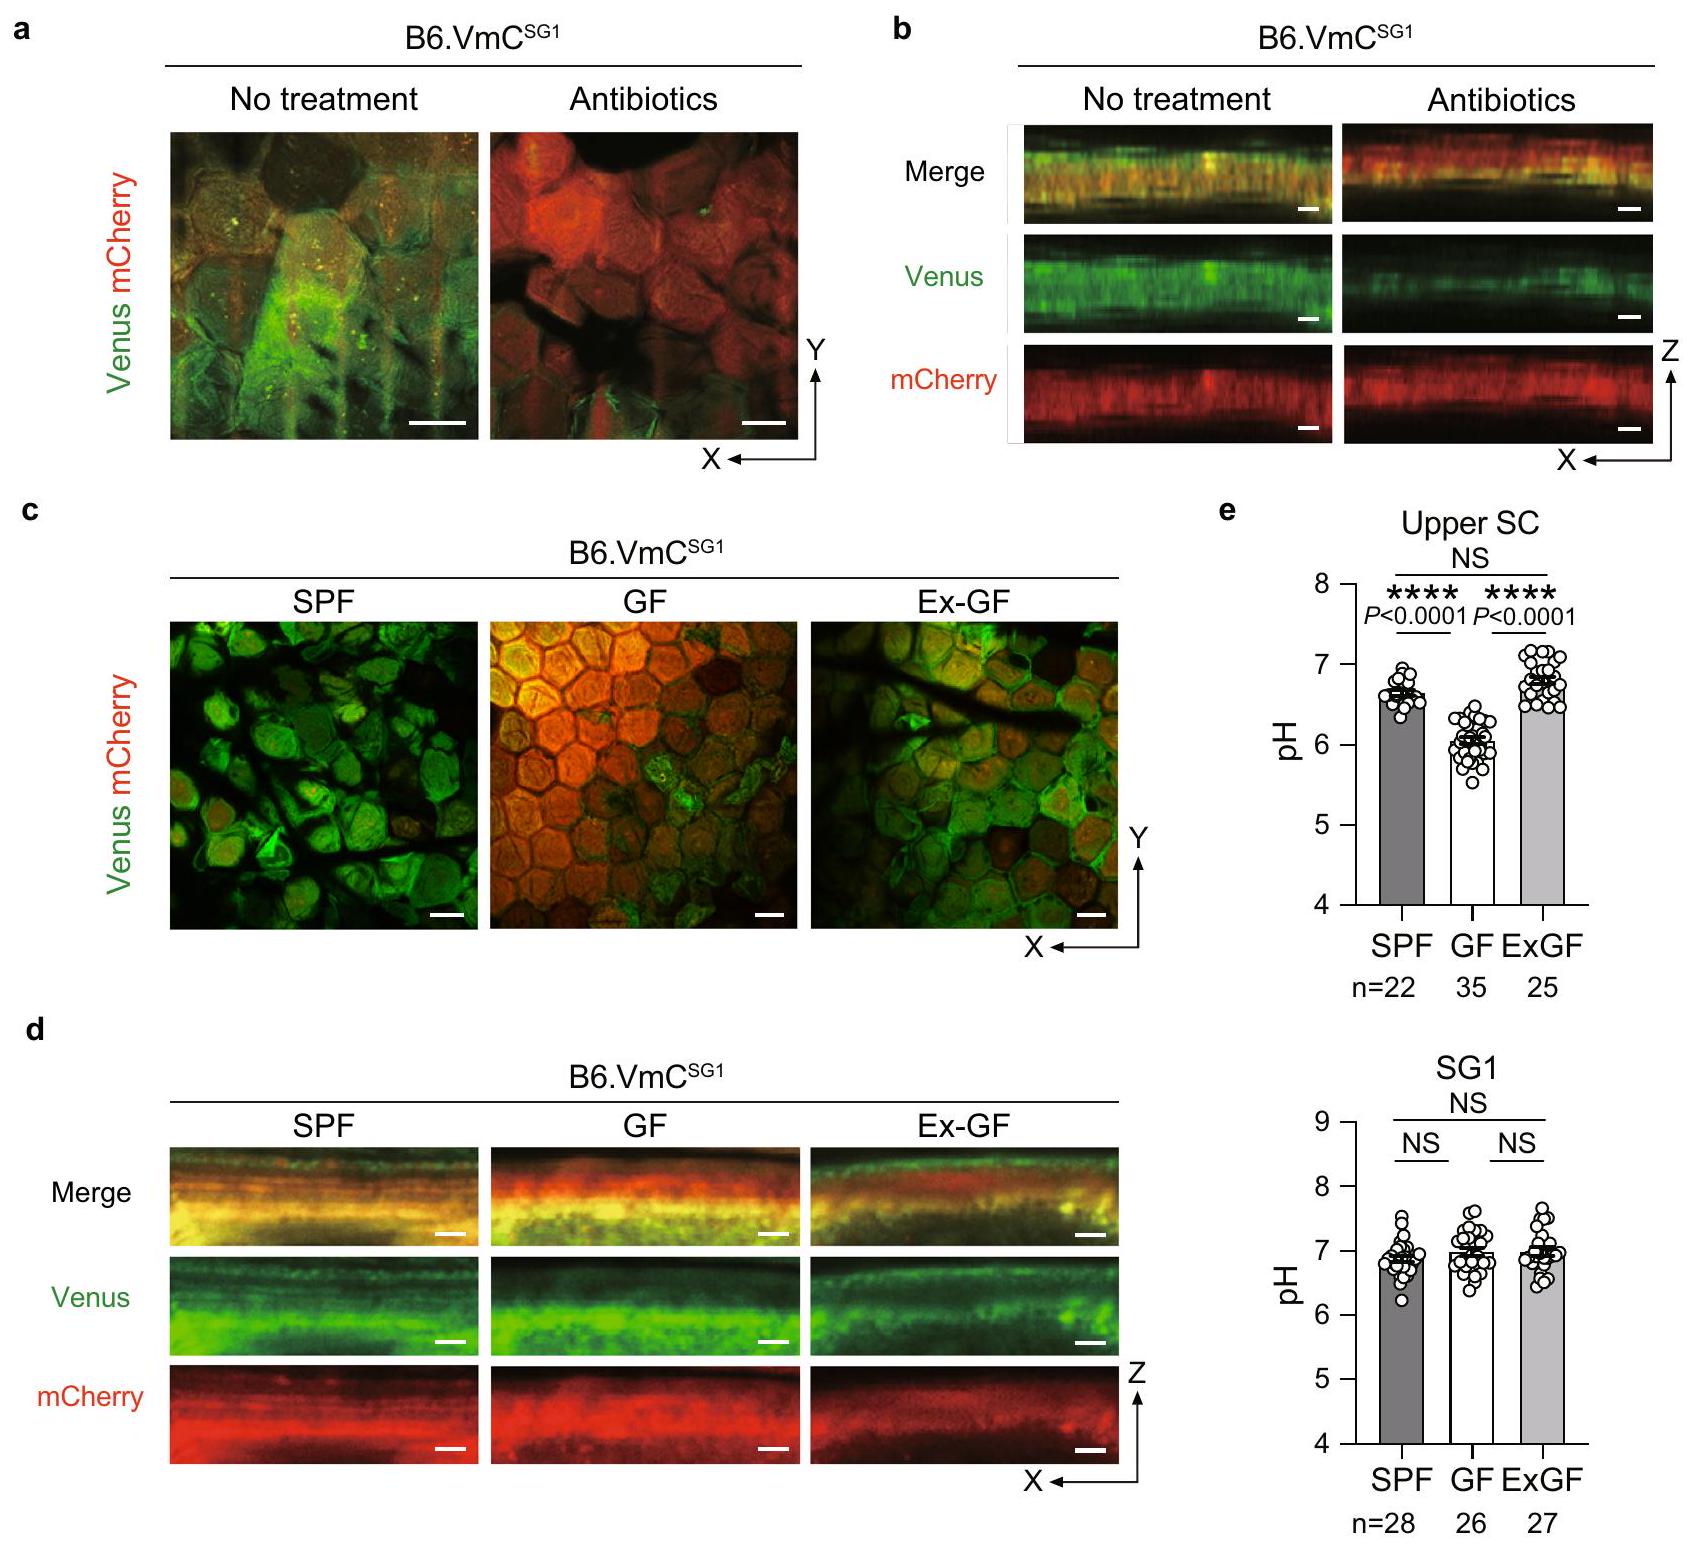
نظرًا لأن ميكروبات الجلد تعيش على سطح الطبقة القرنية، قمنا بتقييم ما إذا كانت وجودها ضرورية للحفاظ على درجة حموضة الطبقة العليامنطقة. لقد عالجنافئران خالية من مسببات الأمراض المحددة (SPF) مع خليط من الأجسام المضادة تم الإبلاغ عنه سابقًا لتقليل عبء ميكروبيوم الجلد وأجرينا تصوير SC-pH داخل الكائن الحي (الشكل 4 أ، ب، والفيلم التكميلي 4). وجدنا أن معظم منطقة SC-pH العلوية من الفئران التي تلقت المضادات الحيوية أصبحت حمضية، وانخفضت منطقة pH العلوي المحايد بشكل كبير، مما يشير إلى أن ميكروبيوتا الجلد يمكن أن تعادل pH منطقة SC-pH العلوية. لتأكيد ذلك، قمنا بإنشاءخالي من الجراثيم ( الفئران وأجرينا تصوير pH داخل الجسم باستخدام SC (الشكل 4c و d، والفيلم التكميلي 4). اكتشفنا أن درجة حموضة الجزء العلويمنطقةكانت مستويات الفئران (pH 6.05 [95% CI 5.97-6.13]) أقل بشكل ملحوظ من تلك الخاصة بسلالة B6.فئران SPF (pH 6.65 [95% CI 6.58-6.72]). ومع ذلك، B6.
الشكل 4 | يتمتع الجزء العلوي من SC-pH برقم هيدروجيني قريب من الحياد بفضل ميكروبيوتا الجلد. أ صورة تمثيلية مجهرية متماسكة في مستوى X-Y بتكبير منخفض و (ب) صور مقطعية معاد تشكيلها في مستوى Zالفئران التي لم تتلق أي علاج أو مضادات حيوية. مقياس الرسم، 10 (أ) و (ب). صور تمثيلية معاد تشكيلها بتقنية التصوير المجهري الضوئي من مستوى X-Y منخفض التكبير و (د) مقاطع Z لـ SPF و GF و B6.VmC المشتركة في السكن فئران (صديقة سابقة). شريط القياس، و درجة الحموضة في الجزء العلوي من SC لـ SPF و GF و B6 المشتركة.فئران (أعلى،، و 25 حقلًا من ثلاثة مستقلين بيولوجيًا الحيوانات، على التوالي) و SG1 من SPF و GF و B6 المشتركة في السكن. VmCفئران (أسفل،، و 27 مجالًا من ثلاثة حيوانات مستقلة بيولوجيًا، على التوالي). تُعرض البيانات كمتوسطSEM ومجمعة من ثلاثة تجارب (e) أو تمثل على الأقل ثلاث تجارب مستقلة (a-d).; NS غير دال، اختبار كروسكال-واليس ANOVA أحادي الاتجاه يليه اختبار دان بعد ذلك (e). تم توفير بيانات المصدر كملف بيانات المصدر.
فئران GF التي تعيش معًا مع B6.VmCأظهرت فئران SPF (المعروفة باسم B6.Ex-GF) مستوى SC علوي محايد مع قيم pH مشابهة (pH 6.81 [95% CI 6.71-6.90]) لفئران B6.VmC.فئران SPF (الشكل 4e). بشكل جماعي، تشير هذه النتائج إلى أن وجود ميكروبات الجلد يعادل منطقة pH SC العلوية القريبة من الحيادية.
منطقة SC-pH متوسطة الحموضة تعمل كحاجز واقي ضد المكورات العنقودية الذهبية
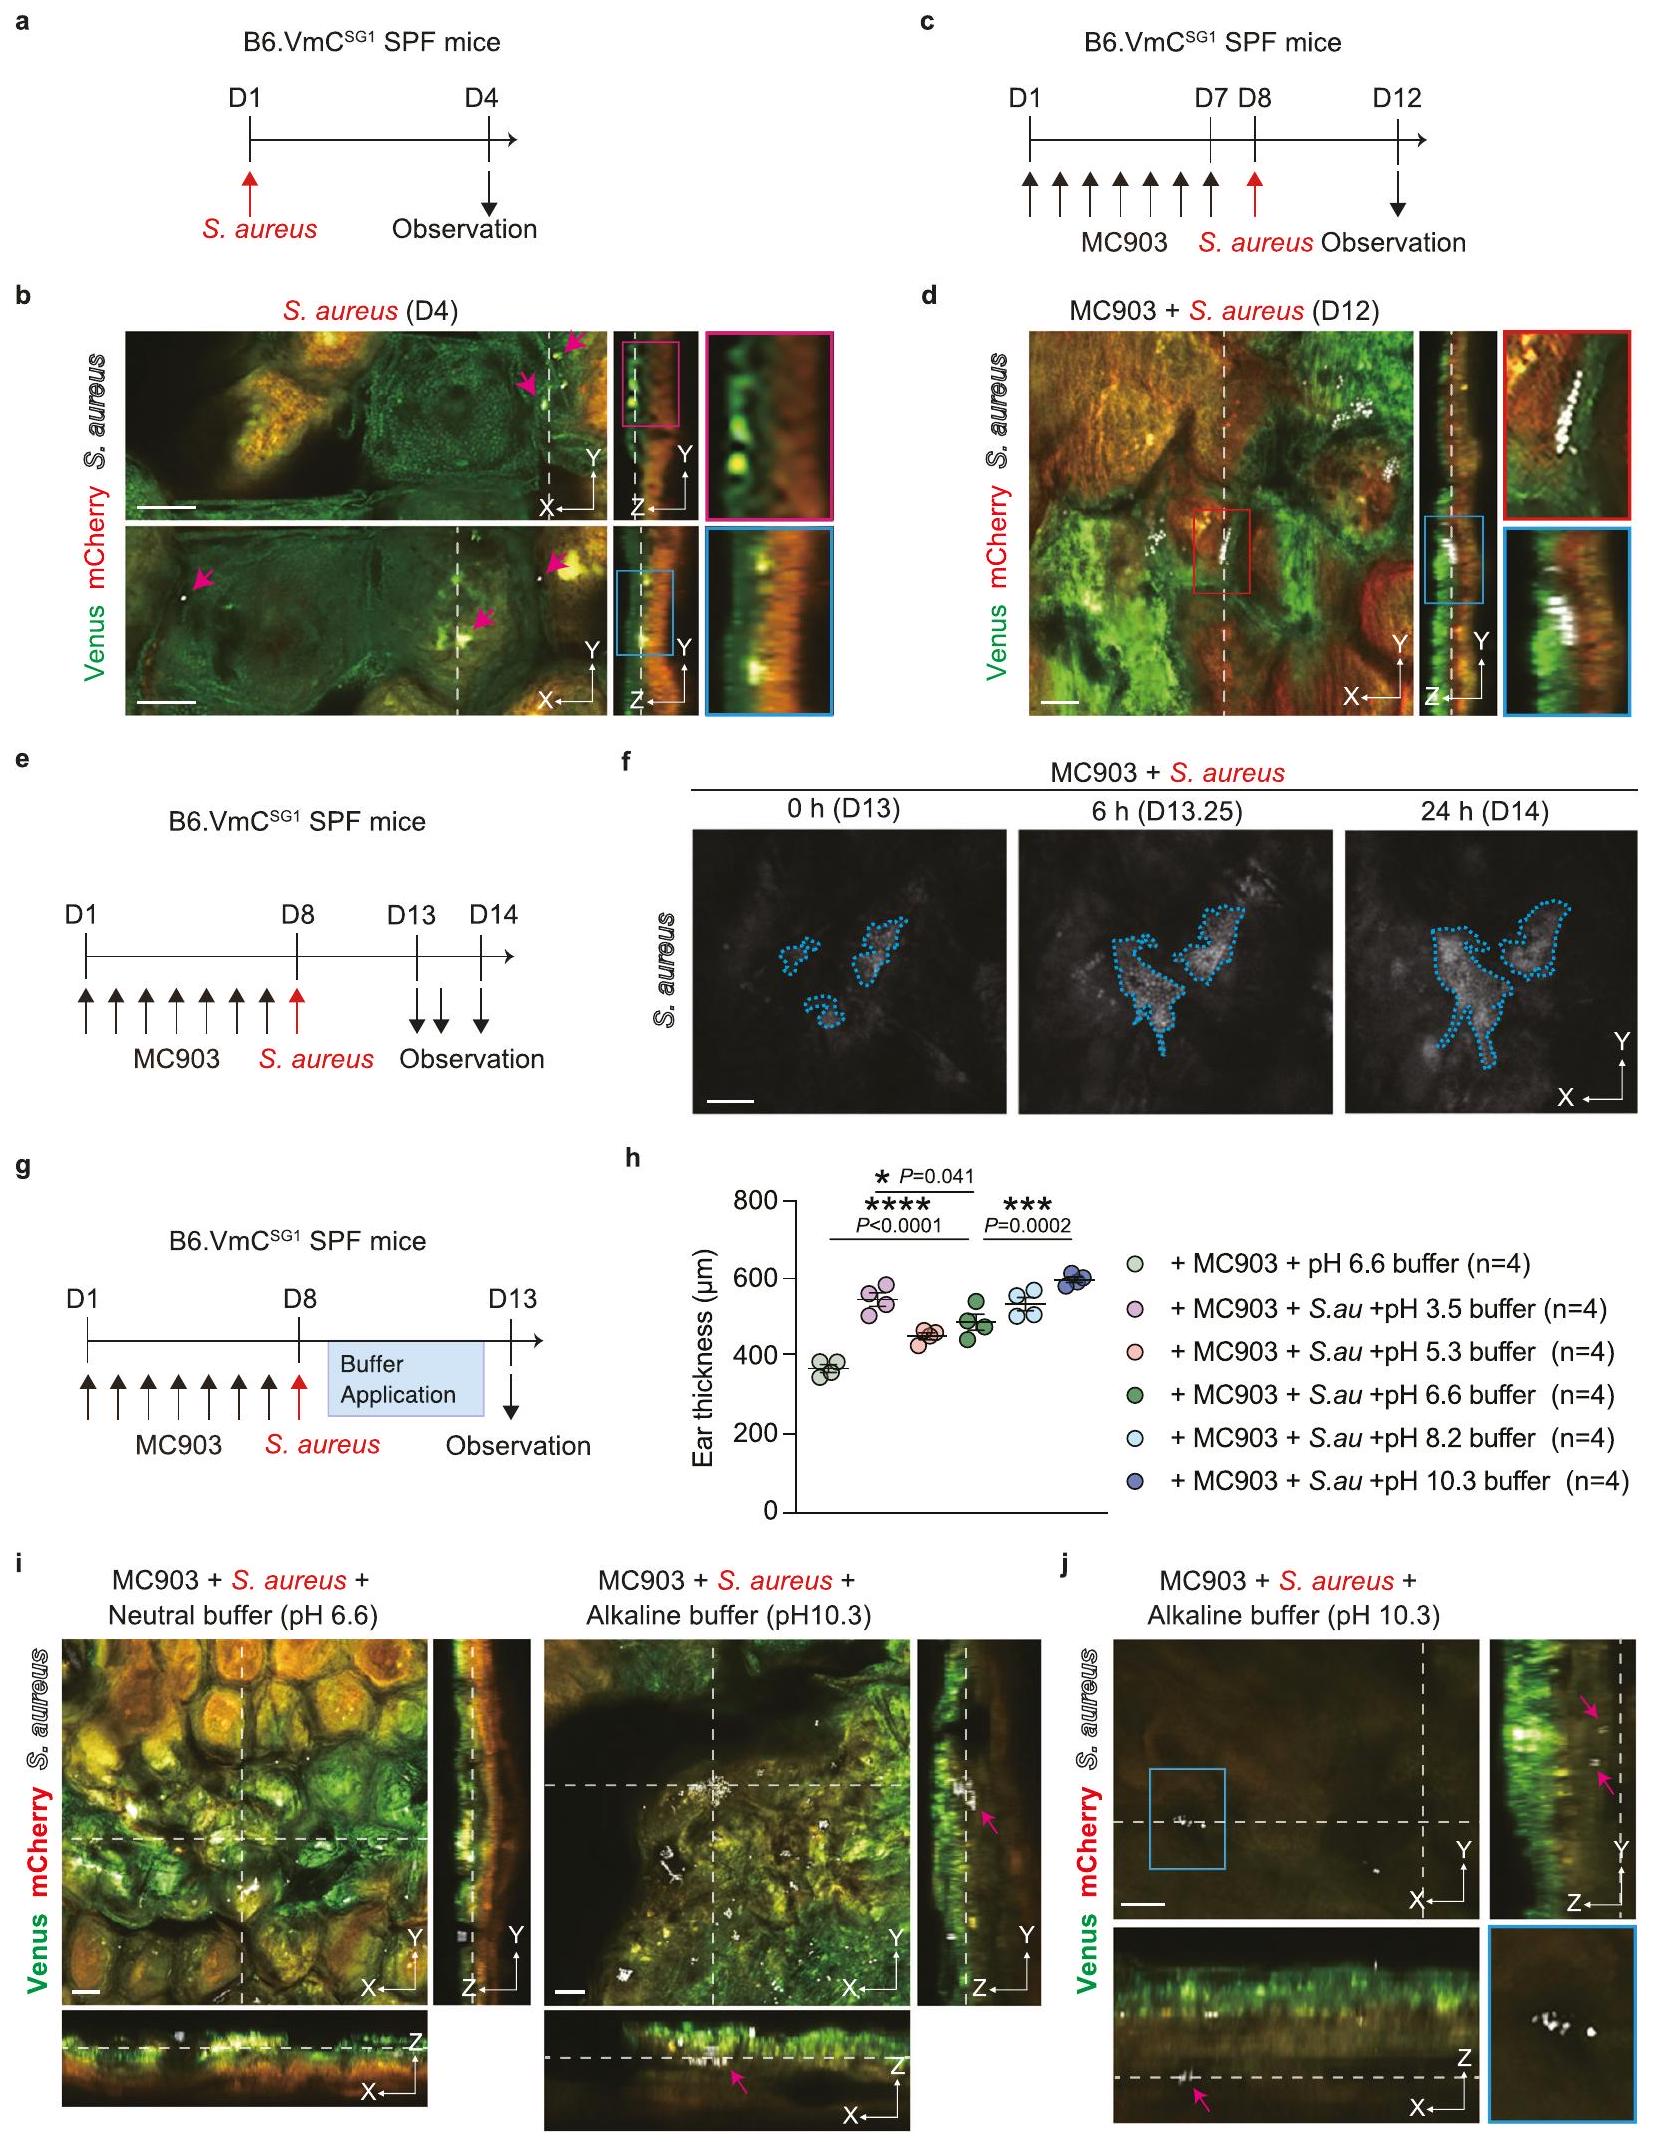
المكورات العنقودية الذهبية، وهي مسببة بارزة للأمراض الجلدية، ترتبط عادةً بأمراض الجلد الالتهابية مثل التهاب الجلد التأتبي. يُذكر أن وفرة المكورات العنقودية الذهبية مرتفعة على جلد مرضى التهاب الجلد التأتبي، وتوزيعها يختلف عن ذلك الذي يُرى في الأصحاء.. ومع ذلك، لا يزال غير واضح كيف يتوطن S. aureus في SC في التهاب الجلد التأتبي. لمراقبة توطين S. aureus في SC، قمنا بتلقيح جلد أذن B6.VmC SPF (المشار إليه فيما بعد بـ الفئران، مع ضمان عدم وجود. المكورات العنقودية الذهبية، مع بروتين فلوري قابل للتحفيز بالأرجواني (VFP) ملصق على المكورات العنقودية الذهبية وأجريت تصوير pH تحت الجلد الحي (الشكل 5 أ والشكل التكميلية 4 أ). على الرغم من أنه تم الإبلاغ عن أن المكورات العنقودية الذهبية تتوطن على سطح SCوجدنا أنه أيضًا تم تحديده في أسفل منطقة pH العلوي المحايد للطبقة القرنية (الشكل 5ب والفيلم التوضيحي 5). ومن الجدير بالذكر أن توزيع S. aureus كان محدودًا حتى فوق منطقة pH القرنية المتوسطة الحمضية، ولم تكن هناك أي علامات على وجود S. aureus في منطقة pH القرنية المتوسطة الحمضية لمدة ثلاثة أسابيع على الأقل (الشكل التوضيحي 4ب).
بعد ذلك، قمنا بفحص توزيع S. aureus عند حدوث الالتهاب. قمنا بتطبيق MC903 على آذانفئران لتحفيز التهاب الجلد الشبيه بمرض الزهايمر (الشكل التكميلي 4c). تم الحفاظ على المناطق الثلاثة ذات مستويات الحموضة SC-pH بشكل تدريجي؛ ومع ذلك، أصبحت جميع المناطق الثلاثة أكثر سمكًا في الفئران التي تلقت MC903 (على الأرجح بسبب التهاب الجلد) مقارنة بتلك التي تم علاجها بالمركب الوهمي (الشكل التكميلي 4d، e). لم يكن هناك فرق في مستوى الحموضة في الجزء العلوي (المركب الوهمي مقابل ) أو مناطق pH المنخفضة SC- (المركبة [ ] مقابل MC903 [ ]) بين المجموعتين؛ ومع ذلك، كانت منطقة SC الوسطى تميل إلى أن يكون لديها pH أعلى في الفئران المعالجة بـ MC903 مقارنة بالفئران المعالجة بالمركبة (المركبة [pH 5.39 ] مقابل MC903 [ ]) (الشكل التوضيحي التكميلي 4f).
بعد ذلك، قمنا بتطبيق S. aureus المعلمة بـ VFP على آذان B6.VmCالفئران التي تلقت MC903 (الشكل 5c، d). وجدنا أن S. aureus استعمرت في أسفل منطقة pH العليا المحايدة للجلد تحت التهاب الجلد الناتج عن MC903. مشابهًا للتحكم في الحالة الثابتة، لم تكن هناك إشارات لـ S. aureus في منطقة pH الحمضية المتوسطة للجلد (الشكل 5d وفيلم إضافي 5). بالإضافة إلى ذلك، قمنا بإجراء تصوير زمني.
الشكل 5 | منطقة SC-pH متوسطة الحموضة تمنع غزو S. aureus. أ، ب B6.تم تلقيح الفئران بـ. الذهبية في اليوم الأول. تم تحليل الفئران في اليوم الرابع. تصميم تجريبي. ب) مستوى منخفض من التكبير في مستوى X-Y (يسار) وصور تمثيلية معاد تكوينها باستخدام التصوير المجهري الفلوري في مستوى منخفض (وسط) أو مرتفع (يمين، المنطقة المحددة بالخطوط الحمراء والزرقاء في الوسط) مقطوعة في مستوى Z. الأسهم الوردية تمثل إشارات S. aureus.تم تطبيق MC903 على B6.VmCتم معالجة فئران SPF يوميًا لمدة 7 أيام (الأيام 1-7) لتحفيز التهاب الجلد (فئران معالجة بـ MC903). تم بعد ذلك تلقيح الفئران بـ S. aureus في اليوم 8 وتم تحليلها في اليوم 12. ج تصميم التجربة. د صور تمثيلية مجهرية متداخلة منخفضة التكبير في مستوى X-Y (يسار) و Z مقطعة معاد تشكيلها (وسط). صور تمثيلية مجهرية متداخلة عالية التكبير في مستوى X-Y (الزاوية العليا اليمنى، المنطقة المحددة بخطوط حمراء في اليسار) و Z مقطعة معاد تشكيلها (الزاوية السفلى اليمنى، المنطقة المحددة بخطوط زرقاء في الوسط). هـ، و تم تلقيح الفئران المعالجة بـ MC903 بـ. الذهبية في اليوم الثامن وتم تحليلها في الأيام 13 و 13.25 و 14. التصميم التجريبي.صور تمثيلية بتقنية الزمن المتقطع لـكشف الـ . aureus في SC من B6.V- فئران SPF. الخط الأزرق المتقطع يمثل منطقة الـ. إشارة(s) aureus.تم تلقيح الفئران المعالجة بـ MC903 بـ S. aureus في اليوم الثامن وتمت معالجة الفئران بمخازن pH مختلفة مرة واحدة يوميًا في الأيام 9-12. تم تحليل الفئران في اليوم 13. ج تصميم التجربة.سمك أذن الفئران التي تم علاجها موضعياً بمخازن مختلفة من الرقم الهيدروجينيكل) بعد تطبيق MC903 و S. aureus. صور تمثيلية مجهرية متماسكة ذات تكبير منخفض في مستوى X-Y وشرائح Z للمجسمات التي تلقتها الفئران باستخدام محاليل عازلة محايدة (pH 6.6) وقلوية (pH 10.3).تمثيل مستوى X-Y (الزاوية العليا اليسرى، تكبير منخفض: الزاوية السفلى اليمنى، منطقة محددة بخطوط زرقاء في الزاوية العليا اليسرى) و-صور تمثيلية معاد تشكيلها مقطعة باستخدام تقنية التصوير المجهري التداخلي. دخلت S. aureus طبقة الخلايا الحية (أسفل SC) في الفئران التي تلقت محلول قاعدي (pH 10.3). السهم الوردي يمثل S. aureus. البيانات تمثل على الأقل ثلاث تجارب مستقلة (b، d، f، h-j). مقياس الرسم، تُعرض البيانات كمتوسط SEM (س). *** تحليل التباين الأحادي مع اختبار مقارنة دانييت (h). يتم توفير بيانات المصدر كملف بيانات المصدر. تصوير الحبل الشوكي من B6.VmCالفئران التي تلقت MC903 و VFPlabeled. الذهبية. وجدنا أن الملقحةتضاعف S. aureus أفقيًا في أسفل منطقة SC-pH العلوية القريبة من الحيادية (الشكل 5f). علاوة على ذلك، وجدنا أن تضاعف S. aureus كان أكثر كبحًا في الظروف الحمضية مقارنةً بالظروف المحايدة أو القلوية في المختبر (الشكل التكميلية 4g). بشكل جماعي، تشير هذه النتائج إلى أن أسفل منطقة SC-pH العلوية القريبة من الحيادية تعمل كموطن لـاستعمار المكورات العنقودية الذهبية.
نظرًا لأن منطقة SC-pH المتوسطة الحمضية لم تظهر أي إشارات لـ S. aureus، قمنا بعد ذلك بفحص تأثير الحموضة في منطقة SCpH المتوسطة. بعد أن طبقنا MC903 على آذان B6.VmCتم تطبيق بكتيريا S. aureus المعلمة بـ VFP على الفئران لمدة 7 أيام (الأيام 1-7) في اليوم الثامن، وتم استخدام محاليل ذات pH مختلف مرة واحدة يوميًا في الأيام (أربعة أيام) إلى الأذنين، وتم تحليلها في اليوم 13 (الشكل 5 ج). B6.VmCأظهرت الفئران التي تلقت محلولاً بتركيز pH 10.3 التهاباً جلدياً معززاً، مما أدى إلى ظهور جلد الأذن أكثر سمكاً بشكل ملحوظ مقارنة بالفئران التي تلقت محلول pH 6.6 (الشكل 5h). كشفت التصوير الحي لـ S. aureus وتوزيع SC-pH أنه بينما في الفئران التي تلقت محلول pH 6.6تم استعمار S. aureus أفقيًا في أسفل منطقة SC-pH العلوية تقريبًا المحايدة، حيث قامت تطبيقات محلول pH 10.3 بتحييد المناطق الوسطى من SC-pH، مما مكن S. aureus من الدخول إلى المناطق الوسطى أو السفلية من SC-pH (الشكل 5i) وحتى إلى SG (طبقة الخلايا الحية) (الشكل 5j والشكل التكميلية 4h والفيلم التكميلية 6). وبالتالي، تشير هذه النتائج إلى أن منطقة SC-pH الحمضية الوسطى هي طبقة الحماية الحمضية التي تعمل كحاجز واقي ضد S. aureus.
توفر ثلاث مناطق SC-pH خطوة بخطوة أساسًا منطقيًا لتنشيط البروتياز بشكل متحكم فيه
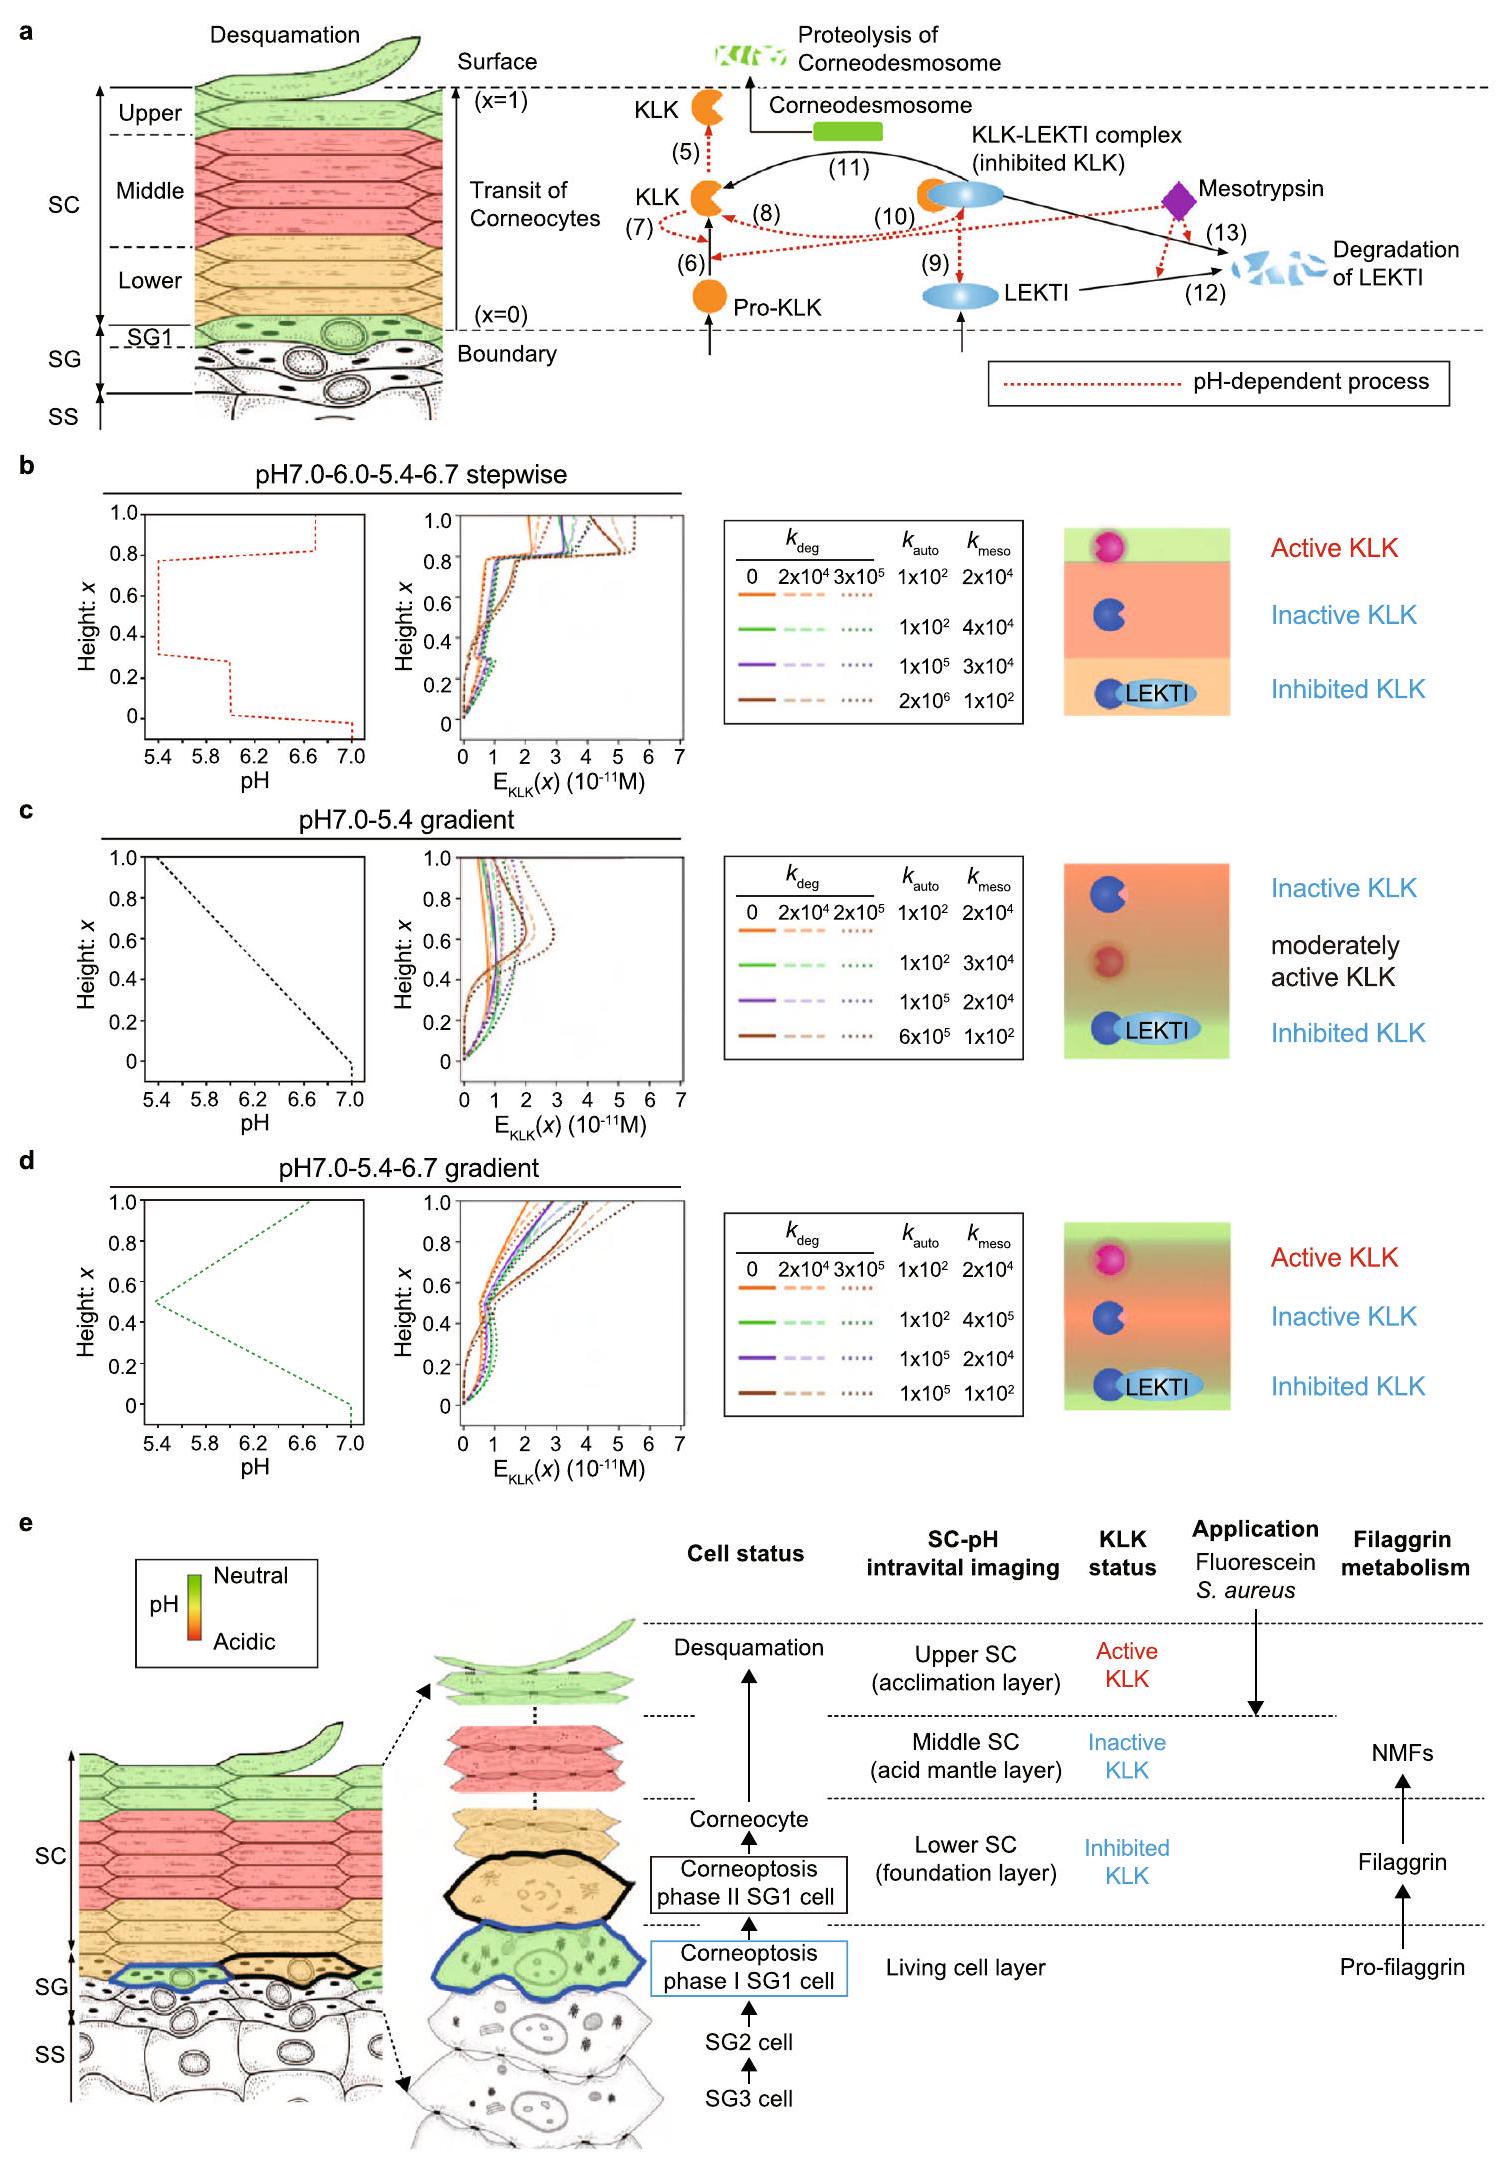
يتم الحفاظ على سمك الطبقة القرنية من خلال التخلص المستمر من طبقة الخلايا القرنية الخارجية عبر عملية تُعرف بالتقشر.يتم تنفيذ التقشر من خلال تحلل الكورنيوديسموسومات (المعنية بالتلاصق بين الكورنيوسيت) بواسطة أحد أعضاء عائلة الببتيداز المرتبطة بالكاليكريين (KLK).تم اعتبار ملف تعريف الرقم الهيدروجيني للطبقة القرنية لتنظيم النشاط التحفيزي لإنزيمات KLKs وضمان حدوث التقشر في الموقع المناسب في. في الظروف العادية، يسمح الرقم الهيدروجيني المحايد في الطبقة السفلية من SC لمثبط كازال من نوع اللمفوي الظهاري (LEKTI) بتعطيل KLKs (KLK5 و KLK7 و KLK14)؛ ومع ذلك، فإن الظروف الحمضية في الطبقة العليا تمنع LEKTI، مما يسمح لـ KLKs بالعمل وتعزيز تقشير الجلد.. هنا، كشفنا عن ملف تعريف تدريجي للرقم الهيدروجيني بقيم pH تبلغ , 5.4 و 6.7 (نموذج pH7.0_6.0_5.4_6.7) في الطبقات SG1 و SC السفلي و SC الأوسط و SC العلوي، على التوالي. لتوضيح الأهمية البيولوجية لهذا الملف التدريجي للرقم الهيدروجيني، قمنا ببناء نموذج رياضي لفهم تنظيم النشاط التحفيزي الفعال لـ KLK في SCs مع ملفات تعريف pH مختلفة. قمنا بنمذجة العمليات المعتمدة على الرقم الهيدروجيني (i) التنشيط من pro-KLKs إلى KLKs النشطة، (ii) تثبيط KLKs النشطة بواسطة LEKTI، (iii) تحلل LEKTI، و (iv) التحلل البروتيني بواسطة KLKs النشطة (الشكل 6a) (انظر الطرق).
أعاد ملف تعريف SC-pH التدريجي إنتاج الزيادة في النشاط التحفيزي الفعال لـ KLK تجاه سطح SC، مما يشير إلى
ضرورة وجود منطقة SC-pH محايدة علوية على سطح SC للتقشير (الشكل 6b). مقارنةً بنموذج pH7.0_6.0_5.4_6.7 التدريجي، أظهر نموذج التدرج pH7.0_5.4 نشاط KLK التحفيزي الفعال المتناقص تجاه سطح SC (الشكل 6c). لم يتمكن هذا الملف التدريجي من إنتاج البيئة الدقيقة المطلوبة لتنفيذ التقشير على سطح SC. بالإضافة إلى ذلك، أظهر نموذج التدرج pH 7.0_5.4_6.7 زيادة مبكرة في نشاط KLK من SC الأوسط ولكن زيادة أبطأ في نشاط KLK في SC العلوي عند مقارنته بنموذج pH7.0_6.0_5.4_6.7 التدريجي. تشير هذه الملاحظة إلى أن الملف التدريجي للرقم الهيدروجيني أكثر ملاءمة لتعديل تشغيل وإيقاف نشاط KLK التحفيزي في منطقة SC-pH المحايدة العلوية (الشكل 6d).
قمنا أيضًا بمحاكاة تأثير النشاط التحفيزي الفعال لـ KLK على ملفات تعريف SC-pH المعطلة، نماذج pH 5.4 الموحد و pH 7.0 الموحد. فشل نموذج pH5.4 الموحد في زيادة النشاط التحفيزي الفعال لـ KLK في جميع أنحاء منطقة SC (الشكل التكميلي 6c) بسبب الرقم الهيدروجيني المنخفض الذي لا يمكنه استغلال النشاط المحتمل لـ KLK مقارنةً بنموذج pH7.0_6.0_5.4_6.7 التدريجي ولم يتمكن من بدء التقشير على سطح SC. على النقيض من ذلك، أدى نموذج pH 7.0 الموحد إلى زيادة مفاجئة في النشاط التحفيزي الفعال لـ KLK في النصف السفلي من SC بسبب الرقم الهيدروجيني العالي الذي يستغل بالكامل النشاط المحتمل لـ KLK في هذه المنطقة (الشكل التكميلي 6c). قد يؤدي النشاط التحفيزي الفعال العالي لـ KLK إلى بدء التقشير حتى في النصف السفلي من SC، مما يؤدي إلى نمط جلد غير طبيعي. تشير هذه النتائج إلى الضرورة البيولوجية لوجود عدة مناطق بمستويات pH مختلفة في SC، كما هو الحال في نموذج pH7.0_6.0_5.4_6.7 التدريجي.
أخيرًا، قمنا بفحص تأثير تثبيط نشاط KLK التحفيزي في منطقة SC-pH العلوية على التقشير في الجسم الحي. تم ذلك عن طريق تطبيق محلول عازل pH 3.5، الذي يثبط بشكل كبير النشاط التحفيزي لـ KLK الفأر مقارنةً بمحلول عازل pH 6.6، على أذن الفئران B6. VmC لمدة أربعة أيام متتالية (الشكل التكميلي 6d، e). الفئران التي تلقت محلول pH 3.5 حافظت على ثلاث مناطق SC-pH تدريجية؛ ومع ذلك، أظهرت سمكًا أكبر في SC مقارنة بالفئران التي تلقت محلول pH 6.6 (الشكل التكميلي 6e). تشير هذه النتائج إلى أن تثبيط نشاط KLK التحفيزي يؤدي إلى تثبيط التقشير، مما يعزز سمك SC. كانت هذه النتائج متوافقة مع نموذجنا الرياضي.
بشكل عام، تشير نتائج المحاكاة إلى أن المناطق الثلاثة التدريجية للرقم الهيدروجيني تحفز LEKTI للارتباط بـ KLKs لتثبيط نشاطها التحفيزي في منطقة SC-pH الحمضية المعتدلة السفلية. وهذا يسمح أيضًا لـ KLKs بالبقاء في حالة غير نشطة في منطقة SC-pH الحمضية المتوسطة وتنشيطها في منطقة SC-pH المحايدة تقريبًا العلوية لتنفيذ التقشير. علاوة على ذلك، تشير نتائجنا إلى أن الكيراتينوسيتات تخضع للتمايز، مما يؤدي إلى تطوير تقسيم ثلاثي للرقم الهيدروجيني، والذي يحافظ على سمك ووظيفة الحاجز لـ SC لإنتاج توازن SC (الشكل 6e).
نقاش
بينما درست الدراسات السابقة SC-pH باستخدام أدوات مقيدة إلى حد كبير لقياس الرقم الهيدروجيني خارج الخلية في SC (مثل تطبيق
إلكترود pH على الجلد)، قمنا بإجراء تصوير حي عالي الدقة للرقم الهيدروجيني داخل الخلايا في SC باستخدام وفئران VH148GmC . أظهرت نتائجنا أن SC يحتوي على ثلاث مناطق pH تدريجية متميزة (حمضية منخفضة-معتدلة [pH 6.0]، حمضية متوسطة [pH 5.4]، وعالية-محايدة تقريبًا [pH 6.7]). تم العثور على المناطق الثلاثة من SC-pH بشكل شائع عبر أجزاء مختلفة من الجسم، مما يعني
أنها تلعب دورًا في توازن SC. علاوة على ذلك، أظهر الرقم الهيدروجيني خارج الخلية في SC من الكورنيوسيتات باستخدام فئران B6.Display-VmC تقسيمًا ثلاثي المستويات، وكانت قيمة الرقم الهيدروجيني تتطابق مع الرقم الهيدروجيني داخل الخلايا. قد يكون التفسير المحتمل للاختلاف بين بياناتنا والدراسات السابقة هو أن الدراسة السابقة استخدمت طرقًا تؤدي إلى التهاب الجلد أو تذويب الخلايا بين الخلايا.
الشكل 6 | توفر ثلاث مناطق pH تدريجية بيئة ملائمة لتقشير SC. أ نظرة عامة على العمليات المعتمدة على الرقم الهيدروجيني المدرجة في نموذج رياضي لنشاط KLK التحفيزي في SC. تتحرك الكورنيوسيتات من حدود SG/SC نحو سطح SC عبر تجديد البشرة. يتم إطلاق pro-KLKs غير النشطة و LEKTI في حدود SC/SG من خلايا SG1. بعد ذلك، يتم تنشيط pro-KLKs إلى KLKs (شكل نشط) بواسطة KLKs وmesotrypsin. KLKs قادرة على تحلل الكورنيوديسموسومات عبر التحلل البروتيني، مما يبدأ التقشير. LEKTI تثبط النشاط التحفيزي لـ KLKs عن طريق تشكيل معقد KLK-LEKTI بشكل عكسي، مما يعطل KLK. يقوم mesotrypsin بتحلل LEKTI في معقد KLK-LEKTI
. الأرقام في الشكل تتوافق مع معادلات النموذج. تمثل الخطوط الحمراء المتقطعة العملية المعتمدة على الرقم الهيدروجيني. ملفات تعريف النشاط التحفيزي الفعال لـ KLK , المعلمات، ومخطط لـ KLK و LEKTI في نموذج pH7.0_6.0_5.4_6.7 التدريجي، (ج) نموذج التدرج pH 7.0_5.4، و (د) نموذج التدرج pH7.0_5.4_6.7. هـ. مخطط وملخص لوظيفة ثلاث مناطق SC-pH التدريجية. تم تعديل صورة SC و SG (يمين) في الشكل 6e بإذن من مطبعة جامعة أكسفورد: المناعة الدولية “تشريح تشكيل وبنية ووظيفة الحاجز للطبقة القرنية” بواسطة ماتسوي تي وآخرون. حقوق الطبع والنشر 2015.
dهن في , كلاهما يمكن أن يؤثر على SC-pH، بينما كان تصويرنا الحي غير جراحي.
تتواجد بروتينات البروتياز المختلفة في جميع أنحاء ؛ ومع ذلك، أكدنا أن كل من بروتينات Venus-mCherry/VenusH148G-mCherry ظلت موجودة بكثرة في طبقة SC. استنادًا إلى هذه الأدلة وخصائص التكيف مثل SC العلوي، قمنا بقياس التغيرات في الفلورية في Venus و mCherry بنجاح من خلال تطبيق محاليل pH المختلفة على مناطق SC العلوية. تشير هذه النتائج إلى أن التعبير عن بروتينات مجس pH النسبية في خلايا SG1 ودمجها في الكورنيوسيتات هي طرق مفيدة لقياس وتصوير SC-pH.
يتكون SC من طبقات من الكورنيوسيتات مع مساحات بين الخلايا مختومة بهياكل دهنية لاميلارية (نموذج “الطوب والملاط”). لقد أعاقت عدم قابلية الذوبان في SC التحليل الشامل، واعتُبر SC حاجزًا متجانسًا . ومع ذلك، باستخدام المجهر الإلكتروني المناعي للفيلاجرين، يمكن تقسيم SC إلى SC السفلي مع الفيلاجرين و SC العلوي بدون فيلاجرين . علاوة على ذلك، أظهر المجهر الإلكتروني الماسح لـ SC أن SC السفلي يتورم عند نقعه في الماء، مما يشكل إدراجات مائية ضخمة بين طبقات الخلايا المجاورة. على النقيض من ذلك، يبقى SC الأوسط تقريبًا غير متأثر بالإجهاد المائي ويحافظ على سمكه. كما يتورم SC العلوي بشكل كبير، مما يؤدي إلى تفكيك تعبئة الألياف داخل الخلايا. تشير هذه النتائج إلى أنه يمكن تقسيم SC إلى ثلاث مناطق متميزة بناءً على قدرتها على اختراق الماء والارتباط.بالإضافة إلى ذلك، كشفت دراستنا السابقة التي أجريت باستخدام TOFSIMS، والتي تتيح تصور توزيع المواد الطبيعية دون استخدام طرق التلوين، أن الأرجينين، وهو مكون رئيسي من عوامل الترطيب الطبيعية المشتقة من الفيلاغرين، كان مركزًا في الطبقة الوسطى من الطبقة القرنية، مما يشير إلى أن هذه الطبقة تلعب دورًا رئيسيًا في ترطيب الجلد.أظهر اختبار النقع في الدراسة أن الطبقة العليا من البشرة تسمح بدخول وخروج أيونات المعادن المختلفة، بينما أظهرت الطبقات الوسطى والسفلى خصائص حواجز مميزة. من خلال صبغ الفيلاغرين باستخدام المناعية الفلورية وتصوير pH البشرة الحي باستخدام STELLA 650 المحتوي على ماء ميلي-كيو، لاحظنا وجود الفيلاغرين وفلورية STELLA 650 في منطقة pH السفلى من البشرة ومنطقة pH العليا من البشرة، على التوالي. تشير هذه النتائج إلى أن المناطق الثلاث التي تم ملاحظتها بواسطة TOF-SIMS تت correspond إلى ثلاث مناطق pH للبشرة. وبالتالي، فإن البشرة ليست طبقة بسيطة أحادية، بل تتمايز إلى ثلاث طبقات محددة بوضوح، حيث يعتبر pH منظمًا رئيسيًا لهذه العملية.
ليس من الواضح كيف يتم تغيير تنظيم الرقم الهيدروجيني في الخلايا الجذعية، مما يؤدي إلى تطوير ثلاث مناطق من الرقم الهيدروجيني في الخلايا الجذعية. أظهرت دراسة حديثة للبروتينات أن ببتيدات ATPase من النوع الفجوي (التي تضخ البروتونات عبر الأغشية البلازمية باستخدام طاقة تحلل ATP) تم اكتشافها من عينات الخلايا الجذعية.. ومع ذلك، لا توجد الميتوكوندريا في الخلايا القرنية، ولا يحدث تخليق ATP عن طريق الفسفرة التأكسدية في الطبقة القرنية. وبالتالي، فإنه من غير الواضح ما إذا كان ATPase من النوع الفجوي نشطًا في الطبقة القرنية ويلعب دورًا في الحفاظ على درجة حموضة الطبقة القرنية. كشفت المجهرية الإلكترونية بالتبريد (cryo-EM) أن تنظيم صفائح الدهون يتغير بشكل جذري في الفجوات بين الخلايا الأولى والخامسة من الطبقة القرنية: (1) نمط شريط واحد مع تكرارية 2.0-2.5 نانومتر، و(2) نمط شريطان معالدوريةنظرًا لأن الرقم الهيدروجيني الأمثل لإنزيمات استقلاب الدهون هو حمضي، نفترض أن إنزيمات استقلاب الدهون قد تساهم في تشكيل تنظيم صفائح الدهون وبالتالي تنظيم الرقم الهيدروجيني للطبقة القرنية.
نظرًا لأن منطقة SC-pH العليا لديها قدرة مشابهة للتكيف وتقوم بضبط درجة الحموضة الخاصة بها بشكل سلبي وفقًا للبيئة الخارجية، وأن ميكروبيوتا الجلد تتواجد على سطح SC، فقد افترضنا أن ميكروبيوتا الجلد تؤثر على درجة الحموضة في منطقة SC-pH العليا. في الواقع، وجدنا أن الفئران الخالية من الجراثيم كانت لديها منطقة SC-pH العليا أكثر حموضة قليلاً من الفئران المحمية من الجراثيم، مما يشير إلى أن ميكروبيوتا الجلد تساهم في تحييد منطقة SC-pH العليا. ومن الجدير بالذكر أن S. aureus كانت تتواجد في ظروف مستقرة واستعمرت السطح السفلي لمنطقة SC-pH العليا في ظروف التهابية. كشفت نتائج اختبار تكاثر S. aureus في المختبر أن S. aureus تفضل بيئة محايدة على الظروف الحمضية. مشابهة لـ S. aureus، تزدهر معظم البكتيريا في مستويات درجة حموضة محايدة (بشكل مثالي عند درجة حموضة 7.0)، ويمكن أن يؤدي الانحراف عن هذه القيم المثلى لدرجة الحموضة إلى تقليل معدل نموها بحواليوبالتالي، قد تعمل السطح السفلي لمنطقة SC-pH العليا كموطن لتكاثر مسببات الأمراض. علاوة على ذلك، وجدنا أن S. aureus لا تزال قادرة على التكاثر عند pH 5.4، وهو قيمة pH لمنطقة SC-pH المتوسطة الحموضة، على الرغم من عدم وجود إشارات لـ S. aureus. استنادًا إلى هذه النتائج، نفترض أن منطقة SC-pH المتوسطة الحموضة لا يمكنها فقط قمع تكاثر S. aureus، ولكنها أيضًا تحافظ على السلامة الهيكلية و/أو إنتاج الببتيدات المضادة للميكروبات لتحقيق وظيفة الحاجز.
الطبقة القرنية فريدة من نوعها حيث يمكنها الحفاظ على التوازن الداخلي والتمايز إلى ثلاث مناطق من الطبقة القرنية حسب درجة الحموضة، على الرغم من أنها تتكون من خلايا كيراتينية ميتة. الأمراض الجلدية الالتهابية، مثل الصدفية، تؤدي إلى تطور خلايا كيراتينية نواة في الطبقة القرنية (تسمى باراكراتوز) وطبقة قرنية أكثر سمكًا (تسمى أكانتوز) مقارنة بالجلد الصحي الطبيعي، مما يشير إلى خلل في توازن الطبقة القرنية. بالإضافة إلى ذلك، يظهر المرضى الذين يعانون من الإكزيما (مجموعة من الأمراض الجلدية الوراثية المتنوعة) طبقة قرنية سميكة وقشرية بشكل غير طبيعي. بعض الأفراد يظهرون زيادة في تنظيم الجينات المرتبطة بتمايز البشرة وانخفاض في تنظيم الجينات المرتبطة بمكونات الوصلات الضيقة، مما يدل على ضعف تمايز الطبقة القرنية.وبالتالي، فإن فك رموز الآليات الكامنة وراء توليد مناطق SC-pH المتدرجة وتنظيم SC-pH قد يوفر رؤى جديدة لتطوير استراتيجيات علاجية للأمراض الجلدية الالتهابية والسمكية.
طرق
فئران
تم الحصول على فئران C57BL/6 (B6) وفئران بلا شعر (HR) من شركة Japan SLC Inc. (هاماماتسو، اليابان). B6.Cldn1تم توفير الفئران من قبل الدكتور م. فوروستي (المعهد الوطني للعلوم الفسيولوجية، أوكازاكي، اليابان). B6.SASP (B6.EGFPتم إنتاج الفئران عن طريق دمج كاسيت EGFP-Neo في موضع جين SASP على الكروموسوم 6 في خلايا ES من خلفية B6 عبر إعادة التركيب المتماثل.لإنشاء B6.SASP (B6.VH148GmC ) الفئران، قمنا بتعديل متجه الإدخال لب6.SASP الفئران عن طريق استبدال cDNA EGFP-Neo بـ Venus-cDNA المCherry باستخدام pSK-VenusH148G-mCherry وCRISPR/Cas9. علاوة على ذلك، فينوس تم إرجاع الطفرة إلى النوع البري (G148 إلى V148) باستخدام التحوير بواسطة أوليغونيوكليوتيد عبر CRISPR/Cas9 لإنشاء B6.SASP (B6.VmC ) الفئران ( الشكل التوضيحي 1a). لإنشاء B6.SASP (B6.عرضفي الفئران، تم دمج كاسيت pDisplay-Venus-mCherry في موضع جين SASP على الكروموسوم 6 في خلايا ES من خلفية B6 عبر إعادة التركيب المتجانس. تم التعبير عن بروتين الاندماج Venus-mCherry من متجه التعبير الثديي pDisplay (Invitrogen) كان م fused في الطرف N إلى تسلسل قائد سلسلة الكلوبيولين المناعي الفأري Ig k، الذي يوجه البروتين إلى المسار الإفرازي، وفي الطرف C إلى مجال غشاء PDGFR، الذي يثبت البروتين في غشاء البلازما، معروضًا على الجانب الخارجي. B6.EGFP, B6.VH148GmC , B6.VmC ، و B6.Cldn1تم إعادة تهجين الفئران مع فئران HR لمدة لا تقل عن 10 أجيال لإنتاج، ، و الفئران، على التوالي.تم تزاوج الفئران مع VH148G mCherryفئران لتوليد Cldn1’/ VH148GmCherryفئران. فئران knockout الشرطي الخاص بالجلد Cldn-1 (B6.Cldn1تم الحصول على K14-CreERT من RIKEN LARGE (رقم الوصول CDB0803K)وتداخلت مع VH148GmCفئران لإنتاج B6.Cldn1 K14-CreERT VH148GmC الفئران. من أجل تحفيز حذف جين Cldn1 المحدد للبشرة، B6.Cldn1 K14-CreERT VH148GmC تم حقن الفئران بحقنة داخل البطن بجرعة 1 ملغ من التاموكسيفين لمدة 5 أيام، وتم استخدام الفئران في التجربة بعد تسعة أيام من آخر حقنة تاموكسيفين. لتوليدفئران، إعادة إنتاج خالية من الجراثيمتم إجراء التجربة على الفئران في مرافق الحيوانات الجنوبيوتية بجامعة كيو.تم الاحتفاظ بفئران GF في عوازل جنتوبيوتيك فردية حتى التحليل مع 12 ساعة من الضوءدورة مظلمة عند درجة حرارة مضبوطة ) ورطوبة ( ) مع الوصول المجاني إلى الماء المعقم ونظام غذائي قياسي مخبري معقم. بالنسبة للإيواء المشترك، تم إيواء الفئران SPF و GF في نفس القفص تحت ظروف SPF لمدة سبعة أيام. جميع الفئران باستثناء B6.VmC تم الحفاظ على فئران GF وتربيتها في مرافق حيوانية خالية من مسببات الأمراض في فرع ريكين في يوكوهاما أو كلية الطب بجامعة كيو مع 12 ساعة من الضوء.دورة مظلمة عند درجة حرارة مضبوطة ) ورطوبة ( ) مع الوصول المجاني إلى الماء ونظام غذائي قياسي من طعام المختبر (مرباة بواسطة سلالات). لم يتم اعتبار الجنس في هذه الدراسة. الفئران التي تتراوح أعمارها بين 3-6 أشهر (باستثناء Cldn1VH148GmCherryتم استخدام الفئران، التي تموت في غضون يوم واحد من الولادة، في جميع التجارب لأن خصائص الكورنيوبتوزيس لا تتغير في هذا النطاق..
معلومات الفئران المستخدمة في كل شكل هي كما يلي. الشكل 1: في الأشكال 1ب، 1 ذكر، و2 إناثتم تحليل الفئران في سن 16-27 أسبوعًا. في الأشكال 1c و d، ذكرين وأنثى واحدة.تم تحليل الفئران في سن 12-23 أسبوعًا. في الأشكال 1e-g، 3 ذكور وأنثى واحدةتم تحليل الفئران في سن 23-27 أسبوعًا. في الأشكال 1 هـ و i، تم عرض 2 ذكر و 1 أنثى من سلالة B6.تم تحليل الفئران في سن 20-27 أسبوعًا.
الشكل 2: في الأشكال 2أ، 2 ذكر و1 أنثىتم تحليل الفئران في سن 16-21 أسبوعًا. في الأشكال.ذكر واحد وأنثى واحدةتم تحليل الفئران في سن 12-15 أسبوعًا. في الأشكال 2e و f، تمثل 2 ذكر و 1 أنثى VH148GmCفئران في سن 19-22 أسبوعًا وذكرين وأنثى واحدة حديثة الولادة (عمرها يوم واحد) Cldn1VH148GmCherryتم تحليل الفئران. في الأشكال 2g، ذكر واحد واثنتان من الإناث من B6.Cldn1تم تحليل فئران K14-CreERT في سن 12-13 أسبوعًا.
الشكل 3: في الشكل 3أ، 3 ذكورتم تحليل الفئران في سن 13-21 أسبوعًا. في الأشكال 3ب-هـ، 2 ذكور و1 أنثىتم تحليل الفئران في سن 12-16 أسبوعًا.
الشكل 4: في الشكل 4أ، ب، ذكر واحد واثنتان من الإناث من B6.تم تحليل الفئران في سن 16-23 أسبوعًا. في الأشكال 4c-e، 3 ذكور من B6.VmC SPF، 3 ذكر B6.VmC GF، و 3 ذكور B6.تم تحليل الفئران السابقة للحبيبة في سن 20-23 أسبوعًا.
الشكل 5: في الأشكال 5ب، د، وف، 2 ذكور و1 أنثى من B6.تم تحليل الفئران في سن 12-19 أسبوعًا. في الشكل 5h، 24 ذكر من B6.VmCفئران SPF (4 ذكور B6).تم تحليل الفئران SPF في كل مجموعة) في عمر 20-23 أسبوعًا. في الأشكال 5i، 6 ذكر B6.VmCفئران SPF (3 ذكر B6.VmCتم تحليل فئران SPF في كلا المجموعتين في سن 20-23 أسبوع. في الأشكال 5j و 3 ذكر B6. VmCتم تحليل فئران SPF في سن 20-23 أسبوعًا. الشكل التكميلي 1: في الشكل التكميلي 1ب، 1د، و1ف، تم اشتقاق خلايا SG1 من ذكرين وأنثى واحدةتم تحليل الفئران في سن 18-22 أسبوعًا. في الشكل التوضيحي 1c و1e و1g، تم اشتقاق خلايا SG1 من 3 ذكور VH148GmC.تم تحليل الفئران في سن 12-14 أسبوعًا. الشكل التكميلي 2: في الشكل التكميلي 2a-c، ذكران وأنثى واحدة من VH148GmCتم تحليل الفئران في سن 12-22 أسبوعًا. في الأشكال 2d و e، تمثل 1 ذكر و 2 أنثى.تم تحليل الفئران في سن 14-23 أسبوعًا. الشكل التكميلي 3: في الشكل التكميلي 3أ و 3ب، 2 ذكر و 1 أنثى في سن 12-20 أسبوعًافأران وذكر واحد واثنتان من الإناثتم تحليل الفئران في سن 14-23 أسبوعًا. في الشكل التكميلي 3c، 3 ذكور من VH148GmCتم تحليل الفئران في سن 12-20 أسبوعًا. في الشكل التكميلية 3d و e، تم استخدام ذكر واحد واثنتين من الإناث من B6.Cldn1فئران K14-CreERT في سن 12-13 أسبوعًا وذكرين وأنثى واحدةالفئران في سنتم تحليل الأسابيع. في الشكل التكميلي 3f، ذكر واحد واثنتان من الإناث من B6.Cldn1تم تحليل فئران K14-CreERT في سن 12-13 أسبوعًا. الشكل التكميلي 4: في الشكل التكميلي 4b، 2 ذكر و 1 أنثى من B6.VmCتم تحليل الفئران في سن 12-19 أسبوعًا. في الشكل التكميلية.ذكر وامرأتانفئران (ذكران و أنثى واحدة من نوع B6).تم تحليل فئران SPF في كلا المجموعتين في سن 12-19 أسبوعًا. الشكل التوضيحي الإضافي 6: في الشكل التوضيحي الإضافي 6e و f، 2 ذكر و 1 أنثىتم تحليل الفئران في سن 20-23 أسبوعًا.
معايرة الرقم الهيدروجيني باستخدام خلايا SG1 المعزولة
تم عزل خلايا SG1 من جلد الظهر لـ و VH148GmC الفئران، كما تم وصفها سابقًا، مع بعض التعديلاتباختصار، تم تخدير الفئران عن طريق الحقن داخل البطن بمزيج من ميديتوميدين-ميدازولام-بوتورفانول (MMB) ). بعد ذلك، تم حقن السم exfoliative المأشوب-A (ETA) المذاب في محلول ملحي مخفف بالفوسفات (PBS) يحتوي على 1 مللي مول من CaCl 2 في جلد الظهر لـ و الفئران والفئران الموضوعة في لمدة 60 دقيقة. تم بعد ذلك تقشير ورقة ETA، التي تتكون من SG1/2/SC، ميكانيكياً من الجلد. بعد 5 دقائق من معالجة التربسين، تم الحصول على خلايا SG1 الإيجابية لـ Venus-mCherry وخلايا SG2 السلبية لـ Venus-mCherry المشتقة من VmC.ورقة ETA للفأر أو خلايا SG1 الإيجابية لـ VenusH148G-mCherry وخلايا SG2 السلبية لـ VenusH148G-mCherry المشتقة من VH148GmCتم وضع ورقة ETA للفأر في محاليل ذات قيم pH مختلفة )، مع النيجرسين ( ) وفالينوميسين ( ) (كلاهما FUJIFILM Wako Pure Chemical Co.، أوساكا، اليابان). كانت المحاليل العازلة تتكون من 50 مليمول من العازلة عند درجة حموضة 150 مليمول من NaCl. تم استخدام محاليل الأسيتات والفوسفات لضبط قيم درجة الحموضة إلى و 5.8-8.0، على التوالي. تم تحديد شدة الفلورية لبروتينات فينوس، فينوسH148G، وmCherry في خلايا SG1 باستخدام عدسة هدف غمر HC PL APO CS2 63x/NA 1.40 على ميكروسكوب تيس SP8 المقلوب (لايكا ميكروسستمز، ويتزلار، ألمانيا). أتم استخدام فلتر الانبعاث للكشف عن فلوريسcence الزهرة أو VenusH148G عند التحفيز بـليزر OPSL، وتم استخدام فلتر الانبعاث لفلورية المCherry عند التحفيز بـليزر OPSL. للحصول على الصورة،تم مسح الطائرات بدقة 361 نانومتر لكل بكسل بسرعة 400 هرتز باستخدام ليزر تم ضبط قوته على (i)لزهرة ولـ mCherry أو (ii)لزهرة ولـ mCherry لخلايا SG1 منالفئران و (iii)لـ VenusH148G ولـ mCherry أو (iv)لزهرة ولـ mCherry لخلايا SG1 من VH148GmCفئران. صور في مستوى X-Y (30) معتم إنشاء المسافات لكلطائرة.
تم تحليل الصور باستخدام فيجي [الصورة]، المعاهد الوطنية للصحة (NIH)، بيثيسدا، ماريلاند، الولايات المتحدة الأمريكية]. تم عرض صور خلايا SG1 باستخدام نص “MAX intensity”. تم تحديد ثلاثين خلية SG1 بواسطة منطقة الاهتمام (ROI)، وتم قياس متوسط كثافاتها باستخدام مدير منطقة الاهتمام. تم قياس كثافة الخلفية بطريقة مماثلة. تم حساب التغيرات في كثافة الفلورسنت كمتوسط كثافة منطقة الاهتمام ناقص كثافة الخلفية لكل صورة. فينوس/ميري تشيري وفينوستم ملاءمة نسب فلورية mCherry والنسب النسبية عند قيم pH المختلفة إلى نموذج انحدار غير خطي على شكل سيغمويد باستخدام برنامج GraphPad Prism 9.
تصوير pH داخل الجسم باستخدام SC (تصوير الشرائح X وY وZ) تم إجراء التصوير الحي للفئران كما هو موصوف سابقًا، مع بعض التعديلات.باختصار، تم تخدير الفئران عن طريق الحقن داخل البطن بمزيج من ميديتوميدين-ميدازولام-بوتورفانول (MMB) (0.75:4:5). تم لصق عينات من جلد الظهر والبطن والأذن والذيل وكف اليد من الفئران على زجاج ميكرو.سمك، C4050HT؛ شركة ماتسunami للزجاج، أوساكا، اليابان) تحتوي على عينة من ماء ميلي-كيو، ماء ميلي-كيو مع STELLAFluor 650 خالي من COOH (Goryo Chemical، سابورو، اليابان)، أو محاليل عازلة بقيم pH مختلفة (4.1-8.0). ثم تم تثبيتها على منصة مسخنة (TPi-SQH26؛ توكاي هيت، فوجينوميا، اليابان) عند تم الحصول على الصور باستخدام عدسة مكبرة HC PL APO CS2 63x/NA 1.40 أو HC PL APO CS2 100x/NA 1.40 باستخدام عدسة غمر مع ميكروسكوب تداخل ضوئي مقلوب TCS SP8 (لايكا للميكروسكوبات).تم استخدام فلتر الانبعاث للكشف عن إشارات هوشت 33342 عند التحفيز باستخدامليزر ديود.تم استخدام فلتر الانبعاث لكوكب الزهرة وكوكب الزهرةالكشف عند التحفيز باستخدام ليزر OPSL بطول موجي 488 نانومتر، وتم استخدام فلتر الانبعاث للكشف عن mCherry عند التحفيز باستخدامليزر OPSL. للحصول على صور بتكبير منخفض،تم مسح الطائرات بدقة 91 نانومتر لكل بكسل، مع وجود تباعد Z بين الشرائحللحصول على صور عالية التكبير،تم مسح مستويات X-Y الفردية بدقة 45 نانومتر لكل بكسل. تم ضبط قوة الليزر على (i)لزهرة ولـ mCherry (البطن، الأصابع، والجلد) أو (ii)لزهرة ولـ mCherry (جلد الظهر والأذن) لالتقاط الصور لـفئران، (iii)لـ VenusH148G ولـ mCherry لالتقاط الصور لـ VH148GmCكلد ن 1VH148GmCherry، و B6.Cldn K14-CreERT VmC الفئران، و (iv)لزهرة ولـ mCherry لالتقاط الصور لـ B6.Display-الفئران. في بعض التجارب،محلول ملحي يحتوي علىتم حقن Hoechst 33342 في الماء المقطر تحت الجلد في جلد الظهر لـالفئران قبل 24 ساعة من التصوير.
لكشف بكتيريا المكورات العنقودية الذهبية المعلمة بالفلوريسنت في الأذن الخارجية للفئران،تم تلقيح الفئران بالبكتيريا ثم تم تخديرها على وسادة تدفئة عبر حقن داخل البطن لمزيج MMB (0.75:4:5) أو مزيج من البنتوباربيتال داخل البطن.حقن واستنشاق الإيزوفلورين. تم وضع الفئران في صندوق مغلق مصنوع من راتنج الأكريلونيتريل-ستايرين مع صمامات تهوية (للتخدير بالاستنشاق) ونافذة مراقبة مغطاة بزجاج ميكرو (C4050HT). تم لصق جلد الأذن بزجاج الميكرو. تم تصور الفلورية لكل من البكتيريا والفئران من خلال مجهر ليزر مسح ضوئي تداخلي FV3000 (أوليمبوس) مزود بعدسة موضوع UPLSAPO 60XS2 والإعدادات التالية: (1) مامتيرين: الإثارة، 405 نانومتر؛ الجمع، ; (2) الزهرة: إثارة، 514 نانومتر؛ جمع، ; و (3) mCherry: الإثارة، 594 نانومتر؛ الجمع، للحصول على الصورة،تم مسح الطائرات بدقةلكل بكسل، وكانت المسافة بين الشرائحتمت معالجة الصور باستخدام فيجي (ImageJ، NIH) وفوتوشوب 2023 (أدوبي، ماونتن فيو، كاليفورنيا، الولايات المتحدة الأمريكية).
قياسات SC-pH
نظرًا لأن نسبة الفلورية بين فينوس/مCherry تم تطبيعها إلى قيمتها المقابلة عند pH 8.0 (فينوس/مCherry النسبية)، فقد تداخلت منحنيات النسبة للفلورية النسبية بين فينوس/مCherry المقاسة تحت قوتين ليزريتين. تم أخذ عينات من جلد الظهر والبطن والأذن منتم تثبيت الفئران على زجاجة ميكرو (C4050HT) تحتوي على عينة من ماء ميلي-كيو أو محلول عازل pH 8.0. بعد ذلك، تم قياس شدة فلورية بروتين فينوس وmCherry باستخدام عدسة مكبرة HC PL APO CS2 63x/NA 1.40 في مجهر تيسير ضوئي مقلوب TCS SP8 (شركة لايكا للميكروسكوبات). مشابهًا لتصوير خلايا SG1 المعزولة،تم مسح الطائرات بدقة 361 نانومتر لكل بكسل بسرعة 400 هرتز. تم ضبط قوة الليزر على (i)لـ
فينوس ولـ mCherry (جلد البطن) أو (ii)لزهرة ولـ mCherry (جلد الظهر والأذن) لالتقاط الصور لـ أو (iii) لزهرة ولـ mCherry لالتقاط الصور لـ B 6. العرض-فئران. فرديتم الحصول على صور للطائرات. تم تحليل الصور باستخدام Fiji وتم تمييز خلايا Cornecoytes أو SG1 بواسطة ROI، وتم قياس متوسط كثافاتها باستخدام مدير ROI. نظرًا لأن منطقة SCpH العليا قادرة على التكيف، تم تطبيع نسبة الفلورسنت Venus/mCherry إلى نسبة Venus/mCherry في منطقة SC-pH العليا عند pH 8.0 للحصول على قيم Venus/mCherry النسبية. تم حساب SCpH عن طريق استبدال القيم النسبية لـ Venus/mCherry بالمنحنيات النسبية التي تم إنشاؤها باستخدام خلايا SG1 المعزولة.
تحليل الميكروسكوب الإلكتروني للبشرة
الجلود الظهرية لـتم تثبيت الفئران في الجلوتارالدهيد في محلول ملحي مخفف بالفوسفات بتركيز 0.1 م لمدة ساعتين. تم غسل العينات طوال الليل في في نفس المخزن ومضاف إليهأكسيد الأوزميوم الرباعي في محلول فوسفات 0.1 م لمدة ساعتين عندتم تجفيف العينات في سلسلة من الإيثانول المتدرج وتضمينها في TAAB EPON 812 (نيشين-إي إم، طوكيو، اليابان)، وتم قطع الأقسام أفقيًا. تم الحصول على الصور باستخدام مجهر إلكتروني مسح ميداني من نوع SU8220 (شركة هيتاشي للتقنيات العالية، طوكيو، اليابان) مع كاشف إلكترونات مرتدة YAG (5 كيلو فولت).
تلطيخ المناعة الفلورية
تم تضمين عينات جلد الفأر مباشرة في مركب درجة الحرارة المثلى للقطع (ساكورا فينيتيك، طوكيو، اليابان) وتجميدها عندتم تطبيق فيلم كاواموتو اللاصق (نوع كريوفيلم 2 C (9)؛ شركة SECTION-LAB المحدودة، يوكوهاما، اليابان) على السطح المقطوع المكشوف، وتم قطع العينات المجمدة إلى-أقسام سميكةدون تجفيف أو تثبيت، تم حجب المقاطع بـألبومين مصل البقر (سيغما ألدريتش، سانت لويس، ميزوري، الولايات المتحدة الأمريكية) في PBS عند لمدة 30 دقيقة، تم حضنها مع جسم مضاد مضاد للفيلاغرين (1:1000؛ Poly19058؛ BioLegend، سان دييغو، كاليفورنيا، الولايات المتحدة الأمريكية) في محلول الحجب في لمدة ساعة واحدة أو عند بين عشية وضحاها. تم غسل الأقسام مرتين بمحلول PBS، وتم تحضينها مع جسم مضاد ثانوي مضاد للأرنب من نوع IgG تم امتصاصه بشكل عالٍ، أليكسا فلور (1:1000؛ ثيرمو فيشر ساينتيفيك، وولثام، ماساتشوستس، الولايات المتحدة الأمريكية) في محلول الحجب عند لمدة 30 دقيقة، وغسلت مرتين بمحلول PBS. تم تثبيت الشرائح في وسط تثبيت الفلورسنت من Dako (Agilent Technologies، سانتا كلارا، كاليفورنيا، الولايات المتحدة الأمريكية) وتمت ملاحظتها تحت ميكروسكوب TCS SP8 المقلوب (Leica Microsystems). تم معالجة الصور باستخدام Fiji (ImageJ، NIH) وAdobe Photoshop (Adobe).
تحليل البقعة الغربية لخلية SC الفأرية
طبقة SC من جلد الظهر، و B6.Cldn1 K14-CreERT VH148GmC تم الحصول على الفئران من خلال تقنية إزالة الشريط (TS) باستخدام شرائط شريط D-Squame الكبيرة (Promotool, Inc.، شاتو، فرنسا). تم إجراء TS تسع مرات (لـ “ و فئران) أو سبعة (لـ B6.Cldn K14-CreERT VH148GmC الفئران) مرات، وفي كل مرة، تم الضغط على الشريط ضد الجلد لمدة 5 ثوانٍ مع ضغط موحد ( ) باستخدام جهاز ضغط D-Squame (Promotool, Inc.). تم نقع كل شريط في 1.8 مل من محلول يوريا (5 م يوريا / 2 م ثيو يوريا)، PBS، و 1 مللي مول من EDTA مضاف إليه خليط مثبطات البروتياز (Nacalai Tesque، طوكيو، اليابان) لمدة 5 دقائق. تم طرد المستخلصات في جهاز الطرد المركزي عند لمدة 10 دقائق عند، وتم تقدير تركيزات البروتينات في السائل الطافي باستخدام مجموعة قياس البروتين SensoLyte OPA بطريقة الفلورية (AnaSpec Inc.، فريمونت، كاليفورنيا، الولايات المتحدة الأمريكية). تم تغيير طبيعة السائل الطافي عند لمدة 5 دقائق في محلول لايملي (بايو راد، هيركوليس، كاليفورنيا، الولايات المتحدة الأمريكية) وتم فصل العينات المنكرة باستخدام محلول تريس/غليسين/ SDS. بعد التحليل الكهربائي، تم نقل البروتينات إلى غشاء PVDF (بايو راد). تم تحضين الأغشية لمدة 5 دقائق في درجة حرارة الغرفة ( ) في محلول حجب EveryBlot ثم مع تخفيف 1:1000 من مضاد GFP (598؛ MBL Life Science، سوني فيل، كاليفورنيا، الولايات المتحدة الأمريكية)، مضاد RFP (PM005؛ MBL Life Science)، 1:1000 تخفيف الأجسام المضادة المضادة للفيلاغرين (Poly19058؛ BioLegend)، أو تخفيف 1:100 من الأجسام المضادة الأولية المضادة للسايتوكيراتين 10 (LH2؛ سانتا كروز للتكنولوجيا الحيوية، دالاس، تكساس، الولايات المتحدة الأمريكية) فيتم الكشف عن المجمعات المناعية باستخدام الأجسام المضادة المضادة للأرانب أو الأجسام المضادة المضادة للفئران IgG، والأجسام المضادة الثانوية المرتبطة بإنزيم البيروكسيداز من الفجل، وركيزة Clarity Western ECL (جميعها من Bio-Rad)، ونظام تصوير iBright FL1500 (Thermo Fisher Scientific).
تطوير بروتين فلوري ملون يمكن تحفيزه بالأشعة البنفسجية مع بكتيريا المكورات العنقودية الذهبية
تم إنتاج S. aureus الذي يعبر عن mAmetrine عبر استبدال الأليل باستخدام بلازميد pRN112 كما تم وصفه سابقًا.باختصار، تم إدخال pRN112 إلى S. aureus MW2 عن طريق التحفيز الكهربائي، وتم زراعة الخلايا على أجار تود هيويت (TH) المحتوي على الكلورامفينيكول. ) للتعقيم الليلي في تم اختيار المستعمرات ونقلها إلى طبق جديد وتم حضنها عندلمدة يومين لاختيار دمج البلازميد في الكروموسوم. بالنسبة لفعاليات التداخل المزدوج، تم اختيار مستعمرات فردية وتم حضنها في وسط TH بدون مضادات حيوية مع التحريك فيتم تخفيف الثقافات بنسبة 1:1000 وزرعها لـ، مما أدى إلى 7 دورات تخفيف وزراعة. تم زراعة الثقافة النهائية على أجار TH يحتوي علىأنهدروتتراسيكلين وتم حضنه طوال الليل عندلاختيار الطفرات ذات التقاطع المزدوج. تم تحليل مستعمرات فردية حساسة للكلورامفينيكول عبر تفاعل البوليميراز المتسلسل (PCR) للتأكد من التكامل الصحيح.
زراعة البكتيريا والتلقيح
للتطعيم بسلالة MW2 من المكورات العنقودية الذهبية، تم زراعة العزلات البكتيرية في وسط تغذية الدماغ والقلب (بيكتون ديكنسون، فرانكلين ليكس، نيو جيرسي، الولايات المتحدة الأمريكية) طوال الليل وتم تعديلها لتكون تقريبًافيوسط. تعليقات بكتيرية (تم تطبيقها موضعياً على آذان الفئران SPF. بالنسبة لمنحنى نمو البكتيريا،تم إضافة عزل بكتيري مزروع في مرق الصويا التربتي (TSB) (بيكتون ديكنسون) طوال الليل إلىمن TSB المعدل pH وتم حضنه مع التحريك عندلتحديد معدل نمو البكتيريا، تم قياس OD (600 نانومتر) كل 15 دقيقة باستخدام جهاز Infinite 200Pro مع برنامج Tecan i-control (شركة تيكان اليابان المحدودة، كاواساكي، اليابان).
علاج بالمضادات الحيوية
B6.VmCتلقت الفئران كوكتيلًا من المضادات الحيوية يتكون من الميترونيدازول (سلفاميثوكسازول )، تريميثوبريم ( ) سيفاليكسين ( ) وبيتريل ( ) مذاب في مياه الشرب لمدة أسبوعين لتقليل الحمل الميكروبي على الجلد بايتريل هو إنروفلوكساسين، الذي يُعرف بشكل أفضل كمثبط لإنزيم الجيراز DNA في فئة المضادات الحيوية الفلوروكينولونية. لضمان تقليل العبء الميكروبي، تم تغيير الأقفاص ثلاث مرات أسبوعياً..
مرض التهاب الجلد التأتبي المشابه الناتج عن المواد الكيميائية
لإحداث حالة مشابهة لالتهاب الجلد باستخدام MC903، يتم معالجة آذان الفئران من نوع B6 WT التي تبلغ من العمر 8 أسابيع أو B6.تم علاج الفئران يوميًا بـ 1 نانومول MC903 (كالسيبوتريول، توكريس بيوساينس، بريستول، المملكة المتحدة) فيالإيثانول لمدة 7 أيام (الأيام 1-7). بعد يوم واحد من تطبيق MC903، تقريبًاتعليق بكتيري فيتم تطبيق الوسط موضعياً على صيوان الأذن. لتطبيق العازل المعدل pH،تم تطبيق 100 ملليمول من محلول فوسفات معدل الحموضة موضعياً على صيوان الأذن مرتين يومياً لمدة أربعة أيام. تم قياس سمك الأذن باستخدام ميكرومتر رقمي (ميتوتويو، كاواساكي، اليابان) في نهاية كل تجربة.
نشاط البروتياز
تم قياس نشاط الكاليكرين المرتبط بالببتيداز (KLK)5 (R&D Systems، مينيابوليس، MN، الولايات المتحدة الأمريكية) والميزوتريبسين (PRSS3) (R&D Systems) المذاب في محاليل ذات pH مختلفة (3.5-8.0) وفقًا لبروتوكول الشركة المصنعة. باختصار، تم إجراء اختبار نشاط KLK5 الموريني فيباستخدام محلول فوسفات الصوديوم بتركيز 50 مللي مولار (pH 5.8-8.0) أو 50 مللي مول من محلول الأسيتات ) يحتوي على فأر KLK5 وركيزة الببتيد الفلورية Boc-V-P-R-AMC (أنظمة R&D) عند التركيزات النهائية. بعد 30 دقيقة من الحضانة، تم قياس الفلورية عند طول موجة الإثارة/الإصدارباستخدام جهاز القراءة المتعددة العلامات PerkinElmer 2030. تم إجراء اختبار نشاط PRSS3 في الفئران في في محلول فوسفات الصوديوم بتركيز 50 مللي مولار ) أو 50 مللي مولار من محلول الأسيتات ( ) يحتوي على فأرة PRSS 3 وبروتين كازين BODIPY FL (ثيرمو فيشر ساينتيفيك). بعد تم قياس الفلورية عند طول موجة الإثارة/الإصدارباستخدام جهاز قراءة متعددة العلامات PerkinElmer 2030. لتحديد النشاط الإنزيمي النسبي لـ KLK5 و PRSS3 من الفئران، تم حساب النشاط الإنزيمي النسبي بناءً على الصيغة: (A-B)/، حيث التألق عند الإشارةالفلوريسcence بدون إنزيمات، وأقصى فلوريسنس تم الحصول عليه في الاختبار (أي pH 7.8 لـ KLK5 الفأري و pH 7.8 لـ PRSS3).
الإحصائيات
تُعبر البيانات عن المتوسطخطأ المعيار للمتوسط. تم مقارنة الفروق بين ثلاث مجموعات أو أكثر باستخدام تحليل التباين أحادي الاتجاه كروسكل واليس (ANOVA) تلاه اختبارات دان بعد ذلك، باستثناء الشكل 5h، حيث تم استخدام تحليل التباين أحادي الاتجاه مع اختبار المقارنة لدونيت. تم إجراء المقارنات الثنائية باستخدام اختبار مان-ويتني ثنائي الاتجاه. الفروق ذات الدلالة الإحصائية موضحة كما يلي:تم تقديم القيم المتوسطة للتكرارات البيولوجية الفردية في الشكل 1e، f، g، i، 2d، 3c، 4e، والشكل التكميلية 5e كبيانات تكميلية 1. تم استخدام GraphPad Prism 9 (برنامج GraphPad، بوسطن، ماساتشوستس، الولايات المتحدة الأمريكية) لإجراء التحليلات.
نموذج رياضي لنشاط KLK الحفزي في SC
نموذجنا الرياضي يصف بشكل صريح أربع عمليات تعتمد على الرقم الهيدروجيني (pH) تشارك في تنظيم تقشر الجلد بواسطة KLKs النشطة: (i) تنشيط البرو- KLKs إلى KLKs، (ii) تثبيط KLKs بواسطة LEKTI، (iii) تحلل مثبط كازال من النوع اللمفاوي (LEKTI)، و (iv) تحلل بروتينات الكورنيوديسموسوم بواسطة KLK. يتم تلخيص هذه العمليات في مخطط رسومي (الشكل 6a) وصيغتها باستخدام معادلات تفاضلية عادية. قمنا بتحديد وظائف النموذج والمعلمات من بيانات القياس ذات الصلة واستخدمنا النموذج المعتمد لمحاكاة النشاط التحفيزي لـ KLKs تحت ملفات SC-pH افتراضية مختلفة.
تطوير النموذج
“وصفنا ديناميات تركيزات البرو-كيه إل كيه ( )، KLKs ( LEKTI )، ومجمع KLK-LEKTI ( ) على ارتفاع في المحكمة العليا:
الجدول 1 | وظائف النموذج والمعلمات
رموز
تفسير
وحدات
درجة الحموضة عند الارتفاع (الشكل 6أ)
–
النشاط التحفيزي النسبي لـ KLKs عند كل pH ) إلى ذلك عند درجة حموضة مثالية تبلغ 7.8
–
النشاط التحفيزي النسبي للميزوتريبسين عند كل درجة حموضة ) إلى ذلك عند درجة حموضة مثالية تبلغ 7.8
–
تركيز الميسوتريبسين في SC
M
تركيز البرو-كيه إل كيه (حدود SG/SC)
M
تركيز LEKTI عند (حدود SG/SC)
M
ثابت معدل التنشيط الذاتي لـ pro-KLK
ثابت معدل تنشيط البرو-كيليك عبر الميسوتريسين
ثابت معدل الارتباط بين KLK و LEKTI إلى معقد KLK-LEKTI
ثابت معدل الانفصال لمركب KLK-LEKTI إلى KLK وLEKTI
ثابت معدل الإزالة لـ LEKTI عبر الميسوتريسين
معدل الانتقال للبروتينات KLKs، KLKs، LEKTI، ومجمع KLK-LEKTI من (حدود SG/SC) إلى (سطح SC)
KLK ببتيداز مرتبط بكاليكريين، LEKT1 مثبط مرتبط بنوع كازال اللمفاوي الظهاري. مع الشروط الأولية، ، و تُفرز بروتينات KLK وLEKTI في الفضاء خارج الخلوي بين الغدد اللعابية (SG) والطبقة القرنية (SC). ) عبر نظام الحبيبات اللاميلية، حيث يتم فصل LEKTI عن البرو-.
لا توجد مركبات KLKs أو KLK-LEKTI عند حدود SG/SC، ويتم تنشيط pro-KLKs إلى KLKs في SC. يتم تفصيل كل مصطلح من معادلات النموذج تحت “تنشيط pro-KLKs إلى KLKs”، ويتم تلخيص وظائف النموذج والمعلمات في الجدول 1 وتحت “تثبيط KLKs بواسطة LEKTI.” باستخدام هذا النموذج، قمنا بتقييم النشاط التحفيزي الفعال لـ KLKs عندكما
ما هي النشاط التحفيزي النسبي لـ KLKs عند كل درجة حموضة، مقارنةً بالنشاط عند المستوى الأمثل.
اشتقاق المعادلات التفاضلية العادية
تنشيط البرو-كيه إل كيه إلى كي إل كيه. يتم تحويل البرو-كيه إل كيه إلى كي إل كيه بواسطة كي إل كيه نفسها (تنشيط ذاتي) أو بواسطة بروتيازات أخرى مثل الميسوتريسين.قمنا بنمذجة عملية تنشيط KLK باستخدام المعادلات التالية:
أينيشير إلى الوقت الذي تستغرقه KLKs وLEKTI للوصول إلى الارتفاع (من وقت إفرازها عند حدود SG/SC ) عبر انتقال الخلايا القرنية. الـيعتمد علىوفقًا لملف pH (الشكل ). الأنشطة التحفيزية لـ KLKs والميزوتريبسين في كل و تُوصف الأنشطة النسبية عند مقارنتها بأقصى نشاط لها عند درجة حموضة مثالية (درجة حموضة 7.8). افترضنا أن الميسوتريبسين موجود بشكل كافٍ عبر كامل الطبقة القرنية لممارسة نشاطه التحفيزي لأن تأثير العوامل المحددة على توزيع الميسوتريبسين لم يتم الإبلاغ عنه بعد.
تثبيط KLKs بواسطة LEKTI. يقوم LEKTI بتثبيط النشاط التحفيزي لـ KLKs من خلال تشكيل معقد KLK-LEKTI بشكل عكسي مما يؤدي إلى تعطيله.
KLKs. لقد نمذجة هذه العملية لتكوين معقد KLK-LEKTI كالتالي:
كل من معدلات الارتباط والانفصال، و ، بالنسبة لمجمع KLK-LEKTI تعتمد على الرقم الهيدروجيني.
تحلل LEKTI. يقوم الميسوتريسين بتحلل LEKTI سواء بمفرده أو في مجمعات KLK-LEKTI.يتم نمذجة هذه العملية من تحلل LEKTI على النحو التالي:
لم نعتبر تدهور البرو-كيه إل كيه وكيه إل كيه لأن تأثير العوامل المحددة على تدهور البرو-كيه إل كيه وكيه إل كيه في الطبقة القرنية لم يتم الإبلاغ عنه بعد.
انتقال الخلايا القرنية من حدود طبقة الشوكة/الطبقة القرنية إلى سطح الطبقة القرنية. يحدث انتقال الخلايا القرنية من حدود طبقة الشوكة/الطبقة القرنية نحو سطح الطبقة القرنية عبر تجدد البشرة (الشكل 6أ). يجلب هذا الانتقال البرو-كيليك، وكيليك، وليكتي، ومجمع كيليك-ليكتي نحو سطح الطبقة القرنية. الوقت المطلوب لوصول البرو-كيليك وليكتي إلى الارتفاعمن إفرازهم عند حدود SG/SC ) تم تعريفه بواسطة
أينهو معدل النقل المستقل عن العمق لـ pro-KLKs و KLKs و LEKTI و KLK-LEKTI.
ديناميات البرو-كيه إل كيه، كي إل كيه، ليكتي، ومعقد كي إل كيه-ليكتي. تم وصف ديناميات تركيزات البرو-كيه إل كيه من خلال مجموعة من المعادلات (6) و(14):
تم الحصول على ديناميات تركيز KLK من خلال دمج المعادلات (7) و(8) و(11) و(14):
تم الحصول على ديناميات تركيز LEKTI من خلال دمج المعادلات (9) و(12) و(14):
تم الحصول على ديناميات تركيز مركب KLK-LEKTI من خلال دمج المعادلات (10) و(13) و(14):
معلمات النموذج وطريقة المحاكاة
قمنا باشتقاق القيم لأربعة معلمات،، ، و عن طريق ملاءمة المنحنى لبيانات التجارب المعملية (الشكل التوضيحي 5 أ-ج) وتلك لـ، و من الأدب.
استخدمنا ثلاثة ممثلينقيم، كل منها يتوافق مع أحد السيناريوهات الثلاثة: عدم تدهور LEKTI ( ) ، انخفاضات مستمرة في LEKTI ( )، واستنفاد كامل لـ LEKTI ( عند pH 7.05 .4 [تدرج] وعند pH 7.0_6.0_5.4_6.7 (خطوة بخطوة) و (تدرج). هذه السيناريوهات الثلاثة سمحت لنا باستنتاج آثار على نتائجنا لكامل النطاق منلكن المعلومات حول توزيع LEKTI كانت مفقودة.
حددنا نطاقات المعلمين المتبقيين. و من خلال تقييم قابلية تكرار التوزيع المكاني المتوقع لـ KLKs (المفصل أدناه تحت “معدلات تنشيط pro-KLK عبر التنشيط الذاتي ( ) وعبر الميسوتريبتسين ( )”). النشاط التحفيزي المعتمد على الرقم الهيدروجيني لـ KLK:لقد حصلنا على ملفعن طريق ملاءمة المنحنى للنشاط النسبي لـ KLK5 الفأري (وهو نوع فرعي تمثيلي من KLKs) عند قيم pH مختلفة (الشكل التكميلي 5a). كان النشاط النسبي هو نسبة النشاط التحفيزي لـ KLK5 المقاس عند كل pH إلى ذلك عند pH 7.8 (الأمثل)، وتم الحصول على قيم النشاط التحفيزي من معدلات التحلل لمادة الركيزة الببتيدية الفلورية Boc-V-P-R-AMC في المختبر. النشاط التحفيزي المعتمد على الرقم الهيدروجيني للميزوتريبسين:. حصلنا على ملف عن طريق ملاءمة المنحنى للنشاط النسبي للميزوتريسين الفأري عند قيم pH مختلفة (الشكل التوضيحي 5b). كان النشاط النسبي هو نسبة النشاط التحفيزي للميزوتريسين المقاس عند كل pH إلى ذلك عند pH 7.8 (الأمثل)، حيث تم الحصول على النشاط التحفيزي من معدلات التحلل لبوديبى FL كازين في المختبر. معدلات الارتباط والانفصال المعتمدة على الرقم الهيدروجيني: و قام ديرايزون وآخرون بقياس و عند عدة قيم pH باستخدام تحليل الرنين السطحي للبلازمون. تم استخدام قيمهم للحصول على ملفات و عبر ملاءمة المنحنيات (الشكل التوضيحي 5c).
التركيزات عند حدود SG/SC: و افترضنا قيمًا لـ و استنادًا إلى بيانات القياس المنشورة (الجدول 2).
تركيزات الميسوتريبسين:لقد أصلحنا الـالقيم أثناء الضبط و في محاكاتنا لأنيظهر فقط في أشكال أو في نموذجنا. اخترنا أن تكون من نفس ترتيب تركيزات KLKs الكلية. هذا أتاح لنا مقارنة مساهمات تفعيل KLK الذاتي مقابل تفعيل KLK بواسطة الميسوتريسين (. و من خلال مقارنة القيم لـ و .
معدلات الانتقال للبروتينات المساعدة لكيناز الكيرتين، كيناز الكيرتين، ليكتي، ومعقد كيناز الكيرتين-ليكتي في الطبقة القرنية:افترضنا أن البروتينات والخلايا القرنية لها نفس وقت العبور (الوقت الذي تستغرقه الخلايا القرنية للعبور من حدود طبقة الشوكة/ طبقة القرنية إلى سطح طبقة القرنية) في طبقة القرنية واعتنقناتم قياس وقت انتقال الخلايا القرنية في الفئران ليكون 5 أيامأياميوميوم.
ثابت معدل الإزالة بواسطة الميسوتريpsين لـ LEKTI:ديناميات التركيز الكلي لـ LEKTI تعتمد على لكنها مستقلة عن تنشيط KLK و )، كما هو موصوف من خلال مجموعة من المعادلات (17) و (18):
للحصول على قيم تمثيلية لـقمنا بإجراء محاكاة للنموذج باستخدامقيم من 0 إلىواختار قيمالتي تجعلانخفاض إلى (لا تدهور)، (انخفاض مستمر)، و (نضوب كامل) عند أي، ، أو 0.0001، على التوالي. لم يكن هناك تدهور، وانخفاضات مستمرة، واستنفاد كامل لـ LEKTI تتوافق مع ثلاثة توزيعات مكانية نموذجية لـ LEKTI عبر SC. ستتيح لنا هذه السيناريوهات الثلاثة استنتاج آثارعلى نتائجنا لكامل النطاق منلكن المعلومات حول التوزيع المكاني لـ LEKTI كانت مفقودة.
القيم المختارة منكانوا، و لـ (خطوة بخطوة)؛ ، و لـ (تدرج)؛ و ، و لـ pH 7357 (تدرج) (الشكل التوضيحي 5d). أكدنا أن محاكاة النموذج باستخدام هذهالقيم لم تظهر أي تدهور في LEKTI (الخطوط الصلبة في الشكل التكميلية 5e)، انخفاضات مستمرة في LEKTI (الخطوط المتقطعة)، أو استنفاد كامل لـ LEKTI (الخطوط المنقطة)، على التوالي.
معدلات تنشيط البرو-كيه إل كيه عبر التنشيط الذاتي ( ) وعبر الميسوتريبتسين ( ). لقد حددنا قيم و التي أعادت إنتاج الديناميات المتوقعة لتركيز KLKs الكليمن المتوقع أن تزداد في جميع أنحاء SC بسبب القرب الوثيق (الذي يشير إلى التفاعلات) بين البروتينات المؤيدة لـ KLKs والميزوتريسين في جميع أنحاء SC.يشير إلى أن تنشيط البرو-كيه إل كيه إلى كي إل كيه يحدث في جميع أنحاء الطبقة السطحية، حيث يوجد كي إل كيه المنشط إما بمفرده أو ضمن مجمعات كي إل كيه-ليكيتي. لإعادة إنتاج هذا السلوك المتوقع، اخترنا قيمًا من، و التي حددت ديناميات كما هو موصوف من خلال مجموعة من المعادلتين (16) و (18):
لاحظ أن دينامياتاعتمد على (المعادلة (2)). باستخدام قيممحدد (تحت “ثابت معدل الإزالة بواسطة الميسوتريpsين: )، قمنا بإجراء محاكاة للنموذج لقيم مختلفة من و (كلاهما من إلىلتحديد قيم أمثلة لـ و التي أعادت إنتاج الزيادات فيفي جميع أنحاء SC. قمنا بتقييم ما إذا كانت الزيادات فيفي النصف العلوي من SC (0.5 كانت قابلة للمقارنة ) لأولئك في النصف السفلي من SC ( ) وما إذا كانت زاد بشكل كبير (أكثر منمن، وهو الحد الأقصى للزيادة في طوال أي،
أين و . كشفت محاكاة نموذجنا أن قيمًا معينة من و استوفى الشروط في المعادلات (21) و (22) لكل القيمة (الشكل التوضيحي الإضافي 5f و 5g و 6a). وجدنا أن هناك أربع تركيبات من و القيم، التي تت corresponded إلى الحواف والوسط من المناطق المحددة للحالة في المعادلتين (21) و (22)، أظهرت زيادات مستمرة فيفي جميع أنحاء المحكمة العليا (الشكل التوضيحي الإضافي 6a). ومع ذلك، فإن تركيبات من و القيم التي لم تستوفِ الشروط في المعادلتين (21) و(22) فشلت في الزيادة (الشكل التوضيحي 6a) أو تم تنشيط معظم البرو-كي إل كيه في النصف السفلي من الحبل الشوكي، مما ترك فقط تنشيطًا ضئيلًا للبرو-كي إل كيه في النصف العلوي من الحبل الشوكي (الشكل التوضيحي 6a).
محاكاة النموذج. قمنا بمحاكاة النشاط التحفيزي لـ KLKs في SC الفأري باستخدام ملفات تعريف pH افتراضية (الشكل 6b-d) لتقييم الأهمية البيولوجية لملفات تعريف pH المتدرجة في SC الفأري. لاختبار ما إذا كانت نماذجنا ذات التدرجات المختلفة في pH يمكن أن تعيد إنتاج الزيادات فينحو سطح SC، قمنا بإجراء محاكاة لنطاق و القيم المحددة أعلاه (تحت “معدلات تنشيط البرو-كيه إل كيه عبر التنشيط الذاتي ( ) وعبر الميسوتريبتسين ( “) والقيم الثلاثة المثال لـ المحدد أعلاه (تحت “ثابت معدل الإزالة بواسطة الميسوتريpsين: ). قمنا بتقييم الزيادات في منإلى، أي، (الشكل التوضيحي 6ب). بالإضافة إلى ذلك، قمنا بمحاكاة النشاط التحفيزي لـ KLKs في نماذج موحدة عند pH 5.4 و pH 7.0، على التوالي (الشكل التوضيحي 6ج). لتفسير تأثير ملفات تعريف pH المقطوعة على توازن SC، قمنا بإجراء محاكاة لنموذجنا باستخدام ، و القيم ضمن نطاقات المعلمات المحددة أعلاه (تحت “معدلات تنشيط pro-KLK عبر التنشيط الذاتي ( ) وعبر الميسوتريبتسين ( )”) والقيم الثلاثة المثال لـالمحدد أعلاه (تحت “ثابت معدل الإزالة بواسطة الميسوتريpsin: ).
ملخص التقرير
معلومات إضافية حول تصميم البحث متاحة في ملخص تقارير مجموعة ناتشر المرتبط بهذه المقالة.
توفر البيانات
تم توفير البيانات الخام التي تم توليدها في هذه الدراسة لرسم الرسوم البيانية وبلوتات ويسترن غير المقطوعة في ملف بيانات المصدر. يتم توفير بيانات المصدر مع هذه الورقة.
Matsui, T. & Amagai, M. Dissecting the formation, structure and barrier function of the stratum corneum. Int. Immunol. 27, 269-280 (2015).
Kubo, A., Nagao, K. & Amagai, M. Epidermal barrier dysfunction and cutaneous sensitization in atopic diseases. J. Clin. Investig. 122, 440-447 (2012).
Alibardi, L. Adaptation to the land: The skin of reptiles in comparison to that of amphibians and endotherm amniotes. J. Exp. Zool. B Mol. Dev. Evol. 298, 12-41 (2003).
Eckhart, L., Ehrlich, F. & Tschachler, E. A stress response program at the origin of evolutionary innovation in the skin. Evol. Bioinform. Online 15, 1176934319862246 (2019).
Byrd, A. L., Belkaid, Y. & Segre, J. A. The human skin microbiome. Nat. Rev. Microbiol. 16, 143-155 (2018).
Nemes, Z. & Steinert, P. M. Bricks and mortar of the epidermal barrier. Exp. Mol. Med. 31, 5-19 (1999).
Brown, S. J. & McLean, W. H. One remarkable molecule: filaggrin. J. Invest. Dermatol. 132, 751-762 (2012).
Nováčková, A. et al. Acidic pH is required for the multilamellar assembly of skin barrier lipids in vitro. J. Invest. Dermatol. 141, 1915-1921.e1914 (2021).
Miyai, M. et al. Keratinocyte-specific mesotrypsin contributes to the desquamation process via kallikrein activation and LEKTI degradation. J. Invest. Dermatol. 134, 1665-1674 (2014).
Matsui T., et al. A unique mode of keratinocyte death requires intracellular acidification. Proc. Natl Acad. Sci. USA 118, e2020722118 (2021).
Simpson, C. L. et al. NIX initiates mitochondrial fragmentation via DRP1 to drive epidermal differentiation. Cell Rep. 34, 108689 (2021).
Ohman, H. & Vahlquist, A. In vivo studies concerning a pH gradient in human stratum corneum and upper epidermis. Acta Derm. Venereol. 74, 375-379 (1994).
Hanson, K. M. et al. Two-photon fluorescence lifetime imaging of the skin stratum corneum pH gradient. Biophys J. 83, 1682-1690 (2002).
Niesner, R. et al. 3D-resolved investigation of the pH gradient in artificial skin constructs by means of fluorescence lifetime imaging. Pharm. Res. 22, 1079-1087 (2005).
Nagao, K. et al. Stress-induced production of chemokines by hair follicles regulates the trafficking of dendritic cells in skin. Nat. Immunol. 13, 744-752 (2012).
Eberlein-König, B. et al. Skin surface pH, stratum corneum hydration, trans-epidermal water loss and skin roughness related to atopic eczema and skin dryness in a population of primary school children. Acta Derm. Venereol. 80, 188-191 (2000).
Elias, P. M. Stratum corneum acidification: how and why? Exp. Dermatol. 24, 179-180 (2015).
Elias, P. M. The how, why and clinical importance of stratum corneum acidification. Exp. Dermatol. 26, 999-1003 (2017).
Grice, E. A. et al. Topographical and temporal diversity of the human skin microbiome. Science 324, 1190-1192 (2009).
Grice, E. A. & Segre, J. A. The skin microbiome. Nat. Rev. Microbiol. 9, 244-253 (2011).
Fernández-Calviño, D. & Bååth, E. Growth response of the bacterial community to pH in soils differing in pH. FEMS Microbiol. Ecol. 73, 149-156 (2010).
Nagai, T. et al. A variant of yellow fluorescent protein with fast and efficient maturation for cell-biological applications. Nat. Biotechnol. 20, 87-90 (2002).
Tojima, T. et al. Attractive axon guidance involves asymmetric membrane transport and exocytosis in the growth cone. Nat. Neurosci. 10, 58-66 (2007).
Matsui, T. et al. SASPase regulates stratum corneum hydration through profilaggrin-to-filaggrin processing. EMBO Mol. Med. 3, 320-333 (2011).
Jayaraman, S., Haggie, P., Wachter, R. M., Remington, S. J. & Verkman, A. S. Mechanism and cellular applications of a green fluorescent protein-based halide sensor. J. Biol. Chem. 275, 6047-6050 (2000).
Manabe, M., Sanchez, M., Sun, T. T. & Dale, B. A. Interaction of filaggrin with keratin filaments during advanced stages of normal human epidermal differentiation and in ichthyosis vulgaris. Differentiation 48, 43-50 (1991).
Candi, E., Schmidt, R. & Melino, G. The cornified envelope: a model of cell death in the skin. Nat. Rev. Mol. Cell Biol. 6, 328-340 (2005).
Kubo, A. et al. The stratum corneum comprises three layers with distinct metal-ion barrier properties. Sci. Rep. 3, 1731 (2013).
Yoshida, K. et al. Functional tight junction barrier localizes in the second layer of the stratum granulosum of human epidermis. J. Dermatol. Sci. 71, 89-99 (2013).
Yokouchi, M. & Kubo, A. Maintenance of tight junction barrier integrity in cell turnover and skin diseases. Exp. Dermatol. 27, 876-883 (2018).
Furuse, M. et al. Claudin-based tight junctions are crucial for the mammalian epidermal barrier: a lesson from claudin-1-deficient mice. J. Cell Biol. 156, 1099-1111 (2002).
Hadj-Rabia, S. et al. Claudin-1 gene mutations in neonatal sclerosing cholangitis associated with ichthyosis: a tight junction disease. Gastroenterology 127, 1386-1390 (2004).
Tokumasu, R. et al. Dose-dependent role of claudin-1 in vivo in orchestrating features of atopic dermatitis. Proc. Natl Acad. Sci. USA 113, E4061-E4068 (2016).
Nakatsuji, T. et al. Staphylococcus aureus exploits epidermal barrier defects in atopic dermatitis to trigger cytokine expression. J. Invest. Dermatol. 136, 2192-2200 (2016).
Sonesson, A. et al. Identification of bacterial biofilm and the Staphylococcus aureus derived protease, staphopain, on the skin surface of patients with atopic dermatitis. Sci. Rep. 7, 8689 (2017).
Watt, F. M. Terminal differentiation of epidermal keratinocytes. Curr. Opin. Cell Biol. 1, 1107-1115 (1989).
Ishida-Yamamoto, A. & Kishibe, M. Involvement of corneodesmosome degradation and lamellar granule transportation in the desquamation process. Med. Mol. Morphol. 44, 1-6 (2011).
Deraison, C. et al. LEKTI fragments specifically inhibit KLK5, KLK7, and KLK14 and control desquamation through a pH-dependent interaction. Mol. Biol. Cell 18, 3607-3619 (2007).
Ovaere, P., Lippens, S., Vandenabeele, P. & Declercq, W. The emerging roles of serine protease cascades in the epidermis. Trends Biochem. Sci. 34, 453-463 (2009).
Proksch, E. pH in nature, humans and skin. J. Dermatol. 45, 1044-1052 (2018).
Richter, T. et al. Dead but highly dynamic-the stratum corneum is divided into three hydration zones. Skin Pharmacol. Physiol. 17, 246-257 (2004).
Dyring-Andersen, B. et al. Spatially and cell-type resolved quantitative proteomic atlas of healthy human skin. Nat. Commun. 11, 5587 (2020).
Narangifard, A. et al. Molecular reorganization during the formation of the human skin barrier studied in situ. J. Invest. Dermatol. 141, 1243-1253.e1246 (2021).
Jin, Q. & Kirk, M. F. pH as a Primary Control in Environmental Microbiology: 1. Thermodynamic Perspective. Front. Environ. Sci. 6, 21 (2018).
Kim, M. et al. Transcriptomic analysis of the major orphan ichthyosis subtypes reveals shared immune and barrier signatures. J. Invest. Dermatol. 142, 2363-2374.e2318 (2022).
Atsugi, T. et al. Holocrine secretion occurs outside the tight junction barrier in multicellular glands: lessons from Claudin-1-deficient mice. J. Invest. Dermatol. 140, 298-308.e295 (2020).
Kawamoto, T. & Kawamoto, K. Preparation of thin frozen sections from nonfixed and undecalcified hard tissues using Kawamot’s film method (2012). Methods Mol. Biol. 1130, 149-164 (2014).
de Jong, N. W., van der Horst, T., van Strijp, J. A. & Nijland, R. Fluorescent reporters for markerless genomic integration in Staphylococcus aureus. Sci. Rep. 7, 43889 (2017).
Uberoi, A. et al. Commensal microbiota regulates skin barrier function and repair via signaling through the aryl hydrocarbon receptor. Cell Host Microbe. 29, 1235-1248.e1238 (2021).
SanMiguel, A. J., Meisel, J. S., Horwinski, J., Zheng, Q. & Grice, E. A. Topical antimicrobial treatments can elicit shifts to resident skin bacterial communities and reduce colonization by Staphylococcus aureus Competitors. Antimicrob. Agents Chemother. 61, e00774-17 (2017).
Ishida-Yamamoto, A. et al. LEKTI is localized in lamellar granules, separated from KLK5 and KLK7, and is secreted in the extracellular spaces of the superficial stratum granulosum. J. Invest. Dermatol. 124, 360-366 (2005).
Ishida-Yamamoto, A. et al. Epidermal lamellar granules transport different cargoes as distinct aggregates. J. Invest. Dermatol. 122, 1137-1144 (2004).
Wu, Y. et al. Upregulation of kallikrein-related peptidase 5 is associated with the malignant behavior of colorectal cancer. Mol. Med. Rep. 14, 2164-2170 (2016).
Komatsu, N. et al. Correlation between SPINK5 gene mutations and clinical manifestations in Netherton syndrome patients. J. Invest. Dermatol. 128, 1148-1159 (2008).
Fortugno, P. et al. Proteolytic activation cascade of the Netherton syndrome-defective protein, LEKTI, in the epidermis: implications for skin homeostasis. J. Invest. Dermatol. 131, 2223-2232 (2011).
Potten, C. S., Saffhill, R. & Maibach, H. I. Measurement of the transit time for cells through the epidermis and stratum corneum of the mouse and guinea-pig. Cell Tissue Kinet. 20, 461-472 (1987).
Fukuda K. Data analysis code for ‘Three stepwise pH progressions in stratum corneum for homeostatic maintenance of the skin’. https:// doi.org/10.5281/zenodo. 10871884
شكر وتقدير
نشكر R. أوزاوا على المساعدة في إنشاء, B6.VH148GmC ، و B6.عرض-الفئران، R. Yokoo لعزل خلايا SG1 ومساعدة في تحليل التصوير المجهري التوافقي لخلايا SG1، Hachiro Iseki لتصوير الميكروسكوب الإلكتروني، وM. Furuse لمشاركة Cldn1جنين فأر مجمد. تم دعم هذا المشروع من قبل جمعية اليابان لتعزيز العلوم (JSPS) منحة دعم البحث العلمي (S) (22HO4994 الممنوحة لـ M.A.)، منحة JSPS لدعم المجالات الابتكارية (15H05948 الممنوحة لـ A.M)، منحة JSPS لدعم البحث العلمي (C) (ممنوح لـ K.F.) ووكالة اليابان للبحوث الطبية والتنمية (AMED) (JP21ek0410058 و 21gm1010001 ممنوح لـ M.A.).
مساهمات المؤلفين
ك.ف.، ي.ع.، ي.ف.ت.ما.، أ.م.، و م.أ. صمموا الدراسة. ك.ف.، ي.ع.، ي.ف.، وت.ما. قام بإجراء التجارب. قام H.H. وT.Mi. وM.V.L. وR.J.T. بإجراء تحليل النمذجة الرياضية. ساعد T.O. في تقنيات المجهر الضوئي التداخلي. قدم A.M. بناء VenusH148G-mCherry، وساعد في تحليل الصور، وقدم ملاحظات حول كتب المخطوطة ك.ف.، ي.إ.، وم.أ. المخطوطة، وقرأ جميع المؤلفين وحرروا المخطوطة.
المصالح المتنافسة
يعلن المؤلفون عدم وجود مصالح متنافسة.
الأخلاق
تم إجراء جميع تجارب الحيوانات وفقًا للإرشادات الأخلاقية للجنة رعاية واستخدام الحيوانات في معهد ريكين يوكوهاما (AEY2021-018(2))، ولجنة رعاية واستخدام الحيوانات في جامعة كيو (A2022-285)، وإرشادات ARRIVE.
ملاحظة الناشر تظل Springer Nature محايدة فيما يتعلق بالمطالبات القضائية في الخرائط المنشورة والانتماءات المؤسسية.
الوصول المفتوح هذه المقالة مرخصة بموجب رخصة المشاع الإبداعي النسب 4.0 الدولية، التي تسمح بالاستخدام والمشاركة والتكيف والتوزيع وإعادة الإنتاج بأي وسيلة أو صيغة، طالما أنك تعطي الائتمان المناسب للمؤلفين الأصليين والمصدر، وتوفر رابطًا لرخصة المشاع الإبداعي، وتوضح ما إذا تم إجراء تغييرات. الصور أو المواد الأخرى من طرف ثالث في هذه المقالة مشمولة في رخصة المشاع الإبداعي للمقالة، ما لم يُشار إلى خلاف ذلك في سطر الائتمان للمادة. إذا لم تكن المادة مشمولة في رخصة المشاع الإبداعي للمقالة وكان استخدامك المقصود غير مسموح به بموجب اللوائح القانونية أو يتجاوز الاستخدام المسموح به، ستحتاج إلى الحصول على إذن مباشرة من صاحب حقوق الطبع والنشر. لعرض نسخة من هذه الرخصة، قم بزيارة http://creativecommons.org/licenses/by/4.0/.
(ج) المؤلفون 2024
(د) تحقق من التحديثات
مختبر توازن الجلد، مركز RIKEN للعلوم الطبية التكاملي، كاناغاوا، اليابان.قسم الأمراض الجلدية، كلية الطب بجامعة كيو، طوكيو، اليابان.مختبر البيولوجيا الخلوية التطورية للجلد، كلية علوم الحياة والتكنولوجيا الحيوية، جامعة طوكيو للتكنولوجيا، طوكيو، اليابان.قسم الهندسة الحيوية، كلية إمبريال لندن، لندن، المملكة المتحدة.مختبر ديناميات الأنسجة، مركز RIKEN للعلوم الطبية التكاملي، كاناغاوا، اليابان.كلية الدراسات العليا لعلوم الحياة الطبية، جامعة يوكوهاما سيتي، كاناغاوا، اليابان.مختبر ديناميات وظيفة الخلية، مركز RIKEN لعلوم الدماغ، سايتاما، اليابان.ساهم هؤلاء المؤلفون بالتساوي: كيتارو فوكودا، يوشيهيرو إيتو، يuki فوروئيشي.البريد الإلكتروني: amagai@keio.jp
The stratum corneum is the outermost skin layer with a vital role in skin barrier function. It is comprised of dead keratinocytes (corneocytes) and is known to maintain its thickness by shedding cells, although, the precise mechanisms that safeguard stratum corneum maturation and homeostasis remain unclear. Previous ex vivo studies have suggested a neutral-to-acidic pH gradient in the stratum corneum. Here, we use intravital pH imaging at single-corneocyte resolution to demonstrate that corneocytes actually undergo differentiation to develop three distinct zones in the stratum corneum, each with a distinct pH value. We identified a moderately acidic lower, an acidic middle, and a neutral upper layer in the stratum corneum, with tight junctions playing a key role in their development. The upper pH neutral zone can adjust its pH according to the external environment and has a neutral pH under steady-state conditions owing to the influence of skin microbiota. The middle acidic pH zone provides a defensive barrier against pathogens. With mathematical modeling, we demonstrate the controlled protease activation of kallikreinrelated peptidases on the stratum corneum surface that results in proper corneocyte shedding in desquamation. This work adds crucial information to our understanding of how stratum corneum homeostasis is maintained.
Multicellular organisms depend on surface barriers to compartmentalize themselves from harsh extreme environments and maintain homeostasis . In terrestrial vertebrates, the body surface is sealed by the stratified squamous epithelium of skin called epidermis . The transition from aquatic to terrestrial life in vertebrates caused selective pressures affecting epidermal anatomy, and terrestrial vertebrates developed an air-liquid interface barrier, known as the stratum corneum (SC), as the outermost layer of their epidermis (Fig. 1a) . The SC
possesses unique characteristics, as it prevents the entry of pathogens and allergens (outside-in barrier), as well as the leakage of water (inside-out barrier), although it consists of layers of nonviable enucleated keratinocytes (corneocytes). It can also maintain site-specific thickness by shedding scales (desquamation) every day. Furthermore, the SC hosts the skin microbiota that plays essential roles in priming the innate and adaptive skin immune systems . These characteristics are a result of a mechanism that maintains homeostasis in the SC.
However, the underlying mechanisms safeguarding SC homeostasis remain elusive.
The corneocytes are linked together by corneodesmosomes, and their intercellular spaces are sealed with lipids. The intracellular spaces of corneocytes are filled with proteins such as keratin filaments and filaggrin, along with their degradation products . The SC contains
enzymes responsible for lipid synthesis and protein degradation, and the catalytic activities of these enzymes are regulated by . In addition, corneocytes are generated through a unique mode of cell death of the uppermost stratum granulosum keratinocytes (SG1 cells, Fig. 1a) called corneoptosis . It requires prolonged intracellular elevation (phase I) followed by controlled intercellular acidification
Fig. 1 | Three stepwise SC-pH zones preserved across various body parts. a Structure of the epidermis. The epidermis is composed of the stratum basale (SB), stratum spinosum (SS), stratum granulosum (SG), and stratum corneum (SC). The SG is composed of SG1, SG2, and SG3. Tight junctions (TJs, red) are formed between adjacent SG2 cells. The present study examined the pH distribution and pH values within the SC and SG1 (orange). b Representative confocal images of the upper epidermis of abdomen skin of mice, as observed under Z-sliced reconstituted (top) and high-magnification X-Y plane images (bottom). Scale bars, 5 (top), 10 (bottom) m. c Representative electron microscopy image (top) and scheme of X-Y plane confocal image (bottom) of the SC groove. Scale bar, . d Representative confocal images of the upper epidermis of dorsal skin of mice, as observed under Z-sliced reconstituted images (top) and low (bottom-left) and high (bottom-right, region marked by blue lines in left) magnification X-Y plane. Scale bars, 5 (top), 10 (bottom-left), and 1 (bottom-right) . High-
magnification X-Y plane confocal images of SC-pH zones (top) of the e dorsal, abdominal, and ear skin of mice. pH values in each SC-pH zone and SG1 (bottom) of the dorsal ( , and 30 spots from four biologically independent animals, respectively), abdominal ( , and 30 spots from four biologically independent animals, respectively), and ear ( , and 30 spots from four biologically independent animals, respectively) skin. Scale bar, . Representative low and high-magnification plane confocal images of the ear skin in B6.Display-VmC mice (left). pH values in each SC-pH zone and SG1 (right, , and 21 spots from three biologically independent animals, respectively). Scale bar, and . Data are shown as mean SEM and are pooled from four ( ) or three experiments ( ) or are representative of at least three independent experiments ( and ). ; Kruskal-Wallis one-way ANOVA followed by Dunn’s post hoc test ( ). Source data are provided as a Source Data file.
(phase II), thereby activating DNases and proteases to eliminate organelles such as mitochondria without causing inflammation . Based on these results, we hypothesized that SC-pH affects SC homeostasis.
Previous studies have employed two main methods for measuring the pH distribution of human SC : applying a pH electrode to the skin surface before and after consecutive tape stripping or performing fluorescence lifetime imaging of three-dimensional human skin constructs stained with a pH indicator dissolved in organic solvents using two-photon scanning microscopy . The SC-pH profile has been reported to exhibit a monotonous gradient, ranging from at the stratum granulosum (SG; the uppermost viable keratinocyte cell layer that is located beneath the SC) to pH 4.5-5.5 at the SC surface . However, tape stripping is known to induce skin inflammation , and the organic solvents may dissolve lipids surrounding corneocytes, which both can affect SC-pH. Thus, previously reported SC-pH measurements may not reflect steady-state in vivo SC-pH values and their distribution. Indeed, kallikrein-related peptidase (KLKs) that initiate desquamation remain inactive at acidic pH and this could not clearly explain why KLKs execute desquamation in the upper . Furthermore, owing to the presence of skin microbiota on the SC surface , it is unlikely that the SC is acidic in vivo, as this pH range is less favorable for commensal bacterial colonization than neutral pH values .
Here, we performed quantitative intravital pH imaging in corneocytes using transgenic mice expressing a ratiometric pH indicator, considering the nuanced SC-pH distribution. We aimed to elucidate the in vivo SC-pH distribution and biological significance of pH in SC homeostasis. Studies that used earlier SC-pH measurements have suggested that the SC possesses a monotonous neutral-to-acidic gradient profile and that acidic microenvironment promotes skin antimicrobial defense . However, in this study, we found that corneocytes undergo differentiation, thereby inducing three-tiered pH zonation; namely, this process generates the lower-moderately acidic ( pH 6.0 ), middle-acidic ( pH 5.4 ), and upper-nearly neutral ( pH 6.7 ) zones. The lower SC-pH zone originates from the acidification during corneoptosis phase II. The middle SC-pH zone is the acid mantle layer that serves as a protective barrier against pathogens. The upper SC-pH zone is surprisingly adaptive; it can adjust its pH based on external conditions, exhibiting a near-neutral pH under steady-state owing to skin microbiota. The three-tiered pH zones are suitable for regulating protease catalytic activity to induce desquamation on the SC surface. Our results establish that SC is not merely a layer of dead keratinocytes. Instead, the SC comprises three distinct pH zones contributing to SC differentiation, thereby maintaining SC homeostasis.
Results
Generation of genetically engineered mice for the measurement and visualization of corneocyte pH
To visualize the in vivo SC-pH distribution and values, we generated fusion proteins using different pH -sensitivity probes. We used Venus
or VenusH148G as the high pH-sensitive probes and mCherry as the low pH -sensitive probe . We generated hairless (HR) mice that specifically expressed these fusion proteins under the skin aspartic protease (SASP) locus, thereby expressing these pH probes in the SG1 cell layer (HR.SASP and HR.SASP [VH148GmC ] mice, respectively [Supplementary Fig. 1a]). Therefore, these mice are identical to the previously described SASP heterozygous knockout mouse , which does not have a phenotype, except that the integration of the Veuns-mcherry (VmC) or Venus mCherry ( VH 148 GmC ) cassette into the SASP locus. To assess whether the fluorescence of Venus-mCherry (VmC) and Venus -mCherry ( VH 148 GmC ) proteins, expressed in the murine SC, reflected the pH changes, we isolated SG1 cells from the dorsal skin of these mice and exposed them into various pH buffers ( ) with protonophores (nigericin and valinomycin) that equilibrated the intracellular pH to the buffer pH . The fluorescence intensities of Venus, VenusH148G, and mCherry at each pH value were analyzed using confocal microscopy (Supplementary Fig. 1b-e). The differences in the Venus, VenusH148G, and mCherry fluorescence profiles in response to pH variations produced specific ratiometric curves for Venus/mCherry and VenusH148G/mCherry fluorescence (Supplementary Fig. 1f, g). When the Venus/mCherry fluorescence ratio was normalized to the corresponding value at pH 8.0 (relative Venus/mCherry), the ratiometric curves of the relative Venus/mCherry fluorescence measured under two laser powers overlapped (Supplementary Fig. 1f). After normalization, the ratiometric curves of VenusH148G/mCherry measured under two laser powers also overlapped (Supplementary Fig. 1g). These results suggest that the pH of corneocytes and SG1 cells in both and VH148GmC mice could be calculated by substituting the relative Venus/mCherry and Venus mCherry values, respectively, into the ratiometric curves established using isolated SG1 cells. Furthermore, the pKa values of VmC and VH148GmC were approximately 5.8 and 7.0, respectively (Supplementary Fig. 1f, g), suggesting that VmC is more suitable for visualizing pH changes in acidic conditions than VH148GmC.
SC comprises three stepwise pH zones across various body parts
To observe the SC-pH distribution in mice in vivo, we performed intravital imaging of and mice via confocal microscopy (Fig. 1a). The reconstituted Z-sliced section revealed that the SC of dorsal skin comprised three-tiered zonation: upper-nearly neutral, middleacidic, and lower-moderately acidic. However, resolving the pH in single corneocytes was difficult (Fig. 1b and Supplementary Movie 1). As the skin exhibited grooved wrinkles (Fig. 1c) and the confocal microscopic image in the plane offered higher resolution than the reconstituted Z-sliced section (Fig. 1b), we focused on the grooved wrinkles in the X-Y plane image (Fig. 1c). This method enabled us to visualize the SC-pH at the single-corneocyte resolution (Fig. 1d, e). In addition to the dorsal skin, the abdomen, ear, tail, and palm skin of mice exhibited a threetiered zonation (Fig. 1f, g, and Supplementary Fig. 2a-e).
Subsequently, we calculated the pH value of each zone in the SC of mice. The upper, middle, and lower SC-pH zones and the SG1 cell layer had significantly different pH values, which ranged between 6.58-6.77, 5.32-5.42, 5.92-6.04, and 6.93-7.11, respectively (Fig. 1e-g). Collectively, the SC had three stepwise SC-pH zones, which were maintained across various body sites.
Given that and mice enabled intravital imaging of the intercellular pH of corneocytes and exhibited threetiered zonation, we speculated whether the extracellular pH of corneocytes shows similar pH changes. To investigate this, we generated B6 mice that specifically expressed Venus-mCherry fusion protein on the extracellular side of the plasma membrane of SG1 cells and corneocytes (B6.SASP mice [B6. Display-VmC mice]) and performed intravital SC-pH imaging. Similar to and VH148GmC mice, B6. Display-VmC mice exhibited three-tiered zonation (Fig. 1h and Supplementary Movie 2). The upper, middle, and lower SC-pH zones and the SG1 cell layer had significantly different pH values [pH 6.76 ( CI 6.61-6.91), 5.36 ( CI 5.30-5.41), 5.82 (95% CI 5.76-5.88), and 6.80 ( Cl 6.67-6.93), respectively] (Supplementary Fig. 2h). These results suggest that the extracellular pH of corneocytes matches with the intracellular pH of corneocytes.
As the fluorescence of Venus can be quenched by pH as well as by the chloride ion concentration ( ) while the fluorescence of EGFP cannot be quenched by , we performed intravital imaging of HR mice expressing EGFP in SG1 cells ( mice). Similar to mice, mice possessed three distinct zones of EGFP intensity in the SC-upper-high EGFP, middle-low EGFP, and lower-high EGFP (Supplementary Fig. 3a)-indicating that the quenched Venus fluorescence was not due to changes. Furthermore, we detected EGFP protein expression in mice and Venus and mCherry expression in mice via western blot analyses of SC samples obtained from tape stripping (TS). The amounts of EGFP, Venus, and mCherry were similar from the (upper SC) to the (lower SC) TS samples; however, the level of filaggrin decreased toward the SC surface, consistent with earlier observations (Supplementary Fig. 3b) . These results suggest that the changes in Venus-mCherry fluorescence within the SC were not due to proteasomal degradation but because of pH -induced quenching in the SC.
The lower SC-pH zone originates from acidification during corneoptosis, and the acidification of the three stepwise SC-pH zones depends on tight junctions
Filaggrin is known to exist within the lower SC region of corneocytes and subsequently degrade into natural moisturizing factors, thereby playing a vital role in skin hydration . To examine the distribution of filaggrin within the SC-pH zones, we performed immunofluorescence staining of filaggrin in mouse skin. Filaggrin was observed in the cell membrane of corneocytes located in the lower SC-pH zone and disappeared above the lower SC-pH zone (Fig. 2a). This result suggests that the lower SC-pH zone corresponds to the previously reported lower SC region, where filaggrin exists , and that filaggrin degrade into natural moisturizing factors at the middle SC-pH zone.
As the corneocytes are formed through SG1 cell death (corneoptosis) and SG1 cells become acidic during corneoptosis phase II , we next aimed to determine the location and pH value of SG1 cells in corneoptosis phase II. To do this, we injected Hoechst 33242 into the skin of and mice and performed intravital SC-pH imaging. The SG1 cells with yellow cytoplasm and Hoechst 33242 nuclear staining (which corresponds to corneoptosis phase II) were localized to the lowermost layer of the lower SC-pH zone (Fig. 2b, c, and Supplementary Fig. 3c, and Supplementary Movie 3). The pH of SG1 cells in corneoptosis phase II was similar to that of corneocytes in the lower SC-pH zone (Fig. 2d), suggesting that the lower SC-pH zone originates from the acidification that occurs during corneoptosis phase II.
In mammalian skin, the epidermis has two types of physical barriers: tight junctions (TJs) and the SC. TJs are formed at the apical side of keratinocytes at the second layer of the SG (Fig. 1a) and are in contact with SG1 cells to function as liquid-liquid interface barriers . Mice lacking claudin-1 (Cldn1 ), a four-transmembrane protein that forms TJ proteins, are known to possess a more tightly compacted and thicker SC, and experience higher water loss through the epidermis than wild-type mice . Claudin-1 deficient patients are known to develop ichthyosis , an inherited keratotic disorder characterized by impaired SC differentiation and thickening owning to impaired desquamation. Furthermore, patients with atopic dermatitis (AD), a chronic inflammatory skin disease leading to high surface SC-pH values , have significantly low claudin-1 protein expression in their epidermis . Based on these reports, we hypothesized that the distributions and values of SC-pH may be abnormal in Cldn1/ mice. As VH148GmC mice have a higher sensitivity to neutral pH values than mice, and Cldn1 mice die within one day of birth (owing to excessive epidermal water loss) , we examined the SC-pH of neonatal Cldn1 mice. We observed the absence of the three stepwise SC-pH zones, and the entire SC exhibited a neutral pH (Fig. 2e, f), indicating that the acidification of the lower and middle SCpH zones requires intact TJs. Collectively these results suggest that the lower SC-pH zone is a foundation layer of three stepwise SC-pH zones and is hampered by TJ disruption.
Furthermore, we examined the SC-pH of epidermis-specific Cldn1 VH148GmC mice (B6.Cldn1 K14-CreERT VH148GmC mice). Similar to neonatal Cldn1/ VH148GmC mice, the entire SC of adult B6.Cldn K14-CreERT VH148 mice exhibited a neutral pH and were thicker compared with that of mice (Supplementary Fig. 3d, e). Surprisingly, immunofluorescence staining of filaggrin in B6.Cldn1 K14-CreERT VH148GmC mice skin revealed that filaggrin distributed with accumulation along with the cell membrane of corneocytes was located in the entire SC (Fig. 2g). However, filaggrin monomer was undetectable in B6.Cldn1 K14-CreERT VH148GmC mice, as confirmed by western blot analyses of SC samples obtained from TS (Supplementary Fig. 3f). Instead, bands approximately the size of dimetric, trimetric, and tetrameric filaggrin were detected. Collectively, these results suggest that Cldn1 deficiency resulted in the loss of three stepwise SC-pH zones and the accumulation of prematurely processed filaggrin. These TJ-impaired conditions are considered to result in decreased filaggrin monomer and suppression of subsequent natural moisturizing factor production, which would lead to impaired desquamation.
The upper SC-pH zone has an acclimation-like property and is susceptible to external pH changes
Given that the middle-acidic SC-pH zone further differentiates into the upper-nearly neutral SC-pH zone, we examined the impact of external stimuli on pH zone differentiation. We applied STELLA Fluor 650 (a fluorescent dye whose fluorescence intensity is stable at ; dissolved in phosphate-buffered saline) containing Milli-Q water to the dorsal skin surface of mice. STELLA Fluor 650 signals were only observed in the upper SC layer, which corresponded to the upper SCpH zone (Fig. 3a). This result was consistent with previous observations based on time-of-flight secondary ion mass spectrometry (TOF-SIMS), which suggested the presence of a surface zone that allowed passive ion (i.e., potassium ) influx and efflux . Furthermore, we applied buffers with various pH values ( ) to the dorsal and abdominal skin of mice and measured the pH of each zone and SG1. In both the dorsal and abdominal skin, the pH of the upper SC-pH zone significantly changed after the buffer treatment. In contrast, the middle and lower SC-pH zones presented pH values similar to those in untreated mice (Fig. 3b, c). Therefore, the upper SC-pH zone exhibits acclimation-like properties and can adjust its pH according to external pH changes, unlike the lower and middle SC-pH zones.
Fig. 2 | Lower SC-pH zone originates from acidification during corneoptosis, expresses filaggrin, and is hampered by TJ disruption. a Immunofluorescence microscopy of mouse ear skin from mice visualized for Venus, mCherry, and filaggrin. Scale bar, . b Z-sliced reconstituted representative (top) and lowmagnification X-Y plane (bottom-left and bottom-right) confocal images of the dorsal skin of mice injected with Hoechst 33242 (white). White arrows represent SG1 cells with yellow cytoplasm (corneoptosis phase II SG1 cells). Scale bar, 10 (top) and 20 (bottom-left and bottom-right) m. c High-magnification X-Y plane representative confocal images of the dorsal skin of mice injected with Hoechst 33242 (white). Scale bar, values of corneocytes and
SG1 cells in corneoptosis phase II in the lower SC-pH zone ( cells from three biologically independent animals, respectively). Low and high-magnification plane representative confocal images of the abdominal skin of neonatal VH148GmC and Cldn1 VH148GmC mice. Scale bar, (e) and (f). g Immunofluorescence microscopy of ear skin from B6.Cldn K14-CreERT VH148GmC mice to visualize Venus, mCherry, and filaggrin. Scale bar, . Data are shown as mean SEM and are pooled from three experiments ( ) or are representative of at least three independent experiments (a-c, e-g). NS, not significant, two-sided Mann-Whitney’s test (d). Source data are provided as a Source Data file.
Fig. 3 | Upper SC-pH zone shows an acclimation-like property. a Highmagnification X-Y plane representative confocal images of the dorsal skin of mice soaked in STELLA Fluor 650. Merged images of Venus (green), mCherry (red), and STELLA Fluor 650 (blue) are shown. Scale bar, . b High-magnification X-Y plane representative confocal images of the dorsal and abdominal skin of mice treated with or without various pH buffers ( , and 7.2). Scale bar, . in the upper SC-pH zones of dorsal or abdomen skin of mice treated without buffer (no water) and various pH buffers ( , and 7.2) , and 22 spots from three biologically independent animals, respectively). in the middle SC-pH zones of dorsal or
abdomen skin of mice treated without buffer (no water) and various pH buffers ( , and 7.2 ) ( , and 25 spots from three biologically independent animals, respectively). e pH in the lower SC-pH zones of dorsal or abdomen skin of mice treated without buffer (no water) and various pH buffers ( , and 7.2 ) ( , and 25 spots from three biologically independent animals, respectively). Data are shown as mean SEM and are pooled from three experiments ( ) or are representative of at least three independent experiments (a and b). , ; Kruskal-Wallis one-way ANOVA followed by Dunn’s post hoc test (c-e). Source data are provided as a Source Data file.
pH of the upper SC-pH zone is neutralized by the skin microbiota
As skin microbiota inhabit the SC surface, we assessed whether their presence is required to maintain the pH of the upper zone. We treated specific-pathogen-free (SPF) mice with an antibody cocktail that has been previously reported to reduce skin microbiota burden and performed intravital SC-pH imaging (Fig. 4a, b, and Supplementary Movie 4). We found that most of the upper SC-pH zone of
mice that received antibiotics became acidic, and the upper-neutral SC-pH zone reduced significantly, indicating that skin microbiota can neutralize the pH of the upper SC-pH zone. To confirm this, we generated germ-free ( ) mice and performed intravital SC-pH imaging (Fig. 4c, d, and Supplementary Movie 4). We discovered that the pH of the upper zone of mice ( pH 6.05 [95% CI 5.97-6.13]) were significantly lower than that of B6. SPF mice ( pH 6.65 [95% CI 6.58-6.72]). However, B6.
Fig. 4 | Upper SC-pH has a nearly neutral pH owing to skin microbiota. a Lowmagnification X-Y plane and (b) Z-sliced reconstituted representative confocal images of mice that received no treatment or antibiotics. Scale bar, 10 (a) and (b). c Low-magnification X-Y plane and (d) Z-sliced reconstituted representative confocal images of SPF, GF, and co-housed B6.VmC (Ex-GF) mice. Scale bar, and . e pH in the upper SC of SPF, GF, and co-housed B6. mice (top, , and 25 fields from three biologically independent
animals, respectively) and SG1 of SPF, GF, and co-housed B6. VmC mice (bottom, , and 27 fields from three biologically independent animals, respectively). Data are shown as mean SEM and are pooled from three experiments (e) or are representative of at least three independent experiments (a-d). ; NS not significant, Kruskal-Wallis one-way ANOVA followed by Dunn’s post hoc test (e). Source data are provided as a Source Data file.
GF mice co-housed with B6.VmC SPF mice (termed B6.Ex-GF mice) displayed a neutralized upper SC with similar pH values ( pH 6.81 [95% CI 6.71-6.90]) to B6.VmC SPF mice (Fig. 4e). Collectively, these results suggest that the presence of the skin microbiota neutralizes the upper-nearly neutral SC-pH zone.
Middle-acidic SC-pH zone serves as a protective barrier against Staphylococcus aureus
S. aureus, a prominent skin pathogen, is typically associated with inflammatory skin diseases such as AD. The abundance of S. aureus is reportedly high on the skin of AD patients, and its distribution differs from that seen in healthy controls . However, how S. aureus localizes to the SC in AD remains unclear. To observe the localization of S. aureus in the SC, we inoculated the ear skin of B6.VmC SPF (hereinafter termed ) mice, ensuring the absence of .
aureus, with violet-excitable fluorescent protein (VFP)-labeled S. aureus and performed intravital SC-pH imaging (Fig. 5a and Supplementary Fig. 4a). Although S. aureus has been reported to localize to the SC surface , we found that it also localized at the bottom of the upperneutral SC pH zone (Fig. 5b and Supplementary Movie 5). Notably, S. aureus distribution was restricted until just above the middle-acidic SC-pH zone, and there were no signs of S. aureus in the middle-acidic SC-pH zone for at least three weeks (Supplementary Fig. 4b).
Next, we examined the distribution of S. aureus upon inflammation. We applied MC903 on the ears of mice to induce AD-like dermatitis (Supplementary Fig. 4c). The three stepwise SC-pH zones were maintained; however, all three zones became thicker in mice that received MC903 (likely owing to skin inflammation) when compared to those of vehicle-treated mice (Supplementary Fig. 4d, e). There was no difference in the pH of the upper (vehicle vs ) or lower SC- pH zones (vehicle [ ] vs MC903 [ ]) between the two groups; however, the middle SC zone tended to have a higher pH in MC903-treated mice than in vehicle-treated mice (vehicle [pH 5.39 ] vs MC903 [ ]) (Supplementary Fig. 4f).
Subsequently, we applied VFP-labeled S. aureus to the ears of B6.VmC mice that received MC903 (Fig. 5c, d). We found that S. aureus colonized at the bottom of the upper-neutral SC pH zone under MC903-induced dermatitis. Similar to the steady-state control, there were no S. aureus signals in the middle-acidic SC-pH zone (Fig. 5d and Supplementary Movie 5). In addition, we performed time-lapse
Fig. 5 | Middle-acidic SC-pH zone prevents S. aureus invasion. a, b B6. mice were inoculated with . aureus on day 1 . Mice were analyzed on day 4 .
a Experimental design. b Low-magnification X-Y plane (left) and low (middle) or high (right, region marked by red and blue lines in the middle) Z-sliced reconstituted representative confocal images. Pink arrows represent S. aureus signals. MC903 was applied to B6.VmC SPF mice daily for 7 days (days 1-7) to induce dermatitis (MC903-treated mice). The mice were subsequently inoculated with S. aureus on day 8 and analyzed on day 12. c Experimental design. d Lowmagnification X-Y plane (left) and Z-sliced reconstituted (middle) representative confocal images. High-magnification X-Y plane (upper-right, region marked by red lines in left) and Z-sliced reconstituted (lower-right, region marked by blue lines in middle) representative confocal images. e, f MC903-treated mice were inoculated with . aureus on day 8 and analyzed on days 13, 13.25, and 14. e Experimental design. Representative time-lapse images of . aureus detection in the SC of B6.V- SPF mice. The blue dashed line represents the area of the . aureus signal(s). MC903-treated mice were inoculated with S. aureus on day 8 and various pH buffers once daily on days 9-12. Mice were analyzed on day 13. g Experimental design. Ear thickness of mice which were topically treated with various pH buffers ( each) after MC903 and S. aureus application. i Low-magnification X-Y plane and Z -sliced reconstituted representative confocal images of mice that received neutral ( pH 6.6 ) and alkaline ( pH 10.3 ) buffers. Representative X-Y plane (upperleft, low-magnification: lower-right, a region marked by blue lines in upper left) and -sliced reconstituted representative confocal images of . aureus entered the living cell layer (below SC) in mice that received alkaline ( pH 10.3 ) buffer. The pink arrow represents S. aureus. Data are representative of at least three independent experiments (b, d, f, h-j). Scale bar, . Data are shown as mean SEM (h). *** ; one-way ANOVA with Dunnett’s comparison test (h). Source data are provided as a Source Data file.
imaging of the SC of B6.VmC mice that received MC903 and VFPlabeled . aureus. We found that inoculated . aureus proliferated horizontally at the bottom of the upper-nearly neutral SC-pH zone (Fig. 5f). Furthermore, we found that S. aureus proliferation was more suppressed under acidic conditions than under neutral or alkaline conditions in vitro (Supplementary Fig. 4g). Collectively, these findings indicate that the bottom of the upper-nearly neutral SC-pH zone act as a niche for . aureus colonization.
Given that the middle-acidic SC-pH zone showed no signals of S. aureus, we next examined the impact of acidic pH in the middle SCpH zone. After we applied MC903 on the ears of B6.VmC mice for 7 days (days 1-7), the mice were applied VFP-labeled S. aureus on day 8 and different pH buffers once daily on days (four days) to the ears, and analyzed on day 13 (Fig. 5 g ). The B6.VmC mice that received pH 10.3 buffer showed enhanced skin inflammation, thereby exhibiting significantly thicker ear skin than that of mice that received the pH 6.6 buffer (Fig. 5h). Intravital imaging of S. aureus and SC-pH distribution revealed that while in mice that received pH 6.6 buffer . aureus colonized horizontally at the bottom of the upper-nearly neutral SC-pH zone, the application of pH 10.3 buffer neutralized the middle SC-pH zones, enabling S. aureus to enter into middle or lower SC-pH zones (Fig. 5i) and even into the SG (living cell layer) (Fig. 5j and Supplementary Fig. 4h and Supplementary Movie 6). Thus, these results indicate that the middle-acidic SC-pH zone is the acid mantle layer that serves as a protective barrier against S. aureus.
Three stepwise SC-pH zones provide a logical basis for controlled protease activation
The SC thickness is maintained by constant shedding of its outermost corneocyte layer via a process known as desquamation . Desquamation is executed via the degradation of corneodesmosomes (involved in corneocyte-corneocyte adherence) by a member of the kallikreinrelated peptidase (KLK) family . The pH profile of the SC has been considered to regulate the catalytic activity of KLKs and ensure that desquamation occurs at the appropriate location in the . Under normal conditions, the neutral pH in the lower SC enables lymphoepithelial Kazal-type-related inhibitor (LEKTI) to inactivate KLKs (KLK5, KLK7, and KLK14); however, acidic conditions in the uppermost layer inhibit LEKTI, allowing KLKs to function and promote skin peeling . Herein, we revealed a stepwise pH profile with pH values of , 5.4, and 6.7 (pH7.0_6.0_5.4_6.7 model) at the SG1, lower SC, middle SC, and upper SC layers, respectively. To elucidate the biological significance of this stepwise pH profile, we built a mathematical model to understand the pH -dependent regulation of the effective catalytic activity of KLK in SCs with different pH profiles. We modeled the pHdependent processes of (i) activation from pro-KLKs to active KLKs, (ii) inhibition of active KLKs by LEKTI, (iii) degradation of LEKTI, and (iv) proteolysis by active KLKs (Fig. 6a) (see Methods).
The stepwise SC-pH profile reproduced the increase in effective KLK catalytic activity toward the SC surface, thereby indicating the
necessity of an upper-neutral SC-pH zone at the SC surface for desquamation (Fig. 6b). Compared to the pH7.0_6.0_5.4_6.7 stepwise model, the pH7.0_5.4 gradient model showed decreased effective KLK catalytic activity toward the SC surface (Fig. 6c). This gradient pH profile could not produce the microenvironment required to execute desquamation at the SC surface. In addition, the pH 7.0_5.4_6.7 gradient model demonstrated an earlier rise in KLK activity from the middle SC but a slower KLK activity rise at the upper SC when compared to the pH7.0_6.0_5.4_6.7 stepwise model. This observation suggests that the stepwise pH profile is better suited to modulate the on-off switching of KLK catalytic activity in the upper-neutral SC-pH zone (Fig. 6d).
We also simulated the impact of the effective catalytic activity of KLK on disrupted SC-pH profiles, the uniform pH 5.4 and uniform pH 7.0 models. The uniform pH5.4 model failed to increase the effective catalytic KLK activity throughout the SC region (Supplementary Fig. 6c) because of the low pH that cannot exploit the potential KLK activity compared to the pH7.0_6.0_5.4_6.7 stepwise model and could not initiate desquamation at the SC surface. In contrast, the uniform pH 7.0 model resulted in an abrupt increase in effective KLK catalytic activity in the bottom half of the SC owing to the high pH that fully exploits the potential KLK activity in this region (Supplementary Fig. 6c). The high effective KLK catalytic activity may initiate desquamation even in the bottom half of SC, which leads to abnormal skin phenotype. These results indicate the biological necessity of having several zones of different pH levels in the SC, as for the pH7.0_6.0_5.4_6.7 stepwise model.
Finally, we examined the impact of suppressing KLK catalytic activity in the upper SC-pH zone on desquamation in vivo. This was performed by applying a pH 3.5 buffer, that significantly suppresses the catalytic activity of mouse KLK compared with a pH 6.6 buffer, on the ear of B6. VmC mice for four consecutive days (Supplementary Fig. 6d, e). The mice that received the pH 3.5 buffer maintained three stepwise SC-pH zones; however, they showed thicker SC than the mice that received the pH 6.6 buffer (Supplementary Fig. 6e). These results suggest that suppressing KLK catalytic activity leads to the suppression of desquamation, thereby promoting SC thickening. These results were compatible with our mathematical model.
Overall, the simulation results suggest that the three stepwise pH zones trigger LEKTI to associate with KLKs to suppress their catalytic activity in the lower-moderately acidic SC-pH zone. This also allows KLKs to remain in an inactive state in the middle-acidic SC-pH zone and become activated in the upper-nearly neutral SC-pH zone to execute desquamation. Furthermore, our results suggest that keratinocytes undergo differentiation, thereby developing three-tiered pH zonation, which maintains the thickness and barrier function of the SC to produce SC homeostasis (Fig. 6e).
Discussion
While past studies examined SC-pH using tools that are largely restricted to measuring extracellular pH in the SC (such as applying a
pH electrode to the skin), we conducted through high-resolution intravital imaging of intracellular pH in the SC using and VH148GmC mice. Our findings showed that the SC has three distinct stepwise pH zones (lower-moderately acidic [pH 6.0], middleacidic [ pH 5.4 ], and upper-nearly neutral [ pH 6.7 ]). The three SC- pH zones were commonly found across various body parts, implying
that they play a role in SC homeostasis. Furthermore, the extracellular pH in the SC of corneocytes using B6.Display-VmC mice exhibited a three-tiered zonation, and the pH value matched the intracellular pH . A possible explanation for the discrepancy of our data from previous studies may be that the previous study used methods that induce skin inflammation or dissolve intercellular
Fig. 6 | Three stepwise pH zones provide a favorable environment for SC desquamation. a Overview of pH -dependent processes included in a mathematical model of catalytic KLK activity in the SC. The corneocytes mobilize from the SG/SC boundary toward the SC surface via epidermal turnover. Inactive pro-KLKs and LEKTI are released into the SC/SG boundary from SG1 cells. Subsequently, pro-KLKs are activated into KLKs (active form) by KLKs and mesotrypsin. KLKs are capable of degrading corneodesmosomes via proteolysis, thereby initiating desquamation. LEKTI inhibits the catalytic activity of KLKs by reversibly forming a KLK-LEKTI complex, which inactivates KLK. Mesotrypsin degrades LEKTI in the KLK-LEKTI
complex. The numbers in the figure correspond to the model equations. The red dashed line represents the pH -dependent process. Profiles of effective catalytic KLK activity , parameters, and schematic of KLK and LEKTI in the pH7.0_6.0_5.4_6.7 stepwise model, (c) pH 7.0_5.4 gradient model, and (d) pH7.0_5.4_6.7 gradient model. e. Schematic and summary of the function of three stepwise SC-pH zones. The image of SC and SG (right) in Fig. 6e was adapted with permission from Oxford University Press: International Immunology “Dissecting the formation, structure, and barrier function of the stratum corneum” by Matsui T et al. Copyright 2015.
lipids in the , both of which can affect SC-pH, whereas our intravital imaging was non-invasive.
Various proteases localize throughout the ; however, we confirmed that both Venus-mCherry/VenusH148G-mCherry proteins remained abundantly intact in the SC layer. Based on this evidence and the acclimation-like property of the upper SC, we successfully measured the fluorescence changes in Venus and mCherry by applying the different pH buffers to the upper SC zones. These results suggest that the expression of ratiometric pH probe proteins in SG1 cells and their integration into the corneocytes are useful methods to measure and visualize SC-pH.
The SC comprises layers of corneocytes with intercellular spaces sealed by lipid lamellar structures (the “brick and mortar model”). The insolubility of the SC has hampered comprehensive analysis, and the SC has been considered a homogeneous barrier . However, using immune-electron microscopy of filaggrin, SC can be divided into lower SC with filaggrin and upper SC without filaggrin . Furthermore, scanning electron microscopy of the SC demonstrated that the lower SC swells when soaked in water, forming massive water inclusions between adjacent cell layers. In contrast, the middle SC remains nearly unaffected by water stress and maintains its thickness. The upper SC also swells massively, thereby loosening its intracellular filament packing. These results suggested that the SC can be divided into three distinct regions based on their water penetration and binding potentials . In addition, our previous study conducted using TOFSIMS, which enables the visualization of the distribution of natural substances without using staining methods, revealed that arginine, a major component of filaggrin-derived natural moisturizing factors, was concentrated in the middle SC, suggesting that this layer plays a key role in skin hydration . The soaking assay in the study revealed that the upper SC allowed for the influx and efflux of various metal ions, while the middle and lower layers exhibited distinct barrier properties. Through immunofluorescence staining of filaggrin and intravital SC-pH imaging using STELLA 650 containing Milli-Q water, we observed filaggrin and STELLA 650 fluorescence located in the lower SC-pH zone and the upper SC-pH zone, respectively. These results suggest that the three zones observed by TOF-SIMS correspond to the three SC-pH zones. Thus, the SC is not a simple monotonous layer but rather differentiates into three sharply demarcated layers, with pH being a key regulator of this process.
It is unclear how pH regulation is altered in the SC , resulting in the development of three stepwise SC-pH zones. A recent proteome study showed that the peptides of vacuolar-type ATPase (which pumps protons across the plasma membranes using ATP hydrolysis energy) are detected from SC samples . However, mitochondria do not exist in the corneocytes, and ATP synthesis by oxidative phosphorylation does not occur in the SC. Thus, it is unclear whether vacuolar-type ATPase is active in the SC and plays a role in maintaining SC-pH. Cryo-electron microscopy (cryo-EM) revealed that the organization of the lipid lamellae drastically changes in the intercellular spaces between the first and the fifth cells of the SC: (1) a single-band pattern with 2.02.5 nm periodicity, and (2) a two-band pattern with periodicity . Since the optimal pH of the lipid metabolism enzyme is acidic, we speculate that the lipid metabolism enzymes may contribute to forming lipid lamellae organization thereby regulating the SC-pH.
Given that the upper SC-pH zone has acclimation-like capability and passively adjusts its pH to the external environment and that skin microbiota localizes on the SC surface, we speculated that the skin microbiota affects the pH of the upper SC-pH zone. Indeed, we found that GF mice had a slightly more acidic upper SC-pH zone than SPF mice, suggesting that skin microbiota contributes to neutralizing the upper SC-pH zone. Notably, S. aureus localized in steady-state conditions and colonized the bottom surface of the upper SC-pH zone in inflammatory conditions. In vitro S. aureus proliferation assay results revealed that S. aureus favors a neutral microenvironment over acidic conditions. Similar to S. aureus, most bacteria thrive at neutral pH levels (optimally at pH 7.0 ), and deviation from these optimal pH values can reduce their growth rate by approximately . Thus, the bottom surface of the upper SC-pH zone may act as a proliferation niche for pathogens. Furthermore, we found that S. aureus could still proliferate at pH 5.4 , the pH value of the middle-acidic SC-pH zone, even though there were no S. aureus signals. Based on these results, we speculate that the middle-acidic SC-pH zone can not only suppress S. aureus proliferation, but also maintains structural integrity and/or antimicrobial peptide production to achieve its barrier function.
The SC is unique as it can maintain homeostasis and differentiate into three stepwise SC-pH zones, although it consists of dead keratinocytes. Inflammatory skin diseases, such as psoriasis, lead to the development of nucleated keratinocytes in the SC (called parakeratosis) and a thicker SC (called acanthosis) when compared to normal healthy skin, suggesting abnormal SC homeostasis. In addition, patients with ichthyoses (a group of heterogenous genetic skin diseases) exhibit a thickened and abnormally desquamated SC. Some individuals show the upregulation of epidermal differentiation-related genes and downregulation of TJ component-associated genes, implying impaired SC differentiation . Thus, deciphering the mechanisms underlying stepwise SC-pH zones generation and SC-pH regulation may provide novel insights for developing treatment strategies for inflammatory skin diseases and ichthyoses.
Methods
Mice
C57BL/6 (B6) and hairless (HR) mice were obtained from Japan SLC Inc. (Hamamatsu, Japan). B6.Cldn1 mice were provided by Dr. M. Furuse (National Institute for Physiological Sciences, Okazaki, Japan). B6.SASP (B6.EGFP ) mice were generated by integrating the EGFP-Neo cassette into the SASP gene locus on chromosome 6 in B6 background ES cells via homologous recombination . To generate B6.SASP (B6.VH148GmC ) mice, we modified the knock-in vector of B6.SASP mice by replacing the EGFP-Neo cDNA with Venus -mCherry cDNA using pSK-VenusH148G-mCherry and CRISPR/Cas9. Furthermore, the Venus mutation was reverted to wild-type (G148 to V148) using oligonucleotide-mutagenesis via CRISPR/Cas9 to generate B6.SASP (B6.VmC ) mice (Supplementary Fig. 1a). To generate B6.SASP (B6.Display ) mice, a pDisplay-Venus-mCherry cassette was integrated into the SASP gene locus on chromosome 6 in B6 background ES cells via homologous recombination. Venus-mCherry fusion protein expressed from the pDisplay Mammalian Expression Vector (Invitrogen) was
fused at the N-terminus to the murine Ig k-chain leader sequence, which directs the protein to the secretory pathway, and at the C-terminus to the PDGFR transmembrane domain, which anchors the protein to the plasma membrane, displaying it on the extracellular side. B6.EGFP , B6.VH148GmC , B6.VmC , and B6.Cldn1 mice were backcrossed with HR mice for at least 10 generations to produce , , and mice, respectively. mice were intercrossed with VH148G mCherry mice to generate Cldn1’/ VH148GmCherry mice. Epidermis-specific Cldn-1 conditional knockout mice (B6.Cldn1 K14-CreERT) were obtained from RIKEN LARGE (Accession No. CDB0803K) and intercrossed with VH148GmC mice to produce B6.Cldn1 K14-CreERT VH148GmC mice. For epidermis-specific Cldn1 knockout induction, B6.Cldn1 K14-CreERT VH148GmC mice received intraperitoneal injection of 1 mg tamoxifen for 5 days and the mice were used for the experiment nine days after the last tamoxifen injection. To generate mice, germ-free rederivation of mice was performed at the gnotobiotic animal facilities of Keio University. B6. VmC GF mice were kept in individual gnotobiotic isolators until analysis with 12 h light dark cycle at a controlled temperature ( ) and humidity ( ) with free access to autoclaved water and autoclaved standard laboratory chow diet. For co-housing, SPF and GF mice were housed in the same cage under SPF conditions for seven days. All mice except B6.VmC GF mice were maintained and housed at pathogen-free animal facilities at the RIKEN Yokohama Branch or Keio University School of Medicine with 12 h light dark cycle at a controlled temperature ( ) and humidity ( ) with free access to water and standard laboratory chow diet (housed by strains). Sex was not considered in this study. 3-6-month-old mice (except Cldn1 VH148GmCherry mice, which die within one day of birth) were used for all experiments because the characteristics of corneoptosis do not change in this range .
The information of the mice used in each figure is as below.
Figure 1: In Figs. 1b, 1 male, and 2 female mice at the age of 16-27 weeks were analyzed. In Figs. 1c, d, 2 male and 1 female mice at the age of 12-23 weeks were analyzed. In Figs. 1e-g, 3 male and 1 female mice at the age of 23-27 weeks were analyzed. In Figs. 1 h and i, 2 male and 1 female B6.Display- mice at the age of 20-27 weeks were analyzed.
Figure 2: In Figs. 2a, 2 male and 1 female mice at the age of 16-21 weeks were analyzed. In Figs. male and 1 female mice at the age of 12-15 weeks were analyzed. In Figs. 2e, f, 2 male and 1 female VH148GmC mice at the age of 19-22 weeks and 2 male and 1 female neonatal (the age of day 1) Cldn1 VH148GmCherry mice were analyzed. In Figs. 2g, 1 male and 2 female B6.Cldn1 K14-CreERT mice at the age of 12-13 weeks were analyzed.
Figure 3: In Fig. 3a, 3 male mice at the age of 13-21 weeks were analyzed. In Figs. 3b-e, 2 male and 1 female mice at the age of 12-16 weeks were analyzed.
Figure 4: In Fig. 4a, b, 1 male and 2 female B6. mice at the age of 16-23 weeks were analyzed. In Figs. 4c-e, 3 male B6.VmC SPF, 3 male B6.VmC GF, and 3 male B6. Ex-GF mice at the age of 20-23 weeks were analyzed.
Figure 5: In Figs. 5b, d, and f, 2 male and 1 female B6. mice at the age of 12-19 weeks were analyzed. In Fig. 5h, 24 male B6.VmC SPF mice ( 4 male B6. SPF mice in each group) at the age of 20-23 weeks were analyzed. In Figs. 5i, 6 male B6.VmC SPF mice ( 3 male B6.VmC SPF mice in both group) at the age of 20-23 week were analyzed. In Figs. 5j and 3 male B6. VmC SPF mice at the age of 20-23 weeks were analyzed.
supplementary Fig. 1: In Supplementary Fig. 1b, 1d, and 1f, SG1 cells derived from 2 male and 1 female mice at the age of 18-22 weeks were analyzed. In Supplementary Fig. 1c, e, and 1g, SG1 cells derived from 3 male VH148GmC mice at the age of 12-14 weeks were analyzed.
supplementary Fig. 2: In Supplementary Fig. 2a-c, 2 male and 1 female VH148GmC mice at the age of 12-22 weeks were analyzed. In Figs. 2d and e, 1 male and 2 female mice at the age of 14-23 weeks were analyzed.
supplementary Fig. 3: In Supplementary Fig. 3a and b, 2 male and 1 female at the age of 12-20 weeks mice and 1 male and 2 female mice at the age of 14-23 weeks were analyzed. In Supplementary Fig. 3c, 3 male VH148GmC mice at the age of 12-20 weeks were analyzed. In Supplementary Fig. 3d and e, 1 male and 2 female B6.Cldn1 K14-CreERT mice at the age of 12-13 weeks and 2 male and 1 female mice at the age of weeks were analyzed. In Supplementary Fig. 3f, 1 male and 2 female B6.Cldn1 K14-CreERT mice at the age of 12-13 weeks were analyzed.
supplementary Fig. 4: In Supplementary Fig. 4b, 2 male and 1 female B6.VmC mice at the age of 12-19 weeks were analyzed. In Supplementary Fig. male and 2 female mice ( 2 male and 1 female B6. SPF mice in both group) at the age of 12-19 weeks were analyzed.
supplementary Fig. 6: In Supplementary Fig. 6e and f, 2 male and 1 female mice at the age of 20-23 weeks were analyzed.
pH calibration using isolated SG1 cells
SG1 cells were isolated from the dorsal skin of and VH148GmC mice, as previously described, with some modifications . Briefly, mice were anesthetized via intraperitoneal injection of a medetomidine-midazolam-butorphanol (MMB) mixture ( ). Subsequently, recombinant exfoliative toxin-A (ETA) dissolved in phosphate-buffered saline (PBS) containing 1 mM CaCl 2 was injected into the dorsal skin of and mice and mice placed at for 60 min . The ETA sheet, which composed of SG1/2/SC, was then mechanically peeled from the skin. After 5 min treatment of trypsin, Venus-mCherry-positive SG1 cells and Venus-mCherry-negative SG2 cells derived from VmC mouse ETA sheet or VenusH148G-mCherry-positive SG1 cells and VenusH148G-mCherry-negative SG2 cells derived from VH148GmC mouse ETA sheet were placed into buffers of various pH values ( ), with nigericin ( ) and valinomycin ( ) (both FUJIFILM Wako Pure Chemical Co., Osaka, Japan). The buffers consisted of 50 mM pH buffer and 150 mM NaCl . Acetate and phosphate buffers were used to adjust the pH values to and 5.8-8.0, respectively. The fluorescence intensity of the Venus, VenusH148G, and mCherry proteins in SG1 cells was determined using an HC PL APO CS2 63x/NA 1.40 immersion objective lens on an inverted TCS SP8 confocal microscope (Leica Microsystems, Wetzlar, Germany). A emission filter was used to detect Venus or VenusH148G fluorescence upon excitation with a OPSL laser, and a emission filter was used for mCherry fluorescence upon excitation with a OPSL laser. For image acquisition, planes were scanned at a resolution of 361 nm per pixel with a speed of 400 Hz using a laser with its power set at (i) for Venus and for mCherry or (ii) for Venus and for mCherry for SG1 cells from mice and (iii) for VenusH148G and for mCherry or (iv) for Venus and for mCherry for SG1 cells from VH148GmC mice. X-Y plane images (30) with spacing were constructed for each plane.
Images were analyzed using Fiji [Image], National Institutes of Health (NIH), Bethesda, MD, USA]. SG1 cell images were projected using the “MAX intensity” script. Thirty SG1 cells were marked by the region of interest (ROI), and their average intensities were measured using the ROI manager. The background intensity was measured similarly. Changes in fluorescence intensity were calculated as the average intensity of the ROI minus the background intensity of each image. The Venus/mCherry and Venus mCherry fluorescence ratios and relative ratios at various pH values were fitted to a sigmoidal nonlinear regression model using GraphPad Prism 9.
Intravital SC-pH imaging (X-Y- and Z-slice imaging)
Intravital imaging of mice was performed as previously described, with some modifications . Briefly, mice were anesthetized via intraperitoneal injection of a medetomidine-midazolam-butorphanol (MMB) mixture (0.75:4:5). Dorsal, abdomen, ear, tail, and palm skin samples from the mice were attached to a micro cover glass ( thickness , C4050HT; MATSUNAMI Glass IND., Osaka, Japan) containing an aliquot of Milli-Q water, Milli-Q water with STELLAFluor 650 free COOH (Goryo Chemical, Sapporo, Japan), or buffers of various pH values (4.1-8.0). They were then fixed on a heated stage (TPi-SQH26; Tokai Hit, Fujinomiya, Japan) at . Images were acquired using HC PL APO CS2 63x/NA 1.40 or HC PL APO CS2 100x/NA 1.40 using immersion objective lens with an inverted TCS SP8 confocal microscope (Leica Microsystems). A emission filter was used to detect Hoechst 33342 signals upon excitation using a diode laser. A emission filter was used for Venus and Venus detection upon excitation using a 488 -nm OPSL laser, and a emission filter was used for mCherry detection upon excitation using a OPSL laser. For low-magnification image acquisition, planes were scanned at a resolution of 91 nm per pixel, with the Z spacing between slices being . For high-magnification image acquisition, single X-Y planes were scanned at a resolution of 45 nm per pixel. The laser power was set at (i) for Venus and for mCherry (abdominal, toe, and skin) or (ii) for Venus and for mCherry (dorsal and ear skin) for image acquisition of mice, (iii) for VenusH148G and for mCherry for image acquisition of VH148GmC , Cldn1 VH148GmCherry , and B6.Cldn K14-CreERT VmC mice, and (iv) for Venus and for mCherry for image acquisition of B6.Display- mice. In some experiments, of saline solution containing Hoechst 33342 in distilled water was injected intradermally into the dorsal skin of mice 24 h prior to imaging.
To detect fluorescently labeled S. aureus in the SC of murine ear pinnae, mice were inoculated with the bacteria and then anesthetized on a heater pad via intraperitoneal injection of an MMB mixture (0.75:4:5) or a combination of intraperitoneal pentobarbital ( ) injection and isoflurane inhalation. The mice were placed in a sealed acrylonitrile-styrene resin box with air vent valves (for inhalation anesthesia) and an observation window covered by a micro cover glass (C4050HT). The ear skin was attached to the micro cover glass. The fluorescence of both the bacteria and the mice was visualized through an FV3000 laser scanning confocal microscope (Olympus) equipped with a UPLSAPO 60XS2 objective lens and the following settings: (1) mAmetrine: excitation, 405 nm ; collection, ; (2) Venus: excitation, 514 nm ; collection, ; and (3) mCherry: excitation, 594 nm ; collection, . For image acquisition, planes were scanned at a resolution of per pixel, and the Z spacing between slices was . Images were processed using Fiji (ImageJ, NIH) and Photoshop 2023 (Adobe, Mountain View, CA, USA).
SC-pH measurements
Since the Venus/mCherry fluorescence ratio was normalized to its corresponding value at pH 8.0 (relative Venus/mCherry), the ratiometric curves of the relative Venus/mCherry fluorescence measured under two laser powers overlapped. Dorsal, abdomen, and ear skin samples from mice were attached to a micro cover glass (C4050HT) containing an aliquot of Milli-Q water or pH 8.0 buffer. Subsequently, Venus and mCherry protein fluorescence intensity was measured using an HC PL APO CS2 63x/NA 1.40 oil immersion objective lens on an inverted TCS SP8 confocal microscope (Leica Microsystems GmbH). Similar to the imaging of isolated SG1 cells, planes were scanned at a resolution of 361 nm per pixel with a speed of 400 Hz . The laser power was set at (i) for
Venus and for mCherry (abdominal skin) or (ii) for Venus and for mCherry (dorsal and ear skin) for image acquisition of or (iii) for Venus and for mCherry for image acquisition of B 6 . Display- mice. Single plane images were acquired. Images were analyzed using Fiji and Cornecoytes or SG1 cells were marked by the ROI, and their average intensities were measured using the ROI manager. Since the upper SCpH zone is capable of acclimatization, the Venus/mCherry fluorescence ratio was normalized to the Venus/mCherry ratio of the upper SC-pH zone at pH 8.0 to obtain relative Venus/mCherry values. The SCpH was calculated by substituting the relative Venus/mCherry values for the ratiometric curves established using isolated SG1 cells.
Electron microscopic analysis of the epidermis
The dorsal skins of mice were fixed in glutaraldehyde in 0.1 M phosphate-buffered saline (PBS) for 2 h . The specimens were washed overnight at in the same buffer and post-fixed with osmium tetroxide in 0.1 M phosphate buffer for 2 h at . The specimens were dehydrated in a graded ethanol series and embedded in TAAB EPON 812 (Nisshin-EM, Tokyo, Japan), and sections were cut horizontally. Images were obtained using a SU8220 field emission scanning electron microscope (Hitachi High Technologies Corporation, Tokyo, Japan) with a YAG-backscattered electron detector ( 5 kV ).
Immunofluorescence staining
Mouse skin samples were directly embedded in optimal cutting temperature compound (Sakura Finetek, Tokyo, Japan) and frozen at . Kawamoto’s adhesive film (Cryofilm type 2 C (9); SECTION-LAB Co. Ltd., Yokohama, Japan) was applied on the exposed cutting surface, and frozen samples were cut into -thick sections . Without drying or fixation, the sections were blocked with bovine serum albumin (Sigma Aldrich, St. Louis, MO, USA) in PBS at for 30 min , incubated with an anti-filaggrin antibody (1:1000; Poly19058; BioLegend, San Diego, CA, USA) in blocking solution at for 1 h or at overnight. The sections were washed twice with PBS, incubated with donkey anti-rabbit IgG highly cross-adsorbed secondary antibody, Alexa Fluor (1:1000; Thermo Fisher Scientific, Waltham, MA, USA) in blocking solution at for 30 min , and washed twice with PBS. The sections were mounted in Dako Fluorescence Mounting Medium (Agilent Technologies, Santa Clara, CA, USA) and observed under an inverted TCS SP8 confocal microscope (Leica Microsystems). Images were processed using Fiji (ImageJ, NIH) and Adobe Photoshop (Adobe).
Western blot analysis of murine SC
The SC layer from the dorsal skin of , and B6.Cldn1 K14-CreERT VH148GmC mice was obtained via tape stripping (TS) with the use of large D-Squame tape strips (Promotool, Inc., Chatou, France). TS was performed nine (for and mice) or seven (for B6.Cldn K14-CreERT VH148GmC mice) times, and each time, the tape was pressed against the skin for 5 s with standardized pressure ( ) using a D-Squame pressurizer (Promotool, Inc.). Each tape was soaked in 1.8 mL of urea buffer ( 5 M urea/ 2 M thiourea), PBS, and 1 mM EDTA supplemented with a protease inhibitor cocktail (Nacalai Tesque, Tokyo, Japan) for 5 min . The lysates were centrifuged at for 10 min at , and the protein concentrations of the supernatants were estimated using the SensoLyte OPA Protein Quantification Kit Fluorimetric (AnaSpec Inc., Fremont, CA, USA). The supernatants were denatured at for 5 min in Laemmli buffer (BioRad, Hercules, CA, USA) and the denatured samples were separated using Tris/glycine/SDS buffer. Following electrophoresis, proteins were transferred onto a PVDF membrane (Bio-Rad). Membranes were incubated for 5 min at room temperature ( ) in EveryBlot blocking buffer and then with a 1:1000 dilution of anti-GFP (598; MBL Life Science, Sunnyvale, CA, USA), anti-RFP (PM005; MBL Life Science), 1:1000
dilution of anti-filaggrin (Poly19058; BioLegend), or 1:100 dilution of anti-cytokeratin 10 (LH2; Santa Cruz Biotechnology, Dallas, TX, USA) primary antibody at . Immune complexes were detected using anti-rabbit or anti-mouse IgG, horseradish peroxidase-linked secondary antibody, Clarity Western ECL Substrate (all Bio-Rad), and an iBright FL1500 Imaging system (Thermo Fisher Scientific).
Development of violet-excitable fluorescent protein-labeled Staphylococcus aureus
mAmetrine-expressing MW2 S. aureus was generated via allele replacement using the pRN112 plasmid as previously described . Briefly, pRN112 was introduced into MW2 S. aureus by electroporation, and the cells were plated on Todd Hewitt (TH) agar containing chloramphenicol ( ) for an overnight incubation at . Colonies were picked and transferred to a fresh plate and incubated at for 2 days to select for integration of the plasmid into the chromosome. For double cross-over events, obtained single colonies were picked and incubated in TH broth without antibiotics with shaking at . Cultures were diluted 1:1000 and cultured for , resulting in 7 dilution-culturing cycles. The final culture was plated on TH agar containing anhydrotetracycline and incubated overnight at to select for double cross-over mutants. Single colonies susceptible to chloramphenicol were analyzed via PCR for correct integration.
Bacterial culture and inoculation
For inoculation with MW2 S. aureus, bacterial isolates were cultured in brain heart infusion medium (Becton Dickinson, Franklin Lakes, NJ, USA) overnight and adjusted to approximately in medium. Bacterial suspensions ( per ear pinna) were topically administered onto the ear pinnae of SPF mice. For the bacterial growth curve, of bacterial isolates cultured in tryptic soy broth (TSB) (Becton Dickinson) overnight was added to of pH -adjusted TSB and incubated with shaking at . To determine the bacterial growth rate, the OD ( 600 nm ) was measured every 15 min using an infinite 200Pro with Tecan i-control (Tecan Japan Co., Ltd., Kawasaki, Japan).
Antibiotic treatment
B6.VmC mice received an antibiotic cocktail consisting of metronidazole ( ), sulfamethoxazole ( ), trimethoprim ( ), cephalexin ( ), and Baytril ( ) dissolved in drinking water for two weeks to reduce skin microbial burden . Baytril is enrofloxacin, which is more easily recognized as a DNA gyrase inhibitor in the fluoroquinolone class of antimicrobials. To ensure decreased microbial burden, cages were changed thrice weekly .
Chemically induced atopic dermatitis-like disease
To induce a dermatitis-like state using MC903, the ear pinnae of 8 -week-old B6 WT mice or B6. mice were treated daily with 1 nmol MC903 (calcipotriol, Tocris Bioscience, Bristol, UK) in ethanol for 7 days (days 1-7). One day after the MC903 application, approximately of bacterial suspension in medium was topically administered to the ear pinnae. For pH -adjusted buffer application, of pH-adjusted 100 mM phosphate buffer was topically applied on the ear pinnae twice daily for four days. Ear thickness was measured with a digital micrometer (Mitutoyo, Kawasaki, Japan) at the end of each experiment.
Protease activity
The activity of murine kallikrein-related peptidase (KLK)5 (R&D Systems, Minneapolis, MN, USA) and mesotrypsin (PRSS3) (R&D Systems) dissolved in various pH (3.5-8.0) buffers was measured according to the manufacturer’s protocol. Briefly, a murine KLK5 activity assay was performed at using 50 mM sodium phosphate buffer ( pH
5.8-8.0) or 50 mM acetate buffer ( ) containing mouse KLK5 and Boc-V-P-R-AMC Fluorogenic Peptide Substrate (R&D Systems) at the final concentrations. After 30 min of incubation, the fluorescence was measured at an excitation/emission wavelength of using the PerkinElmer 2030 Multilabel Reader. The mouse PRSS3 activity assay was performed at in 50 mM sodium phosphate buffer ( ) or 50 mM acetate buffer ( ) containing mouse PRSS 3 and BODIPY FL casein (Thermo Fisher Scientific). After a incubation, the fluorescence was measured at an excitation/emission wavelength of using the PerkinElmer 2030 Multilabel Reader. To determine the relative enzyme activity of murine KLK5 and PRSS3, relative enzyme activity was calculated based on the formula: (A-B)/ , where fluorescence at the indicated fluorescence without enzymes, and maximum fluorescence obtained in the assay (i.e. pH 7.8 for murine KLK5 and pH 7.8 for PRSS3).
Statistics
Data are expressed as the mean standard error of the mean. Differences among three or more groups were compared using KruskalWallis one-way analysis of variance (ANOVA) followed by Dunn’s post hoc tests, except in Fig. 5h, in which one-way ANOVA with Dunnett’s comparison test was used. Dual comparisons were made using the twosided Mann-Whitney test. Statistically significant differences are indicated as follows: . The mean values of single biological replicates in Fig. 1e, f, g, i, 2d, 3c, 4e, and Supplementary Fig. 5e are provided as Supplementary Data 1. GraphPad Prism 9 (GraphPad software, Boston, MA, USA) was used to perform analyses.
Mathematical model of catalytic KLK activity in the SC
Our mathematical model explicitly describes four pH -dependent processes involved in the regulation of skin desquamation by active KLKs: (i) activation of pro-KLKs to KLKs, (ii) inhibition of KLKs by LEKTI, (iii) degradation of lymphoepithelial Kazal-type-related inhibitor (LEKTI), and (iv) KLK-mediated corneodesmosome proteolysis. These processes are summarized in a graphical scheme (Fig. 6a) and formulated using ordinary differential equations. We identified model functions and parameters from the relevant measurement data and used the established model to simulate the catalytic activity of KLKs under different hypothetical SC-pH profiles.
Model development
We described the dynamics of the concentrations of pro-KLKs ( ), KLKs ( ), LEKTI ( ), and the KLK-LEKTI complex ( ) at height in the SC:
Table 1 | Model functions and parameters
Symbols
Explanation
Units
pH at height (Fig. 6a)
–
Relative catalytic activity of KLKs at each pH ( ) to that at an optimal pH of 7.8
–
Relative catalytic activity of mesotrypsin at each pH ( ) to that at an optimal pH of 7.8
–
Concentration of mesotrypsin in the SC
M
Concentration of pro-KLKs at (SG/SC boundary)
M
Concentration of LEKTI at (SG/SC boundary)
M
Rate constant of pro-KLK autoactivation
Rate constant of pro-KLK activation via mesotrypsin
Association rate constant of KLK and LEKTI to the KLK-LEKTI complex
Dissociation rate constant of the KLK-LEKTI complex to KLK and LEKTI
Elimination rate constant of LEKTI via mesotrypsin
Transit rate of pro-KLKs, KLKs, LEKTI, and the KLK-LEKTI complex from (SG/SC boundary) to (SC surface)
KLK kallikrein-related peptidase, LEKT1 lymphoepithelial Kazal-type-related inhibitor.
with the initial conditions , , and . Pro-KLKs and LEKTI are secreted into the extracellular space between the SG and SC ( ) via the lamellar granule system, where LEKTI is separated from pro- .
There are no KLKs or KLK-LEKTI complexes at the SG/SC boundary, and pro-KLKs are activated into KLKs in the SC. Each term of the model equations is detailed under “Activation of pro-KLKs into KLKs,” and the model functions and parameters are summarized in Table 1 and under “Inhibition of KLKs by LEKTI.” Using this model, we evaluated the effective catalytic activity of KLKs at as
which is the relative catalytic activity of KLKs at each pH , compared with that at the optimal .
Derivation of ordinary differential equations
Activation of pro-KLKs into KLKs. Pro-KLKs are converted to KLKs by KLKs themselves (autoactivation) or by other proteases such as mesotrypsin . We modeled this KLK activation process using the following equations:
where denotes the time for pro-KLKs and LEKTI to reach height (from the time of their secretion at the SG/SC boundary ) via corneocyte transit. The depends on according to the pH profile (Fig. ). The catalytic activities of KLKs and mesotrypsin at each and , are described by the relative activities when compared to their maximal activity at an optimal pH (pH 7.8). We assumed that mesotrypsin exists sufficiently across the entire SC to exert its catalytic activity because the influence of specific factors on the distribution of mesotrypsin has not yet been reported.
Inhibition of KLKs by LEKTI. LEKTI inhibits the catalytic activity of KLKs by reversibly forming a KLK-LEKTI complex that inactivates
KLKs. We modeled this process of KLK-LEKTI complex formation as:
Both the association and dissociation rates, and , for the KLK-LEKTI complex are pH -dependent .
LEKTI degradation. Mesotrypsin degrades LEKTI both on its own and in KLK-LEKTI complexes . This process of LEKTI degradation is modeled as:
We did not consider the degradation of pro-KLKs and KLKs because the influence of specific factors on the degradation of proKLKs and KLKs in the SC has not yet been reported.
Corneocyte transit from the SG/SC boundary to the SC surface. Corneocyte transit from the SG/SC boundary toward the SC surface occurs via epidermal turnover (Fig. 6a). This transit brings pro-KLKs, KLKs, LEKTI, and the KLK-LEKTI complex toward the SC surface. The time required for pro-KLKs and LEKTI to reach height from their secretion at the SG/SC boundary ( ) was defined by
where is the depth-independent transit rate of pro-KLKs, KLKs, LEKTI, and KLK-LEKTI.
Dynamics of pro-KLKs, KLKs, LEKTI, and the KLK-LEKTI complex. The dynamics of pro-KLK concentrations were described by a combination of Eqs. (6) and (14):
The dynamics of KLK concentration were obtained by a combination of Eqs. (7), (8), (11), and (14):
The dynamics of the LEKTI concentration were obtained by a combination of Eqs. (9), (12), and (14):
The dynamics of the KLK-LEKTI complex concentration were obtained by a combination of Eqs. (10), (13), and (14):
Model parameters and simulation method
We derived the values for four parameters, , , and by curve-fitting the in vitro experimental data (Supplementary Fig. 5a-c) and those for , and from the literature.
We used three representative values, each corresponding to one of the three scenarios: no degradation of LEKTI ( ), continuous decreases in LEKTI ( ), and complete depletion of LEKTI ( at pH 7.05 .4 [gradient]) and at pH 7.0_6.0_5.4_6.7 (stepwise) and (gradient). These three scenarios allowed us to deduce the effects of on our results for the entire range of , but information on the distribution of LEKTI was lacking.
We identified the ranges of the remaining two parameters, and , by evaluating the reproducibility of the expected spatial distribution of KLKs (detailed below under “Rates of pro-KLK activation via autoactivation ( ) and via mesotrypsin ( )”).
pH-dependent catalytic activity of KLK: . We obtained the profile of by curve-fitting the relative activity of mouse KLK5 (a representative subtype of KLKs) at different pH values (Supplementary Fig. 5a). The relative activity was the ratio of the catalytic activity of KLK5 measured at each pH to that at pH 7.8 (optimal), and the catalytic activity values were obtained from the degradation rates of Boc-V-P-R-AMC Fluorogenic Peptide Substrate in vitro.
pH-dependent catalytic activity of mesotrypsin: . We obtained the profile of by curve-fitting the relative activity of mouse mesotrypsin at different pH values (Supplementary Fig. 5b). The relative activity was the ratio of the catalytic activity of mesotrypsin measured at each pH to that at pH 7.8 (optimal), where the catalytic activity was obtained from the degradation rates of BODIPY FL casein in vitro.
pH-dependent association and dissociation rates: and . Deraison et al. measured and at several pH values using surface plasmon resonance analysis . Their values were used to obtain the profiles of and via curvefitting (Supplementary Fig. 5c).
Concentrations at the SG/SC boundary: and . We assumed values for and based on published measurement data (Table 2).
Mesotrypsin concentrations: . We fixed the values while tuning and in our simulation because appears only in the forms of or in our model. We chose to be of the same order as that of the concentrations of total KLKs . This allowed us to compare the contributions of KLK autoactivation versus mesotrypsin-mediated KLK activation ( . and by comparing the values of and .
Transition rates of pro-KLKs, KLKs, LEKTI, and the KLK-LEKTI complex in the SC: . We assumed that proteins and corneocytes had the same transit time (the time for corneocytes to transit from the SG/ SC boundary to the SC surface) in the SC and adopted as the SC transit time of corneocytes in mice was measured to be 5 days ( days day day .
Rate constant of mesotrypsin-mediated LEKTI elimination: . The dynamics of the total concentration of LEKTI ( ) depend on but are independent of KLK activation ( and ), as described by a combination of Eqs. (17) and (18):
To obtain representative values of , we conducted model simulations using values from 0 to and picked the values of that make decrease to (no degradation), (continuous decrease), and (complete depletion) at , that is, , or 0.0001 , respectively. No degradation, continuous decreases, and complete depletion of LEKTI corresponded to the three example spatial distributions of LEKTI across the SC. These three scenarios would allow us to deduce the effects of on our results for the entire range of , but information on the spatial distribution of LEKTI was lacking.
The selected values of were , and for (stepwise); , and for (gradient); and , and for pH 7357 (gradient) (Supplementary Fig. 5d). We confirmed that the model simulations using these values exhibited no LEKTI degradation (solid lines in Supplementary Fig. 5e), continuous decreases in LEKTI (dashed lines), or complete LEKTI depletion (dotted lines), respectively.
Rates of pro-KLK activation via autoactivation ( ) and via mesotrypsin ( ). We identified the values of and that reproduced the expected dynamics for the total concentration of KLKs is expected to increase throughout the SC because the close proximity (indicating interactions) between pro-KLKs and mesotrypsin throughout the SC suggests that the activation of pro-KLKs to KLKs occurs throughout the SC, where activated KLK exists either on its own or within the KLK-LEKTI complexes. To reproduce this expected behavior, we chose values of , and that determined the dynamics of , as described by a combination of Eq. (16) and (18):
Note that the dynamics of depend on (Eq. (2)).
Using the values of determined (under “Rate constant of mesotrypsin-mediated LEKTI elimination: ), we performed model simulations for different values of and (both from to ) to identify example values of and that reproduced the increases in throughout the SC. We specifically evaluated whether increases in in the upper half of the SC ( 0.5 ) were comparable ( ) to those in the bottom half of the SC ( ) and whether increased significantly (more than of , which is the maximal increase in ) throughout the , that is,
where and .
Our model simulation revealed that certain values of and satisfied the conditions in Eqs. (21) and (22) for each value (Supplementary Fig. 5f, g, and 6a). We found that four combinations of and values, which corresponded to the edges and center of the identified areas for the condition in Eqs. (21) and (22), showed continuous increases in throughout the SC (Supplementary Fig. 6a). However, combinations of and values that did not satisfy the conditions in Eqs. (21) and (22) failed to increase (Supplementary Fig. 6a) or activated most of the pro-KLKs in the bottom half of the SC, leaving only minimal activation of pro-KLKs in the upper half of the SC (Supplementary Fig. 6a).
Model simulation. We simulated the catalytic activity of KLKs in murine SC using hypothetical pH profiles (Fig. 6b-d) to evaluate the biological importance of stepwise pH profiles in murine SC . To test whether our models with different pH gradients could reproduce the increases in toward the SC surface, we performed a simulation for the range of and values identified above (under “Rates of pro-KLK activation via autoactivation ( ) and via mesotrypsin ( “) and the three example values for determined above (under “Rate constant of mesotrypsin-mediated LEKTI elimination: ). We evaluated the increases in from to , i.e., (Supplementary Fig. 6b). In addition, we simulated the catalytic activity of KLKs in uniform pH 5.4 and pH 7.0 models, respectively (Supplementary Fig. 6c). To interpret the influence of disrupted pH profiles on SC homeostasis, we performed a simulation of our model using , and values within the parameter ranges identified above (under “Rates of pro-KLK activation via autoactivation ( ) and via mesotrypsin ( )”) and the three example values for determined above (under “Rate constant of mesotrypsin-mediated LEKTI elimination: ).
Reporting summary
Further information on research design is available in the Nature Portfolio Reporting Summary linked to this article.
Data availability
The raw data generated in this study to plot graphs and uncropped Western blots are provided in the Source Data file. Source data are provided with this paper.
Matsui, T. & Amagai, M. Dissecting the formation, structure and barrier function of the stratum corneum. Int. Immunol. 27, 269-280 (2015).
Kubo, A., Nagao, K. & Amagai, M. Epidermal barrier dysfunction and cutaneous sensitization in atopic diseases. J. Clin. Investig. 122, 440-447 (2012).
Alibardi, L. Adaptation to the land: The skin of reptiles in comparison to that of amphibians and endotherm amniotes. J. Exp. Zool. B Mol. Dev. Evol. 298, 12-41 (2003).
Eckhart, L., Ehrlich, F. & Tschachler, E. A stress response program at the origin of evolutionary innovation in the skin. Evol. Bioinform. Online 15, 1176934319862246 (2019).
Byrd, A. L., Belkaid, Y. & Segre, J. A. The human skin microbiome. Nat. Rev. Microbiol. 16, 143-155 (2018).
Nemes, Z. & Steinert, P. M. Bricks and mortar of the epidermal barrier. Exp. Mol. Med. 31, 5-19 (1999).
Brown, S. J. & McLean, W. H. One remarkable molecule: filaggrin. J. Invest. Dermatol. 132, 751-762 (2012).
Nováčková, A. et al. Acidic pH is required for the multilamellar assembly of skin barrier lipids in vitro. J. Invest. Dermatol. 141, 1915-1921.e1914 (2021).
Miyai, M. et al. Keratinocyte-specific mesotrypsin contributes to the desquamation process via kallikrein activation and LEKTI degradation. J. Invest. Dermatol. 134, 1665-1674 (2014).
Matsui T., et al. A unique mode of keratinocyte death requires intracellular acidification. Proc. Natl Acad. Sci. USA 118, e2020722118 (2021).
Simpson, C. L. et al. NIX initiates mitochondrial fragmentation via DRP1 to drive epidermal differentiation. Cell Rep. 34, 108689 (2021).
Ohman, H. & Vahlquist, A. In vivo studies concerning a pH gradient in human stratum corneum and upper epidermis. Acta Derm. Venereol. 74, 375-379 (1994).
Hanson, K. M. et al. Two-photon fluorescence lifetime imaging of the skin stratum corneum pH gradient. Biophys J. 83, 1682-1690 (2002).
Niesner, R. et al. 3D-resolved investigation of the pH gradient in artificial skin constructs by means of fluorescence lifetime imaging. Pharm. Res. 22, 1079-1087 (2005).
Nagao, K. et al. Stress-induced production of chemokines by hair follicles regulates the trafficking of dendritic cells in skin. Nat. Immunol. 13, 744-752 (2012).
Eberlein-König, B. et al. Skin surface pH, stratum corneum hydration, trans-epidermal water loss and skin roughness related to atopic eczema and skin dryness in a population of primary school children. Acta Derm. Venereol. 80, 188-191 (2000).
Elias, P. M. Stratum corneum acidification: how and why? Exp. Dermatol. 24, 179-180 (2015).
Elias, P. M. The how, why and clinical importance of stratum corneum acidification. Exp. Dermatol. 26, 999-1003 (2017).
Grice, E. A. et al. Topographical and temporal diversity of the human skin microbiome. Science 324, 1190-1192 (2009).
Grice, E. A. & Segre, J. A. The skin microbiome. Nat. Rev. Microbiol. 9, 244-253 (2011).
Fernández-Calviño, D. & Bååth, E. Growth response of the bacterial community to pH in soils differing in pH. FEMS Microbiol. Ecol. 73, 149-156 (2010).
Nagai, T. et al. A variant of yellow fluorescent protein with fast and efficient maturation for cell-biological applications. Nat. Biotechnol. 20, 87-90 (2002).
Tojima, T. et al. Attractive axon guidance involves asymmetric membrane transport and exocytosis in the growth cone. Nat. Neurosci. 10, 58-66 (2007).
Matsui, T. et al. SASPase regulates stratum corneum hydration through profilaggrin-to-filaggrin processing. EMBO Mol. Med. 3, 320-333 (2011).
Jayaraman, S., Haggie, P., Wachter, R. M., Remington, S. J. & Verkman, A. S. Mechanism and cellular applications of a green fluorescent protein-based halide sensor. J. Biol. Chem. 275, 6047-6050 (2000).
Manabe, M., Sanchez, M., Sun, T. T. & Dale, B. A. Interaction of filaggrin with keratin filaments during advanced stages of normal human epidermal differentiation and in ichthyosis vulgaris. Differentiation 48, 43-50 (1991).
Candi, E., Schmidt, R. & Melino, G. The cornified envelope: a model of cell death in the skin. Nat. Rev. Mol. Cell Biol. 6, 328-340 (2005).
Kubo, A. et al. The stratum corneum comprises three layers with distinct metal-ion barrier properties. Sci. Rep. 3, 1731 (2013).
Yoshida, K. et al. Functional tight junction barrier localizes in the second layer of the stratum granulosum of human epidermis. J. Dermatol. Sci. 71, 89-99 (2013).
Yokouchi, M. & Kubo, A. Maintenance of tight junction barrier integrity in cell turnover and skin diseases. Exp. Dermatol. 27, 876-883 (2018).
Furuse, M. et al. Claudin-based tight junctions are crucial for the mammalian epidermal barrier: a lesson from claudin-1-deficient mice. J. Cell Biol. 156, 1099-1111 (2002).
Hadj-Rabia, S. et al. Claudin-1 gene mutations in neonatal sclerosing cholangitis associated with ichthyosis: a tight junction disease. Gastroenterology 127, 1386-1390 (2004).
Tokumasu, R. et al. Dose-dependent role of claudin-1 in vivo in orchestrating features of atopic dermatitis. Proc. Natl Acad. Sci. USA 113, E4061-E4068 (2016).
Nakatsuji, T. et al. Staphylococcus aureus exploits epidermal barrier defects in atopic dermatitis to trigger cytokine expression. J. Invest. Dermatol. 136, 2192-2200 (2016).
Sonesson, A. et al. Identification of bacterial biofilm and the Staphylococcus aureus derived protease, staphopain, on the skin surface of patients with atopic dermatitis. Sci. Rep. 7, 8689 (2017).
Watt, F. M. Terminal differentiation of epidermal keratinocytes. Curr. Opin. Cell Biol. 1, 1107-1115 (1989).
Ishida-Yamamoto, A. & Kishibe, M. Involvement of corneodesmosome degradation and lamellar granule transportation in the desquamation process. Med. Mol. Morphol. 44, 1-6 (2011).
Deraison, C. et al. LEKTI fragments specifically inhibit KLK5, KLK7, and KLK14 and control desquamation through a pH-dependent interaction. Mol. Biol. Cell 18, 3607-3619 (2007).
Ovaere, P., Lippens, S., Vandenabeele, P. & Declercq, W. The emerging roles of serine protease cascades in the epidermis. Trends Biochem. Sci. 34, 453-463 (2009).
Proksch, E. pH in nature, humans and skin. J. Dermatol. 45, 1044-1052 (2018).
Richter, T. et al. Dead but highly dynamic-the stratum corneum is divided into three hydration zones. Skin Pharmacol. Physiol. 17, 246-257 (2004).
Dyring-Andersen, B. et al. Spatially and cell-type resolved quantitative proteomic atlas of healthy human skin. Nat. Commun. 11, 5587 (2020).
Narangifard, A. et al. Molecular reorganization during the formation of the human skin barrier studied in situ. J. Invest. Dermatol. 141, 1243-1253.e1246 (2021).
Jin, Q. & Kirk, M. F. pH as a Primary Control in Environmental Microbiology: 1. Thermodynamic Perspective. Front. Environ. Sci. 6, 21 (2018).
Kim, M. et al. Transcriptomic analysis of the major orphan ichthyosis subtypes reveals shared immune and barrier signatures. J. Invest. Dermatol. 142, 2363-2374.e2318 (2022).
Atsugi, T. et al. Holocrine secretion occurs outside the tight junction barrier in multicellular glands: lessons from Claudin-1-deficient mice. J. Invest. Dermatol. 140, 298-308.e295 (2020).
Kawamoto, T. & Kawamoto, K. Preparation of thin frozen sections from nonfixed and undecalcified hard tissues using Kawamot’s film method (2012). Methods Mol. Biol. 1130, 149-164 (2014).
de Jong, N. W., van der Horst, T., van Strijp, J. A. & Nijland, R. Fluorescent reporters for markerless genomic integration in Staphylococcus aureus. Sci. Rep. 7, 43889 (2017).
Uberoi, A. et al. Commensal microbiota regulates skin barrier function and repair via signaling through the aryl hydrocarbon receptor. Cell Host Microbe. 29, 1235-1248.e1238 (2021).
SanMiguel, A. J., Meisel, J. S., Horwinski, J., Zheng, Q. & Grice, E. A. Topical antimicrobial treatments can elicit shifts to resident skin bacterial communities and reduce colonization by Staphylococcus aureus Competitors. Antimicrob. Agents Chemother. 61, e00774-17 (2017).
Ishida-Yamamoto, A. et al. LEKTI is localized in lamellar granules, separated from KLK5 and KLK7, and is secreted in the extracellular spaces of the superficial stratum granulosum. J. Invest. Dermatol. 124, 360-366 (2005).
Ishida-Yamamoto, A. et al. Epidermal lamellar granules transport different cargoes as distinct aggregates. J. Invest. Dermatol. 122, 1137-1144 (2004).
Wu, Y. et al. Upregulation of kallikrein-related peptidase 5 is associated with the malignant behavior of colorectal cancer. Mol. Med. Rep. 14, 2164-2170 (2016).
Komatsu, N. et al. Correlation between SPINK5 gene mutations and clinical manifestations in Netherton syndrome patients. J. Invest. Dermatol. 128, 1148-1159 (2008).
Fortugno, P. et al. Proteolytic activation cascade of the Netherton syndrome-defective protein, LEKTI, in the epidermis: implications for skin homeostasis. J. Invest. Dermatol. 131, 2223-2232 (2011).
Potten, C. S., Saffhill, R. & Maibach, H. I. Measurement of the transit time for cells through the epidermis and stratum corneum of the mouse and guinea-pig. Cell Tissue Kinet. 20, 461-472 (1987).
Fukuda K. Data analysis code for ‘Three stepwise pH progressions in stratum corneum for homeostatic maintenance of the skin’. https:// doi.org/10.5281/zenodo. 10871884
Acknowledgements
We thank R. Ozawa for assisting with the generation of , B6.VH148GmC , and B6.Display- mice, R. Yokoo for isolating SG1 cells and assisting confocal imaging analysis of SG1 cells, Hachiro Iseki for electron microscopy imaging, and M. Furuse for sharing the Cldn1 frozen mouse embryo. This project was supported by Japan Society for the Promotion of Science (JSPS) Grant-in-Aid for Scientific Research (S) (22HO4994 awarded to M.A.), JSPS Grant-in-Aid for Innovative Areas (15H05948 awarded to A.M), JSPS Grant-in-Aid for Scientific Research (C) ( awarded to K.F.) and Japan Agency for Medical Research and Development (AMED) (JP21ek0410058 and 21gm1010001 awarded to M.A.).
Author contributions
K.F., Y.I., Y.F., T.Ma., A.M., and M.A. designed the study. K.F., Y.I., Y.F., and T.Ma. performed the experiments. H.H., T.Mi., M.V.L., and R.J.T. performed the mathematical modeling analysis. T.O. assisted with confocal microscopy techniques. A.M. provided VenusH148G-mCherry construct, assisted with image analysis, and provided feedback on the
manuscript. K.F., Y.I., and M.A. wrote the manuscript, and all authors read and edited the manuscript.
Competing interests
The authors declare no competing interests.
Ethics
All animal experiments were performed in accordance with the Ethical Guidelines of the Animal Care and Use Committee of the RIKEN Yokohama Institute (AEY2021-018(2)), Keio University Institutional Animal Care and Use Committee (A2022-285), and ARRIVE guidelines.
Correspondence and requests for materials should be addressed to Masayuki Amagai.
Peer review information Nature Communications thanks Cory Simpson, and the other, anonymous, reviewer(s) for their contribution to the peer review of this work. A peer review file is available.
Publisher’s note Springer Nature remains neutral with regard to jurisdictional claims in published maps and institutional affiliations.
Open Access This article is licensed under a Creative Commons Attribution 4.0 International License, which permits use, sharing, adaptation, distribution and reproduction in any medium or format, as long as you give appropriate credit to the original author(s) and the source, provide a link to the Creative Commons licence, and indicate if changes were made. The images or other third party material in this article are included in the article’s Creative Commons licence, unless indicated otherwise in a credit line to the material. If material is not included in the article’s Creative Commons licence and your intended use is not permitted by statutory regulation or exceeds the permitted use, you will need to obtain permission directly from the copyright holder. To view a copy of this licence, visit http://creativecommons.org/ licenses/by/4.0/.
(c) The Author(s) 2024
(D) Check for updates
Laboratory for Skin Homeostasis, RIKEN Center for Integrative Medical Sciences, Kanagawa, Japan. Department of Dermatology, Keio University School of Medicine, Tokyo, Japan. Laboratory for Evolutionary Cell Biology of the Skin, School of Bioscience and Biotechnology, Tokyo University of Technology, Tokyo, Japan. Department of Bioengineering, Imperial College London, London, UK. Laboratory for Tissue Dynamics, RIKEN Center for Integrative Medical Sciences, Kanagawa, Japan. Graduate School of Medical Life Science, Yokohama City University, Kanagawa, Japan. Laboratory for Cell Function Dynamics, RIKEN Center for Brain Science, Saitama, Japan. These authors contributed equally: Keitaro Fukuda, Yoshihiro Ito, Yuki Furuichi. e-mail: amagai@keio.jp