DOI: https://doi.org/10.1038/s41586-024-08383-z
PMID: https://pubmed.ncbi.nlm.nih.gov/39779856
تاريخ النشر: 2025-01-08
حالة خلوية نادرة من PRIMER في مناعة النبات
تاريخ الاستلام: 26 ديسمبر 2023
تم القبول: 8 نوفمبر 2024
نُشر على الإنترنت: 8 يناير 2025
الوصول المفتوح
تحقق من التحديثات
الملخص
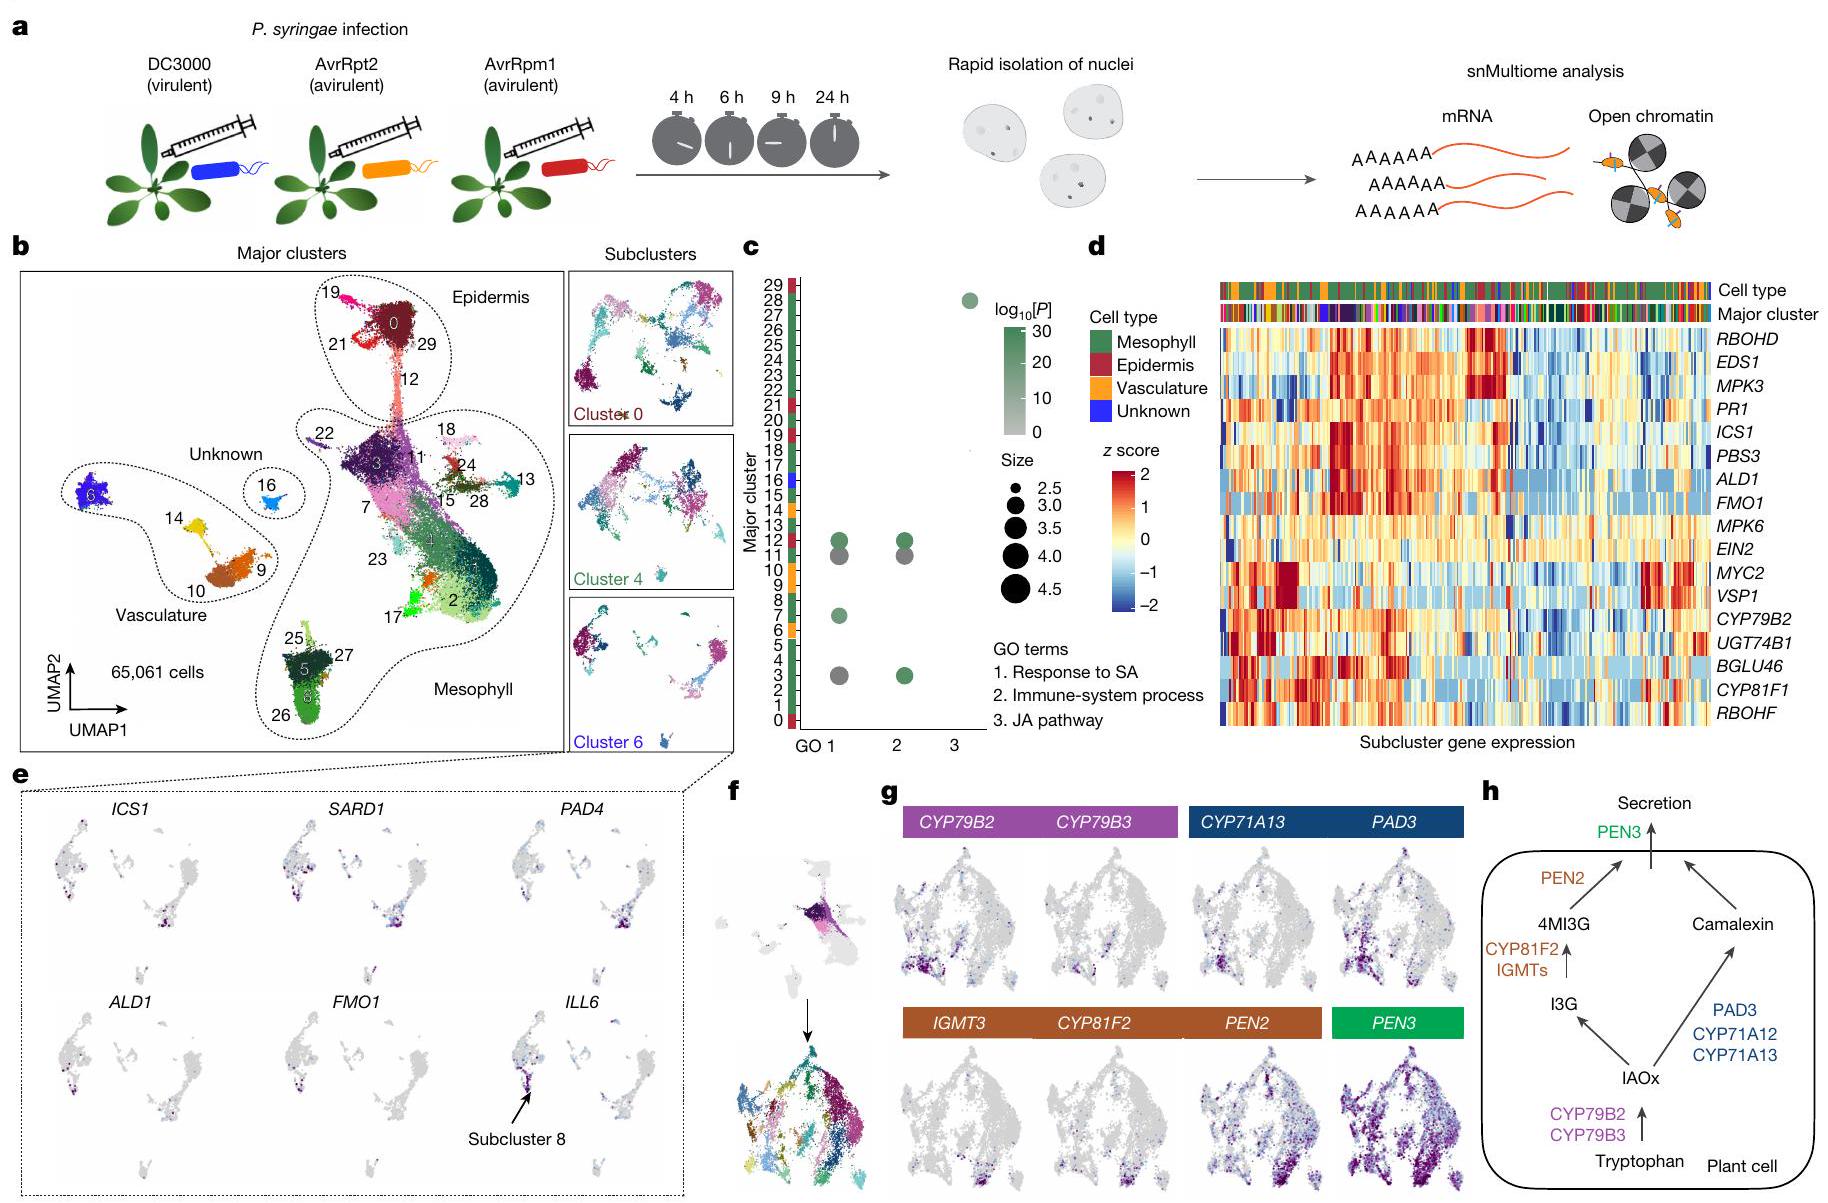
تفتقر النباتات إلى خلايا مناعية متخصصة ومتحركة. وبالتالي، يجب على أي نوع من الخلايا التي تواجه مسببات الأمراض أن تقوم بردود فعل مناعية وتتواصل مع الخلايا المحيطة بها من أجل الدفاع الناجح. ومع ذلك، فإن تنوع وتنظيم الفضاء ووظيفة حالات المناعة الخلوية في النباتات المصابة بمسببات الأمراض غير مفهومة بشكل جيد.
تحليل snMultiome المعتمد على الزمن
تواجه خلايا مسببات الأمراض. تم أخذ عينات من الأوراق المصابة في أربع نقاط زمنية مختلفة
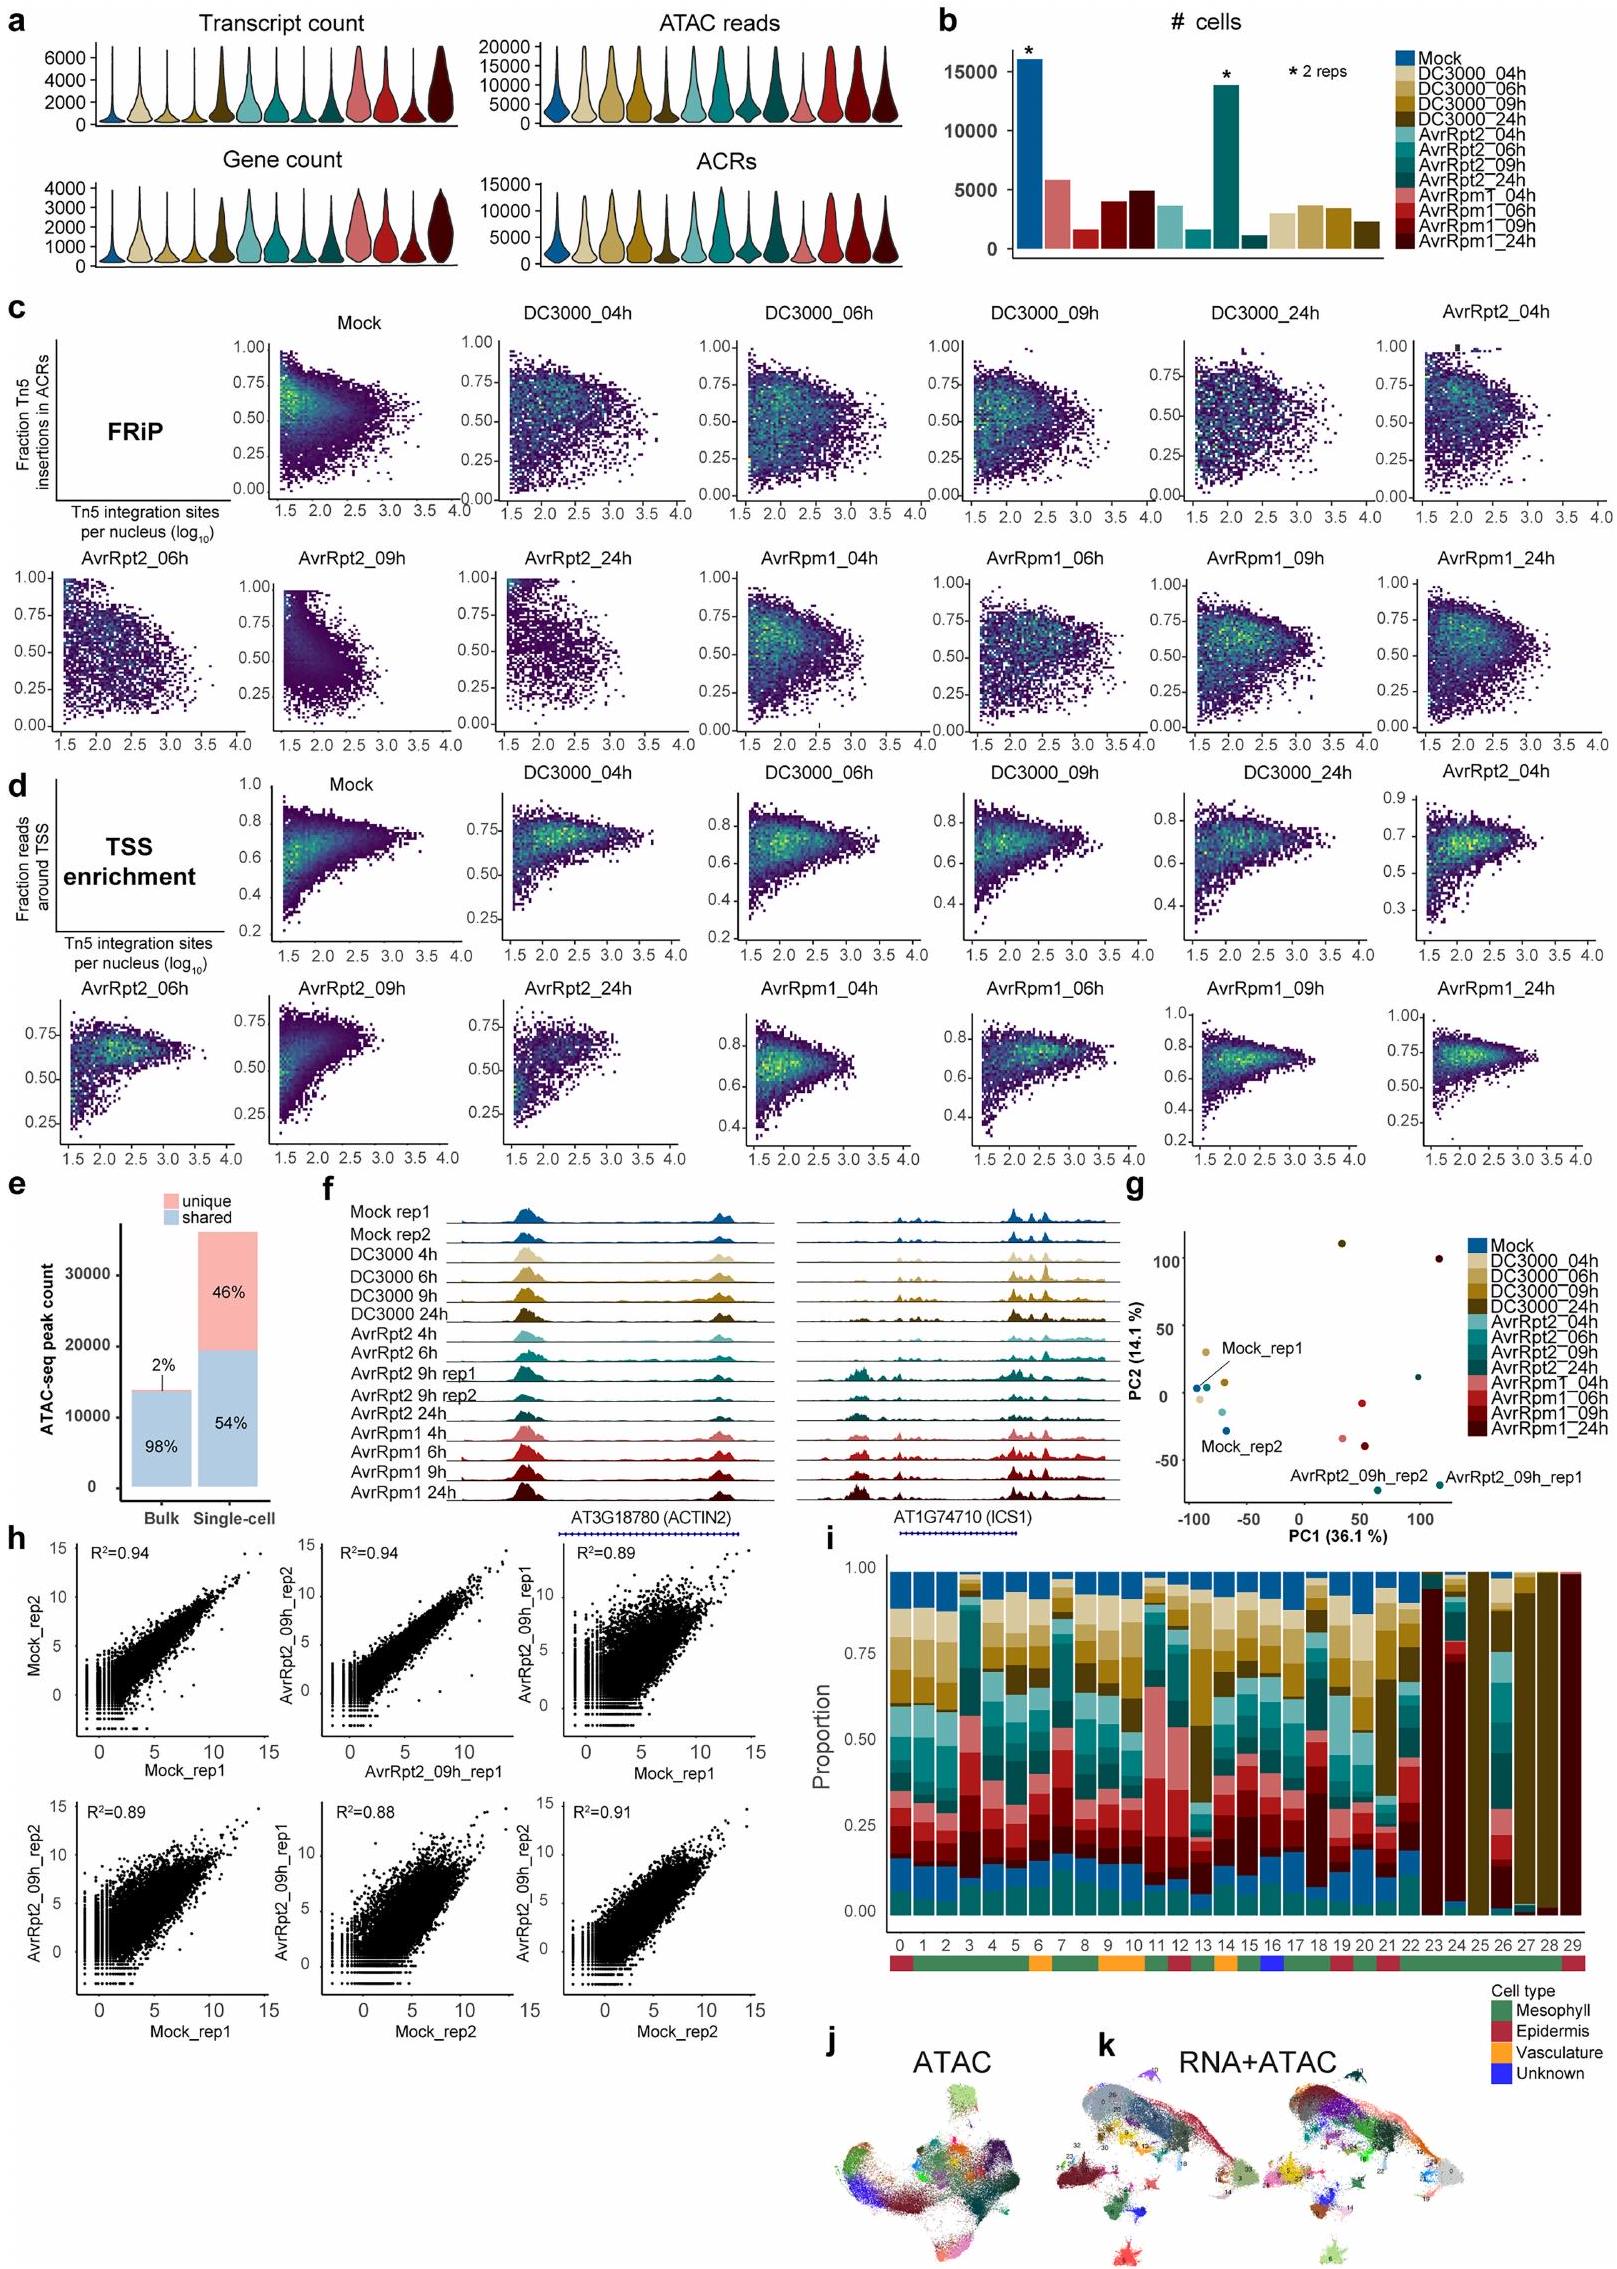
الشروط وفي نقاط زمنية محددة (الشكل البياني الموسع 1i)، مما يشير إلى أن تحليل التجميع التقط حالات خلوية متميزة ناتجة عن عدوى مسببات الأمراض. حددنا الجينات المعبر عنها بشكل خاص في التجمعات الفردية (تم عرض العلامات الرئيسية في الشكل البياني الموسع 2a)، مما أوضح بشكل أكبر هوية كل تجمع (تم عرض التوصيفات الرئيسية لأنواع الخلايا في الشكل 1b). تم أيضًا توقع أنواع الخلايا بناءً على بيانات ATAC-seq. على سبيل المثال، كان هناك ACR محدد للتجمعات (ذروة في الكروموسوم 2 في الموقع 11172821-11173529) للتجمعات 0، 12، 19، 21 و29 مرتبطًا بـ
التمثيل الحيوي
تشريح دقيق لحالات خلايا المناعة
ربط النسخ الجيني والإيبيجينوم
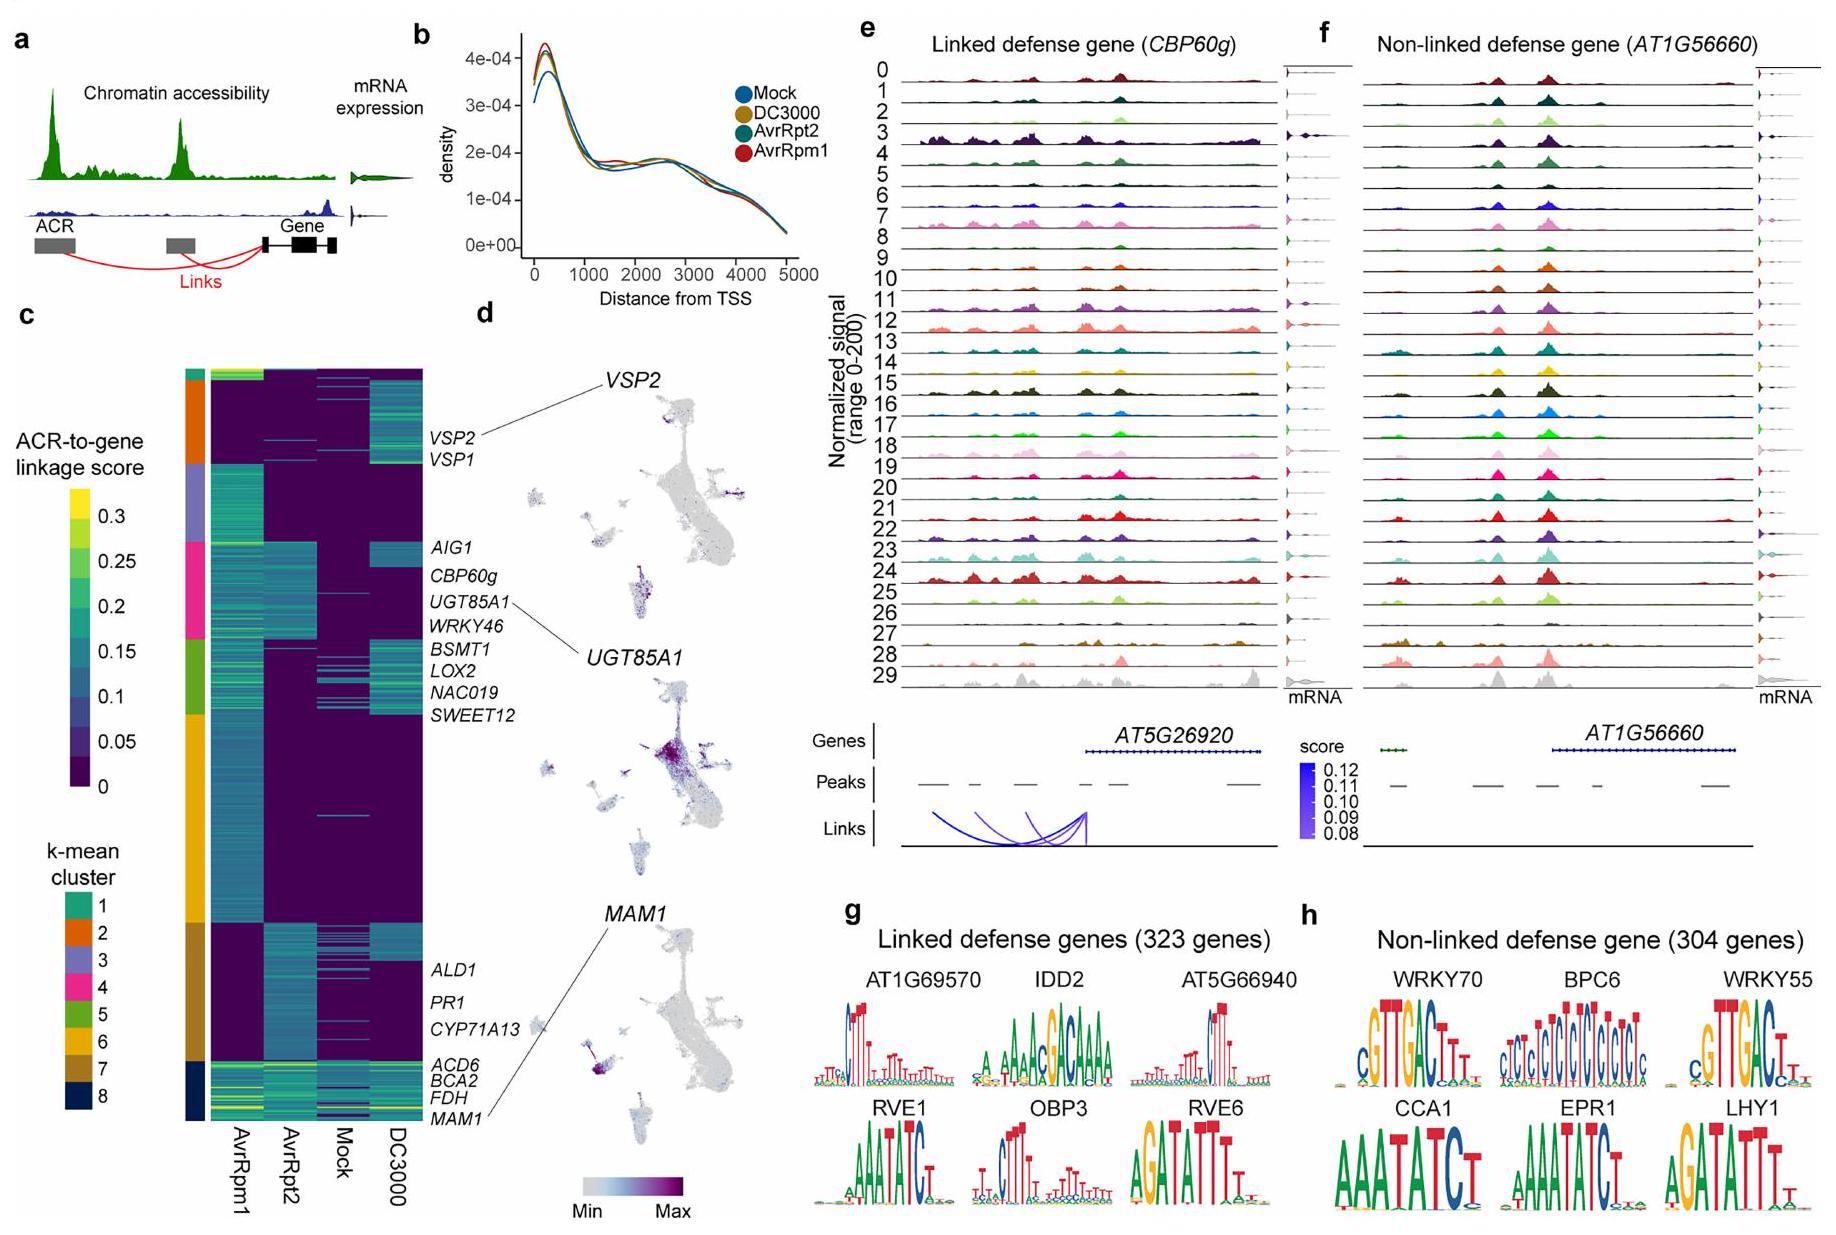
(البيانات الموسعة الأشكال 4ب و5أ). قمنا بتلخيص بيانات ارتباط القمة بالجين لكل جين باستخدام قيم معامل الارتباط بيرسون الأقصى (درجة ارتباط القمة بالجين) (البيانات الموسعة الشكل 4ج). كانت الجينات التي أظهرت روابط في جميع الظروف (العنقود 8؛ البيانات الموسعة الشكل 4ج) غنية بجينات علامات نوع الخلية مثل FDH وBCA2 وMAM1 (البيانات الموسعة الشكل 4ج، د). كانت الجينات التي أظهرت روابط بشكل خاص في ظروف تنشيط ETI (العنقود 4؛ البيانات الموسعة الشكل 4ج) غنية بجينات متعلقة بالمناعة (البيانات الموسعة الأشكال 4د و5ب). كان CBP60G، وهو منظم نسخي للمناعة، لديه عدة ACRs حيث كانت الوصولية مرتبطة بشكل كبير بتعبير mRNA الخاص به (البيانات الموسعة الشكل 4هـ). كانت الجينات التي أظهرت روابط بشكل خاص في عدوى DC3000 (العنقود 2؛ البيانات الموسعة الشكل 4ج) غنية بجينات متعلقة بحمض الجاسمون (JA) (البيانات الموسعة الشكل 5ب). هذه النتيجة تتماشى مع قدرة DC3000 على تنشيط مسار JA في النباتات باستخدام السم coronatine والعوامل المؤثرة لقمع مناعة النبات.
تحديد وحدات الجينات TF-ACR
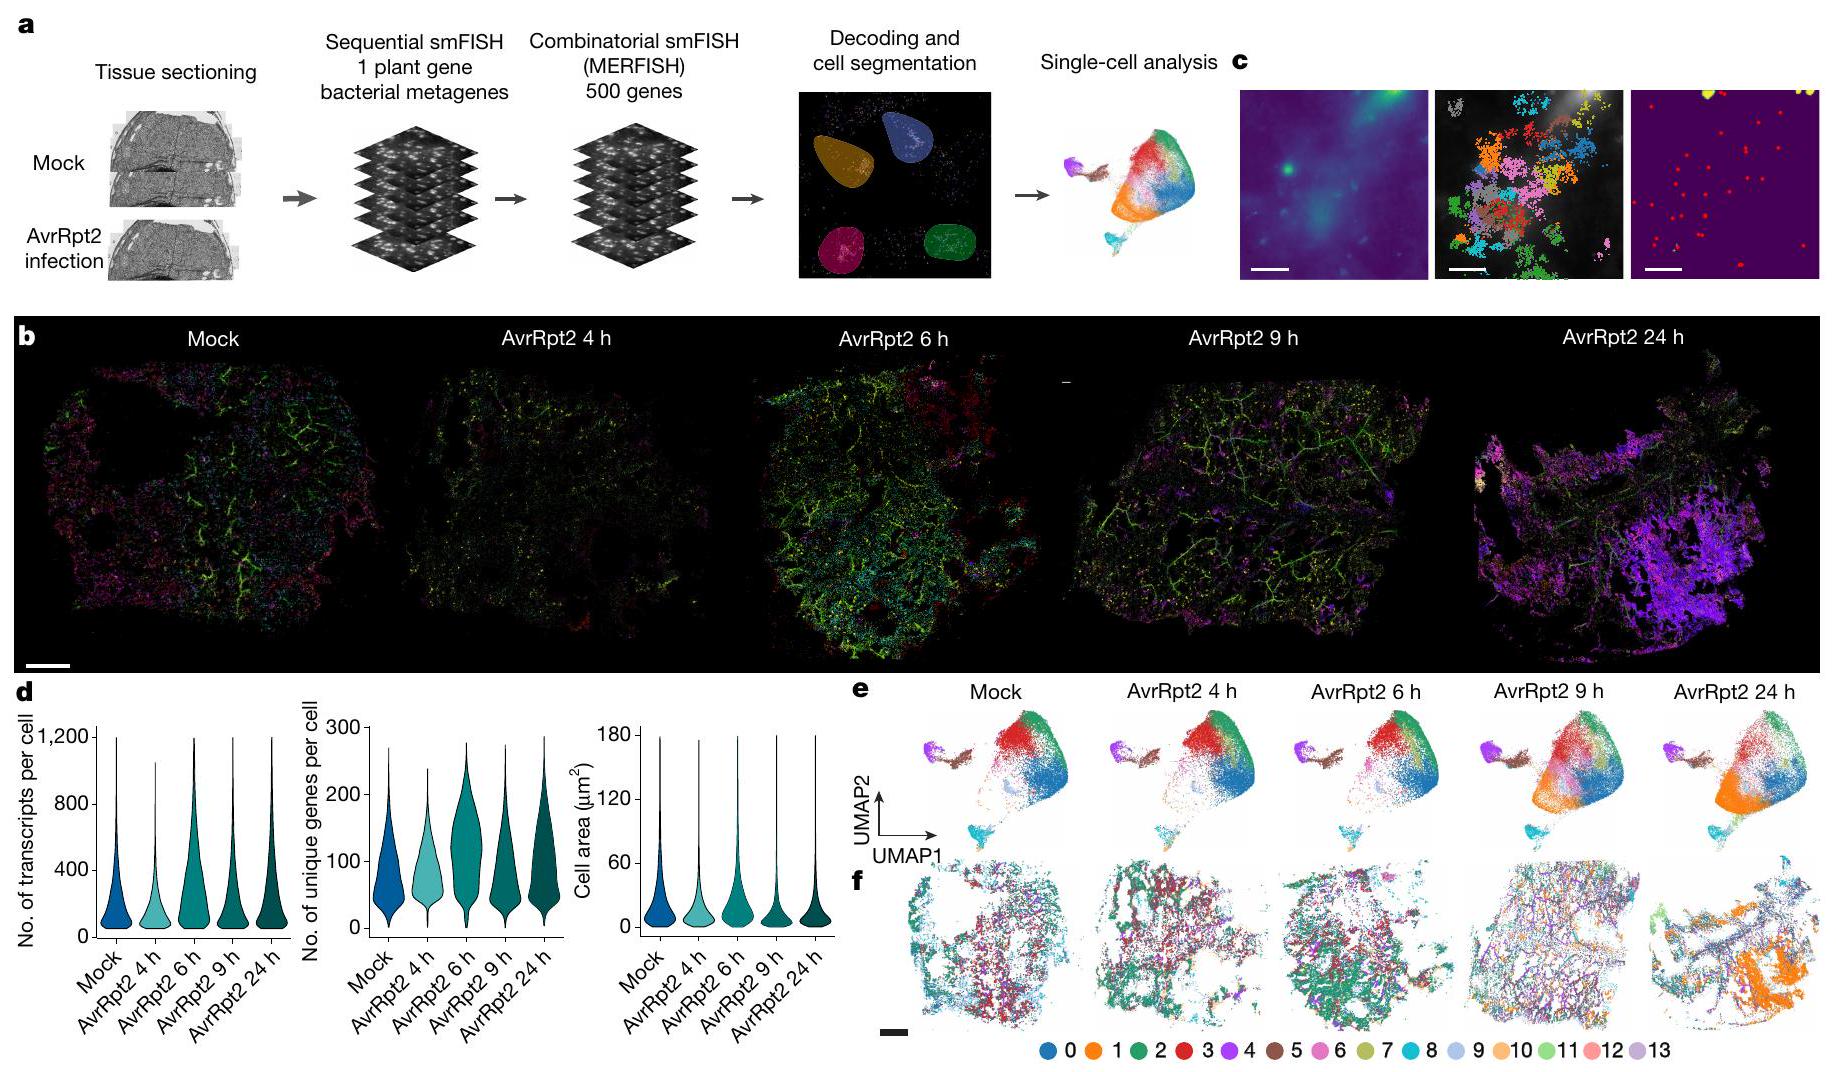
نتيجة الفشل في تقسيم الصبغة DAPI (المنطقة الصفراء). لوحظت أنماط مشابهة عبر مجالات الرؤية والعينات. تم تقديم تحليل كمي منهجي في الشكل 7f من البيانات الموسعة. د، مخططات الكمان تظهر عدد النسخ لكل خلية (يسار) والجينات الفريدة لكل خلية (وسط) المكتشفة في كل عينة MERFISH وحجم المنطقة لكل خلية (يمين). هـ، تمثيلات UMAP للخلايا في كل عينة بناءً على تعبير 500 جين تم اكتشافه باستخدام MERFISH. تم دمج جميع عينات MERFISH، وتم تلوين الخلايا بناءً على مجموعات Leiden الجديدة. و، رسم خرائطي مكاني لمجموعات Leiden في كل عينة باستخدام نفس نظام الألوان كما في هـ. مقياس الرسم،
دمج snMultiome و MERFISH
نمذجة ديناميات استجابة المناعة
أساس أنواع الخلايا الرئيسية: البشرة (أرجواني)، الميزوفيل (أخضر) والأنسجة الوعائية (أصفر). على اليمين، رسم خرائطي مكاني لخلايا snMultiome ملونة بناءً على أنواع الخلايا الرئيسية. تم استخدام عينة AvrRpt2 بعد 9 ساعات من الإصابة. مقياس الرسم، 1 مم. د، قيم الزمن الزائف المحسوبة لخلايا الميزوفيل في بيانات snRNA-seq. هـ، مخططات UMAP تظهر قيم الزمن الزائف في خلايا من كل نقطة زمنية. و، رسم خرائطي مكاني لقيم الزمن الزائف بناءً على دمج البيانات ونقل العلامات.
من خلال تطبيق تحليل الزمن الزائف على نوع خلية تطورية واحد مع حالات مناعية متنوعة، تمكنا من نمذجة الديناميات الزمنية للاستجابة المناعية والعدوى المتنوعة في ورقة مصابة بشكل أفضل. أظهرت حسابات درجات الزمن الزائف لخلايا الميزوفيل (الشكل 4d والطرق) أن توزيع درجات الزمن الزائف المتوقعة في كل عينة كان متسقًا مع ما هو متوقع من نقطة زمنية حقيقية (الشكل 4e). أي أن الخلايا ذات درجات الزمن الزائف المنخفضة كانت متزايدة في النقاط الزمنية المبكرة، بينما ظهرت الخلايا ذات درجات الزمن الزائف العالية في النقاط الزمنية اللاحقة. تشير هذه النتيجة إلى أن الديناميات الزمنية للاستجابات المناعية تم نمذجتها بنجاح. كانت هناك خلايا تتراوح درجات الزمن الزائف فيها بشكل واسع تتواجد في 9 و 24 ساعة بعد الإصابة، مما يشير إلى أن الاستجابات المناعية الخلوية غير متزامنة في الأوراق المصابة.
رسم الخرائط المكانية للبكتيريا
قمنا بإجراء تجربة MERFISH أخرى باستخدام ورقة من A. thaliana مصابة بالعامل الممرض المثبط للمناعة DC3000 بعد 24 ساعة من الإصابة. تداخل توزيع السلالة المحفزة للمناعة AvrRpt2 مع مناطق الأنسجة ذات درجات الزمن الزائفة العالية (مُعززة للمناعة) على عكس سلالة DC3000 المثبطة للمناعة. أكدنا هذه الملاحظة من خلال تحليل كمي لخلايا النبات المجاورة لمستعمرات البكتيريا الفردية. مجتمعة، تشير هذه النتائج إلى أن المناطق النشطة مناعياً التي حددها تحليل الزمن الزائف تتفاعل مع العامل الممرض المحفز للاستجابة المناعية؛ كما قمنا بالتقاط احتمالية تثبيط المناعة بواسطة العامل الممرض الفتاك DC3000.
خلايا PRIMER وخلايا المراقب
تمت معالجته بالماء (M) أو DC3000 (DC) بعد 24 ساعة من الإصابة. DEGs (معدلة
الموتيفات (الشكل 5i والشكل الإضافي 9i). كانت الجينات التي تم إظهار أنها مثبطة بواسطة CAMTA3 مفرطة التمثيل بشكل كبير في خلايا المتفرج مقارنة بخلايا PRIMER (الشكل 5j؛ معدل الاكتشاف الخاطئ (FDR)
نقاش
كشف أطلس الأوراق المصابة بالعوامل الممرضة عن حالات خلوية متنوعة بتفاصيل النسخ الجيني والحمض النووي الريبوزي. توفر هذه الموارد أيضًا وسيلة للتحقيق في حالات الخلايا الفردية التي تم إخفاؤها في التحليلات التقليدية للأنسجة الكلية أو المقطعة ومن خلال التصوير الحي لعدد محدود من خطوط التقارير. على سبيل المثال، حددنا مجموعة فرعية من PCC بحالة مميزة تتسم بتحفيز جينات SAR (الشكل 1e) ومجموعات فرعية من الميزوفيل التي تنشط فروعًا مختلفة من مسارات الأيض الدفاعية المشتقة من التربتوفان (الشكل 1g).
لقد أظهرت الاكتشافات الحديثة دور مستقبلات مجال ربط النوكليوتيدات وتكرارات الغلوتامين الغنيّة بالليوسين كقنوات كالسيوم أو NADases.
المحتوى عبر الإنترنت
- نوبوري، ت. وإيكر، ج. ر. هل لم تُصاب بعد؟ حل حالات الخلايا للنباتات تحت هجوم مسببات الأمراض. تقارير الخلايا. الطرق 3، 100538 (2023).
- نجو، ب. ب. م.، دينغ، ب. وجونز، ج. د. ج. ثلاثون عامًا من المقاومة: التعرج عبر نظام المناعة النباتي. خلية النبات 34، 1447-1478 (2022).
- زو، ج. وآخرون. تحليل الخلايا الفردية لأوراق الأرابيدوبسيس عند الإصابة ببكتيريا pseudomonas syringae. تقارير الخلايا. 42، 112676 (2023).
- تانغ، ب.، فنغ، ل.، هولين، م. ت.، دينغ، ب. وما، و. استجابات نوع الخلية المحددة للعدوى الفطرية في النباتات كما كشفتها تقنيات النسخ الجيني على مستوى الخلية الواحدة. خلية مضيف ميكروبhttps://doi. org/10.1016/j.chom.2023.08.019 (2023).
- زو، ج.، مورينو-بيريز، أ. وكوكر، ج. فهم تفاعلات مسببات الأمراض النباتية باستخدام التقنيات المكانية وتقنيات الخلية الواحدة. اتصالات. بيولوجيا. 6، 814 (2023).
- ماراند، أ. ب. وشميتز، ر. ج. تحليل الخلايا الفردية للعناصر التنظيمية الجانبية. الرأي الحالي في علم الأحياء النباتية 65، 102094 (2021).
- تشين، ك. هـ.، بويتجر، أ. ن.، موفيت، ج. ر.، وانغ، س. وزوانغ، إكس. تصوير RNA. تحليل RNA عالي التعددية ومحدد مكانيًا في خلايا مفردة. ساينس 348، aaa6090 (2015).
- شين، إكس.-إف. & هي، س. واي. بseudomonas syringae pv. tomato DC3000: نموذج للجراثيم لاستكشاف قابلية الإصابة بالأمراض وإشارات الهرمونات في النباتات. مراجعة سنوية لعلم أمراض النبات 51، 473-498 (2013).
- Whalen، M. C.، Innes، R. W.، Bent، A. F. و Staskawicz، B. J. تحديد مسببات الأمراض Pseudomonas syringae في Arabidopsis وموقع بكتيري يحدد عدم الفوعة على كل من Arabidopsis وفول الصويا. خلية النبات 3، 49-59 (1991).
- كونكل، ب. ن.، بينت، أ. ف.، دالبك، د.، إينيس، ر. و. & ستاسكاويكز، ب. ج. RPS2، موضع مقاومة الأمراض في الأرابيدوبسيس الذي يحدد التعرف على سلالات بseudomonas syringae التي تعبر عن جين عدم الفوعة avrRpt2. خلية النبات 5، 865-875 (1993).
- ديبينر، ت.، لينهكرز، هـ.، أرنولد، م. ودانجل، ج. ل. تحديد ورسم خرائط جزيئية لموقع واحد من أرابيدوبسيس ثاليانا يحدد المقاومة لعزل فطر فيتوباثوجيني من بseudomonas syringae. مجلة النبات 1، 289-302 (1991).
- دينغ، ب. وآخرون. مناظر وصول الكروماتين التي تنشطها مستقبلات المناعة على سطح الخلية وداخلها. ج. التجارب. نبات.https://doi.org/10.1093/jxb/erab373 (2021).
- بينغ، ي.، يانغ، ج.، لي، إكس. وزانغ، ي. حمض الساليسيليك: التخليق الحيوي والإشارات. مراجعة سنوية لبيولوجيا النباتات 72، 761-791 (2021).
- Wildermuth، م. س.، ديودني، ج.، وو، ج. و أوزوبل، ف. م. إن إنزيم الإيزوكوريسمات مطلوب لتخليق حمض الساليسيليك للدفاع النباتي. ناتشر 414، 562-565 (2001).
- خان، م. وآخرون. دور أكسيد النيتريك المحفز لـ ATILL6 في النمو ومقاومة الأمراض في أرابيدوبسيس ثاليانا. فرونت. بلانت ساي. 12، 685156 (2021).
- نوبوري، ت.، مين، أ. وتسودا، ك. الشبكات الجزيئية في هولوبيونت النبات والجراثيم. رسائل فيبس. 592، 1937-1953 (2018).
- شيب، أ. ن.، وو، ب.، بونروسترو، ج. د. & غرينليف، و. ج. chromVAR: استنتاج الوصول المرتبط بعوامل النسخ من بيانات الإبيجينوم أحادية الخلية. نات. ميثودز 14، 975-978 (2017).
- هو، ي.، دونغ، ق. ويو، د. WRKY46 في الأرابيدوبسيس يتعاون مع WRKY70 وWRKY53 في المقاومة الأساسية ضد الممرض Pseudomonas syringae. علوم النبات. 185-186، 288-297 (2012).
- سايلنز، و.، كانودت، ر.، تودوروف، هـ. وسايس، ي. مقارنة بين طرق استنتاج مسار الخلايا الفردية. نات. بيولوجيا حيوية.https://doi.org/10.1038/s41587-019-0071-9 (2019).
- كابل، د. م. وآخرون. استنتاج التعبير التفاضلي المحدد لنوع الخلية في النسخ الجيني المكاني. نات. ميثودزhttps://doi.org/10.1038/s41592-022-01575-3 (2022).
- يانغ، س. وآخرون. عائلة جينات BON/CPN تقمع موت الخلايا وتعزز نمو الخلايا في الأرابيدوبسيس. مجلة النبات 45، 166-179 (2006).
- تشين، ل.، زانغ، ل. ويو، د. تحفيز WRKY8 الناتج عن الجروح يشارك في الدفاع الأساسي في الأرابيدوبسيس. تفاعل النبات والميكروبات الجزيئي. 23، 558-565 (2010).
- جابز، ت.، ديترش، ر. أ. و دانجل، ج. ل. بدء موت الخلايا الهارب في طفرات الأرابيدوبسيس بواسطة سوبر أكسيد خارج الخلية. ساينس 273، 1853-1856 (1996).
- أيادي، م.، ديلابورت، ف.، لي، ي.-ف. وزو، د.-إكس. تحليل GT-3a يحدد مجموعة فرعية مميزة من عوامل النسخ المرتبطة بـ DNA ثلاثي الحلزونات في الأرابيدوبسيس. FEBS Lett. 562، 147-154 (2004).
- هنري، إ.، تورونو، ت. ي.، جانوه، أ.، ديسلاند، ل. وكوكر، ج. التصوير المباشر وغير المباشر لتوصيل العوامل البكتيرية إلى أنواع مختلفة من خلايا النباتات أثناء العدوى. خلية النبات 29، 1555-1570 (2017).
- نوبوري، ت.، أوليفا، م.، ليستر، ر. وإيكر، ج. ر. تحليل التعبير الجيني المكاني ثلاثي الأبعاد في الأنسجة النباتية باستخدام PHYTOMap. نات. بلانتسhttps://doi.org/10.1038/s41477-023-01439-41-8 (2023).
- تشاو، ج. وآخرون. العامل المؤثر لديدان الجذور Mi2GO2 يخطف عامل النسخ ثلاثي الحلزونات من نبات المضيف لتعزيز الطفيليات الدودية. اتصالات النبات. 5، 100723 (2024).
- هوانغ، س. وآخرون. تحديد وآلية مستقبلات الجزيئات الصغيرة المحفزة بواسطة TIR في مناعة النباتات. ساينس 377، eabq3297 (2022).
- وان، ل. وآخرون. مجالات TIR لمستقبلات المناعة النباتية هي إنزيمات تقطع NAD+ وتعزز موت الخلايا. ساينس 365، 799-803 (2019).
- يو، د. وآخرون. مجالات TIR لمستقبلات المناعة النباتية هي
-إنزيمات تخليق cAMP/cGMP التي تتوسط موت الخلايا. خلية 185، 2370-2386.e18 (2022). - إيسومان، ك.، ميلبراندت، ج.، دانجل، ج. ل. ونشي مورا، م. ت. الوظائف الإنزيمية المشتركة لـ TIR تنظم موت الخلايا والمناعة عبر شجرة الحياة. العلومhttps://doi.org/10.1126/science.abo0001 (2022).
- جيا، أ. وآخرون. تفاعلات ADP-ribosylation المحفزة بواسطة TIR تنتج جزيئات إشارة لمناعة النباتات. العلومhttps://doi.org/10.1126/science.abq8180 (2022).
- جاكوب، ب. وآخرون. مستقبلات المناعة “المساعدة” في النباتات هي
-قنوات كاتيون غير انتقائية قابلة للاختراق. العلوم 373، 420-425 (2021). - بي، ج. وآخرون. زار1 ريزستوسوم هو قناة قابلة لاختراق الكالسيوم تحفز إشارات المناعة في النباتات. خلية 184، 3528-3541 (2021).
- فوردر، أ. وآخرون. يحدد مقاوم القمح مبادئ شائعة لقنوات مستقبلات المناعة. الطبيعةhttps://doi.org/10.1038/s41586-022-05231-w (2022).
- روس، أ. ف. مقاومة مكتسبة موضعية لعدوى فيروس النبات في العوائل الحساسة بشكل مفرط. علم الفيروسات 14، 329-339 (1961).
- جاكوب، ب.، هيغ، ج. ودانجل، ج. ل. هل المقاومة المكتسبة الموضعية هي الآلية لمقاومة الأمراض الناتجة عن المحفزات في النباتات؟ نات. بلانتسhttps://doi.org/10.1038/s41477-023-01466-1 (2023).
- زافالييف، ر. وآخرون. تشكيل مكثفات NPR1 يعزز بقاء الخلايا خلال استجابة النبات المناعية. خليةhttps://doi.org/10.1016/j.cell.2020.07.016 (2020).
- جاكوب، ف. وآخرون. طفرة camta3 المتداخلة السائدة تضعف المخرجات النسخية الأولية التي تتوسطها كل من مستقبلات المناعة على سطح الخلية والمستقبلات داخل الخلوية في الأرابيدوبسيس ثاليانا. نيو فيتولوجي. 217، 1667-1680 (2018).

(ج) المؤلف(ون) 2025
طرق
المواد الكيميائية والمجموعات
رموز الجينات، الأسماء وأسماء المواقع المرتبة
نمو النبات والعدوى البكتيرية للتحليلات أحادية الخلية والمكانية
إنتاج نباتات معدلة وراثيًا واختبارات عدوى مسببات الأمراض
تم استخدام البلازميد كقالب لردين من تفاعل البلمرة المتسلسل (PCR) باستخدام أزواج من البرايمرات mEGFP_Nter_1_F بالإضافة إلى mEGFP_4R و mEGFP_4F بالإضافة إلى mEGFP_Nter_3R. تم تجميع هذه المنتجات من تفاعل البلمرة المتسلسل في pBICAscII المقطوع بواسطة Stul/Ascl، مما أدى إلى إنتاج pBIC_mEGFP_Nter. تم تضخيم قطعة من تفاعل البلمرة المتسلسل من pBIC_mEGFP_Nter باستخدام mEGFP_Cter_F1 بالإضافة إلى mEGFP_Cter_R، ثم تم استخدامها كقالب لتفاعل البلمرة المتسلسل باستخدام mEGFP_Cter_F2 بالإضافة إلى mEGFP_Cter_R. تم تجميع قطعة تفاعل البلمرة المتسلسل الناتجة في pBIC_mEGFP_Nter المقطوع بواسطة Stul/AscI للحصول على pBIC_mEGFP_Cter. تم تضخيم تسلسل الترميز لـ GT-3A (At5g1380) بواسطة تفاعل البلمرة المتسلسل باستخدام زوج البرايمرات GT3a_mEGFP_F بالإضافة إلى GT3a_mEGFP_R وتم تجميعه في pBIC_mEGFP_Cter المقطوع بواسطة Stul للحصول على pBIC_GT3a_mEGFP. تم تضخيم التسلسل الذي يشفر GT-3A المدمج مع mEGFP من pBIC_GT3a_mEGFP بواسطة تفاعل البلمرة المتسلسل باستخدام زوج من البرايمرات (
توليد نباتات gt3a-KO
تسلسل RNA الجماعي للنباتات
تم التنفيذ باستخدام fastp (الإصدار 0.19.7)
استخراج النوى وتسلسل النوى الفردية
تحليل متعدد الأوميات على مستوى الخلية الواحدة
(الإصدار 2.0.0) لبيانات snRNA-seq وبيانات snATAC-seq، على التوالي. بالنسبة لـ snRNA-seq، تم استخدام خيار -include-introns لمحاذاة القراءات إلى النسخة النووية لـ A. thaliana التي تم بناؤها باستخدام جينوم TAIR10 ونسخة Araport 11. تم إزالة جينوم البلاستيد من الجينوم المرجعي لتحليل بيانات كل من snRNA-seq وsnATAC-seq.
تجميع snRNA-seq. تم إجراء تجميع snRNA-seq باستخدام حزمة R Seurat. تم تطبيع مصفوفة عدد RNA لكل خلية باستخدام SCTransform. تم إجراء تقليل الأبعاد باستخدام تحليل المكونات الرئيسية مع RunPCA. تم تقليل التباين الفني بين العينات باستخدام Harmony.
استدعاء قمم snATAC-seq. تم استدعاء القمم بشكل مستقل على كل مجموعة تم تعريفها بواسطة بيانات snRNA-seq ثم تم دمجها باستخدام وظيفة CallPeaks من Signac، التي تستخدم MACS2 مع المعلمات التالية: effective.genome.size
تجميع snATAC-seq. تم إجراء تقليل الأبعاد باستخدام الفهرسة الدلالية الكامنة (LSI)
تم إسقاطه في مساحة مخفضة إضافيًا باستخدام UMAP (عدد الجيران = 30 و min.dist
المقارنات بين خلايا PRIMER وخلايا المتفرجين
تحليل تسلسل RNA غير المشفر من النباتات gt3a-KO
مقارنات بين بيانات الأومكس على مستوى الخلية الواحدة والبيانات الكمية
ميرفيش
تم تحضينها وتكييفها في OCT (Fisher) لمدة 5 دقائق. بعد التحضين، تم تجميد الأوراق على الفور كما هو موصوف سابقًا.
عدد الخلايا الفريدة عبر جميع المناطق. تم استخدام هذا الرقم بعد ذلك لتهيئة الأمر –num-cells-init في أداة تقسيم أخرى، Baysor
لاختبار جودة طريقة تقسيمنا القائمة على النسخ، استخدمنا FOV مع صبغ DAPI ناجح (وهو نادر في عيناتنا) وأجرينا تقسيمًا قائمًا على DAPI وتقسيمًا قائمًا على النسخ (الشكل الممتد 7د). كانت النتائج من هاتين الاستراتيجيتين للتقسيم متوافقة مع بعضها البعض بشكل عام، حيث كانت الطريقة القائمة على النسخ تلتقط النسخ في السيتوبلازم بالإضافة إلى تلك الموجودة في النواة (الشكل الممتد 7د-ف). تشير هذه النتيجة إلى أن نهج التقسيم لدينا يمكنه التقاط الخلايا بشكل موثوق.
بعد تقسيم Baysor، تم إنشاء مصفوفة خلية-بجين من تعيينات خلايا النسخ. تم إزالة الخلايا التي تحتوي على أقل من 50 نسخة معينة. تم استخدام Scanpy للمعالجة اللاحقة لتجارب MERFISH الخاصة بنا. بعد تحميل مصفوفة الخلية-بجين المعنية في كائن Anndata لكل تجربة، قمنا بتخزين الإحداثيات المكانية لكل خلية تم الحصول عليها من Baysor. تم تطبيع عدد النسخ الفردية في كل خلية بواسطة إجمالي عدد النسخ لكل خلية. ثم تم تحويل مصفوفة الخلية-بجين Anndata إلى مقياس لوغاريتمي.
تقدير smFISH وتحديد مستعمرات البكتيريا. تم إجراء تقدير للنسخ المسمى بواسطة smFISH باستخدام حزمة Python Big-FISH. تم إسقاط سبعة
ملخص التقرير
توفر البيانات
توفر الشيفرة
40. Mine، أ. وآخرون. شبكة إشارات هرمونات الدفاع النباتية تمكّن إعادة برمجة النسخ بسرعة وبشدة عالية خلال المناعة المستحثة بواسطة المؤثرات. خلية النبات 30، 1199-1219 (2018).
41. كايدو، م.، تسونو، ي.، ميس، ك. وأوكونو، ت. استهداف الشبكة الإندوبلازمية لبروتين حركة فيروس الفسيفساء النخرية لزهرة البرسيم الأحمر مرتبط بتكرار RNA1 الفيروسي ولكن ليس RNA2. علم الفيروسات 395، 232-242 (2009).
42. Mine، أ. وآخرون. الأدوار المختلفة لـ Hsp 70 و Hsp 90 في تجميع مركب النسخ لفيروس RNA النباتي ذو السلسلة الموجبة. J. Virol. 86، 12091-12104 (2012).
43. زانغ، إكس.، هنريكس، ر.، لين، س.-س.، نيو، كيو.-و. وتشوا، ن.-هـ. تحويل أريابيدوبسيس ثاليانا بواسطة بكتيريا الأجروبكتيريوم باستخدام طريقة الغمر الزهري. بروتوكولات الطبيعة 1، 641-646 (2006).
44. مatsu ماتو، أ. وآخرون. أداة وسم حيوية تعتمد على ناقل Tn7 متعددة الاستخدامات للكشف الكمي والمكاني عن البكتيريا في النباتات. اتصالات النبات. 3، 100227 (2022).
45. تاونزلي، ب. ت.، كوفينغتون، م. ف.، إيتشيهاشي، ي.، زومشتاين، ك. وسينها، ن. ر. BrAD-seq: تسلسل توجيهي لمهايئ التنفس: بروتوكول تحضير مكتبة مبسط وسريع للغاية لبناء مكتبة mRNA محددة الاتجاه. فرونت. علوم النبات 6، 366 (2015).
46. تشين، س.، تشو، ي.، تشين، ي. وغو، ج. fastp: معالج مسبق FASTQ فائق السرعة شامل. المعلوماتية الحيوية 34، i884-i890 (2018).
47. دوبين، أ. وآخرون. ستار: محاذي تسلسل RNA عالمي فائق السرعة. المعلوماتية الحيوية 29، 15-21 (2013).
48. لياو، ي.، سميث، ج. ك. وشي، و. featureCounts: برنامج عام فعال لتعيين قراءات التسلسل إلى الميزات الجينومية. المعلوماتية الحيوية 30، 923-930 (2014).
49. هاو، ي. وآخرون. تحليل متكامل لبيانات الخلايا الفردية متعددة الأنماط. خلية 184، 3573-3587 (2021).
50. ستيوارت، ت.، سريفاستافا، أ.، ماداد، س.، لاريه، ك. أ. وساتيجا، ر. تحليل حالة الكروماتين على مستوى الخلية الواحدة باستخدام Signac. نات. ميثودز 18، 1333-1341 (2021).
51. مكغينيس، سي. إس.، مورو، إل. إم. وغارتنر، ز. ج. دابلت فايندر: اكتشاف الدوبلت في بيانات تسلسل RNA أحادي الخلية باستخدام الجيران الأقرب الاصطناعيين. نظام الخلية 8، 329-337 (2019).
52. ماراند، أ. ب.، تشين، ز.، جالافوتي، أ. وشميتز، ر. ج. أطلس تنظيمي في الذرة بدقة خلوية فردية. خلية 184، 3041-3055 (2021).
53. زانغ، ي. وآخرون. تحليل قائم على النموذج لبيانات ChIP-seq (MACS). جينوم بيو. 9، R137 (2008).
54. كورسونسكي، إ. وآخرون. دمج بيانات الخلايا المفردة بسرعة وحساسية ودقة مع هارموني. نات. ميثودزhttps://doi.org/10.1038/s41592-019-0619-0 (2019).
55. كوزانوفيتش، د. أ. وآخرون. تحليل الوصول إلى الكروماتين على مستوى الخلية الواحدة باستخدام الفهرسة الخلوية التوافقية. ساينس 348، 910-914 (2015).
56. فورنس، أ. وآخرون. JASPAR 2020: تحديث قاعدة البيانات المفتوحة الوصول لملفات ارتباط عوامل النسخ. أبحاث الأحماض النووية. 48، D87-D92 (2020).
57. ويكهام، هـ. ggplot2: رسومات أنيقة لتحليل البيانات (سبرينجر، 2009).
58. بروكو، سي. وآخرون. تحليل التعبير الجيني الخلوي المحدد في الأوراق والتعبير الجيني على مستوى الخلية الواحدة يكشف عن دور طبقة العمود الفقري في حماية الأشعة فوق البنفسجية. خلية النباتhttps://doi.org/10.1093/plcell/koac167 (2022).
59. أومالي، ر. س. وآخرون. ميزات السيتروما والإبيسيتروما تشكل المشهد التنظيمي للحمض النووي. خلية 165، 1280-1292 (2016).
60. نوبوري، ت. وآخرون. مشهد النسخ لجهاز بكتيري ممرض تحت مناعة النبات. وقائع الأكاديمية الوطنية للعلوم في الولايات المتحدة الأمريكية 115، E3055-E3064 (2018).
61. جيكاميلو، س. ولوندبرغ، ج. إعداد أنسجة النباتات لتمكين تحليل النسخ المكاني باستخدام المصفوفات الدقيقة المشفرة. نات. بروتوك. 13، 2425-2446 (2018).
62. باتشيتاريو، م. وسترينجر، س. Cellpose 2.0: كيفية تدريب نموذجك الخاص. نات. ميثودز 19، 1634-1641 (2022).
63. بتوكوف، ف. وآخرون. تقسيم الخلايا في النسخ الجيني المكاني القائم على التصوير. نات. بيولوجيا التكنولوجيا. 40، 345-354 (2022).
64. كابل، د. م. وآخرون. تحليل قوي لمزيج أنواع الخلايا في النسخ الجيني المكاني. نات. بيوتكنولوج.https://doi.org/10.1038/s41587-021-00830-w (2021).
معلومات إضافية
يجب توجيه المراسلات والطلبات للحصول على المواد إلى جوزيف ر. إكر. تشكر مجلة نيتشر غيتا كوكير، شيوهوا تشونغ والمراجعين الآخرين المجهولين على مساهمتهم في مراجعة الأقران لهذا العمل. تقارير مراجعي الأقران متاحة.
معلومات إعادة الطبع والتصاريح متاحة علىhttp://www.nature.com/reprints.
مقالة
f، الوصول إلى الكروماتين المجمّع حول ACTIN2 (يسار) و ICS1 (يمين). g، تحليل المكونات الرئيسية للترانسكريبتوم الزائف لكل عينة. تم وضع علامات على النسخ المستقلة من Mock و AvrRpt2 بعد 9 ساعات. h، مخططات مبعثرة تقارن الترانسكريبتومات الزائفة لعينات Mock و AvrRpt2 بعد 9 ساعات. تم عرض قيم معامل ارتباط بيرسون. i، مخططات شريطية مكدسة تظهر تمثيل مجموعات Leiden المستندة إلى تعبير الجينات في كل عينة. j، تضمين ثنائي الأبعاد لتشابه الوصول إلى الكروماتين بين النوى من جميع العينات باستخدام تقريب متعدد الأشكال الموحد والإسقاط (UMAP). يتم تلوين النوى حسب مجموعات Leiden. k، تضمينات UMAP بناءً على رسم بياني للجيران المشترك الذي يمثل كل من قياسات تعبير الجينات والوصول إلى الكروماتين. يتم تلوين النوى حسب مجموعات Leiden الجديدة بناءً على التحليل المشترك (يسار) ومجموعات Leiden المحددة فقط من خلال قياس تعبير الجينات (يمين؛ الشكل 1b).
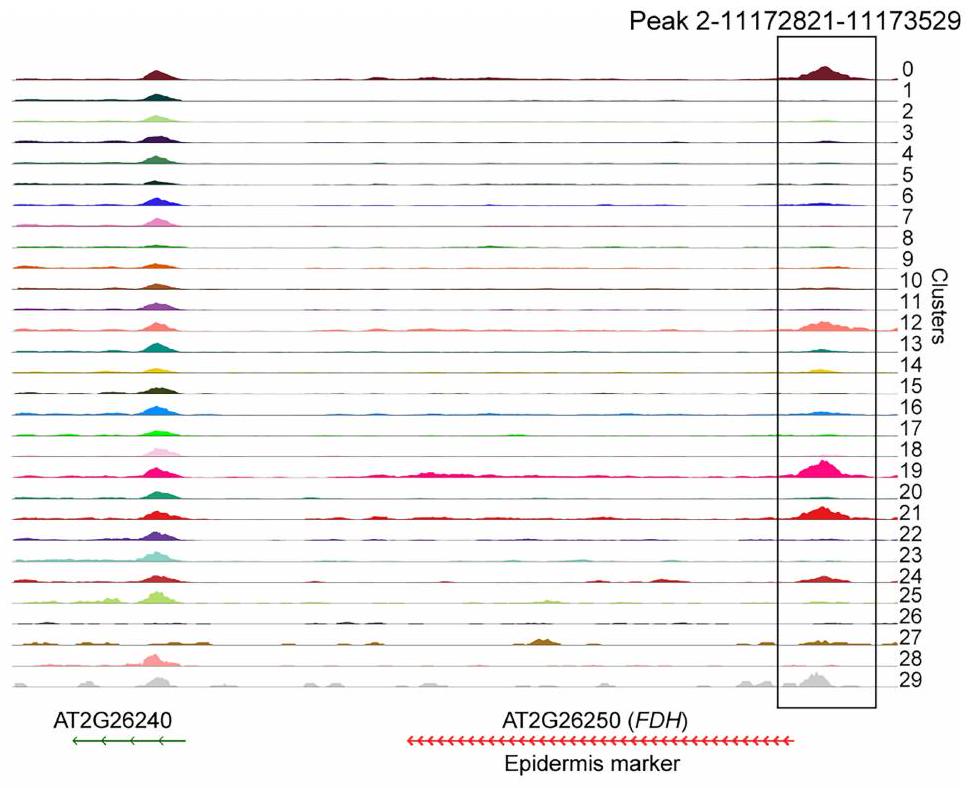
على قمة بالقرب من FDH (الكروموسوم 2، الموقع 11172821-11173529) في كل نواة. د، تحليل إثراء GO لجينات العلامة لكل مجموعة. هـ، تعبير mRNA لـ ICS1 في كل نواة في كل عينة. تم عرض القيم p المعدلة من اختبار هايبرجومتريك أحادي الجانب متبوعًا بتصحيح بنجاميني-هوشبرغ.
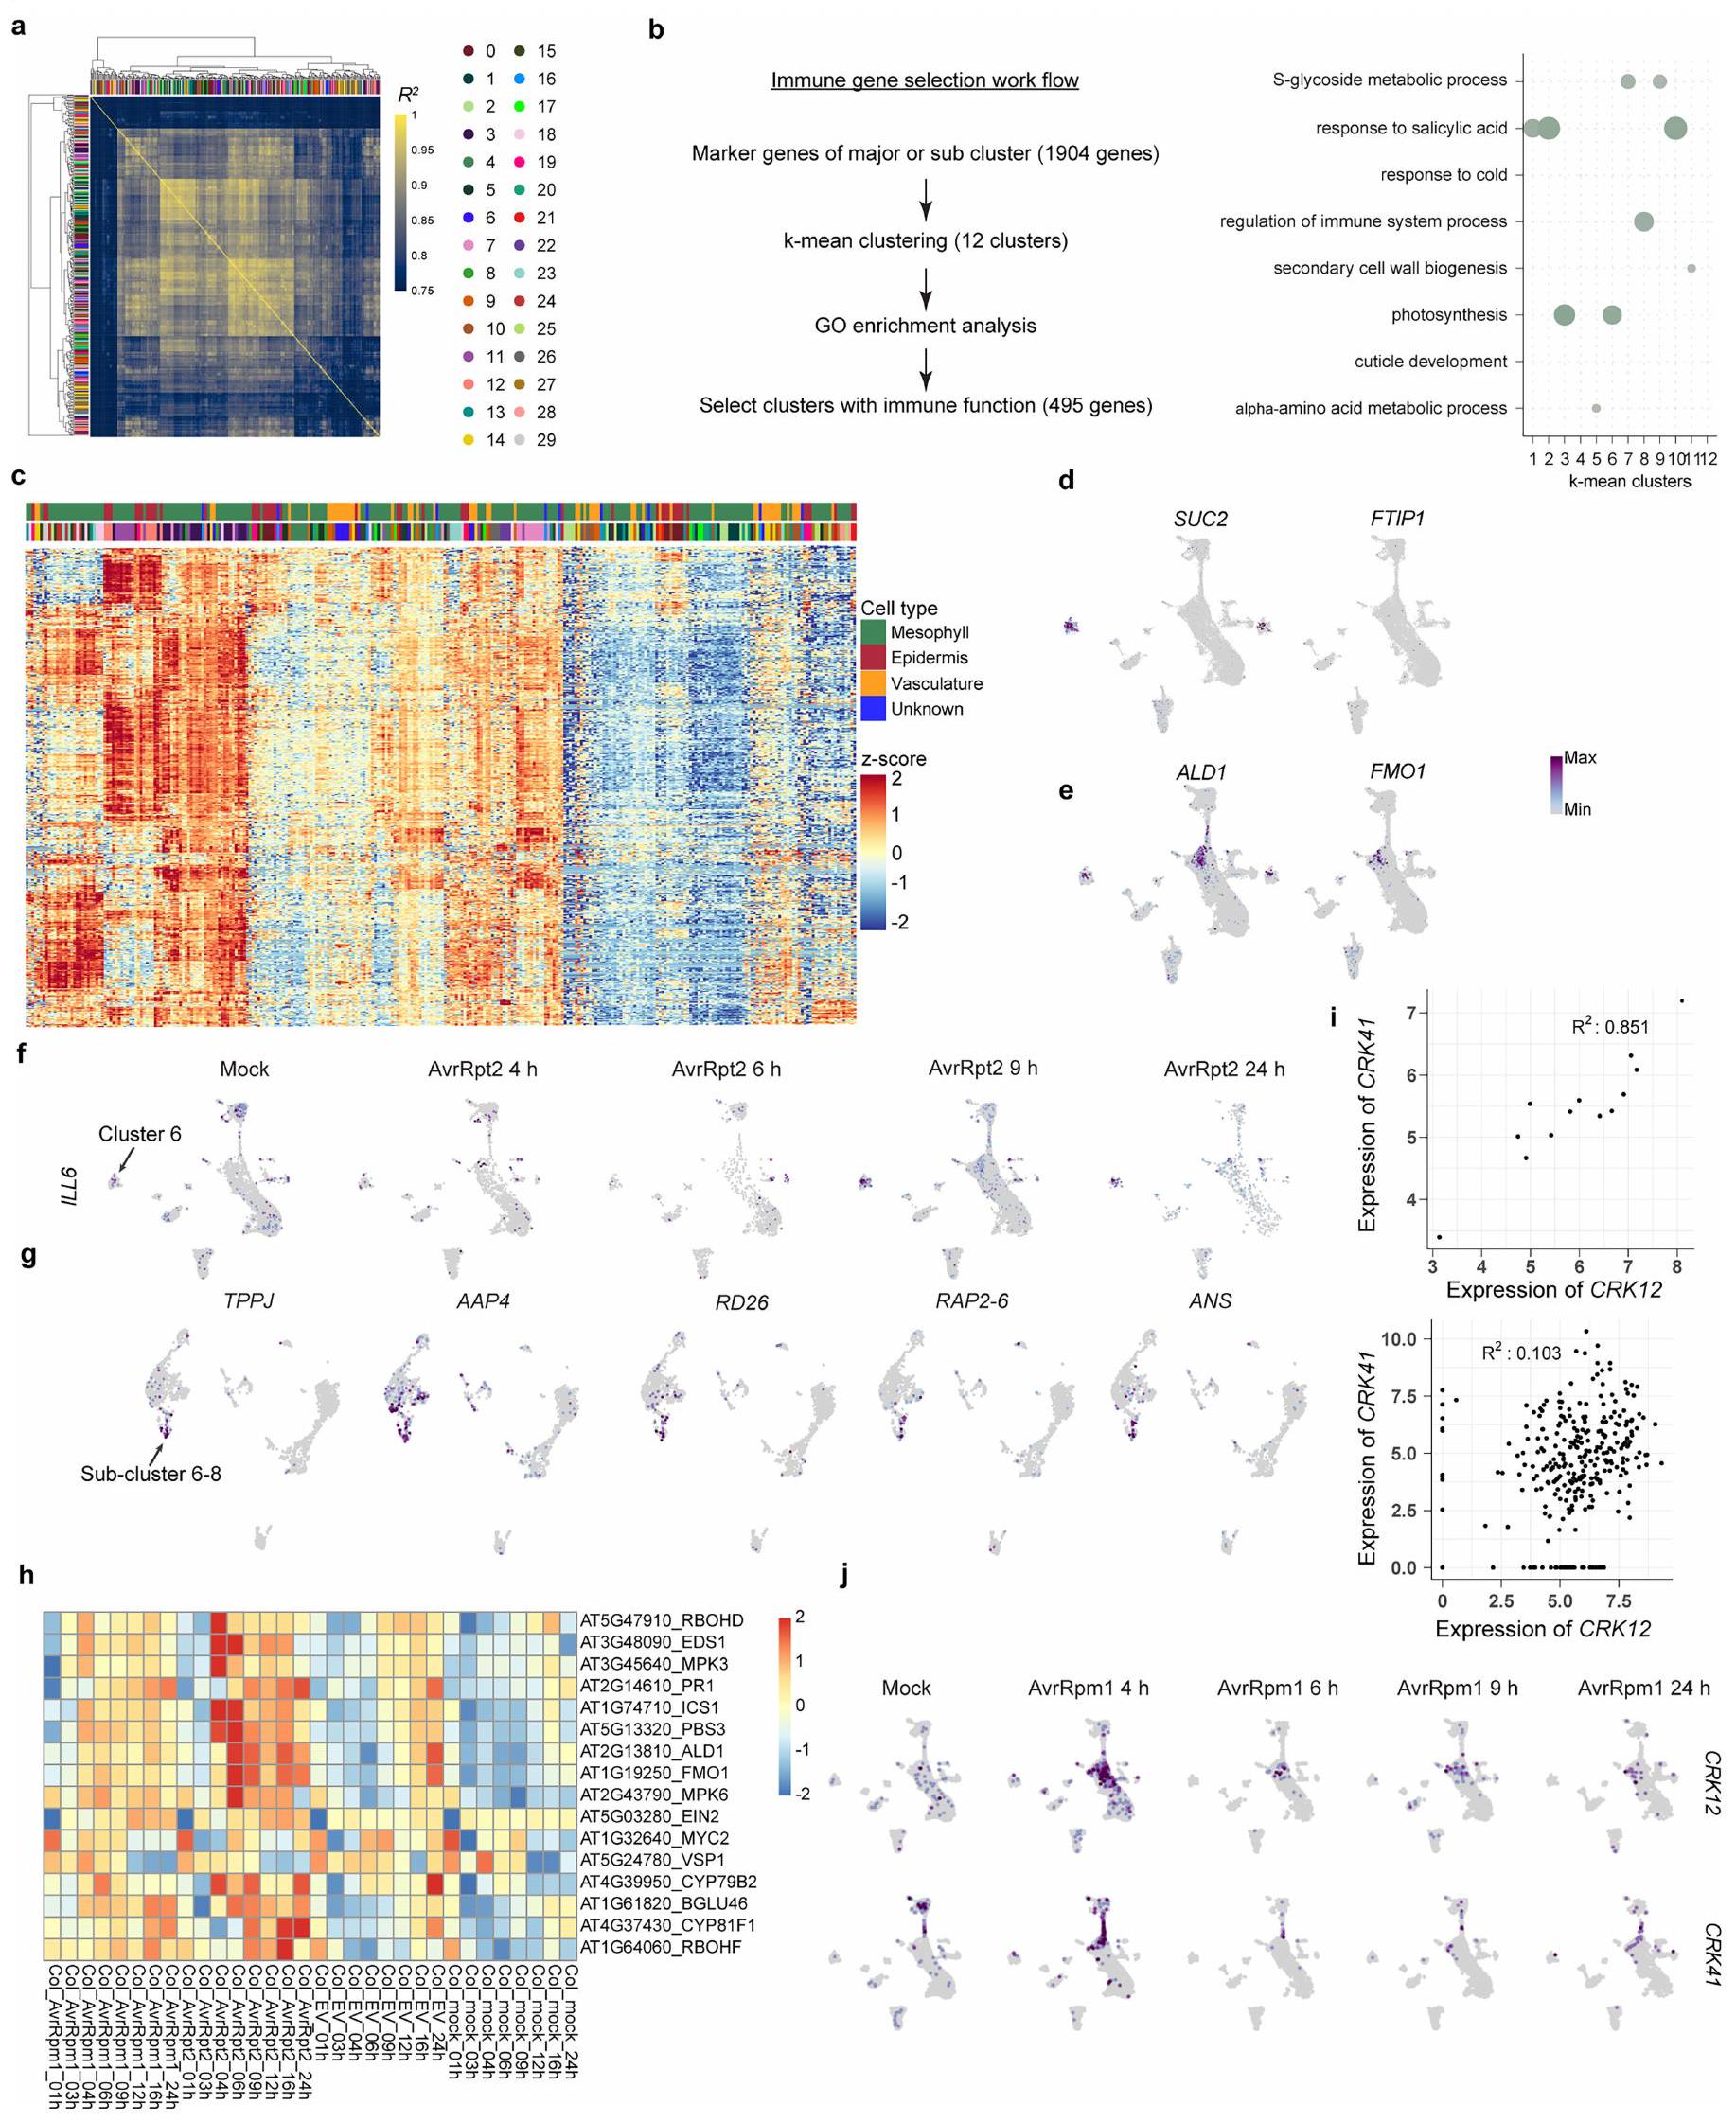
علامات خلايا الرفيق SUC2 وFTIP1. e، تعبير ALD1 وFMO1. f، تعبير ILL6 عند الإصابة بـ AvrRpt2 على مدى الزمن، مما يظهر تحفيزًا محددًا في العنقود 6. g، تعبير الجينات المعبر عنها بشكل خاص في تحت العنقود 6-8. h، خريطة حرارية تظهر تعبير الجينات المتعلقة بالمناعة الموضحة في الشكل 1d في دراسة سابقة لتتابع RNA-seq الكمي، حيث
التعليق (الـ
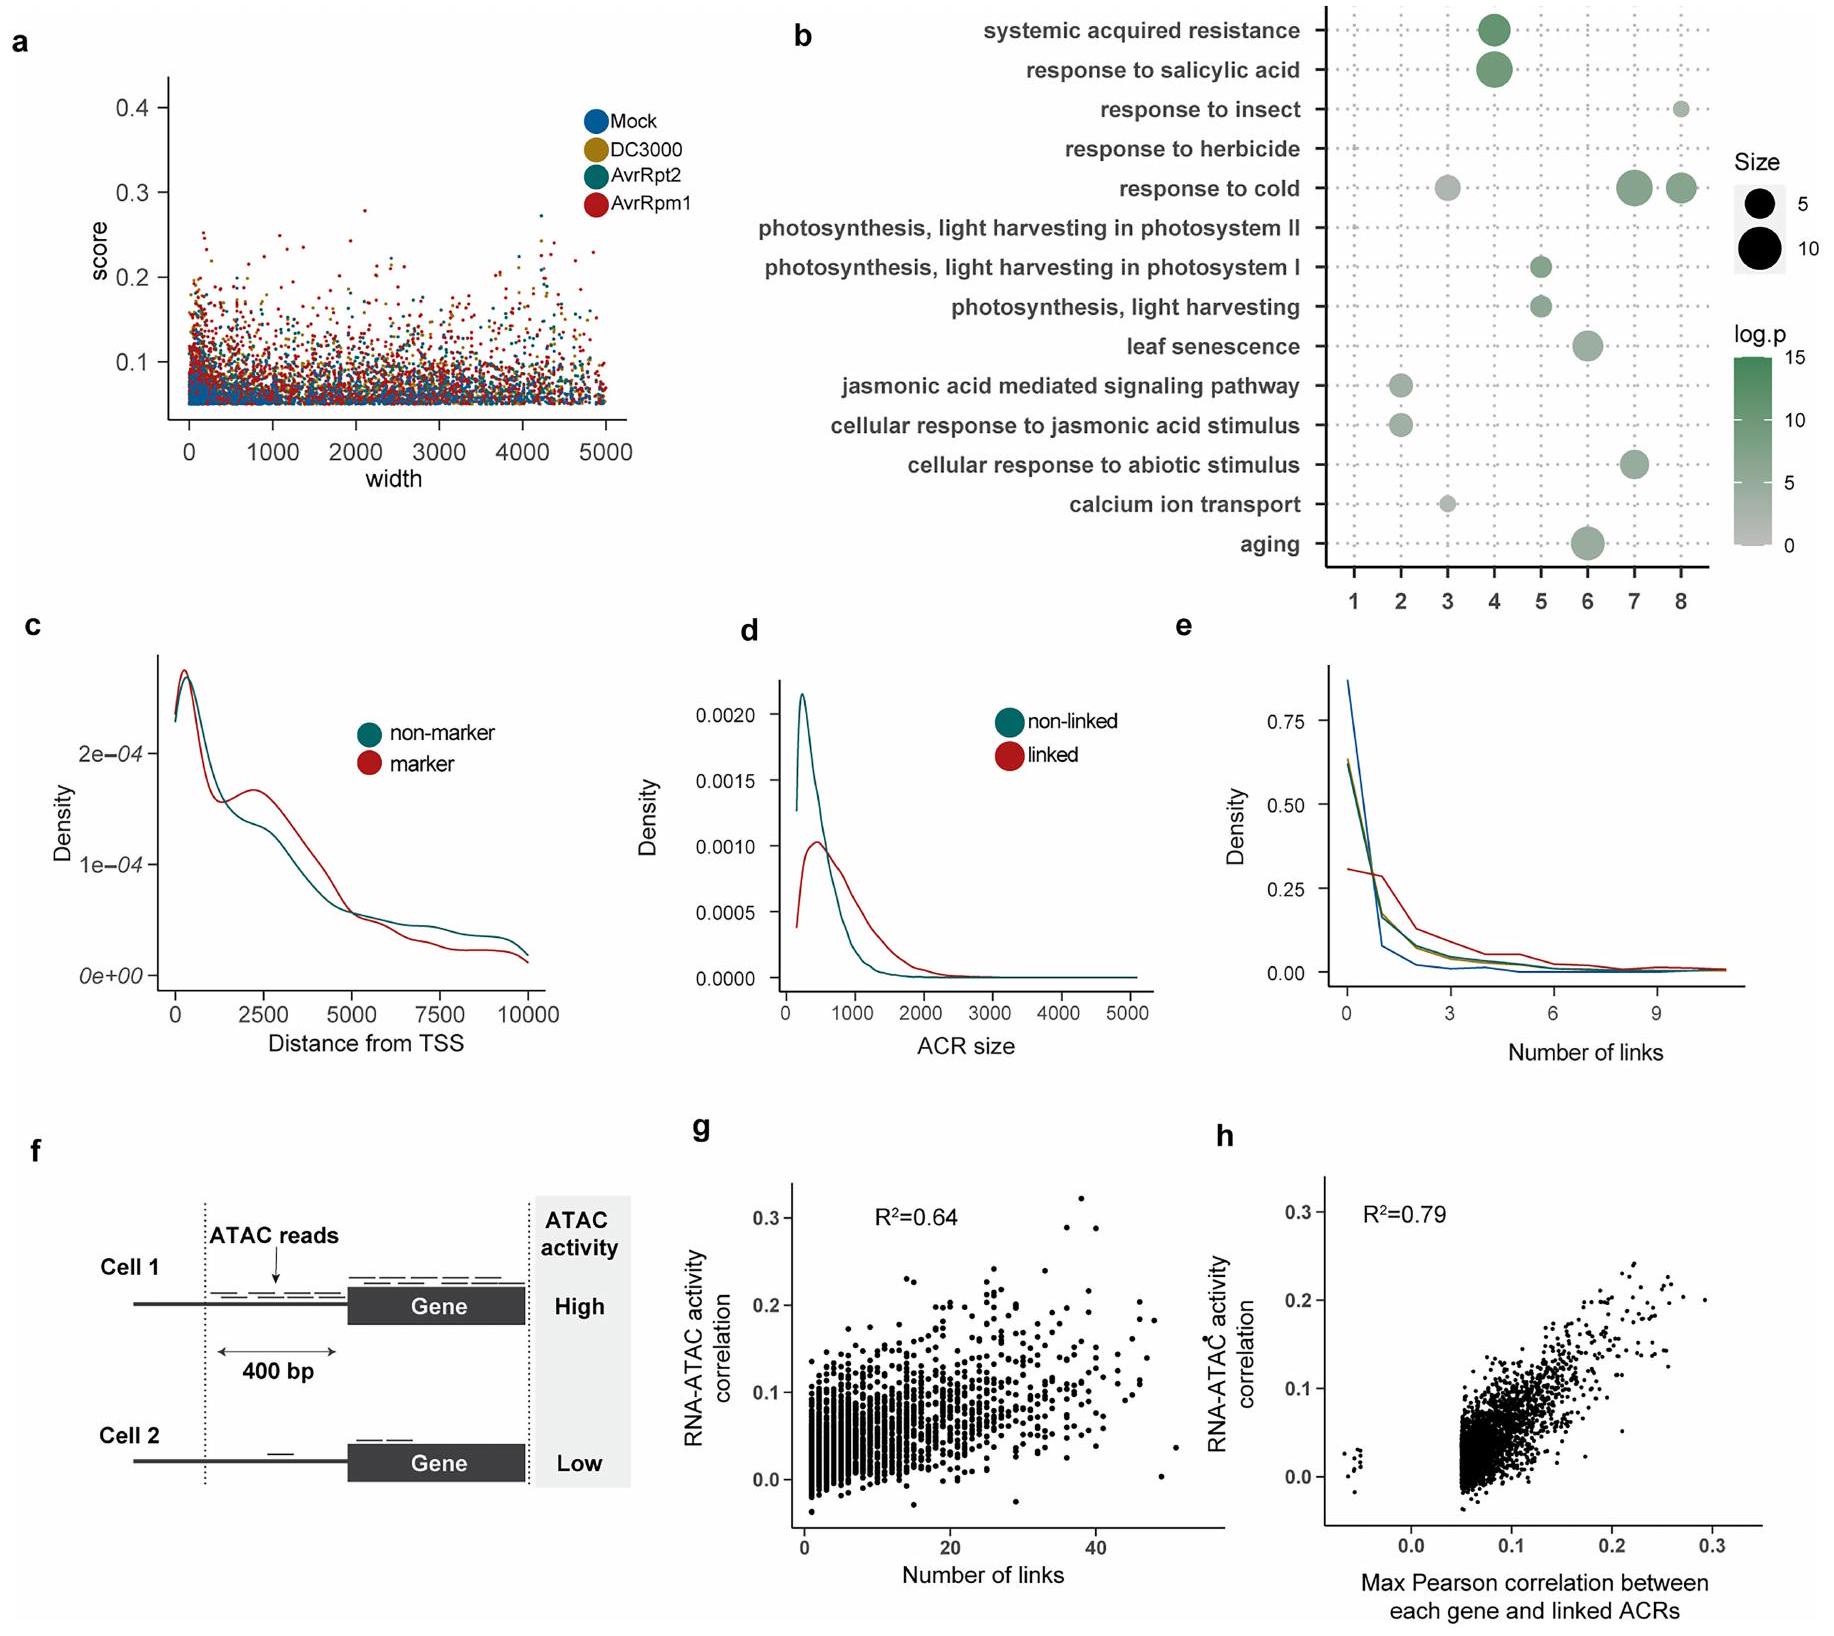
e، رسم بياني للكثافة يظهر تكرار الجينات مع أعداد مختلفة من ACRs المرتبطة. f، مخطط تخطيطي لتحليل نشاط ATAC. لكل جين، تم تجميع قراءات ATAC المرسومة على جسم الجين أو المنطقة التي تبعد 400 نقطة أساسية للأعلى لحساب الدرجة. g، رسم بياني مبعثر يظهر العلاقة بين عدد الروابط (محور x) ودرجة ارتباط نشاط RNA-ATAC (محور y). h، رسم بياني مبعثر يظهر العلاقة بين أقصى معامل ارتباط بين كل جين وACRs المرتبطة (
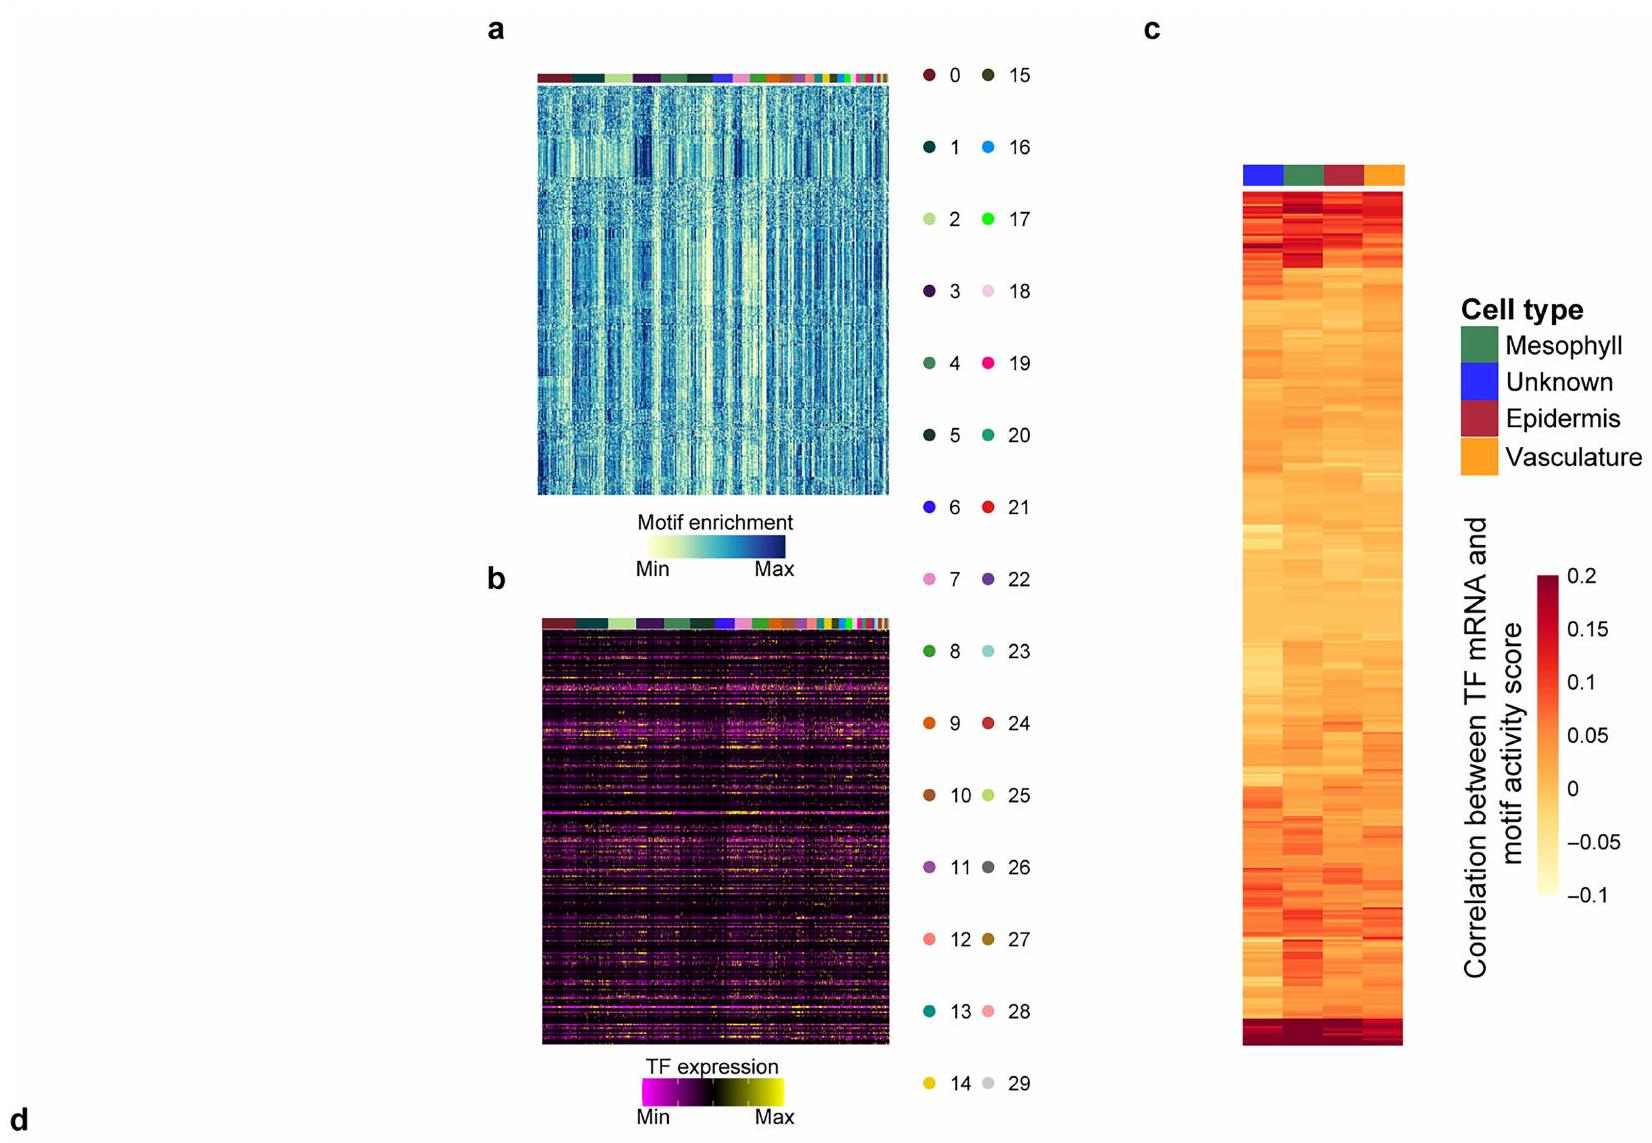
الشكل 6 من البيانات الموسعة | تحديد وحدات TF-gene. أ، ب خرائط حرارية
درجات إثراء النمط والتعبير عن mRNA لعوامل النسخ المقابلة في كل نوع من الخلايا (موضحة في الشريط العلوي). جميع عوامل النسخ موضحة. د، تحليل إثراء GO للجينات المتوقعة أن تكون مستهدفة بواسطة عوامل النسخ الموضحة في الشكل 2h.
من خلال تقسيم البيانات المستندة إلى النص (النقاط الحمراء) ونتيجة تقسيم البيانات المستندة إلى صبغة DAPI الفاشلة (المنطقة الصفراء). لوحظت أنماط مماثلة عبر مجالات الرؤية والعينات. تم تقديم تحليل كمي منهجي في (f). (a,d) قضبان القياس
مقالة
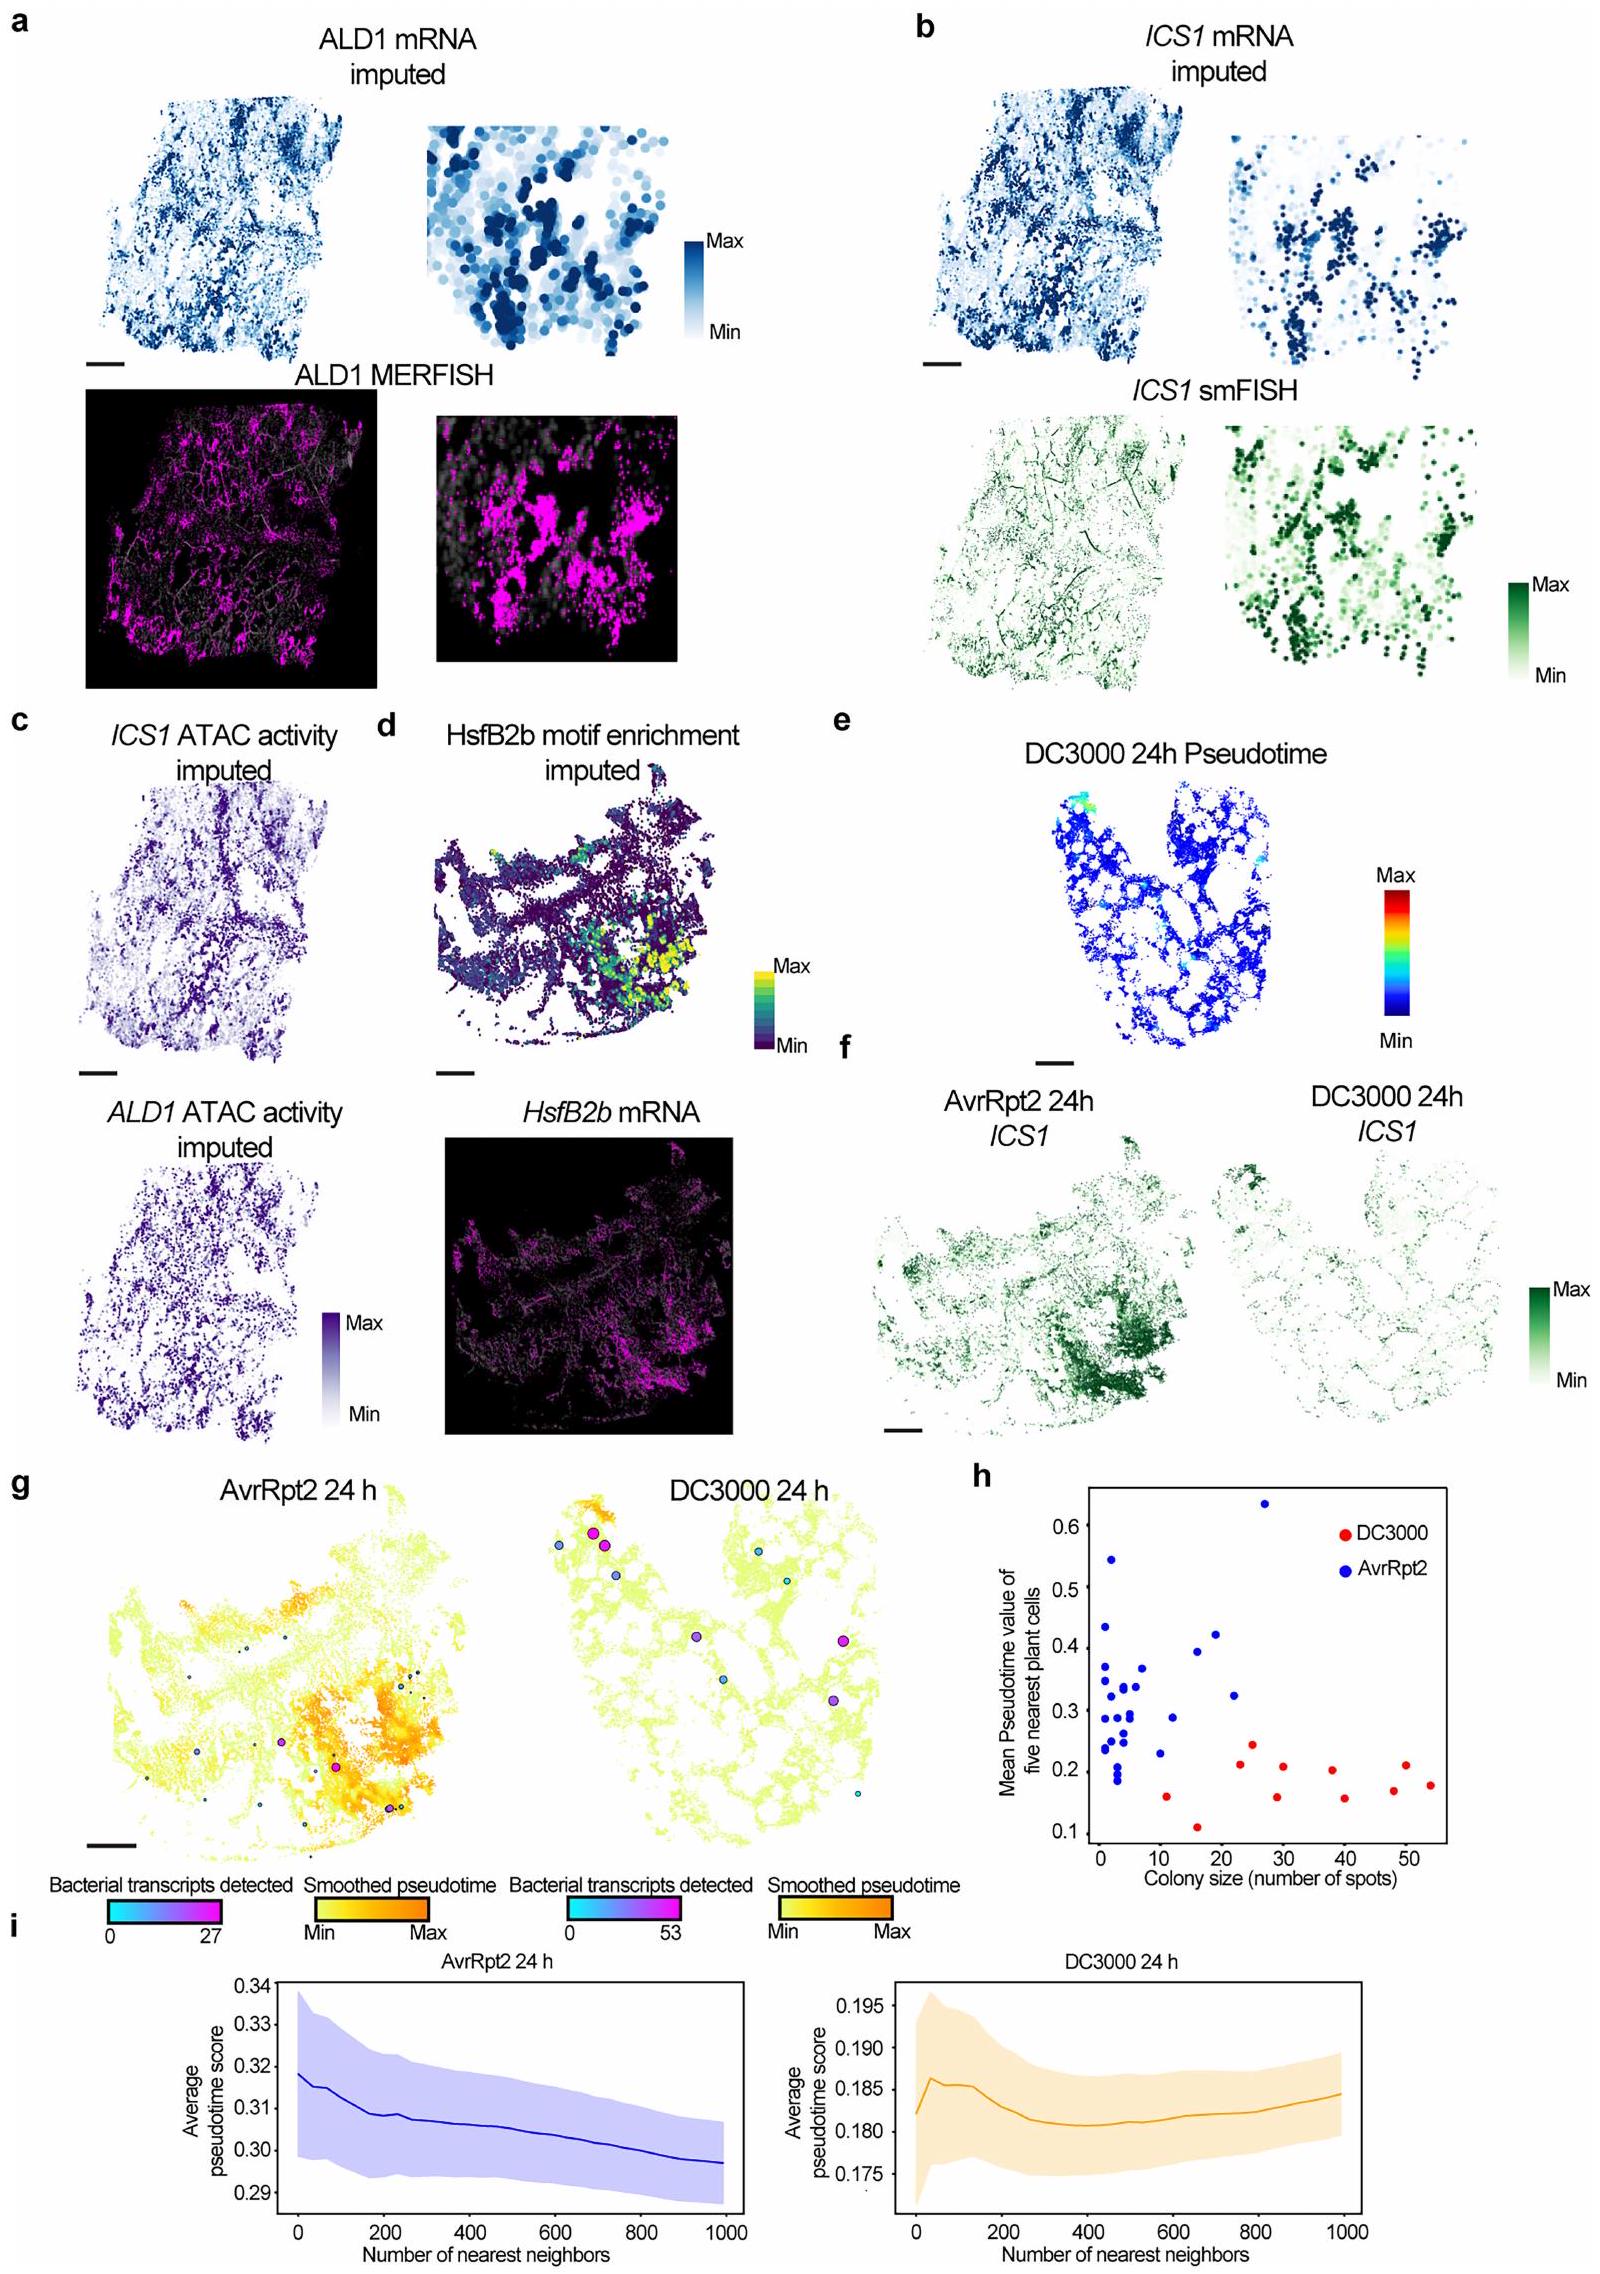
f، smFISH لـ ICS1 في أوراق مصابة بـ AvrRpt2 أو DC3000 بعد 24 ساعة من الإصابة. g، رسم خرائط مكاني للترنسكبتات البكتيرية المكتشفة باستخدام smFISH في نباتات مصابة بـ AvrRpt2 (يسار) و DC3000 (يمين) بعد 24 ساعة من الإصابة (hpi). يتم أيضًا تصور قيم الزمن الزائف في الخلفية. تعكس حجم النقاط عدد الترنسكبتات البكتيرية المكتشفة. a-g، القضبان المقياس
مقالة
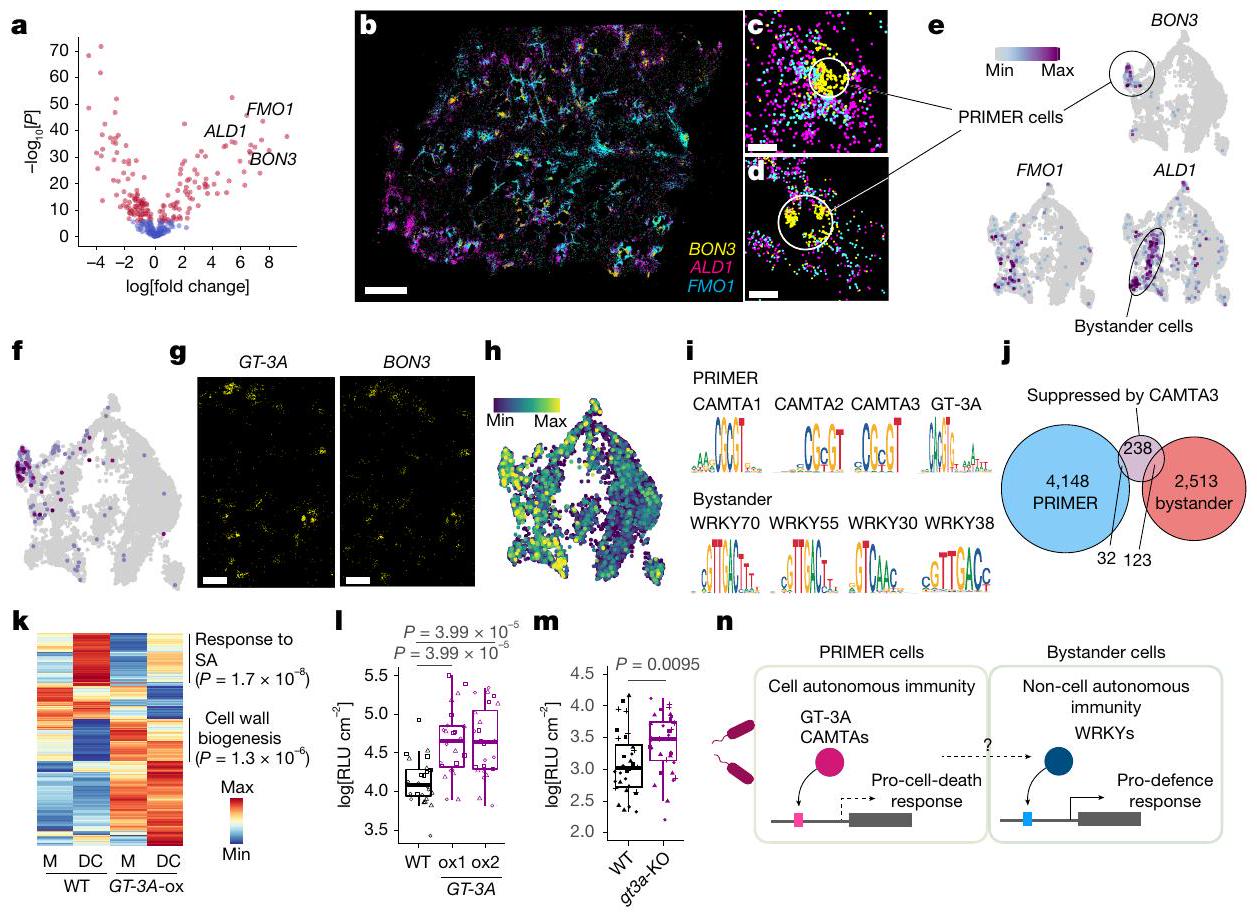
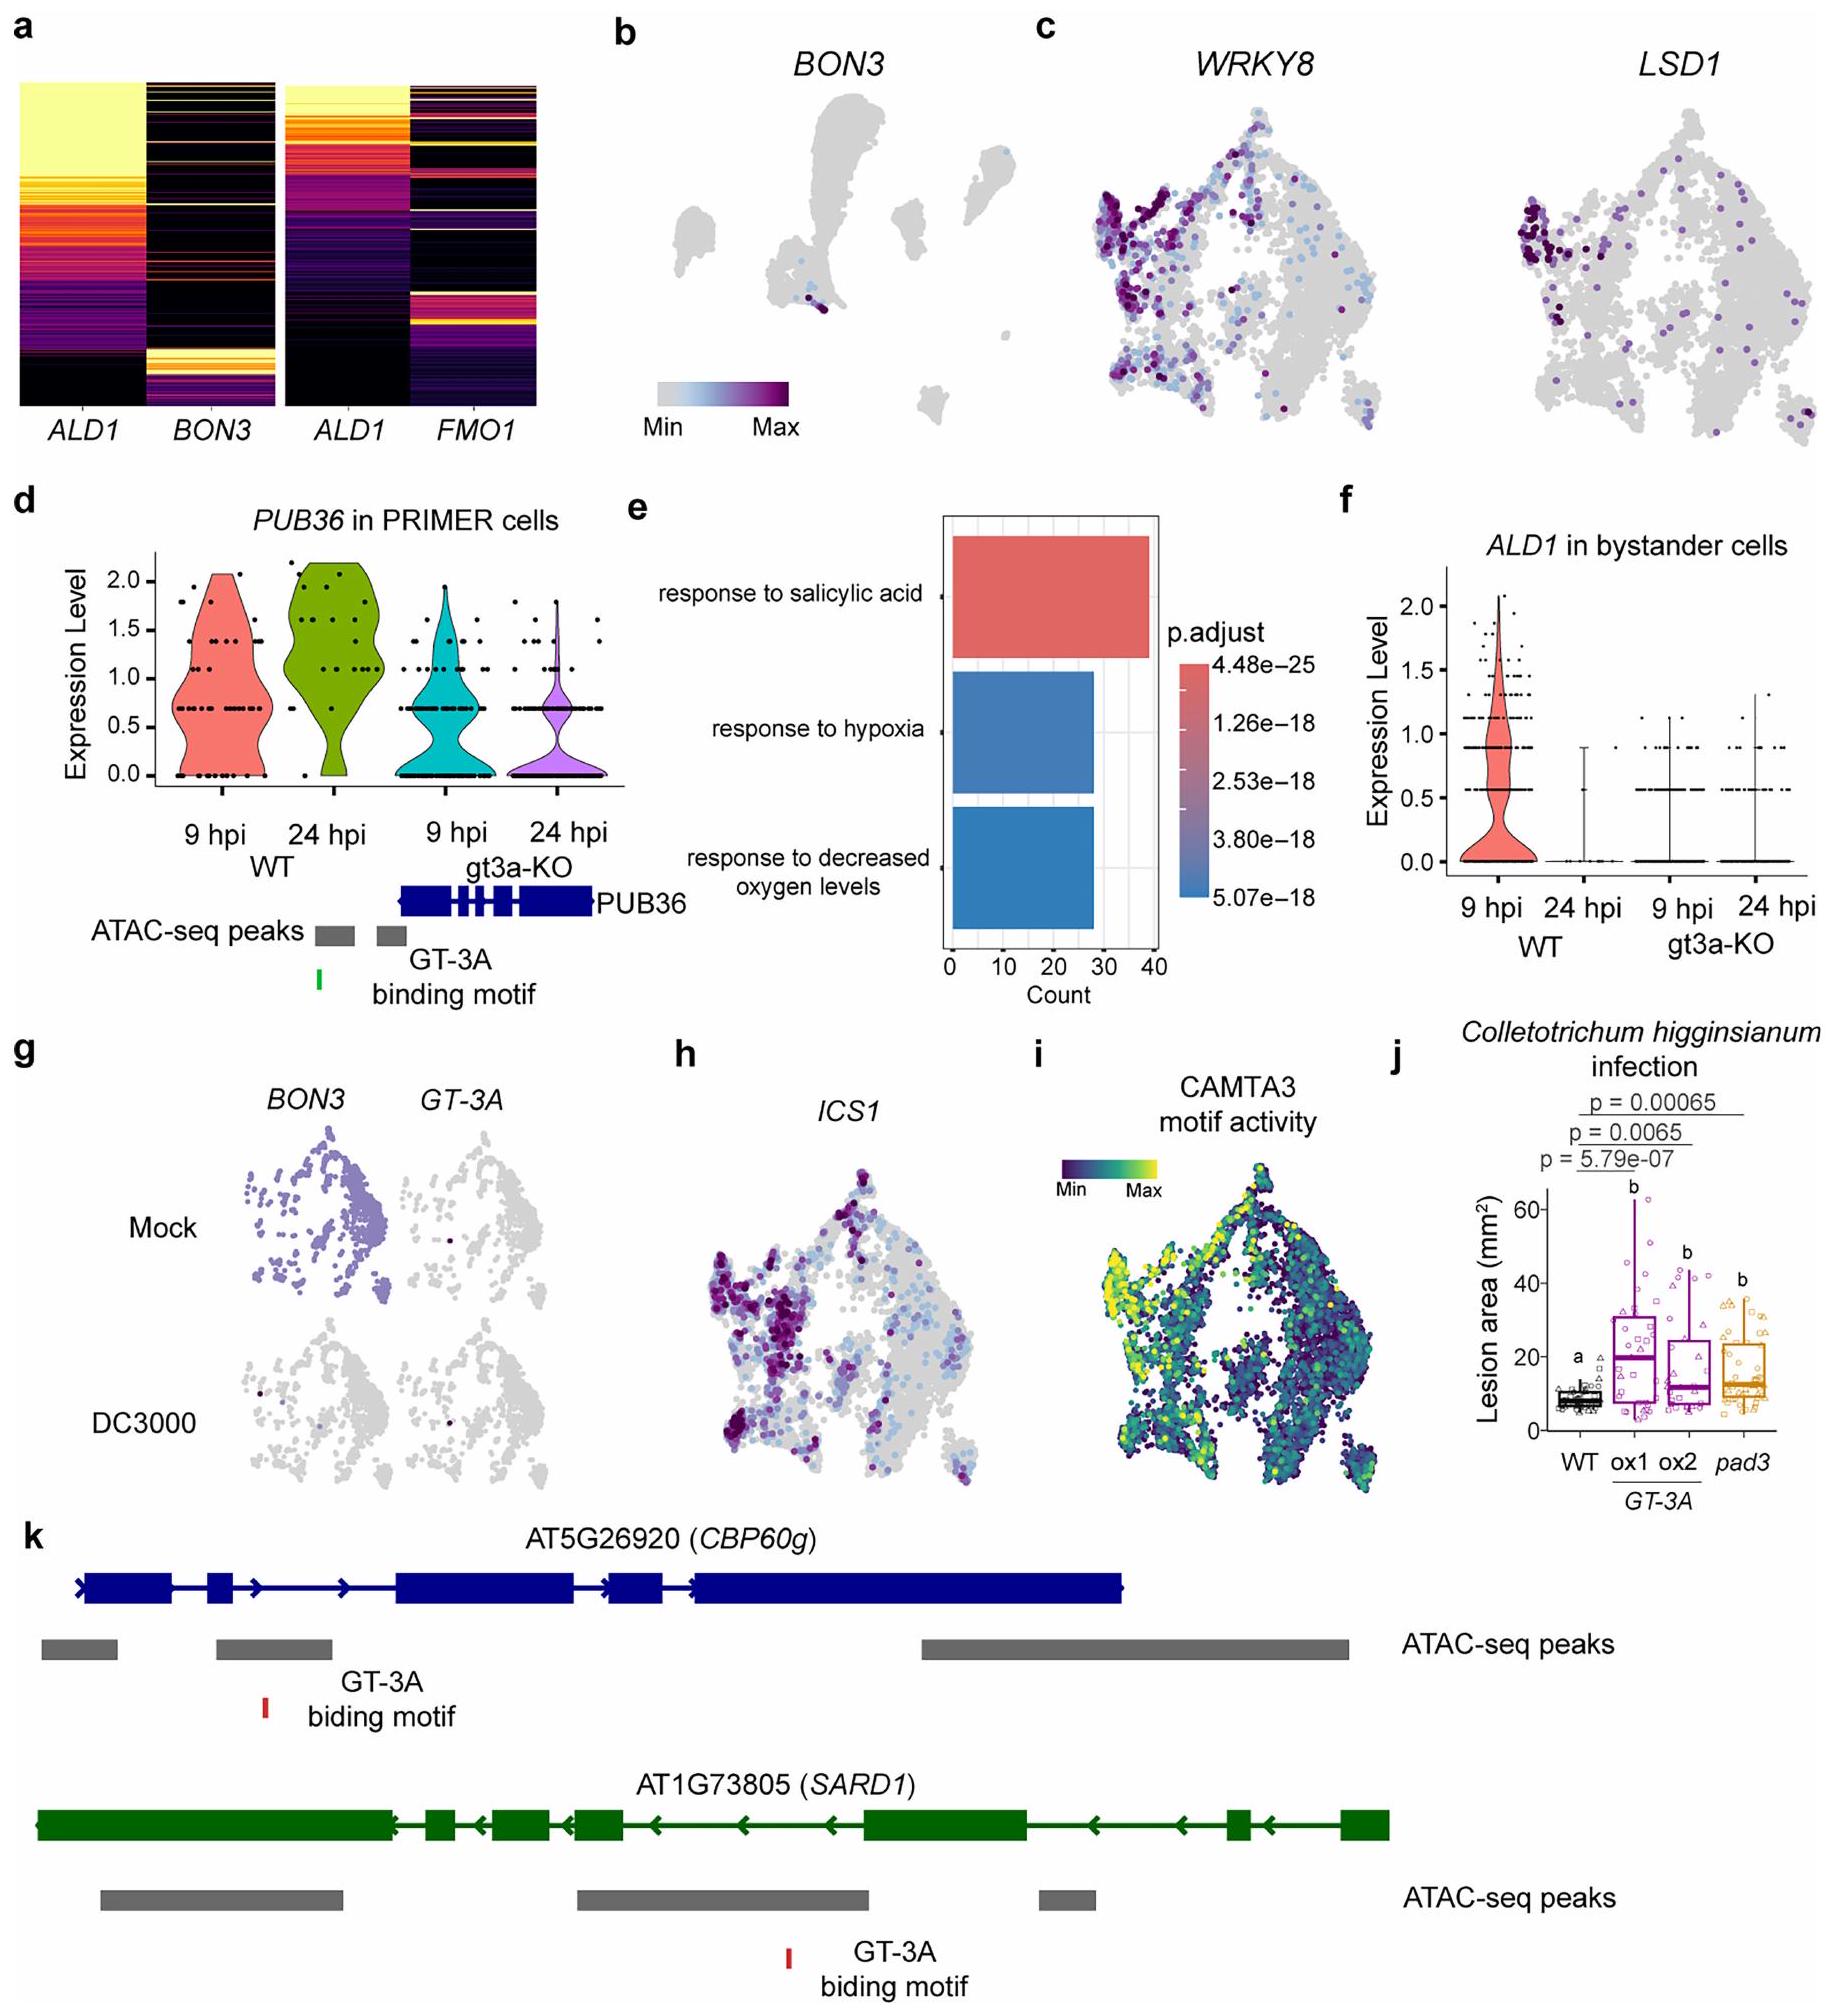
a، خرائط الحرارة التي تظهر التعبير عن ALD1 و FMO1 و BON3 في كل خلية بعد 9 ساعات من الإصابة. b، التعبير عن
أو حالة الإصابة بـ DC3000 (الأسفل). h، التعبير عن /CS1 في خلايا مصابة بـ AvrRpt2. c، g، h، تم دمج جميع النقاط الزمنية. i، نشاط النمط لـ GT-3A في خلايا الميزوفيل النشطة مناعياً. j، منطقة الإصابة الناتجة عن عدوى Colletotrichum higginsianum في Col-0 وسطرين مستقلين من زيادة التعبير عن GT-3A وطفرة pad3 بعد 6 أيام من التلقيح. تشير الحروف المختلفة إلى الأهمية الإحصائية (المعدلة
natureportfolio
ملخص التقرير
إحصائيات
n/a
□

□
□
يجب وصف الاختبارات الشائعة فقط بالاسم؛ وصف تقنيات أكثر تعقيدًا في قسم الطرق.
□ وصف لجميع المتغيرات التي تم اختبارها
□
□
□
□ لمعلومات تحليل بايزي، معلومات حول اختيار الأولويات وإعدادات سلسلة ماركوف مونت كارلو
□ للتصاميم الهرمية والمعقدة، تحديد المستوى المناسب للاختبارات والتقارير الكاملة للنتائج
□ X
تقديرات أحجام التأثير (مثل حجم كوهين،
تحتوي مجموعتنا على الإنترنت حول الإحصائيات لعلماء الأحياء على مقالات حول العديد من النقاط أعلاه.
تم التأكيد
حجم العينة الدقيقة
□
بيان حول ما إذا كانت القياسات قد تم أخذها من عينات متميزة أو ما إذا كانت نفس العينة قد تم قياسها عدة مرات
وصف لجميع المتغيرات التي تم اختبارها
آخر تحديث من قبل المؤلف(المؤلفين): الاتساق والشفافية
بيانات
معلومات السياسة حول توفر البيانات
- رموز الوصول، معرفات فريدة، أو روابط ويب لمجموعات البيانات المتاحة للجمهور
- وصف لأي قيود على توفر البيانات
- بالنسبة لمجموعات البيانات السريرية أو بيانات الطرف الثالث، يرجى التأكد من أن البيان يتماشى مع سياستنا
المشاركون في البحث البشري
| التقرير عن الجنس والنوع | N/A |
| خصائص السكان | N/A |
| التجنيد | N/A |
| الإشراف الأخلاقي | N/A |
التقرير الخاص بالمجال
علوم الحياة □ العلوم السلوكية والاجتماعية □ العلوم البيئية والتطورية والبيئية
لنسخة مرجعية من الوثيقة بجميع الأقسام، انظرnature.com/documents/nr-reporting-summary-flat.pdf
تصميم دراسة العلوم الحياتية
| حجم العينة | لم يتم استخدام أي طريقة إحصائية لتحديد حجم العينة. بدلاً من ذلك، تم تحديد أحجام العينات بناءً على مجموعة من العوامل، بما في ذلك الممارسات القياسية في أبحاث بيولوجيا النباتات وأهداف التجارب. بالنسبة لاختبار نمو الممرضات، اخترنا أحجام العينات بناءً على فعاليتها في دراسات سابقة مماثلة في هذا المجال (مثل PMID: 35545668، PMID: 37704725، وPMID: 35508659). بالنسبة لتجارب snMultiome وMERFISH على مدى الزمن، قمنا بتحليل تكرار واحد لكل حالة بشكل أساسي. تم إجراء تكرارات ثانية لـ snMultiome في ظروف رئيسية، وهو إعداد مشابه لدراسة حديثة لتسلسل RNA أحادي الخلية على مدى الزمن (PMID: 36996230). بالإضافة إلى ذلك، استخدمنا ممرضين مختلفين معروفين بتحفيز استجابات مماثلة واستخدمنا ظروف متطابقة لتجارب snMultiome المستقلة، مما يضمن المزيد من موثوقية بياناتنا. على الرغم من أن تجارب MERFISH تم تنفيذها بتكرارات فردية، إلا أن ظروف العينة تتطابق مع تلك الخاصة بتجارب snMultiome، مما يسمح بالتحقق المتبادل من الاستنتاجات من هذه التحليلات المتوازية. لذلك، نعتقد أن أحجام العينات المستخدمة في تجارب snMultiome وMERFISH كافية لدعم استنتاجات هذه الدراسة. | ||
| استثناءات البيانات | لم يتم استبعاد أي بيانات من التحليلات في هذه الدراسة. | ||
| استنساخ |
|
||
| العشوائية | تم زراعة النباتات في نفس الصينية لضمان ظروف بيئية متسقة. ثم تم تخصيص النباتات الفردية عشوائيًا لمجموعات علاجية مختلفة. تم استخدام هذا التخصيص العشوائي لتقليل التحيز في الاختيار وتوزيع أي متغيرات غير خاضعة للرقابة بالتساوي عبر جميع المجموعات العلاجية. | ||
| عمى | في اختبارات عدوى العوامل الممرضة، تنتج بعض العلاجات ظواهر مرضية مرئية، مما يجعل من المستحيل إخفاء العلاجات المطبقة. لتقليل التحيزات المحتملة، قمنا بتنفيذ بروتوكولات تجريبية متسقة وخطوط تحليل موحدة لجميع العينات. |
التقارير عن مواد وأنظمة وطرق محددة
| المواد والأنظمة التجريبية | طرق | ||
| غير متوفر | مشارك في الدراسة | غير متوفر | مشارك في الدراسة |
| إكس | □ | إكس | □ |
| إكس | □ | إكس | □ |
| إكس | □ | إكس | □ |
| إكس | □ | ||
| إكس | □ | ||
| إكس | □ | ||
- بالنسبة للمخطوطات التي تستخدم خوارزميات أو برامج مخصصة تكون مركزية في البحث ولكن لم يتم وصفها بعد في الأدبيات المنشورة، يجب أن تكون البرمجيات متاحة للمحررين والمراجعين. نحن نشجع بشدة على إيداع الشيفرة في مستودع مجتمعي (مثل GitHub). راجع إرشادات مجموعة Nature لتقديم الشيفرة والبرمجيات لمزيد من المعلومات.
DOI: https://doi.org/10.1038/s41586-024-08383-z
PMID: https://pubmed.ncbi.nlm.nih.gov/39779856
Publication Date: 2025-01-08
A rare PRIMER cell state in plant immunity
Received: 26 December 2023
Accepted: 8 November 2024
Published online: 8 January 2025
Open access
Check for updates
Abstract
Plants lack specialized and mobile immune cells. Consequently, any cell type that encounters pathogens must mount immune responses and communicate with surrounding cells for successful defence. However, the diversity, spatial organization and function of cellular immune states in pathogen-infected plants are poorly understood
Time-resolved snMultiome analysis
encounter pathogen cells. Infected leaves were sampled at four different time points
conditions and at specific time points (Extended Data Fig. 1i), which suggests that the clustering analysis captured distinct cell states induced by pathogen infection. We identified genes specifically expressed in individual clusters (top markers are shown in Extended Data Fig. 2a), which further clarified the identity of each cluster (major cell-type annotations are shown in Fig.1b). Cell types were also predicted on the basis of ATAC-seq data. For instance, a cluster-specific ACR (peak at chromosome 2 position 11172821-11173529) of clusters 0,12,19,21 and 29 was associated with
biosynthesis
Fine dissection of immune-cell states
Linking the transcriptome and epigenome
(Extended Data Figs. 4b and 5a). We summarized peak-to-gene linkage data for each gene by using the maximum Pearson’s correlation coefficient values (peak-to-gene linkage score) (Extended Data Fig. 4c). Genes that showed links in all the conditions (cluster 8; Extended Data Fig. 4c) were enriched with cell-type marker genes such as FDH, BCA2 and MAM1 (Extended Data Fig. 4c,d). Genes that showed links specifically in ETI-activated conditions (cluster 4;Extended Data Fig. 4c) were enriched with immunity-related genes (Extended Data Figs. 4d and 5b). CBP60G, a transcriptional regulator of immunity, had multiple ACRs for which accessibility significantly correlated with its mRNA expression (Extended Data Fig. 4e). Genes that showed links specifically in DC3000 infection (cluster 2; Extended Data Fig.4c) were enriched with jasmonic acid (JA)-related genes (Extended Data Fig. 5b). This finding is consistent with the ability of DC3000 to activate the JA pathway in plants using the toxin coronatine and effectors to suppress plant immunity
Identifying TF-ACR-gene modules
the result of failed DAPI-staining-based segmentation (yellow region). Similar patterns were observed across FOVs and samples. A systematic quantitative analysis is provided in Extended Data Fig. 7f. d, Violin plots showing the number of transcripts per cell (left) and unique genes per cell (middle) detected in each MERFISH sample and the area size per cell (right). e, UMAP embeddings of cells in each sample based on the expression of 500 genes detected using MERFISH. All MERFISH samples are integrated, and cells are coloured on the basis of de novo Leiden clusters. f, Spatial mapping of Leiden clusters in each sample using the same colour scheme as in e. Scale bar,
Integrating snMultiome and MERFISH
Modelling immune-response dynamics
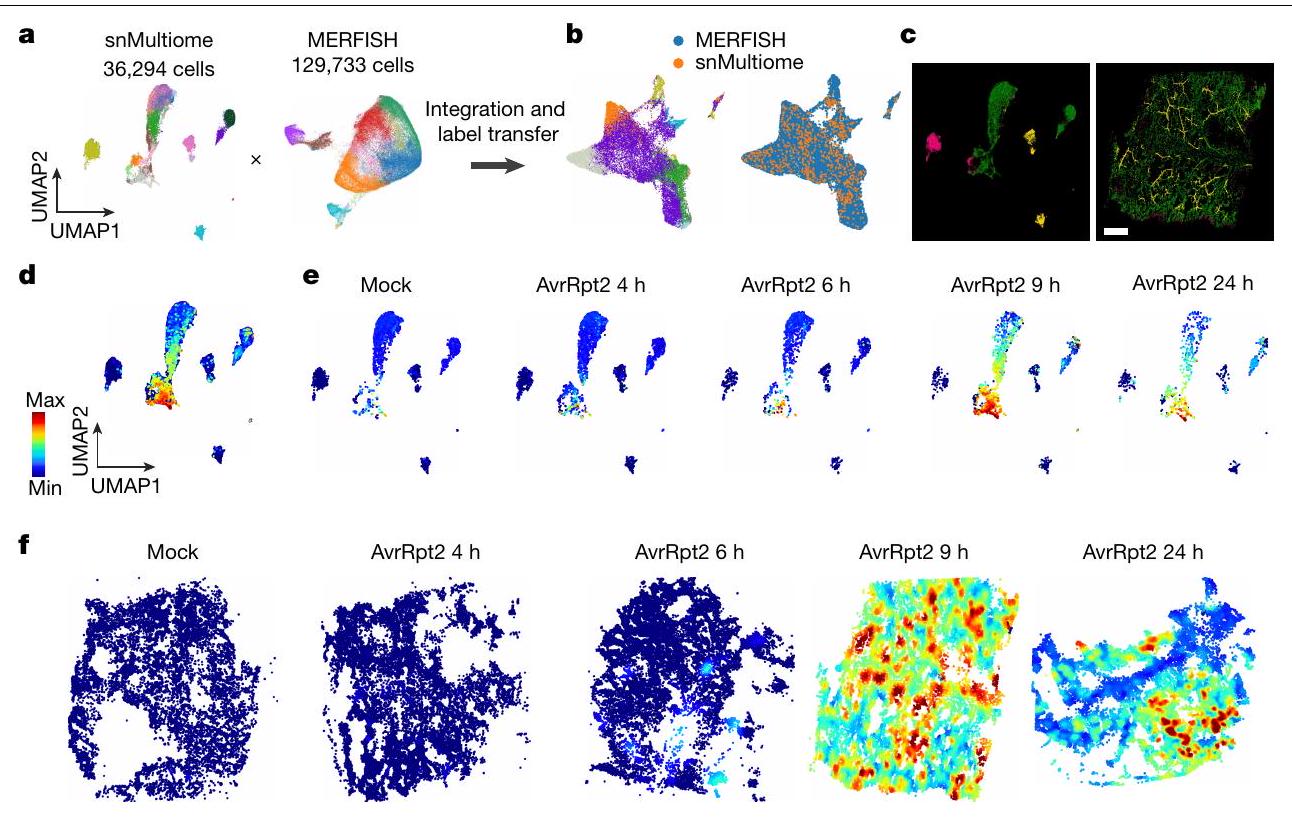
the basis of major cell types: epidermis (magenta), mesophyll (green) and vasculature (yellow). Right, spatial mapping of snMultiome cells coloured on the basis of major cell types. AvrRpt2 9 h.p.i. sample was used. Scale bar, 1 mm . d, Pseudotime values calculated for mesophyll cells in the snRNA-seq data. e, UMAP plots showing pseudotime values in cells from each time point.f, Spatial mapping of pseudotime values based on data integration and label transfer.
that by applying pseudotime analysis to a single developmental cell type with various immune states, we could better model the temporal dynamics of heterogeneous infection and immune responses in an infected leaf. Calculation of pseudotime scores for mesophyll cells (Fig. 4d and Methods) showed that the distribution of predicted pseudotime scores in each sample was consistent with what is expected from the real sampling time point (Fig. 4e). That is, cells with low pseudotime scores were enriched at early time points, whereas cells with high pseudotime scores emerged at later time points. This result indicated that the temporal dynamics of immune responses were successfully modelled. Cells with a wide range of pseudotime scores coexisted at 9 and 24 h.p.i., which suggests that cellular immune responses are asynchronous in infected leaves.
Spatial mapping of bacteria
we performed another MERFISH experiment using an A. thaliana leaf infected by the immunosuppressive pathogen DC3000 at 24 h.p.i. (Extended Data Fig. 8e-g). The distribution of the immune-activating strain AvrRpt2 overlapped with tissue regions with high pseudotime scores (immune heightened) in contrast to the immunosuppressive DC3000 strain (Extended Data Fig. 8e-g). We confirmed this observation by quantitatively analysing the neighbouring plant cells of individual bacterial colonies (Extended Data Fig. 8h,i). Taken together, these results indicate that immune-active regions defined by the pseudotime analysis interact with the ETI-triggering pathogen; we also captured potential immunosuppression by the virulent DC3000 pathogen.
PRIMER and bystander cells
treated with water (M) or DC3000 (DC) at 24 h.p.i. DEGs (adjusted
motifs (Fig. 5i and Extended Data Fig. 9i). Genes previously shown to be repressed by CAMTA3 were significantly overrepresented in bystander cells compared with PRIMER cells (Fig. 5j; false discovery rate (FDR)
Discussion
atlas of pathogen-infected leaves revealed various cell states in transcriptome and epigenome detail. This resource also provides a means to investigate individual cell states that have been obscured in conventional bulk or dissected tissue analyses and by live imaging of a limited number of reporter lines. For instance, we identified a PCC subpopulation with a distinct state characterized by the induction of SAR genes (Fig.1e) and mesophyll subpopulations that activate different branches of tryptophan-derived defence metabolite pathways (Fig.1g).
Recent discoveries have shed light on the role of nucleotide-binding domain and leucine-rich repeat receptors as calcium channels or NADases
Online content
- Nobori, T. & Ecker, J. R. Yet uninfected? Resolving cell states of plants under pathogen attack. Cell Rep. Methods 3, 100538 (2023).
- Ngou, B. P. M., Ding, P. & Jones, J. D. G. Thirty years of resistance: zig-zag through the plant immune system. Plant Cell 34, 1447-1478 (2022).
- Zhu, J. et al. Single-cell profiling of Arabidopsis leaves to Pseudomonas syringae infection. Cell Rep. 42, 112676 (2023).
- Tang, B., Feng, L., Hulin, M. T., Ding, P. & Ma, W. Cell-type-specific responses to fungal infection in plants revealed by single-cell transcriptomics. Cell Host Microbe https://doi. org/10.1016/j.chom.2023.08.019 (2023).
- Zhu, J., Moreno-Pérez, A. & Coaker, G. Understanding plant pathogen interactions using spatial and single-cell technologies. Commun. Biol. 6, 814 (2023).
- Marand, A. P. & Schmitz, R. J. Single-cell analysis of cis-regulatory elements. Curr. Opin. Plant Biol. 65, 102094 (2021).
- Chen, K. H., Boettiger, A. N., Moffitt, J. R., Wang, S. & Zhuang, X. RNA imaging. Spatially resolved, highly multiplexed RNA profiling in single cells. Science 348, aaa6090 (2015).
- Xin, X.-F. & He, S. Y. Pseudomonas syringae pv. tomato DC3000: a model pathogen for probing disease susceptibility and hormone signaling in plants. Annu. Rev. Phytopathol. 51, 473-498 (2013).
- Whalen, M. C., Innes, R. W., Bent, A. F. & Staskawicz, B. J. Identification of Pseudomonas syringae pathogens of Arabidopsis and a bacterial locus determining avirulence on both Arabidopsis and soybean. Plant Cell 3, 49-59 (1991).
- Kunkel, B. N., Bent, A. F., Dahlbeck, D., Innes, R. W. & Staskawicz, B. J. RPS2, an Arabidopsis disease resistance locus specifying recognition of Pseudomonas syringae strains expressing the avirulence gene avrRpt2. Plant Cell 5, 865-875 (1993).
- Debener, T., Lehnackers, H., Arnold, M. & Dangl, J. L. Identification and molecular mapping of a single Arabidopsis thaliana locus determining resistance to a phytopathogenic Pseudomonas syringae isolate. Plant J. 1, 289-302 (1991).
- Ding, P. et al. Chromatin accessibility landscapes activated by cell-surface and intracellular immune receptors. J. Exp. Bot. https://doi.org/10.1093/jxb/erab373 (2021).
- Peng, Y., Yang, J., Li, X. & Zhang, Y. Salicylic acid: biosynthesis and signaling. Annu. Rev. Plant Biol. 72, 761-791 (2021).
- Wildermuth, M. C., Dewdney, J., Wu, G. & Ausubel, F. M. Isochorismate synthase is required to synthesize salicylic acid for plant defence. Nature 414, 562-565 (2001).
- Khan, M. et al. The role of nitric oxide-induced ATILL6 in growth and disease resistance in Arabidopsis thaliana. Front. Plant Sci. 12, 685156 (2021).
- Nobori, T., Mine, A. & Tsuda, K. Molecular networks in plant-pathogen holobiont. FEBS Lett. 592, 1937-1953 (2018).
- Schep, A. N., Wu, B., Buenrostro, J. D. & Greenleaf, W. J. chromVAR: inferring transcription-factor-associated accessibility from single-cell epigenomic data. Nat. Methods 14, 975-978 (2017).
- Hu, Y., Dong, Q. & Yu, D. Arabidopsis WRKY46 coordinates with WRKY70 and WRKY53 in basal resistance against pathogen Pseudomonas syringae. Plant Sci. 185-186, 288-297 (2012).
- Saelens, W., Cannoodt, R., Todorov, H. & Saeys, Y. A comparison of single-cell trajectory inference methods. Nat. Biotechnol. https://doi.org/10.1038/s41587-019-0071-9 (2019).
- Cable, D. M. et al. Cell type-specific inference of differential expression in spatial transcriptomics. Nat. Methods https://doi.org/10.1038/s41592-022-01575-3 (2022).
- Yang, S. et al. The BON/CPN gene family represses cell death and promotes cell growth in Arabidopsis. Plant J. 45, 166-179 (2006).
- Chen, L., Zhang, L. & Yu, D. Wounding-induced WRKY8 is involved in basal defense in Arabidopsis. Mol. Plant Microbe Interact. 23, 558-565 (2010).
- Jabs, T., Dietrich, R. A. & Dangl, J. L. Initiation of runaway cell death in an Arabidopsis mutant by extracellular superoxide. Science 273, 1853-1856 (1996).
- Ayadi, M., Delaporte, V., Li, Y.-F. & Zhou, D.-X. Analysis of GT-3a identifies a distinct subgroup of trihelix DNA-binding transcription factors in Arabidopsis. FEBS Lett. 562, 147-154 (2004).
- Henry, E., Toruño, T. Y., Jauneau, A., Deslandes, L. & Coaker, G. Direct and indirect visualization of bacterial effector delivery into diverse plant cell types during infection. Plant Cell 29, 1555-1570 (2017).
- Nobori, T., Oliva, M., Lister, R. & Ecker, J. R. Multiplexed single-cell 3D spatial gene expression analysis in plant tissue using PHYTOMap. Nat. Plants https://doi.org/10.1038/s41477-023-01439-41-8 (2023).
- Zhao, J. et al. The root-knot nematode effector Mi2GO2 hijacks a host plant trihelix transcription factor to promote nematode parasitism. Plant Commun. 5, 100723 (2024).
- Huang, S. et al. Identification and receptor mechanism of TIR-catalyzed small molecules in plant immunity. Science 377, eabq3297 (2022).
- Wan, L. et al. TIR domains of plant immune receptors are NAD+-cleaving enzymes that promote cell death. Science 365, 799-803 (2019).
- Yu, D. et al. TIR domains of plant immune receptors are
-cAMP/cGMP synthetases mediating cell death. Cell 185, 2370-2386.e18 (2022). - Essuman, K., Milbrandt, J., Dangl, J. L. & Nishimura, M. T. Shared TIR enzymatic functions regulate cell death and immunity across the tree of life. Science https://doi.org/10.1126/ science.abo0001 (2022).
- Jia, A. et al. TIR-catalyzed ADP-ribosylation reactions produce signaling molecules for plant immunity. Science https://doi.org/10.1126/science.abq8180 (2022).
- Jacob, P. et al. Plant “helper” immune receptors are
-permeable nonselective cation channels. Science 373, 420-425 (2021). - Bi, G. et al. The ZAR1 resistosome is a calcium-permeable channel triggering plant immune signaling. Cell 184, 3528-3541 (2021).
- Förderer, A. et al. A wheat resistosome defines common principles of immune receptor channels. Nature https://doi.org/10.1038/s41586-022-05231-w (2022).
- Ross, A. F. Localized acquired resistance to plant virus infection in hypersensitive hosts. Virology 14, 329-339 (1961).
- Jacob, P., Hige, J. & Dangl, J. L. Is localized acquired resistance the mechanism for effectortriggered disease resistance in plants? Nat. Plants https://doi.org/10.1038/s41477-023-01466-1 (2023).
- Zavaliev, R. et al. Formation of NPR1 condensates promotes cell survival during the plant immune response. Cell https://doi.org/10.1016/j.cell.2020.07.016 (2020).
- Jacob, F. et al. A dominant-interfering camta3 mutation compromises primary transcriptional outputs mediated by both cell surface and intracellular immune receptors in Arabidopsis thaliana. New Phytol. 217, 1667-1680 (2018).
(c) The Author(s) 2025
Methods
Reagents and kits
Gene symbols, names and ordered locus names
Plant growth and bacterial infection for single-cell and spatial analyses
Generation of transgenic plants and pathogen-infection assays
plasmid was used as a template for two PCR reactions using primer pairs mEGFP_Nter_1_F plus mEGFP_4R and mEGFP_4F plus mEGFP_ Nter_3R. These PCR products were assembled into Stul/Ascl-digested pBICAscII, which produced pBIC_mEGFP_Nter. A PCR fragment was amplified from pBIC_mEGFP_Nter using mEGFP_Cter_F1 plus mEGFP_ Cter_R, and then used as a template for PCR using mEGFP_Cter_F2 plus mEGFP_Cter_R. The resulting PCR fragment was assembled into Stul/ AscI-digested pBIC_mEGFP_Nter to obtain pBIC_mEGFP_Cter. The coding sequence of GT-3A (At5g1380) was amplified by PCR using the primer pair GT3a_mEGFP_F plus GT3a_mEGFP_R and was assembled into Stul-digested pBIC_mEGFP_Cter to obtain pBIC_GT3a_mEGFP. The sequence encoding carboxy-terminally mEGFP-fused GT-3A was amplified from pBIC_GT3a_mEGFP by PCR using a primer pair (
Generation of gt3a-KO plants
Bulk RNA-seq of plants
performed using fastp (v.0.19.7)
Extraction of nuclei and single-nucleus sequencing
Single-cell multiomic analysis
(v.2.0.0) for snRNA-seq data and snATAC-seq data, respectively. For snRNA-seq, the -include-introns option was used to align reads to the A. thaliana nuclear transcriptome built using the TAIR10 genome and the Araport 11 transcriptome. The chloroplast genome was removed from the reference genome for the analysis of both snRNA-seq and snATAC-seq data. The
snRNA-seq clustering. snRNA-seq clustering was performed using the R package Seurat. The cell-by-gene RNA count matrix was normalized using SCTransform. Dimension reduction was performed using principal component analysis with RunPCA. Technical variance among samples was reduced using Harmony
snATAC-seq peak calling. Peaks were called independently on each cluster defined by snRNA-seq data and then combined using the CallPeaks function of Signac, which uses MACS2 with the following parameters: effective.genome.size
snATAC-seq clustering. Dimensionality reduction was performed using latent semantic indexing (LSI)
projected into an additionally reduced space with UMAP(n.neighbours= 30 L and min.dist
Comparisons between PRIMER and bystander cells
snRNA-seq analysis of gt3a-KO plants
Comparisons between single-cell and bulk omics datasets
MERFISH
incubated and acclimated in OCT (Fisher) for 5 min. Following incubation, the leaves were immediately frozen as previously described
number of unique cells across all regions. This number was then used to initialize the –num-cells-init command in another segmentation tool, Baysor
To test the quality of our transcript-based segmentation method, we used an FOV with successful DAPI staining (which was rare in our samples) and performed DAPI-based watershed segmentation and transcript-based segmentation (Extended Data Fig. 7d). Results from these two segmentation strategies agreed with each other in general, with the transcript-based approach capturing transcripts in the cytoplasm in addition to those in the nucleus (Extended Data Fig. 7d-f). This result indicated that our segmentation approach can reliably capture cells.
After Baysor segmentation, a cell-by-gene matrix was created from the transcript cell assignments. Cells with fewer than 50 assigned transcripts were removed. Scanpy was used for post-processing of our MERFISH experiments. After loading the respective cell-by-gene matrix into an Anndata object for each experiment, we stored the spatial coordinates of each cell obtained from Baysor. The individual transcript counts in each cell were normalized by the total number of transcript counts per cell. The Anndata cell-by-gene matrix was then log-scaled.
smFISH quantification and bacterial colony identification. Quantification of transcripts labelled by smFISH was performed using the Python package Big-FISH. Seven
Reporting summary
Data availability
Code availability
40. Mine, A. et al. The defense phytohormone signaling network enables rapid, high-amplitude transcriptional reprogramming during effector-triggered immunity. Plant Cell 30, 1199-1219 (2018).
41. Kaido, M., Tsuno, Y., Mise, K. & Okuno, T. Endoplasmic reticulum targeting of the Red clover necrotic mosaic virus movement protein is associated with the replication of viral RNA1 but not that of RNA2. Virology 395, 232-242 (2009).
42. Mine, A. et al. Differential roles of Hsp 70 and Hsp 90 in the assembly of the replicase complex of a positive-strand RNA plant virus. J. Virol. 86, 12091-12104 (2012).
43. Zhang, X., Henriques, R., Lin, S.-S., Niu, Q.-W. & Chua, N.-H. Agrobacterium-mediated transformation of Arabidopsis thaliana using the floral dip method. Nat. Protoc. 1, 641-646 (2006).
44. Matsumoto, A. et al. A versatile Tn7 transposon-based bioluminescence tagging tool for quantitative and spatial detection of bacteria in plants. Plant Commun. 3, 100227 (2022).
45. Townsley, B. T., Covington, M. F., Ichihashi, Y., Zumstein, K. & Sinha, N. R. BrAD-seq: Breath Adapter Directional sequencing: a streamlined, ultra-simple and fast library preparation protocol for strand specific mRNA library construction. Front. Plant Sci. 6, 366 (2015).
46. Chen, S., Zhou, Y., Chen, Y. & Gu, J. fastp: an ultra-fast all-in-one FASTQ preprocessor. Bioinformatics 34, i884-i890 (2018).
47. Dobin, A. et al. STAR: ultrafast universal RNA-seq aligner. Bioinformatics 29, 15-21 (2013).
48. Liao, Y., Smyth, G. K. & Shi, W. featureCounts: an efficient general purpose program for assigning sequence reads to genomic features. Bioinformatics 30, 923-930 (2014).
49. Hao, Y. et al. Integrated analysis of multimodal single-cell data. Cell 184, 3573-3587 (2021).
50. Stuart, T., Srivastava, A., Madad, S., Lareau, C. A. & Satija, R. Single-cell chromatin state analysis with Signac. Nat. Methods 18, 1333-1341 (2021).
51. McGinnis, C. S., Murrow, L. M. & Gartner, Z. J. DoubletFinder: doublet detection in single-cell RNA sequencing data using artificial nearest neighbors. Cell Syst. 8, 329-337 (2019).
52. Marand, A. P., Chen, Z., Gallavotti, A. & Schmitz, R. J. A cis-regulatory atlas in maize at single-cell resolution. Cell 184, 3041-3055 (2021).
53. Zhang, Y. et al. Model-based analysis of ChIP-seq (MACS). Genome Biol. 9, R137 (2008).
54. Korsunsky, I. et al. Fast, sensitive and accurate integration of single-cell data with Harmony. Nat. Methods https://doi.org/10.1038/s41592-019-0619-0 (2019).
55. Cusanovich, D. A. et al. Multiplex single cell profiling of chromatin accessibility by combinatorial cellular indexing. Science 348, 910-914 (2015).
56. Fornes, O. et al. JASPAR 2020: update of the open-access database of transcription factor binding profiles. Nucleic Acids Res. 48, D87-D92 (2020).
57. Wickham, H. ggplot2: Elegant Graphics for Data Analysis (Springer, 2009).
58. Procko, C. et al. Leaf cell-specific and single-cell transcriptional profiling reveals a role for the palisade layer in UV light protection. Plant Cell https://doi.org/10.1093/plcell/koac167 (2022).
59. O’Malley, R. C. et al. Cistrome and epicistrome features shape the regulatory DNA landscape. Cell 165, 1280-1292 (2016).
60. Nobori, T. et al. Transcriptome landscape of a bacterial pathogen under plant immunity. Proc. Natl Acad. Sci. USA 115, E3055-E3064 (2018).
61. Giacomello, S. & Lundeberg, J. Preparation of plant tissue to enable spatial transcriptomics profiling using barcoded microarrays. Nat. Protoc. 13, 2425-2446 (2018).
62. Pachitariu, M. & Stringer, C. Cellpose 2.0: how to train your own model. Nat. Methods 19, 1634-1641 (2022).
63. Petukhov, V. et al. Cell segmentation in imaging-based spatial transcriptomics. Nat. Biotechnol. 40, 345-354 (2022).
64. Cable, D. M. et al. Robust decomposition of cell type mixtures in spatial transcriptomics. Nat. Biotechnol. https://doi.org/10.1038/s41587-021-00830-w (2021).
Additional information
Correspondence and requests for materials should be addressed to Joseph R. Ecker. Peer review information Nature thanks Gitta Coaker, Xuehua Zhong and the other, anonymous, reviewer(s) for their contribution to the peer review of this work. Peer reviewer reports are available.
Reprints and permissions information is available at http://www.nature.com/reprints.
Article
f, Sample-aggregated chromatin accessibility around ACTIN2 (left) and ICS1 (right).g, Principle component analysis of pseudobulk transcriptome of each sample. Independent replicates of Mock and AvrRpt2 9 h were labeled. h, Scatter plots comparing pseudobulk transcriptomes of Mock and AvrRpt29 h samples. Pearson’s correlation coefficient values were shown. i, Stacked bar plots showing the representation of gene expression-based Leiden clusters in each sample. j, Two-dimensional embedding of chromatin accessibility similarity among nuclei from all samples with uniform manifold approximation and projection (UMAP). Nuclei are colored by Leiden clusters. k, UMAP embeddings based on a joint neighbor graph that represents both gene expression and chromatin accessibility measurements. Nuclei are colored by de novo Leiden clusters based on the joint analysis (left) and Leiden clusters defined by gene expression measurement alone (right; Fig.1b).
on a peak near FDH(chromosome 2, position 11172821-11173529) in each nucleus. d, GO enrichment analysis for marker genes of each cluster. e, Expression of ICS1 mRNA in each nucleus in each sample. Adjusted p-values from a one-sided hypergeometric test followed by Benjamini-Hochberg correction are shown.
companion cell markers SUC2 and FTIP1. e, Expression of ALD1 and FMO1. f, Expression of ILL6 upon infection of AvrRpt2 in time course, showing specific induction in cluster 6.g, Expression of genes specifically expressed in subcluster 6-8.h, Heatmap showing expression of immune-related genes shown in Fig. 1d in a previous time-course bulk RNA-seq study, where
annotation (the
e, Density plot showing the frequency of genes with different numbers of linked ACRs.f, Schematic diagram of the ATAC activity analysis. For each gene, ATAC reads mapped on the gene body or the 400 bp upstream region were aggregated to calculate the score.g, Scatter plot showing the relationship between the number of linkages ( x -axis) and RNA-ATAC activity correlation score ( y -axis). h, Scatter plot showing the relationship between the maximum correlation coefficient between each gene and linked ACRs (
Extended Data Fig. 6 | Identification of TF-gene modules. a,b Heatmaps
motif enrichment scores and mRNA expression of the corresponding TFs in each cell type (shown in the top bar). All TFs are shown. d, GO enrichment analysis of genes predicted to be targeted by TFs shown in Fig. 2h.
by the transcript-based segmentation (red dots) and the result of failed DAPI-staining-based segmentation (yellow region). Similar patterns were observed across FOVs and samples. A systematic quantitative analysis is provided in (f). (a,d) Scale bars
Article
f, smFISH of ICS1 in leaves infected by AvrRpt2 or DC3000 at 24 hpi.g, Spatial mapping of bacterial transcripts detected with smFISH in plants infected by AvrRpt2 (left) and DC3000 (right) at 24 h post-infection (hpi). Pseudotime values are also visualized in the background. Dot size reflects the number of bacterial transcripts detected. a-g, Scale bars
Article
a, Heatmaps showing expression of ALD1, FMO1, and BON3 in each cell at 9 hpi . b, Expression of
or DC3000-infection (bottom) condition. h, Expression of/CS1 in cells infected by AvrRpt2. c,g,h, All time points were combined. i, Motif activity of GT-3A in immune-active mesophyll cells.j, Lesion area created by Colletotrichum higginsianum infection in Col-0 and two independent GT-3A overexpression lines and pad3 mutant at 6 days post inoculation. Different letters indicate statistical significance (adjusted
natureportfolio
Reporting Summary
Statistics
n/a
□
□
□
Only common tests should be described solely by name; describe more complex techniques in the Methods section.
□ A description of all covariates tested
□
□
□
□ For Bayesian analysis, information on the choice of priors and Markov chain Monte Carlo settings
□ For hierarchical and complex designs, identification of the appropriate level for tests and full reporting of outcomes
□ X
Estimates of effect sizes (e.g. Cohen’s
Our web collection on statistics for biologists contains articles on many of the points above.
Confirmed
exact sample size
□
statement on whether measurements were taken from distinct samples or whether the same sample was measured repeatedly
A description of all covariates tested
ast updated by author(s): sistency and transparency
Data
Policy information about availability of data
- Accession codes, unique identifiers, or web links for publicly available datasets
- A description of any restrictions on data availability
- For clinical datasets or third party data, please ensure that the statement adheres to our policy
Human research participants
| Reporting on sex and gender | N/A |
| Population characteristics | N/A |
| Recruitment | N/A |
| Ethics oversight | N/A |
Field-specific reporting
Life sciences □ Behavioural & social sciences □ Ecological, evolutionary & environmental sciences
For a reference copy of the document with all sections, see nature.com/documents/nr-reporting-summary-flat.pdf
Life sciences study design
| Sample size | No statistical method was used to determine sample size. Instead, sample sizes were determined based on a combination of factors, including standard practices in plant biology research and the objectives of the experiments. For the pathogen growth assay, we selected sample sizes based on their effectiveness in previous similar studies in the field (such as PMID: 35545668, PMID: 37704725, and PMID: 35508659). For the snMultiome and MERFISH time course experiments, we primarily analyzed one replicate for each condition. Second replicates of snMultiome were performed for key conditions, which is a similar setup with a recent time course single-cell RNA-seq study (PMID: 36996230). In addition, we used two different pathogens known to induce similar responses and used matching conditions for independent snMultiome experiments, further ensuring the reproducibility of our data. Although the MERFISH experiments were performed with single replicates, the sample conditions match those of the snMultiome experiments, allowing cross-validation of conclusions from these orthogonal analyses. Therefore, we believe that the sample sizes used for snMultiome and MERFISH experiments are sufficient to support the conclusions of this study. | ||
| Data exclusions | No data was excluded for the analyses in this study. | ||
| Replication |
|
||
| Randomization | Plants were grown in the same tray to ensure consistent environmental conditions. Individual plants were then randomly assigned to different treatment groups. This random allocation was employed to minimize selection bias and distribute any uncontrolled variables evenly across all treatment groups. | ||
| Blinding | In pathogen infection assays, certain treatments produce visible disease phenotypes, making it impossible to conceal the treatments applied. To minimize potential biases, we implemented consistent experimental protocols and standardized analysis pipelines for all samples. |
Reporting for specific materials, systems and methods
| Materials & experimental systems | Methods | ||
| n/a | Involved in the study | n/a | Involved in the study |
| X | □ | X | □ |
| X | □ | X | □ |
| X | □ | X | □ |
| X | □ | ||
| X | □ | ||
| X | □ | ||
- For manuscripts utilizing custom algorithms or software that are central to the research but not yet described in published literature, software must be made available to editors and reviewers. We strongly encourage code deposition in a community repository (e.g. GitHub). See the Nature Portfolio guidelines for submitting code & software for further information.