جينغهانغ شيويورُو غوانجوناثان أولدفيلددابو جوانيولي شانمدرسة الجغرافيا وعلوم الأرض والبيئة، جامعة برمنغهام، برمنغهام B15 2TT، المملكة المتحدةالبحث المتكامل في الطاقة والبيئة والمجتمع (IREES)، معهد أبحاث الطاقة والاستدامة في غرونينغن، جامعة غرونينغن، غرونينغن 9747 AG، هولنداقسم علوم نظام الأرض، وزارة التعليم، المختبر الرئيسي لنمذجة نظام الأرض، معهد دراسات التغير العالمي، جامعة تسينغhua، بكين 100084، الصينمدرسة بارتليت للبناء المستدام، كلية جامعة لندن، لندن WC1E 6BT، المملكة المتحدة
النقاط البارزة
محاسبة انبعاثات الأراضي الإدارية من الوقود الأحفوري وإنتاج الأسمنت وفقًا لـ IPCC للصين ومقاطعاتها في 2020-2021
محاسبة الانبعاثات المستندة إلى الاستهلاك في الصين من 2002 إلى 2020
كشف التأثير الديناميكي لكوفيد-19 على انبعاثات الكربون في الصين
معلومات المقال
الكلمات المفتاحية:
حسابات الانبعاثات الحياد الكربوني استخدام الطاقة تغير المناخ الصين
الملخص
في السنوات القليلة الماضية، أدت تفشي وباء COVID-19 إلى تغيير أنماط الانبعاثات العالمية بشكل كبير وزيادة التحديات في تقليل الانبعاثات. ومع ذلك، لم يتم إجراء تحليل شامل لأحدث اتجاهات انبعاثات الكربون في الصين بسبب نقص الحسابات المحدثة للانبعاثات حسب المناطق والقطاعات. تجمع هذه الدراسة أحدثجرد الانبعاثات للصين و30 محافظة خلال الوباء (2020-2021)، وفقًا للنهج الإداري الإقليمي من الهيئة الحكومية الدولية المعنية بتغير المناخ (IPCC). تغطي جردنا الانبعاثات المتعلقة بالطاقة من 17 نوعًا من احتراق الوقود الأحفوري وإنتاج الأسمنت عبر 47 قطاعًا اقتصاديًا. لتقديم رؤية شاملة لأنماط الانبعاثات، قمنا بتقدير الانبعاثات المستندة إلى الاستهلاك في الصين. نجد أن وباء COVID-19 أدى إلى انخفاض في معدل نمو الانبعاثات الإقليمية في عام 2020 مقارنة بعام 2019. ثم عكس هذا الاتجاه في عام 2021 مع تخفيف تدابير الإغلاق تدريجياً. تكشف دراستنا عن تأثير التوسع السريع في الصادرات، المدفوع بمواد الوقاية من الأوبئة ومنتجات “اقتصاد البقاء في المنزل” على توسيع الفجوات بين الانبعاثات الإقليمية والانبعاثات المستندة إلى الاستهلاك. تقدم دراستنا مخططًا زمنيًا لتصميم استراتيجيات نحو ذروة الكربون والحياد، خاصة في سياق التعافي المستدام والتخفيف من الكربون بعد الجائحة.
1. المقدمة
مع تزايد تأثير الاحتباس الحراري في جميع أنحاء العالم، من الضروري أن تتضافر جهود الدول في جميع أنحاء العالم للحد من انبعاثات الكربون. تضمن التقديرات الموثوقة للانبعاثات أن تكون استراتيجيات التخفيف وصنع السياسات قابلة للتنفيذ وفعالة، مما يوفر فهماً شاملاً لدورة الكربون العالمية. [23] مع تحول الصين إلى أكبر دولة في العالم…المنتج [13]، تتحمل البلاد مزيدًا من المسؤولية عن تخفيض الانبعاثات. تسعى الصين بنشاط إلى تنفيذ استراتيجيات متنوعة للتخفيف منالانبعاثات، متماشياً مع الطموحات أهداف مثل الوصول إلى ذروة الانبعاثات قبل عام 2030 وتحقيق الحياد الكربوني قبل عام 2060 (أي، أهداف الكربون المزدوج). نظرًا لدور الصين في الانبعاثات العالمية وتأثيرها على مسارات الانبعاثات العالمية، فإن هذه الأهداف ليست مهمة للصين فحسب، بل لها تداعيات عالمية. قد يسهم تحقيقها في تعزيز تحقيق أهداف التحكم في درجة الحرارة المحددة في اتفاق باريس.
حققت الصين تقدمًا كبيرًا في تقليل انبعاثات الكربون في السنوات الأخيرة. في عام 2020، انخفضت كثافة الانبعاثات (انبعاث الكربون لكل وحدة من الناتج المحلي الإجمالي) بنسبة مقارنةً بعام 2005، الذي تجاوز هدف التخفيض الذي وعدت به
الحكومة [9]. ومع ذلك، لا تزال هناك تحديات كبيرة أمام الصين لتحقيق أهداف الكربون المزدوج. أولاً، كانت الصين تعتمد بشكل كبير على استهلاك الوقود الأحفوري (حتىفي عام 2020)، مما ساهم في مزيج طاقة عالي الكربون وانبعاثات كربونية ضخمة [41]. ثانيًا، يؤدي توسع القطاعات ذات الاستهلاك العالي للطاقة إلى زيادة حصة التصنيع، مما يؤدي إلى انبعاثات كبيرة [30]. أخيرًا، يؤدي النمو الاقتصادي السريع في الصين حتمًا إلى استهلاك عالي للطاقة [32].
في عام 2020، أثر ظهور COVID-19 والإغلاقات اللاحقة حول العالم على انبعاثات الكربون. في الصين، خلال الأشهر الأربعة الأولى، أدت الأنشطة الصناعية المخفضة والم engagements الاجتماعية إلى انخفاض في استهلاك الطاقة، مما أدى إلى تقليل الانبعاثات. على وجه التحديد، من يناير إلى أبريل، شهدت انبعاثات التصنيع انخفاضًا قدره 70.50 مليون طن، وهو ما يعد انخفاض مقارنة بنفس الفترة في عام 2019 [26]. ومع ذلك، بدلاً من عمليات الإغلاق الواسعة النطاق، اعتمدت البلاد تدابير إغلاق محلية وقصيرة من أبريل فصاعدًا. وبالتالي، كان تأثيرها أقل وضوحًا ويمكن ملاحظة زيادة ملحوظة في الانبعاثات. وقد تم تسليط الضوء على هذه الزيادة بواسطةزيادة في انبعاثات التصنيع في أبريل، مقارنة بأبريل 2019 [26]. نظرًا لأن الانخفاض في انبعاثات الكربون في العديد من القطاعات في عام 2020 لم يكن بسبب تغييرات هيكلية بل بسبب تغييرات سلوكية إلزامية، فمن المتوقع حدوث ارتفاع سريع في الانبعاثات بعد تخفيف القيود [23]. لقد أدخل الوباء غير المتوقع درجة كبيرة من عدم اليقين على مسار الانبعاثات العالمية، مما يجعل من الصعب صياغة سياسات تقليل الانبعاثات. إن المحاسبة الدقيقة لانبعاثات الكربون أمر حاسم لتقييم تأثير الجائحة ولتشكيل استراتيجيات مستقبلية تهدف إلى تحقيق الحياد الكربوني. من خلال مراقبة كيفية استجابة الاقتصادات الكبرى، مثل الصين، للاختلالات المفاجئة، يمكننا الحصول على رؤى قيمة يمكن أن توجه الدول في بناء المرونة ضد الأحداث غير المتوقعة وفي سعيها نحو التنمية المستدامة.
لا تزال هناك بعض الصعوبات والفجوات في تقدير جرد الانبعاثات. أولاً، تفتقر الصين إلى جرد انبعاثات رسمي مستمر، حيث تتوفر البيانات فقط لسنوات محددة (1994، 2005، 2010، 2012، 2014، 2017، 2018) [17،35،36]. لا يصل جرد الانبعاثات غير المتسق إلى معيار مجموعة بيانات عالية الجودة (اتفاق باريس) ويفشل في تقديم المعلومات والتفاصيل اللازمة حول تقليل الانبعاثات. ثانياً، يُستخدم على نطاق واسع تم بناء قواعد بيانات الانبعاثات بمعايير إحصائية مختلفة، كما هو موضح في الجدول S1 في المواد التكميلية 1. تجعل المعايير الإحصائية المختلفة هذه المجموعات البيانية غير قابلة للمقارنة إلى أي مدى ذي معنى. ثالثًا، بينما توجد دراسات تقدم بيانات انبعاثات على مستوى المقاطعات [8،58]، لا تزال هناك فجوات فيما يتعلق بالانبعاثات حسب القطاعات التفصيلية وأنواع الطاقة. على سبيل المثال، وضع غيفارا وآخرون [18] سيناريو الانبعاثات لـالوقود الأحفوري والوقود الحيوي. قام دومبيا وآخرون [7] بإنشاء سيناريو انبعاثات COVID-19 مع إجمالي أربعة قطاعات: الطاقة، الصناعة، السكن والنقل. على الرغم من أن هذه القطاعات وأنواع الطاقة تمثل نسبة عالية من الانبعاثات، إلا أنها لا تعكس صورة شاملة لانبعاثات الصناعة بشكل عام. نظرًا لأن أهداف الكربون المزدوجة للصين تتطلب العمل الجماعي من جميع المقاطعات، فإن اكتمال هذه البيانات أمر ضروري. أخيرًا، من بين جميع الأعمال المذكورة أعلاه، فقط غيفارا وآخرون [18] جعلوا مجموعة بيانات انبعاثاتهم النهائية عامة. الدراسات المتبقية لا تقدم البيانات الخام أو توضح مصدر البيانات، مما يؤدي إلى بيانات تقديرية غير شفافة وغير موثوقة.
بالإضافة إلى الانبعاثات الإقليمية، تم اعتبار الانبعاثات المستندة إلى الاستهلاك مكملًا لحساب الانبعاثات الوطنية. تتبع الطريقة المستندة إلى الاستهلاك الانبعاثات المتجسدة في سلاسل التوريد، مما يتيح قياس الانبعاثات الكربونية المتجسدة في أنماط الاستهلاك في منطقة معينة. تتيح هذه الطريقة تقييمًا شاملاً للمسؤولية الكربونية، مما يحول التركيز من المنتجين إلى المستهلكين. يعزز هذا التحول الاستراتيجيات التي تهدف إلى التخفيف من تغير المناخ من منظور الاستهلاك. ومع ذلك، فإن معظم الدراسات التي تحسب الانبعاثات المستندة إلى الاستهلاك لديها قيود في نطاقها الزمني والمكاني. على سبيل المثال، قدر Feng et al. [12] الاستعانة بمصادر خارجية بين المقاطعات.الانبعاثات في الصين في عام 2007. تشير النتائج إلى أن المنتجات والخدمات التي يتم استهلاكها خارج المحافظة التي يتم إنتاجها فيها تمثلانبعاثات الصين. قدر صن ومي [50] الانبعاثات المستندة إلى الاستهلاك من 2012 إلى 2020 وحللا العوامل التي تؤثر على تغييرات الانبعاثات. وجدا أن الصادرات والاستثمارات في قطاع البناء هي المحركات الرئيسية لنمو الانبعاثات. لذلك، تحتاج الانبعاثات المستندة إلى الاستهلاك في الصين إلى تحليل أكثر عمقًا.
استهدافًا للفجوات البحثية المذكورة أعلاه، يمثل هذا البحث تحديثًا شاملاً لتقديرات انبعاثات الصين الحالية [17،46،47] من خلال تضمين (ط) وصف للاتجاهات الإقليميةانبعاثات من كل من احتراق الطاقة وإنتاج الأسمنت على مدى الفترة التاريخية 1997-2022، مع تركيز قوي على فترة جائحة COVID-19، (ii) أكثر السلاسل الزمنية الشاملة لمخزونات الطاقة/الانبعاثات، تغطي 47 قطاعًا اقتصاديًا و17 نوعًا من الطاقة، (iii) اعتبار التغير في الانبعاثات لـ 30 مقاطعة تشمل الفترة التي تسبق وبعد COVID-19، و(iv) تقديم منظور أكثر شمولية من الانبعاثات المستندة إلى الاستهلاك، والنظر عن كثب في الفجوات بين الانبعاثات المستندة إلى الإقليم والانبعاثات المستندة إلى الاستهلاك على مدى التاريخ الطويل. مجموعة البيانات التي تم تطويرها في هذه الدراسة تهدف إلى دعم قياس ” الصين.تغيرات الانبعاثات، وكشف التأثير غير المتجانس لـ COVID-19 على الانبعاثات عبر 30 مقاطعة و47 قطاعًا اقتصاديًا في الصين. ستوفر جرد الانبعاثات المتسق والقابل للمقارنة معلومات قيمة، مما يساعد في توجيه استجابات الحكومة للأزمات غير المتوقعة في المستقبل ويساعد في تطوير مبادرات التخفيف المستقبلية. علاوة على ذلك، يمكن أن يكون هذا بمثابة نموذج للدول الأخرى، موفرًا دروسًا حول كيفية التعامل مع الاضطرابات واسعة النطاق وتطوير أطر سياسات استجابة. تم نشر جرد الانبعاثات المتعلقة بالطاقة والعمليات في مجموعة البيانات مفتوحة المصدر الخاصة بنا.حسابات وانظمة بيانات انبعاثات الصين (CEADs،www.ceads.net).
2. الطرق
2.1. الأساليب المحاسبية
هناك عدة طرق محاسبية لتقدير انبعاثات الكربون [48]. تقدير المحاسبة القائم على الإنتاج يحدد الانبعاثات الناتجة عن أنشطة الإنتاج في منطقة معينة. بينما تغطي المحاسبة القائمة على الإقليم جميع الانبعاثات الناتجة داخل البلاد. على عكس المحاسبة القائمة على الإنتاج، لا تأخذ المحاسبة القائمة على الإقليم في الاعتبار الانبعاثات الناتجة عن الطيران الدولي أو الشحن. يمكن أن توفر المحاسبة القائمة على الاستهلاك بصمة كربونية أكثر شمولاً. فهي تحدد الانبعاثات المرتبطة بالمنتجات والخدمات التي تحدث في منطقة معينة ولكن يتم إنتاجها في أماكن أخرى [56]. تعتبر المحاسبة القائمة على الإقليم الطريقة المحاسبية الإلزامية في اتفاقية الأمم المتحدة الإطارية بشأن تغير المناخ (UNFCCC)، حيث تتيح هذه الإحصائيات إجراء مقارنات بين تقدم الدول في تقليل الانبعاثات وتكون دقيقة للغاية [57].
2.2. المحاسبة القائمة على الإقليم
في هذه الدراسة، تم تجميع الانبعاثات المعتمدة على الإقليم وفقًا للإرشادات من نهج اللجنة الدولية المعنية بتغير المناخ الإداري الإقليمي [22] وتغطي انبعاثات الكربون للصين و30 مقاطعة من عام 1997 حتى أحدث سنة متاحة للتقارير (2021). نحن نعتبر المحاسبة المعتمدة على الإقليم من مصدرين رئيسيين: الانبعاثات المتعلقة بالطاقة والانبعاثات المتعلقة بالعمليات. النطاق، الشكل، ومصدر البيانات بين التقديرات الوطنية والإقليمية في هذه الورقة متسقة.
2.2.1. انبعاثات القطاعات المتعلقة بالطاقة
تشير الانبعاثات المتعلقة بالطاقة إلى انبعاثات الكربون الناتجة عن احتراق الوقود الأحفوري. يمكن حساب الانبعاثات المتعلقة بالطاقة، مقسمة حسب القطاعات وأنواع الطاقة، بناءً على المعادلة التالية.
أين و يتم تعريفها على أنها نوع الوقود والقطاع.يشير مقدارالمنبعث من احتراق الوقودفي القطاعهو بيانات النشاط، تمثل كمية الوقود الأحفوري المستهلك من قبل الوقود الأحفوريوالقطاع. نحن نعتبر احتراق الطاقة لبيانات النشاط فقط ونستبعد جزء الاستخدام غير الطاقي وفقدان الطاقة. يمكن فصل عامل الانبعاثات إلى و هو القيمة الحرارية الصافية، التي تمثل الحرارة المنبعثة من الوقودعندما يبرد إلى حالته الأولية (درجة الحرارة المحيطة بعد الاحتراق الكامل).هو محتوى الكربون، مما يدل على النسبة المئوية للكتلة من الكربون في جميع العناصر المقاسة في الوقودهو معدل الأكسدة، مما يدل على نسبة الوقود المؤكسد أثناء الاحتراق. تعتمد هذه الدراسة على عوامل الانبعاث المستندة إلى الاستطلاعات من أبحاثنا السابقة [[28]،46].
تغطي جرد انبعاثاتنا 17 نوعًا من الوقود الأحفوري (موضحة في الجدول S2 في المواد التكميلية 1) و47 قطاعًا (موضحة في الجدول S3 في المواد التكميلية 1). من حيث تصنيف القطاعات، يتبع جردنا معيار المحاسبة الاقتصادية الوطني في الصين ونهجه [37]. تسهل نفس الطريقة الإحصائية المقارنة للدراسات المستقبلية.
2.2.2. انبعاثات مرجعية متعلقة بالطاقة
تُقدّر انبعاثات المراجع المتعلقة بالطاقة باستخدام بيانات إمدادات الطاقة. إنها طريقة من أعلى إلى أسفل، يمكن اعتبارها مكملة للنهج القطاعي [22]. قمنا بتقدير انبعاثات المراجع للفحم الخام، والنفط الخام، والغاز الطبيعي، لأنها مصادر الطاقة الأساسية. تُحسب انبعاثات المراجع على النحو التالي:
أين،تشير إلى الانبعاثات المقدرة باستخدام الطريقة المرجعية. بيانات النشاط (يمكن تقديره استنادًا إلى ميزان الطاقة:
من الملحوظ أن العناصر الموجودة بين الأقواس تؤخذ بعين الاعتبار فقط عند تقدير انبعاثات المقاطعة.
2.2.3. الانبعاثات المتعلقة بالعمليات
في هذه الورقة، نقوم بتقدير الانبعاثات المتعلقة بالعمليات من إنتاج الأسمنت، حيث إن إنتاج الأسمنت هو المصدر الثالث الأكبر لانبعاثات الكربون على مستوى العالم [2] ويساهم بحواليمتعلق بالعملية الانبعاثات في الصين [46]. تحدث التفاعل الكيميائي في صناعة الأسمنت عندما تتفاعل الكربونات (بشكل كبير المحتواة في الحجر الجيري تتحول إلى أكاسيد (بشكل أساسي الجير، CaO) ومن خلال إضافة الحرارة. يمكن تقدير الانبعاثات المتعلقة بالعملية على النحو التالي:
أين،تشير إلى الانبعاثات الناتجة عن إنتاج الأسمنت. هو كتلة إجمالي إنتاج الأسمنت. قيمة تم جمعه من ليو وآخرون [28].
2.3. المحاسبة المعتمدة على الاستهلاك
نحن نتبنى نموذج المدخلات والمخرجات لتقدير انبعاثات الاستهلاك في الصين في هذه الدراسة. لقد تم استخدام نموذج المدخلات والمخرجات الممتد بيئيًا على نطاق واسع لحساب الانبعاثات غير المباشرة والانبعاثات المتجسدة لقطاع اقتصادي في دولة واحدة [20،59]. يمكن العثور على تفسيرات أكثر تفصيلًا في الدراسات السابقة [34،55].
الإنتاج الكلي للقطاعات داخل الاقتصاديمكن التعبير عنها كـ
أين هو الناتج الإجمالي للقطاعات.هو مصفوفة معامل التكنولوجيا، تمثل الروابط الاقتصادية بين القطاعات.هي المدخلات الوسيطة من القطاع i إلى القطاع j.هو الناتج الكلي لـ القطاع ج. هو مجموع الاستهلاك الوسيط من القطاعات؛ هو الطلب النهائي للقطاعات. عند حله لإجمالي الإنتاج، يمكن أن تعطي المعادلة (5)
أينهي مصفوفة الهوية،هو مصفوفة ليونتيف العكسية.
علاوة على ذلك، نقدم المعادلة (7) لتقدير الانبعاثات المستندة إلى الاستهلاك.
أين،هي مصفوفة الانبعاثات الناتجة عن الطلبات النهائية للقطاعات (أي الانبعاثات المستندة إلى استهلاك القطاعات)؛هو متجه كثافة الانبعاثات، والذي يمثل الانبعاثات المستندة إلى الإقليم لكل وحدة من الناتج في قطاع ما.
نظرًا لأن الانبعاثات المعتمدة على الإقليم تأخذ في الاعتبار انبعاثات الأسر (الريفية والحضرية)، فإن حساباتنا المعتمدة على الاستهلاك تشمل الانبعاثات الناتجة عن الاستخدام المباشر للطاقة من قبل الأسر، من أجل التناسق وقابلية المقارنة. في دراستنا، تشير حدود الانبعاثات المعتمدة على الاستهلاك إلى الانبعاثات الناتجة عن الطلبات النهائية (أي، استهلاك الحكومة، الواردات، تكوين رأس المال، استهلاك الأسر الريفية والحضرية) في الصين.
2.4. تقييم عدم اليقين
تنشأ مصدران رئيسيان من عدم اليقين في انبعاثات القطاعات المتعلقة بالطاقة من بيانات النشاط وعوامل الانبعاث. من أجل فحص هذا عدم اليقين، قمنا بتطبيق طريقة مونت كارلو، التي يوصي بها إرشادات حساب الانبعاثات التابعة للهيئة الحكومية الدولية المعنية بتغير المناخ. تتضمن هذه الطريقة إدخال توزيعات احتمالية لكل نموذج (بيانات النشاط وعوامل الانبعاث). بناءً على دوال الكثافة الاحتمالية الخاصة بها، يتم اختيار قيم عشوائية لعوامل الانبعاث وبيانات النشاط، والتي تُستخدم بعد ذلك لحساب قيم الانبعاثات المقابلة. باستخدام MATLAB، يتم تنفيذ هذه العملية بشكل تكراري 20,000 مرة، حيث تساهم النتائج من كل تكرار في بناء دالة كثافة الاحتمال العامة للانبعاثات.
2.5. مصادر البيانات
استنادًا إلى طريقة المحاسبة القائمة على الإقليم المذكورة أعلاه، يتم جمع بيانات النشاط لكل نوع من أنواع الوقود الأحفوري في كل قطاع، وعوامل الانبعاث. يتم الحصول على بيانات استهلاك الطاقة على المستوى الوطني و30 مقاطعة من الكتاب الإحصائي للطاقة في الصين لعامي 2021 و2022. يتم جمع بيانات النشاط للأسمنت على المستويين الوطني والإقليمي من الكتاب الإحصائي الصيني لعامي 2021 و2022، بالإضافة إلى الكتاب الإحصائي الإقليمي المقابل لنفس السنوات. يتم استقاء عوامل الانبعاث من أبحاثنا السابقة، التي توفر قيمًا مقاسة خاصة بالصين استنادًا إلى تحقيقات واسعة.
لتقدير بيانات الانبعاثات على المستوى الوطني لعام 2022 بشكل أولي، نطبق معدلات نمو استهلاك الطاقة (من الفحم والنفط والغاز الطبيعي) [42] على مخزون الطاقة في عام 2021 ونحصل على بيانات استهلاك الطاقة لعام 2022. ثم نستخدم هذه البيانات المتوقعة للطاقة لتقدير الانبعاثات لعام 2022.
فيما يتعلق بطريقة المحاسبة المعتمدة على الاستهلاك، تم جمع جداول المدخلات والمخرجات (IOTs) للسنوات 2002 و2005 و2007 و2010 و2012 و2015 و2017 و2018 و2020 من مكتب الإحصاءات في الصين [40].
3. النتائج
3.1. اتجاهات الانبعاثات القائمة على الإقليم في الصين
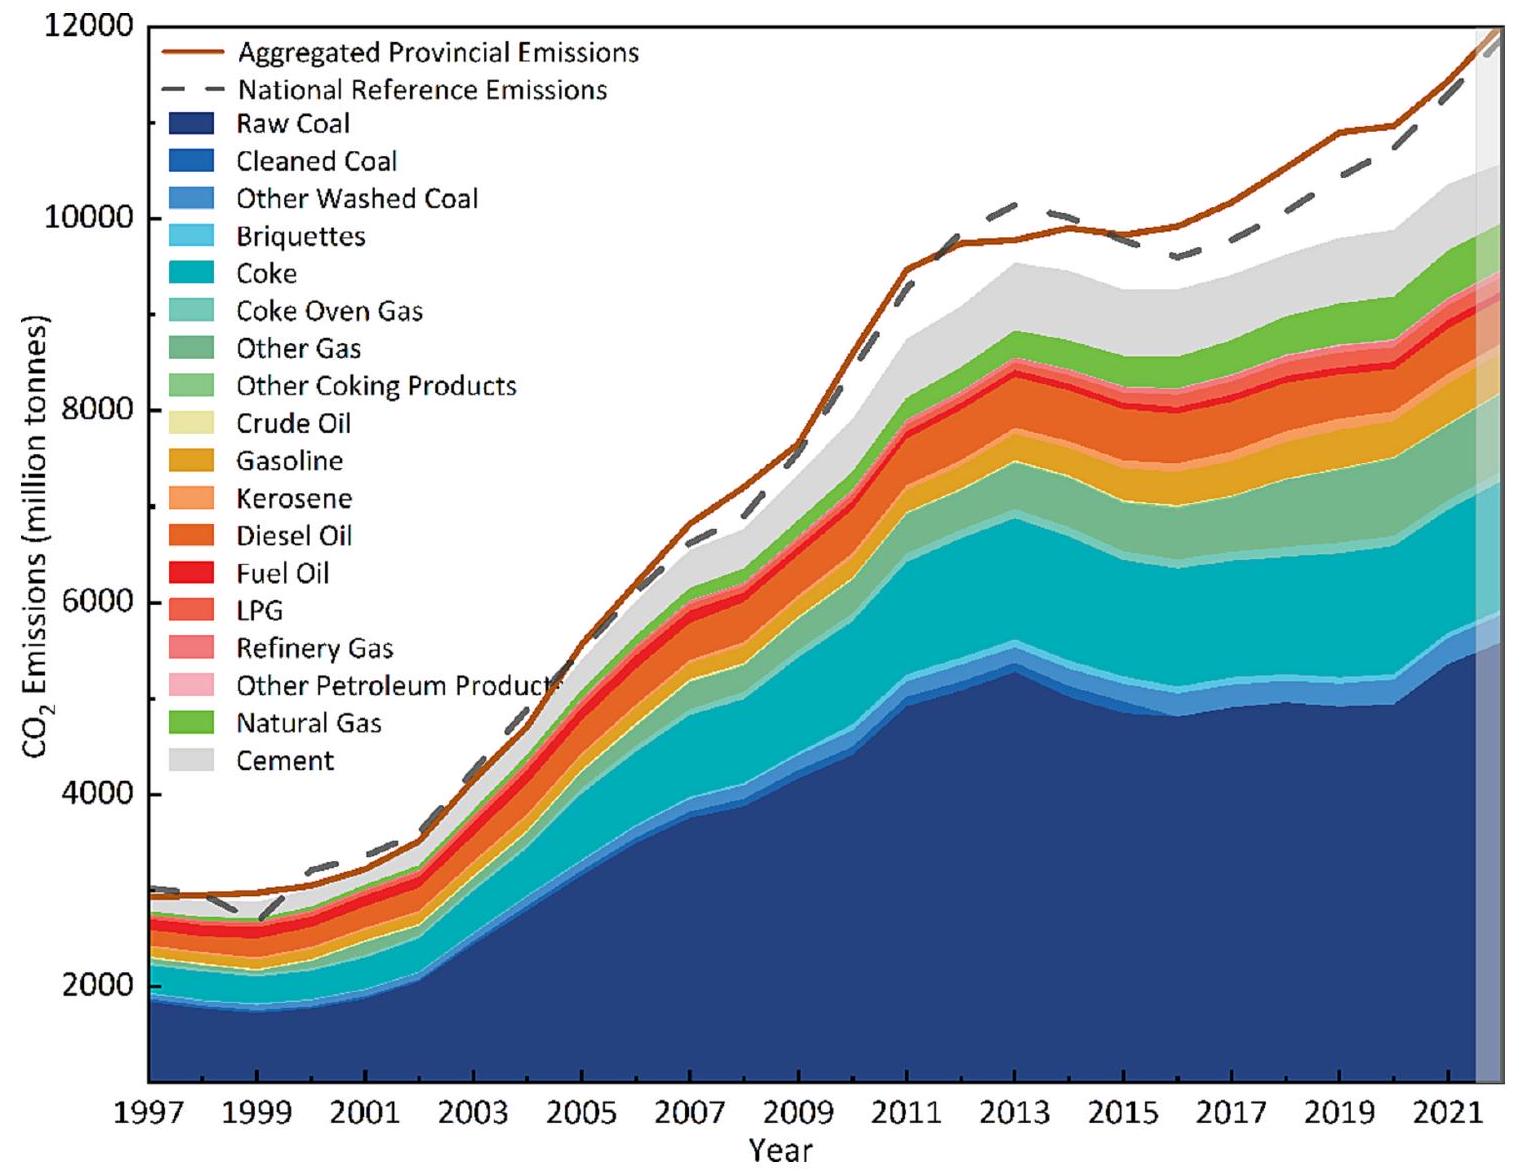
الشكل 1 يظهر القائم على الإقليمانبعاثات حسب فئات الوقود في الصين من 1997 إلى 2022. نمت انبعاثات الصين بشكل كبير من 1997 (2923.86 مليون طن) إلىثم انخفض قليلاً إلى 9253.50
الشكل 1.انبعاثات الصين حسب الفئة، بالملايين من الأطنان، من 1997 إلى 2022. جميع بيانات الانبعاثات في 2022 هي توقعات، وتم تمييزها بتراكب رمادي لتمييزها عن البيانات التاريخية.
جبل في عام 2015 وزاد بنسبةفي عام 2022 (10,571.34 مليون طن). خلال جائحة COVID-19 (2020-2021)، أظهرت الانبعاثات اتجاهًا تصاعديًا مقارنةً بعام 2019. ومع ذلك، كانت نسبة النمو السنوي من 2019 إلى 2020 تبلغ، أقل من ذلك من 2018 إلى 2019 (1.8%). مع أن أصبح الوباء أكثر قابلية للتحكم، كان هناك انتعاش ملحوظ في النمو، يتضح من معدل النمو السنوي من 2020 إلى 2021 الذي ارتفع إلى. في الصورة الأوسع، لا تزال انبعاثات الكربون في تزايد ولم تصل بعد إلى مرحلة الاستقرار. نصيب الفرد من الصينتضاعفت الانبعاثات ثلاث مرات بين عامي 2000 و2021، وتجاوزت الأرقام الخاصة بالمملكة المتحدة والاتحاد الأوروبي اعتبارًا من عام 2013 [52]. بحلول نهاية عام 2020، انخفضت كثافة الانبعاثات بـمقارنةً بما كان عليه في عام 2015، متجاوزًا الهدف الرسمي لـمجموعة التخفيضات للخطة الخمسية الثالثة عشرة.
عند فحص أنواع الطاقة، يتضح أن التعديلات على مزيج الطاقة على مدى العقد الماضي قد أسفرت عن نتائج ملحوظة. من ناحية، تباطأ نمو الانبعاثات لكل نوع من أنواع الطاقة. خلال الفترة من 2015 إلى 2020، كان متوسط معدل النمو السنوي للانبعاثات من الفحم والنفط والغاز الطبيعي هو و على التوالي، وهو ما كان أبطأ بكثير من ذلك خلال الفترة من 2010 إلى 2015 ( و على التوالي). يمكن أن يُعزى هذا الإنجاز إلى تباطؤ معدل نمو استهلاك الطاقة ( و في 2010-2015 و2015-2020 على التوالي)، وهو أقل من الناتج المحلي الإجمالي ( و في الفترة من 2010-2015 و2015-2020 على التوالي). يبرز هذا الاتجاه تحول الصين نحو مرحلة تنمية عالية الجودة ومستقرة حيث تزدهر الاقتصاد بمعدل نمو أقل نسبيًا في استهلاك الطاقة [4]. من ناحية أخرى، هناك تغيير ملحوظ في نسبة الانبعاثات من مصادر الطاقة المختلفة. انخفضت نسبة الانبعاثات من الفحم الخام والنفط الخام (من 62.8% و0.5% في 1997 إلى 51.7% و0.1% في 2021 على التوالي)، بينما زادت نسبة الانبعاثات من الغاز الطبيعي بشكل كبير (من في عام 1997 إلىفي عام 2021). يتماشى هذا الانتقال مع هيكل إنتاج الطاقة المتطور: انخفضت نسب الإنتاج للفحم الخام والنفط الخام (من و في عام 1997 إلى و في عام 2021 على التوالي)، بينما ارتفع إنتاج الغاز الطبيعي بشكل مستمر (منفي عام 1997 إلىفي عام 2021) [41].
فيما يتعلق بانبعاثات العمليات، ارتفعت انبعاثات الصين من إنتاج الأسمنت من 142.74 طن متري في عام 1997 إلى 615.49 طن متري في عام 2022. ومع ذلك، من المتوقع أن تستقر انبعاثات الأسمنت وتبدأ في الانخفاض تدريجياً في المستقبل، ويرجع ذلك إلى القيود المفروضة على إنتاج الأسمنت نتيجة لارتفاع تكاليف العمالة والمواد الخام.
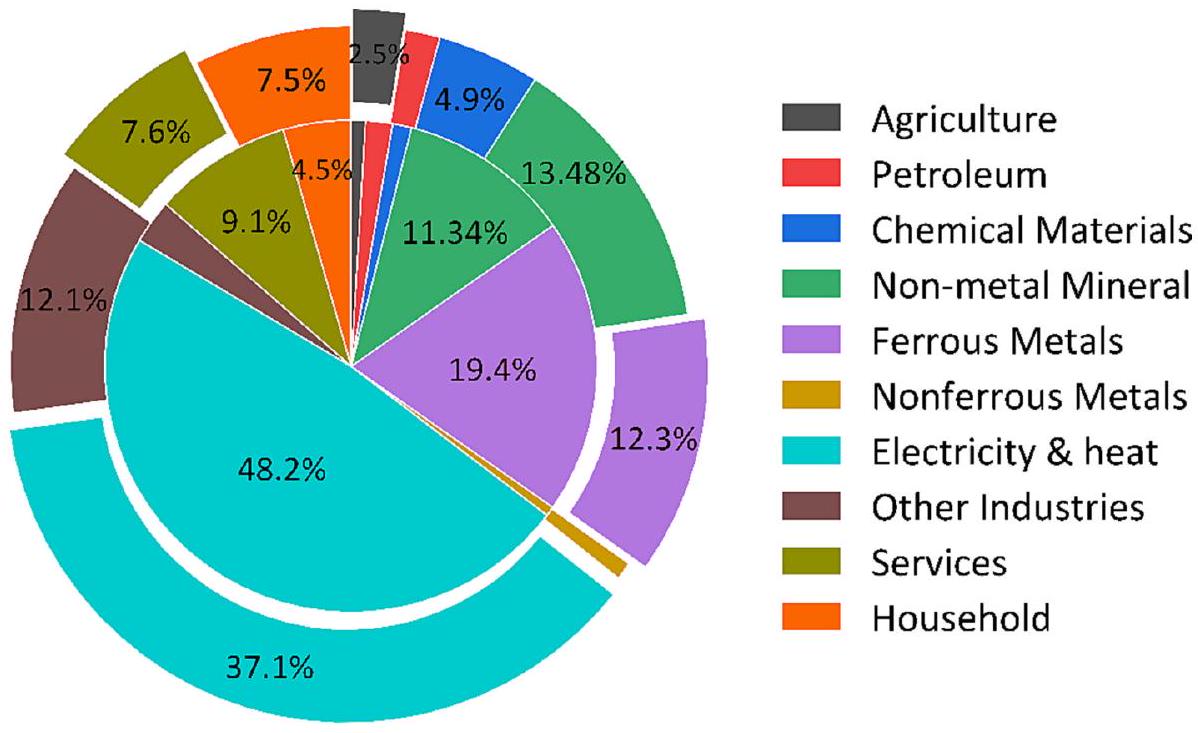
تحليل الانبعاثات حسب القطاعات الاقتصادية، تظل إنتاج وتوريد الطاقة الكهربائية، البخار والمياه الساخنة أكبر مصدر للانبعاثات في عام 2021 (الشكل 2). يعود هذا المساهمة الكبيرة في الانبعاثات إلى اعتماد الصين على الوقود الأحفوري التقليدي في توليد الكهرباء والحرارة. على سبيل المثال، في عام 2021، شكلت توليد الطاقة الحرارية في الصين، التي تعتمد بشكل أساسي على الفحم، نسبةمن توليد الطاقة الوطنية [39].
عند النظر إلى هيكل الصناعة على مدى فترة طويلة (من 1997 إلى 2021)، شهدنا تحولًا كبيرًا. في ظل تسارع التصنيع في الصين، ارتفعت انبعاثات التصنيع، حيث زادت من 2393.30 مليون طن في 1997 (81.9% من إجمالي الانبعاثات) إلى 8837.44 مليون طن في 2021، مما يشكلارتفعت مساهمة الانبعاثات من قطاع إنتاج وتوريد الطاقة الكهربائية والبخار والمياه الساخنة من ( 1085.30 مليون طن ) في عام 1997 إلى ( 5253.15 مليون طن ) في عام 2021. بالإضافة إلى ذلك، زادت حصة قطاع تعدين ومعالجة المعادن الحديدية من في عام 1997 إلىفي عام 2021. ومع ذلك، بسبب الفائض السائد في الصلب وانخفاض إنتاج الصلب الخام، من المتوقع أن تشهد الانبعاثات من صناعة الصلب انخفاضًا [45]. وهذا سيؤدي بالتالي إلى
الشكل 2. مساهمات القطاعات من وجهة نظر الإنتاج لـفي الصين في عام 1997، 2021. الدائرة الداخلية تظهر نسبة انبعاثات القطاعات في عام 2021، والدائرة الخارجية تمثل بيانات عام 1997.
خفض الانبعاثات الناتجة عن تعدين ومعالجة المعادن الحديدية. حتى مع استمرار التصنيع في وتيرته السريعة للتطور، فإن كثافة انبعاثات الكربون فيه في تراجع، مسجلة انخفاضاً قدرهخلال فترة الخطة الخمسية الثالثة عشرة. يبرز هذا الاتجاه الإيجابي الخطوات الفعالة التي تم إحرازها نحو التنمية منخفضة الكربون في قطاع التصنيع في الصين. بالمقابل، تضاعفت الانبعاثات من القطاع الثالث تقريبًا، حيث تمثلمن إجمالي نمو الانبعاثات من 1997 إلى 2021. ضمن هذا القطاع، يبرز قطاع النقل والتخزين والخدمات البريدية والاتصالات، حيث يتحمل مسؤولية كبيرةمن الزيادة. في هذه الأثناء، يظل القطاع الزراعي مساهمًا ضئيلاً، حيث يتناقص نصيبه منفي عام 1997 إلى مجردفي عام 2021.
3.2. الفرق بين انبعاثات الصين المعتمدة على الاستهلاك والانبعاثات المعتمدة على الإقليم
كعنصر حيوي في حسابات الانبعاثات، توفر الانبعاثات المستندة إلى الاستهلاك منظورًا أكثر شمولاً لتحليل أنماط الانبعاثات في الصين. تتشكل الانبعاثات المستندة إلى الاستهلاك من خلال فئات الطلب النهائي المختلفة: الأسر الريفية والحضرية.
الشكل 3. انبعاثات استهلاك الطاقة من 2002 إلى 2020. hhs هو اختصار للأسر. Rural_hhs تشمل الانبعاثات الناتجة عن استهلاك الأسر الريفية و Urban_hhs تشمل الانبعاثات الناتجة عن استهلاك الأسر الحضرية. الفرق يساوي الانبعاثات المستندة إلى الإقليم ناقص الانبعاثات المستندة إلى الاستهلاك.
الاستهلاك، استهلاك الحكومة، تكوين رأس المال والواردات (الشكل 3). على مر السنين، يبرز تكوين رأس المال باستمرار، مما يساهم فيمن الانبعاثات في المتوسط. يتماشى هذا مع معدل الادخار المرتفع في الصين، حيث تلعب الاستثمارات دورًا رئيسيًا بدلاً من الاستهلاك في دفع الطلب [33]. انخفضت الانبعاثات الناتجة عن استهلاك الأسر الريفية من (في عام 2002) إلى 6.5% (في عام 2020)، ويرجع ذلك أساسًا إلى عملية التحضر في الصين [44]. انخفضت نسبة السكان الريفيين من إلىانبعاثات الناتجة عن الأسر الحضرية واستهلاك الحكومة كانت مستقرة نسبيًا، حوالي و على التوالي. انخفضت الانبعاثات المرتبطة بالواردات منإلىعلى مدار نفس الفترة، على الرغم من استقرارالنمو السنوي في قيمة الواردات. وهذا يشير إلى أن طبيعة الواردات تتجه نحو منتجات ذات انبعاثات أقل وأثر بيئي أكثر صداقة.
عند النظر في الفرق بين الانبعاثات المستندة إلى الإقليم والانبعاثات المستندة إلى الاستهلاك (التي تعادل الانبعاثات الناتجة عن الصادرات)، يمكن أن يكشف هذا التفاوت كيف تؤثر أنماط التجارة على انبعاثات الكربون. في الشكل 3، نلاحظ القيمة الإيجابية لـ ‘الفرق’، ومن الواضح أن الصادرات تتجاوز الواردات. لقد أثر هذا الارتفاع في الصادرات بشكل كبير على زيادة انبعاثات الكربون في الصين في السنوات الأخيرة، مما منح الصين ميزة استراتيجية في المناقشات المناخية الدولية [11]. اتسعت الفجوة تدريجياً منذ عام 2002، وبلغت ذروتها في عام 2007، ثم دخلت فترة من الانخفاض. بعد انضمامها إلى منظمة التجارة العالمية في عام 2001، شهدت الصين النمو السنوي في حجم صادراته بين عامي 2002 و2007. كانت الانبعاثات العالية المرتبطة بصادرات السلع الكثيفة الكربون، مثل السلع المعدنية والإلكترونيات، ملحوظة [38]. ومع ذلك، بعد عام 2008، بسبب تنظيمات التصدير الأكثر صرامة جنبًا إلى جنب مع الركود المالي، تباطأ متوسط النمو السنوي في الصادرات إلىبين عامي 2010 و2015. علاوة على ذلك، قد تكون التحسينات في مزيج الصناعة والطاقة في الصين قد ساهمت أيضًا في تباطؤ الصين الضمني.الصادرات، حيث أن معدل النمو الضمنيتراجعت الصادرات بشكل أسرع بكثير من صادرات التجارة [51].
في عام 2020، شهدت الصين انتعاشًا في هذا ‘الاختلاف’، حيث وصل معدل الزيادة إلى مستوى ملحوظ، مدفوعًا بشكل أساسي بزيادة في الصادرات. على الرغم من الجائحة العالمية، كان هناك ارتفاع ملحوظ في أحجام صادرات الصين (بشكل رئيسي من المستلزمات الطبية والأجهزة الإلكترونية) في عام 2020، حيث زادت بنسبةأعلى بكثير منفي عام 2019. يمكن أن تؤدي هذه الزيادة إلى فعالية تدابير الوقاية من الأوبئة والسيطرة عليها في الصين، والتي ضمنت الإنتاج المستقر للسلع ذات الطلب العالي عالميًا، مثل المستلزمات الطبية (بما في ذلك الكمامات) والأجهزة الإلكترونية (بما في ذلك أجهزة الكمبيوتر المحمولة، والأجهزة اللوحية، و
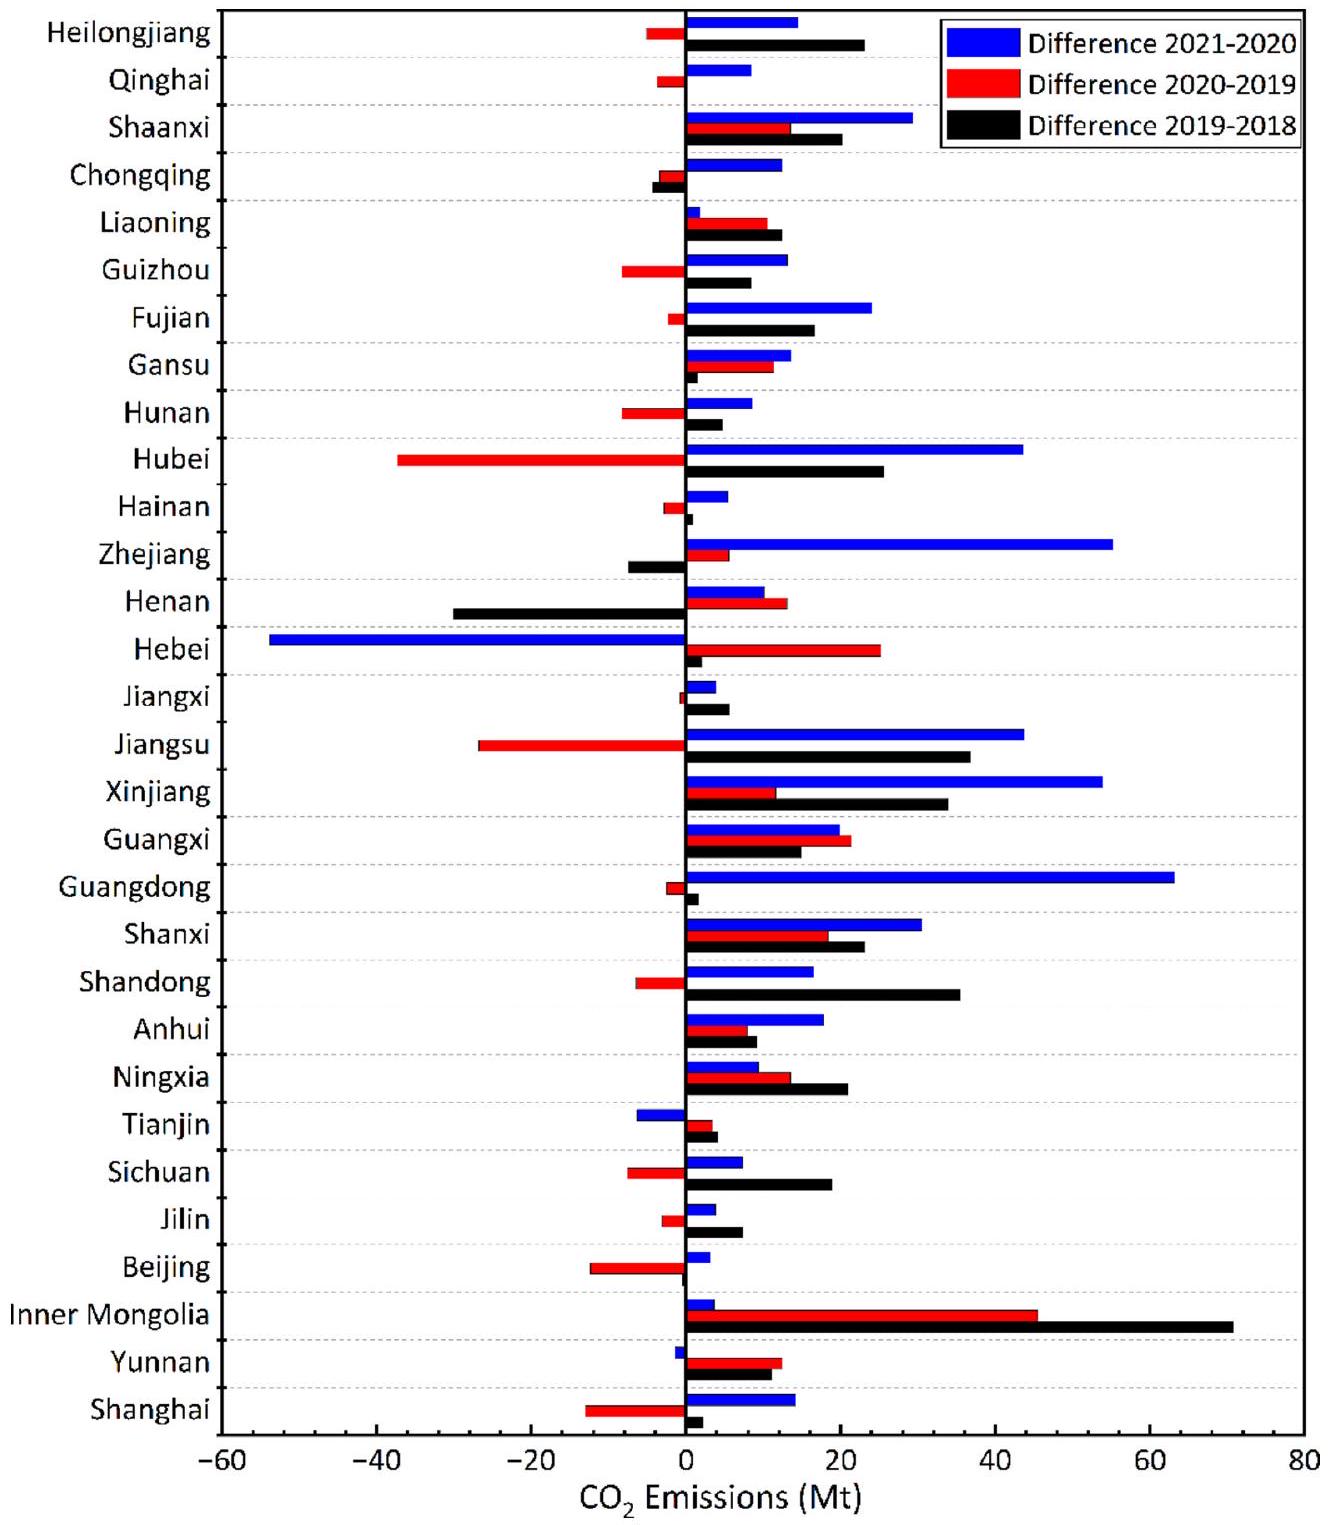
الشكل 4. التغيرات في انبعاثات الأراضي الإقليمية في الصين من 2018 إلى 2021.
الأجهزة المنزلية). نمت الصادرات في هذه الفئات بنسبة و على التوالي، مساهمين و إلى النمو العام في الصادرات، على التوالي [38]. في الوقت نفسه، شهدت الواردات انخفاضًا للسنة الثانية على التوالي، في 2019 و2020، مما زاد من ‘الفرق’.
3.3. التغيرات في انبعاثات المقاطعات والأقاليم خلال جائحة كوفيد-19
مقارنةً بعام 2019، خفضت نحو ثلثي مقاطعات الصينانبعاثات عام 2020 (الشكل 4). ومع ذلك، تغير هذا الاتجاه في عام 2021، حيث أظهرت معظم المقاطعات زيادة في الانبعاثات.
نظرًا لأن التصنيع هو المحرك الرئيسي لـانخفاض الانبعاثات [60]، شهدت المقاطعات التي تمتلك قواعد تصنيع قوية انخفاضًا كبيرًاخفض الانبعاثات في عام 2020. على سبيل المثال، خفضت جيانغسو وشاندونغانبعاثات بواسطة و على التوالي في عام 2020، بينما زادت انبعاثاتهم جميعًا بـ و على التوالي في عام 2019. يعتبر قطاع النقل أيضًا محركًا مهمًا [1]. شهدت مقاطعات مثل فوجيان وشنغهاي، التي تتمتع بشبكات نقل واسعة، انخفاضًا واضحًا في عام 2020، (على التوالي). وهذا يتناقض مع معدلات نموهم من و على التوالي في عام 2019. بالإضافة إلى ذلك، ملحوظكانت التخفيضات واضحة في مقاطعة هوبي (التي عاصمتها ووهان) وبكين، مما يعكس مراحل الإغلاق الممتدة التي استمرت لأكثر من ثلاثة أشهر. بسبب استئناف الأنشطة الاجتماعية والاقتصادية بسرعة بعد أبريل، كان للوباء تأثير ضئيل في غرب الصين. أظهرت مقاطعات مثل يوننان وشنشي ونينغشيا أنماط انبعاثات متسقة في كل من 2019 و2020. قد يُعزى هذا الاستقرار إلى قلة الكثافة السكانية في الغرب، مما قلل على الأرجح من إمكانية انتقال الفيروس. في المقابل، أفادت 14 مقاطعة بزيادة الانبعاثات في 2020. زادت مقاطعات مثل منغوليا الداخلية وشينجيانغ، الغنية بالفحم، من انبعاثاتها بـ و على التوالي. في الوقت نفسه، شهدت تشجيانغ، التي تأثرت بشدة خلال الإغلاق، انخفاضًا في الانبعاثات بمقدار 31.30 مليون طن في الأشهر الأولى [26]. ومع ذلك، زادت الانبعاثات السنوية، جزئيًا بسبب بدء تشغيل شركة تشجيانغ للبتروكيماويات المحدودة في عام 2019 [6]. أدت الجفاف في عام 2020 في قوانغشي إلى زيادة في توليد الطاقة الحرارية [60]، مما أدى إلى انبعاثات أعلى بمقدار 21.38 مليون طن مقارنة بعام 2019.
شهدت العديد من المقاطعات زيادة في الانبعاثات بعد الجائحة في عام 2021. كانت هذه الزيادة في الانبعاثات ملحوظة بشكل خاص في مقاطعات مثل شانشي وشينجيانغ، حيث تعتمد بشكل كبير على الصناعات كثيفة الطاقة. وبالمثل، تم ملاحظة زيادات كبيرة في جيانغسو وقوانغدونغ، المعروفة بأسسها التصنيعية القوية وقطاعاتها الخدمية المزدهرة. تعكس هذه الاتجاهات الملحوظة في الانبعاثات انتعاش الأنشطة الاجتماعية والاقتصادية بعد الوباء. على الرغم من أن الانبعاثات في تلك المقاطعات تظهر اتجاه نمو متجدد، إلا أنها لم تعد بالكامل إلى مستويات ما قبل الجائحة. في المناطق التي تأثرت بشدة بالوباء، مثل هوبي وبكين، قد يتطلب التعافي إلى مستويات الانبعاثات السابقة للجائحة فترة أطول. على العكس من ذلك، شهدت عدد قليل من المقاطعات، مثل خبي وتيانجين، انخفاضًا في الانبعاثات في عام 2021. كان هذا الاتجاه ناتجًا إلى حد كبير عن التقدم المحرز في إصلاحات صناعة الصلب داخل هذه المقاطعات. على وجه التحديد، كانت مقاطعة خبي لديها أعلى حجم تخفيض في إنتاج الصلب الخام، حيث تمثلمن التخفيض الوطني [19,43]. في الوقت نفسه، مقارنةً بعام 2020، كانت تيانجين لديها أعلى نسبة تخفيض في إنتاج الصلب الخام على مستوى البلاد، عندأدت هذه التخفيضات الكبيرة في مخرجات الصناعات كثيفة الطاقة إلى انخفاض في انبعاثات الكربون في هاتين المقاطعتين.
بالنظر إلى مرحلة تطوير كل مقاطعة، وتوافر الموارد، والأهداف الاستراتيجية، والاعتبارات البيئية، أنشأت الصين تنوعًاأهداف تقليل كثافة الانبعاثات للفترة الخامسة عشرة (2015-2020) (التفاصيل في الجدول S4 في المواد التكميلية 1). بحلول نهاية هذه الفترة في عام 2020، حققت 17 مقاطعة أهدافها المحددة، بينما لم تحقق الـ 13 الأخرى.
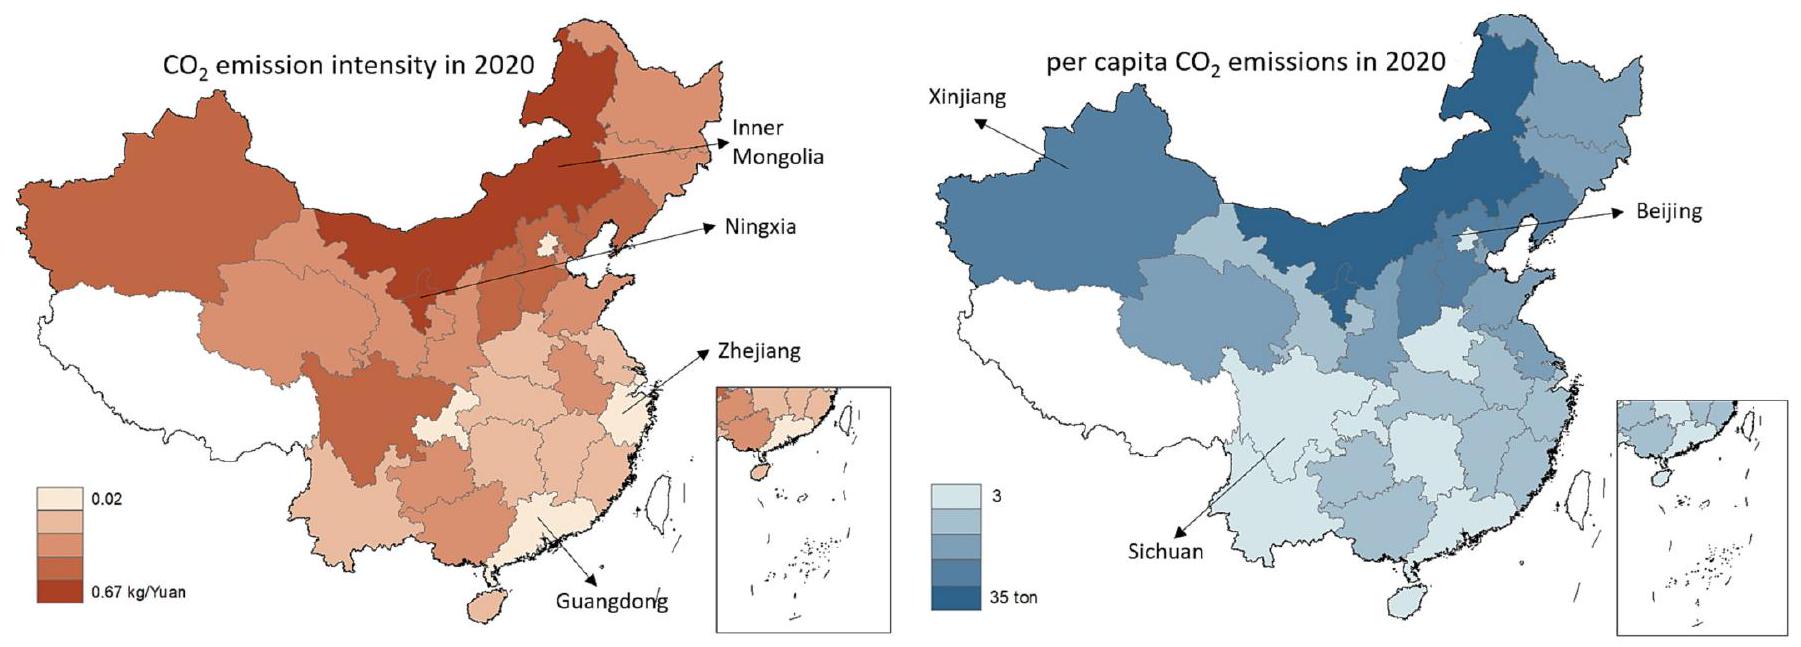
المحافظات التي لم تحقق أهدافها المحددة هي في الغالب تلك التي تركز بشكل كبير على الصناعة، مثل قوانغدونغ وشاندونغ، أو تلك الغنية بالموارد، مثل شانشي وهيبي. من بين هذه، فقط منغوليا الداخلية ونيغشيا وشينجيانغ شهدت كثافة انبعاثات الكربون الخاصة بها. زيادة، ارتفاع و على التوالي خلال فترة الخطة الخمسية الثالثة عشرة. هذه المقاطعات، رغم غناها بالموارد الطاقية، لا تزال متخلفة اقتصاديًا. يتكون العمود الفقري لاقتصادها إلى حد كبير من التصنيع، خاصة في القطاعات كثيفة الطاقة مثل الفحم والصلب. وهذا يجعل الرحلة نحو الحياد الكربوني لهذه المناطق صعبة بشكل خاص. على العكس من ذلك، فإن المقاطعات التي تحقق أهدافها غالبًا ما تعزز هياكلها الصناعية وتتحول نحو اقتصادات أكثر توجيهًا نحو الخدمات. خذ تشونغتشينغ كمثال: لقد انتقل توزيعها القطاعي من، و في عام 2015 (الزراعة، الصناعة، والخدمات على التوالي) إلى، و في عام 2020. ومن الجدير بالذكر أن المناطق المتطورة مثل شنغهاي وبكين وقوانغدونغ، حيث تعتبر المالية والخدمات الركائز الرئيسية، إلى جانب المقاطعات المعروفة بقدراتها القوية على امتصاص الكربون الطبيعي مثل تشجيانغ وفوجيان، تظهر كثافة انبعاثات كربونية أقل مقارنة.
يعتبر انبعاث الكربون للفرد مقياسًا حاسمًا لمستويات انبعاث الكربون الإقليمية [25]. تحتل المقاطعات التي تركز على التصنيع والطاقة، مثل شانشي وهيبي وتيانجين، مرتبة عالية في انبعاثات الكربون للفرد، حيث تتصدر القائمة منغوليا الداخلية ونيغشيا وشينجيانغ (كما هو موضح في الشكل 5). على النقيض من ذلك، تسجل هاينان، التي تعتمد اقتصادها على قطاع الخدمات، والمقاطعات المتطورة ذات الكثافة السكانية العالية مثل بكين وقوانغدونغ، انبعاثات كربونية منخفضة للفرد. على الرغم من أن سيتشوان لها وجود قوي في الطاقة والتصنيع وتحتل المرتبة السادسة في كثافة الانبعاثات، إلا أن انبعاثاتها للفرد كانت أعلى بقليل من بكين في عام 2020. يمكن أن يُعزى ذلك إلى تركيزها على إنتاج الطاقة النظيفة. في عام 2020، مثلت الطاقة الكهرومائية نسبة مذهلة منمن توليد الكهرباء في المحافظة [49].
3.4. المقارنات مع التقديرات الحالية وتقييم عدم اليقين
الشكل 6 يقارن نتائج انبعاثاتنا مع تقديرات من منظمات أخرى، بما في ذلك EIA و BP و IEA و EDGAR و GCB و MEIC. على مدار فترة 24 عامًا، تقدم EDGAR (قاعدة بيانات الانبعاثات للبحث الجوي العالمي) باستمرار أعلى الأرقام. عندما نركز على الفترة من 2018 إلى 2020، تكون قيم انبعاثات القطاع الوطني هي الأدنى، متماشية بشكل وثيق مع بيانات BP المبلغ عنها. انبعاثاتنا الإجمالية على مستوى المقاطعات تتماشى مع GCB، وتتابع أيضًا القيم القريبة لـ EIA. بينما تشمل التقديرات الوطنية من GCB و IEA انبعاثات من احتراق الوقود الأحفوري وإنتاج الأسمنت، فإنها تستخدم عوامل الانبعاث الافتراضية المقدمة من IPCC. قد يفسر هذا ارتفاع قيم انبعاثاتهم مقارنة بتقديراتنا (الانبعاثات المرجعية الوطنية والانبعاثات القطاعية الوطنية). ومع ذلك، تشير الفجوة بين GCB و IEA إلى عدم اليقين الكامن. على الرغم من أن EDGAR و EIA تشمل فقط انبعاثات من الوقود الأحفوري، فإن أرقام EDGAR و EIA أعلى من BP، مما يبرز الفروقات في قواعد البيانات المختلفة.
يمكن تقييم مصدرين رئيسيين من عدم اليقين في البيانات (بيانات النشاط وعوامل الانبعاث) باستخدام طريقة مونت كارلو. يُقدّر عدم اليقين المحيط بانبعاثات الطاقة في الصين لعامي 2020 و2021 بـ ( ) و ( )، مع فترة الثقة. هذا المستوى من الدقة مقبول، حيث يقع نطاق عدم اليقين لدينا ضمنمعيار محدد للدول العالمية [14،15].
بالإضافة إلى ذلك، يمكن أن تنشأ الفجوات في البيانات من أساليب المحاسبة المتنوعة. تظهر انبعاثات المرجع والانبعاثات القائمة على الإقليم مسارات مشابهة، حيث تتجاوز الأولى باستمرار الثانية بحواليسنويًا. هناك ثلاثة عوامل تفسر هذا الانحراف. أولاً، نهج الانبعاثات القائم على الإقليم لا يأخذ في الاعتبار فقدان الطاقة أثناء تحولها، بينما يأخذ نهج الانبعاثات المرجعية ذلك في الاعتبار. ثانيًا، تستبعد الانبعاثات المرجعية فقدان النقل والاستخدام غير الطاقي من الطاقة الأولية، مما يترك الطاقة الثانوية خارجًا. ثالثًا، تُظهر جدول ميزان الطاقة في الصين حوالي الفجوة بين بيانات إنتاج واستهلاك الطاقة [16]. نظرًا لأن انبعاثات الطاقة الثانوية لا تُحتسب في انبعاثات المرجع وتوجد تجارة كبيرة للطاقة الثانوية بين المقاطعات، فإن انبعاثات المرجع تُعتبر مقياسًا إضافيًا قائمًا على الإقليم.
الشكل 5.شدة الانبعاثات وانبعاثات الفرد من محافظات الصين في عام 2020.
الشكل 6. مقارنات مع تقديرات أخرى للفترة من 1997 إلى 2021. مصدر البيانات: إدارة معلومات الطاقة (EIA) [10]؛ بي بي (BP) [3]؛ وكالة الطاقة الدولية (IEA) [21]؛ قاعدة بيانات انبعاثات الأبحاث الجوية العالمية (EDGAR) [5]؛ الميزانية العالمية للكربون (GCB) [14]؛ قاعدة بيانات الانبعاثات متعددة الدقة للصين (MEIC) [31]. ملاحظة: توفر بيانات IEA وGCB وMEIC وبياناتنا بيانات انبعاثات تغطي احتراق الوقود الأحفوري وإنتاج الأسمنت. تشمل EDGAR وEIA وBP فقط الانبعاثات الناتجة عن الوقود الأحفوري.
الانبعاثات في الاتفاقيات الدولية. توفر الأخيرة صورة أكثر دقة وشمولية عنانبعاثات.
أخيرًا، يتم توقع بيانات انبعاثات الصين في عام 2022 بشكل تقريبي، مما يؤدي إلى عدم اليقين الكبير. استنادًا إلى بيانات انبعاثات عام 2021، نطبق معدل نمو استهلاك الطاقة من الفحم والنفط والغاز الطبيعي لتقدير الانبعاثات في عام 2022.
4. المناقشة
تكشف دراستنا أن تأثيرات جائحة COVID-19 والتدابير المرتبطة بالإغلاق على انبعاثات الكربون كانت مؤقتة فقط، بغض النظر عن تأثيراتها العميقة على الحياة اليومية والاقتصاد. أدت حالة الركود في الأنشطة الاقتصادية والاجتماعية مباشرة إلى انخفاض ملحوظ في الانبعاثات في الربع الأول من عام 2020 [26]. ومع ذلك، بدءًا من أبريل، استأنفت الحكومات المركزية والمحلية، إلى جانب المواطنين، أنشطتهم الاجتماعية والاقتصادية تدريجيًا [26]، مما أدى إلى زيادة في الانبعاثات التي عوضت الانخفاضات في الربع الأول. لذلك، فإن انبعاثات عام 2020 ارتفعت بنسبة مقارنةً بعام 2019. في عام 2021، أدى الحاجة الملحة للتعافي الاقتصادي إلى انتعاش مستمر في معظم الأنشطة الاجتماعية. وقد أدى ذلك إلى ارتفاع الانبعاثات في معظم المقاطعات. تشير انتعاشة عام 2021 إلى الديناميات المترابطة للتعافي الاقتصادي وتغيرات أنماط الانبعاثات على المستويين الوطني والإقليمي. على الرغم من أن جائحة COVID-19 قد أدت إلى تغييرات في سلوكنا، مما أدى إلى تقلبات في اتجاهات الانبعاثات، إلا أن ذلك لم يكن كافيًا لدفع انخفاض طويل الأمد في الانبعاثات.
عند فحص الانبعاثات جنبًا إلى جنب مع الاستهلاك، وجدنا زيادة ملحوظة في الفروق بين الانبعاثات الإقليمية والانبعاثات المستندة إلى الاستهلاك في عام 2020. مع استئناف الأنشطة الاجتماعية والاقتصادية تدريجياً بعد أبريل 2020، وسعت الصين بسرعة الإنتاج وصدرّت مجموعة واسعة من المنتجات. شملت هذه المنتجات ليس فقط المستلزمات الطبية مثل الكمامات، التي خففت من النقص العالمي في العناصر الأساسية للرعاية الصحية، ولكن أيضًا أجهزة إلكترونية متنوعة، مثل أجهزة الكمبيوتر المحمولة، والأجهزة اللوحية، والأجهزة المنزلية، التي دعمت العمل عن بُعد، والتعليم، واحتياجات الحياة اليومية خلال الجائحة. ومع ذلك، أدى إنتاج هذه السلع التصديرية إلى زيادة مستقرة ( ) في الانبعاثات الإقليمية في عام 2020. معدل نمو الانبعاثات المستندة إلى الاستهلاك (مع كان أقل من انبعاثات الإقليمية بسبب التأثير الشديد على سلسلة الإمداد العالمية. وبالتالي، فإن الفارق بين الانبعاثات الإقليمية والانبعاثات المستندة إلى الاستهلاك قد تضاعف تقريبًا مقارنةً بعام 2018.
ناقشت الدراسات السابقة التناقض بين الانتعاش الاقتصادي وتقليل انبعاثات الكربون بعد الجائحة [24،27]. على عكس الانتعاش بعد الأزمة المالية العالمية 2008-2009، تشير تغييرات نمط الانبعاثات من 2020 إلى 2021 إلى أننا لم نكرر تمامًا الزيادات الحادة التي شهدناها في الماضي. هذه علامة إيجابية على الانتقال المؤقت نحو نظام طاقة أكثر خضرة وبنية اقتصادية أكثر استدامة. ومع ذلك، نظرًا لتشديد الميزانية العالمية للكربون، لا يزال يتعين علينا اتخاذ إجراءات للتخفيف من الانتعاش المحتمل وتعزيز الجهود العالمية لتقليل الانبعاثات على المدى الطويل، وأخيرًا تحقيق أهداف تقليل الانبعاثات لاتفاقية باريس. في هذا السياق، تعتبر التغييرات في الطاقة والبنية الاقتصادية حاسمة لتحقيق أهداف تقليل الانبعاثات. تكشف دراستنا أن هيكل الطاقة في الصين قد تحسن في العقدين الماضيين، لكنه لا يزال يعتمد بشكل كبير على الوقود الأحفوري. الانتقال نحو أنظمة طاقة أنظف وأكثر استدامة أمر ضروري، كما تم التأكيد عليه في مؤتمر الأطراف الثامن والعشرين لاتفاقية الأمم المتحدة الإطارية بشأن تغير المناخ (COP28) [54]. ومع ذلك، فإن هذا الانتقال يمثل تحديات هائلة للصين، نظرًا لاعتمادها الكبير على الوقود الأحفوري. زيادة معدل استخدام الطاقة المتجددة بشكل كبير هو جانب حاسم من هذا الانتقال. الاستثمار في الطاقة الشمسية والرياح والمائية وغيرها من مصادر الطاقة المتجددة لا يساعد فقط في تقليل انبعاثات الكربون، بل يعزز أيضًا أمن الطاقة، وهو طريق رئيسي لتحقيق التنمية المستدامة العالمية.
5. الاستنتاجات
تقدم أبحاثنا تحليلًا شاملاً لأنماط انبعاثات الكربون في الصين، مما يسلط الضوء على التغييرات في الانبعاثات خلال جائحة COVID-19. يثري عملنا بيانات الانبعاثات الحالية للصين ومقاطعاتها من خلال توفير بيانات شاملة عبر قطاعات وأنواع الوقود الأحفوري المختلفة من 1997 إلى 2021. هذا أمر حيوي لصانعي السياسات والباحثين لتطوير وتنقيح الاستراتيجيات الهادفة إلى تحقيق أهداف الصين الطموحة في مجال الكربون المزدوج.
تضع هذه الدراسة أساسًا بياناتيًّا للمراقبة المستمرة وتطوير الاستراتيجيات نحو ذروة الكربون وحياد الكربون في البلاد. تحمل الرؤى المكتسبة هنا قيمة كبيرة للمجتمع الدولي. لا تعالج هذه الرؤى فقط التناقض بين النمو الاقتصادي والاستدامة البيئية الذي تفاقم بسبب COVID-19، ولكنها تعزز أيضًا قدراتنا على مواجهة تحدي انتقال الطاقة، كما تم تسليط الضوء عليه مؤخرًا خلال COP28. ستتوسع الأعمال المستقبلية لتشمل المزيد من الدول، مما يوفر رؤية شاملة عالمية تدعم تقليل الانبعاثات والتنمية المستدامة.
بيان مساهمة المؤلفين
جينغهانغ شيو: الكتابة – المسودة الأصلية، البرمجيات، التحليل الرسمي. يورو جوان: الكتابة – المراجعة والتحرير، البرمجيات، المنهجية. جوناثان أولدفيلد: الكتابة – المراجعة والتحرير. دابو جوان: الكتابة – المراجعة والتحرير. يولي شان: الكتابة – المراجعة والتحرير، الإشراف، البرمجيات، المنهجية، التصور.
إعلان عن تضارب المصالح
لا شيء.
توفر البيانات
يمكن الحصول على بيانات إحصائيات الطاقة للصين ومقاطعاتها الثلاثين من الكتاب السنوي لإحصاءات الطاقة في الصين 2021 [41]. يتم تلخيص عوامل الانبعاث في حسابات الانبعاثات في ليو وآخرون [28]. يمكن تنزيل جميع البيانات والنتائج التي تم تطويرها في هذه الدراسة مجانًا من حسابات وانبعاثات الكربون ومجموعات البيانات للدول الناشئة (CEADs) على www.ceads.net/data/.
الشكر والتقدير
نشكر الدعم من البرنامج الوطني الرئيسي للبحث والتطوير في الصين (2023YFE0204600 و2023YFE0113001)، ومؤسسة العلوم الطبيعية الوطنية في الصين (72250710169 و72243004)، وتبادلات الجمعية الملكية الدولية (IEC NSFC )، وصندوق دعم سياسة QR من UKRI Research England (PSF-16) وبرنامج الدكتوراه لمجلس المنح الدراسية في الصين.
الملحق أ. البيانات التكميلية
يمكن العثور على البيانات التكميلية لهذه المقالة عبر الإنترنت على https://doi. org/10.1016/j.apenergy.2024.122837.
References
[1] Aminzadegan S, Shahriari M, Mehranfar F, Abramović B. Factors affecting the emission of pollutants in different types of transportation: a literature review. Energy Rep 2022;8:2508-29.
[2] Andrew RM. Global CO2 emissions from cement production, 1928-2018. Earth Syst Sci Data 2019;11(4):1675-710. https://doi.org/10.5194/essd-11-1675-2019.
[3] BP. bp statistical review of world energy. https://www.bp.com/en/global/corpora te/energy-economics/statistical-review-of-world-energy.html; 2020.
[4] China Energy Media Research Institute. China Energy Data Report (2022) (Chinese document). 2022.
[5] Crippa M, Guizzardi D, Muntean M, Schaaf E, Solazzo E, Monforti F, et al. Fossil CO2 emissions of all world countries. 2020.
[6] Department of Ecology and Environment of Zhejiang Province. Zhejiang Province “13th Five-Year” low carbon development report ((Chinese document)). 2021.
[7] Doumbia T, Granier C, Elguindi N, Bouarar I, Darras S, Brasseur G, et al. Changes in global air pollutant emissions during the COVID-19 pandemic: a dataset for atmospheric modeling. Earth Syst Sci Data 2021;13(8):4191-206. https://doi.org/ 10.5194/essd-13-4191-2021.
[8] Du L, Wei C, Cai S. Economic development and carbon dioxide emissions in China: provincial panel data analysis. China Econ Rev 2012;23(2):371-84.
[9] Ecological Environment Department. The reduction of carbon and carbon cooperation has made positive results. https://www.ndrc.gov.cn/xwdt/ztzl/2022 qgjnxcz/bmjncx/202206/t20220612_1327157.html; 2022.
[10] EIA. International CO2 emissions from fuel combustion. https://www.eia.gov/en vironment/emissions/carbon/; 2020.
[11] Fan JL, Hou YB, Wang Q, Wang C, Wei YM. Exploring the characteristics of production-based and consumption-based carbon emissions of major economies: a multiple-dimension comparison. Appl Energy 2016;184:790-9. https://doi.org/ 10.1016/j.apenergy.2016.06.076.
[12] Feng KS, Davis SJ, Sun LX, Li X, Guan DB, Liu WD, et al. Outsourcing CO2 within China. Proc Natl Acad Sci U S A 2013;110(28):11654-9. https://doi.org/10.1073/ pnas. 1219918110.
[13] Friedlingstein P, Jones MW, O’Sullivan M, Andrew RM, Hauck J, Peters GP, et al. Global Carbon Budget 2019. Earth Syst Sci Data 2019;11(4):1783-838. https:// doi.org/10.5194/essd-11-1783-2019.
[14] Friedlingstein P, O’Sullivan M, Jones MW, Andrew RM, Hauck J, Olsen A, et al. Global carbon budget 2020. Earth Syst Sci Data 2020;12(4):3269-340. https://doi. org/10.5194/essd-12-3269-2020.
[15] Gregg M. Uncertainties in accounting for CO2From fossil fuels. J Indust Ecol 2008; 12(2):136-9. https://doi.org/10.1111/j.1530-9290.2008.00014.x.
[16] Guan DB, Liu Z, Geng Y, Lindner S, Hubacek K. The gigatonne gap in China’s carbon dioxide inventories. Nat Clim Change 2012;2(9):672-5. https://doi.org/ 10.1038/Nclimate1560.
[17] Guan Y, Shan Y, Huang Q, Chen H, Wang D, Hubacek K. Assessment to China’s recent emission pattern shifts. Earth’s Future 2021;9(11). https://doi.org/ 10.1029/2021ef002241.
[18] Guevara M, Petetin H, Jorba O, van der Gon HD, Kuenen J, Super I, et al. European primary emissions of criteria pollutants and greenhouse gases in 2020 modulated
by the COVID-19 pandemic disruptions. Earth Syst Sci Data 2022;14(6):2521-52. https://doi.org/10.5194/essd-14-2521-2022.
[19] Hebei Province Bureau of Statistics. Hebei Statistical Yearbook 2022. http://www. hetj.gov.cn/hetj/tjsj/jjnj; 2023.
[20] Huo H, Zhang Q, Guan D, Su X, Zhao H, He K. Examining air pollution in China using production- and consumption-based emissions accounting approaches. Environ Sci Technol 2014;48(24):14139-47. https://doi.org/10.1021/es503959t.
[21] IEA. CO2 emissions from fuel combustion. https://www.iea.org/data-and-statisti cs/data-products; 2023.
[22] IPCC. IPCC guidelines for national greenhouse gas inventories. 2006.
[23] Le Quere C, Jackson RB, Jones MW, Smith AJP, Abernethy S, Andrew RM, et al. Temporary reduction in daily global CO2 emissions during the COVID-19 forced confinement. Nat Clim Change 2020;10(7). https://doi.org/10.1038/s41558-020-0797-x. 647-+.
[24] Le Quere C, Peters GP, Friedlingstein P, Andrew RM, Canadell JG, Davis SJ, et al. Fossil CO2 emissions in the post-COVID-19 era. Nat Clim Change 2021;11(3). https://doi.org/10.1038/s41558-021-01001-0.
[25] Li R, Wang Q, Liu Y, Jiang R. Per-capita carbon emissions in 147 countries: the effect of economic, energy, social, and trade structural changes. Sustain Product Consump 2021;27:1149-64.
[26] Liu Z, Cui D, Deng Z, Wang YL, Zhong HW, Yue X, et al. Impact on China’s CO2 emissions from COVID-19 pandemic. Chinese Sci Bull Chin 2021;66(15):1912-22. https://doi.org/10.1360/Tb-2020-0729.
[27] Liu Z, Deng Z, Zhu B, Ciais P, Davis SJ, Tan J, et al. Global patterns of daily CO2 emissions reductions in the first year of COVID-19. Nat Geosci 2022;15(8):615-20.
[28] Liu Z, Guan D, Wei W, Davis SJ, Ciais P, Bai J, et al. Reduced carbon emission estimates from fossil fuel combustion and cement production in China. Nature 2015;524(7565):335-8. https://doi.org/10.1038/nature14677.
[30] Ma X, Wang C, Dong B, Gu G, Chen R, Li Y, et al. Carbon emissions from energy consumption in China: its measurement and driving factors. Sci Total Environ 2019;648:1411-20.
[31] MEIC. Multi-Resolution Emission Inventory for China. http://www.meicmodel. org/index.html; 2023.
[32] Mi Z, Zheng J, Meng J, Shan Y, Zheng H, Ou J, et al. China’s energy consumption in the new normal. Earth’s Future 2018;6(7):1007-16.
[33] Mi ZF, Zheng JL, Meng J, Zheng HR, Li X, Coffman D, et al. Carbon emissions of cities from a consumption-based perspective. Appl Energy 2019;235:509-18. https://doi.org/10.1016/j.apenergy.2018.10.137.
[34] Miller RE, Blair PD, ebrary, I.. Input-output analysis : Foundations and extensions. 2nd ed. Cambridge University Press; 2009.
[35] Ministry of Ecology and Environment of the People’s Republic of China. People’s Republic of China Fourth National Communication on Climate Change. https://www.mee.gov.cn/ywdt/hjywnews/202312/W020231229717234502302. pdf; 2023.
[36] Ministry of Ecology and Environment of the People’s Republic of China. People’s Republic of China Third Biennial Update Report on Climate Change. https://www. mee.gov.cn/ywdt/hjywnews/202312/W020231229717236049262.pdf; 2023.
[37] National Bureau of Statistics. Natioanl industries classification (GB/T 4754-2017). 2017.
[38] National Bureau of Statistics. China Statistic Yearbook 2022. http://www.stats.gov.cn/sj/ndsj/2022/indexch.htm; 2022.
[39] National Bureau of Statistics. Industrial added value above designated size increased by 4.3% in December 2021. 2022.
[40] National Bureau of Statistics. The input-output tables for China in 2002, 2005, 2007, 2010, 2012, 2015, 2017, 2018, 2020 [in Chinese]. 2022. Retrieved 11/01/
2024 from https://data.stats.gov.cn/ifnormal.htm?u=/files/html/quickSearch/t rcc/trcc01.html&h=740.
[41] National Bureau of Statistics. China energy statistical yearbook 2021-2022. 2023.
[42] National Bureau of Statistics. National Economic and Social Development Statistical Bulletins 2022. http://www.stats.gov.cn/english/PressRelease/20230 2/t20230227_1918979.html; 2023.
[43] National Development and Reform Commission. Steel industry operation in 2021 (in Chinese), https://www.ndrc.gov.cn/fggz/jjyxtj/mdyqy/202201/t20220130 _1314180_ext.html; 2022.
[44] Ou JM, Meng J, Zheng JY, Mi ZF, Bian YH, Yu X, et al. Demand-driven air pollutant emissions for a fast-developing region in China. Appl Energy 2017;204:131-42. https://doi.org/10.1016/j.apenergy.2017.06.112.
[45] Ren L, Zhou S, Peng T, Ou X. A review of CO2 emissions reduction technologies and low-carbon development in the iron and steel industry focusing on China. Renew Sustain Energy Rev 2021;143:110846.
[46] Shan Y, Guan D, Zheng H, Ou J, Li Y, Meng J, et al. China CO2 emission accounts 1997-2015. Sci Data 2018;5:170201. https://doi.org/10.1038/sdata.2017.201.
[47] Shan YL, Huang Q, Guan DB, Hubacek K. China CO2 emission accounts 2016-2017. Sci Data 2020;7(1). doi:ARTN 5410.1038/s41597-020-0393-y.
[48] Shigeto S, Yamagata Y, Ii R, Hidaka M, Horio M. An easily traceable scenario for emission reduction in Japan through the final consumption-based CO 2 emission approach: a case study of Kyoto-city. Appl Energy 2012;90(1):201-5. https://doi.org/10.1016/j.apenergy.2011.03.049.
[49] Sichuan Development Reform Energy. Sichuan Province “14th Five-Year” renewable energy development plan ((Chinese document)). 2020.
[50] Sun X, Mi Z. Factors driving China’s carbon emissions after the COVID-19 outbreak. Environ Sci Technol 2023;57(48):19125-36. https://doi.org/10.1021/ acs.est.3c03802.
[51] Tang X, Jin Y, Wang X, Wang J, McLellan BC. Will China’s trade restructuring reduce CO2 emissions embodied in international exports? J Clean Prod 2017;161: 1094-103.
[52] The World Bank. World Bank Open Data. https://data.worldbank.org/; 2023.
[53] Tianjin Municipal Bureau of Statistics. Tianjin Statistical Yearbook 2022. https://stats.tj.gov.cn/nianjian/2022nj/zk/indexch.htm; 2023.
[54] UNFCCC. COP28 the UEA consensus. 2023.
[55] Weber CL, Peters GP, Guan D, Hubacek K. The contribution of Chinese exports to climate change. Energy Policy 2008;36(9):3572-7. https://doi.org/10.1016/j. enpol.2008.06.009.
[56] Wiedmann TO, Chen GW, Barrett J. The concept of city carbon maps: a case study of Melbourne, Australia. J Indust Ecol 2016;20(4):676-91. https://doi.org/ 10.1111/jiec. 12346.
[57] Winkler L, Rogelj J, Gilbert A. Emissions Responsibility Accounting: A new look at emissions accounting. https://www.imperial.ac.uk/media/imperial-college /grantham-institute/public/publications/evidence-submission-papers/Emissions -Responsibility-Accounting-A-new-look-at-emissions-accounting.pdf; 2020.
[58] Ye B, Jiang J, Li C, Miao L, Tang J. Quantification and driving force analysis of provincial-level carbon emissions in China. Appl Energy 2017;198:223-38.
[59] Zhao HY, Zhang Q, Guan DB, Davis SJ, Liu Z, Huo H, et al. Assessment of China’s virtual air pollution transport embodied in trade by using a consumption-based emission inventory. Atmos Chem Phys 2015;15(10):5443-56. https://doi.org/ 10.5194/acp-15-5443-2015.
[60] Zheng B, Geng GN, Ciais P, Davis SJ, Martin RV, Meng J, et al. Satellite-based estimates of decline and rebound in China’s CO2 emissions during COVID-19 pandemic. Sci Adv 2020;6(49). doi:ARTN eabd499810.1126/sciadv.abd4998.
Corresponding author.
E-mail address: y.shan@bham.ac.uk (Y. Shan). These authors contributed equally.
Jinghang Xu , Yuru Guan , Jonathan Oldfield , Dabo Guan , Yuli Shan School of Geography, Earth and Environmental Sciences, University of Birmingham, Birmingham B15 2TT, UK Integrated Research on Energy, Environment and Society (IREES), Energy and Sustainability Research Institute Groningen, University of Groningen, Groningen 9747 AG, the Netherlands Department of Earth System Science, Ministry of Education Key Laboratory for Earth System Modelling, Institute for Global Change Studies, Tsinghua University, Beijing 100084, China The Bartlett School of Sustainable Construction, University College London, London WC1E 6BT, UK
H I G H L I G H T S
Accounting of IPCC administrative territorial emissions from fossil fuels and cement production for China and its provinces in 2020-2021
Accounting of consumption-based emissions for China from 2002 to 2020
Revealing the dynamic impact of COVID-19 on China’s carbon emissions
ARTICLE INFO
Keywords:
Emission accounts
Carbon neutrality
Energy use
Climate change
China
Abstract
In the past a few years, the outbreak of the COVID-19 epidemic has significantly changed global emission patterns and increased the challenges in emission reduction. However, a comprehensive analysis of the most recent trends of China’s carbon emissions has not been conducted due to a lack of up-to-date emission accounts by regions and sectors. This study compiles the latest emission inventories for China and its 30 provinces during the epidemic (2020-2021), following the administrative-territorial approach from the International Panel on Climate Change (IPCC). Our inventories cover energy-related emissions from 17 types of fossil fuel combustion and cement production across 47 economic sectors. To provide a holistic view of emission patterns, we esitamted consumption-based emissions in China. We find that the COVID-19 epidemic led to a reduction in the growth rate of territorial emissions in 2020 compared to 2019. This trend then reversed in 2021 as lockdown measures gradually relaxed. Our study reveals the impact of the rapid expansion of exports, driven by epidemic prevention materials and “stay-at-home economy” products on widening the differences between territorial- and consumption-based emissions. Our study offers a timely blueprint for designing strategies towards carbon peak and neutrality, especially in the context of sustainable recoveries and carbon mitigation post-pandemic.
1. Introduction
As the impact of global warming has intensified around the world, it is essential for collective efforts of nations worldwide to reduce carbon emissions. Reliable emission estimations ensure mitigation strategies and policymaking are both feasible and impactful, which provide a comprehensive grasp of the global carbon cycle [23]. As China has became the world’s top producer [13], the country takes more responsibility for emission reductions. China is actively pursuing various strategies to mitigate emissions, aligning itself with ambitious
targets such as peaking emissions before 2030 and achieving carbon neutrality before 2060 (i.e., Dual-Carbon goals). Given China’s role in global emissions and its influence on global emission trajectories, these targets are not just significant for China but have global implications. Their achievement could potentially advance the realization of the temperature control goals outlined in the Paris Agreement.
China has made great progress in reducing carbon emissions in recent years. In 2020, the emission intensity (carbon emission per unit of gross domestic product) dropped by compared to 2005 , which surpassed the reduction target promised by the
government [9]. However, there are still great challenges for China to achieve the Dual-Carbon goals. First, China has been heavily reliant on fossil fuel consumption (up to in 2020), which has contributed to a high-carbon energy mix and huge carbon emissions [41]. Secondly, the expansion of sectors with high energy consumption increases the share of manufacturing, leading to large emissions [30]. Finally, the rapid economic growth in China inevitably leads to high energy consumption [32].
In 2020, the onset of COVID-19 and the subsequent lockdowns around the world affected carbon emissions. In China, during the first four months, reduced industrial activities and social engagements led to a decrease in energy consumption, resulting in lowered emissions. Specifically, from January to April, emissions from manufacturing saw a decrease of 70.50 Mt , which is a decline compared to the same period in 2019 [26]. Nevertheless, instead of wide-scale lockdowns, the country adopted localized, brief lockdown measures from April onwards. Hence, its impact was less pronounced and a noticeable increase in emissions could be observed. This rise was highlighted by the increase in manufacturing emissions in April, compared to April 2019 [26]. Given that the drop in carbon emissions in many sectors in 2020 was not due to structural changes but rather to mandatory behavioural changes, a rapid rise in emissions is to be expected after the relaxation of restrictions [23]. The unpredictable epidemic has introduced a significant degree of uncertainty to the global emission trajectory, making it more difficult to formulate emission reduction policies. Accurate accounting of carbon emissions is crucial for assessing the pandemic’s impact and for shaping future strategies aimed at achieving carbon neutrality. By observing how major economies, like China, react to abrupt disruptions, we can gain valuable insights that can guide nations in building resilience against unforeseen events and in their pursuit of sustainable development.
There are still some difficulties and gaps in estimating emission inventory. First, China lacks an official continuous emission inventory, with data available only for select years (1994, 2005, 2010, 2012, 2014, 2017, 2018) [17,35,36]. An inconsistent emission inventory does not reach the standard of a high-quality dataset (Paris Agreement) and fails to provide necessary information and details on emissions reduction. Second, widely used emission databases are constructed with different statistics criteria, shown in Table S1 in Supplementary material 1. Different statistics criteria make these datasets incomparable to any meaningful extent. Thirdly, while there are studies that provide provincial-level emission data [8,58], gaps remain regarding the emissions by detailed sectors and energy types. For example, Guevara et al. [18] set the emission scenario for the fossil fuel and biofuel. Doumbia et al. [7] construct the COVID-19 emission scenario with a total of four sectors: power, industry, residential and transportation. Although these sectors and energy types account for a high proportion of emissions, they do not reflect a comprehensive picture of industry-wide emissions. Given that China’s Dual-Carbon goals necessitate the collective action of all provinces, the completeness of such data essential. Finally, of all the above works, only Guevara et al. [18] made their final emissions dataset public. The remaining studies do not provide the raw data or clarify the data source, resulting in non-transparent and unreliable estimated data.
In addition to territorial emissions, consumption-based emissions have been seen as a complement to national emission accounting. Consumption-based approach trackes emissions embodied in supply chains, thereby quantifying the carbon emissions embodied in the consumption patterns of a given region. This approach enables a comprehensive assessment of carbon accountability, shifting the focus from producers to consumers. Such a shift promotes strategies aimed at mitigating climate change from a consumption perspective. However, most studies that compute consumption-based emissions have limitations in their temporal and spatial scope. For example, Feng et al. [12] estimated the outsourcing of inter-provincial emissions in China in 2007. The results indicate that products and services that are consumed
outside of the province in which they are produced account for of China’s emissions. Sun and Mi [50] estimated the consumption-based emissions from 2012 to 2020 and analysed the factors driving the changes of emissions. They found that exports and investments in construction sector are the primary drivers of emission growth. Therefore, the consumption-based emissions of China need more in-depth analysis.
Aiming at the above research gaps, this paper represents an extensive update of existing China’s emission estimates [17,46,47] by including (i) a description of the trends of territorial emissions from both energy combustion and cement production over the historical period 1997-2022, with a strong focus on the period of the COVID-19 pandemic, (ii) the most comprehensive long time series energy/emission inventories, covering 47 economic sectors and 17 energy types, (iii) consideration of the change in emissions for 30 provinces encompassing the period before and after COVID-19, and (iv) providing a more holistic perspective from consumption-based emissions, look closer into the disparities between territorial-based emissions and consumption-based emissions over the long-term history. The dataset developed in this study is to support the quantification of China’s emission changes, and to reveal the heterogeneous impact of COVID-19 on emissions across China’s 30 provinces and 47 economic sectors. The consistent and comparable emission inventory will provide valuable information, guilding government responses to the future unforeseen crisesand aiding in the development of future abatement initiatives. Furthermore, this could serve as a blueprint for other nations, offering lessons on navigating large-scale disruptions and developing responsive policy frameworks. The energy-related and process-related emission inventories have been published in our open-source dataset China Emission Accounts and Datasets (CEADs, www.ceads.net).
2. Methods
2.1. Accounting approaches
There are several accounting approaches for estimating carbon emissions [48]. Production-based accounting estimates the emissions released from production activities in a region. Territorial-based accounting covers all emissions generated within the country. Unlike production-based accounting, territorial-based accounting does not consider emissions resulting from international aviation or shipping. A more thorough carbon footprint could be provided by consumptionbased accounting. It identifies the emissions associated with products and services that take place in one region but are produced elsewhere [56]. Territorial-based accounting is the mandatory accounting method in the United Nations Framework Convention on Climate Change (UNFCCC), as these statistics enable comparisons between countries’ progress in reducing emissions and are quite accurate [57].
2.2. Territorial-based accounting
In this study, territorial-based emissions are compiled in line with guidance from the International Panel on Climate Change administrative-territorial approach [22] and cover the carbon emissions for China and its 30 provinces from 1997 to the latest available year of reporting (2021). We consider territorial-based accounting from two main sources: energy-related emissions and process-related emissions. The scope, format, and data source between national and provincial estimates in this paper are consistent.
2.2.1. Energy-related sectoral emissions
Energy-related emissions indicate carbon emissions from fossil fuel combustion. The energy-related emissions, broken down by sectors and energy types, can be calculated based on the following equation.
Where and are defined as the fuel type and sector. indicates
the amount of released from the combustion of fuel in sector is activity data, representing the amount of fossil fuels consumed by fossil fuel and sector . We consider the energy combustion for the activity data only and exclude the part of non-energy use and energy loss. Emission factor can be separated into and is net caloric value, representing the heat released by fuel when it cools to its initial state (ambient temperature after complete combustion). is carbon content, indicating the mass percentage of carbon in all elements measured in the fuel is the oxidization rate, indicating the fraction of fuel oxidized during combustion. This study adopts survey-based emission factors from our earlier research [[28],46].
Our emission inventory covers 17 fossil fuels (shown in Table S2 in Supplementary material 1) and 47 sectors (shown in Table S3 in Supplementary material 1). In terms of the classification of sectors, our inventory follows China’s national economic accounting standard and approach [37]. The same statistical approach facilitates the comparison for future studies.
2.2.2. Energy-related reference emissions
Energy-related reference emissions are estimated using energy supply data. It is a top-down method, which can be regarded as a complement to the sectoral approach [22]. We estimated the reference emissions of raw coal, crude oil, and natural gas, since they are primary energy. The reference emissions are calculated as:
Where, indicates the emissions estimated using reference method. The activity data ( ) can be estimated based on the mass balance of energy:
Noticeably, items in brackets are only considered when estimating the provincial emissions.
2.2.3. Process-related emissions
In this paper, we estimate process-related emissions from cement production, as cement production is the third-largest source of carbon emissions globally [2] and contributes around of process-related emissions in China [46]. The chemical reaction in cement manufacture occurs when carbonates (largely ) contained in limestone are converted into oxides (primarily lime, CaO ) and by the addition of heat. The process-related emissions can be estimated as:
Where, indicates the emissions from cement production. is the mass of total cement production. The value of is collected from Liu et al. [28].
2.3. Consumption-based accounting
We adopt the input-output model to estimate consumption-based emissions of China in this study. An environmentally extended inputoutput model has been widely used to calculate the indirect emissions and embodied emissions of an economic sector in one country [20,59]. More detailed explanations can be found in previous studies [34,55].
The total output of sectors within an economy can be expressed as
Where is the total output of sectors. is the technological coefficient matrix, representing the intersectoral economic linkages. is the intermediate inputs from sector i to sector j . is the total output of
sector j . is the sum of intermediate consumption from sectors; is the final demand of sectors. When solved for the total output, Eq. (5) can yield
Where is the identity matrix, is the Leontief inverse matrix.
Further, we introduce Eq. (7) to estimate the consumption-based emissions.
Where, is the matrix of emissions caused by final demands for sectors (i.e., sectoral consumption-based emissions); is the vector of emission intensity, which is the territorial-based emissions per unit of output of a sector.
Since territorial-based emissions consider household emissions (rural and urban), our consumption-based accounting includes the emissions by household’s direct energy use, for consistency and comparability. In our study, the boundary of consumption-based emissions refers to emissions driven by final demands (i.e., government consumption, import, capital formation, rural and urban households consumption) in China.
2.4. Uncertainty assessment
Two primary sources of uncertainty in energy-related sectoral emissions stem from activity data and emission factors. In order to examine this uncertainty, we applied the Monte Carlo method, which is recommended by IPCC emission accounting guidelines. The approach involves inputting probability distributions for each model (activity data and emission factors). Based on their respective probability density functions, random values for emission factors and activity data are selected, which are then used to compute the corresponding emission values. Using MATLAB, this process is iteratively executed 20,000 times, with the results from each iteration contributing to the construction of the overall emission’s probability density function.
2.5. Data sources
Based on the territorial-based accounting method mentioned above, the activity data of each fossil fuel in each sector, and emission factors are collected. Energy consumption data for both national level and 30 provinces are obtained from the China Energy Statistics Yearbook 2021 and 2022 [41]. The activity data of cement at both national and provincial levels are collected from the China Statistical Yearbook 2021 and 2022, along with the corresponding provincial statistical yearbook for the same years. The emission factors are drawn from our earlier research [28,46], which provides China-specific measured values based on extensive investigation.
To preliminary estimate the national-level emissions data for 2022, we apply the growth rates of energy consumption (by coal, oil, and natural gas) [42] to the energy inventory in 2021 and get the energy consumption data for 2022. We then use this predicted energy data to estimate emissions for 2022.
In terms of the consumption-based accounting method, input-output tables (IOTs) for the year 2002, 2005, 2007, 2010, 2012, 2015, 2017, 2018 and 2020 are collected from the Bureau of Statistics in China [40].
3. Results
3.1. Trends of territorial-based emissions in China
Fig. 1 shows territorial-based emissions by fuel categories in China from 1997 to 2022. China’s emissions grew considerably from 1997 ( 2923.86 Mt ) to , then fell slightly to 9253.50
Fig. 1. emissions in China by category, in millions of tones, over 1997 to 2022. All emissions data in 2022 are predictive, and distinguished with a grey overlay to differentiate them from historical data.
Mt. in 2015 and increased by in 2022 (10,571.34 Mt). During the COVID-19 pandemic (2020-2021), emissions exhibited an upward trend compared to 2019. However, the annual growth rate from 2019 to 2020 stood at , lower than that from 2018 to 2019 (1.8%). As the epidemic became more controllable, there was a marked retaliatory rebound in growth, evidenced by the annual growth rate from 2020 to 2021 surging to . In the broader picture, carbon emissions are still increasing and have not reached a plateau phase. China’s per capita emissions have tripled between 2000 and 2021, and have surpassed the figures of the UK and the EU from 2013 onwards [52]. By the end of 2020, emission intensity decreased by compared to that in 2015, beating the official target of an reduction set for the 13th FiveYear Plan.
In examining energy types, it is evident that the adjustments to the energy mix over the past decade have yielded significant results. On the one hand, emissions growth for each energy type has decelerated. During 2015-2020, the average annual growth rate of emissions from coal, oil and natural gas was and respectively, which was considerably slower than that during 2010-2015 ( and respectively). This achievement could be attributed to the slowdown of the growth rate of energy consumption ( and in 2010-2015 and 2015-2020 respectively), which is lower than that of GDP ( and in 2010-2015 and 2015-2020 respectively). Such a trend underscores China’s shift towards a high-quality and stable development phase where the economy thrives with a relatively lower rate of energy consumption growth [4]. On the other hand, there’s a marked change in the proportion of emissions from different energy sources. The proportion of emissions from raw coal and crude oil decreased (from 62.8% and 0.5% in 1997 to 51.7% and 0.1% in 2021 respectively), while that from natural gas increased significantly (from in 1997 to in 2021). This transition aligns with the evolving energy production structure: production proportions for raw coal and crude oil declined (from and in 1997 to and in 2021 respectively), while natural gas production steadily climbed (from in 1997 to in 2021) [41].
In terms of process-related emissions, China’s emissions from cement production rose from 142.74 metric tons in 1997 to 615.49 metric tons in 2022. Nevertheless, cement emissions are expected to stabilize and gradually decrease in the future, largely owing to the constraints on cement production brought about by escalating labor and raw material costs.
Analyzing emissions by economic sectors, the Production and Supply of Electric Power, Steam and Hot Water remains the most substantial emitter in 2021 (Fig. 2). This significant contribution to emissions is due to China’s reliance on traditional fossil fuels for electricity and heat generation. For example, in 2021, China’s thermal power generation, predominantly fueled by coal, accounts for of the national power generation [39].
When looking at the industry structure over a long period (from 1997 to 2021), we have witnessed a considerable transformation. Amid accelerated industrialization in China, emissions from manufacturing surged, growing from 2393.30Mt in 1997 (81.9% of the total emissions) to 8837.44 Mt in 2021 , which makes up . The emissions contribution from the Production and Supply of Electric Power, Steam, and Hot Water sector jumped from ( 1085.30 Mt ) in 1997 to ( 5253.15 Mt ) in 2021 . Additionally, the share of the ferrous metal mining and processing sector increased from in 1997 to in 2021. However, due to the prevailing steel surplus and the drop in crude steel production, it is anticipated that emissions from the steel industry will experience a decline [45]. This would consequently lead to a
Fig. 2. Sector contributions from production perspectives for in China in 1997, 2021. The inner circle shows the proportion of sectoral emissions in 2021, and the outer circle represents the data of 1997.
reduction in emissions from the mining and processing of ferrous metals. Even as manufacturing continues its rapid pace of development, its carbon emission intensity is on a decline, recording a drop of during the 13th Five-Year Plan period. This positive trend underscores the effective strides made towards the low-carbon development of China’s manufacturing sector. In contrast, emissions from the tertiary sector have nearly tripled, accounting for of the total emission growth from 1997 to 2021. Within this sector, the Transportation, Storage, Post and Telecommunication Services sector stands out, being responsible for a substantial of the increase. Meanwhile, the
agricultural sector remains a minor contributor, with its share diminishing from in 1997 to a mere in 2021.
3.2. Difference between consumption-based and territorial-based emissions of China
As a vital component of emission accounts, consumption-based emissions offer a more comprehensive perspective for analyzing China’s emission patterns. Consumption-based emissions is shaped by various final demand categories: rural and urban households
Fig. 3. The consumption-based emissions from 2002 to 2020. hhs is the abbreviation of households. Rural_hhs includes the emissions from rural households consumption and Urban_hhs includes the emissions from urban households consumption. Difference equals territorial-based emissions minus consumptionbased emissions.
consumption, government consumption, capital formation and imports (Fig. 3). Over the years, capital formation consistently stands out, contributing to of emissions on average. This aligns with China’s high savings rate, with investment playing a dominant role rather than consumption in driving demand [33]. Emissions from rural household consumption decreased from (in 2002) to 6.5% (in 2020), mainly attributable to the urbanization process in China [44]. The proportion of the rural population declined from to . Emissions arising from urban households and government consumption have been relatively steady, around and respectively. Emissions tied to imports have decreased from to over the same period, despite a steady annual growth in import value. This suggests the nature of imports is shifting towards products with lower emission and eco-friendlier footprints.
When considering the difference between territorial-based emissions and consumption-based emissions (that equates to the emissions resulting from exports), this disparity can reveal how trade patterns influence carbon emissions. In Fig. 3, we observe the positive value of ‘Difference’, it is evident that exports surpass imports. This surge in exports has significantly influenced China’s increasing carbon emissions in recent years, providing China with a strategic advantage in
international climate discussions [11]. The difference gradually widened from 2002, peaking in 2007, and then entering a period of decline. Following its entry into the World Trade Organization in 2001, China saw a remarkable annual growth in its export volume between 2002 and 2007. The high emissions associated with the export of carbon-intensive commodities, such as metal goods and electronics, were notable [38]. However, after 2008, due to stricter export regulations coupled with the financial downturn, the average annual growth in exports slowed to between 2010 and 2015. Further, improvements in China’s industrial and energy mix may also have contributed to the slowdown in China’s implied exports, as the growth rate of implied exports has declined much faster than trade exports [51].
In 2020, China witnessed a resurgence in this ‘Difference’, with the ratio of increase reaching a significant , primarily driven by an increase in exports. Despite the global pandemic, there was a significant uptick in China’s export volumes (mainly medical supplies and electronic devices) in 2020, increasing by , much higher than in 2019. This growth can result in the effectiveness of China’s epidemic prevention and control measures, which ensured the stable production of goods in high demand globally, such as medical supplies (including face masks) and electronic devices (including laptops, tablets, and
Fig. 4. The changes in China’s provincial territorial emissions from 2018 to 2021.
household appliances). Exports in these categories grew by and respectively, contributing and to the overall export growth, respectively [38]. Meanwhile, imports have witnessed a decline for the second consecutive year, in 2019 and 2020, intensifying the ‘Difference’.
3.3. The changes in provincial-territorial emissions during the COVID-19
Compared with 2019, nearly two-thirds of China’s provinces reduced their emissions in 2020 (Fig. 4). However, this trend shifted in 2021, with most provinces exhibiting a surge in emissions.
Since manufacturing is the major driver of the emission decline [60], provinces with robust manufacturing bases observed substantial emission reduction in 2020. For example, Jiangsu and Shandong reduced their emissions by and respectively in 2020 , while their emissions all increased by and respectively in 2019. The transportation sector is also an important driver [1]. Provinces like Fujian and Shanghai, with extensive transportation networks, experienced a clear decrease in 2020, ( respectively). This contrasted with their growth rates of and respectively in 2019. Additionally, remarkable reductions were evident in Hubei province (whose capital is Wuhan) and Beijing, reflecting their extended lockdown phases that spanned over three months. Due to the swift resumption of social-economic activities after April, the pandemic had a minimal impact in western China. Provinces like Yunnan, Shaanxi, and Ningxia displayed consistent emission patterns in both 2019 and 2020. This stability may be attributed to the west’s sparse populated, which likely curtailed the virus’s transmission potential. In contrast, 14 provinces reported increased emissions in 2020. Provinces like Inner Mongolia and Xinjiang, abundant in coal, increased their emissions by and respectively. Meanwhile, Zhejiang, hit hard during the lockdown, witnessed a drop in emissions by 31.30 Mt in the early months [26]. However, yearly emissions increased, partially due to the initiation of Zhejiang Petrochemical Co., Ltd. in 2019 [6]. Drought in 2020 in Guangxi resulted in a boost in thermal power generation [60], leading to emissions 21.38 Mt. higher than 2019.
Many provinces had increasing emissions after the pandemic in 2021. This increase in emissions was particularly noticeable in provinces like Shanxi and Xinjiang, where heavily relied on energy-intensive industries. Similarly, significant rises were observed in Jiangsu and Guangdong, renowned for their robust manufacturing bases and prosperous service sectors. These notable inclinations in emissions reflect the resurgence of socio-economic activities post-epidemic. Although emissions in those provinces show a resurgent growth trend, they have not entirely returned to pre-pandemic levels. In areas severely affected by the pandemic, such as Hubei and Beijing, recovering to the prepandemic emission levels may require a longer period. Conversely, a small number of provinces, such as Hebei and Tianjin, saw a decline in emissions in 2021. This trend was largely due to the progress made in steel industry reforms within these provinces. Specifically, Hebei Province had the highest reduction volume in crude steel production, accounting for of the national reduction [19,43]. Meanwhile, compared to 2020, Tianjin had the most significant reduction ratio in crude steel production nationwide, at [53]. These significant reductions in energy-intensive industrial outputs resulted in a decline in carbon emissions in these two provinces.
Considering each province’s development phase, resource availability, strategic objectives, and environmental considerations, China established varied emission intensity reduction goals for the 13th Five-Year span (2015-2020) (details in Table S4 in Supplementary material 1). By the end of this period in 2020, 17 provinces achieved their set targets, whereas the other 13 fell short.
The provinces that didn’t reach their set targets are predominantly those with heavy industrial focus, such as Guangdong and Shandong, or those rich in resources, like Shanxi and Hebei. Of these, only Inner Mongolia, Ningxia, and Xinjiang saw their carbon emissions intensity
increase, rising and respectively during the 13 th Five-Year Plan period. These provinces, while rich in energy resources, are still economically lagging. Their economic backbone largely comprises of manufacturing, especially energy-intensive sectors like coal and steel. This makes the journey to carbon neutrality for these regions particularly arduous. Conversely, provinces meeting their targets often enhanced their industrial structures and shifted towards more serviceoriented economies. Take Chongqing as an example: its sectoral breakdown transitioned from , and in 2015 (agriculture, manufacturing, and services respectively) to , and in 2020. Notably, developed regions like Shanghai, Beijing, and Guangdong, where finance and services are the main pillars, alongside provinces known for their potent natural carbon absorption capabilities like Zhejiang and Fujian, exhibit comparatively lower carbon emissions intensity.
Per capita carbon emission serves as a crucial measure of regional carbon emission levels [25]. Manufacturing and energy-centric provinces, such as Shanxi, Hebei, and Tianjin, rank high in per capita emissions, with Inner Mongolia, Ningxia, and Xinjiang topping the list (shown in Fig. 5). Contrastingly, Hainan, with its economy anchored in the service sector, and densely populated developed provinces like Beijing and Guangdong, report low per capita emissions. Even though Sichuan has a strong presence in energy and manufacturing and ranks sixth in emissions intensity, its per capita emissions stood only above Beijing in 2020. This can be credited to its clean energy-focused production. In 2020, hydropower represented a staggering of the province’s electricity generation [49].
3.4. Comparisons with existing estimates and uncertainty assessment
Fig. 6 contrasts our emission findings with estimates from other organizations, including EIA, BP, IEA, EDGAR, GCB, and MEIC. Over the 24-year period, EDGAR (Emissions Database for Global Atmospheric Research) consistently presents the highest figures. When we focus on the period from 2018 to 2020, the national sectoral emissions values are the lowest, aligning closely with the BP data reported. Our provincial aggregate emissions are in line with GCB, and also follow the close values for EIA. While national estimates from GCB and IEA include emissions from fossil fuel combustion and cement production, they use the default emission factors provided by IPCC. This might account for their higher emission values compared to our estimations (National reference emissions and National sectoral emissions). Nevertheless, the discrepancy between GCB and IEA points to inherent uncertainty. Although EDGAR, EIA, and BP only include emissions from fossil fuel, EDGAR’s and EIA’s figures are higher than BP’s, highlighting the variances in different databases.
Two primary sources of uncertainty in the data (activity data and emission factors) can be assessed using the Monte Carlo method. The uncertainty surrounding China’s energy-related emissions for 2020 and 2021 is estimated to be ( ) and ( ), with a confidence interval. This level of precision is acceptable, as our uncertainty range falls within the benchmark set for global countries [14,15].
Additionally, discrepancies in data can arise from varied accounting methods. The reference emissions and territorial-based emissions display similar trajectories, the former consistently exceeds the latter by approximately annually. Three factors account for this deviation. First, the territorial-based emissions approach does not factor in energy loss during its transformation, while the reference emissions approach does. Secondly, reference emissions exclude transportation loss and nonenergy use from the primary energy, leaving out secondary energy. Thirdly, the energy balance table in China shows about a disparity between energy production and consumption data [16]. Given that secondary energy emissions aren’t captured in reference emissions and significant inter-provincial secondary energy trades exist, reference emissions serve as a supplementary measure to territorial-based
Fig. 5. emission intensity and per capita emissions of China’s provinces in 2020.
Fig. 6. Comparisons with other estimates for 1997-2021. Data source: EIA (Energy Information Administration)[10]; BP (British Petroleum) [3]; IEA (International Energy Agency) [21]; EDGAR (Emissions Database for Global Atmospheric Research) [5]; GCB (Global Carbon Budget) [14]; MEIC (Multi-resolution emission inventory for China) [31]. Note: IEA, GCB, MEIC and our data provide emissions data covering fossil fuel combustion and cement production. EDGAR, EIA, and BP only include emissions from fossil fuels.
emissions in international conventions. The latter provides a more accurate and comprehensive picture of emissions.
Finally, emissions data of China in 2022 are forecasted roughly, which leads to large uncertainty. Based on the 2021 emissions data, we apply the growth rate of energy consumption of coal, oil, and natural gas to estimate the emissions in 2022.
4. Discussion
Our study reveals that the influences of COVID-19 pandemic and associated lockdown measures on carbon emissions were only temporary, regardless their profound impacts on both daily life and the economy. The stagnation in economic and social activities directly led to
a notable decrease in emissions in the first quarter of 2020 [26]. However, starting from April, central and local governments, along with citizens gradually recovered their social-economic activities [26], which led to an increase in emissions that offset the reductions in the first quarter. Therefore, China’s territorial-based emissions in 2020 rose by compared to 2019. In 2021, an urgent need for economic recovery resulted in a continuous resurgence on the majority of social activities. This led to emissions rising in most provinces. The 2021 rebound indicates the interconnected dynamics of economic recovery and emissions pattern changes at both national and provincial levels. Although the COVID-19 pandemic had resulted in our behavioural changes, leading to a fluctuation in emissions trends, it was not significant enough to drive a long-lasting reduction in emissions.
When examining emissions alongside consumption, we found a notable surge in the differences between territorial and consumptionbased emissions in 2020. As socio-economic activities gradually resumed after April 2020, China rapidly expanded production and exported a wide range of products. These included not only medical supplies like face masks, which mitigated the global shortage of essential healthcare items, but also various electronic devices, such as laptops, tablets, and household appliances, supporting remote work, education, and daily living needs during the pandemic. However, the production of these export goods led to a stable rise ( ) in territorial emissions in 2020. The growth rate of consumption-based emissions (with ) was lower than that of territorial-based emissions due to the severe effect on the global supply chain. Thus, the difference between territorialand consumption-based emissions nearly doubled compared to 2018.
Previous studies have discussed the contradiction between economic recovery and reducing carbon emissions post-pandemic [24,27]. Unlike the rebound after the 2008-2009 global financial crisis, the emission pattern changes from 2020 to 2021 indicate that we have not entirely replicated the sharp increases seen in the past. This is a positive sign of temporary transiting towards a greener energy system and economic structure. However, given the increasingly tightening global carbon budget, we still need to take action to mitigate potential rebounds and strengthen global efforts to reduce emissions in the long term, and finally achieve emission reduction targets of the Paris Agreement. In this context, energy and economic structural changes are considered to be critical for achieving emission reduction targets. Our study reveals that China’s energy structure has improved in the past two decades, but it still heavily relies on fossil fuels. Transitioning towards cleaner and more sustainable energy systems is essential, as underscored at the 28th Conference of the Parties to the United Nations Framework Convention on Climate Change (COP28) [54]. However, this transition presents tremendous challenges for China, given its high dependence on fossil fuels. Substantially increasing the utilization rate of renewable energy is a crucial aspect of this transition. Investing in solar, wind, hydro, and other renewable energy sources not only helps reduce carbon emissions but also enhances energy security, which is a key pathway for achieving global sustainable development.
5. Conclusions
Our research offers a comprehensive analysis of China’s carbon emissions patterns, shedding light on the emission changes during the COVID-19 pandemic. Our work enriches the existing emissions data for China and its provinces by providing comprehensive data acrossvarious sectors and fossil fuel types from 1997 to 2021. This is pivotal for policymakers and researchers to develop and refine strategies aimed at achieving China’s ambitious Dual-Carbon targets.
This study lays a data foundation for ongoing monitoring and strategy development towards the nation’s carbon peak and neutrality. The insights gained here hold significant value for the international community. These insights not only tackle the contradiction between economic growth and environmental sustainability intensified by the COVID-19, but also enhance our abilities to tackle the challenge of energy transition, as recently highlighted during the COP28. Future works will expand to include more countries, offering a comprehensive global view that supports emission reductions and sustainable development.
The energy statistic data for China and its 30 provinces can be obtained from the China Energy Statistics Yearbook 2021 [41]. The emission factors in emission accounts are summarized in Liu et al. [28]. All the data and results developed in this study can be downloaded freely from Carbon Emission Accounts and Datasets for emerging countries (CEADs) at www.ceads.net/data/.
Acknowledgements
We acknowledge supports from National Key R&D Program of China (2023YFE0204600 and 2023YFE0113001), the National Natural Science Foundation of China (72250710169 and 72243004), the Royal Society International Exchanges (IEC NSFC ), UKRI Research England QR policy support fund (PSF-16) and the China Scholarship Council PhD programme.
Appendix A. Supplementary data
Supplementary data to this article can be found online at https://doi. org/10.1016/j.apenergy.2024.122837.
References
[1] Aminzadegan S, Shahriari M, Mehranfar F, Abramović B. Factors affecting the emission of pollutants in different types of transportation: a literature review. Energy Rep 2022;8:2508-29.
[2] Andrew RM. Global CO2 emissions from cement production, 1928-2018. Earth Syst Sci Data 2019;11(4):1675-710. https://doi.org/10.5194/essd-11-1675-2019.
[3] BP. bp statistical review of world energy. https://www.bp.com/en/global/corpora te/energy-economics/statistical-review-of-world-energy.html; 2020.
[4] China Energy Media Research Institute. China Energy Data Report (2022) (Chinese document). 2022.
[5] Crippa M, Guizzardi D, Muntean M, Schaaf E, Solazzo E, Monforti F, et al. Fossil CO2 emissions of all world countries. 2020.
[6] Department of Ecology and Environment of Zhejiang Province. Zhejiang Province “13th Five-Year” low carbon development report ((Chinese document)). 2021.
[7] Doumbia T, Granier C, Elguindi N, Bouarar I, Darras S, Brasseur G, et al. Changes in global air pollutant emissions during the COVID-19 pandemic: a dataset for atmospheric modeling. Earth Syst Sci Data 2021;13(8):4191-206. https://doi.org/ 10.5194/essd-13-4191-2021.
[8] Du L, Wei C, Cai S. Economic development and carbon dioxide emissions in China: provincial panel data analysis. China Econ Rev 2012;23(2):371-84.
[9] Ecological Environment Department. The reduction of carbon and carbon cooperation has made positive results. https://www.ndrc.gov.cn/xwdt/ztzl/2022 qgjnxcz/bmjncx/202206/t20220612_1327157.html; 2022.
[10] EIA. International CO2 emissions from fuel combustion. https://www.eia.gov/en vironment/emissions/carbon/; 2020.
[11] Fan JL, Hou YB, Wang Q, Wang C, Wei YM. Exploring the characteristics of production-based and consumption-based carbon emissions of major economies: a multiple-dimension comparison. Appl Energy 2016;184:790-9. https://doi.org/ 10.1016/j.apenergy.2016.06.076.
[12] Feng KS, Davis SJ, Sun LX, Li X, Guan DB, Liu WD, et al. Outsourcing CO2 within China. Proc Natl Acad Sci U S A 2013;110(28):11654-9. https://doi.org/10.1073/ pnas. 1219918110.
[13] Friedlingstein P, Jones MW, O’Sullivan M, Andrew RM, Hauck J, Peters GP, et al. Global Carbon Budget 2019. Earth Syst Sci Data 2019;11(4):1783-838. https:// doi.org/10.5194/essd-11-1783-2019.
[14] Friedlingstein P, O’Sullivan M, Jones MW, Andrew RM, Hauck J, Olsen A, et al. Global carbon budget 2020. Earth Syst Sci Data 2020;12(4):3269-340. https://doi. org/10.5194/essd-12-3269-2020.
[15] Gregg M. Uncertainties in accounting for CO2From fossil fuels. J Indust Ecol 2008; 12(2):136-9. https://doi.org/10.1111/j.1530-9290.2008.00014.x.
[16] Guan DB, Liu Z, Geng Y, Lindner S, Hubacek K. The gigatonne gap in China’s carbon dioxide inventories. Nat Clim Change 2012;2(9):672-5. https://doi.org/ 10.1038/Nclimate1560.
[17] Guan Y, Shan Y, Huang Q, Chen H, Wang D, Hubacek K. Assessment to China’s recent emission pattern shifts. Earth’s Future 2021;9(11). https://doi.org/ 10.1029/2021ef002241.
[18] Guevara M, Petetin H, Jorba O, van der Gon HD, Kuenen J, Super I, et al. European primary emissions of criteria pollutants and greenhouse gases in 2020 modulated
by the COVID-19 pandemic disruptions. Earth Syst Sci Data 2022;14(6):2521-52. https://doi.org/10.5194/essd-14-2521-2022.
[19] Hebei Province Bureau of Statistics. Hebei Statistical Yearbook 2022. http://www. hetj.gov.cn/hetj/tjsj/jjnj; 2023.
[20] Huo H, Zhang Q, Guan D, Su X, Zhao H, He K. Examining air pollution in China using production- and consumption-based emissions accounting approaches. Environ Sci Technol 2014;48(24):14139-47. https://doi.org/10.1021/es503959t.
[21] IEA. CO2 emissions from fuel combustion. https://www.iea.org/data-and-statisti cs/data-products; 2023.
[22] IPCC. IPCC guidelines for national greenhouse gas inventories. 2006.
[23] Le Quere C, Jackson RB, Jones MW, Smith AJP, Abernethy S, Andrew RM, et al. Temporary reduction in daily global CO2 emissions during the COVID-19 forced confinement. Nat Clim Change 2020;10(7). https://doi.org/10.1038/s41558-020-0797-x. 647-+.
[24] Le Quere C, Peters GP, Friedlingstein P, Andrew RM, Canadell JG, Davis SJ, et al. Fossil CO2 emissions in the post-COVID-19 era. Nat Clim Change 2021;11(3). https://doi.org/10.1038/s41558-021-01001-0.
[25] Li R, Wang Q, Liu Y, Jiang R. Per-capita carbon emissions in 147 countries: the effect of economic, energy, social, and trade structural changes. Sustain Product Consump 2021;27:1149-64.
[26] Liu Z, Cui D, Deng Z, Wang YL, Zhong HW, Yue X, et al. Impact on China’s CO2 emissions from COVID-19 pandemic. Chinese Sci Bull Chin 2021;66(15):1912-22. https://doi.org/10.1360/Tb-2020-0729.
[27] Liu Z, Deng Z, Zhu B, Ciais P, Davis SJ, Tan J, et al. Global patterns of daily CO2 emissions reductions in the first year of COVID-19. Nat Geosci 2022;15(8):615-20.
[28] Liu Z, Guan D, Wei W, Davis SJ, Ciais P, Bai J, et al. Reduced carbon emission estimates from fossil fuel combustion and cement production in China. Nature 2015;524(7565):335-8. https://doi.org/10.1038/nature14677.
[30] Ma X, Wang C, Dong B, Gu G, Chen R, Li Y, et al. Carbon emissions from energy consumption in China: its measurement and driving factors. Sci Total Environ 2019;648:1411-20.
[31] MEIC. Multi-Resolution Emission Inventory for China. http://www.meicmodel. org/index.html; 2023.
[32] Mi Z, Zheng J, Meng J, Shan Y, Zheng H, Ou J, et al. China’s energy consumption in the new normal. Earth’s Future 2018;6(7):1007-16.
[33] Mi ZF, Zheng JL, Meng J, Zheng HR, Li X, Coffman D, et al. Carbon emissions of cities from a consumption-based perspective. Appl Energy 2019;235:509-18. https://doi.org/10.1016/j.apenergy.2018.10.137.
[34] Miller RE, Blair PD, ebrary, I.. Input-output analysis : Foundations and extensions. 2nd ed. Cambridge University Press; 2009.
[35] Ministry of Ecology and Environment of the People’s Republic of China. People’s Republic of China Fourth National Communication on Climate Change. https://www.mee.gov.cn/ywdt/hjywnews/202312/W020231229717234502302. pdf; 2023.
[36] Ministry of Ecology and Environment of the People’s Republic of China. People’s Republic of China Third Biennial Update Report on Climate Change. https://www. mee.gov.cn/ywdt/hjywnews/202312/W020231229717236049262.pdf; 2023.
[37] National Bureau of Statistics. Natioanl industries classification (GB/T 4754-2017). 2017.
[38] National Bureau of Statistics. China Statistic Yearbook 2022. http://www.stats.gov.cn/sj/ndsj/2022/indexch.htm; 2022.
[39] National Bureau of Statistics. Industrial added value above designated size increased by 4.3% in December 2021. 2022.
[40] National Bureau of Statistics. The input-output tables for China in 2002, 2005, 2007, 2010, 2012, 2015, 2017, 2018, 2020 [in Chinese]. 2022. Retrieved 11/01/
2024 from https://data.stats.gov.cn/ifnormal.htm?u=/files/html/quickSearch/t rcc/trcc01.html&h=740.
[41] National Bureau of Statistics. China energy statistical yearbook 2021-2022. 2023.
[42] National Bureau of Statistics. National Economic and Social Development Statistical Bulletins 2022. http://www.stats.gov.cn/english/PressRelease/20230 2/t20230227_1918979.html; 2023.
[43] National Development and Reform Commission. Steel industry operation in 2021 (in Chinese), https://www.ndrc.gov.cn/fggz/jjyxtj/mdyqy/202201/t20220130 _1314180_ext.html; 2022.
[44] Ou JM, Meng J, Zheng JY, Mi ZF, Bian YH, Yu X, et al. Demand-driven air pollutant emissions for a fast-developing region in China. Appl Energy 2017;204:131-42. https://doi.org/10.1016/j.apenergy.2017.06.112.
[45] Ren L, Zhou S, Peng T, Ou X. A review of CO2 emissions reduction technologies and low-carbon development in the iron and steel industry focusing on China. Renew Sustain Energy Rev 2021;143:110846.
[46] Shan Y, Guan D, Zheng H, Ou J, Li Y, Meng J, et al. China CO2 emission accounts 1997-2015. Sci Data 2018;5:170201. https://doi.org/10.1038/sdata.2017.201.
[47] Shan YL, Huang Q, Guan DB, Hubacek K. China CO2 emission accounts 2016-2017. Sci Data 2020;7(1). doi:ARTN 5410.1038/s41597-020-0393-y.
[48] Shigeto S, Yamagata Y, Ii R, Hidaka M, Horio M. An easily traceable scenario for emission reduction in Japan through the final consumption-based CO 2 emission approach: a case study of Kyoto-city. Appl Energy 2012;90(1):201-5. https://doi.org/10.1016/j.apenergy.2011.03.049.
[49] Sichuan Development Reform Energy. Sichuan Province “14th Five-Year” renewable energy development plan ((Chinese document)). 2020.
[50] Sun X, Mi Z. Factors driving China’s carbon emissions after the COVID-19 outbreak. Environ Sci Technol 2023;57(48):19125-36. https://doi.org/10.1021/ acs.est.3c03802.
[51] Tang X, Jin Y, Wang X, Wang J, McLellan BC. Will China’s trade restructuring reduce CO2 emissions embodied in international exports? J Clean Prod 2017;161: 1094-103.
[52] The World Bank. World Bank Open Data. https://data.worldbank.org/; 2023.
[53] Tianjin Municipal Bureau of Statistics. Tianjin Statistical Yearbook 2022. https://stats.tj.gov.cn/nianjian/2022nj/zk/indexch.htm; 2023.
[54] UNFCCC. COP28 the UEA consensus. 2023.
[55] Weber CL, Peters GP, Guan D, Hubacek K. The contribution of Chinese exports to climate change. Energy Policy 2008;36(9):3572-7. https://doi.org/10.1016/j. enpol.2008.06.009.
[56] Wiedmann TO, Chen GW, Barrett J. The concept of city carbon maps: a case study of Melbourne, Australia. J Indust Ecol 2016;20(4):676-91. https://doi.org/ 10.1111/jiec. 12346.
[57] Winkler L, Rogelj J, Gilbert A. Emissions Responsibility Accounting: A new look at emissions accounting. https://www.imperial.ac.uk/media/imperial-college /grantham-institute/public/publications/evidence-submission-papers/Emissions -Responsibility-Accounting-A-new-look-at-emissions-accounting.pdf; 2020.
[58] Ye B, Jiang J, Li C, Miao L, Tang J. Quantification and driving force analysis of provincial-level carbon emissions in China. Appl Energy 2017;198:223-38.
[59] Zhao HY, Zhang Q, Guan DB, Davis SJ, Liu Z, Huo H, et al. Assessment of China’s virtual air pollution transport embodied in trade by using a consumption-based emission inventory. Atmos Chem Phys 2015;15(10):5443-56. https://doi.org/ 10.5194/acp-15-5443-2015.
[60] Zheng B, Geng GN, Ciais P, Davis SJ, Martin RV, Meng J, et al. Satellite-based estimates of decline and rebound in China’s CO2 emissions during COVID-19 pandemic. Sci Adv 2020;6(49). doi:ARTN eabd499810.1126/sciadv.abd4998.
Corresponding author.
E-mail address: y.shan@bham.ac.uk (Y. Shan). These authors contributed equally.