نعوم بريويسنايا ر. فيليبسلوك م. أولتروجيسيباستيان ليندرليا ج. تايلور-كيرنيي-تشين كاندس تسائيبونوit دي بينأيدن إي. كوانهانا أ. تشانغرينيه ز. وانغلاينا ن. هولدانيال بيلياني-رابيلوهانتر م. نيسونوفراشيل ف. وايسمانأفي إ. فلامهولزديفيد دينغأبهيشيك ي. بهاتأوليفر ميولر-كاجارباتريك م. شيهرون ميلووديفيد ف. سافاج
الملخص
روبيسكو هو العنصر الأساسيإنزيم الإصلاح في الغلاف الحيويومع ذلك، فإن له حركية بطيئةتظل أدوار التطور والآلية الكيميائية في تقييد وظيفتها البيوكيميائية محل نقاش.لقد فشلت الجهود الهندسية الموجهة لتعديل المعايير البيوكيميائية للروبيسكو إلى حد كبير.على الرغم من أن النتائج الأخيرة تشير إلى أن الإمكانات الوظيفية للروبيسكو لها نطاق أوسع مما كان معروفًا سابقًا. هنا قمنا بتطوير اختبار متوازي بشكل كبير، باستخدام بكتيريا الإشريكية القولونية المهندسةحيث يتم ربط نشاط الإنزيم بالنمو، لرسم خريطة منهجية لمشهد التسلسل-الوظيفة لروبيسكو. اختبار مركب لأكثر منمن الطفرات ذات الأحماض الأمينية الفردية مقابلسمح التركيز باستنتاج سرعة الإنزيم والظاهرمعلمات الألفة لآلاف الاستبدالات. حدد هذا النهج العديد من المواقع المحفوظة بشدة التي تتحمل الطفرات والطفرات النادرة التي تحسنالألفة. تشير هذه البيانات إلى أن التغيرات الكيميائية الحيوية غير التافهة متاحة بسهولة وأن المسافة الوظيفية بين إنزيمات الروبيسكو من كائنات متنوعة يمكن عبورها، مما يمهد الطريق لمزيد من جهود هندسة الإنزيمات.
تقوم النباتات والطحالب والبكتيريا الضوئية معًا بتثبيت حوالي 100 جيجا طن من الكربون سنويًا باستخدام إنزيم ريبولوز-1،5-بيسفوسفات كربوكسيلاز/أوكسيجيناز (روبيسكو) – وهو أكثر الإنزيمات وفرة على الأرض.تحفيز الريبسكو، الذي يكون بطيئًا مقارنة بالعديد من إنزيمات الأيض الكربوني المركزية الأخرىيُعتقد أنه يحد من عملية التمثيل الضوئي تحت الظروف الشائعةكما أن إنزيم روبيسكو عرضة لتفاعل جانبي مع الأكسجين، مما يؤدي إلى فرضية أن هذه الكفاءة الظاهرة هي في الواقع توازن دقيق بين عدة مقايضات بيوكيميائية تتعلق بالسرعة، والألفة، والتنوع..
لقد تعرقلت الجهود الهندسية لتحسين إنزيم الريبسكو بسبب انخفاض معدل الحصول على قياسات دقيقة لمعاييره، بما في ذلك معدل التحفيز لعملية الكربوكسيل.يسمىهنا)،ألفة ) وخصوصية لـ ضد لقد أدت جهود مركزة على مدى عدة عقود إلى إنتاج عدة مئات من القياسات الكيميائية الحيوية للروبيسكوز الطبيعي والمتحور.لقد كانت مجموعة هذه القياسات متحيزة نحو إنزيم الروبيسكو في النباتات الوعائية، ولا تزال تنوع الروبيسكو الطبيعي غير ممثلة بشكل كافٍ. تم استخدام فحوصات المكتبات والطفرات المدروسة في الماضي لزيادة نشاط الروبيسكو. وغالبًا ما أسفرت هذه الجهود عن تحسين التعبير.لكنها أدت أحيانًا إلى تحسينات بيولوجية كيميائية أساسية.
لقد استفادت هندسة البروتين في السنوات الأخيرة من إدخال أساليب التعلم الآلي. أحد أهداف هذه الجهود هو تدريب نماذج باستخدام بيانات تسلسل البروتين ووظائفه المعلّمة من الفحوصات الوظيفية عالية الإنتاجية.هندسة الإنزيمات باستخدام التعلم الآلي تقدم تحديًا إضافيًا: من الناحية المثالية، بيانات وظيفية سيتم تحليلها إلى معلمات تحفيزية فردية تقاس بكفاءة عالية إما في المختبرأو في الجسم الحي.
هنا قمنا بتطوير اختبار اختيار في الإشريكية القولونية لتقدير لياقة الكربوكسيل لأكثر منمن 8,835تم إلغاء وظيفة الإيزوميراز ريبوز فوسفات لإنشاء-سلالة تنمو على الجلسرين فقط عندما تعبر عن روبيسكو وظيفي (الشكل التمديدي 2أ). ثم أنشأنا مكتبة مشفرة بشريط من طفرات الأحماض الأمينية الفردية لـ. روبريوم ربيسكو، الذي قمنا بتقييمه بكفاءة عالية باستخدام rpi. من خلال تغيير تركيزات بيئة النمو، تمكنا من تقدير الفعاليةميولمن متغيرات الريبسكو – وهي مجموعة فرعية منها قمنا بالتحقق منها لاحقًا في المختبر. أظهر هذا الفحص أقلية صغيرة جدًا من الطفرات التي حسنت الألفة لـحوالي ثلاثة أضعاف. لم تُلاحظ هذه الروابط من قبل بين ربيزوكسيز البكتيريا، وهي أكثر شيوعًا في ربيزوكسيز النوع الأول الموجود في النباتات والطحالب، وتشير إلى أن التغييرات غير التافهة في الوظيفة البيوكيميائية نادرة، لكنها متاحة بسهولة من خلال الطفرات.
توصيف متغيرات الريبسكو
سلالة الإشريكية القولونية المعتمدة على الريبسكو، Δrpi، لا يمكنها النمو عندما يتم توفير الجلسرين كمصدر الكربون الوحيد لأن الريبولوز-5-فوسفات يتراكم دون مخرج.تتضافر الأفعال المشتركة لإنزيم فوسفوريبولوكيناز (PRK، الذي ينتج الركيزة الخماسية الكربون لروبيسكو) و
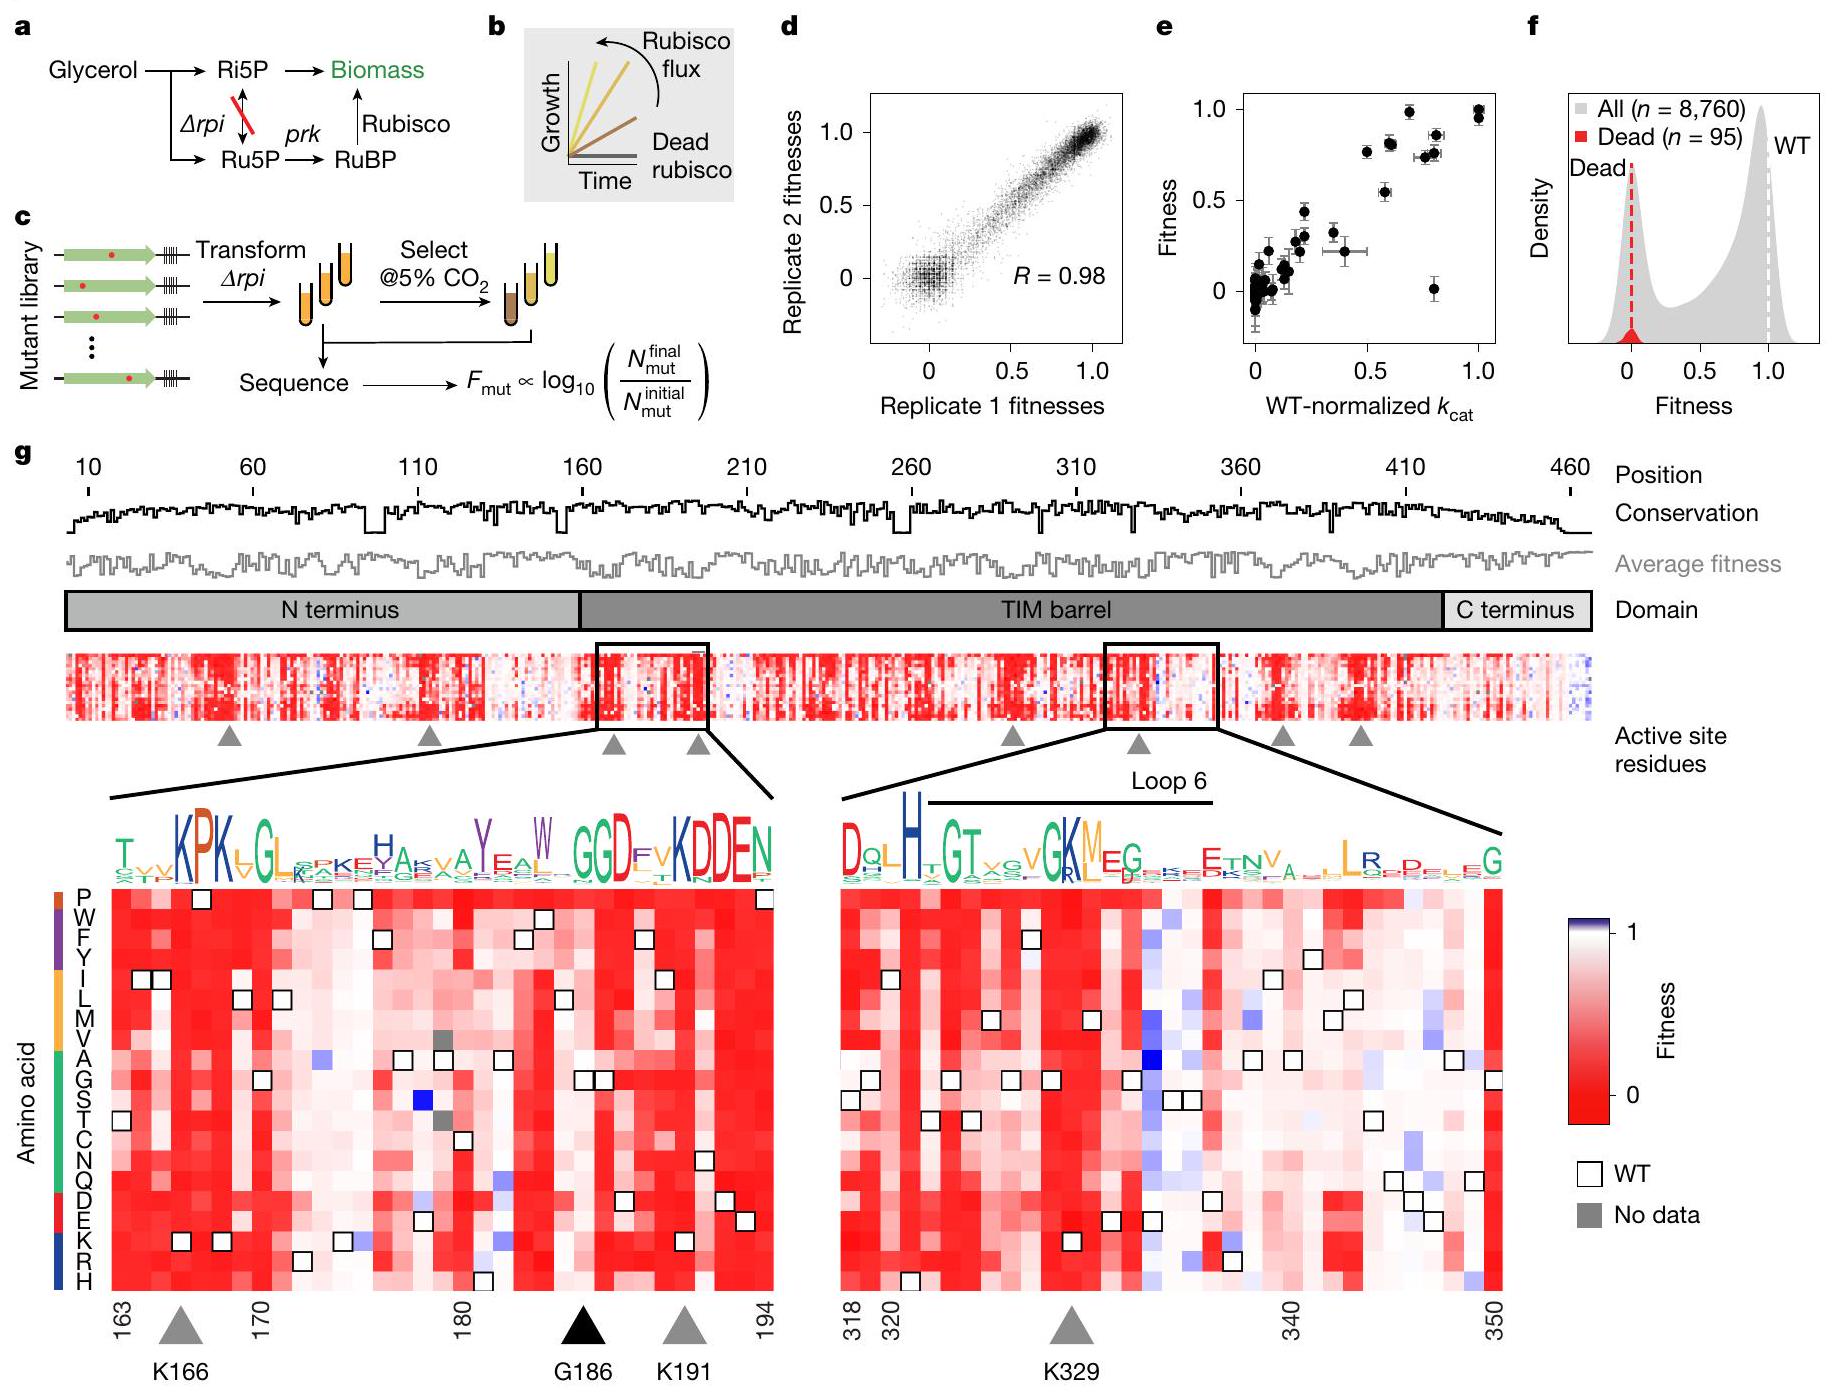
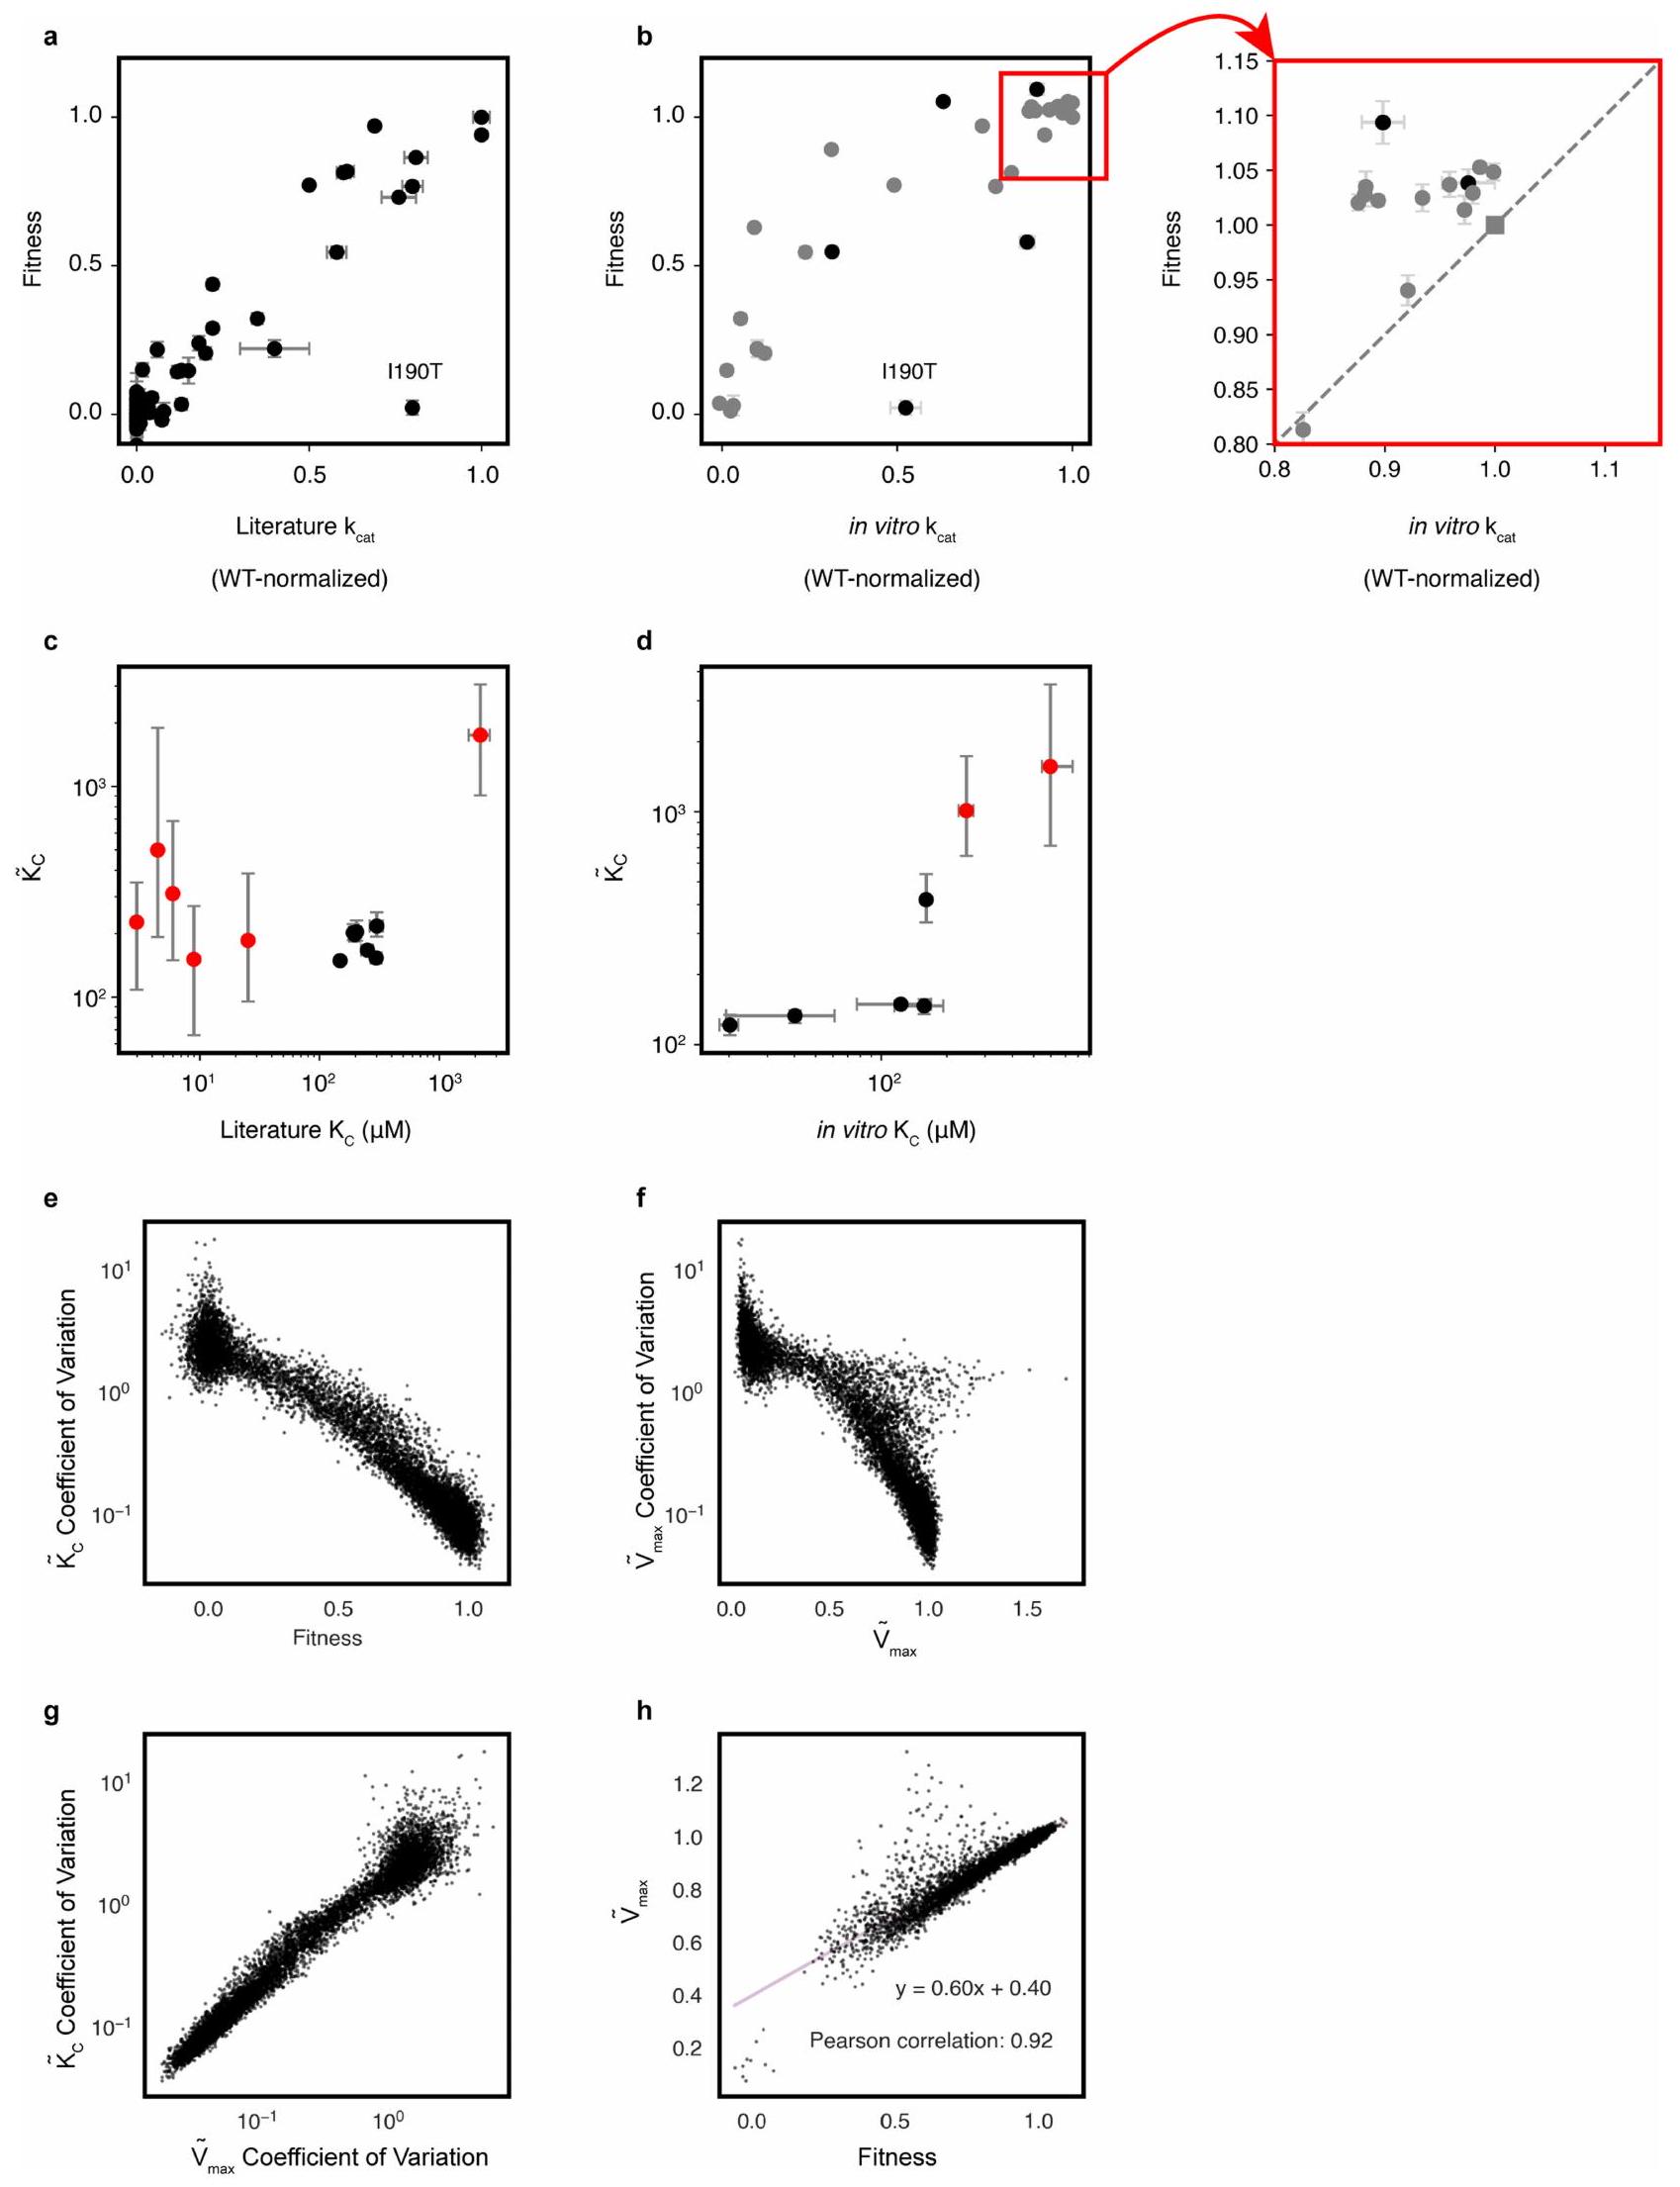
الشكل 1 | مسح طفرات عميق يميز بشكل فردي جميع طفرات الأحماض الأمينية المفردة في الريبسكو. أ، ملخص لعملية الأيض لـ rpi – سلالة الروبيسوكوديبندنت. ب، تنمو Arpi بمعدل يتناسب مع التدفق من خلال الروبيسكو. ج، مخطط لاختيار المكتبة. تم تحويل مكتبة من طفرات الأحماض الأمينية الفردية للروبيسكو إلى Δrpi ثم تم اختيارها في وسط محدود مدعوم بالجليسرول عند مستويات مرتفعة.تم تسلسل العينات قبل وبعد الاختيار، وتم استخدام عدد الرموز الشريطية لتحديد اللياقة النسبية لكل طافرة. د، التوافق بين نسختين بيولوجيتين مثاليتين؛ كل نقطة تمثل اللياقة المتوسطة بين جميع الرموز الشريطية لطافرة معينة. هـ، لياقة 77 طافرة مع قياسات في دراسات سابقة مقارنة بثوابت المعدل المقاسة في تلك الدراسات.البيانات الشاذة قيم خطأ اللياقة هي الانحراف المعياري للمتوسط لتسع قياسات غنى مكررة؛الأخطاء مأخوذة من الأدبيات، حيثما كان ذلك متاحًا. تم تطبيع ملاءمات المتغيرات (باللون الرمادي) بين قيم 0 و 1، حيث يمثل 0 متوسط ملاءمات الطفرات في مجموعة من المواقع النشطة المعروفة (التوزيع الأحمر، المتوسط موضح كخط متقطع أحمر) ويمثل 1 متوسط رموز النوع البري (WT) (خط متقطع أبيض).خريطة حرارية للياقة المتغيرات. تم تحديد الحفظ حسب الموضع وشعار التسلسل من MSA لجميع الروبيسكو. مثلث أسود، G186 (مثال على موضع ذو حفظ عالٍ يتحمل الطفرات)؛ مثلثات رمادية، مواضع الموقع النشط. Ri5P، ريبوز 5-فوسفات؛ Ru5P، ريبولوز-5-فوسفات؛ RuBP، ريبولوز-1،5-بيسفوسفات؛ TIM، إيزوميراز ثلاثي الفوسفات. تقوم إنزيمات الريبسكو بإنقاذ النمو من خلال تحويل هذه المادة الأيضية التي تعتبر مسدودًا إلى 3-فوسفوغليسرات، والتي يمكن أن تعود إلى الأيض الكربوني المركزي (الشكل 1أ والشكل البياني الممتد 2أ؛ لمزيد من أنظمة الاختيار المماثلة انظر المراجع 23، 24). لقد أكدنا أولاً أن معدل النمو لـكان rpi مرتبطًا كميًا بسلوك الإنزيم المعروف في المختبر (الشكل 1ب والشكل الإضافي 2ب-1). أظهر تعبير الروبيسكو المدفوع بمروج قابل للتحفيز أن معدلات النمو زادت مع تركيز الروبيسكو، مما يشير إلى أن زيادة تركيز الإنزيم أدت إلى زيادة اللياقة (الشكل الإضافي 2ب، د، ج)؛ عند الإيزوبروبيل--d-thiogalactopyranoside (IPTG) تركيزات أعلى منبدأت عوائد النمو في الانخفاض، مما يشير إلى أن الإفراط في التعبير عن الريبسكو يأتي بتكلفة للياقة البدنية. وبالمثل، لاحظنا نموًا أسرع في وجود مستويات أعلى من التركيزات (الشكل 2c,d من البيانات الموسعة). بعد ذلك، قمنا بتقييم ما إذا كانت الاختيارات المعتمدة على النمو مرتبطة بالسلوك الكيميائي الحيوي. كانت الأعمال السابقة حول . تم تحديد 77 طفرة من نوع rubrum rubisco تمتد من أقل منإلىمعدل التحفيز من النوع البري (البيانات التكميلية 1). تم اختبار نمو مجموعة فرعية من هذه الطفرات ووجد أنها تتوافق مع معدلات التحفيز المبلغ عنها (البيانات الموسعة الشكل 2i-k). معًا، تتماشى هذه النتائج مع نمو الجلسرين منتكون عملية التمثيل الضوئي محدودة بتدفق كربوكسيلاز الريبسكو، الذي يتحدد بواسطة حركيات الإنزيم. و -بالإضافة إلى الإنزيم وتركيزات. قمنا بعد ذلك بإنشاء مكتبة من جميع استبدالات الأحماض الأمينية الفردية لنموذج الفورم II من روبيسكو من R. rubrum (الشكل التوضيحي الإضافي 3a). تم استنساخ هذه المكتبة في بلازميد اختيار يحتوي على PRK، وتم ترميزها وتهيئتها لتصل إلى حوالي 500,000 مستعمرة. تم استخدام تسلسل القراءة الطويلة لتحديد الرموز الشريطية للمتحولات (الأشكال التوضيحية الإضافية 3b و4) وتبين أن المكتبة النهائية تحتوي على حوالي 180,000 رمز شريطي، تمثل 8,760 متحولًا أو أكثر من 99% من المكتبة المصممة (الشكل التوضيحي الإضافي 4). تم تحويل هذه المكتبة إلى rpi لتقييم لياقة الطفرات (الشكل 1c). تُعرّف لياقة الطفرات بمعدل النمو النسبي لـ
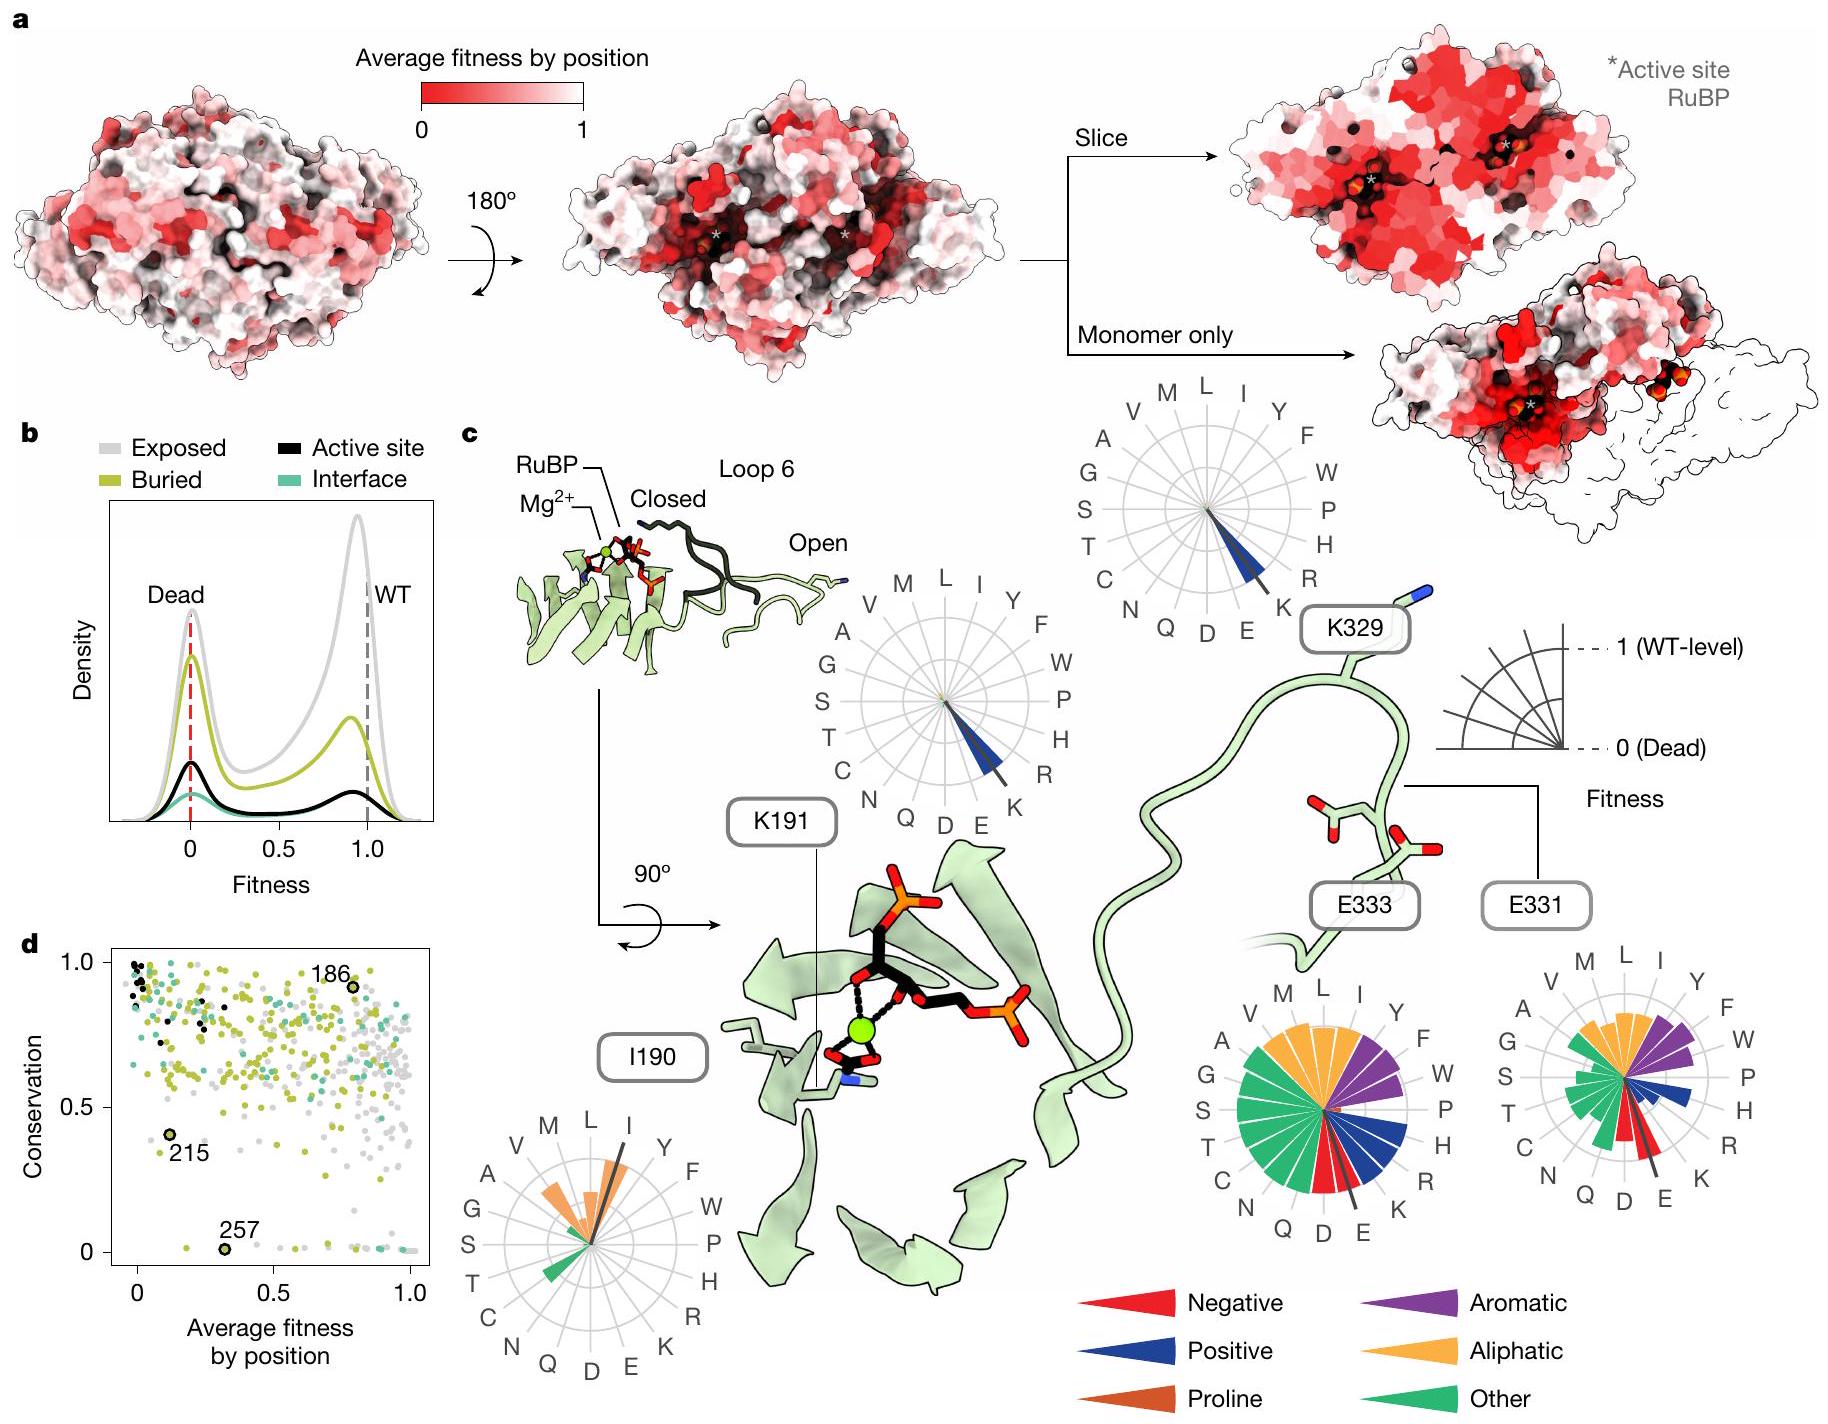
الشكل 2 | توفر قيم اللياقة رؤى هيكلية ووظيفية وتطورية حول الريبسكو. أ، هيكل الريبسكو الهوموديمر من R. rubrum (قاعدة بيانات البروتين (PDB) 9RUB) ملون بقيمة اللياقة المتوسطة لاستبدال في كل موقع. تشير النجوم إلى المواقع النشطة. ب، تأثيرات المتغيرات للأحماض الأمينية في أجزاء مختلفة من معقد الهوموديمر. ج، عرض مقرب للموقع النشط.
ومنطقة Loop 6 المتنقلة. تُظهر مخططات الرادار تأثيرات اللياقة لجميع الطفرات في موضع معين. د، مقارنة متوسط اللياقة في كل موضع مع الحفاظ على النسب بين جميع الروبيسكو. المواضع ملونة كما فيb. تشكل المواضع 215 و257 تفاعلًا ثلاثيًا (الشكل البياني الممتد 8c)، الموضع 186 محفوظ بشكل كبير دون وظيفة معروفة. التعبير عن ذلك الطافرة. تم زراعة ثلاثة تحويلات مكتبية مستقلة في ظروف انتقائية ونمت لمدة حوالي سبع انقسامات في (ما يعادل تقريبًا في المحلول؛ النوع البري ). كانت الاختيار بحضور تركيز IPTG الذي يكون فيه إنزيم الروبيسكو محددًا ويكون ضغط التعبير الزائد في أدنى مستوياته ولكن النمو يكون قويًا نسبيًا (الشكل 2b، d من البيانات الموسعة). تم قياس وفرة الشريط الشريطي قبل وبعد الاختيار باستخدام تسلسل القراءة القصيرة (الطرق). تم حساب لياقة الطفرات من خلال تطبيع البيانات قبل وبعد الاختيار.نسب عدد القراءة إلى مجموعة من الطفرات المعروفة بأنها غير نشطة تحفيزياً وجميع رموز النوع البري (الطرق). تم إجراء تسعة تجارب مكررة بمتوسط معامل بيرسون الثنائي 0.98 (الشكل 1d والشكل 5 من البيانات الموسعة).
قمنا بمقارنة قياسات لياقة الطفرات مع 77 قيمة لمعدل التحفيز مأخوذة من الأدبيات (الشكل 1e والبيانات التكميلية 1)، بالإضافة إلى 35 قياسًا في المختبر من الطفرات المنقاة (الشكل البياني الممتد 6a، b)، ولاحظنا علاقة خطية. بشكل عام، لاحظنا توزيعًا ثنائي القمة لتأثيرات الطفرات (الشكل 1f)، حيث تتجمع لياقات الطفرات بالقرب من النوع البري (الطفرات المحايدة) والمتغيرات الميتة تحفيزيًا..
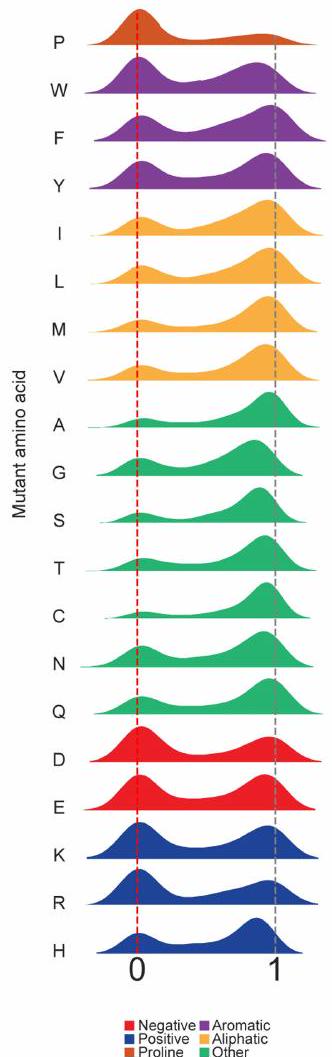
قمنا بقياس قيم اللياقة لأكثر منمن 8,835استبدالات الأحماض الأمينية (الشكل 1g والبيانات الموسعة الأشكال 4f و7b). أقل منمن الطفرات بدت أكثر ملاءمة من النوع البري (وعندما حدث ذلك كان بمقدار صغير (الشكل 1f)) و وُجد أنها ضارة. لم تُظهر التحليلات في المختبر لـ 11 نوعًا مع تحسين اللياقة البدنية زيادة في القيم (الشكل البياني الممتد 6b) تشير إلى أن تلك التأثيرات الصغيرة على اللياقة كانت مرتبطة على الأرجح بتعبير البروتين (الشكل البياني الممتد 2f-h). كانت الطفرات في مواقع النشطة المعروفة ذات لياقة منخفضة جداً (على سبيل المثال، K191 وK166 وK329؛ بقايا مع مثلثات رمادية في الشكل 1g، الأسفل)، وكانت الطفرات إلى البرولين أكثر ضرراً في المتوسط من أي حمض أميني آخر (الشكل البياني الممتد 7a). كانت الحفظ النشوء والتطور واللياقة المتوسطة في كل موقع تميل إلى التعاكس (الأشكال 1g (المسارات العلوية) و2d والشكل البياني الممتد 8a) بما يتماشى مع الدراسات السابقة.؛ ومع ذلك، بدا أن عدة مواقع كانت محفوظة بشكل كبير وقابلة للتغيير الطفري (الشكل 1g، مثلث أسود).
تباين اللياقة عبر الهيكل
أظهرت اختبارات اللياقة البدنية لدينا أن بعض مناطق هيكل الريبسكو هي أكثر حساسية للطفرات من غيرها (الشكل 2أ، ب).
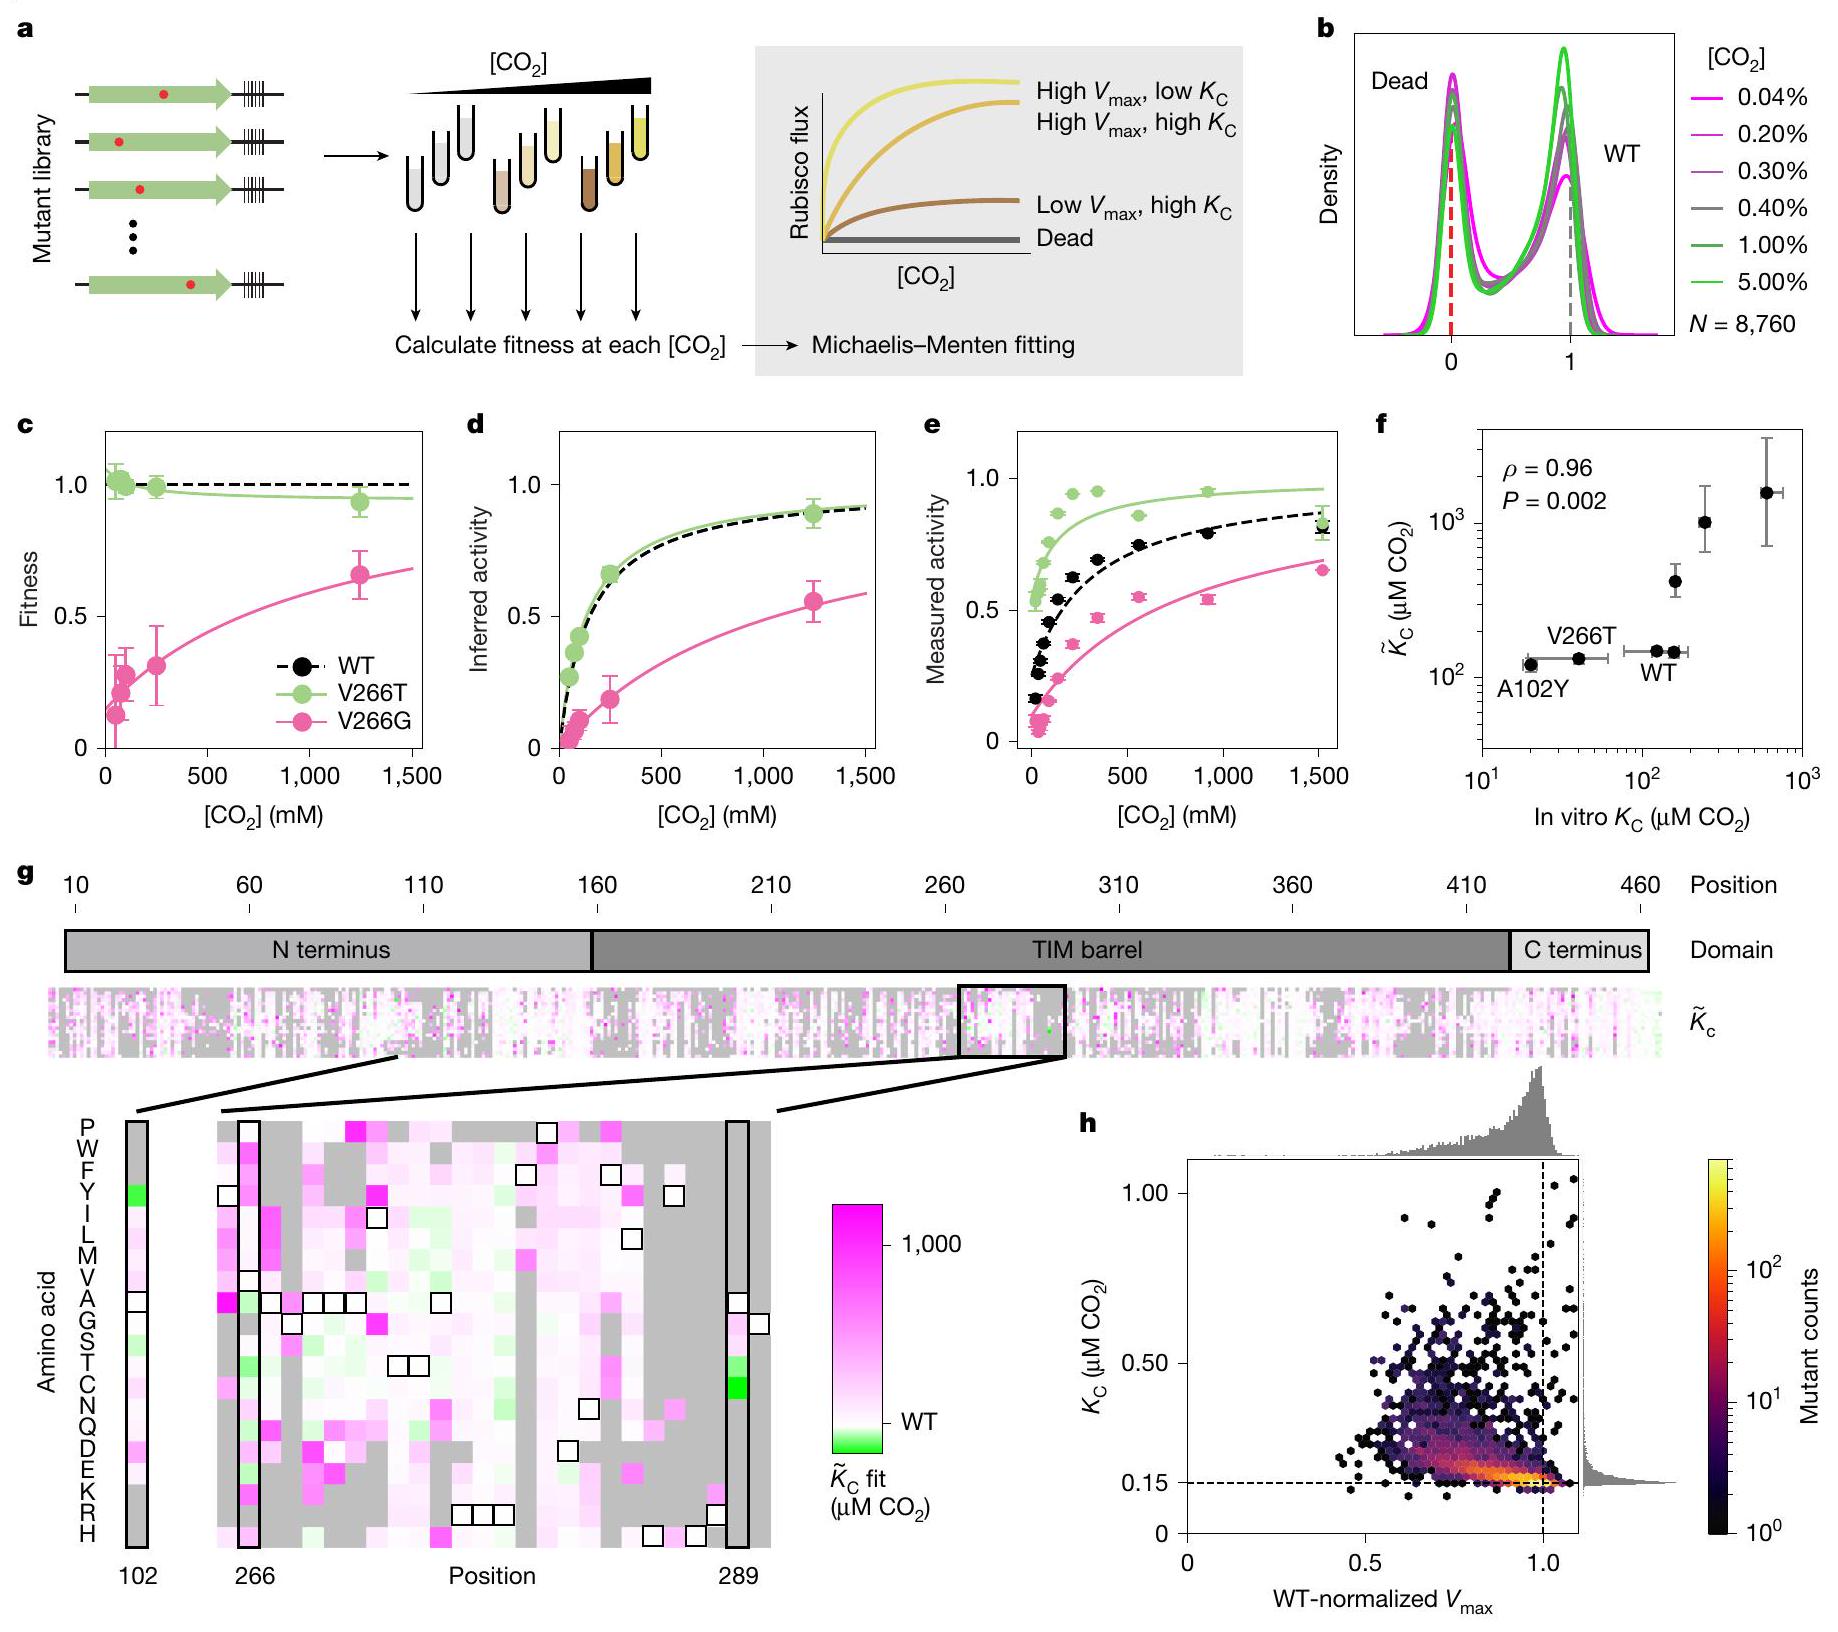
شكل. و يمكن استنتاجه من اللياقة عبرالمعايرة. رسم تخطيطي لاختيار الريبسكو في معايرة [CO2] وبعض أمثلة من منحنيات مايكلس-منتن المستنتجة للطفرات ذات المتغيرات و . ب، ملاءمات المتغيرات في مستويات مختلفة [ ]. ج، قياسات اللياقة البدنية في أوقات مختلفة [ ] لاثنين من الطفرات (أشرطة الخطأ، الانحراف المعياري للمتوسط لـالتكرارات البيولوجية). د، نفس البيانات كما في ج تم رسمها تحت افتراضات معادلة ميكاليز-مينتن (أشرطة الخطأ، الانحراف المعياري للمتوسط لـالتكرارات البيولوجية). هـ، قياسات كينتيك ربيسكو المنفردة لنفس الطافرين من ج ود (النقاط، الوسائط منالقياسات؛ أشرطة الخطأ، الانحراف المعياري). ف، مقارنة بين الريبسكوالقيم المقاسة في المختبر (اختبار الطيف الضوئي) وتلك مستنتج من قيم اللياقةيتم حسابه من ارتباط سبيرمان؛تعكس القيمة نتيجة تحليل اختبار التباديل ذو الجانبين.أشرطة الخطأ، الربع الداخلي للتناسبات المعاد تشكيلها (الطرق)؛ في المختبرأشرطة الخطأ، الانحراف المعياري منالقياسات.ج، خريطة حرارية لـقيم جميع الطفرات التي يكون فيها معامل التباين أقل منالمتحولونمن الإجمالي). تم تسليط الضوء على موضعين مع طفرات ذات تقارب عالٍ في الإطار الموسع أدناه. المتغيرات التي لها الملاءمات التي كانت لها معامل تباين فوق 1 باللون الرمادي. h، هيستوغرام ثنائي الأبعاد للطفرات و قيم منمع صناديق سداسية. خطوط منقطة، قيم WT.
على سبيل المثال، فإن البقايا الموجودة على الوجوه المعرضة للمذيب في التركيب تكون أكثر تسامحًا مع الطفرات، كما هو متوقع، في حين أن بقايا الموقع النشط والمخفية عادةً لا تتحمل الطفرات بشكل جيد. منطقة ملحوظة من الاهتمام هي الحلقة 6 من برميل الإيزوميراز ثلاثي الفوسفات، والتي من المعروف أنها تطوى فوق الموقع النشط أثناء ارتباط الركيزة وتشارك في التحفيز (الشكل 2c (الإطار) والشكل الممتد 1 (اللوحة اليمنى)). على الرغم من هذا الدور الرئيسي في التحفيز، فإن بعض البقايا في هذه الحلقة تتحمل الطفرات بشكل كبير (على سبيل المثال، E331 و E333)، على الرغم من أن بقايا الموقع النشط K329 حساسة للغاية (الشكل 2c).
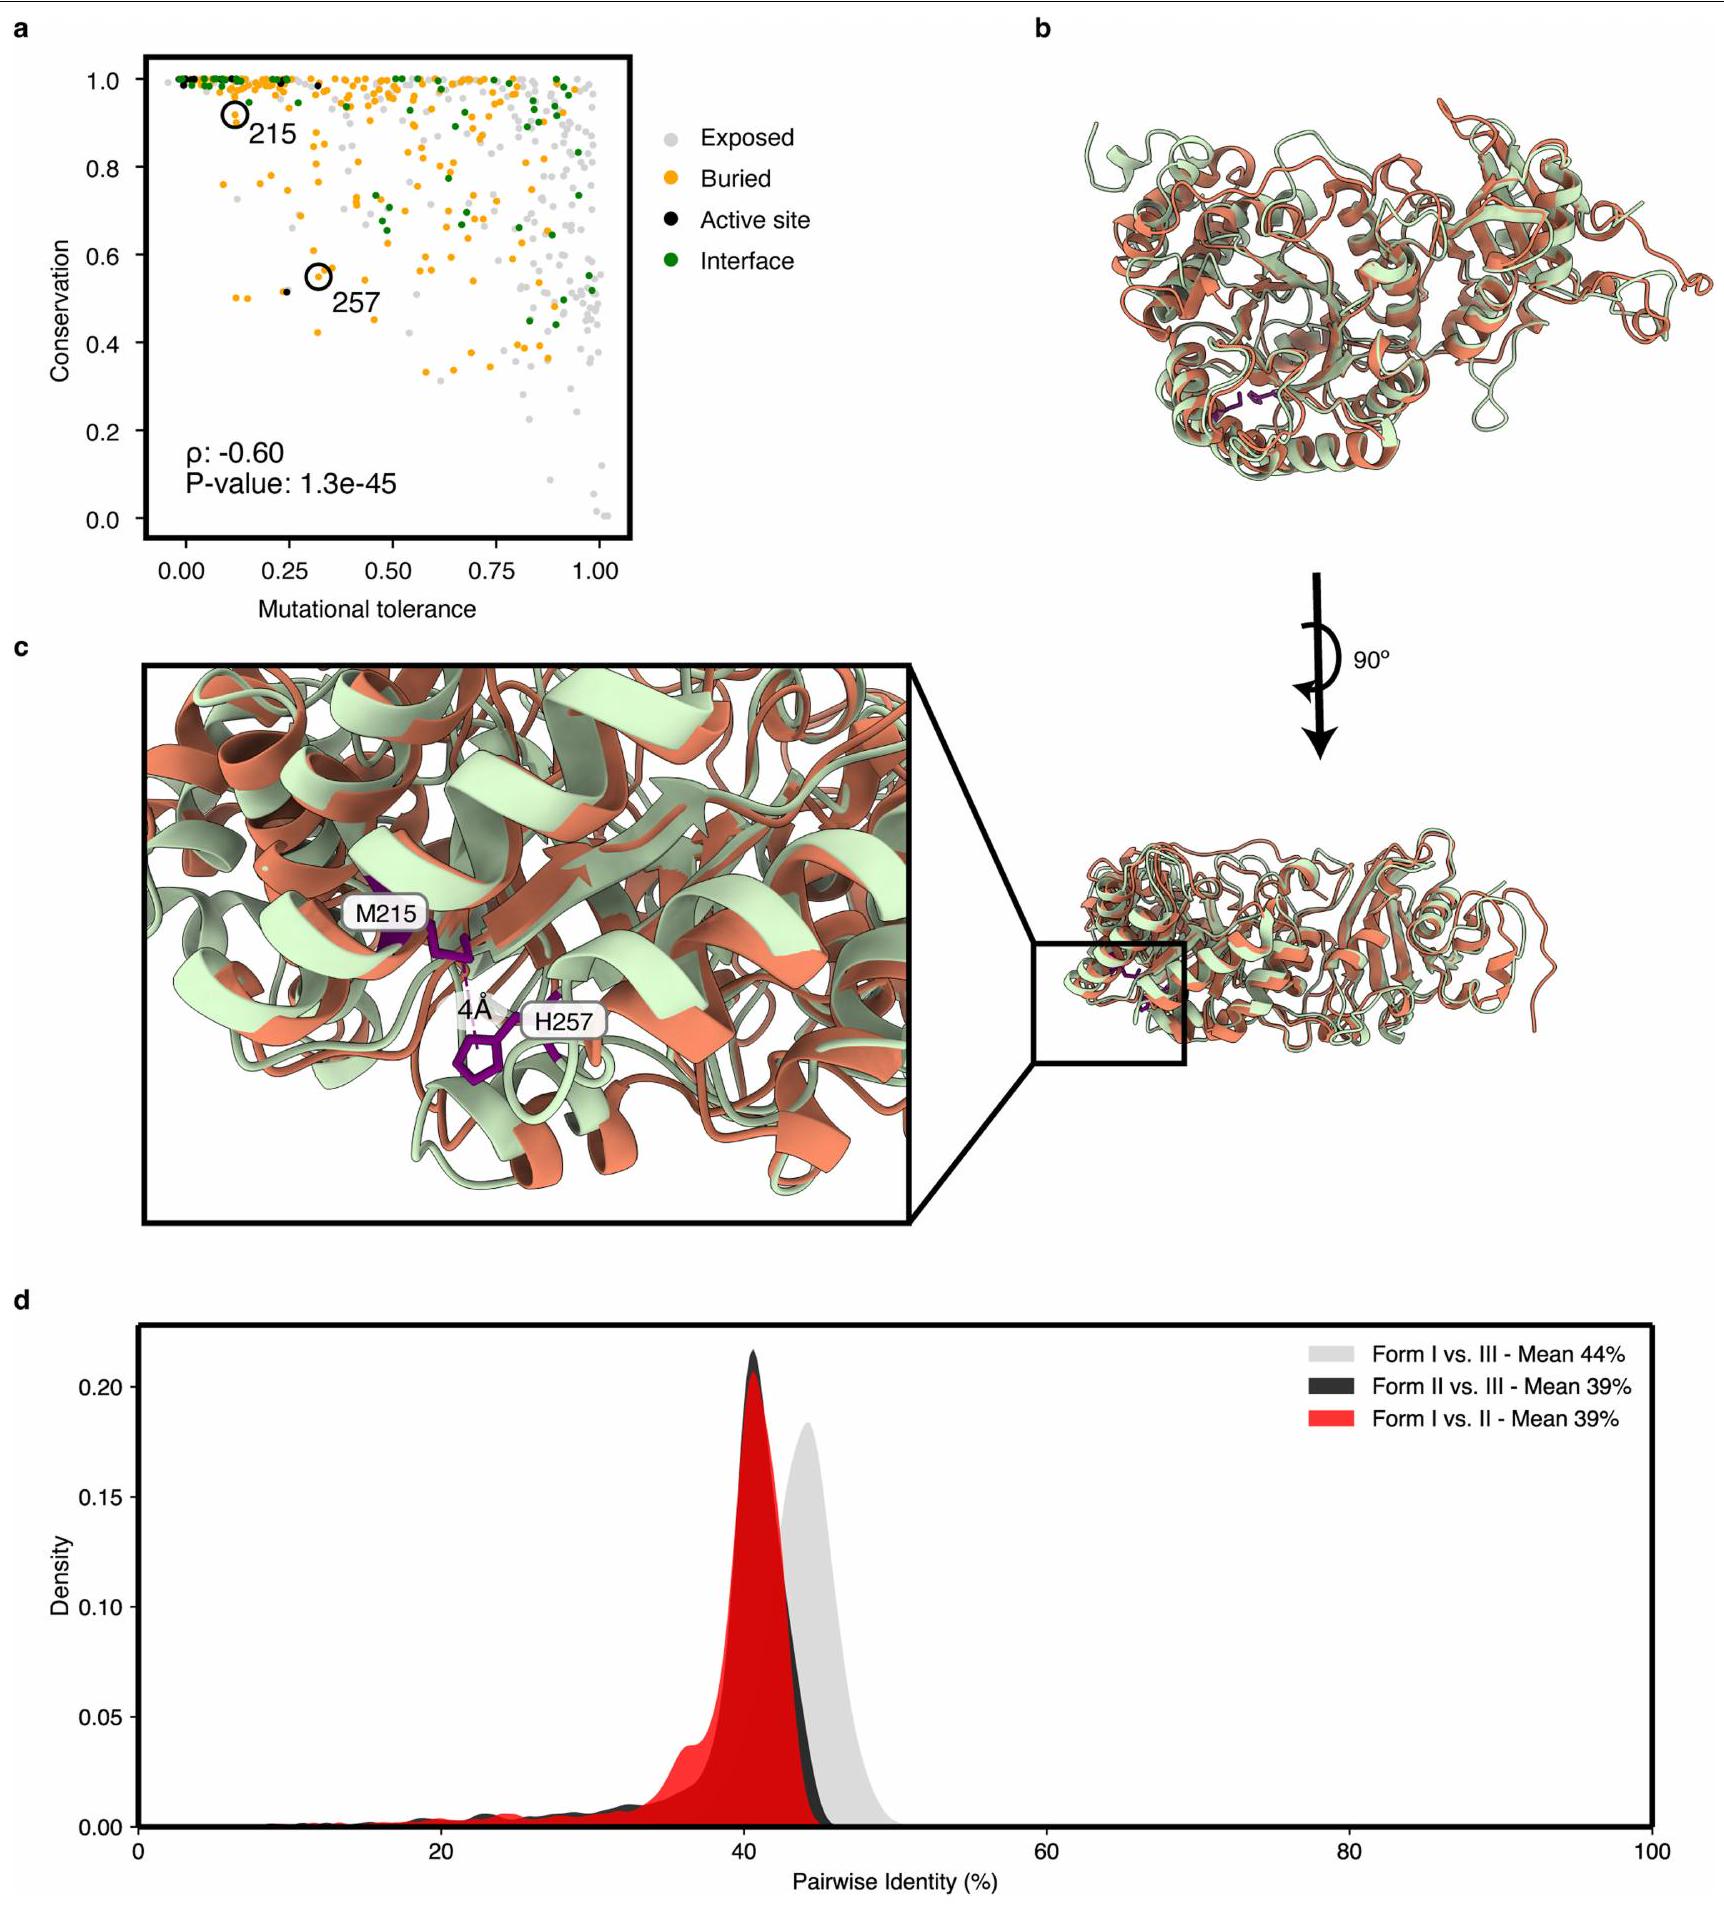
كنا نتوقع أن المواقع المحفوظة لن تتحمل الطفرات بشكل جيد. ووفقًا لهذه الفرضية الشائعة، كانت قيمة اللياقة المتوسطة عند كل موقع مرتبطة سلبًا بالحفاظ على التسلسل (الشكل 2د والشكل التمديدي 8أ). ومع ذلك، كان هناك العديد من القيم الشاذة، حيث كانت بعض المواقع محفوظة بشكل كبير لكنها تظهر تحملًا عاليًا للطفرات (على سبيل المثال، G186 (الشكل 2د، الزاوية العليا اليمنى)). قد تكشف الاختيارات في ظروف بديلة عن القوى الانتقائية التي حافظت على الحفاظ العالي في تلك المواقع.قد تشير المواقع ذات الحفظ المنخفض والتحمل الطفري المنخفض إلى وظيفة حيوية حديثة التطور.; على سبيل المثال، M215 و H257
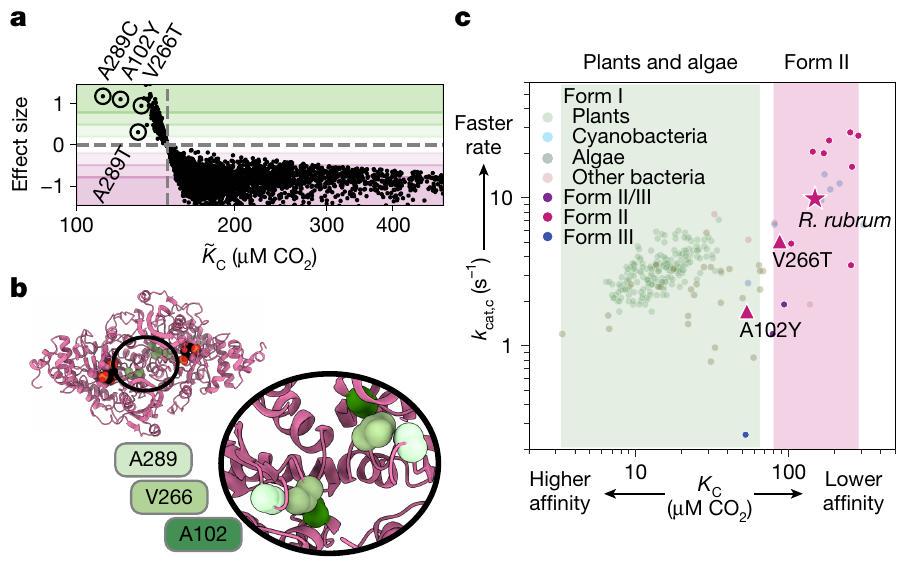
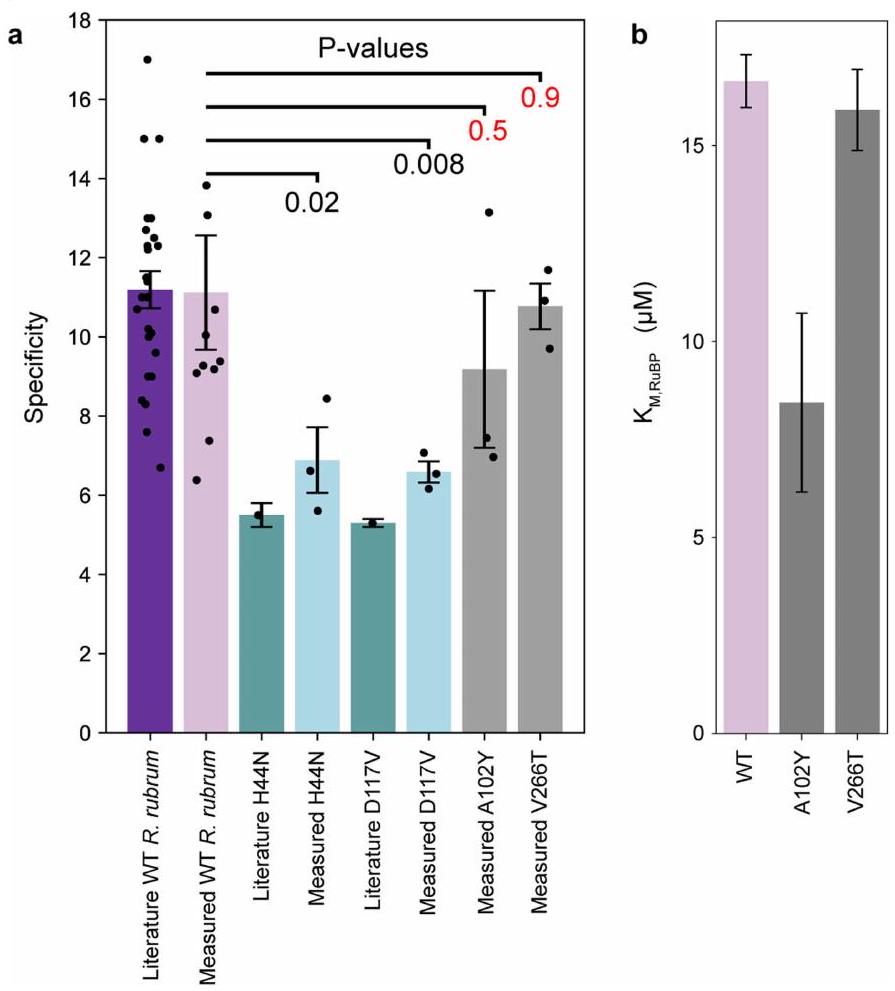
الشكل 4 | يمكن للطفرات الأحادية الأحماض الأمينية عبور المشهد الوظيفي. أ مقابل حجم التأثير لكل طافرة. حجم التأثير هو الفرق بين الطافرة و WT مقسومًا على معامل التباين لـ. ب، هيكل PDB 9RUB؛ إدراج على محور التماثل موسع أدناه. كل موضع يظهر مرتين بسبب القرب منمحور. ضد من الطفرات المحددة (كما تم قياسه بواسطةالتحليل) مقابل جميع إنزيمات الريبوسوكوز (rubiscos) المقاسة من المراجع 6، 12). المناطق المظللة تشير إلى النطاقات المعروفة لـقيم للنباتات والطحالب باللون الأخضر وبروتينات الروبيسكو البكتيرية من النوع الثاني باللون الوردي. النجمة، WT R. rubrum؛ مثلثات، الطفرات A102Y و V266T.
(الشكل 2d) تتلامس في هيكل R. rubrum لكنها غائبة في تسلسلات الشكل I (البيانات الموسعة الشكل 8a-c).
الترابط المستنتج من تيتراشن الركيزة
تحدد لياقة الإنزيم بواسطة المعلمات البيوكيميائية الأساسية، بما في ذلك معدلات التحفيز والألفة. لقياس هذه المعلمات بشكل فردي، قمنا بإجراء تيتراشن للركيزة على المكتبة الكاملة من الطفرات بشكل متزامن (الشكل 3أ). كانت قيم لياقة الطفرات تتفاوت بشكل عام مع زيادة (الشكل 3ب) وتأثرت لياقة بعض الطفرات بشكل كبير (الشكل 3ج). قمنا بتناسب البيانات مع نموذج ميكاليز-مينتن للتحفيز لتقدير معدلات الحد الأقصى الفعالة ( ) و ثوابت نصف التشبع (تُميز التيلدات بين معلمات الملاءمة المستمدة من المكتبة وتلك المقاسة في المختبر). هذه الملاءمة (الشكل 3d؛ الطرق) أنتجت و تقديرات لكل طفره (الشكل 3g والشكل الإضافي 8c، d). قمنا بتقييم موثوقية التقديرات من خلال معامل التباين (الانحراف المعياري على المتوسط؛ ) من 1,100 ملاءمة bootstrap للبيانات لكل طفرة (الطرق)؛ نركز هنا على المتحولينالتي كان لديها معامل تباين أقل من 1 (المرجع 26). الـ 35% المتبقية هي في الغالب طفرات ذات قيم لياقة منخفضة (الشكل 6e من البيانات الموسعة) التي قد تفشل في الطي تمامًا، على الرغم من أنه عند مستويات تعبير أعلى أو بالاشتراك مع طفرات أخرى قد يكون من الممكن بعد ذلك إنتاج تقديرات موثوقة لتأثيراتها على المعدل والألفة.
قمنا بالتحقق منتقديرات من خلال تنقية مجموعة من سبعة طفرات مختارة لتغطية نطاق من التوقعاتالقيم وقياسهاالتآلفات في المختبر (الشكل 3e، f). بشكل غير متوقع، بالنسبة لعدة طفرات، الالقيم المقاسة في المختبر كانت أقل بكثير (أعلى في الألفة) مما كان متوقعًا من تقديراتنا السابقة بناءً على بيانات اللياقة. على سبيل المثال،من V266T كان حوالي، لكن تم تحديده تقريبًا” (الشكل 3f,g؛ المربع المميز). برزت أربع طفرات في تحليلنا لكونها ذات ” منخفضة بشكل خاص.V266T، A289C و A289T (الشكل 4أ).
تقديراتنا لـمرتبط باللياقة البدنية; الشكل التوضيحي الممتد 6h)، مما يشير إلى أنه المحرك الرئيسي لتدفق الريبسكو. ومع ذلك، [روبيسكو] لذا فإن التباين في يمكن أن يكون له سببان محتملان: مستوى تعبير الريبسكوتقديرات تشير إلى ناتج هذين العاملين.
وجدنا أيضًا أن و تقديرات تتعارض عكسيًا للمتغيرات ذات الديناميات القريبة من النوع البري حيث تكون التقديرات في أقصى حد موثوق (الشكل 3h). تشير هذه العلاقة إلى أنه، في غياب الضغط الانتقائي، فإن معظم الطفرات الأحادية للأحماض الأمينية تضعفتآلفبالتزامن. من المهم أن نلاحظ أنه، منذيُعتقد أن خطوة الإضافة في التحفيز لا رجعة فيهاولا يوجد موقع ارتباط لـفي الإنزيمجميع التفضيلات المقاسة تعكسعلى المعدلات. العلاقة السلبية الملحوظة بين و قد تكون مرتبطة بالتغيرات الدقيقة في الإلكترونيات لموقع النشاط أو هندسة الركيزة السكرية المرتبطة قبل أو أثناء تشكيل الرابطة معمن الممكن أيضًا أن تكون هذه التأثيرات ناتجة عن تغييرات في استقرار الإنزيم.
أدت الطفرات في ثلاث مواقع (A289C، A102Y، V266T، A289T) إلى تحسينات قوية فيالألفة في الجسم الحي (الأشكال 3 ج و 4 أ). الطفرات الأخرى في هذه المواقع نفسها قللت من الألفة (على سبيل المثال، V266G و A102F و A289G؛ الشكل 3 ج-ز). هذه المواقع الثلاثة ليست جزءًا من الموقع النشط وتقع بالقرب منمحور واجهة الهوموديمر للروبيسكو (الشكل 4ب). في هذه المنطقة من التركيب، تكون البقايا في أقرب قرب من ‘أنفسها’، أي من نظيرها في المونومر الآخر من الهوموديمر. الدور الذي تلعبه هذه الأحماض الأمينية فيدخول الموقع النشط، أو تشكيل الموقع النشط أو الكهروستاتيكية لا يزال غير واضح.
أكدت القياسات في المختبر أن V266T و A102Y تمتلكان تحسيناتالتشابهات (لم نتمكن من تنقية A 289 C). هذه المراسلة بينمقاسة في الجسم الحي والمقاسة في المختبر تتناقض مع الطفرات التي، حيث لم تُظهر المتابعات الكيميائية الحيوية (الشكل 8b من البيانات الموسعة وملف البيانات التكميلية 1) سرعة أكبرقيم. المتغيرات المحسّنة ربما تم تحسينها من خلال زيادة تعبير البروتين. على عكس معامل الألفة مستقل عن تركيز الإنزيم لذامن المتوقع أن تكون التنبؤات أكثر دقة. يظهر كل من V266T و A102Y تقليصات تقريبًا متناسبة في معدل التحفيز (الشكل 4c، الشكل الإضافي 9c والجدول الإضافي 2). لم يكن لهذه الطفرات أي تأثير على ضد الخصوصية (الشكل 9 أ، ج من البيانات الموسعة والجدول 2 من البيانات الموسعة) تشير إلى أن ‘تكلفة’ تحسين الألفة تُدفع فقط في معدل التحفيز. كان A102Y لديه انخفاض فيبينما لم يتغير نوع V266T عن النوع البري. من غير الواضح ما العلاقة، إن وجدت، في التغيرات في و . بشكل عام، الـ و تضع القياسات هذه الطفرات خارج النطاق الذي تم قياسه حتى الآن بين متغيرات البكتيريا من النوع الثاني وعند حافة توزيع النباتات والطحالب.
الخاتمة
من بين النطاق الضيق من التسلسلات التي تم قياسها هنا، كان من الممكن تحديد الطفرات التي أظهرت تحسينات كبيرة.التقارب، مما يشير إلى أن مشهد معلمات الإنزيم وعرة، مع إمكانية الوصول بسهولة إلى مكاسب الوظيفة الظاهرة. عادةً ما تشترك إنزيمات الروبيسكو من النوع الأول في النباتات في أقل منتتطابق مع ربيزوكوزات البكتيريا من الشكل الثاني (أكثر من 200 طفرة؛ الشكل التمديدي 8d) ويُعتقد أنها تطورت تحت مجموعة مختلفة من الضغوط الانتقائية. علاوة على ذلك، فإن ربيزوكوزات الشكلين الأول والثاني لها حالات أوليغومرية مختلفة، وتفتقر ربيزوكوزات الشكل الثاني إلى الوحدة الفرعية الصغيرة المميزة للشكل الأول، لذا من المدهش أنه من الممكن عبور الفضاء الوظيفي بينهما بتغيير واحد فقط في الأحماض الأمينية.
في هذه الدراسة، لم نتمكن من حساب عاملين من تدفق الأيض عبر روبيسكو: تعبير البروتين والتفاعل الجانبي مع الأكسجين. ارتباط اللياقة مع المعروفينتشير القيم (الشكل 1e والشكل 6a من البيانات الموسعة) وقياساتنا في المختبر (الشكل 6b من البيانات الموسعة) إلى أن البيانات قابلة للتنبؤ، حتى بدون معرفة التعبير. ومع ذلك، فإن الطفرات مثل I164T تسبب اختلافات في تعبير البروتين كدالة لتحفيز IPTG (الشكل 2f,h من البيانات الموسعة) مما يؤثر على معدل النمو النسبي مقارنة بالنمط البري (الشكل 2g من البيانات الموسعة). في الواقع، عندما قمنا بفحص الطفرات ذات قيم اللياقة البدنية الأعلى من تلك الخاصة بالنمط البري، لاحظنا تراجعًا متسقًا فيالمعدلات المقاسة في المختبر (الشكل 6b من البيانات الموسعة، الإطار). نحن نفسر هذا الاتجاه على أنه يشير إلى أن بعض النسب من الطفرات لها تأثير صغير أو لا تأثير علىبينما يتحسن بشكل متواضع مستويات التعبير. هناك حاجة إلى مزيد من العمل لقياس هذا التأثير وأخذه في الاعتبارتفاعل الجانب من الريبسكو مهم أيضًا، حيث إن زيادة تركيز الأكسجين منإلىأسبابمن المتوقع أن ينخفض معدل النمو والعائد (الشكل 2e من البيانات الموسعة) بسبب إنتاج 2-فوسفوغليكولات. يمكن تحديد تأثير الأكسجين على الطفرات الفردية من خلال تيتراشن الأكسجين واختيار المكتبة.
في R. rubrum، تطورت التسلسل الحالي تحت قيود تشمل التنظيم الداخلي، والضغط الانتقائي البيئي، والاحتمالات الممكنة للتجارة بين المعلمات الإنزيمية. تم اقتراح مجموعة متنوعة من التجارة في الآلية الحفازة للروبسكو.، بما في ذلك واحد بين معدل التحفيز وتوافقالخفض في (لكن ليس ) لوحظت في الطفرات ذات أعلى التوافق يتماشى مع مثل هذا التبادل (الشكل 4c). يمكن أن تؤكد أو ترفض اختيار مكتبة من الطفرات ذات الترتيب الأعلى التي تغطي نطاقًا أوسع من الإمكانيات الوظيفية للروبيسكو. قد تقيد التبادلات في الروبيسكوزات البكتيرية أيضًا تطور الروبيسكوزات النباتية. ومع ذلك، وجدت الأعمال السابقة التي تقارن خريطة التسلسل إلى الوظيفة للبروتينات ذات الصلة اعتمادًا كبيرًا على السياق في تأثيرات الطفرات.نظرًا للتقدم في التعبير عن إنزيم الروبيسكو النباتي في الإشريكية القولونيةقد يكون من الممكن استخدام هذا الاختبار لفهم القيود البيوكيميائية للكائنات المسؤولة عن nearly جميع عمليات التمثيل الضوئي على اليابسة..
لا يزال الفضاء العام للروبيسكوس غير مستكشف إلى حد كبير، مما يثير تساؤلاً حول ما إذا كانت التطورات الطبيعية قد أنتجت بالفعل روبيسكوس محسّنة لكل بيئة. قد يسمح أربي باستكشاف أعلى لمعدل تدفق الفضاء التسلسلي للعثور على مناطق مقيدة بتجارة مختلفة وإنتاج تحسينات هندسية كبيرة.
المحتوى عبر الإنترنت
أي طرق، مراجع إضافية، ملخصات تقارير Nature Portfolio، بيانات المصدر، بيانات موسعة، معلومات إضافية، شكر وتقدير، معلومات مراجعة الأقران؛ تفاصيل مساهمات المؤلفين والمصالح المتنافسة؛ وبيانات توفر البيانات والرموز متاحة علىhttps://doi.org/10.1038/s41586-024-08455-0.
بار-أون، ي. م. وميليو، ر. الكتلة العالمية ومتوسط معدل الريبسكو. وقائع الأكاديمية الوطنية للعلوم في الولايات المتحدة الأمريكية 116، 4738-4743 (2019).
بار-إيفن، أ. وآخرون. الإنزيم الفعال بشكل معتدل: الاتجاهات التطورية والفيزيائية الكيميائية التي تشكل معايير الإنزيم. الكيمياء الحيوية 50، 4402-4410 (2011).
بوفير، ج. و.، إيمس، د. م. وكيللي، س. روبيسكو يتطور من أجل تحسين الكفاءة التحفيزية والتمثيل الضوئي في النباتات. وقائع الأكاديمية الوطنية للعلوم في الولايات المتحدة الأمريكية 121، e2321050121 (2024).
باتيلييه، سي.، تشيركز، جي.، لوريمر، جي. إتش. وفاركوار، جي. دي. روبسكو ليس سيئًا حقًا. بيئة خلايا النبات 41، 705-716 (2018).
بريويس، ن.، فيليبس، ن. ر.، توك، أ. ت.، فالنتين-ألفارادو، ل. إ. وسافاج، د. ف. وظيفة روبسكو، تطورها، والهندسة. مراجعة سنوية لعلم الأحياء الكيميائية 92، 385-410 (2023).
دافيدي، د. وآخرون. تم اكتشاف ربيسكو نشط للغاية من خلال استجواب منهجي لتنوع التسلسل الطبيعي. مجلة EMBO. 39، e104081 (2020).
فلامهولز، أ. آي. وآخرون. إعادة تكوين وظيفي لبكتيرياآلية التركيز في الإشريكية القولونية. eLife 9، e59882 (2020).
بار-أون، ي. م.، فيليبس، ر. وميليو، ر. توزيع الكتلة الحيوية على الأرض. وقائع الأكاديمية الوطنية للعلوم في الولايات المتحدة الأمريكية 115، 6506-6511 (2018).
وو، أ. وآخرون. تحليل عبر المقاييس لفهم وقياس تأثير تعزيز التمثيل الضوئي على نمو المحاصيل وإنتاجيتها عبر البيئات. مجلة خلايا النبات والبيئة. 46، 23-44 (2023).
تشيركز، ج. ج. ب.، فاركوهار، ج. د. وأندروز، ت. ج. على الرغم من التحفيز البطيء والتخصص الغامض للركيزة، قد تكون جميع إنزيمات كربوكسيلاز ريبولوز ثنائي الفوسفات مُحسّنة بشكل شبه مثالي. وقائع الأكاديمية الوطنية للعلوم في الولايات المتحدة الأمريكية 103، 7246-7251 (2006).
سافير، ي.، نور، إ.، ميلو، ر. وتلستي، ت. تحليل عبر الأنواع يتتبع تكيف روبسكو نحو الأمثلية في منظر منخفض الأبعاد. وقائع الأكاديمية الوطنية للعلوم في الولايات المتحدة الأمريكية 107، 3475-3480 (2010).
فلامهولز، أ. آي. وآخرون. إعادة النظر في التبادلات بين معلمات كينتيك روبسكو. الكيمياء الحيوية 58، 3365-3376 (2019).
إينيغيز، سي. وآخرون. الاتجاهات التطورية في حركيات روبيسكو وتطورها المشترك معآليات التركيز. مجلة النبات. 101، 897-918 (2020).
ويلسون، ر. هـ.، ألونسو، هـ. وويتني، س. م. تطوير إنزيم روبيسكو من الأركيا ميثانوكوكويدس بورتوني لتحسين عملية التمثيل الضوئي ونمو النباتات. تقارير العلوم 6، 22284 (2016).
ويلسون، ر. هـ.، مارتن-أفيلا، إ.، كونلان، ج. وويتني، س. م. شاشة محسّنة للإشريكية القولونية لتحديد بروتين ربيسكو تكشف عن واجهة بروتين-بروتين يمكن أن تعزز من كينتيكيات تثبيت ثاني أكسيد الكربون. ج. كيمياء حيوية. 293، 18-27 (2018).
فور، أ. ج. وآخرون. رسم خرائط المناظر الطاقية والألوستيرية لمجالات ارتباط البروتين. ناتشر 604، 175-183 (2022).
دينغ، د. وآخرون. تصميم البروتين باستخدام تفضيلات البقايا المستندة إلى الهيكل. نات. كوميونيك. 15، 1639 (2024).
تومسون، س.، زانغ، ي.، إنجل، س.، رينولدز، ك. أ. وكورتيمي، ت. تغيير تعبير بروتياز مراقبة الجودة في الإشريكية القولونية يعيد تشكيل المشهد الطفري داخل الكائن الحي لإنزيم نموذجي. eLife 9، e53476 (2020).
ستيفلر، م. أ.، هيكسترا، د. ر. ورانجاناثان، ر. القابلية للتطور كوظيفة للاختيار المنقي في إنزيم β-لاكتاماز TEM-1. خلية 160، 882-892 (2015).
راس، و. ب. وآخرون. نموذج قائم على التطور لتصميم إنزيمات الكوريسمات ميوتيز. ساينس 369، 440-445 (2020).
ماركين، سي. جي. وآخرون. كشف الهيكل الوظيفي للإنزيمات من خلال كينيات الإنزيمات الدقيقة عالية الإنتاجية. ساينس 373، eabf8761 (2021).
بارك، م. ر.، غرين، د. ن.، وودز، ك. ك. وماتسومورا، إ. التطور الموجه لفرط أشكال RuBisCO من خلال الاختيار الجيني في الإشريكية القولونية المهندسة. تصميم هندسة البروتين واختيارها 19، 113-119 (2006).
مولر-كاجار، أ.، موريل، م. وويتني، س. م. التطور الموجه للروبيسكو في الإشريكية القولونية يكشف عن رابطة هيدروجينية تحدد الخصوصية في إنزيم الشكل الثاني. الكيمياء الحيوية 46، 14067-14074 (2007).
جونز، إي. م. وآخرون. الوصف الهيكلي والوظيفي لمستقبلات البروتين G المرتبطة بالمسار مع الفحص الطفري العميق. eLife 9، e54895 (2020).
سبرا مانين، س. وآخرون. يعتمد التواصل الألوستيري في محملات مشبك بوليميراز الحمض النووي على تقاطع حيوي مرتبط برابطة هيدروجينية. eLife 10، e66181 (2021).
مافور، د. وآخرون. توسيع الاضطرابات الكيميائية في مشهد لياقة اليوبكويتين في بيئة صفية يكشف عن قيود جديدة على تحمل التسلسل. بيولوجيا. مفتوح 7، bio036103 (2018).
دوغلاس-غالاردو، أ. أ.، موريّلو-لوبيز، ج. أ.، أولر، ج.، ملهلاند، أ. ج. وفورينجر-مارتينيز، إ. تثبيت ثاني أكسيد الكربون في RuBisCO يعتمد على حالة البروتون وغير قابل للعكس. ACS Catal. 12، 9418-9429 (2022).
غوتريدج، س.، باري، م. أ. ج.، شميت، س. ن. ج. وفيني، ج. تحقيق في نشاط كربوكسيلاز ريبولوز ثنائي الفوسفات بواسطة دقة عاليةن.م.ر. فيبس ليت. 170، 355-359 (1984).
أينجر، هـ. وآخرون. تجميع إنزيم روبيسكو في الإشريكية القولونية مع خمسة بروتينات مساعدة من البلاستيدات الخضراء بما في ذلك BSD2. ساينس 358، 1272-1278 (2017).
ملاحظة الناشر: تظل شركة سبرينغر ناتشر محايدة فيما يتعلق بالمطالبات القضائية في الخرائط المنشورة والانتماءات المؤسسية.
قمنا بعملية الاستنساخ في مجموعة من خلايا E. coli TOP10، DH5و خلايا NEB Turbo. تم إجراء تعبير البروتين باستخدام BL21(DE3). تم إنتاج Arpi سابقًامن سلالة BW25113. تم الحصول على طفرات rpiB من مجموعة كيو. تم حذف الجينين rpiA و edd من خلال نقل P1 والتخلص اللاحق من علامة الكاناميسين باستخدام pCP20 (المرجع 32). نتيجة هذه الطفرات الثلاثة،، كان حذف EDD يجعل السلالة تعتمد على الروبيسكو عند زراعتها على الجلوكونات – وهي ميزة لم نستخدمها في هذه الدراسة.
البلسميدات
يمكن العثور على التسلسلات والتفاصيل الإضافية حول البلازميدات المستخدمة في هذه الدراسة في البيانات التكميلية 3. pUC19_rbcL. تم تجميع مكتبة الطفرات الخاصة بالروبيسكو في ناقل pUC19 القياسي. تم استخدام هذه البلازميد كقالب PCR لكل من مواقع الربط الفرعية الـ 11.
NP-11-64-1. تم إجراء الاختيارات باستخدام بلازميد مصمم لهذه الدراسة مع أصل p15، ومقاومة للكلورامفينيكول، وLacI الذي يتحكم في تعبير الريبسكو، وTetR الذي يتحكم في تعبير PRK وباركود.
NP-11-63. تم إجراء التعبير المفرط للبروتين في خلايا BL21(DE3) باستخدام pET28 مع مجال SUMO upstream من الجين المعبر عنه.. pSF1389 هو البلازميد الذي يعبر عن SUMOlase الضرورية، bdSENP1، من Brachypodium distachyon.
البادئات
تم شراء جميع البرايمرات من IDT وتم شراء مجموعة الأوليغونوكليوتيدات من Twist Bioscience. لمزيد من التسلسلات، انظر البيانات التكميلية 3.
تصميم وبناء المكتبات
تم تحسين تسلسل ريبسكو R. rubrum ليكون مناسبًا لبكتيريا E. coli وتمت إحداث طفرات بشكل منهجي وفقًا للمخطط الموضح في الشكل 3 من البيانات الموسعة. تم تقسيم جين ريبسكو إلى 11 قطعة. لكل من هذه القطع (حوالي 200 قاعدة نيتروجينية لكل منها) تم تصميم وتخليق جميع الطفرات النقطية كأحواض أوليغونيوكليوتيد. تم شراء 11 حوض فرعي من أوليغو، تحتوي على جميع الطفرات الفردية ضمن منطقتها المعنية التي تبلغ حوالي 200 قاعدة نيتروجينية، من شركة Twist Bioscience وتم تضخيم كل حوض فرعي بشكل فردي باستخدام بوليميراز Kapa Hifi مع عدد دورات يبلغ 15. تم إدخال كل قطعة من جين ريبسكو في متجه وجهة خطي pUC19 المقابل، الذي يحتوي على بقية تسلسل ريبسكو المحيط بالإدخال، من خلال تجميع بوابة الذهب. أنتج هذا التجميع 11 حوضًا فرعيًا من الطول الكامل.جين روبيسكو من نوع روبريم، حيث يحتوي كل مكتبة فرعية على منطقة تبلغ حوالي 200 قاعدة تتضمن جميع الطفرات الفردية. تم تحويل كل من هذه المكتبات الـ 11 من روبيسكو بشكل منفصل إلى خلايا E. coli TOP10، وفي كل حالة، تم جمع أكثر من 10,000 متحول من صفائح الأجار لضمان أخذ عينات زائدة من حوالي 1,000 متغير في كل مكتبة فرعية. تم تنقية البلازميدات من كل مكتبة فرعية وخلطها معًا بنسب مولارية متساوية لإنشاء مكتبة تسلسل البروتين الكاملة.
لإنتاج المكتبة النهائية للاختبار، تم تضخيم بلازميد اختيار يحتوي على نظام تحفيز لروبيسكو وPRK (قابل للتحفيز بواسطة Tac وTet، على التوالي) باستخدام بادئات تتضمن شريط باركود عشوائي مكون من 30 نيوكليوتيد. تم قطع الأمبليكون البلازميدي المستقيم والمكتبة باستخدام Bsal وBsmBI، على التوالي، وتم ربطهما معًا وتحويلهما إلى خلايا TOP10. تم تنقية البلازميد عن طريق كشط حوالي 500,000 مستعمرة وتحويله ثلاث مرات إلى خلايا Δrpi. تم زراعة هذه التحويلات فيوسط مستخلص الخميرة تريبتون إلى مرحلة النمو (الكثافة الضوئية ) ومجمد كـ خزانات الجليسرول.
تحليل نمو البكتيريا
تم زراعة سلالات البكتيريا طوال الليل فيوسط مستخلص الخميرة التربتوني إلى التشبع ثم تم تخفيفه. بمجرد أن وصلت الثقافات إلى النمو الأسي (تم تخفيفهم إلىوسائط M9 في أطباق 96 بئر معالكلورامفينيكول والتركيزات المحددة من الأنهيدروتتراسيكلين و IPTG إلى نهائي0.005 أو 0.0005. تم مراقبة النمو في جهاز قراءة الألواح Spark (تيكان) مع الحفاظ علىوالمشار إليه و التركيزات. كانت عملية الاهتزاز تتكون من التناوب بين 5 دقائق من الوضع المداري و5 دقائق من الوضع المداري المزدوج، وتم جمع القياسات كل 10 دقائق. تم حساب عوائد النمو حتى 40 ساعة وتم حساب معدلات النمو كمعدل النمو بينقيم 0.001 و 0.01 (النطاق الأسي الأكثر اتساقًا في منحنياتنا).
تحليل تسلسل القراءة الطويلة
تم قطع مكتبة البلازميد باستخدام SacII وإرسالها للتسلسل باستخدام Sequel II PacBio. تم محاذاة القراءات وتجميعها حسب الرموز الشريطية الخاصة بها. تم محاذاة جميع القراءات لرمز شريطي معين وتم الحصول على تسلسل إجماعي باستخدام SAMtools.تم الاحتفاظ بتسلسلات الإجماع إذا كانت WT أو تحتوي على طفرة واحدة تتطابق مع المكتبة المصممة. أي طفرة في الهيكل العظمي أبطلت رمز الشريط. تم إنشاء جدول بحث لربط كل رمز شريط بالطفرة المرتبطة به. طرق تحليل البيانات الموصوفة في هذه الدراسة متاحة للجمهور علىhttps://github.com/SavageLab/rubiscodms.
توصيف المكتبة والفحص
تمت الاختيارات عن طريق التخفيفمن مخزون الجليسرول بتركيز OD حوالي 0.25 إلى 5 مل من وسط M9 الحد الأدنى مع إضافة الكلورامفينيكولالجلسرين ( ) ، IPTG و 20 نانومتر من الأنهيدروتتراسيكلين. تم زراعة هذه الثقافات في أنابيب ثقافة سعة 11 مل في في غرفة نمو بيرسيفال AR-22 في ظروف مختلفةتركيزات على جهاز اهتزاز نيو برونزويك العلمي إنوفا 2000 بسرعة 250 دورة في الدقيقة بزاويةتم زراعة الثقافات حتى وصلت إلى OD عند 5 مل. هذا يتوافق مع توسع بمقدار 100 مرة للخلايا، أي بين ستة وسبعة مضاعفات.
تم تدوير الثقافات قبل وبعد الاختيار، وقمنا بتحليل الخلايا وأجرينا بروتوكول استخراج البلازميد القياسي باستخدام مجموعة QIAprep Spin Miniprep (Qiagen). تم إنتاج الأمبليكون من إيلومينا عن طريق تفاعل البوليميراز المتسلسل (PCR) لمنطقة الباركود. تم تسلسل هذه الأمبليكونات باستخدام مجموعة NextSeq P3.
حساب إثراء المتغيرات
تم حساب تعزيز المتغيرات من نسبة السجل لعدد قراءات الباركود. تشمل حسابات التعزيز معلمين للمعالجة: حد أدنى لعدد القراءات ( ) وثابت عددي زائف . عتبة العد هي الحد الأدنى لعدد قراءات الباركود التي يجب ملاحظتها إما قبل أو بعد الاختيار ليتم تضمين الباركود في حساب الإثراء. يتم استخدام ثابت العد الزائف لإضافة قيمة إيجابية صغيرة إلى كل عد باركود لتجنب أخطاء القسمة على الصفر. نحن نستخدم قيمة العد الزائف التي يتم وزنها حسب العدد الإجمالي للقراءات في كل حالة. بالنسبة لـ المتغير ورموز الباركود الفردية، ، بعد تجاوز شرط العتبة، يتم حساب إثراء المتغير على النحو التالي،
لتحديد القيم المثلى لهذه المعلمات، قمنا بحساب الثراء المتنوع عبر مسح ثنائي الأبعاد للمعلمات و لإيجاد التركيبة التي أدت إلى أقصى متوسط لمعامل ارتباط بيرسون عبر جميع النسخ في كل حالة. كانت هذه و (متوسط 0.3 عدداً زائفاً بعد الضرب في العدد الإجمالي للقراءات في كل تجربة، أو )، مما أدى إلى معامل ارتباط قدره 0.978 .
إثراء المتغيراتثم تم حسابه لكل طافرة باستخدام المعادلة (1).
ثم تم تطبيع تعزيزات المتغيرات بحيث يكون لنوع البرية قيمة تعزيز تبلغ 1 في جميع الظروف، وللمتغيرات الميتة تحفيزياً قيمة تعزيز متوسطة تبلغ 0. بالنسبة لتعزيز المتغير ‘الميت’، قمنا بحساب القيمة المتوسطة لتعزيز جميع الطفرات في المواقع التحفيزية K191 و K166 و K329 و D193 و E194 و H287. تم حساب التعزيزات المطابقة في كل حالة على النحو التالي
أينهو إثراء لـ المتغير كما هو موضح في المعادلة (1)، هو إثراء النوع البري و هو متوسط الثراء عبر جميع الطفرات لبقايا التحفيز المذكورة أعلاه.
توافقات مايكلس-مينتن مع بيانات الإثراء
تم استخدام تحسينات مكتبة DMS عبر تركيزات مختلفة من CO2 لتقدير معلمات كينتيك ميكايليس-مينتن لكل متغير. مسترشدين بالعلاقة الخطية بين معدل النمو وكما هو موضح في الشكل 1e، نفترض أن معدل نمو الخلايا يتناسب مع سرعة إنزيم الريبسكو لاشتقاق الـتناسب المعايرة (انظر ‘اشتقاق تناسب ميكاليش-منتن’، المعادلة (S1))
هو نسبة السرعة القصوى للطفرات مقارنة بالنمط البري، هو النوع البريالذي استخدمنا فيه القيمة، و هو الطافرةتم ملاءمة منحنيات المعايرة الثلاثية لكل متغير مع المعادلة (3) باستخدام طريقة المربعات غير الخطية مع ضرورة وجود كلا و أن تكون إيجابياً.
لقد لاحظنا أنتناسب بعض المتغيرات – وخاصة تلك ذات القيم المنخفضة-كانوا حساسين لاختيار معلمات المعالجة و . نظرًا للطبيعة شبه العشوائية لهذه المعلمات، فإن هذه الاعتمادية واضحة أنها غير مرغوب فيها وتولد ثقة منخفضة في الاستنتاجات.القيم. لأخذ هذه الشكوك في الاعتبار، قمنا بإجراء مسح للمعلمات (مع 11 مختلفًاقيم موزعة خطيًا بين 0 و 50، وقيم متباعدة بشكل لوغاريتمي بين و )، وحسبنا الثراء المتغير لجميع تركيبات هذه المعلمات. ثم قمنا بإجراء عشرة عينات فرعية من النسخ المكررة لجميع مجموعات المعلمات وأجرينا ملاءمة مايكلس-مينتن النسبية. من هذه المجموعة من قيم الملاءمة لكل متغير قمنا بحساب معامل التباين القائم على الأرباع الذي تم استخدامه كمعيار للجودة لـ.
محاذاة تسلسل متعددة
تم إنشاء محاذاة متعددة التسلسلات (MSA) لعائلة روبسكو الأوسع خارج روبسكو من النوع الثاني باستخدام أداة البحث عن التشابه HMM المعروفة باسم jackhmmer.بدءًا من تسلسل ريبسكو R. rubrum، تم تطبيق jackhmmer خمس دورات بحث مع عتبة درجة البت 0.5 بت لكل بقايا ضد قاعدة بيانات UniRef100 لتسلسلات البروتين غير المتكررة.لحساب الحفظ النشوي في كل موضع، قمنا بحساب نسبة التسلسلات الكلية التي تحتوي على كل حمض أميني ممكن في الموضع المقابل من MSA. الحفظ النشوي هو الحد الأقصى للنسبة، حيث يتم أخذ الحد الأقصى من جميع الأحماض الأمينية الممكنة. وبالتالي، إذا كان هناك موضع يحتوي على ألانين فيمن تسلسلات الـ MSA، ستكون المحافظة النشوء والتطور 0.9.
تنقية البروتين
تم تحويل خلايا E. coli BL21(DE3) باستخدام pET28 (الذي يشفر الروبيسكو المطلوب مع “علامة الارتباط الخاصة به وSUMO) و بلازميدات pGro (تاكارا). تم زراعة المستعمرات فيفي 100 مل منوسط مستخلص الخميرة تريبتون تحت اختيار الكاناميسينإلى
جرعة زائدة منأرابينوزتمت إضافة إلى كل ثقافة، والتي تم تحضينها بعد ذلك في لمدة 30 دقيقة. تم تحفيز تعبير البروتين باستخدام IPTG (ميلليبور) عند وتم زراعة الخلايا طوال الليل في“. تم تدوير الثقافات ( ) وتم تنقيته كما هو مذكور باختصار، تم تحطيم الثقافات وتحليلها باستخدام BPER II (ثيرمو فيشر). تم طرد الطرد المركزي للعينات لإزالة الجزء غير القابل للذوبان. تم تنقية روبيسكو بواسطة تنقية علامة الهيستيدين باستخدام راتنج Ni-NTA (ثيرمو فيشر) وتم إزالته بواسطة قطع علامة SUMO باستخدام بروتياز bdSUMO (كما تم إنتاجه في المرجع 6). تم تركيز البروتينات المنقاة وتخزينها فيحتى القياس الحركي (خلال 24 ساعة). تم فصل العينات بواسطة الرحلان الكهربائي في هلام بولي أكريلاميد SDS لضمان النقاء.
اختبار الطيف الضوئي لروبيسكو
كلاهما و تستخدم القياسات نفس خليط الإنزيمات المترابطة حيث تم ربط الفسفرة والتقليل اللاحق لـ 1,3-ثنائي فوسفات الجليسرات – منتج كربوكسيليشن RuBP – بأكسدة NADH، والتي يمكن تتبعها من خلالالامتصاص. وفقًا لكوبيان وآخرون.ودافيدي وآخرون، يحتوي خليط التفاعل (الجدول البياني الموسع 1) على محلول عازل فيديثيوثريتول، 2 مللي مول ATP، 10 مللي مول فوسفات الكرياتين،EDTA وكل من كيناز الفوسفوغليسيرات، ديهيدروجيناز الجليسرالدهيد-3 فوسفات وكيناز الفوسفوcreatine. أحجام التفاعل هيوتم هز العينات مرة واحدة قبل بدء قياسات الامتصاص. يتم جمع قياسات الامتصاص على جهاز قراءة الألواح SPARK مع و التحكم (تيكان). تم تحديد معامل الانقراض لـ NADH في جهاز قراءة الألواح من خلال منحنى قياسي لمحلولات NADH ذات التركيز المعروف (تم تحديده بواسطة مقياس الطيف الضوئي Genesys 20 مع طول مسار قياسي 1 سم، ثيرمو فيشر). انخفاض الامتصاص على مر الزمن يعطي معدل أكسدة NADH وبالتالي معدل الكربوكسيل. نظرًا لأن الريبسكو ينتج جزيئين من 3-فوسفوغليسرات لكل تفاعل كربوكسيل، نفترض نسبة 2:1 لمعدل أكسدة NADH إلى معدل الكربوكسيل.
قياسات الطيف الضوئي لـثابت معدل الكربوكسلة (تم قياس ) لكل ربيسكو باستخدام طرق تم تحديدها سابقًاباختصار، تم تنشيط الريبسكو عن طريق الحضانة لمدة 15 دقيقة في درجة حرارة الغرفة مع و وأضيف (التركيز النهائي 80 نانومتر) إلى عينات من مزيج الفحص المخفف بشكل مناسب (الجدول البياني الممتد 1) الذي يحتوي على تركيزات مختلفة من 2-كربوكسي-D-أرابينيتول-1,5-بيسفوسفات (CABP) التي تم موازنتها مسبقًا في جهاز قراءة الألواح (Infinite 200 PRO؛ TECAN) عند، تحت نفس تركيزات الغاز. بعد 15 دقيقة، تم إضافة RuBP (تركيز نهائي 1 مللي مول) إلى خليط التفاعل وتم قياس الامتصاص عند 340 نانومتر لت quantifying معدلات الكربوكسلة. تم استخدام نموذج الانحدار الخطي لرسم معدلات التفاعل كدالة لتركيز CABP. الـتم حسابه عن طريق قسمة الـاعتراض (معدلات التفاعل) بواسطةالتداخل (تركيز المواقع النشطة). تم تنقية البروتين ثلاث مرات من أجلعزيمة.
قياسات الطيف الضوئي لـتم تنشيط طفرات الريبسكو المنقاة (40 مللي مول من البيكربونات و ) وأضيفت إلى لوحة 96 بئرًا مع مزيج الفحص (الجدول البياني الموسع 1، في هذه الحالة تم استخدام نفس تركيز محلول HEPES pH 8 ولكن يمكن استبداله بـ EPPS). تم إضافة بيكربونات لمجموعة من التركيزات ( و 150 مليمول). تم توازن الأطباق و RuBP مسبقًا عند و عند درجة حرارة الغرفة. تم إضافة RuBP إلى تركيز نهائي قدره 1.25 مللي مول مع استخدام الماء كتحكم لكل تكرار. تم قياس أكسدة NADH بواسطةكما فيتم تحليل منحنيات الامتصاص باستخدام برنامج مخصص لإجراء بحث عن المعلمات الفائقة لاختيار مربع لأخذ الميل كمعدل كربوكسيل يمثل بشكل أفضل معظم الانخفاض الأحادي.تم اشتقاقه عن طريق ملاءمة منحنى مايكلس-مينتن باستخدام طريقة المربعات الصغرى غير الخطية. تم تحديد أشرطة الخطأ بناءً على النسخ المكررة: (1) النسخ المكررة على مدى عدة أيام: مايكلس-مينتن تم إجراء التعديلات لكل تكرار، وتم حساب الانحراف المعياري والوسيط بناءً على هذه التعديلات. (2) ثلاث تكرارات: تم تعديل بيانات الامتصاص لاستخراج المعدلات الأولية باستخدام معلمات هايبر مختلفة وتم استخدام الوسيط لهذه التعديلات لاحقًا. تم حساب ثلاث مجموعات مختلفة من المعدلات الأولية بناءً على التكرارات الفنية: واحدة بناءً على قيم الامتصاص الوسيطة، وواحدة بناءً على الوسيط ناقص الانحراف المعياري، وواحدة بناءً على الوسيط زائد الانحراف المعياري. تم إجراء تعديلات مايكلس-منتن على هذه المجموعات الثلاث من المعدلات المحسوبة، وتظهر أشرطة الخطأ الفرق بين الحدود الدنيا والوسيط والحدود العليا.
قياسات الطيف الضوئي لـتم تحديده بطريقة مشابهة لـ و تم استخدام معايرة تركيزات RuBP لإنشاء منحنيات معدل التشبع تحت جو من و تم استخدام الانحدار الخطي البسيط لتناسب تدهورات الامتصاص.تم اشتقاقه من خلال ملاءمة منحنى مايكلس-مينتن باستخدام طريقة المربعات غير الخطية. تم تحديد الخطأ من الجذر التربيعي للقطرية لمصفوفة التغاير أثناء الملاءمة. القيم من التجارب الطيفية الضوئية مُبلغ عنها في الشكل 3f والأشكال البيانية الموسعة 6b و6d و9b.
القياسات الإشعاعية لـ و تم إجراء اختبارات التثبيت كما في المرجع 6 مع تعديلات طفيفة. محلول الاختبار (100 مليمول EPPS-NaOH pHتم نفخ EDTA بـغاز. تم تخفيف الريبسكو كما هو موضح أعلاه إلى حوالي (مقاسة باستخدام امتصاص الأشعة فوق البنفسجية) في محلول الفحص. ثم تم تخفيفها بحجم واحد من محلول الفحص الذي يحتوي على 40 مللي موللتفعيل. تم إجراء التفاعلات (0.5 مل) عندفيقوارير سكرينتيلاسيون زجاجية مغطاة بالحاجز (بيركن إلمر) معالكربونيك أنهيدراز، 1 مللي مولار RuBP وتركيزات تتراوح بين 0.4 إلى 17 مللي مول (ما يتوافق مع ). تم بدء التحليل بإضافة عينة من الريبسكو النشط وتوقفت بعد دقيقتين بإضافةحمض الفورميك.
النشاط المحدد لـتم قياسه من خلال إجراء اختبار لمدة ساعة واحدة عند أعلىتركيز يحتوي على 10 نانومول من RuBP. تم تجفيف التفاعلات على كتلة حرارية، وإعادة تعليقها في 1 مل من الماء ومزجها مع 3 مل من مادة التألق Ultima Gold XR للت quantification باستخدام عداد التألق Hidex.
تم قياس تركيز موقع النشاط للروبيسكو في كل اختبار بشكل مزدوج بواسطة-اختبار ارتباط CABP. A10-عينة من حواليتم تنشيط محلول الريبسكو في عازلة الفحص التي تحتوي على 40 مللي مول من البرد (الحجم النهائي ) لمدة 10 دقائق على الأقل. ثم، منتم إضافة -كربوكسي بانتيلول ثنائي الفوسفات وتم حضنه لمدة لا تقل عن ساعة واحدة عندتم فصل ربيسكو المرتبط بـ CABP من الحر.-2-CPBP بواسطة كروماتوغرافيا الفصل بالحجم (Sephadex G-50 Fine، GE Healthcare) وتم قياسه بواسطة عدّ الفوتونات.
تم ملاءمة البيانات مع معادلة مايكلس-مينتن باستخدام البيانات المجمعة من ثلاثة إلى أربعة تجارب أجريت في أيام مختلفة. تم استخدام هذا الاختبار لتحديد القيم في الشكل 4c والشكل الإضافي 9c.
تحديد خصوصية الريبسكو باستخدام مطيافية الكتلة مع مدخل غشائي. تم تعديل الطريقة الموضحة في المرجع 37 لجهاز مطيافية الكتلة مع مدخل غشائي (MIMS) (أدوات باي).تم معايرة إشارة الأيون عن طريق قياسأيون في الغلاف الجويوعند ‘الصفر’جوّيتم تحقيق المعايرة عن طريق موازنة محلول MIMS (200 مللي مولار هيبيس، “ ) مع الهواء لمدة ساعة واحدة عند الصفرتم تحديد إشارة الأيون من خلال إضافة حواليإلى الكوفيت.تمت معايرته عن طريق إضافة كميات مختلفة منإلى محلول 100 مللي مولار من حمض الهيدروكلوريك وتسجيل الـإشارة الأيون. في كلا الحالتين، قدمت التعديلات الخطية لعدد الأيونات إلى تركيزات الغاز تحويلًا بسيطًا لتحديد تركيزات الغاز ومعدلات الاستهلاك. كان يجب إجراء هذه المعايرات في كل يوم تم فيه استخدام الاختبار.
تم تنشيط إنزيمات روبيسكو في 20 مللي مولار هيبس pH 8، 100 مللي مولار NaCl،و 20 مMNaHCO 3 . تم إضافة الإنزيم المنشط إلىمن محلول ميمز المتوازن مع الهواء بتركيزتم إضافة أنزيم الكربونيك أنهيدراز البقري (سيغما ألدريتش) بتركيز نهائي قدره و تمت إضافة 4 مللي مول إلى التركيز النهائي. تم تحريك التفاعل في غرفة تفاعل MIMS المغلقة لمدة تقارب دقيقتين لجمع إشارة ما قبل التفاعل. تم بدء التفاعل بإضافة 2 مللي مول من RuBP. و تم تصحيح معدلات الاستهلاك للخلفية وتحويلها إلى سرعات تفاعل من خلال التحويل باستخدام المعاملات التي تم تحديدها أثناء المعايرة. تم تحديد الخصوصيات في ثلاث نسخ باستخدام المعادلة التالية:حيث DIC هو مجموعة الكربون غير العضوي المذاب.
تحديد تركيز الإنزيم القابل للذوبان بواسطة التحليل المناعي
التم زراعة السلالة مع ربيسكو من النوع البري تحت ظروف انتقائية (طوال الليل فيفي M9 متوسط معالجليسرول و 20 نانومولمع تركيزات مختلفة من IPTG عندلمدة 24 ساعة. بعد ذلك، تم طرد الثقافات المعكرة في جهاز الطرد المركزي ( ) مما يؤدي إلى حوالي 20 ملغ من الكريات لكل عينة. تم تحلل الكريات باستخدام تم نقل السائل الفائق من BPER II إلى أنبوب جديد وخلطه مع صبغة تحميل SDS. تم استخدام مجموعة نقل Bio-Rad RTA لنظام Trans-Blot Turbo Low Fluorescence PVDF بالتعاون مع نظام نقل Trans-Blot Turbo. تم قطع غشاء PVDF بعناية بين 50 و 70 كيلودالتون بعد الحجب باستخدام شفرة حلاقة. تم حضانة الأجسام المضادة الأولية المضادة لـ RbcL II Rubisco large subunit Form II من Agrisera (1:10,000) وأجسام مضادة DnaK من Abcam (1:5,000) بشكل منفصل. تم استخدام الأجسام المضادة الثانوية المرتبطة بالبيروكسيداز من الفجل، وهي الأجسام المضادة Donkey anti-mouse لـ DnaK (Santa Cruz Biotechnology) و Goat pAB to RB IgG peroxidase (Abcam) كلاهما.بعد ذلك، تم تطبيق ركائز Bio-Rad Clarity Max Western ECL وتم تصوير النتائج النهائية باستخدام جهاز GelDoc (Bio-Rad).
شاذ لياقة المتحولين
كان I190T (الشكل 1e) هو الشاذ الوحيد في مقارنتنا للظروف المخبرية.القياسات من الأدبيات وبيانات لياقتنا. لأن القيمة تم الإبلاغ عنها دون تقديرات للخطأقمنا بإعادة قياسهذا الطافرة ووجدت أنهالذي هومن القيمة النمطية، انخفاضًا منكما تم الإبلاغ عنه سابقًا. ومع ذلك، يبدو أن القيمة غير طبيعية مقارنة ببقية الاتجاه (الشكل 6b من البيانات الموسعة). أحد التفسيرات المحتملة هو أن الطفرة في تلك الموضع لها تأثير سلبي قوي على تعبير البروتين. احتمال آخر، نظرًا لأن I190T مجاورة لموقع النشاط الرئيسي الليسين، K191، هو أن I190T تسبب تأثيرًا سلبيًا على الكارباميل الليسين الذي، لسبب ما، يكون أكثر وضوحًا في الجسم الحي مقارنةً في المختبر.
اشتقاق ملاءمة مايكلس-مينتن
وفقًا لـ Stiffler وآخروننفترض أن الفروق في معدل نمو البكتيريا تتناسب مع الفروق في النشاط الإنزيمي المحدد للنمو.
تحت افتراض نمو المرحلة اللوجارية، النسبة المتوقعة للسجل للقراءات بعد مرور الوقتوتم تطبيعها إلى قراءات النوع البري كما هو موضح بـ
(لاحظ أن المعادلة (S2) ستحتوي أيضًا على عامل تطبيع لحساب العدد الإجمالي للقراءات التي تم الحصول عليها لظروف ما قبل وما بعد الاختيار. ومع ذلك، فهو عامل مشترك لكل من العدات الطافرة والنمط البري وبالتالي يتم إلغاؤه. علاوة على ذلك، تتضمن التحليل الحقيقي أيضًا العدات الزائفة، والتي تم حذفها هنا في اشتقاق معادلة الملاءمة من أجل البساطة. استبدال شرط النمو الأسي، أي،، وتبسيط ذلك يعطي،
لتطبيع الإثراءات، نقوم بالقسمة على لوغاريتم الإثراء لعدّات النوع البري بالنسبة للوسيط الإثرائي للمتغيرات ذات بقايا التحفيز المتحورة (وبالتالي ربيسكو الميت تحفيزياً). ثم نضيف واحداً للاتفاقية التي تنص على أن المتغيرات الميتة تكون مركزة عند إثراء قدره 0 وأن النوع البري يكون عند إثراء قدره 1. وبالتالي، فإن الإثراء الطبيعي للمتغيرات هو،
ثم باستبدال المعادلة (S3) نحصل على،
باستخدام الافتراض في المعادلة (S1) وحقيقة أن سرعة الإنزيم في الطفرات الميتة تساوي 0، نحصل على الثراء الطبيعي المتوقع كدالة لسرعات الروبيسكو.
أخيرًا، باستخدام معادلة ميكاليز-مينتن نحصل على التقديرات المتوقعة كدالة لـتركيز ومعلمات الحركية الإنزيمية.
لذا، في الممارسة العملية، نستخدم المعادلة (S7) كمعادلة ملائمة لقيم الإثراء المعيارية لكل متغير عبر نطاق منتركيزات. لكل منها لدينا، كمعلمات ملائمة، نسبة السرعات القصوى بين الطفرة والنمط البري،، والمتحولمع النوع البريمضبوطة على القيمة الأدبية لـ.
ملخص التقرير
معلومات إضافية حول تصميم البحث متاحة في ملخص تقارير مجموعة نيتشر المرتبط بهذه المقالة.
توفر البيانات
جميع البيانات الخاصة بهذه الورقة متاحة علىhttps://github.com/SavageLab/روبيسكو. كانت التسلسلات لنسقنا الثاني من شجرة عائلة الروبيسكو هي تم تجميعها من UniRef100. يمكن الوصول إلى قراءات التسلسل الخام الخاصة بنا على NCBI SRA (رقم الوصول PRJNA1181558). جميع البيانات الأخرى متاحة في الورقة أو المعلومات التكميلية.
توفر الشيفرة
جميع الشيفرات الخاصة بهذه الورقة متاحة علىhttps://github.com/SavageLab/روبسكو ديمس. 32. داتسينكو، ك. أ. ووانر، ب. ل. تعطيل جينات الكروموسومات في الإشريكية القولونية K-12 في خطوة واحدة باستخدام منتجات PCR. وقائع الأكاديمية الوطنية للعلوم في الولايات المتحدة الأمريكية 97، 6640-6645 (2000). 33. دانيتشيك، ب. وآخرون. اثنا عشر عامًا من SAMtools و BCFtools. جيغا ساينس 10، giab008 (2021). 34. جونسون، ل. س.، إيدي، س. ر. وبورتوغالي، إ. خوارزمية سرعة نموذج ماركوف المخفي وإجراء البحث التكراري لنموذج HMM. BMC Bioinf. 11، 431 (2010). 35. سوزك، ب.إ. وآخرون. مجموعات UniRef: بديل شامل وقابل للتوسع لتحسين عمليات البحث عن تشابه التسلسل. المعلوماتية الحيوية 31، 926-932 (2015). 36. كوبين، د. س.، براون، س. م. وكين، هـ. ج. قياس كمية ونشاط روبسكو في الأوراق. طرق البيولوجيا الجزيئية 684، 349-362 (2011). 37. كوزينز، أ. ب.، غانوم، أ.، فون كيميرر، س. & بادجر، م. ر. التحديد المتزامن لمعلمات كينتيك كربوكسيلاز وأوكسيلاز روبيسكو في القمح (Triticum aestivum) والذرة (Zea mays) باستخدام مطيافية الكتلة المدخلة عبر الغشاء. بيئة خلية النبات. 33، 444-452 (2010). 38. غوتريدج، س.، لوريمر، ج. وبييرس، ج. تفاصيل التفاعلات التي تحفزها أشكال الطفرات من روبيسكو. فيزيولوجيا النبات. الكيمياء الحيوية 26، 675-682 (1988). 39. إينيغيز، سي.، نينيميتس، أ.، مارك، ك. وغالميس، ج. تحليل أسباب التباين بين الطرق في خصائص كينتيك روبيسكو: من القياسات الأولى إلى القياسات الحالية. ج. إكسب. بوت. 72، 7846-7862 (2021).
الشكر والتقدير نشكر ن. أنتونوفيسكي وأ. بار-إيفن على مشاركتهما في صياغة أساس هذا العمل، وكذلك ن. تيبر وس. عامر على تصورهما الأصلي وإنتاجهما لـسلالة rpi، على التوالي. نشكر P. روميرو، N. تومسون، L. فيدوتوف، O. سالتزمان، E. برايويس، S. وايمان، B. يو و J. ديسماريس على المساعدة الأساسية في عملية تحليل البيانات. نشكر A. غلازر، K. ماترييك، J. بلوم و K. رينولدز على مساعدتهم في عملية إنشاء وتأكيد مكتبة DMS. بالإضافة إلى ذلك، نشكر J. تارتاجليا على استخدام بادئات التسلسل الخاصة بها و N. كريشناپا على المساعدة في تشغيل عينات NGS. نود أن نشكر E. مينغ على المساعدة في استخدام ChimeraX. أخيرًا، نشكر F. وانغ على المساعدة التقنية خلال عطلات نهاية الأسبوع. D.F.S. هو باحث في معهد هوارد هيوز الطبي. تم دعم هذا العمل من قبل منحة المعاهد الوطنية للصحة الأمريكية رقم K99GM14145501 (N.P.) وبرنامج العلوم الحيوية الفيزيائية التابع لوزارة الطاقة الأمريكية، رقم الجائزة DE-SC0016240 (D.F.S.).
المصالح المتنافسة: د. ف. س. هو أحد المؤسسين وعضو في المجلس الاستشاري العلمي لشركة Scribe Therapeutics. المؤلفون الآخرون يعلنون عدم وجود مصالح متنافسة.
معلومات إضافية
معلومات إضافية النسخة الإلكترونية تحتوي على مواد إضافية متاحة فيhttps://doi.org/10.1038/s41586-024-08455-0. يجب توجيه المراسلات والطلبات للحصول على المواد إلى ديفيد ف. سافاج. معلومات مراجعة الأقران تشكر Nature المراجعين المجهولين على مساهمتهم في مراجعة هذا العمل. تقارير مراجعي الأقران متاحة. معلومات إعادة الطبع والتصاريح متاحة علىhttp://www.nature.com/reprints.
رسم تخطيطي لمونومر واحد مع تصنيف الثلاثة مجالات فرعية. العرض هو لـ جانب الواجهة. يمين، عرض مقرب لموقع النشاط. الشكل المغلق للحلقة 6 هو من هيكل 8RUC. تم وضع علامات على بقايا الموقع النشط وركيزة RuBP. رسم تخطيطي لمونومر واحد مع تصنيف الثلاثة مجالات فرعية. العرض هو لـ جانب الواجهة. يمين، عرض مقرب لموقع النشاط. الشكل المغلق للحلقة 6 هو من هيكل 8RUC. تم وضع علامات على بقايا موقع النشاط وركيزة RuBP.
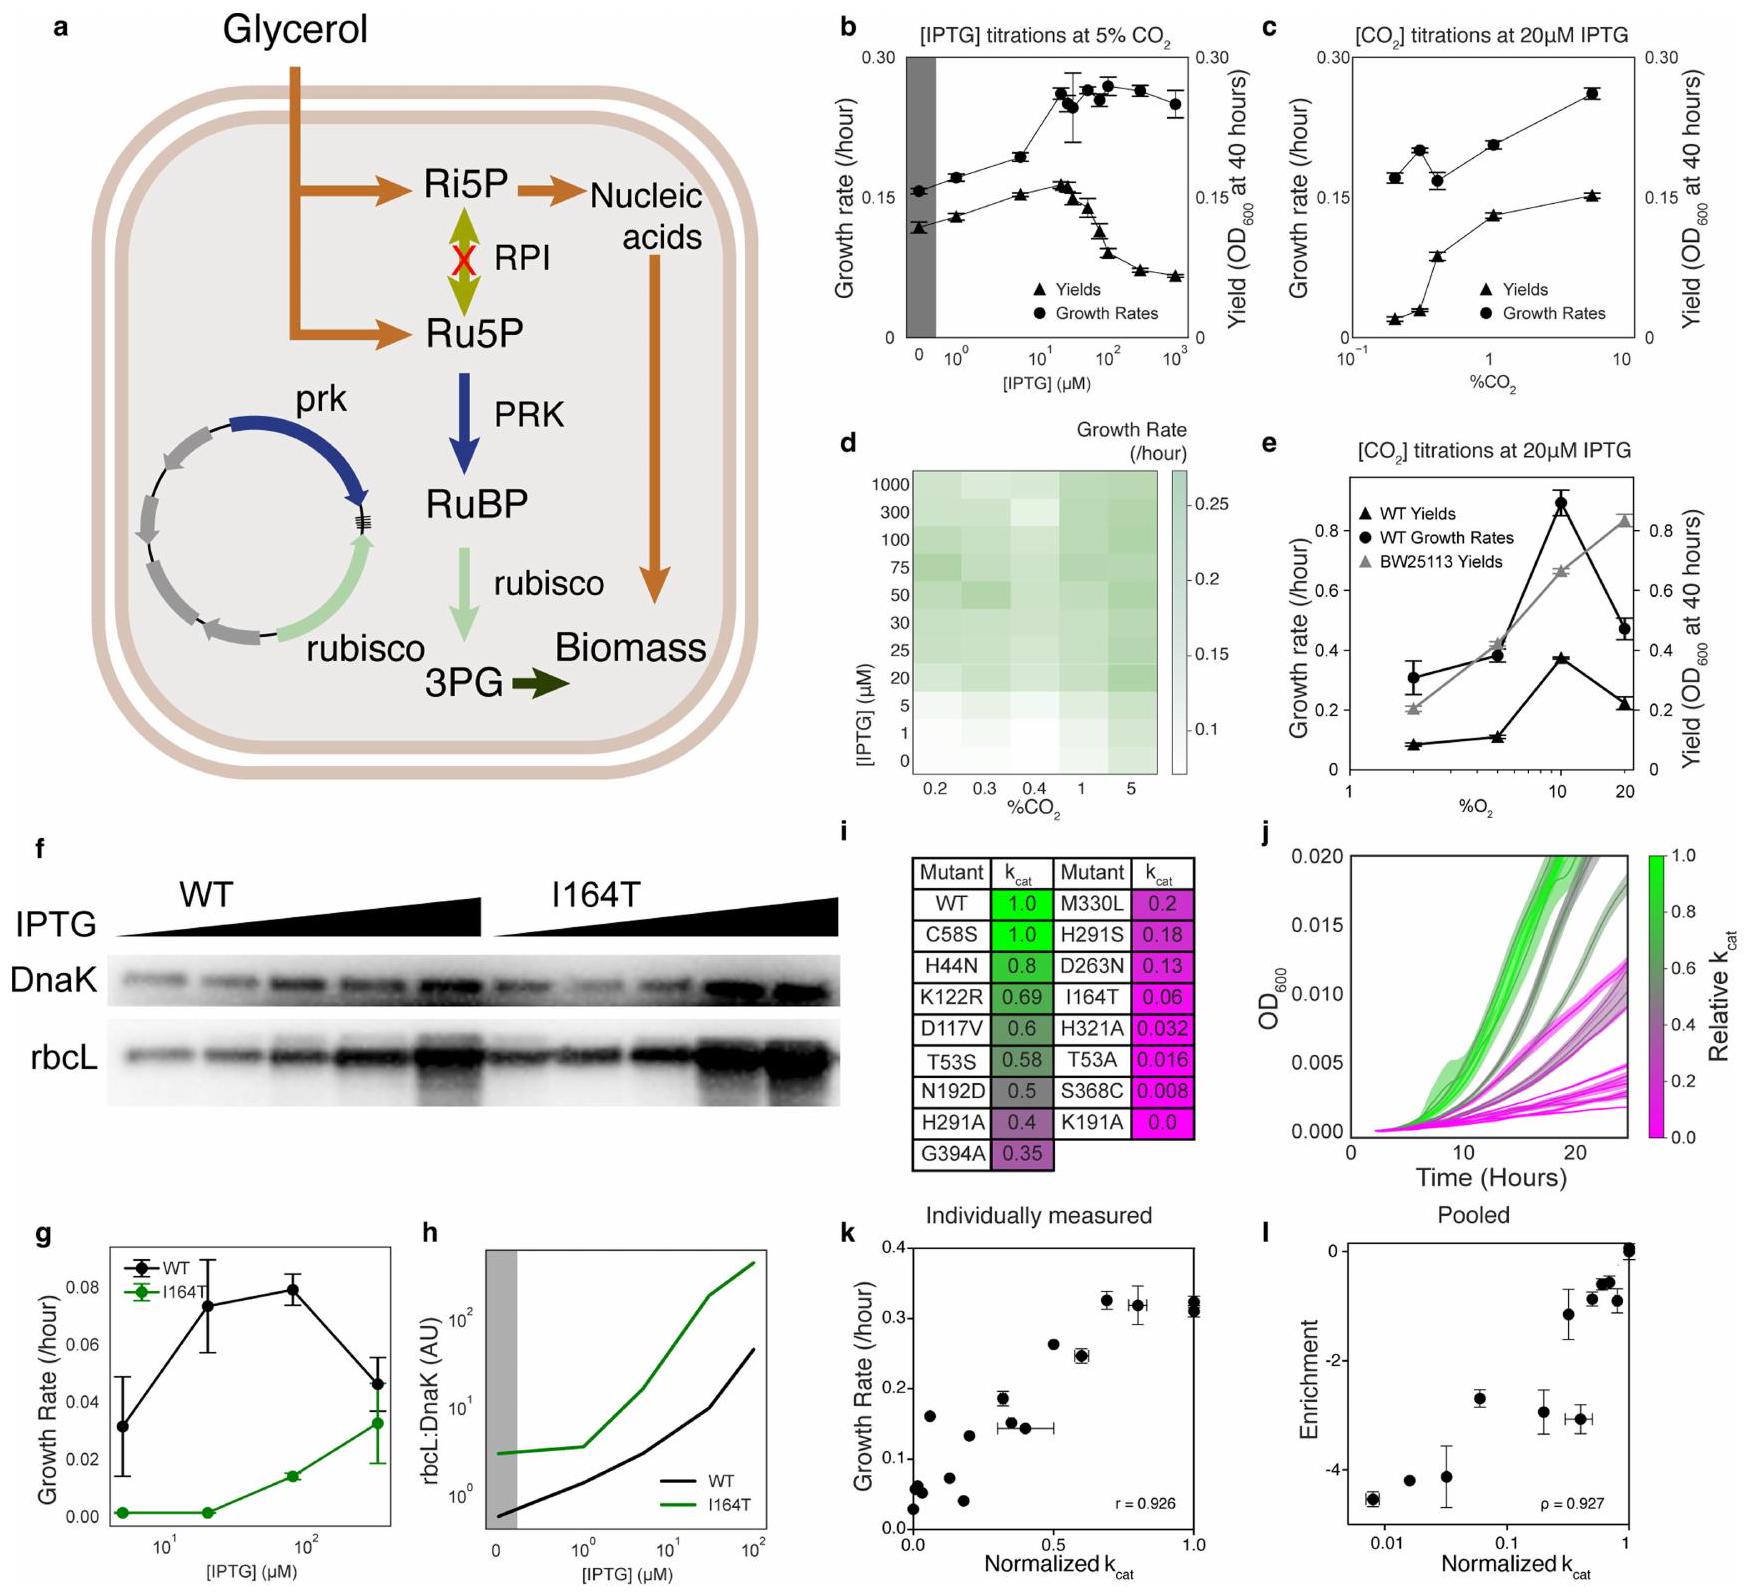
الشكل البياني الموسعrpi يعتمد على الريبسكوسلالة E. coli مع معدل نمو يتناسب مع تدفق الروبيسكو. أ) مخطط لسلالة Δrpi من E. coli المعتمدة على الروبيسكو. تعوض PRK والروبيسكو عن حذف RPI وتنقذ النمو. ب) معدلات النمو والعوائد عبر تيتراشن تحفيز الروبيسكو بواسطة [IPTG].ج) معدلات النمو والعوائد عبر معايرةتم حساب العوائد حتىخريطة حرارية لمعدلات النمو عبر معايرة ثنائية الأبعاد لـ و IPTG. هـ) معدلات النمو والعوائد عبر تيتراشن من . تم حساب العوائد بين 15 و 40 ساعة. كانت BW25113 تحتوي على نفس البلازميد كما rpi ولكن مع GFP بدلاً من الروبيسكو. لم يكن من الممكن حساب معدلات النمو للتحكم بسبب سلوك النمو غير الأسي.f) المناعية للروبسكو القابل للذوبان مع DnaK كعنصر تحكم في التحميل. النصف الأيسر هو النوع البري. روبريم روبيسكو، النصف الأيمن هو الطفرة عالية التعبير I164T. العينات هي من خلايا RPI المزروعة في وسط الاختيار (انظر الطرق) مع تركيزات مختلفة من IPTG. ج) معدلات النمو لـرابي الخلايا التي تعبر عن إما WT أو I164T ربيسكو نمت في وسط اختيار مع تركيزات مختلفة من IPTG.ح) نسبة كثافات الحزم من كدالة لتركيز IPTG. i) مجموعة من الطفرات من الأدبيات ومرتبطة بها القياسات موحدة إلى WT. قيمة WT هيج) منحنيات النموالتعبير عن المتحولين منالتلوين في و على نفس المقياس ويعكسقيم من الأدبيات. ك) قيم معدل النمو المحسوبة من المنحنيات في، تم رسمه مقابل المعايرقيم l) قيم إثراء الطفرات المتوسطة للرموز الشريطية الخام لنفس الطفرات كما فيتم قياسها في تجربة تسلسل نانو بورت واحدة. تم تحديد أشرطة الخطأ في ب، ج، غ، و هـ من الانحراف المعياري للخطأ لعدة تكرارات لا تقل عن أربعة.تم تحديدها كحالات انحراف معياري لثلاثة أو أكثر من النسخ المكررة. تم تحديد أشرطة الخطأ في I كحالات انحراف معياري لثلاثة رموز شريطية مختلفة.لكل طافرة. تظهر الأخطاء في القيم الأدبية من الدراسات التي تم الإبلاغ عنها.
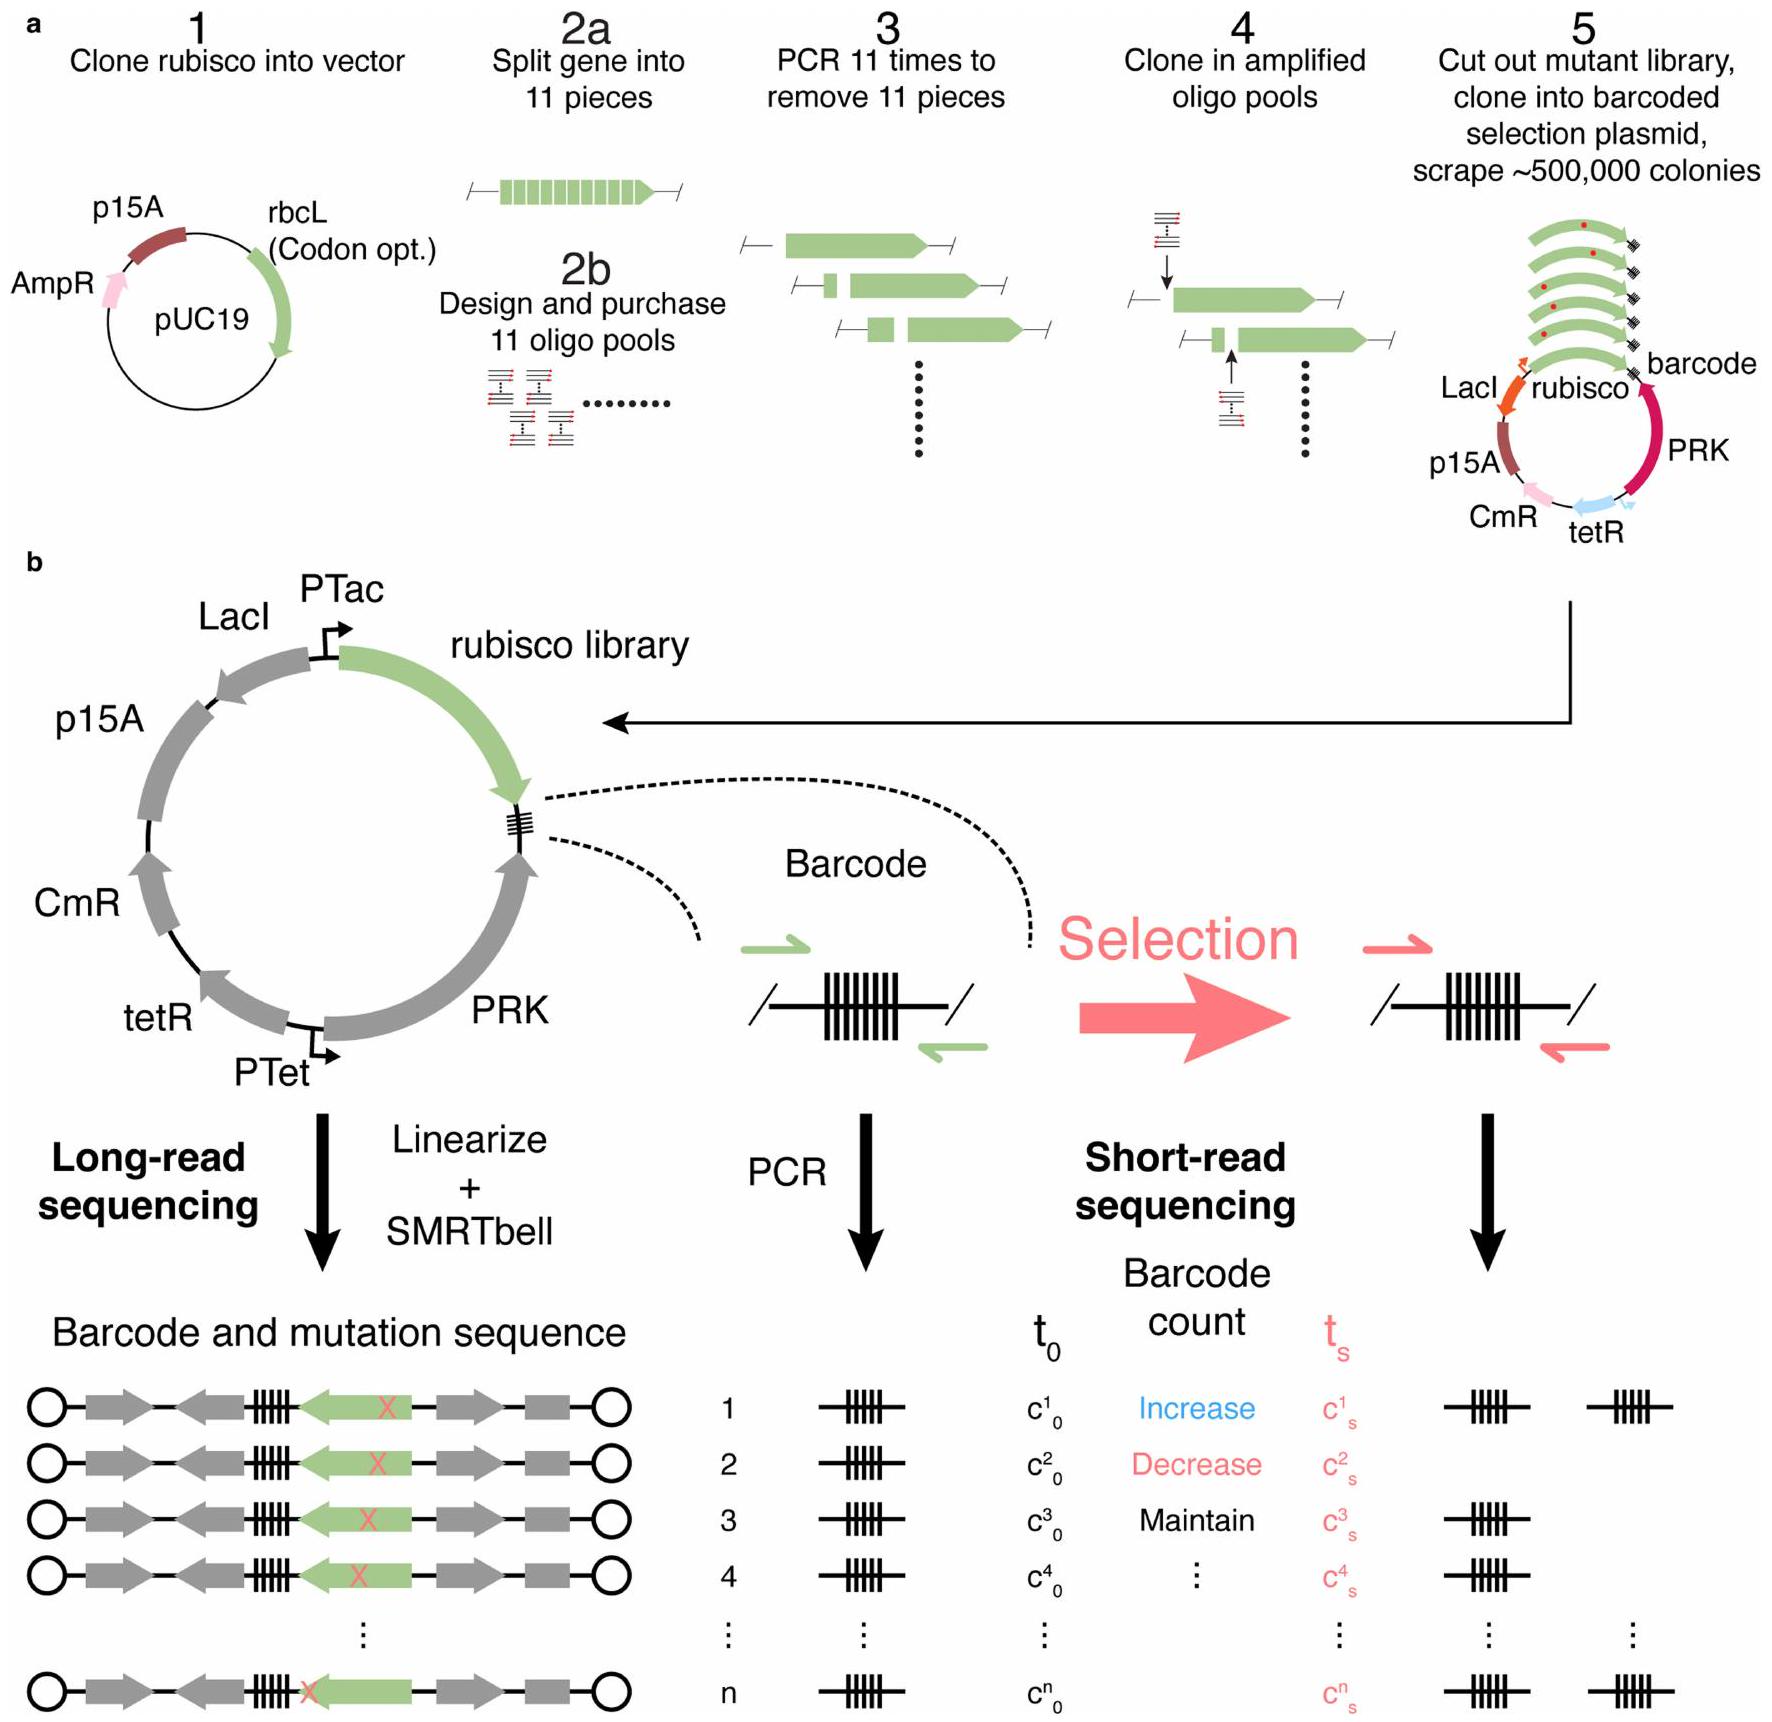
الشكل 3 من البيانات الموسعة | عملية بناء المكتبة وتوصيفها. أ) إجراء بناء المكتبة. الخطوة 1) استنساخ تسلسل ربيسكو R.rubrum المحسن للكودونات في pUC19. الخطوة 2أ) اختيار المواقع لتقسيم الجين التي تناسب استنساخ مكتبات تحت المجموعة. الخطوة 2ب) تضخيم المكتبات الفرعية بواسطة PCR من مجموعة أوليغو تحتوي على جميع الطفرات الـ 8778. الخطوة 3) تضخيم العمود الفقري بواسطة PCR مع وجود فراغ مفقود لربط مجموعة أوليغو فرعية.
الخطوة 4) ربط كل مجموعة أوليغو بالهيكل المناسب لها. الخطوة 5) دمج المكتبات الفرعية، قطع الجينات الكاملة والمتحورة وربطها بهيكل تم تضخيمه بواسطة PCR وموسوم بشريط باركود. بعد التحول، يتم كشط العدد المطلوب من المستعمرات للاختيار. ب) استراتيجية تسلسل المكتبة. تم توصيف المكتبة بواسطة تسلسل طويل القراءة. تم قياس وفرة الشريط الباركود بواسطة تسلسل قصير القراءة قبل وبعد الاختيار (انظر الطرق).
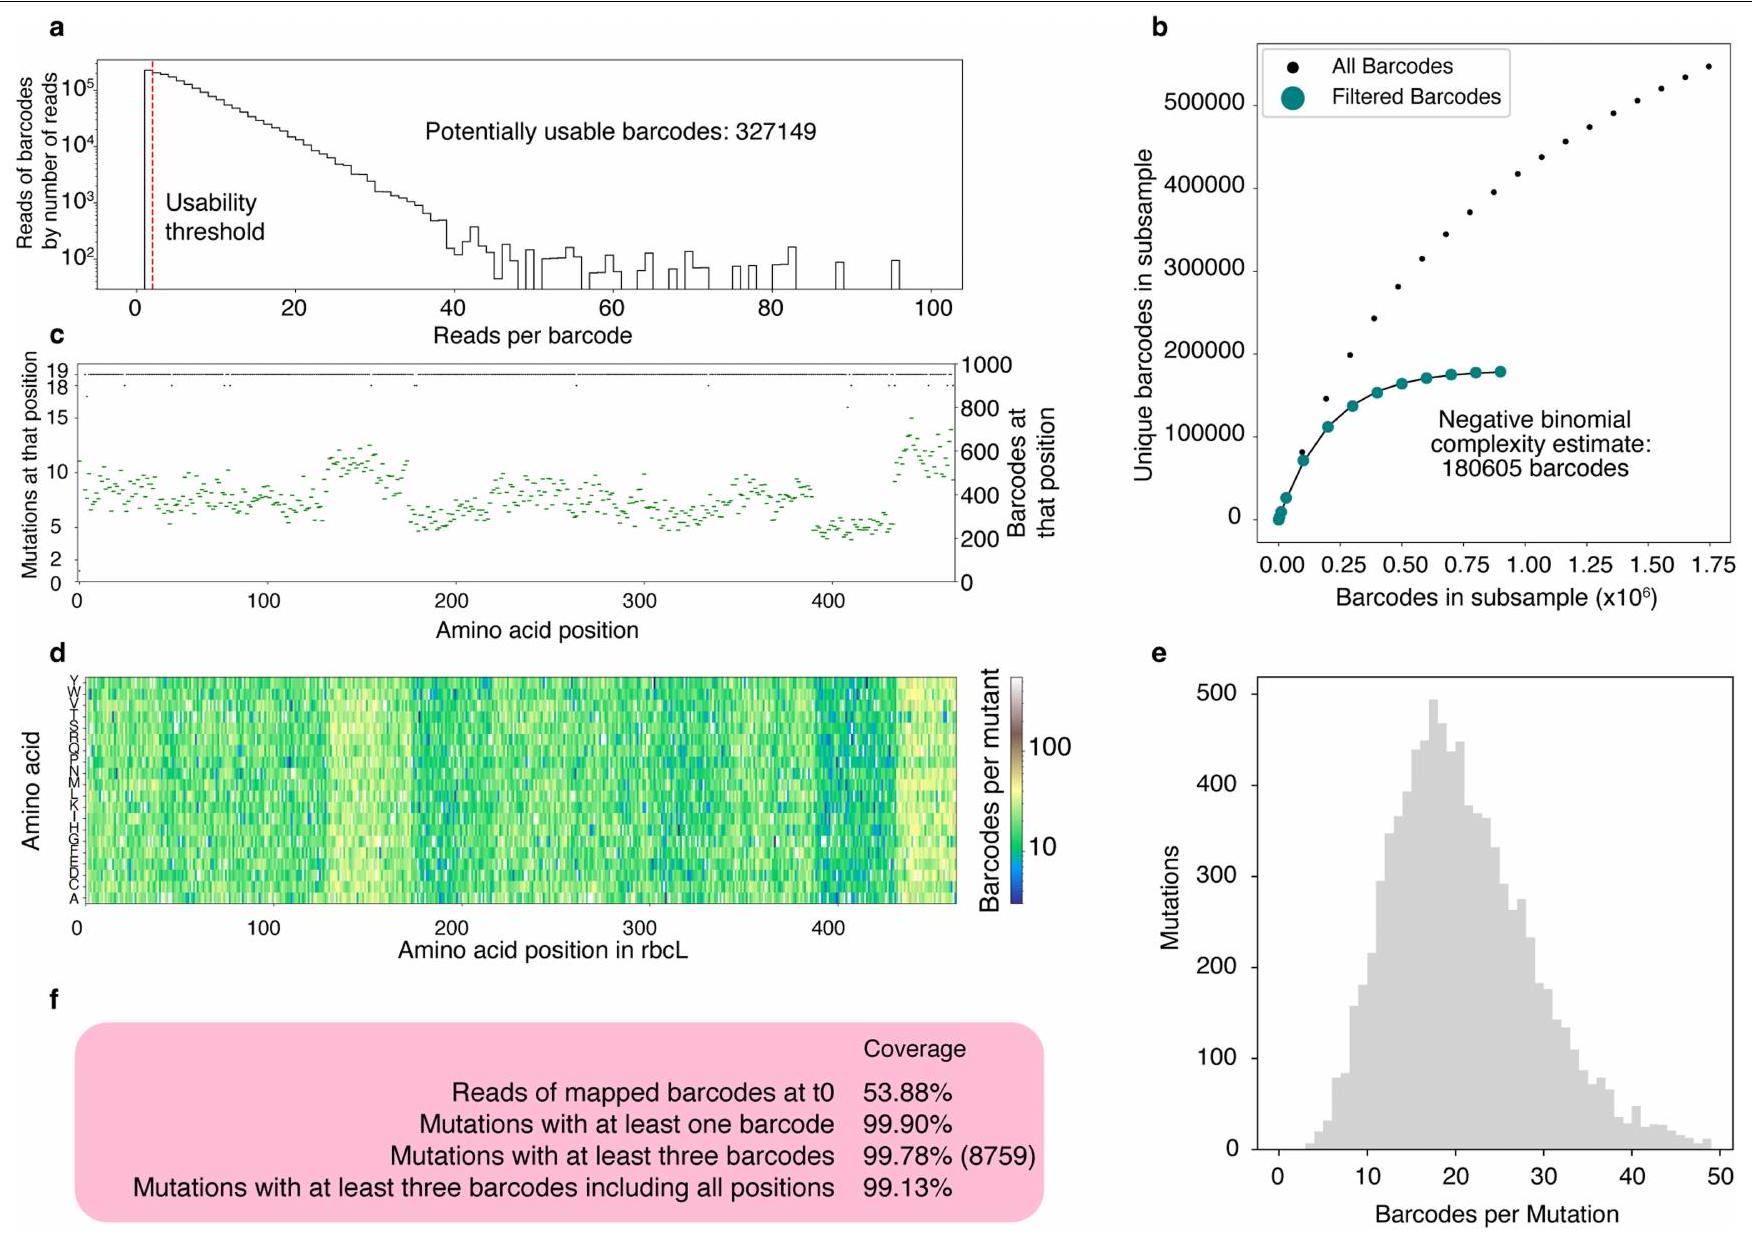
الشكل 4 من البيانات الموسعة | توصيف المكتبة بواسطة تسلسل القراءة الطويلة.
أ) هيستوجرام لقراءات البلازميدات من تسلسل PacBio.-المحور يمثل عدد قراءات البلازميدات مع عدد معين من القراءات (أي العمود عند 50 على -المحور Y هو بارتفاع عدد قراءات الرموز الشريطية التي تحتوي على 50 قراءة). تمكنا من توليد تسلسل إجماعي لأي رمز شريطي يحتوي على أكثر من قراءة واحدة، مما ترك لنا 327,149 رمز شريطي محتمل. ب) رسم نادر يقدر تعقيد المكتبة الكلي، تم ملاءمة توزيع ثنائي سالب. قدرت تعقيد مكتبة حقيقية بـالرموز الشريطية. ج) رسم يوضح عدد الطفرات (من الممكن 19) الموجودة في مكتبتنا عند كل موضع (خطوط سوداء، المحور الأيسر) وعدد الرموز الشريطية (خطوط خضراء، المحور الأيمن). د) خريطة حرارية توضح عدد الرموز الشريطية التي تم تحديدها لكل طفرة. هـ) رسم بياني يوضح عدد الطفرات حسب عدد الرموز الشريطية التي كانت لديهم. و) إحصائيات عن اكتمال المكتبة. بشكل عام، كان لدينا أكثر من 99% من الطفرات في جدول البحث الخاص بنا.
نسخ 1 1
□
1
□
كتاب
11
\#
هو
□
□
□
□
مجرم
□
□
□
“部部都” translates to “كل قسم” in Arabic.
□
□
□
ألتي كرايم
0
نسخة 1
نسخة مكررة 2
نسخ 3
نسخة 4
نسخ 5
نسخة 7
نسخ 8
نسخ 9
الشكل البياني الموسع|مخططات الزوجية لقيم اللياقة المكررة. يتم حساب قيم اللياقة لكل طفره كما هو موضح في الطرق لكل مكرر على حدة. هذه المكررات هي 3 مجموعات من المكررات الفنية لـ 3 مكررات بيولوجية. المكررات 1 و 4 و 7 هي مكررات فنية (نفس الشيء مع 2/5/8 و
3/6/9). تم جمع النسخ 7-9 في يوم مختلف. تم الإبلاغ عن ارتباطات بيرسون لكل زوج من النسخ. يتم الإبلاغ عن توزيع قيم اللياقة على طول القطر ويتم الإبلاغ عن الارتباطات الزوجية بين النسخ خارج القطر. يتم الإبلاغ عن معامل بيرسون R في النصف السفلي الأيسر.
الشكل البياني الممتد 6 | انظر الصفحة التالية للتعليق.
الشكل 6 من البيانات الموسعة | مقارنات بين معلمات كينتيك روبسكو المقاسة بيولوجيًا وتلك المعلمات نفسها كما تم استنتاجها من قيم اللياقة. و ب) اللياقة مقابل القيم، خطأ اللياقة هو الخطأ القياسي للمتوسط لعدد 9 تكرارات، ج و د) مقابل القيم،تُعبر أشرطة الخطأ عن الربع الداخلي لملاءمات البوتستراب (انظر الطرق). القياسات مأخوذة من الأدبيات في و ، يتم قياس القيم في هذه الدراسة بواسطة اختبار الطيف الضوئي في و . نقاط سوداء في تم تنقيتها ثلاث مرات بشكل مستقلأشرطة الخطأ على المحور – هي خطأ قياسي)، جميع البيانات الأخرى باللون الرمادي هي من تنقيات فردية وليس لديها أخطاء مُبلغ عنها. يُظهر الإطار الصغير الطفرات ذات قيم اللياقة بالقرب من أو فوق 1 (مستوى WT). الخط المتقطع يشير إلىالتوافق بين اللياقة البدنية وفي قياسات المختبر، يتم الإشارة إلى WT بمربع. شريط الخطأ على المحور السيني في a وتؤخذ من الأدبيات عند توفرها. أخطاء المحور السيني فيوأخطاء المحور Y في الأشكال (أ) إلى (د) موضحة في الطرق.التكرارات البيولوجية في جميع الحالات. يتم وضع علامة على الطفرة الشاذة في و ويتم مناقشته في الطرق. يشير الأحمر إلىتقديرات مع معامل التباين. هـمعامل التباين كدالة للملاءمة. ف)معامل التباين كدالة لـ ج) معامل التباين كدالة للملاءمةمعامل التباين. ح) الارتباط لـواللياقة البدنية. فقط المتحولون الذين لديهم معامل اختلافمخططة هنا؛ الطفرات ذات معاملات التباينعادةً ما تكون لديها لياقة منخفضة وبالتالي يكون من الصعب ملاءمتها لنموذج ميكاليز-مينتن. ن
متوسط لياقة الأحماض الأمينية عند IPTG
الشكل البياني الممتد 7| هيستوجرامات تأثيرات اللياقة البدنية للطفرات لكل حمض أميني على حدة. أ) هيستوجرام لتأثيرات اللياقة البدنية لجميع الطفرات إلى الحمض الأميني المحدد (أي أن الرسم البياني للبروتين هو هيستوجرام لتأثيرات اللياقة البدنية للطفرات إلى البروتين في كل موضع لا يوجد فيه بروتين). بشكل طبيعي). يتم تلوين الرسوم البيانية حسب الخصائص البيوفيزيائية للأحماض الأمينية. ب) خريطة حرارية لجميع قيم اللياقة. اللياقة هي قيمة الإثراء المعيارية للاختيارات التي تم تنفيذها فيمعالقيم. د) خريطة حرارية لـالقيم. له وحدات من .
بيانات موسعة الشكل 8|”التطور ” الحديث لجهة الاتصال الثلاثية والمقارنات النشوية. أ) الحفظ مقابل التسامح بين ربيسكو بكتيري من النوع الثاني. كما في الشكل 2ج، فإن التسامح الطفري هو متوسط تأثير اللياقة لجميع الطفرات في موضع معين. هنا يتم تحديد الحفظ من خلال تحليل متعدد التسلسلات لجميع ربيسكو بكتيري من النوع الثاني (انظر الطرق). يتم تحديد قيمة P من ارتباط سبيرمان وبالتالي فهي اختبار ذو جانبين. تشكل المواضع 215 و257 جهة اتصال ثلاثية في R. rubrum وغيرها من ربيسكو من النوع الثاني وبالتالي فهي أكثر حفظًا من بين جميع ربيسكو. ب) محاذاة 9RUB و 8RUC،
R. rubrum (الأخضر) وسبانخ (البرتقالي) ربيسكو على التوالي. ج) عرض مُدوّر وتكبير لـ M215 و H 257 من. روبريم. الحلقة التي تحتوي عليها في . rubrum مختصر في السبانخ. د) الهويات الزوجية بين تسلسلات الروبيسكو عبر الأشكال. تسلسلات الروبيسكو التمثيلية منتمت مقارنة الهوية الزوجية. تم اختيار تسلسلات الشكل الأول لتحقيق أقصى هوية تسلسلية فيما بينها منمن أجل أخذ عينات من التسلسلات بشكل أكثر توازنًا (خوفًا من أخذ عينات مفرطة من تسلسلات النباتات). تم اختيار تسلسل النوع الثاني والثالث بشكل عشوائي.
الشكل 9 من البيانات الموسعة | التخصص والقياسات لـ A 102 Y و
V266T. أ) قيم التخصص المقاسة بواسطة مطياف الكتلة المدخل الغشائي (لكل طافرة تم قياسها في هذه الدراسة). يتم عرض المقارنات مع قيم الأدبيات عند توفرها. بيانات الأدبيات للنوع البري (WT) هي منتمثل أشرطة الخطأ الانحراف المعياري للخطأ لجميع القياسات المجمعة في تلك التحليل المنشور. بيانات الأدبيات لـ H 44 N و D 117 V مأخوذة من. تم أخذ الخطأ من الجدول البياني الموسع 2 في تلك المنشورة. تعكس قيم P اختبار t ثنائي الجانب لويلش بالمقارنة مع WT، مع اختبار تبديل لتحديد قيم P. الأرقام الحمراء تشير إلى. ب) تتناسب القيم من اختبارات الطيف الضوئي لعملية كربوكسيلاز ربيسكو على طول معايرة RuBP المكونة من 8 نقاط. تم قياس كل نقطة في المعايرة في ثلاث نسخ فنية. تشير أشرطة الخطأ إلى الجذر التربيعي للقطرية لمصفوفة التغاير أثناء التناسب. تم استخدام جميع قياسات النسخ الثلاثة لإجراء التناسب.
البيانات الموسعة الجدول 1 | تركيبة مزيج الاختبار
مكون
تركيز التحليل
مصدر
محلول EPPS بتركيز pH 8.0
100 مللي مول
ألفا أيسر (رقم الكاتالوج J61296)
كلوريد المغنيسيوم
20 مللي مول
سيغما ألدريتش (رقم الكاتالوج M2670-500G)
ثنائي ثيول الثريول
0.5 مللي مول
بايو باسيك كندا إنك. (رقم الكاتالوج DB0058)
ATP
2 مللي مول
سيغما ألدريتش (رقم الكاتالوج A3377-5G)
فوسفوكرياتين
10 مللي مول
سيغما ألدريتش (رقم الكاتالوج # 27920-5G)
NADH
1.7 مللي مول
ميرك (رقم الكات 481913-1GM)
الكربونيك أنهيدراز
سيغما ألدريتش (رقم الكاتالوج C3934-100MG)
فوسفات الكرياتين كيناز
سيغما ألدريتش (رقم الكاتالوج C3755-35KU)
إنزيم جليسرالديهيد 3 فوسفات ديهيدروجيناز
سيغما ألدريتش (رقم الكاتالوج G2267-10KU)
كيناز الفوسفوغليسيريك 3
سيغما ألدريتش (رقم الكاتالوج P7634-5KU)
مقالة
البيانات الموسعة الجدول 2 | معلمات الحركية الإنزيمية
روبي
WT
V266T
A102Y
محفظة الطبيعة
المؤلف (المؤلفون) المراسلون:
آخر تحديث من المؤلف(ين): 31 أكتوبر 2024
ملخص التقرير
تتمنى Nature Portfolio تحسين قابلية إعادة إنتاج الأعمال التي ننشرها. يوفر هذا النموذج هيكلًا للاتساق والشفافية في التقرير. لمزيد من المعلومات حول سياسات Nature Portfolio، يرجى الاطلاع على سياسات التحرير وقائمة مراجعة سياسة التحرير.
الإحصائيات
لجميع التحليلات الإحصائية، تأكد من أن العناصر التالية موجودة في أسطورة الشكل، أسطورة الجدول، النص الرئيسي، أو قسم الطرق. غير متوفر تم التأكيد □ X حجم العينة بالضبطلكل مجموعة/شرط تجريبي، معطاة كرقم منفصل ووحدة قياس □
بيان حول ما إذا كانت القياسات قد أُخذت من عينات متميزة أو ما إذا كانت نفس العينة قد تم قياسها عدة مرات □
اختبار(ات) الإحصاء المستخدمة وما إذا كانت أحادية الجانب أو ثنائية الجانب يجب أن تُوصف الاختبارات الشائعة فقط بالاسم؛ واصفًا التقنيات الأكثر تعقيدًا في قسم الطرق. □
وصف لجميع المتغيرات المشتركة التي تم اختبارها □
وصف لأي افتراضات أو تصحيحات، مثل اختبارات الطبيعية والتعديل للمقارنات المتعددة □
وصف كامل للمعلمات الإحصائية بما في ذلك الاتجاه المركزي (مثل المتوسطات) أو تقديرات أساسية أخرى (مثل معامل الانحدار) و التباين (مثل الانحراف المعياري) أو تقديرات مرتبطة بعدم اليقين (مثل فترات الثقة) □
لاختبار الفرضية الصفرية، إحصائية الاختبار (على سبيل المثال، ) مع فترات الثقة، أحجام التأثير، درجات الحرية وقيمة ملحوظة أعطِالقيم كقيم دقيقة كلما كان ذلك مناسبًا. □ □ لتحليل بايزي، معلومات حول اختيار القيم الأولية وإعدادات سلسلة ماركوف مونت كارلو □ لتصميمات هرمية ومعقدة، تحديد المستوى المناسب للاختبارات والتقارير الكاملة عن النتائج □ X تقديرات أحجام التأثير (مثل حجم تأثير كوهين)بيرسون )، مما يشير إلى كيفية حسابها تحتوي مجموعتنا على الويب حول الإحصائيات لعلماء الأحياء على مقالات تتناول العديد من النقاط المذكورة أعلاه.
البرمجيات والشيفرة
معلومات السياسة حول توفر كود الكمبيوتر
جمع البيانات
تحليل البيانات
HMMER 3.4
يمكن العثور على جميع مكونات تحليل البيانات فيhttps://github.com/SavageLab/reads_processing الحزم المستخدمة: باندا 2.2.1 ماتplotlib 3.8.4 بايو بايثون 1.81 numpy 1.26.4 scipy 1.12.0 سيبورن 0.12.2 sklearn 1.2.2 بايسام 0.21.0 سام تولز 1.21
بالنسبة للمخطوطات التي تستخدم خوارزميات أو برامج مخصصة تكون مركزية في البحث ولكن لم يتم وصفها بعد في الأدبيات المنشورة، يجب أن تكون البرمجيات متاحة للمحررين والمراجعين. نحن نشجع بشدة على إيداع الشيفرة في مستودع مجتمعي (مثل GitHub). راجع إرشادات مجموعة Nature لتقديم الشيفرة والبرمجيات لمزيد من المعلومات.
معلومات السياسة حول توفر البيانات
يجب أن تتضمن جميع المخطوطات بيانًا حول توفر البيانات. يجب أن يتضمن هذا البيان المعلومات التالية، حيثما ينطبق:
رموز الانضمام، معرفات فريدة، أو روابط ويب لمجموعات البيانات المتاحة للجمهور
وصف لأي قيود على توفر البيانات
بالنسبة لمجموعات البيانات السريرية أو بيانات الطرف الثالث، يرجى التأكد من أن البيان يتماشى مع سياستنا
تم تجميع تسلسلات شجرة النشوء والتطور لروبيسكو من النوع الثاني من UniRef100 يمكن الوصول إلى قراءات التسلسل الخام الخاصة بنا على NCBI SRA، رقم الوصول: PRJNA1181558 جميع البيانات الأخرى متاحة في النص الرئيسي أو المواد التكميلية.
البحث الذي يتضمن مشاركين بشريين، بياناتهم، أو مواد بيولوجية
معلومات السياسة حول الدراسات التي تشمل مشاركين بشريين أو بيانات بشرية. انظر أيضًا معلومات السياسة حول الجنس، الهوية/التقديم الجنسي، والتوجه الجنسي والعرق، والاثنية والعنصرية.
التقارير عن الجنس والنوع الاجتماعي
غير متوفر
التقارير عن العرق أو الإثنية أو غيرها من المجموعات الاجتماعية ذات الصلة
غير متوفر
خصائص السكان
غير متوفر
التوظيف
غير متوفر
رقابة الأخلاقيات
غير متوفر
يرجى ملاحظة أنه يجب أيضًا تقديم معلومات كاملة حول الموافقة على بروتوكول الدراسة في المخطوطة.
التقارير المتخصصة في المجال
يرجى اختيار الخيار أدناه الذي يناسب بحثك بشكل أفضل. إذا لم تكن متأكدًا، اقرأ الأقسام المناسبة قبل اتخاذ قرارك. علوم الحياة العلوم السلوكية والاجتماعية العلوم البيئية والتطورية والإيكولوجية لنسخة مرجعية من الوثيقة بجميع الأقسام، انظرnature.com/documents/nr-reporting-summary-flat.pdf
تصميم دراسة العلوم الحياتية
يجب على جميع الدراسات الإفصاح عن هذه النقاط حتى عندما يكون الإفصاح سلبياً.
حجم العينة
ثلاث نسخ أو أكثر كما هو موضح في لوحات الشكل. الاستثناء الوحيد هو العمل في المختبر في الشكل 6B من البيانات الموسعة (النقاط الرمادية المشار إليها في الشكل غير مكررة). لم يتم اختيار أحجام العينات بناءً على حساب. كانت القيمة الافتراضية لدينا للتكرار هي ثلاث نسخ. في حالة التجربة التي أنتجت مجموعة البيانات الأكثر أهمية (الشكل 1G) قمنا بإجراء 9 تكرارات.
استبعاد البيانات
لم يتم استبعاد أي بيانات، جميع البيانات متاحة في الملفات التكميلية.
استنساخ
كانت جميع المحاولات للتكرار ناجحة.
العشوائية
لم يتم استخدام العشوائية لأنها لم تكن مناسبة لهذه الدراسة، وتم إجراء جميع التحليلات برمجياً.
مُعَمي
لم يكن التعمية ذات صلة بدراستنا، حيث تم إجراء جميع التحليلات برمجياً.
التقارير عن مواد وأنظمة وطرق محددة
نحن بحاجة إلى معلومات من المؤلفين حول بعض أنواع المواد والأنظمة التجريبية والأساليب المستخدمة في العديد من الدراسات. هنا، يرجى الإشارة إلى ما إذا كانت كل مادة أو نظام أو طريقة مدرجة ذات صلة بدراستك. إذا لم تكن متأكدًا مما إذا كان عنصر القائمة ينطبق على بحثك، يرجى قراءة القسم المناسب قبل اختيار رد.
المواد والأنظمة التجريبية
طرق
غير متوفر
مشارك في الدراسة
غير متوفر
□
أجسام مضادة X
إكس
□
إكس
إكس
□
إكس
الحيوانات وغيرها من الكائنات الحية
إكس
□
البحث ذو الاستخدام المزدوج الذي يثير القلق
إكس
□
الأجسام المضادة
الأجسام المضادة المستخدمة أجسام مضادة متعددة النسائل من الأرانب ضد RbcL II، أجريسيرا، AS15 2955، الدفعة 2111 أجسام مضادة متعددة النسيلة من الماعز ضد IgG من الأرانب، أبكام، ab205718، الدفعة GR3366929-1 نسخة أحادية 8E2/2، فأر مضاد-DnaK، أبكام، ab69617، 103741-3 الأجسام المضادة للحمير ضد IgG الفأر-HRP، سانتا كروز للتكنولوجيا الحيوية، sc-2314، الدفعة C2012 التحقق تم التحقق من صحة الأجسام المضادة anti-rbcL II ضد Alexandrium catenella و Amphidinium carterae و Chaetoceros neogracilis و Rhodobacter capsulatus و Rhodospirillum rubrum (ذات الصلة بهذه الدراسة) تشو وآخرون (2021). SxtA يتواجد في البلاستيدات الخضراء والتغيرات في 3’UTR الخاصة به قد تقلل من تخليق السموم في ألكسندريوم كاتينيلا غير السام (المجموعة I). الطحالب الضارة، 2021، 101972، ISSN 1568-9883،https://doi.org/10.1016/j.hal.2020.101972تحديد المناعة بوش وآخرون (2019). التأثيرات المشتركة للتخميل المحاكي ونقص الأكسجين على الدينوفلاجيلات الضارة أمفيدينيوم كارتي. علم الأحياء البحرية، يونيو 2019، 166:80. لون وآخرون (2018). احتواء الكاربوكسيوم لإنزيم روبيسكو الذي يثبت CO2 في بلاستيدات التبغ. نات كوميونيك. 3 سبتمبر 2018؛ 9(1):3570. doi: 10.1038/s41467-018-06044-0.
تم استخدام الأجسام المضادة المضادة لـ DNAK في 37 اقتباسًا. يذكر المصنع: أجسام مضادة أحادية النسيلة من نوع DNAK. مناسبة للاستخدام في تقنية Western Blot وتفاعل مع البروتين الكامل المعاد تركيبه – الإشريكية القولونية، عينات الإشريكية القولونية. تم الاستشهاد بها في 37 منشورًا. المستضد يتوافق مع البروتين الكامل المتعلق بالإشريكية القولونية K-12 dnaK. تم التحقق من صحة الجسم المضاد ضد DnaK من الإشريكية القولونية، وهو ذو صلة بهذه الدراسة.
النباتات
مخزونات البذور
غير متوفر
أنماط جينية نباتية جديدة
غير متوفر
المصادقة
غير متوفر
معهد الجينوميات المبتكرة، جامعة كاليفورنيا بيركلي، بيركلي، كاليفورنيا، الولايات المتحدة الأمريكية.معهد هوارد هيوز الطبي، جامعة كاليفورنيا بيركلي، بيركلي، كاليفورنيا، الولايات المتحدة الأمريكية.قسم البيولوجيا الجزيئية والخلوية، جامعة كاليفورنيا بيركلي، بيركلي، كاليفورنيا، الولايات المتحدة الأمريكية.جامعة هايدلبرغ، هايدلبرغ، ألمانيا.قسم علم النبات والميكروبات، جامعة كاليفورنيا بيركلي، بيركلي، كاليفورنيا، الولايات المتحدة الأمريكية.مدرسة العلوم البيولوجية، جامعة نانيانغ التكنولوجية، سنغافورة، سنغافورة.قسم البيولوجيا، جامعة نابولي فيديريكو الثاني، نابولي، إيطاليا.معهد الطاقة الحيوية المشترك، مختبر لورانس بيركلي الوطني، إيميرفيل، كاليفورنيا، الولايات المتحدة الأمريكية.البيوفيزياء، جامعة كاليفورنيا بيركلي، بيركلي، كاليفورنيا، الولايات المتحدة الأمريكية.معهد كاليفورنيا للعلوم الحيوية الكمية (QB3)، جامعة كاليفورنيا في بيركلي، بيركلي، كاليفورنيا، الولايات المتحدة الأمريكية.مركز البيولوجيا الحاسوبية، جامعة كاليفورنيا بيركلي، بيركلي، كاليفورنيا، الولايات المتحدة الأمريكية.قسم البيولوجيا والهندسة البيولوجية، معهد كاليفورنيا للتكنولوجيا، باسادينا، كاليفورنيا، الولايات المتحدة الأمريكية.كلية الطب، جامعة كاليفورنيا سان دييغو، لا جولا، كاليفورنيا، الولايات المتحدة الأمريكية.قسم الجينوميات البيئية وعلم نظم الحياة، مختبر لورانس بيركلي الوطني، بيركلي، كاليفورنيا، الولايات المتحدة الأمريكية.قسم المواد الأولية، المعهد المشترك للطاقة الحيوية، إيميريفيل، كاليفورنيا، الولايات المتحدة الأمريكية.قسم علوم النبات والبيئة، معهد وايزمان للعلوم، رحوفوت، إسرائيل.البريد الإلكتروني: سافاج@بيركلي.إديو
Noam Prywes , Naiya R. Phillips , Luke M. Oltrogge , Sebastian Lindner , Leah J. Taylor-Kearney , Yi-Chin Candace Tsai , Benoit de Pins , Aidan E. Cowan , Hana A. Chang , Renée Z. Wang , Laina N. Hall , Daniel Bellieny-Rabelo , Hunter M. Nisonoff , Rachel F. Weissman , Avi I. Flamholz , David Ding , Abhishek Y. Bhatt , Oliver Mueller-Cajar , Patrick M. Shih , Ron Milo & David F. Savage
Abstract
Rubisco is the primary -fixing enzyme of the biosphere , yet it has slow kinetics . The roles of evolution and chemical mechanism in constraining its biochemical function remain debated . Engineering efforts aimed at adjusting the biochemical parameters of rubisco have largely failed , although recent results indicate that the functional potential of rubisco has a wider scope than previously known . Here we developed a massively parallel assay, using an engineered Escherichia coli in which enzyme activity is coupled to growth, to systematically map the sequence-function landscape of rubisco. Composite assay of more than of single-amino acid mutants versus concentration enabled inference of enzyme velocity and apparent affinity parameters for thousands of substitutions. This approach identified many highly conserved positions that tolerate mutation and rare mutations that improve affinity. These data indicate that non-trivial biochemical changes are readily accessible and that the functional distance between rubiscos from diverse organisms can be traversed, laying the groundwork for further enzyme engineering efforts.
Plants, algae and photosynthetic bacteria together fix around 100 gigatons of carbon annually using ribulose-1,5-bisphosphate carboxylase/ oxygenase (rubisco)-the most abundant enzyme on Earth . Rubisco catalysis, which is slow compared with many other central carbon metabolic enzymes , is thought to limit photosynthesis under common conditions . Rubisco is also prone to a side reaction with oxygen, leading to the hypothesis that this apparent inefficiency is in fact a careful balance of several biochemical trade-offs between rate, affinity and promiscuity .
Efforts to engineer improvements to rubisco have been hampered by the low throughput of obtaining accurate measurements for its parameters, including catalytic rate for carboxylation ( , called here), affinity ( ) and specificity for versus . A concentrated effort across several decades has produced several hundred biochemical measurements of natural and mutant rubiscos . Collection of these measurements has been biased towards vascular plant rubiscos, and the diversity of natural rubiscos remains undersampled. Library screens and rational mutations have been used in the past to increase rubisco activity. These efforts often resulted in improved expression but occasionally led to fundamental biochemical improvements .
Protein engineering has benefited in recent years from the introduction of machine learning approaches. One goal of such efforts is to train models with labelled protein sequence-function data from high-throughput functional screens . Enzyme engineering with machine learning presents a further challenge: ideally, functional data
would be decomposed into individual catalytic parameters measured in high throughput either in vitro or in vivo .
Here we have developed a selection assay in Escherichia coli to estimate the carboxylation fitness of more than of 8,835 of the single-amino acid mutants of the model Form II rubisco from Rhodospirillum rubrum (Extended Data Fig.1). Ribose phosphate isomerase was knocked out to generate -a strain that grows on glycerol only when it expresses functional rubisco (Extended Data Fig. 2a). We then generated a barcoded library of single-amino acid mutations of the . rubrum rubisco, which we assayed in high throughput using rpi. By varying the concentrations of the growth environment, we were able to estimate the effective affinities of of the rubisco variants-a subset of which we went on to validate in vitro. This screen showed a very small minority of mutations that improved affinity for around threefold. These affinities have never before been observed among bacterial rubiscos, are more typical of the Form I rubiscos found in plants and algae, and indicate that non-trivial alterations to biochemical function are rare, yet readily accessible through mutation.
Characterization of rubisco variants
The rubisco-dependent E. coli strain, Δrpi, cannot grow when glycerol is provided as the only carbon source because ribulose-5-phosphate accumulates with no outlet . The combined actions of phosphoribulokinase (PRK, which produces the five-carbon rubisco substrate) and
Fig. 1 | A deep mutational scan individually characterizes all single-amino acid mutations in rubisco. a, Summary of the metabolism of rpi-the rubiscodependent strain. b, Arpi grows with a rate proportional to the flux through rubisco.c, Schematic of library selection. A library of rubisco single-amino acid mutants was transformed into Δrpi then selected in minimal medium supplemented with glycerol at elevated . Samples were sequenced before and after selection and barcode counts were used to determine the relative fitness of each mutant.d, Correspondence between two example biological replicates; each point represents the median fitness among all barcodes for a given mutant. e, Fitness of 77 mutants with measurements in previous studies compared with the rate constants measured in those studies . The outlier
is I190T (see Methods for discussion). Fitness error values are the s.e.m. of nine replicate enrichment measurements; errors are from the literature, where available.f, Variant fitnesses (grey) were normalized between values of 0 and 1, with 0 representing the average of fitnesses of mutations at a panel of known active site positions (red distribution, average is plotted as a red dashed line) and 1 representing the average of wild-type (WT) barcodes (white dashed line). , Heatmap of variant fitnesses. Conservation by position and sequence logo were determined from a MSA of all rubiscos. Black triangle, G186 (an example of a position with high conservation that is mutationally tolerant); grey triangles, active site positions. Ri5P, ribose 5-phosphate; Ru5P, ribulose-5-phosphate; RuBP, ribulose-1,5-bisphosphate; TIM, triosephosphate isomerase.
rubisco rescue growth by converting this otherwise dead-end metabolite into 3-phosphoglycerate, which can feed back into central carbon metabolism (Fig. 1a and Extended Data Fig. 2a; for similar selection systems see refs. 23,24).
We first confirmed that the growth rate of rpi was related quantitatively to known in vitro enzyme behaviour (Fig. 1b and Extended Data Fig. 2b-1). Expression of rubisco driven by an inducible promoter demonstrated that growth rates increased with the rubisco concentration, indicating that increased enzyme concentration led to higher fitness (Extended Data Fig. 2b,d,g); at isopropyl- -d-thiogalactopyranoside (IPTG) concentrations above , growth yields began to decline, indicating that rubisco overexpression comes with a fitness cost. Similarly, we observed faster growth in the presence of higher concentrations (Extended Data Fig. 2c,d). We next assessed whether growth-based selection correlated with biochemical behaviour. Previous work on . rubrum rubisco identified 77 mutants spanning from
less than to of wild-type catalytic rate (Supplementary Data 1). Growth of a subset of these mutants was tested and found to correlate with reported catalytic rates (Extended Data Fig. 2i-k). Together, these results are consistent with glycerol growth of rpi being limited by rubisco carboxylation flux, which is determined by enzyme kinetics and -as well as enzyme and concentrations.
We next constructed a library of all single-amino acid substitutions to the model Form II rubisco from R. rubrum (Extended Data Fig. 3a). This library was cloned into a selection plasmid containing PRK, barcoded and bottlenecked to around 500,000 colonies. Long-read sequencing was used to map barcodes to mutants (Extended Data Figs. 3b and 4) and determined that the final library contained approximately 180,000 barcodes, representing 8,760 mutants or more than 99% of the designed library (Extended Data Fig. 4).
This library was transformed into rpi to assess mutant fitness (Fig. 1c). Mutant fitness is defined by the relative growth rate of
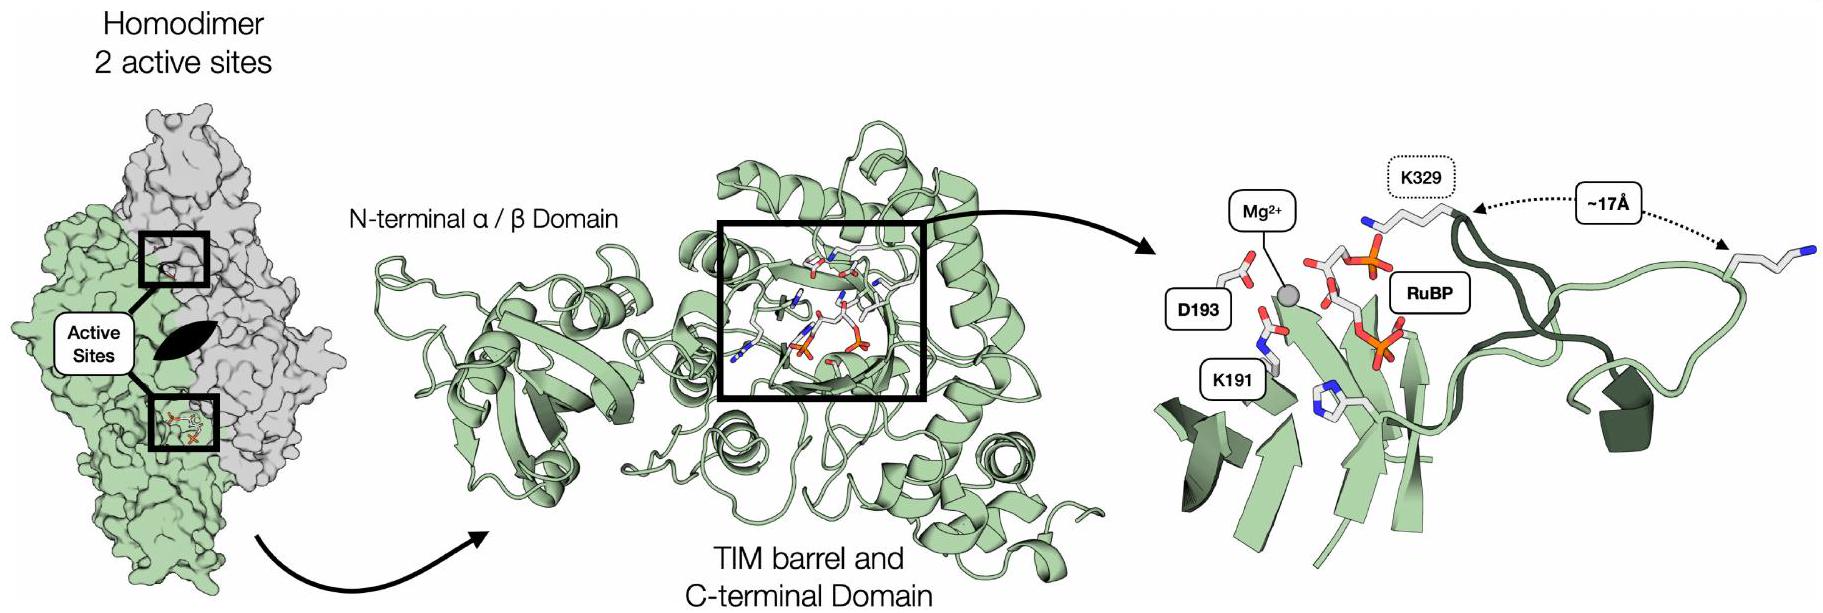
Fig. 2 | Fitness values provide structural, functional and evolutionary insights into rubisco. a, Structure of R. rubrum rubisco homodimer (Protein Data Bank (PDB) 9RUB) coloured by the average fitness value of a substitution at every site. Asterisks denote active sites.b, Variant effects for amino acids in different parts of the homodimer complex. c, Close-up view of the active site
and the mobile Loop 6 region. Radar plots show the fitness effects of all mutations at a given position. d, Comparison of average fitness at each position against phylogenetic conservation among all rubiscos. Positions coloured as inb. Positions 215 and 257 form a tertiary interaction (Extended Data Fig. 8c), position 186 is highly conserved with no known function.
expressing that mutant. Three independent library transformations were grown in selective conditions and grown for around seven divisions in (equivalent to approximately in solution; wild-type ). Selection was in the presence of IPTG-a concentration at which rubisco is limiting and overexpression stress is minimized but growth is relatively robust (Extended Data Fig. 2b,d). Short-read sequencing quantified barcode abundance before and after selection (Methods). Mutant fitness was calculated by normalizing pre- and post-selection read-count ratios to a panel of known catalytically dead mutants and all wild-type barcodes (Methods). Nine replicate experiments were performed with an average pairwise Pearson coefficient of 0.98 (Fig. 1d and Extended Data Fig. 5).
We compared mutant fitness measurements against 77 catalytic rate values taken from the literature (Fig. 1e and Supplementary Data1), as well as 35 in vitro measurements from purified mutants (Extended Data Fig. 6a,b), and observed a linear relationship. Overall, we observed a bimodal distribution of mutant effects (Fig. 1f), with mutant fitnesses clustering near wild-type (neutral mutations) and catalytically dead variants .
We measured fitness values for more than out of 8,835 of amino acid substitutions (Fig. 1g and Extended Data Figs. 4f and 7b). Fewer than of mutations seemed more fit than wild type (and when they did it was by a small amount (Fig. 1f)) and were found to be deleterious. In vitro analysis of 11 variants with improved fitness did not show higher values (Extended Data Fig. 6b) indicating that those small fitness effects were probably related to protein expression (Extended Data Fig. 2f-h). Mutations at known active site positions had very low fitness (for example, K191, K166 and K329; residues with grey triangles in Fig. 1g, bottom), and mutations to proline were more deleterious on average than any other amino acid (Extended Data Fig. 7a). Phylogenetic conservation and average fitness at each position tended to anti-correlate (Figs. 1g (top tracks) and 2d and Extended Data Fig. 8a) consistent with previous studies ; however, several positions seemed to be both highly conserved and mutationally tolerant (Fig. 1g, black triangle).
Fitness variation across the structure
Our fitness assays showed that some regions of the rubisco structure are much more sensitive to mutation than others (Fig. 2a,b).
Fig. and can be inferred from fitness across a titration.
a, Schematic of rubisco selection in [CO2] titration and some examples of inferred Michaelis-Menten curves of mutants with varying and . b, Variant fitnesses at different [ ]. c, Measured fitnesses at different [ ] for two mutants (error bars, s.d. of the mean for biological replicates). d, The same data as in c plotted under the assumptions of the Michaelis-Menten equation (error bars, s.d. of the mean for biological replicates). e, Individually measured rubisco kinetics for the same two mutants from cand d (points, medians of measurements; error bars, s.d.).f, Comparison between rubisco values measured in vitro (spectrophotometric assay) and those
inferred from fitness values is calculated from a Spearman correlation; value reflects the result of a two-sided permutations test analysis. error bars, inner quartiles of the bootstrap fits (Methods); in vitro error bars, s.d. from measurements.g, Heatmap of values for all mutants for which the coefficient of variation is less than mutants, of total). Two positions with high-affinity mutations are highlighted in the inset expanded below. Variants for which the fits had a coefficient of variation above 1 are in grey. h, Two-dimensional histogram of mutant and values from with hexagonal bins. Dashed lines, WT values.
For example, residues on the solvent-exposed faces of the structure are more tolerant to mutation, as expected, whereas active site and buried residues typically do not tolerate mutations well. A notable region of interest is Loop 6 of the triosephosphate isomerase barrel, which is known to fold over the active site during substrate binding and to participate in catalysis (Fig. 2c (inset) and Extended Data Fig. 1 (right panel)). Despite this key role in catalysis, some residues in this loop are highly tolerant to mutation (for example, E331 and E333), although the active site residue K329 is highly sensitive (Fig. 2c).
We expected that conserved positions would not tolerate mutations well. Consistent with this common hypothesis, the average fitness value at each position was negatively correlated with sequence conservation (Fig. 2d and Extended Data Fig. 8a). There were, however, many outliers, with several positions being highly conserved yet showing high mutational tolerance (for example, G186 (Fig. 2d, top right corner)). Selection in alternative conditions may reveal which selective forces have maintained high conservation at those positions . Positions with low conservation and low mutational tolerance may indicate a recently evolved, but critical, function ; for example, M215 and H257
Fig. 4 | Single-amino acid mutations can traverse the functional landscape.
a, versus effect size for each mutant. Effect size is the difference between the mutant and WT divided by the coefficient of variation of . b, PDB structure 9RUB; inset on the symmetry axis is expanded below. Each position appears twice due to proximity to the axis. versus of the indicated mutants (as measured by assay) versus all measured rubiscos from refs. 6,12). Shaded regions indicate known ranges of values for plants and algae in green and Form II bacterial rubiscos in pink. Star, WT R. rubrum; triangles, mutants A102Y and V266T.
(Fig. 2d) are in contact in the R. rubrum structure but are absent in Form I sequences (Extended Data Fig. 8a-c).
Affinity inferred by substrate titration
Enzyme fitness is determined by the underlying biochemical parameters, including catalytic rates and affinities. To measure these parameters individually, we performed a substrate titration on the whole library of mutations in tandem (Fig. 3a). Mutant fitness values varied overall with increasing (Fig. 3b) and some mutants’ fitnesses were affected strongly (Fig. 3c). We fit the data to a Michaelis-Menten model of catalysis to estimate effective maximum rates ( ) and half-saturation constants (the tildes distinguish library-derived fit parameters from those measured in vitro). This fitting (Fig. 3d; Methods) generated and estimates for every mutant (Fig. 3g and Extended Data Fig. 8c,d). We judged the reliability of the estimates by the coefficient of variation (s.d. over the mean; ) of 1,100 bootstrap fits of the data for each mutation (Methods); we focus here on the of the mutants that had a coefficient of variation under 1 (ref. 26). The remaining 35% are primarily mutants with low fitness values (Extended Data Fig. 6e) that may fail to fold altogether, although at higher expression levels or in combination with other mutations it may yet be possible to produce reliable estimates of their effects on rate and affinity.
We validated our estimates by purifying a set of seven mutants chosen to span a range of predicted values and measuring their affinities in vitro (Fig. 3e,f). Unexpectedly, for several mutants, the values measured in vitro were substantially lower (higher affinity) than expected from our previous estimates on the basis of fitness data. For example, the of V266T was around , but was determined to be roughly (Fig. 3f,g; highlighted box). Four mutations stood out in our analysis for having especially low , V266T, A289C and A289T (Fig. 4a).
Our estimates of correlated with fitness ( ; Extended Data Fig. 6h), indicating that it is the primary driver of rubisco flux. However, [rubisco] so variation in can have two potential causes: rubisco expression level and estimates report the product of those two factors.
We further found that and estimates anti-correlate for variants with near-wild-type kinetics where the estimates are most
reliable (Fig. 3h). This correlation implies that, in the absence of selective pressure, most single-amino acid mutations impair affinity and in tandem. It is important to note that, since the addition step in catalysis is thought to be irreversible and there is no binding site for in the enzyme , all measured affinities reflect onrates. The observed anticorrelation between and may therefore be related to subtle changes in the electronics of the active site or the geometry of the bound sugar substrate before or during bond formation with . It is also possible that these effects are caused by changes to enzyme stability.
Mutations at three positions (A289C, A102Y, V266T, A289T) induced strong improvements in affinity in vivo (Figs. 3 g and 4a). Other mutations at these same positions reduced affinity (for example, V266G, A102F and A289G; Fig. 3c-g). These three positions are not part of the active site and sit near the axis of the rubisco homodimer interface (Fig. 4b). In this region of the structure, residues are in closest proximity to ‘themselves’, that is, to their counterpart residue in the other monomer of the homodimer. The role these amino acids play in entry into the active site, active site conformation or electrostatics remains unclear.
In vitro measurements confirmed that V266T and A102Y possess improved affinities (we were unable to purify A 289 C ). This correspondence between measured in vivo and measured in vitro stands in contrast to mutations with , where follow-up biochemistry (Extended Data Fig. 8b and Supplementary Data File 1) did not show faster values. Variants with improved were probably improved through higher protein expression. Unlike , the affinity parameter is independent of enzyme concentration so predictions are expected to be more accurate. V266T and A102Y both exhibit roughly proportional reductions in catalytic rate (Fig. 4c, Extended Data Fig. 9c and Extended Data Table 2). These mutations had no effect on versus specificity (Extended Data Fig. 9a,c and Extended Data Table 2) indicating that the ‘cost’ of improved affinity is paid for in catalytic rate alone. A102Y had a reduced , whereas that of V266T did not change from wild type. It is unclear what relationship, if any, there is in the shifts in and . Overall, the and measurements place these mutants outside the range heretofore measured among bacterial Form II variants and at the edge of the distribution of plants and algae.
Conclusion
Among the narrow range of sequences measured here, it was possible to identify mutants with substantially improved affinity, indicating that the enzyme parameter landscape is rugged, with apparent gain-of-function readily accessible. Form I plant rubiscos typically share less than identity with Form II bacterial rubiscos (more than 200 mutations; Extended Data Fig. 8d) and are thought to have evolved under a different set of selective constraints. Furthermore, Form I and II rubiscos have different oligomeric states and Form II rubiscos lack the small subunit characteristic of Form I, so it is surprising that it is possible to traverse the functional space between them with just one amino acid change.
In this study, we were unable to account for two factors of metabolic flux through rubisco: protein expression and side-reactivity with oxygen. Fitness correlation with known values (Fig. 1e and Extended Data Fig. 6a) and our in vitro measurements (Extended Data Fig. 6b) indicate that the data are predictive, even without knowledge of expression. However, mutations such as I164T cause differences in protein expression as a function of IPTG induction (Extended Data Fig. 2f,h) which has an effect on the relative growth rate as compared with wild type (Extended Data Fig. 2g). Indeed, when we examined mutations with fitness values higher than those of wild type, we observed a consistent regression in their rates measured in vitro (Extended Data Fig. 6b, inset). We interpret this trend to indicate that some fraction of mutations have a small or no effect on while modestly improving
expression levels. Further work is required to measure and account for this effect . The side reaction of rubisco is also important, as increasing the oxygen concentration from to causes rpi to decline in growth rate and yield (Extended Data Fig. 2e), presumably because of 2-phosphoglycolate production. The effect of oxygen on individual mutants may be determined through an oxygen titration and library selection.
In R. rubrum, the present-day sequence evolved under constraints that include endogenous regulation, environmental selective pressure and possible trade-offs between enzymatic parameters. Various trade-offs have been proposed in the catalytic mechanism of rubisco , including one between catalytic rate and affinity . The reductions in (but not ) observed in the mutants with the highest affinity is consistent with such a trade-off (Fig. 4c). A selection of a library of higher order mutants that spans a wider range of rubisco functional possibilities could confirm or reject a trade-off. The trade-offs in bacterial rubiscos may also constrain the evolution of plant rubiscos. However, previous work comparing the sequence-to-function map of related proteins found substantial context dependence on the effects of mutations . Due to advancements in expressing plant rubiscos in E. coli , it may be possible to use this assay to understand the biochemical constraints of the organisms responsible for nearly all of terrestrial photosynthesis .
The overall space of rubiscos remains largely unexplored, raising the question of whether natural evolution has already produced rubiscos optimized for every environment. Arpi may permit a higher throughput exploration of sequence space to find regions that are constrained by different trade-offs and produce substantial engineering improvements.
Online content
Any methods, additional references, Nature Portfolio reporting summaries, source data, extended data, supplementary information, acknowledgements, peer review information; details of author contributions and competing interests; and statements of data and code availability are available at https://doi.org/10.1038/s41586-024-08455-0.
Bar-On, Y. M. & Milo, R. The global mass and average rate of rubisco. Proc. Natl Acad. Sci. USA 116, 4738-4743 (2019).
Bar-Even, A. et al. The moderately efficient enzyme: evolutionary and physicochemical trends shaping enzyme parameters. Biochemistry 50, 4402-4410 (2011).
Bouvier, J. W., Emms, D. M. & Kelly, S. Rubisco is evolving for improved catalytic efficiency and assimilation in plants. Proc. Natl Acad. Sci. USA 121, e2321050121 (2024).
Bathellier, C., Tcherkez, G., Lorimer, G. H. & Farquhar, G. D. Rubisco is not really so bad. Plant Cell Environ. 41, 705-716 (2018).
Prywes, N., Phillips, N. R., Tuck, O. T., Valentin-Alvarado, L. E. & Savage, D. F. Rubisco function, evolution, and engineering. Annu. Rev. Biochem. 92, 385-410 (2023).
Davidi, D. et al. Highly active rubiscos discovered by systematic interrogation of natural sequence diversity. EMBO J. 39, e104081(2020).
Flamholz, A. I. et al. Functional reconstitution of a bacterial concentrating mechanism in Escherichia coli. eLife 9, e59882(2020).
Bar-On, Y. M., Phillips, R. & Milo, R. The biomass distribution on Earth. Proc. Natl Acad. Sci. USA 115, 6506-6511 (2018).
Wu, A. et al. A cross-scale analysis to understand and quantify the effects of photosynthetic enhancement on crop growth and yield across environments. Plant Cell Environ. 46, 23-44 (2023).
Tcherkez, G. G. B., Farquhar, G. D. & Andrews, T. J. Despite slow catalysis and confused substrate specificity, all ribulose bisphosphate carboxylases may be nearly perfectly optimized. Proc. Natl Acad. Sci. USA 103, 7246-7251 (2006).
Savir, Y., Noor, E., Milo, R. & Tlusty, T. Cross-species analysis traces adaptation of Rubisco toward optimality in a low-dimensional landscape. Proc. Natl Acad. Sci. USA 107, 3475-3480 (2010).
Flamholz, A. I. et al. Revisiting trade-offs between Rubisco kinetic parameters. Biochemistry 58, 3365-3376 (2019).
Iñiguez, C. et al. Evolutionary trends in RuBisCO kinetics and their co-evolution with concentrating mechanisms. Plant J. 101, 897-918 (2020).
Wilson, R. H., Alonso, H. & Whitney, S. M. Evolving Methanococcoides burtonii archaeal Rubisco for improved photosynthesis and plant growth. Sci. Rep. 6, 22284 (2016).
Wilson, R. H., Martin-Avila, E., Conlan, C. & Whitney, S. M. An improved Escherichia coli screen for Rubisco identifies a protein-protein interface that can enhance CO2-fixation kinetics. J. Biol. Chem. 293, 18-27 (2018).
Faure, A. J. et al. Mapping the energetic and allosteric landscapes of protein binding domains. Nature 604, 175-183 (2022).
Ding, D. et al. Protein design using structure-based residue preferences. Nat. Commun. 15, 1639 (2024).
Gonzalez Somermeyer, L. et al. Heterogeneity of the GFP fitness landscape and datadriven protein design. eLife 11, e75842 (2022).
Thompson, S., Zhang, Y., Ingle, C., Reynolds, K. A. & Kortemme, T. Altered expression of a quality control protease in E. coli reshapes the in vivo mutational landscape of a model enzyme. eLife 9, e53476 (2020).
Stiffler, M. A., Hekstra, D. R. & Ranganathan, R. Evolvability as a function of purifying selection in TEM-1 β-lactamase. Cell 160, 882-892 (2015).
Russ, W. P. et al. An evolution-based model for designing chorismate mutase enzymes. Science 369, 440-445 (2020).
Markin, C. J. et al. Revealing enzyme functional architecture via high-throughput microfluidic enzyme kinetics. Science 373, eabf8761 (2021).
Parikh, M. R., Greene, D. N., Woods, K. K. & Matsumura, I. Directed evolution of RuBisCO hypermorphs through genetic selection in engineered E. coli. Protein Eng. Des. Sel. 19, 113-119 (2006).
Mueller-Cajar, O., Morell, M. & Whitney, S. M. Directed evolution of rubisco in Escherichia coli reveals a specificity-determining hydrogen bond in the form II enzyme. Biochemistry 46, 14067-14074 (2007).
Sarkisyan, K. S. et al. Local fitness landscape of the green fluorescent protein. Nature 533, 397-401 (2016).
Jones, E. M. et al. Structural and functional characterization of G protein-coupled receptors with deep mutational scanning. eLife 9, e54895 (2020).
Subramanian, S. et al. Allosteric communication in DNA polymerase clamp loaders relies on a critical hydrogen-bonded junction. eLife 10, e66181(2021).
Mavor, D. et al. Extending chemical perturbations of the ubiquitin fitness landscape in a classroom setting reveals new constraints on sequence tolerance. Biol. Open 7, bio036103 (2018).
Douglas-Gallardo, O. A., Murillo-López, J. A., Oller, J., Mulholland, A. J. & VöhringerMartinez, E. Carbon dioxide fixation in RuBisCO is protonation-state-dependent and irreversible. ACS Catal. 12, 9418-9429 (2022).
Gutteridge, S., Parry, M. A. J., Schmidt, C. N. G. & Feeney, J. An investigation of ribulosebisphosphate carboxylase activity by high resolution NMR. FEBS Lett. 170, 355-359 (1984).
Aigner, H. et al. Plant RuBisCo assembly in E. coli with five chloroplast chaperones including BSD2. Science 358, 1272-1278 (2017).
Publisher’s note Springer Nature remains neutral with regard to jurisdictional claims in published maps and institutional affiliations.
We cloned in a combination of E. coli TOP10 cells, DH5 and NEB Turbo cells. Protein expression was carried out using BL21(DE3). Arpi was produced previously from the BW25113 strain. An rpiB knockout was obtained from the Keio collection. rpiA and the edd gene were knocked out through P1 transduction and subsequent curing of the kanamycin marker with pCP20 (ref. 32). The result of these three knockouts, , was . The EDD deletion makes the strain rubisco dependent when grown on gluconate-a feature we did not make use of in this study.
Plasmids
Sequences and further details about plasmids used in this study can be found in Supplementary Data 3.
pUC19_rbcL. The rubisco mutant library was assembled in a standard pUC19 vector. This plasmid was used as a PCR template for each of the 11 sub-library ligation destination sites.
NP-11-64-1. Selections were conducted using a plasmid designed for this study with a p15 origin, chloramphenicol resistance, LacI controlling rubisco expression, TetR controlling PRK expression and a barcode.
NP-11-63. Protein overexpression in BL21(DE3) cells was conducted using pET28 with a SUMO domain upstream of the expressed gene . pSF1389 is the plasmid that expresses the necessary SUMOlase, bdSENP1, from Brachypodium distachyon.
Primers
All primers were purchased from IDT and the oligonucleotide pool was purchased from Twist Bioscience. For sequences, see Supplementary Data 3.
Library design and construction
The R. rubrum rubisco sequence was codon-optimized for E. coli and mutated systematically by means of the scheme outlined in Extended Data Fig. 3. The rubisco gene was split into 11 pieces. For each of those pieces (around 200 base pairs (bp) each) all point mutants were designed and synthesized as oligonucleotide pools. Eleven oligo sub-library pools, containing all single mutants within their respective region of around 200 bp, were purchased from Twist Bioscience and each sub-library was amplified individually using Kapa Hifi polymerase with a cycle number of 15 . Each rubisco gene fragment was inserted into a corresponding linearized pUC19 destination vector, containing the remainder of the rubisco sequence flanking the insert, through golden gate assembly. This assembly generated 11 sub-libraries of the full-length . rubrum rubisco gene, with each sub-library containing a region of approximately 200 bp including all single mutants. Each of these 11 rubisco libraries were transformed separately into E. coli TOP10 cells and, in each case, more than 10,000 transformants were scraped from agar plates to ensure oversampling of the roughly 1,000 variants in each sub-library. Plasmids were purified from each sub-library and mixed together at equal molar ratios to generate the full protein sequence library.
To produce the final library for assay, a selection plasmid containing an induction system for rubisco and PRK (Tac- and Tet-inducible, respectively) was amplified with primers that included a random 30 nucleotide barcode. The linearized plasmid amplicon and the library were cut with Bsal and BsmBI, respectively, ligated together and transformed into TOP10 cells. Plasmid was purified by scraping around 500,000 colonies and transformed in triplicate into Δrpi cells. These transformations were grown in yeast extract tryptone medium to logphase (optical density ) and frozen as glycerol stocks.
Bacterial growth analysis
Bacterial strains were grown overnight in yeast extract tryptone medium to saturation and then backdiluted. Once cultures reached exponential growth ( ) they were diluted into of M9 media in 96-well plates with chloramphenicol and the indicated concentrations of anhydrotetracycline and IPTG to a final of 0.005 or 0.0005 . Growth was monitored in a Spark plate reader (Tecan) while maintaining and the indicated and concentrations. Shaking consisted of alternating 5 min of orbital and 5 min of double orbital modes and measurements were collected every 10 min . Growth yields were calculated up to 40 h and growth rates were calculated as the growth rate between values of 0.001 and 0.01 (the most consistently exponential range in our curves).
Long-read sequencing analysis
The plasmid library was cut with SacII and sent for Sequel II PacBio sequencing. Reads were aligned and grouped by their barcodes. All reads of a given barcode were aligned and a consensus sequence was obtained using SAMtools . Consensus sequences were retained if they were WT or had one mutation that matched the designed library. Any mutation in the backbone invalidated a barcode. A lookup table was generated to link each barcode to its associated mutation. The data analysis methods described in this study are publicly available at https://github.com/SavageLab/rubiscodms.
Library characterization and screening
Selections were performed by diluting of glycerol stock with an OD of around 0.25 into 5 ml of M9 minimal medium with added chloramphenicol ( ), glycerol ( ), IPTG and 20 nM anhydrotetracycline. These cultures were grown in 11 ml culture tubes at in a Percival AR-22 growth chamber at different concentrations on a New Brunswick Scientific Innova 2000 shaker at 250 rpm at an angle of . Cultures were grown until they reached an OD at 5 ml of . This corresponds to a 100 -fold expansion of the cells, that is, between six and seven doublings.
Cultures before and after selection were spun down and we lysed the cells and performed a standard plasmid extraction protocol using QIAprep Spin Miniprep Kit (Qiagen). Illumina amplicons were generated by PCR of the barcode region. These amplicons were sequenced using a NextSeq P3 kit.
Calculation of variant enrichment
Variant enrichments were computed from the log ratio of barcode read counts. The enrichment calculations include two processing parameters: a minimum count threshold ( ) and a pseudo-count constant . The count threshold is the minimum number of barcode reads that must be observed either pre- or post-selection for the barcode to be included in the enrichment calculation. The pseudo-count constant is used to add a small positive value to each barcode count to circumvent division by zero errors. We use a pseudo-count value that is weighted by the total number of reads in each condition. For the th variant and the individual barcodes, , passing the threshold condition the variant enrichment is calculated as,
To identify optimal values for these parameters, we computed the variant enrichments across a two-dimensional parameter sweep of and to find the combination that resulted in the maximum mean Pearson correlation coefficient across all replicates at each condition. These were and (average of 0.3 pseudo-counts after multiplying by the total number of reads in each experiment, or ), leading to a correlation coefficient of 0.978 .
Variant enrichment, , was then calculated for every mutant using equation (1).
The variant enrichments were then normalized such that wild type has an enrichment value of 1 in all conditions and catalytically dead mutants have a median enrichment of 0 . For the ‘dead’ variant enrichment, we computed the median enrichment for all mutations at the catalytic positions K191, K166, K329, D193, E194 and H287. The normalized enrichments at each condition were computed as
where is the enrichment of the th variant as given in equation (1), is the wild-type enrichment and is the median enrichment across all mutants of the catalytic residues listed above.
Michaelis-Menten fits to enrichment data
The DMS library enrichments across different CO2 concentrations were used to estimate Michaelis-Menten kinetic parameters for every variant. Guided by the linear relationship between growth rate and observed in Fig. 1e, we assume that the cell growth rate is proportional to the rubisco enzyme velocity to derive the titration fits (see ‘Derivation of Michaelis-Menten fit’, equation (S1))
is the ratio of mutant maximum velocity relative to wild type, is the wild-type for which we used the value , and is the mutant . The titration curves in triplicate for each variant were fit to equation (3) using non-linear least squares curve fitting while requiring both and to be positive.
We noted that the fits to certain variants-particularly ones with low -were sensitive to the choice of processing parameters and . Given the semi-arbitrary nature of these parameters, this is clearly an undesirable dependence and engenders low confidence in the inferred values. To account for this uncertainty we conducted a parameter sweep (with 11 different values linearly spaced between 0 and 50, and values log spaced between and ), and computed the variant enrichments for all combinations of these parameters. We then performed ten subsamplings of the replicates for all parameter sets and performed the ratiometric Michaelis-Menten fit. From this set of fit values for each variant we computed a quartile-based coefficient of variation that was used as a figure of merit for the .
Multiple sequence alignment
A multiple sequence alignment (MSA) of the broader rubisco family beyond Form II rubiscos was created using the profile HMM homology search tool jackhmmer . Starting with the R. rubrum rubisco sequence, jackhmmer applied five search iterations with a bit score threshold of 0.5 bits per residue against the UniRef100 database of non-redundant protein sequences . To compute phylogenetic conservation at each position, for each possible amino acid we computed the fraction of the total sequences that had that amino acid at the corresponding position of the MSA. The phylogenetic conservation is the maximum fraction, where the maximum is taken over all possible amino acids. Thus, if a position has an alanine in of the sequences of the MSA, the phylogenetic conservation will be 0.9 .
Protein purification
E. coli BL21(DE3) cells were transformed with pET28 (encoding the desired rubisco with a His and SUMO affinity tag) and pGro plasmids (Takara). Colonies were grown at in 100 ml of yeast extract tryptone medium under kanamycin selection to an
OD of . Arabinose was added to each culture, which was then incubated at for 30 min . Protein expression was induced with IPTG (Millipore) at and cells were grown overnight at . Cultures were spun down ( ) and purified as reported . In brief, cultures were spun down and lysed using BPER II (Thermo Fisher). Lysates were centrifuged to remove insoluble fraction. Rubisco was purified by His-tag purification using Ni-NTA resin (Thermo Fisher) and eluted by SUMO tag cleavage with bdSUMO protease (as produced in ref. 6). Purified proteins were concentrated and stored at until kinetic measurement (within 24 h ). Samples were resolved by SDS-polyacrylamide gel electrophoresis to ensure purity.
Rubisco spectrophotometric assay
Both and measurements use the same coupled-enzyme mixture wherein the phosphorylation and subsequent reduction of 1,3-bisphosphoglycerate-the product of RuBP carboxylation-was coupled to NADH oxidation, which can be followed through absorbance. Following Kubien et al. and Davidi et al. , the reaction mixture (Extended Data Table 1) contains buffer at dithiothreitol, 2 mM ATP, 10 mM creatine phosphate, EDTA and each of phosphoglycerate kinase, glyceraldehyde-3-phosphate dehydrogenase and creatine phosphokinase. Reaction volumes are and samples are shaken once before absorbance measurements begin. Absorbance measurements are collected on a SPARK plate reader with and control (Tecan). The extinction coefficient of NADH in the plate reader was determined through a standard curve of NADH solutions of known concentration (determined by a Genesys 20 spectrophotometer with a standard 1-cm path length, Thermo Fisher). Absorbance decline over time gives a rate of NADH oxidation and therefore a carboxylation rate. Because rubisco produces two molecules of 3-phosphoglycerate for every carboxylation reaction, we assume a 2:1 ratio of NADH oxidation rate to carboxylation rate.
Spectrophotometric measurements of . The carboxylation rate constant ( ) of each rubisco was measured using methods established previously . In brief, rubisco was activated by incubation for 15 min at room temperature with and and added (final concentration of 80 nM ) to aliquots of appropriately diluted assay mix (Extended Data Table 1) containing different 2-carboxy-D-arabinitol-1,5-bisphosphate (CABP) concentrations pre-equilibrated in a plate reader (Infinite 200 PRO; TECAN) at , under the same gas concentrations. After 15 min , RuBP (final concentration of 1 mM ) was added to the reaction mix and the absorbance at 340 nm was measured to quantify the carboxylation rates. A linear regression model was used to plot reaction rates as a function of CABP concentration. The was calculated by dividing the intercept (reaction rates) by the intercept (concentration of active sites). Protein was purified in triplicate for determination.
Spectrophotometric measurements of . Purified rubisco mutants were activated ( 40 mM bicarbonate and ) and added to a 96-well plate along with assay mix (Extended Data Table 1, in this case the same concentration of HEPES pH 8 buffer was used but EPPS can be substituted). Bicarbonate was added for a range of concentrations ( and 150 mM ). Plates and RuBP were pre-equilibrated at and at room temperature. RuBP was added to a final concentration of 1.25 mM with water serving as a control for each replicate. NADH oxidation was measured by as in the assay. Absorbance curves were analysed using a custom script to perform a hyper-parameter search to choose a square in which to take the slope as carboxylation rate that best represented most of the monotonic decrease in was derived by fitting the Michaelis-Menten curve using a non-linear least squares method. Error bars were determined depending on replicates: (1) multi day replicates: Michaelis-Menten
fits were made for each replicate, s.e. and median were calculated on the basis of these fits. (2) Triplicates: absorbance data were fit to extract initial rates using different hyper-parameters and the median of these fits was used subsequently. Three different sets of initial rates were calculated on the basis of the technical replicates: one based on the median absorbance values, one based on the median minus the s.d., and one based on the median plus the s.d. Michaelis-Menten fits to these three sets of calculated rates were made and error bars show the difference between the low boundary, median and high boundary set.
Spectrophotometric measurements of was determined in a similar manner to and . A titration of RuBP concentrations was used to generate rate-saturation curves under an atmosphere of and . Simple linear regression was used to fit the absorbance decays. was derived by fitting the Michaelis-Menten curve using a non-linear least squares method. Error was determined from the square root of the diagonals of the covariance matrix during fitting. The values from spectrophotometric assays are reported in Fig. 3f and Extended Data Figs. 6b,d and 9b.
Radiometric measurements of and fixation assays were conducted as in ref. 6 with minor modifications. Assay buffer ( 100 mM EPPS- NaOH pH EDTA) was sparged with gas. Rubisco, purified as described above, was diluted to around (quantified using ultraviolet absorbance) in the assay buffer. It was then diluted with one volume of assay buffer containing 40 mM to activate. Reactions ( 0.5 ml ) were conducted at in septum-capped glass scintillation vials (Perkin-Elmer) with carbonic anhydrase, 1 mM RuBP and concentrations ranging from 0.4 to 17 mM (which corresponds to ). The assay was initiated by the addition of a aliquot of activated rubisco and stopped after 2 min by the addition of formic acid.
The specific activity of was measured by performing a 1 -h assay at the highest concentration containing 10 nmol of RuBP. Reactions were dried on a heat block, resuspended in 1 ml water and mixed with 3 ml Ultima Gold XR scintillant for quantification with a Hidex scintillation counter.
The rubisco active site concentration used in each assay was quantified in duplicate by a -CABP binding assay. A10- l sample of the roughly rubisco solution was activated in assay buffer containing 40 mM cold (final volume ) for at least 10 min . Then, of -carboxypentitol bisphosphate was added and incubated for at least 1 h at ]-2-CABP bound rubisco was separated from free -2-CPBP by size exclusion chromatography (Sephadex G-50 Fine, GE Healthcare) and quantified by scintillation counting.
The data were fit to the Michaelis-Menten equation using the concatenated data of three to four experiments performed on different days. This assay was used to determine the values in Fig. 4c and Extended Data Fig. 9c.
Membrane inlet mass spectrometry determination of rubisco specificity. The method described in ref. 37 was adapted for a membrane inlet mass spectrometry (MIMS) instrument (Bay Instruments). The ion signal was calibrated by measuring the ion at atmospheric and at ‘zero’ . An atmospheric calibrant was achieved by equilibrating the MIMS buffer ( 200 mM Hepes , ) with air for 1 h at . The ‘zero’ ion signal was determined by then adding approximately to the cuvette. was calibrated by adding various amounts of to a solution of 100 mM HCl and recording the ion signal. In both cases, linear fits of ion counts to gas concentrations provided a simple conversion to determine gas concentrations and consumption rates. These calibrations had to be performed on every day in which the assay was used.
Rubisco enzymes were activated in 20 mM Hepes pH 8, 100 mMNaCl , and 20 mMNaHCO 3 . Activated enzyme was added to of MIMS buffer equilibrated with air at a concentration of . Bovine carbonic anhydrase (Sigma Aldrich) was added at a final concentration of and was added to a final concentration of 4 mM . The reaction was stirred in the sealed MIMS reaction chamber for approximately 2 min to collect a pre-reaction signal. The reaction was initiated by the addition of 2 mM RuBP. and consumption rates were background corrected and converted to reaction velocities through conversion using the coefficients determined during calibration. Specificities were determined in triplicate by the following equation: , where DIC is the dissolved inorganic carbon pool.
Quantification of soluble enzyme concentration by immunoblotting
The strain with wild-type rubisco was grown under selective conditions (overnight at in M9 medium with glycerol and 20 nM with varying IPTG concentrations at for 24 h . Afterwards, turbid cultures were centrifuged ( ) culminating in roughly 20 mg pellet per sample. Pellets were lysed with of BPER II and supernatant was transferred into a fresh tube and mixed with SDS loading dye. A Bio-Rad RTA Transfer Kit for Trans-Blot Turbo Low Fluorescence PVDF was used in combination with the Trans-Blot Turbo Transfer System. The PVDF membrane was carefully cut between 50 and 70 kDa post-blocking using a razor blade. Primary anti-RbcL II Rubisco large subunit Form II Antibody from Agrisera (1:10,000) and DnaK Antibody from Abcam (1:5,000) were incubated separately. Secondary horseradish-peroxidase-conjugated antibodies Donkey anti-mouse for DnaK (Santa Cruz Biotechnology) and Goat pAB to RB IgG horseradish peroxidase (Abcam were both used at ). Subsequently, Bio-Rad Clarity Max Western ECL substrates were applied and the final results were imaged using a GelDoc (Bio-Rad).
Mutant fitness outlier
I190T (Fig. 1e) was the only outlier in our comparison of in vitro measurements from the literature and our fitness data. Because the value was reported without error estimates , we re-measured the of this mutant and found it to be , which is of the wild-type value, down from previously reported. Still, the value seems to be anomalous compared with the rest of the trend (Extended Data Fig. 6b). One potential explanation is that the mutation at that position has a strong negative effect on protein expression. Another possibility, given that I190T is adjacent to the key active site lysine, K191, is that I190T causes a negative effect on lysine carbamylation that is, for some reason, more pronounced in vivo than in vitro.
Derivation of Michaelis-Menten fit
Following Stiffler et al. we assume that the differences in bacterial growth rate are proportional to the differences in growth-limiting enzymatic activity.
Under the presumption of log-phase growth, the expected log ratio of reads after elapsed time and normalized to the wild-type reads is given by
(Note that equation (S2) would also contain a normalization factor to account for the total number of reads obtained for the pre- and post-selection conditions. It is, however, a common factor for both the mutant and wild-type counts and therefore cancels out. Furthermore, the real analysis also includes pseudo-counts, which are omitted here in
the derivation of the fit equation for simplicity. Substituting in the condition of exponential growth, that is, , and simplifying yields,
To normalize the enrichments, we divide by the log enrichment of the wild-type counts relative to the median enrichment of variants with mutated catalytic residues (and thus catalytically dead rubisco). We then add one for the convention that dead variants be centred at an enrichment of 0 and that wild-type be at an enrichment of 1 . Thus, the normalized mutant enrichment is,
Then substituting equation (S3) we obtain,
Using the assumption in equation (S1) and the fact that the enzyme velocity of dead mutants is 0 , we obtain the expected normalized enrichment as a function of the rubisco velocities,
Finally, using the Michaelis-Menten equation we obtain the predicted enrichments as a function of concentration and the enzyme kinetic parameters.
Thus, in practice, we use equation (S7) as the fit equation to the normalized enrichment values for each variant across a range of concentrations. For each we have, as fit parameters, the ratio of maximum velocities between the mutant and wild type, , and the mutant with the wild-type set to the literature value of .
Reporting summary
Further information on research design is available in the Nature Portfolio Reporting Summary linked to this article.
Data availability
All data for this paper are available at https://github.com/SavageLab/ rubiscodms. Sequences for our Form II rubisco phylogeny were
assembled from UniRef100. Our raw sequencing reads can be accessed on the NCBI SRA (accession PRJNA1181558). All other data are available in the paper or the Supplementary Information.
Code availability
All code for this paper is available at https://github.com/SavageLab/ rubiscodms.
32. Datsenko, K. A. & Wanner, B. L. One-step inactivation of chromosomal genes in Escherichia coli K-12 using PCR products. Proc. Natl Acad. Sci. USA 97, 6640-6645 (2000).
33. Danecek, P. et al. Twelve years of SAMtools and BCFtools. Gigascience 10, giab008 (2021).
34. Johnson, L. S., Eddy, S. R. & Portugaly, E. Hidden Markov model speed heuristic and iterative HMM search procedure. BMC Bioinf. 11, 431 (2010).
35. Suzek, B.E. et al. UniRef clusters: a comprehensive and scalable alternative for improving sequence similarity searches. Bioinformatics 31, 926-932 (2015).
36. Kubien, D. S., Brown, C. M. & Kane, H. J. Quantifying the amount and activity of Rubisco in leaves. Methods Mol. Biol. 684, 349-362 (2011).
37. Cousins, A. B., Ghannoum, O., VON Caemmerer, S. & Badger, M. R. Simultaneous determination of Rubisco carboxylase and oxygenase kinetic parameters in Triticum aestivum and Zea mays using membrane inlet mass spectrometry. Plant Cell Environ. 33, 444-452 (2010).
38. Gutteridge, S., Lorimer, G. & Pierce, J. Details of the reactions catalysed by mutant forms of rubisco. Plant Physiol. Biochem. 26, 675-682 (1988).
39. Iñiguez, C., Niinemets, Ü., Mark, K. & Galmés, J. Analyzing the causes of method-to-method variability among Rubisco kinetic traits: from the first to the current measurements. J. Exp. Bot. 72, 7846-7862 (2021).
Acknowledgements We thank N. Antonovsky and A. Bar-Even for taking part in formulating the basis for this work, as well as N. Tepper and S. Amram for originally conceiving of and producing the rpi strain, respectively. We thank P. Romero, N. Thompson, L. Fedotov, O. Saltzman, E. Prywes, S. Wyman, B. Yu and J. Desmarais for essential help in the process of data analysis. For their assistance in the process of generating and validating the DMS library, we thank A. Glazer, K. Matreyek, J. Bloom and K. Reynolds. Additionally, we thank J. Tartaglia for the use of her sequencing primers and N. Krishnappa for assistance in running NGS samples. We would like to thank E. Meng for assistance using ChimeraX. Finally, we thank F. Wang for technical assistance over the weekends. D.F.S. is an Investigator of the Howard Hughes Medical Institute. This work was supported by US National Institutes of Health grant no. K99GM14145501 (N.P.) and the US Department of Energy, Physical Biosciences Program, award number DE-SC0016240 (D.F.S.).
Competing interests D.F.S. is a co-founder and scientific advisory board member of Scribe Therapeutics. The other authors declare no competing interests.
Additional information
Supplementary information The online version contains supplementary material available at https://doi.org/10.1038/s41586-024-08455-0.
Correspondence and requests for materials should be addressed to David F. Savage. Peer review information Nature thanks the anonymous reviewers for their contribution to the peer review of this work. Peer reviewer reports are available.
Reprints and permissions information is available at http://www.nature.com/reprints.
diagram of one monomer with the 3 subdomains labelled. View is of the
interfacial side. Right, Close-up view of the active site. Closed form of loop 6 is
from the 8RUC structure. Active site residues and RuBP substrate are labelled.
diagram of one monomer with the 3 subdomains labelled. View is of the
interfacial side. Right, Close-up view of the active site. Closed form of loop 6 is from the 8RUC structure. Active site residues and RuBP substrate are labelled.
Extended Data Fig. rpi is a rubisco-dependent . coli strain with a growth rate that correlates to rubisco flux. a) Schematic of the Δrpi strain of rubiscodependent E. coli. PRK and rubisco compensate for the deletion of RPI and rescue growth.b) Growth rates and yields across a titration of rubisco induction by [IPTG]. c) Growth rates and yields across a titration of . Yields were calculated up to A heatmap of growth rates across a twodimensional titration of and IPTG. e) Growth rates and yields across a titration of . Yields were calculated between 15 and 40 h . The BW25113 contained the same plasmid as rpi but with GFP in place of rubisco. Growth rates could not be calculated for the control due to non-exponential growth behavior. f) Immunoblots for soluble rubisco with DnaK as a loading control. Left half is wild-type . rubrum rubisco, right half is the higherexpressing I164T mutant. Samples are of rpi cells grown in selection media (see Methods) with different concentrations of IPTG.g) Growth rates of rpi
cells expressing either WT or I164T rubisco grown in selection media with different concentrations of IPTG. h) Ratio of band intensities from as a function of IPTG concentration. i) A panel of mutants from the literature and their associated measurements normalised to WT. The WT value is . j) Growth curves of expressing the mutants from . Colouring in and is on the same scale and reflects values from the literature. k) Growth rate values calculated from the curves in , plotted against the normalised values.l) Raw barcode-averaged mutant enrichment values for the same mutants as in measured in one nanopore sequencing experiment. Error bars in b, c, g and e determined from the SEM of at least four replicates. Error bars in determined as standard deviations of three or more replicates. Error bars in I determined as standard deviations of three different barcodes for each mutant. Errors in literature values are shown from studies where they were reported.
Extended Data Fig. 3 | Library construction and characterization pipeline.
a) Library construction procedure. Step 1) Clone a codon-optimised R.rubrum rubisco sequence into pUC19. Step 2a) Choose locations to split the gene which are appropriate for the cloning of subpool libraries. Step 2b) PCR amplify the sub-libraries from an oligo pool containing all 8778 mutations. Step 3) PCR amplify the backbone with a space missing for the ligation of an oligo subpool.
Step 4) Ligate each oligo subpool to its appropriate backbone. Step 5) Combine the sub libraries, cut the full, mutated genes out and ligate them into a PCRamplified and barcoded backbone. After transformation scrape the desired number of colonies for selection.b) Library sequencing strategy. The library was characterised by long read sequencing. Barcode abundances were measured by short-read sequencing before and after selection (see methods).
Extended Data Fig. 4 | Library characterization by long-read sequencing.
a) A histogram of reads of plasmids from PacBio sequencing. The -axis represents the number of reads of plasmids with a given number of reads (i.e. the bar at 50 on the -axis is as tall as the number of reads of barcodes with 50 reads). We were able to generate a consensus sequence for any barcode with more than1 read leaving us with 327,149 possible barcodes.b) A rarefaction plot estimating the overall library complexity, a negative binomial distribution was fit and we
estimated a real library complexity of barcodes. c) A plot of how many mutants (of the possible 19) were in our library at each position (black dashes, left axis) and how many barcodes (green dashes, right axis). d) A heatmap of how many barcodes were characterised for each mutation. e) A histogram of mutants by how many barcodes they had.f) Statistics on the completeness of the library. Overall we had >99% of the mutations in our lookup table.
Replicate 1 1
□
1
□
书
11
#
is
□
□
□
□
க்ரைம் கேர்
□
□
□
部部都
□
□
□
एल्टी க்ரைம்
0
Replicate 1
Replicate 2
Replicate 3
Replicate 4
Replicate 5
Replicate 7
Replicate 8
Replicate 9
Extended Data Fig. |Pairplots of replicate fitness values.Fitness values for each mutant are calculated as described in the methods for each replicate individually.These replicates are 3 sets of technical replicates of 3 biological replicates.Replicates 1, 4 and 7 are technical replicates(same with 2/5/8 and
3/6/9).Replicates 7-9 were collected on a different day.Pearson correlations reported for each pair of replicates.The distribution of fitness values is reported along the diagonal and pairwise correlations are reported between replicated off the diagonal.Pearson R is reported in the bottom-left half.
Extended Data Fig. 6 | See next page for caption.
Extended Data Fig. 6|Comparisons between biochemically measured rubisco kinetic parameters and those same parameters as inferred from fitness values. and b) Fitness vs. values, fitness error is the standard error of the mean for 9 replicates, c and d) vs. values, error bars reflect the inner quartiles of the bootstrap fits (see Methods). Measurements are from the literature in and , values are measured in this study by the spectrophotometric assay in and . Black points in were purified 3 independent times ( -axis error bars are standard error), all other data in grey are from individual purifications and have no errors reported. Inset shows mutants with fitness values near or above 1 (WT-level). Dashed line indicates a correspondence between fitness
and in vitro measurements, WT is indicated with a square. X-axis error bars in a and are taken from the literature when available. X -axis errors in and Y -axis errors in a-d are explained in the methods. biological replicates in all cases. Outlier mutation is labelled in and and is discussed in Methods. Red indicates estimates with coefficient of variation . e) coefficient of variation as a function of fitness. f) coefficient of variation as a function of g) coefficient of variation as a function of fitness coefficient of variation. h) Correlation of and Fitness. Only mutants with a coefficient of variation are plotted here; mutants with coefficients of variation typically have low fitness and are thus harder to fit to a Michaelis-Menten model.
a
Average Amino Acid Fitness at IPTG
Extended Data Fig. 7| Histograms of fitness effects of mutations to each amino acid individually. a) A histogram of fitness effects of all mutations to the specified amino acid (i.e. the plot for proline is the histogram of the fitness effects of mutations to proline at each position where there isn’t a proline
naturally). Plots are coloured by the biophysical properties of the amino acids. b) A heatmap of all fitness values. Fitness is the normalized enrichment value for selections carried out at with values. d) A heatmap of values. has units of .
Extended Data Fig. 8|”Recent” evolution of a tertiary contact and phylogenetic comparisons. a) Conservation vs. Tolerance among bacterial Form II rubiscos. As in Fig. 2c, mutational tolerance is the average fitness effect of all mutations at a given position. Here conservation is determined from an MSA of all Form II bacterial rubiscos (see methods). P-value is determined from the Spearman correlation and is thus a two-sided test. Positions 215 and 257 form a tertiary contact in R. rubrum and other Form II rubiscos and are thus more conserved than among all rubiscos.b) Alignment of 9RUB and 8RUC,
R. rubrum (green) and spinach (orange) rubisco respectively. c) Rotated view and zoom of M215 and H 257 from . rubrum. The loop containing them in . rubrum is truncated in spinach. d) Pairwise identities between rubisco sequences across Forms. Representative rubisco sequences from were compared for pairwise identity. Form I sequences were picked to have a maximum sequence identity between one another of in order to sample sequences more evenly (out of fear of oversampling plant sequences). Form II and III sequence were chosen randomly.
Extended Data Fig. 9 | Specificity and measurements for A 102 Y and
V266T. a) Specificity values measured by Membrane Inlet Mass Spectrometry ( for each mutant measured in this study). Comparisons to literature values are displayed when available. Literature data for WT is from . Error bars represent the SEM of all measurements compiled in that published analysis. Literature data for H 44 N and D 117 V is from . Error is taken from Extended Data Table 2 in that publication. P-values reflect a Welch’s two-sided t-test in comparison to WT, with a permutation test to determine P -values. Red numbers indicate . b) values fit from spectrophotometric assays of rubisco carboxylation along an 8 point RuBP titration. Each point in the titration was measured in technical triplicate. Error bars indicate the square root of the diagonals of the covariance matrix during fitting. All three triplicate measurements were used to perform the fit.
Extended Data Table 1 | Assay mix composition
Component
Assay concentration
Source
EPPS buffer pH 8.0
100 mM
Alfa Aesar (Cat # J61296)
MgCl 2
20 mM
Sigma Aldrich (Cat # M2670-500G)
Dithiothreitol
0.5 mM
Bio Basic Canada inc. (Cat # DB0058)
ATP
2 mM
Sigma Aldrich (Cat # A3377-5G)
Phosphocreatine
10 mM
Sigma Aldrich (Cat # 27920-5G)
NADH
1.7 mM
Merck (Cat # 481913-1GM)
Carbonic anhydrase
Sigma Aldrich (Cat # C3934-100MG)
Creatine phosphokinase
Sigma Aldrich (Cat # C3755-35KU)
Glyceraldehyde 3-phosphate dehydrogenase
Sigma Aldrich (Cat # G2267-10KU)
3-Phosphoglyceric phosphokinase
Sigma Aldrich (Cat # P7634-5KU)
Article
Extended Data Table 2 | Enzyme kinetic parameters
RuBP
WT
V266T
A102Y
natureportfolio
Corresponding author(s):
Last updated by author(s): Oct 31, 2024
Reporting Summary
Nature Portfolio wishes to improve the reproducibility of the work that we publish. This form provides structure for consistency and transparency in reporting. For further information on Nature Portfolio policies, see our Editorial Policies and the Editorial Policy Checklist.
Statistics
For all statistical analyses, confirm that the following items are present in the figure legend, table legend, main text, or Methods section.
n/a
Confirmed
□ X
The exact sample size for each experimental group/condition, given as a discrete number and unit of measurement
□
A statement on whether measurements were taken from distinct samples or whether the same sample was measured repeatedly
□
The statistical test(s) used AND whether they are one- or two-sided
Only common tests should be described solely by name; describe more complex techniques in the Methods section.
□
A description of all covariates tested
□
A description of any assumptions or corrections, such as tests of normality and adjustment for multiple comparisons
□
A full description of the statistical parameters including central tendency (e.g. means) or other basic estimates (e.g. regression coefficient) AND variation (e.g. standard deviation) or associated estimates of uncertainty (e.g. confidence intervals)
□
For null hypothesis testing, the test statistic (e.g. ) with confidence intervals, effect sizes, degrees of freedom and value noted Give values as exact values whenever suitable.
□
□ For Bayesian analysis, information on the choice of priors and Markov chain Monte Carlo settings
□ For hierarchical and complex designs, identification of the appropriate level for tests and full reporting of outcomes
□ X
Estimates of effect sizes (e.g. Cohen’s , Pearson’s ), indicating how they were calculated
Our web collection on statistics for biologists contains articles on many of the points above.
Software and code
Policy information about availability of computer code
Data collection
Data analysis
HMMER 3.4
All data analysis components can be found at https://github.com/SavageLab/reads_processing
Packages used:
pandas 2.2.1
matplotlib 3.8.4
Biopython 1.81
numpy 1.26.4
scipy 1.12.0
seaborn 0.12.2
sklearn 1.2.2
pysam 0.21.0
Samtools 1.21
For manuscripts utilizing custom algorithms or software that are central to the research but not yet described in published literature, software must be made available to editors and reviewers. We strongly encourage code deposition in a community repository (e.g. GitHub). See the Nature Portfolio guidelines for submitting code & software for further information.
Policy information about availability of data
All manuscripts must include a data availability statement. This statement should provide the following information, where applicable:
Accession codes, unique identifiers, or web links for publicly available datasets
A description of any restrictions on data availability
For clinical datasets or third party data, please ensure that the statement adheres to our policy
Sequences for our form II rubisco phylogeny were assembled from UniRef100
Our raw sequencing reads can be accessed on the NCBI SRA, accession ID: PRJNA1181558
All other data are available in the main text or the supplementary materials.
Research involving human participants, their data, or biological material
Policy information about studies with human participants or human data. See also policy information about sex, gender (identity/presentation), and sexual orientation and race, ethnicity and racism.
Reporting on sex and gender
N/A
Reporting on race, ethnicity, or other socially relevant groupings
N/A
Population characteristics
N/A
Recruitment
N/A
Ethics oversight
N/A
Note that full information on the approval of the study protocol must also be provided in the manuscript.
Field-specific reporting
Please select the one below that is the best fit for your research. If you are not sure, read the appropriate sections before making your selection.
Life sciences
Behavioural & social sciences
Ecological, evolutionary & environmental sciences
For a reference copy of the document with all sections, see nature.com/documents/nr-reporting-summary-flat.pdf
Life sciences study design
All studies must disclose on these points even when the disclosure is negative.
Sample size
Triplicate or greater as indicated in figure panels. The only exception is the in vitro work in Extended Data figure 6B (grey points indicated in the figure are not repeated). Sample sizes were not chosen based on a calculation. Our default value for replication was triplicate. In the case of the experiment that generated the most critical dataset (figure 1G) we performed 9 replicates.
Data exclusions
No data was excluded, all data is available in the supplementary files.
Replication
All attempts at replication were successful.
Randomization
No randomization was used since it was not appropriate for this study, all analyses were done programmatically.
Blinding
Blinding was not relevant to our study, all analyses were done programmatically.
Reporting for specific materials, systems and methods
We require information from authors about some types of materials, experimental systems and methods used in many studies. Here, indicate whether each material, system or method listed is relevant to your study. If you are not sure if a list item applies to your research, read the appropriate section before selecting a response.
Materials & experimental systems
Methods
n/a
Involved in the study
n/a
□
X Antibodies
X
□
X
X
□
X
Animals and other organisms
X
□
Dual use research of concern
X
□
Antibodies
Antibodies used
Polyclonal Rabbit Anti-RbcL II, Agrisera, AS15 2955, Lot 2111
Polyclonal Goat to Rabbit IgG, abcam, ab205718, Lot GR3366929-1
Monoclonal clone 8E2/2, Mouse anti-DnaK, abcam, ab69617, 103741-3
Donkey anti-Mouse IgG-HRP, Santa Cruz BioTechnology, sc-2314, Lot C2012
Validation
The anti-rbcL II antibody was validated against Alexandrium catenella, Amphidinium carterae, Chaetoceros neogracilis, Rhodobacter capsulatus, Rhodospirillum rubrum (relevant to this study)
Cho et al. (2021). SxtA localizes to chloroplasts and changes to its 3’UTR may reduce toxin biosynthesis in non-toxic Alexandrium catenella (Group I). Harmful Algae, 2021,101972,ISSN 1568-9883, https://doi.org/10.1016/j.hal.2020.101972. Immunolocalization Bausch et al. (2019). Combined effects of simulated acidification and hypoxia on the harmful dinoflagellate Amphidinium carterae. Marine Biology, June 2019, 166:80.
Long et al. (2018). Carboxysome encapsulation of the CO2-fixing enzyme Rubisco in tobacco chloroplasts. Nat Commun. 2018 Sep 3;9(1):3570. doi: 10.1038/s41467-018-06044-0.
The anti-DnaK antibody has been used in 37 citations. The manufacturer states:
Mouse Monoclonal DNAK antibody. Suitable for WB and reacts with Recombinant full length protein – Escherichia coli, Escherichia coli samples. Cited in 37 publications. Immunogen corresponding to Full Length Protein corresponding to Escherichia coli K-12 dnaK. The antibody has been validated against E. coli DnaK which is relevant to this study.
Plants
Seed stocks
N/A
Novel plant genotypes
N/A
Authentication
N/A
Innovative Genomics Institute, University of California Berkeley, Berkeley, CA, USA. Howard Hughes Medical Institute, University of California Berkeley, Berkeley, CA, USA. Department of Molecular and Cell Biology, University of California Berkeley, Berkeley, CA, USA. University of Heidelberg, Heidelberg, Germany. Department of Plant and Microbial Biology, University of California Berkeley, Berkeley, CA, USA. School of Biological Sciences, Nanyang Technological University, Singapore, Singapore. Department of Biology, University of Naples Federico II, Naples, Italy. Joint BioEnergy Institute, Lawrence Berkeley National Laboratory, Emeryville, CA, USA. Biophysics, University of California Berkeley, Berkeley, CA, USA. California Institute for Quantitative Biosciences (QB3), University of California Berkeley, Berkeley, CA, USA. Center for Computational Biology, University of California Berkeley, Berkeley, CA, USA. Division of Biology and Biological Engineering, California Institute of Technology, Pasadena, CA, USA. School of Medicine, University of California San Diego, La Jolla, CA, USA. Environmental Genomics and Systems Biology Division, Lawrence Berkeley National Laboratory, Berkeley, CA, USA. Feedstocks Division, Joint BioEnergy Institute, Emeryville, CA, USA. Department of Plant and Environmental Sciences, Weizmann Institute of Science, Rehovot, Israel. e-mail: savage@berkeley.edu