خلية سائلة حرارية كهربائية أيونية ذات أداء عالي عند درجات حرارة منخفضة تم تطويرها من خلال استراتيجية المذيب اليوتيكتية High-performance cryo-temperature ionic thermoelectric liquid cell developed through a eutectic solvent strategy
توفر خلايا الطاقة الحرارية الأيونية (i-TE) سبيلاً صديقًا للبيئة وفعالًا من حيث التكلفة وسهل التشغيل لاستعادة الحرارة ذات الدرجة المنخفضة. ومع ذلك، فإن أدنى درجة حرارة محدودة بدرجة تجمد الإلكتروليت المائي. من خلال تطبيق استراتيجية المذيب المميعي، نقوم بتصنيع خلية سائلة i-TE ذات أداء عالي في درجات الحرارة المنخفضة. يتم استخدام الفوراميد كمذيب عضوي فوضوي يدمر شبكة الروابط الهيدروجينية بين جزيئات الماء، مما يشكل مذيبًا مميعيًا يمكّن الخلية من العمل بالقرب من درجات الحرارة المنخفضة (حتى ). بعد تحسين متزامن لهيكل القطب والخلية، تحقق خلية i-TE السائلة المصنعة حديثًا مع نهايات باردة ( ) وساخنة ( ) كثافة طاقة عالية ( ) وكثافة طاقة كبيرة لمدة ساعتين ( ). في نموذج أولي لوحدة مكونة من 25 خلية، كانت جهد الدائرة المفتوحة والتيار القصير 6.9 فولت و68 مللي أمبير على التوالي، وكانت الطاقة القصوى 131 مللي واط. تعتبر قدرة مقاومة التجمد والأداء العالي لنظام خلية i-TE السائلة المصنعة حديثًا متطلبات للتطبيقات في المناطق الباردة.
لقد جذبت خلايا الطاقة الحرارية الأيونية (i-TE) اهتمامًا متزايدًا لأنها توفر طاقة حرارية عالية بتكلفة منخفضة ويمكن تشغيلها بسهولة. لذلك، يمكن أن تستفيد من الحرارة ذات الدرجة المنخفضة لتشغيل أجهزة الإنترنت للأشياء (IoT) . لقد تم دراسة تأثيرات الانتشار الحراري , وتأثيرات التحليل الكهربائي الحراري , والتأثيرات المتزامنة في خلايا i-TE السائلة وخلايا الهلام على نطاق واسع. في خلية i-TE السائلة (تسمى أحيانًا خلية تحليل كهربائي حراري أو خلية حرارية )، يتم الحصول على الطاقة الحرارية الناتجة عن تدرج درجة الحرارة بشكل رئيسي من تأثير التحليل الكهربائي الحراري حيث أن النقل المتزامن للأنيونات والكتيونات المتداخلة يلغي الجهد الإحصائي . يمنح الحمل الحراري زوج الأكسدة والاختزال تحويلًا مستمرًا من الحرارة إلى الكهرباء في حلول i-TE السائلة، والميزة الواضحة هي إنتاج طاقة كبير مقارنةً بنظيرها من خلايا i-TE الهلامية . يتم تحديد توليد الطاقة من خلايا i-TE بكثافة الطاقة لمدة ساعتين ( ) والطاقة الفورية , حيث و هما جهد الدائرة المفتوحة
الجهد والتيار القصير، على التوالي. يمكن تحسين لخلايا i-TE السائلة من خلال ثلاث استراتيجيات عامة: (i) تعديل الإلكتروليت لتعزيز , والذي يتعلق بفارق الإنتروبيا الهيكلية () ونسبة التركيز المعتمدة على درجة الحرارة () بين الأنواع الأكسدة والاختزال , (ii) تصميم هيكل دقيق للقطب يسرع تبادل الإلكترونات بين زوج الأكسدة والاختزال والقطب، والذي يحدد , و(iii) توسيع نطاق درجة الحرارة القصوى () لزيادة أو لخلية i-TE السائلة . لقد قام العديد من الباحثين بتعديل الإلكتروليت لتعزيز وبالتالي . قام زو وآخرون بزيادة إلى من خلال إدخال اليوريا والغوانيدينيوم (GdmCl) إلى الإلكتروليت المائي (المختصر بـ ). وقد أفادوا أن الغوانيدينيوم واليوريا يعيدان تنظيم هياكل الإذابة لزوج الأكسدة والاختزال . اعتمد تيبّي وآخرون استراتيجية اقتران أيوني أمفيبيل تستغل فرق الألفة بين
ميكيلات بروميد دوديكل رباعي الميثيل الأمونيوم والأنواع الأكسدة والاختزال، مما يغير من من 1.4 إلى . في الوقت نفسه، يعزز تحسين من لأن يؤثر مباشرة على تركيز الجزيئات النشطة المطلوبة لتفاعل القطب . باستخدام نهج فوق جزيئي يحصر الأيونات داخل -كلايدوكسترين، أنشأ يامادا وآخرون تدرج تركيز في الإلكتروليت المائي الذي زاد من من -0.86 إلى . قام زو وآخرون بتطوير منهجية بلورة حرارية حساسة حيث يتم بلورة المركب ، وترسيبه، وحله لتوليد تدرج تركيز مستدام. حققت منهجيتهم من في إلكتروليت مائي .في الوقت نفسه، تقدمت المواد النانوية القائمة على الكربون ذات المساحات السطحية المحددة العالية بشكل ملحوظ على مدار العقد الماضي. صمم باوغمان وآخرون قطبًا مركبًا من أنابيب الكربون النانوية وأكسيد الجرافين المخفض مع مسامية قابلة للتعديل. وقد أكدوا وجود علاقة إيجابية بين المساحة السطحية النشطة كهربائيًا للقطب و
في خلية i-TE السائلة . وقد أفادت الأبحاث اللاحقة أن مجموعة متنوعة من الأقطاب القائمة على الكربون، مثل هلام الجرافين , وأنابيب الكربون متعددة الجدران , وPEDOT: PSS المنقوش بالليزر , وقطعة قماش الكربون النشط , تزيد من من خلال زيادة الموصلية الكهربائية الفعالة () و . هو معلمة حاسمة أخرى لخلايا i-TE. يتم تحديد درجة الحرارة العليا في خلية i-TE الهلامية من خلال الاستقرار الحراري لشبكة الهلام شبه الصلبة، بينما يتم تحديد درجة الحرارة الدنيا من خلال السلوك الحركي للأيونات المتداخلة. قدم لي وآخرون الجلوتارالدهيد إلى الجيلاتين، مما شكل روابط تساهمية قوية زادت من من إلى مع الحفاظ على عند . وقد أفادوا بكثافة طاقة عالية قدرها . بالنسبة لخلية i-TE السائلة، محدودة بنقطة تجمد المحلول . تتجاوز قيم لخلايا i-TE السائلة المبلغ عنها دائمًا . على وجه التحديد، فإن قيم للإلكتروليت، و للإلكتروليت، و للإلكتروليت، و للإلكتروليت هي ، و ، و ، و على التوالي. لا يزال خفض إلى منطقة درجات الحرارة المنخفضة مهمة صعبة.
بفضل طبيعة المذيبات المميعة التي تشكل خليط سائل عند نقطة انصهار أقل من أي مكون فردي، كانت الإلكتروليتات المكونة من مذيب مميعي مثل الفوراميد (FA)/ , وإيثيلين جلايكول (EG) , وثنائي ميثيل سلفوكسيد (DMSO) ، مرشحين واعدين للعمليات المبردة في الأنظمة المتعلقة بالطاقة. نظرًا لقدرة المذيبات المميعة على تقديم ظروف نقل أيوني متفوقة للإلكتروليتات في درجات الحرارة دون الصفر ، فإنها تقدم نهجًا قابلاً للتطبيق لخفض الحد الأدنى من درجة حرارة التشغيل لخلايا الطاقة الحرارية الأيونية إلى النطاق المبرد. على سبيل المثال، قام لي وآخرون بتجميع خلية حرارية مبردة مع إلكتروليت أكسدة واختزال مميعي من الفوراميد والماء وحققوا من عند . تستكشف الدراسة الحالية تطبيق خلية سائلة من / الفوراميد (FA) – في درجات الحرارة المنخفضة. تم تصنيع الخلية من خلال استراتيجية المذيب المميعي وتحسين متزامن. نقدم أولاً المذيب العضوي الفوضوي FA، الذي يدمر شبكة الروابط الهيدروجينية بين جزيئات الماء من خلال تفاعلات ثنائية القطب الجزيئية، مما يشكل مذيبًا مميعيًا ذو نقطة انصهار منخفضة. بعد ذلك، نوضح أن الخصائص المحبة للماء للقطب الكربوني المسامي تحدد بشكل حاسم إنتاج الطاقة لخلية i-TE السائلة. أخيرًا، لتوسيع ، نحقق في تأثير مقاومة الحرارة لفاصل عازل حراري (TIS) مصنوع من ألياف القطن. وصلت كثافة الطاقة الفورية () إلى وبلغت كثافة الطاقة لمدة ساعتين () إلى بين عند النهاية الباردة و عند النهاية الساخنة. من المتوقع أن يوسع هذا العمل نطاق درجة الحرارة التشغيلية ويعزز إنتاج الطاقة لخلايا i-TE، مما يمكّن تطبيقها في معظم مناطق المعيشة البشرية، بما في ذلك المناطق القطبية الباردة في الشتاء.
النتائج والمناقشة
مبدأ الأداء العالي لمقاومة التجمد
توضح الشكل 1a كيف يمكن لمذيب مميعي أن يقلل من لخلية i-TE السائلة التي تهدف إلى العمل في درجات الحرارة المنخفضة. يحد تجمد المذيب من لخلية السائل ، مما ي suppress الانتشار الحراري للأيونات. هنا اقترحنا استراتيجية مذيب مميعي تقلل من نقطة التجمد () لمذيبات الماء. نظريًا، يمكن خفض للإلكتروليت من خلال زيادة إنتروبيا جزيئات المذيب، مما يقلل من الطاقة الحرة لجزيء السائل . على المستوى الجزيئي، ينطوي تجمد الماء على نواة الجليد من ترتيب عشوائي إلى هيكل منسق رباعي من خلال الروابط الهيدروجينية . يمكن لمذيب إضافي مثل FA أن يشكل محلول يزعج شبكة الروابط الهيدروجينية بين جزيئات الماء.
أولاً، الـالمحاليل الأيونية ( في زيادات؛ ) تم اشتقاقها من قياسات المسح الحراري التفاضلي (DSC) (الشكل التكميلي 1). من أجل البساطة، فإن المحاليل الأيونيةفايشار إليها فيما بعد بـ FA0-FA100، حيث يشير الرقم إلى النسبة المئوية للحجم من FA. توضح الشكل 1b مخطط الطور للإلكتروليت الهجين الذي تم تحديده من قياسات DSC. يظهر الإلكتروليت سلوكًا ثنائي الطور واضحًا.من FAO خالية من الفوراميدأقل من نقاء الماء ) لأن الـ وأيونات GdmCl مُذابة. في يحتوي على 40 و 50 و 60 فولت، الـالقيم هي، ، و ، على التوالي. يتبع هذا الانخفاض المستمر زيادة عند محتويات FA أعلى. أعمق نقطة eutectic هيعند محتوى FA من.
تم قياس الموصلية الأيونية للمحاليل الأيونية باستخدام مطيافية الامتداد الكهروكيميائي (EIS) عند درجات حرارة مختلفة. تم رسم المقاومات الناتجة عن منحنيات EIS في الشكل التوضيحي 2. تنخفض الموصلية الأيونية للمحلول الأيوني قليلاً مع زيادة محتوى FA، ربما لأن اللزوجة تزداد مع محتوى FA. جميع الموصلات الأيونية تنخفض بشكل مشابه مع انخفاض درجة الحرارة منإلى. ومع ذلك، أدناه، إضافة FA بأي نسبة تزيد من الموصلية الأيونية مقارنةً بـ FAO. على وجه الخصوص، يحتفظ FA50 بموصلية أيونية عالية (5.90إلى أسفلبينما تنخفض الموصلية الأيونية لـ FAO بشكل كبير إلىفي.
تمت دراسة التفاعلات الجزيئية في المحاليل الأيونية باستخدام مطيافية الأشعة تحت الحمراء بتحويل فورييه (FTIR) (الشكل 1c والشكل التكميلي 3). تظهر طيف جميع المحاليل الأيونية قمة مميزة عندالموافق لـاهتزازات الشد لأيونات السيانيد)، مما يشير إلى أن المضاف FA لم يؤثر على الهيكل المعقد لـ . لأن الـ و أشرطة من و FA، على التوالي، تتزامن عند حوالي ، أدى زيادة محتوى FA إلى عدم حدوث إزاحة واضحة في القمم ولكن القمم كانت مفصولة بشكل ملحوظ. كانت هناك انزياحات زرقاء غير قابلة للإهمال من الـ اهتزازات الشد (أميد I) لـ FA عند 1630-1685 سم-1، اهتزازات انحناء N-H (أميد II) لـ FA عند 1600-1640 سم-1، واهتزازات الشد C-H لـ FA عندتُلاحظ مع زيادة محتوى FA. على النقيض، فإن مواقع القمم لـاهتزازات الشد (أميد III) لـ FA عند 1350-1430 سممتطابقة في طيف جميع العينات. تكشف النتائج عن وجود ثلاثة أشكال مختلفة على الأقل من الروابط الهيدروجينية بين FA والماء (الشكل التكميلي 4). ومن ثم، الـ الروابط الهيدروجينية يمكن كسرها بسهولة بواسطة الروابط الهيدروجينية الأقوى لـ ، مما يقلل بشكل كبير منللكهرل الهجين وبالتالي تحسين موصليته الأيونية عند درجات الحرارة المنخفضة.
تحتفظ خلية السائل i-TE مع الإلكتروليت الهجين بأدائها الحراري الكهربائي الممتاز بالقرب من درجات حرارة التبريد. في هذه الدراسة،تم تحسينه عن طريق ضبط محتوى FA وفجوة فصل الأقطاب.. في عملنا السابق،تم اعتماده كمؤشر أداء للبحث عن أقصى درجة حرارة على الجانب الساخن ) ودرجة حرارة الجانب البارد الدنيا ( ) . هنا، نحن
الشكل 1 | مبدأ مقاومة التجمد. أ مبدأ التصميم لـ / خلية سائلة حرارية كهربائية أيونية (i-TE)فورماميدغوانيدينيوم).مخطط الطور للإلكتروليت الهجين.طيف FTIR للإلكتروليتات الهجينة (FA0، FA10، FA20-FA100). د رسم بياني لأقصى قدرةمن الـ أولاً ناقش تأثيرات محتوى الأحماض الدهنية على و فيفا-خلية سائلة. عند تركيز GdmCl يبلغ 3 م، خلية i-TE السائلة مع المركب ينتج أعلى طاقة حرارية (الشكل التكميلي 5). الحد الأقصى النظري لـ في هذا النظام هوعند درجات حرارة أعلى، يفشل النظام بسبب غليان الإلكتروليت. بالنظر إلى الاستقرار الحراري للبلورات الحساسة للحرارة في هذا النظام،تم تحديده عند. في هذه الأثناء، الـتنخفض مع زيادة محتوى FA. بشكل أكثر تحديدًا، عند، و ، الـالقيم كانت، ، و على التوالي، مما يتوافق معزيادات في، و ، على التوالي (الشكل التوضيحي 6 والشكل التوضيحي 7). الشكل التوضيحي 8 يظهر و خلايا السائل i-TE ( ) العمل في نظيراتها القيم. الـيزداد مع زيادة محتوى FA (، و310 مللي فولت عند، و ، على التوالي). الزيادة من FA0 إلى FA10 طفيفة. الـتتجه بشكل معاكس بسبب الزيادة في اللزوجة وانخفاض الموصلية مع زيادة محتوى FA، جنبًا إلى جنب مع انخفاض درجة حرارة الخدمة. ومع ذلك، فإن و من FA60 تظهر انخفاضًا ملحوظًا، ربما يعكس انخفاض القوة الحرارية لهذه الخلية. كما هو موضح في الشكل 1d، فإن أداء مقاومة التجمد وخلايا السائل i-TE المحسّنة (FA50 مع ) تم تحسينها بشكل كبير مقارنة بتلك الخاصة بـ FA0. بعد التلاعب بجزيئات المذيب، انخفض منإلى، مما يشير إلى مقاومة ممتازة للصقيع. الـ من FA50 ( وصلتمتى و وال correspondenteكانأعلى من ذلك من منظمة الأغذية والزراعة (FAO) ) مع الإلكتروليت المائي منخفض الانتروبيا ( ). لاحظ أن الـ تم تقليل FA60 بشكل أكبر إلى، الأدنى بين سلسلة FA (FA0 إلى FA100؛ انظر الشكل التوضيحي التكميلي 9)، لكن تم تقليل FA60 بسبب انخفاض القوة الحرارية. لتوضيح العلاقة بينوسلوك الانصهار للكهارل، الشكل 1e يوضح ضد لخلايا السائل i -TE. الرسم البياني شبه خطي مع ميل قدره، مما يشير إلى أن تم الحصول عليه في اختبار الأداء بشكل جيد
الشكل 2 | تحسين الأقطاب الكهربائية لـخلية i-TE السائلة. أ: مكونات الخلية. ب: الملف الشخصي للكيان للخلية. ج: صورة مجهر إلكتروني مسح ضوئي (SEM) لقطب كهربائي نموذجي من ورق الكربون (CP). د: مخطط هيكلي للخلية.جهد وكثافة القدرة الناتجة مقابل كثافة التيار لخلايا السائل i-TE (FAO، ) مع ثلاثة أقطاب كهربائية مختلفة (ورق كربون غير قابل للماء (CP)، ورق كربون قابل للماء، ورق كربون قابل للماء ) مع و مُعَدّ لـ و ، على التوالي. ج رسم تخطيطي يوضح تأثير المعالجة المحبة للماء و
طلاء جزيئات الذهب النانوية على الهيكل وخصائص قطب CP. د الفولتموجرامات الدورية لقطب CP الكاره للماء، وقطب CP المحب للماء، وقطب Au@CP المحب للماء. هـ أقصى كثافة طاقة ناتجةوقيم المساحة السطحية النشطة كهربائيًا (ESA) لخلايا السائل i-TE (FA0، ) مع أقطاب كهربائية مختلفة. رسومات نايكويست للموصلات الكهربية الكارهة للماء، والموصلات الكهربية المحبة للماء، وقطب كهربائي Au@CP المحب للماء (الإدراج هو رسم مكبر للمناطق الخطية). يتوافق مع سلوك الإيتكتك لـ -إلكتروليت GdmCl.
هيكل القطب وكثافة التيار
تلعب بنية القطب الكهربائي دورًا حاسمًا في إنتاج الطاقة لخلايا السائل i-TE.تحسن قطب كهربائي خشن ذو مساحة سطح محددة عالية كثافة تيار الدائرة القصيرة ) من الخلية . هنا، تم تجميع أجهزة السائل i-TE من قطبين من ورق الكربون (CP)، والإلكتروليت، وفاصل عازل حراري. تم احتواؤها داخل جامعتي تيار من الجرافيت وفاصل أسطواني يحدد فجوة فصل الأقطاب (h) (الشكل 2a والشكل التكميلي 10). تم قياس القوة الحرارية لـ 0.4 M و الخلايا التي لها هذا الهيكل كانت 1.4 وعلى التوالي (الشكل التكميلي 11)، متسق مع القيم المبلغ عنهاالمضاف FA يقلل قليلاً من القوة الحرارية لـحل. على سبيل المثال، القوة الحرارية لمحلول FA50 هيأقل من ذلك في محلول FA0 (الشكل التكميلي 12). FA يضعف التفاعل الكاوتروبي-كاوتروبي بين GdmCl و، مما يقلل من إنتروبي التفاعل للأزواج المختزلة والأكسدة وبالتالي القوة الحرارية. طيف الأشعة فوق البنفسجية والمرئية الخالي من FAمع وبدون GdmCl (الشكل S13a)، وتم الحصول على FA متغيرة (الشكل S13b) لتوصيف الـالتفاعل. أولاً، الـتتحول القمة من 178 نانومتر إلى 209 نانومتر عند إضافة GdmCl، مما يشير إلى التفاعل بين المواد المزعزعة للاستقرار.. ومع ذلك، في الشكل S13b، الـذروة حل i-TE لـ (FA/Water) ينخفض من 209 نانومتر إلى 184 نانومتر، مما يشير إلى أن التفاعلات الكاوتروبية-كاوتروبية تضعف بواسطة FA. علاوة على ذلك، قمنا بمقارنة القوة الحرارية لسلسلتين من محلول i-TE، وهما و 0.4 م مع FA مختلف (الشكل S14). يظهر أنه، بدون GdmCl، فإن القوة الحرارية تظل تقريبًا ثابتة مع FA. على العكس، في، تنخفض القوة الحرارية مع زيادة FA. وهذا يشير إلى أن FA تؤثر على هيكل الهيدرات لـ GdmCl بدلاً من، وبالتالي تفاعل.
تُعرف أقطاب CP بامتلاكها موصلية كهربائية ممتازة وهيكل شبكة ألياف كربونية ذاتية الدعم توفر واجهة نشطة كيميائيًا غنية للإلكترونات. تبادل بين أزواج الاختزال والأكسدة. هنا، لاحظنا أن المحبة للماء للقطب الكهربائي هي عامل مهم آخر لتحديد العلوزاوية الاتصال البصرية للعينات المستلمة من CP هي (الشكل التكميلي 15). لا يمكن لمحلول i-TE الذي تم تصنيعه أن ينتشر في قطب CP لتشكيل واجهة غير متجانسة. بعد المعالجة بالبلازما الأكسجينية، تسربت قطرات محلول i-TE بالكامل واختراقها داخل القطب، مما يشير إلى أداء جيد في الترطيب. بعد ذلك، يُشار إلى CP المستلم على أنه CP غير قابل للبلل (hp-CP) بينما تُسمى CPs المعالجة بالترطيب CPs قابلة للبلل (hl-CP). كما هو موضح في الشكل 2b،أعلى بمقدار 3.7 مرات في CP | منظمة الأغذية والزراعة | – خلية سائلة CP i-TE ( ) من في -خلايا سائلة CP عندما و مُعَدَّة لـ و على التوالي.
بعد ذلك، تم تثبيت طبقة من الذهب بسمك 40 نانومتر لتقليل مقاومة واجهة القطب الكهربائي بالنسبة لتبادل الإلكترونات بينزوج الأكسدة والاختزال. الهيكل المسامي للـ CP المستلم (حجم المساملم يتأثر بطبقة الطلاء الذهبية. من أجل البساطة، فإن هذا القطب الكهربائي المحب للماء معطلاء ذهب سميك يُشار إليه بـ. الـمنأو@سي بي | منظمة الأغذية والزراعة |-Au@CP i-TE خلية سائلة ( تم تحسينه بشكل أكبر إلى أعلى بـمن-خلية CP (الشكل 2ب). يوضح المخطط في الشكل 2ج تأثيرات المعالجة المحبة للماء وتغطية جزيئات الذهب النانوية على هيكل وخصائص قطب CP.– يوفر قطب -CP مواقع نشطة كيميائيًا أكثر من-CP لأن طاقة السطح بين سطح القطب الكهربائي والإلكتروليت أعلى بالنسبة لـ hl-CP مقارنة بـ hp-CP، مما يعزز تسرب الأيونات الحرارية الكهربائية إلى البنية الدقيقة الداخلية. تعمل جزيئات الذهب النانوية على hl-Au@CP على تقليل مقاومة واجهة القطب بشكل فعال وتسريع عملية نقل الإلكترون في تفاعل الأكسدة والاختزال.يمكن تحديد المساحة السطحية النشطة كهربائيًا (ESA) من كثافة التيار الذروة ( ) في الفولتموجرامات الدورية (CVs) للأقطاب (الشكل 2d). وفقًا لمعادلة راندلز-سيفيك، فإن تيار الذروة الفارادي العالي لقطب يظهر حركيات قابلة للعكس يشير إلى ارتفاع تم تقدير المساحات الفعالة السطحية لأقطاب hp-CP و hl-CP و hl-Au@CP على أنها، و ، على التوالي. لاحظ أن تشير القيم فقط إلى أداء أقطاب CP، وليس إلى مساحاتها الفعلية. بشكل عام، يرتبط ارتفاع ESA بارتفاع (الشكل 2e). علاوة على ذلك، مقاومات نقل الشحنة ( قطر نصف الدائرة في مخطط نايكويست، و كانت الأقطاب الكهربائية 102,16 و، على التوالي. المقاومة التي تتحكم فيها الانتشار (مقاومة واربورغ، المنعكس في جزء من مخطط نيكويست الذي يحتوي على قرب-ميل في نطاق الترددات المتوسطة العاليةكان أقل بكثير في-قطب Au@CP ( ) من في و الأقطاب الكهربائية، مما يدل على نقل سريع للإلكترونات وانتشار الأيونات داخل-قطب Au@CP (الشكل 2f).
هيكل واختلاف درجة الحرارة الفعالة لخلايا السائل i-TE
تعتمد أداء توليد الكهرباء لخلايا i-TE على مواد i-TE وفارق درجة الحرارة الفعال.يسمح الحمل الحراري في خلية السائل i-TE بالتشغيل المستمر لزوج الأكسدة والاختزاللكنها تقلل من المقاومة الحرارية وتخفض الـ. وبالتالي، فإن فجوة فصل الأقطاب الكهربائية والفاصل العازل حرارياً (TIS) هما مكونان رئيسيان في التصميم الهيكلي لخلايا السائل i-TE. على سبيل المثال، من خلال استخدام إسفنجة السليلوز المحبة للماء، قام باومان وآخرون بتحسين من الخلية من 63 إلى. هنا، تم غمر نسيج الألياف القطنية TIS في محلول i-TE لزيادة مقاومة الحرارة لخلايا السائل i-TE (الشكل التكميلي 16). يوضح الشكل 3a الفعالية عبر خلايا السائل i-TE مع وبدون TIS كدوال لتدفق الحرارة. كانت الخلايا المختبرة (FA50) و FA50 مع TIS. أولاً، يلاحظ أن GdmCl يزيد من من خلال تقليل الحمل الحراري. ثانياً، يقوم نظام العزل الحراري (TIS) بشكل فعال بكبح الحمل الحراري ويزيد من مقاومة الحرارة للخلايا (تم عرض الموصلية الحرارية للإلكتروليت والقطب الكهربائي في الجدول التكميلي 1). رفع نظام العزل الحراري الحد الأقصىخلية FA50 بواسطةمن تلك الخاصة بخلايا FA50 بدون TIS ( ضد تحت تدفق حراري قدره ). علاوة على ذلك، قام نظام TIS بتقليل حساسية خلية i-TE السائلة تجاه اتجاه تدرج الحرارة (الشكل 3ب)، مما يؤثر على توليد الطاقة في الخلية. عادةً، فإن وضع القطب البارد فوق القطب الساخن يحقق مستوى أعلى من بدلاً من وضع القطب الساخن فوق القطب البارد أو وضع الأقطاب الباردة والساخنة بشكل عمودي. في التكوين الأول، يساهم الخلط المستمر الناتج عن الحمل الحراري في تجانس الإلكتروليت وزيادة موصليته الأيونية.في هذه الدراسة، قام نظام TIS بتقليل الحمل الحراري من خلال الإلكتروليت وثبت ترسيب البلورات الحساسة للحرارة، لذا فإنكان غير حساس لاتجاه تدرج الحرارة.
تظهر الشكل 3c تأثير فجوة فصل الأقطاب الكهربائية ( ) على الـ من-Au@CP | FA50-TIS|hl-Au@CP الخلية تعمل عند قيمتها المقابلةتقلصمن 14 إلى 8 مم لم يؤثر على، مما يشير إلى أن هي خاصية متأصلة من الإلكتروليت ومستقلة عن هيكل الجهاز (الشكل التكميلي 17).ظل أيضًا دون تغيير، مما يشير إلى أن القوة الحرارية هي خاصية جوهرية للخلية (الشكل التكميلي 18).زاد في البداية من 185 إلىكـانخفض من 14 إلى 12 مم، وبلغ الحد الأقصى لـفي، وأخيرًا انخفض إلى في. وبالتالي،من و منتم الحصول عليها فيستكون الفجوة الأقصر بين الأقطاب الكهربائية لها مقاومة داخلية أقل، مما يؤدي إلى زيادة.من أجل توضيح الانخفاض غير الطبيعيكـتم تقليلها أكثر إلى 8 مم، وقد أجرينا محاكاة باستخدام COMSOL Multiphysics 6.0 للتحقيق في تأثير فجوة فصل الأقطاب على الحمل الحراري الكهربائي. في حل i – TE لـالتوصيل الأيوني يرجع إلى التراكممن الأكسدة لـعلى الجانب الساخن، مما يؤدي إلى تدفق عكسي لـمن الجانب الساخن إلى الجانب البارد، والعكس صحيح للجانب الباردتتيح حركة أزواج الأكسدة والاختزال أيضًا عمل خلايا i-TE بشكل مستمر، ولديها أيضًا إنتاج طاقة أعلى من تلك التي تعتمد فقط على أيونات الانتشار الحراري. الشكل 3d يقارن حركة خلايا i-TE المحاكاة. (FA50) بفجوة أقطاب مختلفة، وفرق درجة حرارة ثابت ( ). يظهر بوضوح أن فجوة القطب لها تأثير كبير على سرعة الحمل الحراري، مما يدل على أن دوران زوج الأكسدة والاختزال يتباطأ مع انخفاض فجوة الفصل بين الأقطاب. ستؤدي هذه الحمل الحراري المنخفض إلى تقليل . بعبارة أخرى، انخفضت له تأثيران متعارضان على التوازن بين المقاومة الداخلية المنخفضة والاحتباس المكبوت يؤدي إلى تحسين. بالإضافة إلى ذلك، لاحظنا أيضًا أن الحمل الحراري لزوج الأكسدة والاختزال أدى أيضًا إلى تدرج درجة حرارة غير متساوٍ عموديًا وأفقيًا (الشكل التكميلي 19)، مما يزيد من تعقيد فهم مساهمة السلوك الأيوني المجهري في الجهد الحراري الكلي. لتحديد وقيم المقاومة الفعالة ( ) من خلية السائل i-TE المثلى، وهي، -Au@CP | FA50TISأوسي بي، الـ، و مُخططة كدوال لـ في الشكل 3e والشكل التكميلي 20. الـ انخفض تدريجياً منفيإلىفيوانخفض فجأة إلىفيوإلىفيالتغيير الدراماتيكي فيالاتجاه فييمكن فهمه منحبكة. كـانخفض منإلىإلىارتفع من 4.6 إلى 4.9 إلىلأن معدل نقل الأيونات يقل مع انخفاض درجة الحرارة. ومع ذلك، فإن انتقال الطور في الإلكتروليت زاد منإلىفي و فينقطة تحول واضحة فييظهر أيضًا في منحنى النمو لـمنإلى (الشكل التوضيحي 21). من لذلك تم تحديده على أنهالشكل 3f يقارن النتائج التي تم الحصول عليها و في هذا العمل مع تلك الخاصة بخلايا السائل i-TE المبلغ عنها الأخرىوفقًا لمعرفتنا، لقد حققنا أعلى كثافة طاقة بالقرب من درجات حرارة التبريد وأدنى درجة حرارة على الجانب البارد. كان تحسين بيئة المذيب المضاد للتجمد وتسريع هجرة الأيونات الديناميكية
الشكل 3 | تحسين الهيكل لـخلية سائلة i-TE. اختلافات درجات الحرارة بين الأقطاب الباردة والساخنة كدوال لتدفق الحرارة في ثلاثة تكوينات إلكتروليتية (FA50 بدون GdmCl أو فاصل عزل حراري (TIS)، FA50 مع GdmCl ولكن بدون TIS، FA50 مع كل من GdmCl وTIS).لخلية السائل i-TE في ثلاث زوايا أقطاب مع أو بدون TIS. ج جهد الدائرة المفتوحةتيار القصر، و في الـ
خلايا السائل i-TE مع فواصل أقطاب مختلفة. د ملفات محاكاة الحمل الحراري لخلايا السائل i-TE FA50-TIS مع فواصل أقطاب متغيرة عند و . e ومقاومة فعالةخلية FA50 ( ) مقابل . مقارنة بين و بين الخلايا السائلة i-TE المقترحة والمبلغ عنها. يعتبر لت stabilizing نقل الكتلة لزوجيات الأكسدة والاختزال عند مستوى أدنى، مما يزيد من .
توليد الطاقة على المدى الطويل
بعد ذلك، قمنا بالتحقيق في أداء ناتج الطاقة والأداء الدوري لخلايا السائل hl-Au@CP|FA50-TIS|hl-Au@CP i-TE التي تم تصنيعها مع الفجوة المثلى للفصل بين الأقطاب. ). وضع مولد i-TE يتكون من ثلاث مراحل: زيادة الجهد، وإنتاج الطاقة، وإعادة التنشيط. خلال المرحلة الأولى، يتم توليد حقل كهربائي من خلال النقل الحراري الكهربائي لـمن القطب البارد إلى القطب الساخن. خلال المرحلة الثانية، يتم توصيل حمل خارجي ويتدفق الإلكترونات من القطب الساخن إلى القطب البارد، مما يقلل من المجال الكهربائي الداخلي والجهد. خلال المرحلة النهائية، يتم تجديد الأنواع المستهلكة عند الأقطاب عن طريق الانتشار.، مما يلغي تدرج الحرارة ويستعيد الجهد. الشكل 4أ يعرض منحنيات الجهد والتيار لخلايا السائل i-TE المحسّنة مع المقاومة الخارجية. الحد الأقصىكانت درجة حرارة خلية i-TE السائلة 105 كيلفن (” ). الـارتفعت في البداية إلى 310 مللي فولت ثم انخفضت إلى 195 مللي فولت بعد ساعتين من إنتاج الطاقة إلى الخارج الدائرة. أخيرًا، الـوصلت إلى 0 مللي فولت بسبب الدائرة القصيرة والإزالة. في المرحلة (ii)، انخفض التيار من 6.2 إلى 3.9 مللي أمبير بعد ساعتين من إنتاج الطاقة. تم قياس كثافة الطاقة الناتجة خلال هذه المرحلة باستخدام مقاومات خارجية مختلفة.; انظر الشكل 4ب). الشكل 4ج يوضح كثافة الطاقة المحسوبة من خلال تكامل منحنيات ناتج الطاقة لمدة ساعتين كدالة للمقاومة. بسبب التمديد وبفضل تحسين هيكل الإلكترود والخلايا، حققت الخلية السائلة i-TE التي تم تصنيعها طاقة كثافة لمدة ساعتين ( ) من معمقاوم خارجي حتى عند درجات حرارة قريبة من التبريد. هذه الأداء يتجاوز بكثير أداء خلايا i-TE شبه الصلبة الأخرى المبلغ عنها (الشكل 4d). الـمن منظمة الأغذية والزراعة (FAO) ) و FA50 ( ) تم مقارنته أيضًا (الشكل التوضيحي التكميلي 22). المقاومة المطابقة الأعلى من FAO أصغر من FA50، مما يشير إلى انخفاض المقاومة الداخلية لـ FAO ( ). ومع ذلك، فإن نطاق درجة حرارة العمل الأصغر لـ FAO يؤدي إلى جهد عمل أقل ووالتي تؤثر على أداء مخرجاتها.
تم قياس أداء العمل والراحة الدوري للخلايا السائلة i-TE المصنعة في وضع المولد خلال أسبوع واحد من الدورة المستمرة مع و خلال كل دورة يومية، أظهر وضع العمل-الراحة الجهد المذكور أعلاه
الشكل 4 | توليد الطاقة على المدى الطويل لـ hl-Au@CP | FA50-TIS|hl-Au@CP i-TE خلية سائلة ( ) في في وضع تشغيل مولد i-TE. مقاييس الجهد والتيار خلال ثلاث مراحل عمل ). ب كثافة القدرة الناتجة المقاسة على مدى ساعتين في المرحلة (ii) باستخدام مقاومات خارجية مختلفة. ج كثافة الطاقة الناتجة المقابلة كدالة للمقاومات الخارجية، محسوبة عن طريق تكامل القدرة الناتجة على مدى الزمن (ساعتين) الموضحة في (أ). مقارنة أداء كثافة الطاقة بين خلية i-TE المقترحة وخلية i-TE المبلغ عنها بناءً على التشتت الحراري أو التأثيرات التآزريةتم قياس منحنيات الجهد والتيار خلال أسبوع واحد من الدورة المستمرة ). تدهور ناتج الطاقة لمدة ساعتينخلال أسبوع من الخدمة الدورية في خلية i-TE السائلة في و . تراكم )، ناتج الطاقة مع مقاوم (2 ساعة)، وإعادة تنشيط ذاتي مع قصر الدائرة عند. ثم استراحت الخليةحتى اليوم التالي (تم تحديد وقت إعادة التفعيل إلى 4 ساعات لضمان عودة جهد الدائرة المفتوحة إلى الصفر). يتم عرض منحنيات الجهد والتيار المقاسة لمرحلة بناء الجهد ومرحلة إنتاج الطاقة خلال الأيام السبعة الأولى وكثافة الطاقة الناتجة خلال المرحلة الثانية في اليوم الأول والثالث والخامس والسابع في الشكل التوضيحي 23. كثافة الطاقة لمدة ساعتين ( ) انخفض من في اليوم الأول إلىفي اليوم السابع، قد تعود الأسباب التالية لذلك: أولاً، من المحتمل أن تكون حركيات ذوبان البلورات الحساسة للحرارة قد تباطأت بسبب الخدمة الطويلة للدورة في، مما أدى إلى نقص الإمداد بالأيونات النشطة المطلوبة لتفاعل القطب. ثانياً، فإن عملية تشكيل وحل البلورات الحساسة للحرارة لها تأثير طويل الأمد على القطب، مثل تغطية سطح القطب تدريجياً بفيلم تمرير (الشكل التكميلي 24) الذي يعيق الانتشار والتفاعل الإضافي للجسيمات النشطة على القطب. للتحقق من هذه الفرضية، قمنا بمقارنة تحلل خلية السائل i-TE خلال أسبوع واحد من الخدمة الدورية في و (شكل ). كانت الأداء الدوري لخلايا السائل i-TE أعلى أثناء الخدمة عند أكثر من خلال الخدمة في. في ، الـكانفي الدورة الأولى وانخفض إلىفي الدورة السابعة، مما يدل على معدل احتفاظ جيد بـ. تم أيضًا تحديد التركيب المحدد لطبقة التمرير التي تغطي القطب الكهربائي باستخدام قياسات XRD (الشكل التوضيحي التكميلي 25a) و XPS (الشكل التوضيحي التكميلي 25b). يمكن ملاحظة أن طبقة التمرير هي في الأساس الكريستال الحساس للحرارة الذي يتكون من دمج GdmCl وخلال عملية الاختبار الدوري، انخفض حجم الحبوب تدريجياً وارتبط بسهولة بسطح القطب لتشكيل طبقة التمرير، مما أدى إلى تدهور الأداء. أداء العمل والراحة الدوري لـ FAO ) تم إجراء ( الشكل التوضيحي 26). تدهور إنتاج الطاقة لمدة ساعتينتمت مقارنة FA50 و FA0 خلال أسبوع واحد من الخدمة الدورية (الشكل التوضيحي 26c). على الرغم من إظهار FA50 تدهورًا أكثر حدة من FA0، لا يزال لديه قدرة إجمالية أعلى للطاقة تبلغ 14 ساعة (لـ FA50 مقارنة بـلمنظمة الأغذية والزراعة). القدرة الناتجة الفورية ( ) من الخلية تأثرت بالخدمة الدورية طويلة الأمد، و رسم بياني لـ FA0 و FA50 بعد اختبار دورة واحدة تم تقديمه في الشكل التوضيحي 27.كلاهما يظهر درجات متفاوتة من التوهين (لـ FA50 ولـ FA0). الأدنىتم نسب أداء الدورة الأضعف لـ FA50 إلى عوامل مثل فرق درجة الحرارة الأكبر، ودرجة حرارة النهاية الباردة المنخفضة، وانخفاض الموصلية، وزيادة لزوجة محلول FA50.
وحدة i-TE المكونة من 25 خلية
أخيرًا، خلية السائل i-TE المحسّنة، والمعروفة باسم، أو@سي بي ( )، تم تجميعه في وحدة i-TE مكونة من 25 خلية (الشكل 5أ). ، و التي تم إنتاجها بواسطة الوحدة كانتو131 مللي واط، على التوالي، مع ( و ) (الشكل 5ب). نظرًا لقوة خرجها الكبيرة، يمكن للوحدة تشغيل مصفوفة من الصمامات الثنائية الباعثة للضوء (LED) مباشرة (الشكل 5ج). يوضح هذا الاختبار أن جهازنا يمكنه تشغيل الإلكترونيات بالقرب من درجات حرارة التبريد، مما يؤكد فائدته العملية. الشكل 5د يقارن بين الجهد والطاقة لوحدات خلايا السائل i-TE التي تم تصنيعها لدينا مع تلك الخاصة بأجهزة i-TE و e-TE الأخرى المبلغ عنها.. لقد ضاعف وحدتنا الجهد الكهربائي مقارنةً بتلك الأجهزة المبلغ عنها المستندة إلى أنظمة i-TE الأخرى. يوسع عملنا سيناريوهات تطبيق خلايا i-TE السائلة إلى النطاقات الباردة للغاية، مما يحقق إمكانية توفير الطاقة الذاتية التي تستفيد من الحرارة المهدرة لمستشعرات إنترنت الأشياء في البيئات الباردة للغاية. كما يعد عملنا بنشاط علمي في المناطق القطبية المتجمدة.
طرق
المواد
، “ ) ، هيدروكلوريد الجوانيدين ( GdmCl ) ( ) ، وفورماميد (FA) ( تم شراء ) من شركة العلّاء الصناعية (شنغهاي، الصين). كلوريد البوتاسيوم (KCl)
الشكل 5 | وحدة خلية سائلة i-TE تتكون منوحدات متسلسلة. رسم تخطيطي للوحدة.جهد الخرج والطاقة مقابل تيار الخرج لجهاز الوحدة. تشغيل مجموعة LED بدون معززات جهد إضافية.
( ) تم توفيرها من قبل شركة ماكلين للمواد الكيميائية المحدودة (شنغهاي، الصين). تم استخدام جميع المواد الكيميائية كما تم استلامها دون مزيد من التنقية. تم شراء ألواح الجرافيت وCP من شركة جينغ لونغ للكربون الخاص المحدودة (الصين) وشركة توراي للصناعات، المحدودة (اليابان)، على التوالي.
توصيف الآلية
تم توصيف نقاط التجمد لـ العينات باستخدام جهاز قياس حرارة المسح التفاضلي (ميتلر توليدو DSC1، الولايات المتحدة الأمريكية). تم حساب الموصلية الأيونية للعينات من أول تقاطع للدائرة نصف الدائرية عالية التردد في نتائج قياسات EIS عند درجات حرارة مختلفة، حيث كانت الاستجابة مقاومة بالكامل. تم فحص الخصائص الهيكلية والكيميائية للكهارل باستخدام تقنيات FTIR-الانعكاس الكلي المخفف (بروكير فيرتكس 70، المقاطعة، الدولة). تم قياس الأداء الكهروكيميائي على محطة عمل كهروكيميائية (زينيم برو، ألمانيا) مع تكوين ثلاثي الأقطاب. تم استخدام قطعة CP كقطب عمل وتم استخدام البلاتين و الأقطاب كأقطاب مضادة ومرجعية، على التوالي. تم إجراء مسح CV عند. معادلة راندلز-سيفيك معطاة بواسطة حيث هو تيار الذروة الفارادي، هو عدد الإلكترونات المنقولة خلال تفاعل الأكسدة والاختزال، هو ثابت فاراداي، هو ESA، هو تركيز جزيء الاستكشاف، هو معدل مسح الجهد، هو معامل الانتشار، هو ثابت الغاز العالمي، و هو درجة الحرارة. تم إجراء قياسات EIS بين 10 كيلو هرتز و50 مللي هرتز مع سعة متناوبة قدرها 10 مللي فولت. تم تشغيل كل من CV وEIS باستخدام محلول 0.01 م من الفيررو/فيريسيانيد مع 0.1 م من KCl ككهارل داعم في وسط مائي لتقليل الجهد الزائد الأوم في الخلية.
تصنيع خلية i-TE السائلة
تم تجميع خلية i-TE السائلة مع هيكل طبقي من جامعتي تيار جرافيت، وقطبي CP، وفاصل حراري متصل بالقطب البارد، وموصل أسطواني مكون من بولي فومالدهيد (مصادر تجارية)، وحجم الكهارل في
مركز الخلية، وحلقتين مطاطيتين (الشكل التكميلي 10). يحدد الفاصل فجوة فصل الأقطاب. لتحضير قطب Au@CP المحب للماء، تم معالجة CP أولاً باستخدام بلازما الأكسجين (SUNJUNE PLASMA VP-R5، الصين) لمدة 10 دقائق لتحفيز المحبة القوية للماء. بعد ذلك، تم ترسيب طلاء بسمك 40 نانومتر من الذهب على ألياف الكربون لمدة 120 ثانية عند تيار قدره 30 مللي أمبير باستخدام جهاز MC1000 لرش الأيونات (هيتاشي المحدودة، اليابان). تم تصنيع فاصل حراري من ألياف القطن عن طريق ضغط كرات القطن التجارية ذات الأقطار التقريبية لـ (الشكل التكميلي 16). لتشكيل الكهارل FA50 (كمثال؛ تم تحضير الكهارلات الأخرى بشكل مشابه)، تم إذابة و في 7.5 مل من الماء منزوع الأيونات (DI). بعد إضافة 4.34 جرام من GdmCl، تم تحريك المحلول لمدة 10 دقائق، مما أسفر عن محلول أصفر فاتح مع ترسيب. أخيرًا، تمت إضافة 7.5 مل من FA وتم تحريك المحلول لمدة 5 دقائق للحصول على الكهارل المحسن.
قياسات أداء خلية i-TE السائلة
تم اختبار أداء خلية i-TE السائلة في إعداد قياس فعلي. تم التحكم في درجة الحرارة باستخدام وحدة تحكم درجة حرارة رقمية (YEXIAN TCM-M207، الصين) وتم الحصول على بيانات الجهد ودرجة الحرارة باستخدام برنامج LabVIEW. تم قياس الجهد باستخدام جهاز كيثلي-2000 وتم إجراء توصيف الجهد-التيار للجهاز باستخدام جهاز كيثلي 2400. هناك حوالي 100 نقطة بين 0 فولت إلى جهد الدائرة المفتوحة. معدل مسح الجهد هو 0.1 ثانية لكل نقطة. تم قياس الجهد والتيار بواسطة كيثلي-2400 وكيثلي-6450، على التوالي، خلال مراحل بناء الجهد وإخراج الطاقة من الإخراج المستمر. تم قياس الموصلية الحرارية للقطب باستخدام طريقة القرص الساخن، وتم قياس الموصلية الحرارية الفعالة للكهارل باستخدام طريقة الحالة الثابتة.
تحضير الوحدة
تتكون الوحدة التي تحتوي على 25 وحدة متكاملة من إطار بولي فومالدهيد، وجامعات تيار جرافيت، وقطبي CP، وكهارلات، وأسلاك تيتانيوم (Ti). كان حجم الإطار هو (الطول العرض الارتفاع) واحتوى على 25 خلية. تم تثبيت خمسة وعشرون زوجًا من أوراق الجرافيت على الإطار بواسطة براغي لمنع التسرب بينما تم تثبيت أقطاب CP بين ورقة الجرافيت والإطار. تم توصيل الخلايا على التوالي بواسطة أسلاك Ti.
Massetti, M. et al. Unconventional thermoelectric materials for energy harvesting and sensing applications. Chem. Rev. 121, 12465-12547 (2021).
Liu, W., Qian, X., Han, C.-G., Li, Q. & Chen, G. Ionic thermoelectric materials for near ambient temperature energy harvesting. Appl. Phys. Lett. 118, 020501 (2021).
Eastman, E. D. Theory of the Soret effect. J. Am. Chem. Soc. 50, 283-291 (1928).
Tyrrell, H. J. V., Taylor, D. A. & Williams, C. M. The ‘Seebeck Effect’ in a Purely Ionic System. Nature 177, 668-669 (1956).
Zhao, W. et al. Tailoring intermolecular interactions towards highperformance thermoelectric ionogels at low humidity. Adv. Sci. 9, 2201075 (2022).
Horike, S. et al. Outstanding electrode-dependent seebeck coefficients in ionic hydrogels for thermally chargeable supercapacitor near room temperature. ACS Appl. Mater. Interfaces 12, 43674-43683 (2020).
Wang, H. et al. lonic thermoelectric figure of merit for charging of supercapacitors. Adv. Electron. Mater. 3, 1700013 (2017).
Zhao, Y. et al. Quasi-solid conductive gels with high thermoelectric properties and high mechanical stretchability consisting of a low cost and green deep eutectic solvent. J. Mater. Chem. A 10, 4222-4229 (2022).
Zito, R. Thermogalvanic energy conversion. AIAA J. 1, 2133-2138 (1963).
Quickenden, T. I. & Mua, Y. A review of power generation in aqueous thermogalvanic cells. J. Electrochem. Soc. 142, 3985 (1995).
Lazar, M. A., Al-Masri, D., MacFarlane, D. R. & Pringle, J. M. Enhanced thermal energy harvesting performance of a cobalt redox couple in ionic liquid-solvent mixtures. Phys. Chem. Chem. Phys. 18, 1404-1410 (2016).
Im, H. et al. High-efficiency electrochemical thermal energy harvester using carbon nanotube aerogel sheet electrodes. Nat. Commun. 7, 10600 (2016).
Buckingham, M. A., Marken, F. & Aldous, L. The thermoelectrochemistry of the aqueous iron(II)/iron(III) redox couple: significance of the anion and pH in thermogalvanic thermal-toelectrical energy conversion. Sustain. Energy Fuels 2, 2717-2726 (2018).
Taheri, A., MacFarlane, D. R., Pozo-Gonzalo, C. & Pringle, J. M. Quasi-solid-state electrolytes for low-grade thermal energy harvesting using a cobalt redox couple. ChemSusChem 11, 2788-2796 (2018).
Duan, J. et al. Aqueous thermogalvanic cells with a high Seebeck coefficient for low-grade heat harvest. Nat. Commun. 9, 5146 (2018).
Han, C.-G. et al. Giant thermopower of ionic gelatin near room temperature. Science 368, 1091-1098 (2020).
Li, Y. et al. 3D Hierarchical Electrodes Boosting Ultrahigh Power Output for Gelatin-KCl-FeCN Ionic Thermoelectric Cells. Adv. Energy Mater. 12, 2103666 (2022).
Li, Y. et al. Realizing record-high output power in flexible gelatin/ GTA-KCl-FeCN ionic thermoelectric cells enabled by extending
the working temperature range. Energy Environ. Sci. 10.1039. D2EE02792E https://doi.org/10.1039/D2EE02792E (2022).
Duan, J. et al. Liquid-state thermocells: Opportunities and challenges for low-grade heat harvesting. Joule 5, 768-779 (2021).
Dupont, M. F., MacFarlane, D. R. & Pringle, J. M. Thermoelectrochemical cells for waste heat harvesting – progress and perspectives. Chem. Commun. 53, 6288-6302 (2017).
Iwami, R., Yamada, T. & Kimizuka, N. Increased Seebeck Coefficient of Thermocell Based on the Selective Electrostatic Interactions with Cationic Micelles. Chem. Lett. 49, 1197-1200 (2020).
Yu, B. et al. Thermosensitive crystallization-boosted liquid thermocells for low-grade heat harvesting. Science 370, 342-346 (2020).
Zhou, H., Yamada, T. & Kimizuka, N. Supramolecular thermoelectrochemical cells: enhanced thermoelectric performance by host-guest complexation and salt-induced crystallization. J. Am. Chem. Soc. 138, 10502-10507 (2016).
Romano, M. S. et al. Carbon nanotube – reduced graphene oxide composites for thermal energy harvesting applications. Adv. Mater. 25, 6602-6606 (2013).
Li, G. et al. High-efficiency cryo-thermocells assembled with anisotropic holey graphene aerogel electrodes and a eutectic redox electrolyte. Adv. Mater. 31, 1901403 (2019).
Hu, R. et al. Harvesting waste thermal energy using a carbon-nanotube-based thermo-electrochemical cell. Nano Lett. 10, 838-846 (2010).
Liu, Y. et al. Advanced wearable thermocells for body heat harvesting. Adv. Energy Mater. 10, 2002539 (2020).
Zhang, L. et al. High power density electrochemical thermocells for inexpensively harvesting low-grade thermal energy. Adv. Mater. 29, 1605652 (2017).
Gao, W., Lei, Z., Zhang, C., Liu, X. & Chen, Y. Stretchable and freezetolerant organohydrogel thermocells with enhanced thermoelectric performance continually working at subzero temperatures. Adv. Funct. Mater. 31, 2104071 (2021).
Yu, B. et al. Cost-effective n-type thermocells enabled by thermosensitive crystallizations and 3D multi-structured electrodes. Nano Energy 93, 106795 (2022).
Gao, Y., Qin, Z., Guan, L., Wang, X. & Chen, G. Z. Organoaqueous calcium chloride electrolytes for capacitive charge storage in carbon nanotubes at sub-zero-temperatures. Chem. Commun. 51, 10819-10822 (2015).
Roberts, A. J., Danil de Namor, A. F. & Slade, R. C. T. Low temperature water based electrolytes for carbon supercapacitors. Phys. Chem. Chem. Phys. 15, 3518-3526 (2013).
Chang, N. et al. An aqueous hybrid electrolyte for low-temperature zinc-based energy storage devices. Energy Environ. Sci. 13, 3527-3535 (2020).
Nian, Q. et al. Aqueous Batteries Operated at . Angew. Chem. Int. Ed. 58, 16994-16999 (2019).
Smith, E. L., Abbott, A. P. & Ryder, K. S. Deep Eutectic Solvents (DESs) and Their Applications. Chem. Rev. 114, 11060-11082 (2014).
Qiu, M. et al. Tailoring water structure with high-tetrahedral-entropy for antifreezing electrolytes and energy storage at . Nat. Commun. 14, 601 (2023).
Matsumoto, M., Saito, S. & Ohmine, I. Molecular dynamics simulation of the ice nucleation and growth process leading to water freezing. Nature 416, 409-413 (2002).
Stangret, J., Kamieńska-Piotrowicz, E. & Laskowska, K. FT-IR studies of molecular interactions in formamide-methanol mixtures. Vib. Spectrosc. 44, 324-330 (2007).
Liu, C. et al. Ion regulation in double-network hydrogel module with ultrahigh thermopower for low-grade heat harvesting. Nano Energy 92, 106738 (2021).
Alzahrani, H. A. H., Buckingham, M. A., Marken, F. & Aldous, L. Success and failure in the incorporation of gold nanoparticles inside ferri/ferrocyanide thermogalvanic cells. Electrochem. Commun. 102, 41-45 (2019).
Park, S. M. & Yoo, J. S. Peer reviewed: electrochemical impedance spectroscopy for better electrochemical measurements. Anal. Chem. 75, 455 A-461 A (2003).
Gunawan, A. et al. The amplifying effect of natural convection on power generation of thermogalvanic cells. Int. J. Heat. Mass Transf. 78, 423-434 (2014).
Kang, T. J. et al. Electrical power from nanotube and graphene electrochemical thermal energy harvesters. Adv. Funct. Mater. 22, 477-489 (2012).
Zhou, H., Yamada, T. & Kimizuka, N. Thermo-electrochemical cells empowered by selective inclusion of redox-active ions by polysaccharides. Sustain. Energy Fuels 2, 472-478 (2018).
Qian, W., Cao, M., Xie, F. & Dong, C. Thermo-electrochemical cells based on carbon nanotube electrodes by electrophoretic deposition. Nano-Micro Lett. 8, 240-246 (2016).
Cheng, H., He, X., Fan, Z. & Ouyang, J. Flexible quasi-solid state ionogels with remarkable seebeck coefficient and high thermoelectric properties. Adv. Energy Mater. 9, 1901085 (2019).
Malik, Y. T. et al. Self-healable organic-inorganic hybrid thermoelectric materials with excellent ionic thermoelectric properties. Adv. Energy Mater. 12, 2103070 (2022).
He, X., Cheng, H., Yue, S. & Ouyang, J. Quasi-solid state nanoparticle/(ionic liquid) gels with significantly high ionic thermoelectric properties. J. Mater. Chem. A 8, 10813-10821 (2020).
Chi, C. et al. Selectively tuning ionic thermopower in all-solid-state flexible polymer composites for thermal sensing. Nat. Commun. 13, 221 (2022).
Zhao, D. et al. Ionic thermoelectric supercapacitors. Energy Environ. Sci. 9, 1450-1457 (2016).
Jeong, M. et al. Embedding aligned graphene oxides in polyelectrolytes to facilitate thermo-diffusion of protons for high ionic thermoelectric figure-of-merit. Adv. Funct. Mater. 31, 2011016 (2021).
Yang, P. et al. Wearable thermocells based on gel electrolytes for the utilization of body heat. Angew. Chem. Int. Ed. 55, 12050-12053 (2016).
Duan, J. et al. P-N conversion in thermogalvanic cells induced by thermo-sensitive nanogels for body heat harvesting. Nano Energy 57, 473-479 (2019).
الشكر والتقدير
تم دعم هذا العمل من قبل برنامج الابتكار في شنتشن للعلماء الشباب المتميزين (أرقام المنح RCJC2O21O706091949018)، وبرنامج فريق البحث المبتكر ورائد الأعمال في قوانغدونغ (أرقام المنح 2016ZTO6G587)، وصندوق العلوم والتكنولوجيا في شنتشن (أرقام المنح KYDPT20181011104007). يقر المؤلفون بالدعم
من مراكز أبحاث وتعليم الهندسة الميكانيكية في MIT وSUSTech. يقر W.S.L بالدعم من مؤسسة Tencent من خلال جائزة XPLORER.
مساهمات المؤلفين
تصور شواهوا وانغ ويوتشين لي هذا المشروع. أعد شواهوا وانغ العينات، وصنع الخلايا. أجرى شواهوا وانغ وماو يو التجربة. قام شواهوا وانغ ويوتشين لي وماو يو وكايكاي لي بتحليل البيانات. قام شواهوا وانغ ويوبينغ وانغ بإجراء محاكاة COMSOL. أعد شواهوا وانغ المخطوطة. قام هوان لي، وجياجيا تشانغ، ويوتشين لي، وويشو ليو بمراجعة المخطوطة. حصل ويشو ليو على التمويل. ويشو ليو، الإشراف. شارك جميع المؤلفين في التحليل والنقاش.
المصالح المتنافسة
يعلن المؤلفون عدم وجود مصالح متنافسة.
معلومات إضافية
المعلومات التكميلية النسخة عبر الإنترنت تحتوي على
المواد التكميلية المتاحة على https://doi.org/10.1038/s41467-024-45432-7.
يجب توجيه المراسلات والطلبات للحصول على المواد إلى ويشو ليو.
معلومات مراجعة الأقران تشكر Nature Communications شياوغانغ تشانغ والمراجع المجهول الآخر على مساهمتهم في مراجعة الأقران لهذا العمل. يتوفر ملف مراجعة الأقران.
قسم علوم المواد والهندسة، الجامعة الجنوبية للعلوم والتكنولوجيا، شنتشن، قوانغدونغ 518055، الصين.ساهم هؤلاء المؤلفون بالتساوي: شواهوا وانغ، يوتشين لي. البريد الإلكتروني:liuws@sustech.edu.cn
High-performance cryo-temperature ionic thermoelectric liquid cell developed through a eutectic solvent strategy
Received: 18 September 2023
Accepted: 23 January 2024
Published online: 08 February 2024
(A) Check for updates
Shuaihua Wang , Yuchen , Mao Yu , Qikai , Huan , Yupeng Wang , Jiajia Zhang , Kang Zhu & Weishu Liu (1)
Abstract
Ionic thermoelectric (i-TE) liquid cells offer an environmentally friendly, cost effective, and easy-operation route to low-grade heat recovery. However, the lowest temperature is limited by the freezing temperature of the aqueous electrolyte. Applying a eutectic solvent strategy, we fabricate a highperformance cryo-temperature i-TE liquid cell. Formamide is used as a chaotic organic solvent that destroys the hydrogen bond network between water molecules, forming a deep eutectic solvent that enables the cell to operate near cryo temperatures (down to ). After synergistic optimization of the electrode and cell structure, the as-fabricated liquid i-TE cell with cold ( ) and hot ( ) ends achieve a high power density ( ) and a large twohour energy density ( ). In a prototype 25 -cell module, the open-circuit voltage and short-circuit current are 6.9 V and 68 mA , respectively, and the maximum power is 131 mW . The anti-freezing ability and high output performance of the as-fabricated i-TE liquid cell system are requisites for applications in frigid regions.
Ionic thermoelectric (i-TE) cells have attracted increasing attention because they provide high thermopower at low cost and can be easily operated. Therefore, they can potentially utilize low-grade heat to power internet-of-things (IoT) devices . The thermodiffusion effects , thermogalvanic effects , and synergistic effects in i-TE liquid cells and gel cells have been widely studied. In an i-TE liquid cell (sometimes called a thermogalvanic cell or thermocell ), the thermopower derived by a temperature gradient is mainly contributed by the thermogalvanic effect since the coupling transport of thermodiffusive anion and cation cancels the statistic potential . The convection endows redox couple a continuous conversion from heat to electricity in the liquid-state i-TE solutions, and the obvious advantage of large power output as compared with its counterpart of i-TE gel cell . The power generation of i-TE cells is determined by the two-hour energy density ( ) and the instantaneous power , where and are the open-circuit
voltage and short-circuit current, respectively. The of i-TE liquid cells can be improved through three general strategies: (i) modifying the electrolyte to boost the , which is related to the solvationstructural entropy difference ( ) and the temperature-dependent concentration ratio difference ( ) between the redox species , (ii) designing an electrode microstructure that accelerates electron exchange between the redox couple and electrode, which decides the , and (iii) extending the maximum working temperature range ( ) to increase the or of an i-TE liquid cell . Many researchers have modified the electrolyte to enhance the and consequently the . Zhou et al. boosted the to by introducing urea and guanidinium ( GdmCl ) to an aqueous electrolyte (abbreviated as ). They reported that guanidinium and urea synergistically reorganize the solvation structures of the redox couple . Teppei et al. adopted an amphiphilic ionpairing strategy that exploits the binding-affinity difference between
dodecyl tetramethylammonium bromide micelles and the redox species, thus changing the of from 1.4 to . Meanwhile, enhancing the boosts the because the directly affects the concentration of the activated molecules required for the electrode reaction . Employing a supramolecular approach that confines ions within -cyclodextrin cavities, Yamada et al. created an concentration gradient in an aqueous electrolyte that increased the from -0.86 to . Zhou et al. devised a thermosensitive crystallization methodology in which the complex is crystallized, precipitated, and dissolved to generate a sustained concentration gradient. Their methodology achieved an of in a aqueous electrolyte .
Meanwhile, carbon-based nanomaterials with high specific surface areas have markedly advanced over the last decade. Baughman et al. designed a carbon nanotube-reduced graphene oxide composite electrode with adjustable porosity. They confirmed a positive correlation between the electroactive surface area of the electrode and the in the i-TE liquid cell . Subsequent research has reported that various carbon-based electrodes, such as graphene aerogel , multiwalled carbon nanotubes , laser-etched PEDOT: PSS , and active carbon cloth , increase the by increasing the effective electrical conductivity ( ) and . The is another critical parameter of i-TE cells. The up-limit temperature in an i-TE gel cell is determined by the thermal stability of the quasi-solid-state gel network, whereas the down-limit temperature is limited by the kinetic behavior of the thermodiffusing ions. Li et al. introduced glutaraldehyde to gelatin, forming strong covalent bonds that increased the from to while maintaining at . They reported a high power density of . For an i-TE liquid cell, is limited by the freezing point of the solution . The values of the reported i-TE liquid cells always exceed . Specifically, the values of electrolyte, electrolyte, electrolyte, and electrolyte are , and , respectively. Depressing the into the cryotemperature region remains a challenging task.
Benefiting from the natural of eutectic solvents that form a liquid mixture at a lower melting point than that of any individual component, electrolytes consisting of a eutectic mixture solvent such as Formamide (FA)/ , Ethylene glycol (EG) , and Dimethyl sulfoxide (DMSO) , were promising candidates for cryogenic processes in energy-related systems. Given the ability of eutectic solvents to offer superior ionic transport conditions for electrolytes in subzero temperatures , they present a viable approach to lower the minimum operating temperature of ionic thermoelectric cells into the cryogenic range. For instance, Li et al. assemble a cryo-thermocell with a eutectic redox electrolyte of formamide and water and achieved a of at . The present study explores the application of an /formamide (FA)- liquid cell at cryo temperatures. The cell is fabricated through a eutectic solvent strategy and synergistic optimization. We first introduce the chaotic organic FA solvent, which destroys the hydrogen bond network among the water molecules through molecular dipole interactions, forming a eutectic solvent with a low melting point. Next, we show that the hydrophilic properties of the porous carbon electrode critically determine the power output of the i-TE liquid cell. Finally, to enlarge the , we investigate the thermal resistance effect of a thermally insulating separator (TIS) formed from cotton fibers. The instantaneous output power density ( ) reached and the two-hour energy density ( ) reached between at the cold end and at the hot end. This work is expected to broaden the working temperature range and enhance the power output of i-TE cells, enabling their application in most human living areas, including frigid polar regions in the winter.
Results and discussion
Principle of high anti-freezing performance
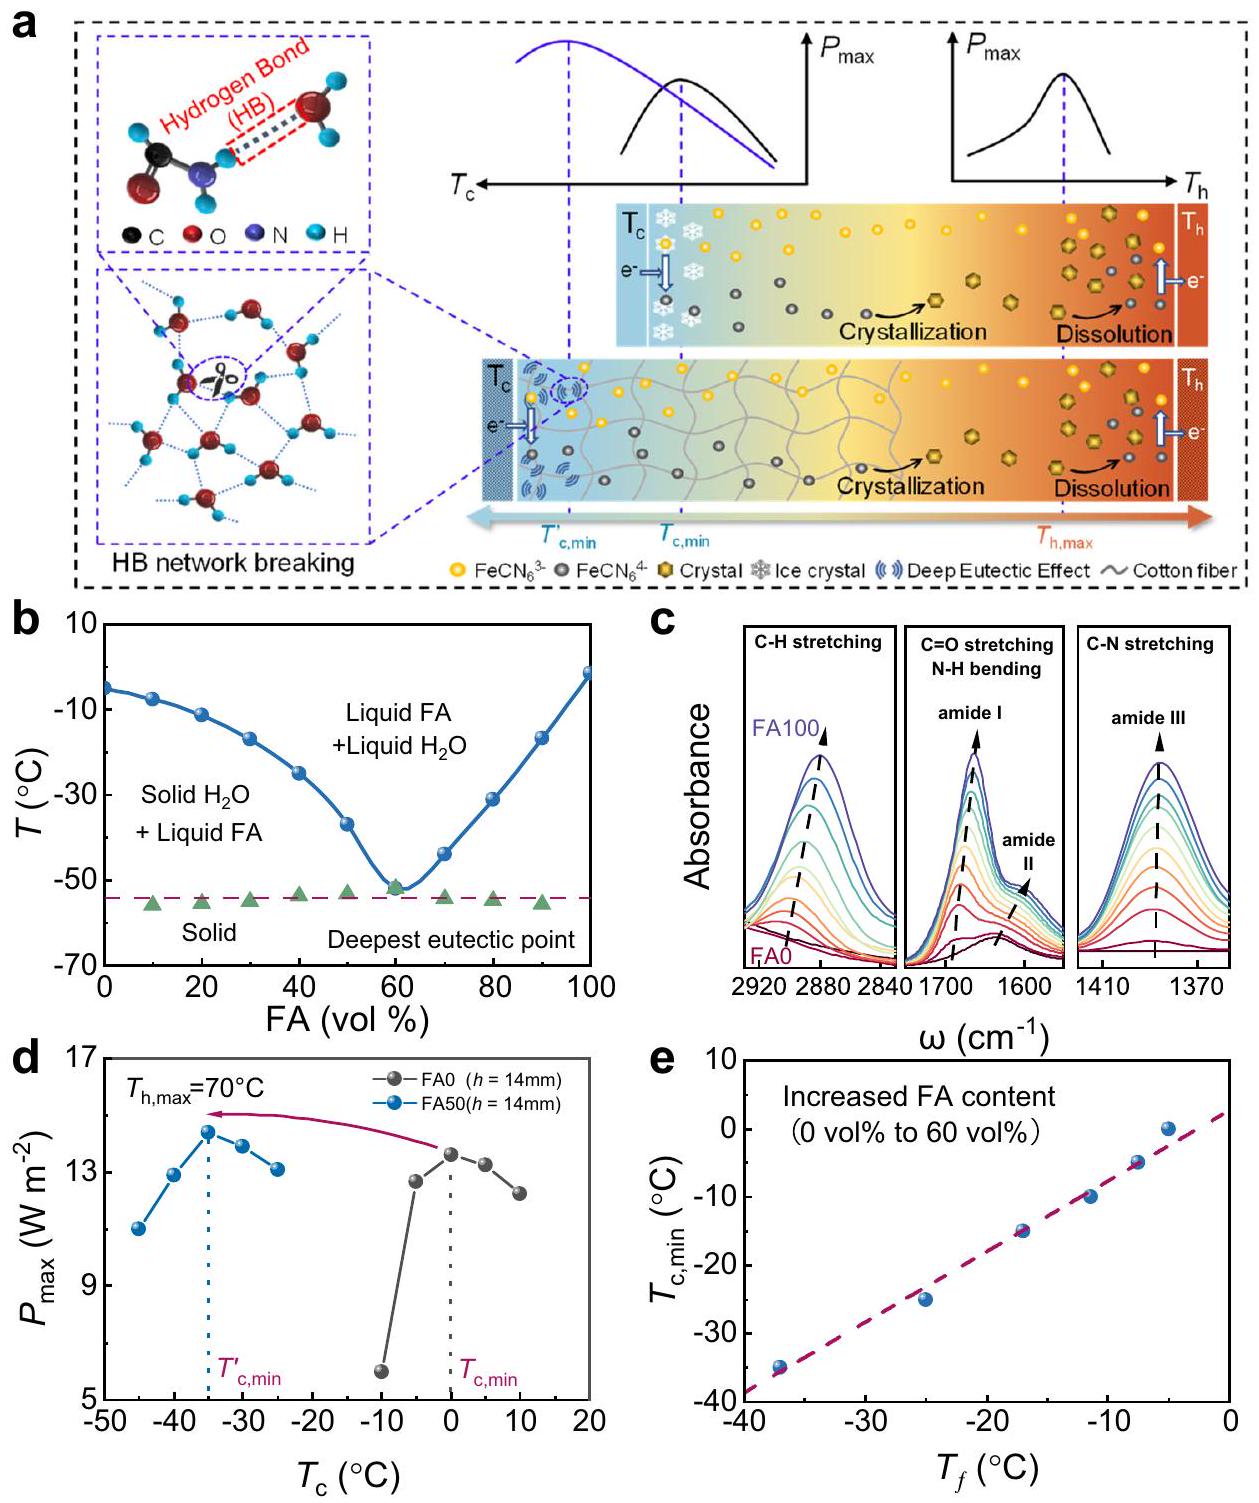
Figure 1a illustrates how a eutectic solvent can decrease the of an i-TE liquid cell intended to operate at cryo temperatures. The freezing of the solvent limits the of the liquid cell, suppressing the thermodiffusion of ions. Here we proposed a eutectic solvent strategy that decreases the freezing point ( ) of water solvents. Theoretically, the of an electrolyte can be lowered by increasing the entropy of the solvent molecules, which decreases the Gibbs free energy of the liquid . At the molecular level, water freezing involves the nucleation of ice from a random arrangement into a tetrahedrally coordinated structure through hydrogen bonding . An additional solvent such as FA can form a solution that disturbs the hydrogen bond network between water molecules.
First, the of ionic solutions ( in increments; ) were derived from differential scanning calorimetry (DSC) measurements (Supplementary Fig. 1). For simplicity, the ionic solutions FA are hereafter referred to as FA0-FA100, where the number denotes the volume percentage of FA. Figure 1b shows the phase diagram of the hybrid electrolyte determined from DSC measurements. The electrolyte exhibits obvious binary eutectic behavior. The of formamide-free FAO is below that of pure water ( ) because the and GdmCl ions are solvated. In containing , 40,50 , and 60 vol. , the values are , , and , respectively. This continuous decrease is followed by a increase at higher FA contents. The deepest eutectic point is at an FA content of .
The ionic conductivities of the ionic solutions were measured using electrochemical impedance spectroscopy (EIS) at different temperatures. The resistances yielded by the EIS curves are plotted in Supplementary Fig. 2. The ionic conductivity of the ionic solution decreases slightly with increasing FA content, probably because the viscosity increases with FA content. All ionic conductivities decline similarly as the temperature drops from to . However, below , FA added at any proportion increases the ionic conductivity from that at FAO. In particular, FA50 retains is high ionic conductivity (5.90 ) down to , whereas the ionic conductivity of FAO dramatically drops to at .
The molecular interactions in the ionic solutions were investigated using Fourier transform infrared spectroscopy (FTIR) (Fig. 1c and Supplementary Fig. 3). The spectra of all ionic solutions exhibit a characteristic peak at corresponding to the stretching vibrations of cyanide ions ( ), indicating that the FA additive did not affect the complex structure of . Because the and bands of and FA, respectively, coincide at around , increasing the FA content caused no obvious peak displacement but the peaks were visibly separated. Non-negligible blue shifts of the stretching vibrations (amide I) of FA at 1630-1685 cm-1, N-H bending vibrations (amide II) of FA at 1600-1640 cm-1, and C-H stretching vibrations of FA at are observed with increasing FA content. In contrast, the peak positions of the stretching vibrations (amide III) of FA at 1350-1430 cm are identical in the spectra of all samples. The results reveal at least three different forms of hydrogen bonds between FA and water (Supplementary Fig. 4) . Hence, the hydrogen bonds are easily broken by the stronger hydrogen bonds of , substantially lowering the of the hybrid electrolyte and thereby improving its ionic conductivity at low temperatures.
The i-TE liquid cell with the hybrid electrolyte maintains its excellent thermoelectric performance near cryo temperatures. In this study, the was optimized by adjusting the FA content and the electrode separation gap . In our previous work, was adopted as a performance indicator for seeking the maximum hot-side temperature ( ) and minimum cold-side temperature ( ) . Herein, we
Fig. 1 | Principle of anti-freezing. a Design principal of the / ionic thermoelectric (i-TE) liquid cell ( formamide, guanidinium). phase diagram of the hybrid electrolyte. FTIR spectra of the hybrid electrolytes (FA0, FA10, FA20-FA100). d Plot of maximum power of the
first discuss the effects of FA content on and in the FA- liquid cell. At a GdmCl concentration of 3 M , the i -TE liquid cell with the complex produces the highest thermopower (Supplementary Fig. 5). The theoretical upper limit of in this system is . At higher temperatures, the system fails due to boiling of the electrolyte. Considering the thermal stability of the thermal-sensitive crystals in this system, the was set at . Meanwhile, the decreases with increasing FA content. More specifically, at , and , the values were , , and , respectively, corresponding to increases of , and , respectively (Supplementary Fig. 6 and Supplementary Fig. 7). Supplementary Fig. 8 shows the and of the i-TE liquid cell ( ) working at their corresponding values. The increases with increasing FA content ( , and 310 mV at , and , respectively). The increase from FA0 to FA10 is slight. The trends oppositely because the increase
in viscosity and decrease in conductivity with increasing FA content, along with the decrease in service temperature. However, the and of FA60 show a marked decline, probably reflecting the decreased thermopower of this cell. As shown in Fig. 1d, the antifreezing performance and of the optimized i-TE liquid cell (FA50 with ) are largely improved from those of FA0. After manipulating the solvent molecules, the decreased from to , suggesting excellent frost resistance. The of FA50 ( ) reached when and and the corresponding was higher than that of FAO ( ) with the low-entropy aqueous electrolyte ( ). Note that the of FA60 was further decreased to , the lowest among the FA series (FA0 to FA100; see Supplementary Fig. 9), but the of FA60 was reduced by the low thermopower. To clarify the relationship between and the eutectic behavior of the electrolyte, Fig. 1e plots versus for the i -TE liquid cells. The plot is almost linear with an slope of , indicating that the obtained in the performance test well
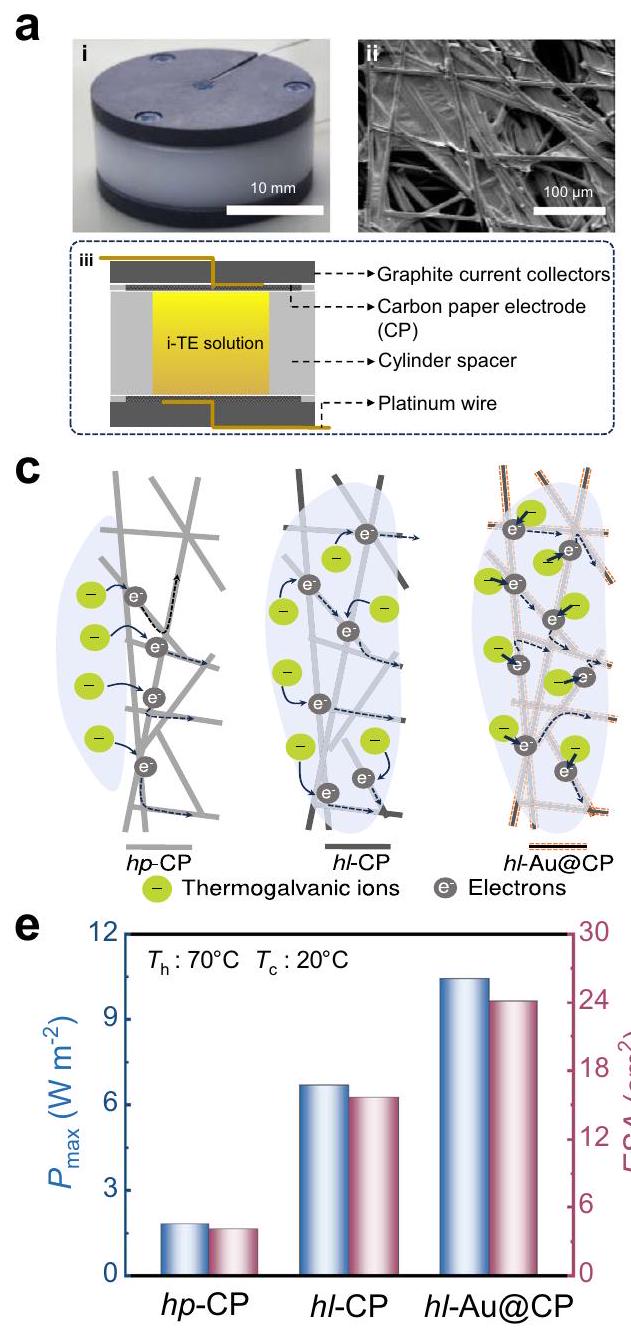
Fig. 2 | Electrode optimization of the i-TE liquid cell. a Components of the cell. i: Entity profile of the cell. ii: Scanning electron microscope (SEM) image of a typical carbon paper (CP) electrode. iii: Structure diagram of the cell. Voltage and output power density versus current density of the i-TE liquid cell (FAO, ) with three different electrodes (hydrophobic carbon paper (CP), hydrophilic CP, hydrophilic ) with and set to and , respectively. c Schematic showing the effect of hydrophilic treatment and a
gold-nanoparticle coating on the structure and properties of the CP electrode. d Cyclic voltammograms of the hydrophobic CP, hydrophilic CP, and hydrophilic Au@CP electrode. e Maximum output power density and electroactive surface area (ESA) values of i-TE liquid cells (FA0, ) with different electrodes. f Nyquist plots of the hydrophobic CP, hydrophilic CP, and hydrophilic Au@CP electrode (inset is a magnified plot of the linear regions).
corresponds to the eutectic behavior of the -GdmCl electrolyte.
Electrode structure and current density
The electrode structure plays a critical role in the energy output of an i-TE liquid cell . A rough electrode with a high specific surface area improves the short-circuit current density ( ) of the cell . Here, the i-TE liquid devices were assembled from two carbon paper (CP) electrodes, the electrolyte, and a thermal insulation separator. They were encapsulated within two graphite current collectors and a cylinder spacer that defines the electrode separation gap (h) (Fig. 2a and Supplementary Fig. 10). The measured thermopowers of the 0.4 M and cells with this structure were 1.4 and respectively (Supplementary Fig. 11), consistent with their reported values . The FA additive slightly decreases the thermopower of the solution. For example, the thermopower of FA50 solution is lower than that of FA0 solution (Supplementary Fig. 12). FA weakens the chaotropic-chaotropic interaction between GdmCl and , which lowers the
reaction entropy of the redox couples and thus the thermopower. The UV-Vis spectra of FA-free with and without GdmCl (Figure S13a), and with varying FA (Figure S13b) were obtained to characterize the interaction. First, the peak shifts from 178 nm to 209 nm upon GdmCl addition, indicating the chaotropic-chaotropic interaction between GdmCl and . However, in Figure S13b, the peak of the i -TE solution of (FA/Water) reverses from 209 nm to 184 nm , indicating that the chaotropic-chaotropic interactions are weakened by FA. Moreover, we compared the thermopower of two i-TE solution series, namely and 0.4 M with different FA (Figure S14). It shows that, without GdmCl , the thermopower is nearly constant with FA . In contrast, in , the thermopower decreases with increasing FA. This suggests that FA affects the hydrate structure of GdmCl rather than , and consequently the interaction.
CP electrodes are known to possess excellent electrical conductivity and a self-supporting carbon-fiber network structure that provides an abundant electrochemically active interface for electron
exchange between redox couples . Here, we noted that hydrophilicity of the electrode is another important determiner of high . The optical contact angle of the as-received CP is (Supplementary Fig. 15). The as-fabricated i-TE solutions cannot diffuse into the CP electrode to form a heterogeneous interface. After treatment with oxygen plasma, the i-TE solution droplets completely infiltrated and penetrated the electrode interior, suggesting good hydrophilic performance. Hereafter, the as-received CP is referenced as hydrophobic CP (hp-CP) while the hydrophilically treated CPs are called hydrophilic CPs (hl-CP). As shown in Fig. 2b, the is 3.7 times higher in the CP | FAO | – CP i-TE liquid cell ( ) than in the -CP liquid cell when and are set to and , respectively.
Next, a 40 -nm-thick Au layer was installed to reduce the electrodeinterface resistance relative to electron exchange between the redox couple. The porous structure of the asreceived CP (pore size ) was unaffected by the Au coating layer. For simplicity, this hydrophilic CP electrode with the thick Au coating is referenced as . The of the Au@CP | FAO | -Au@CP i-TE liquid cell ( ) was further improved to times higher than of the -CP cell (Fig. 2b). The schematic in Fig. 2c shows the effects of the hydrophilic treatment and gold-nanoparticle coating on the structure and properties of the CP electrode. The -CP electrode provides more electrochemically active sites than -CP because the surface energy between the electrode surface and electrolyte is higher for hl-CP than for hp-CP, promoting the infiltration of thermogalvanic ions into the internal microstructure. The gold nanoparticles on hl-Au@CP effectively reduce the electrode-interface resistance and accelerate the electron transfer process of the redox reaction . The electroactive surface area (ESA) can be determined from the peak current density ( ) in the cyclic voltammograms (CVs) of the electrodes (Fig. 2d). According to the Randles-Sevcik equation, a high faradaic peak current of an electrode exhibiting reversible kinetics indicates a high . The ESAs of the hp-CP, hl-CP, and hl-Au@CP electrodes were estimated as , and , respectively. Note that the values indicate only the performances of the CP electrodes, not their actual areas. In general, a higher ESA corresponds to a higher (Fig. 2e). Furthermore, the charge transfer resistances ( , diameter of the semicircle in a Nyquist plot) of the , and electrodes were 102,16 , and , respectively. The diffusioncontrolled impedance (Warburg impedance , reflected in the part of the Nyquist plot with a near- slope in the medium-high frequency domain) was much lower in the -Au@CP electrode ( ) than in the and electrodes, indicating fast electron transfer and ion diffusion within the -Au@CP electrode (Fig. 2f).
Structure and effective temperature difference of the i-TE liquid cell
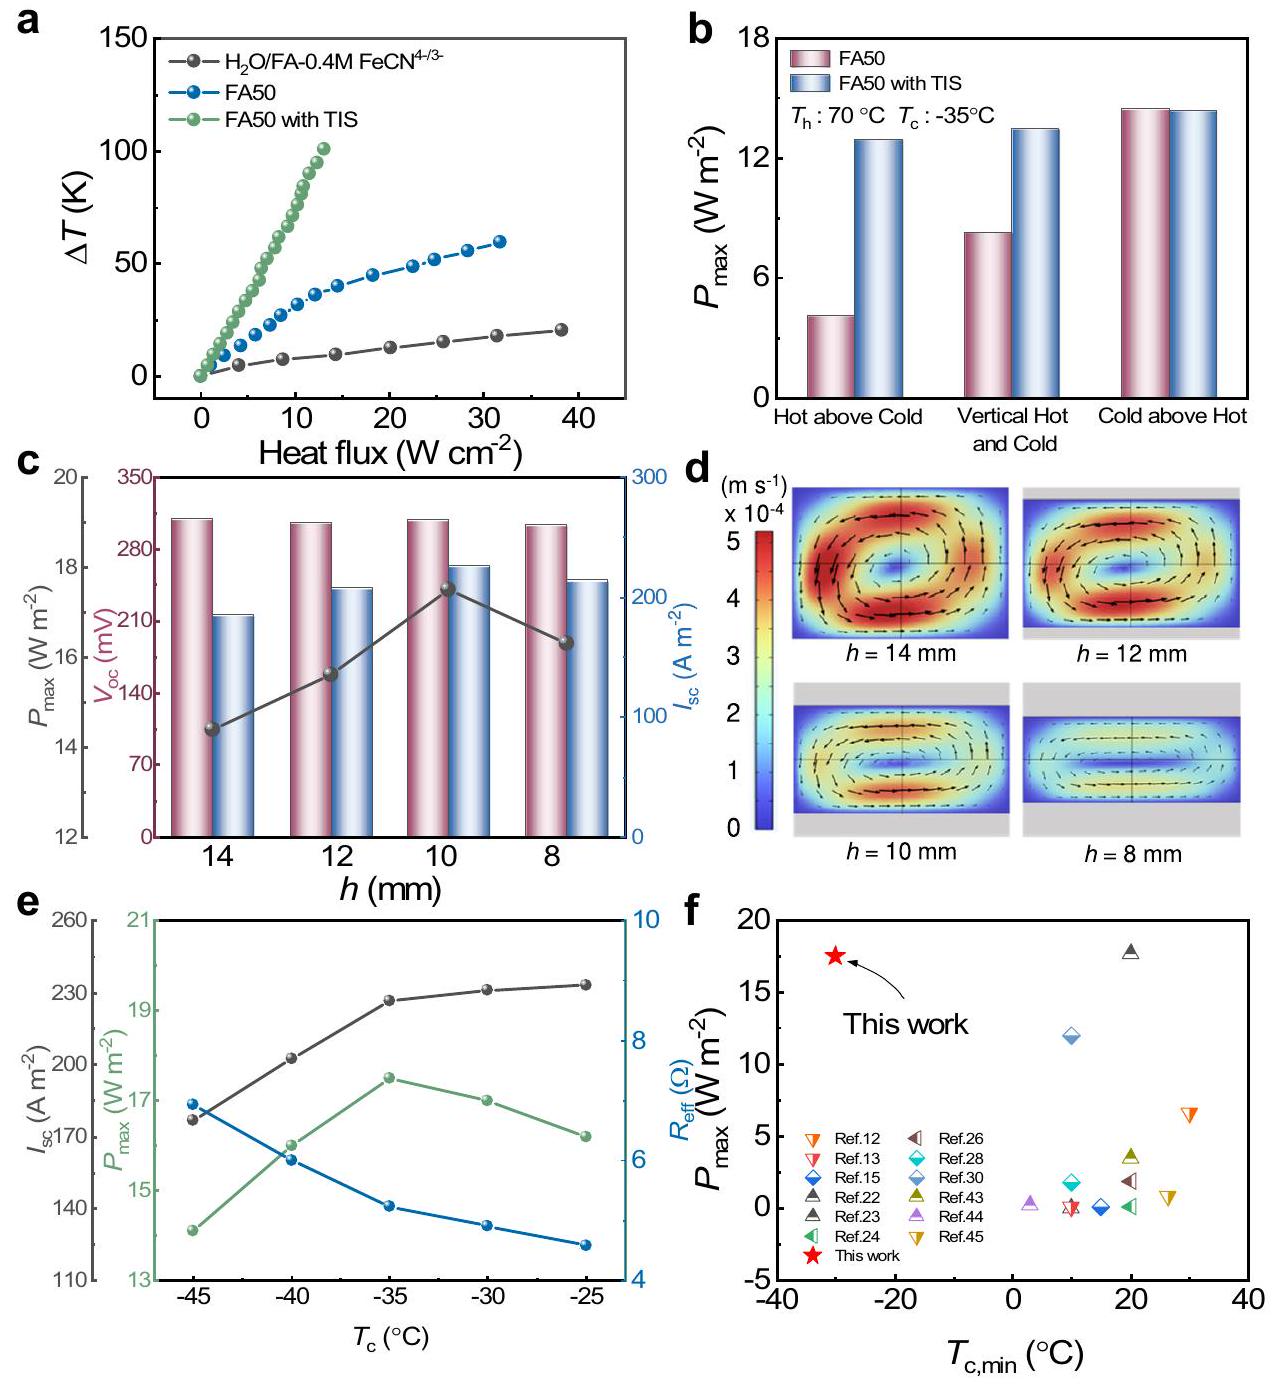
The electricity generation performance of i-TE cells relies on the i-TE materials and the effective temperature difference . Convection in the i-TE liquid cell enables continuous operation of the redox couple but lowers the thermal resistance and reduces the . Consequently, the electrode separation gap and thermally insulating separator (TIS) are key components of the structural design of an i-TE liquid cell. For instance, by using a hydrophilic cellulose sponge, Baughman et al. improved the of the cell from 63 to . Here, a cotton-fiber TIS was immersed in the i-TE solution to enlarge the thermal resistance of the i-TE liquid cell (Supplementary Fig. 16). Figure 3a plots the effective across the i -TE liquid cells with and without the TIS as functions of heat flux. The tested cells were (FA50), and FA50 with TIS. First, one observes that GdmCl enlarges the by reducing the convection. Second, the TIS effectively suppresses heat convection and increases the thermal resistance of the cell (The thermal conductivity of the electrolyte and electrode are shown in Supplementary Table 1). The TIS raised the
maximum of the FA50 cell by from that of the FA50 cell without the TIS ( versus under a heat flux of ). Furthermore, the TIS desensitized the i-TE liquid cell to the temperature-gradient direction (Fig. 3b), which affects the power generation of the cell. Typically, placing the cold electrode above the hot electrode achieves a higher than placing the hot electrode above the cold electrode or placing vertical cold and hot electrodes. In the former configuration, incessant convection mixing homogenizes the electrolyte and increases its ionic conductivity . In this study, the TIS suppressed convection through the electrolyte and fixed thermosensitive crystal precipitation, so the was insensitive to the temperature-gradient direction.
Figure 3c shows the effect of electrode separation gap ( ) on the of the -Au@CP | FA50-TIS|hl-Au@CP cell working at its corresponding . Decreasing from 14 to 8 mm did not affect the , indicating that is an inherent property of the electrolyte and independent of device structure (Supplementary Fig. 17). was also unchanged, indicating that the thermopower is an intrinsic property of the cell (Supplementary Fig. 18). The initially increased from 185 to as decreased from 14 to 12 mm , reached a maximum of at , and finally decreased to at . Consequently, a of and a of were obtained at . The shorter of the electrode separation gap would have less internal resistance, hence resulting in the increase . In order to clarify the abnormal decreased as the further decreased to 8 mm , we have conducted simulation with COMSOL Multiphysics 6.0 to investigate the effect of electrode separation gap on the thermogavanic convection. In the i – TE solution of , the ionic convection is due to the accumulated from oxidation of at hot side, resulting into back flux of from hot side to cold, and vice versa for cold side . The convection of redox couples also afford the i-TE cells work continuous, and also have higher energy output than that with only thermodiffusion ions. Figure 3d compares the simulated convection of the i-TE cell of (FA50) with different electrode gap, and a fixed temperature difference of ( ). It clearly shows that the electrode gap has a significant effect on the convection speed, showing that the redox pair circulation slow down as the electrode separation gap decreases. This reduced convection would result in a decreased . In other words, the decreased has two opposite effects on the . The balance between the reduced internal resistance and suppressed convection results in the optimized . Additionally, we also noted that the convection of redox couple also resulted in the non-uniform temperature gradient both vertically and horizontally (Supplementary Fig. 19), which add the complex to understand the contribution of the microscopic ionic behavior to macroscopic thermovoltage. To identify the , and effective resistance values ( ) of the optimal i-TE liquid cell, namely, -Au@CP | FA50TIS Au CP , the , and are plotted as functions of in Fig. 3e and Supplementary Fig. 20. The gradually decreased from at to at and suddenly decreased to at and to at . The dramatic change in the trend at can be understood from the plot. As decreased from to to increased from 4.6 to 4.9 to because the ion transport rate reduces with decreasing temperature. However, a phase transition in the electrolyte increased the to at and at . An obvious turning point at also appears in the growth curve of from to (Supplementary Fig. 21). From the was therefore determined as . Figure 3f compares the obtained and in this work with those of other reported i-TE liquid cells . To our knowledge, we have achieved the highest power density near cryo temperatures and the lowest cold-side temperature. Improving the anti-freezing solvent environment and accelerating the dynamic ion migration was
Fig. 3 | Structural optimization of the i-TE liquid cell. a Temperature differences between the cold and hot electrodes as functions of heat flux in three electrolyte configurations (FA50 with neither GdmCl nor a thermal insulation separator (TIS), FA50 with GdmCl but without TIS, FA50 with both GdmCl and TIS). of the i-TE liquid cell in three electrode orientations with or without the TIS. c Open circuit voltage , short-circuit current , and in the
i-TE liquid cell with different electrode separations gaps. d Simulated convection profiles of the FA50-TIS i-TE liquid cell with varying electrode separations gaps at and . e , and effective resistance of the FA50 cell ( ) versus . Comparison of and between the proposed and reported i-TE liquid cells .
considered to stabilize the mass transfer for redox couples at a lower , thereby increasing the .
Long-term power generation
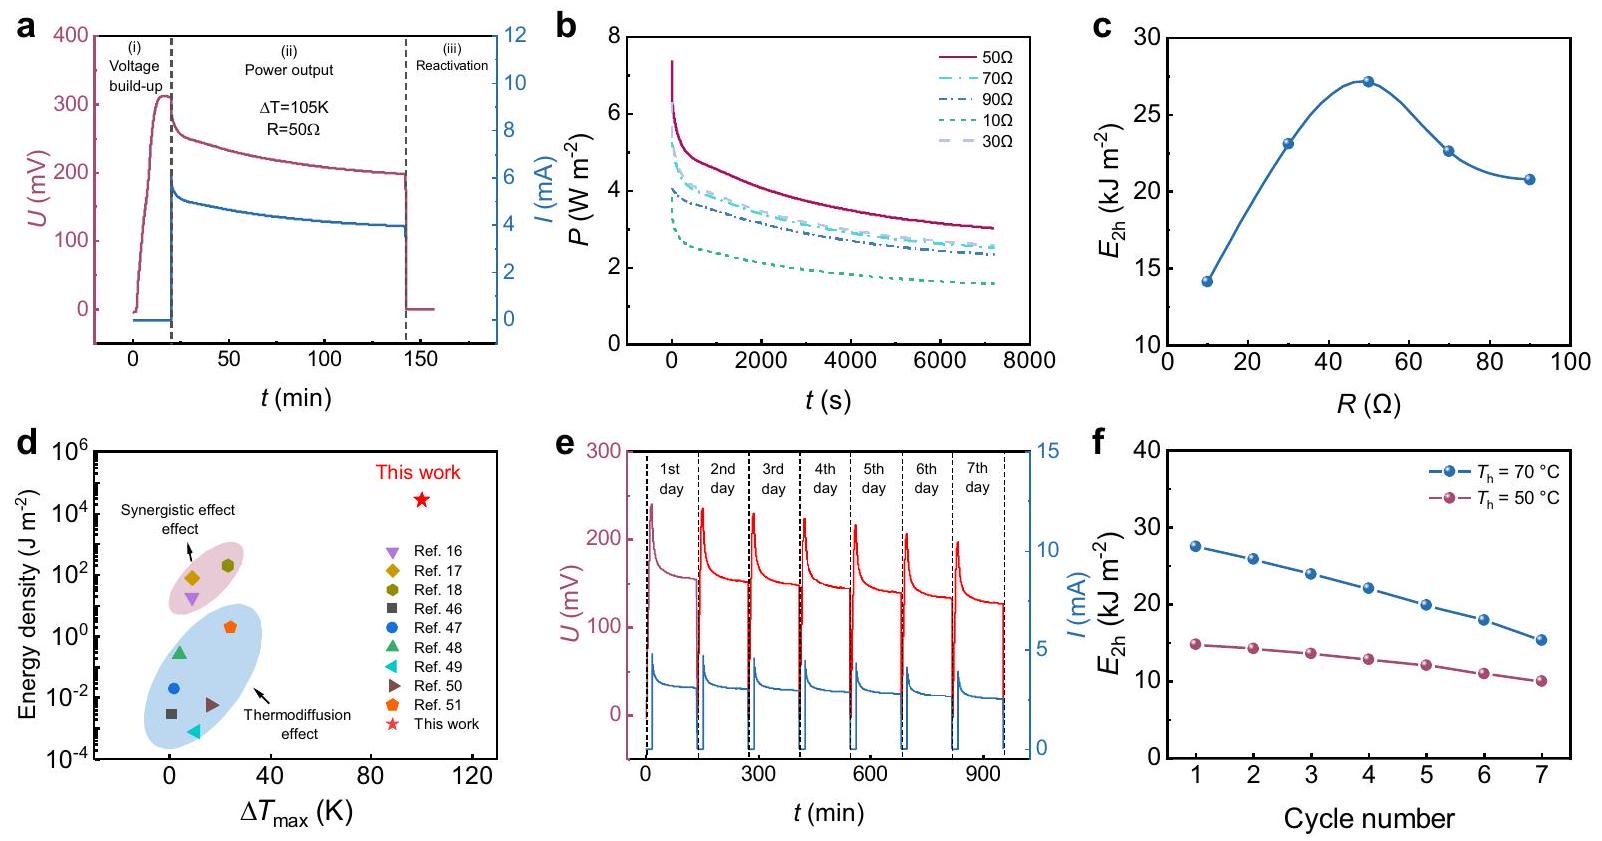
Next, we investigated the energy output performance and cyclic performance of the as-fabricated hl-Au@CP|FA50-TIS|hl-Au@CP i-TE liquid cell with the optimized separation gap of the electrodes ( ). The i-TE generator mode consists of three stages: voltage build-up, power output, and reactivation. During the first stage, an electric field is generated by the thermogalvanic transfer of from the cold to the hot electrode. During the second stage, an external load is connected and electrons flow from the hot to the cold electrode, decreasing the internal electrostatic field and voltage. During the final stage, the consumed species at the electrodes are replenished by diffusing , canceling the temperature gradient and recovering the voltage. Figure 4a presents the working voltage and current curves of the optimized i-TE liquid cell with a external resistance. The maximum of the i-TE liquid cell was 105 K ( ). The initially rose to 310 mV and then dropped to 195 mV after 2 h of power output to the external
circuit. Finally, the reached 0 mV due to short circuiting and removal. In Stage (ii), the current reduced from 6.2 to 3.9 mA after 2 h of power output. The output power density during this stage was measured with various external resistors ( ; see Fig. 4b). Figure 4 c plots the energy density calculated by integrating the poweroutput curves for 2 h as a function of resistance. Owing to the extended and optimized electrode and cell structure, the as-fabricated i-TE liquid cell achieved a two-hour energy density ( ) of with a external resistor even at near cryo temperatures. This performance far exceeds those of other reported quasi-solid-state i-TE cells (Fig. 4d) . The of FAO ( ) and FA50 ( ) was also compared (Supplementary Fig. 22). The matching resistance with the highest of FAO is smaller than that of FA50, indicating the lower internal resistance of FAO ( ). However, the smaller working temperature range of FAO results in a lower working voltage and a lower , which compromise its output performance.
The cyclic working-resting performance of the as-fabricated i-TE liquid cell was measured in generator mode during one week of continuous cycling with and . During each one-day cycle, the working-rest mode exhibited the above-mentioned voltage
Fig. 4 | Long-term power generation of the hl-Au@CP | FA50-TIS|hl-Au@CP i-TE liquid cell ( ) at in i-TE generator working mode.
a Measured voltage and current curves during three working stages ( ). b Output power density measured over 2 h in stage (ii) using different external resistors. c Corresponding generated energy density as a function of external resistors, calculated by integrating the output power over time ( 2 h ) shown in (a).
d Performance comparison of energy density between the proposed i-TE cell and reported i-TE cells based on thermodiffusion or synergistic effects . e Measured voltage and current curves during one week of continuous cycling ( ). Decay of two-hour energy output of the i-TE liquid cell during one week of cyclic service at and .
build-up ( ), power output with a resistor ( 2 h ), and selfreactivation with short circuiting at . The cell then rested until the following day (The time of reactivation was set to 4 hours to ensure that the open-circuit voltage returned to zero). The measured voltage and current curves of the build-up voltage and power-output stages during the first seven days and the output power density during the second stage on the first, third, fifth, and seventh days are shown in Supplementary Fig. 23. The 2 h energy density ( ) decreased from on day 1 to on day 7, for which the following reasons may account: first, the thermosensitive crystallization dissolution kinetics were presumably slowed by long cycle service at , resulting in the insufficient supply of active ions required for the electrode reaction. Second, the formation and dissolution process of thermosensitive crystallization has a long-term impact on the electrode, such as the electrode surface is gradually covered with a passivation film (Supplementary Fig. 24) which hinders the further diffusion and reaction of active particles on the electrode. To verify this conjecture, we compared the decays of the i-TE liquid cell during one week of cyclic service at and (Fig. ). The cyclic performance of the i-TE liquid cell was higher during service at than during service at . At , the was in the first cycle and decreased to in the seventh cycle, demonstrating a good retention rate of . The specific composition of the passivation layer covering the electrode was also characterized with XRD (Supplementary Fig. 25a) and XPS (Supplementary Fig. 25b) measurement. It can be observed that the passivation layer is essentially the thermosensitive crystal formed by the combination of GdmCl and . During the cyclic testing process, the grain size gradually decreased and easily adhered to the electrode surface to form the passivation layer, resulting in the performance degradation. The cyclic working-resting performance of FAO ( ) was also conducted (Supplementary Fig. 26). The decay of two-hour energy output of FA50 and FA0 during one week of cyclic service were compared (Supplementary Fig. 26c). Despite exhibiting more severe degradation than FA0, FA50
still had a higher total power capacity of 14 hours ( for FA50 compared to for FAO). The instantaneous output power ( ) of the cell was affected by the long-term cyclic service, and the graph of FA0 and FA50 after the one-weak cycle test was given by Supplementary Fig. 27. The of both exhibit varying degrees of attenuation ( for FA50 and for FA0). The lower of FA50 was attributed to its poorer cycling performance, which was influenced by factors such as larger working temperature difference, lower cold-end temperature, lower conductivity and higher viscosity of FA50 solution.
25-cell i-TE module
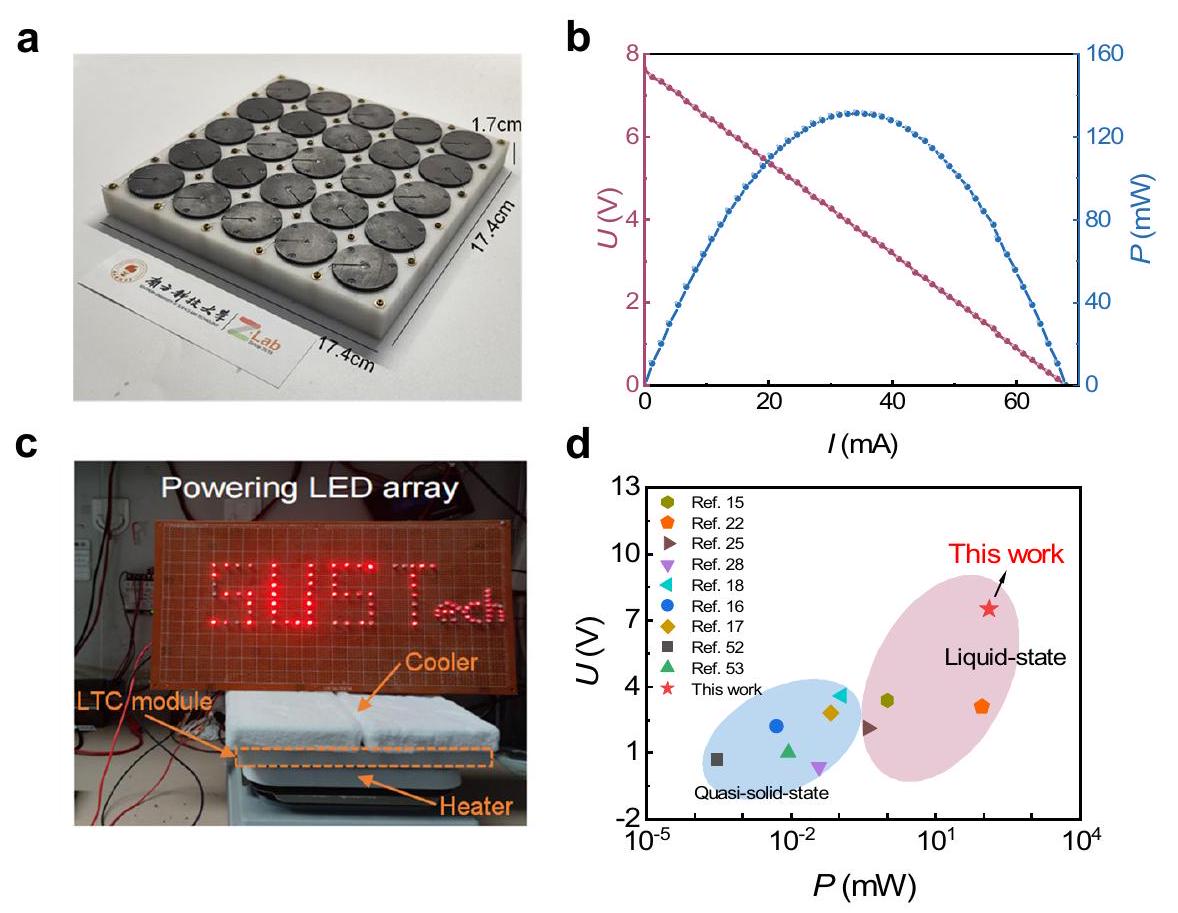
Finally, the optimized i-TE liquid cell, namely, Au@CP ( ), was assembled into a 25 -cell i-TE module (Fig. 5a). The , and produced by the module were , and 131 mW , respectively, with ( and ) (Fig. 5b). Owing to its considerable output power, the module could directly drive a light-emitting diode (LED) array (Fig. 5c). This test demonstrates that our device can power electronics near cryo temperatures, confirming its practical utility. Figure 5d compares the voltage and power of our as-fabricated i-TE liquid cell module devices with those of other reported i-TE and e-TE devices . Our module doubled the voltage from those of the reported devices based on other i-TE systems. Our work extends the application scenarios of i-TE liquid cells to the extremely cold regime, potentially realizing selfpowered supplies that harvest waste heat for IoT sensors in extremely cold environments. Our work also promises scientific activity in frigid polar regions.
Methods
Materials
, ), guanidine hydrochloride ( GdmCl ) ( ), and formamide (FA) ( ) were purchased from Aladdin Industrial Corporation (Shanghai, China). Potassium chloride (KCl)
Fig. 5 | i-TE liquid cell module composed of units in series. a Schematic diagram of the module. Output voltage and power versus output current of the module device. c Powering an LED array with no additional voltage boosters.
( ) was provided by Macklin Biochemical Co., Ltd. (Shanghai, China). All chemical reagents were used as received without further purification. Graphite plates and CP were purchased from JingLong Special Carbon Company, Ltd. (China) and Toray Industries, Inc. (Japan), respectively.
Mechanism characterization
The freezing points of the samples were characterized using a differential scanning calorimeter (Mettler Toledo DSC1, USA). The ionic conductivities of the samples were calculated from the first intercept of the high-frequency semicircle in the results of EIS measurements at different temperatures, where the response is fully resistive. The structural and chemical bonding characteristics of the electrolyte were examined using FTIR-attenuated total reflectance techniques (Bruker Vertex 70 v , province, country). The electrochemical performances were measured on an electrochemical workstation (Zennium Pro, Germany) with a three-electrode configuration. A CP piece was used as the working electrode and platinum and electrodes were used as the counter and reference electrodes, respectively. The CV scanning was performed at . The Randles-Sevcik equation is given by , where is the faradaic peak current, is the number of electrons transferred during the redox reaction, is Faraday’s constant, is the ESA, is the concentration of the probe molecule, is the potential scan rate, is the diffusion coefficient, is the universal gas constant, and is the temperature. EIS measurements were conducted between 10 kHz and 50 mHz with an AC amplitude of 10 mV . Both CV and EIS were run using 0.01 M ferro/ferricyanide solution with 0.1 M KCl as the supporting electrolyte in aqueous media to reduce the ohmic overpotential in the cell.
Fabrication of the i-TE liquid cell
The i-TE liquid cell was assembled with a laminar structure of two graphite current collectors, two CP electrodes, a thermal separator attached to the cold-side electrode, a cylinder spacer composed of polyformaldehyde (commercial sources), the electrolyte volume at the
cell center, and two rubber O-rings (Supplementary Fig. 10). The spacer defines the electrode separation gap . To prepare the hydrophilic Au@CP electrode, the CP was first treated with oxygen plasma (SUNJUNE PLASMA VP-R5, China) for 10 minutes to induce strong hydrophilicity. Next, a 40 -nm-thick Au coating was deposited on the carbon fibers for 120 s at a current of 30 mA using an MC1000 ion sputter (Hitachi Ltd, Japan). A cotton-fiber laminating thermal separator was fabricated by compressing commercial cotton balls with approximate diameters of (Supplementary Fig. 16). To form the FA50 electrolyte (as an example; the other electrolytes were prepared similarly), and were dissolved in 7.5 mL deionized (DI) water. After adding 4.34 g of GdmCl , the solution was stirred for 10 min , yielding a light-yellow solution with precipitation. Finally, 7.5 mL FA was added and the solution was stirred for 5 min to obtain the optimized electrolyte.
Performance measurements of the i-TE liquid cell
The performance of the i-TE liquid cell was tested in an actual measurement setup. The temperature was controlled with a digital temperature control module (YEXIAN TCM-M207, China) and the voltage and temperature data were acquired using the LabVIEW program. The voltage was measured with a Keithley-2000 instrument and the current-voltage characterization of the device was performed with a Keithley 2400 instrument. There are approximately 100 points between 0 V to open-circuit voltage. The voltage sweep rate is 0.1 s per point. The voltage and current were measured by a Keithley-2400 and Keithley-6450, respectively, during the voltage build-up and power output stages of continuous power output. The thermal conductivity of the electrode was measured with hot-disk method, and the effective thermal conductivity of the electrolyte was measured with the steadystate method .
Module preparation
The module containing 25 integrated units consisted of a polyformaldehyde frame, graphite current collectors, CP electrodes, electrolytes, and titanium (Ti) wires. The frame size was (length width height) and contained 25 cells. Twenty-five pairs of graphite sheets were fixed on the frame by screws to prevent leakage while the CP electrodes were fixed between the graphite sheet and the frame. The cells were connected in series by Ti wires.
Massetti, M. et al. Unconventional thermoelectric materials for energy harvesting and sensing applications. Chem. Rev. 121, 12465-12547 (2021).
Liu, W., Qian, X., Han, C.-G., Li, Q. & Chen, G. Ionic thermoelectric materials for near ambient temperature energy harvesting. Appl. Phys. Lett. 118, 020501 (2021).
Eastman, E. D. Theory of the Soret effect. J. Am. Chem. Soc. 50, 283-291 (1928).
Tyrrell, H. J. V., Taylor, D. A. & Williams, C. M. The ‘Seebeck Effect’ in a Purely Ionic System. Nature 177, 668-669 (1956).
Zhao, W. et al. Tailoring intermolecular interactions towards highperformance thermoelectric ionogels at low humidity. Adv. Sci. 9, 2201075 (2022).
Horike, S. et al. Outstanding electrode-dependent seebeck coefficients in ionic hydrogels for thermally chargeable supercapacitor near room temperature. ACS Appl. Mater. Interfaces 12, 43674-43683 (2020).
Wang, H. et al. lonic thermoelectric figure of merit for charging of supercapacitors. Adv. Electron. Mater. 3, 1700013 (2017).
Zhao, Y. et al. Quasi-solid conductive gels with high thermoelectric properties and high mechanical stretchability consisting of a low cost and green deep eutectic solvent. J. Mater. Chem. A 10, 4222-4229 (2022).
Zito, R. Thermogalvanic energy conversion. AIAA J. 1, 2133-2138 (1963).
Quickenden, T. I. & Mua, Y. A review of power generation in aqueous thermogalvanic cells. J. Electrochem. Soc. 142, 3985 (1995).
Lazar, M. A., Al-Masri, D., MacFarlane, D. R. & Pringle, J. M. Enhanced thermal energy harvesting performance of a cobalt redox couple in ionic liquid-solvent mixtures. Phys. Chem. Chem. Phys. 18, 1404-1410 (2016).
Im, H. et al. High-efficiency electrochemical thermal energy harvester using carbon nanotube aerogel sheet electrodes. Nat. Commun. 7, 10600 (2016).
Buckingham, M. A., Marken, F. & Aldous, L. The thermoelectrochemistry of the aqueous iron(II)/iron(III) redox couple: significance of the anion and pH in thermogalvanic thermal-toelectrical energy conversion. Sustain. Energy Fuels 2, 2717-2726 (2018).
Taheri, A., MacFarlane, D. R., Pozo-Gonzalo, C. & Pringle, J. M. Quasi-solid-state electrolytes for low-grade thermal energy harvesting using a cobalt redox couple. ChemSusChem 11, 2788-2796 (2018).
Duan, J. et al. Aqueous thermogalvanic cells with a high Seebeck coefficient for low-grade heat harvest. Nat. Commun. 9, 5146 (2018).
Han, C.-G. et al. Giant thermopower of ionic gelatin near room temperature. Science 368, 1091-1098 (2020).
Li, Y. et al. 3D Hierarchical Electrodes Boosting Ultrahigh Power Output for Gelatin-KCl-FeCN Ionic Thermoelectric Cells. Adv. Energy Mater. 12, 2103666 (2022).
Li, Y. et al. Realizing record-high output power in flexible gelatin/ GTA-KCl-FeCN ionic thermoelectric cells enabled by extending
the working temperature range. Energy Environ. Sci. 10.1039. D2EE02792E https://doi.org/10.1039/D2EE02792E (2022).
Duan, J. et al. Liquid-state thermocells: Opportunities and challenges for low-grade heat harvesting. Joule 5, 768-779 (2021).
Dupont, M. F., MacFarlane, D. R. & Pringle, J. M. Thermoelectrochemical cells for waste heat harvesting – progress and perspectives. Chem. Commun. 53, 6288-6302 (2017).
Iwami, R., Yamada, T. & Kimizuka, N. Increased Seebeck Coefficient of Thermocell Based on the Selective Electrostatic Interactions with Cationic Micelles. Chem. Lett. 49, 1197-1200 (2020).
Yu, B. et al. Thermosensitive crystallization-boosted liquid thermocells for low-grade heat harvesting. Science 370, 342-346 (2020).
Zhou, H., Yamada, T. & Kimizuka, N. Supramolecular thermoelectrochemical cells: enhanced thermoelectric performance by host-guest complexation and salt-induced crystallization. J. Am. Chem. Soc. 138, 10502-10507 (2016).
Romano, M. S. et al. Carbon nanotube – reduced graphene oxide composites for thermal energy harvesting applications. Adv. Mater. 25, 6602-6606 (2013).
Li, G. et al. High-efficiency cryo-thermocells assembled with anisotropic holey graphene aerogel electrodes and a eutectic redox electrolyte. Adv. Mater. 31, 1901403 (2019).
Hu, R. et al. Harvesting waste thermal energy using a carbon-nanotube-based thermo-electrochemical cell. Nano Lett. 10, 838-846 (2010).
Liu, Y. et al. Advanced wearable thermocells for body heat harvesting. Adv. Energy Mater. 10, 2002539 (2020).
Zhang, L. et al. High power density electrochemical thermocells for inexpensively harvesting low-grade thermal energy. Adv. Mater. 29, 1605652 (2017).
Gao, W., Lei, Z., Zhang, C., Liu, X. & Chen, Y. Stretchable and freezetolerant organohydrogel thermocells with enhanced thermoelectric performance continually working at subzero temperatures. Adv. Funct. Mater. 31, 2104071 (2021).
Yu, B. et al. Cost-effective n-type thermocells enabled by thermosensitive crystallizations and 3D multi-structured electrodes. Nano Energy 93, 106795 (2022).
Gao, Y., Qin, Z., Guan, L., Wang, X. & Chen, G. Z. Organoaqueous calcium chloride electrolytes for capacitive charge storage in carbon nanotubes at sub-zero-temperatures. Chem. Commun. 51, 10819-10822 (2015).
Roberts, A. J., Danil de Namor, A. F. & Slade, R. C. T. Low temperature water based electrolytes for carbon supercapacitors. Phys. Chem. Chem. Phys. 15, 3518-3526 (2013).
Chang, N. et al. An aqueous hybrid electrolyte for low-temperature zinc-based energy storage devices. Energy Environ. Sci. 13, 3527-3535 (2020).
Nian, Q. et al. Aqueous Batteries Operated at . Angew. Chem. Int. Ed. 58, 16994-16999 (2019).
Smith, E. L., Abbott, A. P. & Ryder, K. S. Deep Eutectic Solvents (DESs) and Their Applications. Chem. Rev. 114, 11060-11082 (2014).
Qiu, M. et al. Tailoring water structure with high-tetrahedral-entropy for antifreezing electrolytes and energy storage at . Nat. Commun. 14, 601 (2023).
Matsumoto, M., Saito, S. & Ohmine, I. Molecular dynamics simulation of the ice nucleation and growth process leading to water freezing. Nature 416, 409-413 (2002).
Stangret, J., Kamieńska-Piotrowicz, E. & Laskowska, K. FT-IR studies of molecular interactions in formamide-methanol mixtures. Vib. Spectrosc. 44, 324-330 (2007).
Liu, C. et al. Ion regulation in double-network hydrogel module with ultrahigh thermopower for low-grade heat harvesting. Nano Energy 92, 106738 (2021).
Alzahrani, H. A. H., Buckingham, M. A., Marken, F. & Aldous, L. Success and failure in the incorporation of gold nanoparticles inside ferri/ferrocyanide thermogalvanic cells. Electrochem. Commun. 102, 41-45 (2019).
Park, S. M. & Yoo, J. S. Peer reviewed: electrochemical impedance spectroscopy for better electrochemical measurements. Anal. Chem. 75, 455 A-461 A (2003).
Gunawan, A. et al. The amplifying effect of natural convection on power generation of thermogalvanic cells. Int. J. Heat. Mass Transf. 78, 423-434 (2014).
Kang, T. J. et al. Electrical power from nanotube and graphene electrochemical thermal energy harvesters. Adv. Funct. Mater. 22, 477-489 (2012).
Zhou, H., Yamada, T. & Kimizuka, N. Thermo-electrochemical cells empowered by selective inclusion of redox-active ions by polysaccharides. Sustain. Energy Fuels 2, 472-478 (2018).
Qian, W., Cao, M., Xie, F. & Dong, C. Thermo-electrochemical cells based on carbon nanotube electrodes by electrophoretic deposition. Nano-Micro Lett. 8, 240-246 (2016).
Cheng, H., He, X., Fan, Z. & Ouyang, J. Flexible quasi-solid state ionogels with remarkable seebeck coefficient and high thermoelectric properties. Adv. Energy Mater. 9, 1901085 (2019).
Malik, Y. T. et al. Self-healable organic-inorganic hybrid thermoelectric materials with excellent ionic thermoelectric properties. Adv. Energy Mater. 12, 2103070 (2022).
He, X., Cheng, H., Yue, S. & Ouyang, J. Quasi-solid state nanoparticle/(ionic liquid) gels with significantly high ionic thermoelectric properties. J. Mater. Chem. A 8, 10813-10821 (2020).
Chi, C. et al. Selectively tuning ionic thermopower in all-solid-state flexible polymer composites for thermal sensing. Nat. Commun. 13, 221 (2022).
Zhao, D. et al. Ionic thermoelectric supercapacitors. Energy Environ. Sci. 9, 1450-1457 (2016).
Jeong, M. et al. Embedding aligned graphene oxides in polyelectrolytes to facilitate thermo-diffusion of protons for high ionic thermoelectric figure-of-merit. Adv. Funct. Mater. 31, 2011016 (2021).
Yang, P. et al. Wearable thermocells based on gel electrolytes for the utilization of body heat. Angew. Chem. Int. Ed. 55, 12050-12053 (2016).
Duan, J. et al. P-N conversion in thermogalvanic cells induced by thermo-sensitive nanogels for body heat harvesting. Nano Energy 57, 473-479 (2019).
Acknowledgements
This work was supported by the Shenzhen Innovation Program for Distinguished Young Scholars (Grant Nos. RCJC2O21O706091949018), the Guangdong Innovative and Entrepreneurial Research Team Program (Grant Nos. 2016ZTO6G587), and a Shenzhen Science Technology Fund (Grant Nos. KYDPT20181011104007). The authors acknowledge support
from the Centers for Mechanical Engineering Research and Education at MIT and SUSTech. W.S.L acknowledges support from the Tencent Foundation through the XPLORER Prize.
Author contributions
Shuaihua Wang and Yuchen Li conceived this project. Shuaihua Wang prepared the samples, and fabricated the cells. Shuaihua Wang and Mao Yu conducted experiment. Shuaihua Wang, Yuchen Li, Mao Yu and Qikai Li analyzed the data. Shuaihua Wang and Yupeng Wang performed COMSOL simulation. Shuaihua Wang prepared the manuscript. Huan Li, Jiajia Zhang, Yuchen Li and Weishu Liu revised the manuscript. Weishu Liu funding acquisition. Weishu Liu, supervision. All authors participated in the analysis and discussion.
Competing interests
The authors declare no competing interests.
Additional information
Supplementary information The online version contains
supplementary material available at https://doi.org/10.1038/s41467-024-45432-7.
Correspondence and requests for materials should be addressed to Weishu Liu.
Peer review information Nature Communications thanks Xiaogang Zhang and the other anonymous reviewer for their contribution to the peer review of this work. A peer review file is available.
Department of Materials Science and Engineering, Southern University of Science and Technology, Shenzhen, Guangdong 518055, China. These authors contributed equally: Shuaihua Wang, Yuchen Li. e-mail: liuws@sustech.edu.cn