دراسة ارتباط جينومي واسعة النطاق متعددة الأنساب للاكتئاب الشديد تساعد في اكتشاف المواقع، التحديد الدقيق، ترتيب الأولويات الجينية والاستدلال السببي Multi-ancestry genome-wide association study of major depression aids locus discovery, fine mapping, gene prioritization and causal inference

المجلة: Nature Genetics، المجلد: 56، العدد: 2
DOI: https://doi.org/10.1038/s41588-023-01596-4
PMID: https://pubmed.ncbi.nlm.nih.gov/38177345
تاريخ النشر: 2024-01-04

دراسة ارتباط جينومي واسعة النطاق متعددة الأنساب للاكتئاب الشديد تساعد في اكتشاف المواقع، التحديد الدقيق، ترتيب الأولويات الجينية والاستدلال السببي

تم الاستلام: 21 يوليو 2022
تم القبول: 26 أكتوبر 2023
نُشر على الإنترنت: 4 يناير 2024
(أ) التحقق من التحديثات

تظهر قائمة المؤلفين وانتماءاتهم في نهاية الورقة

الملخص

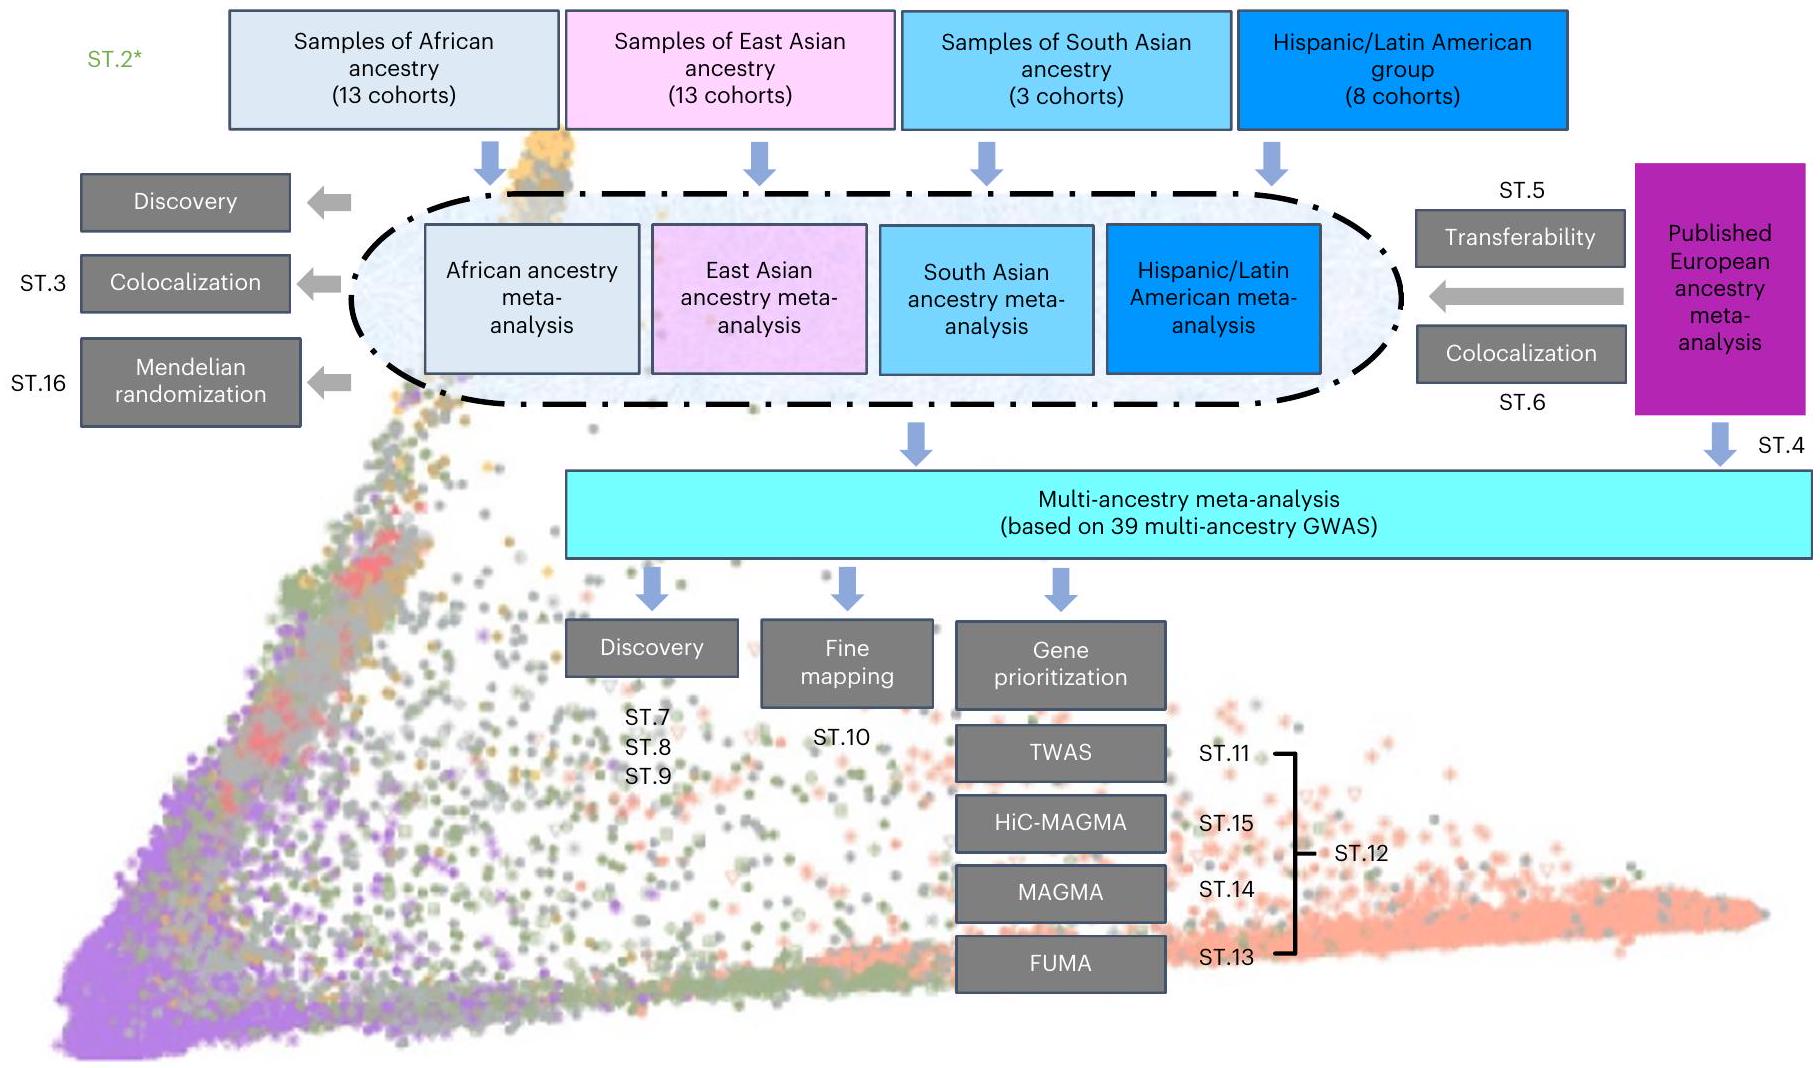
أُجريت معظم دراسات الارتباط الجينومي الواسع النطاق (GWAS) للاكتئاب الرئيسي (MD) على عينات من أصول أوروبية. هنا نبلغ عن دراسة GWAS متعددة الأنساب للاكتئاب الرئيسي، مضيفين بيانات من 21 مجموعة تضم 88,316 حالة اكتئاب رئيسي و902,757 ضابطًا إلى البيانات التي تم الإبلاغ عنها سابقًا. استخدم هذا التحليل مجموعة من المقاييس لتعريف الاكتئاب الرئيسي وشمل عينات من أصول أفريقية (36% من حجم العينة الفعّال)، وشرق آسيوية (26%)، وجنوب آسيوية (6%)، ومشاركين من أصول إسبانية/لاتينية أمريكية (32%). حددت دراسة GWAS متعددة الأنساب 53 موقعًا جينيًا جديدًا مرتبطًا بشكل كبير. بالنسبة للمواقع الجينية من دراسات GWAS على عينات من أصول أوروبية، كان عدد المواقع التي يمكن نقلها إلى مجموعات أنساب أخرى أقل من المتوقع. استفاد التحديد الدقيق من تنوع العينة الإضافي. حددت دراسة الارتباط عبر النسخ الجيني 205 جينات جديدة مرتبطة بشكل كبير. تشير هذه النتائج إلى أنه بالنسبة للاكتئاب الرئيسي، قد يكون زيادة التنوع العرقي والعالمي في الدراسات الجينية أمرًا مهمًا بشكل خاص لضمان اكتشاف الجينات الأساسية ولتوفير معلومات حول إمكانية نقل النتائج.

الاكتئاب الشديد (MD) هو أحد أكثر التحديات الصحية العالمية إلحاحًا. بينما أظهرت دراسات الارتباط على مستوى الجينوم (GWAS) وعدًا في الكشف عن الآليات البيولوجية الكامنة وراء تطور ، لقد كشفت عن بنية جينية متعددة الجينات بشكل كبير، تتميز بمتغيرات تمنح زيادة صغيرة في المخاطر بشكل فردي ، ربما بسبب تباين أعراض وأسباب مرض العضال . استكشفت الأبحاث الوراثية السابقة تأثير تعريفات النتائج المختلفة ، الجنس والتعرض للصدمات حول التغايرية. ومع ذلك، لم يتم بعد تقييم دور النسب والعرق في علم الوراثة لمرض MD بشكل منهجي.
حتى الآن، أجريت دراسات الارتباط الجيني الواسعة النطاق للاكتئاب الرئيسي في الغالب على أفراد من أصول أوروبية. جمع أكبر دراسة ارتباط جيني واسع النطاق لمرض الزهايمر بيانات من عدة دراسات وحددت 223 متغيرًا نوكليوتيديًا أحاديًا مستقلاً ذا دلالة إحصائية شملت تلك الدراسة أيضًا بيانات من 59,600 أمريكي أفريقي من مجموعة برنامج المليون محارب قديم (MVP). في التحليل التلوي ثنائي الأنساب الخاص بهم، ارتفع عدد المتغيرات الجينية المفردة (SNPs) ذات الدلالة الإحصائية إلى 233. أُجريت دراسات أخرى للجينوم المرتبطة بالاكتئاب الكبير (MD GWASs) على مشاركين أمريكيين أفارقة ولاتينيين/هسبان مع أحجام عينات محدودة، ولم تجد متغيرات ذات ارتباطات ذات دلالة إحصائية مع… .
مع مشاركة 10,640 امرأة صينية، تُعد دراسة CONVERGE أكبر دراسة جينومية واسعة النطاق لاضطراب الاكتئاب الكبير تُجرى حتى الآن خارج البلدان ‘الغربية’. حددت الدراسة ارتباطين ذوي دلالة جينومية واسعة مرتبطين ببيولوجيا الميتوكوندريا وأبلغت عن ارتباط جيني بمقدار 0.33 مع اضطراب الاكتئاب في عينات من أصول أوروبية. تماشيًا مع ذلك، أظهر عملنا الأخير أن بعض المواقع التي تم تحديدها سابقًا من دراسات الارتباط الجيني الشامل (GWAS) التي أُجريت على عينات من أصول أوروبية لا يمكن نقلها إلى عينات من أصول شرق آسيوية. .
قد تؤثر التغايرية في التأثيرات الجينية على النتائج عند تقييم التأثيرات السببية لعوامل الخطر للاكتئاب الشديد. أبلغت دراسات سابقة في عينات من الأصول الأوروبية عن ارتباطات جينية وعلاقات سببية بين الاكتئاب الشديد والنتائج القلبية الأيضية. من الجدير بالذكر أن دراستنا السابقة أشارت إلى اتجاه متناقض للعلاقات بين نمط الحياة المتوسطي ومؤشر كتلة الجسم لدى الأفراد من شرق آسيا والأفراد من أصول أوروبية (تأثير سببي إيجابي لمؤشر كتلة الجسم). لذا، فإن التحقيق في العلاقات السببية باستخدام التوزيع العشوائي المندلي (MR) في مجموعات ذات أصول متنوعة وفي أنواع فرعية مختلفة من الأمراض أمر مهم لضمان القابلية للتعميم وللتفريق بين الآليات البيولوجية والاجتماعية التي تكمن وراء العلاقة بين عامل الخطر والمرض.
الشكل 1| مخطط تخطيطي للتحليلات في هذه الدراسة. شملنا بيانات من 21 مجموعة ذات أصول متنوعة. قمنا بتصنيف الأفراد إلى مجموعات عرقية/إثنية وأجرينا تحليلات الارتباط مع الاكتئاب لكل مجموعة. بعد ذلك، أجرينا تحليل تلوي للنتائج حسب المجموعة العرقية/الإثنية. اختبرنا ما إذا كانت المواقع الجينية المرتبطة بالاكتئاب التي تم الإبلاغ عنها سابقًا في دراسات على أصول أوروبية قابلة للنقل إلى هذه المجموعات. كما استخدمنا النتائج لاكتشاف ارتباطات جديدة بالاكتئاب وللتحليل التعددي لتقييم التأثيرات السببية للصفات القلبية الأيضية من خلال…
الأصل العرقي. بعد ذلك دمجنا جميع النتائج الخاصة بالأصل العرقي/الإثني في تحليل تلوي متعدد الأصول شمل أيضًا عينات ذات أصل أوروبي. شكلت نتائج التحليل التلوي متعدد الأصول الأساس لاكتشاف المواقع، والتخطيط الدقيق لتحديد المتغيرات المسببة، والعديد من طرق تحديد أولويات الجينات لتحديد الجينات المرتبطة بخطر الاكتئاب الرئيسي. ST. ( ) تشير إلى الجدول التكميلي المقابل. ST.2* (باللون الأخضر) تشير إلى الجدول التكميلي 2، الذي يعرض تقديرات التضخم الجينومي لعدة تحليلات.
زيادة التنوع في البحوث الجينية أمر مهم أيضًا لضمان فوائد صحية عادلة في الولايات المتحدة، يمكن أن تؤثر الاختلافات في عرض مرض الزهايمر عبر المجموعات العرقية على احتمالية التشخيص. الوراثة المحسّنة للمشاركين من أصول أوروبية ستفيد بشكل أساسي تلك المجموعة من المرضى، وبالتالي قد تزيد من الفجوات في التشخيص والعلاج بين المجموعات.
في هذه المقالة، استخدمنا بيانات من عينات ذات أصول متنوعة وأجرينا تحليلات تلويّة للجينوم على مستوى واسع، تلتها تحديد دقيق للأماكن الجينية وأولوية الجينات المستهدفة (الشكل 1). قمنا بتقييم قابلية انتقال المواقع الجينية عبر مجموعات الأنساب. وأخيرًا، استكشفنا الروابط السببية ذات الاتجاهين بين الاكتئاب الرئيسي والصفات القلبية الأيضية.

النتائج

دراسات الارتباط الجيني الواسعة النطاق (GWAS) في عينات من أصول أفريقية وشرق آسيوية وجنوب آسيوية وأمريكية لاتينية/هسبانية

أجرينا أولاً تحليلات تلويّة لدراسات الارتباط الجيني على مستوى الجينوم (GWAS) مصنفة حسب الأصل/المجموعة العرقية. تم تعيين الأفراد إلى مجموعات الأنساب (الأفريقية، جنوب آسيوية، شرق آسيوية أو أوروبية) باستخدام تحليلات المكونات الرئيسية بناءً على مصفوفات القرابة الجينية. تم التعيين إلى مجموعة الهسبانية/الأمريكية اللاتينية بناءً على التقرير الذاتي أو على التوظيف في دولة أمريكية لاتينية (الأشكال التكميلية 1-7). نحن نعترف بالطبيعة التعسفية لهذا النهج ولإختيار مجموعات المرجعية
وتحديد النقاط الفاصلة لتعيين المشاركين. ومع ذلك، فإن إنشاء مثل هذه المجموعات مكننا من البحث عن الارتباطات الخاصة بالمجموعات وتقييم قابلية نقل المواقع المحددة سابقًا. استخدمت الدراسات المدرجة في التحليلات التلوية المقاييس التالية لتعريف الاكتئاب الرئيسي: المقابلات السريرية المنظمة، سجلات الرعاية الصحية الطبية، استبيانات الأعراض، والاستطلاعات التي يملأها المشاركون بأنفسهم (الجدول التكميلي 1 والملاحظة التكميلية).
شملت التحليلات 36,818 حالة من مرض MD و161,679 من الضوابط من أصل أفريقي، و21,980 حالة و360,956 من الضوابط من أصل شرق آسيوي، و4,505 حالات و27,176 من الضوابط من أصل جنوب آسيوي، و25,013 حالة و352,946 من الضوابط في مجموعة الأمريكيين اللاتينيين/الهسبانيين (الشكل الموسع 1 والرسوم التوضيحية التكميلية 8-11). ولأخذ التضخم الطفيف الموجود في عينات الأمريكيين اللاتينيين/الهسبانيين في الاعتبار ( ومعامل التقاطع لتحليل ارتباط عدم التوازن (LDSC) 1.051؛ الجدول التكميلي 2)، قمنا بتصحيح إحصائيات الاختبار لهذا التحليل بناءً على معامل التقاطع لـ LDSC.
في المجموعة الهسبانية/الأمريكية اللاتينية، ارتبطت الأليل G لموقع rs78349146 عند 2q24.2 بزيادة خطر الإصابة بالاكتئاب الكبير (تردد الأليل المؤثر (EAF) (معامل الانحدار) ، الخطأ المعياري للمتوسط ) (الشكل التوضيحي التكميلي 12). لاختبار دور هذه المواقع في الملفات الجزيئية، أجرينا التموقع المشترك للاكتئاب ومواقع التعبير الكمي للجينات في الدماغ متعددة الأنساب (eQTLs) . المواقع التي لها احتمال خلفي (PP) >90% لكل من السمتين المرتبطتين ومشاركة الاثنين
الشكل 2 | قابلية انتقال المواقع الجينية التي تم الإبلاغ عنها سابقًا من دراسات GWAS لاكتشاف اضطراب الاكتئاب (MD) ذات الأصول الأوروبية إلى مجموعات الأنساب الأخرى. أ، مخطط فين يوضح أعداد المواقع الجينية التي تم تحديدها سابقًا في دراسات الأنساب الأوروبية والتي لديها أدلة على قابلية الانتقال إلى مجموعات الأنساب/العرقيات الأخرى: الأفريقية، والهسبانية/الأمريكية اللاتينية، وجنوب آسيا، وشرق آسيا (باللون الأسود) وتقاطعاتها (باللون السماوي). يُعرض هنا فقط 112 موقعًا جينيًا لديها أدلة على قابلية الانتقال إلى مجموعة أنساب واحدة على الأقل. ب، رسم بياني يوضح نسب قابلية الانتقال المعدلة حسب القوة (PAT). قمنا أولاً بحساب عدد المواقع الجينية القابلة للانتقال التي لوحظت من بين 195، 196، 179 و180 موقعًا جينيًا كانت موجودة في…
الأصول الأفريقية، والأصل الإسباني/الأمريكي اللاتيني، والأصل الجنوب آسيوي، والأصل شرق آسيوي، على التوالي. تم تقسيم هذه حسب العدد المتوقع للمواقع القابلة للنقل (الأرقام المعروضة أسفل الشكل)، مع أخذ تقديرات التأثير من دراسات سابقة على الأصول الأوروبية، ومعلومات تردد الأليل وحجم العينة من مجموعات الأصول الأفريقية، والإسبانية/الأمريكية اللاتينية، والجنوب آسيوية، وشرق آسيوية لدينا. تُعرض النسب بشكل منفصل للاضطراب الاكتئابي الواسع التعريف والاضطراب الاكتئابي المحدد سريريًا. تشير أشرطة الخطأ إلى فواصل الثقة لنسب PAT. لم نتمكن من حساب النتائج للطبيب السريري في مجموعة الأمريكيين اللاتينيين/الهسبان بسبب عدم كفاية عدد الحالات.
تم اعتبار المتغيرات المختلفة ولكن المرتبطة (الفرضية (H)3) أو متغير سببي واحد (H4) كمتزامنة في الموقع. لاحظنا تزامنًا مهمًا في الموقع لـ DPP4 وRBMS1 وTANK. اختبرنا eQTLs الخاصة بالأصل من الدم ولاحظنا RBMS1 (H3: احتمال التوافق (الهسباني/الأمريكي اللاتيني) 99.12%) وTANK (H3: احتمال التوافق (الأوروبي) 97.85%; H3: احتمال التوافق (الهسباني/الأمريكي اللاتيني) ) في الموقع 2 q 24.2. بالنسبة لمواقع الصفات الكمية للبروتين (pQTLs) من الدم، إما أننا لم نعثر على الجينات في المجموعة أو كان عدد المتغيرات النوكليوتيدية المفردة داخل الجين منخفضًا جدًا (<20) لاختبار التموقع المشترك (الجدول التكميلي 3).
لم ترتبط أي متغيرات بأهمية جينومية واسعة في دراسة الارتباط الجينومي الشامل (GWAS) في عينات من أصول أفريقية وشرقية وجنوب آسيوية (الشكل الموسع 1أ، ب، د). تم ربط موقع واحد بشكل مقترح في دراسة GWAS للأصول الأفريقية (الشكل الموسع 1أ والشكل التكميلي 12). المتغير الرئيسي، rs6902879 (أليل التأثير: A، تردد الأليل الفعّال 0.16، ، الخطأ المعياري للمتوسط 0.01، ) عند 6q16 يقع في الجزء العلوي من جين مستقبل هرمون تركيز الميلانين 2 (MCHR2) ويرتبط بزيادة تعبير MCHR2 في القشرة بناءً على تعبير النسيج الجيني (GTEx v8) ( ). اختبار تعدد الأنساب لعوامل تنظيم التعبير الجيني في الدماغ ، لاحظنا تراكبًا كبيرًا لـ GRIK2 و ASCC3، مع اختلافات كبيرة في الأنساب لـ ASCC3 (H3:PP(أوروبي) 99.97%). لم يكن MCHR2 موجودًا في بيانات الـ RNA.
على الرغم من أن المتغيرات الرائدة في 2q24.2 و6q16 لم تظهر دليلاً قويًا على الارتباط في دراسة GWAS منشورة كبيرة شملت مشاركين من أصل أوروبي ( )، في كل حالة كان هناك متغير غير مرتبط ضمن 500 كيلوباز من المتغيرات الرئيسية المرتبطة بـ (الشكل التوضيحي التكميلي 12). لذلك، على الرغم من أن الأدلة لا تدعم وجود متغير سببي مشترك، لا يمكننا استبعاد وجود ارتباط في نفس الموقع الجيني، ولكن ربما مع متغير سببي مختلف لدى المشاركين من أصول أوروبية.
كتحليل للحساسية، أجرينا تحليلًا تلويًا لكل مجموعة عرقية/إثنية للاكتئاب السريري، شمل دراسات تم فيها تحديد الاضطراب الاكتئابي الرئيسي من خلال مقابلات سريرية منظمة أو سجلات الرعاية الصحية الطبية وفقًا لتصنيف الأمراض الدولي (ICD9)/10 أو الدليل التشخيصي والإحصائي للاضطرابات النفسية (DSM)-IV/5 لمعايير الاضطراب الاكتئابي الرئيسي (الجدول التكميلي 1). كان هناك 29,389 حالة و49,999 ضابطًا من
الأصل الأفريقي، 7,886 حالة و14,412 ضابطة من أصل شرق آسيوي، 848 حالة و13,908 ضابطة في المجموعة الهسبانية/اللاتينية الأمريكية، و4,252 حالة و26,738 ضابطة من أصل جنوب آسيوي (الشكل الموسع 2 والرسوم التوضيحية التكميلية 13-16). في دراسة GWAS للأصل الجنوب آسيوي، كان الأليل A من rs7749931 عند 6q15 مرتبطًا بانخفاض خطر الإصابة بالاكتئاب الرئيسي (الأليل المؤثر: A، تردد الأليل المؤثر 0.49، ، الخطأ المعياري للمتوسط 0.03، ) (الشكل البياني الموسع 2د والشكل التوضيحي التكميلي 15). يقع المتغير أسفل جين STX7 (سينتاكسين 7). لم نلاحظ وجود مواقع ذات دلالة جينومية واسعة مرتبطة بالاكتئاب السريري في أي مجموعة عرقية أخرى.

قابلية نقل ارتباطات MD عبر مجموعات الأنساب

الدراسات السابقة للجينوم الواسع النطاق في عينات من الأصول الأوروبية قد حددت 206 مواقع مرتبطة بالاكتئاب الرئيسي (الجدول التكميلي 4) كانت نتائج 196 من هذه المواقع متاحة في مجموعة واحدة على الأقل من مجموعات الأنساب/الأعراق. قمنا بتقييم ما إذا كانت هذه الارتباطات الجينية مشتركة عبر مجموعات الأنساب المختلفة. قد تكون المواقع الفردية غير كافية لإثبات وجود ارتباط؛ لذلك، اتبعنا نهجًا طورناه مؤخرًا وقمنا أولاً بتقدير عدد المواقع التي نتوقع رؤية ارتباط فيها عند الأخذ في الاعتبار حجم العينة ( )، عدم التوازن الارتباطي (LD) وتكرار الأليل الثانوي (MAF). تفاوت هذا التقدير بشكل كبير بين مجموعات الأنساب، على سبيل المثال، توقعنا اكتشاف ارتباطات ذات دلالة إحصائية لـ 65% من مواقع MD في دراسات GWAS مع عينات من الأنساب الأفريقية، ولكن فقط لـ 15% من مواقع MD في عينات من الأنساب جنوب آسيوية (الشكل 2). نبلغ عن نسبة قابلية النقل المعدلة بالقوة (PAT)، وهي العدد المرصود مقسومًا على العدد المتوقع من المواقع. كانت قابلية النقل منخفضة، مع نسب PAT تبلغ 0.27 (فاصل الثقة 95% (CI) من 0.19 إلى 0.35) في عينات الأنساب الأفريقية، و0.29 في كل من الأنساب شرق آسيوية ( CI 0.20 إلى 0.39) وجنوب آسيا ( عينات الأنساب بنسبة CI 0.12 إلى 0.46). في مجموعة الهسبانيين/الأمريكيين اللاتينيين، كانت نسبة PAT 0.63 ( CI 0.55 إلى 0.72)، أعلى بشكل ملحوظ من المجموعات الأخرى. كانت تقديرات PAT للاضطراب الاكتئابي السريري قريبة من تلك الخاصة بالاضطراب الاكتئابي الواسع، مع تداخل فواصل الثقة في كل حالة (الشكل 2). لم نتمكن من تقدير نسب PAT للاضطراب الاكتئابي السريري في مجموعة الهسبانيين/الأمريكيين اللاتينيين بسبب عدم كفاية عدد الحالات بناءً على هذا التعريف. كما قمنا بتقييم قابلية نقل 102 موقعًا جينيًا تم تحديدها في علم الجينوم النفسي
الشكل 3 | الارتباطات الجينية للاكتئاب الرئيسي بين مجموعات الأنساب المختلفة. رسم بياني يوضح الارتباطات الجينية على مستوى الجينوم بين المجموعات الأفريقية، الأوروبية، شرق آسيوية، ومجموعات الهسبانيك/الأمريكيين اللاتينيين. تعكس شدة التلوين قوة الارتباط. كما تُعرض المعاملات المقدرة وأخطاء المعيار في كل خلية. نقدم فقط التقديرات التي كان فيها الخطأ المعياري المتوسط أقل من 0.3؛ وإلا، يتم تلوين الحقل بالرمادي.
دراسة الارتباط الجيني الشامل لمجموعة عمل اضطراب الاكتئاب الكبير في الاتحاد (PGC-MDD) وفي دراسة مستقلة على عينات من الأصول الأوروبية، دراسة الوراثة الأسترالية للاكتئاب (AGDS) كانت نسبة PAT 1.48، وهي أعلى بكثير من تقديرات PAT عبر الأنساب المختلفة. نبلغ عن أدلة على قابلية نقل المواقع الفردية (الجدول التكميلي 5) وكذلك تزامن مواقع eQTL و pQTL الخاصة بالأنساب (الجدول التكميلي 6 والشكل التكميلي 17).
بالإضافة إلى ذلك، قمنا بتقدير الترابطات الجينية عبر الأنساب باستخدام برنامج POPCORN الإصدار 1.0 (المرجع 29). نحن نقدم فقط تقديرات الترابط الجيني حيث كان الخطأ المعياري أقل من 0.3. كان حجم العينة لمجموعة الأنساب جنوب آسيا صغيرًا جدًا لإجراء هذا التحليل. كانت الترابطات الجينية للاكتئاب الرئيسي بين المجموعات الأوروبية ومجموعات الأنساب الهسبانية/اللاتينية الأمريكية، والأفريقية، والآسيوية الشرقية كما يلي لوحظ أدنى تقدير بين الأصول شرق آسيوية، ومجموعة الهسبانيك/الأمريكيين اللاتينيين ( ) (الشكل 3).

التحليل التلوي متعدد الأنساب

أجرينا تحليل تلوي متعدد الأنساب باستخدام بيانات من دراسات أجريت على مشاركين من أصول أفريقية وشرق آسيوية وجنوب آسيوية وعينات من أصل إسباني/لاتيني أمريكي (ملاحظة تكميلية)، ودمجناها مع بيانات منشورة سابقًا لـ 258,364 حالة و571,252 ضابط من أصول أوروبية. ، مما أسفر عن حجم عينة إجمالي يبلغ 345,389 حالة و الضوابط. قدمت هذه التحليلات نتائج لـ الاختلافات النوكليوتيدية المفردة بعد مراقبة الجودة. لم يكن هناك دليل على وجود تمايز سكاني متبقي ( “، تقاطع LDSC 1.019؛ الجدول التكميلي 2). حددنا 190 متغيرًا جينيًا مستقلاً ذا دلالة جينومية واسعة النطاق، موزعة على 169 موقعًا جينيًا تفصل بينها مسافة لا تقل عن 500 كيلوباز (الشكل الموسع 3، الجدول التكميلي 7 والشكل التكميلي 18). تمثل 53 من هذه المتغيرات ارتباطات جديدة ( ويقع على بعد أكثر من من المتغيرات التي تم الإبلاغ عنها سابقًا). تم ربط معظم المواقع الـ 196 التي تم الإبلاغ عنها سابقًا بأهمية على مستوى الجينوم في التحليل التلوي متعدد الأنساب، والذي يدمج بيانات الاكتشاف لهذه المواقع (الجدول التكميلي 4).
كتحليل حساسية، أجرينا أيضًا تحليل تلوي متعدد الأنساب للاكتئاب السريري. كان هناك 57,714 حالة و110,358 ضابط من أصل أوروبي تحت التعريف السريري للاكتئاب الرئيسي، والتي تم دمجها لاحقًا مع الدراسات السريرية غير الأوروبية المذكورة أعلاه من خلال التحليل التلوي (100,089
(حالات و214,415 ضوابط في المجموع) (الشكل البياني الموسع 4 والأشكال التكميلية 19 و20). حدد هذا التحليل سبعة مواقع ذات دلالة جينومية واسعة النطاق، اثنان منها جديدان (rs2085224 عند 3p22.3 وrs78676209 عند 5p12) (الجدول التكميلي 8).
ثم استبعدنا الفئات التي كان لديها نسبة حالات إلى ضوابط متطرفة ( ) ولم يتم تعديل ذلك تحليليًا، وكذلك المجموعات التي تضم مشاركين مراهقين. كما أسفرت هذه التحليل الحساس عن نتائج متسقة بالنسبة لـ 190 متغيرًا وراثيًا رئيسيًا (الشكل التوضيحي التكميلي 21).
أخيرًا، أعدنا تحليل البيانات باستخدام نهج التحليل التلوي متعدد الأنساب المطبق في MR-MEGA، مما أسفر عن 44 منطقة مستقلة مرتبطة بالاكتئاب الرئيسي بعد تصحيح معامل لامبدا GC، وبعضها كان قد تم تفويته في التحليلات الرئيسية بسبب التغاير بين الأنساب (الجدول التكميلي 9).

التحديد الدقيق متعدد الأنساب

استخدمنا طريقة تحديد المواقع الدقيقة البايزية متعددة الأنساب لاشتقاق مجموعات موثوقة بنسبة 99% لـ 155 موقعًا جينيًا تم ربطها بأهمية على مستوى الجينوم ولم تظهر أدلة على وجود إشارات مستقلة متعددة. للمقارنة، قمنا أيضًا بتنفيذ تحديد المواقع الدقيقة لأصل واحد لنفس المواقع بناءً على دراسات الارتباط الجيني واسعة النطاق التي أُجريت على مشاركين من أصل أوروبي، بما في ذلك PGC-MDD و AGDS. .
زاد التحديد الدقيق متعدد الأنساب من دقة التحديد الدقيق بشكل كبير مقارنة بالتحديد الدقيق القائم فقط على بيانات المشاركين من أصول أوروبية. وكان الحجم الوسيط لـ تم تقليل مجموعات الموثوقية من 65.5 إلى 30 متغيرًا. من بين 145 موقعًا جينوميًا أجرينا عليها التحديد الدقيق في مجموعتي العينات، كان لدى 113 موقعًا (77.9%) مجموعة موثوقية بنسبة 99% أصغر من التحديد الدقيق متعدد الأنساب، في حين تم حل أربعة مواقع (0 من التحديد الدقيق الأوروبي) إلى متغيرات مفردة يُعتقد أنها سببية (الشكل 4 والجدول التكميلي 10). على سبيل المثال، rs12699323، المصنف كمتغير داخل الجين، مرتبط بتعبير TMEM106B (البروتين العابر للغشاء 106B). rs1806152 هو متغير في منطقة التوصيل مرتبط بتعبير الجين القريب PAUPAR (RNA المضاد لـ PAX6) على الكروموسوم 11. في موقع آخر، تم ربط rs9564313 بتعبير PCDH9 (بروتوكادهرين-9)، وهو جين تم تسليط الضوء عليه أيضًا في نتائج تحليل TWAS وتحليل العلامات المتعددة للتعليقات الجينومية (MAGMA). .

تحديد أولوية جينات TWAS

لفهم أفضل للآليات البيولوجية لنتائج دراستنا للجينوم الواسع (GWAS)، أجرينا عدة تحليلات حاسوبية لتوصيف الوظائف وترتيب الأولويات للجينات الأكثر احتمالاً أن تكون سببية. أجرينا دراسة ارتباط عبر النسخ (TWAS) استنادًا إلى نتائج التحليل التلوي متعدد الأنساب للتعبير في الأنسجة ذات الصلة بـ قمنا بدمج نتائج TWAS مع التعيين الوظيفي والتعليق التوضيحي (FUMA)، وMAGMA التقليدي وHiC-MAGMA لتحديد أولويات الجينات المستهدفة.
حددت TWAS 354 ارتباطًا هامًا ( ) مع MD، منها 205 لم يتم الإبلاغ عنها سابقًا (الشكل 5 والجدول التكميلي 11). كان الارتباطان الجينيان الأكثر أهمية مع MD هما RPL31P12 (مخ المخيخ في GTEx، ، ) و NEGR1 (نخاع الدماغ في قاعدة العقد القاعدية، GTEx ، )، متسق مع النتائج السابقة .
PCDH8P1 (GTEx قشرة المخ الحزامية الأمامية BA24، Z=-8.3679، “) كان أهم نتيجة جديدة في تحليل TWAS. كان NDUFAF3 جينًا جديدًا مرتبطًا بمرض الاكتئاب (MD) (نواة المخ في منطقة النواة المتكئة في العقد القاعدية، GTEx). ، أفضل معرف GWAS rs7617480، أفضل GWAS ). تم تأكيد هذه النتائج أيضًا بواسطة HiC-MAGMA. البروتين الذي يشفره NDUFAF3 يستهدفه الميتفورمين، الدواء الأول لعلاج داء السكري من النوع الثاني.
أظهرت ثلاثة وأربعون جينًا دليلاً على الارتباط عبر جميع طرق تحديد أولوية الجينات الأربع (TWAS، FUMA، MAGMA و HiC-MAGMA) وتم تصنيفها كجينات ذات ثقة عالية (الجدول 1 والجداول التكميلية 11-15). شملت هذه الجينات التي تم تسليط الضوء عليها مرارًا في الدراسات السابقة بسبب أدلتها القوية على الارتباط وأهميتها البيولوجية في اضطراب الاكتئاب الرئيسي: NEGR1، DRD2، CELF4، LRFN5، TMEM161B.
الشكل 4 | دقة تحديد الموقع الدقيق بناءً على دراسات الارتباط الجينومي متعددة الأنساب ودراسات الارتباط الجينومي للأصل الأوروبي، موضحًا حجم مجموعات الثقة لـ 155 موقعًا هامًا. أ، مخطط صندوقي يُظهر الوسيط (الخط المركزي) والمدى الربيعي (المفصل العلوي والسفلي) لأحجام مجموعة الثقة للتحديد الدقيق
المواقع. تمتد الشوارب إلى 1.5 ضعف المدى الربيعي البيني. تُشير النقاط البيانية التي تقع خارج هذا النطاق إلى نقاط فردية في الشكل. ب، مخططات الأعمدة المكدسة التي تُظهر عدد المواقع ضمن فئات الحجم لمجموعات المصداقية.
الشكل 5 | على طراز مانهاتن -مخطط النقاط لارتباطات الجينات مع الاكتئاب الشديد في تحليل TWAS بناءً على إحصائيات ملخص GWAS للاكتئاب الشديد المحدد بشكل واسع. تُظهر الارتباطات الجينية المهمة كنقاط حمراء (354 جينًا مهمًا، 205 منها جديدة)، ويتم تمييز أسماء أكثر 50 جينًا أهمية على جانبي المخطط. تُعرض الارتباطات الجديدة باللون الأسود، بينما الجينات المرتبطة سابقًا
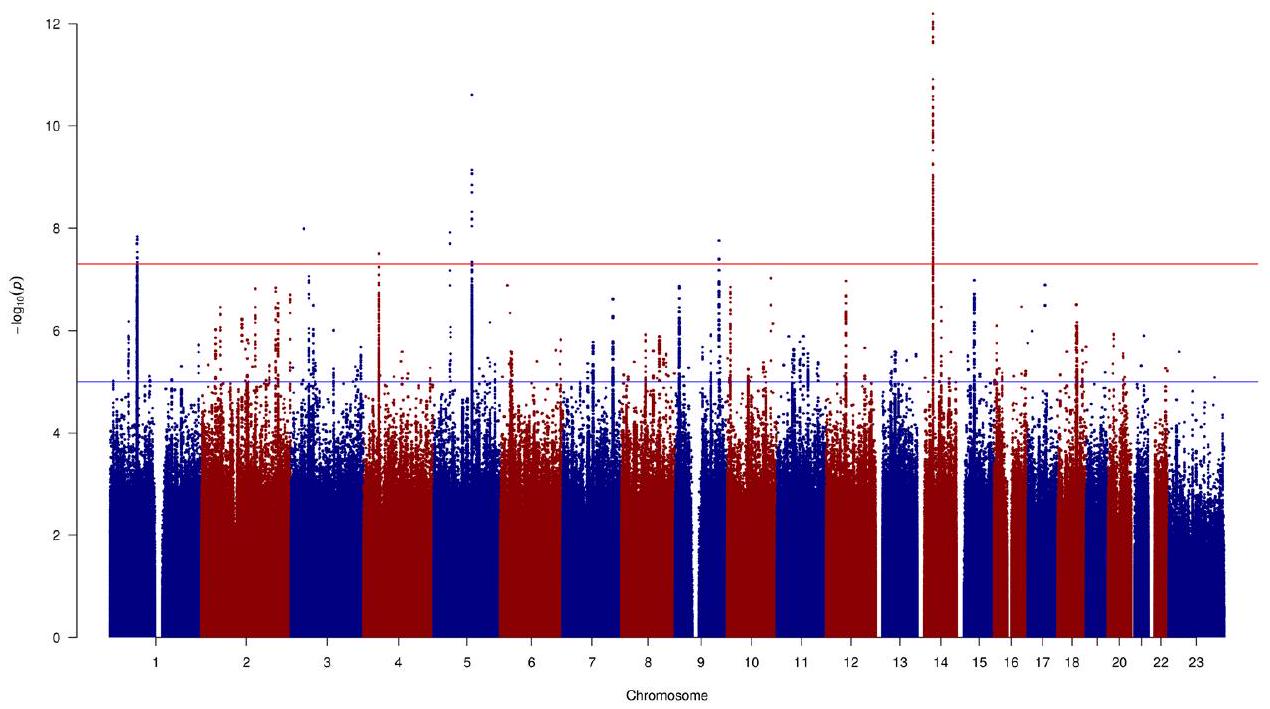
مع MD موضحة باللون الرمادي. تشير الخطوط الحمراء إلى عتبة الدلالة ( ). بالنسبة للجينات في الجزء العلوي من الرسم البياني، ارتبط التعبير المتزايد بزيادة خطر الاكتئاب، في حين أظهر التعبير عن الجينات في الجزء السفلي من الرسم علاقة عكسية. NT، نص جديد.
و TMEM106B. كان الكادهرين-9 (CDH9) والبروتوكادهرينات (PCDHA1، PCDHA2 و PCDHA3) أيضًا من بين الجينات ذات الثقة العالية (الجدول التكميلي 12). وأخيرًا، 25 من الجينات ذات الثقة العالية ترمز لأهداف أدوية معروفة، مثل السيمفاستاتين (RHOA). قد تشير هذه إلى فرص لإعادة استخدام الأدوية.

السيد

قمنا بتقييم العلاقات السببية ذات الاتجاهين بين الاستعداد الوراثي للاكتئاب الرئيسي والصفات القلبية الأيضية باستخدام تحليلات MR ذات العينتين الخاصة بالأصل. أشارت نتائجنا إلى وجود علاقة إيجابية ذات اتجاهين بين الاستعداد الوراثي للاكتئاب الرئيسي ومؤشر كتلة الجسم (الاكتئاب الرئيسي -> مؤشر كتلة الجسم: CI 0.024 إلى : إلى ) (الشكل 6 والجدول التكميلي 16). هذا
تم ملاحظة العلاقة ذات الاتجاهين حصريًا في عينات من الأصول الأوروبية ( في جميع المجموعات الأخرى). كان الاستعداد الوراثي للاكتئاب السريري أيضًا سببًا في مؤشرات أخرى للملفات الأيضية غير المواتية في عينات من الأصول الأوروبية: ثلاثي الغليسريدات (TGs، تأثير إيجابي؛ ، فترة الثقة 95% من 0.070 إلى )، البروتينات الدهنية عالية الكثافة (HDLs، تأثير سلبي؛ إلى ) والبروتينات الدهنية منخفضة الكثافة (LDLs، تأثير إيجابي؛ CI 0.012 إلى ). ظلت التأثيرات ذات دلالة إحصائية بعد إزالة المتغيرات التي تسهم في التحيز المحتمل للتغاير الذي لوحظ من خلال اختبار المجموع المتبقي للتعدد السببي واختبار الشواذ العالمي. بالإضافة إلى ذلك، لم يُلاحظ تعدد سببي (الجدول التكميلي 16). من ناحية أخرى، في عينات من أصل شرق آسيوي، وجدنا ارتباطًا سببيًا سلبيًا بين ثلاثي الغليسريد والاكتئاب المزمن ( إلى
الجدول 1 | الجينات المرتبطة بمرض MD
جين دواء فوما ماجما هاي-سيماجما كان ت رواية مجموعة موثوقة
الجينات المرتبطة في TWAS و Hi-C MAGMA
NDUFAF3 ميتفورمين، ناداه لا 1.00 0.004 نعم ٩
PBRM1 ألبرازولام، دورفالوماب، إيفيروليموس لا 0.10 0.017 نعم
TBCA لا 0.16 0.042 نعم
BTN2A3P لا 1.00 نعم
ZNF204P لا 1.00 0.014 لا
HLA-B ثاليدوميد، تيكلوبيدين، فينوباربيتال، كاربامازيبين، كلوزابين، لاموتريجين لا 0.46 لا
RABGAP1 لا 1.00 0.001 نعم
جولغا1 لا 1.00 0.020 نعم
فرات2 لا 0.78 0.017 نعم
ENSG00000278376 لا ٠٫٠٦ 0.004 ٦٢
TRHDE-AS1 لا ٠٫١٤ 0.048 نعم
INSYN1-AS1 لا ٠٫٢٥ 0.014 نعم ٢٥
الجينات المرتبطة عبر جميع الطرق الأربع
إعادة القراءة نعم لا ٤٥
نيجر1 نعم لا
ZNF638 سيتيدين نعم 0.003 0.004 لا ٦١
RFTN2 ليبopolysaccharide (ليبopolysaccharide) نعم 0.003 لا ٢٠٤
ZNF445 نعم 0.001 لا ١٣٨
ZNF197 نعم لا ١٣٨
CCDC71 نعم 0.039 نعم ٩
ENSG00000225399 نعم 0.010 0.003 ٩
آر إتش أو إيه سيمفاستاتين، برافاستاتين، أتورفاستاتين، ماغنيسيوم، CCG-1423 نعم 0.031 0.019 لا ٩
CDH9 الكالسيوم نعم 0.003 0.002 لا ٩٥
TMEM161B كروفيلمر نعم لا
PFDN1 نعم 0.025 نعم ٦٧
SLC4A9 بيكربونات الصوديوم نعم 0.029 0.002 لا ٦٧
HARS1 أدينوسين فوسفات، بيروفوسفات، فوسفات، هستيدين نعم 0.024 0.017 نعم ١٤١
HARS2 أدينوسين فوسفات، بيروفوسفات، فوسفات، هستيدين نعم 0.019 0.044 لا ١٤١
ZMAT2 نعم 0.014 0.005 لا ١٤١
PCDHA1 الكالسيوم نعم 0.015 0.005 لا ١٤١
PCDHA2 الكالسيوم نعم 0.031 0.010 لا ١٤١
PCDHA3 الكالسيوم نعم 0.043 0.004 لا ١٤١
TMEM106B كروفيلمر نعم لا 1
زد إتش إتش سي 21 إنزيم مساعد أ، بالميتيل-إنزيم مساعد أ نعم 0.002 0.036 لا ٤٢
SORCS3 نعم لا ١٦
MYBPC3 نعم 0.004 0.012 لا ٤٨
SLC39A13 كلوريد الزنك، كبريتات الزنك نعم 0.007 0.003 نعم ٤٨
CTNND1 نعم 0.002 0.010 لا ٦٠
ANKK1 الميثادون، نالتريكسون، فوساماتينيب نعم 0.011 لا
DRD2 كابيرجولين، روبينيرول، سولبيريد نعم لا
MLEC نعم 0.013 نعم
SPPL3 نعم لا
LRFN5 نعم لا 10
AREL1 نعم 0.007 لا ١٤٣
الجدول (مستمر) 1 | الجينات المرتبطة بمرض MD
جين دواء فوما ماجما هاي-سيماجما كان ت رواية مجموعة موثوقة
دي إل إس تي حمض الليبويك سوكسينيل-كوإنزيم أ، كوإنزيم أ، ديهيدروليبوأميد (S)-سوكسينيلديهيدروليبوأميد نعم 0.001 لا ١٤٣
مارك3 فوستاماتينيب، ألسترباولون نعم لا ١١
KLC1 فلورويوراسيل، إيرينوتيكان، لوكوفورين نعم لا ١١
XRCC3 فلورويوراسيل، إيرينوتيكان، لوكوفورين نعم 0.004 لا ١١
ZFYVE21 إينوزيتول 1،3-بيسفوسفات نعم نعم ١١
سيلف4 إيلوبيريدون نعم لا ٨
RAB27B جوانوزين-5′-ثنائي الفوسفات نعم 0.042 لا
إميليين3 نعم 0.039 0.001 لا ٦٤
CHD6 الفوسفات، أدينوسين ثلاثي الفوسفات (ATP)، أدينوسين ثنائي الفوسفات (ADP) نعم 0.001 0.001 لا ٦٤
EP300 أسيتيل-كوإنزيم أ، عامل نمو التحول بيتا (TGF-) ، جارسينول، أدينوزين أحادي الفوسفات الدوري، الكركمين، موستينوسات نعم لا ١٦
رانجاب1 نعم 0.003 لا ١٦
ZC3H7B نعم 0.001 لا ١٦
تتضمن هذه الجدول 12 جينًا مرتبطة بشكل كبير في تحليل TWAS وHi-C MAGMA، أي ليست في قرب مادي من موقع GWAS، و43 جينًا مرتبطة بشكل كبير عبر جميع الطرق الأربع (TWAS، FUMA، MAGMA وHi-C MAGMA). تُعرض معرفات Ensembl للجينات التي لا تحمل أسماء رمزية. الأدوية التي تستهدف الجينات ذات الأولوية أو الجينات من نفس العائلة من GeneCards وDrugBank وChEmbl. الجين المحدد بواسطة التحديد الموضعي لـ FUMA أو تحديد eQTL. معدل بونفيروني ذو الجانبين القيمة لـ MAGMA أو Hi-C MAGMA لـ الإحصائيات (P<0.05 تعني دلالة إحصائية). تقرير جديد مقارنةً بتقارير MAGMA وTWAS السابقة حول مرض الزهايمر. عدد المتغيرات في ال مجموعة موثوقة، متاحة فقط للمواقع المحددة من خلال التحديد الدقيق متعدد الأنساب.
). علاوة على ذلك، أظهرت القابلية الوراثية للاكتئاب الرئيسي ارتباطًا سببيًا إيجابيًا مع ضغط الدم الانقباضي (SBP، CI 0.009 إلى ). في عينات من الأصول الأفريقية، كان لضغط الدم الانقباضي ارتباط سببي إيجابي مع الاكتئاب المزمن ( إلى .

مناقشة

نقدم أول دراسة شاملة للجينوم المرتبطة بالاكتئاب الكبير في عينة متنوعة من حيث الأصول، تشمل بيانات من ما يقرب من مليون مشارك من أصول أفريقية وشرق آسيوية وجنوب آسيوية، وعينات من أصل إسباني/لاتيني أمريكي. التقرير الأكبر السابق شمل 26,000 حالة من أصول أفريقية. .
من خلال تجميع البيانات في تحليلات ميتا محددة للسلالة، حددنا موقعين جديدين، 2q24.2 و6p15. في مجموعة الهسبانيين/الأمريكيين اللاتينيين، تم العثور على متغيرات في كانت مرتبطة بالاكتئاب الشديد. تم تعريف معظم الحالات في هذه المجموعة باستخدام استبيانات الأعراض. ستتطلب الدراسات المستقبلية تقييم ما إذا كان ارتباط هذا الموقع الجيني بالاكتئاب السريري يتوافق مع تقديرنا. بينما يتطلب الارتباط الإضافي في 6q16 في دراسات الارتباط الجيني الشامل في عينات من الأصول الأفريقية تأكيدًا إضافيًا في الدراسات المستقبلية، فإن الرابط مع الاكتئاب الشديد معقول بيولوجيًا. كان المتغير الرئيسي مرتبطًا بشكل كبير بتعبير تحديدًا في نسيج قشرة الدماغ. هرمون تركيز الميلانين (MCH) هو ببتيد عصبي يُعبّر عنه في الجهاز العصبي المركزي والطرفي. يعمل كناقل عصبي ومعدل عصبي في مجموعة واسعة من الوظائف العصبية الموجهة نحو تنظيم السلوك الموجه نحو الهدف، مثل تناول الطعام، والتنبيه العام. .
مكن التنوع، إلى جانب حجم العينة الكبير، من مقارنة البنية الوراثية السببية عبر مجموعات الأنساب. قمنا بتقييم مدى قابلية نقل 206 مواقع تم تحديدها سابقًا من دراسات GWAS الكبرى لاكتشاف الأنساب الأوروبية إلى مجموعات أنساب أخرى. تؤثر الاختلافات في ترددات الأليل، والارتباط غير العشوائي، وأحجام العينات المتغيرة على القدرة على ملاحظة الارتباطات لكل مجموعة. طورنا مؤخرًا نسب PAT، وهي طريقة لأخذ كل هذه العوامل في الاعتبار من خلال مقارنة المواقع القابلة للنقل المرصودة مع ما هو متوقع لدراسة ذات نسب أنساب وحجم عينة معين. . كانت نسب PAT حوالي للأصول الأفريقية، وجنوب آسيا، وشرق آسيا، كانت متشابهة بشكل ملحوظ ومنخفضة باستمرار. لقد حسبنا سابقًا PAT
نسب لعدة صفات أخرى ووجدوا تباينًا بين الصفات، لكن التقديرات لـ MD كانت في القاع . بنسبة نسبة PAT ، كانت قابلية نقل مواقع اضطراب الاكتئاب الرئيسي التي تم اكتشافها في عينات من أصول أوروبية أعلى بكثير لمجموعة الأمريكيين اللاتينيين/الهسبان. قد يعكس هذا الاكتشاف أن مجموعة الأمريكيين اللاتينيين/الهسبان احتوت على العديد من المشاركين الذين لديهم نسبة عالية من الأصول الأوروبية. تم تعريف الغالبية العظمى من الحالات ضمن هذه المجموعة عبر استبيانات الأعراض بدلاً من التشخيص الطبي السريري. ومن ثم، قد يكون من الممكن أن تكون قابلية النقل للتشخيص الطبي السريري أعلى حتى في هذه المجموعة. بالنسبة للأصول الأفريقية، وجنوب آسيا، وشرق آسيا، كانت نسب PAT للتشخيص الطبي السريري جميعها أقل من 0.5 ومتسقة مع التقديرات من التحليل الرئيسي، مما يوضح أن التباين في تعريفات النتائج لا يفسر محدودية قابلية نقل مواقع الاضطراب الاكتئابي عبر مجموعات الأنساب.
لفهم أفضل للآليات الكامنة وراء الفروق الفردية في القابلية لتطور الاضطراب الاكتئابي (MD)، نحتاج إلى سد الفجوة من اكتشاف المواقع إلى تحديد الجينات المستهدفة. حقق دراستنا تقدماً كبيراً في هذا الصدد. استفاد التحديد الدقيق من العينات المتنوعة الإضافية، حيث تم تقليل حجم مجموعات المصداقية الوسيطة من 65.6 إلى 35، وتم حل 32 موقعًا إلى المتغيرات الجينية المفترضة المسببة (11 موقعًا من التحديد الدقيق للأصل الأوروبي).
في تحليل TWAS، كان تعبير 354 جينًا مرتبطًا بشكل كبير بالاكتئاب الرئيسي (MD). من بين هذه، كانت 205 ارتباطات جينية جديدة، و89 كانت متداخلة مع نتائج أكبر تحليل TWAS للاكتئاب الرئيسي تم نشره سابقًا. . علاوة على ذلك، كان هناك تداخل بين 80 جينًا والارتباطات من دراسة TWAS كبيرة أخرى للاكتئاب الرئيسي نُشرت سابقًا، والتي تضمنت عينات متداخلة إلى حد كبير من الأصول الأوروبية تم تحديد عدد من هذه الميزات في تحليل TWAS، بما في ذلك NEGR1 وESR2 وTMEM106B، مسبقًا بشكل دقيق وتم تسليط الضوء عليها كعوامل محتملة السبب في تحليلات ما بعد TWAS السابقة، مما يعزز دور TWAS كأداة مهمة لفهم العلاقة بين تعبير الجينات والاكتئاب الرئيسي.
من خلال TWAS وثلاث أدوات أخرى تدمج الجسم المتزايد من المعرفة حول التوضيحات الوظيفية للجينوم، قمنا بتصنيف 43 جينًا كـ ‘عالي الثقة’. التعريف يظل اعتباطيًا حتى يتم وضع إرشادات واضحة في هذا المجال. ومع ذلك، تمثل قائمة الثقة العالية نقطة انطلاق قائمة على الأدلة لمتابعة إضافية. وهي توفر تأكيدًا لعدة جينات تم تسليط الضوء عليها مرارًا وتكرارًا باعتبارها قريبة من ارتباطات GWAS.
الشكل 6 | اختبارات MR ذات الاتجاهين بين اضطراب الاكتئاب الرئيسي والنتائج القلبية الأيضية. تُعرض البيانات مع و . تم تمييز الارتباطات ذات الدلالة الاسمية بنجمة حمراء. تم اشتقاق الإحصائيات باستخدام والأخطاء المعيارية لعدد المتغيرات المستخدمة كمتغيرات أداة في كل تحليل، معروضة كـ NSNPs. لم تُعرض النتائج لضغط الدم الانبساطي الذي
لم تكن هناك ارتباطات ذات دلالة إحصائية. ( القيم بالترتيب من الأعلى إلى الأسفل: و 0.01). يمكن العثور على مزيد من التفاصيل في الجدول التكميلي 16. AFR، الأصول الأفريقية؛ EAS، الأصول شرق آسيوية؛ EUR، الأصول الأوروبية؛ HIS، المجموعة الهسبانية/الأمريكية اللاتينية؛ SAS، الأصول جنوب آسيوية.
متغير وذو احتمال بيولوجي عالي : NEGR1، DRD2، CELF4، LRFN5، TMEM161B و TMEM106B.
علاوة على ذلك، تم تصنيف الكادهرين-9 (CDH9) والبروتوكادهرينات (PCDHA1، PCDHA2 وPCDHA3) كجينات ذات ثقة عالية. الكادهرينات هي بروتينات عابرة للغشاء، تقوم بتوسط الالتصاق بين الخلايا والأنسجة في الكائنات الحية. في الدراسات السابقة، تم ربط الكادهرينات بمرض الاضطراب الاكتئابي (MD) وباضطرابات أخرى تشمل الدماغ، بما في ذلك مرض الزهايمر ذو البداية المتأخرة، الذي غالبًا ما يظهر بأعراض نفسية عصبية مصحوبة بالاكتئاب والقلق. تعزز نتائج دراستنا الأدلة على تورط الكادهرينات والبروتوكادهرينات في مسببات مرض MD.
الجينات التي تم ربطها حديثًا بتطور مرض MD في دراستنا تسلط الضوء على مسارات جديدة، وتحدد أهدافًا دوائية محتملة جديدة وتقترح فرصًا لإعادة استخدام الأدوية. يقوم جين NDUFAF3 بترميز بروتين تجميع المعقد الأول في الميتوكوندريا، وهو الهدف الرئيسي لدواء الميتفورمين. ، الدواء الأول لعلاج داء السكري من النوع الثاني. قدمت الأبحاث في الكائنات النموذجية رابطًا مؤقتًا بين الميتفورمين وتقليل الاكتئاب والقلق . علاوة على ذلك، دراسة حديثة استخدمت أكثر من 360,000 عينة من بنك المملكة المتحدة البيولوجي
وجدت (UKB) ارتباطات بين NDUFAF3 وتقلب المزاج، مما يشير إلى أن اضطراب الطاقة قد يلعب دورًا مهمًا في فسيولوجيا تقلب المزاج. .
أشارت دراسات MR السابقة التي أُجريت على مجموعات ذات أصل أوروبي إلى وجود علاقة سببية بين زيادة مؤشر كتلة الجسم وارتفاع احتمالات الإصابة بالاكتئاب حسب علمنا، لم يتم الإبلاغ سابقًا عن دليل على وجود علاقة سببية عكسية (أي أن الاستعداد الوراثي للاكتئاب الرئيسي يزيد من احتمالات ارتفاع مؤشر كتلة الجسم). لاحظنا أيضًا أن الاستعداد الوراثي للاكتئاب الرئيسي كان مرتبطًا بمستويات أعلى من ثلاثي الغليسريد، ومستويات أقل من كوليسترول HDL، ومستويات أعلى من كوليسترول LDL لدى الأفراد من أصل أوروبي، والتي لم تكن ذات دلالة في الدراسة السابقة الوحيدة للتحليل العشوائي المندمج ذات القوة الإحصائية الأصغر. الأفراد المصابون بالاكتئاب يظهرون مستويات أعلى من الالتهاب ويكونون معرضين لخطر متزايد للإصابة باضطرابات القلب والأيض، بغض النظر عن عمر بداية المرض. قد تعكس الارتباطات الظاهرية بين الاكتئاب الوجداني والصفات القلبية الأيضية جزئيًا التداخل الجيني بينهما . ومع ذلك، في مجموعات الأنساب الأخرى، لم يُلاحظ وجود علاقة ذات دلالة إحصائية بين مؤشر كتلة الجسم والاكتئاب. أظهرت تحليلات التعيين العشوائي لدينا تأثير تقليل الدهون الثلاثية على زيادة احتمالات الإصابة بالاكتئاب لدى المشاركين من أصول شرق آسيوية.
لذلك، نقدم دليلاً إضافيًا على وجود اتجاه معاكس للتأثير في العلاقة بين اضطراب الاكتئاب الرئيسي والصفات الأيضية في مجموعات الأنساب الأوروبية والآسيوية الشرقية. بدلاً من تعميم النتائج حول عوامل خطر الاكتئاب عبر السكان، هناك حاجة إلى دراسات إضافية لفهم كيفية مساهمة العوامل الوراثية والبيئية في العلاقات المعقدة عبر مجموعات الأنساب المتنوعة.
لدراستنا حدود. في هذه الدراسة، قمنا بتصنيف الأفراد إلى مجموعات عرقية وإثنية. وعلى الرغم من أن هذا أتاح رؤى مهمة (على سبيل المثال، حول قابلية نقل مواقع MD)، إلا أن هذه التصنيفات الفئوية غير دقيقة وقد يتم استبعاد بعض المشاركين ذوي الأنساب المختلطة. في الأبحاث المستقبلية، نهدف إلى تنفيذ استراتيجيات تحليلية مختلفة تكون شاملة تمامًا.
تفاوت حجم العينة بشكل كبير بين مجموعات الأنساب. كانت أصغر مجموعة هي الأفراد من أصل جنوب آسيوي. يعيش معظم الأفراد المشمولين في دراستنا في الولايات المتحدة أو المملكة المتحدة. لتوصيف اضطراب الاكتئاب الرئيسي في السكان العالميين، هناك حاجة إلى دراسات مستقبلية تعطي الأولوية لجمع البيانات الأولية. للمساهمة في ذلك، نحن حالياً نقوم بتجنيد مرضى اضطراب الاكتئاب الرئيسي وأفراد الضبط من باكستان في دراسة DIVERGE. ومع ذلك، سيكون من الضروري بذل جهد عالمي منسق لزيادة التنوع في علم الوراثة لمعالجة المشكلة بشكل كامل . ينطبق هذا أيضًا على نقص بيانات الأوميكس الأخرى وقواعد البيانات الوظيفية الأخرى لدعم التحليلات اللاحقة لدراسات الارتباط الجينومي الواسعة النطاق المتنوعة من حيث الأصل، مثل الموارد الكبيرة للترانسكريبتوميات أو البروتيوميات في الأنسجة ذات الصلة قد يكون لهذا تأثير على نتائج TWAS لدينا لأن بيانات تسلسل الحمض النووي الريبي كانت في الغالب من مشاركين من أصول أوروبية.
علاوة على ذلك، قد تتأثر القوة الإحصائية لاكتشاف الارتباطات الجينية بتقليل التغطية للتنوع الجيني الموجود في المجموعات السلالية المتنوعة، بالإضافة إلى عوامل أخرى مثل موثوقية تقييم النتائج عبر المجموعات المختلفة.
بالإضافة إلى ذلك، اختبر تحليل MR ثنائي الاتجاه لدينا العلاقات بين اضطراب الاكتئاب الرئيسي والصفات القلبية الأيضية. عند اختبار اضطراب الاكتئاب الرئيسي كعامل تعرض، يجب تفسير النتائج على أنها تأثير الاستعداد الوراثي لاضطراب الاكتئاب الرئيسي وليس كتأثير اضطراب الاكتئاب الرئيسي نفسه.
استخدمت هذه الدراسة بيانات من عدة مجموعات سكانية وموارد حيوية موجودة لتحقيق أحجام عينات كبيرة. استلزم ذلك استخدام تعريفات مختلفة للنتائج، تشمل استبيانات الأعراض التي يملأها المرضى بأنفسهم، والسجلات الصحية الإلكترونية، والمقابلات السريرية المنظمة. تم مناقشة المزايا والعيوب المحتملة لهذه الأساليب بشكل موسع في الدراسات السابقة. من الممكن أن بعض المواقع الجينومية الـ190 ذات الدلالة الإحصائية التي حددناها مرتبطة بحساسية عامة أكثر للأمراض النفسية بدلاً من أن تكون محددة للاكتئاب الرئيسي. ومع ذلك، بالنظر إلى التداخل بين الاضطرابات النفسية المختلفة ، ومع ذلك، فإن مثل هذه النتائج ذات قيمة لفهمنا لعلم الأحياء ولتطوير علاجات جديدة لمرض العضلات.
في الختام، في هذه الدراسة الأولى واسعة النطاق ومتعددة الأنساب للجينوم المرتبطة بالاكتئاب الرئيسي، أظهرنا من خلال تحليلات القابلية للنقل أن نسبة ملحوظة من مواقع الاكتئاب الرئيسي خاصة بعينات من أصل أوروبي. حددنا ارتباطات جديدة ذات مصداقية بيولوجية تم تفويتها في تحليلات الأنساب الأوروبية وأثبتنا أن العينات الكبيرة والمتنوعة يمكن أن تكون مهمة لتحديد الجينات المستهدفة والآليات المحتملة. تشير هذه النتائج إلى أنه بالنسبة للاكتئاب الرئيسي، وهو حالة متغايرة ذات مسببات معقدة للغاية، قد يكون من المهم بشكل خاص زيادة التنوع العرقي وكذلك التنوع العالمي في الدراسات الجينية لضمان اكتشاف الجينات الأساسية ولتوفير معلومات حول قابلية نقل النتائج عبر مجموعات الأنساب.

المحتوى الإلكتروني

أي طرق، مراجع إضافية، ملخصات تقارير Nature Portfolio، بيانات المصدر، بيانات موسعة، معلومات تكميلية، شكر وتقدير، معلومات مراجعة الأقران؛ تفاصيل مساهمات المؤلفين والمصالح المتنافسة؛ وبيانات توافر البيانات والرمز متاحة علىhttps://doi.org/10.1038/s41588-023-01596-4.

References

  1. GBD 2017 DALYs and HALE Collaborators. Global, regional, and national disability-adjusted life-years (DALYs) for 359 diseases and injuries and healthy life expectancy (HALE) for 195 countries and territories, 1990-2017: a systematic analysis for the Global Burden of Disease Study 2017. Lancet 392, 1859-1922 (2018).
  2. Wray, N. R. et al. Genome-wide association analyses identify 44 risk variants and refine the genetic architecture of major depression. Nat. Genet. 50, 668-681 (2018).
  3. CONVERGE Consortium. Sparse whole-genome sequencing identifies two loci for major depressive disorder. Nature 523, 588-591 (2015).
  4. Zhang, Y., Qi, G., Park, J.-H. & Chatterjee, N. Estimation of complex effect-size distributions using summary-level statistics from genome-wide association studies across 32 complex traits. Nat. Genet. 50, 1318-1326 (2018).
  5. Flint, J. & Kendler, K. S. The genetics of major depression. Neuron 81, 1214 (2014).
  6. Cai, N. et al. Minimal phenotyping yields genome-wide association signals of low specificity for major depression. Nat. Genet. 52, 437-447 (2020).
  7. Blokland, G. A. M. et al. Sex-dependent shared and nonshared genetic architecture across mood and psychotic disorders. Biol. Psychiatry 91, 102-117 (2022).
  8. Martin, J. et al. Examining sex-differentiated genetic effects across neuropsychiatric and behavioral traits. Biol. Psychiatry 89, 1127-1137 (2021).
  9. Kang, H.-J. et al. Sex differences in the genetic architecture of depression. Sci. Rep. 10, 9927 (2020).
  10. Arnau-Soler, A. et al. A validation of the diathesis-stress model for depression in Generation Scotland. Transl. Psychiatry 9, 25 (2019).
  11. Van der Auwera, S. et al. Genome-wide gene-environment interaction in depression: a systematic evaluation of candidate genes: the childhood trauma working-group of PGC-MDD. Am. J. Med. Genet. B 177, 40-49 (2018).
  12. Peterson, R. E. et al. Molecular genetic analysis subdivided by adversity exposure suggests etiologic heterogeneity in major depression. Am. J. Psychiatry 175, 545-554 (2018).
  13. Howard, D. M. et al. Genome-wide meta-analysis of depression identifies 102 independent variants and highlights the importance of the prefrontal brain regions. Nat. Neurosci. 22, 343-352 (2019).
  14. Mitchell, B. L. et al. The Australian Genetics of Depression Study: new risk loci and dissecting heterogeneity between subtypes. Biol. Psychiatry 92, 227-235 (2022).
  15. Levey, D. F. et al. Bi-ancestral depression GWAS in the Million Veteran Program and meta-analysis in million individuals highlight new therapeutic directions. Nat. Neurosci. 24, 954-963 (2021).
  16. Dunn, E. C. et al. Genome-wide association study of depressive symptoms in the Hispanic Community Health Study/Study of Latinos. J. Psychiatr. Res. 99, 167-176 (2018).
  17. Dunn, E. C. et al. Genome-wide association study (GWAS) and genome-wide by environment interaction study (GWEIS) of depressive symptoms in African American and Hispanic/Latina women. Depress. Anxiety 33, 265-280 (2016).
  18. Bigdeli, T. B. et al. Genetic effects influencing risk for major depressive disorder in China and Europe. Transl. Psychiatry 7, e1074 (2017).
  19. Giannakopoulou, O. et al. The genetic architecture of depression in individuals of East Asian ancestry: a genome-wide association study. JAMA Psychiatry 78, 1258-1269 (2021).
  20. Torgersen, K. et al. Shared genetic loci between depression and cardiometabolic traits. PLoS Genet. 18, e1010161 (2022).
  21. O’Loughlin, J. et al. Mendelian randomisation study of body composition and depression in people of East Asian ancestry highlights potential setting-specific causality. BMC Med. 21, 37 (2023).
  22. Fatumo, S. et al. A roadmap to increase diversity in genomic studies. Nat. Med. 28, 243-250 (2022).
  23. Bailey, R. K., Mokonogho, J. & Kumar, A. Racial and ethnic differences in depression: current perspectives. Neuropsychiatr. Dis. Treat. 15, 603-609 (2019).
  24. Hunter-Zinck, H. et al. Genotyping array design and data quality control in the Million Veteran Program. Am. J. Hum. Genet. 106, 535-548 (2020).
  25. Stein, M. B. et al. Genome-wide association studies of posttraumatic stress disorder in 2 cohorts of US Army soldiers. JAMA Psychiatry 73, 695-704 (2016).
  26. Shen, H. et al. Polygenic prediction and GWAS of depression, PTSD, and suicidal ideation/self-harm in a Peruvian cohort. Neuropsychopharmacology 45, 1595-1602 (2020).
  27. Zeng, B. et al. Multi-ancestry eQTL meta-analysis of human brain identifies candidate causal variants for brain-related traits. Nat. Genet. 54, 161-169 (2022).
  28. Huang, Q. Q. et al. Transferability of genetic loci and polygenic scores for cardiometabolic traits in British Pakistani and Bangladeshi individuals. Nat. Commun. 13, 4664 (2022).
  29. Brown, B. C., Asian Genetic Epidemiology Network Type 2 Diabetes Consortium, Ye, C. J., Price, A. L. & Zaitlen, N. Transethnic genetic-correlation estimates from summary statistics. Am. J. Hum. Genet. 99, 76-88 (2016).
  30. Lam, M. et al. Comparative genetic architectures of schizophrenia in East Asian and European populations. Nat. Genet. 51, 1670-1678 (2019).
  31. McLaren, W. et al. The Ensembl variant effect predictor. Genome Biol. 17, 122 (2016).
  32. Sherry, S. T., Ward, M. & Sirotkin, K. dbSNP-database for single nucleotide polymorphisms and other classes of minor genetic variation. Genome Res. 9, 677-679 (1999).
  33. Dall’Aglio, L., Lewis, C. M. & Pain, O. Delineating the genetic component of gene expression in major depression. Biol. Psychiatry 89, 627-636 (2021).
  34. Guyon, A., Conductier, G., Rovere, C., Enfissi, A. & Nahon, J.-L. Melanin-concentrating hormone producing neurons: activities and modulations. Peptides 30, 2031-2039 (2009).
  35. Hispanic Community Health Study – Study of Latinos. National Institutes of Health https://www.ncbi.nlm.nih.gov/projects/gap/ cgi-bin/study.cgi?study_id=phs000810.v1.p1 (2015).
  36. Resource for Genetic Epidemiology Research on Aging. National Institutes of Health https://www.ncbi.nlm.nih.gov/ projects/gap/cgi-bin/study.cgi?study_id=phs000674.v3.p3 (2018).
  37. Maître, J.-L. & Heisenberg, C.-P. Three functions of cadherins in cell adhesion. Curr. Biol. 23, R626-R633 (2013).
  38. Lutz, M. W., Sprague, D., Barrera, J. & Chiba-Falek, O. Shared genetic etiology underlying Alzheimer’s disease and major depressive disorder. Transl. Psychiatry 10, 88 (2020).
  39. Chang, H. et al. The protocadherin 17 gene affects cognition, personality, amygdala structure and function, synapse development and risk of major mood disorders. Mol. Psychiatry 23, 400-412 (2018).
  40. Xiao, X. et al. The gene encoding protocadherin 9 (PCDH9), a novel risk factor for major depressive disorder. Neuropsychopharmacology 43, 1128-1137 (2018).
  41. Pernicova, I. & Korbonits, M. Metformin-mode of action and clinical implications for diabetes and cancer. Nat. Rev. Endocrinol. 10, 143-156 (2014).
  42. Zemdegs, J. et al. Metformin promotes anxiolytic and antidepressant-like responses in insulin-resistant mice by decreasing circulating branched-chain amino acids. J. Neurosci. 39, 5935-5948 (2019).
  43. Ward, J. et al. The genomic basis of mood instability: identification of 46 loci in 363,705 UK Biobank participants, genetic correlation with psychiatric disorders, and association with gene expression and function. Mol. Psychiatry 25, 3091-3099 (2020).
  44. Tyrrell, J. et al. Using genetics to understand the causal influence of higher BMI on depression. Int. J. Epidemiol. 48, 834-848 (2019).
  45. van den Broek, N. et al. Causal associations between body mass index and mental health: a Mendelian randomisation study. J. Epidemiol. Community Health 72, 708-710 (2018).
  46. Speed, M. S., Jefsen, O. H., Børglum, A. D., Speed, D. & Østergaard, S. D. Investigating the association between body fat and depression via Mendelian randomization. Transl. Psychiatry 9, 184 (2019).
  47. So, H.-C., Chau, C. K.-L., Cheng, Y.-Y. & Sham, P. C. Causal relationships between blood lipids and depression phenotypes: a Mendelian randomisation analysis. Psychol. Med. 51, 2357-2369 (2021).
  48. Perry, B. I., Oltean, B. P., Jones, P. B. & Khandaker, G. M. Cardiometabolic risk in young adults with depression and evidence of inflammation: a birth cohort study. Psychoneuroendocrinology 116, 104682 (2020).
  49. Hagenaars, S. P. et al. Genetic comorbidity between major depression and cardio-metabolic traits, stratified by age at onset of major depression. Am. J. Med. Genet. B 183, 309-330 (2020).
  50. Valkovskaya, M. et al. Study protocol of DIVERGE, the first genetic epidemiological study of major depressive disorder in Pakistan. Psychiatr. Genet. 33, 69-78 (2023).
  51. Breeze, C. E., Beck, S., Berndt, S. I. & Franceschini, N. The missing diversity in human epigenomic studies. Nat. Genet. 54, 737-739 (2022).
  52. Long, E. et al. The case for increasing diversity in tissue-based functional genomics datasets to understand human disease susceptibility. Nat. Commun. 13, 2907 (2022).
  53. Cross-Disorder Group of the Psychiatric Genomics Consortium. Genomic relationships, novel loci, and pleiotropic mechanisms across eight psychiatric disorders. Cell 179, 1469-1482.e11 (2019).
Publisher’s note Springer Nature remains neutral with regard to jurisdictional claims in published maps and institutional affiliations.
Open Access This article is licensed under a Creative Commons Attribution 4.0 International License, which permits use, sharing, adaptation, distribution and reproduction in any medium or format, as long as you give appropriate credit to the original author(s) and the source, provide a link to the Creative Commons license, and indicate if changes were made. The images or other third party material in this article are included in the article’s Creative Commons license, unless indicated otherwise in a credit line to the material. If material is not included in the article’s Creative Commons license and your intended use is not permitted by statutory regulation or exceeds the permitted use, you will need to obtain permission directly from the copyright holder. To view a copy of this license, visit http://creativecommons. org/licenses/by/4.0/.
© The Author(s) 2024

Xiangrui Meng © , Georgina Navoly , Olga Giannakopoulou , Daniel F. Levey © , Dora Koller (1) , Gita A. Pathak , Nastassja Koen , Kuang Lin , Mark J. Adams © , Miguel E. Rentería © , Yanzhe Feng , J. Michael Gaziano , Dan J. Stein (B , Heather J. Zar , Megan L. Campbell (B , David A. van Heel © , Bhavi Trivedi , Sarah Finer (B , Andrew McQuillin (B) , Nick Bass , V. Kartik Chundru (B , Hilary C. Martin , Qin Qin Huang (B) , Maria Valkovskaya , Chia-Yi Chu (1) , Susan Kanjira , Po-Hsiu Kuo® , Hsi-Chung Chen (1) , Shih-Jen Tsai (1) , YuLi Liu , Kenneth S. Kendler (1) , Roseann E. Peterson (1) , Na Cai © , Yu Fang (B , Srijan Sen , Laura J. Scott (1) , Margit Burmeister © , Ruth J. F. Loos © , Michael H. Preuss (© , Ky’Era V. Actkins , Lea K. Davis © , Monica Uddin , Agaz H. Wani , Derek E. Wildman (1) , Allison E. Aiello , Robert J. Ursano (1) , Ronald C. Kessler (1) , Masahiro Kanai © , Yukinori Okada (B , Saori Sakaue © , Jill A. Rabinowitz , Brion S. Maher (B , George Uhl , William Eaton , Carlos S. Cruz-Fuentes © , Gabriela A. Martinez-Levy © , Adrian I. Campos © , Iona Y. Millwood © , Zhengming Chen , Liming Li © , Sylvia Wassertheil-Smoller (B) , Yunxuan Jiang , Chao Tian , Nicholas G. Martin (1) , Brittany L. Mitchell (1) , Enda M. Byrne (1) , Swapnil Awasthi , Jonathan R. I. Coleman ( , Stephan Ripke (1) , PGC-MDD Working Group***, China Kadoorie Biobank Collaborative Group***, the 23andMe Research Team*,, Genes and Health Research Team*,, BioBank Japan Project ***, Tamar Sofer (1) , Robin G. Walters (1) , Andrew M. McIntosh (1) , Renato Polimanti © , Erin C. Dunn , Murray B. Stein © , Joel Gelernter (B ) , Cathryn M. Lewis (B) & Karoline Kuchenbaecker (B)

Division of Psychiatry, UCL, London, UK. UCL Genetics Institute, UCL, London, UK. Department of Psychiatry, VA CT Healthcare Center, West Haven, CT, USA. Department of Psychiatry, Yale University School of Medicine, New Haven, CT, USA. Department of Genetics, Microbiology and Statistics, University of Barcelona, Barcelona, Spain. SAMRC Unit on Risk and Resilience in Mental Disorders, Department of Psychiatry and Neuroscience Institute, University of Cape Town, Cape Town, South Africa. Nuffield Department of Population Health, University of Oxford, Oxford, UK. Division of Psychiatry, University of Edinburgh, Edinburgh, UK. Department of Genetics and Computational Biology, QIMR Berghofer Medical Research Institute, Brisbane, Queensland, Australia. Department of Medicine, VA Boston Healthcare System, Boston, MA, USA. Department of Medicine, Brigham and Women’s Hospital, Boston, MA, USA. Department of Medicine, Harvard Medical School, Boston, MA, USA. SAMRC Unit on Child and Adolescent Health, Department of Paediatrics and Child Health, University of Cape Town, Cape Town, South Africa. Department of Psychiatry and Neuroscience Institute, University of Cape Town, Cape Town, South Africa. Blizard Institute, Queen Mary University of London, London, UK. Wolfson Institute of Population Health, Queen Mary University of London, London, UK. Wellcome Sanger Institute, Saffron Walden, UK. Department of Public Health and Institute of Epidemiology and Preventive Medicine, National Taiwan University, Taipei, Taiwan. Department of Psychiatry, National Taiwan University Hospital, Taipei, Taiwan. Center of Sleep Disorders, National Taiwan University Hospital, Taipei, Taiwan. Institute of Brain Science and Division of Psychiatry, National Yang-Ming Chiao Tung University, Taipei, Taiwan. Department of Psychiatry, Taipei Veterans General Hospital, Taipei, Taiwan. Center for Neuropsychiatric Research, National Health Research Institutes, Miaoli County, Taiwan. Department of Psychiatry, VCU, Richmond, VA, USA. Department of Psychiatry, SUNY Downstate Health Sciences University, Brooklyn, NY, USA. Helmholtz Pioneer Campus, Helmholtz Munich, Neuherberg, Germany. Computational Health Centre, Helmholtz Munich, Neuherberg, Germany. Department of Medicine, Technical University of Munich, Munich, Germany. Michigan Neuroscience Institute, University of Michigan, Ann Arbor, MI, USA. Department of Psychiatry, University of Michigan, Ann Arbor, MI, USA. Department of Biostatistics, University of Michigan, Ann Arbor, MI, USA. Center for Statistical Genetics, University of Michigan, Ann Arbor, MI, USA. Department of Computational Medicine and Bioinformatics, University of Michigan, Ann Arbor, MI, USA. Department of Human Genetics, University of Michigan, Ann Arbor, MI, USA. Charles Bronfman Institute for Personalized Medicine, Icahn School of Medicine at Mount Sinai, New York, NY, USA. Novo Nordisk Foundation Center for Basic Metabolic Research, Faculty of Health and Medical Sciences, University of Copenhagen, Copenhagen, Denmark. Department of Medicine, Division of Genetic Medicine, Vanderbilt University Medical Center, Nashville, TN, USA. Department of Biomedical Informatics, Vanderbilt University Medical Center, Nashville, TN, USA. Department of Psychiatry and Behavioral Sciences, Vanderbilt University Medical Center, Nashville, TN, USA. College of Public Health, University of South Florida, Tampa, FL, USA. Genomics Program, College of Public Health, University of South Florida, Tampa, FL, USA. Robert N. Butler Columbia Aging Center, Department of Epidemiology, Mailman School of Public Health, Columbia University, New York, NY, USA. Department of Psychiatry, Uniformed Services University of the Health Sciences, Bethesda, MD, USA. Department of Health Care Policy, Harvard Medical School, Boston, MA, USA. Department of Statistical Genetics, Osaka University Graduate School of Medicine, Osaka, Japan. Analytic and Translational Genetics Unit, Massachusetts General Hospital, Boston, MA, USA. Program in Medical and Population Genetics, Broad Institute of Harvard and MIT, Cambridge, MA, USA. Department of Genome Informatics, Graduate School of Medicine, University of Tokyo, Tokyo, Japan. Laboratory for Systems Genetics, RIKEN Center for Integrative Medical Sciences, Yokohama, Japan. Divisions of Genetics and Rheumatology, Department of Medicine, Brigham and Women’s Hospital, Harvard Medical School, Boston, MA, USA. Department of Mental Health, Johns Hopkins Bloomberg School of Public Health, Baltimore, MD, USA. Neurology and Pharmacology, University of Maryland, Maryland VA Healthcare System, Baltimore, MD, USA. Departamento de Genética, Instituto Nacional de Psiquiatría ‘Ramón de la Fuente Muñíz’, Mexico City, Mexico. Institute for Molecular Bioscience, The University of Queensland, Brisbane, Queensland, Australia. MRC Population Health Research Unit, University of Oxford, Oxford, UK. Department of Epidemiology and Biostatistics, School of Public Health, Peking University, Beijing, China. Peking University Center for Public Health and Epidemic Preparedness and Response, Peking University, Beijing, China. Key Laboratory of Epidemiology of Major Diseases (Peking University), Ministry of Education, Beijing, China. Department of Epidemiology and Population Health, Albert Einstein College of Medicine, Bronx, NY, USA. Department of Biostatistics, Emory University, Atlanta, GA, USA. , Inc., Mountain View, CA, USA. Mental Health and Neuroscience Research Program, QIMR Berghofer Medical Research Institute, Brisbane, Queensland, Australia. Child Health Research Centre, The University of Queensland, Brisbane, Queensland, Australia. Stanley Center for Psychiatric Research, Broad Institute of Harvard and MIT, Cambridge, MA, USA. Department of Psychiatry and Psychotherapy, Charité – Universitätsmedizin, Berlin, Germany. Social Genetic and Developmental Psychiatry Centre, Institute of Psychiatry, Psychology and Neuroscience, King’s College London, London, UK. Analytic and Translational
Genetics Unit, Massachusetts General Hospital, Cambridge, MA, USA. Division of Sleep and Circadian Disorders, Department of Medicine, Brigham and Women’s Hospital, Boston, MA, USA. Department of Biostatistics, Harvard T.H. Chan School of Public Health, Boston, MA, USA. Institute for Genomics and Cancer, University of Edinburgh, Edinburgh, UK. VA Connecticut Healthcare Center, West Haven, CT, USA. Department of Psychiatry, Massachusetts General Hospital, Boston, MA, USA. Psychiatric and Neurodevelopmental Genetics Unit (PNGU), Massachusetts General Hospital, Boston, MA, USA. Stanley Center for Psychiatric Research, Broad Institute, Cambridge, MA, USA. Department of Psychiatry, UC San Diego School of Medicine, La Jolla, CA, USA. Herbert Wertheim School of Public Health and Human Longevity, University of California San Diego, La Jolla, CA, USA. Psychiatry Service, VA San Diego Healthcare System, San Diego, CA, USA. Department of Genetics, Yale University School of Medicine, New Haven, CT, USA. Department of Medical and Molecular Genetics, King’s College London, London, UK. These authors contributed equally: Xiangrui Meng, Georgina Navoly, Olga Giannakopoulou. *Lists of authors and their affiliations appear at the end of the paper. e-mail: k.kuchenbaecker@ucl.ac.uk

مجموعة عمل اضطراب الاكتئاب الكبير التابعة لـ PGC

شيانغروي مينغ ، مارك ج. آدامز ، كينيث س. كندلر ، روزان إي. بيترسون ، نا كاي ، نيكولاس ج. مارتن ، إندا م. بيرن ، جوناثان ر. آي. كولمان ، ستيفان ريبيكي ، أندرو م. ماكينتوش ، إيرين سي. دن ، كاثرين م. لويس وكارولين كوشنبايكر

تظهر قائمة كاملة بالأعضاء وانتماءاتهم في المعلومات التكميلية.

مجموعة التعاون في بنك كادوري الحيوي في الصين

كوانغ لين ، أيونا ي. ميلوود ، تشنغمينغ تشن ، ليمينغ لي وروبن ج. والترز

تظهر قوائم كاملة بالأعضاء وانتماءاتهم في المعلومات التكميلية.

فريق أبحاث 23andMe

يونشوان جيانغ وتشاو تيان

تظهر قائمة كاملة بالأعضاء وانتماءاتهم في المعلومات التكميلية.

فريق أبحاث الجينات والصحة

ديفيد أ. فان هيل ، بهافي تريفيدي ، سارة فاينر ، نيك باس وقين تشين هوانغ

تظهر قائمة كاملة بالأعضاء وانتماءاتهم في المعلومات التكميلية.

مشروع بنك الأحياء الياباني

ماساهيرو كاناي ، يوكينوري أوكادا وساوري ساكاوي
تظهر قائمة كاملة بالأعضاء وانتماءاتهم في المعلومات التكميلية.

الطرق

المجموعات المشاركة

لتحليل المجموعات الأفريقية، شرق آسيا، جنوب آسيا، والمجموعة الهسبانية/الأمريكية اللاتينية، قمنا بتضمين بيانات من 21 مجموعة دراسية (الجدول التكميلي 1) بمشاركين من أصول متنوعة، حيث تم أخذ القياسات من عينات مختلفة. تم وصف التفاصيل بما في ذلك تصميم الدراسة، طرق التحديد الجيني والتخمين، وضبط الجودة لهذه الدراسات في منشورات سابقة (ملاحظة تكملية). قدم جميع المشاركين موافقة مستنيرة. حصلت جميع الدراسات على موافقات أخلاقية من لجان مراجعة الأخلاقيات المحلية. تم أخذ القياسات من عينات مختلفة بدلاً من قياسات متكررة من نفس الفرد.
بالنسبة لكل دراسة، تم إجراء تحليل المكونات الرئيسية بناءً على التشابه الجيني للأفراد. تم تعيين الأفراد الذين تجمعوا حول مجموعة مرجعية ذات أصل مؤكد إلى تلك المجموعة المحددة وشملوا في تحليل الارتباط، باستثناء المجموعة الهسبانية/الأمريكية اللاتينية، التي استندت إلى العرق المبلغ عنه ذاتيًا. تم استبعاد الأفراد الذين لديهم اختلاط بين مجموعات الأنساب المرجعية المحددة مسبقًا.
قمنا أيضًا بتضمين دراستين منشورتين سابقًا عن الاضطراب الاكتئابي الكبير، باستخدام بيانات من مشاركين من أصول أوروبية، بما في ذلك PGC-MDD2 ( و ) و AGDS ( و ) (المرجع 14) لإجراء تحليل تلوي متعدد الأنساب للاكتئاب الرئيسي (الجدول التكميلي 1). كان الحجم الإجمالي للعينة في التحليل التلوي متعدد الأنساب ( و ). من بين المشاركين، كان 70.1% (حجم العينة الفعّال) من أصول أوروبية، و8.2% من شرق آسيا، و11.8% من أفريقيا، و1.5% من أصول جنوب آسيوية، و كانوا من أصل إسباني/أمريكي لاتيني.
استخدمنا مجموعة من الإجراءات لتعريف الاكتئاب، بما في ذلك المقابلات السريرية المنظمة، وسجلات الرعاية الطبية، واستبيانات الأعراض، والاستطلاعات التي أبلغ عنها المشاركون بأنفسهم (الجدول التكميلي 1). أُجريت التحليلات التلوية بشكل أساسي من خلال دمج دراسات الارتباط الجيني الواسعة النطاق (GWAS) لجميع تعريفات الظاهرة (أي، الاكتئاب الواسع MD). بالإضافة إلى ذلك، أُجريت تحليلات تلوية للاكتئاب السريري وتحليلات لاحقة ذات صلة. اعتبرنا الاكتئاب الذي تم تحديده من خلال المقابلات السريرية المنظمة (التي تقيم مباشرة معايير التشخيص بناءً على DSM-IV، DSM-5 أو ICD9/10 من خلال المقابلات أو الإبلاغ الذاتي) أو سجلات الرعاية الطبية (ICD9 أو ICD10 من وحدات الرعاية الأولية أو الثانوية) كاكتئاب سريري. من بين دراسات GWAS، استوفت دراسات Genes and Health، MVP، دراسة الأوبئة الجينية للشيخوخة (GERA)، BioVU، مركز أبحاث التدخل الوقائي التجريبي (PIRC)، مسح الصحة النفسية للمراهقين المكسيكيين (MAMHS)، CONVERGE، UKB، دراسة الجيش لتقييم المخاطر والمرونة لدى أفراد الخدمة (Army-STARRS) وBioMe التعريف السريري للاكتئاب. استنادًا إلى بيانات الأنساب الأوروبية من أعمال منشورة سابقة لمجموعة PGC-MDD. ، جميع الدراسات استوفت التعريف السريري، باستثناء UKB و23andMe، اللتين تم استبعادهما في تحليل الاكتئاب السريري.

تحليلات الارتباط الجيني على مستوى الدراسة

طوال المخطوطة، كانت جميع الاختبارات الإحصائية ذات اتجاهين، ما لم يُذكر خلاف ذلك صراحة. كان لدينا وصول إلى بيانات على مستوى الأفراد لدراسات Army STARRS، UKB، مبادرة صحة المرأة (WHI)، دراسة صحة المتدربين (IHS)، GERA، دراسة قلب جاكسون (JHS)، دراسة صحة الأطفال دراكنشتاين ودراسة صحة أحياء ديترويت. تم منح الوصول إلى البيانات عبر متعاونينا، UKB تحت رقم الطلب 51119 وdbGaP تحت رقم المشروع 18933.
تم تقييم الارتباطات على مستوى SNP مع الاكتئاب من خلال الانحدارات اللوجستية باستخدام برنامج PLINK الإصدار 1.90. تم استخدام نموذج الإضافة لكل أليل. تم تضمين العمر والجنس والمكونات الرئيسية والمتغيرات المشتركة الأخرى ذات الصلة بمستوى الدراسة كمتغيرات مشتركة. حيثما توفرت، تم استخدام الأنماط الجينية على الكروموسوم تم ترميزها بـ 0 أو 2 في المشاركين الذكور و0 و1 و2 في المشاركات الإناث. بيانات المتغيرات على كانت متاحة فقط لبعض الدراسات (الجدول التكميلي 1). كان حجم العينة الفعّال 1763 للأفارقة، 58,833 لشرق آسيا، 13,099 لأصول جنوب آسيا و79,720 للأمريكيين من أصل إسباني/لاتيني. ملخص
تم استلام الإحصاءات من متعاونينا لجميع الدراسات الأخرى. تم إجراء تحليلات الانحدار اللوجستي ذات التأثير الإضافي من قبل شركة 23 and Me Inc، ودراسة تايوان-الاكتئاب، وMVP، وBBJ، وRabinowitz، وMAMHS، وPrOMIS، وBioVU. تم تضمين العمر، الجنس، المكونات الرئيسية والمتغيرات الأخرى ذات الصلة بمستوى الدراسة كمتغيرات ضابطة.
تم استخدام نماذج التأثير المختلط في تحليل الارتباط لـ CKB وBioME وGenes and Health باستخدام SAIGE (الإصدار 0.36.1) (المرجع 54). أجرت دراسة CONVERGE في البداية اختبارات GWA بنموذج التأثير المختلط باستخدام مجموعة أدوات الانحدار البايزي واللوجستي-النموذج المختلط الخطي (BOLT-LMM)، تلتها تحليلات الانحدار اللوجستي باستخدام PLINK لاسترجاع نسب الأرجحية اللوغاريتمية (ORs). بالنسبة لدراسة CONVERGE، تم استخدام نسب الأرجحية اللوغاريتمية والانحراف المعياري من PLINK في التحليل التلوي الخاص بنا. نفذت دراسة HCHS/SOL اختبارات GWA بنموذج التأثير المختلط لضبط بنية السكان والقرابة مع الاكتئاب كمتغير ثنائي. وأُجري باستخدام GENESIS تم تحويل الإحصائيات الملخصة من GENESIS إلى والمتوسط الحسابي للخطأ المعياري قبل التحليل التلوي. أولاً، تم تحويل الدرجة وتباينها إلى و الخطأ المعياري للمتوسط بواسطة النقاط/التباين والانحراف المعياري للمتوسط = جذر التباين/التباين. بعد ذلك، وتم تحويل المتوسط الحسابي والانحراف المعياري إلى تقريبًا وخطأ المعيار المتوسط باستخدام و الخطأ المعياري للمتوسط الخطأ المعياري المتوسط ، حيث pi هي نسبة الحالات في التحليل .
قمنا بتقييد التحليل اللاحق على المتغيرات التي تحتوي على درجة دقة التقدير (imputation accuracy info score) بمقدار 0.7 أو أعلى وعدد الأليلات الفعالة ماف ماف بقيمة 50 أو أعلى. بالنسبة للدراسة ذات حجم العينة الصغيرة، طلبنا تردد الأليل الطفيف ألا يقل عن 0.05. تم إعادة ترميز الأليلات للمتغيرات الإدخالية/الحذفية (indels) كـ ‘I’ للأليل الأطول و’D’ للأليل الأقصر. تم إزالة المتغيرات الإدخالية/الحذفية ذات الأنماط المختلفة في نفس الموقع.

التحليلات التلوية

قمنا أولاً بتنفيذ تحليلات ميتا ذات تأثير ثابت موزونة بالعكس حسب التباين (IVW) لدراسات الارتباط الجينومي الواسعة (GWAS) من كل مجموعة عرقية/إثنية (أي، الأصول الأفريقية، الأصول شرق آسيوية، الأصول جنوب آسيوية ومجموعة الهسبانيك/الأمريكيين اللاتينيين) باستخدام برنامج METAL (الإصدار 2011-03-25) (المرجع 57). عامل التضخم الجينومي تم حسابها لكل دراسة وتحليل تلوي باستخدام حزمة R GenABEL الإصدار 1.8.0 (المرجع 58). نظرًا لاعتماد هذا التقدير على حجم العينة، قمنا أيضًا بحسابه (المرجع 59) كما المرجع 60 . تم أيضًا حساب تقاطع LDSC باستخدام لوحة مرجعية لتغاير الارتباط (LD) متطابقة في الأصل من لوحة مرجعية Pan UKB لكل تحليل تلوي باستخدام LDSC (الإصدار 1.0.1) (المرجع 62). للتحليلات التلوية التي بها تضخم متبقي ( ) تم تعديل إحصائيات الاختبار للمتغيرات بواسطة تقاطع LDSC. بعد التحليلات التلوية باستخدام METAL، تم استبعاد المتغيرات الموجودة في أقل من دراستين. كانت الاختبارات الإحصائية عادة ذات اتجاهين ما لم يُذكر خلاف ذلك. كما أجرينا تحليل التغاير باستخدام METAL لتقييم ما إذا كانت أحجام التأثير المرصودة (أو إحصائيات الاختبار) متجانسة عبر العينات.
قمنا بدمج بيانات من 71 مجموعة ذات أصول متنوعة باستخدام تحليل تلوي بتأثيرات ثابتة IVW في برنامج METAL و تم حسابها، وكانت 1.687 و1.001 على التوالي. كما تم حساب تقاطع LDSC باستخدام لوحة مرجعية LD متعددة الأنساب (ملاحظة تكميلية)، والتي كانت 1.019 (الخطأ المعياري المتوسط 0.011). قمنا بتعديل إحصائيات الاختبار من التحليل التلوي متعدد الأنساب باستخدام تقاطع LDSC البالغ 1.019. تم الاحتفاظ فقط بالمتغيرات الموجودة في دراستين على الأقل لمزيد من التحليل، مما أسفر عن إجمالي عدد من… الأنواع. كما قمنا بحساب عدد الحالات والإجمالي الكلي للعينات لكل نوع بناءً على حجم العينة الخام وتوفر كل دراسة.
استخدمنا عتبة دلالة إحصائية مقدارها لتحديد إشارات الارتباط المستقلة، تم تطبيق عملية الاختيار الأمامي والإقصاء الخلفي في GCTA (الأمر ‘cojo-slt’) باستخدام الإحصائيات الملخصة من التحليل التلوي متعدد الأنساب، مع لوحة مرجعية LD متعددة الأنساب المذكورة أعلاه (إصدار GCTA 1.92.0 بيتا 2) من الممكن أن يحدد الخوارزمية إشارات ثانوية إيجابية كاذبة إذا لم يتطابق الترابط الوراثي (LD) في مجموعة المرجع مع الترابط الوراثي الفعلي في بيانات دراسة الارتباط الجيني الواسعة النطاق (GWAS) بشكل جيد؛ لذلك، لكل إشارة مستقلة
تم إنشاء مخططات تكبير الموقع المحددة بواسطة خوارزمية GCTA للمنطقة الممتدة 250 كيلوبازا للأمام والخلف. ثم قمنا بفحص كل من هذه المخططات يدويًا وأزلنا أي إشارات ثانوية من قائمتنا حيث كان هناك فصل غير واضح في الترابط الوراثي، أي أن بعض المتغيرات القريبة من الضربة الثانوية كانت مرتبطة وراثيًا بالمتغير الرئيسي.
تم تعريف المواقع بواسطة تحديد الفاصل الجينومي المحيط بمسافة 250 كيلوبازا للأمام والخلف من كل متغير وراثي رئيسي. حيثما كانت المتغيرات الوراثية الرئيسية متباعدة بأقل من 500 كيلوبازا، تم تجميع المواقع المقابلة كموقع واحد يحتوي على إشارات مستقلة متعددة. ثم تم اختيار المتغير الوراثي الرئيسي لكل موقع باعتباره المتغير الذي يمتلك أقل قيمة ارتباط. القيمة. تم إجراء التحليل لتحديد المواقع، إلى جانب جميع المهام الأخرى المتعلقة بـ R ما لم يُذكر خلاف ذلك، باستخدام (الإصدار 3.4.3) (المرجع 65) وتم إنتاج الأشكال باستخدام الحزم ggplot2 (الإصدار 3.2.1) (المرجع 66)، qqman (الإصدار 0.1.4) (المرجع 67) و ggpubr (الإصدار 0.6.0) (المرجع 68).
أجرينا تحليلات حساسية لتعريفات النتائج، ونسبة الحالات إلى الضوابط، واستخدام نهج تحليل تلوي متعدد الأنساب مختلف (ملاحظة تكميلية).

التحديد الدقيق

قمنا بتحديد المواقع الدقيقة لجميع المواقع ذات الارتباطات ذات الدلالة الإحصائية من دراسة GWAS متعددة الأنساب باستخدام طريقة تحديد المواقع الدقيقة الإحصائية للعينات متعددة الأنساب. . باختصار، هذه الطريقة هي امتداد لمنهج التحديد الدقيق البيزي الذي يستخدم تقديرات التغاير عبر مجموعات الأنساب، بحيث يكون للمتغيرات التي لها تقديرات تأثير مختلفة عبر السكان احتمال أولي أصغر لأن تكون المتغير المسبب.
لكل متغير رئيسي، قمنا أولاً باستخراج جميع المتغيرات القريبة مع كما تم تحديده بواسطة مرجع الترابط الوراثي متعدد الأنساب. تم حساب الاحتمال المسبق متعدد الأنساب لكل متغير ليكون سببيًا من تحليل تلوي بتأثيرات ثابتة يجمع الإحصائيات الملخصة من التحليل التلوي الخاص بكل أصل من الأصول الخمسة الرئيسية. تم حساب الإحصائيات لتقدير التغاير في تقديرات التأثير عبر مجموعات الأنساب. كانت الاحتمالية اللاحقة لإدراج متغير في المجموعة الموثوقة متناسبة مع إحصائية اختبار كاي-تربيع الخاصة به والاحتمالية السابقة. تم تحديد المجموعة الموثوقة بنسبة 99% لكل متغير رئيسي عن طريق ترتيب جميع متغيرات SNP (ضمن) من المتغير الرئيسي) وفقًا لاحتمالاتهم اللاحقة ثم تضمين متغيرات SNP المصنفة حتى تصل أو تتجاوز احتمالاتهم اللاحقة التراكمية 0.99.
كمقارنة، أجرينا أيضًا تحليل تحديد المواقع الدقيق باستخدام الطريقة البايزية استنادًا إلى الإحصائيات الملخصة لتحليل التلوي للأصول الأوروبية. تم استخدام نفس قائمة المتغيرات الجينية المستقلة الرائدة من تحليل التلوي متعدد الأصول لهذا التحديد الدقيق في بيانات الأصول الأوروبية. جميع المتغيرات الجينية القريبة مع كما تم تحديده بواسطة لوحة المرجع LD الأوروبية لمشروع 1000 جينوم، تم تضمينها في التحديد الدقيق للمواقع. تم حساب الاحتمالية اللاحقة بطريقة مماثلة، ولكن بدون الافتراض المسبق متعدد الأنساب. وبالمثل مع التحديد الدقيق متعدد الأنساب، تم ترتيب جميع المتغيرات الجينية المفردة، وتم اشتقاق 99% من المجموعات الموثوقة بناءً على ذلك.
نظرًا لأن التحديد الدقيق لدينا استند إلى إحصائيات ملخصة من التحليل التلوي، يمكن أن تؤثر التغايرية بين الدراسات الفردية (على سبيل المثال، بسبب الاختلافات في مصفوفة التحديد الجيني) على معايرة واستدعاء التحديد الدقيق. استخدمنا طريقة جديدة لمراقبة الجودة تعتمد على إحصائيات ملخصة اقترحها كاناي وزملاؤه (SLALOM) لتحليل القيم الشاذة في إحصائيات الارتباط لكل موقع محدد بدقة. . تحسب هذه الطريقة إحصائيات الاختبار (DENTIST-S) من -عشرات من متغيرات الاختبار والمتغير الرئيسي (المتغير ذو أدنى القيمة في كل موقع)، وارتباط التغاير بين متغيرات الاختبار والمتغير الرئيسي في الموقع من بين 155 موقعًا تم تحديدها بدقة في دراستنا، كان هناك 134 موقعًا بأعلى احتمال إدراج لاحق للمتغير أكبر من 0.1. بالنسبة لهذه المواقع الـ134، تم حساب القيم لجميع المتغيرات ضمن منطقة 1 ميغابايت من المتغير الرئيسي لكل موقع بناءً على مرجع الترابط متعدد الأنساب الخاص بنا من بيانات UKB. تماشيًا مع المعايير التي استخدمها كاناي وزملاؤه، المتغيرات التي تحتوي على DENTIST-S قيمة أصغر من و تم تعريف المتغير الرئيسي الذي يزيد عن 0.6
تم تصنيف المواقع التي تم تحديدها بدقة على أنها قوية إذا لم تكن هناك متغيرات شاذة.

تحليل التموقع المشترك

قمنا بإجراء التموقع المشترك بين الارتباطات الجينية مع الاكتئاب الرئيسي وتعبير الجينات في أنسجة الدماغ والدم من عينات ذات أصول أوروبية وأفريقية ومشاركين من أصول إسبانية/لاتينية باستخدام حزمة coloc في لغة R. لاختيار الجينات للاختبار، قمنا برسم خرائط لـ SNPs ضمن نافذة 3 ميغاباز عند 2q24.2 و6q16.2 باستخدام أداة Variant Effect Predictor “، مما أدى إلى وجود ثمانية وأربعة جينات، على التوالي. المواقع ذات الاحتمالية اللاحقة إما لأن الصفتين مرتبطتان وتشتركان في متغيرين مختلفين ولكنهما مرتبطان (فرضية H3) أو متغير سببي واحد (فرضية H4) تم اعتباره كمتزامن. تم اختبار إحصائيات الملخص للأصل الأوروبي والأفريقي للاكتئاب (MD) مقابل تعدد الأنساب لمؤشرات التعبير الجيني في الدماغ (eQTLs) من عينات أوروبية وأفريقية أمريكية. . بالنسبة للمجموعة الهسبانية/الأمريكية اللاتينية، قمنا باختبار تعبير الجينات والبروتينات في نسيج الدم من دراسة التصلب العصيدي متعددة الأعراق والدراسة متعددة الأوميات للطب الدقيق لأصل أفريقي، قمنا باختبار تعبير الجينات في الدم من دراسة GENOA وتعبير البروتيوم في الدم . بالنسبة للأصل الأوروبي، قمنا باختبار تعبير الجينات في الدم من eQTLgen ، وتعبير البروتيوم من الدم قمنا أيضًا بإجراء تحليلات التموقع المشترك لمؤشرات التعبير الجيني المرتبطة بالسلالة (eQTL) ومؤشرات البروتين المرتبطة بالسلالة (pQTL) للمواقع التي تم الإبلاغ عنها سابقًا والتي كانت قابلة للنقل أو غير قابلة للنقل.

تقييم قابلية انتقال المواقع المرتبطة بمرض السكري من النوع الثاني

قمنا بتقييم ما إذا كانت المواقع المرتبطة بالاكتئاب السريري المنشورة تظهر دليلاً على الارتباط في عينات من الأصول الآسيوية الشرقية، والآسيوية الجنوبية، والأفريقية، والهسبانية/الأمريكية اللاتينية. جمعنا المتغيرات الجينية المستقلة ذات الدلالة الجينومية الشاملة من دراستين كبيرتين للجينوم المرتبط بالاكتئاب السريري في عينات من الأصول الأوروبية، مما أسفر عن 195 موقعًا. شملت المجموعات ذات الأنساب المتنوعة في هذه الدراسة أعدادًا أقل من المشاركين مقارنة بدراسات الاكتشاف ذات الأنساب الأوروبية. كما أن المتغير المعين قد يكون أقل تكرارًا في مجموعة أنساب أخرى. لذلك، قد لا تظهر المتغيرات الرئيسية الفردية دليلًا على الارتباط بسبب نقص القوة الإحصائية. علاوة على ذلك، في دراسة الاكتشاف، يكون المتغير الرئيسي إما المتغير المسبب أو مرتبطًا به ارتباطًا قويًا. ومع ذلك، تعني الاختلافات في الترابط الوراثي أن المتغير الرئيسي قد لا يكون مرتبطًا في مجموعة أنساب أخرى وبالتالي قد لا يظهر دليلًا على الارتباط. بناءً على ذلك، كان تقييمنا لقابلية النقل قائمًا على نسب PAT التي تجمع المعلومات عبر المواقع وتأخذ في الاعتبار العوامل الثلاثة جميعها، حجم العينة، وتكرار الأليل الأقل، والاختلافات في… .
أولاً، تم إنشاء مجموعات موثوقة لكل موقع جيني. وكانت تتألف من المتغير الرئيسي بالإضافة إلى جميع المتغيرات المفردة المرتبطة (SNPs) ) ضمن نافذة 50 كيلوباز من المتغير الرئيسي (استنادًا إلى لوحات مرجعية للارتباط الوراثي المتطابقة مع الأنساب من بيانات 1000 جينوم) ومع تم تعريف الإشارة على أنها ‘قابلة للنقل’ إلى مجموعة نسب أخرى إذا كان على الأقل متغير واحد من المجموعة الموثوقة مرتبطًا عند اختبار ذو طرفين مع MD وكان هناك اتجاه تأثير متسق بين دراسة الاكتشاف والدراسة التجريبية. هو عدد متغيرات النوكليوتيد المفردة في المجموعة الموثوقة لكل موقع، و هو عامل عقوبة استخلصناه من تقديرات تجريبية. كان عدد SNPs المستقلة الفعلي غالبًا أعلى في مجموعات الأنساب الأخرى بسبب الاختلافات في الترابط الوراثي، مما أدى إلى عبء اختبار متعدد أعلى واحتمالية أكبر لتحديد SNPs ذات قيمة منخفضة القيمة، بمحض الصدفة فقط. هذا يؤدي إلى تضخيم إحصائيات الاختبار وتم تعديله بواسطة عامل العقوبة . لاشتقاق ال لكل مجموعة عرقية، استخدمنا الإحصائيات الملخصة من دراسة ارتباط جيني واسعة النطاق سابقة حول سرطان الثدي ، حيث كان يُعتقد أن الأنماط الظاهرية غير مرتبطة بكثافة الثدي. تم أخذ ما مجموعه 441 متغيرًا جينيًا مفردًا (SNPs) ذات دلالة في سرطان الثدي من ورقتهم البحثية، وأُجريت تحليلات الانحدار الخطي لـ قيم هذه المتغيرات الجينية المفردة (SNPs) في كل من إحصائياتنا الملخصة المتنوعة من حيث الأصل لاضطراب الاكتئاب الرئيسي (MD) على عدد المتغيرات الجينية المفردة في المجموعات الموثوقة. تم التعامل مع تقديرات المعاملات (الميل من الانحدارات) كـ لكل سلالة. ونتيجة لذلك، كانوا ، 0.006847 و0.003147 لعينات من الأصول الأفريقية، والآسيوية الشرقية، والآسيوية الجنوبية، ولمجموعة الأمريكيين اللاتينيين/الهسبان، على التوالي.
في الخطوة التالية، تم حساب القدرة الإحصائية لاكتشاف ارتباط لموقع معين بافتراض تأثير إضافي عند معدل خطأ من النوع الأول 0.05، باستخدام تقديرات التأثير من دراسة الاكتشاف، وتردد الأليل وحجم العينة من كل من مجموعات البيانات المستهدفة من مجموعات عرقية/إثنية متنوعة. تم جمع تقديرات القدرة عبر المواقع المنشورة لإعطاء تقدير لعدد المواقع الإجمالي المتوقع أن تكون مرتبطة بشكل كبير. هذا هو العدد المتوقع إذا كانت جميع المواقع قابلة للنقل ويأخذ في الاعتبار القدرة الإحصائية للتكرار. قمنا بحساب نسبة PAT بقسمة عدد المواقع المرصودة على العدد المتوقع. بالإضافة إلى ذلك، تم تعريف المواقع على أنها “غير قابلة للنقل” إذا كان لديها قدرة كافية لتحديد ارتباط لكنها لم تظهر دليلاً على الارتباط، أي إذا كانت تحتوي على متغير واحد على الأقل في المجموعة الموثوقة مع… الطاقة، في حين أن أياً من المتغيرات في المجموعة الموثوقة لم يكن ولا يوجد متغير ضمن 50 كيلوباز من الموقع يحتوي على في مجموعة البيانات المستهدفة.
للمقارنة، أجرينا أيضًا تقييمًا لقابلية النقل لدراسة بحثية عن الأصول الأوروبية. المواقع الجينية الـ102 المهمة التي أبلغ عنها هوارد وزملاؤه تم تقييم قابليتها للنقل في دراسة AGDS باستخدام الطريقة المذكورة أعلاه.
لتقييم ما إذا كانت قلة قابلية النقل قد تعود إلى تعريفات نتائج غير متجانسة، أجرينا تحليل حساسية، حيث قمنا بتقدير نسب PAT بناءً فقط على الدراسات التي تستوفي تعريف MD السريري.

الارتباطات الجينية عبر الأنساب

قمنا بتقدير الارتباطات الجينية عبر الأنساب باستخدام برنامج POPCORN الإصدار 1.0 (المراجع 29، 54، 78). تم حساب الارتباطات الزوجية بين كل تركيبة من المجموعات الخمس للأنساب/الأعراق (أي الأفريقية، الأوروبية، شرق آسيوية، جنوب آسيوية، والأمريكية اللاتينية/الهسبانية) للاكتئاب العام والاكتئاب السريري بشكل منفصل.

تعليق الجينات

تم أولاً توضيح الإحصائية الملخصة من التحليل التلوي متعدد الأنساب باستخدام FUMA. تم استخراج نتائج كل من التعيين الموضعي وتعيين eQTL من FUMA. تم استخدام عينات الجينوم الأوروبي من مشروع 1000 جينوم كلوحة مرجعية للارتباط الجيني (LD) لتوضيح جينات FUMA. تم استخدام مجموعات البيانات الخاصة بنسيج الدماغ المتاحة في FUMA لتوضيح جينات eQTL.
تم تنفيذ تحليلات الارتباط المعتمدة على الجينات باستخدام تحليل التوصيف الجينومي متعدد العلامات (MAGMA، الإصدار 1.08) (المرجع 80) وMAGMA المرتبط بتقنية Hi-C (H-MAGMA) . تم استخدام لوحة مرجعية لتغاير الارتباط (LD) متعددة الأنساب المذكورة أعلاه من UKB كلوحة مرجعية لتغاير الارتباط. يقوم H-MAGMA بتعيين المتغيرات الجينية غير المشفرة إلى جيناتها المعنية بناءً على التفاعلات طويلة المدى في الأنسجة ذات الصلة بالأمراض التي تم قياسها بواسطة استخدمنا دماغ البالغين ملف التعليقات التوضيحية.

تحليل الارتباط عبر كامل النسخ الجينية ورسم خرائط الأدوية

لإجراء تحليل TWAS، تم استخدام برنامج FUSION تم تنزيل أوزان SNP من موقع FUSION الإلكتروني. وتم اشتقاقها من عدة دراسات خارجية، بما في ذلك (1) أوزان SNP من جميع أنسجة الدماغ المتاحة، والغدة الكظرية، والغدة النخامية، والغدة الدرقية، والدم الكامل من GTEx الإصدار 8 (المرجع 84) (استنادًا إلى الجينات التي لها وراثة معنوية و’جميع العينات’ في GTEx الإصدار 8، والتي تشمل أيضًا أفرادًا من أصول أفريقية أمريكية وآسيوية)؛ (2) أوزان SNP من اتحاد CommonMind، الذي يشمل عينات من قشرة الفص الجبهي الظهراني للدماغ؛ (3) أوزان SNP من دراسة الشباب الفنلنديين؛ و(4) من سجل التوائم الهولندي، الذي يوفر أوزان SNP من أنسجة الدم (الدم الكامل والدم المحيطي، على التوالي).
استخدمنا لوحة مرجعية لتغاير الارتباط (LD) متعددة الأنساب كما هو موضح أعلاه. تم الاحتفاظ بالمتغيرات الموجودة في لوحة المرجع السكانية الأوروبية لمشروع 1000 جينوم. كما تم إجراء تحليل TWAS منفصل باستخدام لوحة مرجعية لتغاير الارتباط تعتمد على عينات من أصل أوروبي من مشروع 1000 جينوم، كتحليل حساسية.
عتبة الدلالة على مستوى كامل النسخ المرتبطة بدراسات TWAS في هذه الدراسة كانت . كان هذا العتبة سابقًا
تم اشتقاقه باستخدام إجراء قائم على التبديل، والذي يقدر عتبة الدلالة بناءً على عدد الميزات المختبرة .
تمت مقارنة النتائج مع دراسات TWAS السابقة في اضطراب الاكتئاب الرئيسي، بما في ذلك أكبر دراستين لـ TWAS في اضطراب الاكتئاب الرئيسي حتى الآن. . استخدمت هذه الدراسات عمومًا مجموعات أصغر من أوزان SNP (باستثناء الدراسة التي أجراها دال أغلّو وزملاؤه، والتي استخدمت أوزان SNP مماثلة للدراسة الحالية، ولكن بأوزان SNP مشتقة من إصدار GTEx السابق، الإصدار 7). تحليل TWAS تم إنشاء مخطط -score باستخدام وظيفة TWAS-plotter .
لتقييم مدى صلة الجينات الجديدة باكتشاف الأدوية، تم البحث عن الجينات في ثلاث قواعد بيانات دوائية كبيرة: GeneCards ، دراج بانك و ChEMBL في الجدول 1، يتم عرض مجموعة مختارة من الأدوية (تلك التي تم الإبلاغ عنها في عدة منشورات) التي تستهدف على الأرجح مجموعات الجينات ذات الأولوية العالية لدينا لكل جين.

السيد

قمنا بإجراء تحليل MR ثنائي الاتجاه لعينة مزدوجة باستخدام حزمة TwoSampleMR في لغة R (الإصدار 0.5.6) لاختبار التأثيرات السببية المحتملة بين الاكتئاب السريري والستة صفات القلبية الأيضية. اتبعنا إرشادات STROBE-MR (تعزيز تقارير الدراسات الرصدية في علم الأوبئة باستخدام التوزيع العشوائي المندلي) (ملاحظة تكميلية). بالنسبة للأفراد من أصل أوروبي، تم استخدام UKB لاختيار الأدوات لمؤشر كتلة الجسم، الجلوكوز الصائم، HDL، LDL، ضغط الدم الانقباضي وTGs. تم الحصول على بيانات ملخص ضغط الدم الانقباضي من UKB للأفراد من أصل أفريقي وجنوب آسيوي والمشاركين من أصل إسباني/لاتيني أمريكي. بالنسبة لعينات من أصل أفريقي، شرق آسيوي وجنوب آسيوي ومجموعة إسبانية/لاتينية أمريكية، تم إجراء تحليل تلوي باستخدام METAL. بوزن التباين العكسي باستخدام UKB والاتحادات التالية: GIANT لمؤشر كتلة الجسم؛ ماجيك للسكر الصائم؛ الاتحاد العالمي لعلم جينات الدهون لـ HDL و LDL و TG؛ وبنك الأحياء الياباني لضغط الدم الانقباضي في عينات من الأصول شرق آسيوية. تم تقدير الارتباطات الجينية مع المتغيرات الكمية بالنسبة للمقياس والوحدات والنماذج المحددة في الدراسات الأصلية. كما تم إجراء تحليلات التغاير. لتجنب تداخل العينات، تم استبعاد مجموعات البيانات المستخدمة لتعريف المتغيرات الآلية (IV) للصفات القلبية الأيضية من إحصائيات الارتباط الجيني على مستوى الجينوم لمرض الاكتئاب المستخدمة في تحليلات التعديل الجيني (MR) التي أجريت بالنسبة لكل مجموعة عرقية.
الدلالة على مستوى الجينوم بأكمله ) تم استخدامه كعتبة لاختيار المتغيرات المستقلة للتعرضات. ومع ذلك، إذا كان هناك أقل من عشرة متغيرات متاحة، تم استخدام عتبة استرشادية ( ) تم استخدامه لاختيار المتغيرات المستقلة (الجدول التكميلي 16). قمنا بتضمين المتغيرات المستقلة التي كانت موجودة في كلا المجموعتين البيانتين (التعرض والنتيجة) فقط. اتبعنا الافتراضات الثلاثة الرئيسية للمتغيرات المستقلة للتحليل: (1) الصلة: المتغير المستقل مرتبط بعامل الخطر المعني؛ (2) الاستقلالية: المتغير المستقل غير مرتبط بالعوامل المربكة؛ و(3) الاستبعاد: المتغير المستقل مرتبط بالنتيجة فقط من خلال التعرض. استخدمنا المعايير التالية للتجميع: و النافذة. تم استخدام المعلومات التالية في كل من بيانات التعرض والنتيجة: معرف SNP، حجم التأثير، الأليل المؤثر، الأليل الآخر، تردد الأليل المؤثر و القيمة. استخدمنا خمس طرق مختلفة للتحليل العشوائي للمندوب: IVW، MR-Egger، الوسيط المرجح، الوضع البسيط والوضع المرجح تم الإبلاغ عن تقديرات IVW كنتائج رئيسية بسبب قوتها الإحصائية الأعلى. في حين تم استخدام الاختبارات الأخرى لتقييم اتساق التقديرات عبر طرق مختلفة. تم إجراء تقاطع انحدار MR-Egger واختبارات التغاير في MR كتحليلات حساسية إضافية. في حالة وجود تغاير كبير، تم استخدام اختبار مجموع البواقي المتعدد التأثيرات واختبار الشواذ العالمي لإزالة المتغيرات الجينية بناءً على مساهمتها في التغاير. ).

ملخص التقرير

مزيد من المعلومات حول تصميم البحث متاحة في ملخص تقرير مجموعة نيتشر المرتبط بهذا المقال.

توفر البيانات

سيتم توفير إحصائيات ملخص دراسات الارتباط الجيني الواسعة النطاق عبر موقع PGC الإلكتروني (https://www.med.unc.edu/pgc/download-results/) تحت معرف مجموعة البيانات ‘mdd2023diverse’. لا تسمح 23andMe وWHI وJHS
مشاركة إحصائيات ملخص الجينوم على مستوى الجينوم الكامل. سيتم توفير إحصائيات ملخص GWAS الكاملة لمجموعة بيانات الاكتشاف 23andMe من خلال 23andMe للباحثين المؤهلين بموجب اتفاقية مع 23andMe تحمي خصوصية المشاركين في 23andMe. يرجى زيارةhttps://research.23andme.com/collaborate/#dataset-access/لمزيد من المعلومات وللتقدم بطلب للوصول إلى البيانات. يمكن للباحثين التقدم بطلب للوصول إلى WHI وJHS عبر dbGaP (https://www.ncbi.nlm.nih. gov/gap/). استخدمت الدراسة الحالية بيانات من دراسات dbGaP بموجب الطلب رقم 18933.

توفر الشفرة البرمجية

استخدمنا برامج متاحة للجمهور للتحليلات. البرامج المستخدمة مذكورة في قسم الطرق. نصوص التحليل المخصصة متوفرة علىhttps://doi.org/10.5281/zenodo.8335659.

References

  1. Zhou, W. et al. Efficiently controlling for case-control imbalance and sample relatedness in large-scale genetic association studies. Nat. Genet. 50, 1335-1341 (2018).
  2. Gogartsen, S. M. et al. Genetic association testing using the GENESIS R/Bioconductor package. Bioinformatics 35, 5346-5348 (2019).
  3. Cook, J. P., Mahajan, A. & Morris, A. P. Guidance for the utility of linear models in meta-analysis of genetic association studies of binary phenotypes. Eur. J. Hum. Genet. 25, 240-245 (2017).
  4. Willer, C. J., Li, Y. & Abecasis, G. R. METAL: fast and efficient meta-analysis of genomewide association scans. Bioinformatics 26, 2190-2191 (2010).
  5. Gen-ABEL project. GitHub https://github.com/GenABEL-Project/ GenABEL (2022).
  6. Yang, J. et al. Genomic inflation factors under polygenic inheritance. Eur. J. Hum. Genet. 19, 807-812 (2011).
  7. Freedman, M. L. et al. Assessing the impact of population stratification on genetic association studies. Nat. Genet. 36, 388-393 (2004).
  8. Pan-UK Biobank. Broad Institute https://pan.ukbb.broadinstitute. org (2020).
  9. Bulik-Sullivan, B. K. et al. LD score regression distinguishes confounding from polygenicity in genome-wide association studies. Nat. Genet. 47, 291-295 (2015).
  10. Yang, J., Lee, S. H., Goddard, M. E. & Visscher, P. M. GCTA: a tool for genome-wide complex trait analysis. Am. J. Hum. Genet. 88, 76-82 (2011).
  11. Yang, J. et al. Conditional and joint multiple-SNP analysis of GWAS summary statistics identifies additional variants influencing complex traits. Nat. Genet. 44, 369-375 (2012).
  12. Development Core Team. : a language and environment for statistical computing (R Foundation for Statistical Computing, 2017).
  13. Wickham, H. in ggplot2: Elegant Graphics for Data Analysis (ed. Wickham, H.) 241-253 (Springer International, 2016).
  14. Turner, D. S. qqman: an R package for visualizing GWAS results using Q-Q and manhattan plots. J. Open Source Softw. 3, 731 (2018).
  15. Kassambara, A. Ggpubr:’ggplot2′ based publication ready plots, R package version 0.6.0 (2023).
  16. Gormley, P. et al. Meta-analysis of 375,000 individuals identifies 38 susceptibility loci for migraine. Nat. Genet. 48, 856-866 (2016).
  17. Kanai, M. et al. Meta-analysis fine-mapping is often miscalibrated at single-variant resolution. Cell Genomics 14, 100210 (2022).
  18. Chen, W. et al. Improved analyses of GWAS summary statistics by reducing data heterogeneity and errors. Nat. Commun. 12, 7117 (2021).
  19. Giambartolomei, C. et al. Bayesian test for colocalisation between pairs of genetic association studies using summary statistics. PLoS Genet. 10, e1004383 (2014).
  20. Schubert, R. et al. Protein prediction for trait mapping in diverse populations. PLoS ONE 17, e0264341 (2022).
  21. Shang, L. et al. Genetic architecture of gene expression in European and African Americans: an eQTL mapping study in GENOA. Am. J. Hum. Genet. 106, 496-512 (2020).
  22. Zhang, J. et al. Plasma proteome analyses in individuals of European and African ancestry identify cis-pQTLs and models for proteome-wide association studies. Nat. Genet. 54, 593-602 (2022).
  23. Võsa, U. et al. Large-scale cis- and trans-eQTL analyses identify thousands of genetic loci and polygenic scores that regulate blood gene expression. Nat. Genet. 53, 1300-1310 (2021).
  24. Zhang, H. et al. Genome-wide association study identifies 32 novel breast cancer susceptibility loci from overall and subtype-specific analyses. Nat. Genet. 52, 572-581 (2020).
  25. Mägi, R. et al. Trans-ethnic meta-regression of genome-wide association studies accounting for ancestry increases power for discovery and improves fine-mapping resolution. Hum. Mol. Genet. 26, 3639-3650 (2017).
  26. Watanabe, K., Taskesen, E., van Bochoven, A. & Posthuma, D. Functional mapping and annotation of genetic associations with FUMA. Nat. Commun. 8, 1826 (2017).
  27. de Leeuw, C. A., Mooij, J. M., Heskes, T. & Posthuma, D. MAGMA: generalized gene-set analysis of GWAS data. PLoS Comput. Biol. 11, e1004219 (2015).
  28. Sey, N. Y. A. et al. A computational tool (H-MAGMA) for improved prediction of brain-disorder risk genes by incorporating brain chromatin interaction profiles. Nat. Neurosci. 23, 583-593 (2020).
  29. Gusev, A. et al. Integrative approaches for large-scale transcriptome-wide association studies. Nat. Genet. 48, 245-252 (2016).
  30. TWAS/FUSION project. Gusev Lab http://gusevlab.org/projects/ fusion/ (2022).
  31. Dataset summary of analysis samples. GTEx Portal https:// gtexportal.org/home/tissueSummaryPage (2019).
  32. Gaspar, H. A. et al. Using genetic drug-target networks to develop new drug hypotheses for major depressive disorder. Transl. Psychiatry 9, 117 (2019).
  33. Gerring, Z. F., Gamazon, E. R. & Derks, E. M., Major Depressive Disorder Working Group of the Psychiatric Genomics Consortium. A gene co-expression network-based analysis of multiple brain tissues reveals novel genes and molecular pathways underlying major depression. PLoS Genet. 15, e1008245 (2019).
  34. Pain, O. TWAS-plotter: R script to make Manhattan-style plot for TWAS. GitHub ().
  35. GeneCards. The GeneCards Human Gene Database https://www. genecards.org/ (2023)
  36. ChEMBL database. European Bioinformatics Institute https://www. ebi.ac.uk/chembl/ (2023).
  37. Wishart, D. S. in Principles of Pharmacogenetics and Pharmacogenomics (eds. Altman, R. B., Flockhart, D. & Goldstein, D. B.) 55-65 (Cambridge Univ. Press, 2012).
  38. Mendelian randomization with GWAS summary data. GitHub https://mrcieu.github.io/TwoSampleMR/index.html (2020).
  39. Hemani, G. et al. The MR-Base platform supports systematic causal inference across the human phenome. eLife 7, e34408 (2018).
  40. Turcot, V. et al. Protein-altering variants associated with body mass index implicate pathways that control energy intake and expenditure in obesity. Nat. Genet. 50, 26-41 (2018).
  41. Chen, J. et al. The trans-ancestral genomic architecture of glycemic traits. Nat. Genet. 53, 840-860 (2021).
  42. Graham, S. E. et al. The power of genetic diversity in genome-wide association studies of lipids. Nature 600, 675-679 (2021).
  43. Sakaue, S. et al. A cross-population atlas of genetic associations for 220 human phenotypes. Nat. Genet. 53, 1415-1424 (2021).
  44. Bowden, J. et al. A framework for the investigation of pleiotropy in two-sample summary data Mendelian randomization. Stat. Med. 36, 1783-1802 (2017).
  45. Verbanck, M., Chen, C.-Y., Neale, B. & Do, R. Detection of widespread horizontal pleiotropy in causal relationships inferred from Mendelian randomization between complex traits and diseases. Nat. Genet. 50, 693-698 (2018).

الشكر والتقدير

نحن ممتنون لجميع المشاركين الذين شاركوا في الدراسات ونُقر بالمحققين المشاركين في الدراسات المشاركة. نشكر جميع أعضاء مختبر UCL HumGen (https://www. uclhumgen.com/)، الذين قدموا دعماً نقدياً واقتراحات. نشكر أ. هنري، كلية الجامعة بلندن، على المناقشات والاقتراحات في تقنيات التحليل الرئيسية. تم إجراء هذا العمل على مجموعة علوم الحاسوب في كلية الجامعة بلندن؛ نشكر فريق المجموعة على الدعم المقدم. أهم شكر لمشروع بنك الصين الكادوري هو للمشاركين في الدراسة. كما يثمن الباحثون المساهمات القيمة لأعضاء فرق المسح في كل من المراكز الإقليمية العشرة، وفرق تطوير وإدارة المشروع في بكين، وأكسفورد، والمراكز الإقليمية العشرة. يوفر التأمين الصحي الوطني في الصين الربط الإلكتروني لجميع العلاجات في المستشفيات. يشكر تجمع مسح الصحة النفسية للمراهقين في المكسيك كل من سي. بينجيت وإي. مينديز على مساهماتهما في جمع وتنظيم بيانات تجمع مسح الصحة النفسية للمراهقين في المكسيك على التوالي. يشكر دراسة الصحة للمتدربين الأطباء على مشاركة الأطباء المتدربين في الدراسة. تم تمويل هذا المشروع من قبل المعهد الوطني للصحة النفسية (رقم المنحة R01MH101459). يشكر مشروع MVP المحاربين القدامى الذين يشاركون في MVP. من قسم الطب النفسي بجامعة ييل، قسم علم الوراثة البشرية، نشكر ونعترف بجهود أ. م. لاكوبيل، سي. روبنسون وسي. تايريل. التمويل: تم دعم هذا العمل بتمويل من مكتب شؤون المحاربين القدامى للبحوث والتطوير بمنحة MVP رقم CX001849-01 (MVP025) وبرنامج الدراسات التعاونية VA CSP575B. تم دعم د. ف. ل. بمنحة الباحث الشاب من NARSAD من مؤسسة أبحاث الدماغ والسلوك. استخدمت دراسة BioVU للتحليلات الموصوفة بيانات من مركز فاندر بيلت الطبي BioVU، الذي يدعمه العديد من المصادر: التمويل المؤسسي، الوكالات الخاصة والمنح الفيدرالية. وتشمل هذه منحة المعدات المشتركة الممولة من المعاهد الوطنية للصحة (NIH) رقم S10RR025141؛ ومنح جوائز العلوم السريرية والترجمية UL1TR002243، UL1TR000445 وUL1RRO24975. كما تدعم البيانات الجينومية مشاريع يقودها الباحثون تشمل U01HG004798، R01NS032830، RC2GM092618، P50GM115305، U01HG006378، U19HL065962 وR01HD074711؛ ومصادر تمويل إضافية مدرجة في https://victr.vumc.org/biovu-funding/. مؤلفو CONVERGE هم جزء من اتحاد CONVERGE (الصين، جامعة أكسفورد وجامعة فرجينيا كومنولث للأبحاث التجريبية في علم الأوبئة الوراثية) ويعربون عن امتنانهم لدعم جميع الشركاء في المستشفيات عبر الصين. شكر خاص لجميع المتعاونين والمرضى في CONVERGE الذين جعلوا هذا العمل ممكنًا. اتحاد CONVERGE: ن. كاي، ت. ب. بيجدلي، و. كريتزشمار، ي. لي، ج. ليانغ، ل. سونغ، ج. هو، ك. لي، و. جين، ز. هو، ج. وانغ، ل. وانغ، ب. تشيان، ي. ليو، ت. جيانغ، ي. لو، إكس. تشانغ، ي. يين، ي. لي، إكس. شو، ج. جاو، م. ريمرز، ت. ويب، ب. رايلي، س. باكانو، ر. إ. بيترسون، ي. تشن، هـ. تشونغ، ز. ليو، ج. وانغ، ج. صن، هـ. سانغ، ج. جيانغ، إكس. تشو، ي. لي، ي. لي، و. تشانغ، إكس. وانغ، إكس. فانغ، ر. بان، ج. مياو، ك. تشانغ، ج. هو، ف. يو، ب. دو، و. سانغ، ك. لي، ج. تشن، م. كاي، ل. يانغ، د. يانغ، ب. ها، إكس. هونغ، هـ. دينغ، ج. لي، ك. لي، ي. سونغ، س. جاو، ج. تشانغ، ز. جان، هـ. مينغ، ج. بان، س. جاو، ك. تشانغ، ن. صن، ي. لي، ك. نيو، ي. تشانغ، ت. ليو، س. هو، ز. تشانغ، ل. لو، ج. دونغ، إكس. وانغ، م. تاو، إكس. وانغ، ج. شيا، هـ. رونغ، ك. هي، ت. ليو، ج. هوانغ، ك. مي، ز. شين، ي. ليو، ج. شين، ت. تيان، إكس. ليو، و. وو، د. جو، ج. فو، ج. شي، ي. تشن، إكس. جان، ل. ليو، ل. وانغ، ف. يانغ،
إي. كونغ، ج. مارشيني، هـ. يانغ، ج. وانغ، س. شي، ر. موت، ك. شو، ج. وانغ، ك. س. كيندلر وج. فلينت. تعرب AGDS عن امتنانها لجميع المشاركين الذين منحوا وقتهم للمساهمة في هذه الدراسة. نشكر جميع الأشخاص الذين ساعدوا في التصور والتنفيذ وحملة الإعلام وتنظيف البيانات. نشكر ر. باركر، س. كروس ول. سوليفان على عملهم القيم في تنسيق جميع الجوانب الإدارية والتشغيلية لمشروع AGDS. تشكر دراسة 23andMe المشاركين في البحث وموظفي 23andMe لجعل هذا العمل ممكنًا. تشكر Genes and Health منظمة Social Action for Health، ومركز Cell، وأعضاء مجموعة الاستشارات المجتمعية، والموظفين الذين قاموا بتجنيد وجمع البيانات من المتطوعين. نشكر المركز الوطني للعينات البيولوجية التابع لـ NIHR (UK Biocentre)، ومركز الطب النفسي الاجتماعي والتنموي الوراثي (كلية كينغز لندن)، ومعهد ويلكوم سانجر، ومعهد برود على معالجة العينات، والتصنيف الجيني، والتسلسل، وتوصيف المتغيرات. نشكر مؤسسة Barts Health NHS Trust، ومجموعات تفويض الخدمات السريرية NHS (City and Hackney، Waltham Forest، Tower Hamlets، Newham، Redbridge، Havering، Barking and Dagenham)، ومؤسسة East London NHS Foundation Trust، ومستشفيات Bradford Teaching Hospitals NHS Foundation Trust، والصحة العامة في إنجلترا (وخاصة د. وايلي)، وخدمة بيانات الاكتشاف/مؤسسة Endeavour Health الخيرية (وخاصة د. ستابلز) لمشاركة البيانات المتوافقة مع اللائحة العامة لحماية البيانات بدعم من الموافقة الخطية الفردية المستنيرة. وقبل كل شيء، نشكر جميع المتطوعين المشاركين في Genes and Health. تحتوي الجداول التكميلية 17-21 على القائمة الكاملة لأعضاء مجموعة عمل PGC-MDD، وفريق أبحاث 23andMe، وفريق أبحاث Genes and Health، ومجموعة التعاون في بنك الصين كادوري، ومشروع BioBank اليابان. هذه الدراسة جزء من مشروع تلقى تمويلاً من المجلس الأوروبي للأبحاث ضمن برنامج أفق 2020 للبحث والابتكار التابع للاتحاد الأوروبي (اتفاقية المنحة رقم 948561) ومن مؤسسة ويلكوم (212360/Z/18/Z). تم دعم الحوسبة من قبل مجلس أبحاث التكنولوجيا الحيوية والعلوم البيولوجية (BB/R01356X/1). يدعم D.K. زمالة MSCA الفردية، المفوضية الأوروبية (101028810). يدعم G.N. مجلس أبحاث التكنولوجيا الحيوية والعلوم البيولوجية، رقم المنحة BB/MOO9513/1. يدعم R.P. منح من المعاهد الوطنية للصحة NIH (R33 DA047527؛ R21 DC018098) وجائزة One Mind Rising Star. يدعم G.A.P. برنامج تدريب العلوم البيولوجية في جامعة ييل (T32 MH014276). يدعم P.-H.K. مشروع وزارة العلوم والتكنولوجيا (MOST 108-2314-B-002-136-MY3)، ومشروع المعاهد الوطنية للصحة (NHRI-EX106-10627NI)، ومشروع تطوير المسيرة المهنية في جامعة تايوان الوطنية (109L7860). يدعم A.M.M. منح من مؤسسة ويلكوم (226770/Z/22/Z، 223165/Z/21/Z، 220857/Z/20/Z و216767/Z/19/Z)، والابتكار والبحوث في المملكة المتحدة (MR/SO35818/1 وMR/WO14386/1)، والمعاهد الوطنية للصحة الأمريكية NIH (R01MH124873)، وبرنامج أفق 2020 للاتحاد الأوروبي (اتفاقية المنحة 847776). يدعم M.J.A. منح من مؤسسة ويلكوم (104036/Z/14/Z و220857/Z/20/Z). تم تمويل AGDS بشكل أساسي من قبل المجلس الوطني للصحة والبحوث الطبية في أستراليا NHMRC، منحة رقم 1086683. تم دعم هذا العمل أيضًا بمنح NHMRC 1145645، 1078901، 1113400 و1087889 والمعهد الوطني للصحة النفسية NIMH. تم تمويل دراسة QSkin من قبل NHMRC (أرقام المنح 1073898، 1058522 و1123248). يدعم N.G.M. منحة باحث NHMRC رقم 1172990. يدعم W.E. منحة المعهد الوطني لتعاطي المخدرات R01DA009897. تم تمويل CONVERGE من قبل مؤسسة ويلكوم (WT090532/Z/09/Z، WT083573/Z/07/Z وWT089269/Z/09/Z) ومنحة NIH رقم MH100549. تم دعم K.S.K. من قبل NIMH R01MH125938 وR21MH126358. تم دعم R.E.P. من قبل NIMH R01MH125938، R21MH126358 ومؤسسة أبحاث الدماغ والسلوك NARSAD منحة 28632P&S Fund. يدعم L.K.D. تمويل R01 MH118223. يدعم R.J.U.، R.C.K. وM.B.S. وزارة الدفاع الأمريكية. تم دعم J.G. ودراسة MVP من قبل مكتب شؤون المحاربين القدامى للبحوث والتطوير بمنحة MVP رقم CX001849-01 (MVP025) و…
برنامج الدراسات التعاونية لوزارة شؤون المحاربين القدامى CSP575B. يتم دعم S.S. بواسطة R01MH101459. يتم دعم M.U. وD.E.W. وA.E.A. بواسطة 2R01MD011728. يتم دعم C.S.C.-F. بواسطة مؤسسة كوهين لعلوم المحاربين القدامى، المعهد الوطني للطب النفسي في المكسيك، المجلس الوطني للعلوم والتكنولوجيا في المكسيك. دراسة صحة المجتمع الهسباني / دراسة اللاتينيين هي دراسة تعاونية مدعومة بعقود من المعهد الوطني للقلب والرئة والدم (NHLBI) إلى جامعة نورث كارولينا (HHSN2682013000011/N01-HC-65233)، جامعة ميامي (HHSN268201300004I/N01-HC-65234)، كلية ألبرت أينشتاين للطب (HHSN268201300002I/N01-HC-65235)، جامعة إلينوي في شيكاغو (HHSN268201300003I/ NO1-HC-65236 جامعة نورث وسترن) وجامعة ولاية سان دييغو (HHSN268201300005I/N01-HC-65237). المعاهد/المراكز/المكاتب التالية ساهمت في HCHS/SOL من خلال تحويل أموال إلى NHLBI: المعهد الوطني لصحة الأقليات والفوارق الصحية، المعهد الوطني للصمم واضطرابات التواصل الأخرى، المعهد الوطني لأبحاث الأسنان والوجه والفكين، المعهد الوطني للسكري وأمراض الجهاز الهضمي والكلى، المعهد الوطني للاضطرابات العصبية والسكتة الدماغية، مكتب المكملات الغذائية في المعاهد الوطنية للصحة. مركز التحليل الجيني في جامعة واشنطن تم دعمه بعقود من NHLBI وNIDCR (HHSN268201300005C AMO3 وMODO3). كما تلقت دراسة صحة المجتمع الهسباني / دراسة اللاتينيين دعمًا من جائزة المعاهد الوطنية للصحة (R01MH113930). يتم دعم B.S.M. وW.E. بواسطة NIDA. يتم دعم J.A.R. وG.U. بواسطة NIDA وNIA وVA وجامعة ماريلاند ونظام الرعاية الصحية VA في ماريلاند ومؤسسة بحوث وتعليم بالتيمور. تم دعم المسح الأساسي لسجل الصين كادوري وإعادة المسح الأولى بواسطة مؤسسة كادوري الخيرية في هونغ كونغ. تم دعم المتابعة طويلة الأمد بواسطة مؤسسة ويلكوم ترست (212946/Z/18/Z، 202922/Z/16/Z، 104085/Z/14/Z و088158/Z/09/Z)، البرنامج الوطني الرئيسي للبحوث والتنمية في الصين (2016YFC0900500، 2016YFC0900501، 2016YFC0900504 و2016YFC1303904) والمؤسسة الوطنية للعلوم الطبيعية في الصين (91843302). تم تمويل استخراج الحمض النووي والتصنيف الجيني بواسطة شركة جلاكسو سميث كلاين، والمجلس الطبي البريطاني (MC-PC-13049 وMC-PC-14135). يتم دعم سجل الصين كادوري بتمويل أساسي من المجلس الطبي البريطاني (MC_UU_00017/1، MC_UU_12026/2 وMC_U137686851)، أبحاث السرطان في المملكة المتحدة (C16077/A29186 وC500/A16896) ومؤسسة القلب البريطانية (CH/1996001/9454) إلى وحدة خدمة التجارب السريرية ووحدة الدراسات الوبائية وإلى وحدة أبحاث صحة السكان التابعة للمجلس الطبي البريطاني في جامعة أكسفورد. تم تمويل مشروع “جينز آند هيلث” مؤخرًا بتمويل أساسي من ويلكوم (WT102627 وWT210561)، المجلس الطبي البريطاني (UK) (M009017)، مجلس تمويل التعليم العالي لإنجلترا Catalyst، جمعية بارتس الخيرية (845/1796)، أبحاث بيانات الصحة في المملكة المتحدة (لموقع لندن الرئيسي) ودعم تنفيذ الأبحاث من شبكة البحوث السريرية التابعة للمعهد الوطني للصحة في NHS (شمال تيمز). تم تمويل “جينز آند هيلث” مؤخرًا بواسطة شركة ألنيلام للأدوية، جينوميكس PLC؛ واتحاد صناعة علوم الحياة من شركة بريستول مايرز سكويب، جلاكسو سميث كلاين للأبحاث والتطوير المحدودة، ميز ثيرابيوتيكس إنك، ميرك شارب آند دوهم LLC، نوفو نورديسك A/S، فايزر إنك، مركز تطوير تاكيدا الأمريكيتين إنك. يتم تمويل C.M.L. وJ.R.I.C. جزئيًا من قبل مركز أبحاث الطب الحيوي NIHR ماودسلي في مؤسسة NHS ساوث لندن وماودسلي ومستشفى كينغز كوليدج لندن (NIHR2O3318). البحث المبلغ عنه في هذا المنشور تم دعمه من قبل المعهد الوطني للصحة العقلية التابع للمعاهد الوطنية للصحة تحت رقم الجائزة R01MH124873. تم إجراء التحليلات الإحصائية على جهاز الحوسبة العنقودية الجينية (“http://www. geneticcluster.org) استضافتها SURFsara وبدعم مالي من المنظمة العلمية الهولندية (NWO 480-05-003 الباحث الرئيسي: بوستهوما) إلى جانب دعم إضافي من مؤسسة الدماغ الهولندية وجامعة VU أمستردام.

مساهمات المؤلفين

تولى ك.ك. تصور هذا المشروع والإشراف على العمل. كتب كل من إكس.م.، ج.ن. وك.ك. المخطوطة وقاموا بمراجعتها نقدياً. قام سي.م.ل. بمراجعة المخطوطة نقدياً. أجرى إكس.م. وأو.ج. تحليل GWAS على مستوى الدراسة. قام ي. فنغ بإجراء التحليل التلوي للدراسات ذات الأصول الأفريقية. أجرى إكس.م. جميع التحليلات التلوية، وتحديد المواقع والـ SNPs المستقلة، والتخطيط الدقيق والتعليق بما في ذلك FUMA وMAGMA وHi-C MAGMA. أجرى إكس.م. وج.ن. تحليلات القابلية للنقل. قام ج.ن. بتحليل TWAS وأجرى البحث عن أهداف الأدوية. أجرى د.ك. ور.ب. تحليل MR. أجرى ج.أ.ب. ور.ب. تحليل QTL والتوطين المشترك. كتب ج.ن.، إكس.م. وك.ك. وصف الدراسات (الملاحظة التكميلية) وقاموا بمراجعتها. قدم أ.م. الدعم للتحليلات وتفسير النتائج. ساهم م.ف. وسي.-ي.س. في صياغة وتحرير المخطوطة. بالنسبة لـ MVP، ج.ج. وم.ب.س. هما الباحثان الرئيسيان؛ شارك ج.م.ج. ود.ف.ل. في إعداد البيانات. بالنسبة لمستودع الصين كادوري، ز.س. ول.ل. هما الباحثان الرئيسيان؛ ر.ج.و. هو قائد الجينوميات؛ شارك ر.ج.و. وإي.ي.م. في جمع البيانات؛ أجرى ر.ج.و. وك.ل. مراقبة الجودة وتحليل الارتباط الجيني على مستوى الجينوم؛ أجرى ك.ل. تعويض النمط الجيني. بالنسبة لـ Genes and Health، د.أ.ف.ه. هو الباحث الرئيسي؛ شارك ب.ت.، س.ف.، ن.ب.، هـ.س.م.، ف.ك.س. وك.ق.هـ. في جمع البيانات والتحليل. بالنسبة لمجموعة دراسة GREAT، ب.-هـ.ك. هو الباحث الرئيسي؛ شارك هـ.-س.س.، س.-ج.ت. وي.-ل.ل. في جمع البيانات والتحليل. بالنسبة لـ AGDS، ن.ج.م. وإي.م.ب. هما الباحثان الرئيسيان؛ أجرى ب.ل.م. تحليل البيانات. بالنسبة لـ CONVERGE، ك.س.ك. هو الباحث الرئيسي؛ شارك ر.إ.ب. ون.س. في جمع البيانات والتحليل. بالنسبة لـ BioVU، ل.ك.د. هو الباحث الرئيسي؛ شارك ك.إ.ف.أ. في جمع البيانات والتحليل. بالنسبة لـ Army STARRS، ر.ج.أ. وم.ب.س. هما الباحثان الرئيسيان، وشارك ر.س.ك. في جمع البيانات والإعداد. بالنسبة لدراسة Intern Health، س. سين هو الباحث الرئيسي؛ شارك ي. فانغ، ل.ج.س. وم.ب. في جمع البيانات والإعداد. بالنسبة لـ BioMe، ر.ج.ف.ل. هو الباحث الرئيسي وشارك م.هـ.ب. في جمع البيانات والتحليل. بالنسبة لـ 23 andMe، شارك ي.ج. وت.ت. في جمع البيانات والتحليل. بالنسبة لدراسة Drakenstein Child Health، د.ج.س. وه.ج.ز. هما الباحثان الرئيسيان؛ شارك م.ل.س. ون.ك. في جمع البيانات والإعداد. بالنسبة لدراسة Detroit Neighborhood Health، م.أ. هو الباحث الرئيسي؛ شارك أ.هـ.و.، د.إ.و. وأ.إ.أ. في جمع البيانات والإعداد. بالنسبة لدراسة Mexican Adolescent Mental Health Survey Cohort، س.س.ك.-ف. هو الباحث الرئيسي؛ شارك ج.أ.م.-ل.، م.إ.ر. وأ.إ.س. في جمع البيانات والتحليل. بالنسبة لدراسة Hispanic Community Health Study/Study of Latinos، إ.س.د. وس.و.-س. هما الباحثان الرئيسيان؛ شارك ت.س. في جمع البيانات والتحليل. بالنسبة لتجربة PIRC الجيل الأول، و.إ. هو الباحث الرئيسي؛ شارك ج.أ.ر.، ب.س.م. وج.أ. في جمع البيانات والتحليل. بالنسبة لمشروع BioBank اليابان، ي.أ. هو الباحث الرئيسي؛ شارك م.ك. وس. ساكاوي في جمع البيانات والتحليل. بالنسبة لـ PGC-MDD، ساهم كل من سي.م.ل.، س.أ.، ج.ر.إ.س.، أ.م.م.، م.ج.أ.، س.ك. وس.ر. في دراسة PGC-MDD للأصول الأوروبية. قرأ جميع المؤلفين المخطوطة وراجعواها نقدياً وقدموا مساهمات فكرية كبيرة للدراسة. وافق جميع المؤلفين على المخطوطة.

المصالح المتنافسة

يعمل O.G. الآن كموظف بدوام كامل في شركة Union Chimique Belge. يعمل A.I.C. حالياً في شركة Regeneron Pharmaceuticals وقد يمتلك أسهماً أو خيارات أسهم. أبلغ C.T. عن كونه موظفاً ويتلقى خيارات أسهم من شركة 23 and Me أثناء إجراء الدراسة. أبلغ Y.J. عن كونه موظفاً في 23 and Me خارج العمل المقدم. يعلن جميع المؤلفين الآخرين عدم وجود مصالح متنافسة.

معلومات إضافية

البيانات الموسعة متاحة لهذا البحث على
https://doi.org/10.1038/s41588-023-01596-4.
معلومات تكميلية النسخة الإلكترونية تحتوي على مواد تكميلية متاحة علىhttps://doi.org/10.1038/s41588-023-01596-4.
يجب توجيه المراسلات وطلبات المواد إلى كارولين كوشنبايكر.
معلومات مراجعة الأقران تشكر مجلة Nature Genetics وووجاي ميونغ والمراجع(ين) الآخرين المجهولين على مساهمتهم في مراجعة الأقران لهذا العمل. تقارير مراجعة الأقران متاحة.
معلومات إعادة الطبع والأذونات متاحة علىwww.nature.com/reprints.
الشكل البياني الموسع 1 | مخططات مانهاتن للارتباطات الجينية مع الاكتئاب الكبير في الأنساب غير الأوروبية. الــ” -المحاور تظهر القيم للارتباطات بين كل تعدد أشكال نوكليوتيد مفرد والاكتئاب الكبير. ال -المحاور تُظهر الموقع الكروموسومي (GRCh37). الخط الأحمر يمثل عتبة الدلالة على مستوى الجينوم بأكمله والخط الأزرق . أ، مخطط مانهاتن للأصول الأفريقية. بسبب القيد الذي ينص على ضرورة توفر المتغيرات الجينية المفردة (SNPs) في دراستين على الأقل، كانت النتائج متاحة فقط لـ 6,051 متغيرًا
على كروموسوم X. ب، مخطط مانهاتن للأصل الآسيوي الشرقي. ج، مخطط مانهاتن للأصل الأمريكي اللاتيني. الارتباط تم تعديل القيم بواسطة تقاطع LDSC البالغ 1.0508. د، مخطط مانهاتن للأصل الجنوب آسيوي. قدمت مجموعة واحدة فقط بيانات للمتغيرات على كروموسوم X. لم تُدرج هذه المتغيرات لأن التحليل التلوي يتطلب على الأقل مجموعتين لتوفير بيانات لكل متغير.
الشكل البياني الموسع 2 | مخططات مانهاتن للارتباطات الجينية مع الاكتئاب السريري الرئيسي في الأفراد من أصول غير أوروبية. الــ” -المحاور تظهر القيم للارتباطات بين كل تعدد أشكال نوكليوتيد مفرد والاكتئاب الكبير. ال -المحاور تظهر الكروموسومية
الموضع (GRCh37). الخط الأحمر يمثل الدلالة على مستوى الجينوم بأكمله
عتبة والخط الأزرق . أ، مخطط مانهاتن للأصل الأفريقي. ب، مخطط مانهاتن للأصل شرق آسيوي. ج، مخطط مانهاتن للأصل الأمريكي اللاتيني. د، مخطط مانهاتن للأصل جنوب آسيوي.
الشكل البياني الموسع 3 | مخطط مانهاتن للارتباطات الجينية مع الاكتئاب الكبير في التحليل التلوي متعدد الأنساب. -المحاور تظهر القيم للارتباطات بين كل تعدد شكل نوكليوتيد مفرد و
الاكتئاب الشديد. الـ -المحاور تعرض الموقع الكروموسومي (GRCh37). الخط الأحمر يمثل عتبة الدلالة على مستوى الجينوم بأكمله والخط الأزرق . جمعية تم تعديل القيم بواسطة تقاطع LDSC بمقدار 1.0185.
الشكل البياني الموسع 4 | مخطط مانهاتن للارتباطات الجينية مع الاكتئاب السريري والاكتئاب الكبير. الـ -المحاور تعرض الموقع الكروموسومي (GRCh37). الاكتئاب الرئيسي في التحليل التلوي متعدد الأنساب. الـ -المحاور تظهر أن الخط الأحمر يمثل عتبة الدلالة على مستوى الجينوم بأكمله و قيم الارتباطات بين كل تعدد أشكال نوكليوتيد أحادي الخط الأزرق .

نيتشر بورتفوليو

المؤلف (المؤلفون) المراسل(ون):
كارولين كوشنبايكر
آخر تحديث بواسطة المؤلف(ين): 27 سبتمبر 2023

ملخص التقرير

تتمنى دار نشر نيتشر تحسين قابلية تكرار الأعمال التي ننشرها. يوفر هذا النموذج هيكلًا للاتساق والشفافية في التقرير. لمزيد من المعلومات حول سياسات دار نشر نيتشر، يرجى الاطلاع على سياسات التحرير وقائمة التحقق من سياسة التحرير.

الإحصائيات

بالنسبة لجميع التحليلات الإحصائية، تأكد من وجود العناصر التالية في شرح الشكل، شرح الجدول، النص الرئيسي، أو قسم الطرق.

تم التأكيد

حجم العينة الدقيق لكل مجموعة/حالة تجريبية، معطاة كرقم منفصل ووحدة قياس
بيان حول ما إذا كانت القياسات قد أُخذت من عينات مميزة أو ما إذا تم قياس نفس العينة مرارًا وتكرارًا
الاختبار الإحصائي المستخدم وما إذا كان أحادي الجانب أو ثنائي الجانب
يجب وصف الاختبارات الشائعة فقط بالاسم؛ وصف التقنيات الأكثر تعقيدًا في قسم الطرق.
وصف لجميع المتغيرات المشتركة التي تم اختبارها
وصف لأي افتراضات أو تصحيحات، مثل اختبارات التوزيع الطبيعي والتعديل للمقارنات المتعددة
وصف كامل للمعلمات الإحصائية بما في ذلك الاتجاه المركزي (مثل المتوسطات) أو التقديرات الأساسية الأخرى (مثل معامل الانحدار) والتباين (مثل الانحراف المعياري) أو التقديرات المرتبطة بعدم اليقين (مثل فترات الثقة)
لاختبار الفرضية الصفرية، إحصائية الاختبار (على سبيل المثال ) مع فواصل الثقة، أحجام التأثير، درجات الحرية و القيمة المسجلة أعطِ القيم كقيم دقيقة كلما كان ذلك مناسبًا.
للتحليل البايزي، معلومات حول اختيار التوزيعات الأولية وإعدادات سلسلة ماركوف مونت كارلو
للتصاميم الهرمية والمعقدة، تحديد المستوى المناسب للاختبارات والتقارير الكاملة للنتائج
تقديرات أحجام التأثير (مثل “كوهين”) ، بيرسون )، موضحًا كيف تم حسابها
مجموعتنا على الويب حول الإحصاءات لعلماء الأحياء تحتوي على مقالات حول العديد من النقاط المذكورة أعلاه.

البرمجيات والرمز البرمجي

معلومات السياسة حول توفر شفرة الكمبيوتر

جمع البيانات
تحليل البيانات
جمع البيانات ليس جزءًا من هذه الدراسة. لم يتم استخدام أي برنامج لجمع البيانات.
تم استخدام نماذج التأثير المختلط في تحليل الارتباط لـ CKB وBioME وGenes & Health باستخدام SAIGE (الإصدار 0.36.1، الإصدار 0.37، أو الإصدار 0.39). أجرت دراسة CONVERGE في البداية اختبارات GWA بنموذج التأثير المختلط باستخدام FastLMM (الإصدار 2.06.20130802)، تلتها تحليلات الانحدار اللوجستي باستخدام PLINK لاسترجاع لوغاريتمات الأرجحية (logORs). بالنسبة لدراسة CONVERGE، تم استخدام لوغاريتمات الأرجحية والأخطاء المعيارية من PLINK في التحليل التلوي الخاص بنا. نفذت دراسة HCHS/SOL اختبارات GWA بنموذج التأثير المختلط لضبط بنية السكان والقرابة مع الاكتئاب كمتغير ثنائي، وتم تشغيلها باستخدام GENESIS.
قمنا بتنفيذ تحليلات تلويّة بتأثير ثابت موزونة بالعكس باستخدام METAL (الإصدار 2011-03-25) وتحليل ميتا متعدد الأنساب باستخدام MR-MEGA (الإصدار 0.2).
لتحديد إشارات الارتباط المستقلة، تم تطبيق عملية الاختيار الأمامي والإقصاء الخلفي في برنامج GCTA (الإصدار 1.92.0 بيتا 2) (الأمر ‘cojo-slt’) باستخدام الإحصائيات الملخصة من التحليل التلوي متعدد الأنساب، مع لوحة مرجعية لتغاير الارتباط متعددة الأنساب.
أجرينا التموقع المشترك بين الارتباطات الجينية مع الاكتئاب الرئيسي وتعبير الجينات في أنسجة الدماغ والدم من عينات ذات أصول أوروبية وأفريقية والمشاركين من أصل إسباني/لاتيني باستخدام حزمة coloc في لغة R (الإصدار).
تم أولاً توضيح إحصائية الملخص من التحليل التلوي متعدد الأنساب باستخدام FUMA (الإصدار 1.3.7).
تم تنفيذ تحليلات الارتباط المعتمدة على الجينات باستخدام تحليل التعدد العلامي للتعليقات الجينومية (MAGMA، الإصدار 1.08) وMAGMA المرتبط بتقنية Hi-C (H-MAGMA).
لإجراء دراسة ارتباط عبر النسخ الجيني (TWAS)، تم استخدام برنامج FUSION.
قمنا بإجراء تحليل MR ثنائي الاتجاه لعينة مزدوجة باستخدام حزمة TwoSampleMR في لغة R (الإصدار 0.5.6،https://mrcieu.github.io/TwoSampleMR/index.html).
قمنا بتقدير الارتباطات الجينية عبر الأنساب باستخدام برنامج POPCORN الإصدار 1.029,55,64. تم حساب الارتباطات الزوجية بين كل
بالنسبة للمخطوطات التي تستخدم خوارزميات أو برامج مخصصة تشكل جزءًا أساسيًا من البحث ولكن لم يتم وصفها بعد في الأدبيات المنشورة، يجب توفير البرنامج للمحررين والمراجعين. نحن نشجع بشدة على إيداع الشيفرة في مستودع مجتمعي (مثل GitHub). راجع إرشادات مجموعة Nature لتقديم الشيفرة والبرمجيات لمزيد من المعلومات.

البيانات

معلومات السياسة حول توفر البيانات

يجب أن تتضمن جميع المخطوطات بيان توافر البيانات. يجب أن يوفر هذا البيان المعلومات التالية، حيثما كان ذلك مناسبًا:
  • رموز الوصول، المعرفات الفريدة، أو روابط الويب لمجموعات البيانات المتاحة للجمهور
  • وصف لأي قيود على توفر البيانات
  • بالنسبة لمجموعات البيانات السريرية أو بيانات الطرف الثالث، يرجى التأكد من أن البيان يتوافق مع سياستنا
ستتوفر إحصائيات ملخص دراسات الارتباط الجيني الواسعة النطاق عبر موقع PGC الإلكترونيhttps://www.med.unc.edu/pgc/download-results/. معرف مجموعة البيانات: ‘mdd2023diverse’. لا تسمح 23andMe و WHI و JHS بمشاركة إحصائيات ملخصة على مستوى الجينوم الكامل. سيتم توفير إحصائيات ملخص GWAS الكاملة لمجموعة بيانات الاكتشاف 23andMe من خلال 23andMe للباحثين المؤهلين بموجب اتفاقية مع 23andMe تحمي خصوصية المشاركين في 23andMe. يرجى زيارةhttps://research.23andme.com/collaborate/#dataset-access/لمزيد من المعلومات وللتقدم بطلب للوصول إلى البيانات. يمكن للباحثين التقدم بطلب للوصول إلى WHI وJHS عبر dbgaphttps://www.ncbi.nlm.nih.gov/gap/.

المشاركون في البحوث البشرية

معلومات السياسة حول الدراسات التي تشمل مشاركين بشريين في البحث والجنس والنوع الاجتماعي في البحث.
التقارير عن الجنس والنوع الاجتماعي استخدمنا الجنس البيولوجي في الدراسة. تم تحديده بناءً على النمط الجيني للمشاركين.
خصائص السكان
خصائص السكان للمشاركين عبر دراسات متعددة هي كما يلي:
دراسة CKB: متوسط العمر 52.2 سنة (الانحراف المعياري = 10.7)، مع وجود “ الفئة النسائية.
دراسة CONVERGE: متوسط العمر 46.1 سنة، مع مجموعة مكونة بالكامل من الإناث.
دراسة تايوان: متوسط العمر 49.2 سنة (الانحراف المعياري = 11.3)، و57.5% من الإناث.
دراسة WHI: للأصول المختلفة، متوسط الأعمار كما يلي: 62.7 سنة (الانحراف المعياري=7.5) للآسيويين الشرقيين، 61.5 سنة (الانحراف المعياري=7.1) للأفارقة، و60.3 سنة (الانحراف المعياري=6.7) للأمريكيين من أصل إسباني/لاتيني. المجموعة تتكون من إناث بنسبة 100%.
دراسة IHS: متوسط الأعمار حسب الأصل هو 27.4 سنة (الانحراف المعياري=2.4) للآسيويين الشرقيين، 27.8 سنة (الانحراف المعياري=2.7) للأفارقة، و26.6 سنة (الانحراف المعياري=2.1) للآسيويين الجنوبيين، مع نسب إناث تبلغ 54.8%، 63.3%، و46.9% على التوالي.
دراسة UKB: متوسط الأعمار حسب الأصل هو 52.1 سنة (الانحراف المعياري=7.3) للآسيويين الشرقيين، 50.7 سنة (الانحراف المعياري=7.4) للأفارقة، و53.0 سنة (الانحراف المعياري=8.3) للآسيويين الجنوبيين. تحتوي المجموعة على 72.1%، 61%، و43.8% إناث، على التوالي.
دراسة Army-STARRS: متوسط الأعمار حسب الأصل هو 24.5 سنة (الانحراف المعياري=6.3) للآسيويين الشرقيين، 23.5 سنة (الانحراف المعياري=5.7) للأفارقة، و22.8 سنة (الانحراف المعياري=5.1) للأمريكيين من أصل إسباني/لاتيني، مع نسب إناث تبلغ 12.5%، 21.4%، و15.4% على التوالي.
دراسة BioMe: متوسط العمر 58.9 سنة، مع إناث.
دراسة BBJ: متوسط العمر هو 63.0 سنة، مع إناث.
دراسة AGDS: متوسط العمر 44.1 سنة (الانحراف المعياري=15.1)، مع إناث.
دراسة IHS: متوسط العمر 55.2 سنة (الانحراف المعياري = 12.2)، مع إناث.
دراسة DCHS: متوسط العمر 26.4 سنة (الانحراف المعياري = 5.6)، مع مجموعة مكونة بالكامل من الإناث.
دراسة HCHS/SOL: متوسط العمر 46 سنة (الانحراف المعياري = 14)، مع إناث.
دراسة DNHS: متوسط العمر 53.2 سنة (الانحراف المعياري = 16.6)، مع إناث.
دراسة PIRC: متوسط العمر 29 سنة، مع إناث.
دراسة MAMHS: متوسط العمر هو 14.28 سنة، مع إناث.
دراسة ProMIS: متوسط العمر 28.2 سنة (الانحراف المعياري = 6.3)، مع مجموعة مكونة بالكامل من الإناث.
تُقدَّم تفاصيل إضافية حول خصائص السكان في الجدول التكميلي 1، المعنون بـ “ملخص المجموعة”.
التوظيف نقدم أوصافًا مفصلة للمجموعات الـ 21 المشمولة في هذه الدراسة في المواد التكميلية.
الرقابة الأخلاقية تمت الموافقة على كل مجموعة من المجموعات المشمولة من قبل لجنة مراجعة أخلاقيات ذات صلة وقد قمنا بإدراج التفاصيل في المخطوطة.
يرجى ملاحظة أنه يجب أيضًا تقديم معلومات كاملة حول الموافقة على بروتوكول الدراسة في المخطوطة.

التقارير المتخصصة بالمجال

يرجى اختيار الخيار الأنسب لأبحاثك من الخيارات أدناه. إذا لم تكن متأكدًا، فاقرأ الأقسام المناسبة قبل اتخاذ قرارك.
علوم الحياة
العلوم السلوكية والاجتماعية
العلوم البيئية والتطورية والبيئية
للحصول على نسخة مرجعية من الوثيقة مع جميع الأقسام، انظر إلىnature.com/documents/nr-reporting-summary-flat.pdf

تصميم دراسة علوم الحياة

يجب على جميع الدراسات الكشف عن هذه النقاط حتى عندما يكون الكشف سلبيًا.
حجم العينة لتحديد حجم العينة، جمعنا عدد المشاركين في كل دراسة تم تضمينها في التحليل المعني.
استثناءات البيانات قمنا بتقييد التحليل اللاحق على المتغيرات الجينية التي لديها درجة دقة التقدير (imputation accuracy info score) بمقدار 0.7 أو أعلى وعدد الأليل الفعال (2ماف(1-مف)نR2) بقيمة 50 أو أكثر. بالنسبة للدراسة ذات حجم العينة الصغيرة، طلبنا بدلاً من ذلك تردد الأليل الطفيف لا يقل عن 0.05. تم إعادة ترميز الأليلات للانديلز كـ “I” للأليل الأطول و “D” للأليل الأقصر. تم إزالة الانديلز ذات الأنماط المختلفة في نفس الموضع.
التكرار
تم تضمين جميع مجموعات الحالات والضوابط المتاحة للاكتئاب الشديد في التحليل التلوي الأساسي متعدد الأنساب، ولذلك لا نقوم بإجراء تكرار للمواقع الجينية المهمة التي حددناها من التحليل التلوي متعدد الأنساب في مجموعات مستقلة.
قمنا باختبار تكرار المواقع الجينية التي تم تحديدها سابقًا والمرتبطة بالاكتئاب من الأصول الأوروبية عبر مجموعات ذات أصول غير أوروبية، ويتم وصف ذلك في المخطوطة على أنه قابلية النقل. نضيف مزيدًا من المعلومات كما طلب المحررون.
العشوائية كانت هذه دراسة ارتباط جيني. التوزيع حسب النمط الجيني.
مُعمٍ كانت هذه دراسة ارتباط جيني، أي تصميم رصدي. لذلك لم يتم استخدام التعمية.

التقارير الخاصة بالمواد والأنظمة والأساليب المحددة

نحن نطلب من المؤلفين معلومات حول بعض أنواع المواد، والأنظمة التجريبية، والأساليب المستخدمة في العديد من الدراسات. هنا، يرجى الإشارة إلى ما إذا كان كل مادة أو نظام أو أسلوب مدرج ذو صلة بدراستك. إذا لم تكن متأكدًا مما إذا كان عنصر القائمة ينطبق على بحثك، فاقرأ القسم المناسب قبل اختيار الرد.
المواد والأنظمة التجريبية الطرق
غير متوفر مشارك في الدراسة غير متوفر مشارك في الدراسة
تسلسل ربط البروتين بالحمض النووي (ChIP-seq)
خطوط الخلايا حقيقية النواة
علم الحفريات والآثار
التصوير العصبي القائم على الرنين المغناطيسي
الحيوانات والكائنات الأخرى
البيانات السريرية
البحوث ذات الاستخدام المزدوج المقلقة

  1. البريد الإلكتروني:k.kuchenbaecker@ucl.ac.uk

Journal: Nature Genetics, Volume: 56, Issue: 2
DOI: https://doi.org/10.1038/s41588-023-01596-4
PMID: https://pubmed.ncbi.nlm.nih.gov/38177345
Publication Date: 2024-01-04

Multi-ancestry genome-wide association study of major depression aids locus discovery, fine mapping, gene prioritization and causal inference

Received: 21 July 2022
Accepted: 26 October 2023
Published online: 4 January 2024
(A) Check for updates

A list of authors and their affiliations appears at the end of the paper

Abstract

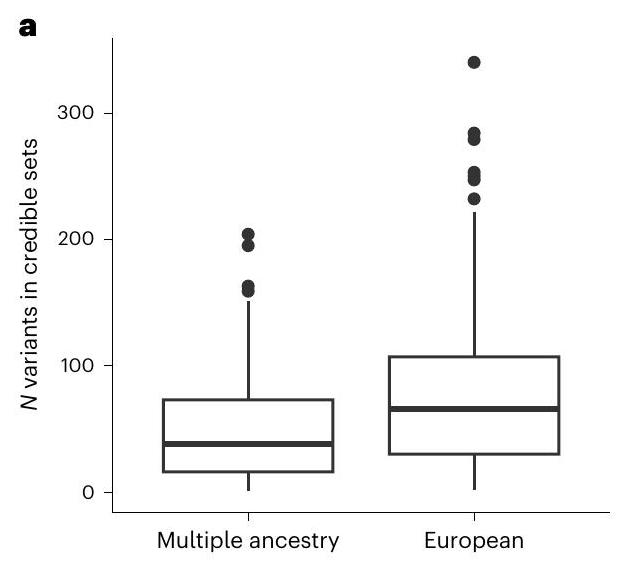
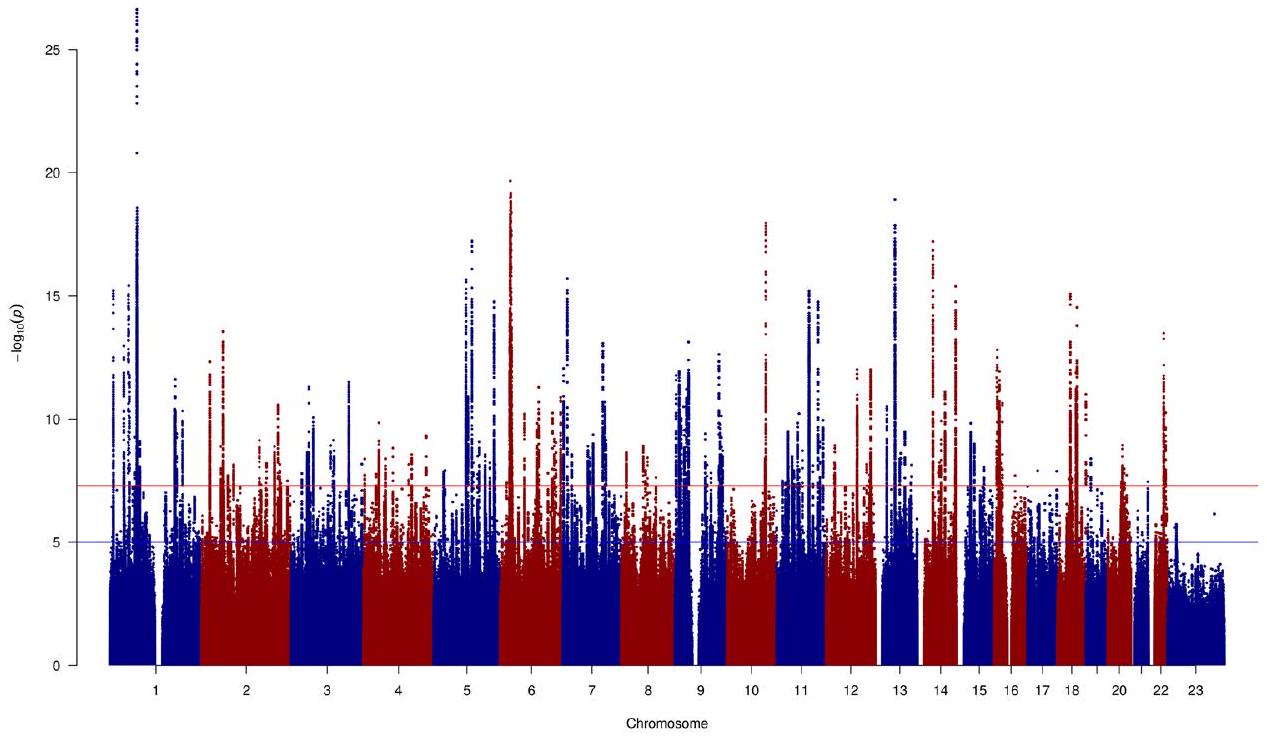
Most genome-wide association studies (GWAS) of major depression (MD) have been conducted in samples of European ancestry. Here we report a multi-ancestry GWAS of MD, adding data from 21 cohorts with 88,316 MD cases and 902,757 controls to previously reported data. This analysis used a range of measures to define MD and included samples of African (36% of effective sample size), East Asian (26%) and South Asian (6%) ancestry and Hispanic/Latin American participants (32%). The multi-ancestry GWAS identified 53 significantly associated novel loci. For loci from GWAS in European ancestry samples, fewer than expected were transferable to other ancestry groups. Fine mapping benefited from additional sample diversity. A transcriptome-wide association study identified 205 significantly associated novel genes. These findings suggest that, for MD, increasing ancestral and global diversity in genetic studies may be particularly important to ensure discovery of core genes and inform about transferability of findings.

Major depression (MD) is one of the most pressing global health challenges . While genome-wide association studies (GWAS) have shown promise of uncovering biological mechanisms underlying the development of , they have revealed a highly polygenic genetic architecture, characterized by variants that individually confer small risk increases , probably due to the heterogeneity of MD symptoms and etiology . Previous genetic research explored the impact of different outcome definitions , sex and trauma exposure on heterogeneity. However, the role of ancestry and ethnicity in the genetics of MD has not yet been systematically evaluated.
So far, GWAS of MD were mostly conducted in individuals of European ancestry . The largest MD GWAS combined data from several studies and identified 223 independent significant single-nucleotide polymorphisms (SNPs) . That study also included data from 59,600 African Americans from the Million Veteran Program (MVP) cohort. In their bi-ancestral meta-analysis, the number of significant SNPs increased to 233. Other MD GWASs were conducted in African American and Hispanic/Latin American participants with limited sample sizes, and did not find variants with statistically significant associations with .
With 10,640 female Chinese participants, the CONVERGE study is the largest MD GWAS conducted outside ‘Western’ countries so far . The study identified two genome-wide significant associations linked to mitochondrial biology and reported a genetic correlation of 0.33 with MD in European ancestry samples . In line with this, our recent work demonstrated that some of the previously identified loci from GWAS conducted in samples of European ancestry are not transferable to samples of East Asian ancestry .
Heterogeneity ingenetic effects could impact on findings when evaluating causal effects of risk factors for MD. Previous studies in samples of European ancestry reported genetic correlations and causal relationships between MD and cardiometabolic outcomes . Notably, our previous study indicated a contradicting direction for associations between MD and body mass index (BMI) in East Asian individuals and European ancestry individuals (positive causal effect of BMI) . Thus, investigating causal relationships using Mendelian randomization (MR) in diverse ancestry groups and in different disease subtypes is important to ensure generalizability and to distinguish between biological and societal mechanisms underlying the relationship between a risk factor and the disease.
Fig.1|Schematic diagram of the analyses in this study. We included data from 21 cohorts with diverse ancestry. We assigned individuals into ancestry/ethnic groups and carried out association analyses with MD for each. Subsequently, we meta-analyzed the results by ancestry/ethnic group. We tested whether previously reported MD loci from European ancestry studies are transferable to these groups. We also used the results for discovery of novel depression associations and MR to assess the causal effects of cardiometabolic traits by
ancestry. We subsequently merged all ancestry/ethnicity-specific results in a multi-ancestry meta-analysis that also included samples with European ancestry. The multi-ancestry meta-analysis results formed the basis for locus discovery, fine mapping to identify causal variants and several gene prioritization approaches to identify genes linked to MD risk. ST. ( ) refers to the corresponding Supplementary Table. ST.2* (in green) refers to Supplementary Table 2, showing genomic inflation estimates of multiple analyses.
Increasing diversity in genetic research is also important to ensure equitable health benefits . In the United States, differences in presentation of MD across ethnic groups can impact on the likelihood of diagnosis . Genetics optimized for European ancestry participants would primarily benefit that group of patients and could therefore further widen the disparities in diagnosis and treatment between groups.
In this Article, we used data from samples with diverse ancestries and carried out genome-wide association meta-analyses, followed by fine mapping and prioritization of target genes (Fig. 1). We assessed the transferability of genetic loci across ancestry groups. Finally, we explored bi-directional causal links between MD and cardiometabolic traits.

Results

GWAS in African, East Asian and South Asian ancestry and Hispanic/Latin American samples

We first conducted GWAS meta-analyses stratified by ancestry/ethnic group. Individuals were assigned to ancestry groups (African, South Asian, East Asian or European) using principal component analyses based on genetic relatedness matrices. Assignment to the Hispanic/ Latin American group was based on self-report or on recruitment in a Latin American country (Supplementary Figs. 1-7) . We acknowledge the arbitrary nature of this approach and of choosing reference groups
and cut-offs to assign participants. However, creating such groups enabled us to look for associations that are specific to groups and to assess the transferability of previously identified loci. The studies included in the meta-analyses used the following measures to define MD: structured clinical interviews, medical healthcare records, symptoms questionnaires and self-completed surveys (Supplementary Table 1 and Supplementary Note).
The analyses included 36,818 MD cases and 161,679 controls of African ancestry, 21,980 cases and 360,956 controls of East Asian ancestry, 4,505 cases and 27,176 controls of South Asian ancestry, and 25,013 cases and 352,946 controls in the Hispanic/Latin American group (Extended Data Fig. 1 and Supplementary Figs. 8-11). To account for the minor inflation found in the Hispanic/Latin American samples ( and linkage disequilibrium score regression (LDSC) intercept 1.051; Supplementary Table 2), we corrected test statistics for this analysis based on the LDSC intercept.
In the Hispanic/Latin American group, the G-allele of rs78349146 at 2 q 24.2 was associated with increased risk of MD (effect allele frequency (EAF) (regression coefficient) , s.e.m. ) (Supplementary Fig. 12). To test the role of these loci in molecular profiles, we performed colocalization for depression and multi-ancestry brain expression quantitative trait loci (eQTLs) . Loci with posterior probability (PP) >90% for both traits being associated and sharing two
Fig. 2 | Transferability of previously reported loci from European ancestry discovery GWAS of MD to other ancestry groups. a, A Venn diagram showing the numbers of previously identified loci from European ancestry studies with evidence of transferability to the other ancestry/ethnic groups: African, Hispanic/Latin American, South Asian and East Asian (in black) and their intersections (in cyan). Only the 112 loci with evidence of transferability to at least one ancestry group are shown here. b, A plot showing power-adjusted transferability (PAT) ratios. We first calculated the observed number of transferable loci out of the 195,196,179 and 180 loci that were present in the
African, Hispanic/Latin American, South Asian and East Asian ancestries, respectively. These were divided by the expected number of transferable loci (numbers displayed underneath the figure), taking effect estimates from previous European ancestry studies, and allele frequency and sample size information from our African, Hispanic/Latin American, South Asian and East Asian ancestry cohorts. The ratios are presented separately for broadly defined MD and clinically ascertained MD. The error bars indicate CIs for PAT ratios. We were unable to compute results for clinical MD in the Hispanic/Latin American group because of insufficient numbers of cases.
different but linked variants (hypothesis (H)3) or a single causal variant (H4) were considered as colocalized. We observed significant colocalization for DPP4, RBMS1 and TANK. We tested ancestry-specific eQTLs from blood and observed RBMS1 (H3: PP (Hispanic/Latin American) 99.12%) and TANK (H3: PP (European) 97.85%; H3: PP (Hispanic/Latin American) ) at the 2 q 24.2 locus. For the protein quantitative trait loci (pQTLs) from blood, we either did not find the genes in the cohort or the number of SNPs within the gene was too low (<20) to test for colocalization (Supplementary Table 3).
No variants were associated at genome-wide significance in the GWAS in samples of African, East and South Asian ancestry (Extended Data Fig.1a,b,d). One locus was suggestively associated in the African ancestry GWAS (Extended Data Fig. 1a and Supplementary Fig.12). The lead variant, rs6902879 (effect allele: A, EAF 0.16, , s.e.m. 0.01, ) at 6 q 16 is located upstream of the melanin-concentrating hormone receptor 2 gene (MCHR2) and associated with increased expression of MCHR2 in cortex based on genotype-tissue expression (GTEx v8) ( ). Testing the multi-ancestry brain eQTLs , we observed significant colocalization for GRIK2 and ASCC3, with significant ancestry differences for ASCC3(H3:PP(European) 99.97%). MCHR2 was not present in the RNA data.
Although the lead variants at 2 q 24.2 and at 6 q 16 did not display strong evidence of association in a large published GWAS in participants of European ancestry ( ), in each case there was an uncorrelated variant within 500 kb of the lead variants associated at (Supplementary Fig. 12). Hence, although the evidence does not support a shared causal variant, we cannot rule out that there is an association at the same locus, but possibly with a different causal variant in European ancestry participants.
As a sensitivity analysis, we conducted a meta-analysis for each ancestry/ethnic group for clinical depression, comprising studies in which MD was ascertained by structured clinical interviews or medical healthcare records following the International Classification of Diseases (ICD9)/10 or the Diagnostic and Statistical Manual of Mental Disorders (DSM)-IV/5 criteria for major depressive disorder (Supplementary Table 1). There were 29,389 cases and 49,999 controls of
African ancestry, 7,886 cases and 14,412 controls of East Asian ancestry, 848 cases and 13,908 controls in the Hispanic/Latin American group, and 4,252 cases and 26,738 controls of South Asian ancestry (Extended Data Fig. 2 and Supplementary Figs. 13-16). In the South Asian ancestry GWAS, the A allele of rs7749931 at 6 q 15 was associated with decreased risk of MD (effect allele: A, EAF 0.49, , s.e.m. 0.03, ) (Extended Data Fig. 2d and Supplementary Fig. 15). The variant is located downstream of STX7 (syntaxin 7). We did not observe genome-wide significant loci associated with clinical depression in any other ancestry group.

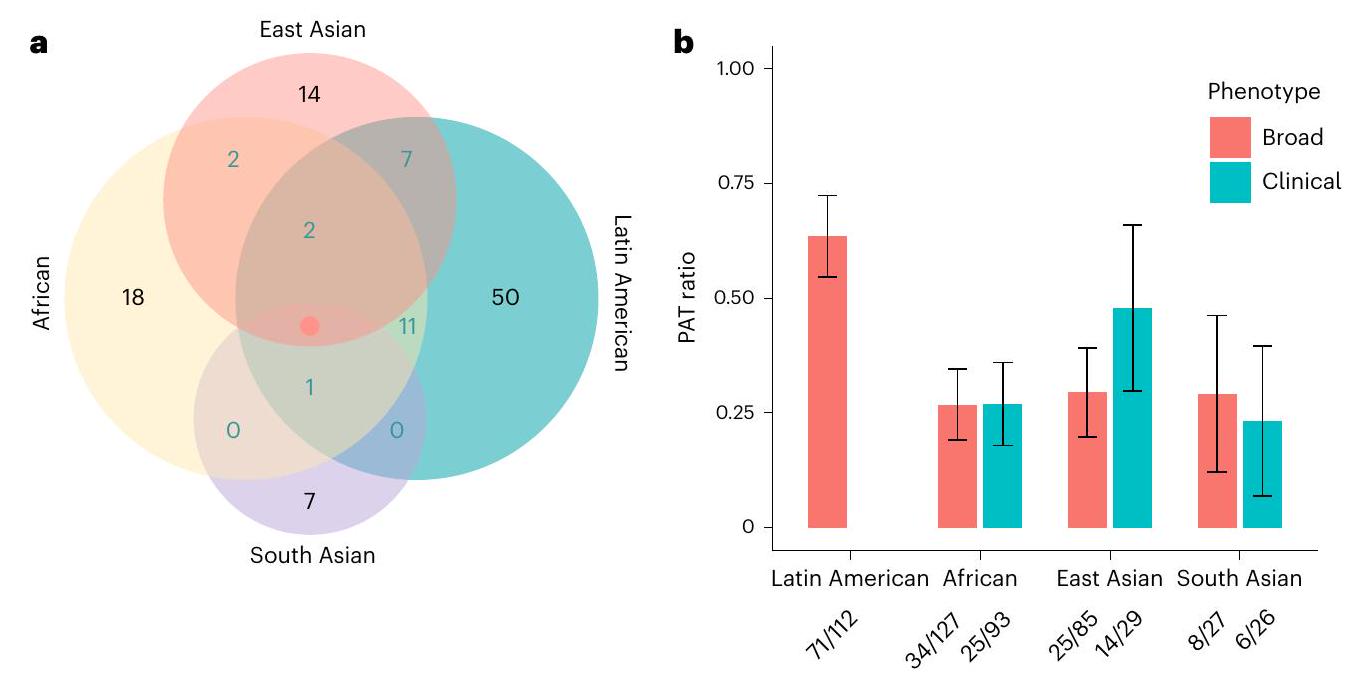
Transferability of MD associations across ancestry groups

Previous GWAS in samples of European ancestry have identified 206 loci associated with MD (Supplementary Table 4) . The results for 196 of these loci were available in at least one of the ancestry/ethnic groups. We assessed whether these genetic associations are shared across different ancestry groups. Individual loci may be underpowered to demonstrate an association; therefore, we followed an approach we recently developed and first estimated the number of loci we expect to see an association for when accounting for sample size ( ), linkage disequilibrium (LD) and minor allele frequency (MAF). This estimate varied widely between ancestry groups, for example, we expected to detect significant associations for 65% of MD loci in the GWAS with samples of African ancestry, but only for 15% of MD loci in samples of South Asian ancestry (Fig. 2). We report the power-adjusted transferability (PAT) ratio, that is, the observed number divided by the expected number of loci. Transferability was low, with PAT ratios of 0.27 (95% confidence interval (CI) 0.19 to 0.35 ) in African ancestry samples, and 0.29 in both East Asian ( CI 0.20 to 0.39) and South Asian ( CI 0.12 to 0.46) ancestry samples. In the Hispanic/Latin American group, the PAT ratio was 0.63 ( CI 0.55 to 0.72 ), notably higher than in the other groups. PAT estimates for clinical MD were close to those for broad MD, with overlapping CIs in each case (Fig. 2). We were unable to estimate PAT ratios for clinical MD in the Hispanic/Latin American group because of insufficient numbers of cases based on this definition. We also assessed the transferability of 102 loci identified in the Psychiatric Genomics
Fig. 3 | Genetic correlations for MD between different ancestry groups. A plot showing the genome-wide genetic correlations between the African, European, East Asian and Hispanic/Latin American groups. The intensity of the coloring reflects the strength of the correlation. The estimated coefficients and standard errors are also shown in each cell. We only present estimates where the s.e.m. was smaller than 0.3; otherwise, the field is colored in gray.
Consortium-Major Depressive Disorder Working Group’s (PGC-MDD) GWAS and in an independent study in samples of European ancestry, the Australian Genetics of Depression Study (AGDS) . The PAT ratio was 1.48, considerably higher than the cross-ancestry PAT estimates. We report evidence of transferability of individual loci (Supplementary Table 5) as well as their ancestry-specific eQTL and pQTL colocalization (Supplementary Table 6 and Supplementary Fig. 17).
In addition, we estimated trans-ancestry genetic correlations using POPCORN version 1.0 (ref. 29). We only present genetic correlation estimates where the s.e.m. was less than 0.3. The sample size for the South Asian ancestry group was too small to conduct this analysis. The genetic correlations for MD between the European and the Hispanic/ Latin American, African and East Asian ancestry groups were . The lowest estimate was observed between the East Asian ancestry, and the Hispanic/Latin American group ( ) (Fig.3).

Multi-ancestry meta-analysis

We carried out a multi-ancestry meta-analysis using data from studies conducted in participants of African, East Asian and South Asian ancestry and Hispanic/Latin American samples (Supplementary Note), and combined them with previously published data for 258,364 cases and 571,252 controls of European ancestry , yielding a total sample size of 345,389 cases and controls. These analyses provided results for SNPs after quality control. There was no evidence of residual population stratification ( , LDSC intercept 1.019; Supplementary Table 2). We identified 190 independent genome-wide significant SNPs mapping to 169 loci that were separated from each other by at least 500 kb (Extended Data Fig. 3, Supplementary Table 7 and Supplementary Fig. 18). Fifty-three of the SNPs represent novel associations ( and located more than from previously reported variants). Most of the 196 previously reported loci were associated at genome-wide significance in the multi-ancestry meta-analysis, which incorporates the discovery data for these loci (Supplementary Table 4).
As a sensitivity analysis, we also conducted a multi-ancestry meta-analysis for clinical depression. There were 57,714 cases and 110,358 controls of European ancestry under the clinical definition of MD, which were subsequently combined with the aforementioned non-European clinically ascertained studies by meta-analysis (100,089
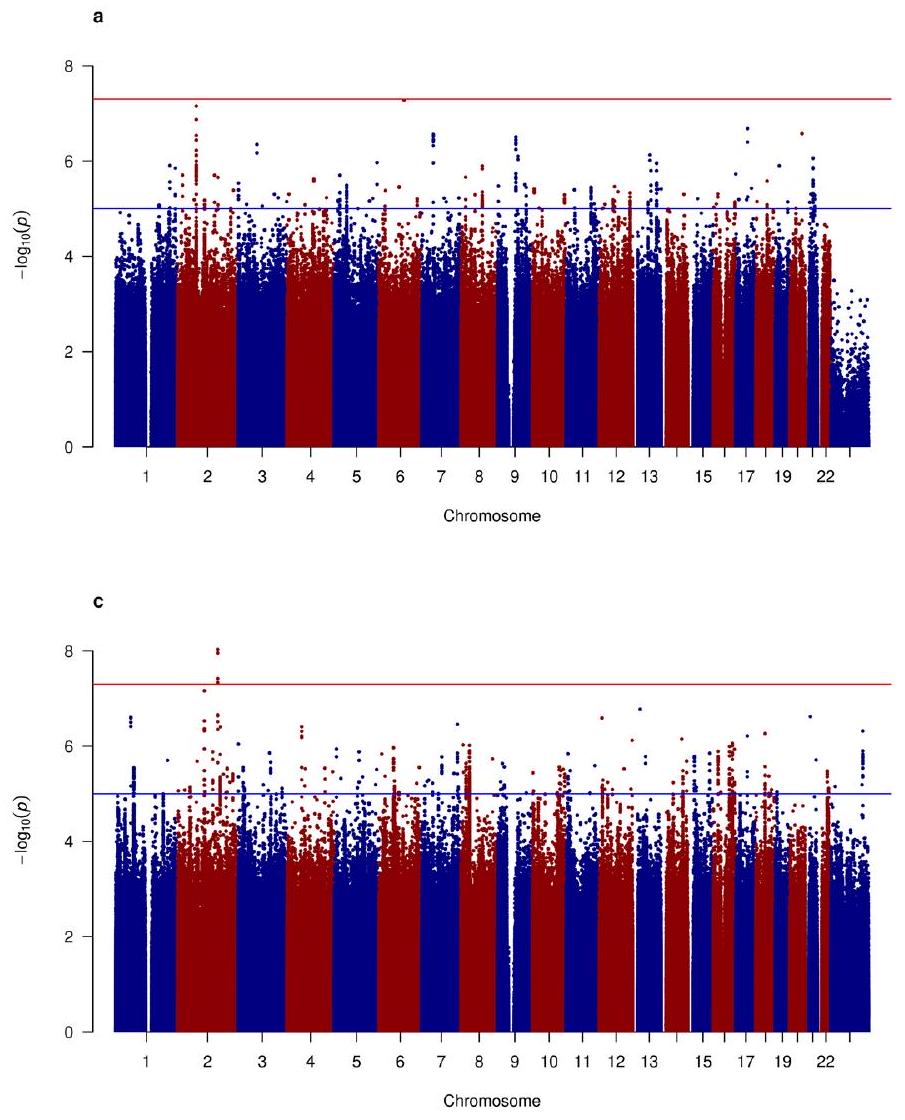
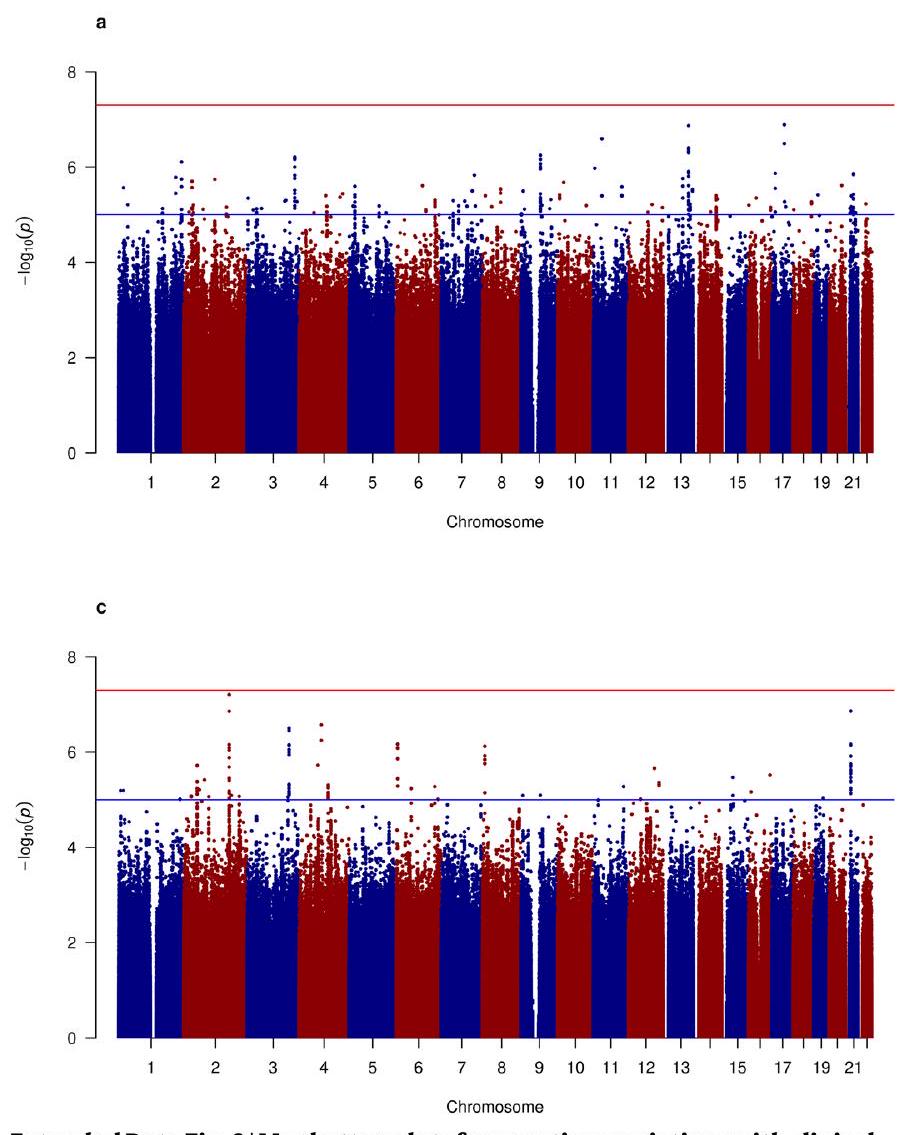
cases and 214,415 controls in total) (Extended Data Fig. 4 and Supplementary Figs. 19 and 20). This analysis identified seven genome-wide significant loci, two of which were novel (rs2085224 at 3p22.3 and rs78676209 at 5p12) (Supplementary Table 8).
We then excluded cohorts that had an extreme case-control ratio ( ) and did not adjust for this analytically, as well as cohorts with adolescent participants. This sensitivity analysis also yielded consistent results for the 190 lead SNPs (Supplementary Fig. 21).
Finally, we re-analyzed the data using a multi-ancestry meta-analysis approach implemented in MR-MEGA, which resulted in 44 independent regions associated with MD after lambda GC correction, some of which had been missed in the main analyses due to their between-ancestry heterogeneity (Supplementary Table 9).

Multi-ancestry fine mapping

We used a multi-ancestry Bayesian fine-mapping method to derive 99% credible sets for 155 loci that were associated at genome-wide significance and did not show evidence of multiple independent signals. For comparison, we also implemented single ancestry fine mapping of the same loci based on GWAS conducted in participants of European ancestry, including PGC-MDD and AGDS .
Multi-ancestry fine mapping increased fine-mapping resolution substantially as compared with fine mapping solely based on the data from European ancestry participants. The median size of the credible sets was reduced from 65.5 to 30 variants. Among the 145 loci for which we conducted fine mapping on both sample sets, 113 (77.9%) loci had a smaller 99% credible set from the multi-ancestry fine mapping, while four loci (0 from the European fine-mapping) were resolved to single putatively causal SNPs (Fig. 4 and Supplementary Table 10). For example, rs12699323, annotated as an intronic variant, is linked to expression of TMEM106B (transmembrane protein 106B). rs1806152 is a splice region variant associated with expression of the nearby gene PAUPAR (PAX6 upstream antisense RNA) on chromosome 11. At another locus, rs9564313 has been linked to expression of PCDH9 (protocadherin-9), a gene that is also highlighted in our TWAS and multi-marker analysis of genomic annotation (MAGMA) results .

TWAS and gene prioritization

To better understand the biological mechanisms of our GWAS findings, we performed several in silico analyses to functionally annotate and prioritize the most likely causal genes. We carried out a transcriptome-wide association study (TWAS) based on the results from the multi-ancestry meta-analysis for expression in tissues relevant to . We combined the TWAS results with functional mapping and annotation (FUMA), conventional MAGMA and HiC-MAGMA to prioritize target genes.
The TWAS identified 354 significant associations ( ) with MD, 205 of which had not been previously reported (Fig. 5 and Supplementary Table 11). The two most significant gene associations with MD were RPL31P12 (GTEx brain cerebellum, , ) and NEGR1 (GTEx brain caudate basal ganglia, , ), consistent with previous findings .
PCDH8P1 (GTEx brain anterior cingulate cortex BA24,Z=-8.3679, ) was the most significant novel TWAS result. NDUFAF3 was another novel gene association with MD (GTEx brain nucleus accumbens basal ganglia, , best GWAS ID rs7617480, best GWAS ). These results were also confirmed by HiC-MAGMA. The protein NDUFAF3 encodes is targeted by metformin, the first-line drug for treating type 2 diabetes.
Forty-three genes displayed evidence of association across all four gene prioritization methods (TWAS, FUMA, MAGMA and HiC-MAGMA) and were classified as high-confidence genes (Table 1 and Supplementary Tables 11-15). These included genes repeatedly highlighted in previous studies due to their strong evidence of association and biological relevance in MD: NEGR1, DRD2, CELF4, LRFN5, TMEM161B
Fig. 4 | Resolution of the locus fine mapping based on the multi-ancestry and the European ancestry GWAS, showing the size of the credible sets for 155 significant loci. a, A box plot showing the median (central line) and interquartile range (upper and lower hinges) of the sizes of the credible set for fine-mapped
loci. The whiskers extend to 1.5 times the interquartile range. Data points falling outside that range are denoted by individual dots in the figure. b, Stacked bar charts showing the number of loci within size categories for credible sets.
Fig. 5 | Manhattan-style -score plot of gene associations with MD in a TWAS based on the GWAS summary statistics for broadly defined MD. Significant gene associations are shown as red dots ( 354 significant genes, 205 of them novel), and the 50 most significant gene names are highlighted on both sides of the plot. Novel associations are shown in black, while genes previously associated
with MD are shown in gray. The red lines indicate the significance threshold ( ). For genes on the top part of the graph, increased expression was associated with increased depression risk, while expression of the genes on the bottom part of the plot showed an inverse association. NT, novel transcript.
and TMEM106B. Cadherin-9 (CDH9) and protocadherins (PCDHA1, PCDHA2 and PCDHA3) were also among the high-confidence genes (Supplementary Table 12). Finally, 25 of the high-confidence genes encode targets of established drugs, such as simvastatin (RHOA). These may indicate opportunities for drug repurposing.
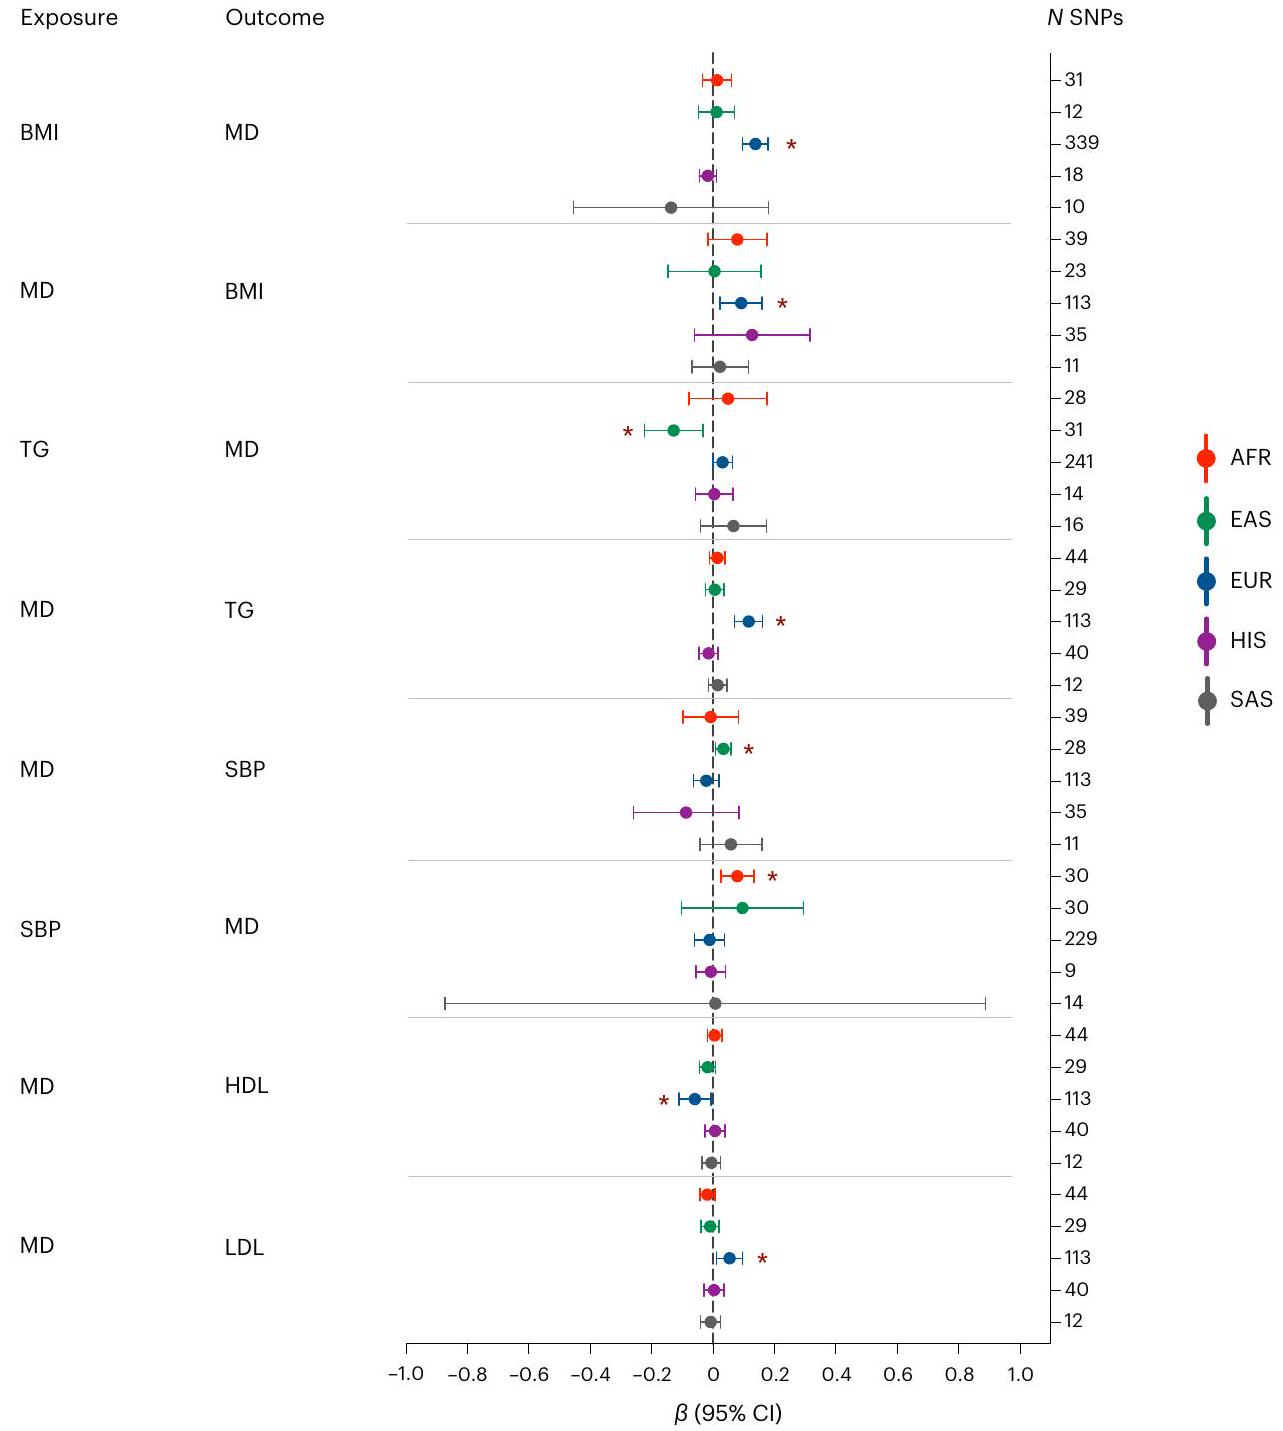
MR

We assessed bi-directional causal relationships between MD genetic liability and cardiometabolic traits using ancestry-specific two-sample MR analyses. Our results indicated a positive, bi-directional relationship between MD genetic liability and BMI (MD-> BMI: CI 0.024 to : to ) (Fig. 6 and Supplementary Table 16). This
bi-directional relationship was exclusively observed in samples of European ancestry ( in all other groups). MD genetic liability was also causal for other indicators of unfavorable metabolic profiles in samples of European ancestry: triglycerides (TGs, positive effect; , 95% CI 0.070 to ), high-density lipoproteins (HDLs, negative effect; to ) and low-density lipoproteins (LDLs, positive effect; CI 0.012 to ). The effects remained significant after removing the variants contributing to the possible heterogeneity bias observed through the MR-pleiotropy residual sum and outlier global test. Additionally, no pleiotropy was observed (Supplementary Table 16). In samples of East Asian ancestry, on the other hand, we found a negative causal association between TG and MD ( to
Table 1 | Genes associated with MD
Gene Drug FUMA MAGMA Hi-CMAGMA TWAS P Novel Credible set
Genes associated in TWAS and Hi-C MAGMA
NDUFAF3 Metformin, NADH No 1.00 0.004 Yes 9
PBRM1 Alprazolam, durvalumab, everolimus No 0.10 0.017 Yes
TBCA No 0.16 0.042 Yes
BTN2A3P No 1.00 Yes
ZNF204P No 1.00 0.014 No
HLA-B Thalidomide, ticlopidine, phenobarbital, carbamazepine, clozapine, lamotrigine No 0.46 No
RABGAP1 No 1.00 0.001 Yes
GOLGA1 No 1.00 0.020 Yes
FRAT2 No 0.78 0.017 Yes
ENSG00000278376 No 0.06 0.004 62
TRHDE-AS1 No 0.14 0.048 Yes
INSYN1-AS1 No 0.25 0.014 Yes 25
Genes associated across all four methods
RERE Yes No 45
NEGR1 Yes No
ZNF638 Cytidine Yes 0.003 0.004 No 61
RFTN2 Lipopolysaccharide Yes 0.003 No 204
ZNF445 Yes 0.001 No 138
ZNF197 Yes No 138
CCDC71 Yes 0.039 Yes 9
ENSG00000225399 Yes 0.010 0.003 9
RHOA Simvastatin, pravastatin, atorvastatin, magnesium, CCG-1423 Yes 0.031 0.019 No 9
CDH9 Calcium Yes 0.003 0.002 No 95
TMEM161B Crofelemer Yes No
PFDN1 Yes 0.025 Yes 67
SLC4A9 Sodium bicarbonate Yes 0.029 0.002 No 67
HARS1 Adenosine phosphate, pyrophosphate, phosphate, histidine Yes 0.024 0.017 Yes 141
HARS2 Adenosine phosphate, pyrophosphate, phosphate, histidine Yes 0.019 0.044 No 141
ZMAT2 Yes 0.014 0.005 No 141
PCDHA1 Calcium Yes 0.015 0.005 No 141
PCDHA2 Calcium Yes 0.031 0.010 No 141
PCDHA3 Calcium Yes 0.043 0.004 No 141
TMEM106B Crofelemer Yes No 1
ZDHHC21 Coenzyme A, palmityl-CoA Yes 0.002 0.036 No 42
SORCS3 Yes No 16
MYBPC3 Yes 0.004 0.012 No 48
SLC39A13 Zinc chloride, zinc sulfate Yes 0.007 0.003 Yes 48
CTNND1 Yes 0.002 0.010 No 60
ANKK1 Methadone, naltrexone, fostamatinib Yes 0.011 No
DRD2 Cabergoline, ropinirole, sulpiride Yes No
MLEC Yes 0.013 Yes
SPPL3 Yes No
LRFN5 Yes No 10
AREL1 Yes 0.007 No 143
Table (continued) 1 | Genes associated with MD
Gene Drug FUMA MAGMA Hi-CMAGMA TWAS P Novel Credible set
DLST Lipoic acid succinyl-CoA, coenzyme A, dihydrolipoamide (S)-succinyldihydrolipoamide Yes 0.001 No 143
MARK3 Fostamatinib, alsterpaullone Yes No 11
KLC1 Fluorouracil, irinotecan, leucovorin Yes No 11
XRCC3 Fluorouracil, irinotecan, leucovorin Yes 0.004 No 11
ZFYVE21 Inositol 1,3-bisphosphate Yes Yes 11
CELF4 Iloperidone Yes No 8
RAB27B Guanosine-5′-diphosphate Yes 0.042 No
EMILIN3 Yes 0.039 0.001 No 64
CHD6 Phosphate, ATP, ADP Yes 0.001 0.001 No 64
EP300 Acetyl-CoA, TGF- , garcinol, cyclic AMP, curcumin, mocetinostat Yes No 16
RANGAP1 Yes 0.003 No 16
ZC3H7B Yes 0.001 No 16
This table includes 12 genes significantly associated in the TWAS and Hi-C MAGMA, that is, not in physical proximity to a GWAS hit, and 43 genes significantly associated across all four methods (TWAS, FUMA, MAGMA and Hi-C MAGMA). Ensembl IDs are shown for genes without symbol names. Drugs targeting the prioritized genes or genes of the same family from GeneCards, DrugBank and ChEmbl. Gene mapped by FUMA positional mapping or eQTL mapping. Bonferroni adjusted two-sided value for MAGMA or Hi-C MAGMA of statistics (P<0.05 implies statistical significance). Novel report as compared with previous MAGMA and TWAS on MD. Number of variants in the credible set, only available for mapped loci from multi-ancestry fine-mapping.
). Moreover, MD genetic liability showed a positive causal association with systolic blood pressure (SBP, CI 0.009 to ). In samples of African ancestry, SBP had a positive causal association with MD ( to .

Discussion

We present the first large-scale GWAS of MD in an ancestrally diverse sample, including data from almost 1 million participants of African, East Asian and South Asian ancestry, and Hispanic/Latin American samples. The largest previous report included 26,000 cases of African ancestry .
By aggregating data in ancestry-specific meta-analyses, we identified two novel loci, 2 q 24.2 and 6 p 15 . In the Hispanic/Latin American group, variants at were associated with MD. Most of the cases in this group were defined using symptoms questionnaires. Future studies will be required to assess whether the association of this loci with clinical MD is consistent with our estimate. While the additional association at 6q16 in the GWAS in samples of African ancestry requires further confirmation in future studies, the link with MD is biologically plausible. The lead variant was significantly associated with the expression of specifically in brain cortex tissue. Melanin-concentrating hormone (MCH) is a neuropeptide that is expressed in the central and peripheral nervous systems. It acts as a neurotransmitter and neuromodulator in a broad array of neuronal functions directed toward the regulation of goal-directed behavior, such as food intake, and general arousal .
The diversity, in combination with the large sample size, enabled a comparison of the causal genetic architecture across ancestry groups. We assessed to what extent the 206 previously identified loci from large European ancestry discovery GWAS were transferable to other ancestry groups. Differences in allele frequencies, linkage disequilibrium and variable sample sizes impact on power to observe associations for each group. We recently developed PAT ratios, an approach to account for all these factors by comparing observed transferable loci with what is expected for a study of a given ancestry and sample size . The PAT ratios were about for African, South Asian and East Asian ancestry, remarkably similar and consistently low. We previously computed PAT
ratios for several other traits and found variation between traits, but the estimates for MD were at the bottom . With a PAT ratio of , the transferability of MD loci discovered in European ancestry samples was much higher for the Hispanic/Latin American group. This finding may reflect that the Hispanic/Latin American group contained many participants with a high proportion of European ancestry . The majority of cases within this group were defined via symptom questionnaires rather than clinical MD. Hence, it may be possible that the transferability for clinical MD is even higher in this group. For African, South Asian and East Asian ancestry, the PAT ratios for clinical MD were all below 0.5 and consistent with the estimates from the main analysis, demonstrating that heterogeneity in outcome definitions does not explain the limited transferability of MD loci across ancestry groups.
To better understand mechanisms underlying individual differences in vulnerability to development of MD, we need to bridge the gap from locus discovery to the identification of target genes. Our study achieved substantial progress in this respect. Fine mapping benefitted from the additional diverse samples, with median credible sets reduced from 65.6 to 35 in size and with 32 loci resolved to putatively causal SNPs ( 11 loci from the European ancestry fine mapping).
On the TWAS, the expression of 354 genes was significantly associated with MD. Out of these, 205 gene associations were novel, and 89 were overlapping with results of the largest previously published MD TWAS . Furthermore, 80 genes were overlapping with associations from another, previously published, large MD TWAS with largely overlapping samples of European ancestry . A number of these TWAS features, including NEGR1, ESR2 and TMEM106B, were previously also fine mapped and highlighted as putatively causal in previous post-TWAS analyses, strengthening the role of TWAS as an important tool to better understand the relationship between gene expression and MD.
Through TWAS and three other tools that incorporate the growing body of knowledge about functional annotations of the genome, we classified 43 genes as ‘high confidence’. The definition admittedly remains arbitrary until the field establishes clear guidelines. Nevertheless, the high-confidence list represents an evidence-based starting point for further follow-up. It provides confirmation for several genes that have repeatedly been highlighted as being near a GWAS-associated
Fig. 6 | Bi-directional MR tests between MD and cardiometabolic outcomes. The data are presented with a and a . Nominally significant associations are marked with a red asterisk. Statistics have been derived using the and standard errors for the number of variants used as IVs in each analysis, shown as NSNPs. Results are not shown for diastolic blood pressure for which there
were no significant associations. ( values in order from top to bottom: and 0.01 ). More details can be found in Supplementary Table 16. AFR, African ancestry; EAS, East Asian ancestry; EUR, European ancestry; HIS, Hispanic/Latin American group; SAS, South Asian ancestry.
variant and having high biological plausibility : NEGR1, DRD2, CELF4, LRFN5, TMEM161B and TMEM106B.
Furthermore, cadherin-9 (CDH9) and protocadherins (PCDHA1, PCDHA2 and PCDHA3) were classified as high-confidence genes. Cadherins are transmembrane proteins, mediating adhesion between cells and tissues in organisms . In previous studies, cadherins have been linked with MD and with other disorders involving the brain, including late-onset Alzheimer’s disease, which often manifests as neuropsychiatric symptoms coupled with depression and anxiety . The results of our study strengthen the evidence for the involvement of cadherins and protocadherins in the etiology of MD.
Genes newly implicated in MD development in our study highlight novel pathways, pinpoint potential new drug targets and suggest opportunities for drug repurposing.NDUFAF3 encodes mitochondrial complex I assembly protein, which is the main target of the drug metformin , the first-line drug for treating type 2 diabetes. Research in model organisms has provided a tentative link between metformin and a reduction in depression and anxiety . Furthermore, a recent study using more than 360,000 samples from the United Kingdom Biobank
(UKB) found associations between NDUFAF3 and mood instability, suggesting that energy dysregulation may play an important role in the physiology of mood instability .
Previous MR studies conducted in populations of European ancestry suggested a causal relationship of higher BMI increasing the odds of depression . To our knowledge, evidence of a reverse causal association (that is, MD genetic liability increases the odds of higher BMI) has not been previously reported . We also observed that the genetic liability to MD was associated with higher TG levels, lower HDL cholesterol and higher LDL cholesterol levels in individuals of European ancestry, which were not significant in the only previous MR study of smaller statistical power . Individuals with depression present higher levels of inflammation and are at increased risk of cardiometabolic disorders, irrespective of the age of onset . The phenotypic associations between MD and cardiometabolic traits may partly reflect the genetic overlap between them . However, in other ancestry groups, no significant relationship between BMI and MD was observed. Our MR analyses showed an effect of reduced TGs on increasing odds of MD in participants of East Asian ancestry.
Therefore, we provide further evidence for an opposite direction of effect for the relationship between MD and metabolic traits in European and East Asian ancestry groups . Instead of generalizing findings about depression risk factors across populations, further studies are needed to understand how genetic and environmental factors contribute to the complex relationships across diverse ancestry groups.
Our study has limitations. In this study, we assigned individuals into ancestry and ethnic groups. While this enabled important insights (for example, about transferability of MD loci), such categorical assignments are imprecise and some participants with admixed ancestry may still get excluded. In future research, we aim to implement different analytic strategies that are fully inclusive.
The sample size varied greatly across ancestry groups. The smallest group were individuals of South Asian ancestry. Most of the individuals included in our study live in the United States or in the United Kingdom. To characterize MD in global populations, future studies prioritizing primary data collection are needed. To contribute to this, we are currently recruiting MD patients and controls from Pakistan into the DIVERGE study . However, a concerted global effort to increase diversity in genetics will be necessary to fully address the issue . This also applies to the lack of other omics data and other functional databases to support downstream analyses for ancestrally diverse GWAS, such as large resources for transcriptomics or proteomics in relevant tissues . This may have impacted on our TWAS results because the RNA sequencing data was predominantly from participants of European ancestry.
Furthermore, statistical power for discovery of genetic associations may be impacted by reduced coverage of genetic variation present in diverse ancestral groups, as well as other factors such as the reliability of outcome assessment across different groups.
Additionally, our bi-directional MR analysis tested the relationships between MD and cardiometabolic traits. When testing MD as the exposure, the results should be interpreted as the effect of MD genetic liability and not as the effect of MD itself.
This study utilized data from several existing cohorts and bioresources to achieve large sample sizes. This necessitated using different outcome definitions, covering self-administered symptom questionnaires, electronic healthcare records and structured clinical interviews. The potential advantages and disadvantages of these approaches have been extensively discussed in previous studies . It is possible that some of the 190 genome-wide significant loci we identified are linked to a more general susceptibility to mental illness instead of being specific to MD. However, given the overlap between different psychiatric disorders , such findings are nevertheless of value for our understanding of the biology and for the development of new treatments for MD.
In conclusion, in this first large-scale, multi-ancestry GWAS of MD, we demonstrated through transferability analyses that a notable proportion of MD loci are specific to samples of European ancestry. We identified novel, biologically plausible associations that were missed in European ancestry analyses and demonstrated that large, diverse samples can be important for identifying target genes and putative mechanisms. These findings suggest that for MD, a heterogeneous condition with highly complex etiology, increasing ancestral as well as global diversity in genetic studies may be particularly important to ensure discovery of core genes and to inform about transferability of findings across ancestry groups.

Online content

Any methods, additional references, Nature Portfolio reporting summaries, source data, extended data, supplementary information, acknowledgements, peer review information; details of author contributions and competing interests; and statements of data and code availability are available at https://doi.org/10.1038/s41588-023-01596-4.

References

  1. GBD 2017 DALYs and HALE Collaborators. Global, regional, and national disability-adjusted life-years (DALYs) for 359 diseases and injuries and healthy life expectancy (HALE) for 195 countries and territories, 1990-2017: a systematic analysis for the Global Burden of Disease Study 2017. Lancet 392, 1859-1922 (2018).
  2. Wray, N. R. et al. Genome-wide association analyses identify 44 risk variants and refine the genetic architecture of major depression. Nat. Genet. 50, 668-681 (2018).
  3. CONVERGE Consortium. Sparse whole-genome sequencing identifies two loci for major depressive disorder. Nature 523, 588-591 (2015).
  4. Zhang, Y., Qi, G., Park, J.-H. & Chatterjee, N. Estimation of complex effect-size distributions using summary-level statistics from genome-wide association studies across 32 complex traits. Nat. Genet. 50, 1318-1326 (2018).
  5. Flint, J. & Kendler, K. S. The genetics of major depression. Neuron 81, 1214 (2014).
  6. Cai, N. et al. Minimal phenotyping yields genome-wide association signals of low specificity for major depression. Nat. Genet. 52, 437-447 (2020).
  7. Blokland, G. A. M. et al. Sex-dependent shared and nonshared genetic architecture across mood and psychotic disorders. Biol. Psychiatry 91, 102-117 (2022).
  8. Martin, J. et al. Examining sex-differentiated genetic effects across neuropsychiatric and behavioral traits. Biol. Psychiatry 89, 1127-1137 (2021).
  9. Kang, H.-J. et al. Sex differences in the genetic architecture of depression. Sci. Rep. 10, 9927 (2020).
  10. Arnau-Soler, A. et al. A validation of the diathesis-stress model for depression in Generation Scotland. Transl. Psychiatry 9, 25 (2019).
  11. Van der Auwera, S. et al. Genome-wide gene-environment interaction in depression: a systematic evaluation of candidate genes: the childhood trauma working-group of PGC-MDD. Am. J. Med. Genet. B 177, 40-49 (2018).
  12. Peterson, R. E. et al. Molecular genetic analysis subdivided by adversity exposure suggests etiologic heterogeneity in major depression. Am. J. Psychiatry 175, 545-554 (2018).
  13. Howard, D. M. et al. Genome-wide meta-analysis of depression identifies 102 independent variants and highlights the importance of the prefrontal brain regions. Nat. Neurosci. 22, 343-352 (2019).
  14. Mitchell, B. L. et al. The Australian Genetics of Depression Study: new risk loci and dissecting heterogeneity between subtypes. Biol. Psychiatry 92, 227-235 (2022).
  15. Levey, D. F. et al. Bi-ancestral depression GWAS in the Million Veteran Program and meta-analysis in million individuals highlight new therapeutic directions. Nat. Neurosci. 24, 954-963 (2021).
  16. Dunn, E. C. et al. Genome-wide association study of depressive symptoms in the Hispanic Community Health Study/Study of Latinos. J. Psychiatr. Res. 99, 167-176 (2018).
  17. Dunn, E. C. et al. Genome-wide association study (GWAS) and genome-wide by environment interaction study (GWEIS) of depressive symptoms in African American and Hispanic/Latina women. Depress. Anxiety 33, 265-280 (2016).
  18. Bigdeli, T. B. et al. Genetic effects influencing risk for major depressive disorder in China and Europe. Transl. Psychiatry 7, e1074 (2017).
  19. Giannakopoulou, O. et al. The genetic architecture of depression in individuals of East Asian ancestry: a genome-wide association study. JAMA Psychiatry 78, 1258-1269 (2021).
  20. Torgersen, K. et al. Shared genetic loci between depression and cardiometabolic traits. PLoS Genet. 18, e1010161 (2022).
  21. O’Loughlin, J. et al. Mendelian randomisation study of body composition and depression in people of East Asian ancestry highlights potential setting-specific causality. BMC Med. 21, 37 (2023).
  22. Fatumo, S. et al. A roadmap to increase diversity in genomic studies. Nat. Med. 28, 243-250 (2022).
  23. Bailey, R. K., Mokonogho, J. & Kumar, A. Racial and ethnic differences in depression: current perspectives. Neuropsychiatr. Dis. Treat. 15, 603-609 (2019).
  24. Hunter-Zinck, H. et al. Genotyping array design and data quality control in the Million Veteran Program. Am. J. Hum. Genet. 106, 535-548 (2020).
  25. Stein, M. B. et al. Genome-wide association studies of posttraumatic stress disorder in 2 cohorts of US Army soldiers. JAMA Psychiatry 73, 695-704 (2016).
  26. Shen, H. et al. Polygenic prediction and GWAS of depression, PTSD, and suicidal ideation/self-harm in a Peruvian cohort. Neuropsychopharmacology 45, 1595-1602 (2020).
  27. Zeng, B. et al. Multi-ancestry eQTL meta-analysis of human brain identifies candidate causal variants for brain-related traits. Nat. Genet. 54, 161-169 (2022).
  28. Huang, Q. Q. et al. Transferability of genetic loci and polygenic scores for cardiometabolic traits in British Pakistani and Bangladeshi individuals. Nat. Commun. 13, 4664 (2022).
  29. Brown, B. C., Asian Genetic Epidemiology Network Type 2 Diabetes Consortium, Ye, C. J., Price, A. L. & Zaitlen, N. Transethnic genetic-correlation estimates from summary statistics. Am. J. Hum. Genet. 99, 76-88 (2016).
  30. Lam, M. et al. Comparative genetic architectures of schizophrenia in East Asian and European populations. Nat. Genet. 51, 1670-1678 (2019).
  31. McLaren, W. et al. The Ensembl variant effect predictor. Genome Biol. 17, 122 (2016).
  32. Sherry, S. T., Ward, M. & Sirotkin, K. dbSNP-database for single nucleotide polymorphisms and other classes of minor genetic variation. Genome Res. 9, 677-679 (1999).
  33. Dall’Aglio, L., Lewis, C. M. & Pain, O. Delineating the genetic component of gene expression in major depression. Biol. Psychiatry 89, 627-636 (2021).
  34. Guyon, A., Conductier, G., Rovere, C., Enfissi, A. & Nahon, J.-L. Melanin-concentrating hormone producing neurons: activities and modulations. Peptides 30, 2031-2039 (2009).
  35. Hispanic Community Health Study – Study of Latinos. National Institutes of Health https://www.ncbi.nlm.nih.gov/projects/gap/ cgi-bin/study.cgi?study_id=phs000810.v1.p1 (2015).
  36. Resource for Genetic Epidemiology Research on Aging. National Institutes of Health https://www.ncbi.nlm.nih.gov/ projects/gap/cgi-bin/study.cgi?study_id=phs000674.v3.p3 (2018).
  37. Maître, J.-L. & Heisenberg, C.-P. Three functions of cadherins in cell adhesion. Curr. Biol. 23, R626-R633 (2013).
  38. Lutz, M. W., Sprague, D., Barrera, J. & Chiba-Falek, O. Shared genetic etiology underlying Alzheimer’s disease and major depressive disorder. Transl. Psychiatry 10, 88 (2020).
  39. Chang, H. et al. The protocadherin 17 gene affects cognition, personality, amygdala structure and function, synapse development and risk of major mood disorders. Mol. Psychiatry 23, 400-412 (2018).
  40. Xiao, X. et al. The gene encoding protocadherin 9 (PCDH9), a novel risk factor for major depressive disorder. Neuropsychopharmacology 43, 1128-1137 (2018).
  41. Pernicova, I. & Korbonits, M. Metformin-mode of action and clinical implications for diabetes and cancer. Nat. Rev. Endocrinol. 10, 143-156 (2014).
  42. Zemdegs, J. et al. Metformin promotes anxiolytic and antidepressant-like responses in insulin-resistant mice by decreasing circulating branched-chain amino acids. J. Neurosci. 39, 5935-5948 (2019).
  43. Ward, J. et al. The genomic basis of mood instability: identification of 46 loci in 363,705 UK Biobank participants, genetic correlation with psychiatric disorders, and association with gene expression and function. Mol. Psychiatry 25, 3091-3099 (2020).
  44. Tyrrell, J. et al. Using genetics to understand the causal influence of higher BMI on depression. Int. J. Epidemiol. 48, 834-848 (2019).
  45. van den Broek, N. et al. Causal associations between body mass index and mental health: a Mendelian randomisation study. J. Epidemiol. Community Health 72, 708-710 (2018).
  46. Speed, M. S., Jefsen, O. H., Børglum, A. D., Speed, D. & Østergaard, S. D. Investigating the association between body fat and depression via Mendelian randomization. Transl. Psychiatry 9, 184 (2019).
  47. So, H.-C., Chau, C. K.-L., Cheng, Y.-Y. & Sham, P. C. Causal relationships between blood lipids and depression phenotypes: a Mendelian randomisation analysis. Psychol. Med. 51, 2357-2369 (2021).
  48. Perry, B. I., Oltean, B. P., Jones, P. B. & Khandaker, G. M. Cardiometabolic risk in young adults with depression and evidence of inflammation: a birth cohort study. Psychoneuroendocrinology 116, 104682 (2020).
  49. Hagenaars, S. P. et al. Genetic comorbidity between major depression and cardio-metabolic traits, stratified by age at onset of major depression. Am. J. Med. Genet. B 183, 309-330 (2020).
  50. Valkovskaya, M. et al. Study protocol of DIVERGE, the first genetic epidemiological study of major depressive disorder in Pakistan. Psychiatr. Genet. 33, 69-78 (2023).
  51. Breeze, C. E., Beck, S., Berndt, S. I. & Franceschini, N. The missing diversity in human epigenomic studies. Nat. Genet. 54, 737-739 (2022).
  52. Long, E. et al. The case for increasing diversity in tissue-based functional genomics datasets to understand human disease susceptibility. Nat. Commun. 13, 2907 (2022).
  53. Cross-Disorder Group of the Psychiatric Genomics Consortium. Genomic relationships, novel loci, and pleiotropic mechanisms across eight psychiatric disorders. Cell 179, 1469-1482.e11 (2019).
Publisher’s note Springer Nature remains neutral with regard to jurisdictional claims in published maps and institutional affiliations.
Open Access This article is licensed under a Creative Commons Attribution 4.0 International License, which permits use, sharing, adaptation, distribution and reproduction in any medium or format, as long as you give appropriate credit to the original author(s) and the source, provide a link to the Creative Commons license, and indicate if changes were made. The images or other third party material in this article are included in the article’s Creative Commons license, unless indicated otherwise in a credit line to the material. If material is not included in the article’s Creative Commons license and your intended use is not permitted by statutory regulation or exceeds the permitted use, you will need to obtain permission directly from the copyright holder. To view a copy of this license, visit http://creativecommons. org/licenses/by/4.0/.
© The Author(s) 2024

Xiangrui Meng © , Georgina Navoly , Olga Giannakopoulou , Daniel F. Levey © , Dora Koller (1) , Gita A. Pathak , Nastassja Koen , Kuang Lin , Mark J. Adams © , Miguel E. Rentería © , Yanzhe Feng , J. Michael Gaziano , Dan J. Stein (B , Heather J. Zar , Megan L. Campbell (B , David A. van Heel © , Bhavi Trivedi , Sarah Finer (B , Andrew McQuillin (B) , Nick Bass , V. Kartik Chundru (B , Hilary C. Martin , Qin Qin Huang (B) , Maria Valkovskaya , Chia-Yi Chu (1) , Susan Kanjira , Po-Hsiu Kuo® , Hsi-Chung Chen (1) , Shih-Jen Tsai (1) , YuLi Liu , Kenneth S. Kendler (1) , Roseann E. Peterson (1) , Na Cai © , Yu Fang (B , Srijan Sen , Laura J. Scott (1) , Margit Burmeister © , Ruth J. F. Loos © , Michael H. Preuss (© , Ky’Era V. Actkins , Lea K. Davis © , Monica Uddin , Agaz H. Wani , Derek E. Wildman (1) , Allison E. Aiello , Robert J. Ursano (1) , Ronald C. Kessler (1) , Masahiro Kanai © , Yukinori Okada (B , Saori Sakaue © , Jill A. Rabinowitz , Brion S. Maher (B , George Uhl , William Eaton , Carlos S. Cruz-Fuentes © , Gabriela A. Martinez-Levy © , Adrian I. Campos © , Iona Y. Millwood © , Zhengming Chen , Liming Li © , Sylvia Wassertheil-Smoller (B) , Yunxuan Jiang , Chao Tian , Nicholas G. Martin (1) , Brittany L. Mitchell (1) , Enda M. Byrne (1) , Swapnil Awasthi , Jonathan R. I. Coleman ( , Stephan Ripke (1) , PGC-MDD Working Group***, China Kadoorie Biobank Collaborative Group***, the 23andMe Research Team*,, Genes and Health Research Team*,, BioBank Japan Project ***, Tamar Sofer (1) , Robin G. Walters (1) , Andrew M. McIntosh (1) , Renato Polimanti © , Erin C. Dunn , Murray B. Stein © , Joel Gelernter (B ) , Cathryn M. Lewis (B) & Karoline Kuchenbaecker (B)

Division of Psychiatry, UCL, London, UK. UCL Genetics Institute, UCL, London, UK. Department of Psychiatry, VA CT Healthcare Center, West Haven, CT, USA. Department of Psychiatry, Yale University School of Medicine, New Haven, CT, USA. Department of Genetics, Microbiology and Statistics, University of Barcelona, Barcelona, Spain. SAMRC Unit on Risk and Resilience in Mental Disorders, Department of Psychiatry and Neuroscience Institute, University of Cape Town, Cape Town, South Africa. Nuffield Department of Population Health, University of Oxford, Oxford, UK. Division of Psychiatry, University of Edinburgh, Edinburgh, UK. Department of Genetics and Computational Biology, QIMR Berghofer Medical Research Institute, Brisbane, Queensland, Australia. Department of Medicine, VA Boston Healthcare System, Boston, MA, USA. Department of Medicine, Brigham and Women’s Hospital, Boston, MA, USA. Department of Medicine, Harvard Medical School, Boston, MA, USA. SAMRC Unit on Child and Adolescent Health, Department of Paediatrics and Child Health, University of Cape Town, Cape Town, South Africa. Department of Psychiatry and Neuroscience Institute, University of Cape Town, Cape Town, South Africa. Blizard Institute, Queen Mary University of London, London, UK. Wolfson Institute of Population Health, Queen Mary University of London, London, UK. Wellcome Sanger Institute, Saffron Walden, UK. Department of Public Health and Institute of Epidemiology and Preventive Medicine, National Taiwan University, Taipei, Taiwan. Department of Psychiatry, National Taiwan University Hospital, Taipei, Taiwan. Center of Sleep Disorders, National Taiwan University Hospital, Taipei, Taiwan. Institute of Brain Science and Division of Psychiatry, National Yang-Ming Chiao Tung University, Taipei, Taiwan. Department of Psychiatry, Taipei Veterans General Hospital, Taipei, Taiwan. Center for Neuropsychiatric Research, National Health Research Institutes, Miaoli County, Taiwan. Department of Psychiatry, VCU, Richmond, VA, USA. Department of Psychiatry, SUNY Downstate Health Sciences University, Brooklyn, NY, USA. Helmholtz Pioneer Campus, Helmholtz Munich, Neuherberg, Germany. Computational Health Centre, Helmholtz Munich, Neuherberg, Germany. Department of Medicine, Technical University of Munich, Munich, Germany. Michigan Neuroscience Institute, University of Michigan, Ann Arbor, MI, USA. Department of Psychiatry, University of Michigan, Ann Arbor, MI, USA. Department of Biostatistics, University of Michigan, Ann Arbor, MI, USA. Center for Statistical Genetics, University of Michigan, Ann Arbor, MI, USA. Department of Computational Medicine and Bioinformatics, University of Michigan, Ann Arbor, MI, USA. Department of Human Genetics, University of Michigan, Ann Arbor, MI, USA. Charles Bronfman Institute for Personalized Medicine, Icahn School of Medicine at Mount Sinai, New York, NY, USA. Novo Nordisk Foundation Center for Basic Metabolic Research, Faculty of Health and Medical Sciences, University of Copenhagen, Copenhagen, Denmark. Department of Medicine, Division of Genetic Medicine, Vanderbilt University Medical Center, Nashville, TN, USA. Department of Biomedical Informatics, Vanderbilt University Medical Center, Nashville, TN, USA. Department of Psychiatry and Behavioral Sciences, Vanderbilt University Medical Center, Nashville, TN, USA. College of Public Health, University of South Florida, Tampa, FL, USA. Genomics Program, College of Public Health, University of South Florida, Tampa, FL, USA. Robert N. Butler Columbia Aging Center, Department of Epidemiology, Mailman School of Public Health, Columbia University, New York, NY, USA. Department of Psychiatry, Uniformed Services University of the Health Sciences, Bethesda, MD, USA. Department of Health Care Policy, Harvard Medical School, Boston, MA, USA. Department of Statistical Genetics, Osaka University Graduate School of Medicine, Osaka, Japan. Analytic and Translational Genetics Unit, Massachusetts General Hospital, Boston, MA, USA. Program in Medical and Population Genetics, Broad Institute of Harvard and MIT, Cambridge, MA, USA. Department of Genome Informatics, Graduate School of Medicine, University of Tokyo, Tokyo, Japan. Laboratory for Systems Genetics, RIKEN Center for Integrative Medical Sciences, Yokohama, Japan. Divisions of Genetics and Rheumatology, Department of Medicine, Brigham and Women’s Hospital, Harvard Medical School, Boston, MA, USA. Department of Mental Health, Johns Hopkins Bloomberg School of Public Health, Baltimore, MD, USA. Neurology and Pharmacology, University of Maryland, Maryland VA Healthcare System, Baltimore, MD, USA. Departamento de Genética, Instituto Nacional de Psiquiatría ‘Ramón de la Fuente Muñíz’, Mexico City, Mexico. Institute for Molecular Bioscience, The University of Queensland, Brisbane, Queensland, Australia. MRC Population Health Research Unit, University of Oxford, Oxford, UK. Department of Epidemiology and Biostatistics, School of Public Health, Peking University, Beijing, China. Peking University Center for Public Health and Epidemic Preparedness and Response, Peking University, Beijing, China. Key Laboratory of Epidemiology of Major Diseases (Peking University), Ministry of Education, Beijing, China. Department of Epidemiology and Population Health, Albert Einstein College of Medicine, Bronx, NY, USA. Department of Biostatistics, Emory University, Atlanta, GA, USA. , Inc., Mountain View, CA, USA. Mental Health and Neuroscience Research Program, QIMR Berghofer Medical Research Institute, Brisbane, Queensland, Australia. Child Health Research Centre, The University of Queensland, Brisbane, Queensland, Australia. Stanley Center for Psychiatric Research, Broad Institute of Harvard and MIT, Cambridge, MA, USA. Department of Psychiatry and Psychotherapy, Charité – Universitätsmedizin, Berlin, Germany. Social Genetic and Developmental Psychiatry Centre, Institute of Psychiatry, Psychology and Neuroscience, King’s College London, London, UK. Analytic and Translational
Genetics Unit, Massachusetts General Hospital, Cambridge, MA, USA. Division of Sleep and Circadian Disorders, Department of Medicine, Brigham and Women’s Hospital, Boston, MA, USA. Department of Biostatistics, Harvard T.H. Chan School of Public Health, Boston, MA, USA. Institute for Genomics and Cancer, University of Edinburgh, Edinburgh, UK. VA Connecticut Healthcare Center, West Haven, CT, USA. Department of Psychiatry, Massachusetts General Hospital, Boston, MA, USA. Psychiatric and Neurodevelopmental Genetics Unit (PNGU), Massachusetts General Hospital, Boston, MA, USA. Stanley Center for Psychiatric Research, Broad Institute, Cambridge, MA, USA. Department of Psychiatry, UC San Diego School of Medicine, La Jolla, CA, USA. Herbert Wertheim School of Public Health and Human Longevity, University of California San Diego, La Jolla, CA, USA. Psychiatry Service, VA San Diego Healthcare System, San Diego, CA, USA. Department of Genetics, Yale University School of Medicine, New Haven, CT, USA. Department of Medical and Molecular Genetics, King’s College London, London, UK. These authors contributed equally: Xiangrui Meng, Georgina Navoly, Olga Giannakopoulou. *Lists of authors and their affiliations appear at the end of the paper. e-mail: k.kuchenbaecker@ucl.ac.uk

PGC-MDD Working Group

Xiangrui Meng , MarkJ. Adams , Kenneth S. Kendler , Roseann E. Peterson , Na Cai , Nicholas G. Martin , Enda M. Byrne , Jonathan R. I. Coleman , Stephan Ripke , Andrew M. McIntosh , Erin C. Dunn , Cathryn M. Lewis & Karoline Kuchenbaecker

A full lists of members and their affiliations appear in the Supplementary Information.

China Kadoorie Biobank Collaborative Group

Kuang Lin , Iona Y. Millwood , Zhengming Chen , Liming Li & Robin G. Walters

A full lists of members and their affiliations appear in the Supplementary Information.

the 23andMe Research Team

YunxuanJiang & Chao Tian

A full lists of members and their affiliations appear in the Supplementary Information.

Genes and Health Research Team

David A. van Heel , Bhavi Trivedi , Sarah Finer , Nick Bass & Qin Qin Huang

A full lists of members and their affiliations appear in the Supplementary Information.

BioBank Japan Project

Masahiro Kanai , Yukinori Okada & Saori Sakaue
A full lists of members and their affiliations appear in the Supplementary Information.

Methods

Participating cohorts

For the analyses of the African, East Asian, South Asian and Hispanic/ Latin American group, we included data from 21 cohorts (Supplementtary Table 1) with ancestrally diverse participants, where measurements were taken from distinct samples. Details including study design, genotyping and imputation methods and quality control for these studies had been described by previous publications (Supplementary Note). All participants provided informed consent. All studies obtained ethical approvals from local ethics review boards. Measures were taken from distinct samples rather than repeat measures from the same individual.
For each study, a principal component analysis was carried out based on the genetic similarity of individuals. Individuals who clustered around a reference group with confirmed ancestry were assigned to that specific group and included in the association analysis, except for the Hispanic/Latin American group, which was based on self-reported ethnicity. Individuals with admixture between the predefined ancestry reference groups were excluded.
We also included two previously published studies of MD, using data from ancestrally European participants, including the PGC-MDD2 ( and ) and the AGDS ( and ) (ref.14) to conduct a multi-ancestry meta-analysis of MD (Supplementary Table 1). The total sample size of the multi-ancestry meta-analysis was ( and ). Of the participants, 70.1% (effective sample size) were of European ancestry, 8.2% East Asian, 11.8% African and 1.5% were of South Asian ancestry, and were Hispanic/Latin American.
We used a range of measures to define depression, including structured clinical interviews, medical care records, symptom questionnaires and self-reported surveys (Supplementary Table 1). The meta-analyses were primarily conducted combining GWASs of all phenotype definitions (that is, broad MD). In addition, meta-analyses for clinical depression and relevant downstream analyses were also conducted. We considered depression ascertained by structured clinical interviews (directly assessing diagnostic criteria based on DSM-IV, DSM-5 or ICD9/10 through interviews or self-report) or medical care records (ICD9 or ICD10 from primary or secondary care units) as clinical depression. Among the GWASs, the Genes and Health study, MVP, the Genetic Epidemiology Research on Aging Study (GERA), BioVU, the Prevention Intervention Research Center First Generation Trial (PIRC), the Mexican Adolescent Mental Health Survey (MAMHS), CONVERGE, the UKB, the Army Study to Assess Risk and Resilience in Service Members (Army-STARRS) and BioMe fulfilled the clinical definition of depression. On the basis of European ancestry data from previous published work of the PGC-MDD group , all studies fulfilled the clinical definition, except for the UKB and the 23andMe, which were excluded in the analysis of clinical MD.

Study-level genetic association analyses

Throughout the manuscript, all statistical tests were two sided, unless explicitly indicated. We had access to individual-level data for Army STARRS, UKB, Women’s Health Initiative (WHI), Intern Health Study (IHS), GERA, Jackson Heart Study (JHS), Drakenstein Child Health Study and the Detroit Neighborhood Health Study. Data access was granted via our collaborators, the UKB under application ID 51119 and the dbGaP under project ID 18933.
SNP-level associations with depression were assessed through logistic regressions using PLINK version 1.90. The additive per-allele model was employed. Age, sex, principal components and other relevant study-level covariates were included as covariates. Where available, genotypes on chromosome were coded 0 or 2 in male participants and 0,1 and 2 in female participants. Data for variants on were only available for some of the studies (Supplementary Table 1). The effective sample size was 1,763 for African, 58,833 East Asian, 13,099 South Asian ancestry and 79,720 for Hispanic/Latin American. Summary
statistics were received from our collaborators for all other studies. Additive-effect logistic regressions were conducted by the 23 and Me Inc, Taiwan-MDD study, MVP, BBJ, Rabinowitz, MAMHS, PrOMIS and BioVU.Age, sex, principal components and other relevant study-level covariates were included as covariates.
Mixed-effect models were used in the association analysis for CKB, BioME and Genes and Health with SAIGE (version 0.36.1) (ref. 54). The CONVERGE study initially conducted mixed-effect model GWA tests with Bayesian and logistic regression toolkit-linear mixed model (BOLT-LMM), followed by PLINK logistic regressions to retrieve log odds ratios (ORs). For the CONVERGE study, the logORs and s.e.m. from PLINK were used in our meta-analysis. The HCHS/SOL implemented mixed-effect model GWA tests to adjust for population structure and relatedness with depression as binary outcome and was conducted using GENESIS . The summary statistics from GENESIS were converted into and s.e.m. before meta-analysis. First, the score and its variance were transformed into and s.e.m. by score/variance and s.e.m. = sqrt(variance)/variance. Afterwards, and s.e.m. were converted into approximate and s.e.m. using and s.e.m. s.e.m. , where pi is the proportion of cases in analysis .
We restricted the downstream analysis to variants with imputation accuracy info score of 0.7 or higher and effective allele count MAF MAF of 50 or higher. For study of small sample size, we required a minor allele frequency of no less than 0.05 . The alleles for indels were re-coded as ‘ I ‘ for the longer allele and ‘ D ‘ for the shorter one. Indels of different patterns at the same position were removed.

Meta-analyses

We first implemented inverse variance-weighted (IVW) fixed-effect meta-analyses for GWAS from each ancestry/ethnic group (that is, African ancestry, East Asian ancestry, South Asian ancestry and the Hispanic/Latin American group) using METAL (version 2011-03-25) (ref. 57). The genomic inflation factor was calculated for each study and meta-analysis with R package GenABEL version 1.8.0 (ref. 58). Given the dependence of this estimate on sample size, we also calculated (ref.59) as ref. 60 . The LDSC intercept was also calculated with an ancestry-matched LD reference panel from the Pan UKB reference panel for each meta-analysis with LDSC (version 1.0.1) (ref. 62). For meta-analyses with residual inflation ( ), test statistics for variants were adjusted by LDSC intercept. Following the meta-analyses by METAL, variants present in less than two studies were filtered out. Statistical tests were generally two sided unless otherwise stated. We also performed a heterogeneity analysis with METAL to assess whether observed effect sizes (or test statistics) are homogeneous across samples.
We combined data from 71 cohorts with diverse ancestry using an IVW fixed-effects meta-analysis in METAL and were calculated, and were 1.687 and 1.001, respectively. The LDSC intercept was also calculated with the multi-ancestry LD reference panel (Supplementary Note), which was 1.019 (s.e.m. 0.011). We adjusted the test statistics from the multi-ancestry meta-analysis using the LDSC intercept of 1.019. Only variants present in at least two studies were retained for further analysis, yielding a total of variants. We also calculated the number of cases and the total number of samples for each variant based on the crude sample size and availability of each study.
We used a significance threshold of . To identify independent association signals, the GCTA forward selection and backward elimination process (command ‘cojo-slt’) were applied using the summary statistics from the multi-ancestry meta-analysis, with the aforementioned multi ancestry LD reference panel (GCTA version 1.92.0 beta2) . It is possible that the algorithm identifies false positive secondary signals if the LD in the reference set does not match the actual LD in the GWAS data well; therefore, for each independent signal
defined by the GCTA algorithm, locus zoom plots were generated for the 250 kb upstream and downstream region. We then inspected each of these plots manually and removed any secondary signals from our list where there was unclear LD separation, that is, some of the variants close to the secondary hit were in LD with the lead variant.
Loci were defined by the flanking genomic interval mapping 250 kb upstream and downstream of each lead SNP. Where lead SNPs were separated by less than 500 kb , the corresponding loci were aggregated as a single locus with multiple independent signals. The lead SNP for each locus was then selected as the SNP with minimum association value. The analysis for loci identification, along with all other R-related tasks unless otherwise stated, was conducted using (version 3.4.3) (ref. 65) and figures were produced using the packages ggplot2 (version 3.2.1) (ref. 66), qqman (version 0.1.4) (ref. 67) and ggpubr (version 0.6.0) (ref. 68).
We conducted sensitivity analyses for outcome definitions, case-control ratio and using a different multi-ancestry meta-analysis approach (Supplementary Note).

Fine mapping

We fine mapped all loci with statistically significant associations from the multi-ancestry GWAS using a statistical fine-mapping method for multi-ancestry samples . Briefly, this method is an extension of a Bayesian fine-mapping approach that utilizes estimates of the heterogeneity across ancestry groups, such that variants with different effect estimates across populations have a smaller prior probability to be the causal variant.
For each lead variant, we first extracted all nearby variants with as determined by the multi-ancestry LD reference. The multi-ancestry prior for each variant to be causal was calculated from a fixed-effects meta-analysis combining the summary statistics from ancestry-specific meta-analysis for each of the five major ancestry groups. statistics were calculated to estimate the heterogeneity of the effect estimates across ancestry groups. The posterior probability for a variant to be included in the credible set was proportional to its chi-square test statistic and the prior. The 99% credible set for each lead variant was determined by ranking allSNPs (within of the lead variant) according to their posterior probabilities and then including ranked SNPs until their cumulative posterior probabilities reached or exceeded 0.99.
As a comparison, we also conducted a Bayesian fine-mapping analysis based on the summary statistics of the European-ancestry meta-analysis. The same list of independent lead SNPs from the multi-ancestry meta-analysis were used for this fine mapping in the European ancestry data. All nearby SNPs with as determined by the 1,000 Genomes European LD reference panel were included in the fine mapping. The posterior probability was calculated in a similar way, but without the multi-ancestry prior. Similar to the multi-ancestry fine mapping, all SNPs were ranked, and 99% of the credible sets were derived accordingly.
Since our fine mapping was based on meta-analysis summary statistics, heterogeneity of individual studies (for example, due to differences in genotyping array) can influence the fine-mapping calibration and recall. We used a novel summary statistics-based quality control method proposed by Kanai and colleagues (SLALOM) to dissect outliers in association statistics for each fine-mapped locus . This method calculates test statistics (DENTIST-S) from -scores of test variants and the lead variant (the variant of the lowest value in each locus), and the LD between test variants and the lead variant in the locus . Among the 155 fine-mapped loci in our study, there were 134 loci with the largest variant posterior inclusion probability of greater than 0.1. For these 134 loci, values were calculated for all variants within the 1 Mb region of the lead variant for each locus based on our multi-ancestry LD reference from the UKB data. In line with the criteria used by Kanai and colleagues, variants with DENTIST-S value smaller than and with the lead variant greater than 0.6 were defined
as outliers. Fine-mapped loci were classified as robust if there were no outlying variants.

Colocalization analysis

We performed colocalization between genetic associations with MD and gene expression in brain and blood tissues from samples of European and African ancestry and Hispanic/Latin American participants using coloc R package . To select genes for testing, we mapped SNPs within a 3 Mb window at 2 q 24.2 and 6 q 16.2 using Variant Effect Predictor , resulting in eight and four genes, respectively. Loci with posterior probability either for both traits are associated and share two different but linked variants (H3 hypothesis) or a single causal variant (H4 hypothesis) were considered as colocalized. The European and African ancestry summary statistics for MD were tested against multi-ancestry brain eQTLs from European and African American samples . For the Hispanic/Latin American group, we tested gene and protein expression of blood tissue from Multi-Ethnic Study of Atherosclerosis and Trans-omics for Precision Medicine . For African ancestry, we tested gene expression of blood from GENOA study and proteome expression of blood . For European ancestry, we tested gene expression of blood from eQTLgen , and proteome expression from blood . We also carried out ancestry-specific eQTL and pQTL colocalization analyses for previously reported loci that were or were not transferable.

Assessment of transferability of MD-associated loci

We assessed whether published MD-associated loci display evidence of association in the East Asian, South Asian and African ancestry and Hispanic/Latin American samples. Pooling the independent genome-wide significant SNPs from two large GWAS of MD in samples of European ancestry yielded 195 loci . The ancestrally diverse groups included in this study had smaller numbers of participants than the European ancestry discovery studies. Also, a given variant may be less frequent in another ancestry group. Therefore, individual lead variants may not display evidence of association because of lack of power. Moreover, in the discovery study, the lead variant is either the causal variant or is strongly correlated with it. However, differences in LD mean that the lead variant may not be correlated in another ancestry group and may therefore not display evidence of association. Our assessment of transferability was therefore based on PAT ratios that aggregate information across loci and account for all three factors, sample size, MAF and differences in .
First, credible sets for each locus were generated. They consisted of lead variant plus all correlated SNPs ( ) within a 50 kb window of the lead variant (based on ancestry matched LD reference panels from the 1,000 Genomes data) and with . A signal was defined as being ‘transferable’ to another ancestry group if at least one variant from the credible set was associated at two-sided with MD and had consistent direction of effect between the discovery and test study. is the number of SNPs in the credible set for each locus, and is a penalization factor we derived from empirical estimations. The effective number of independent SNPs was often higher in other ancestry groups due to differences in LD, leading to higher multiple testing burden and higher likelihood of identifying SNPs with a low value, by chance alone. This inflates the test statistics and was adjusted for by the penalization factor . To derive the for each ancestry group, we used the summary statistics from a previous GWAS on breast cancer , in which phenotypes were believed to be uncorrelated with MD. A total of 441 breast cancer significant SNPs were taken from their paper, and linear regressions were conducted for the values of these SNPs in each of our ancestrally diverse summary statistics for MD on the number of SNPs in credible sets. The coefficient estimates (slope from regressions) were treated as for each ancestry. As a result, were , 0.006847 and 0.003147 for samples of African, East Asian, South Asian ancestry and for the Hispanic/Latin American group, respectively.
In the next step, the statistical power to detect an association of a given locus was calculated assuming an additive effect at a type I error rate of 0.05 , with effect estimates from the discovery study, and allele frequency and sample size from each of the target datasets from diverse ancestry/ethnic groups. The power estimates were summed up across published loci to give an estimate of the total number of loci expected to be significantly associated. This is the expected number if all loci are transferable and accounts for the statistical power for replication. We calculated the PAT ratio by dividing the observed number of loci by the expected number. In addition, loci were defined as ‘nontransferable’ if they had sufficient power for identifying an association but did not display evidence of association, that is, if they contained at least one variant in the credible set with power, while none of the variants in the credible set had and no variant within 50 kb of locus had in the target dataset.
For comparison, we also conducted a transferability assessment for a European ancestry look-up study. The 102 significant loci reported by Howard and colleagues were evaluated for their transferability in the AGDS study using the aforementioned method.
To assess whether low transferability may be due to heterogeneous outcome definitions, we carried out a sensitivity analysis, where we estimated PAT ratios based only on studies fulfilling the clinical MD definition.

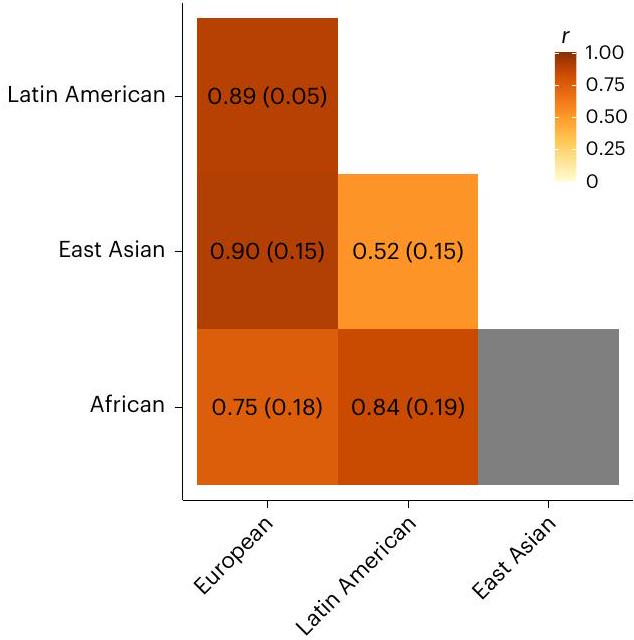
Trans-ancestry genetic correlations

We estimated trans-ancestry genetic correlations using POPCORN version 1.0 (refs. 29,54,78). Pairwise correlations were calculated between each combination of the five ancestry/ethnic groups (that is, African, European, East Asian, South Asian and Hispanic/Latin American) for broad depression and clinical depression separately.

Gene annotation

The summary statistic from the multi-ancestry meta-analysis was first annotated with FUMA . Both positional mapping and eQTL mapping results were extracted from FUMA. The 1,000 Genomes European samples were employed as the LD reference panel for FUMA gene annotation. Datasets for brain tissue available in FUMA were employed for eQTL gene annotation.
Gene-based association analyses were implemented using Multi-marker Analysis of GenoMic Annotation (MAGMA, version 1.08) (ref. 80) and Hi-C coupled MAGMA (H-MAGMA) . The aforementioned multiple ancestry LD reference panel from the UKB was used as the LD reference panel. H-MAGMA assigns noncoding SNPs to their cognate genes based on long-range interactions in disease-relevant tissues measured by . We used the adult brain annotation file.

Transcriptome-wide association analysis and drug mapping

To perform a TWAS, the FUSION software was used . SNP weights were downloaded from the FUSION website and were derived from multiple external studies, including (1) SNP weights from all available brain tissues, adrenal gland, pituitary gland, thyroid gland and whole blood from GTEx v8 (ref. 84) (based on significantly heritable genes and ‘All Samples’ in GTEx v8, which also includes African American and Asian individuals); (2) SNP weights from the CommonMind Consortium, which includes samples from the brain dorsolateral prefrontal cortex; (3) SNP weights from the Young Finns study; and (4) from the Netherlands Twin Register, which provides SNP weights from blood tissues (whole blood and peripheral blood, respectively).
We used the multi-ancestry LD reference panel described above. Variants present in the 1,000 Genomes European population reference panel were retained. A separate TWAS was also performed using a LD reference panel based on the 1,000 Genomes Project’s samples of European ancestry, as a sensitivity analysis.
The transcriptome-wide significance threshold for the TWAS associations in this study was . This threshold was previously
derived using a permutation-based procedure, which estimates a significance threshold based on the number of features tested .
The results were compared with previous TWAS in MD, including the two largest MD TWAS so far . These studies generally used smaller sets of SNP weights (except the study by Dall’Aglio and colleagues, which used similar SNP weights as the current study, but with SNP weights derived from the previous GTEx release, v7). The TWAS -score plot was generated using a TWAS-plotter function .
To assess the relevance of novel genes to drug discovery, genes were searched in three large drug databases: GeneCards , DrugBank and ChEMBL . In Table 1, a selection of drugs (the ones reported in multiple publications) probably targeting our high-confidence prioritized gene sets are shown for each gene.

MR

We performed a bi-directional two-sample MR analysis using the TwoSampleMR R package (version 0.5.6) to test possible causal effects between MD and six cardiometabolic traits. We followed the STROBE-MR (strengthening the reporting of observational studies in epidemiology using Mendelian randomisation) guidelines (Supplementary Note). For individuals of European ancestry, the UKB was used to select instruments for BMI, fasting glucose, HDL, LDL, SBP and TGs. SBP summary data were obtained from the UKB for individuals of African and South Asian ancestry and Hispanic/Latin American participants. For samples of African, East Asian and South Asian ancestry and the Hispanic/Latin American group, a meta-analysis was performed using METAL with inverse variance weighting using the UKB and the following consortia: GIANT for BMI; MAGIC for fasting glucose; Global Lipids Genetics Consortium for HDL, LDL and TG; and Biobank Japan for SBP in samples of East Asian ancestry. The genetic associations with quantitative variables were estimated with respect to the scale, units and models defined in the original studies. Heterogeneity analyses were also performed. To avoid sample overlap, the datasets used to define instrumental variables (IV) for the cardiometabolic traits were excluded from the MD genome-wide association statistics used for the MR analyses conducted with respect to each ancestry group.
Genome-wide significance ( ) was used as the threshold to select IVs for the exposures. However, if less than ten variants were available, a suggestive threshold ( ) was used to select IVs (Supplementary Table 16). We only included IVs that were present in both datasets (exposure and the outcome). We followed the three main IV assumptions for the analysis: (1) relevance: the IV is associated with the risk factor of interest; (2) independence: the IV is not associated with confounders; and (3) exclusion: the IV is only associated with the outcome through the exposure. We used the following criteria for clumping: and a window. The following information was used in both the exposure and outcome data: SNP ID, effect size, effect allele, other allele, EAF and value. We used five different MR methods: IVW, MR-Egger, weighted median, simple mode and weighted mode . The IVW estimates were reported as the main results due to their higher statistical power while the other tests were used to assess the consistency of the estimates across different methods. MR-Egger regression intercept and MR heterogeneity tests were conducted as additional sensitivity analyses. In case of significant heterogeneity, the MR-pleiotropy residual sum and outlier global test was used to remove genetic variants based on their contribution to heterogeneity ).

Reporting summary

Further information on research design is available in the Nature Portfolio Reporting Summary linked to this article.

Data availability

GWAS summary statistics will be made available via the PGC website (https://www.med.unc.edu/pgc/download-results/) under dataset identifier ‘mdd2023diverse’. 23andMe, WHI and JHS do not permit
sharing of genome-wide summary statistics. The full GWAS summary statistics for the 23andMe discovery dataset will be made available through 23andMe to qualified researchers under an agreement with 23 and Me that protects the privacy of the 23andMe participants. Please visit https://research.23andme.com/collaborate/#dataset-access/ for more information and to apply to access the data. Investigators can apply for access to WHI and JHS via dbGaP (https://www.ncbi.nlm.nih. gov/gap/). The current study utilized data from dbGaP studies under application #18933.

Code availability

We used publicly available software for the analyses. The software used is listed in the Methods section. Custom analysis scripts are available at https://doi.org/10.5281/zenodo.8335659.

References

  1. Zhou, W. et al. Efficiently controlling for case-control imbalance and sample relatedness in large-scale genetic association studies. Nat. Genet. 50, 1335-1341 (2018).
  2. Gogartsen, S. M. et al. Genetic association testing using the GENESIS R/Bioconductor package. Bioinformatics 35, 5346-5348 (2019).
  3. Cook, J. P., Mahajan, A. & Morris, A. P. Guidance for the utility of linear models in meta-analysis of genetic association studies of binary phenotypes. Eur. J. Hum. Genet. 25, 240-245 (2017).
  4. Willer, C. J., Li, Y. & Abecasis, G. R. METAL: fast and efficient meta-analysis of genomewide association scans. Bioinformatics 26, 2190-2191 (2010).
  5. Gen-ABEL project. GitHub https://github.com/GenABEL-Project/ GenABEL (2022).
  6. Yang, J. et al. Genomic inflation factors under polygenic inheritance. Eur. J. Hum. Genet. 19, 807-812 (2011).
  7. Freedman, M. L. et al. Assessing the impact of population stratification on genetic association studies. Nat. Genet. 36, 388-393 (2004).
  8. Pan-UK Biobank. Broad Institute https://pan.ukbb.broadinstitute. org (2020).
  9. Bulik-Sullivan, B. K. et al. LD score regression distinguishes confounding from polygenicity in genome-wide association studies. Nat. Genet. 47, 291-295 (2015).
  10. Yang, J., Lee, S. H., Goddard, M. E. & Visscher, P. M. GCTA: a tool for genome-wide complex trait analysis. Am. J. Hum. Genet. 88, 76-82 (2011).
  11. Yang, J. et al. Conditional and joint multiple-SNP analysis of GWAS summary statistics identifies additional variants influencing complex traits. Nat. Genet. 44, 369-375 (2012).
  12. Development Core Team. : a language and environment for statistical computing (R Foundation for Statistical Computing, 2017).
  13. Wickham, H. in ggplot2: Elegant Graphics for Data Analysis (ed. Wickham, H.) 241-253 (Springer International, 2016).
  14. Turner, D. S. qqman: an R package for visualizing GWAS results using Q-Q and manhattan plots. J. Open Source Softw. 3, 731 (2018).
  15. Kassambara, A. Ggpubr:’ggplot2′ based publication ready plots, R package version 0.6.0 (2023).
  16. Gormley, P. et al. Meta-analysis of 375,000 individuals identifies 38 susceptibility loci for migraine. Nat. Genet. 48, 856-866 (2016).
  17. Kanai, M. et al. Meta-analysis fine-mapping is often miscalibrated at single-variant resolution. Cell Genomics 14, 100210 (2022).
  18. Chen, W. et al. Improved analyses of GWAS summary statistics by reducing data heterogeneity and errors. Nat. Commun. 12, 7117 (2021).
  19. Giambartolomei, C. et al. Bayesian test for colocalisation between pairs of genetic association studies using summary statistics. PLoS Genet. 10, e1004383 (2014).
  20. Schubert, R. et al. Protein prediction for trait mapping in diverse populations. PLoS ONE 17, e0264341 (2022).
  21. Shang, L. et al. Genetic architecture of gene expression in European and African Americans: an eQTL mapping study in GENOA. Am. J. Hum. Genet. 106, 496-512 (2020).
  22. Zhang, J. et al. Plasma proteome analyses in individuals of European and African ancestry identify cis-pQTLs and models for proteome-wide association studies. Nat. Genet. 54, 593-602 (2022).
  23. Võsa, U. et al. Large-scale cis- and trans-eQTL analyses identify thousands of genetic loci and polygenic scores that regulate blood gene expression. Nat. Genet. 53, 1300-1310 (2021).
  24. Zhang, H. et al. Genome-wide association study identifies 32 novel breast cancer susceptibility loci from overall and subtype-specific analyses. Nat. Genet. 52, 572-581 (2020).
  25. Mägi, R. et al. Trans-ethnic meta-regression of genome-wide association studies accounting for ancestry increases power for discovery and improves fine-mapping resolution. Hum. Mol. Genet. 26, 3639-3650 (2017).
  26. Watanabe, K., Taskesen, E., van Bochoven, A. & Posthuma, D. Functional mapping and annotation of genetic associations with FUMA. Nat. Commun. 8, 1826 (2017).
  27. de Leeuw, C. A., Mooij, J. M., Heskes, T. & Posthuma, D. MAGMA: generalized gene-set analysis of GWAS data. PLoS Comput. Biol. 11, e1004219 (2015).
  28. Sey, N. Y. A. et al. A computational tool (H-MAGMA) for improved prediction of brain-disorder risk genes by incorporating brain chromatin interaction profiles. Nat. Neurosci. 23, 583-593 (2020).
  29. Gusev, A. et al. Integrative approaches for large-scale transcriptome-wide association studies. Nat. Genet. 48, 245-252 (2016).
  30. TWAS/FUSION project. Gusev Lab http://gusevlab.org/projects/ fusion/ (2022).
  31. Dataset summary of analysis samples. GTEx Portal https:// gtexportal.org/home/tissueSummaryPage (2019).
  32. Gaspar, H. A. et al. Using genetic drug-target networks to develop new drug hypotheses for major depressive disorder. Transl. Psychiatry 9, 117 (2019).
  33. Gerring, Z. F., Gamazon, E. R. & Derks, E. M., Major Depressive Disorder Working Group of the Psychiatric Genomics Consortium. A gene co-expression network-based analysis of multiple brain tissues reveals novel genes and molecular pathways underlying major depression. PLoS Genet. 15, e1008245 (2019).
  34. Pain, O. TWAS-plotter: R script to make Manhattan-style plot for TWAS. GitHub ().
  35. GeneCards. The GeneCards Human Gene Database https://www. genecards.org/ (2023)
  36. ChEMBL database. European Bioinformatics Institute https://www. ebi.ac.uk/chembl/ (2023).
  37. Wishart, D. S. in Principles of Pharmacogenetics and Pharmacogenomics (eds. Altman, R. B., Flockhart, D. & Goldstein, D. B.) 55-65 (Cambridge Univ. Press, 2012).
  38. Mendelian randomization with GWAS summary data. GitHub https://mrcieu.github.io/TwoSampleMR/index.html (2020).
  39. Hemani, G. et al. The MR-Base platform supports systematic causal inference across the human phenome. eLife 7, e34408 (2018).
  40. Turcot, V. et al. Protein-altering variants associated with body mass index implicate pathways that control energy intake and expenditure in obesity. Nat. Genet. 50, 26-41 (2018).
  41. Chen, J. et al. The trans-ancestral genomic architecture of glycemic traits. Nat. Genet. 53, 840-860 (2021).
  42. Graham, S. E. et al. The power of genetic diversity in genome-wide association studies of lipids. Nature 600, 675-679 (2021).
  43. Sakaue, S. et al. A cross-population atlas of genetic associations for 220 human phenotypes. Nat. Genet. 53, 1415-1424 (2021).
  44. Bowden, J. et al. A framework for the investigation of pleiotropy in two-sample summary data Mendelian randomization. Stat. Med. 36, 1783-1802 (2017).
  45. Verbanck, M., Chen, C.-Y., Neale, B. & Do, R. Detection of widespread horizontal pleiotropy in causal relationships inferred from Mendelian randomization between complex traits and diseases. Nat. Genet. 50, 693-698 (2018).

Acknowledgements

We are grateful to all the participants who took part in the studies and acknowledge the investigators involved in the participating studies. We thank all members of the UCL HumGen laboratory (https://www. uclhumgen.com/), who gave critical support and suggestions. We thank A. Henry, University College London, for discussions and suggestions in key analytic techniques. This work was conducted on the University College London Computer Science cluster; we thank the cluster team for the support provided. China Kadoorie Biobank’s most important acknowledgement is to the participants in the study. The investigators also acknowledge the invaluable contributions of the members of the survey teams in each of the ten regional centres, and of the project development and management teams based at Beijing, Oxford and the ten regional centres. China’s National Health Insurance provides electronic linkage to all hospital treatments. The Mexican Adolescent Mental Health Survey cohort thanks C. Benjet and E. Méndez for their contributions to the Mexican Adolescent Mental Health Survey cohort’s data acquisition and curation, respectively. Intern Health Study thanks the training physicians for taking part in the Intern Health Study. This project was funded by the National Institute of Mental Health (grant no. R01MH101459). MVP thanks the veterans who participate in the MVP. From the Yale Department of Psychiatry, Division of Human Genetics, we thank and acknowledge the efforts of A. M. Lacobelle, C. Robinson and C. Tyrell. Funding: this work was supported by funding from the Veterans Affairs Office of Research and Development MVP grant CX001849-01 (MVP025) and VA Cooperative Studies Program CSP575B. D.F.L. was supported by an NARSAD Young Investigator Grant from the Brain and Behavior Research Foundation. The BioVU study used for the analyses described was obtained from Vanderbilt University Medical Center’s BioVU, which is supported by numerous sources: institutional funding, private agencies and federal grants. These include the National Institutes of Health (NIH)-funded Shared Instrumentation grant S10RR025141; and Clinical and Translational Science Awards grants UL1TR002243, UL1TR000445 and UL1RRO24975. Genomic data are also supported by investigator-led projects that include U01HG004798, R01NS032830, RC2GM092618, P50GM115305, U01HG006378, U19HL065962 and R01HD074711; and additional funding sources listed at https://victr.vumc.org/ biovu-funding/. CONVERGE authors are part of the CONVERGE consortium (China, Oxford and Virginia Commonwealth University Experimental Research on Genetic Epidemiology) and gratefully acknowledge the support of all partners in hospitals across China. Special thanks to all the CONVERGE collaborators and patients who made this work possible. CONVERGE Consortium: N. Cai, T. B. Bigdeli, W. Kretzschmar, Y. Li, J. Liang, L. Song, J. Hu, Q. Li, W. Jin, Z. Hu, G. Wang, L. Wang, P. Qian, Y. Liu, T. Jiang, Y. Lu, X. Zhang, Y. Yin, Y. Li, X. Xu, J. Gao, M. Reimers, T. Webb, B. Riley, S. Bacanu, R.E. Peterson, Y. Chen, H. Zhong, Z. Liu, G. Wang, J. Sun, H. Sang, G. Jiang, X. Zhou, Y. Li, Y. Li, W. Zhang, X. Wang, X. Fang, R. Pan, G. Miao, Q. Zhang, J. Hu, F. Yu, B. Du, W. Sang, K. Li, G. Chen, M. Cai, L. Yang, D. Yang, B. Ha, X. Hong, H. Deng, G. Li, K. Li, Y. Song, S. Gao, J. Zhang, Z. Gan, H. Meng, J. Pan, C. Gao, K. Zhang, N. Sun, Y. Li, Q. Niu, Y. Zhang, T. Liu, C. Hu, Z. Zhang, L. Lv, J. Dong, X. Wang, M. Tao, X. Wang, J. Xia, H. Rong, Q. He, T. Liu, G. Huang, Q. Mei, Z. Shen, Y. Liu, J. Shen, T. Tian, X. Liu, W. Wu, D. Gu, G. Fu, J. Shi, Y. Chen, X. Gan, L. Liu, L. Wang, F. Yang,
E. Cong, J. Marchini, H. Yang, J. Wang, S. Shi, R. Mott, Q. Xu, J. Wang, K. S. Kendler and J. Flint. The AGDS is indebted to all of the participants for giving their time to contribute to this study. We thank all the people who helped in the conception, implementation, media campaign and data cleaning. We thank R. Parker, S. Cross and L. Sullivan for their valuable work coordinating all the administrative and operational aspects of the AGDS project. The 23andMe Study thanks the research participants and employees of 23andMe for making this work possible. Genes and Health thanks Social Action for Health, Centre of the Cell, members of our Community Advisory Group, and staff who have recruited and collected data from volunteers. We thank the NIHR National Biosample Centre (UK Biocentre), the Social Genetic and Developmental Psychiatry Centre (King’s College London), Wellcome Sanger Institute and the Broad Institute for sample processing, genotyping, sequencing and variant annotation. We thank Barts Health NHS Trust, NHS Clinical Commissioning Groups (City and Hackney, Waltham Forest, Tower Hamlets, Newham, Redbridge, Havering, Barking and Dagenham), East London NHS Foundation Trust, Bradford Teaching Hospitals NHS Foundation Trust, Public Health England (especially D. Wyllie), Discovery Data Service/Endeavour Health Charitable Trust (especially D. Stables) for General Data Protection Regulation compliant data sharing backed by individual written informed consent. Most of all we thank all of the volunteers participating in Genes and Health. Supplementary Tables 17-21 contain the complete list of members of the PGC-MDD Working Group, the 23andMe Research Team, the Genes and Health Research Team, the China Kadoorie Biobank Collaborative Group and the BioBank Japan Project. This study is part of a project that has received funding from the European Research Council under the European Union’s Horizon 2020 research and innovation program (grant agreement no. 948561) and from Wellcome (212360/Z/18/Z). Computing was supported by the Biotechnology and Biological Sciences Research Council (BB/ R01356X/1). D.K. is supported by the MSCA Individual Fellowship, European Commission (101028810). G.N. is supported by the Biotechnology and Biological Sciences Research Council, grant number BB/MOO9513/1. R.P. is supported by grants from the NIH (R33 DA047527; R21 DC018098) and One Mind Rising Star Award. G.A.P. is supported by the Yale Biological Sciences Training Program (T32 MH014276). P.-H.K. is supported by The Ministry of Science and Technology Project (MOST 108-2314-B-002-136-MY3), the National Health Research Institutes Project (NHRI-EX106-10627NI) and the National Taiwan University Career Development Project (109L7860). A.M.M. is supported by grants from the Wellcome Trust (226770/Z/22/Z, 223165/Z/21/Z, 220857/Z/20/Z and 216767/Z/19/Z), UK Research and Innovation (MR/SO35818/1 and MR/WO14386/1), the United States NIH (R01MH124873) and the European Union Horizon 2020 scheme (grant agreement 847776). M.J.A. is supported by grants from the Wellcome Trust (104036/Z/14/Z and 220857/Z/20/Z). The AGDS was primarily funded by the National Health and Medical Research Council (NHMRC) of Australia grant 1086683. This work was further supported by NHMRC grants 1145645, 1078901, 1113400 and 1087889 and NIMH. The QSkin study was funded by the NHMRC (grant numbers 1073898, 1058522 and 1123248). N.G.M. is supported through NHMRC investigator grant 1172990. W.E. is supported by National Institute of Drug Abuse grant R01DA009897. CONVERGE was funded by the Wellcome Trust (WT090532/Z/09/Z, WT083573/ Z/07/Z and WT089269/Z/09/Z) and by NIH grant MH100549. K.S.K. was supported by NIMH R01MH125938 and R21MH126358. R.E.P. was supported by NIMH R01MH125938, R21MH126358 and The Brain & Behavior Research Foundation NARSAD grant 28632P&S Fund. L.K.D. is supported by funding R01 MH118223. R.J.U., R.C.K. and M.B.S. are supported by the US Department of Defense. J.G. and the MVP study were supported by funding from the Veterans Affairs Office of Research and Development MVP grant CX001849-01 (MVP025) and
VA Cooperative Studies Program CSP575B. S.S. is supported by R01MH101459. M.U., D.E.W., and A.E.A. are supported by 2R01MD011728. C.S.C.-F. is supported by Cohen Veteran Bioscience, Mexico’s National Institute of Psychiatry, Mexico’s National Council of Science and Technology. The Hispanic Community Health Study/ Study of Latinos is a collaborative study supported by contracts from the National Heart, Lung, and Blood Institute (NHLBI) to the University of North Carolina (HHSN2682013000011/N01-HC-65233), University of Miami (HHSN268201300004I/N01-HC-65234), Albert Einstein College of Medicine (HHSN268201300002I/N01-HC-65235), University of Illinois at Chicago (HHSN268201300003I/ NO1-HC-65236 Northwestern University) and San Diego State University (HHSN268201300005I/N01-HC-65237). The following institutes/centers/offices have contributed to the HCHS/SOL through a transfer of funds to the NHLBI: National Institute on Minority Health and Health Disparities, National Institute on Deafness and Other Communication Disorders, National Institute of Dental and Craniofacial Research, National Institute of Diabetes and Digestive and Kidney Diseases, National Institute of Neurological Disorders and Stroke, NIH Institution-Office of Dietary Supplements. The Genetic Analysis Center at the University of Washington was supported by NHLBI and NIDCR contracts (HHSN268201300005C AMO3 and MODO3). The Hispanic Community Health Study/Study of Latinos also received support from the National Institutes of Health Award (R01MH113930). B.S.M. and W.E. are supported by the NIDA. J.A.R. and G.U. are supported by NIDA, NIA, VA, University of Maryland, Maryland VA Healthcare System, Baltimore Research and Education Foundation. The China Kadoorie Biobank baseline survey and the first re-survey were supported by the Kadoorie Charitable Foundation in Hong Kong. Long-term follow-up was supported by the Wellcome Trust (212946/Z/18/Z, 202922/Z/16/Z, 104085/Z/14/Z and 088158/Z/09/Z), the National Key Research and Development Program of China (2016YFC0900500, 2016YFC0900501, 2016YFC0900504 and 2016YFC1303904) and the National Natural Science Foundation of China (91843302). DNA extraction and genotyping was funded by GlaxoSmithKline, and the UK Medical Research Council (MC-PC-13049 and MC-PC-14135). The China Kadoorie Biobank is supported by core funding from the UK Medical Research Council (MC_UU_00017/1, MC_UU_12026/2 and MC_ U137686851), Cancer Research UK (C16077/A29186 and C500/ A16896) and the British Heart Foundation (CH/1996001/9454) to the Clinical Trial Service Unit and Epidemiological Studies Unit and to the MRC Population Health Research Unit at Oxford University. Genes and Health has recently been core-funded by Wellcome (WT102627 and WT210561), the Medical Research Council (UK) (M009017), Higher Education Funding Council for England Catalyst, Barts Charity (845/1796), Health Data Research UK (for London substantive site) and research delivery support from the NHS National Institute for Health Research Clinical Research Network (North Thames). Genes and Health has recently been funded by Alnylam Pharmaceuticals, Genomics PLC; and a Life Sciences Industry Consortium of BristolMyers Squibb Company, GlaxoSmithKline Research and Development Limited, Maze Therapeutics Inc, Merck Sharp & Dohme LLC, Novo Nordisk A/S, Pfizer Inc, Takeda Development Centre Americas Inc. C.M.L. and J.R.I.C. are part-funded by the NIHR Maudsley Biomedical Research Centre at South London and Maudsley NHS Foundation Trust and King’s College London (NIHR2O3318). Research reported in this publication was supported by the National Institute of Mental Health of the National Institutes of Health under award number R01MH124873. Statistical analyses were carried out on the Genetic Cluster Computer (http://www. geneticcluster.org) hosted by SURFsara and financially supported by the Netherlands Scientific Organization (NWO 480-05-003 PI: Posthuma) along with a supplement from the Dutch Brain Foundation and the VU University Amsterdam.

Author contributions

K.K. conceived this project and supervised the work. X.M., G.N. and K.K. wrote and critically revised the manuscript. C.M.L. critically revised the manuscript. X.M. and O.G. carried out the study-level GWAS analysis. Y. Feng carried out meta-analysis for studies of African ancestry. X.M. carried out all meta-analysis, loci and independent SNP identification, fine mapping and annotation including FUMA, MAGMA and Hi-C MAGMA. X.M. and G.N. carried out the transferability analyses. G.N. carried out the TWAS analysis and conducted the drug target look-up. D.K. and R.P. carried out the MR analysis. G.A.P. and R.P. carried out the QTL and colocalization analysis. G.N., X.M. and K.K. wrote and revised the study descriptions (Supplementary Note). A.M. provided support for analyses and result interpretation. M.V. and C.-Y.C. contributed to drafting and editing of the manuscript. For MVP, J.G. and M.B.S. are the principal investigators; J.M.G. and D.F.L. were involved in preparing data. For China Kadoorie Biobank, Z.C. and L.L. are the principal investigators; R.G.W. is the genomics lead; R.G.W. and I.Y.M. were involved in data collection; R.G.W. and K.L. carried out quality control and genome-wide association analysis; K.L. carried out the genotype imputation. For Genes and Health, D.A.v.H. is the principal investigator; B.T., S.F., N.B., H.C.M., V.K.C. and Q.Q.H. were involved in data collection and analysis. For the GREAT study cohort, P.-H.K. is the principal investigator; H.-C.C., S.-J.T. and Y.-L.L. were involved in data collection and analysis. For AGDS, N.G.M. and E.M.B. are the principal investigators; B.L.M. carried out data analysis. For CONVERGE, K.S.K. is the principal investigator; R.E.P. and N.C. were involved in data collection and analysis. For BioVU, L.K.D. is the principal investigator; K.’E.V.A. was involved in data collection and analysis. For Army STARRS, R.J.U. and M.B.S. are the principal investigators, and R.C.K. was involved in data collection and preparation. For Intern Health Study, S. Sen is the principal investigator; Y. Fang, L.J.S. and M.B. were involved in data collection and preparation. For BioMe, R.J.F.L. is the principal investigator and M.H.P. was involved in data collection and analysis. For 23 andMe, Y.J. and C.T. were involved in data collection and analysis. For the Drakenstein Child Health Study, D.J.S. and H.J.Z. are the principal investigators; M.L.C. and N.K. were involved in data collection and preparation. For the Detroit Neighborhood Health Study, M.U. is the principal investigator; A.H.W., D.E.W. and A.E.A. were involved in data collection and preparation. For the Mexican Adolescent Mental Health Survey Cohort, C.S.C.-F. is the principal investigator; G.A.M.-L., M.E.R. and A.I.C. were involved in data collection and analysis. For the Hispanic Community Health Study/Study of Latinos, E.C.D. and S.W.-S. are the principal investigators; T.S. was involved in data collection and analysis. For PIRC first generation trial, W.E. is the principal investigator; J.A.R., B.S.M. and G.U. were involved in data collection and analysis. For the BioBank Japan Project, Y.O. is the principal investigator; M.K. and S. Sakaue were involved in data collection and analysis. For PGC-MDD, C.M.L., S.A., J.R.I.C., A.M.M., M.J.A., S.K. and S.R. contributed to the PGC-MDD study of European ancestry. All authors read and critically revised the manuscript and made substantial intellectual contributions to the study. All authors approved the manuscript.

Competing interests

O.G. is now a full-time employee at Union Chimique Belge. A.I.C. is currently an employee of Regeneron Pharmaceuticals and may own stock or stock options. C.T. reported being an employee of and receiving stock options from 23 and Me during the conduct of the study. Y.J. reported being an employee of 23 andMe outside the submitted work. All other authors declare no competing interests.

Additional information

Extended data is available for this paper at
https://doi.org/10.1038/s41588-023-01596-4.
Supplementary information The online version contains supplementary material available at https://doi.org/10.1038/s41588-023-01596-4.
Correspondence and requests for materials should be addressed to Karoline Kuchenbaecker.
Peer review information Nature Genetics thanks Woojae Myung and the other, anonymous, reviewer(s) for their contribution to the peer review of this work. Peer reviewer reports are available.
Reprints and permissions information is available at www.nature.com/reprints.
Extended Data Fig. 1 | Manhattan plots for genetic associations with major depression in non-European ancestries. The -axes show the values for the associations between each single-nucleotide polymorphism and major depression. The -axes show the chromosomal position (GRCh37). The red line represents the genome-wide significance threshold of and the blue line . a, Manhattan plot for African ancestry. Due to the restriction that SNPs need to be available in at least two studies, only results for 6,051 variants were available
on the X chromosome. b, Manhattan plot for East Asian ancestry. c, Manhattan plot for Latin American ancestry. Association values have been adjusted by the LDSC intercept of 1.0508. d, Manhattan plot for South Asian ancestry. Only one cohort provided data for variants on the X chromosome. Those are not included because for the meta-analysis at least two cohorts were required to provide data for each variant.
Extended Data Fig. 2 | Manhattan plots for genetic associations with clinical major depression in individuals of non-European ancestries. The -axes show the values for the associations between each single-nucleotide polymorphism and major depression. The -axes show the chromosomal
position (GRCh37). The red line represents the genome-wide significance
threshold of and the blue line . a, Manhattan plot for African ancestry. b, Manhattan plot for East Asian ancestry. c, Manhattan plot for Latin American ancestry. d, Manhattan plot for South Asian ancestry.
Extended Data Fig. 3 | Manhattan plot for genetic associations with major depression in the multi-ancestry meta-analysis. The -axes show the values for the associations between each single-nucleotide polymorphism and
major depression. The -axes show the chromosomal position (GRCh37). The red line represents the genome-wide significance threshold of and the blue line . Association values have been adjusted by the LDSC intercept of 1.0185.
Extended Data Fig. 4 | Manhattan plot for genetic associations with clinical and major depression. The -axes show the chromosomal position (GRCh37). The major depression in the multi-ancestry meta-analysis. The -axes show the red line represents the genome-wide significance threshold of and the values for the associations between each single-nucleotide polymorphism blue line .

natureportfolio

Corresponding author(s):
Karoline Kuchenbaecker
Last updated by author(s): Sep 27, 2023

Reporting Summary

Nature Portfolio wishes to improve the reproducibility of the work that we publish. This form provides structure for consistency and transparency in reporting. For further information on Nature Portfolio policies, see our Editorial Policies and the Editorial Policy Checklist.

Statistics

For all statistical analyses, confirm that the following items are present in the figure legend, table legend, main text, or Methods section.

Confirmed

The exact sample size for each experimental group/condition, given as a discrete number and unit of measurement
A statement on whether measurements were taken from distinct samples or whether the same sample was measured repeatedly
The statistical test(s) used AND whether they are one- or two-sided
Only common tests should be described solely by name; describe more complex techniques in the Methods section.
A description of all covariates tested
A description of any assumptions or corrections, such as tests of normality and adjustment for multiple comparisons
A full description of the statistical parameters including central tendency (e.g. means) or other basic estimates (e.g. regression coefficient) AND variation (e.g. standard deviation) or associated estimates of uncertainty (e.g. confidence intervals)
For null hypothesis testing, the test statistic (e.g. ) with confidence intervals, effect sizes, degrees of freedom and value noted Give values as exact values whenever suitable.
For Bayesian analysis, information on the choice of priors and Markov chain Monte Carlo settings
For hierarchical and complex designs, identification of the appropriate level for tests and full reporting of outcomes
Estimates of effect sizes (e.g. Cohen’s , Pearson’s ), indicating how they were calculated
Our web collection on statistics for biologists contains articles on many of the points above.

Software and code

Policy information about availability of computer code

Data collection
Data analysis
Data collection not part of this study. No software was used for data collection.
Mixed-effect models were used in the association analysis for CKB, BioME, Genes & Health with SAIGE (version 0.36.1, version 0.37, or version 0.39). The CONVERGE study initially conducted mixed-effect model GWA tests with FastLMM (version 2.06.20130802), followed by PLINK logistic regressions to retrieve logORs. For the CONVERGE study, the logORs and standard errors from PLINK were used in our meta-analysis. The HCHS/SOL implemented mixed-effect model GWA tests to adjust for population structure and relatedness with depression as binary outcome and was run using GENESIS.
We implemented inverse-variance weighted fixed-effect meta-analyses using METAL (version 2011-03-25) and a multi ancestry metaregression using MR-MEGA (v.0.2).
To identify independent association signals, the GCTA (version 1.92 .0 beta2) forward selection and backward elimination process (command ‘cojo-slt’) were applied using the summary statistics from the multi-ancestry meta-analysis, with a multi ancestry LD reference panel.
We performed colocalization between genetic associations with MD and gene expression in brain and blood tissues from samples of European and African ancestry and Hispanic/Latinx participants using coloc R package (version).
The summary statistic from the multi-ancestry meta-analysis was first annotated with FUMA (v1.3.7).
Gene-based association analyses were implemented using Multi-marker Analysis of GenoMic Annotation (MAGMA, v1.08) and Hi-C coupled MAGMA (H-MAGMA).
To perform a transcriptome-wide association study (TWAS), the FUSION software was used.
We performed a bi-directional two-sample MR analysis using the TwoSampleMR R package (v0.5.6, https://mrcieu.github.io/TwoSampleMR/ index.html).
We estimated trans-ancestry genetic correlations using POPCORN v1.029,55,64. Pairwise correlations were calculated between each
For manuscripts utilizing custom algorithms or software that are central to the research but not yet described in published literature, software must be made available to editors and reviewers. We strongly encourage code deposition in a community repository (e.g. GitHub). See the Nature Portfolio guidelines for submitting code & software for further information.

Data

Policy information about availability of data

All manuscripts must include a data availability statement. This statement should provide the following information, where applicable:
  • Accession codes, unique identifiers, or web links for publicly available datasets
  • A description of any restrictions on data availability
  • For clinical datasets or third party data, please ensure that the statement adheres to our policy
GWAS summary statistics will be made available via the PGC website https://www.med.unc.edu/pgc/download-results/. Dataset identifier: ‘mdd2023diverse’. 23andMe, WHI and JHS do not permit sharing of genome-wide summary statistics. The full GWAS summary statistics for the 23andMe discovery data set will be made available through 23andMe to qualified researchers under an agreement with 23andMe that protects the privacy of the 23andMe participants. Please visit https://research.23andme.com/collaborate/#dataset-access/ for more information and to apply to access the data. Investigators can apply for access to WHI and JHS via dbgap https://www.ncbi.nlm.nih.gov/gap/.

Human research participants

Policy information about studies involving human research participants and Sex and Gender in Research.
Reporting on sex and gender We used biological sex in the study. It was determined based on the participants’ genotypes.
Population characteristics
The population characteristics of participants across multiple studies are as follows:
CKB Study: Mean age is 52.2 years (SD=10.7), with a female cohort.
CONVERGE Study: Mean age is 46.1 years, with an entirely female cohort.
Taiwan Study: Mean age is 49.2 years (SD=11.3), and 57.5% are female.
WHI Study: For different ancestries, the mean ages are as follows: 62.7 years (SD=7.5) for East Asians, 61.5 years (SD=7.1) for Africans, and 60.3 years (SD=6.7) for Hispanic/Latin Americans. The cohort is 100% female.
IHS Study: Mean ages by ancestry are 27.4 years (SD=2.4) for East Asians, 27.8 years (SD=2.7) for Africans, and 26.6 years (SD=2.1) for South Asians, with female proportions of 54.8%, 63.3%, and 46.9%, respectively.
UKB Study: Mean ages by ancestry are 52.1 years (SD=7.3) for East Asians, 50.7 years (SD=7.4) for Africans, and 53.0 years (SD=8.3) for South Asians. The cohort has 72.1%, 61%, and 43.8% females, respectively.
Army-STARRS Study: Mean ages by ancestry are 24.5 years (SD=6.3) for East Asians, 23.5 years (SD=5.7) for Africans, and 22.8 years (SD=5.1) for Hispanic/Latin Americans, with female proportions of 12.5%, 21.4%, and 15.4%, respectively.
BioMe Study: Mean age is 58.9 years, with females.
BBJ Study: Mean age is 63.0 years, with females.
AGDS Study: Mean age is 44.1 years (SD=15.1), with females.
IHS Study: Mean age is 55.2 years (SD=12.2), with females.
DCHS Study: Mean age is 26.4 years (SD=5.6), with an entirely female cohort.
HCHS/SOL Study: Mean age is 46 years (SD=14), with females.
DNHS Study: Mean age is 53.2 years (SD=16.6), with females.
PIRC Study: Mean age is 29 years, with females.
MAMHS Study: Mean age is 14.28 years, with females.
ProMIS Study: Mean age is 28.2 years (SD=6.3), with an entirely female cohort.
Further details on population characteristics are provided in Supplementary Table 1, titled “Cohort Summary.”
Recruitment We provide detailed descriptions of the 21 cohorts included in this study in the supplementary material.
Ethics oversight Each of the cohorts included was approved by a relevant ethics review board and we have listed the details in the manuscript.
Note that full information on the approval of the study protocol must also be provided in the manuscript.

Field-specific reporting

Please select the one below that is the best fit for your research. If you are not sure, read the appropriate sections before making your selection.
Life sciences
Behavioural & social sciences
Ecological, evolutionary & environmental sciences
For a reference copy of the document with all sections, see nature.com/documents/nr-reporting-summary-flat.pdf

Life sciences study design

All studies must disclose on these points even when the disclosure is negative.
Sample size To determine sample size we added up the number of participants of each study that was included in a given analysis.
Data exclusions We restricted the downstream analysis to genetic variants with imputation accuracy info score of 0.7 or higher and effective allele count (2maf(1-maf)NR2) of 50 or higher. For study of small sample size, we instead required a minor allele frequency of no less than 0.05 . The alleles for indels were re-coded as “I” for the longer allele and “D” for the shorter one. Indels of different patterns at the same position were removed.
Replication
All available cohorts of major depression cases and controls were included in the primary multi-ancestry meta-analysis and therefore we do not perform replication for significant loci we identified from the multi-ancestry meta-analysis in independent cohorts.
We tested replication of previously identified loci linked to depression from European ancestry across non-European ancestry groups and this is described in the manuscript as transferability. Add some more information as requested by editors.
Randomization This was a genetic association study. Allocation by genotype.
Blinding This was a genetic association study, ie observational design. So no blinding was used.

Reporting for specific materials, systems and methods

We require information from authors about some types of materials, experimental systems and methods used in many studies. Here, indicate whether each material, system or method listed is relevant to your study. If you are not sure if a list item applies to your research, read the appropriate section before selecting a response.
Materials & experimental systems Methods
n/a Involved in the study n/a Involved in the study
ChIP-seq
Eukaryotic cell lines
Palaeontology and archaeology
MRI-based neuroimaging
Animals and other organisms
Clinical data
Dual use research of concern