لقد أثبت دمج الهياكل النانوية من المعادن النبيلة، وخاصة جزيئات الفضة النانوية، في تصميمات أجهزة الاستشعار أنه يعزز أداء أجهزة الاستشعار عبر مقاييس رئيسية، بما في ذلك زمن الاستجابة، والاستقرار، والحساسية. ومع ذلك، لا يزال هناك فجوة حاسمة في فهم المساهمات الفريدة لمختلف معلمات التخليق على هذه التحسينات. تتناول هذه الدراسة هذه الفجوة من خلال فحص كيفية تأثير عوامل مثل درجة الحرارة، ووقت النمو، واختيار عوامل التغطية على شكل وحجم الهياكل النانوية، مما يحسن أداء أجهزة الاستشعار في ظروف متنوعة. باستخدام نترات الفضة وبوروهيدريد الصوديوم، تم إنشاء جزيئات بذور فضية، تلتها نمو محكوم في محلول يحتوي على أيونات فضية إضافية. تم تنظيم حجم وشكل الهياكل النانوية الناتجة لتحقيق خصائص مثالية للاستشعار الكيميائي الحيوي في الشبكات اللاسلكية لأجهزة الاستشعار. أظهرت النتائج أن تضمين هذه الهياكل النانوية في مصفوفات بولي فينيل الكحول (PVA) أدى إلى استقرار متفوق، حيث حافظت على 93% من الفعالية على مدى 30 يومًا مقارنة بـ 70% في بولي إيثيلين جلايكول (PEG). كشفت مقاييس الأداء عن تحسينات كبيرة: تقليل أوقات الاستجابة (1.2 مللي ثانية مقابل 1.5 مللي ثانية عند تركيز المحلل صفر) واستجابات أسرع عند مستويات أعلى من المحلل (0.2 مللي ثانية). تؤكد هذه النتائج أن درجات حرارة التخليق الأعلى والتحكم الدقيق في الشكل تساهم في هياكل نانوية أكبر وأكثر استقرارًا. إن الاستقرار المحسن والاستجابة يسلطان الضوء على إمكانيات الهياكل النانوية من المعادن النبيلة لتطبيقات أجهزة الاستشعار القابلة للتوسع والدائمة، مما يقدم تقدمًا كبيرًا على الطرق الحالية.
الكلمات الرئيسية: الهياكل النانوية • جهاز استشعار • بوروهيدريد الصوديوم • عوامل التغطية • الاستشعار الكيميائي الحيوي • بولي فينيل الكحول • بولي إيثيلين جلايكول
1 المقدمة
يعد الاستشعار الكيميائي الحيوي أمرًا أساسيًا في مجالات مثل الرعاية الصحية، ورصد البيئة، وسلامة الغذاء، والتكنولوجيا الحيوية، حيث يكشف عن المواد البيولوجية أو الكيميائية لتوفير بيانات حيوية. في الرعاية الصحية، تدعم هذه الأجهزة التشخيص، ورصد الأمراض، والعلاج، مع أجهزة استشعار الجلوكوز لإدارة مرض السكري وأجهزة الاستشعار الحيوية للكشف المبكر عن حالات مثل السرطان، مما يعزز نتائج المرضى [1]. تدعم أجهزة الاستشعار القابلة للارتداء التي تراقب العلامات الحيوية، مثل معدل ضربات القلب ومستويات الأكسجين، المراقبة الصحية في الوقت الحقيقي والرعاية الوقائية. يستفيد رصد البيئة من الاستشعار الكيميائي الحيوي للكشف عن الملوثات، والسموم، والجراثيم في الهواء، والماء، والتربة، مما يساعد على حماية النظم البيئية
والصحة العامة [2]. على سبيل المثال، يمكن لأجهزة الاستشعار الحيوية في الماء تحديد البكتيريا الضارة، مما يضمن مياه شرب آمنة، وتكتشف أجهزة استشعار جودة الهواء الغازات الضارة، مما يساعد على منع الأمراض التنفسية. في الزراعة، تراقب أجهزة الاستشعار الكيميائية الحيوية صحة التربة وظروف المحاصيل، مما يعزز الاستخدام الفعال للموارد وتحسين العائد. تستفيد سلامة الغذاء من الاستشعار الكيميائي الحيوي من خلال تحديد الملوثات، مثل الجراثيم، والسموم، والمواد المسببة للحساسية، مما يمنع الأمراض المنقولة عن طريق الغذاء ويحافظ على معايير الجودة [3]. تضمن أجهزة الاستشعار التي تكشف عن الإشريكية القولونية أو السالمونيلا في الغذاء حماية الصحة العامة وتقليل الفاقد من خلال مراقبة النضارة [4]. تعتمد تطبيقات التكنولوجيا الحيوية على الاستشعار الكيميائي الحيوي لتطوير الأدوية، والتحليل الجيني، والبحث الخلوي. تتيح أجهزة الاستشعار مثل اختبارات المناعية المرتبطة بالإنزيم (ELISAs) قياس دقيق للبروتينات والأجسام المضادة، وهو أمر حيوي في علم المناعة وبحوث الأمراض [5].
يعزز دمج الاستشعار الكيميائي الحيوي مع الشبكات اللاسلكية لأجهزة الاستشعار (WSNs) قدرات المراقبة والكفاءة. تتكون الشبكات اللاسلكية لأجهزة الاستشعار من أجهزة استشعار لاسلكية موزعة مكانيًا، مما يسمح بالمراقبة المستمرة في الوقت الحقيقي على مساحات واسعة [6]. هذا ذو قيمة في رصد البيئة، حيث يتيح الكشف المبكر عن التلوث استجابة سريعة [7]. في الرعاية الصحية، يسمح دمج الشبكات اللاسلكية لأجهزة الاستشعار مع أجهزة الاستشعار الكيميائية الحيوية للأجهزة القابلة للارتداء بمراقبة العلامات الحيوية والعلامات الكيميائية الحيوية، مثل الجلوكوز، مع نقل البيانات في الوقت الحقيقي للتدخل في الوقت المناسب والرعاية الشخصية، مما يلغي الإجراءات الغازية [8]. تستفيد تطبيقات سلامة الغذاء من الشبكات اللاسلكية لأجهزة الاستشعار من خلال تتبع الظروف مثل درجة الحرارة، والرطوبة، والملوثات طوال الإنتاج والتوزيع، مما يمنع الفساد ويقلل من مخاطر الأمراض المنقولة عن طريق الغذاء [3]. بالإضافة إلى ذلك، في الزراعة، تعمل أجهزة الاستشعار الكيميائية الحيوية المدمجة في الشبكات اللاسلكية لأجهزة الاستشعار على تحسين استخدام الموارد والإنتاجية من خلال مراقبة صحة التربة، والمواد الغذائية، وحالة المحاصيل، مما يؤدي إلى ممارسات فعالة وتحسين العوائد [3].
2 مراجعة الأدبيات
تم استخدام أجهزة الاستشعار الكهروكيميائية، مثل أجهزة الاستشعار البوتنشيومترية والأمبيرومترية، على نطاق واسع في الاستشعار الكيميائي الحيوي بسبب حساسيتها العالية وخصوصيتها. تقيس أجهزة الاستشعار البوتنشيومترية التغيرات في الجهد بسبب التفاعلات الكيميائية الحيوية وتستخدم عادةً لاستشعار درجة الحموضة والأقطاب الانتقائية للأيونات [9]. من ناحية أخرى، تقيس أجهزة الاستشعار الأمبيرومترية التيار الناتج عن تفاعلات الأكسدة أو الاختزال، مما يجعلها مثالية لتطبيقات مثل مراقبة الجلوكوز والكشف عن الملوثات البيئية. تقدم هذه الأجهزة قدرات مراقبة في الوقت الحقيقي وسهلة النسخ المصغر للتكامل مع الشبكات اللاسلكية لأجهزة الاستشعار. على الرغم من مزاياها، تواجه أجهزة الاستشعار الكهروكيميائية تحديات مثل القابلية للتداخل من أنواع كيميائية أخرى، والاستقرار المحدود مع مرور الوقت، والحاجة إلى المعايرة المتكررة [10]. بالإضافة إلى ذلك، يمكن أن تتأثر أدائها بتغيرات في درجة الحرارة ودرجة الحموضة، مما قد يؤدي إلى قراءات غير دقيقة. كما أن الحاجة إلى مصدر طاقة مستمر لنقل البيانات في الشبكات اللاسلكية لأجهزة الاستشعار تشكل تحديًا في البيئات النائية أو ذات الموارد المحدودة [11].
تكتشف أجهزة الاستشعار الضوئية، بما في ذلك مطيافية الامتصاص ومطيافية الفلورية، المواد الكيميائية الحيوية من خلال تفاعلها مع الضوء. تقيس مطيافية الامتصاص كمية الضوء الممتص بواسطة عينة عند أطوال موجية محددة، وهو مفيد للكشف عن جزيئات حيوية متنوعة [12]. تستخدم مطيافية الفلورية علامات فلورية تصدر الضوء عند التحفيز، مما يوفر حساسية عالية للكشف عن تركيزات منخفضة من المحللات. تعتبر الرنين السطحي البلازمي (SPR) طريقة بصرية أخرى تقيس التغيرات في معامل الانكسار بالقرب من سطح المستشعر، مما يكون مفيدًا لدراسة التفاعلات الجزيئية والكشف عن الجزيئات الحيوية [13]. على الرغم من أن أجهزة الاستشعار الضوئية حساسة للغاية، إلا أنها غالبًا ما تتطلب أدوات معقدة وضخمة، مما يجعل النسخ المصغر للتكامل مع الشبكات اللاسلكية لأجهزة الاستشعار تحديًا. كما يمكن أن تتأثر بالعوامل البيئية مثل الضوء المحيط، وتقلبات درجة الحرارة، ووجود مواد فلورية أخرى، مما قد يتداخل مع القياسات الدقيقة. بالإضافة إلى ذلك، يمكن أن تزيد الحاجة إلى مصادر ضوء خارجية وأنظمة كشف متطورة من استهلاك الطاقة والتعقيد في تطبيقات الشبكات اللاسلكية لأجهزة الاستشعار [14].
تعمل المستشعرات الكهروضغطية، مثل مقياس توازن البلورات الكوارتزية (QCM)، بناءً على مبدأ أن بعض المواد تولد شحنة كهربائية استجابةً للإجهاد الميكانيكي [15]. يمكن لهذه المستشعرات اكتشاف التغيرات في الكتلة على سطح المستشعر من خلال قياس تغير التردد لبلورة الكوارتز، مما يجعلها مفيدة لدراسة تفاعلات البروتين-الليغاند والمراقبة البيئية. تُقدَّر مستشعرات QCM لحساسيتها العالية وقدرتها على توفير مراقبة في الوقت الحقيقي للتفاعلات الجزيئية [16]. القيد الرئيسي للمستشعرات الكهروضغطية هو حساسيتها للعوامل البيئية مثل درجة الحرارة والرطوبة، والتي يمكن أن تسبب انحرافًا وتؤثر على الدقة. بالإضافة إلى ذلك، غالبًا ما تتطلب هذه المستشعرات معالجة إشارة متطورة ومعايرة للحفاظ على الأداء. يمكن أن يكون دمج المستشعرات الكهروضغطية مع الشبكات اللاسلكية للمستشعرات تحديًا بسبب استهلاكها العالي نسبيًا للطاقة والحاجة إلى ظروف بيئية مستقرة لضمان نقل البيانات بشكل موثوق وتشغيل المستشعر [17]. يوفر الجدول 1 مقارنة بين عدة طرق استشعار حالية للتطبيقات البيوكيميائية.
الجدول 1 مقارنة بين تقنيات الاستشعار المختلفة للتطبيقات البيوكيميائية
تقنية الاستشعار
المزايا
العيوب
المستشعرات الجهدية
حساسية عالية، مفيدة لاستشعار الرقم الهيدروجيني، كشف الأيونات
عرضة للتداخل، استقرار محدود، تتطلب معايرة متكررة
المستشعرات الأمبيرومترية
مثالية للكشف القائم على الأكسدة/الاختزال، مراقبة في الوقت الحقيقي
تتأثر بتغيرات درجة الحرارة والرقم الهيدروجيني، تتطلب مصدر طاقة مستمر
المستشعرات الضوئية
حساسية عالية، متعددة الاستخدامات في كشف الجزيئات الحيوية
أجهزة قياس معقدة، إعدادات ضخمة، تداخل من الضوء المحيط
المستشعرات الكهروضغطية
مراقبة في الوقت الحقيقي، حساسة لتغيرات الكتلة
حساسية بيئية (درجة الحرارة، الرطوبة)، مشاكل انحراف
3 العمل المقترح
3.1 آلية تكوين ونمو البذور
تبدأ عملية تنفيذ تخليق الهياكل النانوية الفضية بإنشاء جزيئات بذور فضية صغيرة، والتي تعمل كمواقع نواة. تتضمن الخطوة الأولية عادةً تقليل محلول نترات الفضة باستخدام عامل اختزال قوي، مثل بوروهيدريد الصوديوم. تؤدي هذه العملية إلى تكوين جزيئات بذور فضية صغيرة. تعتبر هذه الجزيئات الأولية حاسمة حيث تعمل كنوى أساسية يمكن أن يحدث عليها ترسيب فضة إضافية خلال مرحلة النمو اللاحقة. بمجرد تشكيل جزيئات البذور بنجاح، يتم إدخالها في محلول نمو يحتوي على أيونات فضة إضافية وعامل اختزال أكثر اعتدالًا، مثل حمض الأسكوربيك. يتم التحكم بدقة في ظروف محلول النمو لضمان ترسيب الأيونات الفضية الإضافية على جزيئات البذور الموجودة بدلاً من تكوين جزيئات جديدة. يعد هذا التحكم الدقيق في عملية الترسيب ضروريًا لنمو جزيئات البذور إلى هياكل نانوية أكبر ومحددة جيدًا.
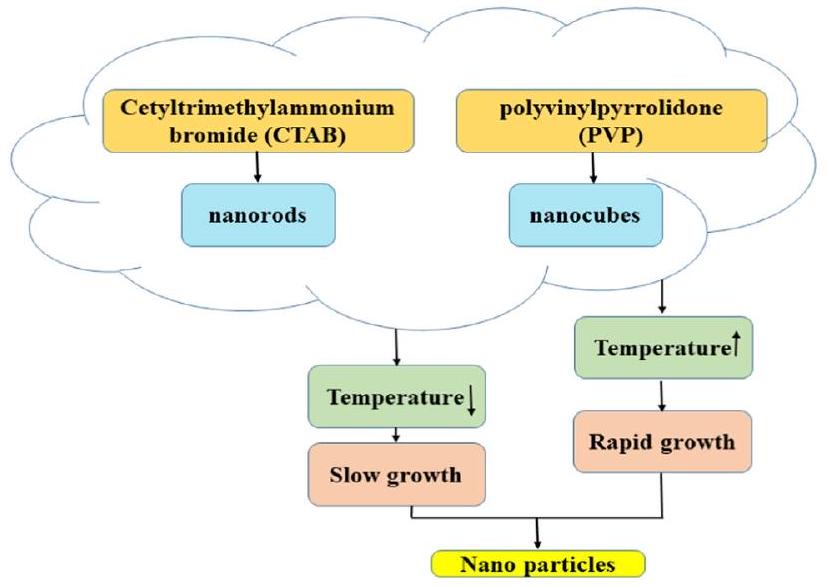
يمكن ضبط نمو جزيئات البذور إلى هياكل نانوية أكبر بدقة من خلال تعديل عدة معلمات كما هو موضح في الشكل 1. تشمل هذه المعلمات تركيز أيونات الفضة في محلول النمو، ونوع وتركيز عامل الاختزال، ووجود عوامل تغليف محددة. يعد اختيار عوامل التغليف المحددة والمصفوفات البوليمرية أمرًا حاسمًا لتحسين خصائص أداء المستشعر. تؤثر عوامل التغليف، مثل بروميد سيتيل تريميثيل الأمونيوم (CTAB)، على شكل الهياكل النانوية، مما يؤثر على المساحة السطحية والتفاعل [21]. على سبيل المثال، يعزز CTAB تكوين القضبان النانوية، مما يمكن أن يعزز تأثيرات الرنين البلازمي السطحي، مما يحسن الحساسية للمستشعرات الضوئية. من ناحية أخرى، توفر المصفوفات البوليمرية بيئة داعمة للهياكل النانوية، مما يؤثر على الاستقرار الميكانيكي، والتوصيل، والتفاعل مع المواد المستهدفة. يمكن اختيار البوليمرات مثل الكحول البولي فينيل (PVA) أو البولستيرين لخصائصها المواتية، مثل المرونة وسهولة المعالجة. يهدف الاختيار المشترك لعوامل التغليف والبوليمرات إلى تحقيق تشتت مثالي، واستقرار، وزيادة الحساسية، مما يضمن أداء فعال للمستشعر. ومع ذلك، يمكن أن يؤدي هذا النمو السريع أحيانًا إلى أشكال أقل انتظامًا. على العكس من ذلك، يمكن أن تؤدي درجات الحرارة المنخفضة إلى إبطاء عملية النمو، مما يسمح بتكوين جزيئات أكثر تحكمًا وانتظامًا. كما تؤثر مدة تفاعل النمو على الهياكل النانوية النهائية. توفر أوقات التفاعل الأطول المزيد من الفرص لترسيب أيونات الفضة على جزيئات البذور، مما يمكن أن يؤدي إلى نمو أكثر شمولاً وقد يمكّن من تحويل الأشكال.
سيبدأ الخطة التجريبية باختبار تركيزات مختلفة من نترات الفضة وبوروهيدريد الصوديوم لتحسين مرحلة تكوين البذور الأولية. ستستخدم مراحل النمو حمض الأسكوربيك تحت ظروف درجة حرارة ووقت متغيرة ( ) لمراقبة التأثيرات على حجم الجزيئات وانتظامها. ستشمل التجارب عدة تجارب مع CTAB وPVA كعوامل تغليف، إلى جانب مقارنات مع بوليمرات بديلة، لتقييم الفروق في أداء المستشعر. سيتم تأكيد القابلية للتكرار من خلال إجراء تجارب ثلاثية وقياس التناسق في شكل الجزيئات وخصائصها الضوئية.
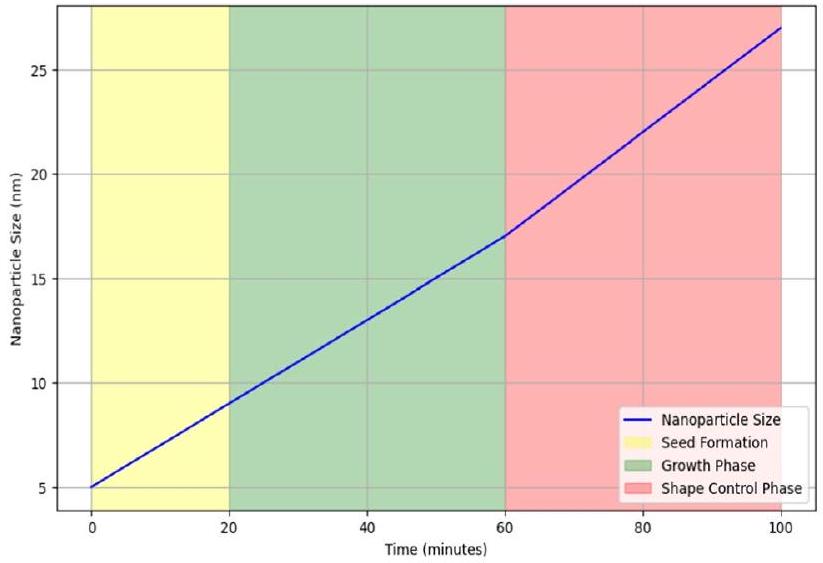
يوضح الشكل 2 عملية نمو البذور المدعومة للهياكل النانوية الفضية، مع تسليط الضوء على ثلاث مراحل. في البداية، خلال مرحلة تكوين البذور ( )، تتكون جزيئات بذور فضية صغيرة. في مرحلة النمو ( )، تترسب أيونات فضة إضافية على هذه البذور، مما يزيد بشكل مطرد من حجم الجسيمات النانوية. أخيرًا، مرحلة التحكم في الشكل
الشكل 1 العوامل المؤثرة في نمو وشكل الهياكل النانوية الفضية
الشكل 2 عملية نمو البذور المدعومة للهياكل النانوية الفضية
( ) تتضمن تعديل ظروف النمو مثل عوامل التغليف ودرجة الحرارة للتحكم في شكل الجسيمات النانوية، مما يؤدي إلى زيادة تدريجية في الحجم. تتيح هذه الطريقة التحكم الدقيق في حجم وشكل الهياكل النانوية الفضية، مما يعزز قابليتها للتطبيق في تقنيات المستشعرات المختلفة. يمثل دمج الهياكل النانوية من المعادن النبيلة في المصفوفات البوليمرية نهجًا متطورًا في تعزيز الاستشعار البيوكيميائي ضمن الشبكات اللاسلكية للمستشعرات. تظهر المعادن النبيلة مثل الفضة خصائص فريدة على النطاق النانوي، بما في ذلك نسبة عالية من المساحة السطحية إلى الحجم، وتأثيرات بلازما، ونشاط تحفيزي، وهي مفيدة لتطبيقات الاستشعار [18]. إن تضمين هذه الهياكل النانوية في المصفوفات البوليمرية يخدم عدة أغراض حاسمة في سياق تكنولوجيا المستشعر.
أولاً، توفر المصفوفة البوليمرية بيئة مستقرة وواقية للهياكل النانوية الحساسة. المعادن النانوية مثل الفضة عرضة بشدة للأكسدة والتدهور البيئي، مما يمكن أن يهدد قدراتها على الاستشعار بمرور الوقت. من خلال تغليفها داخل بوليمر، مثل الكحول البولي فينيل (PVA) أو بولي إيثيلين جلايكول (PEG)، يتم حماية الهياكل النانوية من الاتصال المباشر مع العناصر المسببة للتآكل المحتملة في بيئة الاستشعار [19]. تضمن هذه الحماية الوظائف المستمرة والموثوقية للمستشعرات، وهو أمر حاسم لتطبيقات المراقبة المستمرة. ثانيًا، يمكن تصميم المصفوفة البوليمرية للتفاعل بشكل تآزري مع الهياكل النانوية من المعادن النبيلة، مما يعزز أدائها في الاستشعار. على سبيل المثال، يمكن تصميم البوليمرات لتسهيل تفاعلات محددة مع المواد المستهدفة، مما يحسن انتقائية وحساسية المستشعر. يمكن أن ترتبط المجموعات الوظيفية أو الروابط داخل المصفوفة البوليمرية بشكل انتقائي بالجزيئات الحيوية أو الأنواع الكيميائية ذات الاهتمام، مما يعزز الكشف الفعال حتى عند التركيزات المنخفضة [20]. هذه القدرة مفيدة بشكل خاص في المراقبة الطبية والبيئية، حيث يكون الكشف الدقيق والسريع عن المواد المستهدفة أمرًا بالغ الأهمية.
علاوة على ذلك، فإن دمج الهياكل النانوية من المعادن النبيلة في مصفوفات البوليمر يمكّن من تصنيع منصات استشعار مرنة وخفيفة الوزن. تتطلب الشبكات اللاسلكية للاستشعار حساسات ليست فقط حساسة وانتقائية ولكن أيضًا قوية وقابلة للتكيف مع سيناريوهات النشر المختلفة. تلبي الحساسات المعتمدة على البوليمر التي تتضمن معادن نانوية هذه المتطلبات من خلال تقديم مرونة في التصميم والنشر. يمكن دمجها بسهولة في الأجهزة القابلة للارتداء، أو تضمينها في محطات مراقبة البيئة، أو نشرها في مواقع نائية دون المساس بالأداء. علاوة على ذلك، فإن استخدام مصفوفات البوليمر يسهل التصنيع القابل للتوسع وبتكلفة فعالة للحساسات. تعتمد الاستجابة الحساسة للحساسات على التفاعلات بين المحللات المستهدفة والهياكل النانوية داخل مصفوفة البوليمر. تشمل العوامل الرئيسية مساحة السطح، حيث تعزز زيادة مساحة سطح الهيكل النانوي من احتمالية تفاعل المحلل، مما يزيد من الحساسية. يسمح تفعيل الهياكل النانوية بالارتباط الانتقائي بمحللات معينة، مما يحسن دقة الكشف. تتغير ديناميات نقل الشحنة عند سطح الهيكل النانوي عند ارتباط المحلل، مما يؤثر على الإشارات الكهربائية. بالإضافة إلى ذلك، بالنسبة للهياكل النانوية المعدنية، فإن الرنين السطحي المحلولي المحلي (LSPR) يعزز الإشارات الضوئية، مما يساهم في زيادة الحساسية. البوليمرات متوافقة مع مجموعة واسعة من تقنيات التصنيع بما في ذلك الطلاء الدوراني، والطباعة النفاثة، وتجميع الميكروفلويديك، مما يسمح بالإنتاج الضخم للحساسات بتكاليف منخفضة مقارنة بالطرق التقليدية. هذه القابلية للتوسع ضرورية للنشر الواسع لشبكات الاستشعار في الرعاية الصحية والزراعة ومراقبة العمليات الصناعية.
3.2 جزيئات الفضة النانوية في مصفوفات البوليمر
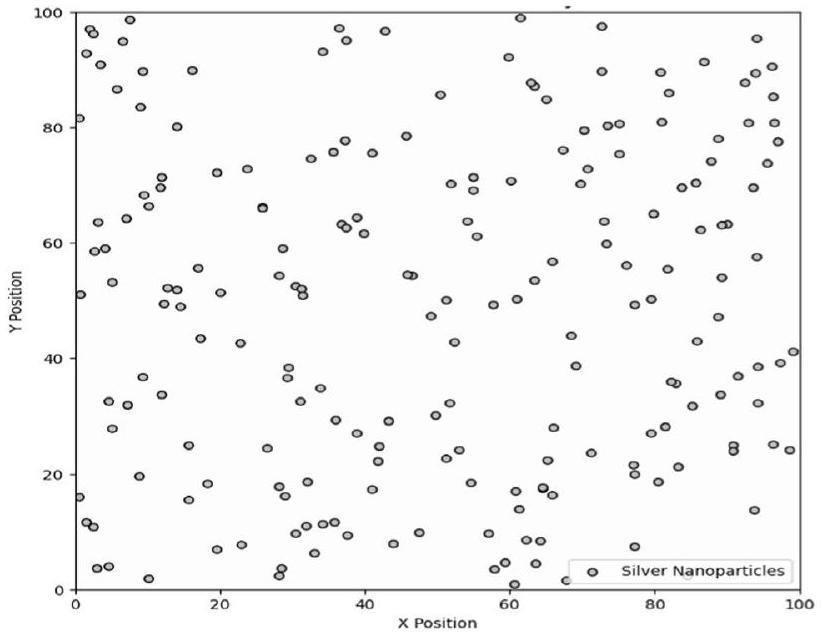
يوفر الشكل 3 توضيحًا نوعيًا للتوزيع المكاني لجزيئات الفضة النانوية، مع تسليط الضوء على انتشارها العام عبر منطقة معينة. يهدف هذا الشكل إلى إعطاء انطباع عام عن وضع الجسيمات وتجمعها
الشكل 3 الهياكل النانوية المدمجة في مصفوفة البوليمر
ميول بدلاً من أن تكون مستمدة من قياسات تجريبية محددة أو بيانات نظرية. يمثل الخلفية الزرقاء الفاتحة البوليمر، مما يوفر بيئة مستقرة للجزيئات النانوية. توضح النقاط الفضية المتناثرة عشوائيًا داخل هذه المصفوفة توزيع الجزيئات النانوية، مما يرمز إلى احتوائها داخل البوليمر. يضمن هذا الاحتواء استقرار ووظائف الهياكل النانوية، مما يحميها من التدهور البيئي. تساعد مخطط التشتت في تصور كيفية دمج الجزيئات النانوية في مصفوفة البوليمر، مع تسليط الضوء على ترتيبها المتناثر وإمكانية تحسين الاستشعار البيوكيميائي في تطبيقات مختلفة، مثل الشبكات اللاسلكية للاستشعار للمراقبة والتشخيص في الوقت الحقيقي. يعد نشر عقد الاستشعار الخطوة الحاسمة التالية. يتم وضع هذه العقد، المدمجة بهياكل نانوية من المعادن النبيلة، بشكل استراتيجي عبر المنطقة المستهدفة بناءً على المسح الأولي. يجب أن يضمن التوزيع أن كل عقدة يمكنها التواصل مع عدة عقد مجاورة، مما يساهم في إنشاء شبكة شبكية. يجب وضع العقد لتعظيم التغطية وضمان مراقبة المناطق الحرجة بشكل كافٍ. يسمح التكرار الموجود في طوبولوجيا الشبكة للشبكة بالحفاظ على الوظائف حتى إذا أصبحت بعض العقد غير فعالة بسبب الظروف البيئية أو أعطال الأجهزة. يمكن أن يُعزى تحسين أداء الاستشعار من خلال دمج الهياكل النانوية الفضية إلى عدة آليات، بما في ذلك زيادة مساحة السطح، والرنين السطحي المحلولي المحلي، وزيادة نقل الإلكترون. تساهم هذه العوامل مجتمعة في تحسين الحساسية والانتقائية في عمليات الكشف. على سبيل المثال، يمكن أن يسهل وجود الهياكل النانوية امتصاص المحللات المستهدفة، مما يزيد من الاستجابة الفعالة للحساس.
يوضح الشكل 4 الاستقرار المقارن للهياكل النانوية الفضية المدمجة في مصفوفات بولي فينيل الكحول (PVA) وبولي إيثيلين جلايكول (PEG) على مدى فترة 30 يومًا. يظهر أن سلامة الهيكل النانوي في مصفوفة PVA تبقى مرتفعة باستمرار، حيث تنخفض قليلاً فقط من 100 إلى . بالمقابل، تظهر مصفوفة PEG انخفاضًا أكثر وضوحًا، حيث تنخفض من 100
الشكل 4 استقرار الهياكل النانوية الفضية في مصفوفة البوليمر
إلى على مدى نفس الفترة. يشير هذا إلى أن PVA يوفر بيئة أكثر استقرارًا بشكل ملحوظ للهياكل النانوية الفضية مقارنةً بـ PEG. الاستقرار على المدى الطويل وإمكانية إعادة الإنتاج للحساسات المطورة أمران حاسمان لتطبيقها العملي. لتقييم هذه المعايير، تم إخضاع الحساسات لاختبارات الشيخوخة المعجلة وقياسات متكررة على مر الزمن. تشير النتائج إلى أن الحساسات تحافظ على أداء ثابت على مدى فترات طويلة، مما يظهر استقرارًا جيدًا. بالإضافة إلى ذلك، تم تقييم إمكانية إعادة الإنتاج من خلال تصنيع عدة حساسات تحت ظروف متطابقة، مما يؤكد أداءً مشابهًا عبر العينات.
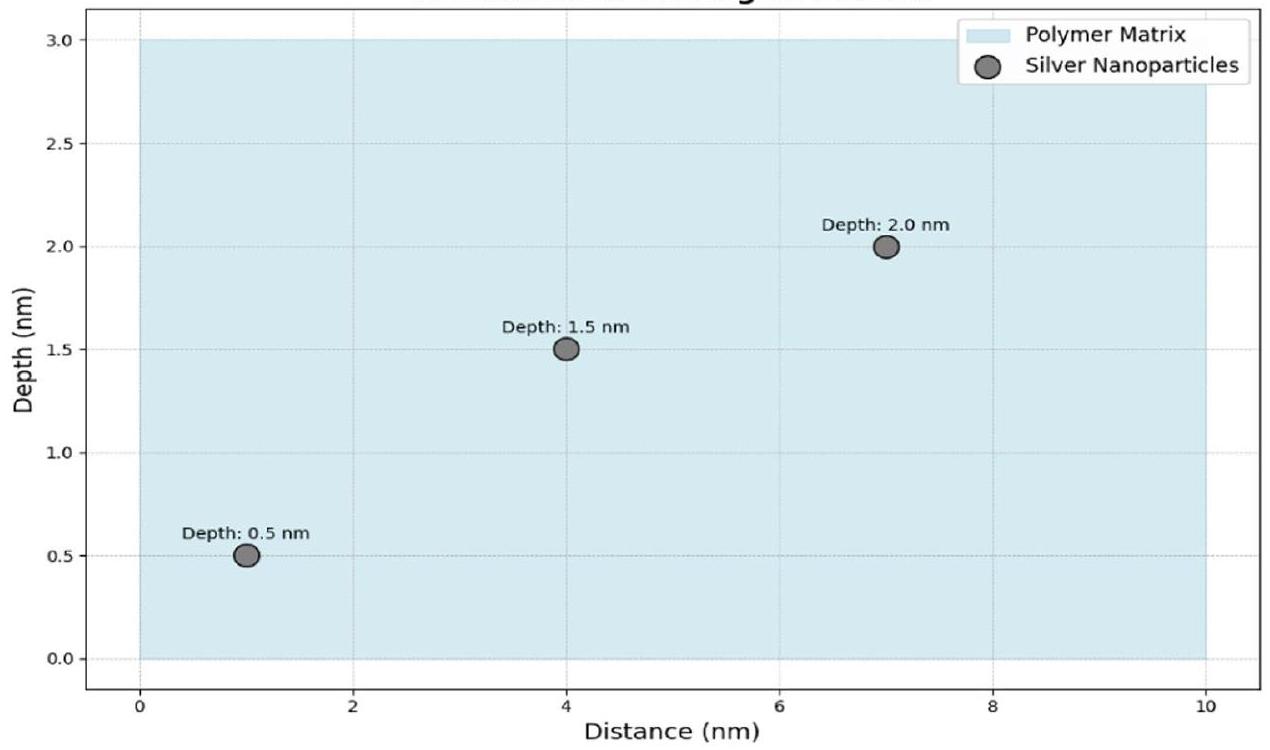
تم اختيار جزيئات الفضة النانوية لخصائصها البلازمونية القوية، التي تكون حساسة للغاية للتغيرات في البيئة العازلة المحيطة. كما هو موضح في الشكل 5، يتم اختيار مصفوفات البوليمر بناءً على توافقها مع كل من الجزيئات النانوية والجزيئات الحيوية المستهدفة. يتم تصنيع جزيئات الفضة النانوية باستخدام طرق مثل الاختزال الكيميائي أو الإزالة بالليزر، مما يضمن التحكم في حجمها وشكلها وتوزيعها داخل مصفوفة البوليمر. يتم استخدام تقنيات التوصيف مثل مطيافية الأشعة فوق البنفسجية والمرئية، والمجهر الإلكتروني النافذ، والمجهر الإلكتروني الماسح للتحقق من خصائصها البصرية والهيكلية. سيتم تقييم البيانات في مراحل مختلفة، بدءًا من التكوين الأولي لبذور الفضة خلال مراحل نموها. سيتم استخدام المجهر الإلكتروني النافذ والمجهر الإلكتروني الماسح لقياس حجم الجسيمات وتوزيعها، بينما ستراقب مطيافية الأشعة فوق البنفسجية والمرئية الرنين البلازموني، مما يوفر رؤى حول استقرار الجسيمات وتجانسها. ستقوم بيانات دراسات الاستقرار بتقييم السلامة الهيكلية والوظيفية على مر الزمن، وهو أمر أساسي للتطبيقات العملية في شبكات الاستشعار.
ثم يتم تضمين جزيئات الفضة النانوية في مصفوفة البوليمر من خلال تقنيات مثل خلط المحلول، الطلاء الدوراني، أو النسيج الكهربائي. يعد التحكم الدقيق في تركيز الجزيئات النانوية وتشتتها أمرًا حاسمًا لتحقيق توزيع موحد وزيادة كفاءة SPR. للتحكم في تشتت الهياكل النانوية الفضية في مصفوفة البوليمر، يمكن استخدام تقنيات مختلفة، بما في ذلك صب المذيب، والتسونيد، واستخدام المواد السطحية أو المثبتات. يعد التشتت الأمثل أمرًا حيويًا لتعزيز أداء الاستشعار، حيث يمكن أن يؤدي التكتل إلى تقليل كفاءة الحساس. من خلال تحسين تركيز الهياكل النانوية واستخدام طرق مثل الخلط عالي القص أو البلمرة في الموقع، يمكن تحقيق توزيع موحد. يتم حساب طول الموجة الرنيني () لـ SPR باستخدام الثوابت العازلة ( و) لمصفوفة البوليمر).
لتحليل البيانات، سيتم استخدام نظرية ميا والتقريبات ماكسويل-غارنيت لنمذجة حسابات طول الموجة الرنيني، مع الأخذ في الاعتبار شكل الجزيئات النانوية وتوزيعها داخل مصفوفة البوليمر. ستقوم الطرق الكمية بتحليل طيف الامتصاص وخصائص SPR، بينما ستعمل المحاكاة الحاسوبية على تحسين حجم الجسيمات وشكلها للمحللات المستهدفة. سيستخدم التحليل أدوات البرمجيات مثل MATLAB وPython لتطوير النماذج وتفسير البيانات.
يتضمن هذا الحساب نماذج نظرية مثل نظرية ميا أو تحليل العناصر المحدودة (FEA)، مع الأخذ في الاعتبار شكل وحجم الجزيئات النانوية وترتيبها المكاني داخل البوليمر.
طول الموجة الرنيني: 500 نانومتر
الشكل 5 تحليل عمق الجزيئات النانوية في مصفوفة البوليمر
حيث هو سرعة الضوء، و هو الثابت العازل للمعدن (الفضة)، و هو الثابت العازل للوسط المحيط (مصفوفة البوليمر). هذه المعادلة تستند إلى نظرية ميا، التي نمذجة كيفية تشتت الجزيئات النانوية وامتصاصها للضوء. طول الموجة الرنيني أمر حاسم لأنه يحدد حساسية مستشعر SPR؛ أي تغيير في يشير إلى ارتباط المحللات بسطح الجسيمات النانوية، مما يعزز موثوقية الكشف. بالنسبة لمادة مركبة تحتوي على كسور حجمية من الجسيمات النانوية () ومصفوفة البوليمر ()، يمكن تقريب الثابت الكهربائي الفعال () باستخدام نظرية ماكسويل-غارنيت:
تفترض نظرية ماكسويل-غارنيت أن الجسيمات النانوية موزعة بالتساوي داخل المصفوفة وأن خصائصها البصرية تضاف. هذا الثابت ضروري للتنبؤ بكيفية تفاعل المادة المركبة مع الضوء، مما يؤثر على الاستجابة البصرية لجهاز الاستشعار. يمكن وصف الامتصاص للجسيمات النانوية الفضية المدمجة في مصفوفة البوليمر عند ذروة SPR بواسطة قانون لامبرت-بير
حيث هو الامتصاص المولي، وccc هو تركيز الجسيمات النانوية، و هو طول مسار العينة. يُستخدم هذا القانون على نطاق واسع في الطيفية لتحديد تركيز المحللات، مما يجعله معادلة أساسية لمعايرة أجهزة الاستشعار. هذه العلاقة حاسمة لتحديد الخصائص البصرية للجسيمات النانوية. تتأثر تردد الرنين للجسيمات النانوية الفضية بحجمها وشكلها. بالنسبة للجسيمات الكروية الصغيرة، يمكن تعديل شرط الرنين بواسطة حجم الجسيم () باستخدام التقريب شبه الساكن:
حيث هو تردد الرنين الزاوي، و هو تردد البلازما للمعدن الكتلي، و هو الثابت الكهربائي الخلفي للمعدن، و هو نصف قطر الجسيمات النانوية. يتم تحسين تصميم أجهزة استشعار SPR بناءً على الحسابات والتحقق التجريبي. يشمل ذلك تصميم هندسة المستشعر (مثل الأفلام الرقيقة أو الهياكل النانوية)، وتحسين زاوية سقوط الضوء، ودمج المكونات البصرية المناسبة للكشف عن الإشارة. أثناء التشغيل، يتفاعل مستشعر SPR مع الجزيئات الحيوية التي ترتبط بسطح الجسيمات النانوية داخل مصفوفة البوليمر. يتسبب هذا الارتباط في تحول في طول موجة الرنين، والذي يتم مراقبته في الوقت الحقيقي باستخدام تقنيات الطيف. يتم تعزيز حساسية المستشعر بواسطة تعزيز المجال الكهرومغناطيسي عند ، مما يمكّن من الكشف الدقيق وكمية تفاعل الجزيئات الحيوية. يتم تقييم استقرار مستشعر SPR في ظروف بيئية متنوعة (مثل درجة الحرارة والرطوبة) وتحسينه من خلال استراتيجيات تفعيل السطح المناسبة أو استراتيجيات التغطية. يضمن ذلك أداء موثوق وطول عمر المستشعر في التطبيقات العملية.
3.3 النشر المتقدم وتشغيل الشبكات اللاسلكية
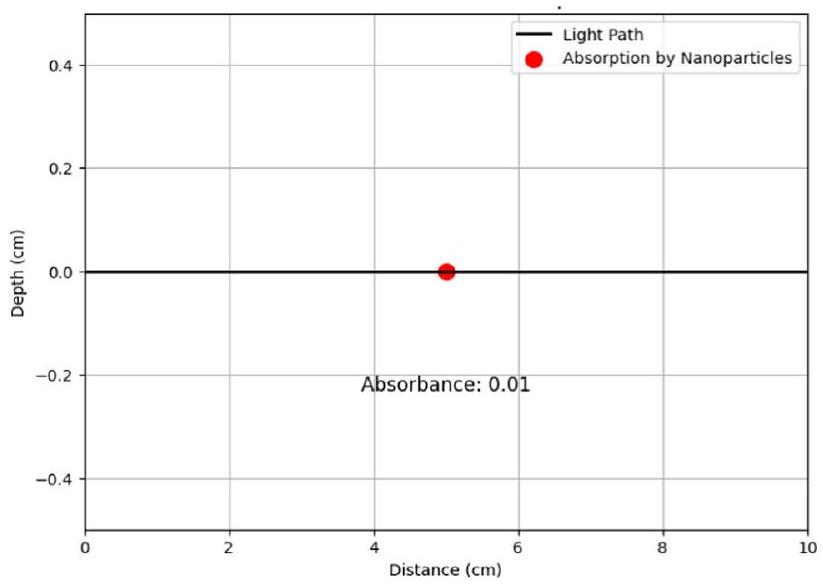
تنفيذ قانون بير-لامبرت ( ɛ.c.l) يحدد امتصاص الضوء بواسطة الجسيمات النانوية الفضية في البوليمرات. توضح الشكل 6 العلاقة بين الامتصاص (A)، الامتصاص المولي ()، التركيز (c)، وطول المسار (I) كما هو موصوف بواسطة قانون بير-لامبرت. يظهر كيف تعزز الجسيمات النانوية الفضية المدمجة في مصفوفات البوليمر امتصاص الضوء، مما يحسن حساسية وخصوصية الشبكات اللاسلكية (WSNs) للكشف عن المواد الكيميائية الحيوية. تساعد البيانات المقدمة في معايرة المستشعرات وتحسين أدائها. تلعب الجسيمات النانوية الفضية، بفضل خصائصها البصرية الفريدة، دورًا حاسمًا في تحسين حساسية وخصوصية مستشعرات WSN للكشف عن المحللات الكيميائية الحيوية. من خلال الاستفادة من قانون بير-لامبرت، الذي يحدد امتصاص الضوء بواسطة الجسيمات النانوية، يمكننا تحديد تركيز المحللات المستهدفة بدقة في بيئة الاستشعار. تتضمن هذه الطريقة تضمين الجسيمات النانوية الفضية داخل مصفوفات البوليمر، حيث يتم تحديد تفاعلها مع الضوء الساقط بدقة باستخدام الطيف فوق البنفسجي-المرئي. توفر أطياف الامتصاص المستخلصة رؤى مباشرة حول فعالية الجسيمات النانوية في امتصاص الضوء عند أطوال موجية محددة، وهو أمر حاسم لمعايرة المستشعر وتحسين الأداء. تسهل التمثيلات الرسومية لهذه التفاعلات تحليلًا مفصلًا لأنماط الامتصاص، مما يساعد في تصميم مستشعرات عالية الحساسية. لا تعزز هذه التطورات موثوقية ودقة الكشف الكيميائي الحيوي في WSN فحسب، بل توسع أيضًا إمكانيات التطبيق في مجالات مثل مراقبة البيئة، وتشخيص الرعاية الصحية، وسلامة الغذاء. في النهاية، يمثل دمج الجسيمات النانوية داخل WSN
الشكل 6 قانون بير-لامبرت للامتصاص
المنصات نهجًا متقدمًا لتطوير تقنيات المستشعر، مما يعد بإحداث ثورة في المراقبة والتحليل في بيئات تشغيل متنوعة كما هو موضح في الشكل 7.
يمكن تمثيل التوزيع الاستراتيجي للعقد من خلال سلسلة من المعادلات التي تصف المواقع المثلى وتفاعلات العقد داخل الشبكة. على سبيل المثال، قد تعرف دالة الهدف منطقة تغطية الشبكة بناءً على إحداثيات لكل عقدة ، بينما تضمن القيود أن تحافظ كل عقدة على الاتصال مع جيرانها:
حيث يمثل المنطقة المغطاة بواسطة العقدة هو كثافة العقد، و هو المسافة بين العقدتين و . يوفر رسم توزيع العقد والتغطية، المعبر عنه رياضيًا، نظرة عامة واضحة على تخطيط الشبكة ويبرز أيضًا مناطق الازدواجية. تعتبر الازدواجية في الشبكة ميزة رئيسية، حيث تضمن أن الشبكة يمكن أن تحافظ على سلامة التشغيل حتى في حالة فشل العقد أو التحديات البيئية. تعمل العقد الزائدة كنسخ احتياطية، مما يمكّن الشبكة من إعادة توجيه البيانات والحفاظ على العمليات السلسة دون انقطاعات كبيرة. يمكن وصف الازدواجية رياضيًا بواسطة:
الشكل 7 تحليل تغطية عقدة مستشعر WSN
حيث يمثل مجموعة العقد المجاورة للعقدة iii. يأخذ النشر الاستراتيجي أيضًا في الاعتبار عوامل مختلفة مثل التضاريس، والعقبات، والظروف البيئية، التي يمكن أن تؤثر على أداء الشبكة وتغطيتها. يتم تضمين هذه العوامل في مشكلة التحسين كقيود ومعلمات إضافية:
حيث يمثل التأثير البيئي على العقدة و يمثل العقبات. من خلال دمج هذه العوامل، يمكن تحسين خطة النشر للتغلب على التحديات المحتملة، مما يعزز متانة وموثوقية الشبكة. لا تضمن هذه الطريقة المراقبة المستمرة وجمع البيانات فحسب، بل تحسن أيضًا استخدام الموارد. من خلال زيادة كفاءة كل عقدة والشبكة بشكل عام، تتطلب الموارد الأقل لتحقيق مستويات التغطية والأداء المطلوبة. تؤدي هذه التحسينات إلى توفير التكاليف وتمديد عمر الشبكة. يمكن تحديد كفاءة استخدام الموارد على النحو التالي:
حيث هو التغطية المقدمة بواسطة العقدة و هو استهلاك الطاقة للعقدة .
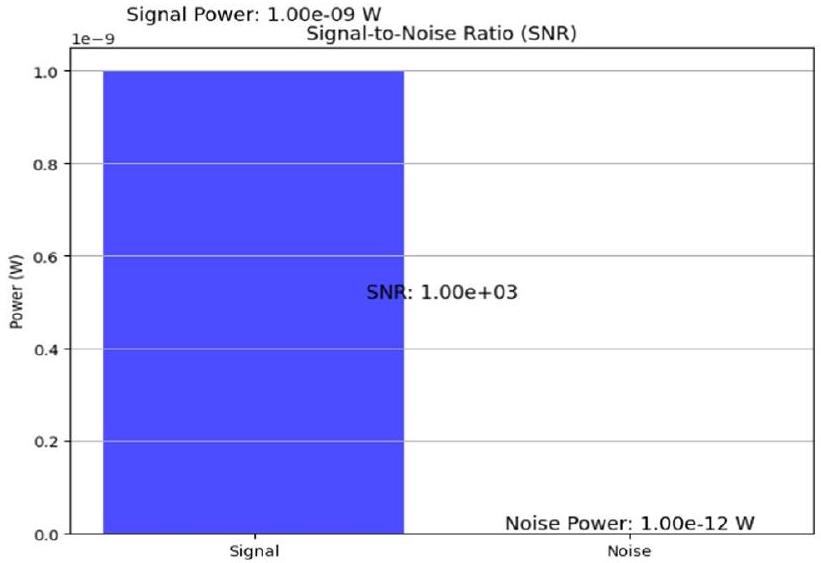
تقييم نسبة الإشارة إلى الضوضاء يتحقق من فعالية عقدة المستشعر في الكشف عن الإشارات الكيميائية الحيوية وسط الضوضاء الخلفية. الشكل 8، يقارن مستويات طاقة الإشارة والضوضاء، موضحًا قدرة المستشعر على تمييز سلامة الإشارة عن التداخل البيئي. هذا التقييم حاسم لضمان جمع بيانات موثوقة ودقيقة في سيناريوهات تطبيق متنوعة، مما يعزز الأداء العام للمستشعر وجودة البيانات. بعد نشر العقد، يجب تكوين الشبكة ومعايرتها. تتضمن هذه الخطوة إعداد بروتوكولات الاتصال، وضمان أن كل عقدة يمكنها نقل البيانات بفعالية إلى جيرانها والمحور المركزي. تضمن المعايرة أن المستشعرات تقيس بدقة المعلمات المطلوبة، مثل مستويات المواد الكيميائية الحيوية، أو درجة الحرارة، أو الرطوبة. قد تتضمن عملية المعايرة ضبط حساسية المستشعر واختبار نطاقات الاتصال لضمان الأداء الأمثل. هذه الخطوة حاسمة لضمان أن الشبكة تعمل بكفاءة وتوفر بيانات موثوقة. مع تشغيل الشبكة بالكامل، تصبح إدارة البيانات والتحليل هي النقاط المحورية. يتم نقل البيانات التي تجمعها عقد المستشعر عبر الشبكة الشبكية إلى محور مركزي أو عدة محاور، حيث يتم تجميعها ومعالجتها. تضمن الطبيعة القوية لتوبولوجيا الشبكة أن البيانات من جميع العقد تُنقل بشكل موثوق، حتى إذا فشلت بعض العقد [21]. يمكن تطبيق تحليلات البيانات المتقدمة لتفسير البيانات المجمعة، مما يوفر رؤى قيمة.
الشكل 8 نسبة الإشارة إلى الضوضاء
في الظروف البيئية، والتغيرات البيوكيميائية، وغيرها من المعايير المراقبة. يمكن استخدام هذه المعلومات للمراقبة في الوقت الحقيقي، والتحليل التنبؤي، وعمليات اتخاذ القرار.
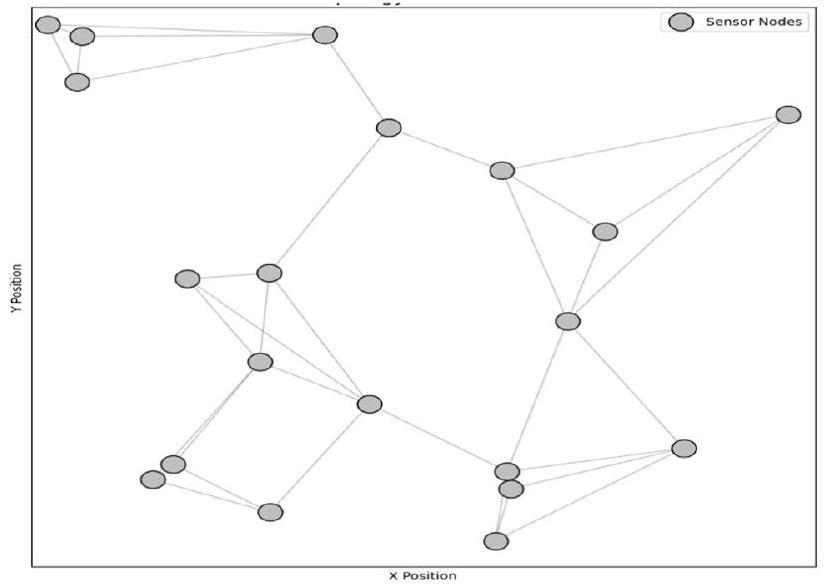
توضح الشكل 9 طوبولوجيا الشبكة الشبكية لشبكة استشعار لاسلكية تحتوي على عقد استشعار مزودة بهياكل نانوية من المعادن النبيلة في شبكة المنطقة المنزلية [22،23]. يظهر الرسم البياني 20 عقدة موزعة عشوائيًا عبر منطقة محددة، كل منها ممثلة بنقطة فضية. ترتبط العقد بأقرب ثلاثة جيران لها بخطوط رمادية، مما يوضح هيكل الشبكة الشبكية [24]. يسمح هذا التكوين الشبكي بنقل البيانات بشكل قوي، حتى في حالة فشل بعض العقد. تساعد هذه التصويرية في فهم التوزيع الاستراتيجي وترابط العقد لضمان تغطية فعالة، واكتساب موثوق للبيانات، واتصالات مرنة ضمن الطوبولوجيا الشبكية.
4 النتائج والمناقشة
4.1 النتائج
يتطلب الإعداد التجريبي لدراسة الهياكل النانوية للمعادن النبيلة [25،26] ودمجها في مصفوفات البوليمر مختبرًا مجهزًا جيدًا. تشمل المعدات الأساسية مطيافًا لقياس الخصائص البصرية، ومجاهر إلكترونية (SEM/TEM) لتصوير الهياكل النانوية، ومحللات حجم الجسيمات للتوصيف. تعتبر البيئات ذات التحكم في درجة الحرارة مثل حمامات الماء أو الأفران ضرورية للتحكم في ظروف التخليق. تم إجراء تخليق الهياكل النانوية الفضية باستخدام محلول نترات الفضة بتركيز 0.01 م ومحلول بوروهيدريد الصوديوم بتركيز 0.002 م كعامل مختزل. شملت عملية تكوين البذور الأولية تحريك المزيج لمدة 30 دقيقة في درجة حرارة الغرفة.في مرحلة النمو، تم إضافة محلول أيون الفضة بتركيز 0.05 م بشكل قطرة قطرة، مع وجود عامل تغليف PVP) للتحكم في حجم الجسيمات، وتم تسخين خليط التفاعل عند لمدة 60 دقيقة. تم تعديل الرقم الهيدروجيني إلى 8 باستخدام محلول مخفف من هيدروكسيد الصوديوم، وتم تحريك المحلول باستمرار بسرعة 500 دورة في الدقيقة لضمان نمو مت uniform.
تُستخدم أدوات البرمجيات مثل MATLAB أو Python مع المكتبات ذات الصلة لتحليل البيانات، بما في ذلك التحليل الإحصائي ورسم نتائج التجارب. قد يتم استخدام برمجيات الكيمياء الحاسوبية أو الفيزياء لمحاكاة ديناميات نمو الهياكل النانوية، مما يعزز الفهم النظري. تركز النتائج على تقييم مؤشرات الأداء الرئيسية مثل أوقات الاستجابة، وزيادة الحساسية، والاستقرار تحت ظروف بيئية متغيرة. تسلط النتائج الضوء على كيفية تأثير دمج الهياكل النانوية على قدرات المستشعرات، مع معالجة التحديات في المراقبة في الوقت الحقيقي والموثوقية. علاوة على ذلك، سيتم مناقشة اعتبارات الجدوى الاقتصادية ومعلمات التخليق مثل درجة الحرارة لتوضيح الآثار الأوسع لنشر المستشعرات عبر التطبيقات الطبية الحيوية والبيئية والصناعية.
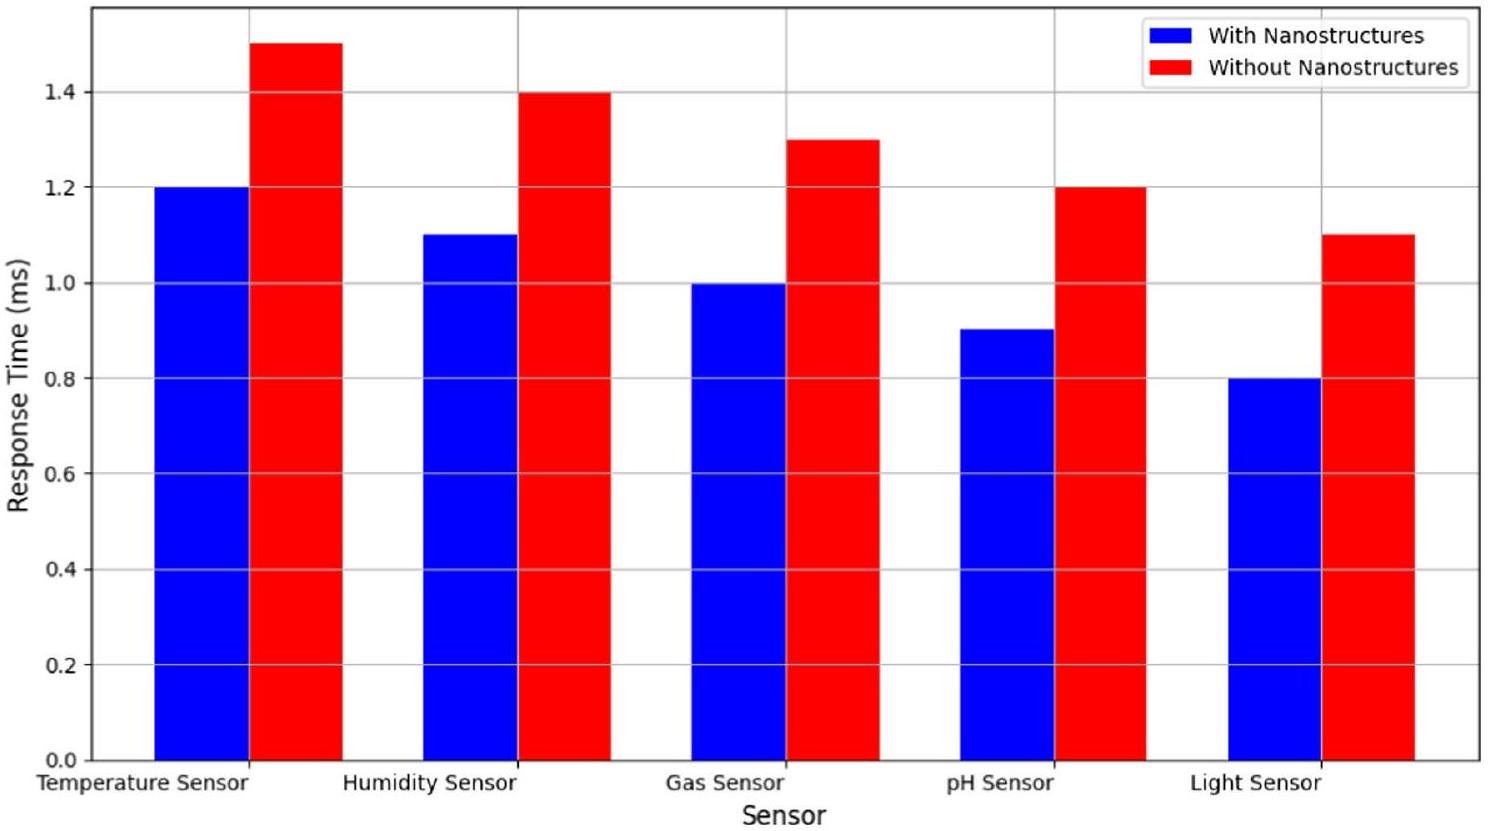
الشكل 10 يقارن أوقات استجابة المستشعرات التي تحتوي على هياكل نانوية من المعادن النبيلة وتلك التي لا تحتوي عليها عبر أنواع مختلفة من المستشعرات: مستشعرات الحرارة، والرطوبة، والغاز، ودرجة الحموضة، والضوء. وقت الاستجابة، الذي يقاس بالمللي ثانية، يشير إلى مدى سرعة اكتشاف المستشعر واستجابته للتغيرات في بيئته [30]. الشكل 4 يوضح بوضوح أن المستشعرات [31] المدمجة مع هياكل نانوية من المعادن النبيلة تظهر عمومًا أوقات استجابة أقل مقارنةً بنظيراتها التي لا تحتوي على هياكل نانوية [32، 33]. هذا الانخفاض الكبير في وقت الاستجابة أمر حاسم للتطبيقات التي تتطلب مراقبة في الوقت الحقيقي واكتشاف سريع للتغيرات البيئية. يمكن أن يُعزى تحسين استجابة المستشعرات المدمجة بالهياكل النانوية إلى تحسين نسبة مساحة السطح إلى الحجم وخصائصها الحفزية، مما يسهل التفاعل الأسرع.
الشكل 9 طوبولوجيا الشبكة لعقد المستشعر
الشكل 10 مقارنة أوقات استجابة المستشعر
مع المواد المستهدفة [34]. لذلك، يُظهر الرسم البياني بفعالية كيف أن دمج الهياكل النانوية يعزز أداء المستشعر من خلال تسريع أوقات الاستجابة، مما يحسن الكفاءة التشغيلية العامة في تطبيقات الشبكات الاستشعارية اللاسلكية [35].
يوفر الشكل 11 تحليلًا مقارنًا لتكلفة كل وحدة استشعار بين المستشعرات المدمجة مع الهياكل النانوية للمعادن الثمينة وتلك التي لا تحتوي عليها. يمثل كل عمود نوعًا محددًا من المستشعرات، مما يبرز الآثار المالية لاعتماد المستشعرات ذات الهياكل النانوية في الشبكات الاستشعارية اللاسلكية [36، 37]. يتم تحديد تكلفة كل مستشعر مع وبدون الهياكل النانوية من خلال تحليل تكاليف المواد والتصنيع والاختبار. بالنسبة للمستشعرات التي لا تحتوي على هياكل نانوية، تشمل النفقات المكونات القياسية وطرق الإنتاج. بالمقابل، تتضمن المستشعرات التي تحتوي على هياكل نانوية تكاليف إضافية للحصول على ودمج مواد مثل جزيئات الفضة النانوية، بالإضافة إلى عمليات تصنيع قد تكون أكثر تعقيدًا.
الشكل 11 مقارنة تكلفة كل مستشعر
قد تبرر الأداء والحساسية [38] التكاليف الأعلى من خلال تحسين الموثوقية وتقليل تكرار الاختبارات. في النهاية، يسمح تحليل التكلفة الشامل، بما في ذلك وفورات الحجم، بمقارنة واضحة للتداعيات المالية المرتبطة بكل نوع من أنواع المستشعرات. تكشف البيانات أن المستشعرات التي تحتوي على هياكل نانوية من المعادن النبيلة تتكبد عمومًا تكاليف أولية أعلى بسبب المواد وعمليات التصنيع المرتبطة بدمج الهياكل النانوية. ومع ذلك، تشير الرسوم البيانية أيضًا إلى إمكانية تحقيق وفورات في التكاليف على المدى الطويل المرتبطة بهذه المستشعرات، مثل تقليل تكاليف الصيانة والاستبدال بفضل متانتها وموثوقيتها المحسّنة. من خلال قياس الاستثمار الأولي والفوائد طويلة الأجل، تساعد الرسوم البيانية صانعي القرار في تقييم الجدوى الاقتصادية لنشر المستشعرات ذات الهياكل النانوية في تطبيقات الشبكات الاستشعارية المختلفة. كما تبرز التوازنات بين الاستثمار الأولي والمدخرات التشغيلية المستقبلية، مما يدعم اتخاذ قرارات مستنيرة في استثمارات تكنولوجيا المستشعرات.
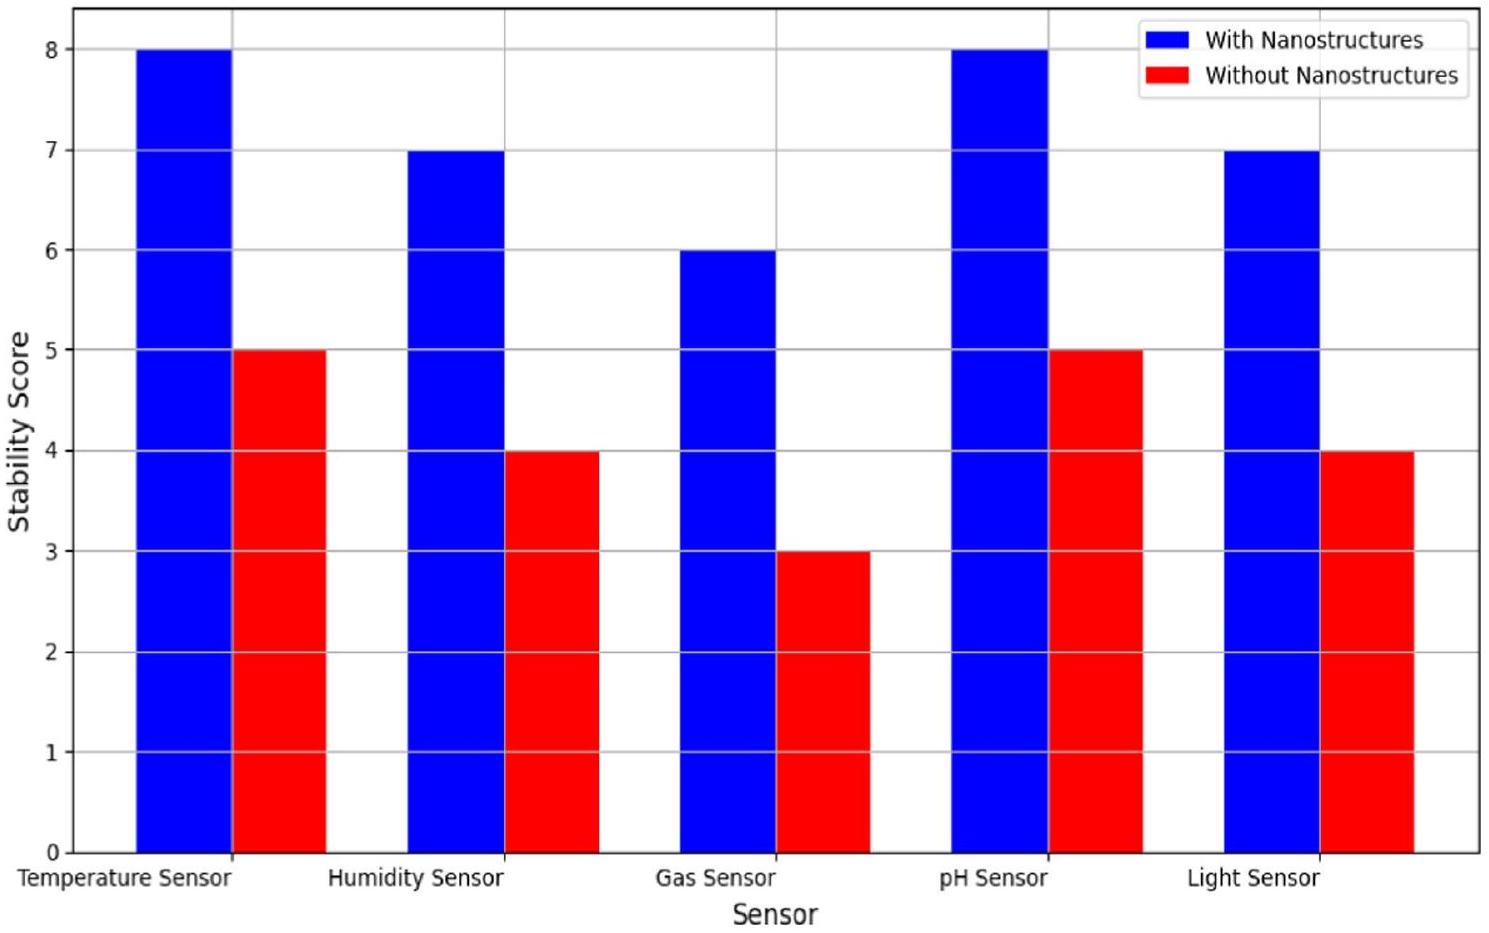
تقوم الشكل 12 بتقييم استقرار المستشعرات مع وبدون هياكل نانوية من المعادن النبيلة تحت ظروف بيئية قاسية. تشير درجات الاستقرار، الموضحة على مقياس مقارن، إلى قدرة المستشعرات على الحفاظ على سلامة الأداء عند تعرضها لضغوط بيئية مثل تقلبات درجة الحرارة، وتغيرات الرطوبة، والعوامل التآكلية. توضح تحليل درجات الاستقرار أن المستشعرات المدمجة مع هياكل نانوية من المعادن النبيلة تحقق باستمرار تقييمات استقرار أعلى مقارنة بتلك التي لا تحتوي على هياكل نانوية. تؤكد هذه النتيجة على التأثير الحامي والم stabilizing لهياكل البوليمر النانوية، التي تحمي المستشعرات من التدهور البيئي وتعزز من عمرها الافتراضي. يدعم الرسم البياني بصريًا الفرضية القائلة بأن دمج الهياكل النانوية يعزز من متانة المستشعرات، مما يجعلها مقاومة للبيئات التشغيلية الصعبة النموذجية في نشرات الشبكات الاستشعارية اللاسلكية. لذلك، يوفر الرسم البياني دليلًا تجريبيًا على الفوائد العملية لدمج هياكل المعادن النبيلة في مصفوفات البوليمر لضمان موثوقية المستشعرات وطول عمرها في ظروف بيئية متنوعة.
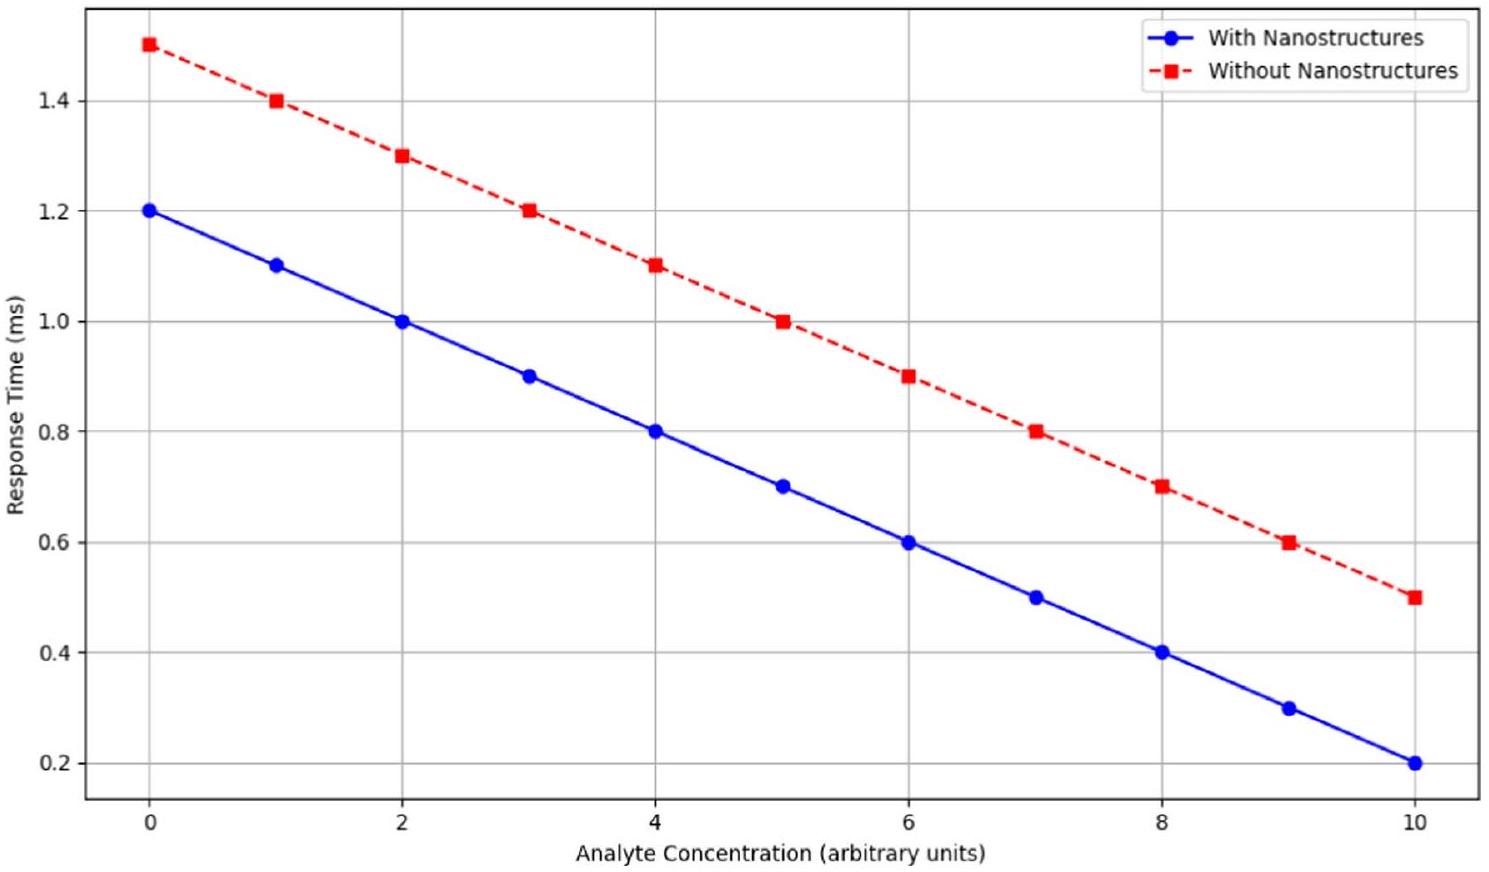
كما هو موضح في الشكل 13، من الواضح أن المستشعرات التي تحتوي على هياكل نانوية من المعادن النبيلة تظهر باستمرار أوقات استجابة أسرع عبر جميع تركيزات المحللات. مع زيادة تركيز المحلل، تنخفض أوقات الاستجابة لكلا نوعي المستشعرات؛ ومع ذلك، فإن الانخفاض يكون أكثر وضوحًا في المستشعرات ذات الهياكل النانوية. على سبيل المثال، عند تركيز محلل قدره 0، تكون مدة استجابة المستشعرات ذات الهياكل النانوية 1.2 مللي ثانية، مقارنةً بـ 1.5 مللي ثانية للمستشعرات غير ذات الهياكل النانوية. تستمر هذه الاتجاهات، حيث تظهر أوقات استجابة أقل بكثير للمستشعرات ذات الهياكل النانوية عند تركيزات أعلى من المحلل، مثل 0.2 مللي ثانية عند تركيز 10، مقارنةً بـ 0.5 مللي ثانية للمستشعرات غير ذات الهياكل النانوية. تشير أوقات الاستجابة الأسرع [39] إلى إمكانية تحقيق وفورات في التكاليف على المدى الطويل بسبب تقليل الحاجة إلى الصيانة والاستبدال، حيث قد تتمتع هذه المستشعرات بمتانة وكفاءة أكبر، مما يبرر التكاليف الأولية الأعلى لدمج الهياكل النانوية. هذه الخاصية حاسمة لتطبيقات المراقبة في الوقت الحقيقي، حيث يكون الكشف السريع أمرًا حيويًا. من المحتمل أن يكون الأداء المحسن للمستشعرات ذات الهياكل النانوية ناتجًا عن زيادة مساحة السطح وخصائص التحفيز لـ
الشكل 12 مقارنة استقرار المستشعر في ظروف قاسية
الشكل 13 زمن الاستجابة مقابل تركيز المحلل
الهياكل النانوية، مما يسهل التفاعلات الأسرع مع المحللات. تدعم هذه الأدلة البصرية الاستنتاج بأن دمج الهياكل النانوية من المعادن النبيلة يحسن بشكل كبير من أداء المستشعر، مما يجعلها أكثر فعالية لمجموعة متنوعة من تطبيقات الاستشعار.
يوضح الشكل 14 بشكل فعال تأثير درجة الحرارة على نمو الهياكل النانوية الفضية، مسلطًا الضوء على علاقة واضحة بين زيادة درجة الحرارة وأحجام الهياكل النانوية الأكبر. من خلال تقديم بيانات عبر مجموعة من درجات الحرارة من 20 إلى ، يظهر الرسم البياني زيادة تدريجية في حجم الهيكل النانوي، مما يؤكد أن درجات الحرارة الأعلى تسرع من عملية النمو. يعزز استخدام تدرج الألوان الفهم، موضحًا معدل النمو بصريًا. توفر هذه التمثيل البصري أدلة قوية على أن درجة الحرارة هي عامل حاسم في التحكم في حجم الهياكل النانوية الفضية أثناء التخليق. من خلال تغيير درجة الحرارة بشكل منهجي ومراقبة التغيرات المتسقة في حجم الجسيمات، يؤكد الرسم البياني الفرضية القائلة بأن التلاعب في درجة الحرارة يمكن أن يضبط أبعاد الهياكل النانوية بدقة. هذه الرؤية حاسمة لتحسين ظروف التخليق في التطبيقات العملية، مما يضمن التحكم الدقيق في خصائص الهياكل النانوية لتحسين الأداء في الاستشعار البيوكيميائي وغيرها من التقنيات.
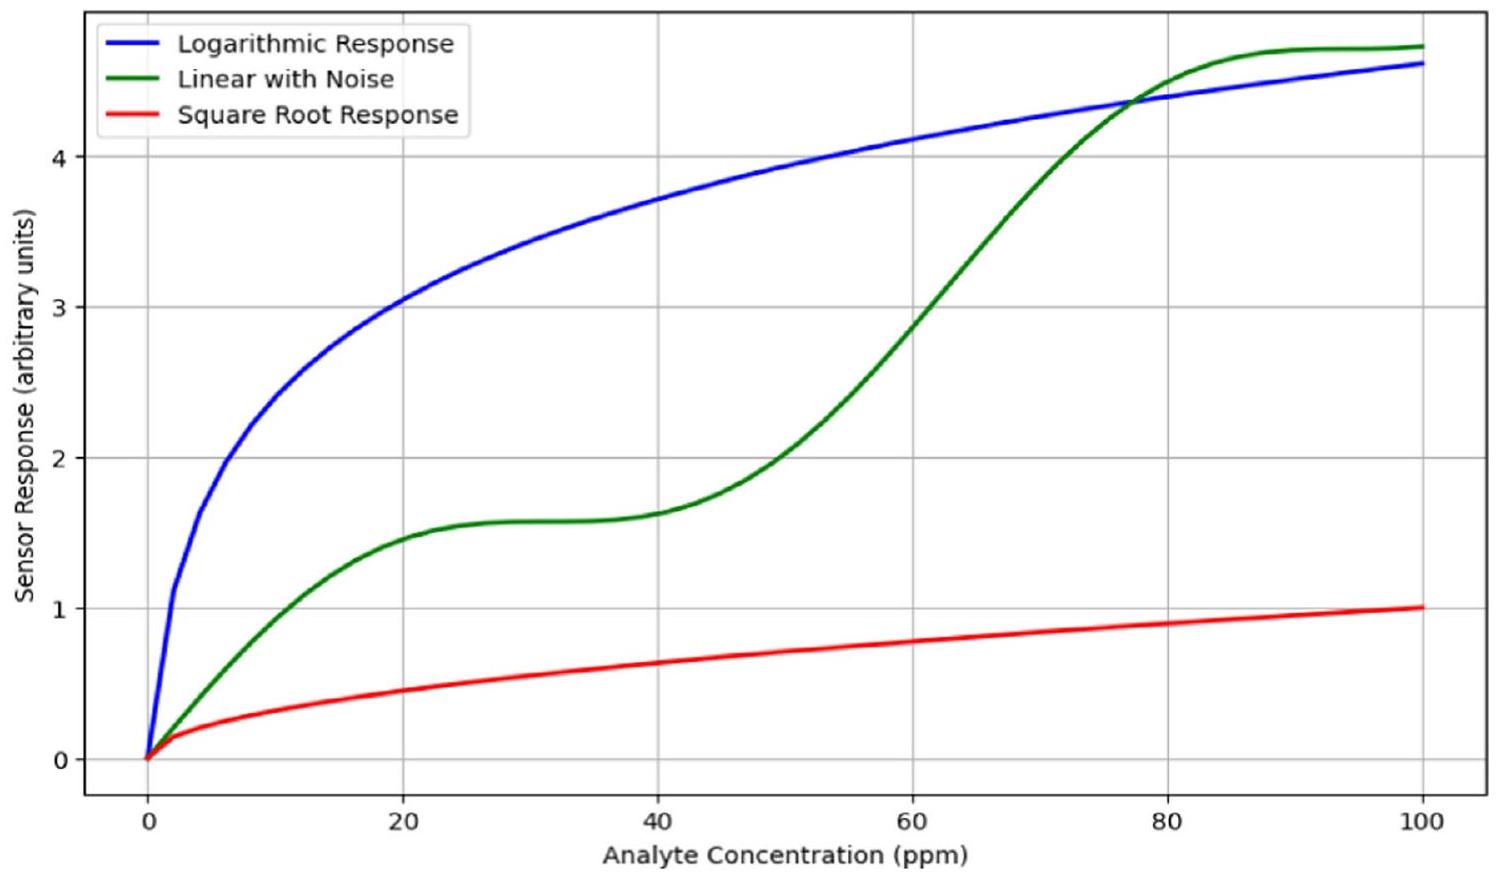
يوضح الشكل 15 منحنيات استجابة ثلاثة مستشعرات متميزة لتركيزات متغيرة من المحلل، من 0 إلى 100 جزء في المليون، كاشفًا عن كفاءتها وفعاليتها. يظهر مستشعر الاستجابة اللوغاريتمية (الخط الأزرق) حساسية عالية عند
الشكل 14 تأثير درجة الحرارة على نمو الجسيمات النانوية الفضية
الشكل 15 منحنيات استجابة المستشعر
تركيزات منخفضة، مع زيادة حادة في الاستجابة تتناقص تدريجيًا، مما يجعلها فعالة للغاية في اكتشاف مستويات منخفضة من المحللات. يظهر مستشعر الاستجابة الخطية مع الضوضاء (الخط الأخضر) استجابة خطية بشكل أساسي مع ضوضاء جيبية طفيفة، مع الحفاظ على حساسية متسقة عبر نطاق التركيز. على الرغم من التقلبات الطفيفة، تشير الاتجاهات الخطية العامة إلى أداء موثوق ومستقر، مما يجعل هذا المستشعر مناسبًا للتطبيقات التي تتطلب حساسية متسقة. يعرض مستشعر الاستجابة الجذر التربيعي (الخط الأحمر) حساسية أعلى عند التركيزات المنخفضة مع منحنى أولي حاد يصبح أقل حدة مع زيادة التركيز. تبرز هذه الخاصية كفاءة المستشعر في اكتشاف مستويات أقل من المحللات، مما يجعله مثاليًا للتطبيقات التي تحتاج إلى حساسية عالية في الطرف المنخفض من طيف التركيز.
يوضح الشكل 16 كيف يتغير عامل تعزيز المجال الكهرومغناطيسي مكانيًا داخل مصفوفة بوليمر، مع التركيز على طول الموجة الرنانة . يولد بيانات محاكاة لمواقع مكانية وعوامل تعزيزها المقابلة، محسوبة بناءً على دالة شبيهة بالغوس مركزة حول موقع ذروة. يعرض الرسم البياني
الشكل 16 تعزيز المجال الكهرومغناطيسي
مساهمات المؤلفين م. ساهايا شيلا و س. كومارغانش أجريا التجارب، وكتبا المخطوطة. بيناي كومار باندي و ميسفين إيسايس ليليشوا أجريا التجربة، وكتبا المخطوطة.
تمويل لم يتلق المؤلفون أي دعم مالي للبحث أو التأليف أو نشر هذه المقالة.
توفر البيانات تتوفر مجموعات البيانات المستخدمة و/أو التي تم تحليلها خلال الدراسة الحالية من المؤلف المراسل عند الطلب المعقول.
توفر الشيفرة الشيفرة ذات الصلة مع المخطوطة متاحة أيضًا وستكون متاحة، إذا طُلب ذلك لاحقًا.
الإعلانات
الموافقة الأخلاقية والموافقة على المشاركة غير قابلة للتطبيق (حيث إن نتائج الدراسات لا تشمل أي إنسان أو حيوان). غير قابلة للتطبيق (حيث إن نتائج الدراسات لا تشمل أي إنسان أو حيوان).
المصالح المتنافسة يعلن المؤلفون أنهم ليس لديهم ‘صراع مصالح معروف أو علاقات شخصية’ قد تؤثر على العمل المبلغ عنه في هذه الورقة.
الوصول المفتوح هذه المقالة مرخصة بموجب رخصة المشاع الإبداعي 4.0 الدولية، التي تسمح بالاستخدام والمشاركة والتكيف والتوزيع وإعادة الإنتاج في أي وسيلة أو تنسيق، طالما أنك تعطي الائتمان المناسب للمؤلفين الأصليين والمصدر، وتوفر رابطًا لرخصة المشاع الإبداعي، وتوضح ما إذا كانت هناك تغييرات قد أُجريت. الصور أو المواد الأخرى من طرف ثالث في هذه المقالة مشمولة في رخصة المشاع الإبداعي للمقالة، ما لم يُذكر خلاف ذلك في سطر ائتمان للمادة. إذا لم تكن المادة مشمولة في رخصة المشاع الإبداعي للمقالة واستخدامك المقصود غير مسموح به بموجب اللوائح القانونية أو يتجاوز الاستخدام المسموح به، ستحتاج إلى الحصول على إذن مباشرة من صاحب حقوق الطبع والنشر. لعرض نسخة من هذه الرخصة، قم بزيارة http://creativecommons.org/licenses/by/4.0/.
References
Teymourian H, Barfidokht A, Wang J. Electrochemical glucose sensors in diabetes management: an updated review (2010-2020). Chem Soc Rev. 2020;49(21):7671-709.
Ramakrishnan S, Sathvara P, Tripathi S, Jayaraman A. Water pollutants, sensor types, and their advantages and challenges. In: Sensors for environmental monitoring, identification, and assessment. IGI Global; 2024. pp. 78-101
Ataei Kachouei M, Kaushik A, Ali MA. Internet of Things—enabled food and plant sensors to empower sustainability. Adv Intell Syst. 2023;5(12):2300321.
Oliveira M, Conceição P, Kant K, Ainla A, Diéguez L. Electrochemical sensing in 3D cell culture models: new tools for developing better cancer diagnostics and treatments. Cancers. 2021;13(6):1381.
Tabatabaei MS, Islam R, Ahmed M. Applications of gold nanoparticles in ELISA, PCR, and immuno-PCR assays: a review. Anal Chim Acta. 2021;1143:250-66.
Fascista A. Toward integrated large-scale environmental monitoring using WSN/UAV/Crowdsensing: a review of applications, signal processing, and future perspectives. Sensors. 2022;22(5):1824.
Wang B, Yao X, Jiang Y, Sun C, Shabaz M. Design of a real-time monitoring system for smoke and dust in thermal power plants based on improved genetic algorithm. J Healthc Eng. 2021;2021(1):7212567.
Baskar D, Arunsi M, Kumar V. Energy-efficient and secure IoT architecture based on a wireless sensor network using machine learning to predict mortality risk of patients with COVID-19. In: 2021 6th international conference on communication and electronics systems (ICCES). IEEE; 2021. pp. 1853-61
Isildak Ö, Özbek O. Application of potentiometric sensors in real samples. Crit Rev Anal Chem. 2021;51(3):218-31.
Beaver K, Dantanarayana A, Minteer SD. Materials approaches for improving electrochemical sensor performance. J Phys Chem B. 2021;125(43):11820-34.
Phalaagae P, Zungeru AM, Sigweni B, Rajalakshmi S, Batte H, Eyobu OS. An energy efficient authentication scheme for cluster-based wireless IoT sensor networks. Sci Afr. 2024; e02287.
Beć KB, Grabska J, Huck CW. Biomolecular and bioanalytical applications of infrared spectroscopy-a review. Anal Chim Acta. 2020;1133:150-77.
Ravindran N, Kumar S, CAThirunavookarasu MSN, CK S. Recent advances in surface plasmon resonance (SPR) biosensors for food analysis: a review. Crit Rev Food Sci Nutr. 2023;63(8):1055-77.
De D, Mukherjee A, Das SK, Dey N. Wireless sensor network: applications, challenges, and algorithms. Nat Inspired Comput Wirel Sensor Netw. 2020; 1-18.
Na Songkhla S, Nakamoto T. Overview of quartz crystal microbalance behavior analysis and measurement. Chemosensors. 2021;9(12):350.
Alanazi N, Almutairi M, Alodhayb AN. A review of quartz crystal microbalance for chemical and biological sensing applications. Sens Imaging. 2023;24(1):10.
Riaz A, Sarker MR, Saad MHM, Mohamed R. Review on comparison of different energy storage technologies used in micro-energy harvesting, WSNs, low-cost microelectronic devices: challenges and recommendations. Sensors. 2021;21(15):5041.
Sugirtham N, Sherine Jenny R, Thiyaneswaran B, et al. Modified playfair for text file encryption and meticulous decryption with arbitrary fillers by septenary quadrate pattern. Int J Netw Distrib Comput. 2024. https://doi.org/10.1007/s44227-023-00019-4.
Kumarganesh S, Anthoniraj S, Senthil Kumar T, Elayaraja P, et al. A novel analytical framework is developed for wireless heterogeneous networks for video streaming applications. J Math. 2022;2022(1):1-7. https://doi.org/10.1155/2022/2100883.
Saravanan K, Anthoniraj S, Kumarganesh 1S et al. WMLP: web-based multi-layer protocols for emergency data transmission in mobile ad hoc network. In: International conference of computer sciences and renewable energies 2021 (ICCSRE2021) July 23-24, at Agadir, Morocco. 2021. https://doi.org/10.1051/e3sconf/202129701065.
Noah NM. Design and synthesis of nanostructured materials for sensor applications. J Nanomater. 2020;2020(1):8855321.
Sharma Y, Kapoor P. Noble metal nanostructures for various applications. Mater Today Proc. 2023;297:01065. https://doi.org/10.1016/j. matpr.2023.03.628.
Das R, Bera JN. Self-reconfigurable partial mesh using ZigBee control board towards fail-proof and reliable home area networking. Ad Hoc Netw. 2024;152: 103327.
Sharma M, Talwar R, Nassa VK, Binay K, Pandey D. Design and performance analysis of a multiband vivaldi antenna for wireless broadband communication in spectrum. In: Artificial intelligence and information technologies. CRC Press, 2025. pp. 86-91.
Sasidevi S, Kumarganesh S, Saranya S, Thiyaneswaran B, et al. Design of surface plasmon resonance (SPR) sensors for highly sensitive biomolecular detection in cancer diagnostics. Plasmonics J. 2024. https://doi.org/10.1007/s11468-024-02343-z.
Maheshwari RU, Kumarganesh S, KVM S, Gopalakrishnan A, Selvi K, Paulchamy B, Pandey D. Advanced plasmonic resonance-enhanced biosensor for comprehensive real-time detection and analysis of deepfake content. Plasmonics. 2024; 1-18.
Dhanasekar S, Martin Sagayam K, Pandey BK, Pandey D. Refractive index sensing using metamaterial absorbing augmentation in elliptical graphene arrays. Plasmonics. 2023; 1-11.
Abdulkarim YI, Awl HN, Muhammadsharif FF, Saeed SR, Sidiq KR, Khasraw SS, Dong J, Pandey BK, Pandey D. Metamaterial-based sensors loaded corona-shaped resonator for COVID-19 detection by using microwave techniques. Plasmonics. 2024;19(2):595-610.
Du John HV, Jose T, Jone AAA, Sagayam KM, Pandey BK, Pandey D. Polarization insensitive circular ring resonator based perfect metamaterial absorber design and simulation on a silicon substrate. SILICON. 2022;14(14):9009-20.
Du John HV, Moni DJ, Ponraj DN, Sagayam KM, Pandey D, Pandey BK. Design of Si based nano strip resonator with polarization-insensitive metamaterial (MTM) absorber on a glass substrate. Silicon. 2021; 1-10.
Du John HV, Jose T, Sagayam KM, Pandey BK, Pandey D Enhancing absorption in a metamaterial absorber-based solar cell structure through anti-reflection layer integration. Silicon. 2024; 1-11.
Du John HV, Sagayam KM, Jose T, Pandey D, Pandey BK, Kotti J, Kaur P. Design simulation and parametric investigation of a metamaterial light absorber with tungsten resonator for solar cell applications using silicon as dielectric layer. SILICON. 2023;15(9):4065-79.
Sharma M, Pandey D, Khosla D, Goyal S, Pandey BK, Gupta AK. Design of a GaN-based Flip Chip Light Emitting Diode (FC-LED) with au bumps & thermal analysis with different sizes and adhesive materials for performance considerations. SILICON. 2022;14(12):7109-20.
Sharma M, Pandey D, Palta P, Pandey BK. Design and power dissipation consideration of PFAL CMOS V/S conventional CMOS based 2: 1 multiplexer and full adder. SILICON. 2022;14(8):4401-10.
Raja DSS, Kumar DR, Santhiyakumari N, Kumarganesh S, Sagayam KM, Thiyaneswaran B, Pandey D. A compact dual-feed wide-band slotted antenna for future wireless applications. Analog Integr Circuits Signal Process. 2024;118(2):291-305.
Sharma M, Talwar R, Pandey D, Nassa VK, Pandey BK, Dadheech P. A review of dielectric resonator antennas (DRA)-based RFID technology for Industry 4.0. Robotics and Automation in Industry 4.0. 2024; 303-s sensor network using machine learning to predi24.
Antennas R, Sharma M, Talwar R, Pandey D, Nassa VK, Pandey BK, Dadheech P. 17 a review of dielectric. Robotics and automation in industry 4.0: smart industries and intelligent technologies. 2024; 303.
Pandey BK, Pandey D. Parametric optimization and prediction of enhanced thermoelectric performance in co-doped using response surface methodology and neural network. J Mater Sci Mater Electron. 2023;34(21):1589.
Anand R, Lakshmi SV, Pandey D, Pandey BK. An enhanced ResNet-50 deep learning model for arrhythmia detection using electrocardiogram biomedical indicators. Evol Syst. 2024;15(1):83-97.
Kumar Pandey B, Pandey D, Nassa VK, Ahmad T, Singh C, George AS, Wakchaure MA. Encryption and steganography-based text extraction in IoT using the EWCTS optimizer. Imaging Sci J. 2021;69(1-4):38-56.
Publisher’s Note Springer Nature remains neutral with regard to jurisdictional claims in published maps and institutional affiliations.
Mesfin Esayas Lelisho, mesfinesayas@mtu.edu.et; M. Sahaya Sheela, hisheelu@gmail.com; S. Kumarganesh, saikgss@gmail.com; Binay Kumar Pandey, binaydece@gmail.com | ¹Department of ECE, Vel Tech Rangarajan Dr. Sagunthala R&D Institute of Science and Technology, Chennai, Tamil Nadu, India. Department of ECE, Knowledge Institute of Technology, Salem, Tamil Nadu, India. Department of Information Technology, College of Technology, Govind Ballabh Pant University of Agriculture and Technology Pantnagar, Udham Singh Nagar, India. Mizan-Tepi University, Tepi, Ethiopia.
Integrating noble metal nanostructures, specifically silver nanoparticles, into sensor designs has proven to enhance sensor performance across key metrics, including response time, stability, and sensitivity. However, a critical gap remains in understanding the unique contributions of various synthesis parameters on these enhancements. This study addresses this gap by examining how factors such as temperature, growth time, and choice of capping agents influence nanostructure shape and size, optimizing sensor performance for diverse conditions. Using silver nitrate and sodium borohydride, silver seed particles were created, followed by controlled growth in a solution containing additional silver ions. The size and morphology of the resulting nanostructures were regulated to achieve optimal properties for biochemical sensing in wireless sensor networks. Results demonstrated that embedding these nanostructures in Polyvinyl Alcohol (PVA) matrices led to superior stability, maintaining 93% effectiveness over 30 days compared to 70% in Polyethylene Glycol (PEG). Performance metrics revealed significant improvements: reduced response times ( 1.2 ms vs. 1.5 ms at zero analyte concentration) and faster responses at higher analyte levels ( 0.2 ms ). These outcomes confirm that higher synthesis temperatures and precise shape control contribute to larger, more stable nanostructures.The enhanced stability and responsiveness underscore the potential of noble metal nanostructures for scalable and durable sensor applications, offering a significant advancement over current methods.
Biochemical sensing is essential across fields like healthcare, environmental monitoring, food safety, and biotechnology, as it detects biological or chemical substances to provide crucial data. In healthcare, these sensors support diagnostics, disease monitoring, and treatment, with glucose sensors for diabetes management and biosensors for early detection of conditions like cancer, enhancing patient outcomes [1]. Wearable sensors that monitor vital signs, such as heart rate and oxygen levels, further support real-time health monitoring and preventive care. Environmental monitoring leverages biochemical sensing to detect pollutants, toxins, and pathogens in air, water, and soil, helping protect ecosystems
and public health [2]. For example, water biosensors can identify harmful bacteria, ensuring safe drinking water, and air quality sensors detect hazardous gases, helping prevent respiratory diseases. In agriculture, biochemical sensors monitor soil health and crop conditions, promoting efficient resource use and yield improvement. Food safety benefits from biochemical sensing by identifying contaminants, such as pathogens, toxins, and allergens, preventing foodborne illnesses and maintaining quality standards [3]. Sensors detecting E. coli or Salmonella in food ensure public health protection and reduce waste by monitoring freshness [4]. Biotechnology applications rely on biochemical sensing for drug development, genetic analysis, and cellular research. Sensors like enzyme-linked immunosorbent assays (ELISAs) enable precise protein and antibody quantification, which is vital in immunology and disease research [5].
Integrating biochemical sensing with wireless sensor networks (WSNs) enhances monitoring capabilities and efficiency. WSNs consist of spatially distributed wireless sensors, allowing real-time, continuous monitoring over large areas [6]. This is valuable in environmental monitoring, where early contamination detection enables rapid response [7]. In healthcare, combining WSNs with biochemical sensors allows wearable devices to continuously monitor vital signs and biochemical markers, like glucose, with real-time data transmission for timely intervention and personalized care, eliminating invasive procedures [8]. Food safety applications benefit from WSNs by tracking conditions such as temperature, humidity, and contaminants throughout production and distribution, preventing spoilage and reducing foodborne illness risks [3]. Additionally, in agriculture, WSN-integrated biochemical sensors optimize resource use and productivity by monitoring soil health, nutrients, and crop status, leading to efficient practices and improved yields [3].
2 Literature review
Electrochemical sensors, such as potentiometric and amperometric sensors, have been widely used in biochemical sensing due to their high sensitivity and specificity. Potentiometric sensors measure changes in voltage due to biochemical reactions and are commonly used for pH sensing and ion-selective electrodes [9]. Amperometric sensors, on the other hand, measure the current produced by oxidation or reduction reactions, making them ideal for applications like glucose monitoring and detecting environmental pollutants. These sensors offer real-time monitoring capabilities and are relatively easy to miniaturize for integration with WSNs. Despite their advantages, electrochemical sensors face challenges such as susceptibility to interference from other chemical species, limited stability over time, and the need for frequent calibration [10]. Additionally, their performance can be affected by changes in temperature and pH , which can lead to inaccurate readings. The requirement for a continuous power supply for data transmission in WSNs also poses a challenge in remote or resource-limited settings [11].
Optical sensors, including absorbance spectroscopy and fluorescence spectroscopy, detect biochemical substances through their interaction with light. Absorbance spectroscopy measures the amount of light absorbed by a sample at specific wavelengths, which is useful for detecting various biomolecules [12]. Fluorescence spectroscopy uses fluorescent markers that emit light upon excitation, providing high sensitivity for detecting low concentrations of analytes. Surface plasmon resonance (SPR) is another optical method that measures changes in the refractive index near the sensor surface, useful for studying molecular interactions and detecting biomolecules [13]. Optical sensors, while highly sensitive, often require complex and bulky instrumentation, making miniaturization for WSN integration challenging. They can also be affected by environmental factors such as ambient light, temperature fluctuations, and the presence of other fluorescent substances, which can interfere with accurate measurements. Additionally, the need for external light sources and sophisticated detection systems can increase power consumption and complexity in WSN applications [14].
Piezoelectric sensors, like quartz crystal microbalance (QCM), operate based on the principle that certain materials generate an electrical charge in response to mechanical stress [15]. These sensors can detect mass changes on a sensor surface by measuring the frequency shift of a quartz crystal, making them useful for studying protein-ligand interactions and environmental monitoring. QCM sensors are valued for their high sensitivity and ability to provide real-time monitoring of molecular interactions [16]. The primary limitation of piezoelectric sensors is their sensitivity to environmental factors such as temperature and humidity, which can cause drift and affect accuracy. Additionally, these sensors often require sophisticated signal processing and calibration to maintain performance. Integrating piezoelectric sensors with WSNs can be challenging due to their relatively high power consumption and the need for stable environmental conditions to ensure reliable data transmission and sensor operation [17]. Table 1 provides a comparison of several current sensing methods for the biochemical application.
Table 1 Comparison of different sensing techniques for biochemical applications
Sensing technique
Advantages
Disadvantages
Potentiometric sensors
High sensitivity, useful for pH sensing, ion detection
Susceptible to interference, limited stability, requires frequent calibration
Amperometric sensors
Ideal for oxidation/reduction-based detection, real-time monitoring
Affected by changes in temperature and pH, requires continuous power supply
Optical sensors
High sensitivity, versatile in biomolecule detection
Complex instrumentation, bulky setups, interference from ambient light
The implementation of silver nanostructure synthesis begins with the creation of small silver seed particles, which serve as nucleation sites. The initial step typically involves the reduction of a silver nitrate solution using a strong reducing agent, such as sodium borohydride. This reduction process results in the formation of tiny silver seed particles. These initial seed particles are crucial as they act as the foundational nuclei upon which further silver deposition can occur during the subsequent growth phase. Once the seed particles have been successfully formed, they are introduced into a growth solution that contains additional silver ions and a milder reducing agent, such as ascorbic acid. The conditions of the growth solution are meticulously controlled to ensure that the additional silver ions deposit onto the existing seed particles rather than nucleating new particles. This precise control over the deposition process is essential for the growth of the seed particles into larger and well-defined nanostructures.
The growth of the seed particles into larger nanostructures can be finely tuned by adjusting several parameters as shown in Fig. 1. These parameters include the concentration of silver ions in the growth solution, the type and concentration of the reducing agent, and the presence of specific capping agents. The selection of specific capping agents and polymer matrices is critical for optimizing sensor performance characteristics. Capping agents, such as cetyltrimethylammonium bromide (CTAB), influence the morphology of nanostructures, impacting surface area and reactivity [21]. For example, CTAB promotes the formation of nanorods, which can enhance surface plasmon resonance effects, improving sensitivity for optical sensors. On the other hand, polymer matrices provide a supportive environment for nanostructures, influencing mechanical stability, conductivity, and interaction with target analytes. Polymers like polyvinyl alcohol (PVA) or polystyrene can be selected for their favorable properties, such as flexibility and ease of processing. The combined choice of capping agents and polymers is aimed at achieving optimal dispersion, stability, and enhanced sensitivity, thereby ensuring efficient sensor performance. However, this rapid growth can sometimes lead to less uniform shapes. Conversely, lower temperatures can slow down the growth process, allowing for more controlled and uniform particle formation. The duration of the growth reaction also influences the final nanostructures. Longer reaction times provide more opportunities for silver ions to deposit onto the seed particles, which can lead to more extensive growth and potentially enable shape transformations.
The experimental plan will commence with testing various concentrations of silver nitrate and sodium borohydride to optimize the initial seed formation phase. Growth phases will use ascorbic acid under varied temperature and time conditions ( ) to observe impacts on particle size and uniformity. Experiments will include multiple trials with CTAB and PVA as capping agents, alongside comparisons with alternative polymers, to assess differences in sensor performance. Reproducibility will be confirmed by conducting triplicate experiments and measuring consistency in particle morphology and optical properties.
Figure 2 demonstrates the seed-mediated growth process for silver nanostructures, highlighting three phases. Initially, during the seed formation phase ( ), small silver seed particles are formed. In the growth phase ( ), additional silver ions deposit onto these seeds, steadily increasing nanoparticle size. Finally, the shape control phase
Fig. 1 Factors influencing the growth and shape of silver nanostructures
Fig. 2 Seed-mediated growth process of silver nanostructures
( ) involves adjusting growth conditions like capping agents and temperature to control nanoparticle shape, resulting in a gradual size increase. This method allows precise control over the size and shape of silver nanostructures, enhancing their applicability in various sensor technologies. Integrating noble metal nanostructures into polymer matrices represents a sophisticated approach in enhancing biochemical sensing within wireless sensor networks. Noble metals such as silver exhibit unique properties at the nanoscale, including high surface area-to-volume ratio, plasmonic effects, and catalytic activity, which are advantageous for sensing applications [18]. Embedding these nanostructures in polymer matrices serves multiple crucial purposes in the context of sensor technology.
Firstly, the polymer matrix provides a stable and protective environment for delicate nanostructures. Nanostructured metals like silver are highly susceptible to oxidation and environmental degradation, which can compromise their sensing capabilities over time. By encapsulating them within a polymer, such as polyvinyl alcohol (PVA) or polyethylene glycol (PEG), the nanostructures are shielded from direct contact with potentially corrosive elements in the sensing environment [19]. This protection ensures prolonged functionality and reliability of the sensors, which is crucial for continuous monitoring applications. Secondly, the polymer matrix can be engineered to interact synergistically with the noble metal nanostructures, enhancing their sensing performance. For instance, polymers can be tailored to facilitate specific interactions with target analytes, thereby improving the selectivity and sensitivity of the sensor. Functional groups or ligands within the polymer matrix can selectively bind to biomolecules or chemical species of interest, promoting efficient detection even at low concentrations [20]. This capability is particularly beneficial in biomedical and environmental monitoring, where precise and rapid detection of analytes is paramount.
Moreover, the integration of noble metal nanostructures in polymer matrices enables the fabrication of flexible and lightweight sensor platforms. Wireless sensor networks demand sensors that are not only sensitive and selective but also robust and adaptable to various deployment scenarios. Polymer-based sensors incorporating nanostructured metals fulfil these requirements by offering flexibility in design and deployment. They can be easily integrated into wearable devices, embedded in environmental monitoring stations, or deployed in remote locations without compromising performance. Furthermore, the use of polymer matrices facilitates scalable and cost-effective manufacturing of sensors. The sensitive response of the sensors relies on interactions between target analytes and the nanostructures within the polymer matrix. Key factors include surface area, where increased nanostructure surface enhances analyte interaction likelihood, thus boosting sensitivity. Functionalization of nanostructures allows selective binding to specific analytes, improving detection accuracy. Charge transfer dynamics at the nanostructure surface are altered upon analyte binding, affecting electrical signals. Additionally, for metallic nanostructures, localized surface plasmon resonance (LSPR) enhances optical signals, contributing to greater sensitivity. Polymers are compatible with a wide range of fabrication techniques including spin-coating, inkjet printing, and microfluidic assembly, allowing for mass production of sensors at reduced costs compared to traditional methods. This scalability is crucial for widespread deployment of sensor networks in healthcare, agriculture, and industrial process monitoring.
3.2 Silver nanoparticles in polymer matrices
Figure 3 provides a qualitative illustration of the spatial distribution of silver nanoparticles, highlighting their general dispersion across an area. This figure is intended to give an overall impression of particle positioning and clustering
Fig. 3 Nanostructures embedded in polymer matrix
tendencies rather than being derived from specific experimental measurements or theoretical data. The light blue background represents the polymer, providing a stable environment for the nanoparticles. Silver dots scattered randomly within this matrix illustrate the distribution of nanoparticles, symbolizing their encapsulation within the polymer. This encapsulation ensures the stability and functionality of the nanostructures, protecting them from environmental degradation. The scatter plot helps to conceptualize how nanoparticles are integrated into a polymer matrix, highlighting their dispersed arrangement and the potential for enhanced biochemical sensing in various applications, such as in wireless sensor networks for real-time monitoring and diagnostics. Deployment of sensor nodes is the next crucial step. These nodes, embedded with noble metal nanostructures, are strategically placed across the target area based on the initial survey. The placement should ensure that each node can communicate with multiple neighboring nodes, establishing a mesh network. Nodes should be positioned to maximize coverage and ensure that critical areas are adequately monitored. The redundancy inherent in a mesh topology allows the network to maintain functionality even if some nodes become inoperative due to environmental conditions or hardware failures. The enhancement of sensing performance through the integration of silver nanostructures can be attributed to several mechanisms, including increased surface area, localized surface plasmon resonance, and enhanced electron transfer. These factors collectively contribute to improved sensitivity and selectivity in detection processes. For instance, the presence of nanostructures can facilitate the adsorption of target analytes, thereby increasing the effective response of the sensor.
Figure 4 depicts the comparative stability of silver nanostructures embedded in Polyvinyl Alcohol (PVA) and Polyethylene Glycol (PEG) matrices over a 30-day period. It shows that nanostructure integrity in the PVA matrix remains consistently high, declining only slightly from 100 to . In contrast, the PEG matrix shows a more pronounced decrease, dropping from 100
Fig. 4 Stability of silver nanostructures in polymer matrix
to over the same period. This indicates that PVA offers a significantly more stable environment for silver nanostructures compared to PEG. The long-term stability and reproducibility of the developed sensors are critical for their practical application. To assess these parameters, the sensors were subjected to accelerated aging tests and repeated measurements over time. Results indicate that the sensors maintain consistent performance over extended periods, demonstrating good stability. Additionally, reproducibility was evaluated by fabricating multiple sensors under identical conditions, confirming similar performance across samples.
Silver nanoparticles are chosen for their strong plasmonic properties, which are highly sensitive to changes in the surrounding dielectric environment. As given in Fig. 5, the polymer matrices are selected based on their compatibility with both the nanoparticles and the target biomolecules. Silver nanoparticles are synthesized using methods such as chemical reduction or laser ablation, ensuring control over their size, shape, and distribution within the polymer matrix. Characterization techniques like UV-Vis spectroscopy, TEM, and SEM are employed to verify their optical and structural properties. Data will be evaluated at various stages, starting from the initial formation of silver seeds through their growth phases. TEM and SEM will be used to measure particle size and distribution, while UV-Vis spectroscopy will monitor plasmonic resonance, providing insights into particle stability and uniformity. Data from stability studies will assess structural and functional integrity over time, essential for practical applications in sensor networks.
The synthesized silver nanoparticles are then embedded into the polymer matrix through techniques like solution mixing, spin coating, or electrospinning. Careful control of nanoparticle concentration and dispersion is critical to achieving uniform distribution and maximizing SPR efficiency. To control the dispersion of silver nanostructures in a polymer matrix, various techniques can be employed, including solvent casting, sonication, and the use of surfactants or stabilizers. Optimal dispersion is crucial for enhancing the sensing performance, as agglomeration can lead to reduced sensor efficiency. By optimizing the concentration of nanostructures and using methods such as high shear mixing or in situ polymerization, uniform distribution can be achieved.The resonance wavelength ( ) of the SPR is calculated using the dielectric constants ( and ) for the polymer matrix).
For data analysis, Mie theory and Maxwell-Garnett approximations will be used to model resonance wavelength calculations, accounting for nanoparticle shape and distribution within the polymer matrix. Quantitative methods will analyze absorbance spectra and SPR properties, while computational simulations will further optimize particle size and shape for target analytes. The analysis will use software tools such as MATLAB and Python for model development and data interpretation.
This calculation involves theoretical models such as Mie theory or finite element analysis (FEA), taking into account the shape and size of nanoparticles and their spatial arrangement within the polymer.
Resonance Wavelength: 500 nm
Fig. 5 Nanoparticle depth in polymer matrix analysis
where is the speed of light, is the dielectric constant of the metal (silver), and is the dielectric constant of the surrounding medium (polymer matrix). This equation is based on Mie theory, which models how nanoparticles scatter and absorb light. The resonance wavelength is crucial because it determines the sensitivity of the SPR sensor; a shift in indicates the binding of analytes to the nanoparticle surface, enhancing detection reliability.For a composite material with volume fractions of nanoparticles ( ) and polymer matrix ( ), the effective dielectric constant ( ) can be approximated using the Maxwell-Garnett theory:
The Maxwell-Garnett theory assumes that nanoparticles are evenly dispersed within the matrix and that their optical properties are additive. This constant is essential for predicting how the composite material interacts with light, impacting the sensor’s optical response. The absorbance of the silver nanoparticles embedded in the polymer matrix at the SPR peak can be described by the Lambert-Beer law
where is the molar absorptivity, ccc is the concentration of nanoparticles, and is the path length of the sample. This law is widely used in spectroscopy to quantify analyte concentration, making it a fundamental equation for sensor calibration.This relationship is crucial for quantifying the optical properties of the nanoparticles. The resonance frequency of silver nanoparticles is influenced by their size and shape. For small spherical particles, the resonance condition can be modified by the particle size ( ) using the quasi-static approximation:
where is the resonance angular frequency, is the plasma frequency of the bulk metal, is the background dielectric constant of the metal, and is the radius of the nanoparticles. The design of SPR sensors is optimized based on calculations and experimental validation. This includes designing the sensor geometry (such as thin films or nanostructures), optimizing the incident angle of light, and integrating appropriate optical components for signal detection. During operation, the SPR sensor interacts with biomolecules that bind to the surface of the nanoparticles within the polymer matrix. This binding causes a shift in the resonance wavelength, which is monitored in real-time using spectroscopic techniques. The sensitivity of the sensor is enhanced by the electromagnetic field enhancement at , enabling precise detection and quantification of biomolecular interaction. The stability of the SPR sensor in varied environmental conditions (such as temperature and humidity) is assessed and optimized through appropriate surface functionalization or encapsulation strategies. This ensures reliable performance and longevity of the sensor in practical applications.
3.3 Advanced deployment and operation of WSNs
Implementing the Beer-Lambert law ( ɛ.c.l) quantifies light absorption by silver nanoparticles in polymers. Figure 6 illustrates the relationship between absorbance (A), molar absorptivity ( ), concentration (c), and path length (I) as described by the Beer-Lambert law. It demonstrates how silver nanoparticles embedded in polymer matrices enhance light absorption, thereby improving the sensitivity and specificity of wireless sensor networks (WSNs) for biochemical detection. The data presented helps in calibrating sensors and optimizing their performance. Silver nanoparticles, owing to their unique optical properties, play a crucial role in improving the sensitivity and specificity of WSN-based sensors for detecting biochemical analytes. By leveraging the Beer-Lambert law, which quantifies light absorption by nanoparticles, we can accurately determine the concentration of target analytes in the sensing environment. This approach involves embedding silver nanoparticles within polymer matrices, where their interaction with incident light is precisely characterized using UV-Vis spectroscopy. The absorption spectra obtained provide direct insights into the nanoparticles’ effectiveness in absorbing light at specific wavelengths, crucial for sensor calibration and performance optimization. Graphical representations of these interactions facilitate detailed analysis of absorbance patterns, aiding in the design of highly sensitive sensors. Such advancements not only enhance the reliability and accuracy of biochemical sensing in WSN but also expand the application potential in fields such as environmental monitoring, healthcare diagnostics, and food safety. Ultimately, integrating nanoparticles within WSN
Fig. 6 Beer-Lambert law for absorption
platforms represents a cutting-edge approach to advancing sensor technologies, poised to revolutionize real-time monitoring and analysis in diverse operational environments as given in Fig. 7.
The strategic placement of nodes can be represented through a series of equations that describe the optimal positions and interactions of the nodes within the network. For instance, the objective function might define the network coverage area based on the coordinates of each node , while constraints ensure each node maintains connectivity with its neighbors:
where represents the area covered by node is the density of nodes, and is the distance between nodes and . The mapping of node distribution and coverage, expressed mathematically, not only provides a clear overview of the network layout but also highlights areas of redundancy. Network redundancy is a key feature, as it ensures that the network can maintain operational integrity even in the event of node failures or environmental challenges. Redundant nodes act as backups, enabling the network to reroute data and maintain seamless operations without significant disruptions. The redundancy can be mathematically described by:
Fig. 7 WSN sensor node coverage analysis
where represents the set of neighboring nodes to node iii. Strategic deployment also considers various factors such as terrain, obstacles, and environmental conditions, which can impact the performance and coverage of the network. These factors are included in the optimization problem as additional constraints and parameters:
where represents the environmental impact on node and represents obstacles. By incorporating these factors, the deployment plan can be optimized to overcome potential challenges, thereby enhancing the robustness and reliability of the network.This approach not only ensures continuous monitoring and data collection but also optimizes resource utilization. By maximizing the efficiency of each node and the overall network, fewer resources are required to achieve the desired coverage and performance levels. This optimization leads to cost savings and extends the lifespan of the network. The resource utilization efficiency can be quantified as:
where is the coverage provided by node and is the power consumption of node .
Assessing SNR validates sensor node efficacy in detecting biochemical signals amidst background noise. Figure 8 , contrasts signal and noise power levels, illustrating the sensor’s capability to differentiate signal integrity from environmental interference. This evaluation is pivotal for ensuring reliable and accurate data acquisition in diverse application scenarios, enhancing overall sensor performance and data quality. After deploying the nodes, the network must be configured and calibrated. This step involves setting up the communication protocols, ensuring that each node can effectively transmit data to its neighbours and the central hub. Calibration ensures that the sensors are accurately measuring the desired parameters, such as biochemical levels, temperature, or humidity. The calibration process might include adjusting sensor sensitivity and testing communication ranges to ensure optimal performance. This step is crucial for ensuring that the network operates efficiently and provides reliable data. With the network fully operational, data management and analysis become the focal points. Data collected by the sensor nodes are transmitted through the mesh network to a central hub or multiple hubs, where it is aggregated and processed. The robust nature of a mesh topology ensures that data from all nodes are reliably transmitted, even if some nodes fail [21]. Advanced data analytics can be applied to interpret the collected data, providing valuable insights
Fig. 8 Signal-to-noise ratio
into environmental conditions, biochemical changes, and other monitored parameters. This information can be used for real-time monitoring, predictive analysis, and decision-making processes.
Figure 9 demonstrates a mesh topology for a wireless sensor network with sensor nodes embedded with noble metal nanostructures home area networking [22,23]. The graph shows 20 nodes distributed randomly across a defined area, each represented by a silver dot. Nodes are connected to their three nearest neighbours with grey lines, illustrating the mesh network’s structure [24]. This network configuration allows for robust data transmission, even if some nodes fail. The visualization helps to understand the strategic placement and interconnection of nodes to ensure effective coverage, reliable data acquisition, and resilient communication within the mesh topology.
4 Results and discussion
4.1 Results
The experimental setup for studying noble metal nanostructures [25,26] and their integration into polymer matrices typically requires a well-equipped laboratory. Essential equipment includes spectrophotometers for optical property measurements, electron microscopes (SEM/TEM) for nanostructure imaging, and particle size analyzers for characterization. Temperature-controlled environments such as water baths or ovens are crucial for controlling synthesis conditions. The synthesis of silver nanostructures was conducted using a 0.01 M silver nitrate solution and a 0.002 M sodium borohydride solution as the reducing agent. The initial seed formation involved stirring the mixture for 30 min at room temperature . For the growth phase, a 0.05 M silver ion solution was added dropwise, with a capping agent PVP) to control particle size, and the reaction mixture was heated at for 60 min . The pH was adjusted to 8 using a dilute sodium hydroxide solution, and the solution was stirred continuously at 500 rpm to ensure uniform growth.
Software tools like MATLAB or Python with relevant libraries are used for data analysis, including statistical analysis and plotting of experimental results. Computational chemistry or physics software may be employed for simulating nanostructure growth dynamics, enhancing theoretical understanding. The results focuses on evaluating key performance metrics such as response times, sensitivity enhancements, and stability under varying environmental conditions. The results highlight how nanostructure integration influences sensor capabilities [27,28], addressing challenges in real-time monitoring and reliability. Furthermore, considerations on cost-effectiveness and synthesis parameters like temperature will be discussed to elucidate the broader implications for sensor deployment across biomedical, environmental, and industrial applications [29].
Figure 10 compares the response times of sensors with and without noble metal nanostructures across different sensor types: temperature, humidity, gas, pH, and light sensors. Response time, measured in milliseconds, indicates how quickly a sensor detects and responds to changes in its environment [30]. Figure 4 clearly illustrates that sensors [31] integrated with noble metal nanostructures generally exhibit lower response times compared to their counterparts without nanostructures [32, 33]. This significant reduction in response time is critical for applications requiring real-time monitoring and rapid detection of environmental changes. The enhanced responsiveness of nanostructure-integrated sensors can be attributed to their improved surface area-to-volume ratio and catalytic properties, which facilitate faster interaction
Fig. 9 Mesh topology for sensor nodes
Fig. 10 Comparison of sensor response times
with target analytes [34]. Therefore, the graph effectively demonstrates how nanostructure integration enhances sensor performance by accelerating response times, thereby improving overall operational efficiency in WSN applications [35].
Figure 11 provides a comparative analysis of the cost per sensor unit between sensors integrated with and without noble metal nanostructures. Each bar represents a specific sensor type, highlighting the financial implications of adopting nanostructured sensors in WSNs [36, 37]. The cost per sensor with and without metal nanostructures is determined by analyzing material, fabrication, and testing costs. For sensors without nanostructures, expenses include standard components and production methods. In contrast, those with nanostructures involve additional costs for sourcing and integrating materials like silver nanoparticles, as well as potentially more complex fabrication processes. Enhanced
Fig. 11 Comparison of cost per sensor
performance and sensitivity [38] may justify the higher costs by improving reliability and reducing testing frequency. Ultimately, a comprehensive cost analysis, including economies of scale, allows for a clear comparison of the financial implications associated with each sensor type. The data reveals that sensors with noble metal nanostructures generally incur higher initial costs due to materials and fabrication processes involved in nanostructure integration. However, the graph also suggests potential long-term cost savings associated with these sensors, such as reduced maintenance and replacement costs owing to their enhanced durability and reliability. By quantifying the upfront investment and longterm benefits, the graph assists decision-makers in evaluating the economic feasibility of deploying nanostructured sensors in various WSN applications. It underscores the trade-offs between initial investment and future operational savings, thereby supporting informed decision-making in sensor technology investments.
Figure 12 assesses the stability of sensors with and without noble metal nanostructures under harsh environmental conditions. Stability scores, depicted on a comparative scale, indicate the sensors’ ability to maintain performance integrity when exposed to environmental stressors like temperature fluctuations, humidity variations, and corrosive agents. Analysis of the stability scores demonstrates that sensors integrated with noble metal nanostructures consistently achieve higher stability ratings compared to those without nanostructures. This finding underscores the protective and stabilizing effect of nanostructured polymer matrices, which shield the sensors from environmental degradation and enhance their longevity. The graph visually supports the hypothesis that nanostructure integration enhances sensor robustness, making them resilient to challenging operating environments typical in WSN deployments. Therefore, the graph provides empirical evidence of the practical benefits of integrating noble metal nanostructures in polymer matrices for ensuring sensor reliability and longevity in diverse environmental conditions.
As demonstrated in Fig. 13, It is evident that sensors with noble metal nanostructures consistently exhibit faster response times across all analyte concentrations. As the analyte concentration increases, the response times for both sensor types decrease; however, the decrease is more pronounced in sensors with nanostructures. For instance, at an analyte concentration of 0 , the response time for nanostructured sensors is 1.2 ms , compared to 1.5 ms for nonnanostructured sensors. This trend continues, showing significantly lower response times for nanostructured sensors at higher analyte concentrations, such as 0.2 ms at a concentration of 10, compared to 0.5 ms for non-nanostructured sensors. The faster response times [39] imply potential long-term cost savings due to reduced maintenance and replacement needs, as these sensors may have greater durability and efficiency, justifying the higher initial costs of nanostructure integration. This characteristic is crucial for real-time monitoring applications, where rapid detection is vital. The enhanced performance of nanostructured sensors is likely due to the increased surface area and catalytic properties of
Fig. 12 Comparison of sensor stability in harsh conditions
Fig. 13 Response time versus analyte concentration
the nanostructures, facilitating quicker interactions with the analytes. This visual evidence supports the conclusion that incorporating noble metal nanostructures significantly improves sensor performance, making them more effective for various sensing applications.
Figure 14 effectively demonstrates the impact of temperature on the growth of silver nanostructures, highlighting a clear correlation between increased temperature and larger nanostructure sizes. By presenting data across a range of temperatures from 20 to , the chart shows a progressive increase in nanostructure size, confirming that higher temperatures accelerate the growth process. The use of a color gradient further enhances understanding, illustrating the growth rate visually. This visual representation provides compelling evidence that temperature is a critical factor in controlling the size of silver nanostructures during synthesis. By systematically varying the temperature and observing consistent changes in particle size, the chart validates the hypothesis that temperature manipulation can fine-tune nanostructure dimensions. This insight is crucial for optimizing synthesis conditions in practical applications, ensuring precise control over nanostructure properties for enhanced performance in biochemical sensing and other technologies.
Figure 15 demonstrates the response curves of three distinct sensors to varying concentrations of an analyte, from 0 to 100 ppm , revealing their efficiency and effectiveness. The logarithmic response (blue line)sensor shows high sensitivity at
Fig. 14 Temperature impact on silver nanoparticles growth
Fig. 15 Sensor response curves
low concentrations, with a steep increase in response that gradually tapers off, making it highly efficient for detecting low levels of analytes. Thelinear with noise (green line) sensor exhibits a primarily linear response with slight sinusoidal noise, maintaining consistent sensitivity across the concentration range. Despite minor fluctuations, the overall linear trend indicates reliable and stable performance, making this sensor suitable for applications requiring consistent sensitivity. The square root response (red line)sensor displays higher sensitivity at lower concentrations with a steep initial curve that becomes less steep as concentration increases. This characteristic highlights the sensor’s efficiency in detecting lower levels of analytes, making it ideal for applications needing high sensitivity at the low end of the concentration spectrum.
Figure 16 visualize how the electromagnetic field enhancement factor varies spatially within a polymer matrix, focusing on the resonance wavelength . It generates simulated data for spatial positions and their corresponding enhancement factors, calculated based on a Gaussian-like function centered around a peak position. The plot displays
Fig. 16 Electromagnetic field enhancement
Author contributions M. Sahaya Sheela and S.Kumarganesh perform experiments, wrote manuscript. Binay Kumar Pandey and Mesfin Esayas Lelisho perform experiment, wrote manuscript.
Funding The author(s) received no financial support for the research, authorship, and/or publication of this article.
Data availability The datasets used and/or analysed during the current study available from the corresponding author on reasonable request.
Code availability The relevant code with the manuscript is also available and would be available, if will be asked to do so later.
Declarations
Ethical approval and consent to participate Not applicable (as the results of studies do not involve any human or animal). Not applicable (as the results of studies do not involve any human or animal).
Competing interests The authors declare that they have’no known conflict of interests or personal relationships’ that could have appeared to influence the work reported in this paper.
Open Access This article is licensed under a Creative Commons Attribution 4.0 International License, which permits use, sharing, adaptation, distribution and reproduction in any medium or format, as long as you give appropriate credit to the original author(s) and the source, provide a link to the Creative Commons licence, and indicate if changes were made. The images or other third party material in this article are included in the article’s Creative Commons licence, unless indicated otherwise in a credit line to the material. If material is not included in the article’s Creative Commons licence and your intended use is not permitted by statutory regulation or exceeds the permitted use, you will need to obtain permission directly from the copyright holder. To view a copy of this licence, visit http://creativecommons.org/licenses/by/4.0/.
References
Teymourian H, Barfidokht A, Wang J. Electrochemical glucose sensors in diabetes management: an updated review (2010-2020). Chem Soc Rev. 2020;49(21):7671-709.
Ramakrishnan S, Sathvara P, Tripathi S, Jayaraman A. Water pollutants, sensor types, and their advantages and challenges. In: Sensors for environmental monitoring, identification, and assessment. IGI Global; 2024. pp. 78-101
Ataei Kachouei M, Kaushik A, Ali MA. Internet of Things—enabled food and plant sensors to empower sustainability. Adv Intell Syst. 2023;5(12):2300321.
Oliveira M, Conceição P, Kant K, Ainla A, Diéguez L. Electrochemical sensing in 3D cell culture models: new tools for developing better cancer diagnostics and treatments. Cancers. 2021;13(6):1381.
Tabatabaei MS, Islam R, Ahmed M. Applications of gold nanoparticles in ELISA, PCR, and immuno-PCR assays: a review. Anal Chim Acta. 2021;1143:250-66.
Fascista A. Toward integrated large-scale environmental monitoring using WSN/UAV/Crowdsensing: a review of applications, signal processing, and future perspectives. Sensors. 2022;22(5):1824.
Wang B, Yao X, Jiang Y, Sun C, Shabaz M. Design of a real-time monitoring system for smoke and dust in thermal power plants based on improved genetic algorithm. J Healthc Eng. 2021;2021(1):7212567.
Baskar D, Arunsi M, Kumar V. Energy-efficient and secure IoT architecture based on a wireless sensor network using machine learning to predict mortality risk of patients with COVID-19. In: 2021 6th international conference on communication and electronics systems (ICCES). IEEE; 2021. pp. 1853-61
Isildak Ö, Özbek O. Application of potentiometric sensors in real samples. Crit Rev Anal Chem. 2021;51(3):218-31.
Beaver K, Dantanarayana A, Minteer SD. Materials approaches for improving electrochemical sensor performance. J Phys Chem B. 2021;125(43):11820-34.
Phalaagae P, Zungeru AM, Sigweni B, Rajalakshmi S, Batte H, Eyobu OS. An energy efficient authentication scheme for cluster-based wireless IoT sensor networks. Sci Afr. 2024; e02287.
Beć KB, Grabska J, Huck CW. Biomolecular and bioanalytical applications of infrared spectroscopy-a review. Anal Chim Acta. 2020;1133:150-77.
Ravindran N, Kumar S, CAThirunavookarasu MSN, CK S. Recent advances in surface plasmon resonance (SPR) biosensors for food analysis: a review. Crit Rev Food Sci Nutr. 2023;63(8):1055-77.
De D, Mukherjee A, Das SK, Dey N. Wireless sensor network: applications, challenges, and algorithms. Nat Inspired Comput Wirel Sensor Netw. 2020; 1-18.
Na Songkhla S, Nakamoto T. Overview of quartz crystal microbalance behavior analysis and measurement. Chemosensors. 2021;9(12):350.
Alanazi N, Almutairi M, Alodhayb AN. A review of quartz crystal microbalance for chemical and biological sensing applications. Sens Imaging. 2023;24(1):10.
Riaz A, Sarker MR, Saad MHM, Mohamed R. Review on comparison of different energy storage technologies used in micro-energy harvesting, WSNs, low-cost microelectronic devices: challenges and recommendations. Sensors. 2021;21(15):5041.
Sugirtham N, Sherine Jenny R, Thiyaneswaran B, et al. Modified playfair for text file encryption and meticulous decryption with arbitrary fillers by septenary quadrate pattern. Int J Netw Distrib Comput. 2024. https://doi.org/10.1007/s44227-023-00019-4.
Kumarganesh S, Anthoniraj S, Senthil Kumar T, Elayaraja P, et al. A novel analytical framework is developed for wireless heterogeneous networks for video streaming applications. J Math. 2022;2022(1):1-7. https://doi.org/10.1155/2022/2100883.
Saravanan K, Anthoniraj S, Kumarganesh 1S et al. WMLP: web-based multi-layer protocols for emergency data transmission in mobile ad hoc network. In: International conference of computer sciences and renewable energies 2021 (ICCSRE2021) July 23-24, at Agadir, Morocco. 2021. https://doi.org/10.1051/e3sconf/202129701065.
Noah NM. Design and synthesis of nanostructured materials for sensor applications. J Nanomater. 2020;2020(1):8855321.
Sharma Y, Kapoor P. Noble metal nanostructures for various applications. Mater Today Proc. 2023;297:01065. https://doi.org/10.1016/j. matpr.2023.03.628.
Das R, Bera JN. Self-reconfigurable partial mesh using ZigBee control board towards fail-proof and reliable home area networking. Ad Hoc Netw. 2024;152: 103327.
Sharma M, Talwar R, Nassa VK, Binay K, Pandey D. Design and performance analysis of a multiband vivaldi antenna for wireless broadband communication in spectrum. In: Artificial intelligence and information technologies. CRC Press, 2025. pp. 86-91.
Sasidevi S, Kumarganesh S, Saranya S, Thiyaneswaran B, et al. Design of surface plasmon resonance (SPR) sensors for highly sensitive biomolecular detection in cancer diagnostics. Plasmonics J. 2024. https://doi.org/10.1007/s11468-024-02343-z.
Maheshwari RU, Kumarganesh S, KVM S, Gopalakrishnan A, Selvi K, Paulchamy B, Pandey D. Advanced plasmonic resonance-enhanced biosensor for comprehensive real-time detection and analysis of deepfake content. Plasmonics. 2024; 1-18.
Dhanasekar S, Martin Sagayam K, Pandey BK, Pandey D. Refractive index sensing using metamaterial absorbing augmentation in elliptical graphene arrays. Plasmonics. 2023; 1-11.
Abdulkarim YI, Awl HN, Muhammadsharif FF, Saeed SR, Sidiq KR, Khasraw SS, Dong J, Pandey BK, Pandey D. Metamaterial-based sensors loaded corona-shaped resonator for COVID-19 detection by using microwave techniques. Plasmonics. 2024;19(2):595-610.
Du John HV, Jose T, Jone AAA, Sagayam KM, Pandey BK, Pandey D. Polarization insensitive circular ring resonator based perfect metamaterial absorber design and simulation on a silicon substrate. SILICON. 2022;14(14):9009-20.
Du John HV, Moni DJ, Ponraj DN, Sagayam KM, Pandey D, Pandey BK. Design of Si based nano strip resonator with polarization-insensitive metamaterial (MTM) absorber on a glass substrate. Silicon. 2021; 1-10.
Du John HV, Jose T, Sagayam KM, Pandey BK, Pandey D Enhancing absorption in a metamaterial absorber-based solar cell structure through anti-reflection layer integration. Silicon. 2024; 1-11.
Du John HV, Sagayam KM, Jose T, Pandey D, Pandey BK, Kotti J, Kaur P. Design simulation and parametric investigation of a metamaterial light absorber with tungsten resonator for solar cell applications using silicon as dielectric layer. SILICON. 2023;15(9):4065-79.
Sharma M, Pandey D, Khosla D, Goyal S, Pandey BK, Gupta AK. Design of a GaN-based Flip Chip Light Emitting Diode (FC-LED) with au bumps & thermal analysis with different sizes and adhesive materials for performance considerations. SILICON. 2022;14(12):7109-20.
Sharma M, Pandey D, Palta P, Pandey BK. Design and power dissipation consideration of PFAL CMOS V/S conventional CMOS based 2: 1 multiplexer and full adder. SILICON. 2022;14(8):4401-10.
Raja DSS, Kumar DR, Santhiyakumari N, Kumarganesh S, Sagayam KM, Thiyaneswaran B, Pandey D. A compact dual-feed wide-band slotted antenna for future wireless applications. Analog Integr Circuits Signal Process. 2024;118(2):291-305.
Sharma M, Talwar R, Pandey D, Nassa VK, Pandey BK, Dadheech P. A review of dielectric resonator antennas (DRA)-based RFID technology for Industry 4.0. Robotics and Automation in Industry 4.0. 2024; 303-s sensor network using machine learning to predi24.
Antennas R, Sharma M, Talwar R, Pandey D, Nassa VK, Pandey BK, Dadheech P. 17 a review of dielectric. Robotics and automation in industry 4.0: smart industries and intelligent technologies. 2024; 303.
Pandey BK, Pandey D. Parametric optimization and prediction of enhanced thermoelectric performance in co-doped using response surface methodology and neural network. J Mater Sci Mater Electron. 2023;34(21):1589.
Anand R, Lakshmi SV, Pandey D, Pandey BK. An enhanced ResNet-50 deep learning model for arrhythmia detection using electrocardiogram biomedical indicators. Evol Syst. 2024;15(1):83-97.
Kumar Pandey B, Pandey D, Nassa VK, Ahmad T, Singh C, George AS, Wakchaure MA. Encryption and steganography-based text extraction in IoT using the EWCTS optimizer. Imaging Sci J. 2021;69(1-4):38-56.
Publisher’s Note Springer Nature remains neutral with regard to jurisdictional claims in published maps and institutional affiliations.
Mesfin Esayas Lelisho, mesfinesayas@mtu.edu.et; M. Sahaya Sheela, hisheelu@gmail.com; S. Kumarganesh, saikgss@gmail.com; Binay Kumar Pandey, binaydece@gmail.com | ¹Department of ECE, Vel Tech Rangarajan Dr. Sagunthala R&D Institute of Science and Technology, Chennai, Tamil Nadu, India. Department of ECE, Knowledge Institute of Technology, Salem, Tamil Nadu, India. Department of Information Technology, College of Technology, Govind Ballabh Pant University of Agriculture and Technology Pantnagar, Udham Singh Nagar, India. Mizan-Tepi University, Tepi, Ethiopia.