دورة كيميائية وكهربائية لتحليل الماء بفصل عالي الكفاءة في إلكتروليت قريب من الحيادية Electrochemical and chemical cycle for high-efficiency decoupled water splitting in a near-neutral electrolyte
الهيدروجين الأخضر الناتج عن تحليل الماء باستخدام الكهرباء المتجددة ضروري لتحقيق انبعاثات كربونية صفرية. تقنيات التحليل الكهربائي الحالية غير تنافسية مع الهيدروجين الرمادي منخفض التكلفة الناتج عن الوقود الأحفوري، مما يحد من إمكانيات توسيع نطاقها. تظهر العمليات المبتكرة التي تفصل تفاعلات تطور الهيدروجين والأكسجين وتنتجها في خلايا منفصلة أو مراحل مختلفة كمسار محتمل لتقليل تكلفة النظام من خلال تمكين التشغيل بدون أغشية ومكونات ختم باهظة الثمن. بعض هذه العمليات تقسم تفاعلات تطور الهيدروجين أو الأكسجين إلى تفاعلات فرعية كيميائية وكهروكيميائية، مما يمكنها من تحقيق كفاءة عالية. ومع ذلك، تم إثبات الكفاءة العالية فقط في عملية دفعة مع تقلبات حرارية تقدم تحديات تشغيلية. يقدم هذا العمل عملية مبتكرة تنتج الهيدروجين والأكسجين في خلايا منفصلة وتدعم التشغيل المستمر في نظام بدون أغشية. نحن نثبت كفاءة فارادائية وكهروكيميائية عالية ومعدل تشغيل مرتفع في إلكتروليت قريب من الحيادية من NaBr في الماء، حيث يتم أكسدة البروميد كهربائيًا إلى برومات بالتزامن مع تطور الهيدروجين في خلية واحدة، ويتم تقليل البرومات كيميائيًا إلى بروميد في تفاعل تحفيزي يتطور فيه الأكسجين في خلية أخرى. قد تؤدي هذه العملية إلى التحليل الكهربائي للماء بدون أغشية بكفاءة عالية تتجاوز قيود التحليل الكهربائي بالأغشية الذي يعود تاريخه إلى قرن من الزمان.
الهيدروجين الأخضر الناتج عن تحليل الماء باستخدام الطاقات المتجددة ضروري لتقليل انبعاثات غازات الدفيئة، خاصة في القطاعات الصناعية التي يصعب تقليل انبعاثاتها مثل إنتاج الصلب والأسمنت والأمونيا. في الوقت الحالي، تعتبر تقنيات التحليل الكهربائي للماء غير تنافسية مع الإنتاج منخفض التكلفة للهيدروجين الرمادي من خلال إصلاح الميثان بالبخار.. لذلك، هناك حاجة ملحة لتحسين التحليل الكهربائي للمياه لدعم الإنتاج منخفض التكلفة للهيدروجين الأخضر على نطاق التيروات. نحو هذا الهدف، تم فصل تحليل الماء الكهربائي (DWE)، حيث يتم فصل تفاعلات تطور الهيدروجين والأكسجين (HER و OER، على التوالي) من حيث الوقت و/أو المكان، قد برز كمفهوم ثوري أثار جهودًا مبتكرة للتغلب على قيود تحليل الماء الكهربائي.قد تقود DWE الطريق نحو التشغيل الآمن بدون أغشيةمما يوفر فرصًا جديدة لإعادة تشكيل التحليل الكهربائي للمياه وقد يتجاوز الحواجز الأساسية لهذه التكنولوجيا التي تعود إلى قرن مضى.
تم الإبلاغ عن DWE لأول مرة بواسطة سايمز وكرونين في عام 2013، حيث تم تقديم حمض الفوسفوموليبدينك كزوج مختزل قابل للذوبان (SRC) يعمل كعازل مرتبط بالإلكترون والبروتون ويقوم بوساطة تبادل الإلكترون والبروتون المرتبط بين تفاعل الأكسدة الأنودية (OER) وتفاعل الاختزال الكاثودي (HER).على الرغم من أن العملية تولد الأكسجين والهيدروجين في أوقات مختلفة على مراحل متتابعة، تم استخدام غشاء لمنع انتقال الأنيونات البوليوكسموليبدات بين الأقطاب، وكانت الكفاءة أقل من تلك الخاصة بالتحليل الكهربائي التقليدي للماء. الكفاءة المنخفضة هي عيب جوهري في هذا النهج، حيث إن جهد الأكسدة والاختزال في SRC يتراكم مع جهد OER وHER، مما يتطلب جهدًا أكبر من التحليل الكهربائي التقليدي للماء.. الدراسات اللاحقة التي اتبعت هذا النهج قدمت أنواعًا مختلفة من العوازل المرتبطة بالإلكترون والبروتون في الإلكتروليتات الحمضية، لكن الكفاءة ظلت منخفضة ولا يزال من الضروري وجود غشاء .
تم الإبلاغ عن مخطط DWE آخر بواسطة تشين وآخرون.وبواسطة لاندمان وآخرون، واستبدال SRC بأقطاب مختزلة صلبة (SRE). لهذا الغرض، تم استخدام أقطاب هيدروكسيد النيكل (الأكسيد) مثل تلك المستخدمة عادة في البطاريات القابلة لإعادة الشحن القلوية كأقطاب مساعدة تتوسط أيون الهيدروكسيد.تبادل بين الهيدروجين الناتج عند الكاثود في خلية واحدة والأكسجين الناتج عند الأنود في خلية أخرى. وبالتالي، تم تقسيم الخلية الكهربية إلى خليتين منفصلتين تنتجان الهيدروجين والأكسجين بعيدًا عن بعضهما البعض، مما يمهد الطريق لتقنية التحليل الكهربائي بدون غشاء. تتطلب هذه الطريقة تشغيلًا على دفعات لتجديد الأقطاب المساعدة، في حين تدعم خلايا التحليل الكهربائي المتسلسلة التشغيل المستمر تمامًا مثل المحللات الكهربائية التقليدية..
تم الإبلاغ عن نهج مختلف من قبل راوش وآخرين، حيث تم تقديم دورة كيميائية وكهروكيميائية حيث تم تقليل حمض السيليكو تنجستيك كهربائيًا عند الكاثود بينما تطور الأكسجين عند الأنود بكفاءة إلكتروليتية من (استنادًا إلى القيمة الحرارية العليا للهيدروجين)، ثم تم نقله إلى خلية أخرى حيث تم أكسدته كيميائيًا وأطلق الهيدروجين عند ملامسته لمحفز من البلاتينتم الإبلاغ عن القفزة التالية من قبل دوتان وآخرين، حيث قدموا دورة كيميائية كهربائية ومفعلة حرارياً (ETAC) تقسم تفاعل الأكسدة (OER) إلى تفاعلين فرعيين وتمكن من التشغيل في ظروف قريبة من التوازن الحراري.تم تحقيق ذلك من خلال تدوير أنود هيدروكسيد النيكل بين مرحلة كيميائية كهربائية (E) تشحن الأنود إلى أكسيد هيدروكسيد النيكل بينما يتطور الهيدروجين عند الكاثود، ومرحلة كيميائية نشطة حرارياً (TAC) تعيد تقليله إلى هيدروكسيد النيكل وتطور الأكسجين دون تطبيق الكهرباء.
تتيح عملية ETAC التشغيل بدون غشاء بكفاءة كهربائية ملحوظة من (على مستوى الخلية) عند كثافة تيار (المرجع 7). لكنها تقدم أيضًا تحديات جديدة تنشأ من التشغيل الدفعي والتأرجح بين الإلكتروليتات الباردة والساخنة في مراحل E و TAC، فضلاً عن قيود السعة ومعدل الأكسيد (أو هيدروكسيد) النيكل. يمكن تجاوز هذه القيود تمامًا من خلال نقل تخزين الشحن من الأنود الصلب من هيدروكسيد النيكل (أو أكسيد النيكل) إلى الإلكتروليت السائل، مما يمكّن من التشغيل المستمر بدلاً من التشغيل الدفعي وتجنب القيود الحركية التي تنشأ من الانتشار في الحالة الصلبة والتحولات الطورية في SRE.. يقدم هذا العمل إثبات مفهوم لهذا النهج الجديد، باستخدام SRC الذي يخزن ويطلق الأكسجين بدلاً من الهيدروجينويظهر DWE بدون أغشية في عملية مستمرة ومتساوية الحرارة (دون تقلبات حرارية) بكفاءة عالية وكثافة تيار عالية.
مفهوم
نقترح دورة كيميائية وكهربائية تقسم تفاعل أكسدة الأكسجين إلى تفاعلين فرعيين، كهربائي وكيميائي، مشابهين لدورة ETAC.. ولكن بدلاً من استخدام أنود هيدروكسيد النيكل (أوكسيد) ، نقترح SRC يدعم التشغيل المستمر وعملية متساوية الحرارة بكفاءة عالية وبمعدل مرتفع. يتم أكسدة SRC المخفض (red) في تفاعل كيميائي كهربائي (red، حيث هو عدد الإلكترونات) التي تكمل HER بدون إطلاق الأكسجين أو غيره من المنتجات الجانبية المتطايرة؛ وفي وجود محفز مناسب، يقوم SRC المؤكسد (ox) بإطلاق الأكسجين بشكل تلقائي في تفاعل كيميائي يعيده إلى حالته المختزلة. ). لتوفير قوة دافعة لهذه التفاعل الكيميائي، يجب أن يكون لدى SRC جهد أكسدة واختزال قابل للعكس ( ) فوق جهد الأكسدة الحرارية ( ، فيما يتعلق بالقطب الهيدروجيني القابل للعكس)، في حين أنه من أجل الكفاءة العالية يجب أن يتم أكسدته عند جهد زائد منخفض ويفضل أن يكون ذلك تحت جهد بدء تفاعل أكسدة الأكسجين (OER)لتحفيزات OER المتطورة. هذا يحدد جهد أكسدة-اختزال قابل للعكس مشابه لذلك من هيدروكسيد النيكل (الأكسجين). استنادًا إلى هذه المعايير، البروميدبروماتزوجتم اختيار. أملاح كل من الأنواع المختزلة والمؤكسدة، NaBr و، لديها قابلية ذوبان عالية في الماء، 946 وعلى التوالي (عند. علاوة على ذلك، البروم ( ) الناتج عند الأنود أكثر كثافة من الماء وهو قابل للذوبان بدرجة عالية في الماء، مما يقلل من خطر التبخر والاحتجاز بواسطة فقاعات الهيدروجين المنتجة عند الكاثود. هذا يجعل زوجين مفضلين علىزوج ينتج الكلور المتقلب ) ذات ذوبانية منخفضة في الماء ( في، مما يؤدي إلى فقدان فاراداي.
الشكل 1 يوضح عملية DWE لدينا لإنتاج الهيدروجين والأكسجين بشكل منفصل في خلايا مختلفة، باستخدامكنظام تخزين وإطلاق الأكسجين بالتناوب. تتكون الخلية الكهروكيميائية من كاثود ينتج الهيدروجين من خلال تفاعل تقليل الهيدروجين (التفاعل 1) وأنود يحدث فيه تفاعل أكسدة البروميد (التفاعل 2):
وفقًا للدراسات حول التحليل الكهربائي للبروميدجزيئات البروم ) الناتجة عند القطب الموجب تتفاعل مع الماء في كتلة الإلكتروليت لتكوين حمض الهيببروموس ( HBrO ، التفاعل 3) الذي يشكل أيونات الهيببروميت ( ) وأيونات البروتون عن طريق التفكك (التفاعل 4). تتفاعل أيونات الهيبوم bromite مع حمض الهيبوم bromous لتكوين أيونات البرومات (، التفاعل 5)، المنتج المطلوب:
يمكن تلخيص العملية المتعلقة بالأنود بشكل عام، التفاعلات 2-5، بالتفاعل 6:
مما يؤدي إلىنسبة 6:3:1. للاختصار، توضح الشكل 1 التفاعلات المرتبطة بالأنود (التفاعلات 2-5) كتفاعل واحد (التفاعل 6).
HBrO ويمكن أن تؤدي المنتجات الوسيطة إلى تفاعلات جانبية غير مرغوب فيها :
الشكل 1| عملية DWE المقترحة. توضيح تخطيطي لعملية DWE المقترحة مع توليد مستمر لـ و في خلايا كهربائية وكيميائية منفصلة باستخدامكزوج أكسدة واختزال قابل للذوبان. البروميت المؤكسديتدفق الإلكتروليت من قاع الخلية الكهروكيميائية إلى قاع الخلية الحفازة، حيث يتم اختزاله إلى بروميد.بواسطة محفز ويتدفق من أعلى الخلية التحفيزية إلى أعلى الخلية الكهروكيميائية. يمثل الطلاء الأخضر طبقة من هيدروكسيد الكروم شبه النفاذ.
عملية فيوتم العثور على أن الرقم الهيدروجيني 8 يوفر ظروفًا مثالية لقمع تطور الأكسجين (التفاعل 7) وتحقيق قريب منكفاءة فاراداي لإنتاج البرومات (التفاعل 6)للقضاء على التفاعلات العكسية الكاثودية (التفاعلات 8-11)، يتم استخدام كمية صغيرة ( ) من ثنائي كرومات الصوديوم ( ) يضاف إلى إلكتروليت بروميد الصوديوم ( NaBr ) المائي. أيونات الديكرومات ( ) يتم تقليلها وترسيبها على الكاثود، مما يغلفه بطبقة من هيدروكسيد الكروم شبه النفاذ (الموضح بالطبقة الخضراء في الشكل 1) التي تقمع تفاعلات فقدان الكاثود بينما تسمح بحدوث تفاعل تقليل الهيدروجين دون عائق. وهذا يمكننا من تحقيق كفاءة فارادائية عالية دون الحاجة إلى غشاء لتقسيم الخلية إلى أقسام أنودية وكاثودية.
تتكون الخلية الحفازة من عمود مدمج مع محفز (الشكل 1، اليمين) يسهل التحلل الحفازي لأنيونات البرومات.) إلى بروميد ( ) والأكسجين:
تم ربط الخليتين في نظام تدفق يوفر تدفقًا مستمرًا للإلكتروليت من خلية إلى أخرى، كما هو موضح في الشكل 1.
إثبات المفهوم
تم التحقق من جدوى عملية DWE المقترحة بشكل منفصل في مجموعتين من التجارب التي تفحص أداء العمليات الفرعية الكهروكيميائية والحفزية. ثم تم إجراء قياسات تكميلية تجمع بين العمليتين الفرعيتين في عملية موحدة من الدفعة إلى الحمام التي تفصل الماء إلى هيدروجين وأكسجين في خلايا منفصلة.
العملية الكهروكيميائية
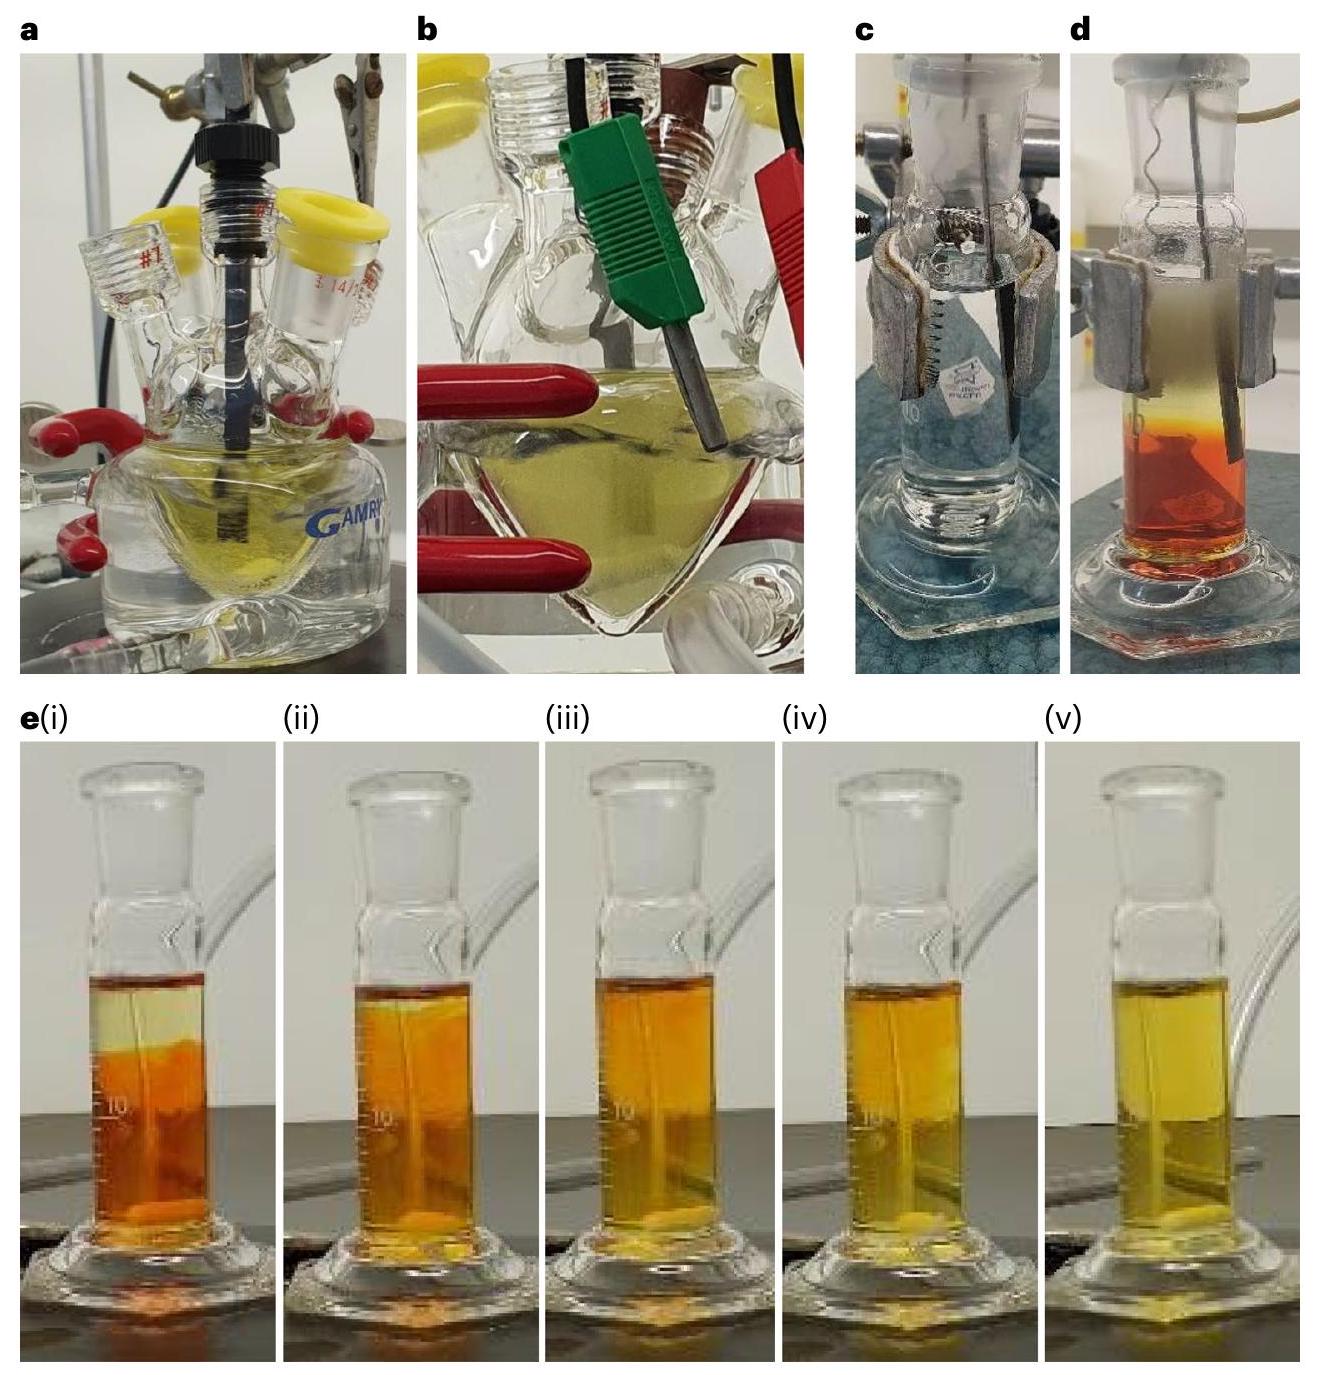
تم فحص العملية الكهروكيميائية في وضعين تشغيليين. الوضع الأول (الرئيسي) يتوافق مع التحليل الكهربائي للبرومات في محلول مائي 1.5 م من NaBr مع إضافةحيث تم تسخين الإلكتروليت إلى وتم التحريك خلال العملية. في الوضع الثاني، قمنا بدراسة إمكانية إجراء العملية دون المواد السامة مضاف باستخدام فصل الطور بين البروم عالي الكثافةالذي يتشكل على الأنود (التفاعل 2) وبقية الإلكتروليت لتقليل انتشار نواتج التفاعل إلى الكاثود. في الوضع الثاني، تم إجراء التحليل الكهربائي في إلكتروليت غير مسخن (في درجة حرارة الغرفة) دون تحريك. تقدم الشكل 2 صورًا لاختبارات التحليل الكهربائي التي أجريت في الوضعين الأول والثاني (الشكل 2أ، ب والشكل 2ج، د، على التوالي؛ تم تلخيص تركيبة الإلكتروليت وظروف التجربة الأخرى في الجدول 1). في كلا الحالتين، تم وضع الأنود والكاثود في خلية تحليل كهربائي بدون غشاء أو تقسيم الحجاب الحاجز. إضافة في وضع التشغيل الأول نتجت محلول ذو لون مصفر (قبل التحليل الكهربائي)، كما هو موضح في الشكل 2أ، بينما في غيابه في الوضع الثاني كان المحلول الكهربائي عديم اللون (الشكل 2ج). خلال التشغيل في الوضع الأول، أصبح حجم المحلول الكهربائي بالكامل غائمًا (الشكل 2ب) بسبب تطور فقاعات الهيدروجين التي تم تحريكها في جميع أنحاء الخلية. ظل لون المحلول الكهربائي مصفرًا، مع مساهمات من كلاالأنيونات والوسائط المؤكسدة للبروميد. أدت العملية في الوضع الثاني إلى تكوين فقاعات هيدروجين كثيفة في أعلى الخلية، جنبًا إلى جنب مع فصل الطور بين الأحمر-محلول مؤكسد غني غرق في قاع الخلية، والمحلول الأصفر الذي يحتوي على أنواع بروم مؤكسدة في الجزء العلوي من الخلية (الفيديو التوضيحي 1). أدى التحريك اللاحق إلى تحويل المحاليل الحمراء والصفراء المنفصلة عن بعضها إلى محلول أصفر متجانس (الشكل 2e(i)-(v) والفيديو التوضيحي 2)، مما يشير إلى أنتفاعل المحلول الغني مع بقية الإلكتروليت وفقًا للتفاعلات. ومع ذلك، تبقى كمية متبقية من المنتجات الوسيطة غير المتفاعلة، كما يتضح من اللون الأصفر للمحلول المقلوب.
تم فحص الكفاءة الفارادائية للأكسدة الكهربائية للبروميد لكلا وضعي التشغيل، مع وبدونعن طريق التحليل الكهربائي لـ 20 مل من محلول 1.5 م من NaBr (بدون مواد عازلة) لمدة 5.36 ساعات عند تيار 600 مللي أمبير (إجمالي الشحنة، 11,578 كولوم) وتحليل محتوى البرومات الناتج بواسطة المعايرة اليودومترية (الفيديو التكميلي 3). بالنظر إلى أن ستة إلكترونات مطلوبة لأكسدة أيون البروميد إلى أيون البرومات (التفاعل 6)، يجب أن تنتج هذه الشحنة 0.02 مول من أيونات البرومات عندكفاءة فاراداي والتحويلأيونات البروميد في الإلكتروليت الأولي (20 مل من 1.5 مولي NaBr) إلى أيونات البرومات. في وضع التشغيل الأول (الشكل 2ب)، كانت الكفاءة الفارادية“، مما يدل على النجاح في قمع التفاعلات الجانبية الكاثودية (التفاعلات 8-11) بالإضافة إلى تفاعل الأكسدة الكهربائية (التفاعل 7). تم تقديم تأكيد مباشر على عدم وجود تداخل من تفاعل الأكسدة الكهربائية في الفيديو التوضيحي 4، الذي يظهر تحليل البروميد في جهاز هوفمان دون تطور للأكسجين. بدون الـالإضافي (ولكن تحت نفس الظروف)، انخفضت الكفاءة الفارادائية إلى، مما يدل على الدور المهم لـلمنع التفاعلاتعن طريق تشكيل حاجز كاثودي بولي أكسيد، كما تم الإبلاغ عنه في أماكن أخرى.
في وضع التشغيل الثاني (الشكل 2d)، بدونكفاءة فاراداي كانتدون تحريك، وسقط إلىمع التحريك، مما يظهر فعالية الفصل الطوري التلقائي بين الإلكتروليت المؤكسد وبقية الإلكتروليت في كبح تفاعلات فقدان الكاثود (التفاعلات 8-11). قد يتم تعزيز الكفاءة الفارادية بشكل أكبر من خلال إزالة الإلكتروليت المؤكسد من قاع الخلية، كما هو موضح في الشكل 1. قد يؤدي هذا النهج إلى تشغيل عالي الكفاءة في إلكتروليت NaBr غير الضار دونتم الإبلاغ عن نهج مشابه في بطاريات تدفق الزنك-بروميد بدون غشاء، حيث يتم استغلال فصل الطور في الإلكتروليت لقمع التفاعلات العكسية مثل تلك التي تحدث في نظامنا.. نهج بديل لإضافة إلى الإلكتروليت هو تغليف الكاثود مسبقًا (خارج الموقع) بطبقة من بولي أكسيد الكروم (أو غيره) بدلاً من الترسيب في الموقع لـالأنيونات أثناء التشغيل في وجودلقد حققنا نجاحًا جزئيًا في اتباع هذا النهج من خلال استخدام كاثود مسبق الطلاء تم تركيبه بعد اجتيازه اختبارات التحليل الكهربائي السابقة معفي الإلكتروليت، تصل إلى فارادايك
الشكل 2 | اختبارات التحليل الكهربائي للبروميد. أ-هـ، صور للخلايا الكهربائية التي استخدمناها لفحص عملية التحليل الكهربائي للبروميد مع التحريك (أ وب) وبدون تحريك ( ) الكهارل. الألواح و قبل التحليل الكهربائي؛ و تكون خلال
التحليل الكهربائي؛ ويظهر لقطات متسلسلة خلال التحريك اللاحق بعد التحليل الكهربائي (الفيديو التكميلي 2). تم تلخيص تركيبة الإلكتروليت وظروف التجربة الأخرى في الجدول 1.
الجدول 1 | الظروف التجريبية لقياسات الكفاءة الفارادائية
رقم التجربة
شكل
كفاءة فارادايك (%)
نوع الخلية
الكاثود
طلاء الكاثود
درجة الحرارة ( )
التحريك (دورة في الدقيقة)
الرقم الهيدروجيني، الابتدائي
الرقم الهيدروجيني، النهائي
1
–
خلية مزدوجة الجدار
رقائق البلاتين
–
60
٤٠٠
5.8
9.2
2
2أ،ب
3.8 مللي مول
في الموقع
٧.٥
7.9
٣
–
خارج الموقع
5.8
9.5
٤
2c-e
–
خلية أسطوانية
ملف Pt
–
ر.ت.
–
5.8
8.3
٥
–
٤٠٠
5.8
10.5
تيار التحليل الكهربائي، 600 مللي أمبير؛ مدة التحليل الكهربائي،محلول 1.5 م من NaBr (بدون عازل)؛ درجة حرارة الغرفة.تغطية في الموقع عن طريق الاختزال الكهربائي لـالأنيونات والترسيب الكاثودي أثناء التحليل الكهربائي.استخدام كاثود مطلي مسبقًا من اختبارات التحليل الكهربائي السابقة. كفاءةفي الاختبارات اللاحقة بدوننشتبه في أن الكفاءة الفارادية المنخفضة للقطب السالب المسبق الطلاء مقارنةً بالطلاء في الموقع أثناء التحليل الكهربائي في وجودفي الإلكتروليت يمكن أن يُعزى إلى انفصال أجزاء صغيرة من طبقة الطلاء أثناء التشغيل. في وجودالأنيونات في الإلكتروليت، فإن طبقة الحاجز أكثر فعالية من الطلاء المسبق خارج الموقع، ربما بسبب الشفاء الذاتي لطبقة البوليوكسيد أثناء التشغيل. بالإضافة إلى ذلك،كما يعمل كعازل، وبدونه ينتقل الرقم الهيدروجيني إلى قيم مرتفعة (الجدول 1) قد تعزز الطفيليات. تطور الأكسجين (التفاعل 7). تظهر الاختبارات طويلة الأمد استقرار العملية في وجودخلال التشغيل المستمر على مدى خمسة أيام، كما هو موضح في الشكل البياني الممتد 1، من خلال مراقبة تركيز البروميد والبرومات في الإلكتروليت (الأشكال البيانية الممتدة 2 و3، على التوالي).
بالإضافة إلى قياسات الكفاءة الفارادية، تم قياس الكفاءة الكهروكيميائية (أي كفاءة الجهد) للوضع التشغيلي الأول (الشكل 2ب)، الذي أظهر أعلى كفاءة فارادية.تم ذلك بواسطة جلفانستاتيك ذو قطبين
الشكل 3 | كفاءة التحليل الكهربائي للبروميد. أ، كثافة التيار في الحالة المستقرة مقابل الجهد (I النتائج المصححة التي تم الحصول عليها من قياسات الجلفانستاتيك عند كثافات تيار مختلفة خلال التحليل الكهربائي للبروميد مع (رموز زرقاء) وبدون (رموز سوداء) محلول بورات (0.7 م). للمقارنة، تم تمييز النتائج من تقارير DWE السابقة برموز حمراء.لـ SRC، و SRE و * لـ ETAC) وموسومة بأرقامها المرجعية الخاصة. كانت تركيبة الإلكتروليت في بداية قياسات التحليل الكهربائي 1.5 مولي NaBr مع، مع وبدون محلول بورات. الـ
تم تسخين الإلكتروليت إلىوتم التحريك بسرعة 400 دورة في الدقيقة، ج، منحنيات كثافة التيار مقابل الجهد المصححة) للقطب السالب من رقائق البلاتين وDSA (الأنود)، على التوالي، تم الحصول عليها من قياسات LSV بمعدل مسح جهدتُلخص الظروف التجريبية لجميع القياسات في الجدول 2. تمثل نقاط البيانات وأشرطة الخطأ في (أ) القيم المتوسطة والانحراف المعياري للقياسات الجلفانية المقدمة في الشكل الإضافي 5 (القيم العددية مقدمة في الجدول التكميلي 1ب).
تم إجراء جميع القياسات في إلكتروليت مسخن ). كان الرقم الهيدروجيني الابتدائي 8. CE، القطب المضاد؛ RE، القطب المرجعي؛ WE، القطب العامل؛ RHE، القطب الهيدروجيني القابل للعكس. قياسات الفولتمترية عند كثافات تيار مختلفة تتراوح من 5 إلىبدون ومع محلول بورات (البيانات الموسعة الأشكال 4 و 5، على التوالي). الشكل 3أ يعرض كثافة التيار في الحالة المستقرة مقابل نتائج الجهد (مصححة IR، حيث I هو التيار والمقاومة السلسلية) التي تم الحصول عليها لعملية التحليل الكهربائي للبروميد في المحاليل غير المنظم (أسود) والمنظمة (0.7 م محلول بورات، أزرق) في محاليل 1.5 م NaBr معمسخن إلى وتم التحريك بسرعة 400 دورة في الدقيقة؛ تم تلخيص ظروف التجربة لهذه القياسات في الجدول 2. إدخال محلول بورات بتركيز 0.7 م يقلل من جهد الخلية بـ عند كثافات تيار تصل إلى ، مما يؤدي إلى جهد بدء منخفض قدره 1.5 فولت عند يظل الانخفاض في جهد الخلية ملحوظًا حتى عندتم الحصول على جهد خلية قدره 2.4 فولت عند كثافة تيار عالية من. وبالتالي، زادت كفاءة الخلية الكهروكيميائية من 86 إلىفي، ومن 75 إلى في (الشكل التوضيحي 1). مقارنة نتائجنا (المنحنيات السوداء والزرقاء) مع تقارير DWE السابقة، المميزة بالرموز الحمراء (، و )، يُظهر أن الأداء الكهربائي لعمليتنا يتجاوز تقارير DWE السابقة باستخدام SRC و SRE (المعلمة بالمربعات المفتوحة والمملوءة، و ، على التوالي)، باستثناء عملية ETAC (المعلمة بالنجوم، تقدم عملية التحليل الكهربائي للماء باستخدام ETAC أقل جهد خلية، 1.5 فولت عند كثافة تيار (المرجع 7)، لكنه يصل فقط إلى بينما تصل عمليتنا إلى. أيضًا، على عكس ETAC، الذي هو عملية دفعة مع تقلبات حرارية تتطلب طاقة حرارية إضافية لتسخين الإلكتروليت الساخن في الانتقالات من المرحلة الباردة إلى المرحلة الساخنةتم تصميم عمليتنا للعمل بشكل مستمر وبحرارة ثابتة (الشكل 1)، مما يتجنب هذه الخسارة الحرارية ويزيد من إنتاجية العملية. ونتيجة لذلك، من المتوقع أن يكون الفارق بين الكفاءة على مستوى الخلية ومستوى النظام أصغر لعمليتنا. كما نلاحظ أنه تم ملاحظة تشغيل مستقر في قياسات الجلفانستاتيك المطولة لمدة 5.5 ساعة (الشكل البياني الممتد 6).
لتقييم المساهمات الفردية للتفاعلات الكاثودية والأنيودية في جهد عمليتنا، قمنا بتحليل خسائر الاستقطاب الكاثودي (تفاعل تقليل الهيدروجين) والأنيودي (تفاعل أكسدة البروميد) من خلال قياسات الفولتمترية ذات المسح الخطي في خلية ثلاثية الأقطاب. تم تقديم النتائج في الشكل 3ب، ج، حيث تظهر كثافة التيار كدالة لجهد كاثود رقائق البلاتين والأنود المستقر أبعادياً (DSA)، على التوالي. تم إجراء هذه القياسات في محاليل إلكتروليت 1.5 م من NaBr تحتوي على تركيزات مختلفة من مخفف البورات (كما هو موضح في الشرح)، تحت نفس الظروف كما في وضع التشغيل الأول لقياسات الجلفانستاتيك باستثناء عدم إضافةيمكن ملاحظة أن التفاعل الكاثودي (الشكل 3ب) يتطلب جهدًا زائدًا أعلى بكثير من نظيره الأنودي (الشكل 3ج). وبالتالي، فإن تفاعل تقليل الهيدروجين يمثل الخسارة الرئيسية في الاستقطاب في عمليتنا الكهروكيميائية. إن إضافة محلول بورات يعزز حركية تفاعل تقليل الهيدروجين ويقلل بشكل كبير من خسارة الجهد الزائد الكاثودي (الشكل 3ب)، مع تأثير ضئيل على الاستقطاب الأنودي (الشكل 3ج). يمكن أن يُعزى التأثير المفيد لمحلول بورات في تقليل خسارة الجهد الزائد الكاثودي إلى عمله كمصدر للبروتونات في محلول NaBr القريب من الحيادية.وقمع تدرجات الرقم الهيدروجيني المحلية عند الكاثود.
عملية تحفيزية
تمت دراسة حركيات تحلل البرومات إلى بروميد وأكسجين (التفاعل 12) باستخدامالعامل المساعد الذي تم اختياره بناءً على
الشكل 4 | التحلل الحفزي للبرومايت إلى بروميد وأكسجين. تأثير العازل (أ) و التأثير (ب) على التحويل الحفزي لـ إلىو (رد فعل 12). كان الإلكتروليت وكان تحميل المحفز 50 ملغ في أ و 25 ملغ في ب. ج، التحويل الحفزي لـ 1 م
محلول البرومات الذي تم الحصول عليه من خلال التحليل الكهربائي للبروميد (الشكل 2ب). كانت كمية المحفز 50 ملغ. يمثل المنحنى الأسود الصلب نسبة تحويل البرومات إلى بروميد، بينما يمثل المنحنى الأزرق المتقطع التيار الكهربائي المكافئ.
الجدول 3 | الظروف التجريبية لتجارب التحلل الحفزي
شكل
معدل أولي ( )
كتلة آدامز (مغ)
الإضافات
–
0.0310
١٠٢.٨
لا
4أ
0.0362
٥١.٢
4ب
0.0349
٢٥.٥
4أ
0.0041
51.6
محلول فوسفات بتركيز 0.1 م
4أ
0.0068
٥٥.٠
محلول بورات بتركيز 0.1 م
٤ب
0.0168
٢٥.٤
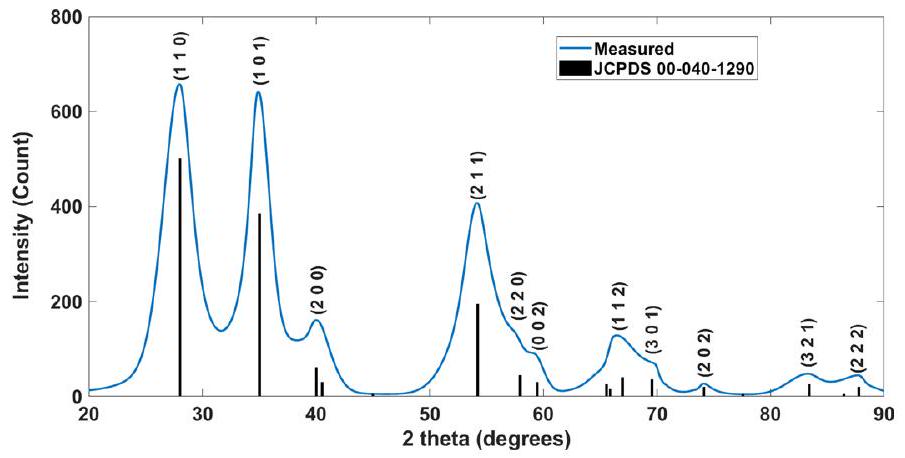
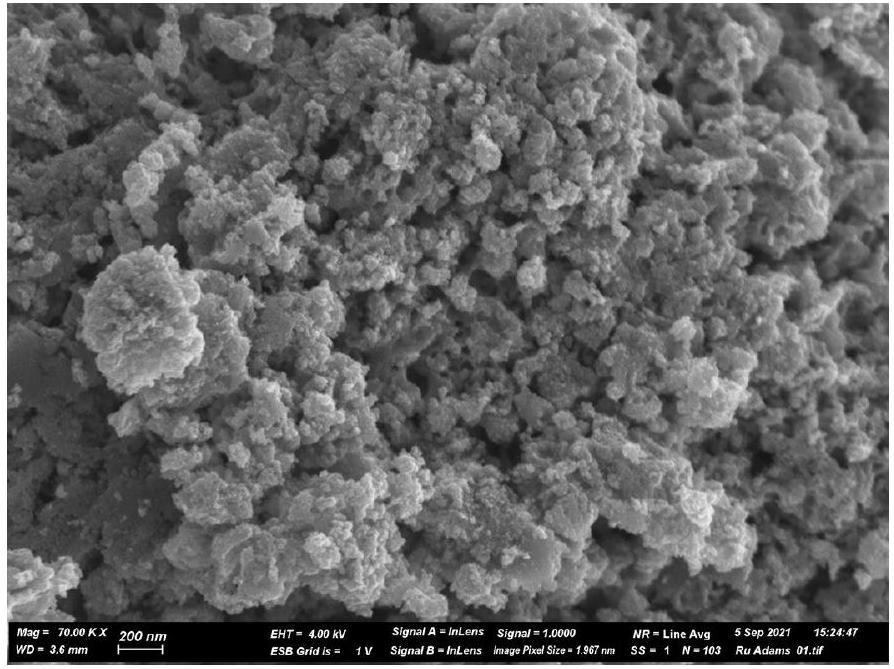
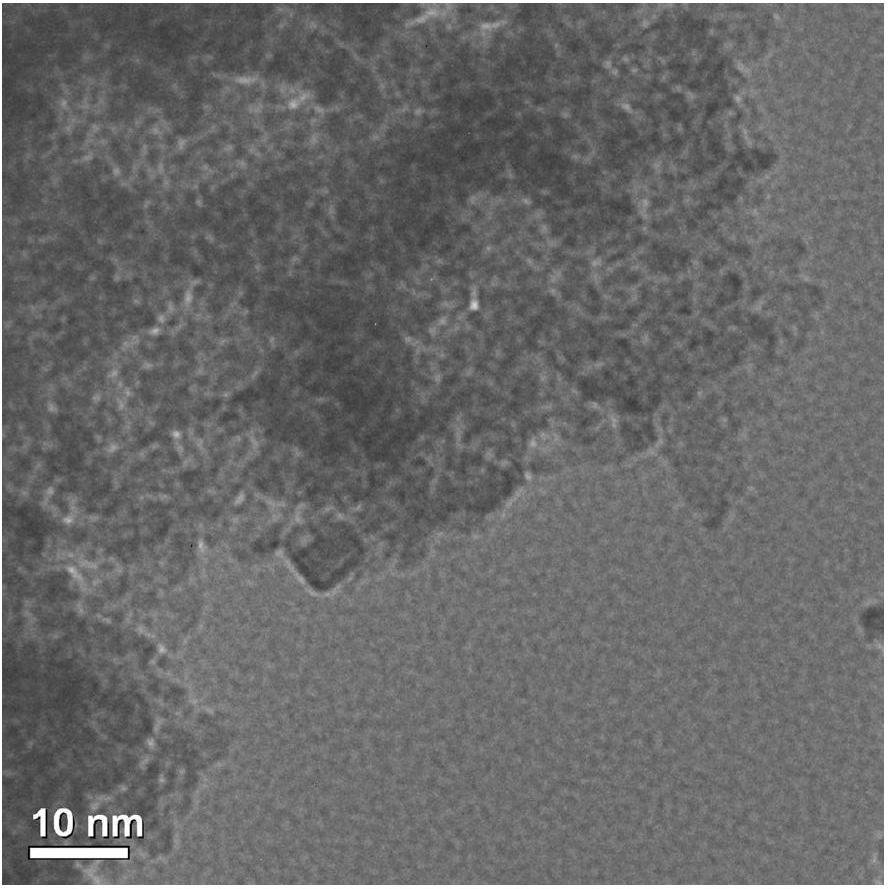
تمت جميع القياسات في بيئة مسخنة ومتحركة.إلكتروليت400 دورة في الدقيقة). كان الرقم الهيدروجيني الابتدائي 8. التقارير السابقةتم تخليق المحفز باستخدام طريقة آدامز, كما هو موضح في الطرق. كان هذا المحفز مكونًا من المرحلة الروتيلية، كما يتضح من مخطط حيود الأشعة السينية المعروض في الشكل 7 من البيانات الموسعة، مع هيكل حبيبي يتكون من تجمعات دون الميكرومتر، كما هو موضح في صور المجهر الإلكتروني الماسح والمجهر الإلكتروني الناقل، المعروضة في الشكلين 8 و 9 من البيانات الموسعة، على التوالي، مع مساحة سطح برونور-إيميت-تيلر تبلغ (الشكل التكميلي 3ب) وتوزيع حجم المسام ثنائي النمط مع و مسام (الشكل التكميلي 3ج). تم قياس تحويل البرومات إلى بروميد من خلال مراقبة حجم الغاز الناتج (الأكسجين) كدالة للوقت أثناء التحلل التحفيزي لـ محلول مائي (تم تسخينه مسبقًا إلى ) في وجود المحفز، باستخدام طريقة إزاحة الماء (الطرق للتفاصيل؛ صورة للنظام موجودة في الشكل التكميلي 4 والفيديو التكميلي 5). تم تلخيص الظروف التجريبية لهذه القياسات في الجدول 3. تم غسل بعض المحفز بواسطة الغاز الناتج خارج الخلية التحفيزية. هذه الظاهرة أعاقت التقييم الكمي الدقيق للنشاط النوعي للمحفز. ومع ذلك، فإن التجارب المعروضة هنا تظهر وظيفة العملية وأدائها. يجب أن يهدف التطوير المستقبلي لهذه العملية إلى تثبيت المحفز عن طريق تضمينه في دعم مسامي.
قمنا بدراسة تأثير المحاليل العازلة من البورات والفوسفات (0.1 م) على حركية التفاعل، باستخدام من محفز آدامز. يقدم الشكل 4أ نسبة تحويل البرومات إلى بروميد كدالة للوقت للمحلول الأساسي ( ) مع وبدون المحاليل العازلة من البورات والفوسفات. بدون عازل (المنحنى الأسود)، تم تحقيق تحويل كامل في ، وكانت سرعة التفاعل الأولية . كان لإضافة العازل (0.1 م) إلى الإلكتروليت الأساسي تأثير
سلبي على حركية تحلل البرومات (الشكل 4أ)، وكان أسوأ بالنسبة لعازل الفوسفات (المنحنى الأحمر) مقارنة بعازل البورات (المنحنى الأزرق). بالنسبة لعازل البورات، كانت سرعة التفاعل الأولية ، وتم تحقيق تحويل كامل في ، بينما بالنسبة لعازل الفوسفات انخفضت سرعة التفاعل الأولية إلى ولم يتم تحقيق تحويل كامل في الإطار الزمني لهذه القياسات (10 ساعات). بعد ذلك، تم دراسة تأثير المضاف على حركية التفاعل، باستخدام 25 ملغ من محفز آدامز. تم تقديم النتائج في الشكل 4ب. في الإلكتروليت بدون (المنحنى الأسود)، تم تحقيق تحويل كامل في وكانت سرعة التفاعل الأولية . أدت إضافة إلى تقليل سرعة التفاعل الأولية إلى وتأخير تحقيق التحويل الكامل إلى . يمكن أن يُعزى التثبيط التحفيزي في وجود المحاليل العازلة من الفوسفات والبورات و المضاف إلى الامتصاص التنافسي على سطح المحفز الذي يتداخل مع امتصاص البرومات.
عملية من دفعة إلى دفعة
لإثبات جدوى عملية DWE الخاصة بنا، قمنا بدمج العمليات الفرعية الكهربائية والتحفيزية في عملية من دفعة إلى دفعة. تم أخذ عينة من 7 مل من 20 مل من الإلكتروليت المؤكسد من أفضل اختبار كهربائي (الشكل 2ب) بعد تحويل 1 م من تركيز البروميد إلى برومات، وتم نقلها إلى الخلية التحفيزية مع 50 ملغ من محفز آدامز، الذي قام بتحلل أيونات البرومات إلى أيونات بروميد وأكسجين. تم قياس حجم الغاز الناتج (الأكسجين) (الشكل التكميلي 4) وتحويله إلى نسبة تحويل البرومات إلى بروميد، المعروضة كدالة لوقت التفاعل في الشكل 4ج (المنحنى الأسود الصلب). تظهر النتائج تحويلًا كاملاً (100%) للبرومات الذي تم الحصول عليه كهربائيًا إلى بروميد وأكسجين بعد . وهذا يظهر دورة كاملة لتطور الهيدروجين وأكسدة البروميد إلى برومات مع كفاءة فارادائية تبلغ في الخلية الكهربائية، تليها تحويل كامل للبرومات المتكون في الخلية الكهربائية مرة أخرى إلى بروميد مع تطور أكسجين ستويكيومتري في الخلية التحفيزية.
ربط الخلايا الكهربائية والتحفيزية في نظام تدفق مشترك يتجاوز نطاق هذه الدراسة، التي تقدم إثبات مفهوم لعملية DWE جديدة وتظهر وظيفتها الأساسية وأدائها. في نظام كامل مع تدفق إلكتروليت مستمر بين الخليتين، من المهم مطابقة معدل تكوين البرومات في الخلية الكهربائية مع معدل تحويله مرة أخرى إلى بروميد في الخلية التحفيزية. لمقارنة هذه المعدلات في اختباراتنا، تم تحويل معدل تطور الأكسجين الذي تم قياسه في الخلية التحفيزية إلى تيار كهربائي مكافئ من خلال تخصيص أربعة إلكترونات لكل جزيء ، كما هو موضح بالمنحنى الأزرق المتقطع في الشكل 4ج. في بداية التفاعل، تتوافق سرعة التحويل مع
تيار مرتفع يزيد عن 1 أمبير. وهذا يشير إلى تفاعل تحفيزي سريع لن يحد من التفاعل الكهربائي في الخلية الأخرى. في التطوير المستقبلي للعملية المستمرة، يجب ضبط عدة معلمات لمطابقة معدلات تكوين البرومات والتحلل في الخلايا الكهربائية والتحفيزية. في الخلية الكهربائية، يجب ضبط التيار المطبق، وحجم القطب، وتركيب وحجم الإلكتروليت. في الخلية التحفيزية، يجب مطابقة طول وقطر العمود التحفيزي، وكمية المحفز والدعم المسامي الذي تم تضمينه بشكل صحيح مع التيار الكهربائي ومعدل تدفق الإلكتروليت لدعم عملية مستمرة سلسة.
باختصار، تقدم هذه الدراسة عملية DWE جديدة تنتج الهيدروجين والأكسجين في خلايا كهربائية وتحفيزية منفصلة وتدعم التشغيل المستمر في نظام بدون غشاء. نحن نوضح كفاءة عالية ومعدل مرتفع في إلكتروليت قريب من الحياد من NaBr في الماء، حيث يتم أكسدة البروميد كهربائيًا إلى برومات بالتزامن مع تطور الهيدروجين في خلية واحدة، ويتم تقليل البرومات كيميائيًا إلى بروميد في تفاعل تحفيزي يتطور الأكسجين في خلية أخرى. تم تحقيق كفاءة فارادائية تبلغ في إلكتروليت NaBr بتركيز 1.5 م مع التي تمنع تفاعلات فقد الكاثود عن طريق تغليف الكاثود بطبقة حاجزة تعيق الاختزال الكهربائي للأنواع المؤكسدة من البروم. تحت هذه الظروف، لا يتطور الأكسجين في الخلية الكهربائية، مما يمكّن التشغيل الآمن بدون أغشية. إضافة عازل البورات تعزز HER وتقلل من جهد الخلية (مصحح IR) إلى 1.5 فولت عند كثافة تيار تبلغ ، أو 2.4 فولت عند . تتوافق هذه القيم مع قيم كفاءة كهربائية تبلغ و ، على التوالي، متفوقة على التقارير السابقة حول تقسيم الماء المفصول باستخدام عوازل مرتبطة بالإلكترون . كفاءة الإلكتروليت في نظامنا أقل قليلاً من تلك المبلغ عنها في تقسيم الماء ETAC ، لكن عمليتنا تدعم التشغيل المستمر بدون تقلبات حرارية، على عكس ETAC، التي هي عملية دفعة مع تقلبات حرارية بين الإلكتروليتات الباردة والساخنة. ميزة أخرى لعمليتنا هي التشغيل في إلكتروليت قريب من الحياد، على عكس التقارير السابقة حول DWE في الإلكتروليتات الحمضية أو القلوية. نحن أيضًا نوضح تقليل سريع للإلكتروليت المؤكسد وتطور الأكسجين بواسطة محفز دون تطبيق الكهرباء. يجب أن تهدف الجهود الإضافية لتطوير هذه العملية الرائدة إلى تقنية تنافسية لإنتاج الهيدروجين الأخضر إلى الأهداف التالية: (1) استبدال كاثود Pt و أنود (DSA) ومحفز ( آدامز) ببدائل وفيرة من الأرض؛ (2) استبدال المضاف ببدائل غير سامة؛ و (3) دمج العمليات الفرعية الكهربائية والتحفيزية في عملية سلسة، والتحقق من أدائها على المدى الطويل.
المحتوى عبر الإنترنت
أي طرق، مراجع إضافية، ملخصات تقارير Nature Portfolio، بيانات المصدر، بيانات موسعة، معلومات تكملية، شكر وتقدير، معلومات مراجعة الأقران؛ تفاصيل مساهمات المؤلفين والمصالح المتنافسة؛ وبيانات توفر البيانات والرموز متاحة على https://doi.org/10.1038/s41563-023-01767-y.
References
Krishnan, S. et al. Present and future cost of alkaline and PEM electrolyser stacks. Int. J. Hydrogen Energy 48, 32313-32330 (2023).
McHugh, P. J., Stergiou, A. D. & Symes, M. D. Decoupled electrochemical water splitting: from fundamentals to applications. Adv. Energy Mater. 10, 2002453 (2020).
Ifkovits, Z. P., Evans, J. M., Meier, M. C., Papadantonakis, K. M. & Lewis, N. S. Decoupled electrochemical water-splitting systems: a review and perspective. Energy Environ. Sci. 14, 4740-4759 (2021).
Landman, A., Rothschild, A. & Grader, G. S. in Electrochemical Power Sources: Fundamentals, Systems, and Applications, Hydrogen Production by Water Electrolysis (eds Smolinka, T. & Garche, J.) Ch. 12, 407-454 (Elsevier, 2021).
Chen, L., Dong, X., Wang, Y. & Xia, Y. Separating hydrogen and oxygen evolution in alkaline water electrolysis using nickel hydroxide. Nat. Commun. 7, 11741 (2016).
Landman, A. et al. Photoelectrochemical water splitting in separate oxygen and hydrogen cells. Nat. Mater. 16, 646-651 (2017).
Dotan, H. et al. Decoupled hydrogen and oxygen evolution by a two-step electrochemical-chemical cycle for efficient overall water splitting. Nat. Energy 4, 786-795 (2019).
Wang, J. et al. Decoupling half-reactions of electrolytic water splitting by integrating a polyaniline electrode. J. Mater. Chem. A 7, 13149-13153 (2019).
Symes, M. D. & Cronin, L. Decoupling hydrogen and oxygen evolution during electrolytic water splitting using an electron-coupled-proton buffer. Nat. Chem. 5, 403-409 (2013).
Rausch, B., Symes, M. D. & Cronin, L. A bio-inspired, small molecule electron-coupled-proton buffer for decoupling the half-reactions of electrolytic water splitting. J. Am. Chem. Soc. 135, 13656-13659 (2013).
Kirkaldy, N., Chisholm, G., Chen, J. J. & Cronin, L. A practical, organic-mediated, hybrid electrolyser that decouples hydrogen production at high current densities. Chem. Sci. 9, 1621-1626 (2018).
Chisholm, G., Cronin, L. & Symes, M. D. Decoupled electrolysis using a silicotungstic acid electron-coupled-proton buffer in a proton exchange membrane cell. Electrochim. Acta 331, 135255 (2020).
Li, W. et al. Electrolyzer design for flexible decoupled water splitting and organic upgrading with electron reservoirs. Chem 4, 637-649 (2018).
Amstutz, V. et al. Renewable hydrogen generation from a dual-circuit redox flow battery. Energy Environ. Sci. 7, 2350-2358 (2014).
Zhang, F. et al. Decoupled redox catalytic hydrogen production with a robust electrolyte-borne electron and proton carrier. J. Am. Chem. Soc. 143, 223-231 (2021).
Rausch, B., Symes, M. D., Chisholm, G. & Cronin, L. Decoupled catalytic hydrogen evolution from a molecular metal oxide redox mediator in water splitting. Science 345, 1326-1330 (2014).
Bazant, M. Z. Theory of chemical kinetics and charge transfer based on nonequilibrium thermodynamics. Acc. Chem. Res. 46, 1144-1160 (2013).
Suen, N. T. et al. Electrocatalysis for the oxygen evolution reaction: recent development and future perspectives. Chem. Soc. Rev. 46, 337-365 (2017).
Bratsch, S. G. Standard electrode potentials and temperature coefficients in water at 298.15 K. J. Phys. Chem. Ref. Data 18, 1-21 (1989).
Hayes, W. M. (ed.) CRC Handbook of Chemistry and Physics 97th edn (CRC Press, 2016).
Amoore, J. E. & Hautala, E. Odor as an aid to chemical safety: odor thresholds compared with threshold limit values and volatilities for 214 industrial chemicals in air and water dilution. J. Appl. Toxicol. 3, 272-290 (1983).
Viswanathan, K. & Tilak, B. V. Chemical, electrochemical, and technological aspects of sodium chlorate manufacture. J. Electrochem. Soc. 131, 1551-1559 (1984).
Osuga, T. & Sugino, K. Electrolytic production of bromates. J. Electrochem. Soc. 104, 448 (1957).
Cettou, P., Robertson, P. M. & Ibl, N. On the electrolysis of aqueous bromide solutions to bromate. Electrochim. Acta 29, 875-885 (1984).
Pavlović, O. Ž., Krstajić, N. V. & Spasojević, M. D. Formation of bromates at a titanium anode. Surf. Coat. Technol. 34, 177-183 (1988).
Vasudevan, S. Studies relating to electrolytic preparation of potassium bromate. Ind. Eng. Chem. Res. 47, 1743-1746 (2008).
Gomes, A. S. O., Busch, M., Wildlock, M., Simic, N. & Ahlberg, E. Understanding selectivity in the chlorate process: a step towards efficient hydrogen production. ChemistrySelect 3, 6683-6690 (2018).
Endrődi, B., Sandin, S., Wildlock, M., Simic, N. & Cornell, A. Suppressed oxygen evolution during chlorate formation from hypochlorite in the presence of chromium(VI). J. Chem. Technol. Biotechnol. 94, 1520-1527 (2019).
Endrődi, B., Simic, N., Wildlock, M. & Cornell, A. A review of chromium(VI) use in chlorate electrolysis: functions, challenges and suggested alternatives. Electrochim. Acta 234, 108-122 (2017).
Endrődi, B. et al. Towards sustainable chlorate production: the effect of permanganate addition on current efficiency. J. Clean. Prod. 182, 529-537 (2018).
Amit, L., Naar, D., Gloukhovski, R., la O’, G. J. & Suss, M. E. A single-flow battery with multiphase flow. ChemSusChem 14, 1068-1073 (2021).
Jackson, M. N., Jung, O., Lamotte, H. C. & Surendranath, Y. Donordependent promotion of interfacial proton-coupled electron transfer in aqueous electrocatalysis. ACS Catal. 9, 3737-3743 (2019).
Strmcnik, D. et al. Improving the hydrogen oxidation reaction rate by promotion of hydroxyl adsorption. Nat. Chem. 5, 300-306 (2013).
Mills, A. & Meadows, G. Heterogeneous redox catalysis: a novel route for removing bromate ions from water. Water Res. 29, 2181-2185 (1995).
Duonghong, D., Erbs, W., Shuben, L. & Grätzel, M. Efficient redox catalysis by in the generation of oxygen and bromine from aqueous bromate solutions. Chem. Phys. Lett. 95, 266-268 (1983).
Dong, Z., Dong, W., Sun, F., Zhu, R. & Ouyang, F. Effects of preparation conditions on catalytic activity of Ru/AC catalyst to reduce bromate ion in water. React. Kinet. Mech. Catal. 107, 231-244 (2012).
Thakur, D. B. et al. Ruthenium catalyst on carbon nanofiber support layers for use in silicon-based structured microreactors. Part II: catalytic reduction of bromate contaminants in aqueous phase. Appl. Catal. B Environ. 102, 243-250 (2011).
Fan, C. et al. Enhanced performance and mechanism of bromate removal in aqueous solution by ruthenium oxide modified biochar ( /BC). Colloids Surf. A Physicochem. Eng. Asp. 572, 27-36 (2019).
Adams, R., Voorhees, V. & Shriner, R. L. Platinum catalyst for reductions: platinic oxide. Org. Synth. 8, 92 (1928).
Publisher’s note Springer Nature remains neutral with regard to jurisdictional claims in published maps and institutional affiliations.
تم استخدام الماء المقطر مرتين (DDW؛ Direct-Q3 UV، Merck) لتحضير المحاليل المائية. تم استخدام محلول بيرانا، الذي يتكون من خليط 2:5 من بيروكسيد الهيدروجين المركز (، درجة تحليل، Merck) وحمض الكبريتيك (؛ 95-98%، درجة كاشف تحليلي (AR)، مختبر بايو)، تم استخدامه لتنظيف الخلايا الكهروكيميائية، والأدوات الزجاجية، وأقطاب البلاتين قبل الاستخدام. تم استخدام الأسيتون (AR، مختبر بايو) والإيثانول (نقي، AR، مجموعة غادوت) لتنظيف الأنود قبل الاستخدام. تم تحضير الإلكتروليتات باستخدام بروميد الصوديوم (، ألفا أيسر). تم تعديل قيم الرقم الهيدروجيني باستخدام محلولات هيدروكسيد الصوديوم (NaOH؛ حبيبات، AR، بيو-لاب). تم إعداد محاليل العازلة باستخدام حمض البوريك (فوسفات ثنائي البوتاسيوم (درجة ACS، أكروس); درجة ACS، شركة سبيكتروم كيميكل) وفوسفات البوتاسيوم أحادي (؛ درجة تحليلية، ميرك). ثنائي كرومات الصوديوم ثنائي الهيدرات (; تم استخدام مادة (ACS grade, Merck) كإضافة في الإلكتروليت. تم استخدام غاز الأرغون (99.999%، ماكسيما) لتفريغ الإلكتروليت في قياسات الاستقطاب. هيدرات ثلاثي كلوريد الروثينيوم“أكروس أورغانيكس” ونترات الصوديومتم استخدام (الدرجة، أكروس) لتخليق مسحوق ثنائي أكسيد الروثينيوم (محفز آدامز). تم استخدام يوديد البوتاسيوم (KI؛ كاشف ACS، شركة سبيكتروم كيميكل) ومحلول قياسي 0.1 N من ثيوسلفات الصوديوم (ألفا أيسار) لعملية المعايرة اليودومترية لمحلولات البرومات. برومات الصوديوم (تم استخدام (99.5% أساس معدني، ألفا أيسر) لتحضير المحاليل لقياسات إزاحة الماء.
الأقطاب الكهربائية
رقائق البلاتين (رقائق بسماكة 0.05 مم؛ المساحة الهندسية،عامل خشونة السطح،; 99.95%; هولندا موران) وملف Pt (قطر السلك، 1 مم؛ قطر الملف والطول، 4 و15 مم، على التوالي؛ ALSCo.) تم استخدامها كأقطاب سالبة في قياسات التحليل الكهربائي للبروميد المعروضة في الشكل 2ب، ج، على التوالي. تم استخدام نفس ورقة Pt ( ) تم استخدامه كـ WE في قياسات الاستقطاب الكاثودي HER المعروضة في الشكل 3b. قطعة أصغر ( ) من هذا الرقاقة البلاتينية تم استخدامها لقياسات كثافة التيار العالي الموضحة في الشكل 3a، للامتثال للحد الأقصى للتيار ( 800 مللي أمبير ) لجهاز البوتنشيومتر (BioLogic SP-150). تم تنظيف أقطاب البلاتين عن طريق الغمر في محلول بيرانا ثم شطفها جيدًا بالماء المقطر قبل القياسات. تجاري Ti DSAs (سمك ركيزة التيتانيوم، 1 مم؛ سمك طبقة الأكاسيد المختلطة، (الشكل التوضيحي التكميلي 2)؛ تم استخدام DSA10K، De Nora كأنودات، مع الحفاظ على المساحة الهندسية قريبة من تلك الخاصة بالكاثود المقابل. تم تنظيف DSAs مسبقًا في خليط من DDW/إيثانول/أسيتون لمدة 10 دقائق في حمام بالموجات فوق الصوتية (منظف بالموجات فوق الصوتية MRC، 31، 120 واط) ثم تم شطفها جيدًا في DDW. تم استخدام ARHE (HydroFlex، Gaskatel) كمرجع في قياسات الثلاثة أقطاب. تم غمره في الإلكتروليت المعني لمدة ساعة قبل بدء القياسات.
تحضير محفز آدامز
التم تحضير محفز آدامز المستخدم في عملية تقليل البرومات (الشكل 4) وفقًا لعملية آدامز المعدلة.عن طريق طحن 2 جرام من و 10 جرام من مساحيق باستخدام الهاون والمدقة. تم تسخين الخليط الناتج لمدة 5 دقائق في فرن صندوقي (فرن غرفة مختبر ELF، الحد الأقصى“كاربوليت” فيتم وضع الفرن في خزانة تهوية لإزالة المنتجات الثانوية السامة للتفاعل بأمان مثل أكسيد النيتروجين. ) الغازات. الناتجة تم تبريد محفز آدامز إلى درجة حرارة الغرفة وغسله بالماء المقطر. تم تكرار عملية الغسل ثلاث مرات باستخدام الطرد المركزي (جهاز الطرد المركزي SCEN-206، MRC) وإزالة المواد المتفاعلة غير المتفاعلة في الماء المقطر. ثم تم تجفيف مسحوق المحفز المستعاد في الهواء لعدة أيام.
قياسات الكفاءة فاراداي
تم تقييم الكفاءة الفارادائية لأكسدة البروميد إلى برومات (التفاعل 6) لطريقتي التشغيل تحت الظروف التجريبية الموضحة في الجدول 1، باستخدامتم استخدام Ti DSA (الأنود) وورقة أو ملف Pt ككاثود في نفس الحجرة (الشكل 2ب، د، على التوالي). تم تحديد كمية الأنيونات الناتجة من البرومات في نهاية كل اختبار كهربائي من خلال المعايرة اليودومترية ومقارنتها بالشحنة الكهربائية، ( الحالي؛وقت التحليل الكهربائي)، الذي مر بين الأقطاب خلال الاختبار المعني. في وضع التشغيل الأول (الشكل 2أ)، تم استخدام خلية كيميائية كهربائية مزدوجة الجدار (د. بوب، غامري) ، والمحلول الكهربائي، 1.5 م NaBr بدون إضافات (رقم التجربة 1 و 3 في الجدول 1) أو مع (التجربة رقم 2 في الجدول 1)، تم تسخينه إلى وتم التحريك بسرعة 400 دورة في الدقيقة باستخدام محرك مغناطيسي مغطى بتفلون. في وضع التشغيل الثاني (الشكل 2d والتجارب رقم 4 و 5 في الجدول 1)، تم استخدام خلية أسطوانية (أسطوانة بايركس متدرجة، 20 مل، دوران)، وتم الاحتفاظ بالكهارل (1.5 م NaBr، بدون إضافات) في درجة حرارة الغرفة. كان الرقم الهيدروجيني الابتدائي للكهارل 1.5 م NaBr بدون إضافات 5.8، بينما كان الرقم الهيدروجيني مع المضاف كان 7.5.
الاستقرار على المدى الطويل
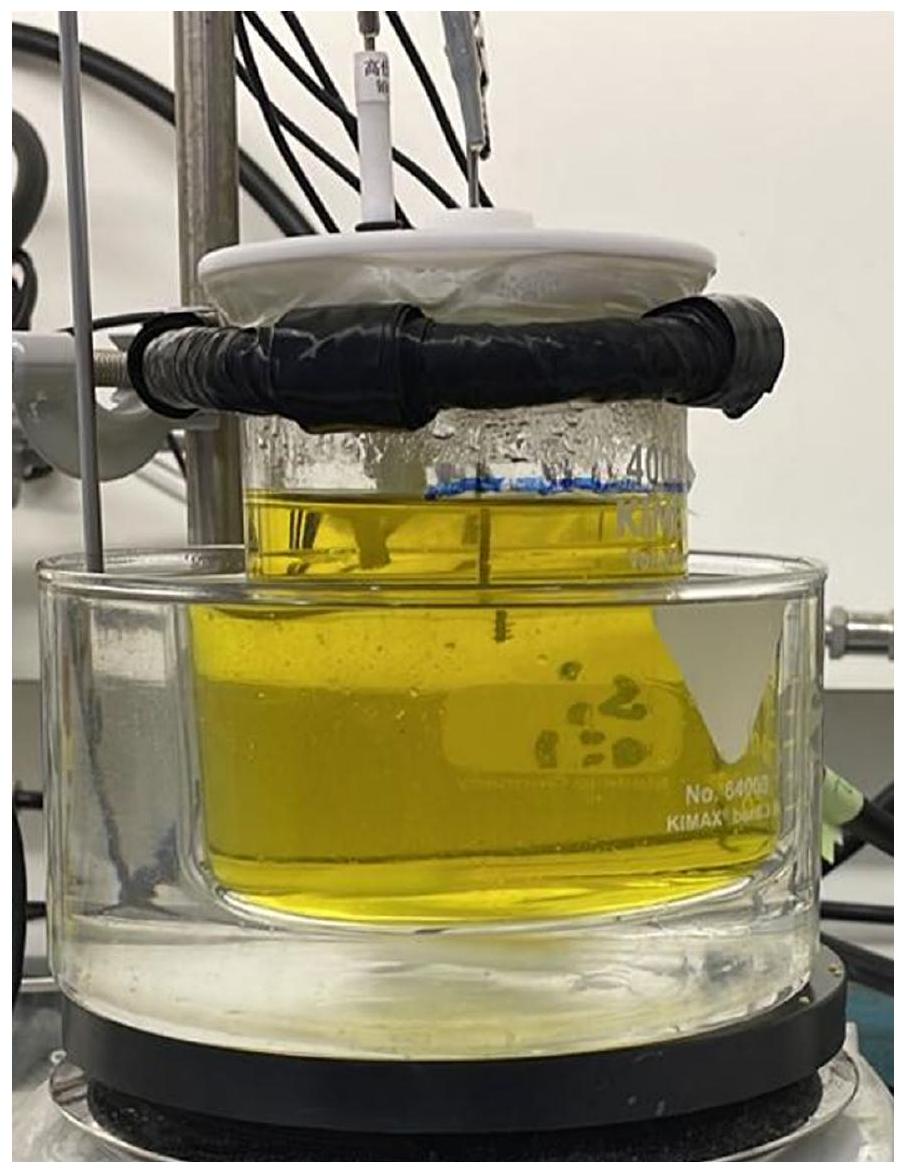
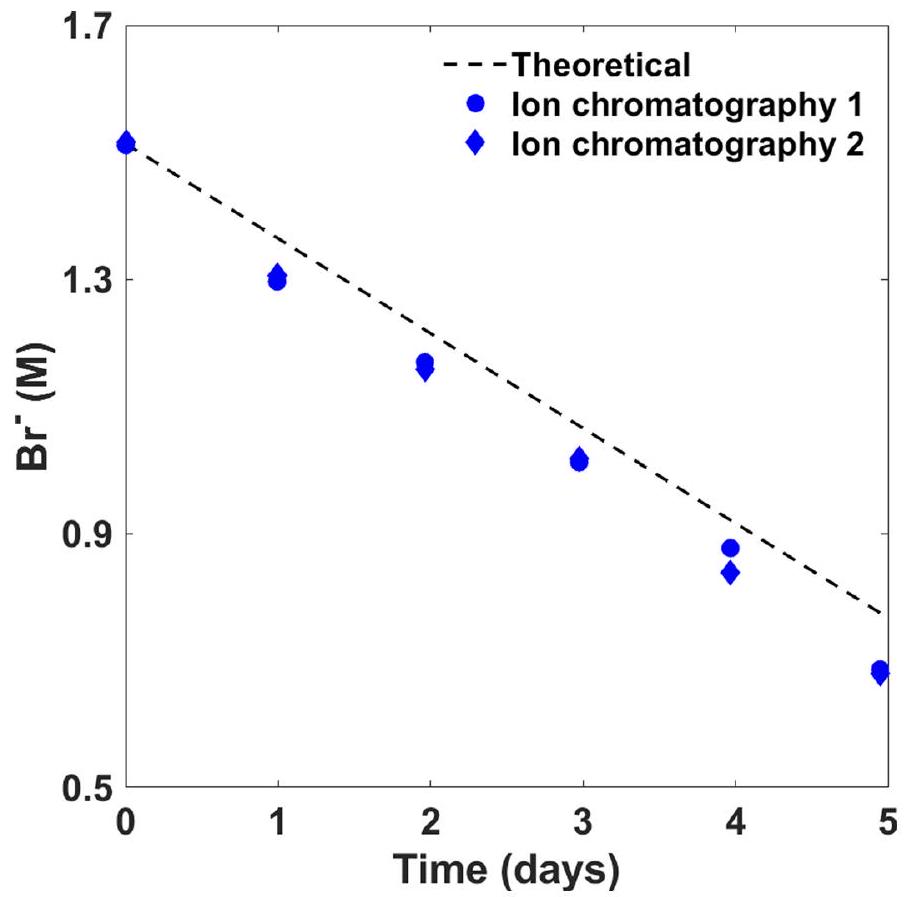
تم إجراء قياسات كفاءة فارادايك على مدار خمسة أيام متتالية مع 119 ساعة من التحليل الكهربائي المستمر عند تيار 300 مللي أمبير (كثافة تيار) ). تم ملء خلية أسطوانية كبيرة (500 مل) مع كاثود من رقائق البلاتين وDSA (أنود) بـ 300 مل من الإلكتروليت (التركيز الأولي، محلول بورات; صورة في الشكل البياني الممتد 1). تم تسخين الخلية إلى وتم التحريك بسرعة 400 دورة في الدقيقة. لتقليل التبخر، تم إغلاق الغطاء على الخلية بفيلم مختبري من بارافيلم. تم قياس تركيزات البروميد والبرومات عن طريق أخذ عينات من الإلكتروليت تقريبًا كل 24 ساعة خلال الاختبار، وتحليل تركيبة العينة بواسطة المعايرة اليودومترية وكروماتوغرافيا الأيونات. تم تقديم النتائج في الأشكال البيانية الموسعة 2 و 3، على التوالي. تم قياس الرقم الهيدروجيني كل يوم، وكانت النتائج في نطاق 8.0 إلى 8.6.
الت titration الأيودومتري
الت titration اليوديمتريةتم استخدامه لتحديد تركيز أيونات البرومات) في المحلول الكهربائي بعد اختبارات التحليل الكهربائي للبروميد. تم تقليل أيونات البرومات إلى أيونات بروميد ( ) في وجود كمية مفرطة من أيونات اليوديد في وسط حمضي: اليودتمت معايرة الجزيئات التي تطورت بواسطة محلول الثيوكبريتات القياسي:لهذا الغرض، تم إضافة محلول من 3.8 جرام من KI في 40 مل من الماء المقطر إلى عينة من (حجم العينة، ) الذي تم جمعه من الخلية الكهروكيميائية (حجم الخلية، ) في نهاية تجربة التحليل الكهربائي، تليها إضافة 0.6 مل من حمض الكبريتيك المركز، بعد التخفيف بالماء المقطر إلى حجم 50 مل، تم تيتراة المحلول الداكن الأرجواني الناتج (الشكل التوضيحي 5، اليسار) تدريجياً عن طريق إضافة محلول قياسي 0.1 N من ثيوسلفات الصوديوم، (تركيز أيون الثيوكبريتات، حتى الوصول إلى محلول شفاف (الفيديو التكميلي 3 والشكل التكميلي 5، اليمين). حجم محلول الثيوكبريتات الذي تم إضافته إلى هذه النقطة،، تم استخدامه لحساب كمية أيونات البرومات التي تم توليدها بواسطة التحليل الكهربائي:.
كروماتوغرافيا الأيونات
تم استخدام كروماتوغرافيا الأيونات لقياس تركيز أيونات البروميد والبرومات في المحاليل المأخوذة خلال قياس الاستقرار على المدى الطويل (البيانات الموسعة الأشكال 2 و 3، على التوالي) باستخدام جهاز كروماتوغرافيا Metrohm 881 Compact IC pro المزود بعمود تحليلي Shodex IC-SI-52 4E. اثنانتم جمع عينات مكررة تقريبًا كل 24 ساعة من بداية الاختبار وتم تخفيفها بالماء المقطر لإعداد عينات بحجم 4 مل تم تحليلها بواسطة كروماتوغرافيا الأيونات باستخدام معايير البرومات والبروميد من شركة سيغما-ألدريتش.
الكفاءة الكهروكيميائية
تم تقييم الكفاءة الكهروكيميائية لاختبارات التحليل الكهربائي للبروميد من نتائج التيار-الجهد في حالة الاستقرار المعروضة في الشكل 3a. لهذا الغرض، تم إجراء قياسات جلفانية عند تيارات مختلفة في تكوين خلية ذات قطبين (الشكل 2a) باستخدام جهاز قياس الجهد BioLogic SP-150 مع كاثود من رقائق البلاتين وأنود DSA10K. كان المحلول الكهربائي 1.5 م من NaBr مع إضافة ثنائي كرومات الصوديوم (3.8 مللي مول)، بدون عازل أو مع عازل بورات بتركيز 0.7 م (الرموز السوداء والزرقاء في الشكل 3a، على التوالي). تم تسخين المحلول الكهربائي إلىفي خلية كيميائية كهربائية مزدوجة الجدار (د. بوب، غامري) وتم التحريك بسرعة 400 دورة في الدقيقة. تم تلخيص ظروف التجربة في الجدول 2. قيم كثافة التيار تتراوح من 5 إلىتم تطبيقها بترتيب تصاعدي، مع الاحتفاظ بها لمدة 5 دقائق في كل مرة، مع مراقبة الجهد المطبق. تم حساب متوسط قيم الجهد للحصول على القيمة المتوسطة والانحراف المعياري عند كل كثافة تيار وتصحيحها لانخفاض المقاومة (IR). المقاومةتم قياسه بواسطة مطيافية الامتياز الكهروكيميائي باستخدام جهاز قياس الجهد BioLogic SP-150 وتم تحديده كنقطة التقاطع عند التردد العالي مع المحور الحقيقي في مخطط نايكويست. تم إجراء قياسات مطيافية الامتياز الكهروكيميائي في وضع الجلفانستاتيكي عند نفس التيارات مثل قياسات التيار-الجهد، مع سعة تذبذب تبلغ 5% من التيار المتوسط وتردد تذبذب يتراوح من 200 كيلوهرتز إلى 100 مللي هرتز.-قيم الجهد المتوسطة المصححة،، تم استخدامها لحساب الكفاءة الكهروكيميائية بناءً على القيمة الحرارية العليا (HHV) للهيدروجين: (بوحدات النسبة المئوية للقدرة الحرارية العليا).
قياسات الاستقطاب الكاثودي
تم قياس منحنيات الاستقطاب الكاثودي المعروضة في الشكل 3b بواسطة LSV في خلية كهروكيميائية مزودة بثلاثة أقطاب ومبردة بالماء (Dr.Bob، Gamry) باستخدام رقائق البلاتين. ) كـ WE وجهاز potentiostat (BioLogic SP-150) بمعدل مسح تم استخدام سلك من البلاتين (قطر 1 مم؛ غامري) موضوع في حجرة زجاجية مفروزة منفصلة كقطب كهربائي موازن، حيث حدثت أكسدة البروميد. تم استخدام ARHE كقطب مرجعي. تم وضع القطب المرجعي وقطب العمل في نفس الحجرة. المقاومة السلسليةتم قياسه بطريقة انقطاع التيار قبل كل قياس. تم إجراء القياسات في محاليل 1.5 م من NaBr المملوءة بالآر والتي تحتوي على إضافات مختلفة فيتم تعديل قلوية المحلول الكهربائي إلى pH 8 باستخدام محلول NaOH بتركيز 5 م، وتم قياسه بواسطة جهاز قياس pH من سلسلة Oakton 500. تم تلخيص ظروف التجربة في الجدول 2. في التجارب القصيرة التي تتوافق مع عدة منحنيات استقطاب، وُجد أن إضافة ثنائي كرومات الصوديوم إلى المحلول الكهربائي لها تأثير ضئيل على منحنيات الاستقطاب؛ لذلك لم يتم استخدامه في قياسات الاستقطاب الكاثودي. لم يتم تطبيق أي تحريك في هذه القياسات لتقليل التداخل الناتج عن التفاعلات العكسية لمنتجات أكسدة البروميد عند القطب الكهربائي.
قياسات الاستقطاب الأنودي
تم قياس منحنيات الاستقطاب الأنودي المعروضة في الشكل 3c بطريقة مشابهة لقياسات الاستقطاب الكاثودي، مع الاستثناءات التالية: أولاً، أنود DSA10K ( ) تم استخدامه كـ WE؛ وثانيًا، تم وضع WE و CE (ملف Pt) في نفس الحجرة، بحيث تكون أيونات الهيدروكسيد ( ) التي تشكلت في CE لن تكون مقيدة من التفاعل مع تكونت عند القطب الكهربائي في المحلول الكثيف. تم تلخيص الظروف التجريبية في الجدول 2.
تحلل برومات التحفيزي
تقنية إزاحة الماءتم استخدامه لمراقبة حركيات التحلل التحفيزي للبروما (التفاعل 12) بواسطةمحفز آدامز (الشكل 4). تعتمد الطريقة على قياس كمية الماء التي تم إزاحتها بواسطة الأكسجين المنطلق في التفاعل. يتكون الإعداد التجريبي، المقدم في الشكل التكميلية 4، من مفاعل زجاجي محكم الغاز موضوع في حمام مائي فوق لوحة مسخنة وعمود ماء. يتم توصيل مخرج المفاعل بمدخل عمود الماء، بينما يتم توجيه مخرج العمود إلى دورق موضوع على ميزان رقمي (BB-1550، MRC) يقوم بمراقبة الوزن. تغير كدالة للزمن خلال تفاعل التحلل. قبل بدء التجربة، يتم إغلاق الأنبوب السيليكوني الذي يربط المفاعل بعمود الماء بواسطة مشبك معدني. لبدء القياس، يتم استخدام حجم معروف ( ) من محلول بتركيز معروف من أيونات البرومات ) يُضاف إلى المفاعل، الذي يحتوي على كتلة مقاسة من محفز آدامز. ثم يتم إغلاق المفاعل، ويتم فتح مشبك الضغط. يتدفق غاز الأكسجين الذي يتكون في المفاعل إلى عمود الماء عبر الأنبوب ويزيح الماء من العمود إلى الكأس، وكتلة الماء المزاح (يتم قياسه باستمرار (الفيديو التكميلي 5). الكتلة المقاسة (بالكيلوغرام) تساوي تقريبًا حجم الأكسجين (باللترات) لأن كثافة الماء هي عند درجة الحرارة والضغط القياسيين. حجم الأكسجين، يتم تحويله إلى عدد مولات الأكسجين،، بواسطة قانون الغاز المثالي (; ضغط الغاز؛حجم الغاز؛مولات الغاز؛ثابت الغاز المثالي؛نسبة 2:3 بين أيونات البرومات المحولة إلى بروميد والناجمة عنالجزيئات (التفاعل 12)، نسبة التحويل هي، المعروض في الشكل 4 كدالة لزمن التفاعل ( ). المنحدر يولد معدل تفاعل يمكن تحويله إلى تيار كهربائي مكافئ (المعروض في الشكل 4c، المنحنى الأزرق)، حيث هو ثابت فاراداي و 4 هو عدد الإلكترونات اللازمة لتوليد الجزيء. تم التحقق من قيم التحويل بشكل مستقل من خلال المعايرات اليودومترية في نهاية التجربة، مما يؤكد التحلل الكامل للبرومات إلى بروميد مع عائد أكسجين قريب من 100% في نهاية التجارب. تم تطبيق تقنية إزاحة الماء لسلسلة من التجارب مع نسب مختلفة من حجم المحفز إلى حجم المحلول ومع إضافات إلكتروليت مختلفة بما في ذلك الديكرومات، ومخزن الفوسفات، ومخزن البورات، كما هو ملخص في الجدول 3.
توفر البيانات
يعلن المؤلفون أن البيانات التي تدعم نتائج هذه الدراسة متاحة ضمن الورقة وملفات المعلومات التكميلية الخاصة بها.
References
Vogel, A., Jeffery, G. H., Bassett, J., Mendham, J. & Denney, R. C. Vogel’s Textbook of Quantitative Chemical Analysis 5th edn, 406 (Longman Scientific & Technical, 1989).
Asakai, T. & Hioki, A. Potassium bromate assay by primary methods through iodine liberation reaction. Anal. Methods 5, 6240-6245 (2013).
Walker, M., Zhang, Y., Heaven, S. & Banks, C. Potential errors in the quantitative evaluation of biogas production in anaerobic digestion processes. Bioresour. Technol. 100, 6339-6346 (2009).
El Asri, O., Mahaouch, M. & Afilal, M. E. The evaluation and the development of three devices for measurement of biogas production. Phys. Chem. News 75, 75-85 (2015).
Brack, P., Dann, S., Upul Wijayantha, K. G., Adcock, P. & Foster, S. A simple, low-cost, and robust system to measure the volume of hydrogen evolved by chemical reactions with aqueous solutions. J. Vis. Exp. 2016, e54383 (2016).
شكر وتقدير
تم دعم هذا البحث من قبل وزارة الابتكار والعلوم والتكنولوجيا في إسرائيل (رقم المنحة 1001577992) ومن قبل جائزة ككل-جي إن إف لحلول المناخ. يقر أ.ر. بدعم المعهد الوطني الإسرائيلي لتخزين الطاقة (INIES) وبرنامج نانسي وستيفن غراند للطاقة في معهد التخنيون ورئاسة ل. شيرلي تارك في العلوم.
مساهمات المؤلفين
قام A.R. بتصور الفكرة وبدأ وأشرف على البحث. حدد I.S. زوج البروميد/البرومات كمرشح رئيسي لـ SRC، وحدد نهج طلاء الكاثود لتفكيك الماء بدون غشاء. اختار I.S. المواد النشطة، واصطناع الـ
قام آدامز بتحفيز القياسات وكما قام بإجراء قياسات الكفاءة الفارادية وقياسات تطور الأكسجين التحفيزي. قام إ.د. بإجراء توصيفات المواد الخاصة بالتحفيز والأقطاب. قام إ.د. و إ.س. بتصميم وإجراء اختبارات التحليل الكهربائي القصيرة الأجل. قام إ.د. و م.س. و أ.ب. بتصميم وإجراء اختبارات الاستقرار على المدى الطويل وقياسات الكفاءة الفارادية. قام أ.ب. بتصميم وإجراء اختبارات الكروماتوغرافيا الأيونية. قام إ.س. بتحليل البيانات لقياسات تطور الأكسجين التحفيزي. قام إ.س. و إ.د. بتحليل بيانات اختبارات التحليل الكهربائي القصيرة الأجل، و قام إ.د. و م.س. و أ.ب. بتحليل بيانات اختبارات الاستقرار على المدى الطويل. كتب إ.س. و إ.د. المسودة الأولى من المخطوطة. ساهم جميع المؤلفين في المناقشة العلمية وتحرير المقال.
المصالح المتنافسة
أ.ر. هو أحد المؤسسين المشاركين لـبرو، شركة ناشئة تطور تكنولوجيا جديدة لإنتاج الهيدروجين الأخضر.
الشكل البياني الممتد 1 | استقرار التحليل الكهربائي على المدى الطويل. صورة لإعداد القياس.
الشكل البياني الممتد 2 | استقرار التحليل الكهربائي على المدى الطويل. نتائج تظهر البروميد (تركيز خلال خمسة أيام من التحليل الكهربائي المستمر لـ 300 مل من محلول مائي بتركيز 1.5 م مولار من NaBr (التركيب الأولي) مع 0.3 م مولار من البورات
ذاكرة مؤقتة وعند تيار قدره 300 مللي أمبير، درجة الحرارة، ومعدل التحريك 400 دورة في الدقيقة. تمثل نقاط البيانات قياسات كروماتوغرافيا الأيونات لعينتين مكررتين.
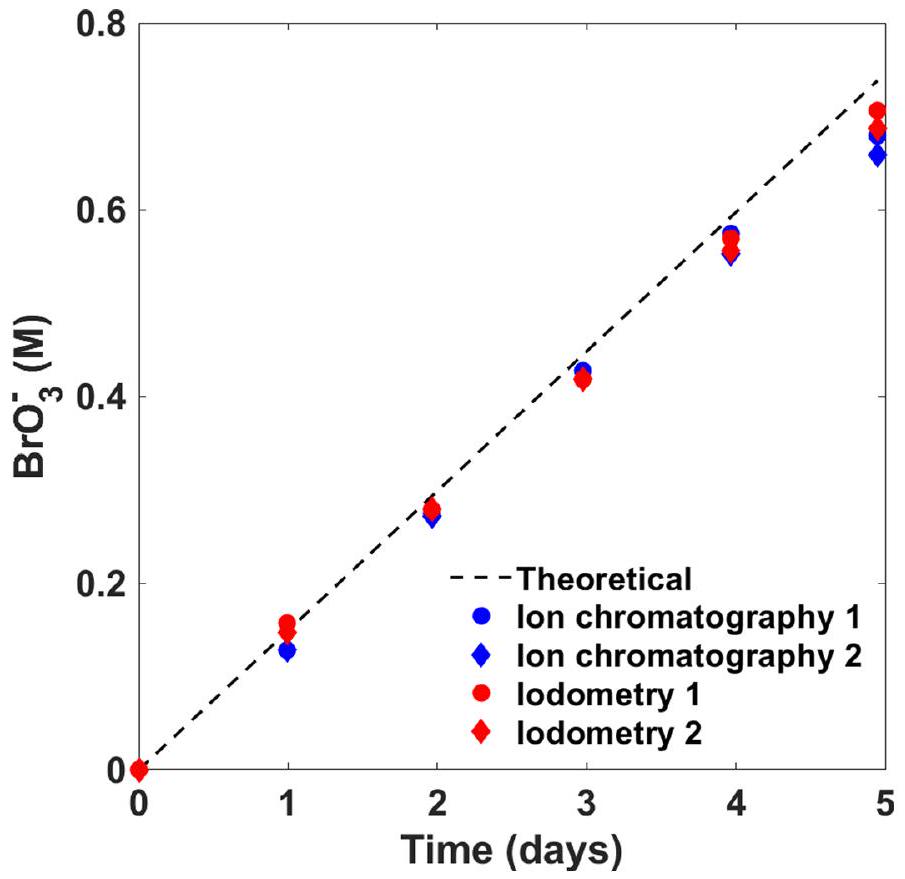
الشكل 3 من البيانات الموسعة | استقرار التحليل الكهربائي على المدى الطويل. نتائج تظهر البرومات () التركيز خلال خمسة أيام من التحليل الكهربائي المستمر لمحلول مائي حجمه 300 مل من 1.5 م NaBr (التركيب الأولي) مع 0.3 م بورات
المخزن و , عند تيار قدره 300 مللي أمبير، ودرجة حرارة , ومعدل تحريك قدره 400 دورة في الدقيقة. النقاط البيانية تمثل كروماتوغرافيا الأيونات (باللون الأزرق) والمعايرة اليودومترية (باللون الأحمر) لعينتين مكررتين.
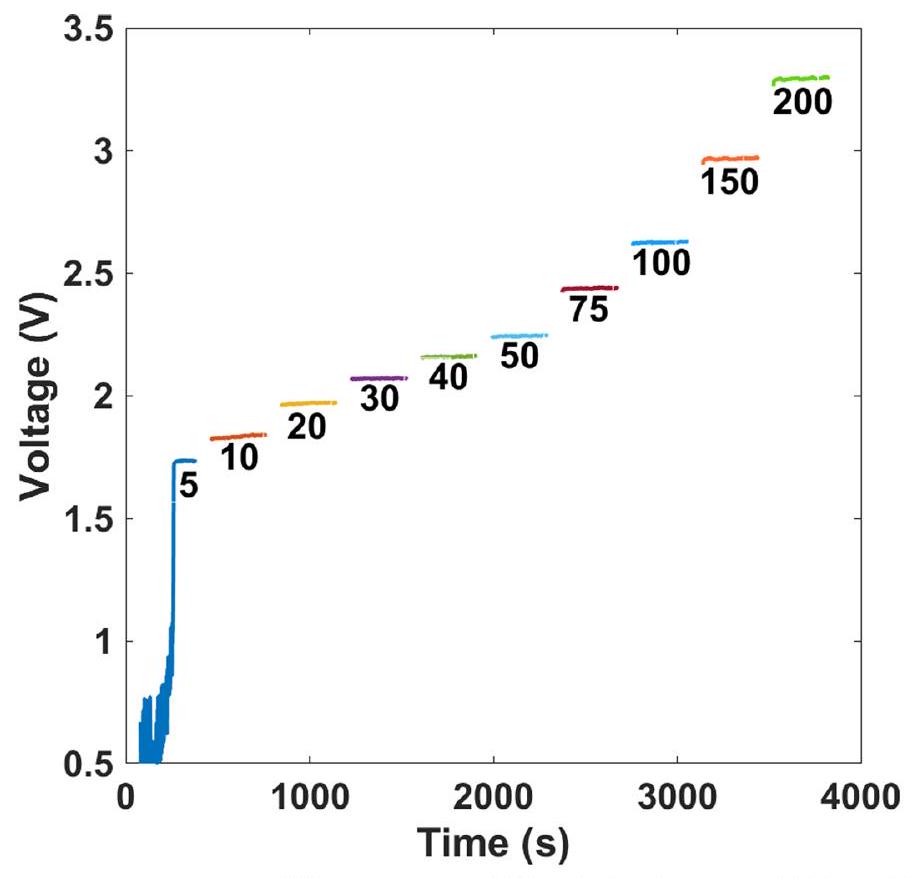
البيانات الموسعة الشكل 4 | قياسات الكرونو بوتنشيومترية عند كثافات تيار مختلفة في إلكتروليت NaBr بدون مخزن. تركيب الإلكتروليت: 1.5 م NaBr مع . تم تسخين الإلكتروليت إلى
وتم تحريكه بمعدل 400 دورة في الدقيقة. يتم الإشارة إلى كثافات التيار بواسطة التسميات في الأشكال (بوحدات من ). يتم تقديم الجهد بدون تصحيح.
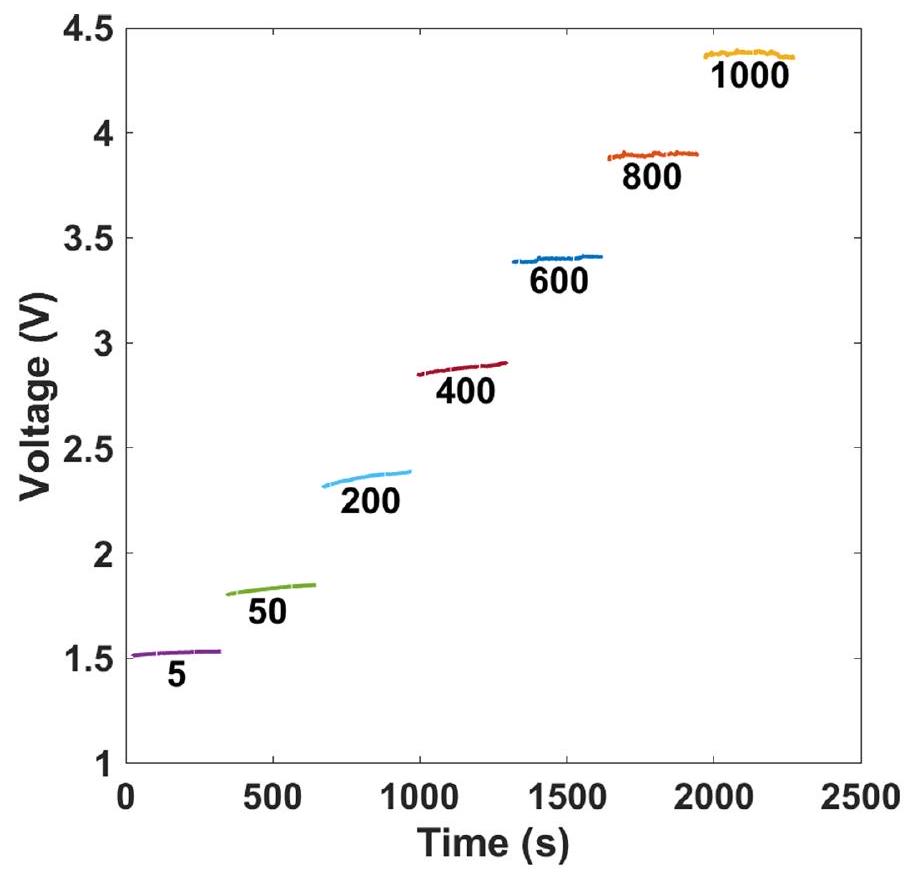
البيانات الموسعة الشكل 5| قياسات الكرونو بوتنشيومترية عند كثافات تيار مختلفة في إلكتروليت NaBr مع مخزن بورات. تركيب الإلكتروليت: مخزن بورات، . الإلكتروليت
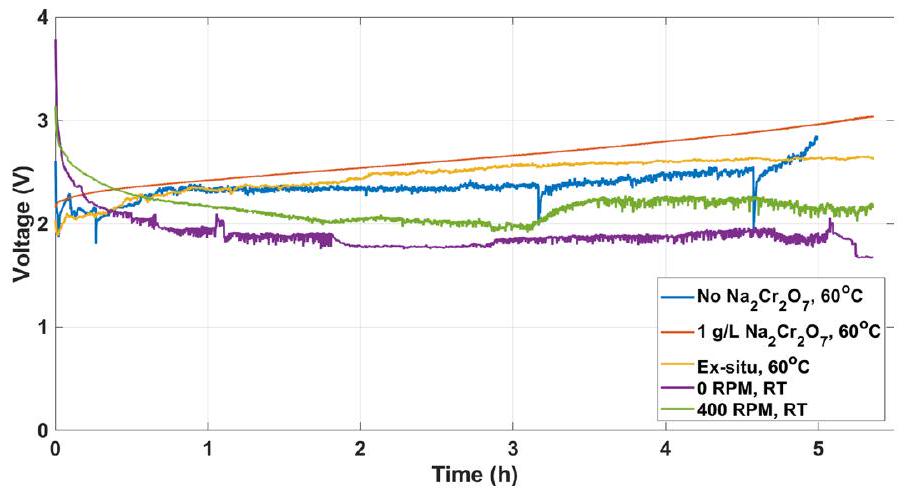
البيانات الموسعة الشكل 6 | استقرار التحليل الكهربائي للبروميد. الجهد (مصحح IR) كدالة للوقت خلال قياسات غالوانوستاتيكية مطولة عند تيار قدره 600 مللي أمبير في إلكتروليت 1.5 م NaBr مع (المنحنى الأحمر) أو بدون (جميع المنحنيات الأخرى) تم قياسها عند (المنحنيات الزرقاء والحمراء والبرتقالية) أو عند درجة حرارة الغرفة (المنحنيات الأرجوانية والخضراء) مع (جميع المنحنيات باستثناء المنحنى الأرجواني) أو بدون تحريك (المنحنى الأرجواني). تم استخدام ورق أو لفائف Pt نقية (عند أو درجة حرارة الغرفة
RT ، على التوالي) ككاثود و أنود DSA في القياسات، باستثناء القياس المقدم بواسطة المنحنى البرتقالي حيث تم استخدام كاثود ورق Pt مسبق الطلاء من اختبارات التحليل الكهربائي السابقة. انحراف الجهد في المنحنى الأحمر ناتج عن تغييرات في تركيب الإلكتروليت بسبب تحويل البروميد إلى برومات خلال القياس.
البيانات الموسعة الشكل XRD من محفز آدامز. مخطط حيود الأشعة السينية على محفز آدامز، مع الإشارة إلى ملف JCPDS من المرحلة الروتيلية.
البيانات الموسعة الشكل 8| صورة مجهر إلكتروني مسح ضوئي لـ محفز آدامز.
البيانات الموسعة الشكل 9 | صورة مجهر إلكتروني نقل لـ محفز آدامز.
البيانات الموسعة الشكل 10 | التحويل الحفزي لمحلول 1 م برومات تم الحصول عليه من التحليل الكهربائي للبروميد. المنحنى الأسود الصلب يمثل الحجم المتولد من الأكسجين بسبب تحلل البرومات، والمنحنى الأزرق المتقطع يمثل معدل تطور الأكسجين.
قسم علوم المواد والهندسة، معهد التخنيون – معهد التكنولوجيا الإسرائيلي، حيفا، إسرائيل. برنامج الطاقة نانسي وستيفن غراند (GTEP)، معهد التخنيون – معهد التكنولوجيا الإسرائيلي، حيفا، إسرائيل. مركز ستيوارت وليندا ريسنيك للاستدامة في التحفيز (RSCC)، معهد التخنيون – معهد التكنولوجيا الإسرائيلي، حيفا، إسرائيل. هؤلاء المؤلفون ساهموا بالتساوي: إيليا سلوبودكين، إيلينا دافيدوفا. البريد الإلكتروني: avnerrot@technion.ac.il
Green hydrogen produced by water splitting using renewable electricity is essential to achieve net-zero carbon emissions. Present water electrolysis technologies are uncompetitive with low-cost grey hydrogen produced from fossil fuels, limiting their scale-up potential. Disruptive processes that decouple the hydrogen and oxygen evolution reactions and produce them in separate cells or different stages emerge as a prospective route to reduce system cost by enabling operation without expensive membranes and sealing components. Some of these processes divide the hydrogen or oxygen evolution reactions into electrochemical and chemical sub-reactions, enabling them to achieve high efficiency. However, high efficiency has been demonstrated only in a batch process with thermal swings that present operational challenges. This work introduces a breakthrough process that produces hydrogen and oxygen in separate cells and supports continuous operation in a membraneless system. We demonstrate high faradaic and electrolytic efficiency and high rate operation in a near-neutral electrolyte of NaBr in water, whereby bromide is electro-oxidized to bromate concurrent with hydrogen evolution in one cell, and bromate is chemically reduced to bromide in a catalytic reaction that evolves oxygen in another cell. This process may lead the way to high-efficiency membraneless water electrolysis that overcomes the limitations of century-old membrane electrolysis.
Green hydrogen produced by water splitting using renewable energies is essential to reduce greenhouse gas emissions, especially in hard-to-abate industrial sectors such as steel, cement and ammonia production. At present, water electrolysis technologies are uncompetitive with the low-cost production of grey hydrogen by steam methane reforming . Therefore, there is a pressing need to improve water electrolysis to support low-cost production of green hydrogen at the terawatt scale. Towards this aim, decoupled
water electrolysis (DWE), wherein the hydrogen and oxygen evolution reactions (HER and OER, respectively) are decoupled in time and/or place, has emerged as a disruptive concept that has spurred innovative efforts to overcome the limitations of water electrolysis . DWE may lead the way to safe operation without membranes , providing new opportunities to reshape water electrolysis and potentially overcome the fundamental barriers of this century-old technology.
DWE was first reported by Symes and Cronin in 2013, introducing phosphomolybdic acid as a soluble redox couple (SRC) that functions as an electron-coupled-proton buffer and mediates the electron-coupled-proton exchange between the anodic OER and cathodic HER . Despite the process generating oxygen and hydrogen at different times in stepwise stages, a membrane was used to prevent redox shuttling of the polyoxomolybdate anions between the electrodes, and the efficiency was lower than that of conventional water electrolysis. Low efficiency is an inherent disadvantage of this approach since the oxidation and reduction overpotentials of the SRC add up to those of the OER and HER, thus necessitating a larger voltage than in conventional water electrolysis . Subsequent studies pursuing this approach introduced different electron-coupled-proton buffers in acidic electrolytes, but the efficiency remained low and a membrane was still necessary .
Another DWE scheme was reported by Chen et al. and by Landman et al. , replacing the SRC by solid redox electrodes (SRE). To this end, nickel (oxy)hydroxide electrodes such as those commonly used in rechargeable alkaline batteries were employed as auxiliary electrodes that mediate the hydroxide ion exchange between the HER at the cathode of one cell and the OER at the anode of another cell. Thereby the electrolytic cell was divided into two separate cells that generate hydrogen and oxygen remotely from each other, paving the way for membraneless DWE. This approach requires batch operation to regenerate the auxiliary electrodes, whereas SRCs support continuous operation much like conventional electrolysers .
A different approach was reported by Rausch et al., introducing an electrochemical and chemical cycle whereby silicotungstic acid was reduced electrochemically at the cathode while oxygen evolved at the anode with an electrolytic efficiency of (based on the higher heating value of hydrogen), and then transferred into another cell where it was oxidized chemically and released hydrogen upon contact with a platinum catalyst . The next leap was reported by Dotan et al., introducing an electrochemical and thermally activated chemical (ETAC) cycle that divides the OER into two sub-reactions and enables operation in near thermoneutral conditions . This was achieved by cycling a nickel hydroxide anode between an electrochemical stage (E) that charges the anode to nickel oxyhydroxide while hydrogen evolves at the cathode, and a thermally activated chemical stage (TAC) that reduces it back to nickel hydroxide and evolves oxygen without applying electricity.
The ETAC process enables membraneless operation with a remarkable electrolytic efficiency of (at the cell level) at a current density of (ref. 7). But it also presents new challenges that emerge from batch operation and swinging between cold and hot electrolytes in the E and TAC stages, as well as from capacity and rate limitations of the nickel (oxy) hydroxide anodes. These limitations can be circumvented altogether by shifting the charge storage from the solid nickel (oxy)hydroxide anode to the liquid electrolyte, thereby enabling continuous instead of batch operation and avoiding kinetic limitations that arise from solid-state diffusion and phase transformations in the SRE . This work presents a proof of concept of this new approach, using a SRC that stores and releases oxygen instead of hydrogen , and demonstrates membraneless DWE in a continuous and isothermal process(without thermal swings) with high efficiency and high current density.
Concept
We propose an electrochemical and chemical cycle that divides the OER into two sub-reactions, electrochemical and chemical, similarly to the ETAC cycle . But instead of using a nickel (oxy)hydroxide anode, we propose a SRC that supports continuous operation and an isothermal process with high efficiency and at a high rate. The reduced SRC (red) is oxidized in an electrochemical reaction (red , where is the number of electrons ) that complements the HER without
evolving oxygen or other volatile side products; and, in the presence of a suitable catalyst, the oxidized SRC (ox) evolves oxygen spontaneously in a chemical reaction that reduces it back to its reduced state ( ). To provide a driving force for this chemical reaction, the SRC should have a reversible redox potential ( ) above the thermodynamic OER potential ( , with respect to the reversible hydrogen electrode), whereas for high efficiency it should be oxidized at a low overpotential and ideally below the OER onset potential ( for state-of-the-art OER catalysts) . This dictates a reversible redox potential of , similar to that of nickel (oxy) hydroxide . Based on these criteria, the bromide bromate couple ( was selected. The salts of both the reduced and oxidized species, NaBr and , have high solubility in water, 946 and , respectively (at . Moreover, the bromine ( ) produced at the anode is denser than water and is highly soluble in water , which minimizes the risk of evaporation and entrainment by the hydrogen bubbles produced at the cathode. This makes the couple preferable over the couple that produces volatile chlorine ( ) with low solubility in water ( at , which results in a faradaic loss .
Figure 1 illustrates our DWE process for the decoupled production of hydrogen and oxygen in separate cells, using as a SRC that stores and releases oxygen by turns. The electrolytic cell comprises a cathode that generates hydrogen by the HER (reaction1) and an anode where the bromide electro-oxidation reaction (reaction2) takes place:
According to studies on bromide electrolysis , the bromine molecules ( ) produced at the anode react with water in the bulk of the electrolyte to form hypobromous acid ( HBrO , reaction3) that forms hypobromite anions ( ) and protons by dissociation (reaction 4). The hypobromite anions react with hypobromous acid to form bromate anions ( , reaction 5), the desired product:
The overall anode-related process, reactions 2-5, can be summarized by reaction 6:
resulting in an ratio of 6:3:1. For brevity, Fig. 1 illustrates the anodic-related reactions (reactions 2-5) as one (reaction 6).
The HBrO and intermediate products may lead to undesired side reactions :
Fig. 1| Proposed DWE process. Schematic illustration of the proposed DWE process with continuous generation of and in separate electrolytic and catalytic cells using as a soluble redox couple. The oxidized bromaterich electrolyte flows from the bottom of the electrolytic cell to the bottom of the catalytic cell, where it is reduced to bromide by a catalyst and flows from the top of the catalytic cell back to the top of the electrolytic cell. The green coating represents a semipermeable chromium hydroxide layer.
Operation at and pH 8 was found to provide optimal conditions to suppress oxygen evolution (reaction 7) and achieve close to faradaic efficiency for bromate production (reaction 6. To suppress the cathodic backward reactions (reactions 8-11), a small amount ( ) of sodium dichromate ( ) is added to the sodium bromide ( NaBr ) aqueous electrolyte. The dichromate anions ( ) are reduced and deposited on the cathode, coating it with a semipermeable chromium hydroxide layer (illustrated by the green layer in Fig. 1) that suppresses the cathodic loss reactions while allowing the HER to occur without hindrance. This enables us to achieve a high faradaic efficiency without needing a membrane to divide the cell into anodic and cathodic compartments.
The catalytic cell comprises a column embedded with a catalyst (Fig. 1, right) that facilitates the catalytic decomposition of bromate anions ( ) into bromide ( ) and oxygen:
The two cells are connected into a flow system that provides continuous electrolyte flow from one cell to another, as illustrated in Fig.1.
Proof of concept
The feasibility of the proposed DWE process was validated separately in two sets of experiments that examine the performance of the electrolytic and catalytic subprocesses. Then, complementary measurements were carried out combining the two subprocesses into a unified batch-to-bath process that splits water into hydrogen and oxygen in separate cells.
Electrolytic process
The electrolytic process was examined in two operational modes. The first (main) mode corresponds to bromate electrolysis in 1.5 M NaBr aqueous electrolyte with the addition of , where the electrolyte was heated to and stirred during the process. In the second mode, we examined the possibility of carrying out the process without the toxic additive by using the phase separation
between the high-density bromine that forms on the anode (reaction 2) and the rest of the electrolyte to minimize the diffusion of reaction products to the cathode. In the second mode, the electrolysis was carried out in an unheated electrolyte (at room temperature) without stirring. Figure 2 presents photographs of the electrolysis tests carried out in the first and second modes (Fig. 2a,b and Fig. 2c,d, respectively; the electrolyte composition and other experimental conditions are summarized in Table 1). In both cases, the anode and cathode were placed in an electrolytic cell with no membrane or diaphragm division. The addition of in the first operational mode resulted in a yellowish solution (prior to electrolysis), as shown in Fig. 2a, whereas in its absence in the second mode the electrolyte was colourless (Fig. 2c). During operation in the first mode, the whole volume of the electrolyte becomes cloudy (Fig. 2b) due to the evolution of hydrogen bubbles that were stirred throughout the cell. The electrolyte colour remained yellowish, comprising contributions from both the anions and the bromide oxidation intermediates. The operation in the second mode resulted in intense hydrogen bubble formation at the top of the cell, along with a phase separation between the red -rich oxidized solution that sank down to the bottom of the cell, and the yellowish solution that contained oxidized bromine species in the upper part of the cell (Supplementary Video 1). Subsequent stirring turned the phase-separated red and yellowish solutions into a homogeneous yellowish solution (Fig.2e(i)-(v) and Supplementary Video 2), indicating that the -rich solution reacted with the rest of the electrolyte according to reactions . However, a residual amount of unreacted intermediate products remained, as indicated by the yellow colour of the stirred solution.
The faradaic efficiency of bromide electro-oxidation was examined for both operational modes, with and without , by electrolysing 20 ml of 1.5 M NaBr electrolyte (without buffers) for 5.36 hours at a current of 600 mA (total charge, 11,578 Coulomb) and analysing the resulting bromate content by iodometric titration (Supplementary Video3). Considering that six electrons are needed to oxidize a bromide anion to a bromate anion (reaction 6), this charge should produce 0.02 moles of bromate anions at faradaic efficiency and convert of the bromide anions in the initial electrolyte ( 20 ml of 1.5 M NaBr ) to bromate anions. In the first operational mode (Fig. 2b), the faradaic efficiency was , indicating successful suppression of the cathodic side reactions (reactions 8-11) as well as the anodic OER (reaction 7). A direct confirmation of no OER interference is presented in Supplementary Video 4, showing bromide electrolysis in a Hoffman apparatus with no oxygen evolution. Without the additive (but otherwise the same conditions), the faradaic efficiency dropped to , indicating the important role of to prevent reactions by forming a polyoxide cathodic barrier, as reported elsewhere .
In the second operational mode (Fig. 2d), without , the faradaic efficiency was without stirring, and it dropped to with stirring, demonstrating the effectiveness of the spontaneous phase separation between the oxidized electrolyte and the rest of the electrolyte in suppressing the cathodic loss reactions (reactions 8-11). The faradaic efficiency may be further enhanced by removing the oxidized electrolyte from the bottom of the cell, as illustrated in Fig.1. This approach may lead the way to high-efficiency operation in a benign NaBr electrolyte without . A similar approach has been reported in membraneless zinc-bromine redox flow batteries, harnessing the phase separation in the electrolyte to suppress backward reactions like those occurring in our system . An alternative approach to adding to the electrolyte is precoating the cathode (ex situ) with a chromium polyoxide (or other) layer instead of in situ deposition of anions during operation in the presence of . We have achieved partial success pursuing this approach by using a precoated cathode that was installed after going through previous electrolysis tests with in the electrolyte, reaching a faradaic
Fig. 2 | Bromide electrolysis tests. a-e, Photographs of the electrolytic cells we used to examine the bromide electrolysis process with stirred (a and b) and still ( ) electrolytes. Panels and are before electrolysis; and are during
electrolysis; and shows sequential snapshots during subsequent stirring after electrolysis (Supplementary Video 2). The electrolyte composition and other experimental conditions are summarized in Table1.
Table 1 | Experimental conditions for faradaic efficiency measurements
Experiment no.
Figure
Faradaic efficiency (%)
Cell type
Cathode
Cathode coating
Temp. ( )
Stirring (r.p.m.)
pH, initial
pH, final
1
–
Double-jacketed cell
Pt foil
–
60
400
5.8
9.2
2
2a,b
3.8 mM
In situ
7.5
7.9
3
–
Ex situ
5.8
9.5
4
2c-e
–
Cylindrical cell
Pt coil
–
r.t.
–
5.8
8.3
5
–
400
5.8
10.5
Electrolysis current, 600 mA ; electrolysis duration, of 1.5 M NaBr electrolyte (without buffer); r.t., room temperature. situ coating by electroreduction of anions and cathodic deposition during electrolysis. Using a precoated cathode from prior electrolysis tests.
efficiency of in subsequent tests without . We suspect that the lower faradaic efficiency of the precoated cathode with respect to in situ coating during electrolysis in the presence of in the electrolyte may be ascribed to the detachment of small segments of the coating layer during operation. In the presence of anions in the electrolyte, the barrier layer is more effective than the ex situ precoating, probably due to self-healing of the polyoxide layer during operation. In addition, also serves as a buffer and without it the pH shifts to high values (Table 1) that may promote parasitic
oxygen evolution (reaction 7). Long-term tests demonstrate the process stability in the presence of during continuous operation over five days, as shown in Extended Data Fig.1, by monitoring the concentration of bromide and bromate in the electrolyte (Extended Data Figs. 2 and 3, respectively).
In addition to the faradaic efficiency measurements, the electrolytic (that is, voltage) efficiency was measured for the first operational mode (Fig. 2b), which demonstrated the highest faradaic efficiency ( ). This was done by two-electrode galvanostatic
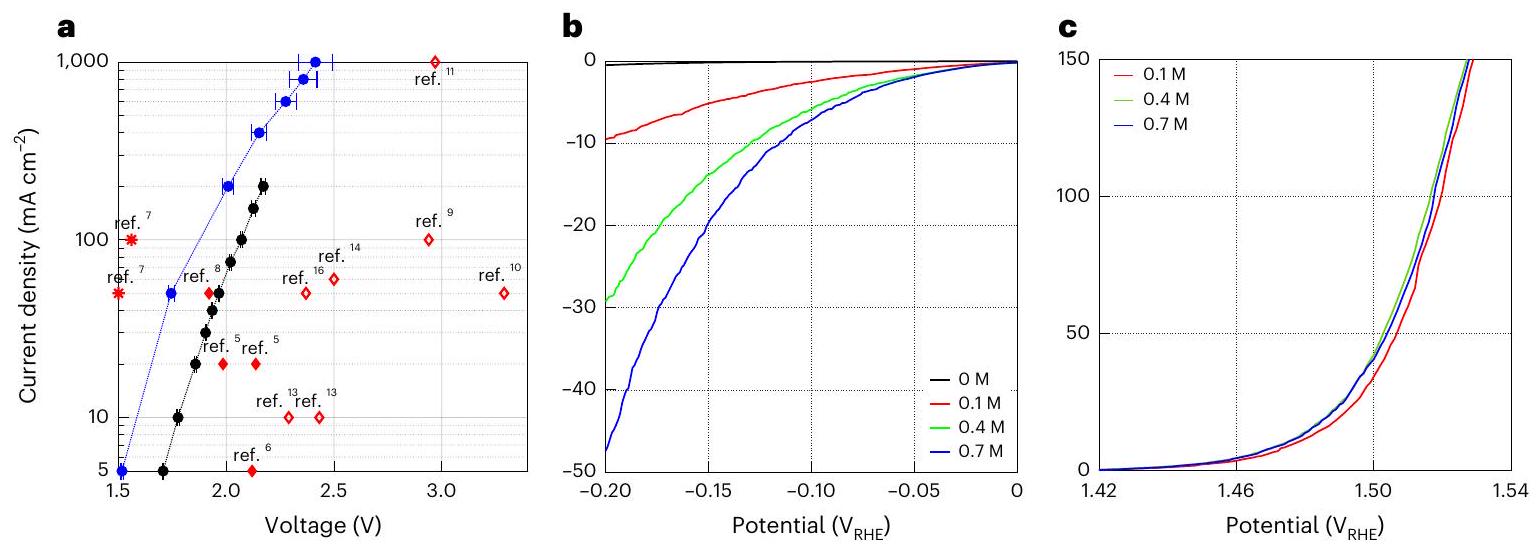
Fig. 3 | Electrolytic efficiency of bromide electrolysis. a, Steady-state current density versus voltage (I corrected) results obtained by galvanostatic measurements at different current densities during bromide electrolysis with (blue symbols) and without (black – symbols) borate buffer ( 0.7 M ). For a comparison, results from previous DWE reports are marked by red symbols ( for SRC, for SRE and * for ETAC) and labelled by their respective reference numbers. The electrolyte composition at the beginning of the electrolysis measurements was 1.5 M NaBr with , with and without borate buffer. The
electrolyte was heated to and stirred at 400 r.p.m.b,c, Current density versus potential curves corrected) of the Pt foil cathode and DSA (anode), respectively, obtained by LSV measurements with a potential scan rate of . The experimental conditions of all the measurements are summarized in Table 2. The data points and error bars in a present the mean values and standard deviation of the galvanostatic measurements presented in Extended Data Fig. 5 (the numerical values are presented in Supplementary Table 1b).
Table 2 | Experimental conditions for electrolytic efficiency and cathodic and anodic polarization measurements
Figure
Method
Electrodes
Electrolyte
Buffer
Stirring
3a
Galvanostatic two-electrode cell
DSA (anode) Pt foil cathode
1.5 M NaBr 3.8 mM
–
400r.p.m.
3b
LSV threeelectrode cell
Pt foil WE Pt wire CE RHE RE
1.5 M NaBr
–
–
0.1 M borate
0.4 M borate
0.7 M borate
3c
LSV threeelectrode cell
DSA WE Pt coil CE RHE RE
1.5 M NaBr
0.1 M borate
–
0.4 M borate
0.7 M borate
All the measurements were carried out in a heated electrolyte ( ). The initial pH was 8. CE, counter electrode; RE, reference electrode; WE, working electrode; RHE, reversible hydrogen electrode.
voltammetry measurements at different current densities ranging from 5 to without and with borate buffer (Extended Data Figs. 4 and 5, respectively). Figure 3a presents the steady-state current density versus voltage results (IR corrected, where I is the current and the series resistance) obtained for bromide electrolysis in unbuffered (black) and buffered ( 0.7 M borate buffer, blue) 1.5 M NaBr electrolytes with , heated to and stirred at 400 r.p.m.; the experimental conditions of these measurements are summarized in Table 2. Introducing 0.7 M borate buffer decreases the cell voltage by at current densities up to , resulting in a low onset voltage of 1.5 V at . The reduction in cell voltage remains notable even at . A cell voltage of 2.4 V was obtained at a high current density of . Consequently, the electrolytic cell efficiency increased from 86 to at , and from 75 to at (Supplementary Fig. 1). Comparing
our results (black and blue curves) with previous DWE reports, marked by red symbols ( , and ), shows that the electrolytic performance of our process surpasses previous DWE reports using SRC and SRE (marked by open and solid squares, and , respectively), except for the ETAC process (marked by stars, ). ETAC water electrolysis presents the lowest cell voltage, 1.5 V at a current density of (ref. 7), but it goes only as high as , whereas our process reaches . Also, unlike ETAC, which is a batch process with thermal swings that require additional thermal energy to heat the hot electrolyte in the transitions from the cold stage to the hot stage , our process is designed to operate continuously and isothermally (Fig. 1), avoiding this thermal loss and increasing the process productivity. As a result, the gap between the efficiency at the cell level and system level is expected to be smaller for our process. We also note that stable operation was observed in prolonged galvanostatic measurements for 5.5 h (Extended Data Fig. 6).
To assess the individual contributions of the cathodic and anodic reactions to the voltage of our process, we analysed the cathodic (HER) and anodic (bromide electro-oxidation reaction) polarization losses by means of linear sweep voltammetry (LSV) measurements in a three-electrode cell. The results are presented in Fig. 3b,c, showing the current density as a function of the potential of the Pt foil cathode and dimensionally stable anode (DSA), respectively. These measurements were carried out in 1.5 M NaBr electrolytes containing different borate buffer concentrations (as indicated in the legend), under the same conditions as in the first operational mode of the galvanostatic measurements except for not adding . One can see that the cathodic reaction (Fig. 3b) requires a much higher overpotential than the anodic counterpart (Fig. 3c). Thus, the HER presents the main polarization loss in our electrolytic process. The addition of borate buffer enhances the HER kinetics and reduces the cathodic overpotential loss substantially (Fig.3b), with negligible effect on the anodic polarization (Fig.3c). The beneficial effect of the borate buffer in reducing the cathodic overpotential loss may be attributed to serving as a proton source in our near-neutral NaBr electrolyte and suppressing local pH gradients at the cathode .
Catalytic process
The kinetics of bromate decomposition to bromide and oxygen (reaction 12) were studied using a catalyst that was chosen based on
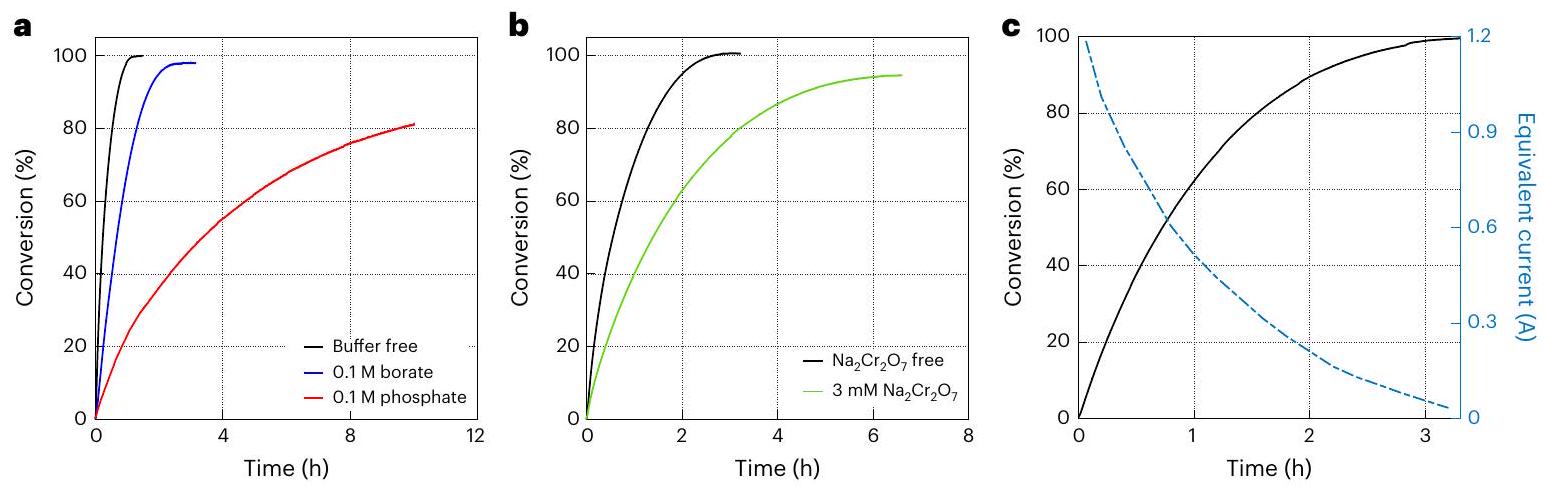
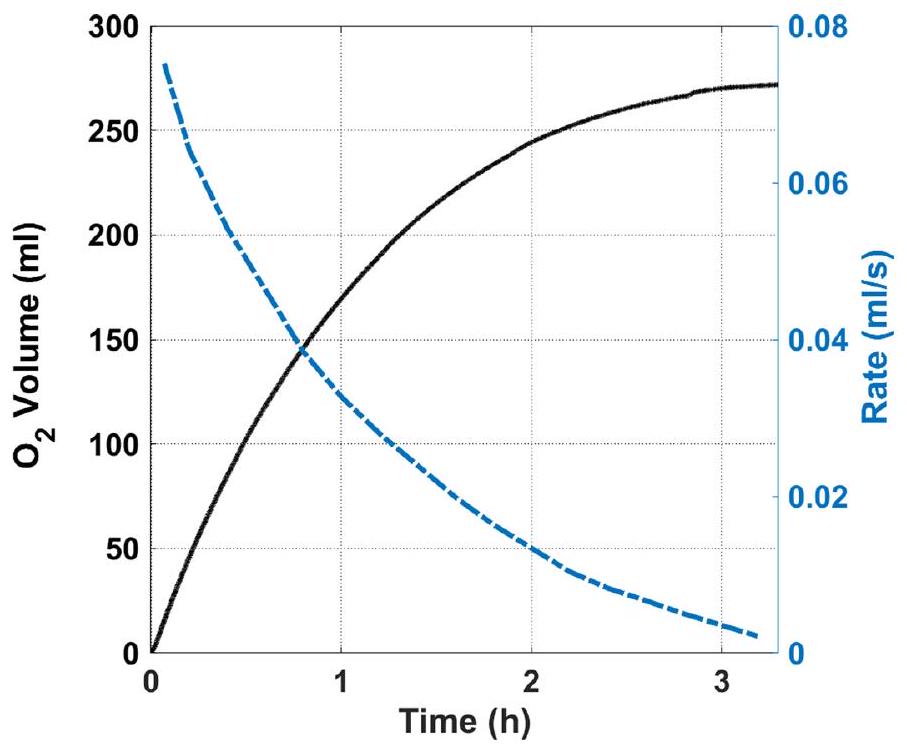
Fig. 4 | Catalytic decomposition of bromate to bromide and oxygen. Buffer effect (a) and effect (b) on the catalytic conversion of to and (reaction 12). The electrolyte was and the catalyst loading was 50 mg in a and 25 mg in b. c, Catalytic conversion of 1 M
bromate solution obtained by bromide electrolysis (Fig. 2b). The catalyst loading was 50 mg . The solid black curve presents the fraction of conversion of bromate to bromide, and the dashed blue curve presents the equivalent electric current.
Table 3 | Experimental conditions for catalytic decomposition experiments
Figure
Initial rate ( )
Adams mass (mg)
Additives
–
0.0310
102.8
No
4a
0.0362
51.2
4b
0.0349
25.5
4a
0.0041
51.6
0.1 M phosphate buffer
4a
0.0068
55.0
0.1 M borate buffer
4b
0.0168
25.4
All the measurements were carried out in a heated and stirred electrolyte , 400 r.p.m.). The initial pH was 8.
previous reports . The catalyst was synthesized using the Adams method , as described in the Methods. This catalyst was composed of the rutile phase, as shown by the X-ray diffraction diffractogram presented in Extended Data Fig. 7, with a granular structure comprising submicrometre aggregates, as shown in scanning electron microscopy and transmission electron microscopy micrographs, presented in Extended Data Figs. 8 and 9, respectively, with a Brunauer-EmmettTeller surface area of (Supplementary Fig. 3b) and a bimodal pore-size distribution with and pores (Supplementary Fig. 3c). The conversion of bromate to bromide was measured by monitoring the volume of the effluent gas (oxygen) as a function of time during the catalytic decomposition of aqueous solution (preheated to ) in the presence of the catalyst, using the water displacement method (Methods for details; a picture of the system is in Supplementary Fig. 4 and Supplementary Video 5). The experimental conditions of these measurements aresummarized in Table 3. Some of the catalyst was washed away by the effluent gas out of the catalytic cell. This artefact disabled precise quantitative assessment of the specific activity of the catalyst. Nevertheless, the experiments presented herein demonstrate the process functionality and performance. Future development of this process should immobilize the catalyst by embedding it in a porous support.
We examined the effect of borate and phosphate buffers ( 0.1 M ) on the reaction kinetics, using of the Adams catalyst. Figure 4a presents the fraction of conversion of bromate to bromide as a function of time for the baseline solution ( ) with and without borate and phosphate buffers. Without a buffer (black curve), full conversion was achieved in , and the initial reaction rate was . Buffer addition ( 0.1 M ) to the baseline electrolyte had an
adverse effect on the bromate decomposition kinetics (Fig. 4a), which was worse for the phosphate buffer (red curve) than for the borate buffer (blue curve). For the borate buffer, the initial reaction rate was , and full conversion was achieved in , whereas for the phosphate buffer the initial reaction rate dropped to and full conversion was not achieved in the time frame of this measurement ( 10 h ). Next, the effect of the additive on the reaction kinetics was examined, using 25 mg of the Adams catalyst. The results are presented in Fig. 4b. In the electrolyte without (black curve), full conversion was achieved in and the initial reaction rate was . The addition of reduced the initial reaction rate to and delayed the achievement of full conversion to . The catalytic deactivation in the presence of phosphate and borate buffers and additive could possibly be attributed to competitive adsorption on the surface of the catalyst that interferes with the bromate adsorption.
Batch-to-batch process
To demonstrate the feasibility of our DWE process, we combined the electrolytic and catalytic subprocesses into a batch-to-batch process. An aliquot of 7 ml out of 20 ml of the oxidized electrolyte was taken from the best performing electrolytic test (Fig. 2b) after converting 1 M of the bromide concentration to bromate, and was transferred to the catalytic cell with 50 mg of the Adams catalyst, which decomposed the bromate anions to bromide anions and oxygen. The volume of the effluent gas (oxygen) was measured (Supplementary Fig.4) and converted to the fraction of bromate-to-bromide conversion, presented as a function of the reaction time in Fig. 4c (black solid curve). The results show complete conversion (100%) of electrolytically obtained bromate to bromide and oxygen after . This demonstrates a full cycle of hydrogen evolution and bromide electro-oxidation to bromate with faradaic efficiency in the electrolytic cell, followed by complete conversion of the bromate formed in the electrolytic cell back to bromide with stoichiometric oxygen evolution in the catalytic cell.
Coupling the electrolytic and catalytic cells in a joint flow system is beyond the scope of this study, which presents a proof of concept of a new DWE process and demonstrates its basic functionality and performance. In a complete system with continuous electrolyte flow between the two cells, it is important to match the rate of bromate formation in the electrolytic cell with the rate of its conversion back to bromide in the catalytic cell. To compare these rates in our tests, the rate of oxygen evolution that was measured in the catalytic cell was converted to an equivalent electric current by assigning four electrons per molecule, shown by the dashed blue curve in Fig. 4c. At the beginning of the reaction, the conversion rate corresponds to
a high current of over 1 A . This indicates a fast catalytic reaction that would not limit the electrolytic reaction in the other cell. In future development of the continuous process, several parameters should be tuned to match the rates of the bromate formation and decomposition in the electrolytic and catalytic cells. In the electrolytic cell, the applied current, electrode size and electrolyte composition and volume should be adjusted. In the catalytic cell, the length and diameter of the catalytic column, the amount of catalyst and the porous support in which it is embedded should be properly matched with the electrolytic current and electrolyte flow rate to support a seamless continuous operation.
In summary, this work presents a new DWE process that produces hydrogen and oxygen in separate electrolytic and catalytic cells and supports continuous operation in a membraneless system. We demonstrate a high efficiency and high rate in a near-neutral electrolyte of NaBr in water, whereby bromide is electro-oxidized to bromate concurrent with hydrogen evolution in one cell, and bromate is chemically reduced to bromide in a catalytic reaction that evolves oxygen in another cell. A faradaic efficiency of was achieved in a 1.5 M NaBr electrolyte with that prevents cathodic loss reactions by coating the cathode with a barrier layer that hinders the electroreduction of oxidized bromine species. Under these conditions, no oxygen evolves in the electrolytic cell, enabling safe operation without membranes. Adding a borate buffer enhances the HER and reduces the cell voltage (IR corrected) to 1.5 V at a current density of , or 2.4 V at . These values correspond to electrolytic efficiency values of and , respectively, outperforming previous reports on decoupled water splitting using electron-coupled-proton buffers . The electrolytic efficiency of our system is slightly lower than that reported in ETAC water splitting , but our process supports continuous operation without thermal swings, unlike ETAC, which is a batch process with thermal swings between cold and hot electrolytes. Another advantage of our process is operation in a near-neutral electrolyte, unlike previous reports on DWE in acid or alkaline electrolytes. We also demonstrate fast reduction of the oxidized electrolyte and oxygen evolution by a catalyst without applying electricity. Further efforts to develop this breakthrough process into a competitive technology for green hydrogen production should aim at the following goals: (1) replacing the Pt cathode and anode (DSA) and catalyst ( Adams) by Earth-abundant alternatives; (2) replacing the additive by non-toxic alternatives; and (3) integrating the electrolytic and catalytic subprocesses into a seamless process, and validating its long-term performance.
Online content
Any methods, additional references, Nature Portfolio reporting summaries, source data, extended data, supplementary information, acknowledgements, peer review information; details of author contributions and competing interests; and statements of data and code availability are available at https://doi.org/10.1038/s41563-023-01767-y.
References
Krishnan, S. et al. Present and future cost of alkaline and PEM electrolyser stacks. Int. J. Hydrogen Energy 48, 32313-32330 (2023).
McHugh, P. J., Stergiou, A. D. & Symes, M. D. Decoupled electrochemical water splitting: from fundamentals to applications. Adv. Energy Mater. 10, 2002453 (2020).
Ifkovits, Z. P., Evans, J. M., Meier, M. C., Papadantonakis, K. M. & Lewis, N. S. Decoupled electrochemical water-splitting systems: a review and perspective. Energy Environ. Sci. 14, 4740-4759 (2021).
Landman, A., Rothschild, A. & Grader, G. S. in Electrochemical Power Sources: Fundamentals, Systems, and Applications, Hydrogen Production by Water Electrolysis (eds Smolinka, T. & Garche, J.) Ch. 12, 407-454 (Elsevier, 2021).
Chen, L., Dong, X., Wang, Y. & Xia, Y. Separating hydrogen and oxygen evolution in alkaline water electrolysis using nickel hydroxide. Nat. Commun. 7, 11741 (2016).
Landman, A. et al. Photoelectrochemical water splitting in separate oxygen and hydrogen cells. Nat. Mater. 16, 646-651 (2017).
Dotan, H. et al. Decoupled hydrogen and oxygen evolution by a two-step electrochemical-chemical cycle for efficient overall water splitting. Nat. Energy 4, 786-795 (2019).
Wang, J. et al. Decoupling half-reactions of electrolytic water splitting by integrating a polyaniline electrode. J. Mater. Chem. A 7, 13149-13153 (2019).
Symes, M. D. & Cronin, L. Decoupling hydrogen and oxygen evolution during electrolytic water splitting using an electron-coupled-proton buffer. Nat. Chem. 5, 403-409 (2013).
Rausch, B., Symes, M. D. & Cronin, L. A bio-inspired, small molecule electron-coupled-proton buffer for decoupling the half-reactions of electrolytic water splitting. J. Am. Chem. Soc. 135, 13656-13659 (2013).
Kirkaldy, N., Chisholm, G., Chen, J. J. & Cronin, L. A practical, organic-mediated, hybrid electrolyser that decouples hydrogen production at high current densities. Chem. Sci. 9, 1621-1626 (2018).
Chisholm, G., Cronin, L. & Symes, M. D. Decoupled electrolysis using a silicotungstic acid electron-coupled-proton buffer in a proton exchange membrane cell. Electrochim. Acta 331, 135255 (2020).
Li, W. et al. Electrolyzer design for flexible decoupled water splitting and organic upgrading with electron reservoirs. Chem 4, 637-649 (2018).
Amstutz, V. et al. Renewable hydrogen generation from a dual-circuit redox flow battery. Energy Environ. Sci. 7, 2350-2358 (2014).
Zhang, F. et al. Decoupled redox catalytic hydrogen production with a robust electrolyte-borne electron and proton carrier. J. Am. Chem. Soc. 143, 223-231 (2021).
Rausch, B., Symes, M. D., Chisholm, G. & Cronin, L. Decoupled catalytic hydrogen evolution from a molecular metal oxide redox mediator in water splitting. Science 345, 1326-1330 (2014).
Bazant, M. Z. Theory of chemical kinetics and charge transfer based on nonequilibrium thermodynamics. Acc. Chem. Res. 46, 1144-1160 (2013).
Suen, N. T. et al. Electrocatalysis for the oxygen evolution reaction: recent development and future perspectives. Chem. Soc. Rev. 46, 337-365 (2017).
Bratsch, S. G. Standard electrode potentials and temperature coefficients in water at 298.15 K. J. Phys. Chem. Ref. Data 18, 1-21 (1989).
Hayes, W. M. (ed.) CRC Handbook of Chemistry and Physics 97th edn (CRC Press, 2016).
Amoore, J. E. & Hautala, E. Odor as an aid to chemical safety: odor thresholds compared with threshold limit values and volatilities for 214 industrial chemicals in air and water dilution. J. Appl. Toxicol. 3, 272-290 (1983).
Viswanathan, K. & Tilak, B. V. Chemical, electrochemical, and technological aspects of sodium chlorate manufacture. J. Electrochem. Soc. 131, 1551-1559 (1984).
Osuga, T. & Sugino, K. Electrolytic production of bromates. J. Electrochem. Soc. 104, 448 (1957).
Cettou, P., Robertson, P. M. & Ibl, N. On the electrolysis of aqueous bromide solutions to bromate. Electrochim. Acta 29, 875-885 (1984).
Pavlović, O. Ž., Krstajić, N. V. & Spasojević, M. D. Formation of bromates at a titanium anode. Surf. Coat. Technol. 34, 177-183 (1988).
Vasudevan, S. Studies relating to electrolytic preparation of potassium bromate. Ind. Eng. Chem. Res. 47, 1743-1746 (2008).
Gomes, A. S. O., Busch, M., Wildlock, M., Simic, N. & Ahlberg, E. Understanding selectivity in the chlorate process: a step towards efficient hydrogen production. ChemistrySelect 3, 6683-6690 (2018).
Endrődi, B., Sandin, S., Wildlock, M., Simic, N. & Cornell, A. Suppressed oxygen evolution during chlorate formation from hypochlorite in the presence of chromium(VI). J. Chem. Technol. Biotechnol. 94, 1520-1527 (2019).
Endrődi, B., Simic, N., Wildlock, M. & Cornell, A. A review of chromium(VI) use in chlorate electrolysis: functions, challenges and suggested alternatives. Electrochim. Acta 234, 108-122 (2017).
Endrődi, B. et al. Towards sustainable chlorate production: the effect of permanganate addition on current efficiency. J. Clean. Prod. 182, 529-537 (2018).
Amit, L., Naar, D., Gloukhovski, R., la O’, G. J. & Suss, M. E. A single-flow battery with multiphase flow. ChemSusChem 14, 1068-1073 (2021).
Jackson, M. N., Jung, O., Lamotte, H. C. & Surendranath, Y. Donordependent promotion of interfacial proton-coupled electron transfer in aqueous electrocatalysis. ACS Catal. 9, 3737-3743 (2019).
Strmcnik, D. et al. Improving the hydrogen oxidation reaction rate by promotion of hydroxyl adsorption. Nat. Chem. 5, 300-306 (2013).
Mills, A. & Meadows, G. Heterogeneous redox catalysis: a novel route for removing bromate ions from water. Water Res. 29, 2181-2185 (1995).
Duonghong, D., Erbs, W., Shuben, L. & Grätzel, M. Efficient redox catalysis by in the generation of oxygen and bromine from aqueous bromate solutions. Chem. Phys. Lett. 95, 266-268 (1983).
Dong, Z., Dong, W., Sun, F., Zhu, R. & Ouyang, F. Effects of preparation conditions on catalytic activity of Ru/AC catalyst to reduce bromate ion in water. React. Kinet. Mech. Catal. 107, 231-244 (2012).
Thakur, D. B. et al. Ruthenium catalyst on carbon nanofiber support layers for use in silicon-based structured microreactors. Part II: catalytic reduction of bromate contaminants in aqueous phase. Appl. Catal. B Environ. 102, 243-250 (2011).
Fan, C. et al. Enhanced performance and mechanism of bromate removal in aqueous solution by ruthenium oxide modified biochar ( /BC). Colloids Surf. A Physicochem. Eng. Asp. 572, 27-36 (2019).
Adams, R., Voorhees, V. & Shriner, R. L. Platinum catalyst for reductions: platinic oxide. Org. Synth. 8, 92 (1928).
Publisher’s note Springer Nature remains neutral with regard to jurisdictional claims in published maps and institutional affiliations.
Double distilled water (DDW; Direct-Q3 UV, Merck) was used to prepare the aqueous solutions. Piranha solution, comprising a 2:5 mixture of concentrated hydrogen peroxide ( , analytic grade, Merck) and sulfuric acid ( ; 95-98%, analytical reagent grade (AR), Bio-Lab), was used for cleaning the electrochemical cells, glassware and Pt electrodes before use. Acetone (AR, Bio-Lab) and ethanol (absolute, AR, Gadot-Group) were used for cleaning the anode before use. The electrolytes were prepared using sodium bromide ( , Alfa Aesar). The pH values were adjusted with the use of sodium hydroxide (NaOH; pearls, AR, Bio-Lab) solutions. The buffer solutions were prepared with the use of boric acid ( , ACS grade, Acros), phosphate dipotassium phosphate ( ; ACS grade, Spectrum Chemical) and monopotassium phosphate ( ; analytic grade, Merck). Sodium dichromate dihydrate ( ; ACS grade, Merck) was used as an additive in the electrolyte. Ar gas (99.999%, Maxima) was used for purging the electrolyte in the polarization measurements. Ruthenium trichloride hydrate , Acros Organics) and sodium nitrate ( grade, Acros) were used for the synthesis of ruthenium dioxide powder ( Adams catalyst). Potassium iodide (KI; ACS reagent, Spectrum Chemical) and a standardized 0.1 N solution of sodium thiosulfate (Alfa Aesar) were used for the iodometric titration of bromate solutions. Sodium bromate ( ; 99.5% metal basis, Alfa Aesar) was used to prepare the solutions for the water displacement measurements.
Electrodes
Pt foil (0.05-mm-thick foil; geometric area, ; surface roughness factor, ; 99.95%; Holland Moran) and Pt coil (wire diameter, 1 mm ; coil diameter and length, 4 and 15 mm , respectively; ALSCo.) electrodes were used as cathodes in the bromide electrolysis measurements presented in Fig. 2b,c, respectively. The same Pt foil ( ) was used as the WE in the cathodic polarization HER measurements presented in Fig.3b. A smaller piece ( ) of this Pt foil was used for the high current density measurements presented in Fig.3a, to comply with the maximum current limitation ( 800 mA ) of the potentiostat (BioLogic SP-150). The Pt electrodes were cleaned by dipping into piranha solution and then thoroughly rinsing in DDW before measurements. Commercial Ti DSAs (Ti substrate thickness, 1 mm ; thickness of mixed oxide layer, (Supplementary Fig. 2); DSA10K, De Nora) were used as anodes, keeping the geometric area close to that of the corresponding cathode. The DSAs were precleaned in a mixture of DDW/ethanol/ acetone for 10 min in an ultrasound bath (MRC ultrasonic cleaner, 31, 120 W) and then thoroughly rinsed in DDW.ARHE (HydroFlex, Gaskatel) was used as the RE in the three-electrode measurements. It was immersed in the respective electrolyte 1 h before starting the measurements.
Adams catalyst synthesis
The Adams catalyst used in the bromate reduction process (Fig.4) was prepared following a modified Adams process by grinding together 2 g of and 10 g of powders with a mortar and pestle. The resulting mixture was heated for 5 min in a box furnace (ELF Laboratory Chamber Furnace, maximum , Carbolite) at . The furnace was placed in a fume hood to safely remove toxic by-products of the reaction such as nitrogen oxide ( ) gases. The resulting Adams catalyst was then cooled to ambient temperature and washed with DDW. The washing was repeated three times by means of centrifugation (SCEN-206 centrifuge, MRC) and decantation of the unreacted reagents in DDW. The recovered catalyst powder was then dried in air for several days.
Faradaic efficiency measurements
The faradaic efficiency of the bromide electro-oxidation to bromate (reaction 6) was evaluated for the two operational modes under the
experimental conditions described in Table 1, using a Ti DSA (anode) and Pt foil or coil cathode in the same compartment (Fig. 2b,d, respectively). The amount of generated bromate anions was determined at the end of each of the electrolysis tests by iodometric titration and compared with the electric charge, ( , current; , electrolysis time), that passed between the electrodes during the respective test. In the first operational mode (Fig. 2a), a double-jacketed electrochemical cell (Dr. Bob, Gamry) was used, and the electrolyte, 1.5 M NaBr without additives (experiment nos 1 and 3 in Table 1) or with (experiment no. 2 in Table 1), was heated to and stirred at 400 r.p.m. using a Teflon-coated magnetic stirrer. In the second operational mode (Fig. 2d and experiment nos 4 and 5 in Table 1), a cylindrical cell (graduated Pyrex cylinder, 20 ml , Duran) was used, and the electrolyte ( 1.5 M NaBr , without additives) was kept at room temperature. The initial pH of the 1.5 M NaBr electrolyte without additives was 5.8, whereas that with the additive was 7.5.
Long-term stability
Faradaic efficiency measurements were carried out during five consecutive days with 119 h of continuous electrolysis at a current of 300 mA (current density of ). A large ( 500 ml ) cylindrical cell with a Pt foil cathode and DSA (anode) was filled with 300 ml of the electrolyte (initial concentration, borate buffer and ; photograph in Extended Data Fig. 1). The cell was heated to and stirred at 400 r.p.m. To reduce evaporation, the cap was sealed to the cell with a Parafilm laboratory film. The bromide and bromate concentrations were measured by sampling the electrolyte approximately every 24 h during the test, and analysing the sample composition by iodometric titration and ion chromatography. The results are presented in Extended Data Figs. 2 and 3, respectively. The pH was measured each day, and the results were in the range of 8.0 to 8.6.
Iodometric titration
Iodometric titration was used to determine the concentration of bromate anions ( ) in the electrolyte after bromide electrolysis tests. The bromate anions were reduced to bromide anions ( ) in the presence of an excessive amount of iodide anions in acidic medium: . The iodine ( ) molecules that evolved were titrated by standardized thiosulfate solution: . To this end, a solution of 3.8 g KI in 40 ml DDW was added to an aliquot of (volume of aliquot, ) that was collected from the electrolytic cell (volume of cell, ) at the end of the electrolysis experiment, followed by the addition 0.6 ml of concentrated sulfuric acid, . After dilution by DDW to a volume of 50 ml , the resultant dark-violet solution (Supplementary Fig. 5, left) was gradually titrated by adding a standardized 0.1 N solution of sodium thiosulfate, (concentration of thiosulfate anion, ) until reaching a transparent solution (Supplementary Video 3 and Supplementary Fig. 5, right). The volume of the thiosulfate solution that was added to this point, , was used to calculate the amount of bromate ions that was generated by the electrolysis: .
Ion chromatography
Ion chromatography was used to measure the concentration of bromide and bromate anions in the sampled solutions during the long-term stability measurement (Extended Data Figs. 2 and 3, respectively) using a Metrohm 881 Compact IC pro chromatograph equipped with a Shodex IC-SI-52 4E analytical column. Two duplicate samples were collected approximately every 24 h from the beginning of the test and diluted by DDW to prepare 4 ml samples that were analysed by ion chromatography using bromate and bromide standards from Sigma-Aldrich.
Electrolytic efficiency
The electrolytic efficiency of the bromide electrolysis tests was evaluated from the steady-state current-voltage results presented in Fig. 3a. To this end, galvanostatic measurements were carried out at different currents in a two-electrode cell configuration (Fig. 2a) using a BioLogic SP-150 potentiostat with a Pt foil cathode and a DSA10K anode. The electrolyte was 1.5 M NaBr with sodium dichromate additive ( 3.8 mM ), without a buffer or with 0.7 M borate buffer (black and blue symbols in Fig. 3a, respectively). The electrolyte was heated to in a double-jacketed electrochemical cell (Dr. Bob, Gamry) and stirred at 400 r.p.m. The experimental conditions are summarized in Table 2. Current density values from 5 to were applied in ascending order, holding for 5 min at a time, while monitoring the applied voltage. The voltage values were averaged to obtain the mean value and standard deviation at each current density and corrected for the ohmic (IR) drop. The resistance was measured by electrochemical impedance spectroscopy using a BioLogic SP-150 potentiostat and was determined as the high-frequency intercept with the real axis in the Nyquist plot. The electrochemical impedance spectroscopy measurements were conducted in galvanostatic mode at the same currents as the current-voltage measurements, with an oscillation amplitude of 5% of the mean current and oscillation frequency from 200 kHz to 100 mHz . The -corrected mean voltage values, , were used to calculate the electrolytic efficiency based on the higher heating value (HHV) of hydrogen: (in units of percent HHV).
Cathodic polarization measurements
The cathodic polarization curves presented in Fig. 3b were measured by LSV in a three-electrode water-jacketed electrochemical cell (Dr.Bob, Gamry) using Pt foil ( ) as the WE and a potentiostat (BioLogic SP-150) at a scan rate . A Pt wire (diameter, 1 mm ; Gamry) placed in a separate fritted glass compartment was used as the CE, where bromide electro-oxidation took place. ARHE was used as the RE. The RE and WE were placed in the same compartment. The series resistance was measured by a current interruption method before each measurement. Measurements were carried out in Ar-purged 1.5 M NaBr electrolytes containing different additives at . The basicity of the electrolyte was adjusted to pH 8 using a 5 M NaOH solution, measured by an Oakton series 500 pH meter. The experimental conditions are summarized in Table 2. In short experiments that correspond to several polarization curves, the addition of sodium dichromate to the electrolyte was found to have a negligible effect on the polarization curves; therefore it was not used in the cathodic polarization measurements. No stirring was applied in these measurements to minimize interference by back reactions of the products of bromide electro-oxidation at the CE.
Anodic polarization measurements
The anodic polarization curves presented in Fig. 3c were measured similarly to the cathodic polarization measurements, with the following exceptions: first, a DSA10K anode ( ) was used as the WE; and second, the WE and CE (Pt coil) were placed in the same compartment, so that the hydroxide anions ( ) formed at the CE would not be restricted from reacting with formed at the WE in the bulk solution. The experimental conditions are summarized in Table 2.
Bromate catalytic decomposition
A water displacement technique was used to monitor the kinetics of the bromate catalytic decomposition (reaction 12) by the Adams catalyst (Fig. 4). The method is based on weighing the amount of water displaced by the oxygen released in the reaction. The experimental set-up, presented in Supplementary Fig. 4, comprises a gas-tight glass reactor placed in a water bath on top of a heated plate and a water column. The outlet of the reactor is connected to the inlet of a water column, whereas the outlet of the column is directed to a beaker that is placed on a digital balance (BB-1550, MRC) that monitors the weight
change as a function of time during the decomposition reaction. Before the start of the experiment, the silicone tube connecting the reactor and the water column is closed by a metal pinch clamp. To start the measurement, a known volume ( ) of solution with a known concentration of bromate anions ( ) is added to the reactor, which contains a measured mass of the Adams catalyst . Then, the reactor is sealed, and the pinch clamp is opened. The oxygen gas that evolves in the reactor flows to the water column through the tube and displaces the water from the column to the beaker, and the mass of the displaced water ( ) is constantly measured (Supplementary Video 5). The measured mass (in kilograms) is nearly equal to the oxygen volume ( , in litres) since the density of water is at standard temperature and pressure. The oxygen volume, , is converted to number of moles of oxygen, , by the ideal gas law ( ; , pressure of gas; , volume of gas; , moles of gas; , ideal gas constant; , temperature of gas). Taking a ratio of 2:3 between the bromate anions converted to bromide and the generated molecules (reaction 12), the conversion fraction is , presented in Fig. 4 as a function of the reaction time ( ). The slope yields a reaction rate that can be converted to an equivalent electric current (presented in Fig. 4c, blue curve), where is Faraday’s constant and 4 is the number of electrons needed to generate an molecule. The conversion values were verified independently by end-of-experiment iodometric titrations, confirming the full decomposition of bromate to bromide with close to 100% oxygen yield at the end of the experiments. The water displacement technique was applied for a series of experiments with different catalyst-to-solution volume ratios and with different electrolyte additives including dichromate, phosphate buffer and borate buffer, as summarized in Table 3.
Data availability
The authors declare that the data supporting the findings of this study are available within the paper and its Supplementary Information files.
References
Vogel, A., Jeffery, G. H., Bassett, J., Mendham, J. & Denney, R. C. Vogel’s Textbook of Quantitative Chemical Analysis 5th edn, 406 (Longman Scientific & Technical, 1989).
Asakai, T. & Hioki, A. Potassium bromate assay by primary methods through iodine liberation reaction. Anal. Methods 5, 6240-6245 (2013).
Walker, M., Zhang, Y., Heaven, S. & Banks, C. Potential errors in the quantitative evaluation of biogas production in anaerobic digestion processes. Bioresour. Technol. 100, 6339-6346 (2009).
El Asri, O., Mahaouch, M. & Afilal, M. E. The evaluation and the development of three devices for measurement of biogas production. Phys. Chem. News 75, 75-85 (2015).
Brack, P., Dann, S., Upul Wijayantha, K. G., Adcock, P. & Foster, S. A simple, low-cost, and robust system to measure the volume of hydrogen evolved by chemical reactions with aqueous solutions. J. Vis. Exp. 2016, e54383 (2016).
Acknowledgements
This research was supported by the Ministry of Innovation, Science and Technology, Israel (grant no. 1001577992) and by the KKL-JNF Climate and KKL-JNF Climate Solution Prize. A.R. acknowledges the support of the Israel National Institute for Energy Storage (INIES), of the Nancy and Stephen Grand Technion Energy Program and of the L. Shirley Tark Chair in Science.
Author contributions
A.R. conceived the idea and initiated and supervised the research. I.S. identified the bromide/bromate couple as a leading SRC candidate, and identified the cathode coating approach for membraneless water splitting. I.S. selected the active materials, synthesized the
Adams catalyst and performed the faradaic efficiency measurements and catalytic oxygen evolution measurements. E.D. performed the materials characterizations of the catalyst and electrodes. E.D. and I.S. designed and performed the short-term electrolysis tests. E.D., M.S. and A.B. designed and performed the long-term stability tests and faradaic efficiency measurements. A.B. designed and performed the ion chromatography tests. I.S. performed the data analysis for the catalytic oxygen evolution measurements. I.S. and E.D. performed the data analysis of the short-term electrolysis tests, and E.D., M.S. and A.B., that of the long-term stability tests. I.S. and E.D. wrote the first draught of the manuscript. All authors contributed to the scientific discussion and editing of the Article.
Competing interests
A.R. is one of the cofounders of Pro, a start-up company that develops new technology for green hydrogen production.
Extended Data Fig. 1| Long term electrolysis stability. A photograph of the measurement setup.
Extended Data Fig. 2 | Long term electrolysis stability. Results showing the bromide ( ) concentration during five days of continuous electrolysis of 300 ml aqueous solution of 1.5 M NaBr (initial composition) with 0.3 M borate
buffer and , at a current of 300 mA , temperature of , and stirring rate of 400 rpm . The data points present ion chromatography measurements of two duplicate samples.
Extended Data Fig. 3 | Long term electrolysis stability. Results showing the bromate ( ) concentration during five days of continuous electrolysis of 300 ml aqueous solution of 1.5 M NaBr (initial composition) with 0.3 M borate
buffer and , at a current of 300 mA , temperature of , and stirring rate of 400 rpm . The data points present ion chromatography (blue) and iodometric titration (red) of two duplicate samples.
Extended Data Fig. 4 | Chronopotentiometry measurements at different current densities in NaBr electrolyte without a buffer. Electrolyte composition: 1.5 M NaBr with . The electrolyte was heated to
and stirred at a rate of 400 rpm . The current densities are indicated by the labels in the figures (in units of ). The voltage is presented without correction.
Extended Data Fig. 5| Chronopotentiometry measurements at different current densities in NaBr electrolyte with a borate buffer. Electrolyte composition: borate buffer, . The electrolyte
Extended Data Fig. 6 | Bromide electrolysis stability. The voltage (IR corrected) as a function of time during prolonged galvanostatic measurements at a current of 600 mA in 1.5 M NaBr electrolyte with (red curve) or without (all other curves) measured at (blue, red and orange curves) or at room temperature (purple and green curves) with (all curves expect for the purple curve) or without stirring (purple curve). Pristine Pt foil or coil (at or room
temperature, RT , respectively) cathode and DSA anode were used in the measurements, except for the one presented by the orange curve where a pre-coated Pt foil cathode from previous electrolysis tests was used. The voltage drift in the red curve results from changes in the electrolyte composition due to conversion of bromide to bromate during the measurement.
Extended Data Fig. XRD of the Adams catalyst. X-ray diffraction diffractogram on the Adams catalyst, with reference to the JCPDS profile of the rutile phase.
Extended Data Fig. 8|SEM micrograph of the Adams catalyst.
Extended Data Fig. 9 | TEM micrograph of the Adams catalyst.
Extended Data Fig. 10 | Catalytic conversion of 1 M bromate solution obtained by bromide electrolysis. The solid black curve presents the evolved volume of oxygen due to bromate decomposition, and the dashed blue curve presents the oxygen evolution rate.
Department of Materials Science and Engineering, Technion – Israel Institute of Technology, Haifa, Israel. The Nancy and Stephen Grand Technion Energy Program (GTEP), Technion – Israel Institute of Technology, Haifa, Israel. The Stewart and Lynda Resnick Sustainability Center for Catalysis (RSCC), Technion – Israel Institute of Technology, Haifa, Israel. These authors contributed equally: Ilya Slobodkin, Elena Davydova. e-mail: avnerrot@technion.ac.il