DOI: https://doi.org/10.1007/s11356-024-31860-x
PMID: https://pubmed.ncbi.nlm.nih.gov/38200188
تاريخ النشر: 2024-01-10
دور التقنيات البيئية وجودة المؤسسات والعولمة على الاستدامة البيئية في دول الاتحاد الأوروبي: أدلة جديدة من تقديرات بيانات اللوحة المتقدمة
© المؤلف(ون) 2024
الملخص
تزيد عوامل مثل الاستثمارات في التقنيات النظيفة بيئيًا، والعولمة، وجودة المؤسسات بشكل كبير من جودة البيئة. تهدف الدراسة إلى تسليط الضوء على كيفية تأثير التقنيات البيئية وجودة المؤسسات والعولمة والنمو الاقتصادي على بيئة مستدامة. بالإضافة إلى ذلك، تقيم هذه الدراسة هدف الاتحاد الأوروبي للوصول إلى صفر انبعاثات كربونية بحلول عام 2050 ونتائج تحقيق الحياد الكربوني بحلول عام 2030، الذي تم وضعه على جدول الأعمال في مؤتمر الأمم المتحدة لتغير المناخ للأطراف (COP-26). لهذا الغرض، تم اختيار عشرة دول (ألمانيا، النمسا، الدنمارك، فنلندا، فرنسا، هولندا، إسبانيا، إيطاليا، السويد، وسويسرا) التي تستثمر في أعلى تقنيات بيئية في الاتحاد الأوروبي. نطاق بيانات الدراسة هو من 1990 إلى 2019. كما تم التحقيق في صلاحية فرضية منحنى القدرة الاستيعابية (LCC) في هذه الدول. تم استخدام مقدرات CCEMG وDCCE لتقدير المعاملات طويلة الأجل. عند تقييم اللوحة ككل، تم تحديد أن فرضية LCC صالحة من قبل كلا المقدرين. وفقًا للنتائج المستندة إلى الدول، تم تحديد أن فرضية LCC صالحة فقط لإسبانيا. تتضمن الدراسة أيضًا الملاحظات التالية. (i) تزيد التقنيات البيئية من LCF للنمسا، مما يحسن جودة البيئة. (ii) تقلل العولمة من LCF للنمسا. (iii) تقلل متغير جودة المؤسسات من LCF للنمسا وتزيد من LCF لألمانيا وفرنسا. تشير هذه النتائج إلى أنه لتحقيق بيئة مستدامة في المستقبل، يجب على صانعي السياسات زيادة ميزانيات البحث والتطوير لتقنية البيئة، وتعزيز معايير المؤسسات، وأخذ العولمة في الاعتبار.
المقدمة
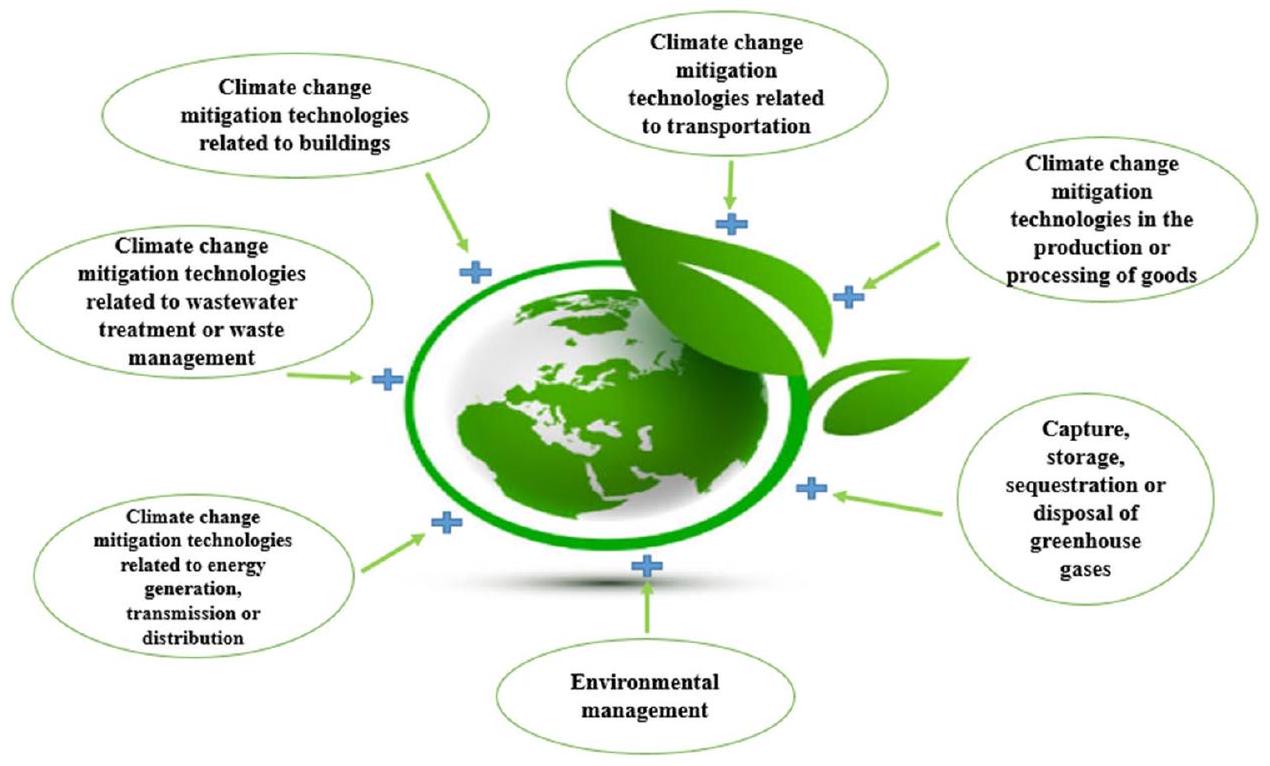
دعم شعبي واسع. بالطبع، يؤثر هذا على الاستدامة البيئية (Pata et al. 2023b). تلعب التقنيات البيئية التي تم تطويرها بشكل رئيسي في بناء المباني وأنشطة النقل العام دورًا رئيسيًا في منع التلوث البيئي من خلال التقاط وتخزين والتخلص من غازات الدفيئة، وتوليد الطاقة، ونقلها وتوزيعها. وبالمثل، تقدم الابتكارات التكنولوجية وإدارة البيئة في معالجة مياه الصرف الصحي وإدارة النفايات بيئة أكثر قابلية للعيش (OECD 2023). يوضح الشكل 1 محتوى التقنيات البيئية.
على الوجود البشري من حيث أبعاده الاجتماعية والاقتصادية والبيئية (Shahbaz et al. 2015؛ Aydin et al. 2023). على الرغم من أنه من الصعب إعطاء تعريف مرضٍ للعولمة، إلا أنها تُعرف عمومًا على النحو التالي: يتم التعبير عنها على أنها تسهيل بناء المؤسسات على المستويات الدولية والوطنية والإقليمية والمحلية وتفاعل العمليات الاجتماعية والسياسية والتكنولوجية والتجارية والاقتصادية والمالية والبيئية (Rennen وMartens 2003). هناك آراء حول تقليل أو زيادة التلوث البيئي الناتج عن العولمة. أولئك الذين يجادلون بأن العولمة تسبب التلوث البيئي (Shahbaz et al. 2019) يذكرون أن تحرير التجارة سيزداد مع العولمة، مما سيسبب التلوث البيئي (Damania et al. 2003). بعبارة أخرى، بينما تعزز العولمة التقدم الاقتصادي، فإنها تسرع من فقدان الموارد الطبيعية في العديد من الدول النامية ذات اللوائح البيئية الضعيفة (Cole 2006؛ Copeland وTaylor 2004). علاوة على ذلك، أدت الضغوط البيئية المتزايدة الناتجة عن العولمة إلى تغييرات في النظام البيئي، والنفايات البيئية، وفقدان التنوع البيولوجي، والتلوث (Panayotou 2000). من ناحية أخرى، أولئك الذين يجادلون بأن العولمة تحسن جودة البيئة قد ذكروا أنهم سيستخدمون تقنيات أكثر صداقة للبيئة لا تسبب التلوث البيئي مع وصول الدول إلى مستويات أعلى من النمو الاقتصادي (Stern 2004). وهذا يزيد من جودة البيئة.
إذا كان هذا العامل يظهر قيمة أقل من 1، فهذا يعني أن الوضع البيئي غير مستدام. تشير القيمة الأكبر من 1 إلى أن القدرة البيئية أكبر من ECOF. وهذا يعني أن الموارد الطبيعية يمكن أن تمتص الضغط البشري وتظهر استدامة بيئية. تمثل LCF التي تساوي 1 حد الاستدامة البيئية (باتا وآخرون 2023ب). LCF هي أداة أكثر شمولاً من انبعاثات الكربون وECOF. لذلك، فإنها تقدم مساهمة أكثر اكتمالاً وشمولاً مقارنةً بالأبحاث البيئية السابقة (أووسوسي وآخرون 2022أ). في نظرية LCF، يعمل تطبيق EKC كآلية عكسية وفقًا لثاني أكسيد الكربون وECOF. وذلك لأن LCF تمثل الجودة البيئية. يجب أن تكون مرونة الإيرادات على المدى الطويل أعلى من المدى القصير لتكون صالحة (باتا وآخرون 2023أ).

الجودة، العلاقة بين التقنيات البيئية، العولمة، جودة المؤسسات، وتدهور البيئة هي الدراسة الأولى للدول المختارة في الاتحاد الأوروبي. (ii) كمية الأدبيات التي تم فيها فحص عامل القدرة الاستيعابية ضمن إطار فرضية LCC محدودة للغاية. (iii) كيف يؤثر انتشار وتطوير التقنيات الصديقة للبيئة على البيئة في دول الاتحاد الأوروبي؟ تستكشف الدراسة كيف تؤثر التكنولوجيا الصديقة للبيئة على جودة البيئة على المدى الطويل كما تحددها LCF لتقديم حل لهذه القضية. يتم فحص تأثير جودة المؤسسات، والنمو الاقتصادي، والعولمة على LCF لأفضل عشرة دول في الاتحاد الأوروبي تستثمر في التكنولوجيا البيئية في هذا السياق. في هذه المرحلة، تعتبر هذه الدراسة الأولى التي تفحص تأثير المتغيرات التي تتفاعل وتشكل قوة جماعية لبعضها البعض على الاستدامة البيئية. (iv) فرضت الوثائق والإعلانات الدولية مثل برنامج الأمم المتحدة للبيئة، اتفاقية باريس للمناخ، UNFCCC، وFit for 55 التزامًا على دول الاتحاد الأوروبي للاستثمار في التقنيات البيئية. بالنظر إلى كل هذه الالتزامات، تم اختيار هذه المجموعة من الدول للحصول على نتائج أكثر كفاءة. في الوقت نفسه، لم يتم النظر في دول الاتحاد الأوروبي الأخرى بسبب قيود البيانات. من خلال النظر في هذه الدول، تم إجراء استنتاجات سياسية لجميع دول الاتحاد الأوروبي. (v) بالإضافة إلى ذلك، فإن النهج الاقتصادي الجديد المستخدم في الدراسة ينتج نتائج موثوقة، و(vi) تسفر هذه الدراسة عن توصيات سياسية مثمرة لدول الاتحاد الأوروبي المختارة بشأن العلاقة بين التقنيات البيئية، العولمة، جودة المؤسسات، والقدرة الاستيعابية للنمو الاقتصادي.

مراجعة الأدبيات
علاقة التقنيات البيئية و LCF
علاقة العولمة و LCF
(2022) البيانات التي تغطي 1990 و2017 في دراستهم عن دول البريكس. نتيجة للدراسة، تقلل العولمة بشكل كبير من ECOF. أشار مؤيدو الرأي الثاني إلى أن العولمة تزيد من التلوث البيئي. في هذا الرأي، بحث شهباز وآخرون (2018) في تأثير العولمة على انبعاثات CO2 في اليابان من 1971 إلى 2014. وفقًا للنتائج، تم الإشارة إلى أن العولمة أثرت سلبًا على البيئة في اليابان. استخدم شريف وآخرون (2022) تحليل ARDL المعزز عبر الأقسام مع البيانات التي تغطي 1995-2019 لدول مجموعة السبع. أثبتت العولمة الاجتماعية أن لها تأثيرًا إيجابيًا على انبعاثات الكربون. بالإضافة إلى هذين الرأيين، تظهر بعض الدراسات أن تأثير العولمة على التلوث البيئي محايد. في هذا الصدد، تم فحص العلاقة بين العولمة و ECOF في ماليزيا في الفترة من 1971 إلى 2014. في الدراسة، تم إجراء اختبار التكامل المشترك لبير وهنك، وتم تحديد التكامل المشترك. أظهرت النتائج أن العولمة ليست محددًا أساسيًا لـ ECOF (أحمد وآخرون 2019).
علاقة جودة المؤسسات و LCF
في مجموعة من ثلاث دول شرق آسيوية (إندونيسيا وكوريا الجنوبية وتايلاند) مع بيانات من 1990 إلى 2016. وفقًا لنتائج اختبار التكامل المشترك، هناك علاقة إيجابية وذات دلالة بين جودة المؤسسات وانبعاثات الكربون. خلص علي وآخرون (2019) إلى أن جودة المؤسسات، بما في ذلك جودة البيروقراطية، ونظام القانون، ومؤشرات مكافحة الفساد، تقلل من انبعاثات ثاني أكسيد الكربون في 47 دولة نامية. بالنسبة لـ 47 سوقًا ناشئة واقتصادات ناشئة (EMDEs)، التي ناقشها لي وأوزتورك (2020)، تم استخدام اختبارات جذر الوحدة CADF وCIPS في بيانات اللوحة بين 1990 و2014. تظهر نتائج الدراسة أن جودة الإنفاق الحكومي في اقتصادات الأسواق الناشئة تزيد من انبعاثات ثاني أكسيد الكربون من خلال زيادة الأنشطة الاقتصادية. باستخدام بيانات من 1984 إلى 2016، استخدم حسن وآخرون (2020) نموذج الانحدار الذاتي الموزع (ARDL) لباكستان. تشير نتائج الدراسة إلى أن جودة المؤسسات في باكستان تساهم في ارتفاع انبعاثات ثاني أكسيد الكربون. يفحص ني وآخرون (2022) أهمية جودة المؤسسات في تحسين LCF للاقتصادات ذات الاستهلاك العالي للموارد مع بيانات من 1996 إلى 2019. تثبت النتائج طويلة الأجل في الدراسة أن جودة المؤسسات تحسن LCF.
علاقة النمو الاقتصادي و LCF
| المتغيرات | وصف | مصدر |
| عامل سعة التحميل (lcf) | القدرة البيولوجية/البصمة البيئية (الهكتارات العالمية لكل شخص) | شبكة البصمة العالمية |
| التقنيات البيئية (ET) | براءات الاختراع في تكنولوجيا البيئة (النسبة المئوية) | منظمة التعاون والتنمية الاقتصادية |
| العولمة (جلوب) | مؤشر KOF | دريهر، أكسل (2006) |
| جودة المؤسسات (iq) | مؤشر جودة الحكومة (مؤشر ICRG) | قاعدة بيانات كنوما |
| النمو الاقتصادي (الناتج المحلي الإجمالي) | الناتج المحلي الإجمالي للفرد (بالدولار الأمريكي الثابت لعام 2015) | مؤشر التنمية العالمية |

البيانات والنموذج
| المتغيرات |
|
|
قرص مضغوط |
| lnlcf | 326.2330* | 29.64456* | 11.19457* |
| lngdp | 1130.718* | ١١٤.٤٤٤٨* | 33.35050* |
| lngdp2 | 1129.460* | 114.3121* | 33.32607* |
| إنترنت | 876.9107* | 87.69109* | ٢٩.٠٨٨٦٠* |
| lnglob | 1292.048* | 131.4504* | 35.94209* |
| ذكاء | 478.5802* | 45.70336* | 16.93535* |
| نموذج | ٣٨٠.١٠٩٤* | 35.32363* | 8.933454* |
| تجانس الميل | إحصائيات الاختبار |
|
|
|
|
7.815* | 0.000 | |
|
|
8.882* | 0.000 |
- يدل على رفض الفرضية الصفرية عند مستوى دلالة 1%
أينهو مصطلح الخطأ. استخدمنا الأشكال اللوغاريتمية لجميع المتغيرات باستثناء جودة المؤسسات. تفسر فرضية LCC العلاقة على شكل U بين lngdp و lnlcf. إذا كانت lngdp و lngdp2 ذات دلالة إحصائية وسلبية وإيجابية على التوالي، فإن فرضية LCC تكون صالحة. وبناءً عليه، فإن lngdp يقلل من lnlcf حتى قيمة العتبة، ويزيد من lnlcf عندما يتم تجاوز هذه القيمة.
المنهجية والنتائج التجريبية
تم استخدام هذه الاختبارات لاختبار اعتماد المقطع العرضي. هذه الاختبارات هي CDLM1 و CDLM2 و CD، التي طورها بيساران (2021) وبريوش وباجان (1980). يتم التحقيق في تجانس ميلان النموذج 1 باستخدام اختبارات دلتا التي اقترحها بيساران وياماغاتا (2008). يقدم الجدول 2 نتائج هذه الاختبارات. وفقًا للنتائج، هناك اعتماد مقطع عرضي مشترك وتباين لكل من المتغيرات والنموذج 1.
| المتغيرات | مستوى | الفرق الأول |
| lnlcf | -0.3681 (0.3564) | -2.3142 (0.0103)** |
| lngdp | 0.8686 (0.8075) | -1.8149 (0.0348)** |
| lngdp2 | 0.8962 (0.8149) | -1.8696 (0.0308)** |
| إنترنت | -0.6297 (0.2645) | -3.4358 (0.003)* |
| lnglob | 0.9071 (0.8178) | -2.1382 (0.0162)** |
| ذكاء | -0.3787 (0.3524) | -1.4221 (0.0775)*** |
| اختبارات | إحصاء الاختبار |
|
| ويسترلوند وإدجيرتون (2008) | ||
| تاو_ن |
|
0.007 |
| في ن |
|
0.002 |
- يدل على رفض الفرضية الصفرية عند
مستوى الدلالة
بعد هذه الخطوة، قمنا بتقدير معاملات المدى الطويل للنموذج 1 لكامل اللوحة ولكل دولة. لهذا الغرض، استخدمنا مقدرين: مقدر متوسط المجموعة ذو التأثيرات المشتركة المرتبطة (CCEMG) من تأليف بيساران (2006) ومقدر التأثيرات المشتركة الديناميكية المرتبطة (DCCE) من تأليف تشوديك وبيساران (2015). تم الإبلاغ عن نتائج تقدير اللوحة في الجدول 5.
الخاتمة وتوصيات السياسة
| المتغيرات | CCEMG | DCCE | ||
| معامل |
|
معامل |
|
|
| lngdp | -35.440* | 0.000 | -53.654* | 0.002 |
| lngdp2 | 1.699* | 0.000 | 2.484* | 0.002 |
| lnet | 0.010 | 0.850 | 0.019 | 0.850 |
| lnglob | -1.413*** | 0.061 | -1.052 | 0.435 |
| ذكاء | 0.021 | 0.953 | -0.209 | 0.670 |
| دول | lngdp | lngdp2 | lnet | lnglob | ذكاء |
| النمسا | -18.2838 | 0.78292 | 0.215214* | -5.27879* | -2.68844* |
| ألمانيا | -25.6547 | 1.141215 | -0.28871 | -0.02498 | 1.11414*** |
| فرنسا | -120.449 | 5.729732 | 0.132487 | 0.465173 | 0.89860*** |
| إيطاليا | -501.033 | ٢٤.٠٧٦٥٩ | 0.906414 | -5.5227 | -0.83149 |
| إسبانيا | -444.22** | 21.49279** | -0.25112 | -3.32529 | 0.620017 |
| الدنمارك | 17.4913 | -0.67771 | -0.04841 | -3.33865 | -1.63045 |
| فنلندا | -33.5538 | 1.370919 | -0.12113 | -4.54479 | -2.37424 |
| هولندا | -68.1796 | ٣.٢٣٨٠٦٨ | -0.05856 | -2.10508 | -4.54296 |
| السويد | -161.035 | 7.54184 | 0.723194 | ٣.٤٣٣٣٩٣ | -1.27074 |
| سويسرا | -34.2695 | 1.432628 | 0.10979 | -0.56306 | 0.007564 |
التقنيات القديمة. من خلال تقديم حوافز خاصة للمستثمرين الأجانب، يمكن تشجيعهم على استخدام تكنولوجيا أنظف تأخذ في الاعتبار البيئة. قد تعزز وسائل الإعلام الوطنية الوعي البيئي، ويجب تعزيز شبكة الاتصال الاجتماعي مع الدول الأخرى (شهباز وآخرون 2019). بعبارة أخرى، يجب على الحكومات أن تأخذ في اعتبارها العواقب البيئية للعولمة عند تصميم سياساتها. في هذا السياق، قد تحتاج الحكومات إلى وضع معايير انبعاثات. في هذا السياق، يمكنها اتخاذ تدابير متنوعة من خلال نظام تجارة الانبعاثات (ETS) وآلية تنظيم الكربون على الحدود (CCRM). يجب على الاتحاد الأوروبي منع تسرب الكربون لجعل سياسته المناخية أكثر فعالية. نتيجةً لهذه الآلية التي ستطبق على الواردات، يتم إنشاء مصدر دخل. وبالتالي، سيتم تحفيز الدول الثالثة على تنسيق السياسات الخضراء وتقليل الانبعاثات. بالإضافة إلى مراقبة وتقليل واردات السلع ذات البصمة الكربونية العالية، ستقوم الحكومات بتطوير سياسات تسعير الكربون لمكافحة تغير المناخ. ستضمن تطوير السياسات بما يتماشى مع منظمة التجارة العالمية وأنظمة دولية أخرى الامتثال لقواعد ETS وCCRM في استيراد المنتجات ذات المنشأ من الدول الثالثة إلى الاتحاد الأوروبي (المفوضية الأوروبية (EC) 2021؛ أيدين وديغرمينجي 2023). يمكن فرض عقوبات على الشركات التي تقلل من جودة البيئة من خلال تجاهل هذه المعايير. يمكن أن تكون هذه العقوبات ضرائب كربونية، وحقوق ملوثات، وائتمانات تلوث. تمتلك مثل هذه السياسات القدرة على تحسين جودة البيئة بالإضافة إلى زيادة النمو الاقتصادي.
لصانعي السياسات فرض قوانين حماية البيئة وربما جعل كل مواطن يفهمها. بهذه الطريقة، سيتم استبدال المؤسسات ذات الجودة المؤسسية الضعيفة بمؤسسات ذات جودة مؤسسية قوية. على العكس من ذلك، تزيد جودة المؤسسات من LCF في ألمانيا وفرنسا. يظهر أن القوانين البيئية وقوانين التجارة مطبقة في هذين البلدين. تمتلك هذه الدول ستة مؤشرات – الاستقرار السياسي، جودة التنظيم، فعالية الحكومة، سيادة القانون، المساءلة، ومكافحة الفساد – مما يساهم في تحسين جودة البيئة. بالإضافة إلى ذلك، تتمتع هذه الدول بمستويات منخفضة نسبيًا من السلوكيات، بما في ذلك الضغط، والبحث عن الريع، والرشوة، والمحسوبية. تساهم المستويات المنخفضة من هذه الأنشطة في تقليل تلوث البيئة في البلدان.
بدعم قوي من الجمهور، خاصة في المنطقة الأوروبية. ستزداد جودة البيئة مع توسع وتطور التكنولوجيا الصديقة للبيئة. أخيرًا، يعزز الاتحاد الأوروبي بشكل غير مباشر الاستثمارات في التكنولوجيا الصديقة للبيئة لتحقيق أهداف الصفقة الخضراء الأوروبية مع خطط وبرامج مثل هورايزون أوروبا والجيل التالي من الاتحاد الأوروبي بالتزامن مع اتفاقية باريس للمناخ ومشاريع “Fit for 55”. بالإضافة إلى ذلك، يجب تشجيع المؤسسات والباحثين من قبل صانعي السياسات على استخدام التقنيات الصديقة للبيئة. يمكن أن تأخذ هذه الحوافز شكل إعفاءات ضريبية ودعم مالي. وفقًا للنتائج التي تم الحصول عليها، يجب على صانعي السياسات التركيز على تحسين الأثر البيئي للتقنيات البيئية لتعزيز واستدامة الاستدامة البيئية. نظرًا لتسارع وتيرة القضايا البيئية مثل الازدحام، والاستهلاك المفرط، وتغير المناخ، والأسواق العالمية الجديدة، أصبح الاستثمار في هذه التقنيات البيئية أمرًا ضروريًا. لذلك، تحتاج البلدان إلى إعادة النظر في جميع أنواع سياسات الاستثمار التكنولوجي. سيساعد دمج السياسات البيئية في تشجيع إنشاء هياكل تكنولوجية أكثر وعيًا تتحكم في المخاطر والشكوك مع التطورات الناشئة في التكنولوجيا البيئية.
إعلانات
الموافقة على النشر غير قابلة للتطبيق.
تضارب المصالح يعلن المؤلفون عدم وجود مصالح متنافسة.
References
Adebayo TS, AbdulKareem HK, Kirikkaleli D, Shah MI, Abbas S (2022b) CO2 behavior amidst the COVID-19 pandemic in the United Kingdom: the role of renewable and non-renewable energy development. Renew Energ 189:492-501
Adebayo TS, Oladipupo SD, Adeshola I, Rjoub H (2022a) Wavelet analysis of the impact of renewable energy consumption and technological innovation on CO2 emissions: evidence from Portugal. Environ Sci Pollut Res 29(16):23887-23904
Ahmad M, Shabir M, Naheed R, Shehzad K (2022) How do environmental innovations and energy productivity affect the environment? Analyzing the role of economic globalization. Int J Environ Sci Technol 19(8):7527-7538
Ahmed Z, Ahmad M, Rjoub H, Kalugina OA, Hussain N (2022) Economic growth, renewable energy consumption, and ecological footprint: exploring the role of environmental regulations and democracy in sustainable development. Sustain Dev 30(4):595-605
Ahmed Z, Wang Z, Mahmood F, Hafeez M, Ali N (2019) Does globalization increase the ecological footprint? Empirical evidence from Malaysia. Environ Sci Pollut Res 26:18565-18582
Akadiri SS, Adebayo TS, Riti JS, Awosusi AA, Inusa EM (2022) The effect of financial globalization and natural resource rent on load capacity factor in India: an analysis using the dual adjustment approach. Environ Sci Pollut Res 29(59):89045-89062
Akinsola GD, Awosusi AA, Kirikkaleli D, Umarbeyli S, Adeshola I, Adebayo TS (2022) Ecological footprint, public-private partnership investment in energy, and financial development in Brazil: a gradual shift causality approach. Environ Sci Pollut Res 29(7):10077-10090
Ali HS, Zeqiraj V, Lin WL, Law SH, Yusop Z, Bare UAA, Chin L (2019) Does quality institutions promote environmental quality? Environ Sci Pollut Res 26:10446-10456
Amegavi GB, Langnel Z, Ahenkan A, Buabeng T (2022) The dynamic relationship between economic globalisation, institutional quality, and ecological footprint: evidence from Ghana. J Int Trade Econ Dev 31(6):876-893
Apergis N, Degirmenci T, Aydin M (2023) Renewable and nonrenewable energy consumption, energy technology investment, green technological innovation, and environmental sustainability inthe United States: testing the EKC and LCC hypotheses with novel Fourier estimation. Environ Sci Pollut Res 30:125570125584. https://doi.org/10.1007/s11356-023-30901-1
economies: policy towards environmental sustainability. Int J Sustain Dev World Ecol 29(7):593-610
Awosusi AA, Kutlay K, Altuntaş M, Khodjiev B, Agyekum EB, Shouran M, Kamel S (2022a) A roadmap toward achieving sustainable environment: evaluating the impact of technological innovation and globalization on load capacity factor. Int J Environ Res Public Health 19(6):3288
Aydin M, Bozatli O (2022) Do transport taxes reduce air pollution in the top 10 countries with the highest transport tax revenues? A country-specific panel data analysis. Environ Sci Pollut Res 29:54181-54192. https://doi.org/10.1007/s11356-022-19651-8
Aydin M, Degirmenci T (2023) The impact of clean energy consumption, green innovation, and technological diffusion on environmental sustainability: new evidence from load capacity curve hypothesis for 10 European Union countries. Sustain Dev. https://doi.org/10.1002/sd. 2794
Aydin M, Degirmenci T, Yavuz H (2023) The influence of multifactor productivity, research and development expenditure, renewable energy consumption on ecological footprint in G7 countries: testing the Environmental Kuznets Curve Hypothesis. Environ Model Assess 28:693-708. https://doi.org/10.1007/ s10666-023-09879-0
Aydin M, Degirmenci T, Gurdal T, Yavuz H (2023a) The role of green innovation in achieving environmental sustainability in European Union countries: testing the environmental Kuznets curve hypothesis. Gondw Res 118:105-116
Aydin M, Sogut Y, Altundemir ME (2023b) Moving toward the sustainable environment of European Union countries: investigating the effect of natural resources and green budgeting on environmental quality. Resour Policy 83:103737
Aydin M, Koc P, Tumay M (2023c) Investigating the environmental Kuznets curve hypothesis with recovered paper consumption, human development index, urbanization, and forest footprint. Int J Environ Sci Technol: 1-12
Bashir MF, Ma B, Shahbaz M, Jiao Z (2020) The nexus between environmental tax and carbon emissions with the roles of environmental technology and financial development. PloS One 15(11):e0242412
Borozan D (2022) Revealing the complexity in the environmental Kuznets curve set in a European multivariate framework. Environ Dev Sustain 24(7):9165-9184
Breitung J (2001) The local power of some unit root tests for panel data. In: Baltagi BH, Fomby TB, Carter Hill R (eds) Nonstationary panels, anel cointegration, and dynamic panels (Advances in Econometrics), vol 15. Emerald Group Publishing Limited, Leeds, pp 161-177. https://doi.org/10.1016/S0731-9053(00) 15006-6
Breitung J, Das S (2005) Panel unit root tests under cross-sectional dependence. Stat Neerl 59(4):414-433
Breusch TS, Pagan AR (1980) The Lagrange multiplier test and its applications to model specification in econometrics. Rev Econ Stud 47(1):239-253
Chudik A, Pesaran MH (2015) Common correlated effects estimation of heterogeneous dynamic panel data models with weakly exogenous regressors. J Econom 188(2):393-420
Cole MA (2006) Does trade liberalization increase national energy use? Econ Lett 92(1):108-112
Copeland BR, Taylor MS (2004) Trade, growth, and the environment. J Econ Lit 42(1):7-71
Damania R, Fredriksson PG, List JA (2003) Trade liberalization, corruption, and environmental policy formation: theory and evidence. J Environ Econ Manage 46(3):490-512
Degirmencioglu Aydin N, Aydin M (2023) An environmental impact assessment of major economic sectors in Turkey: economics and law perspective. J Knowl Econ. https://doi.org/10.1007/ s13132-023-01400-y
Destek MA, Sinha A (2020) Renewable, non-renewable energy consumption, economic growth, trade openness and ecological footprint: evidence from organisation for economic co-operation and development countries. J Clean Prod 242:118537
Dong K, Sun R, Hochman G, Zeng X, Li H, Jiang H (2017) Impact of natural gas consumption on CO2 emissions: panel data evidence from China’s provinces. J Clean Prod 162:400-410
Erdogan S (2023) Linking natural resources and environmental sustainability: a panel data approach based on the load capacity curve hypothesis. Sustainable Development. https://doi.org/10. 1002/sd. 2836
Erdogan S (2024) On the impact of natural resources on environmental sustainability in African countries: a comparative approach based on the EKC and LCC hypotheses. Resour Policy 88:104492
European Commission (EC) (2021)’Fit for 55′: delivering the EU’s 2030 climate target on the way to climate neutrality, Brussels. https://eur-lex.europa.eu/legalcontent/EN/TXT/PDF/?uri= CELEX:52021DC0550&from=EN. 04.12.2023
European Council (EC) (2023) https://www.consilium.europa.eu/en/ policies/green-deal/fit-for-55-the-eu-plan-for-a-green-transition/. 24.04.2023
Galli A (2015) On the rationale and policy usefulness of ecological footprint accounting: the case of Morocco. Environ Sci Policy 48:210-224
Grossman GM, Krueger AB (1991) Environmental impacts of a North American free trade agreement. Working Paper No. 3914. National Bureau of Economic Research, Cambridge
Hassan ST, Xia E, Khan NH, Shah SMA (2019) Economic growth, natural resources, and ecological footprints: evidence from Pakistan. Environ Sci Pollut Res 26:2929-2938
Huo W, Zaman BU, Zulfiqar M, Kocak E, Shehzad K (2023) How do environmental technologies affect environmental degradation? Analyzing the direct and indirect impact of financial innovations and economic globalization. Environ Technol Innov 29:102973
Hussain M, Dogan E (2021) The role of institutional quality and envi-ronment-related technologies in environmental degradation for BRICS. J Clean Prod 304:127059
Hussain M, Khan JA (2023) The nexus of environment-related technologies and consumption-based carbon emissions in top five emitters: empirical analysis through dynamic common correlated effects estimator. Environ Sci Pollut Res 30(10):25059-25068
Hussain M, Mir GM, Usman M, Ye C, Mansoor S (2022) Analysing the role of environment-related technologies and carbon emissions in emerging economies: a step towards sustainable development. Environ Technol 43(3):367-375
Jahanger A, Usman M, Murshed M, Mahmood H, Balsalobre-Lorente D (2022) The linkages between natural resources, human capital, globalization, economic growth, financial development, and ecological footprint: the moderating role of technological innovations. Resour Policy 76:102569
Kirikkaleli D, Adebayo TS, Khan Z, Ali S (2021) Does globalization matter for ecological footprint in Turkey? Evidence from dual adjustment approach. Environ Sci Pollut Res 28(11):14009-14017
Lau LS, Choong CK, Eng YK (2014) Carbon dioxide emission, institutional quality, and economic growth: empirical evidence in Malaysia. Renew Energy 68:276-281
Le HP, Ozturk I (2020) The impacts of globalization, financial development, government expenditures, and institutional quality on CO 2 emissions in the presence of environmental Kuznets curve. Environ Sci Pollut Res 27:22680-22697
Liu X, Olanrewaju VO, Agyekum EB, El-Naggar MF, Alrashed MM, Kamel S (2022) Determinants of load capacity factor in an emerging economy: the role of green energy consumption and technological innovation. Front Environ Sci 10:2071
Ni Z, Yang J, Razzaq A (2022) How do natural resources, digitalization, and institutional governance contribute to ecological sustainability through load capacity factors in highly resource-consuming economies? Resour Policy 79:103068
North DC, Institutions IC (1990) Economic performance, vol 3. Cambridge University Press, Cambridge
OECD (2023) Patents on environment technologies. https://doi.org/10. 1787/fff120f8-en. Accessed 20 Mar 2023
Panayotou T (1993) Empirical tests and policy analysis of environmental degradation at different stages of economic development. Technology and Employment Programme Working Paper of International Labour Office Geneva
Panayotou T (2000) Globalization and environment. CID Working Paper Series 2000. Harvard University, Cambridge, MA, p 53
Panayotou T (2003) Economic growth and the environment. Econ Surv Eur 2:45-72
Pata UK, Ertugrul HM (2023) Do the Kyoto Protocol, geopolitical risks, human capital and natural resources affect the sustainability limit? A new environmental approach based on the LCC hypothesis. Resour Policy 81:103352
Pata UK, Isik C (2021) Determinants of the load capacity factor in China: a novel dynamic ARDL approach for ecological footprint accounting. Resour Policy 74:102313
Pata UK, Samour A (2022) Do renewable and nuclear energy enhance environmental quality in France? A new EKC approach with the load capacity factor. Prog Nucl Energy 149:104249
Pata UK, Caglar AE, Kartal MT, Depren SK (2023b) Evaluation of the role of clean energy technologies, human capital, urbanization, and income on the environmental quality in the United States. J Clean Prod 402:136802
Pata UK, Kartal MT, Adebayo TS, Ullah S (2023a) Enhancing environmental quality in the United States by linking biomass energy consumption and load capacity factor. Geosci Front 14(3):101531
Pesaran MH (2006) Estimation and inference in large heterogeneous panels with a multifactor error structure. Econometrica 74(4):967-1012
Pesaran MH (2021) General diagnostic tests for cross-sectional dependence in panels. Empir Econ 60(1):13-50
Pesaran MH, Yamagata T (2008) Testing slope homogeneity in large panels. J Econom 142(1):50-93
Rennen W, Martens P (2003) The globalisation timeline. Integrated Assessment 4(3):137-144
Rothstein BO, Teorell JA (2008) What is quality of government? A theory of impartial government institutions. Governance 21(2):165-190
Salman M, Long X, Dauda L, Mensah CN (2019) The impact of institutional quality on economic growth and carbon emissions: evidence from Indonesia, South Korea and Thailand. J Clean Prod 241:118331
Sarkodie SA, Adams S (2018) Renewable energy, nuclear energy, and environmental pollution: accounting for political institutional quality in South Africa. Sci Total Environ 643:1590-1601
Shahbaz M, Mallick H, Mahalik MK, Loganathan N (2015) Does globalization impede environmental quality in India? Ecol Indic 52:379-393
Shahbaz M, Shahzad SJH, Mahalik MK (2018) Is globalization detrimental to CO 2 emissions in Japan? New threshold analysis. Environ Model Assess 23:557-568
Sharif A, Saqib N, Dong K, Khan SAR (2022) Nexus between green technology innovation, green financing, and CO2 emissions in the G7 countries: the moderating role of social globalisation. Sustain Dev 30(6):1934-1946
Siche R, Pereira L, Agostinho F, Ortega E (2010) Convergence of ecological footprint and emergy analysis as a sustainability indicator of countries: Peru as case study. Commun Nonlinear Sci Numer Simul 15(10):3182-3192
Sikora A (2021) European Green Deal-legal and financial challenges of the climate change. Era Forum 21(4):681-697
Solarin SA, Bello MO (2018) Persistence of policy shocks to an environmental degradation index: the case of ecological footprint in 128 developed and developing countries. Ecol Indic 89:35-44
Stern DI (2004) The rise and fall of the environmental Kuznets curve. World Dev 32(8):1419-1439
United Nations (n.d.) Sustainable Development Goals Report. https:// www.un.org/sustainabledevelopment/progress-report/. 12.06.2023
Wackernagel M, Rees W (1998) Our ecological footprint: reducing human impact on the earth, vol 9 . New society publishers
Wang Y, Zhang C, Lu A, Li L, He Y, ToJo J, Zhu X (2017) A disaggregated analysis of the environmental Kuznets curve for industrial CO2 emissions in China. Appl Energy 190:172-180
Westerlund J, Edgerton DL (2008) A simple test for cointegration in dependent panels with structural breaks. Oxf Bull Econ Stat 70(5):665-704
Zeng Q, Destek MA, Khan Z, Badeeb RA, Zhang C (2023) Green innovation, foreign investment and carbon emissions: a roadmap to sustainable development via green energy and energy efficiency for BRICS economies. Int J Sust Dev World Ecol. https://doi.org/ 10.1080/13504509.2023.2268569
- Responsible Editor: Ilhan Ozturk
Mucahit Aydin
aydinm@sakarya.edu.tr
Yasin Sogut
yasin.sogut1@ogr.sakarya.edu.tr
Azad Erdem
azad.erdem@ogr.sakarya.edu.tr
1 Faculty of Political Sciences, Department of Econometrics, Sakarya University, Esentepe Campus, Serdivan/Sakarya, Turkey
2 UNEC Research Methods Application Center, Azerbaijan State University of Economics (UNEC), Istiqlaliyyat Str. 6, Baku, Azerbaijan
3 Faculty of Political Sciences, Department of Public Finance, Sakarya University, Esentepe Campus, Serdivan/Sakarya, Turkey - Bold values indicate robust results that are significant for both estimators
- and *** denote rejection of the null hypothesis at
and levels of significance, respectively
- and *** denote rejection of the null hypothesis at
DOI: https://doi.org/10.1007/s11356-024-31860-x
PMID: https://pubmed.ncbi.nlm.nih.gov/38200188
Publication Date: 2024-01-10
The role of environmental technologies, institutional quality, and globalization on environmental sustainability in European Union countries: new evidence from advanced panel data estimations
© The Author(s) 2024
Abstract
Factors such as investments in environmentally clean technologies, globalization, and institutional quality significantly increase environmental quality. The study aims to provide light on how environmental technologies, institutional quality, globalization, and economic growth affect a sustainable environment. In addition, this study evaluates the European Union’s carbon zero target by 2050 and the results of achieving carbon neutrality by 2030, which was put on the agenda at the UN Climate Change Conference of the Parties (COP-26). For this purpose, ten countries (Germany, Austria, Denmark, Finland, France, Netherlands, Spain, Italy, Sweden, and Switzerland) that invest in the highest environmental technology in the European Union were selected in the study. The data range of the study is from 1990 to 2019. Also, the validity of the load capacity curve (LCC) hypothesis was investigated in these countries. The CCEMG and DCCE estimators were used to estimate long-run coefficients. When the panel was assessed as a whole, the LCC hypothesis was determined to be valid by both estimators. According to country-based results, it has been determined that the LCC hypothesis is valid only for Spain. The study also includes the following observations. (i) Environmental technologies increase LCF for Austria, improving environmental quality. (ii) Globalization reduces LCF for Austria. (iii) Institutional quality variable decreases LCF for Austria and increases LCF for Germany and France. These findings suggest that to attain a sustainable environment in the future, policymakers should raise research and development budgets for environmental technology, enhance the standards of institutions, and take globalization into account.
Introduction
widespread popular backing. Of course, this impacts environmental sustainability (Pata et al. 2023b). Environmental technologies developed mainly in building construction, and public transport activities increase environmental sustainability. Environmental technologies play a major role in preventing environmental pollution by capturing, storing, and disposing of greenhouse gases, energy generation, transmission, and distribution. Likewise, technological innovations and environmental management in wastewater treatment and waste management offer us a more livable environment (OECD 2023). Figure 1 shows the content of environmental technologies.
impacted human existence regarding its social, economic, and environmental dimensions (Shahbaz et al. 2015; Aydin et al. 2023). Although it is difficult to give a satisfactory definition of globalization, it is generally defined as follows: It is expressed as facilitating the building of institutions at the international, national, regional, and local levels and the interaction of social, political, technological, commercial, economic, financial, and ecological processes (Rennen and Martens 2003). There are views on reducing or increasing the environmental pollution of globalization. Those who argue that globalization causes environmental pollution (Shahbaz et al. 2019) state that trade liberalization will increase with globalization, which will cause environmental pollution (Damania et al. 2003). In other words, while globalization promotes economic progress, it hastens the loss of natural resources in many emerging countries with low environmental regulations (Cole 2006; Copeland and Taylor 2004). Furthermore, growing ecological pressures brought on by globalization have resulted in changes to the ecosystem, environmental waste, a loss of biodiversity, and pollution (Panayotou 2000). On the other hand, those who argue that globalization improves environmental quality have stated that they will use more environmentally friendly technologies that do not cause environmental pollution as countries reach higher levels of economic growth (Stern 2004). This increases the environmental quality.
this factor shows a value less than 1 , it means that the environmental situation is unsustainable. A value greater than 1 indicates that the biocapacity is greater than ECOF. This means that natural resources can absorb human pressure and show ecological sustainability. LCF equal to 1 represents the environmental sustainability limit (Pata et al. 2023b). LCF is a more comprehensive instrument than carbon emissions and ECOF. Therefore, it provides a more complete and comprehensive contribution compared to previous environmental research (Awosusi et al. 2022a). In the LCF theory, the application of EKC works as an inverse mechanism according to carbon dioxide and ECOF. This is because LCF stands for ecological quality. The long-run revenue elasticity must be higher than the short-run to be valid (Pata et al. 2023a).
quality, the relationship between environmental technologies, globalization, institutional quality, and environmental degradation is the first study for selected EU countries. (ii) The amount of literature in which the load capacity factor has been examined within the framework of the LCC hypothesis is quite limited. (iii) How does the spread and development of environmentally friendly technologies impact the environment in European Union countries? The investigation explores how environmentally friendly technology affects long-term environmental quality as determined by LCF to provide a solution to this topic. The influence of institutional quality, economic growth, and globalization on LCF for the top ten EU countries investing in environmental technology is examined in this context. At this point, it is the first study to examine the effect of variables that interact and form a collective force for each other on environmental sustainability. (iv) International documents and declarations such as the United Nations Environment Programme, Paris Climate Agreement, UNFCCC, and Fit for 55 have imposed an obligation on the European Union countries to invest in environmental technologies. Considering all these obligations, this country group has been selected to obtain more efficient results. At the same time, other EU countries were not considered due to data limitations. By considering these countries, policy inferences were made for all EU countries. (v) Additionally, the new econometric approach utilized in the study produces reliable results, and (vi) this study results in fruitful policy recommendations for selected EU countries regarding the relationship between environmental technologies, globalization, institutional quality, and load capacity of economic growth.
Literature review
Environmental technologies and LCF relationship
Globalization and LCF relationship
(2022) used the data covering 1990 and 2017 in their study of BRICS countries. As a result of the study, globalization significantly reduces ECOF. The advocates of the second view stated that globalization increases environmental pollution. In this view, Shahbaz et al. (2018) investigated the impact of globalization on CO2 emissions in Japan from 1971 to 2014. According to the findings, it was stated that globalization negatively affected the environment in Japan. Sharif et al. (2022) used cross-section augmented ARDL analysis with the data covering 1995-2019 for the G7 countries. Social globalization has proven to have a positive effect on carbon emissions. In addition to these two views, some studies show that the impact of globalization on environmental pollution is neutral. In this respect, the relationship between globalization and ECOF was examined for Malaysia in the period 1971-2014. In the study, Bayer and Hanck cointegration test was performed, and cointegration was determined. The results showed that globalization is not an essential determinant of ECOF (Ahmed et al. 2019).
Institutional quality and LCF relationship
in a panel of three East Asian countries (Indonesia, South Korea, and Thailand) with data from 1990 to 2016. According to the panel cointegration test result, there is a positive and significant relationship between institutional quality and carbon emissions. Ali et al. (2019) concluded that institutional quality, including bureaucratic quality, legal system, and corruption control indicators, reduces CO2 emissions in 47 developing countries. For 47 emerging markets and emerging economies (EMDEs), which Le and Ozturk (2020) discussed, CADF and CIPS unit root tests were used in panel data between 1990 and 2014. The results of the study show that the quality of government spending in emerging market economies increases CO2 emissions through increased economic activities. Using data from 1984 to 2016, Hassan et al. (2020) employed an autoregressive distributed lag model (ARDL) for Pakistan. The study’s findings indicate that institutional quality in Pakistan contributes to rising CO2 emissions. Ni et al. (2022) examine the importance of institutional quality in improving the LCF of high resourceconsuming economies with data from 1996 to 2019. Longterm results in the study prove that institutional quality improves LCF.
Economic growth and LCF relationship
| Variables | Description | Source |
| Load capacity factor (lcf) | Biocapacity/ecological footprint (global hectares per person) | Global Footprint Network |
| Environmental technologies (et) | Patents on environment technologies (percentage) | OECD |
| Globalization (glob) | KOF (index) | Dreher, Axel (2006) |
| Institutional quality (iq) | ICRG Indicator of Quality of Government (index) | Knoema Database |
| Economic growth (gdp) | GDP per capita (constant 2015 US$) | World Development Indicator |
Data and model
| Variables |
|
|
CD |
| lnlcf | 326.2330* | 29.64456* | 11.19457* |
| lngdp | 1130.718* | 114.4448* | 33.35050* |
| lngdp2 | 1129.460* | 114.3121* | 33.32607* |
| Inet | 876.9107* | 87.69109* | 29.08860* |
| lnglob | 1292.048* | 131.4504* | 35.94209* |
| iq | 478.5802* | 45.70336* | 16.93535* |
| Model | 380.1094* | 35.32363* | 8.933454* |
| Slope homogeneity | Test statistics |
|
|
|
|
7.815* | 0.000 | |
|
|
8.882* | 0.000 |
- denotes rejection of the null hypothesis at a 1% level of significance
whereis the error term. We used logarithmic forms of all variables except institutional quality. The LCC hypothesis explains the U-shaped relationship between lngdp and lnlcf. If lngdp and lngdp2 are statistically significant and negative and positive, respectively, the LCC hypothesis is valid. Accordingly, lngdp decreases the lnlcf until the threshold value, increasing the lnlcf when this threshold value is exceeded.
Methodology and empirical results
were used to test cross-section dependence. These tests are CDLM1, CDLM2, and CD, developed by Pesaran (2021) and Breusch and Pagan (1980). The homogeneity of Model 1 slopes is investigated using the Delta tests proposed by Pesaran and Yamagata (2008). Table 2 introduces these test results. According to the results, there is a CSD and heterogeneity of both variables and Model 1.
| Variables | Level | First difference |
| lnlcf | -0.3681 (0.3564) | -2.3142 (0.0103)** |
| lngdp | 0.8686 (0.8075) | -1.8149 (0.0348)** |
| lngdp2 | 0.8962 (0.8149) | -1.8696 (0.0308)** |
| Inet | -0.6297 (0.2645) | -3.4358 (0.003)* |
| lnglob | 0.9071 (0.8178) | -2.1382 (0.0162)** |
| iq | -0.3787 (0.3524) | -1.4221 (0.0775)*** |
| Tests | Test stat. |
|
| Westerlund and Edgerton (2008) | ||
| tau_n |
|
0.007 |
| phi_n |
|
0.002 |
- denotes rejection of the null hypothesis at a
level of significance
run. After this step, we estimated the long-run coefficients of Model 1 for the whole panel and each country. For this aim, we used two estimators: the common correlated effects mean group estimator (CCEMG) by Pesaran (2006) and the dynamic common correlated effects estimator (DCCE) by Chudik and Pesaran (2015). Panel estimation results are reported in Table 5.
Conclusion and policy recommendations
| Variables | CCEMG | DCCE | ||
| Coeff. |
|
Coeff. |
|
|
| lngdp | -35.440* | 0.000 | -53.654* | 0.002 |
| lngdp2 | 1.699* | 0.000 | 2.484* | 0.002 |
| lnet | 0.010 | 0.850 | 0.019 | 0.850 |
| lnglob | -1.413*** | 0.061 | -1.052 | 0.435 |
| iq | 0.021 | 0.953 | -0.209 | 0.670 |
| Countries | lngdp | lngdp2 | lnet | lnglob | iq |
| Austria | -18.2838 | 0.78292 | 0.215214* | -5.27879* | -2.68844* |
| Germany | -25.6547 | 1.141215 | -0.28871 | -0.02498 | 1.11414*** |
| France | -120.449 | 5.729732 | 0.132487 | 0.465173 | 0.89860*** |
| Italy | -501.033 | 24.07659 | 0.906414 | -5.5227 | -0.83149 |
| Spain | -444.22** | 21.49279** | -0.25112 | -3.32529 | 0.620017 |
| Denmark | 17.4913 | -0.67771 | -0.04841 | -3.33865 | -1.63045 |
| Finland | -33.5538 | 1.370919 | -0.12113 | -4.54479 | -2.37424 |
| Netherlands | -68.1796 | 3.238068 | -0.05856 | -2.10508 | -4.54296 |
| Sweden | -161.035 | 7.54184 | 0.723194 | 3.433393 | -1.27074 |
| Switzerland | -34.2695 | 1.432628 | 0.10979 | -0.56306 | 0.007564 |
old technologies. By offering special incentives to foreign investors, they can be encouraged to use cleaner technology that considers the environment. The national media may enhance environmental awareness, and the social contact network with other nations should be strengthened (Shahbaz et al. 2019). In other words, governments should consider globalization’s environmental consequences when designing their policies. In this context, governments may need to set emission standards. In this context, they can take various measures through the Emissions Trading System (ETS) and the Border Carbon Regulation Mechanism (CCRM). The EU has to prevent carbon leakage to make its climate policy more effective. As a result of this mechanism to be applied to imports, a source of income is created. Thus, third countries will be incentivized to harmonize green policies and reduce emissions. In addition to monitoring and reducing imports of goods with high carbon footprints, governments will develop carbon pricing policies to combat climate change. Developing policies in line with the World Trade Organization and other international systems will ensure compliance with ETS and CCRM rules in importing third-country origin products into the EU (European Commission (EC) 2021; Aydin and Degirmenci 2023). Companies that reduce environmental quality by ignoring these standards can be sanctioned. These sanctions can be carbon taxes, pollutant rights, and pollution credits. Such policies have the power to improve environmental quality as well as increase economic growth.
policymakers to enforce environmental protection laws and possibly make every citizen understand them. This way, institutions with relatively weak institutional quality will be replaced by institutions with solid institutional quality. Conversely, institutional quality increases the LCF in Germany and France. It shows that environmental regulations and trade laws are implemented in these two countries. These nations have six indicators-political stability, regulatory quality, government efficacy, the rule of law, accountability, and corruption control-contributing to higher environmental quality. Additionally, these nations have relatively low levels of behaviors, including lobbying, rent-seeking, bribery, and nepotism. The low level of these activities contributes to the countries’ decreased environmental pollution.
with strong public support, especially in the European region. Environmental quality will rise as environmentally friendly technology expands and develops. Finally, the EU indirectly promotes investments in environmentally friendly technology to accomplish the aims of the European Green Deal with plans and programs like Horizon Europe and Next, Generation EU in conjunction with the Paris Climate Agreement and the “Fit for 55 ” projects. Additionally, institutions and researchers should be encouraged by policymakers to employ ecofriendly technologies. These incentives can take the form of tax exemptions and subsidies. In line with the results obtained, policymakers should focus on improving the environmental impact of environmental technologies to promote and sustain environmental sustainability. Given the accelerating pace of environmental issues such as overcrowding, overconsumption, climate change, and new global markets, investing in these environmental technologies has become imperative. Therefore, countries need to reconsider all kinds of technological investment policies. Integrating environmental policies will encourage the creation of more informed technology structures that control risks and uncertainties with emerging developments in environmental technology.
Declarations
Consent for publication Not applicable.
Conflict of interest The authors declare no competing interests.
References
Adebayo TS, AbdulKareem HK, Kirikkaleli D, Shah MI, Abbas S (2022b) CO2 behavior amidst the COVID-19 pandemic in the United Kingdom: the role of renewable and non-renewable energy development. Renew Energ 189:492-501
Adebayo TS, Oladipupo SD, Adeshola I, Rjoub H (2022a) Wavelet analysis of the impact of renewable energy consumption and technological innovation on CO2 emissions: evidence from Portugal. Environ Sci Pollut Res 29(16):23887-23904
Ahmad M, Shabir M, Naheed R, Shehzad K (2022) How do environmental innovations and energy productivity affect the environment? Analyzing the role of economic globalization. Int J Environ Sci Technol 19(8):7527-7538
Ahmed Z, Ahmad M, Rjoub H, Kalugina OA, Hussain N (2022) Economic growth, renewable energy consumption, and ecological footprint: exploring the role of environmental regulations and democracy in sustainable development. Sustain Dev 30(4):595-605
Ahmed Z, Wang Z, Mahmood F, Hafeez M, Ali N (2019) Does globalization increase the ecological footprint? Empirical evidence from Malaysia. Environ Sci Pollut Res 26:18565-18582
Akadiri SS, Adebayo TS, Riti JS, Awosusi AA, Inusa EM (2022) The effect of financial globalization and natural resource rent on load capacity factor in India: an analysis using the dual adjustment approach. Environ Sci Pollut Res 29(59):89045-89062
Akinsola GD, Awosusi AA, Kirikkaleli D, Umarbeyli S, Adeshola I, Adebayo TS (2022) Ecological footprint, public-private partnership investment in energy, and financial development in Brazil: a gradual shift causality approach. Environ Sci Pollut Res 29(7):10077-10090
Ali HS, Zeqiraj V, Lin WL, Law SH, Yusop Z, Bare UAA, Chin L (2019) Does quality institutions promote environmental quality? Environ Sci Pollut Res 26:10446-10456
Amegavi GB, Langnel Z, Ahenkan A, Buabeng T (2022) The dynamic relationship between economic globalisation, institutional quality, and ecological footprint: evidence from Ghana. J Int Trade Econ Dev 31(6):876-893
Apergis N, Degirmenci T, Aydin M (2023) Renewable and nonrenewable energy consumption, energy technology investment, green technological innovation, and environmental sustainability inthe United States: testing the EKC and LCC hypotheses with novel Fourier estimation. Environ Sci Pollut Res 30:125570125584. https://doi.org/10.1007/s11356-023-30901-1
economies: policy towards environmental sustainability. Int J Sustain Dev World Ecol 29(7):593-610
Awosusi AA, Kutlay K, Altuntaş M, Khodjiev B, Agyekum EB, Shouran M, Kamel S (2022a) A roadmap toward achieving sustainable environment: evaluating the impact of technological innovation and globalization on load capacity factor. Int J Environ Res Public Health 19(6):3288
Aydin M, Bozatli O (2022) Do transport taxes reduce air pollution in the top 10 countries with the highest transport tax revenues? A country-specific panel data analysis. Environ Sci Pollut Res 29:54181-54192. https://doi.org/10.1007/s11356-022-19651-8
Aydin M, Degirmenci T (2023) The impact of clean energy consumption, green innovation, and technological diffusion on environmental sustainability: new evidence from load capacity curve hypothesis for 10 European Union countries. Sustain Dev. https://doi.org/10.1002/sd. 2794
Aydin M, Degirmenci T, Yavuz H (2023) The influence of multifactor productivity, research and development expenditure, renewable energy consumption on ecological footprint in G7 countries: testing the Environmental Kuznets Curve Hypothesis. Environ Model Assess 28:693-708. https://doi.org/10.1007/ s10666-023-09879-0
Aydin M, Degirmenci T, Gurdal T, Yavuz H (2023a) The role of green innovation in achieving environmental sustainability in European Union countries: testing the environmental Kuznets curve hypothesis. Gondw Res 118:105-116
Aydin M, Sogut Y, Altundemir ME (2023b) Moving toward the sustainable environment of European Union countries: investigating the effect of natural resources and green budgeting on environmental quality. Resour Policy 83:103737
Aydin M, Koc P, Tumay M (2023c) Investigating the environmental Kuznets curve hypothesis with recovered paper consumption, human development index, urbanization, and forest footprint. Int J Environ Sci Technol: 1-12
Bashir MF, Ma B, Shahbaz M, Jiao Z (2020) The nexus between environmental tax and carbon emissions with the roles of environmental technology and financial development. PloS One 15(11):e0242412
Borozan D (2022) Revealing the complexity in the environmental Kuznets curve set in a European multivariate framework. Environ Dev Sustain 24(7):9165-9184
Breitung J (2001) The local power of some unit root tests for panel data. In: Baltagi BH, Fomby TB, Carter Hill R (eds) Nonstationary panels, anel cointegration, and dynamic panels (Advances in Econometrics), vol 15. Emerald Group Publishing Limited, Leeds, pp 161-177. https://doi.org/10.1016/S0731-9053(00) 15006-6
Breitung J, Das S (2005) Panel unit root tests under cross-sectional dependence. Stat Neerl 59(4):414-433
Breusch TS, Pagan AR (1980) The Lagrange multiplier test and its applications to model specification in econometrics. Rev Econ Stud 47(1):239-253
Chudik A, Pesaran MH (2015) Common correlated effects estimation of heterogeneous dynamic panel data models with weakly exogenous regressors. J Econom 188(2):393-420
Cole MA (2006) Does trade liberalization increase national energy use? Econ Lett 92(1):108-112
Copeland BR, Taylor MS (2004) Trade, growth, and the environment. J Econ Lit 42(1):7-71
Damania R, Fredriksson PG, List JA (2003) Trade liberalization, corruption, and environmental policy formation: theory and evidence. J Environ Econ Manage 46(3):490-512
Degirmencioglu Aydin N, Aydin M (2023) An environmental impact assessment of major economic sectors in Turkey: economics and law perspective. J Knowl Econ. https://doi.org/10.1007/ s13132-023-01400-y
Destek MA, Sinha A (2020) Renewable, non-renewable energy consumption, economic growth, trade openness and ecological footprint: evidence from organisation for economic co-operation and development countries. J Clean Prod 242:118537
Dong K, Sun R, Hochman G, Zeng X, Li H, Jiang H (2017) Impact of natural gas consumption on CO2 emissions: panel data evidence from China’s provinces. J Clean Prod 162:400-410
Erdogan S (2023) Linking natural resources and environmental sustainability: a panel data approach based on the load capacity curve hypothesis. Sustainable Development. https://doi.org/10. 1002/sd. 2836
Erdogan S (2024) On the impact of natural resources on environmental sustainability in African countries: a comparative approach based on the EKC and LCC hypotheses. Resour Policy 88:104492
European Commission (EC) (2021)’Fit for 55′: delivering the EU’s 2030 climate target on the way to climate neutrality, Brussels. https://eur-lex.europa.eu/legalcontent/EN/TXT/PDF/?uri= CELEX:52021DC0550&from=EN. 04.12.2023
European Council (EC) (2023) https://www.consilium.europa.eu/en/ policies/green-deal/fit-for-55-the-eu-plan-for-a-green-transition/. 24.04.2023
Galli A (2015) On the rationale and policy usefulness of ecological footprint accounting: the case of Morocco. Environ Sci Policy 48:210-224
Grossman GM, Krueger AB (1991) Environmental impacts of a North American free trade agreement. Working Paper No. 3914. National Bureau of Economic Research, Cambridge
Hassan ST, Xia E, Khan NH, Shah SMA (2019) Economic growth, natural resources, and ecological footprints: evidence from Pakistan. Environ Sci Pollut Res 26:2929-2938
Huo W, Zaman BU, Zulfiqar M, Kocak E, Shehzad K (2023) How do environmental technologies affect environmental degradation? Analyzing the direct and indirect impact of financial innovations and economic globalization. Environ Technol Innov 29:102973
Hussain M, Dogan E (2021) The role of institutional quality and envi-ronment-related technologies in environmental degradation for BRICS. J Clean Prod 304:127059
Hussain M, Khan JA (2023) The nexus of environment-related technologies and consumption-based carbon emissions in top five emitters: empirical analysis through dynamic common correlated effects estimator. Environ Sci Pollut Res 30(10):25059-25068
Hussain M, Mir GM, Usman M, Ye C, Mansoor S (2022) Analysing the role of environment-related technologies and carbon emissions in emerging economies: a step towards sustainable development. Environ Technol 43(3):367-375
Jahanger A, Usman M, Murshed M, Mahmood H, Balsalobre-Lorente D (2022) The linkages between natural resources, human capital, globalization, economic growth, financial development, and ecological footprint: the moderating role of technological innovations. Resour Policy 76:102569
Kirikkaleli D, Adebayo TS, Khan Z, Ali S (2021) Does globalization matter for ecological footprint in Turkey? Evidence from dual adjustment approach. Environ Sci Pollut Res 28(11):14009-14017
Lau LS, Choong CK, Eng YK (2014) Carbon dioxide emission, institutional quality, and economic growth: empirical evidence in Malaysia. Renew Energy 68:276-281
Le HP, Ozturk I (2020) The impacts of globalization, financial development, government expenditures, and institutional quality on CO 2 emissions in the presence of environmental Kuznets curve. Environ Sci Pollut Res 27:22680-22697
Liu X, Olanrewaju VO, Agyekum EB, El-Naggar MF, Alrashed MM, Kamel S (2022) Determinants of load capacity factor in an emerging economy: the role of green energy consumption and technological innovation. Front Environ Sci 10:2071
Ni Z, Yang J, Razzaq A (2022) How do natural resources, digitalization, and institutional governance contribute to ecological sustainability through load capacity factors in highly resource-consuming economies? Resour Policy 79:103068
North DC, Institutions IC (1990) Economic performance, vol 3. Cambridge University Press, Cambridge
OECD (2023) Patents on environment technologies. https://doi.org/10. 1787/fff120f8-en. Accessed 20 Mar 2023
Panayotou T (1993) Empirical tests and policy analysis of environmental degradation at different stages of economic development. Technology and Employment Programme Working Paper of International Labour Office Geneva
Panayotou T (2000) Globalization and environment. CID Working Paper Series 2000. Harvard University, Cambridge, MA, p 53
Panayotou T (2003) Economic growth and the environment. Econ Surv Eur 2:45-72
Pata UK, Ertugrul HM (2023) Do the Kyoto Protocol, geopolitical risks, human capital and natural resources affect the sustainability limit? A new environmental approach based on the LCC hypothesis. Resour Policy 81:103352
Pata UK, Isik C (2021) Determinants of the load capacity factor in China: a novel dynamic ARDL approach for ecological footprint accounting. Resour Policy 74:102313
Pata UK, Samour A (2022) Do renewable and nuclear energy enhance environmental quality in France? A new EKC approach with the load capacity factor. Prog Nucl Energy 149:104249
Pata UK, Caglar AE, Kartal MT, Depren SK (2023b) Evaluation of the role of clean energy technologies, human capital, urbanization, and income on the environmental quality in the United States. J Clean Prod 402:136802
Pata UK, Kartal MT, Adebayo TS, Ullah S (2023a) Enhancing environmental quality in the United States by linking biomass energy consumption and load capacity factor. Geosci Front 14(3):101531
Pesaran MH (2006) Estimation and inference in large heterogeneous panels with a multifactor error structure. Econometrica 74(4):967-1012
Pesaran MH (2021) General diagnostic tests for cross-sectional dependence in panels. Empir Econ 60(1):13-50
Pesaran MH, Yamagata T (2008) Testing slope homogeneity in large panels. J Econom 142(1):50-93
Rennen W, Martens P (2003) The globalisation timeline. Integrated Assessment 4(3):137-144
Rothstein BO, Teorell JA (2008) What is quality of government? A theory of impartial government institutions. Governance 21(2):165-190
Salman M, Long X, Dauda L, Mensah CN (2019) The impact of institutional quality on economic growth and carbon emissions: evidence from Indonesia, South Korea and Thailand. J Clean Prod 241:118331
Sarkodie SA, Adams S (2018) Renewable energy, nuclear energy, and environmental pollution: accounting for political institutional quality in South Africa. Sci Total Environ 643:1590-1601
Shahbaz M, Mallick H, Mahalik MK, Loganathan N (2015) Does globalization impede environmental quality in India? Ecol Indic 52:379-393
Shahbaz M, Shahzad SJH, Mahalik MK (2018) Is globalization detrimental to CO 2 emissions in Japan? New threshold analysis. Environ Model Assess 23:557-568
Sharif A, Saqib N, Dong K, Khan SAR (2022) Nexus between green technology innovation, green financing, and CO2 emissions in the G7 countries: the moderating role of social globalisation. Sustain Dev 30(6):1934-1946
Siche R, Pereira L, Agostinho F, Ortega E (2010) Convergence of ecological footprint and emergy analysis as a sustainability indicator of countries: Peru as case study. Commun Nonlinear Sci Numer Simul 15(10):3182-3192
Sikora A (2021) European Green Deal-legal and financial challenges of the climate change. Era Forum 21(4):681-697
Solarin SA, Bello MO (2018) Persistence of policy shocks to an environmental degradation index: the case of ecological footprint in 128 developed and developing countries. Ecol Indic 89:35-44
Stern DI (2004) The rise and fall of the environmental Kuznets curve. World Dev 32(8):1419-1439
United Nations (n.d.) Sustainable Development Goals Report. https:// www.un.org/sustainabledevelopment/progress-report/. 12.06.2023
Wackernagel M, Rees W (1998) Our ecological footprint: reducing human impact on the earth, vol 9 . New society publishers
Wang Y, Zhang C, Lu A, Li L, He Y, ToJo J, Zhu X (2017) A disaggregated analysis of the environmental Kuznets curve for industrial CO2 emissions in China. Appl Energy 190:172-180
Westerlund J, Edgerton DL (2008) A simple test for cointegration in dependent panels with structural breaks. Oxf Bull Econ Stat 70(5):665-704
Zeng Q, Destek MA, Khan Z, Badeeb RA, Zhang C (2023) Green innovation, foreign investment and carbon emissions: a roadmap to sustainable development via green energy and energy efficiency for BRICS economies. Int J Sust Dev World Ecol. https://doi.org/ 10.1080/13504509.2023.2268569
- Responsible Editor: Ilhan Ozturk
Mucahit Aydin
aydinm@sakarya.edu.tr
Yasin Sogut
yasin.sogut1@ogr.sakarya.edu.tr
Azad Erdem
azad.erdem@ogr.sakarya.edu.tr
1 Faculty of Political Sciences, Department of Econometrics, Sakarya University, Esentepe Campus, Serdivan/Sakarya, Turkey
2 UNEC Research Methods Application Center, Azerbaijan State University of Economics (UNEC), Istiqlaliyyat Str. 6, Baku, Azerbaijan
3 Faculty of Political Sciences, Department of Public Finance, Sakarya University, Esentepe Campus, Serdivan/Sakarya, Turkey - Bold values indicate robust results that are significant for both estimators
- and *** denote rejection of the null hypothesis at
and levels of significance, respectively
- and *** denote rejection of the null hypothesis at