DOI: https://doi.org/10.1038/s41467-024-44947-3
PMID: https://pubmed.ncbi.nlm.nih.gov/38321008
تاريخ النشر: 2024-02-06
زيادة ثلاثية في أحواض الأنهار العالمية مع ندرة المياه بسبب التلوث المستقبلي
تم القبول: 9 يناير 2024
نُشر على الإنترنت: 06 فبراير 2024
(د) التحقق من التحديثات
الملخص
أمن المياه في خطر اليوم. بينما تؤثر التغيرات المناخية على توفر المياه، أدت التحضر والأنشطة الزراعية إلى زيادة الطلب على المياه بالإضافة إلى التلوث، مما يحد من استخدام المياه الآمنة. قمنا بإجراء تقييم عالمي لندرة المياه النظيفة المستقبلية لعام 2050 من خلال إضافة جانب تلوث المياه إلى التقييمات التقليدية لندرة المياه الناتجة عن الكمية. تم ذلك من أجل
إلى التغيرات في توفر المياه، مثل تصريف الأنهار
النتائج
نقاط نقص المياه من المياه النظيفة
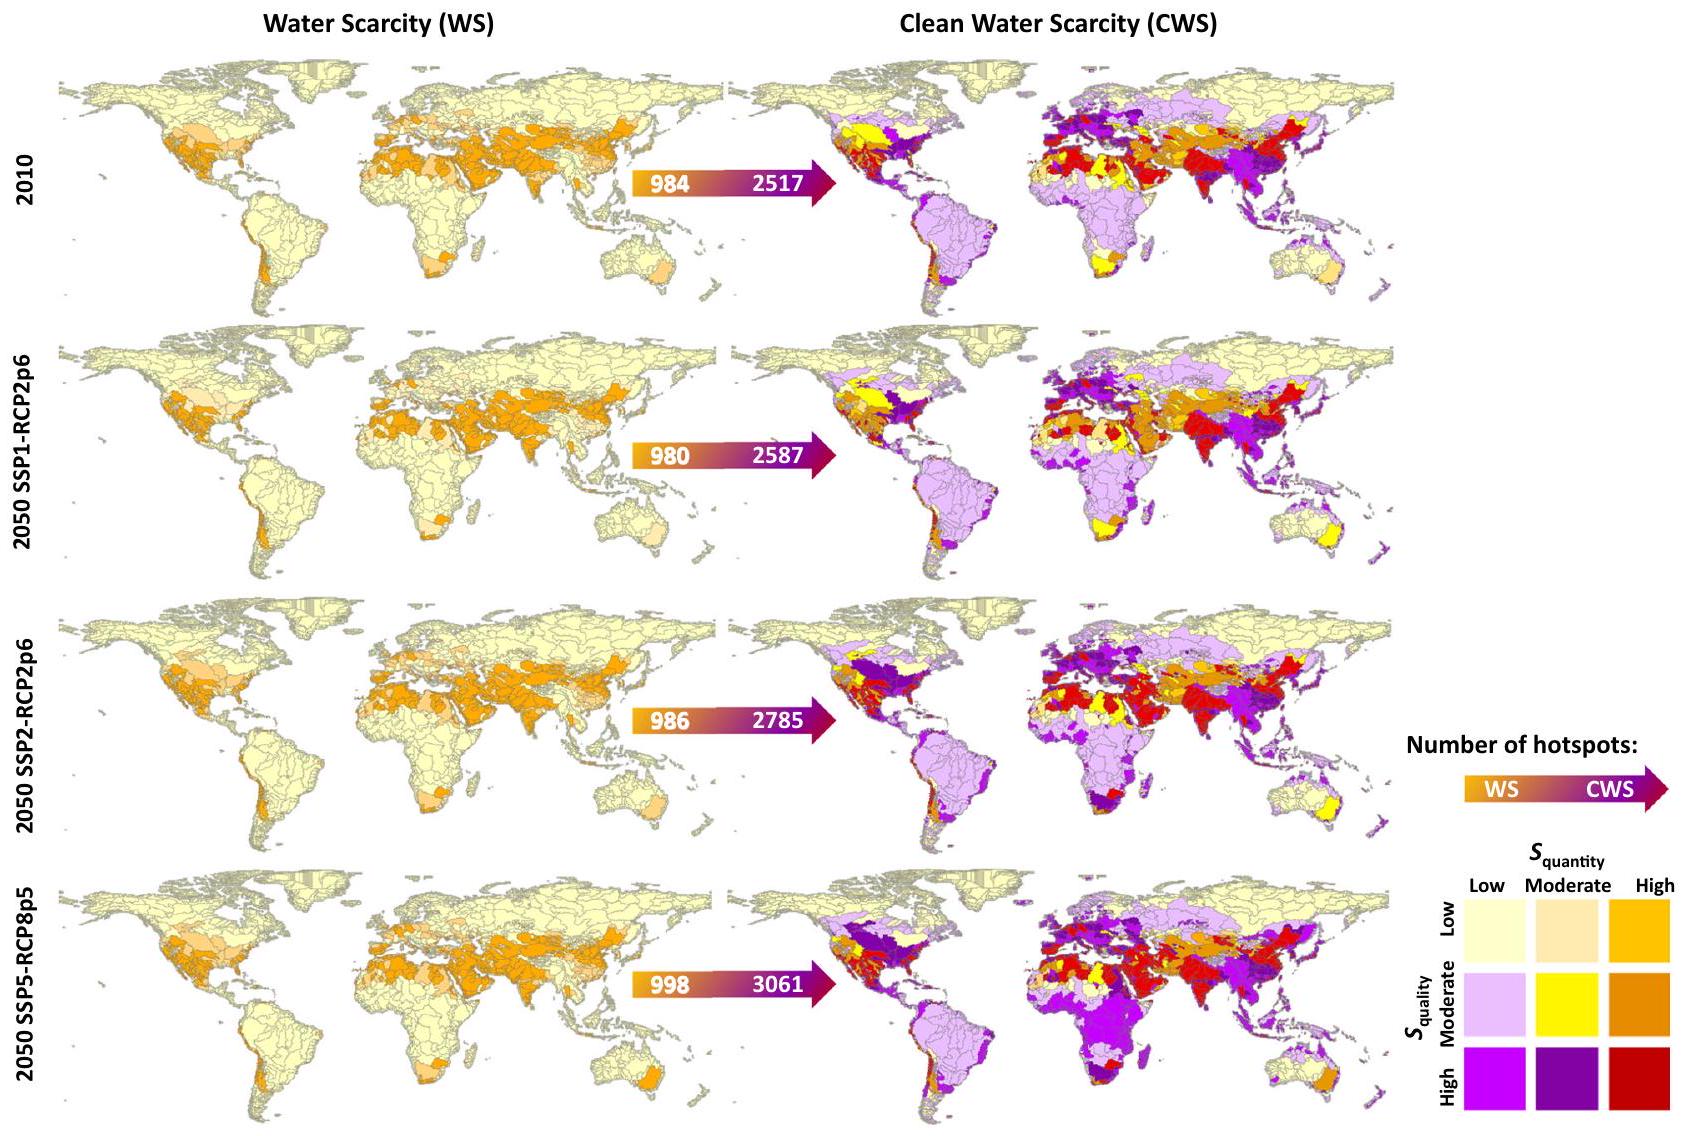
وتقييم ندرة المياه النظيفة. النقاط الساخنة هي الأحواض الفرعية حيث إما
كانت المستويات أيضًا مهيمنة من قبل تلوث النيتروجين. في عام 2010، واجه أكثر من 2000 حوض فرعي احتمال نقص المياه بسبب تلوث المياه المعتدل، موزع بشكل رئيسي في أمريكا الجنوبية وأفريقيا، ولكن أيضًا في أمريكا الشمالية وآسيا الشمالية وأستراليا (الشكل 2). تغطي هذه الأحواض الفرعية 39% من مساحة الصرف العالمية ويعيش فيها 18% من السكان. الأحواض الفرعية التي لا تواجه حاليًا مشاكل نقص المياه مع جودة مياه عالية وكمية مياه عالية توجد في الغالب في مناطق ذات كثافة سكانية منخفضة مثل الأجزاء الشمالية من أمريكا الشمالية وآسيا، والأجزاء الوسطى من أستراليا (الشكل 2).
الجدول 1 | حصة المناطق (% من الإجمالي العالمي) من المساحة (مساحة أحواض التصريف الفرعية)، السكان، خسائر النيتروجين (N) إلى الأنهار من النفايات البشرية، الأراضي الزراعية، تطبيق الأسمدة النيتروجينية في الزراعة، تطبيق السماد العضوي النيتروجيني في الزراعة، النيتروجين في المحاصيل المحصودة، وفائض النيتروجين في الزراعة (المعرف بأنه إجمالي المدخلات النيتروجينية إلى الزراعة ناقص المخرجات النيتروجينية من امتصاص المحاصيل والرعي الحيواني) في ‘ندرة المياه الكلاسيكية’ (WS) و’ندرة المياه النظيفة’ (CWS) في عام 2010 و2050
| سنة | % من الإجمالي العالمي | |||||||||||||||
| منطقة | السكان | نفايات بشرية | الأراضي الزراعية | سماد النيتروجين | N سماد | محصول الحصاد | فائض في الزراعة | |||||||||
| WS | CWS | WS | CWS | WS | CWS | WS | CWS | WS | CWS | WS | CWS | ws | CWS | WS | CWS | |
| 2010 | ١٨ | 32 | 42 | ٨٠ | ٤٤ | 84 | ٢٦ | ٤٤ | ٣٩ | 84 | 18 | 53 | ٢٨ | 69 | 32 | 69 |
| SSP1-RCP2p6 | 19 | ٣٣ | ٤٥ | ٨٠ | ٤٩ | 82 | ٢٧ | ٤٧ | ٣٤ | 79 | ٢٥ | 64 | 31 | 69 | 32 | 70 |
| SSP2-RCP2p6 | 19 | 37 | ٤٧ | 84 | 50 | 85 | 27 | 53 | ٣٦ | 83 | 26 | 70 | 31 | 75 | ٣٣ | 74 |
| SSP5-RCP8p5 | 19 | ٤٨ | ٤٦ | 91 | ٤٩ | 91 | ٢٨ | 68 | ٣٣ | 89 | ٢٥ | ٨٠ | 32 | 84 | 31 | 84 |
 السيناريوهات المستندة إلى المسارات الاقتصادية المشتركة (SSPs) ومسارات التركيز التمثيلية (RCPs) متاحة في الجداول التكميلية S9-S11 في المعلومات الداعمة.
| ندرة المياه النظيفة | مبني على الكمية
|
|||
| منخفض (0-0.2) | معتدل (0.2-0.4) | مرتفع (>0.4) | ||
| مبني على الجودة
|
منخفض (0-0.45) | نقطة ساخنة | ||
| معتدل (0.45-1) | نقطة ساخنة | |||
| عالي
|
نقطة ساخنة | نقطة ساخنة | نقطة ساخنة | |
| الصفوف والأعمدة التي تعتمد على الكمية العالية أو الجودة العالية أو كليهما من الكمية والجودة | ||||
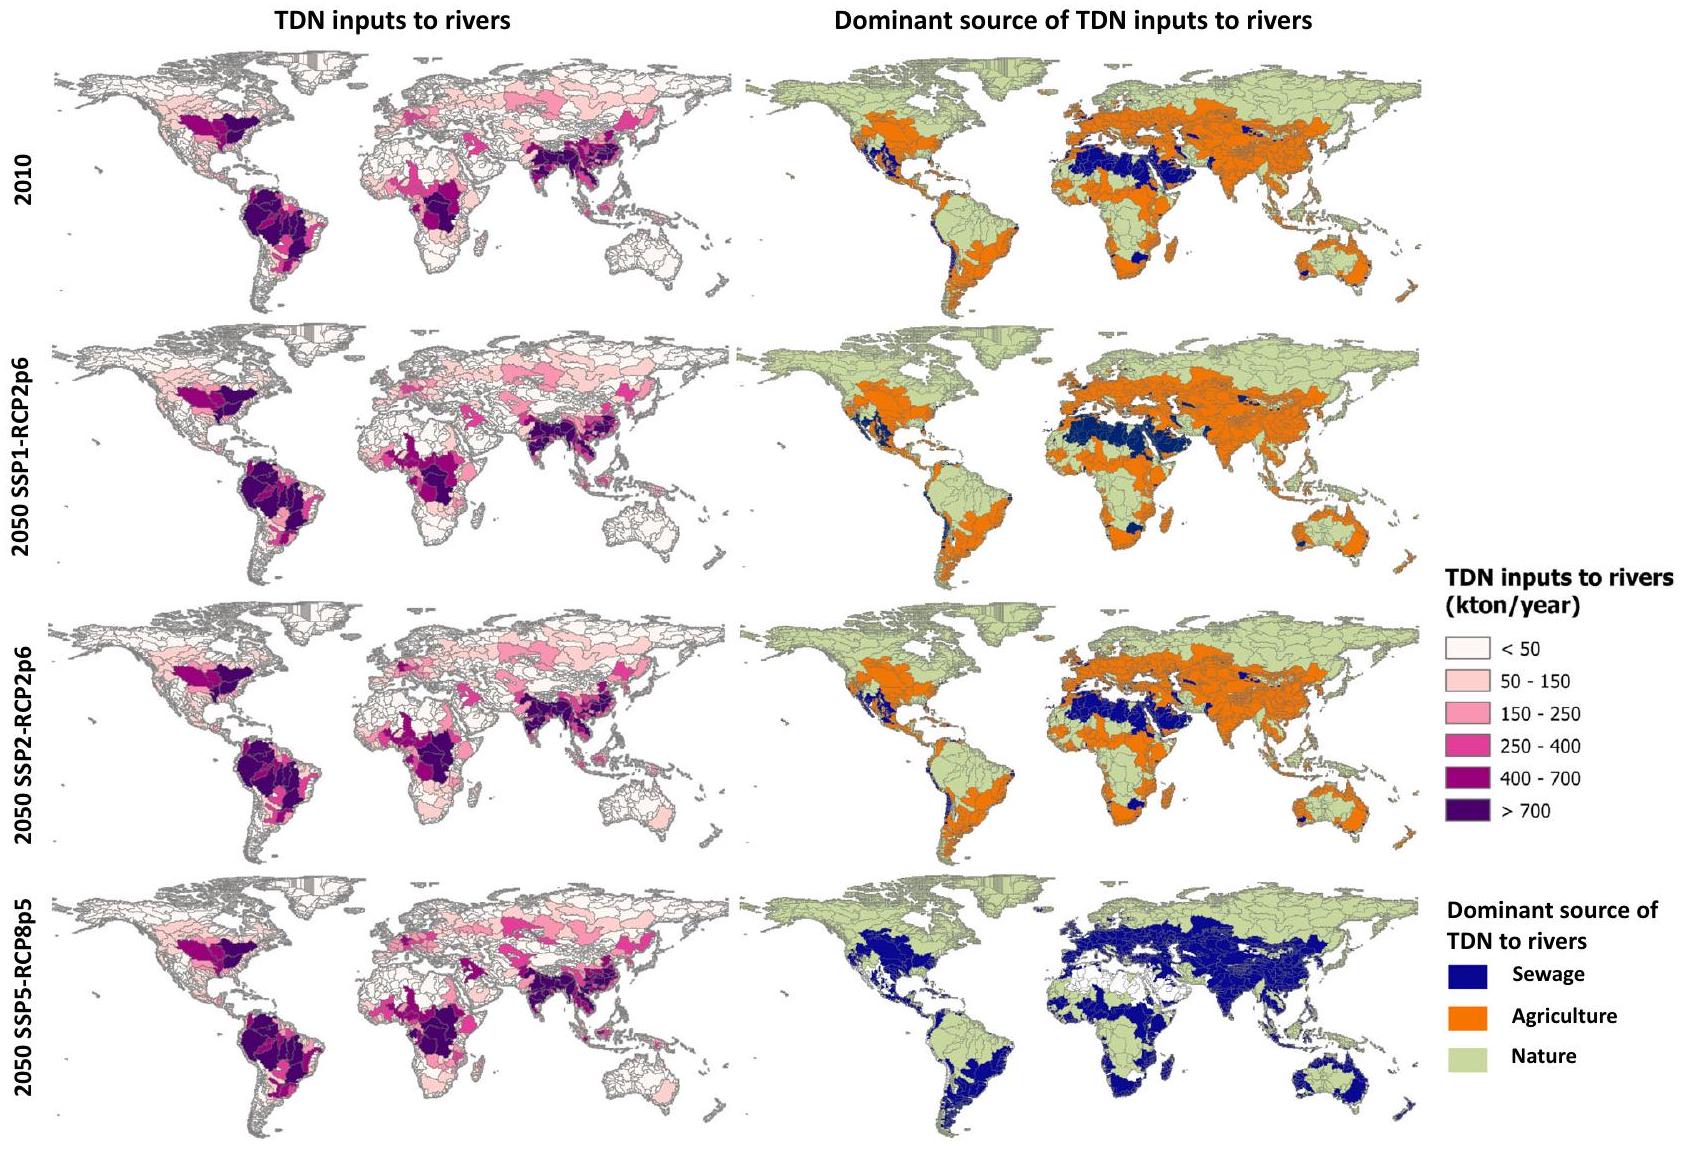
فائض النيتروجين الزراعي في عام 2050 (كان 69% في عام 2010). مساهم آخر مهم في تلوث المياه في الأحواض الفرعية الساخنة في سيناريو SSP5-RCP8p5 هو خسائر النيتروجين إلى الأنهار من النفايات البشرية. من المتوقع أن تمثل هذه الخسائر 91% من إجمالي الخسائر العالمية بسبب ارتفاع اتصالات الصرف الصحي وسوء معالجة مياه الصرف الصحي في هذا السيناريو الاقتصادي الأول والمتحضر بشكل كبير.
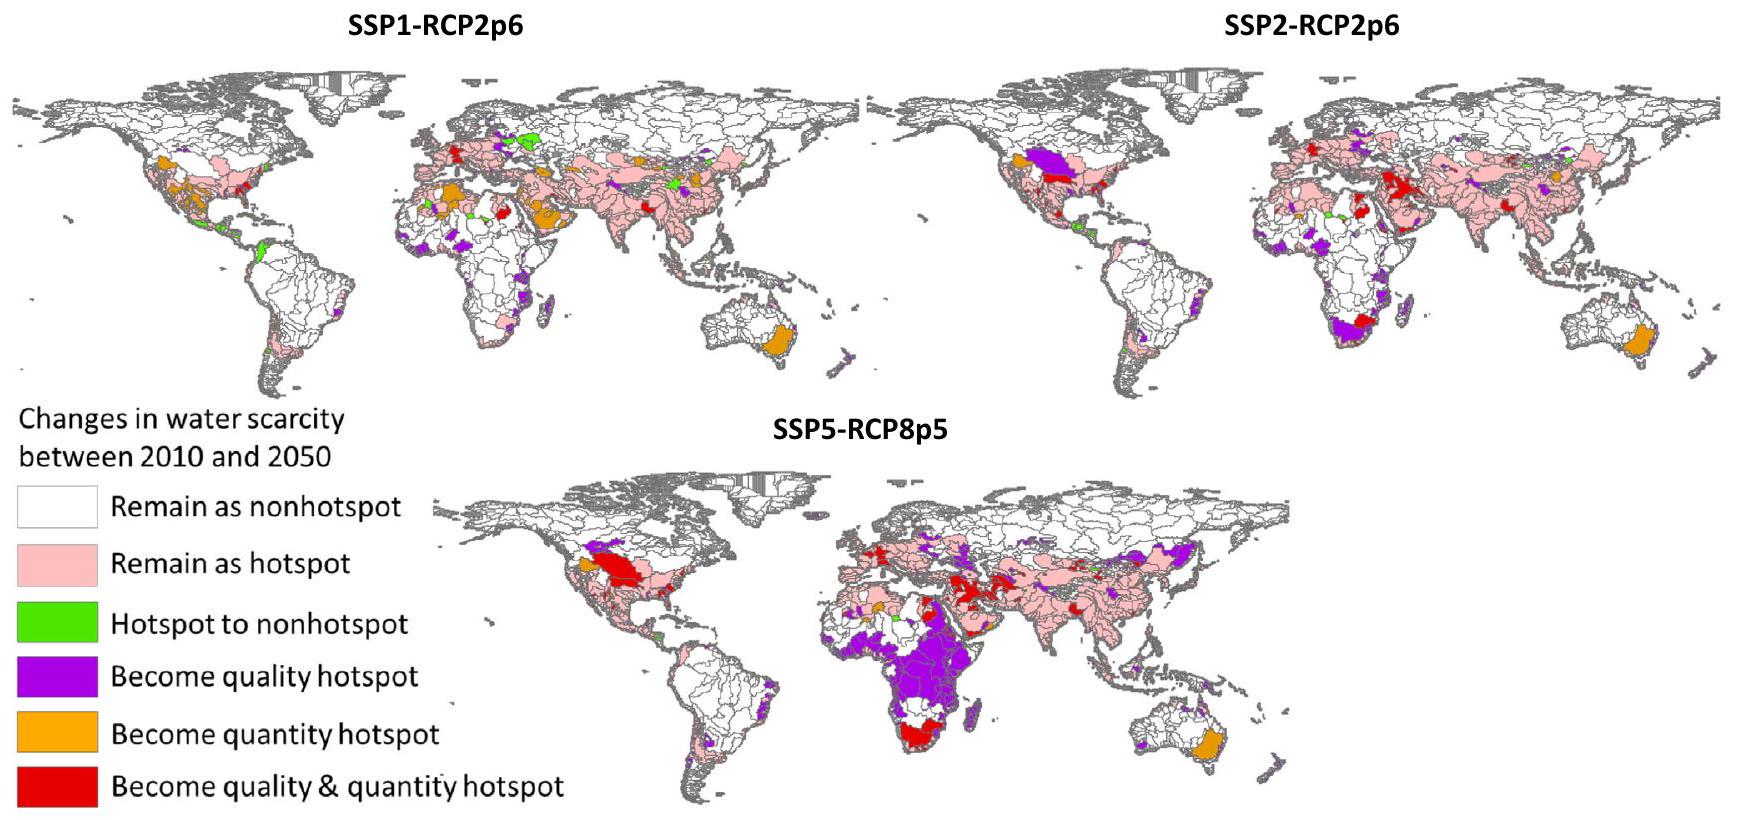
تلوث المياه هو سبب مهم لندرة المياه
حيث تعتبر مستويات الندرة لمياه الكمية أو الجودة أو كليهما مرتفعة كما هو موضح في الجدول 2. بالنسبة لعام 2050، تم حساب ندرة المياه النظيفة لثلاثة سيناريوهات: SSP1-RCP2p6، SSP2-RCP2p6، SSP5-RCP8p5. تفاصيل السيناريوهات بناءً على المسارات الاقتصادية المشتركة (SSPs) ومسارات التركيز التمثيلية (RCPs) متاحة في الجداول S9-S11 في المعلومات الداعمة.
تظل كمية المياه مهمة
تحديات مختلفة بين النقاط الساخنة
تحسنت إلى مستويات عالية، حيث إن الإنتاج الغذائي العالي في الصين والهند وأوروبا وأمريكا الشمالية (مثل نهر المسيسيبي) المدفوع بطلب الغذاء لا يزال يؤدي إلى فائض عالٍ من النيتروجين في الزراعة (الشكل التوضيحي التكميلي S20 في الملحق). في سيناريو SSP5، يتم دفع التلوث عالميًا بشكل رئيسي بواسطة مياه الصرف كما هو موضح أعلاه بسبب التحضر العالمي وعدم كفاية تطوير معالجة مياه الصرف. لا يزال ترسيب النيتروجين في الغلاف الجوي وثباته على الأراضي الطبيعية المصدر الرئيسي لإدخالات TDN إلى الأنهار في أمريكا الجنوبية ووسط أفريقيا في المستقبل، بينما يصبح فائض النيتروجين الزراعي أكثر أهمية بشكل متزايد في سيناريو SSP5 (الشكل التوضيحي التكميلي S20 في الملحق).
نقاش
مع دراسة فان فليت وآخرون
مجموعة بيانات N من تيان وآخرون.
لتحسين كفاءة المغذيات في المحاصيل بحيث يتم الحفاظ على إنتاجية المحاصيل وتلبية الطلب على الغذاء. لذلك، من الضروري النظر في التفاعلات بين أهداف التنمية المستدامة المذكورة أعلاه في استراتيجيات ندرة المياه لتجنب الآثار السلبية على تحقيق الأهداف المتعلقة بالغذاء والمدن والمناخ. توفر نتائجنا حول النقاط الساخنة لندرة المياه النظيفة وخصائصها الاجتماعية والاقتصادية والمناخية مؤشراً قيماً للغاية حول الأماكن والتفاعلات التي تحتاج إلى معالجة للتخفيف من ندرة المياه وضمان التنمية المستدامة في مجالات أخرى من المجتمع.
طرق
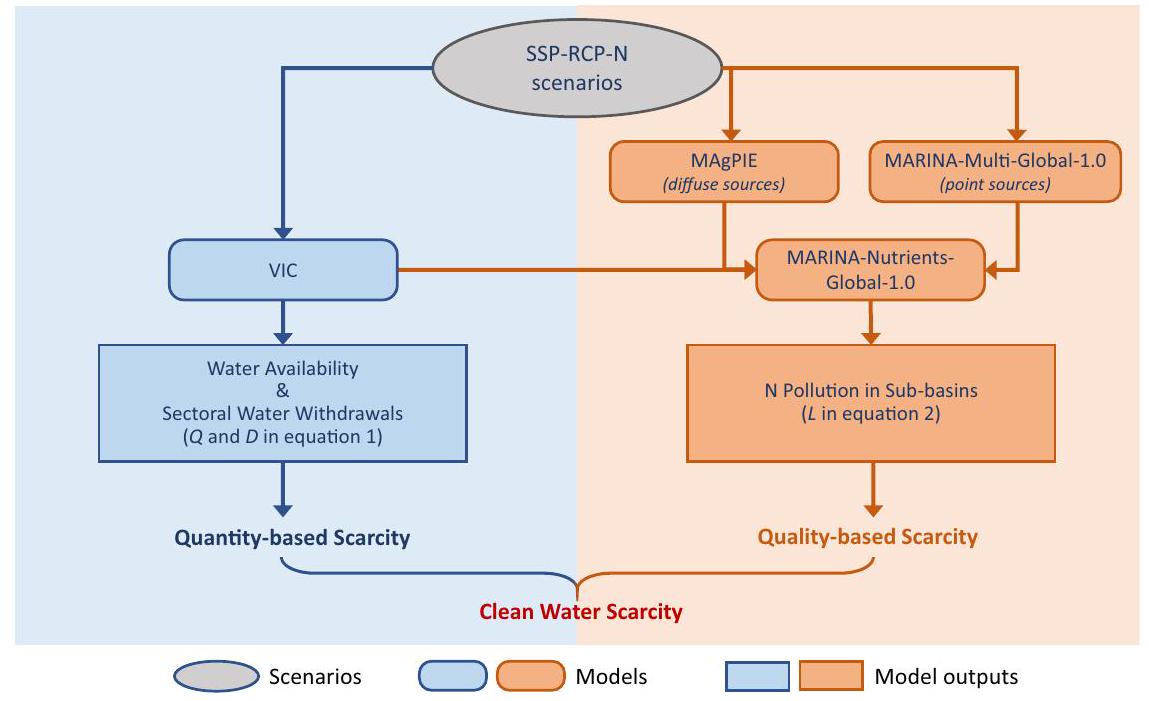
تقييم ندرة المياه النظيفة
مؤشرات ندرة المياه النظيفة
إطار نمذجة لتقييم ندرة المياه النظيفة
مبني على
المصادر تعتمد على MARINA-Multi-Global-1.0 الذي تم تطويره بواسطة ستروكال وآخرون.
تحليل النقاط الساخنة
السيناريوهات
السياسات والنظام الغذائي الغني باللحوم ومنتجات الألبان، عدم تحسين كبير في توصيل ومعالجة مياه الصرف الصحي، عدم تغييرات كبيرة في سحب المياه، جنبًا إلى جنب مع التخفيف القوي من آثار المناخ وتأثيراته على الهيدرولوجيا. تفترض SSP5-RCP8p5 مستقبلًا حضريًا مع تطوير اجتماعي واقتصادي مدفوع بالوقود الأحفوري، وسياسات ذات طموح منخفض ونظام غذائي غني باللحوم ومنتجات الألبان، وتحسين توصيل مياه الصرف الصحي ولكن مع تحسينات محدودة في معالجة مياه الصرف الصحي، وسحب مياه مرتفع، مع التخفيف المنخفض من آثار المناخ وتأثيراته على الهيدرولوجيا. الافتراضات المتعلقة بتوصيل ومعالجة مياه الصرف الصحي متاحة في الجدول التكميلي S10 في SI وفي Strokal et al.
توفر البيانات
توفر الشيفرة
References
- Oki, T. & Kanae, S. Global hydrological cycles and world water resources. science 313, 1068-1072 (2006).
- Seneviratne, S. I., et al. Weather and climate extreme events in a changing climate. In: Climate Change 2021: The Physical Science Basis. Contribution of Working Group I to the Sixth Assessment Report of the Intergovernmental Panel on Climate Change (Cambridge Univ. Press, Cambridge and New York, 2021).
- Mekonnen, M. & Hoekstra, A. Sustainability: four billion people facing severe water scarcity. Sci. Adv. 2, 1-7 (2016).
- Gosling, S. N. & Arnell, N. W. A global assessment of the impact of climate change on water scarcity. Climatic Change 134, 371-385 (2016).
- Caretta, A. M. M. A., Arfanuzzaman, R. B. M., Morgan, S. M. R. & Kumar, M. Water. In: Climate Change 2022: Impacts, Adaptation, and Vulnerability. Contribution of Working Group II to the Sixth Assessment Report of the Intergovernmental Panel on Climate Change (Cambridge Univ. Press, Cambridge and New York, 2022).
- Liu, J. et al. Water scarcity assessments in the past, present, and future. Earth’s future 5, 545-559 (2017).
- Alcamo, J., Flörke, M. & Märker, M. Future long-term changes in global water resources driven by socio-economic and climatic changes. Hydrological Sci. J. 52, 247-275 (2007).
- Schewe, J. et al. Multimodel assessment of water scarcity under climate change. Proc. Natl Acad. Sci. 111, 3245-3250 (2014).
- Hagemann, S. et al. Climate change impact on available water resources obtained using multiple global climate and hydrology models. Earth Syst. Dyn. 4, 129-144 (2013).
- Haddeland, I. et al. Global water resources affected by human interventions and climate change. Proc. Natl Acad. Sci. 111, 3251-3256 (2014).
- Koutroulis, A. et al. Global water availability under high-end climate change: A vulnerability based assessment. Glob. Planet. Change 175, 52-63 (2019).
- Fekete, B. M., et al. Millennium ecosystem assessment scenario drivers (1970-2050): climate and hydrological alterations. Global Biogeochemical Cycles 24 (2010).
- Hanasaki, N. et al. A global water scarcity assessment under Shared Socio-economic Pathways-Part 2: Water availability and scarcity. Hydrol. Earth Syst. Sci. 17, 2393-2413 (2013).
- Wada, Y. et al. Modeling global water use for the 21st century: The Water Futures and Solutions (WFaS) initiative and its approaches. Geosci. Model Dev. 9, 175-222 (2016).
- Cui, R. Y. et al. Regional responses to future, demand-driven water scarcity. Environ. Res. Lett. 13, 094006 (2018).
- Greve, P. et al. Global assessment of water challenges under uncertainty in water scarcity projections. Nat. Sustain. 1, 486-494 (2018).
- Strokal, M. et al. Urbanization: an increasing source of multiple pollutants to rivers in the 21st century. npj Urban Sustain. 1, 1-13 (2021).
- Li, Y. et al. Multi-pollutant assessment of river pollution from livestock production worldwide. Water Res. 209, 117906 (2022).
- Kroeze, C. et al. Global modelling of surface water quality: a multipollutant approach. Curr. Opin. Environ. Sustain. 23, 35-45 (2016).
- Liu, J. et al. A high-resolution assessment on global nitrogen flows in cropland. Proc. Natl Acad. Sci. 107, 8035-8040 (2010).
- Tian, H. et al. History of anthropogenic Nitrogen inputs (HaNi) to the terrestrial biosphere: a 5 arcmin resolution annual dataset from 1860 to 2019. Earth Syst. Sci. Data 14, 4551-4568 (2022).
- Diaz, R. J. & Rosenberg, R. Spreading dead zones and consequences for marine ecosystems. science 321, 926-929 (2008).
- Garnier, J., Beusen, A., Thieu, V., Billen, G. & Bouwman, L. N: P: Si nutrient export ratios and ecological consequences in coastal seas evaluated by the ICEP approach. Global Biogeochemical Cycles 24 (2010).
- Beusen, A. H., Bouwman, A. F., Van Beek, L. P., Mogollón, J. M. & Middelburg, J. J. Global riverine N and P transport to ocean increased during the 20th century despite increased retention along the aquatic continuum. Biogeosciences 13, 2441-2451 (2016).
- Wang, Y. et al. Effects of anthropogenic disturbances and climate change on riverine dissolved inorganic nitrogen transport. J. Adv. Model. Earth Syst. 12, e2020MS002234 (2020).
- Liu, J., Liu, Q. & Yang, H. Assessing water scarcity by simultaneously considering environmental flow requirements, water quantity, and water quality. Ecol. Indic. 60, 434-441 (2016).
- Zeng, Z., Liu, J. & Savenije, H. H. A simple approach to assess water scarcity integrating water quantity and quality. Ecol. Indic. 34, 441-449 (2013).
- van Vliet, M. T., Flörke, M. & Wada, Y. Quality matters for water scarcity. Nat. Geosci. 10, 800-802 (2017).
- van Vliet, M. T. et al. Global water scarcity including surface water quality and expansions of clean water technologies. Environ. Res. Lett. 16, 024020 (2021).
- Farinosi, F. et al. An innovative approach to the assessment of hydro-political risk: A spatially explicit, data driven indicator of hydro-political issues. Glob. Environ. Change 52, 286-313 (2018).
- Veldkamp, T. et al. Water scarcity hotspots travel downstream due to human interventions in the 20th and 21st century. Nat. Commun. 8, 1-12 (2017).
- Assembly, U. G. Transforming our world: the 2030 agenda for sustainable development, 21 October 2015, (A/RES/70/1, 2015).
- Droppers, B., Franssen, W. H., Van Vliet, M. T., Nijssen, B. & Ludwig, F. Simulating human impacts on global water resources using VIC5. Geosci. Model Dev. 13, 5029-5052 (2019).
- Alcamo, J. et al. Global estimates of water withdrawals and availability under current and future “business-as-usual” conditions. Hydrol. Sci. J. 48, 339-348 (2003).
- Kummu, M., Ward, P. J., de Moel, H. & Varis, O. Is physical water scarcity a new phenomenon? Global assessment of water shortage over the last two millennia. Environ. Res. Lett. 5, 034006 (2010).
- Hanasaki, N. et al. An integrated model for the assessment of global water resources-Part 2: Applications and assessments. Hydrol. Earth Syst. Sci. 12, 1027-1037 (2008).
- Vörösmarty, C. J. et al. Global threats to human water security and river biodiversity. Nature 467, 555-561 (2010).
- De Vries, W., Kros, J., Kroeze, C. & Seitzinger, S. P. Assessing planetary and regional nitrogen boundaries related to food security and adverse environmental impacts. Curr. Opin. Environ. Sustain. 5, 392-402 (2013).
- Yu, C. et al. Managing nitrogen to restore water quality in China. Nature 567, 516-520 (2019).
- Warner, S. SDG Indicator 6.3.2 Technical Guidance Document NO.2: Target Values (UNEP GEMS/Water, 2020).
- Taylor, R. Rethinking water scarcity: The role of storage. EOS Trans. Am. Geophys. Union 90, 237-238 (2009).
- Seneviratne, S., et al. Changes in climate extremes and their impacts on the natural physical environment. In Managing the Risks of Extreme Events and Disasters to Advance Climate Change Adaptation. Special Report of the Intergovernmental Panel on Climate Change (eds. Field, C. B., Barros, V., Stocker, T. F., Qin, D., Dokken, D. J., Ebi, K. L., Mastrandrea, M. D., Mach, K. J., Plattner, G. -K., Allen, S. K., Tignor, M. & Midgley, P. M.) 109-230 (Cambridge Univ. Press, Cambridge and New York, 2012).
- Pastor, A., Ludwig, F., Biemans, H., Hoff, H. & Kabat, P. Accounting for environmental flow requirements in global water assessments. Hydrol. Earth Syst. Sci. 18, 5041-5059 (2014).
- McCrackin, M. L., Harrison, J. A. & Compton, J. E. Factors influencing export of dissolved inorganic nitrogen by major rivers: A new, seasonal, spatially explicit, global model. Glob. Biogeochemical Cycles 28, 269-285 (2014).
- Exner-Kittridge, M. et al. The seasonal dynamics of the stream sources and input flow paths of water and nitrogen of an Austrian headwater agricultural catchment. Sci. Total Environ. 542, 935-945 (2016).
- Wang, M. et al. Accounting for interactions between Sustainable Development Goals is essential for water pollution control in China. Nat. Commun. 13, 730 (2022).
- van Vliet, M. et al. Multi-model assessment of global hydropower and cooling water discharge potential under climate change. Glob. Environ. Change 40, 156-170 (2016).
- Prudhomme, C. et al. Hydrological droughts in the 21st century, hotspots and uncertainties from a global multimodel ensemble experiment. Proc. Natl Acad. Sci. 111, 3262-3267 (2014).
- Elliott, J. et al. Constraints and potentials of future irrigation water availability on agricultural production under climate change. Proc. Natl Acad. Sci. 111, 3239-3244 (2014).
- Haddeland, I. et al. Multimodel estimate of the global terrestrial water balance: setup and first results. J. Hydrometeorol. 12, 869-884 (2011).
- Wada, Y. et al. Multimodel projections and uncertainties of irrigation water demand under climate change. Geophys. Res. Lett. 40, 4626-4632 (2013).
- Wang, M., Kroeze, C., Strokal, M., van Vliet, M. T. & Ma, L. Global change can make coastal eutrophication control in China more difficult. Earths Fut. 8, e2019EF001280 (2020).
- Ascott, M. J. et al. Global patterns of nitrate storage in the vadose zone. Nat. Commun. 8, 1416 (2017).
- Van Meter, K. J., Basu, N. B. & Van Cappellen, P. Two centuries of nitrogen dynamics: Legacy sources and sinks in the Mississippi and
55. Beusen, A. et al. Exploring river nitrogen and phosphorus loading and export to global coastal waters in the Shared Socio-economic pathways. Glob. Environ. Change 72, 102426 (2022).
56. Wang, J., Li, Y., Huang, J., Yan, T. & Sun, T. Growing water scarcity, food security and government responses in China. Glob. Food Security 14, 9-17 (2017).
57. Gasbarro, F., Rizzi, F. & Frey, M. Adaptation measures of energy and utility companies to cope with water scarcity induced by climate change. Bus. Strategy Environ. 25, 54-72 (2016).
58. Alam, K. Farmers’ adaptation to water scarcity in drought-prone environments: A case study of Rajshahi District, Bangladesh. Agric. water Manag. 148, 196-206 (2015).
59. Grizzetti, B., Pretato, U., Lassaletta, L., Billen, G. & Garnier, J. The contribution of food waste to global and European nitrogen pollution. Environ. Sci. Policy 33, 186-195 (2013).
60. Springmann, M. et al. Options for keeping the food system within environmental limits. Nature 562, 519-525 (2018).
61. Kanter, D. R. et al. Nitrogen pollution policy beyond the farm. Nat. Food 1, 27-32 (2020).
62. Houlton, B. Z. et al. A world of cobenefits: solving the global nitrogen challenge. Earths Future 7, 865-872 (2019).
63. Beusen, A. H. W. et al. Exploring river nitrogen and phosphorus loading and export to global coastal waters in the Shared Socio-economic pathways. Glob. Environ. Change 72, 102426 (2022).
64. Bodirsky, B. L. et al. Reactive nitrogen requirements to feed the world in 2050 and potential to mitigate nitrogen pollution. Nat. Commun. 5, 1-7 (2014).
65. Strokal, M. et al. Global multi-pollutant modelling of water quality: scientific challenges and future directions. Curr. Opin. Environ. Sustain. 36, 116-125 (2019).
66. Li, A., Wang, M., Kroeze, C., Ma, L. & Strokal, M. Past and future pesticide losses to Chinese waters under socioeconomic development and climate change. J. Environ. Manag. 317, 115361 (2022).
67. Strokal, V. et al. Future microplastics in the Black Sea: River exports and reduction options for zero pollution. Mar. Pollut. Bull. 178, 113633 (2022).
68. Uddin, M. G., Nash, S. & Olbert, A. I. A review of water quality index models and their use for assessing surface water quality. Ecol. Indic. 122, 107218 (2021).
69. Parween, S., Siddique, N. A., Mahammad Diganta, M. T., Olbert, A. I. & Uddin, M. G. Assessment of urban river water quality using modified NSF water quality index model at Siliguri city, West Bengal, India. Environ. Sustain. Indic. 16, 100202 (2022).
70. Uddin, M. G., Nash, S., Rahman, A. & Olbert, A. I. A sophisticated model for rating water quality. Sci. Total Environ. 868, 161614 (2023).
71. Sutadian, A. D., Muttil, N., Yilmaz, A. G. & Perera, B. Development of river water quality indices-a review. Environ. Monit. Assess. 188, 1-29 (2016).
72. Xue, L., Weng, L. & Yu, H. Addressing policy challenges in implementing Sustainable Development Goals through an adaptive governance approach: A view from transitional China. Sustain. Dev. 26, 150-158 (2018).
73. Pradhan, P., Costa, L., Rybski, D., Lucht, W. & Kropp, J. P. A systematic study of sustainable development goal (SDG) interactions. Earths Fut. 5, 1169-1179 (2017).
74. Nilsson, M. et al. Mapping interactions between the sustainable development goals: lessons learned and ways forward. Sustain. Sci. 13, 1489-1503 (2018).
75. Flörke, M., Bärlund, I., van Vliet, M. T. H., Bouwman, A. F. & Wada, Y. Analysing trade-offs between SDGs related to water quality using salinity as a marker. Curr. Opin. Environ. Sustain. 36, 96-104 (2019).
76. Liu, K., Cao, W., Zhao, D., Liu, S. & Liu, J. Assessment of ecological water scarcity in China. Environ. Res. Lett. 17, 104056 (2022).
77. Ma, T. et al. Pollution exacerbates China’s water scarcity and its regional inequality. Nat. Commun. 11, 650 (2020).
78. Alcamo, J., Henrichs, T. & Rosch, T. World water in 2025. World water series report 2 (2000).
79. Kanter, D. R. et al. A framework for nitrogen futures in the shared socioeconomic pathways. Glob. Environ. Change 61, 102029 (2020).
80. Dietrich, J. P. et al. MAgPIE 4 – a modular open-source framework for modeling global land systems. Geosci. Model Dev. 12, 1299-1317 (2019).
81. Modi, P., Hanasaki, N., Yamazaki, D., Boulange, J. E. S. & Oki, T. Sensitivity of subregional distribution of socioeconomic conditions to the global assessment of water scarcity. Commun. Earth Environ. 3, 144 (2022).
82. Stehfest, E., van Vuuren, D., Bouwman, L. & Kram, T. Integrated assessment of global environmental change with IMAGE 3.0: Model description and policy applications (Netherlands Environmental Assessment Agency (PBL), 2014).
83. Arnold, J. G. et al. SWAT: Model use, calibration, and validation. Trans. ASABE 55, 1491-1508 (2012).
84. Fink, G., Alcamo, J., Flörke, M. & Reder, K. Phosphorus loadings to the world’s largest lakes: sources and trends. Glob. Biogeochemical Cycles 32, 617-634 (2018).
85. Liu, S. et al. Effects of anthropogenic nitrogen discharge on dissolved inorganic nitrogen transport in global rivers. Glob. change Biol. 25, 1493-1513 (2019).
86. Alcamo, J. & Henrichs, T. Critical regions: a model-based estimation of world water resources sensitive to global changes. Aquat. Sci. 64, 352-362 (2002).
87. Hanasaki, N., Yoshikawa, S., Pokhrel, Y. & Kanae, S. A quantitative investigation of the thresholds for two conventional water scarcity indicators using a state-of-the-art global hydrological model with human activities. Water Resour. Res. 54, 8279-8294 (2018).
88. Lake County Water Atals. Learn More About Trophic State Index (TSI) – Lake, http://www.lake.wateratlas.usf.edu/library/learn-more/ learnmore.aspx?toolsection=lm_tsi. (2002).
شكر وتقدير
مساهمات المؤلفين
المصالح المتنافسة
معلومات إضافية
المواد التكميلية المتاحة على
https://doi.org/10.1038/s41467-024-44947-3.
http://www.nature.com/reprints
© المؤلفون 2024
مجموعة نظم الأرض والتغيير العالمي، جامعة فاغينينغن والبحث، Droevendaalsesteeg 3، 6708 PB Wageningen، هولندا. معهد بوتسدام لأبحاث تأثير المناخ (PIK)، جمعية لايبنيز، Telegrafenberg A56، 14412 بوتسدام، ألمانيا. جامعة هومبولت، معهد ثاير للعلوم الزراعية والبستانية، Invalidenstr. 42، 10099 برلين، ألمانيا. مركز UFZ-هيلمهولتز للبحث البيئي، قسم نظم الهيدروليك الحاسوبية، لايبزيغ، ألمانيا. قسم الجغرافيا الفيزيائية، جامعة أوترخت، صندوق بريد 80.115، 3508 TC أوترخت، هولندا. – البريد الإلكتروني:mengru.wang@wur.nl
DOI: https://doi.org/10.1038/s41467-024-44947-3
PMID: https://pubmed.ncbi.nlm.nih.gov/38321008
Publication Date: 2024-02-06
A triple increase in global river basins with water scarcity due to future pollution
Accepted: 9 January 2024
Published online: 06 February 2024
(D) Check for updates
Abstract
Water security is at stake today. While climate changes influence water availability, urbanization and agricultural activities have led to increasing water demand as well as pollution, limiting safe water use. We conducted a global assessment of future clean-water scarcity for 2050s by adding the water pollution aspect to the classical water quantity-induced scarcity assessments. This was done for
to changes in water availability, such as river discharge
Results
Water scarcity hotspots of clean water
and clean-water scarcity assessment. Hotspots are sub-basins where either
levels was also dominated by nitrogen pollution. In 2010, more than 2000 sub-basins face potential water scarcity due to moderate water pollution, distributed mainly in South America and Africa, but also in North America, Northern Asia, and Australia (Fig. 2). These sub-basins cover 39% of the global drainage area and 18% of the population lives there. Sub-basins that currently do not face water scarcity issues with high water quality and high water quantity are mostly in sparsely populated regions such as northern parts of North America and Asia, and central parts of Australia (Fig. 2).
Table 1 | The shares (% of the global total) of area (sub-basins drainage area), population, N (nitrogen) losses to rivers from human waste, agriculture land, N fertilizer application in agriculture, N manure application in agriculture, N in harvested crops, and N surplus in agriculture (defined as total N inputs to agriculture minus N outputs by crop uptake and animal grazing) in the ‘Classical water scarcity’ (WS) and ‘Clean-water scarcity’ (CWS) in 2010 and 2050
| Year | % of the global total | |||||||||||||||
| Area | Population | N Human Waste | Agricultural land | N fertilizer | N manure | N Harvested Crop | N surplus in agriculture | |||||||||
| WS | CWS | WS | CWS | WS | CWS | WS | CWS | WS | CWS | WS | CWS | ws | CWS | WS | CWS | |
| 2010 | 18 | 32 | 42 | 80 | 44 | 84 | 26 | 44 | 39 | 84 | 18 | 53 | 28 | 69 | 32 | 69 |
| SSP1-RCP2p6 | 19 | 33 | 45 | 80 | 49 | 82 | 27 | 47 | 34 | 79 | 25 | 64 | 31 | 69 | 32 | 70 |
| SSP2-RCP2p6 | 19 | 37 | 47 | 84 | 50 | 85 | 27 | 53 | 36 | 83 | 26 | 70 | 31 | 75 | 33 | 74 |
| SSP5-RCP8p5 | 19 | 48 | 46 | 91 | 49 | 91 | 28 | 68 | 33 | 89 | 25 | 80 | 32 | 84 | 31 | 84 |
of the scenarios based on the Shared-economic pathways (SSPs) and Representative Concentration Pathways (RCPs) are available in Supplementary Tables S9-S11 in the Supporting Information.| Clean-Water Scarcity | Quantity-based
|
|||
| Low (0-0.2) | Moderate (0.2-0.4) | High (>0.4) | ||
| Quality-based
|
Low (0-0.45) | Hotspot | ||
| Moderate (0.45-1) | Hotspot | |||
| High (
|
Hotspot | Hotspot | Hotspot | |
| The rows and columns with High quantity-based, quality-based, or both quantity- and quality- | ||||
agricultural N surplus in 2050 (this was 69% in 2010). Another important contributor to water pollution in the hotspot sub-basins in SSP5-RCP8p5 is the N losses to rivers from human waste. These N losses are projected to account for 91% of the total global losses due to the high sewage connections and poor wastewater treatment in this economic-first and highly urbanized future scenario.
Water pollution is an important cause of water scarcity
where either the levels of scarcity for water quantity-driven or quality-driven or both are considered high in Table 2. For 2050, clean-water scarcity is calculated for three scenarios: SSP1-RCP2p6, SSP2-RCP2p6, SSP5-RCP8p5. Details of the scenarios based on the Shared-economic pathways (SSPs) and Representative Concentration Pathways (RCPs) are available in Supplementary Tables S9-S11 in the Supporting Information.
Water quantity remains important
Different challenges among hotpots
have improved to high levels, the high food production in China, India, Europe and North America (e.g., Mississippi river) driven by food demand still leads to high N surpluses in agriculture (Supplementary Fig. S20 in SI). In SSP5, pollution is driven worldwide mainly by sewage as described above due to global urbanization and inadequate development of sewage treatment. Atmospheric N deposition and fixation on natural land remain the main source of TDN inputs to rivers in South America and Central Africa in the future, while agricultural N surpluses become increasingly more important in SSP5 (Supplementary Fig. S 20 in SI ).
Discussion
with the study of van Vliet et al.
degree) N dataset from Tian et al.
on their nutrient requirement) to improve nutrient efficiencies of crops such that the crop yield is maintained and food demand is met. It is thus essential to consider the interactions between the abovementioned SDGs in the water scarcity strategies to avoid negative impacts on achieving the goals for food, cities, and climate. Our results about the clean-water scarcity hotspots and their socio-economic and climate characteristics provide a very valuable indication of where and what interactions need to be addressed to mitigate water scarcity as well as ensure sustainable development for other domains of society.
Methods
Clean-water scarcity assessment
Indicators for clean-water scarcity
Modeling framework to assess clean-water scarcity
based (
sources is based on MARINA-Multi-Global-1.0 developed by Strokal et al.
Hotspot analysis
Scenarios
policies and medium meat & dairy diet, not much-improved sewage connection and treatment, not much-changes in water withdrawal, combined with strong climate mitigation and its impacts on hydrology. SSP5-RCP8p5 assumes an urbanized future with fossil-fuel-driven socioeconomic development, low-ambition N policies and meat & dairy-rich diet, improved sewage connection but limited improvements in sewage treatment, high water withdrawal, combine with low climate mitigation and its impacts on hydrology. The scenario assumptions for sewage connection and treatment are available in Supplementary Table S10 in SI and in Strokal et al.
Data availability
Code availability
References
- Oki, T. & Kanae, S. Global hydrological cycles and world water resources. science 313, 1068-1072 (2006).
- Seneviratne, S. I., et al. Weather and climate extreme events in a changing climate. In: Climate Change 2021: The Physical Science Basis. Contribution of Working Group I to the Sixth Assessment Report of the Intergovernmental Panel on Climate Change (Cambridge Univ. Press, Cambridge and New York, 2021).
- Mekonnen, M. & Hoekstra, A. Sustainability: four billion people facing severe water scarcity. Sci. Adv. 2, 1-7 (2016).
- Gosling, S. N. & Arnell, N. W. A global assessment of the impact of climate change on water scarcity. Climatic Change 134, 371-385 (2016).
- Caretta, A. M. M. A., Arfanuzzaman, R. B. M., Morgan, S. M. R. & Kumar, M. Water. In: Climate Change 2022: Impacts, Adaptation, and Vulnerability. Contribution of Working Group II to the Sixth Assessment Report of the Intergovernmental Panel on Climate Change (Cambridge Univ. Press, Cambridge and New York, 2022).
- Liu, J. et al. Water scarcity assessments in the past, present, and future. Earth’s future 5, 545-559 (2017).
- Alcamo, J., Flörke, M. & Märker, M. Future long-term changes in global water resources driven by socio-economic and climatic changes. Hydrological Sci. J. 52, 247-275 (2007).
- Schewe, J. et al. Multimodel assessment of water scarcity under climate change. Proc. Natl Acad. Sci. 111, 3245-3250 (2014).
- Hagemann, S. et al. Climate change impact on available water resources obtained using multiple global climate and hydrology models. Earth Syst. Dyn. 4, 129-144 (2013).
- Haddeland, I. et al. Global water resources affected by human interventions and climate change. Proc. Natl Acad. Sci. 111, 3251-3256 (2014).
- Koutroulis, A. et al. Global water availability under high-end climate change: A vulnerability based assessment. Glob. Planet. Change 175, 52-63 (2019).
- Fekete, B. M., et al. Millennium ecosystem assessment scenario drivers (1970-2050): climate and hydrological alterations. Global Biogeochemical Cycles 24 (2010).
- Hanasaki, N. et al. A global water scarcity assessment under Shared Socio-economic Pathways-Part 2: Water availability and scarcity. Hydrol. Earth Syst. Sci. 17, 2393-2413 (2013).
- Wada, Y. et al. Modeling global water use for the 21st century: The Water Futures and Solutions (WFaS) initiative and its approaches. Geosci. Model Dev. 9, 175-222 (2016).
- Cui, R. Y. et al. Regional responses to future, demand-driven water scarcity. Environ. Res. Lett. 13, 094006 (2018).
- Greve, P. et al. Global assessment of water challenges under uncertainty in water scarcity projections. Nat. Sustain. 1, 486-494 (2018).
- Strokal, M. et al. Urbanization: an increasing source of multiple pollutants to rivers in the 21st century. npj Urban Sustain. 1, 1-13 (2021).
- Li, Y. et al. Multi-pollutant assessment of river pollution from livestock production worldwide. Water Res. 209, 117906 (2022).
- Kroeze, C. et al. Global modelling of surface water quality: a multipollutant approach. Curr. Opin. Environ. Sustain. 23, 35-45 (2016).
- Liu, J. et al. A high-resolution assessment on global nitrogen flows in cropland. Proc. Natl Acad. Sci. 107, 8035-8040 (2010).
- Tian, H. et al. History of anthropogenic Nitrogen inputs (HaNi) to the terrestrial biosphere: a 5 arcmin resolution annual dataset from 1860 to 2019. Earth Syst. Sci. Data 14, 4551-4568 (2022).
- Diaz, R. J. & Rosenberg, R. Spreading dead zones and consequences for marine ecosystems. science 321, 926-929 (2008).
- Garnier, J., Beusen, A., Thieu, V., Billen, G. & Bouwman, L. N: P: Si nutrient export ratios and ecological consequences in coastal seas evaluated by the ICEP approach. Global Biogeochemical Cycles 24 (2010).
- Beusen, A. H., Bouwman, A. F., Van Beek, L. P., Mogollón, J. M. & Middelburg, J. J. Global riverine N and P transport to ocean increased during the 20th century despite increased retention along the aquatic continuum. Biogeosciences 13, 2441-2451 (2016).
- Wang, Y. et al. Effects of anthropogenic disturbances and climate change on riverine dissolved inorganic nitrogen transport. J. Adv. Model. Earth Syst. 12, e2020MS002234 (2020).
- Liu, J., Liu, Q. & Yang, H. Assessing water scarcity by simultaneously considering environmental flow requirements, water quantity, and water quality. Ecol. Indic. 60, 434-441 (2016).
- Zeng, Z., Liu, J. & Savenije, H. H. A simple approach to assess water scarcity integrating water quantity and quality. Ecol. Indic. 34, 441-449 (2013).
- van Vliet, M. T., Flörke, M. & Wada, Y. Quality matters for water scarcity. Nat. Geosci. 10, 800-802 (2017).
- van Vliet, M. T. et al. Global water scarcity including surface water quality and expansions of clean water technologies. Environ. Res. Lett. 16, 024020 (2021).
- Farinosi, F. et al. An innovative approach to the assessment of hydro-political risk: A spatially explicit, data driven indicator of hydro-political issues. Glob. Environ. Change 52, 286-313 (2018).
- Veldkamp, T. et al. Water scarcity hotspots travel downstream due to human interventions in the 20th and 21st century. Nat. Commun. 8, 1-12 (2017).
- Assembly, U. G. Transforming our world: the 2030 agenda for sustainable development, 21 October 2015, (A/RES/70/1, 2015).
- Droppers, B., Franssen, W. H., Van Vliet, M. T., Nijssen, B. & Ludwig, F. Simulating human impacts on global water resources using VIC5. Geosci. Model Dev. 13, 5029-5052 (2019).
- Alcamo, J. et al. Global estimates of water withdrawals and availability under current and future “business-as-usual” conditions. Hydrol. Sci. J. 48, 339-348 (2003).
- Kummu, M., Ward, P. J., de Moel, H. & Varis, O. Is physical water scarcity a new phenomenon? Global assessment of water shortage over the last two millennia. Environ. Res. Lett. 5, 034006 (2010).
- Hanasaki, N. et al. An integrated model for the assessment of global water resources-Part 2: Applications and assessments. Hydrol. Earth Syst. Sci. 12, 1027-1037 (2008).
- Vörösmarty, C. J. et al. Global threats to human water security and river biodiversity. Nature 467, 555-561 (2010).
- De Vries, W., Kros, J., Kroeze, C. & Seitzinger, S. P. Assessing planetary and regional nitrogen boundaries related to food security and adverse environmental impacts. Curr. Opin. Environ. Sustain. 5, 392-402 (2013).
- Yu, C. et al. Managing nitrogen to restore water quality in China. Nature 567, 516-520 (2019).
- Warner, S. SDG Indicator 6.3.2 Technical Guidance Document NO.2: Target Values (UNEP GEMS/Water, 2020).
- Taylor, R. Rethinking water scarcity: The role of storage. EOS Trans. Am. Geophys. Union 90, 237-238 (2009).
- Seneviratne, S., et al. Changes in climate extremes and their impacts on the natural physical environment. In Managing the Risks of Extreme Events and Disasters to Advance Climate Change Adaptation. Special Report of the Intergovernmental Panel on Climate Change (eds. Field, C. B., Barros, V., Stocker, T. F., Qin, D., Dokken, D. J., Ebi, K. L., Mastrandrea, M. D., Mach, K. J., Plattner, G. -K., Allen, S. K., Tignor, M. & Midgley, P. M.) 109-230 (Cambridge Univ. Press, Cambridge and New York, 2012).
- Pastor, A., Ludwig, F., Biemans, H., Hoff, H. & Kabat, P. Accounting for environmental flow requirements in global water assessments. Hydrol. Earth Syst. Sci. 18, 5041-5059 (2014).
- McCrackin, M. L., Harrison, J. A. & Compton, J. E. Factors influencing export of dissolved inorganic nitrogen by major rivers: A new, seasonal, spatially explicit, global model. Glob. Biogeochemical Cycles 28, 269-285 (2014).
- Exner-Kittridge, M. et al. The seasonal dynamics of the stream sources and input flow paths of water and nitrogen of an Austrian headwater agricultural catchment. Sci. Total Environ. 542, 935-945 (2016).
- Wang, M. et al. Accounting for interactions between Sustainable Development Goals is essential for water pollution control in China. Nat. Commun. 13, 730 (2022).
- van Vliet, M. et al. Multi-model assessment of global hydropower and cooling water discharge potential under climate change. Glob. Environ. Change 40, 156-170 (2016).
- Prudhomme, C. et al. Hydrological droughts in the 21st century, hotspots and uncertainties from a global multimodel ensemble experiment. Proc. Natl Acad. Sci. 111, 3262-3267 (2014).
- Elliott, J. et al. Constraints and potentials of future irrigation water availability on agricultural production under climate change. Proc. Natl Acad. Sci. 111, 3239-3244 (2014).
- Haddeland, I. et al. Multimodel estimate of the global terrestrial water balance: setup and first results. J. Hydrometeorol. 12, 869-884 (2011).
- Wada, Y. et al. Multimodel projections and uncertainties of irrigation water demand under climate change. Geophys. Res. Lett. 40, 4626-4632 (2013).
- Wang, M., Kroeze, C., Strokal, M., van Vliet, M. T. & Ma, L. Global change can make coastal eutrophication control in China more difficult. Earths Fut. 8, e2019EF001280 (2020).
- Ascott, M. J. et al. Global patterns of nitrate storage in the vadose zone. Nat. Commun. 8, 1416 (2017).
- Van Meter, K. J., Basu, N. B. & Van Cappellen, P. Two centuries of nitrogen dynamics: Legacy sources and sinks in the Mississippi and
55. Beusen, A. et al. Exploring river nitrogen and phosphorus loading and export to global coastal waters in the Shared Socio-economic pathways. Glob. Environ. Change 72, 102426 (2022).
56. Wang, J., Li, Y., Huang, J., Yan, T. & Sun, T. Growing water scarcity, food security and government responses in China. Glob. Food Security 14, 9-17 (2017).
57. Gasbarro, F., Rizzi, F. & Frey, M. Adaptation measures of energy and utility companies to cope with water scarcity induced by climate change. Bus. Strategy Environ. 25, 54-72 (2016).
58. Alam, K. Farmers’ adaptation to water scarcity in drought-prone environments: A case study of Rajshahi District, Bangladesh. Agric. water Manag. 148, 196-206 (2015).
59. Grizzetti, B., Pretato, U., Lassaletta, L., Billen, G. & Garnier, J. The contribution of food waste to global and European nitrogen pollution. Environ. Sci. Policy 33, 186-195 (2013).
60. Springmann, M. et al. Options for keeping the food system within environmental limits. Nature 562, 519-525 (2018).
61. Kanter, D. R. et al. Nitrogen pollution policy beyond the farm. Nat. Food 1, 27-32 (2020).
62. Houlton, B. Z. et al. A world of cobenefits: solving the global nitrogen challenge. Earths Future 7, 865-872 (2019).
63. Beusen, A. H. W. et al. Exploring river nitrogen and phosphorus loading and export to global coastal waters in the Shared Socio-economic pathways. Glob. Environ. Change 72, 102426 (2022).
64. Bodirsky, B. L. et al. Reactive nitrogen requirements to feed the world in 2050 and potential to mitigate nitrogen pollution. Nat. Commun. 5, 1-7 (2014).
65. Strokal, M. et al. Global multi-pollutant modelling of water quality: scientific challenges and future directions. Curr. Opin. Environ. Sustain. 36, 116-125 (2019).
66. Li, A., Wang, M., Kroeze, C., Ma, L. & Strokal, M. Past and future pesticide losses to Chinese waters under socioeconomic development and climate change. J. Environ. Manag. 317, 115361 (2022).
67. Strokal, V. et al. Future microplastics in the Black Sea: River exports and reduction options for zero pollution. Mar. Pollut. Bull. 178, 113633 (2022).
68. Uddin, M. G., Nash, S. & Olbert, A. I. A review of water quality index models and their use for assessing surface water quality. Ecol. Indic. 122, 107218 (2021).
69. Parween, S., Siddique, N. A., Mahammad Diganta, M. T., Olbert, A. I. & Uddin, M. G. Assessment of urban river water quality using modified NSF water quality index model at Siliguri city, West Bengal, India. Environ. Sustain. Indic. 16, 100202 (2022).
70. Uddin, M. G., Nash, S., Rahman, A. & Olbert, A. I. A sophisticated model for rating water quality. Sci. Total Environ. 868, 161614 (2023).
71. Sutadian, A. D., Muttil, N., Yilmaz, A. G. & Perera, B. Development of river water quality indices-a review. Environ. Monit. Assess. 188, 1-29 (2016).
72. Xue, L., Weng, L. & Yu, H. Addressing policy challenges in implementing Sustainable Development Goals through an adaptive governance approach: A view from transitional China. Sustain. Dev. 26, 150-158 (2018).
73. Pradhan, P., Costa, L., Rybski, D., Lucht, W. & Kropp, J. P. A systematic study of sustainable development goal (SDG) interactions. Earths Fut. 5, 1169-1179 (2017).
74. Nilsson, M. et al. Mapping interactions between the sustainable development goals: lessons learned and ways forward. Sustain. Sci. 13, 1489-1503 (2018).
75. Flörke, M., Bärlund, I., van Vliet, M. T. H., Bouwman, A. F. & Wada, Y. Analysing trade-offs between SDGs related to water quality using salinity as a marker. Curr. Opin. Environ. Sustain. 36, 96-104 (2019).
76. Liu, K., Cao, W., Zhao, D., Liu, S. & Liu, J. Assessment of ecological water scarcity in China. Environ. Res. Lett. 17, 104056 (2022).
77. Ma, T. et al. Pollution exacerbates China’s water scarcity and its regional inequality. Nat. Commun. 11, 650 (2020).
78. Alcamo, J., Henrichs, T. & Rosch, T. World water in 2025. World water series report 2 (2000).
79. Kanter, D. R. et al. A framework for nitrogen futures in the shared socioeconomic pathways. Glob. Environ. Change 61, 102029 (2020).
80. Dietrich, J. P. et al. MAgPIE 4 – a modular open-source framework for modeling global land systems. Geosci. Model Dev. 12, 1299-1317 (2019).
81. Modi, P., Hanasaki, N., Yamazaki, D., Boulange, J. E. S. & Oki, T. Sensitivity of subregional distribution of socioeconomic conditions to the global assessment of water scarcity. Commun. Earth Environ. 3, 144 (2022).
82. Stehfest, E., van Vuuren, D., Bouwman, L. & Kram, T. Integrated assessment of global environmental change with IMAGE 3.0: Model description and policy applications (Netherlands Environmental Assessment Agency (PBL), 2014).
83. Arnold, J. G. et al. SWAT: Model use, calibration, and validation. Trans. ASABE 55, 1491-1508 (2012).
84. Fink, G., Alcamo, J., Flörke, M. & Reder, K. Phosphorus loadings to the world’s largest lakes: sources and trends. Glob. Biogeochemical Cycles 32, 617-634 (2018).
85. Liu, S. et al. Effects of anthropogenic nitrogen discharge on dissolved inorganic nitrogen transport in global rivers. Glob. change Biol. 25, 1493-1513 (2019).
86. Alcamo, J. & Henrichs, T. Critical regions: a model-based estimation of world water resources sensitive to global changes. Aquat. Sci. 64, 352-362 (2002).
87. Hanasaki, N., Yoshikawa, S., Pokhrel, Y. & Kanae, S. A quantitative investigation of the thresholds for two conventional water scarcity indicators using a state-of-the-art global hydrological model with human activities. Water Resour. Res. 54, 8279-8294 (2018).
88. Lake County Water Atals. Learn More About Trophic State Index (TSI) – Lake, http://www.lake.wateratlas.usf.edu/library/learn-more/ learnmore.aspx?toolsection=lm_tsi. (2002).
Acknowledgements
Author contributions
Competing interests
Additional information
supplementary material available at
https://doi.org/10.1038/s41467-024-44947-3.
http://www.nature.com/reprints
© The Author(s) 2024
Earth Systems and Global Change Group, Wageningen University & Research, Droevendaalsesteeg 3, 6708 PB Wageningen, The Netherlands. Potsdam Institute for Climate Impact Research (PIK), Leibniz Association, Telegrafenberg A56, 14412 Potsdam, Germany. Humboldt University, Thaer-Institute of Agricultural and Horticultural Sciences, Invalidenstr. 42, 10099 Berlin, Germany. UFZ-Helmholtz Centre for Environmental Research, Department of Computational Hydrosystems, Leipzig, Germany. Department of Physical Geography, Utrecht University, PO Box 80.115, 3508 TC Utrecht, the Netherlands. – e-mail: mengru.wang@wur.nl