سجلات جديدة لدرجات حرارة المحيطات ومؤشرات المناخ ذات الصلة في عام 2023 New Record Ocean Temperatures and Related Climate Indicators in 2023

المجلة: Advances in Atmospheric Sciences، المجلد: 41، العدد: 6
DOI: https://doi.org/10.1007/s00376-024-3378-5
تاريخ النشر: 2024-01-11

– ورقة أصلية –

ليجينغ تشينغ جون أبراهام كيفن إي. ترينبرث تيم بوير مايكل إي. مان جيانغ زو فان وانغ فوجيانغ يو ريكاردو لوكاريني جون فاسولو في زينغ يوانلونغ لي بين زانغ ليينغ وان شينغ رونغ تشين داكوي وانغ ليتشينغ فنج شيانغتشو سونغ يولونغ ليو فرانكو ريزغيتي سيمونا سيمونشيللي فيكتور غوريستكي جينغشين تشين أليكسي ميشونوف جيم ريجان كارينا فون شوكمان يويينغ بان زيتاو تان يوجينغ زو وانغشو وي غوانتشينغ تشيوبينغ رين ليجوان ، ويانغ المركز الدولي لعلوم المناخ والبيئة، معهد الفيزياء الجوية، الأكاديمية الصينية للعلوم، بكين 100029، الصين جامعة سانت توماس، كلية الهندسة، مينيسوتا 55105، الولايات المتحدة الأمريكية المركز الوطني لأبحاث الغلاف الجوي NSF، بولدر، كولورادو 80307، الولايات المتحدة الأمريكية جامعة أوكلاند، أوكلاند 1010، نيوزيلندا الإدارة الوطنية للمحيطات والغلاف الجوي، المراكز الوطنية لمعلومات البيئة، سيلفر سبرينغ، ماريلاند 20910، الولايات المتحدة الأمريكية قسم علوم الأرض والبيئة، جامعة بنسلفانيا، فيلادلفيا، بنسلفانيا 19104، الولايات المتحدة الأمريكية معهد المحيطات، الأكاديمية الصينية للعلوم، تشينغداو 266071، الصين مركز التنبؤ البيئي البحري الوطني، وزارة الموارد الطبيعية في الصين، بكين 100081، الصين مركز بيانات المحيطات، الأكاديمية الصينية للعلوم، تشينغداو 266071، الصين كلية علوم المحيطات، جامعة هوهai، نانجينغ 210098، الصين الهيئة الوطنية للبيانات والمعلومات البحرية، تيانجين 300171، الصين الوكالة الوطنية الإيطالية للتقنيات الجديدة والطاقة والتنمية الاقتصادية المستدامة، مركز أبحاث سان تيريزا، ليريشي 19032، إيطاليا المعهد الوطني للجيوفيزياء وعلم البراكين، فرع بولونيا، بولونيا 40128، إيطاليا معهد المحيطات في بحر الصين الجنوبي، الأكاديمية الصينية للعلوم، قوانغتشو 510301، الصين إيسيك/سيزيس-إم دي، جامعة ماريلاند، كوليج بارك، ماريلاند، 20740، الولايات المتحدة الأمريكية ميركاتور أوشن إنترناشيونال، تولوز 31400، فرنسا مركز المراقبة والبحث البيئي الإيكولوجي، إدارة البيئة والإيكولوجيا في وادي نهر اللؤلؤ وبحر الصين الجنوبي، وزارة الإيكولوجيا والبيئة، جمهورية الصين الشعبية، قوانغتشو 510611، الصين المركز الوطني لمعلومات الأرصاد الجوية، إدارة الأرصاد الجوية الصينية، بكين 100081، الصين المركز الدولي للبحوث في البيانات الضخمة من أجل أهداف التنمية المستدامة، بكين 100094، الصين

(تاريخ الاستلام 23 ديسمبر 2023؛ تاريخ المراجعة 9 يناير 2024؛ تاريخ القبول 9 يناير 2024)

الملخص

لقد تم تغيير البيئة الفيزيائية والبيوجيوكيميائية العالمية بشكل كبير استجابةً لزيادة غازات الدفيئة في الغلاف الجوي الناتجة عن الأنشطة البشرية. في عام 2023، وصلت درجة حرارة سطح البحر (SST) ومحتوى حرارة المحيط في عمق 2000 متر (OHC) إلى مستويات قياسية. في عام 2023 تجاوزت تلك الخاصة بعام 2022 بـ ( 1 زيتا جول جول) (بيانات IAP/CAS المحدثة)؛ (بيانات NCEI/NOAA). سجل المحيط الأطلسي الاستوائي والبحر الأبيض المتوسط والمحيطات الجنوبية أعلى مستوى لحرارة المحيطات منذ الخمسينيات. وبالتزامن مع بداية ظاهرة النينيو القوية، وصلت درجة حرارة سطح البحر العالمية إلى أعلى مستوى لها في عام 2023 بمتوسط سنوي قدره أعلى من 2022 و مذهل فوق قيم 2022 للنصف الثاني من 2023. وصلت مؤشرات تدرج الكثافة وعدم تجانس درجة الحرارة المكاني إلى أعلى قيمها في 2023.

الكلمات الرئيسية: محتوى حرارة المحيط، الملوحة، التراصف، الاحترار العالمي، المناخ
الاقتباس: تشينغ، ل. ج.، والمؤلفون المشاركون، 2024: سجلات جديدة لدرجات حرارة المحيطات ومؤشرات المناخ ذات الصلة في 2023. علوم الغلاف الجوي المتقدمة، 41(6)، 1068-1082،https://doi.org/10.1007/s00376-024-3378-5.

نقاط بارزة في المقال:

  • في عام 2023، كانت متوسط درجة حرارة سطح البحر السنوي العالمي ومحتوى حرارة المحيط في أعلى 2000 متر هما الأعلى على الإطلاق المسجل بواسطة الأدوات الحديثة.
  • حققت مؤشرات محيطية أخرى، بما في ذلك تدرج الكثافة وعدم تجانس درجة الحرارة المكاني، مستويات قياسية.
  • تطور ظاهرة النينيو القوية خلال عام 2023 وأثرت على أنماط الاحترار والشذوذ في الملوحة.

1. المقدمة

زيادة في ثاني أكسيد الكربون ) وغيرها من غازات الدفيئة في الغلاف الجوي الناتجة عن الأنشطة البشرية أدت إلى زيادة في الإشعاع طويل الموجة المحتجز داخل نظام الأرض، مما نتج عنه زيادة في الفرق بين الإشعاع الوارد والصادر في قمة الغلاف الجوي، مما تسبب في عدم توازن طاقة الأرض (EEI) (ترينبرث وآخرون، 2014؛ غوليف وآخرون، 2021). مع حوالي الحرارة الزائدة المتراكمة في نظام الأرض المودعة في محيطات العالم، تسبب ارتفاع درجات حرارة المحيطات وزيادة محتوى حرارة المحيط (OHC) (راين وآخرون، 2013؛ جونسون وآخرون، 2018؛ فون شكويمان وآخرون، 2020؛ لوبي وآخرون، 2021؛ تشينغ وآخرون، 2023). كل من محتوى حرارة المحيط وارتفاع مستوى سطح البحر المرتبط بهما (SLR) هما مؤشرات قوية على تغير المناخ لأنهما يمتلكان نسب إشارة إلى ضوضاء أكبر من تغير درجة حرارة السطح (تشينغ وآخرون، 2018). كما يلعب محتوى حرارة المحيط أدوارًا أساسية في دورات الطاقة والمياه والكربون في الأرض (تشينغ وآخرون، 2022أ) ويؤثر بشكل كبير على المجتمع البشري (أبراهام وتشينغ، 2022).
علاوة على ذلك، فإن تغير المياه العذبة في المحيط، الذي ينعكس في التغيرات في ملوحة المحيط، يجمع التغيرات في دورة المياه الجوية ودوران المحيط، وهذه التغيرات، إلى جانب
مع تغيرات درجة الحرارة، تنظم تيارات المحيطات وتؤثر على الاستقرار العمودي للمحيط. تُميز اتجاهات ملوحة المحيطات عمومًا بنمط تغيير “المالح يصبح أكثر ملوحة، والعذب يصبح أكثر عذوبة”، مما يعني أن المناطق التي هي حاليًا عذبة تصبح أكثر عذوبة، والمناطق التي هي حاليًا مالحة تصبح أكثر ملوحة (دوراك وويفيلز، 2010). يمكن قياس هذه العملية بواسطة مؤشر “تباين الملوحة” (SC) الذي يحسب الفرق في الملوحة بين المناطق ذات الملوحة العالية والمنخفضة مقارنةً بمتوسط عالمي (تشنغ وآخرون، 2020).
هذه التغيرات في درجة حرارة المحيط وملوحة المياه ليست متجانسة مكانياً. حيث أن التغيرات غير متساوية، فقد زادت تباينات حقول درجة حرارة المحيط الثلاثية الأبعاد في الطبقات العليا حتى عمق 2000 متر (Ren et al., 2022). عمودياً، تتغير هياكل درجة حرارة المحيط وكثافته، مما يؤدي إلى تغييرات في التراص العمودي (Li et al., 2020a)، والتي تؤثر بدورها على التبادلات العمودية للطاقة والمياه والكربون والمواد المغذية وغيرها من المواد.
بدأ عام 2023 كالسنة الثالثة من ظاهرة النينيا المطولة التي تلاشت بحلول أبريل، حيث ارتفعت درجات حرارة سطح البحر (SSTs) في المحيط الهادئ الاستوائي المركزي والشرقي مع بداية ظاهرة النينيو الكبرى الجديدة (الشكل 1). بحلول أواخر عام 2023، تم تصنيف النينيو على أنه “قوي”. لـمؤشر نينيو المحيطي)، مع توقعات لدرجات حرارة سطح البحر في نينيو 3.4 تتجاوز في
الشكل 1. مؤشر ENSO (مؤشر نينيو المحيطي، ONI)، محسوب بناءً على متوسط متحرك لمدة 3 أشهر لدرجة حرارة سطح البحر المعاد بناؤها موسعًا، الإصدار 5 (ERSST.v5): شذوذات درجة حرارة سطح البحر في منطقة نينيو3.4 ( )] (تظليل) [البيانات محدثة من هوانغ وآخرون (2017)]. التنبؤ لمؤشر النينيو-النينيا لشهر ديسمبر 2023 يعتمد على نظام التنبؤ الجماعي للنينيو-النينيا IAP (تشنغ وزو، 2016؛ لي وآخرون، 2023).
نوفمبر وديسمبر 2023 (الشكل 1). الـ استمر التركيز في الغلاف الجوي في الزيادة في عام 2023 وهو أكثر من فوق المستويات ما قبل الصناعية. في مونا لوا، هاواي، ارتفع المتوسط في نوفمبر 2023 إلى 420.46 جزء في المليون بالحجم (ppm)، بزيادة قدرها حوالي 3 ppm مقارنة بنوفمبر 2022.https://gml.noaa.gov/ccgg/الاتجاهات/). لقد ظل مؤشر EEI فوق على مدار السنوات الأخيرة (لوب وآخرون، 2022). وهذا يعادل زيادة في الطاقة قدرها . إذا كان التسخين تحت 2000 متر حوالي (بيركي وجونسون، 2010) و من الـ EEI يدخل إلى المحيط، ثم من المتوقع أن يكون في المحيط على عمق يزيد عن 2000 متر.
كانت درجات حرارة سطح البحر المرتفعة جداً في المناطق خارج المناطق الاستوائية في عام 2023 نتيجة جزئية على الأقل لظاهرة النينيا السابقة، حيث أدت درجات حرارة السطح الباردة إلى تقليل درجات حرارة التروبوسفير والإشعاع الطويل الموجة الخارج. في شمال المحيط الهادئ، غذت درجات حرارة المحيط المرتفعة الأنهار الجوية و”قنابل المطر” التي أدت إلى فيضانات واسعة النطاق ولكن أيضاً إلى تخفيف من الجفاف المستمر في العديد من مناطق غرب أمريكا الشمالية. كما حدثت فيضانات شديدة في نيوزيلندا، بكين/ الصين، ألاسكا، الهند، إيطاليا، سلوفينيا، اليابان، فيرمونت، كينيا، وشرق إفريقيا. شهدت الولايات الجنوبية في الولايات المتحدة، الصين، الهند، جنوب أوروبا (إسبانيا، البرتغال، إيطاليا، اليونان، فرنسا) وأماكن أخرى موجات حر قياسية. كما رافقت حرائق الغابات عدة مناطق شهدت حرارة قياسية و/أو جفاف خلال عام 2023. سجلت العديد من الدول أرقام قياسية في درجات الحرارة وسجلت أدنى مستويات الجليد البحري على الإطلاق خلال الشتاء الجنوبي حول القارة القطبية الجنوبية. كانت موسم أعاصير الأطلسي نشطاً، خاصة بالنظر إلى أنه كان عاماً من النينيو حيث عادة ما يتم كبح نشاط العواصف. في شرق المحيط الهادئ، تطور إعصار أوتيس بمعدل قياسي إلى عاصفة من الفئة 5 في أقل من يوم قبل أن يضرب اليابسة بالقرب من أكابولكو، المكسيك، في أواخر أكتوبر. كانت نتائج العديد من هذه الأحداث مدمرة من حيث الأرواح المفقودة، والاضطراب، والأضرار. هذه التغيرات المناخية لها عواقب اجتماعية وبيئية عميقة (أبراهام وآخرون، 2022).
تقدم هذه الورقة تحديثًا حول التغيرات المحيطية المختلفة في عام 2023 باستخدام منتجين بيانات مختلفين: (1) معهد الفيزياء الجوية (IAP) في الأكاديمية الصينية للعلوم (CAS) (تشنغ وآخرون، 2017، 2020؛ لي وآخرون، 2020أ)؛ (2) المراكز الوطنية لمعلومات البيئة (NCEI) في الإدارة الوطنية للمحيطات والغلاف الجوي (NOAA) (ليفيتوس وآخرون، 2012). نحن ندرج OHC، SST، مؤشر SC، التدرج، ومؤشرات عدم تجانس درجة الحرارة المكاني لوصف التغيرات المحيطية في عام 2023.

2. البيانات والأساليب

تم الحصول على بيانات المصدر من قياسات في الموقع المتاحة من خلال قاعدة بيانات المحيطات العالمية (WOD) (Boyer et al.، 2018)، وهي المصدر الرئيسي لجميع منتجات البيانات. النظام الرئيسي لمراقبة الأعماق منذ عام 2005 هو العوامات المخصصة من برنامج Argo (Argo، 2023)، بينما تشمل مصادر البيانات الأخرى، بيانات XBT من السفن المتاحة، وبيانات الموصلية ودرجة الحرارة والعمق (CTD).
تساهم السفن البحثية، والحيوانات المجهزة بالأدوات، والطائرات الانزلاقية، والعوامات المربوطة، والمقاييس المرتبطة بالجليد، في تعزيز الملاحظات على مستوى العالم وتعتبر مصادر رئيسية في البحار الضحلة/رفوف القارات، والمناطق المغطاة بالجليد الموسمي في العروض العليا. تنشأ الفروقات بين منتجات البيانات من الملاحظات الإضافية في الموقع التي تمتلكها مركز البيانات، ومراقبة جودة البيانات (QC)، وعلم المناخ، والتداخل العمودي، وسد الفجوات، وتقنيات معالجة البيانات الأخرى (أبراهام وآخرون، 2013؛ بوير وآخرون، 2016؛ تشينغ وآخرون، 2022أ). تُستخدم جميع البيانات instrumentية لمنتجات IAP/CAS وNCEI/NOAA. يقدم هذا البحث أحدث المعلومات من IAP/CAS وNCEI/NOAA لعام 2023، مع دمج أحدث تقنيات معالجة جودة البيانات ورسم الخرائط. كل من مجموعات بيانات IAP/CAS وNCEI/NAA هي منتجات مصفوفة شهرية، ولديها الدقة الأفقية، وتغطي أعلى 2000 متر من المحيط.
قدمت IAP تحديثًا كبيرًا في عام 2023 استنادًا إلى إصدار سابق في تشينغ وآخرون (2017)؛ نظام مراقبة جودة البيانات المسمى نظام مراقبة الجودة لمركز بيانات المحيطات CAS-Ocean Data Center (CODC-QC) (تان وآخرون، 2023)، حيث يتم الاحتفاظ فقط بالبيانات “الجيدة” (علامة تم تصحيح انحيازات XBT بواسطة مخطط محدث في تشينغ وآخرون (2014) تم تعديله وتوسيعه حتى عام 2023. تم تصحيح انحيازات جهاز قياس الحرارة الميكانيكي (MBT) باستخدام مخطط جديد متاح من غوريستكي وتشينغ (2020). تم تطبيق تصحيح لانحياز منهجي كبير في بيانات الزجاجات باستخدام مخطط تصحيح مقترح حديثًا (غوريستكي وآخرون، 2022). تم أيضًا تطبيق تصحيحات الانحياز لملفات درجة الحرارة من المستشعرات المرفقة بالحيوانات البحرية كما أوصى به غوريستكي وآخرون (2023). معًا، أدت هذه التغييرات في إجراءات مراقبة الجودة وتصحيحات الانحياز إلى اتجاه أقوى لحرارة المحيط العلوي (OHC) على المدى الطويل من 1960 إلى 2023 ومن 2005 إلى 2023.
بالنسبة لبيانات NCEI/NOAA، يتم استخدام نهج تحليل موضوعي من Levitus وآخرون (2012) للتداخل المكاني. يتم تصحيح انحيازات XBT باستخدام نهج Levitus وآخرون (2009). يفترض تحليل NCEI عدم وجود تغيير في درجة الحرارة حيث لا توجد بيانات، مما سيؤدي إلى تقدير أقل لحرارة المحيط في المناطق التي لا توجد بها بيانات. ومع ذلك، بسبب نظام أرجو ومكونات أخرى من نظام مراقبة المحيط، فإن التغطية منذ عام 2005 أكبر من من المحيط العالمي إلى عمق 2000 متر. جانب آخر من إجراء NCEI الذي يمكن أن يؤدي إلى تقدير منخفض لحرارة المحيط هو تصنيف ملفات Argo في الدوامات المقياسية وغيرها من الميزات المحيطية، والتي في السنوات الأخيرة تكون أكثر من خمسة انحرافات معيارية عن المتوسط طويل الأجل (1955-2006) للمنطقة الجغرافية التي يتم مواجهتها فيها، وبالتالي يتم تصنيفها كقيم شاذة ولا يتم تضمينها في حساب التكامل العالمي لحرارة المحيط (Tan et al., 2023). بينما يتم اتخاذ خطوات لتعديل خطوات ضمان الجودة لأخذ ميزات المحيط الدافئ في الاعتبار، فإن تقديرات NCEI المقدمة هنا لا تمثل هذه الميزات بالكامل في التكامل العالمي. والنتيجة هي أن تقديرات NCEI تعتبر بالتالي محافظة بطبيعتها.
تم استخدام مجموعة بيانات إعادة التحليل الإضافية (إسكودير وآخرون، 2021؛ نيغام وآخرون، 2021) (CMS-MEDREA) لتقييم التغيرات في البحر الأبيض المتوسط. قامت CMS-MEDREA بدمج بيانات XBT وCTD وArgo، مدمجة البيانات من CMS والبحر-
DataNet (https://www.seadatanet.org/) وبيانات مستوى سطح البحر على طول المسار من الأقمار الصناعية CMS (إسكويدير وآخرون، 2021). يتم إنتاج هذا المنتج بواسطة نظام عددي يتكون من نموذج هيدروديناميكي مزود من قبل نواة النمذجة الأوروبية للمحيط ونظام استيعاب بيانات تبايني. دقة الشبكة الأفقية للنموذج هي (حول )، مع 141 مستوى عمودي غير متساوي المسافات.
ال يتم حساب المؤشر (تشنغ وآخرون، 2020) لكل شهر فوق الثلاثي الأبعاد مجال ملوحة المحيط كما يلي:
أين ( ) هي خطوط العرض، خطوط الطول، والعمق؛ هو متوسط الملوحة حيث تكون الملوحة أعلى من الوسيط العالمي المناخي ; و هو متوسط الملوحة حيث تكون الملوحة أقل من الوسيط العالمي المناخي و تُحدد بناءً على مجال الملوحة المناخية خلال الفترة من 1960 إلى 2017. تُستخدم بيانات IAP/CAS لحساب مؤشر SC.
يتم حساب تصنيف المحيطات (Li et al., 2020a) على أنه تردد الطفو المربع :
أين ، و تشير إلى كثافة مياه البحر، والانحراف المحتمل المحلي في الكثافة، وتسارع الجاذبية، على التوالي. الكمية يمثل تردد برونت-فيسال – التردد الجوهري للموجات الداخلية.
مؤشر عدم التجانس المكاني يحدد انتشار خصائص كتلة الماء في الفضاء مثل درجة الحرارة (رين وآخرون، 2022)، تم حسابه كمعيار انحراف مكاني مرجح بالحجم (SSD) على عمق 2000 متر العلوي من المحيط العالمي على النحو التالي:
أين ( تمثل ) خط الطول، خط العرض، العمق، والوقت؛ هو الحجم المركز عند نقطة شبكة معينة ( ); هو عدد نقاط الشبكة في المحيط العالمي، و يمثل القيمة المتوسطة المكانية الموزونة حسب الحجم. تشير إلى الملكية متجانس مكانيًا.

3. التغيرات العالمية في المحيطات من حيث محتوى الحرارة المحيطية، والملوحة، والتصنيف الطبقي

3.1. درجة حرارة OHC والسطح

تظهر التغيرات في محتوى الحرارة المحيطية العالمية في عمق 2000 متر منذ عام 1958 (الشكل 2) أنه، بغض النظر عن تقنيات المعالجة، كان هناك اتجاه واضح لارتفاع درجة حرارة المحيطات في
في العقود الأخيرة. ارتفعت درجة حرارة الجزء العلوي من المحيطات العالمية بمتوسط قدره 2000 متر خلال الفترة من 1958 إلى 2023 (IAP/CAS) و بواسطة خلال الفترة من 1958 إلى 2020 (تقدير خمس سنوات من NCEI/NOAA). تُحسب مستويات الثقة باستخدام نهج تشينغ وآخرون (2022ب). ومع ذلك، فإن هذه الاتجاهات لا تتطابق ضمن حدود الخطأ، ربما بسبب (1) الافتراضات المحافظة من NOAA عندما لا توجد بيانات (الاسترخاء إلى المناخ في فجوات البيانات)، خاصة في ظل وجود اتجاهات الاحترار العالمي؛ و(2) الفرق في تصحيح انحياز XBT/MBT والإدراج الجديد لتصحيح انحياز بيانات الزجاجات (غوريتسكي وتشينغ، 2020؛ غوريتسكي وآخرون، 2022).
بغض النظر عن التقدير المستخدم، فقد حدث زيادة بمقدار من مرتين إلى ثلاث مرات في معدل الزيادة في حرارة المحيطات منذ أواخر الثمانينيات. على سبيل المثال، وفقًا لتحليل IAP، فإن اتجاه حرارة المحيطات للفترة من 1958 إلى 1985 هو ، ومنذ عام 1986، فإن اتجاه OHC هو (الشكل 2). اتجاه IAP خلال الفترة من 1958-1985 من أعلى من الإصدار السابق في تشينغ وآخرون (2023) ( )، وذلك أساسًا بسبب الإدراج الجديد لتصحيح انحياز بيانات الزجاجة.
بعد عام 2007، مع تحسين التغطية العالمية لبيانات قاع المحيطات، تم تقليل عدم اليقين في حرارة المحيطات. هناك اتجاه واضح للاحتباس الحراري. و من 2007-2023 لـ IAP/CAS و NCEI/NOAA (سلاسل زمنية موسمية)، على التوالي (الشكل 2). تقدير OHC لمدة ثلاثة أشهر من NCEI لديه اتجاه أقوى قليلاً من سلسلة البيانات الخماسية من 2005 إلى 2020، مما يشير إلى تأثير التغييرات في أخذ العينات المرتبطة بنهج الرسم البياني.
يميل محتوى الحرارة المحيطية (OHC) إلى الوصول إلى ذروته قبل فترة قصيرة ثم ينخفض خلال وبعد حدث النينيو، مرتبطًا بإطلاق الحرارة من المحيط إلى الغلاف الجوي، بشكل رئيسي من خلال زيادة التبخر (تشنغ وآخرون، 2019). في عام 2023، كان محتوى الحرارة المحيطية في أعلى مستوى تم تسجيله على الإطلاق في محيطات العالم، وقد لا تكون آثار النينيو واضحة بالكامل بعد. يتجاوز محتوى الحرارة المحيطية في الطبقة العليا حتى عمق 2000 متر في عام 2023 ما كان عليه في عام 2022 بـ وفقًا لبيانات IAP/CAS، و وفقًا لبيانات NCEI/NOAA (لعمق 0-2000 متر؛ يتم تقديم فترة الثقة 95٪؛ الجدول 1). يتم تقديم ترتيب مصنف لأعلى خمس سنوات في درجة حرارة المحيطات العالمية في الجدول 1. القيم السنوية لدرجة حرارة المحيطات من 2019 إلى 2022 المحدثة في هذه الورقة (الجدول 1) هي بشكل جماعي أعلى ( أكثر من الأرقام في الإصدار السابق (تشن وآخرون، 2023)، بسبب تحديث مجموعة بيانات IAP/CAS التي أدت إلى زيادة شذوذ OHC بعد عام 2019 مقارنة بالخط الأساسي من 1981 إلى 2010. تشير التحليلات الأولية إلى أن الفرق يُعزى على الأرجح إلى استبدال نظام WOD-QC (المستخدم في التحليلات السابقة لـ IAP) بأنظمة CODC-QC الجديدة. أشار تان وآخرون (2023) إلى أن نظام WOD-QC قد أزال المزيد من الشذوذ الإيجابي مقارنةً بـ CODC-QC. تصحيحات التحيز للبيانات التي تم جمعها بواسطة الحيوانات البحرية تلعب دورًا ثانويًا. يُعزى الفرق في قيم OHC لعام 2023 بين المجموعتين أيضًا بشكل أساسي إلى جودة البيانات، والتي تتعلق بكيفية تعريف الشواذ وتحديدها مع مساهمة ثانوية من نهج الخرائط. يتطلب الأمر تحقيقًا دقيقًا للتوفيق بين تقديرات المجموعتين.
الشكل 2. الحرارة المحتواة في المحيطات العالمية في الطبقة العليا حتى عمق 2000 متر من 1958 حتى 2023 وفقًا لـ (أ) IAP/CAS و (ب) NCEI/NOAA ). تُظهر الخط (أ) القيم الشهرية و(ب) القيم الموسمية، ويقدم الرسم البياني (أ) الشذوذات السنوية و(ب) الشذوذات الخماسية بالنسبة لخط الأساس من 1981 إلى 2010.
الجدول 1. الترتيب المصنف لأكثر خمس سنوات حرارة في محيطات العالم منذ عام 1955. قيم OHC هي لعمق 2000 متر العلوي بوحدات ZJ. قيم SST هي في كلا من شذوذ OHC و SST مرتبطان بمتوسط الفترة من 1981 إلى 2010. لاحظ أن قيم IAP/CAS أعلى بشكل جماعي. ) من الإصدار السابق (تشن وآخرون، 2023) بسبب تحديث مجموعة بيانات IAP/CAS التي أدت إلى زيادة في شذوذ OHC مقارنةً بقاعدة البيانات من 1981 إلى 2010.
رتبة سنة OHC (IAP/CAS) (الوحدات: ZJ) OHC (NCEI/NOAA) (الوحدات: زJ) شذوذ درجة حرارة سطح البحر (IAP/CAS) (الوحدات: )
1 ٢٠٢٣ 286 247 0.54
2 ٢٠٢٢ ٢٧١ 238 0.31
٣ ٢٠٢١ 254 229 0.28
٤ ٢٠٢٠ 237 211 0.38
٥ 2019 228 ٢١٠ 0.40
خلال حدث النينيو، يحدث إعادة توزيع للحرارة من طبقة 100-500 متر إلى الطبقات العليا. طبقة، مما يؤدي إلى ارتفاع درجة حرارة سطح البحر (SST) أعلى من المعتاد (تشنغ وآخرون، 2019). يؤدي ارتفاع درجة حرارة سطح البحر غير الطبيعي إلى ارتفاع متوسط درجة حرارة السطح العالمية (GMST) (ترينبرث وآخرون 2002؛ لي وآخرون، 2024). في عام 2023، أصبحت درجة حرارة سطح البحر الأعلى على الإطلاق بعد أبريل، وكان المتوسط السنوي هو أعلى من عام 2022 وشيء مذهل أعلى من متوسط 1981-2020 (الشكل 3). بحلول يونيو 2023، كانت درجات حرارة سطح البحر العالمية الشهرية قد بلغت بالفعل أعلى من أي سنة سابقة، قيمة كبيرة للغاية (الشكل 3) مما يعني أيضًا أن متوسط درجات حرارة السطح العالمية كان الأعلى على
سجل. انحراف درجة حرارة سطح البحر الشهري في عام 2023 مقارنةً بالفترة من 1981 إلى 2010 زاد من في يناير إلى في سبتمبر، مما يجعل سبتمبر 2023 أكثر الشهور حرارة على الإطلاق بالنسبة لدرجات حرارة سطح البحر العالمية. عادةً ما يحدث أكثر الشهور حرارة لدرجات حرارة سطح البحر في سنة معينة في مارس، في نهاية الصيف الجنوبي، لأن هناك منطقة محيطية كبيرة في نصف الكرة الجنوبي (الشكل 3، مخطط الصندوق الداخلي). على الرغم من أن درجات حرارة سطح البحر قد زادت بشكل كبير في 2023، إلا أن زيادة محتوى الحرارة المحيطية كانت ثابتة على مر الزمن (الشكل 2). لذلك، فإن التغير الطبيعي النسبي الصغير في محتوى الحرارة المحيطية من سنة إلى أخرى مقارنةً باتجاه الاحترار هو ما يجعل محتوى الحرارة المحيطية مؤشراً جيداً للمناخ.
الشكل 3. التغيرات العالمية في درجة حرارة سطح البحر من 1955 حتى 2023 وفقًا لبيانات المستوى الأول (1 م) في تحليل درجات الحرارة الموزعة من IAP/CAS الخط الأسود هو القيمة السنوية، والخط الأحمر هو القيمة الشهرية. الشذوذات تتعلق بقاعدة بيانات من 1981 إلى 2010. يتم عرض التغيرات داخل السنة في درجة حرارة سطح البحر في المربع الداخلي، مع القيم لعام 2023 المعروضة باللون الأسود.
تغيير.

3.2. مؤشرات المناخ المحيطي الأخرى

تظهر تغييرات كبيرة أيضًا في مقاييس المحيطات الأخرى. تكشف سلسلة زمنية لمؤشر SC في الطبقات العليا حتى عمق 2000 متر منذ عام 1958 (الشكل 4) عن زيادة قوية في مؤشر SC خلال النصف القرن الماضي، مما يشير إلى تضخيم لـ نمط الملوحة (تشنغ وآخرون، 2020). وصل مؤشر SC إلى في عام 2023، كانت القيمة الرابعة الأعلى منذ عام 1958. ومع ذلك، فإن الفرق بين أعلى 5 سنوات (2017، 2022، 2021، 2023، و2019) ليس ذا دلالة إحصائية بسبب التباين الكبير بين السنوات وعدم اليقين في البيانات؛ على سبيل المثال، هناك المزيد من بيانات ملوحة Argo في الوقت الحقيقي مؤخرًا التي لم تخضع لرقابة جودة دقيقة وتعديل انحياز. هذه المقياس القائم على المحيط يتماشى عمومًا مع العديد من التقديرات القائمة على الغلاف الجوي ويعزز الأدلة على أن دورة المياه العالمية قد تضخمت مع الاحترار العالمي (تشنغ وآخرون، 2020). على اليابسة، تعني دورة المياه المضخمة فترات جفاف أقوى وأطول، وزيادة في أحداث الأمطار الغزيرة مع إمكانية حدوث فيضانات، كما لوحظ (فيشر وآخرون، 2021).
لقد زادت تدرجات كثافة المحيطات أيضًا منذ أواخر الخمسينيات (الشكل 4ب) بسبب التغير في الهيكل العمودي لدرجة الحرارة والملوحة (Li et al., 2020a). يظهر مؤشر التدرج تباينًا أقوى بين السنوات إلى عقود أكثر من
مؤشر OHC و SC لأنه يكشف عن تغييرات أكبر في المحيط العلوي، مما يظهر شذوذات أقوى من المحيط الأعمق. في عام 2023، زادت طبقية الـ 2000 متر العليا إلى وصولها إلى قيم قياسية عالية في عام 2023 بشكل رئيسي بسبب تطور ظاهرة النينيو القوية.
لقد زاد مؤشر عدم التجانس المكاني لدرجة حرارة المحيطات أيضًا منذ الخمسينيات (الشكل 4c)، مع اتجاه نحو . وصل هذا المؤشر إلى أعلى مستوى قياسي في عام 2023 مقارنةً بقاعدة بيانات 1981-2010، مما يشير إلى زيادة كبيرة في تباين درجة حرارة المحيط. كانت ظاهرة الاحترار غير المتجانس في الطبقة العليا من المحيط، والتي كانت أسرع في خطوط العرض المتوسطة إلى المنخفضة، هي المسؤولة بشكل رئيسي عن زيادة هذا المؤشر في عام 2023 (رين وآخرون، 2022).

4. الأنماط الإقليمية لارتفاع درجة حرارة المحيطات والملوحة

تظهر الخرائط المكانية لشذوذ حرارة المحيطات السطحية لعام 2022 مقارنةً بمتوسط ظروف 1981-2010 (الشكل 5) أن معظم مناطق المحيطات تشهد ارتفاعًا ملحوظًا في درجات الحرارة، بينما تسجل بعض المناطق (معظم المحيط الأطلسي، شمال المحيط الهادئ، المحيط الهادئ الغربي، والمحيطات الجنوبية) ارتفاعًا في درجات الحرارة بمعدل أسرع من المتوسط العالمي. تم مناقشة العوامل التي تؤثر على أنماط الاتجاهات طويلة الأجل لدرجة حرارة المحيطات.
الشكل 4. التغيرات الشهرية (الخط الأسود) والسنوية (الأشرطة الملونة) في (أ) مؤشر SC، (ب) التراص، و(ج) مؤشر عدم التجانس المكاني لدرجة الحرارة في أعلى 2000 متر من المحيط العالمي من 1958 إلى 2023 [البيانات محدثة من تشينغ وآخرون (2017)]. وحدات الملوحة هي (باستخدام الملوحة المطلقة).
بواسطة تشينغ وآخرون (2022أ، ج).
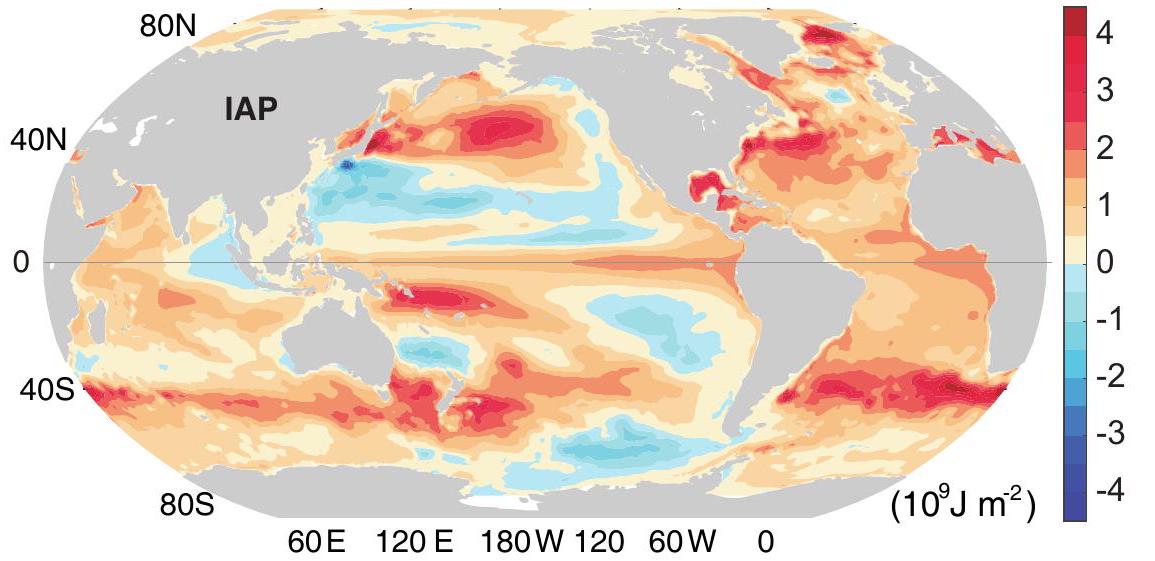
يتم تقديم الفرق السنوي المتوسط لـ OHC بين عامي 2023 و2022 في الشكل 6. في المحيط الهادئ الاستوائي، توجد انحرافات حرارية قوية في المحيط الهادئ الشرقي وانحرافات تبريد…
تقع في غرب المحيط الهادئ في عام 2023 (الشكل 6) تشير إلى ارتفاع مستوى الطبقة الحرارية الاستوائية المرتبطة بظاهرة النينيو. يظهر محتوى الحرارة المحيطية الأفقي تسخينًا استوائيًا قويًا ضمن ، والذي يتم تعويضه جزئيًا عن طريق التبريد حول و
شذوذ OHC لعام 2023 (0-2000م) بالنسبة لخط الأساس 1981-2010 (IAP/CAS)
الشكل 5. الشذوذ السنوي لحرارة المحيطات في عام 2023 بالنسبة لخط الأساس من 1981 إلى 2010 لبيانات IAP/CAS؛ الوحدات: [تم تحديث البيانات من تشينغ وآخرون (2017)].
الشكل 6. (أ) اختلافات القيم السنوية المتوسطة لحرارة المحيط في الطبقة العليا 2000 م بين 2023 و 2022، استنادًا إلى تحليل IAP/CAS. (ب) كما في (أ) ولكن لتحليل NCEI/NOAA. الوحدات: تُعرض قيم الحرارة المحيطية في المناطق على الجانب الأيمن من الخرائط المكانية [تم تحديث البيانات من تشينغ وآخرون (2017) في (أ)، ومن ليفيتوس وآخرون (2012) في (ب)].
تظهر التقديرات الاثنان أنماطًا كبيرة متسقة، لكن بيانات NCEI/NOAA أكثر ضوضاءً، وذلك بشكل رئيسي بسبب نهج التMapping.
تظهر الشذوذات في الملوحة لعام 2023 مقارنة بقاعدة بيانات 1981-2010 (الشكل 7أ) اتجاهات للتخفيف في معظم محيطات الهادئ والهندي، مع مناطق ذات ملوحة نسبية مثل
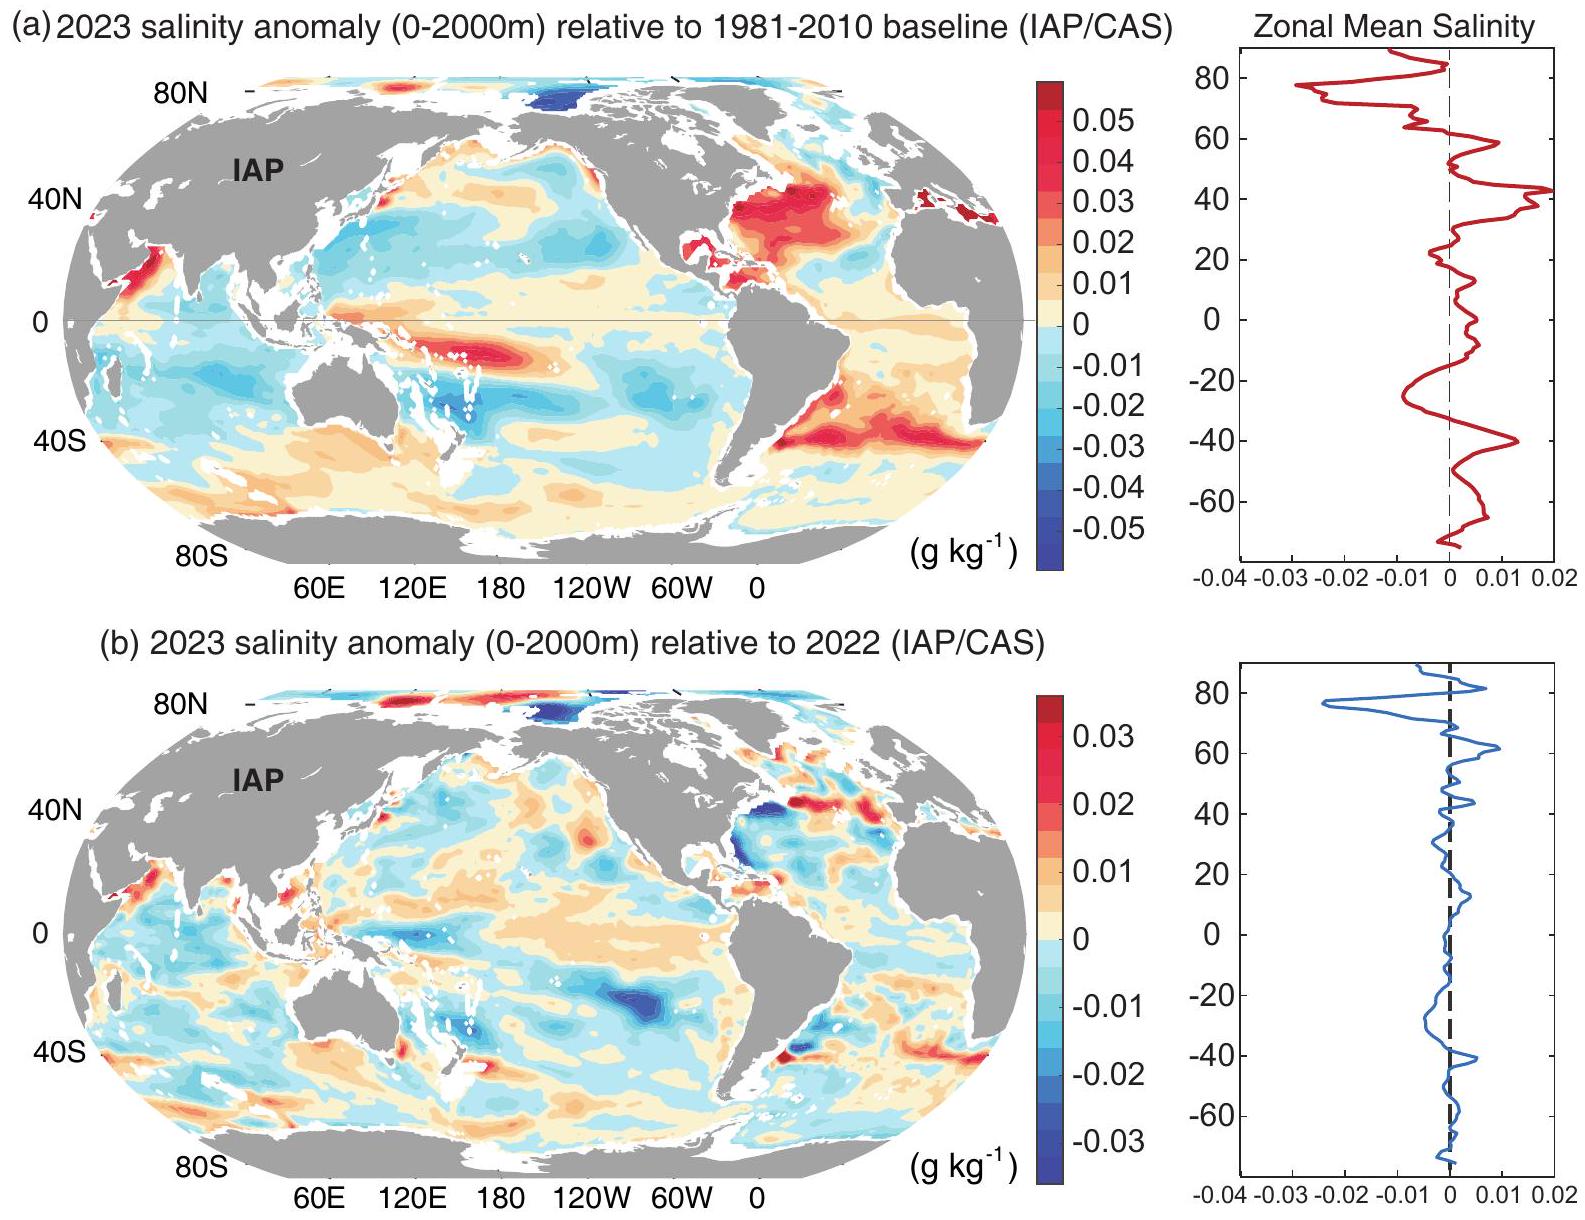
تزداد ملوحة المحيط الأطلسي في المناطق المتوسطة، والبحر الأبيض المتوسط، والمحيط الهندي الغربي. هذه ظاهرة نموذجية تُظهر أن “الماء العذب يصبح أكثر عذوبة، والماء المالح يصبح أكثر ملوحة”، وهي تغيير مدفوع بتعزيز دورة المياه الجوية. تكشف التغيرات في ملوحة المناطق الاستوائية عن المزيد من تأثير ظاهرة النينيو، خاصة في المحيط الهادئ الغربي وحول المنطقة الاستوائية.
الشكل 7. (أ) شذوذ ملوحة الطبقة العليا 2000 م في عام 2023 مقارنة بقاعدة بيانات 1981-2010. (ب) الفرق في الملوحة في الطبقة العليا 2000 م بين عامي 2023 و2022. يتم تقديم شذوذات الملوحة المتوسطة العرضية على الجانب الأيمن من الخرائط المكانية [البيانات محدثة من تشينغ وآخرون (2020)].
منطقة التقارب الاستوائية (ITCZ) خلال حدث النينيو، يتحرك الفرع الصاعد من دوران ووكر إلى المحيط الهادئ المركزي الاستوائي، مما يؤدي إلى تقليل هطول الأمطار في المحيط الهادئ الغربي ومنطقة التقارب الاستوائية وزيادة في ملوحة المحيط (الشكل 7ب).

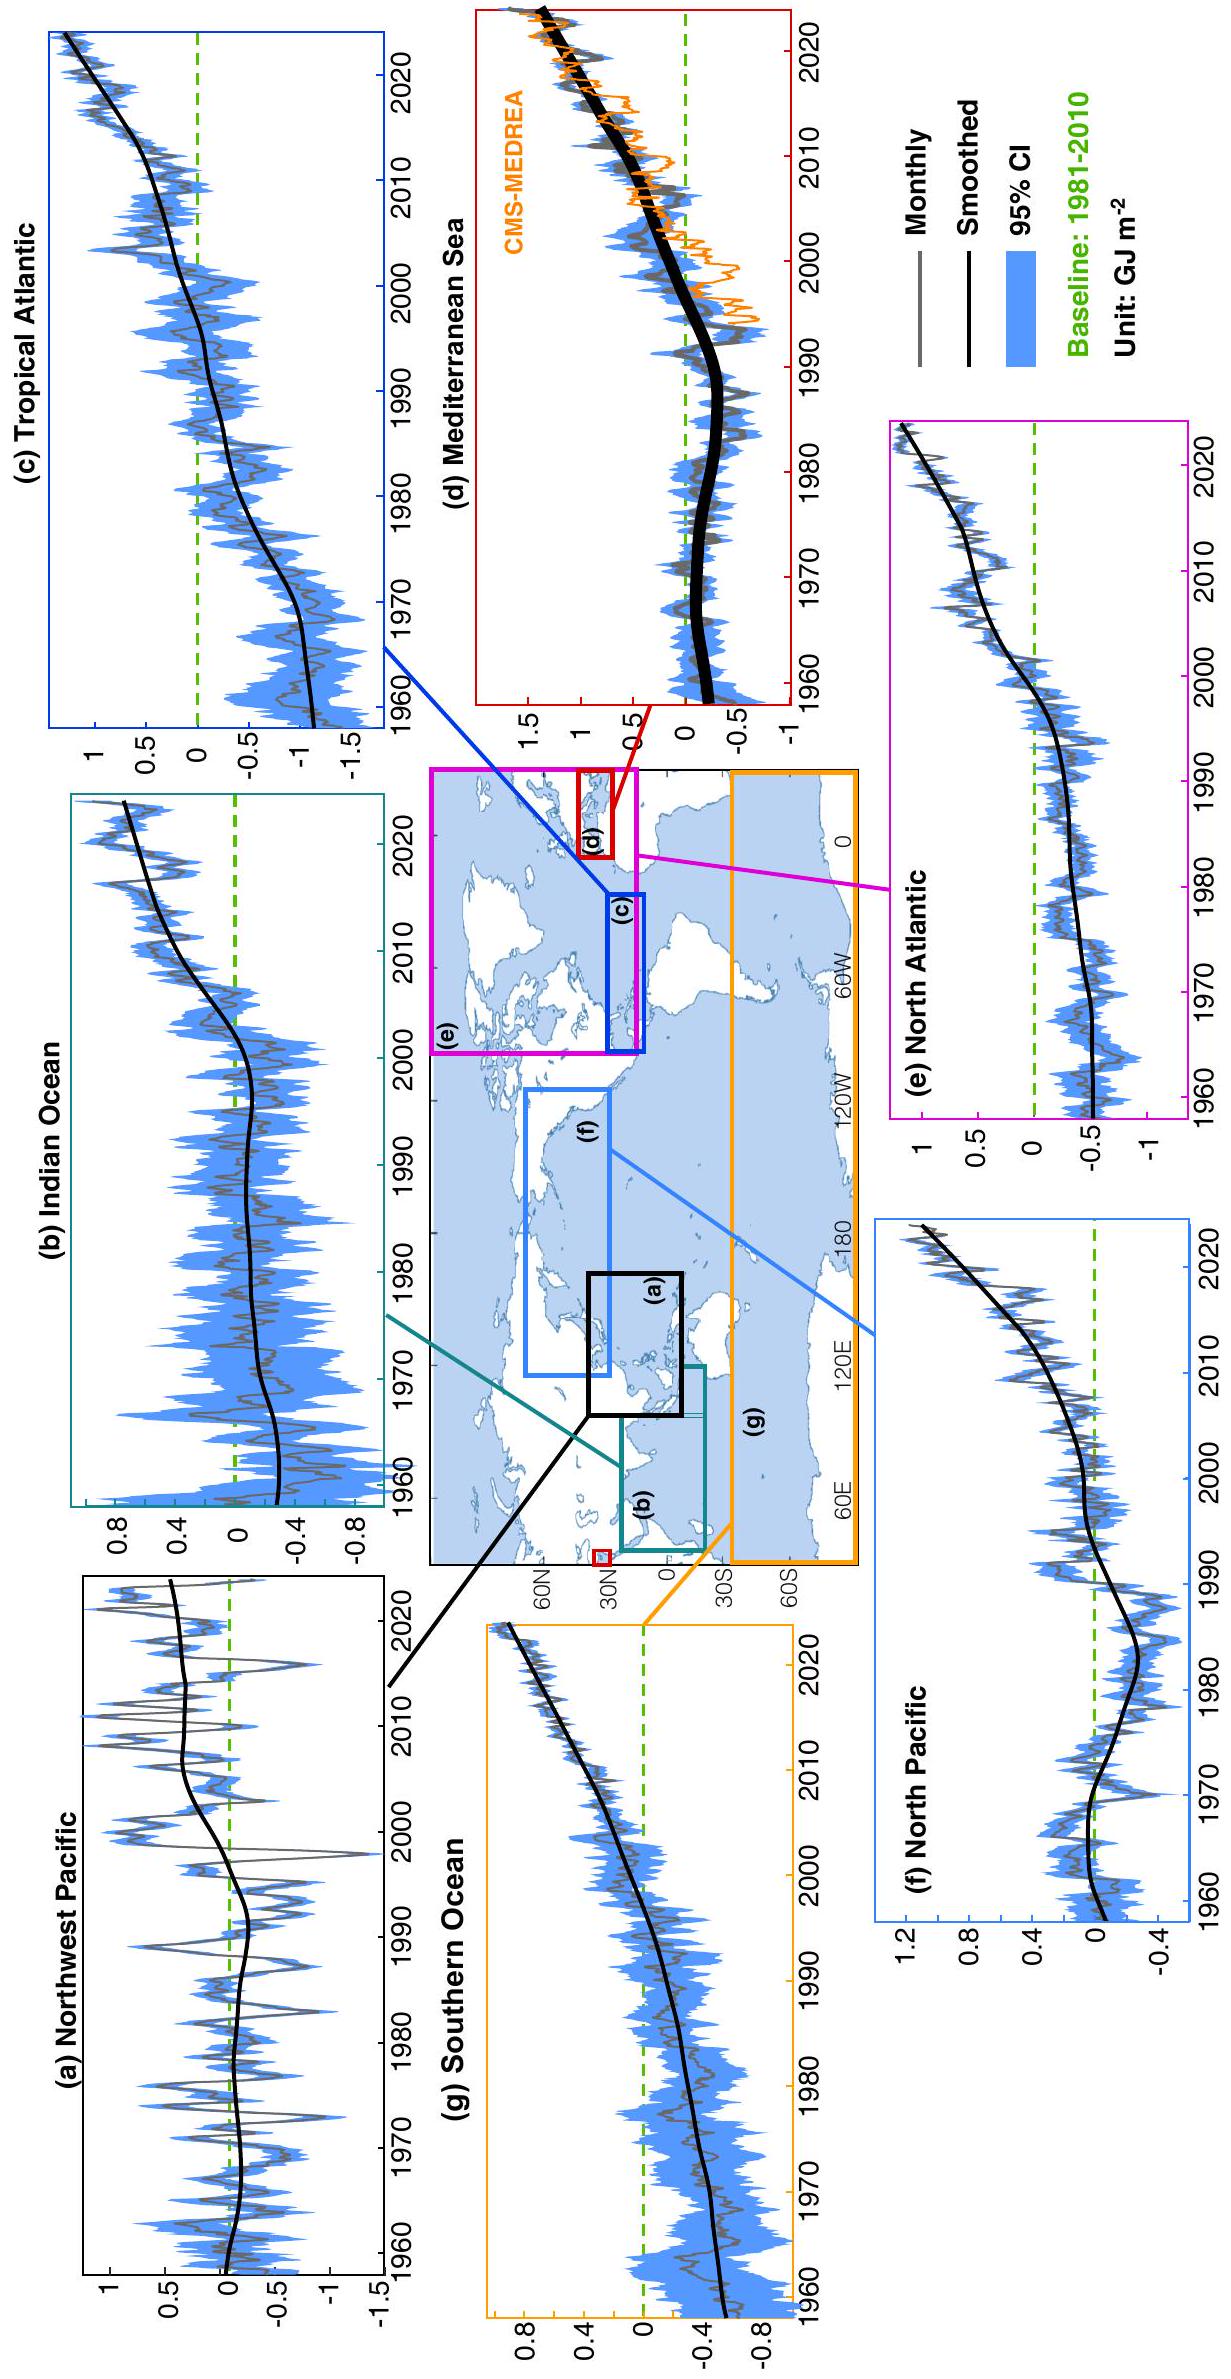
5. تغييرات حرارة المحيطات على مستوى الحوض والنقاط الساخنة الإقليمية

تطور OHC الإقليمي في سبع مناطق محيطية موضح في الشكل 8 للفترة من 1958 إلى 2023. المنطقة الشمالية الغربية من المحيط الهادئ، المحددة بـ و تسودها تقلبات داخلية كبيرة على مدى السنوات والعقود، خاصة من التقلبات المحيطية بين العقود وENSO (تكون قيم حرارة المحيط العلوي أعلى خلال سنوات لا نينا). منذ عام 2000، كانت قيم حرارة المحيط العلوي في الطبقات العليا 2000 متر أعلى بشكل جماعي مما كانت عليه في الفترة من 1958 إلى 2000. في عام 2023، كانت حرارة المحيط العلوي في شمال غرب المحيط الهادئ أقل مما كانت عليه في 2020-2022 بسبب ظاهرة النينيو. فوق خط الأساس من 1981-2010، مرتبة 20 منذ 1958).
تعتبر السنة الهندية OHC في 2023 من بين أفضل خمس سنوات سجلت (الشكل 8ب؛ بالنسبة لخط الأساس من 1981 إلى 2010). الانخفاض في حرارة المحيطات من 2020 إلى 2022 يتماشى مع
مع الميل السلبي لحرارة المحيط الهندي خلال ظاهرة لانيينا (تشنغ وآخرون، 2019)، المدفوع أساسًا بتقليل نقل الحرارة عبر ممرات تدفق إندونيسيا خلال مرحلة تلاشي لانيينا (ترينبرث وزانغ، 2019؛ لي وآخرون، 2020ب؛ فولكوف وآخرون، 2020). ومع ذلك، فقد أظهرت حرارة المحيط الهندي زيادة مستمرة منذ يناير 2023، المرتبطة بإنهاء لانيينا وتطور النينيو.
المحيط الأطلسي الاستوائي ، منطقة مهمة لتطور الأعاصير (ترينبرث وآخرون، 2018)، تظهر زيادة مستمرة في محتوى الحرارة المحيطية منذ أواخر الخمسينيات (الشكل 8c). وصل محتوى الحرارة المحيطية في عمق 2000 متر في عام 2023 إلى أعلى قيمة تم تسجيلها على الإطلاق في عام 2023 أعلى من خط الأساس 1981-2010، وهو أعلى من 2022).
في شمال المحيط الأطلسي، كان محتوى الحرارة في المحيط في عمق 2000 متر قريبًا من أعلى مستوى قياسي له في عام 2023، أقل من عام 2022 بـ وأقل من 2021 بـ على الرغم من أن سنوات النينيو تميل إلى أن تكون لديها مواسم أعاصير أضعف قليلاً، إلا أن حوض الأطلسي شهد 20 عاصفة مسماة في عام 2023 (بما في ذلك سبعة أعاصير)، مما يجعله في المرتبة الرابعة من حيث عدد العواصف في سنة منذ عام 1950.https://www.noaa.gov/news-release/2023-atlantic-hurricane-season-ranks-4th-for-most-
الشكل 8. التغير الإقليمي في محتوى الحرارة في المحيط العلوي 2000 متر من 1958 حتى 2023 بالنسبة لخط الأساس من 1981 إلى 2010. تم تنعيم سلسلة الزمن (الخطوط السوداء) بواسطة LOWESS (تنعيم الرسم البياني الموزون محليًا) بعرض نطاق يبلغ 240 شهرًا. المناطق المظللة باللون الرمادي هي فترات الثقة [البيانات محدثة من تشينغ وآخرون (2017)].
الأعاصير المسماة في السنة). في عام 2023، كانت درجة حرارة سطح البحر في المحيط الأطلسي الشمالي عند مستوى قياسي مرتفع منذ مارس. الحد الأقصى لدرجة الحرارة هو أعلى من متوسط 1981-2010. هذه الشذوذات الدافئة موزعة بشكل رئيسي في شرق المحيط الأطلسي الشمالي وهي ضحلة، حيث تقتصر على العمق العلوي 100 متر من المحيط (الشكل 9). تظل أسباب هذه الشذوذات موضوعًا للبحث.
في شمال المحيط الهادئ منطقة من الاحترار الواسع النطاق ( ) وازدادت موجات الحرارة البحرية [المعروفة باسم “الكتلة” (Scannell et al., 2020)] في عام 2023 (الأشكال 5 و 6 و 8). وقد انخفض محتوى الحرارة المحيطية في الطبقة العليا بعمق 2000 متر قليلاً بمقدار مقارنةً بعام 2022. تجاوزت قيمة OHC في المحيط الجنوبي في عمق 2000 متر في عام 2023 قيمة عام 2022 بـ (الشكل 8g)، مستمراً في اتجاهه التصاعدي الطويل الأمد منذ الستينيات.
كانت حرارة المحيط في البحر الأبيض المتوسط في عام 2023 أعلى من عام 2022 بـ (الشكل 8d) لبيانات IAP/CAS و لبيانات إعادة تحليل المحيط المستقلة (CMSMEDREA؛ إسكودير وآخرون، 2021؛ نيجام وآخرون، 2021)، مما يشير إلى مستوى قياسي مرتفع لحرارة المحيط في عام 2023 (الشكل 8د). تم قياس زيادة ملحوظة في درجة الحرارة في العقود القليلة الماضية في البحر الأبيض المتوسط، بدءًا من الحوض الشرقي حيث تشكلت المياه المتوسطة الأكثر دفئًا (وأكثر ملوحة) وانتشرت نحو الحوض الغربي في طريقها للعودة إلى شمال الأطلسي (بيناردي وآخرون، 2015؛ فون شكويمان وآخرون، 2016؛ سيمونشيللي وآخرون، 2018). تم توفير قياسات دقيقة من قبل رصيف CNR_ISMAR في قناة صقلية منذ عام 1993 (شرويدر وآخرون، 2017؛ بن إسماعيل وآخرون، 2021؛ متاحة فيhttps://doi.org/10.48670/moi-00044) ودرجات الحرارة الناتجة عن المراقبة باستخدام مجسات XBT في البحر التيراني وبحر ليغوريا منذ عام 1999 على طول خط MX04 جنوة-باليرمو (Reseghetti et al.، 2023؛ سيمون-
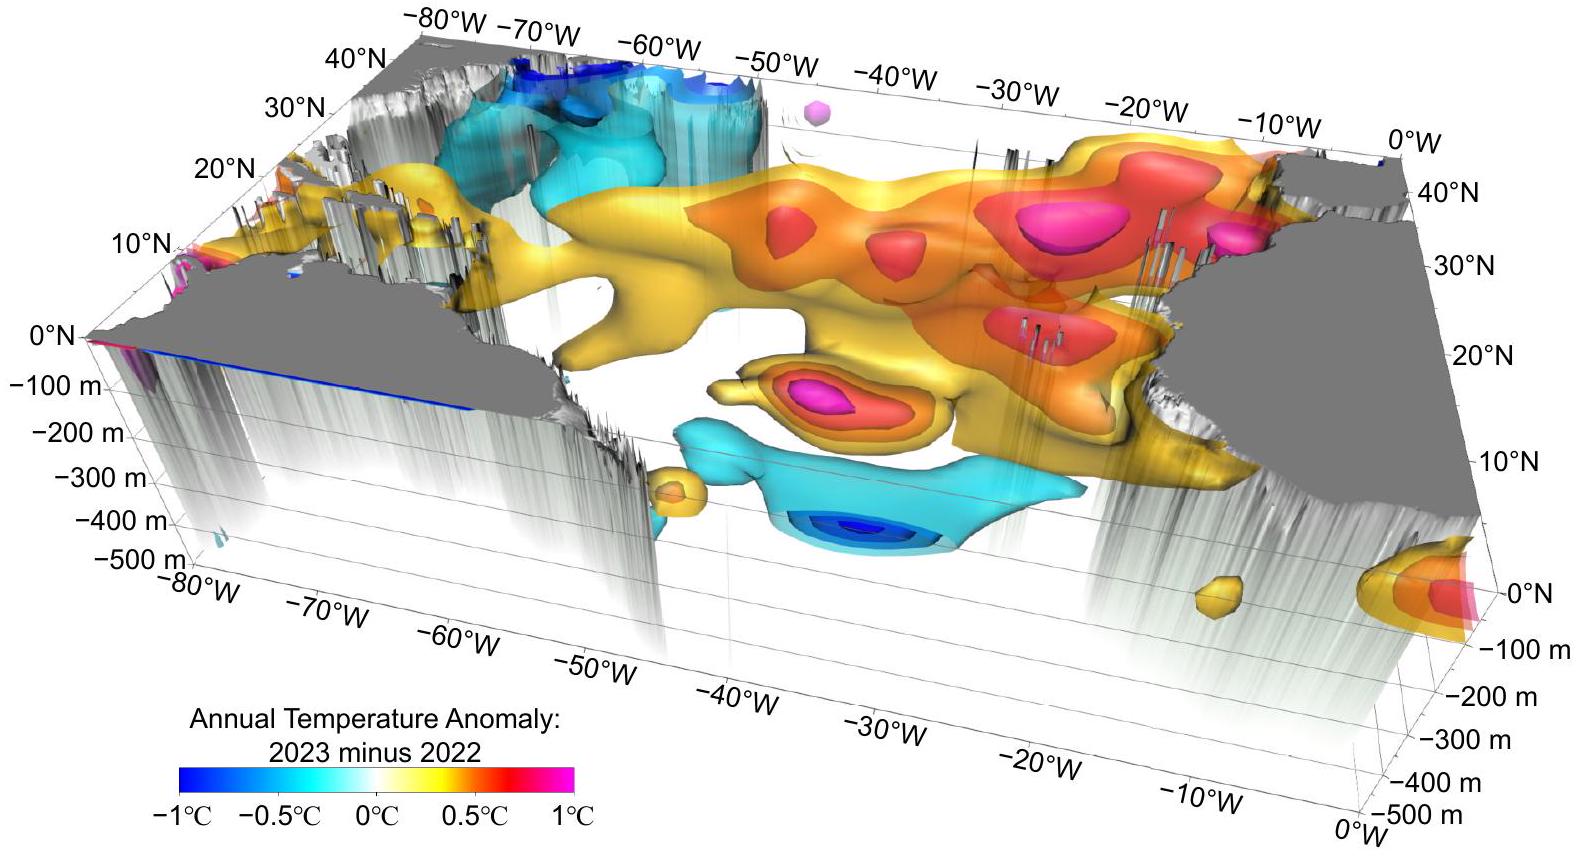
سيللي وآخرون، 2023) (الشكل 10أ)، أشاروا إلى ارتفاع واضح في درجة الحرارة في طبقة بدأت في ربيع 2013 (تشن وآخرون، 2022c). ثم امتدت هذه المنطقة الدافئة أعمق نحو الشمال، لتصل إلى 700 متر في 2016 (الشكل 10ب). تشير البيانات من MX04 ومن رصيف قناة صقلية إلى ارتفاع درجات الحرارة في الفترة من 2013 إلى 2016 فوق (الشكل 10ج) وبعد انخفاض طفيف وفترة استقرار، حدث انتعاش في النمو في عام 2021، بلغ ذروته حتى الآن في سبتمبر 2023 عندما تم قياس سجل جديد لأقصى درجة حرارة على طول خط MX04. تم حساب المعدل الخطي للفترة هو لمنطقة MX04، بينما هي في قناة صقلية.

6. ملاحظات ختامية

استنادًا إلى التحليلات التي أجرتها عدة مجموعات بحثية مستقلة، يقدم هذا البحث تحديثات لدرجة حرارة سطح البحر، وحرارة المحيط، والملوحة، والتصنيف، ومؤشر عدم تجانس درجة الحرارة المكاني لعام 2023. استمر المحيط في الاحترار عالميًا في عام 2023، ليس فقط على السطح ولكن أيضًا عبر الـ 2000 متر العليا. لقد زادت معدل الاحترار في العقود الأخيرة، مع وجود معدل أسرع للاحتباس الحراري منذ حوالي عام 1990 (تشنغ وآخرون، 2022أ، ب). وبالمثل، زاد مؤشر SC، مما يدل على وجود مزيد من الشذوذات الملحية المتطرفة وأثر تضخيم دورة المياه العالمية على المحيط العلوي. كما كان تصنيف المحيط في أعلى مستوياته القياسية في عام 2023، حيث أصبحت مياه المحيط العلوي أكثر استقرارًا مع مرور الوقت، على الرغم من وجود مزيد من التباين مقارنة بخصائص المناخ الأخرى. تكشف أنماط الاحترار الإقليمية أن ثلاثة من بين سبعة مناطق تم التحقيق فيها في هذه الدراسة وصلت إلى مستويات قياسية من حرارة المحيط في الـ 2000 متر العليا في عام 2023.
نظرًا للاختلافات بين IAP/CAS و NOAA
الشكل 9. مجالات ثلاثية الأبعاد لتغيرات درجة حرارة المحيط في عام 2023 مقارنة بعام 2022 في المحيط الأطلسي الشمالي. تم استخدام بيانات NCEI/NOAA، وتم تعديل الرسم التوضيحي باستخدام المجالات والزوايا من Seidov et al. (2021).
الشكل 10. درجة الحرارة على طول مقطع MX04 جنوة-باليرمو (البحر الأبيض المتوسط الغربي) المسجلة بواسطة مجسات XBT من سفن الفرصة وقيم درجة الحرارة الشهرية المتوسطة على عمق 400 متر من رصيف قناة صقلية. (أ) مسارات XBT في البحر التيراني والبحر الليغوري. (ب) مخطط هوفمولر لعدم تطابق متوسط درجة حرارة MX04 في الفترة من 1999 إلى 2023 تم حسابه عن طريق طرح خط الأساس من بيانات IAP/CAS للفترة 1981-2010. (ج) قيم درجة الحرارة المتوسطة لـ MX04 المحسوبة في الطبقات من 100-700 متر، وقيم درجة الحرارة الشهرية المتوسطة على عمق 400 متر من رصيف قناة صقلية، بين 2004 و2023، مع تمثيل أشرطة الخطأ للانحرافات المعيارية النسبية. تختلف الانحرافات المعيارية المرتبطة بسلسلتين زمنيتين بمقدار ترتيب واحد بسبب التباين المرتبط بدرجة الحرارة اليومية المأخوذة من موقع واحد (عمق 400 متر) أو درجة الحرارة اليومية ضمن طبقة معينة. ) تم أخذ عينات على طول خط، بطول حوالي 430 ميل بحري.
تقديرات تغيير OHC من NCEI بين 2023 و2022 (15 زيجا جول لـ IAP/CAS و9 زيجا جول لـ NOAA/NCEI)، تم محاولة فحص إضافي. متوسط شذوذ EEI الصافي من CERES من يناير إلى أكتوبر 2023 هو ، على الرغم من أن القيم كانت تتناقص بشكل حاد في أواخر عام 2023. بافتراض الصفر لشهري نوفمبر وديسمبر، فإن شذوذ CERES 2023 سيكون لسنة أو 25 زج. علاوة على ذلك، إذا إذا ذهب هذا إلى المحيط، فإن زيادة OHC ستكون 22.5 زيجاجول.https://sealevel.colorado.edu/data/ 2023rel2)، التغير المقدر بين يناير وأكتوبر 2023 ويناير وديسمبر 2022 هو 5.58 مم. تحويل ارتفاع مستوى البحر إلى المساهمة من حرارة المحيط يعتمد بشكل حاسم على مكان إضافة الحرارة. أولاً، عادة ما يهيمن ارتفاع مستوى البحر على التغيرات في الحجم والكتلة الناتجة عن ذوبان الجليد الأرضي، وتقدير معقول هو أن تسخين المحيط يساهم بمقدار 2.5 مم من التمدد. استجابة مستوى البحر تختلف كثيرًا اعتمادًا على مكان إيداع الحرارة (فاسولو وآخرون، 2020)؛ الاستجابة أكبر عند درجات حرارة أعلى، وتقدير تقريبي هو أن الحرارة المطلوبة المضافة هي . لذلك، على الرغم من أن هذه التقديرات العالمية الإجمالية تختلف، إلا أنها توضح الطريق للمضي قدماً في تقليل عدم اليقين، وجميعها تشير إلى ارتفاع كبير في درجات الحرارة في عام 2023.
الشكر والتقدير. يتم دعم تحليل IAP/CAS بواسطة
مؤسسة العلوم الطبيعية الوطنية في الصين (أرقام المنح 42076202، 42122046، 42206208 و42261134536)، مؤسسة العلوم الأساسية الجديدة من خلال جائزة XPLORER، زميل أكاديمية DAMO الشاب، جمعية تعزيز الابتكار الشبابي، الأكاديمية الصينية للعلوم؛ مشروع البنية التحتية العلمية والتكنولوجية الوطنية الرئيسية “منشأة محاكاة النظام الأرضي” (EarthLab). تم إجراء الحسابات في هذه الدراسة على الحاسوب الفائق ORISE. يتم رعاية NCAR من قبل مؤسسة العلوم الوطنية الأمريكية. استخدمنا بعض البيانات التي تم جمعها على متن السفينة R/V Shiyan 6 التي تنفذ الرحلة البحثية المفتوحة NORC2022-10+NORC2022-303 المدعومة من مشاريع مشاركة وقت السفن NSFC 42149910. تم دعم جهود الدكتور فاسولو في هذا العمل من خلال جوائز ناسا 80NSSC17K0565، 80NSSC21K1191، و80NSSC22K0046 ومن خلال مكون تحليل النماذج الإقليمية والعالمية (RGMA) من برنامج نمذجة النظام الأرضي والبيئي التابع لمكتب أبحاث البيولوجيا والبيئة (BER) في وزارة الطاقة الأمريكية عبر مؤسسة العلوم الوطنية IA 1947282. تم دعم جهود الدكتور ميشونوف من قبل NOAA (رقم المنحة NA19NES4320002 إلى CISESS-MD في جامعة ماريلاند). بيانات IAP/CAS متاحة فيhttp://www.ocean.iap.ac.cn/ و https://msdc.qdio.ac.cn/تتوفر بيانات NCEI/NOAA على https://www.ncei.noaa.gov/products/climate-data-records/global-
محتوى حرارة المحيط. تم إجراء هذه الدراسة باستخدام أيضًا معلومات خدمة كوبرنيكوس البحرية التابعة للاتحاد الأوروبيhttps://marine.copernicus.eu/) لتقديرات OHC في البحر الأبيض المتوسط. يتم دعم G. LI من قبل مشروع دعم المواهب الشابة لجمعية قوانغتشو للعلوم والتكنولوجيا. البيانات منhttps://gml.noaa.gov/ccgg/trends/تعود بيانات XBT التاريخية على خط MX04 (جنوة-باليرمو) إلى Reseghetti وآخرون (2023). منذ عام 2021، تم جمع بيانات XBT في إطار مشروع MACMAP الممول من المعهد الوطني للجيوفيزياء والبراكين (INGV) بموجب اتفاق بين INGV وENEA وشركة الشحن GNV SpA التي تقدم الضيافة على سفنها التجارية. كما تم إجراء تحليل البحر الأبيض المتوسط باستخدام معلومات خدمة كوبرنيكوس البحرية التابعة للاتحاد الأوروبي.
الوصول المفتوح. هذه المقالة مرخصة بموجب رخصة المشاع الإبداعي النسب 4.0 الدولية، التي تسمح بالاستخدام والمشاركة والتكيف والتوزيع وإعادة الإنتاج بأي وسيلة أو صيغة، طالما تم إعطاء الائتمان المناسب للمؤلفين الأصليين والمصدر، بالإضافة إلى رابط لرخصة المشاع الإبداعي، وإشارات إلى أي تغييرات تم إجراؤها. الصور أو المواد الأخرى من طرف ثالث في هذه المقالة مشمولة في رخصة المشاع الإبداعي الخاصة بالمقالة، ما لم يُشار إلى خلاف ذلك في سطر الائتمان للمادة. إذا لم تكن المادة مشمولة في رخصة المشاع الإبداعي الخاصة بالمقالة ولم يُسمح بالاستخدام المقصود بموجب اللوائح القانونية أو تجاوز الاستخدام المسموح به، سيتعين على المستخدم الحصول على إذن مباشرة من صاحب حقوق الطبع والنشر. لعرض نسخة من هذه الرخصة، قم بزيارةhttp://creativecommons.org/licenses/by/4.0/.

REFERENCES

Abraham, J., and Coauthors, 2013: A review of global ocean temperature observations: Implications for ocean heat content estimates and climate change. Rev. Geophys., 51, 450-483, https://doi.org/10.1002/rog. 20022.
Abraham, J., L. J. Cheng, M. E. Mann, K. Trenberth, and K. Von Schuckmann, 2022: The ocean response to climate change guides both adaptation and mitigation efforts. Atmos. Ocean. Sci. Lett., 15, 100221, https://doi.org/10.1016/j.aosl.2022. 100221.
Abraham, J. P., and L. J. Cheng, 2022: Intersection of climate change, energy, and adaptation. Energies, 15, 5886, https:// doi.org/10.3390/en15165886.
Argo, 2023: Argo Float Data and Metadata from Global Data Assembly Centre (Argo GDAC). SEANOE. Available from https://doi.org/10.17882/42182.
Ben Ismail S., K. Schroeder, J. Chiggiato, S. Sparnocchia, and M. Borghini, 2021: Long term changes monitored in two Mediterranean Channels. Copernicus Marine Service Ocean State Report, Issue 5, K. Von Schuckmann et al., Eds., 48-52, https://doi.org/10.1080/1755876X.2021.1946240.
Boyer, T., and Coauthors, 2016: Sensitivity of global upperocean heat content estimates to mapping methods, XBT bias corrections, and baseline climatologies. J. Climate, 29, 4817-4842, https://doi.org/10.1175/JCLI-D-15-0801.1.
Boyer, T. P., and Coauthors, 2018: World ocean database 2018. NOAA Atlas NESDIS 87.
Cheng, L. J., J. Zhu, R. Cowley, T. Boyer, and S. Wijffels, 2014: Time, probe type, and temperature variable bias corrections
to historical expendable bathythermograph observations. . Atmos. Oceanic Technol., 31(8), 1793-1825, https://doi.org/ 10.1175/JTECH-D-13-00197.1.
Cheng, L. J., K. E. Trenberth, J. Fasullo, T. Boyer, J. Abraham, and J. Zhu, 2017: Improved estimates of ocean heat content from 1960 to 2015. Science Advances, 3, e1601545, https:// doi.org/10.1126/sciadv. 1601545.
Cheng, L. J., K. Trenberth, J. Fasullo, J. Abraham, T. Boyer, K. Von Schuckmann, and J. Zhu, 2018: Taking the pulse of the planet. Eos, 99, 14-16, https://doi.org/10.1029/2017EO 081839.
Cheng, L. J., K. E. Trenberth, J. T. Fasullo, M. Mayer, M. Balmaseda, and J. Zhu, 2019: Evolution of ocean heat content related to ENSO. J. Climate, 32, 3529-3556, https://doi.org/ 10.1175/JCLI-D-18-0607.1.
Cheng, L. J., and Coauthors, 2020: Improved estimates of changes in upper ocean salinity and the hydrological cycle. J. Climate, 33, 10 357-10 381, https://doi.org/10.1175/JCLI-D-20-0366.1.
Cheng, L. J., and Coauthors, 2022a: Past and future ocean warming. Nature Reviews Earth & Environment, 3, 776-794, https://doi.org/10.1038/s43017-022-00345-1.
Cheng, L. J., G. Foster, Z. Hausfather, K. E. Trenberth, and J. Abraham, 2022b: Improved quantification of the rate of ocean warming. J. Climate, 35, 4827-4840, https://doi.org/10. 1175/JCLI-D-21-0895.1.
Cheng, L. J, and Coauthors, 2022c: Another record: Ocean warming continues through 2021 despite La Niña conditions. Adv. Atmos. Sci., 39(3), 373-385, https://doi.org/10.1007/s00376-022-1461-3.
Cheng, L. J., and Coauthors, 2023: Another year of record heat for the oceans. Adv. Atmos. Sci, 40, 963-974, https://doi.org/ .
Durack, P. J., and S. E. Wijffels, 2010: Fifty-year trends in global ocean salinities and their relationship to broad-scale warming. J. Climate, 23, 4342-4362, https://doi.org/10.1175/ 2010JCLI3377.1.
Escudier, R., and Coauthors, 2021: A high resolution reanalysis for the mediterranean sea. Front. Earth Sci., 9, 702285, https://doi.org/10.3389/feart.2021.702285.
Fischer, E. M., S. Sippel, and R. Knutti, 2021: Increasing probability of record-shattering climate extremes. Nature Climate Change, 11, 689-695, https://doi.org/10.1038/s41558-021-01092-9.
Fasullo, J. T., Gent, P. R., and Nerem, R. S. 2020: Forced patterns of sea level rise in the community earth system model large ensemble from 1920 to 2100. Journal of Geophysical Research: Oceans, 125, e2019JC016030. https://doi.org/10. 1029/2019JC016030
Gouretski, V., and L. J. Cheng, 2020: Correction for systematic errors in the global dataset of temperature profiles from mechanical bathythermographs. J. Atmos. Oceanic Technol., 37(5), 841-855, https://doi.org/10.1175/JTECH-D-190205.1.
Gouretski, V., L. J. Cheng, and T. Boyer, 2022: On the consistency of the bottle and CTD profile data. J. Atmos. Oceanic Technol., 39(12), 1869-1887, https://doi.org/10.1175/JTECH-D-22-0004.1.
Gouretski, V., F. Roquet, and L. J. Cheng, 2023: Measurement biases in ocean temperature profiles from marine mammal data loggers. J. Atmos. Oceanic Technol., submitted.
Gulev, S., and Coauthors, 2021: Changing state of the climate sys-
tem. Climate Change 2021: The Physical Science Basis. Contribution of Working Group I to the Sixth Assessment Report of the Intergovernmental Panel on Climate Change, V. Mas-son-Delmotte et al., Eds., Cambridge University Press.
Huang, B. Y., and Coauthors, 2017: Extended reconstructed sea surface temperature, Version 5 (ERSSTv5): Upgrades, validations, and intercomparisons. J. Climate, 30, 8179-8205, https://doi.org/10.1175/JCLI-D-16-0836.1.
Johnson, G., and Coauthors, 2018: Ocean heat content [in State of the Climate in 2017]. Bull. Amer. Meteor. Soc., 99, S72-S77.
Levitus, S., J. I. Antonov, T. P. Boyer, R. A. Locarnini, H. E. Garcia, and A. V. Mishonov, 2009: Global ocean heat content 1955-2008 in light of recently revealed instrumentation problems. Geophys. Res. Lett., 36, L07608, https://doi.org/10. 1029/2008GL037155.
Levitus, S., and Coauthors, 2012: World ocean heat content and thermosteric sea level change ( ), 1955-2010. Geophys. Res. Lett., 39, L10603, https://doi.org/10.1029/ 2012GL051106.
Li, G. C., L. J. Cheng, J. Zhu, K. E. Trenberth, M. E. Mann, and J. P. Abraham, 2020a: Increasing ocean stratification over the past half-century. Nature Climate Change, 10, 1116-1123, https://doi.org/10.1038/s41558-020-00918-2.
Li, K. X., F. Zheng, L. J. Cheng, T. Y. Zhang, and J. Zhu, 2023: Record-breaking global temperature and crises with strong El Niño in 2023-2024. The Innovation Geoscience, 1(2), 100030. https://doi.org/10.59717/j.xinn-geo.2023.100030.
Li, K. X., F. Zheng, J. Zhu, and Q.-C. Zeng, 2024: El Niño and the AMO sparked the astonishingly large margin of warming in the global mean surface temperature in 2023. Adv. Atmos. Sci., https://doi.org/10.1007/s00376-023-3371-4.
Li, Y. L., W. Q. Han, F. Wang, L. Zhang, and J. Duan, 2020b: Vertical structure of the upper-Indian Ocean thermal variability. J. Climate, 33, 7233-7253, https://doi.org/10.1175/JCLI-D-19-0851.1.
Loeb, N. G., G. C. Johnson, T. J. Thorsen, J. M. Lyman, F. G. Rose, and S. Kato, 2021: Satellite and ocean data reveal marked increase in Earth’s heating rate. Geophys. Res. Lett., 48, e2021GL093047, https://doi.org/10.1029/2021GL09 3047.
Loeb, N. G., and Coauthors, 2022: Evaluating twenty-year trends in Earth’s energy flows from observations and reanalyses. . Geophys. Res. Atmos., 127, e2022JD036686, https://doi.org/ 10.1029/2022JD036686.
Nigam, T., and Coauthors, 2021: Mediterranean Sea Physical Reanalysis INTERIM (CMEMS MED-Currents, E3R1i system) (Version 1) [Data set]. Copernicus Monitoring Environment Marine Service (CMEMS). https://doi.org/10.25423/ CMCC/MEDSEA_MULTIYEAR_PHY_006_004_E3R1I.
Pinardi, N., and Coauthors, 2015: Mediterranean Sea large-scale low-frequency ocean variability and water mass formation rates from 1987 to 2007: A retrospective analysis. Progress in Oceanography, 132, 318-332, https://doi.org/10.1016/j. pocean.2013.11.003.
Purkey, S., and G. C. Johnson, 2010: Warming of global abyssal and deep Southern Ocean waters between the 1990s and 2000s: Contributions to global heat and sea level rise budgets. J. Climate, 23, 6336-6351, https://doi.org/10.1175/ 2010JCLI3682.1.
Ren, Q. P., Y.-O. Kwon, J. Y. Yang, R.-X. Huang, Y. L. Li, and F. Wang, 2022: Increasing inhomogeneity of the global
oceans. Geophys. Res. Lett., 49, e2021GL097598, https://doi. org/10.1029/2021GL097598.
Reseghetti, F., C. Fratianni, and S. Simoncelli, 2023: Reprocessed of XBT dataset in the Ligurian and Tyrrhenian seas (1999-2019). Istituto Nazionale di Geofisica e Vulcanologia (INGV). [Available online from https://doi.org/10.13127/ rep_xbt_1999_2019].
Rhein, M., and Coauthors, 2013: Observations: Ocean pages. Climate Change 2013: The Physical Science Basis. Contribution of Working Group I to the Fifth Assessment Report of the Intergovernmental Panel on Climate Change, T. F. Stocker et al., Eds., Cambridge University Press.
Scannell, H. A., G. C. Johnson, L. Thompson, J. M. Lyman, and S. C. Riser, 2020: Subsurface evolution and persistence of marine heatwaves in the Northeast Pacific. Geophys. Res. Lett., 47, e2020GL090548, https://doi.org/10.1029/2020 GL090548.
Schroeder, K., J. Chiggiato, S. A. Josey, M. Borghini, S. Aracri, and S. Sparnocchia, 2017: Rapid response to climate change in a marginal sea. Scientific Reports, 7, 4065, https://doi.org/ 10.1038/s41598-017-04455-5.
Seidov, D., A. Mishonov, and R. Parsons, 2021: Recent warming and decadal variability of Gulf of Maine and Slope Water. Limnology and Oceanography, 66, 3472-3488, https://doi. org/10.1002/lno.11892.
Simoncelli, S., N. Pinardi, C. Fratianni, C. Dubois, and G. Notarstefano, 2018: Water mass formation processes in the Mediterranean Sea over the past 30 years. In: Copernicus Marine Service Ocean State Report, Issue 2, Journal of Operational Oceanography, 11:sup1, s13-s16, https://doi.org/10.1080/ 1755876X.2018.1489208.
Simoncelli, S., Reseghetti, F., Fratianni, C., Cheng, L., and Raiteri, G., 2023: Reprocessing of XBT profiles from the Ligurian and Tyrrhenian seas over the time period 1999-2019 with full metadata upgrade, Earth Syst. Sci. Data Discuss. [preprint], https://doi.org/10.5194/essd-2023-525, in review.
Tan, Z. T., L. J. Cheng, V. Gouretski, B. Zhang, Y. J. Wang, F. C. Li, Z. H. Liu, and J. Zhu, 2023: A new automatic quality control system for ocean profile observations and impact on ocean warming estimate. Deep-Sea Res. Part I Oceanogr. Res. Pap., 194, 103961, https://doi.org/10.1016/j.dsr.2022. 103961.
Trenberth, K. E., J. T. Fasullo, and M. A. Balmaseda, 2014: Earth’s energy imbalance. J. Climate, 27, 3129-3144, https:// doi.org/10.1175/JCLI-D-13-00294.1.
Trenberth, K. E., J. M. Caron, D. P. Stepaniak, and S. Worley, 2002: Evolution of El Niño-Southern Oscillation and global atmospheric surface temperatures. J. Geophys. Res., 107, AAC 5-1-AAC 5-17, doi: 10.1029/2000JD000298.
Trenberth, K. E., L. J. Cheng, P. Jacobs, Y. X. Zhang, and J. Fasullo, 2018: Hurricane Harvey links to ocean heat content and climate change adaptation. Earth’s Future, 6, 730-744, https://doi.org/10.1029/2018EF000825.
Trenberth, K. E., and Y. X. Zhang, 2019: Observed interhemispheric meridional heat transports and the role of the Indonesian Throughflow in the Pacific Ocean. J. Climate, 32, 8523-8536, https://doi.org/10.1175/JCLI-D-19-0465.1.
Volkov, D. L., S.-K. Lee, A. L. Gordon, and M. Rudko, 2020: Unprecedented reduction and quick recovery of the South Indian Ocean heat content and sea level in 2014-2018. Science Advances, 6, eabc1151, https://doi.org/10.1126/sciadv. abc1151.
Von Schuckmann, K., and Coauthors, 2016: The Copernicus marine environment monitoring service ocean state report. Journal of Operational Oceanography, 9, s235-s320, https:// doi.org/10.1080/1755876X.2016.1273446.
Von Schuckmann, K., and Coauthors, 2020: Heat stored in the Earth system: Where does the energy go? Earth System Sci-
ence Data, 12, 2013-2041, https://doi.org/10.5194/essd-12-2013-2020.
Zheng, F., and J. Zhu, 2016: Improved ensemble-mean forecasting of ENSO events by a zero-mean stochastic error model of an intermediate coupled model. Climate Dyn., 47, 3901-3915, https://doi.org/10.1007/s00382-016-3048-0.

    • Corresponding author: Lijing CHENG

Journal: Advances in Atmospheric Sciences, Volume: 41, Issue: 6
DOI: https://doi.org/10.1007/s00376-024-3378-5
Publication Date: 2024-01-11

– Original Paper –

Lijing CHENG , John ABRAHAM , Kevin E. TRENBERTH , Tim BOYER , Michael E. MANN , Jiang ZHU , Fan WANG , Fujiang YU , Ricardo LOCARNINI , John FASULLO , Fei ZHENG , Yuanlong LI , Bin ZHANG , Liying WAN , Xingrong CHEN , Dakui WANG , Licheng FENG , Xiangzhou SONG , Yulong LIU , Franco RESEGHETTI , Simona SIMONCELLI , Viktor GOURETSKI , Gengxin CHEN , Alexey MISHONOV , Jim REAGAN , Karina VON SCHUCKMANN , Yuying PAN , Zhetao TAN , Yujing ZHU , Wangxu WEI , Guancheng , Qiuping REN , Lijuan , and Yayang International Center for Climate and Environment Sciences, Institute of Atmospheric Physics, Chinese Academy of Sciences, Beijing 100029, China University of St. Thomas, School of Engineering, Minnesota 55105, USA NSF National Center for Atmospheric Research, Boulder, Colorado 80307, USA University of Auckland, Auckland 1010, New Zealand National Oceanic and Atmospheric Administration, National Centers for Environmental Information, Silver Spring, Maryland 20910, USA Department of Earth and Environmental Science, University of Pennsylvania, Philadelphia, Pennsylvania 19104, USA Institute of Oceanology, Chinese Academy of Sciences, Qingdao 266071, China National Marine Environmental Forecasting Center, Ministry of Natural Resources of China, Beijing 100081, China Oceanographic Data Center, Chinese Academy of Sciences, Qingdao 266071, China College of Oceanography, Hohai University, Nanjing 210098, China National Marine Data and Information Service, Tianjin 300171, China Italian National Agency for New Technologies, Energy and Sustainable Economic Development, S. Teresa Research Center, Lerici 19032, Italy Istituto Nazionale di Geofisica e Vulcanologia, Sede di Bologna, Bologna 40128, Italy South China Sea Institute of Oceanology, Chinese Academy of Sciences, Guangzhou 510301, China ESSIC/CISESS-MD, University of Maryland, College Park, MD, 20740, USA Mercator Ocean International, Toulouse 31400, France Eco-Environmental Monitoring and Research Center, Pearl River Valley and South China Sea Ecology and Environment Administration, Ministry of Ecology and Environment, PRC, Guangzhou 510611, China National Meteorological Information Center, China Meteorological Administration, Beijing 100081, China International Research Center of Big Data for Sustainable Development Goals, Beijing 100094, China

(Received 23 December 2023; revised 9 January 2024; accepted 9 January 2024)

Abstract

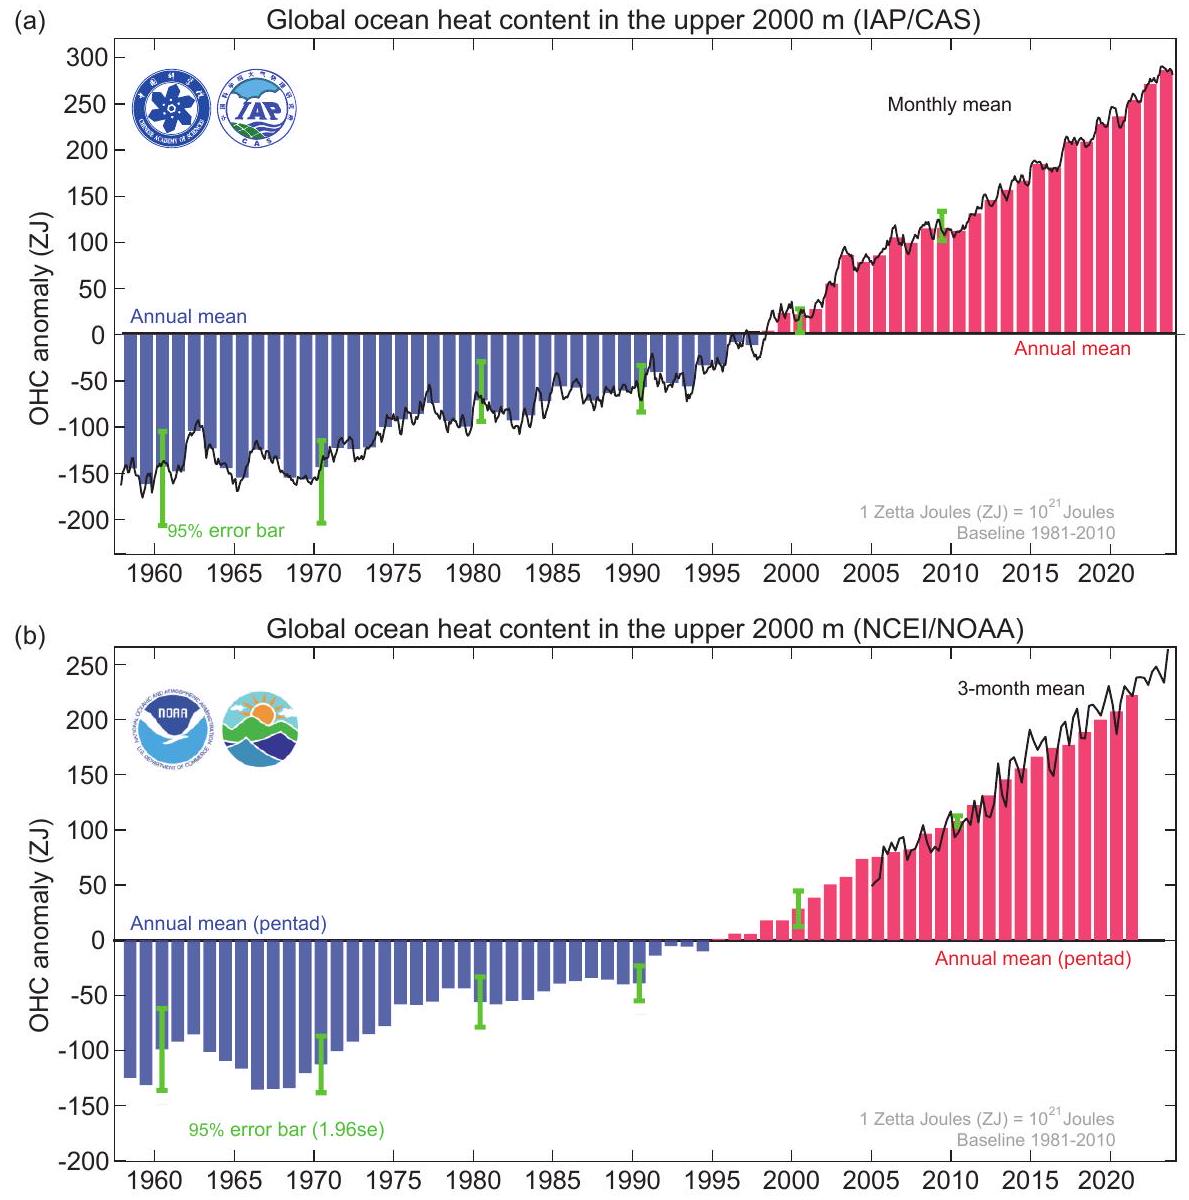
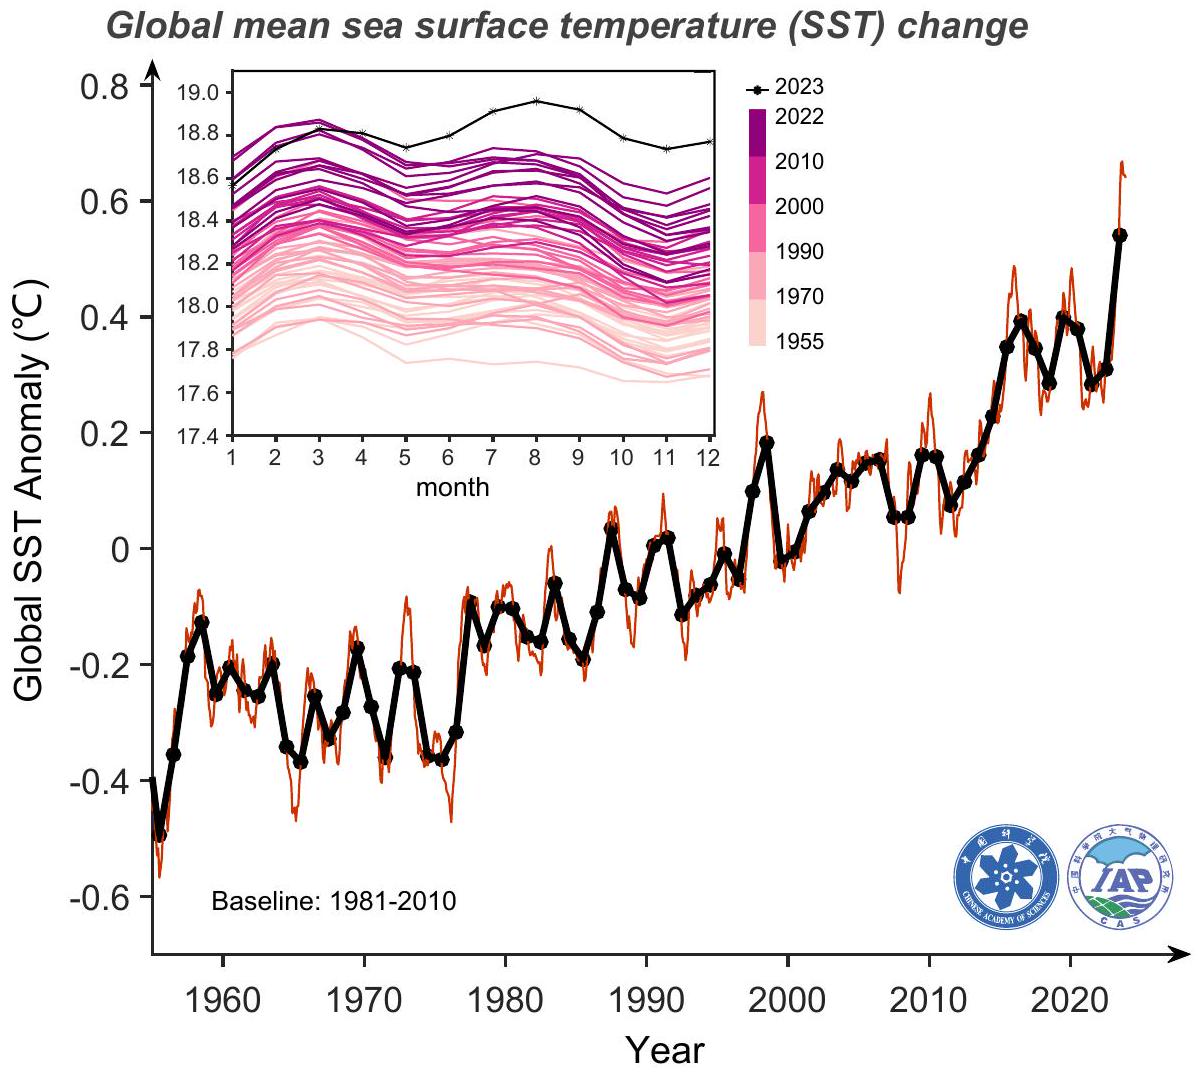
The global physical and biogeochemical environment has been substantially altered in response to increased atmospheric greenhouse gases from human activities. In 2023, the sea surface temperature (SST) and upper 2000 m ocean heat content (OHC) reached record highs. The in 2023 exceeded that of 2022 by ( 1 Zetta Joules Joules) (updated IAP/CAS data); (NCEI/NOAA data). The Tropical Atlantic Ocean, the Mediterranean Sea, and southern oceans recorded their highest OHC observed since the 1950s. Associated with the onset of a strong El Niño, the global SST reached its record high in 2023 with an annual mean of higher than 2022 and an astounding above 2022 values for the second half of 2023 . The density stratification and spatial temperature inhomogeneity indexes reached their highest values in 2023.

Key words: ocean heat content, salinity, stratification, global warming, climate
Citation: Cheng, L. J., and Coauthors, 2024: New record ocean temperatures and related climate indicators in 2023. Adv. Atmos. Sci., 41(6), 1068-1082, https://doi.org/10.1007/s00376-024-3378-5.

Article Highlights:

  • In 2023, the global annual mean SST and upper 2000 m ocean heat content were the highest ever recorded by modern instruments.
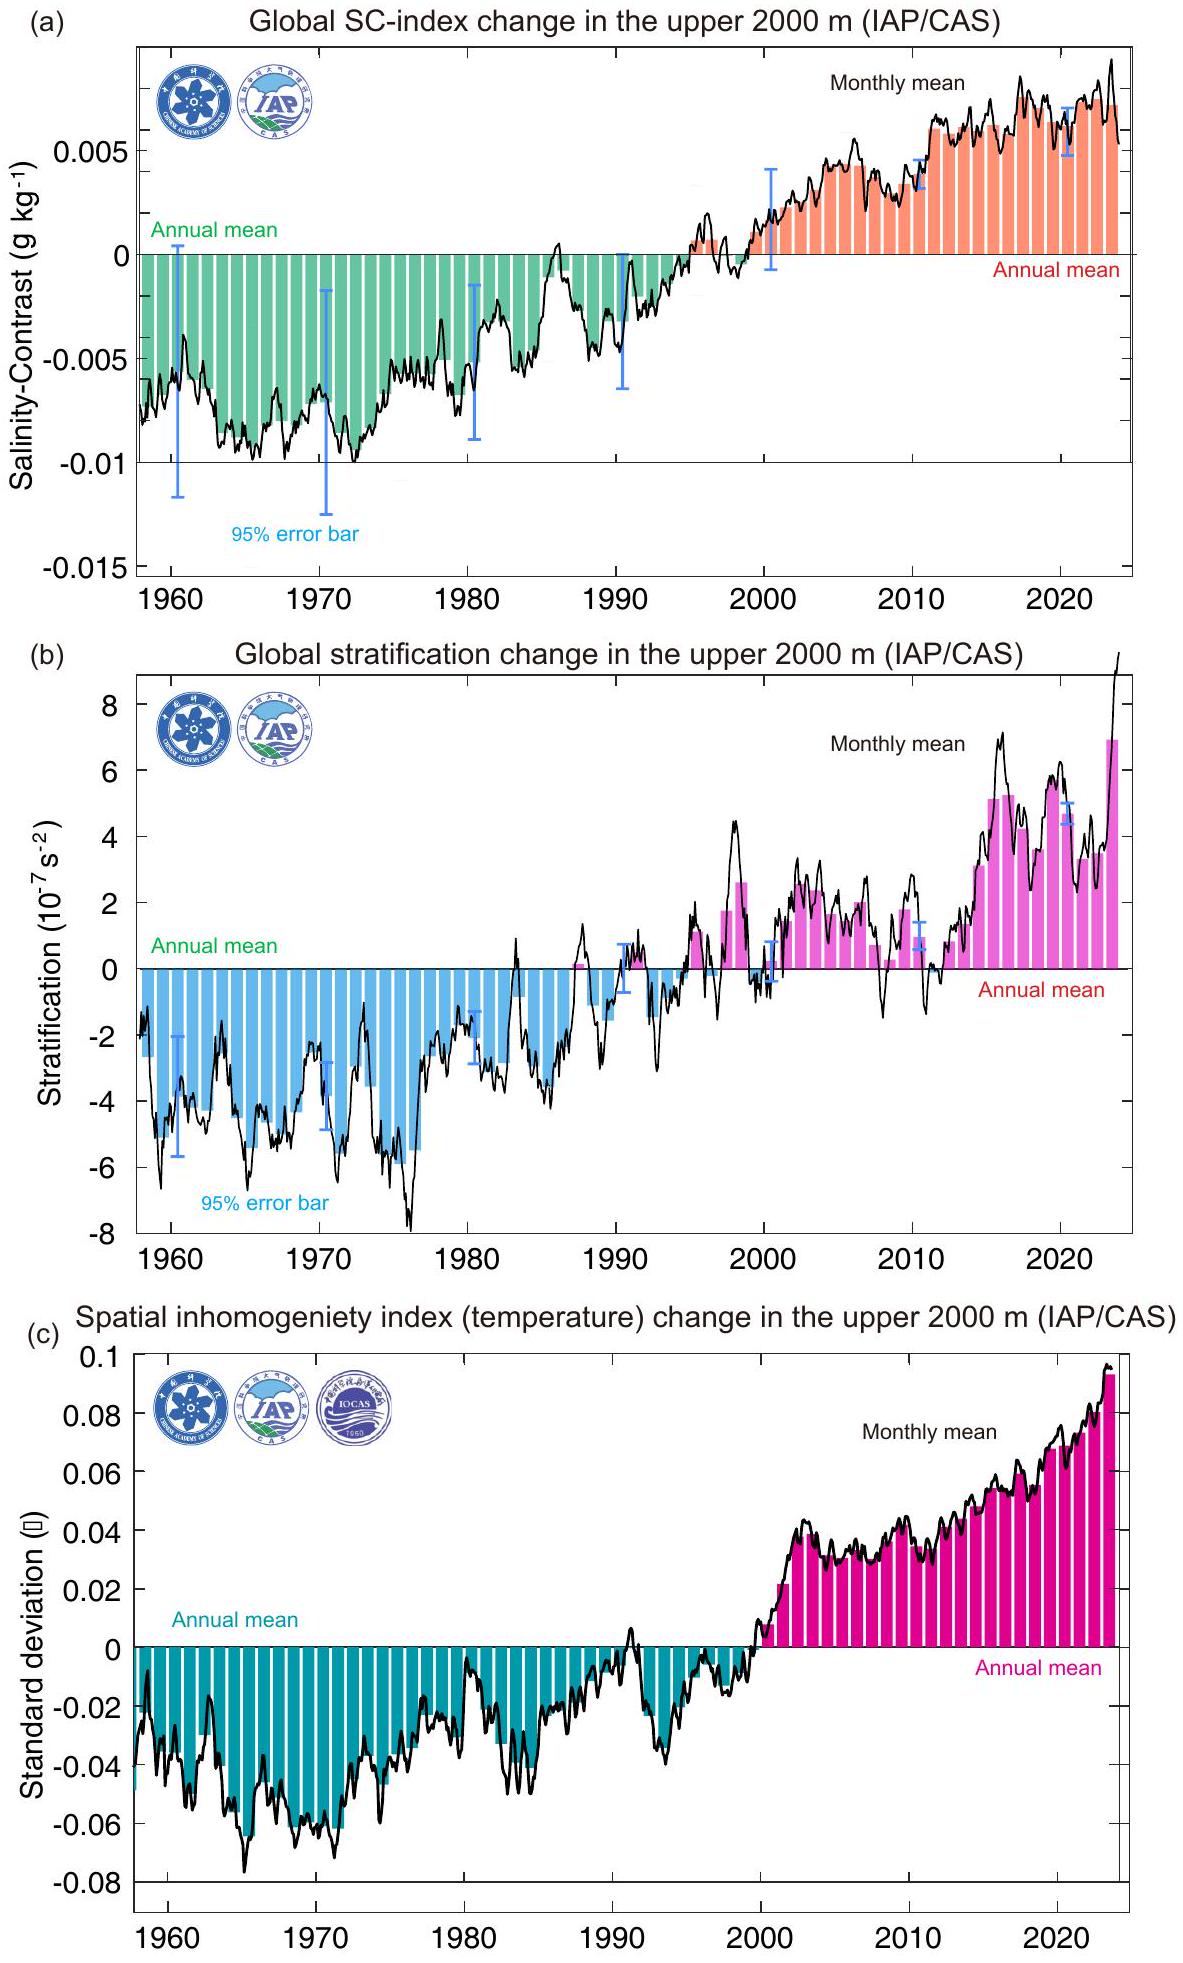
  • Other oceanic indices, including density stratification and spatial temperature inhomogeneity, attained record highs.
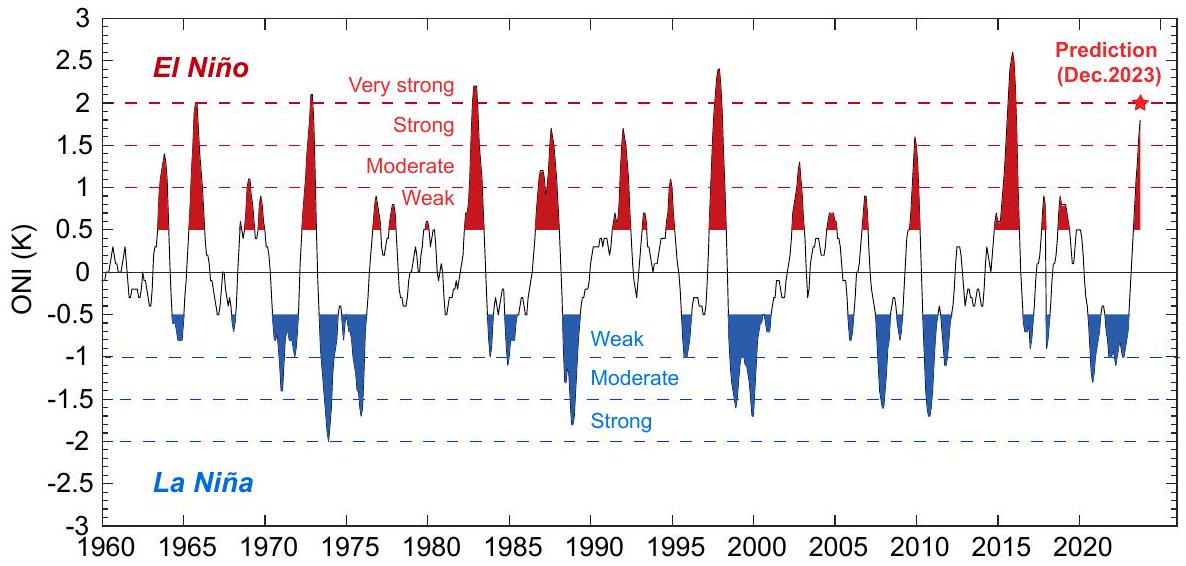
  • A strong El Niño developed during 2023 and influenced warming and salinity anomaly patterns.

1. Introduction

The increase in carbon dioxide ( ) and other greenhouse gases in the atmosphere from human activities has led to an increase in longwave radiation trapped within the Earth system, resulting in an increase in the difference between incoming and outgoing radiation at the top of the atmosphere and causing an Earth Energy Imbalance (EEI) (Trenberth et al., 2014; Gulev et al., 2021). With about of the excess heat accumulated in the Earth system deposited in the world’s ocean, EEI causes rising ocean temperatures and increasing ocean heat content (OHC) (Rhein et al., 2013; Johnson et al., 2018; Von Schuckmann et al., 2020; Loeb et al., 2021; Cheng et al., 2023). Both OHC and the closely associated sea level rise (SLR) are robust indicators of climate change because they have larger forced signal-to-noise ratios than surface temperature change (Cheng et al., 2018). OHC also plays essential roles in Earth’s energy, water, and carbon cycles (Cheng et al., 2022a) and significantly affects human society (Abraham and Cheng, 2022).
Further, ocean freshwater change, reflected in changes in ocean salinity, aggregates changes in the atmospheric water cycle and ocean circulation, and these changes, along
with temperature changes, regulate the ocean currents and impact the vertical stability of the ocean. Ocean salinity trends are generally characterized by a “fresh gets fresher, salty gets saltier” change pattern, meaning areas that are currently fresh are becoming fresher, and areas that are currently salty are becoming more saline (Durack and Wijffels, 2010). This process can be quantified by a “salinity-contrast” (SC) index that calculates the salinity difference between the higher and lower salinity regions compared to a global average (Cheng et al., 2020).
These ocean temperature and salinity changes are not spatially homogeneous. As the changes are non-uniform, the variance of the three-dimensional upper 2000 m ocean temperature fields have increased (Ren et al., 2022). Vertically, the ocean temperature and density structures are altered, leading to vertical stratification changes (Li et al., 2020a), which in turn impact the vertical exchanges of energy, water, carbon, nutrients, and other substances.
The year 2023 began as the third year of a prolonged La Niña that faded by April, as sea surface temperatures (SSTs) in the tropical central and eastern Pacific rose with the onset of a new major El Niño (Fig. 1). By late 2023, the El Niño was classed as “strong” ( for Oceanic Niño Index), with predicted Niño3.4 SSTs exceeding in
Fig. 1. An ENSO index (Oceanic Niño Index, ONI), calculated based on a 3 -month running mean of Extended Reconstructed Sea Surface Temperature, version 5 (ERSST.v5): SST anomalies in the Niño3.4 region ( )] (shading) [data updated from Huang et al. (2017)]. The prediction for the December 2023 ONI is based on the IAP ENSO ensemble prediction system (Zheng and Zhu, 2016; Li et al., 2023).
November and December 2023 (Fig. 1). The concentration in the atmosphere continued to increase in 2023 and is more than above preindustrial levels. At Mauna Loa, Hawaii, the November 2023 mean rose to 420.46 parts per million by volume (ppm), an increase of about 3 ppm compared to November 2022 (https://gml.noaa.gov/ccgg/ trends/). The EEI has remained above over recent years (Loeb et al., 2022). This equals an energy increase of . If the heating below 2000 m is about (Purkey and Johnson, 2010) and of the EEI goes into the ocean, then is expected in the ocean above 2000 m depth.
Very high SSTs in the extratropics in 2023 were at least in part a consequence of the prior La Niña, as cool surface temperatures reduced tropospheric temperatures and outgoing longwave radiation. In the North Pacific, high ocean temperatures fueled the atmospheric rivers and “rain bombs” that led to extensive flooding but also relief from long-standing drought in many parts of western North America. Severe flooding also occurred in New Zealand, Beijing/ China, Alaska, India, Italy, Slovenia, Japan, Vermont, Kenya, and East Africa. Record heatwaves occurred in the southern United States, China, India, southern Europe (Spain, Portugal, Italy, Greece, France) and elsewhere. Wildfires also accompanied several areas that exhibited record heat and/or drought during 2023. Many nations set all-time temperature records and record low sea ice was recorded throughout the southern winter around Antarctica. The Atlantic hurricane season was vigorous, especially considering it was an El Niño year when storm activity would usually be suppressed. In the East Pacific, hurricane Otis developed at a record rate to a category 5 storm in less than one day before making landfall near Acapulco, Mexico, in late October. The results of many of these events have been devastating in terms of lives lost, disruption, and damage. These climatic changes have profound societal and ecological consequences (Abraham et al., 2022).
This paper provides an update on various oceanic changes in 2023 using two different data products: (1) the Institute of Atmospheric Physics (IAP) at the Chinese Academy of Sciences (CAS) (Cheng et al., 2017, 2020; Li et al., 2020a); (2) National Centers for Environmental Information (NCEI) at the National Oceanic and Atmospheric Administration (NOAA) (Levitus et al., 2012). We include the OHC, SST, SC index, stratification, and temperature spatial inhomogeneity indexes to describe ocean changes in 2023.

2. Data and methods

The source data are obtained from in situ measurements made available through the World Ocean Database (WOD) (Boyer et al., 2018), the primary data source for all data products. The main subsurface observing system since 2005 is the profiling floats from the Argo program (Argo, 2023), whereas other data sources, including XBTs from ships of opportunity, conductivity-temperature-depth (CTD) data
from research ships, instrumented animals, gliders, moored buoys, and ice-tethered profilers, augment observations globally and are primary sources in shallow seas/continental shelves, and high-latitude seasonal ice covered areas. The differences between the data products arise from additional in situ observations owned by the data center, data quality control (QC), climatology, vertical interpolation, gap-filling, and other data processing techniques (Abraham et al., 2013; Boyer et al., 2016; Cheng et al., 2022a). All instrumental data are used for the IAP/CAS and NCEI/NOAA products. This paper presents the most up-to-date information from IAP/CAS and NCEI/NOAA for 2023, incorporating the latest data quality processing and mapping techniques. Both the IAP/CAS and NCEI/NAA datasets are monthly gridded products, have horizontal resolution, and cover the ocean’s upper 2000 m .
IAP introduced a major update in 2023 based on a previous version in Cheng et al. (2017); the data quality-control named the CAS-Ocean Data Center (CODC) Quality Control system-CODC-QC (Tan et al., 2023), where only the “good” data (flag ) are used. XBT biases have been corrected by an updated scheme in Cheng et al. (2014) modified and extended to 2023. Mechanical Bathythermograph (MBT) biases have been corrected using a newly available scheme of Gouretski and Cheng (2020). Correction for a significant systematic bias in bottle data was applied using a newly proposed correction scheme (Gouretski et al., 2022). Bias corrections for temperature profiles from sensors attached to marine animals recommended by Gouretski et al. (2023) were also applied. Together, these changes in QC procedure and bias corrections resulted in a stronger long-term upper 2000 m OHC trend for the 1960-2023 and 2005-2023 periods.
For NCEI/NOAA data, an objective analysis approach from Levitus et al. (2012) is used for spatial interpolation. The XBT biases are corrected with the Levitus et al. (2009) approach. The NCEI analysis assumes no temperature change where there is no data, which will underestimate the OHC in areas without data. However, due to Argo and other components of the ocean observing system, the coverage since 2005 is greater than of the global ocean to 2000 m. Another aspect of the NCEI procedure that can lead to an underestimation of OHC is the flagging of Argo profiles in mesoscale eddies and other oceanic features, which in recent years are more than five standard deviations from the long-term (1955-2006) mean for the geographic area in which they are encountered, and thus flagged as outliers and not incorporated into the global OHC integral calculation (Tan et al., 2023). While steps are being taken to amend the QC steps to account for the features of a warming ocean, the NCEI estimates presented here do not fully represent these features in the global integral. The consequence is that the NCEI estimates are thus inherently conservative.
An additional reanalysis dataset (Escudier et al., 2021; Nigam et al., 2021) (CMS-MEDREA) is used to assess the Mediterranean changes. CMS-MEDREA assimilated XBT, CTD, and Argo profiles, integrating data from CMS and Sea-
DataNet (https://www.seadatanet.org/) and CMS satellite along-track sea level anomalies (Escudier et al., 2021). This product is generated by a numerical system composed of a hydrodynamic model supplied by the Nucleus for European Modelling of the Ocean and a variational data assimilation scheme. The model horizontal grid resolution is (about ), with 141 unevenly spaced vertical levels.
The index (Cheng et al., 2020) is calculated for each month over the 3D ocean salinity field as follows:
where ( ) are latitude, longitude, and depth; is the salinity averaged where salinity is higher than the climatological global median ; and is the salinity averaged where salinity is lower than the climatological global median and are determined based on the climatological salinity field during 1960-2017. The IAP/CAS data are used to calculate the SC index.
Ocean stratification is calculated (Li et al., 2020a) as the squared buoyancy frequency :
where , and denote the sea water density, local potential density anomaly, and gravitational acceleration, respectively. The quantity represents the Brunt-Väisälä fre-quency-the intrinsic frequency of internal waves.
The spatial inhomogeneity index defines the spatial spreads of water mass property , such as temperature (Ren et al., 2022), calculated as its volume-weighted spatial standard deviation (SSD) over the global upper 2000 m ocean as follows:
where ( ) represent longitude, latitude, depth, and time; is the volume centered at a given grid point ( ); is the number of grid points in the global ocean, and represents the volume-weighted spatially averaged value. indicates that property is spatially uniform.

3. Global ocean changes of OHC, salinity, and stratification

3.1. OHC and surface temperatures

The global upper 2000 m OHC changes since 1958 (Fig. 2) show that, regardless of the processing techniques, there has been an unequivocal ocean warming trend in
recent decades. The upper 2000 m of the world’s ocean has warmed on average by during 1958-2023 (IAP/CAS) and by during 1958-2020 (NCEI/NOAA pentadal estimate). The confidence levels are calculated using the approach of Cheng et al. (2022b). However, these trends do not match within the error bars, probably because of (1) conservative assumptions by NOAA when there are no data (relax to climatology in data gaps), especially in the presence of global warming trends; and (2) the difference in XBT/MBT bias correction and the new inclusion of the bottle data bias correction (Gouretski and Cheng, 2020; Gouretski et al., 2022).
Regardless of which estimate is used, there has been a two- to three- fold increase in the rate of increase in OHC since the late 1980s. For example, according to the IAP analysis, the OHC trend for 1958-1985 is , and since 1986, the OHC trend is (Fig. 2). The IAP trend within 1958-1985 of is higher than the previous release in Cheng et al. (2023) ( ), mainly because the new inclusion of the bottle data bias correction.
After 2007, with better global coverage of ocean subsurface data, OHC uncertainty is reduced. There is a significant warming trend of and from 2007-2023 for IAP/CAS and NCEI/NOAA (seasonal time series), respectively (Fig. 2). The NCEI three-month OHC estimate has a slightly stronger trend than the pentadal time series from 2005 to 2020, indicating the impact of sampling changes associated with the mapping approach.
OHC tends to peak shortly before and then decline during and after an El Niño event, associated with ocean heat release into the atmosphere, mainly through increased evaporation (Cheng et al., 2019). In 2023, OHC was at the highest level ever recorded in the world’s ocean, and the El Niño effects may not yet be fully evident. The 2023 upper 2000 m OHC exceeds that of 2022 by according to IAP/CAS data, and by according to NCEI/NOAA data (for the 0-2000 m layer; 95% confidence interval is presented; Table 1). A ranked ordering of the hottest five years for global OHC is provided in Table 1. The annual OHC values from 2019 to 2022 updated in this paper (Table 1) are collectively higher ( ) than the numbers in the previous release (Cheng et al., 2023), because of the update of the IAP/CAS dataset that led to higher OHC anomalies after 2019 relative to the 1981-2010 baseline. Preliminary analyses suggest the difference is likely attributed to the replacement of the WOD-QC system (used in previous IAP analyses) by the new CODC-QC systems. Tan et al. (2023) indicated that the WOD-QC system has removed more positive anomalies than CODC-QC. The bias corrections to data collected by marine animals play a secondary role. The difference in 2023 OHC values between the two groups is also primarily attributed to the data QC, which relates to how the outliers are defined and flagged with a secondary contribution from the mapping approach. A careful investigation is warranted to reconcile the two groups’ estimates.
Fig. 2. Global upper 2000 m OHC from 1958 through 2023 according to (a) IAP/CAS and (b) NCEI/NOAA ( ). The line shows (a) monthly and (b) seasonal values, and the histogram presents (a) annual and (b) pentad anomalies relative to a 1981-2010 baseline.
Table 1. Ranked order of the five hottest years of the world’s ocean since 1955. The OHC values are for the upper 2000 m in units of ZJ. The SST values are in . Both OHC and SST anomalies are relative to the 1981-2010 average. Note the IAP/CAS values are collectively higher ( ) than the previous release (Cheng et al., 2023) because of the update of the IAP/CAS dataset that led to higher OHC anomalies relative to the 1981-2010 baseline.
Rank Year OHC (IAP/CAS) (units: ZJ) OHC (NCEI/NOAA) (units: ZJ) SST anomaly (IAP/CAS) (units: )
1 2023 286 247 0.54
2 2022 271 238 0.31
3 2021 254 229 0.28
4 2020 237 211 0.38
5 2019 228 210 0.40
During an El Niño event, there is a heat redistribution from the 100-500 m layer into the upper layer, yielding higher SST than normal (Cheng et al., 2019). The anomalously high SST leads to a higher global mean surface temperature (GMST) (Trenberth et al. 2002; Li et al., 2024). In 2023, the SST became the highest on record after April, and the annual mean was higher than in 2022 and an astounding higher than the 1981-2020 average (Fig. 3). By June 2023, global monthly SSTs were already above those of any prior year, an exceedingly large value (Fig. 3) that also meant GMSTs were the highest on
record. The monthly SST anomaly in 2023 relative to 1981-2010 grew from in January to in September, making September 2023 the hottest month on record for global SSTs. Normally, the hottest month for SST in a particular year occurs in March, at the end of the southern summer, because there is a large ocean area in the Southern Hemisphere (Fig. 3 inner box plot). Although SST has increased dramatically in 2023, the OHC increase has been steady over time (Fig. 2). Therefore, it is the relatively small year-to-year natural variability in OHC relative to the warming trend that makes OHC such a good indicator of climate
Fig. 3. Global SST changes from 1955 through 2023 according to first level ( 1 m ) data in the IAP/CAS temperature gridded analysis ( ). The black line is the annual value, and the red is the monthly value. The anomalies are relative to a 1981-2010 baseline. The within-year variation of SST is shown in the inner box, with 2023 values shown in black.
change.

3.2. Other oceanic climate indicators

Substantial changes are also seen in other oceanic metrics. The upper 2000 m SC index time series since 1958 (Fig. 4) reveal a robust increase in the SC index in the past half-century, indicating an amplification of the salinity pattern (Cheng et al., 2020). The SC index reached in 2023, the fourth-highest value since 1958. However, the difference between the top 5 years 2017, 2022, 2021, 2023, and 2019) is not statistically significant because of the large inter-annual variability and data uncertainty; for instance, there are more real-time Argo salinity data recently that have not undergone careful quality-control and bias adjustment. This ocean-based metric is generally consistent with many atmosphere-based estimates and strengthens the evidence that the global water cycle has been amplified with global warming (Cheng et al., 2020). On land, the amplified water cycle means stronger and longer dry spells and more heavy rainfall events with the potential for flooding, as observed (Fischer et al., 2021).
Ocean density stratification has also increased since the late 1950s (Fig. 4b) because of the change in vertical temperature and salinity structure (Li et al., 2020a). The stratification index shows stronger interannual to decadal variability than
the OHC and SC-index because it reveals more upper-ocean changes, which shows stronger anomalies than the deeper ocean. In 2023, the upper 2000 m stratification increased to , reaching record high values in 2023 mainly because of the development of the strong El Niño.
The spatial inhomogeneity index of ocean temperature has also increased since the 1950s (Fig. 4c), with a trend of . This index reached a record high of in 2023 relative to a 1981-2010 baseline, indicating a substantial increase in ocean temperature spatial variance. The non-uniform upper-ocean warming, which was more rapid at mid-to-low latitudes, was mainly responsible for this index increase in 2023 (Ren et al., 2022).

4. Regional patterns of ocean warming and salinity

Spatial maps of the 2022 OHC anomaly relative to the mean 1981-2010 conditions (Fig. 5) reveal that most of the ocean areas are warming significantly, while some areas (much of the Atlantic, North Pacific, Western Pacific, and southern oceans) are heating at a faster rate than the global average ( ). The drivers of the long-term OHC trend patterns were discussed
Fig. 4. Monthly (black line) and annual (color bars) changes in (a) SC index, (b) stratification, and (c) spatial inhomogeneity index of temperature in the upper 2000 m of the global ocean from 1958 to 2023 [data updated from Cheng et al. (2017)]. The units for salinity are (using absolute salinity).
by Cheng et al. (2022a, c).
The OHC annual mean difference between 2023 and 2022 is presented in Fig. 6. In the tropical Pacific, strong warming anomalies in the eastern Pacific and cooling anoma-
lies in the western Pacific in 2023 (Fig. 6) indicate the shoaling of the equatorial thermocline associated with El Niño. The zonal OHC shows strong tropical warming within , which is partly offset by the cooling around and
2023 OHC (0-2000m) anomaly relative to 1981-2010 baseline (IAP/CAS)
Fig. 5. The annual OHC anomaly in 2023 relative to a 1981-2010 baseline for IAP/CAS data; units: [data updated from Cheng et al. (2017)].
Fig. 6. (a) Differences of annual mean upper 2000 m OHC values between 2023 and 2022, based on IAP/CAS analysis. (b) As in (a) but for the NCEI/NOAA analysis. Units: . The zonal OHCs are presented on the righthand side of the spatial maps [data updated from Cheng et al. (2017) in (a), and from Levitus et al. (2012) in (b)].
. The two estimates show consistent large-scale patterns, but the NCEI/NOAA data are noisier, mainly because of the mapping approach.
The 2023 salinity anomalies relative to a 1981-2010 baseline (Fig. 7a) reveal freshening trends for most of the Pacific and Indian oceans, with relatively saline areas such
as the midlatitude Atlantic, the Mediterranean Sea, and the West Indian Ocean becoming more saline. This is a typical “fresh gets fresher, salty gets saltier” pattern change driven by atmospheric hydrological cycle amplification. The tropical salinity changes reveal more of the impact of El Niño, especially in the western Pacific and around the Intertropical Con-
Fig. 7. (a) The upper 2000 m salinity anomaly in 2023 relative to a 1981-2010 baseline. (b) The difference in salinity in the upper 2000 m between 2023 and 2022. The zonal mean salinity anomalies are presented on the right-hand side of the spatial maps [data updated from Cheng et al. (2020)].
vergence Zone (ITCZ) . During the El Niño event, the upward branch of the Walker circulation moves into the tropical central Pacific Ocean, resulting in less rainfall in the western Pacific and ITCZ and an increase in ocean salinity (Fig. 7b).

5. Basin-wide OHC changes and regional hotspots

The evolution of regional OHC in seven ocean regions is presented in Fig. 8 for 1958 to 2023. The northwest region of the Pacific Ocean, bounded by and , is dominated by substantial interannual and decadal internal variability, especially from the Interdecadal Pacific Variability and ENSO (OHC is higher during the La Niña year). Since 2000, the upper 2000 m OHC values have collectively been higher than in 1958-2000. In 2023, the Northwest Pacific OHC is lower than in 2020-22 because of El Niño (Fig. 8a; above a 1981-2010 baseline, ranked 20 since 1958).
The Indian OHC in 2023 is among the top five record years (Fig. 8b; relative to a 1981-2010 baseline). The decrease in OHC from 2020 to 2022 is consistent
with the negative Indian OHC tendency during La Niña (Cheng et al., 2019), driven mainly by decreasing the heat transport through the Indonesian Throughflow passages during the decaying stage of La Niña (Trenberth and Zhang, 2019; Li et al., 2020b; Volkov et al., 2020). However, the Indian OHC has shown a continuous increase since January 2023, associated with the cessation of La Nina and the development of El Niño.
The tropical Atlantic Ocean , a region important for hurricane development (Trenberth et al., 2018), shows a continual increase in OHC since the late 1950s (Fig. 8c). The upper 2000 m OHC in 2023 reached the highest value ever recorded in 2023 higher than the 1981-2010 baseline, and it is higher than 2022).
In the North Atlantic Ocean, the upper 2000 m OHC was near its record high in 2023, lower than 2022 by and lower than 2021 by . Although El Niño years tend to have slightly weaker hurricane seasons, the Atlantic basin saw 20 named storms in 2023 (including seven hurricanes), which ranks fourth for the number of storms in a year since 1950 (https://www.noaa.gov/news-release/2023-atlantic-hurricane-season-ranks-4th-for-most-
Fig. 8. Regional observed upper 2000 m OHC change from 1958 through 2023 relative to a 1981-2010 baseline. The time series (black lines) are smoothed by LOWESS (locally weighted scatterplot smoothing) with a span width of 240 months. The gray shaded areas are the confidence intervals [data updated from Cheng et al. (2017)].
named-storms-in-year). In 2023, the SST in the North Atlantic Ocean has been at a record high since March. The maximum temperature is higher than the 1981-2010 average. These warm anomalies are mainly distributed in the eastern North Atlantic Ocean and are shallow, being confined to the upper 100 m ocean (Fig. 9). The causes of these anomalies remain a topic of investigation.
In the North Pacific Ocean , an area of largescale warming ( ) and marine heatwaves [named “The Blob” (Scannell et al., 2020)] persisted in 2023 (Figs. 5, 6 and 8). The upper 2000 m OHC has decreased slightly by compared with 2022. The upper 2000 m OHC in the Southern Ocean in 2023 exceeded the 2022 value by (Fig. 8g), continuing its long-term increasing trend since the 1960s.
The Mediterranean Sea OHC in 2023 was higher than in 2022 by (Fig. 8d) for IAP/CAS data and by for independent ocean reanalysis data (CMSMEDREA; Escudier et al., 2021; Nigam et al., 2021), indicating a record-high OHC in 2023 (Fig. 8d). A marked temperature increase has been measured in the last few decades in the Mediterranean Sea, starting from the Eastern Basin where warmer (and saltier) Intermediate Waters formed and spread towards the Western Basin on their way back to the North Atlantic (Pinardi et al., 2015; Von Schuckmann et al., 2016; Simoncelli et al., 2018). Accurate measurements provided by a CNR_ISMAR mooring in the Sicily Channel since 1993 (Schroeder et al., 2017; Ben Ismail et al., 2021; available at https://doi.org/10.48670/moi-00044) and the temperatures resulting from the monitoring with XBT probes in the Tyrrhenian and Ligurian Seas since 1999 along the MX04 Genoa-Palermo line (Reseghetti et al., 2023; Simon-
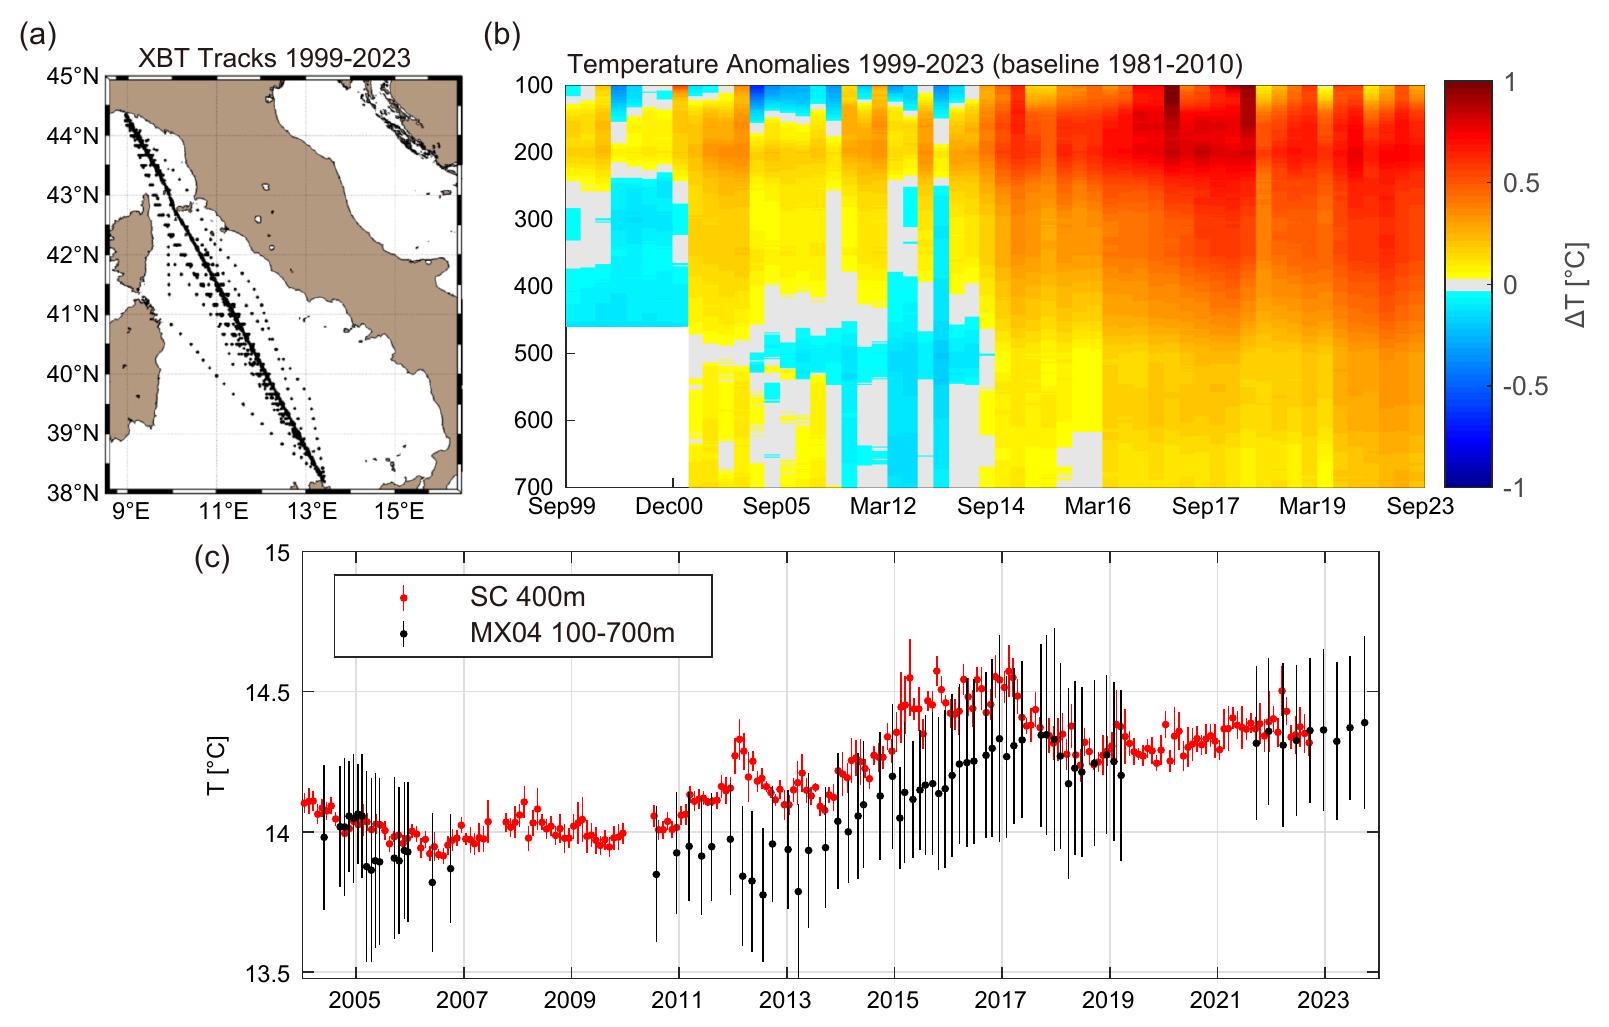
celli et al., 2023) (Fig. 10a), indicated clear warming in the layer that started in spring 2013 (Cheng et al., 2022c). This warming region subsequently extended deeper and northward, reaching 700 m in 2016 (Fig. 10b). Data from MX04 and from the Sicilian Channel mooring indicate warming in the period 2013-16 above (Fig. 10c) and, after a slight decrease and a stationary period, a recovery in growth in 2021, culminating for now in September 2023 when a new maximum temperature record was measured along the MX04 line. The linear rate calculated for the period is for the MX04 area, while it is in the Sicily Channel.

6. Concluding remarks

Based on analyses conducted by several independent research groups, this paper provides updates of the SST, OHC, salinity, stratification, and a spatial temperature inhomogeneity index for the year 2023. The ocean continued to warm globally in 2023, not only at the surface but also across the upper 2000 m . The warming rate has increased in recent decades, with a faster rate of warming evident since around 1990 (Cheng et al., 2022a, b). Similarly, the SC index has increased, signifying more extreme salinity anomalies and an imprint of global water cycle amplification on the upper ocean. Ocean stratification also was at a record high in 2023, with upper ocean waters becoming more stable over time, although with more variability than other climate characteristics. Regional warming patterns reveal that three out of seven investigated regions in this study reached record levels of their upper 2000 m OHC in 2023.
Given the disparities between IAP/CAS and NOAA/
Fig. 9. Three-dimensional fields of oceanic temperature changes in 2023 relative to 2022 in the North Atlantic Ocean. The NCEI/NOAA data are used, and the illustration is modified with domains and angles from Seidov et al. (2021).
Fig. 10. Temperature along the MX04 Genova-Palermo transect (western Mediterranean) recorded by XBT probes from ships of opportunity and monthly mean temperature values at 400 m from the Sicily Channel mooring. (a) XBT tracks in the Tyrrhenian and Ligurian seas. (b) Hovmoller plot of mean MX04 temperature anomalies in 1999-2023 computed by subtracting the 1981-2010 baseline of IAP/CAS data. (c) MX04 mean temperature values computed in the layers of 100-700 m, and monthly mean temperature values at 400 m from the Sicily Channel mooring, between 2004 and 2023, with the error bars representing the relative standard deviations. The standard deviations associated with the two time-series differ by one order of magnitude owing to the variability associated with the daily temperature sampled at a single location ( 400 m deep) or the daily temperature within a specific layer ( ) sampled along a line, about 430 nautical miles long.
NCEI OHC change estimates between 2023 and 2022 (15 ZJ for IAP/CAS and 9 ZJ for NOAA/NCEI), a further bulk check was attempted. The CERES 2023 January-October mean net EEI anomaly is , although values were decreasing sharply in late 2023. Assuming zero for November and December, the CERES 2023 anomaly would be for the year or 25 ZJ . Further, if of this went into the ocean, the OHC increase would be 22.5 ZJ . For global sea level (https://sealevel.colorado.edu/data/ 2023rel2), the estimated change between January-October 2023 and January-December 2022 is 5.58 mm . Converting SLR to the contribution from OHC depends critically on where the heat is added. Firstly, SLR is usually dominated by volume and mass changes from melting land ice, and a reasonable estimate is that ocean warming contributes 2.5 mm from expansion. The SL response varies a lot depending on where heat is deposited (Fasullo et al., 2020); the response is greater for higher temperatures, and a rough estimate is that the required heat added is . Hence, even though these bulk global estimates vary, they show the way forward for reducing uncertainty, and all indicate substantial warming in 2023.
Acknowledgements. The IAP/CAS analysis is supported by
the National Natural Science Foundation of China (Grant Nos. 42076202, 42122046, 42206208 and 42261134536), the new Cornerstone Science Foundation through the XPLORER PRIZE, DAMO Academy Young Fellow, Youth Innovation Promotion Association, Chinese Academy of Sciences; National Key Scientific and Technological Infrastructure project “Earth System Science Numerical Simulator Facility” (EarthLab). The calculations in this study were carried out on the ORISE Supercomputer. NCAR is sponsored by the US National Science Foundation. We used some data collected onboard R/V Shiyan 6 implementing the Open Research Cruise NORC2022-10+NORC2022-303 supported by NSFC shiptime Sharing Projects 42149910. The efforts of Dr. Fasullo in this work were supported by NASA Awards 80NSSC17K0565, 80NSSC21K1191, and 80NSSC22K0046 and by the Regional and Global Model Analysis (RGMA) component of the Earth and Environmental System Modeling Program of the U.S. Department of Energy’s Office of Biological & Environmental Research (BER) via National Science Foundation IA 1947282. The efforts of Dr. MISHONOV were supported by NOAA (Grant No. NA19NES4320002 to CISESS-MD at the University of Maryland). The IAP/CAS data are available at http://www.ocean.iap.ac.cn/ and https://msdc.qdio.ac.cn/. The NCEI/NOAA data are available athttps://www.ncei.noaa.gov/products/climate-data-records/global-
ocean-heat-content. This study has been conducted using also E.U. Copernicus Marine Service Information (https://marine.copernicus.eu/) for the Mediterranean OHC estimates. G. LI is supported by the Young Talent Support Project of Guangzhou Association for Science and Technology. The data are from https://gml.noaa.gov/ccgg/trends/. The historical XBT data along the MX04 line (Genova-Palermo) are from Reseghetti et al. (2023). Since 2021, XBT data have been collected under the framework of the MACMAP project funded by the Istituto Nazionale di Geofisica e Vulcanologia (INGV) in agreement between INGV, ENEA, and GNV SpA shipping company that provides hospitality on its commercial vessels. The Mediterranean Sea analysis has also been conducted using E.U. Copernicus Marine Service Information.
Open Access. This article is licensed under a Creative Commons Attribution 4.0 International License, which permits use, sharing, adaptation, distribution and reproduction in any medium or format, as long as appropriate credit is given to the original author(s) and the source, plus a link to the Creative Commons license, and indications of any changes made. The images or other third-party material in this article are included in the article’s Creative Commons license, unless indicated otherwise in a credit line to the material. If material is not included in the article’s Creative Commons license and intended use is not permitted by statutory regulation or exceeds the permitted use, the user will need to obtain permission directly from the copyright holder. To view a copy of this license, visit http://creativecommons.org/licenses/by/4.0/.

REFERENCES

Abraham, J., and Coauthors, 2013: A review of global ocean temperature observations: Implications for ocean heat content estimates and climate change. Rev. Geophys., 51, 450-483, https://doi.org/10.1002/rog. 20022.
Abraham, J., L. J. Cheng, M. E. Mann, K. Trenberth, and K. Von Schuckmann, 2022: The ocean response to climate change guides both adaptation and mitigation efforts. Atmos. Ocean. Sci. Lett., 15, 100221, https://doi.org/10.1016/j.aosl.2022. 100221.
Abraham, J. P., and L. J. Cheng, 2022: Intersection of climate change, energy, and adaptation. Energies, 15, 5886, https:// doi.org/10.3390/en15165886.
Argo, 2023: Argo Float Data and Metadata from Global Data Assembly Centre (Argo GDAC). SEANOE. Available from https://doi.org/10.17882/42182.
Ben Ismail S., K. Schroeder, J. Chiggiato, S. Sparnocchia, and M. Borghini, 2021: Long term changes monitored in two Mediterranean Channels. Copernicus Marine Service Ocean State Report, Issue 5, K. Von Schuckmann et al., Eds., 48-52, https://doi.org/10.1080/1755876X.2021.1946240.
Boyer, T., and Coauthors, 2016: Sensitivity of global upperocean heat content estimates to mapping methods, XBT bias corrections, and baseline climatologies. J. Climate, 29, 4817-4842, https://doi.org/10.1175/JCLI-D-15-0801.1.
Boyer, T. P., and Coauthors, 2018: World ocean database 2018. NOAA Atlas NESDIS 87.
Cheng, L. J., J. Zhu, R. Cowley, T. Boyer, and S. Wijffels, 2014: Time, probe type, and temperature variable bias corrections
to historical expendable bathythermograph observations. . Atmos. Oceanic Technol., 31(8), 1793-1825, https://doi.org/ 10.1175/JTECH-D-13-00197.1.
Cheng, L. J., K. E. Trenberth, J. Fasullo, T. Boyer, J. Abraham, and J. Zhu, 2017: Improved estimates of ocean heat content from 1960 to 2015. Science Advances, 3, e1601545, https:// doi.org/10.1126/sciadv. 1601545.
Cheng, L. J., K. Trenberth, J. Fasullo, J. Abraham, T. Boyer, K. Von Schuckmann, and J. Zhu, 2018: Taking the pulse of the planet. Eos, 99, 14-16, https://doi.org/10.1029/2017EO 081839.
Cheng, L. J., K. E. Trenberth, J. T. Fasullo, M. Mayer, M. Balmaseda, and J. Zhu, 2019: Evolution of ocean heat content related to ENSO. J. Climate, 32, 3529-3556, https://doi.org/ 10.1175/JCLI-D-18-0607.1.
Cheng, L. J., and Coauthors, 2020: Improved estimates of changes in upper ocean salinity and the hydrological cycle. J. Climate, 33, 10 357-10 381, https://doi.org/10.1175/JCLI-D-20-0366.1.
Cheng, L. J., and Coauthors, 2022a: Past and future ocean warming. Nature Reviews Earth & Environment, 3, 776-794, https://doi.org/10.1038/s43017-022-00345-1.
Cheng, L. J., G. Foster, Z. Hausfather, K. E. Trenberth, and J. Abraham, 2022b: Improved quantification of the rate of ocean warming. J. Climate, 35, 4827-4840, https://doi.org/10. 1175/JCLI-D-21-0895.1.
Cheng, L. J, and Coauthors, 2022c: Another record: Ocean warming continues through 2021 despite La Niña conditions. Adv. Atmos. Sci., 39(3), 373-385, https://doi.org/10.1007/s00376-022-1461-3.
Cheng, L. J., and Coauthors, 2023: Another year of record heat for the oceans. Adv. Atmos. Sci, 40, 963-974, https://doi.org/ .
Durack, P. J., and S. E. Wijffels, 2010: Fifty-year trends in global ocean salinities and their relationship to broad-scale warming. J. Climate, 23, 4342-4362, https://doi.org/10.1175/ 2010JCLI3377.1.
Escudier, R., and Coauthors, 2021: A high resolution reanalysis for the mediterranean sea. Front. Earth Sci., 9, 702285, https://doi.org/10.3389/feart.2021.702285.
Fischer, E. M., S. Sippel, and R. Knutti, 2021: Increasing probability of record-shattering climate extremes. Nature Climate Change, 11, 689-695, https://doi.org/10.1038/s41558-021-01092-9.
Fasullo, J. T., Gent, P. R., and Nerem, R. S. 2020: Forced patterns of sea level rise in the community earth system model large ensemble from 1920 to 2100. Journal of Geophysical Research: Oceans, 125, e2019JC016030. https://doi.org/10. 1029/2019JC016030
Gouretski, V., and L. J. Cheng, 2020: Correction for systematic errors in the global dataset of temperature profiles from mechanical bathythermographs. J. Atmos. Oceanic Technol., 37(5), 841-855, https://doi.org/10.1175/JTECH-D-190205.1.
Gouretski, V., L. J. Cheng, and T. Boyer, 2022: On the consistency of the bottle and CTD profile data. J. Atmos. Oceanic Technol., 39(12), 1869-1887, https://doi.org/10.1175/JTECH-D-22-0004.1.
Gouretski, V., F. Roquet, and L. J. Cheng, 2023: Measurement biases in ocean temperature profiles from marine mammal data loggers. J. Atmos. Oceanic Technol., submitted.
Gulev, S., and Coauthors, 2021: Changing state of the climate sys-
tem. Climate Change 2021: The Physical Science Basis. Contribution of Working Group I to the Sixth Assessment Report of the Intergovernmental Panel on Climate Change, V. Mas-son-Delmotte et al., Eds., Cambridge University Press.
Huang, B. Y., and Coauthors, 2017: Extended reconstructed sea surface temperature, Version 5 (ERSSTv5): Upgrades, validations, and intercomparisons. J. Climate, 30, 8179-8205, https://doi.org/10.1175/JCLI-D-16-0836.1.
Johnson, G., and Coauthors, 2018: Ocean heat content [in State of the Climate in 2017]. Bull. Amer. Meteor. Soc., 99, S72-S77.
Levitus, S., J. I. Antonov, T. P. Boyer, R. A. Locarnini, H. E. Garcia, and A. V. Mishonov, 2009: Global ocean heat content 1955-2008 in light of recently revealed instrumentation problems. Geophys. Res. Lett., 36, L07608, https://doi.org/10. 1029/2008GL037155.
Levitus, S., and Coauthors, 2012: World ocean heat content and thermosteric sea level change ( ), 1955-2010. Geophys. Res. Lett., 39, L10603, https://doi.org/10.1029/ 2012GL051106.
Li, G. C., L. J. Cheng, J. Zhu, K. E. Trenberth, M. E. Mann, and J. P. Abraham, 2020a: Increasing ocean stratification over the past half-century. Nature Climate Change, 10, 1116-1123, https://doi.org/10.1038/s41558-020-00918-2.
Li, K. X., F. Zheng, L. J. Cheng, T. Y. Zhang, and J. Zhu, 2023: Record-breaking global temperature and crises with strong El Niño in 2023-2024. The Innovation Geoscience, 1(2), 100030. https://doi.org/10.59717/j.xinn-geo.2023.100030.
Li, K. X., F. Zheng, J. Zhu, and Q.-C. Zeng, 2024: El Niño and the AMO sparked the astonishingly large margin of warming in the global mean surface temperature in 2023. Adv. Atmos. Sci., https://doi.org/10.1007/s00376-023-3371-4.
Li, Y. L., W. Q. Han, F. Wang, L. Zhang, and J. Duan, 2020b: Vertical structure of the upper-Indian Ocean thermal variability. J. Climate, 33, 7233-7253, https://doi.org/10.1175/JCLI-D-19-0851.1.
Loeb, N. G., G. C. Johnson, T. J. Thorsen, J. M. Lyman, F. G. Rose, and S. Kato, 2021: Satellite and ocean data reveal marked increase in Earth’s heating rate. Geophys. Res. Lett., 48, e2021GL093047, https://doi.org/10.1029/2021GL09 3047.
Loeb, N. G., and Coauthors, 2022: Evaluating twenty-year trends in Earth’s energy flows from observations and reanalyses. . Geophys. Res. Atmos., 127, e2022JD036686, https://doi.org/ 10.1029/2022JD036686.
Nigam, T., and Coauthors, 2021: Mediterranean Sea Physical Reanalysis INTERIM (CMEMS MED-Currents, E3R1i system) (Version 1) [Data set]. Copernicus Monitoring Environment Marine Service (CMEMS). https://doi.org/10.25423/ CMCC/MEDSEA_MULTIYEAR_PHY_006_004_E3R1I.
Pinardi, N., and Coauthors, 2015: Mediterranean Sea large-scale low-frequency ocean variability and water mass formation rates from 1987 to 2007: A retrospective analysis. Progress in Oceanography, 132, 318-332, https://doi.org/10.1016/j. pocean.2013.11.003.
Purkey, S., and G. C. Johnson, 2010: Warming of global abyssal and deep Southern Ocean waters between the 1990s and 2000s: Contributions to global heat and sea level rise budgets. J. Climate, 23, 6336-6351, https://doi.org/10.1175/ 2010JCLI3682.1.
Ren, Q. P., Y.-O. Kwon, J. Y. Yang, R.-X. Huang, Y. L. Li, and F. Wang, 2022: Increasing inhomogeneity of the global
oceans. Geophys. Res. Lett., 49, e2021GL097598, https://doi. org/10.1029/2021GL097598.
Reseghetti, F., C. Fratianni, and S. Simoncelli, 2023: Reprocessed of XBT dataset in the Ligurian and Tyrrhenian seas (1999-2019). Istituto Nazionale di Geofisica e Vulcanologia (INGV). [Available online from https://doi.org/10.13127/ rep_xbt_1999_2019].
Rhein, M., and Coauthors, 2013: Observations: Ocean pages. Climate Change 2013: The Physical Science Basis. Contribution of Working Group I to the Fifth Assessment Report of the Intergovernmental Panel on Climate Change, T. F. Stocker et al., Eds., Cambridge University Press.
Scannell, H. A., G. C. Johnson, L. Thompson, J. M. Lyman, and S. C. Riser, 2020: Subsurface evolution and persistence of marine heatwaves in the Northeast Pacific. Geophys. Res. Lett., 47, e2020GL090548, https://doi.org/10.1029/2020 GL090548.
Schroeder, K., J. Chiggiato, S. A. Josey, M. Borghini, S. Aracri, and S. Sparnocchia, 2017: Rapid response to climate change in a marginal sea. Scientific Reports, 7, 4065, https://doi.org/ 10.1038/s41598-017-04455-5.
Seidov, D., A. Mishonov, and R. Parsons, 2021: Recent warming and decadal variability of Gulf of Maine and Slope Water. Limnology and Oceanography, 66, 3472-3488, https://doi. org/10.1002/lno.11892.
Simoncelli, S., N. Pinardi, C. Fratianni, C. Dubois, and G. Notarstefano, 2018: Water mass formation processes in the Mediterranean Sea over the past 30 years. In: Copernicus Marine Service Ocean State Report, Issue 2, Journal of Operational Oceanography, 11:sup1, s13-s16, https://doi.org/10.1080/ 1755876X.2018.1489208.
Simoncelli, S., Reseghetti, F., Fratianni, C., Cheng, L., and Raiteri, G., 2023: Reprocessing of XBT profiles from the Ligurian and Tyrrhenian seas over the time period 1999-2019 with full metadata upgrade, Earth Syst. Sci. Data Discuss. [preprint], https://doi.org/10.5194/essd-2023-525, in review.
Tan, Z. T., L. J. Cheng, V. Gouretski, B. Zhang, Y. J. Wang, F. C. Li, Z. H. Liu, and J. Zhu, 2023: A new automatic quality control system for ocean profile observations and impact on ocean warming estimate. Deep-Sea Res. Part I Oceanogr. Res. Pap., 194, 103961, https://doi.org/10.1016/j.dsr.2022. 103961.
Trenberth, K. E., J. T. Fasullo, and M. A. Balmaseda, 2014: Earth’s energy imbalance. J. Climate, 27, 3129-3144, https:// doi.org/10.1175/JCLI-D-13-00294.1.
Trenberth, K. E., J. M. Caron, D. P. Stepaniak, and S. Worley, 2002: Evolution of El Niño-Southern Oscillation and global atmospheric surface temperatures. J. Geophys. Res., 107, AAC 5-1-AAC 5-17, doi: 10.1029/2000JD000298.
Trenberth, K. E., L. J. Cheng, P. Jacobs, Y. X. Zhang, and J. Fasullo, 2018: Hurricane Harvey links to ocean heat content and climate change adaptation. Earth’s Future, 6, 730-744, https://doi.org/10.1029/2018EF000825.
Trenberth, K. E., and Y. X. Zhang, 2019: Observed interhemispheric meridional heat transports and the role of the Indonesian Throughflow in the Pacific Ocean. J. Climate, 32, 8523-8536, https://doi.org/10.1175/JCLI-D-19-0465.1.
Volkov, D. L., S.-K. Lee, A. L. Gordon, and M. Rudko, 2020: Unprecedented reduction and quick recovery of the South Indian Ocean heat content and sea level in 2014-2018. Science Advances, 6, eabc1151, https://doi.org/10.1126/sciadv. abc1151.
Von Schuckmann, K., and Coauthors, 2016: The Copernicus marine environment monitoring service ocean state report. Journal of Operational Oceanography, 9, s235-s320, https:// doi.org/10.1080/1755876X.2016.1273446.
Von Schuckmann, K., and Coauthors, 2020: Heat stored in the Earth system: Where does the energy go? Earth System Sci-
ence Data, 12, 2013-2041, https://doi.org/10.5194/essd-12-2013-2020.
Zheng, F., and J. Zhu, 2016: Improved ensemble-mean forecasting of ENSO events by a zero-mean stochastic error model of an intermediate coupled model. Climate Dyn., 47, 3901-3915, https://doi.org/10.1007/s00382-016-3048-0.

    • Corresponding author: Lijing CHENG