DOI: https://doi.org/10.1029/2023gb007953
تاريخ النشر: 2024-04-01
مقالة بحثية
10.1029/2023GB007953
قسم خاص:
ريكا ب2
النقاط الرئيسية:
- المنطقة أصدرت
، و إلى الغلاف الجوي بين عامي 2000 و 2020 - استنادًا إلى ما سبق، ظلت النظم البيئية الأرضية
الغمر، لكن الانبعاثات الناتجة عن الحرائق والمياه الداخلية تعوض إلى حد كبير عن الغمر في النظم البيئية النباتية - عند تضمين التدفقات الجانبية أيضًا، تؤدي الميزانيات الكاملة للكربون والنيتروجين في منطقة التربة المتجمدة إلى مصادر صافية تبلغ 144 (-506، 826؛ بما في ذلك
و و
المعلومات الداعمة:
المراسلة إلى:
justine.ramage@natgeo.su.se
اقتباس:
تم القبول 29 فبراير 2024
مساهمات المؤلفين:
© 2024. المؤلفون.
صافي توازن غازات الدفيئة وميزانية منطقة التربة المتجمدة (2000-2020) من توسيع تدفقات النظام البيئي
الملخص
من المتوقع أن يتحول منطقة التربة المتجمدة الشمالية من مصب صافي إلى مصدر صافي للكربون تحت تأثير الاحترار العالمي. ومع ذلك، تظل تقديرات التوازن الحالي لغازات الدفيئة (GHG) وميزانيات منطقة التربة المتجمدة غير مؤكدة للغاية. هنا، نقوم بإنشاء أول ميزانيات شاملة من الأسفل إلى الأعلى لـ
الدورات البيوجيوكيميائية العالمية
التحليل الرسمي: مكينزي كوهين، آنا ماريا فيركالا، كارولينا فويت، مايا إي. ماروشتشاك، غوستاف هوجيليوس الحصول على التمويل: مكينزي كوهين، آنا ماريا فيركالا، كارولينا فويت، مايا إي. ماروشتشاك، كريستينا بياسي، ديفيد أوليفيلدت، بريندان م. روجرز، غوستاف هوجيليوس التحقيق: مكينزي كوهين، آنا ماريا فيركالا، كارولينا فويت، مايا إي. ماروشتشاك، غوستاف هوجيليوس المنهجية: مكينزي كوهين، آنا ماريا فيركالا، كارولينا فويت، مايا إي. ماروشتشاك، ديفيد أوليفيلدت، غوستاف هوجيليوس
إدارة المشروع: غوستاف هوغيليوس الموارد: ماكنزي كوهين، كارولينا فويت، مايا إي. ماروشتشاك، كريستينا بياسي، ديفيد أوليفيلدت، ستيفانو بوتر، بريندان م. روجرز، غوستاف هوغيليوس
الإشراف: غوستاف هوجيليوس التحقق: ماكنزي كوهين، آنا ماريا فيركالا، كارولينا فويت، مايا إي. ماروشتشاك، غوستاف هوجيليوس التصور: ماكنزي كوهين، آنا ماريا فيركالا، كارولينا فويت، مايا إي. ماروشتشاك
الكتابة – المسودة الأصلية: مكينزي كوهين، آنا-ماريا فيركالا، كارولينا فويت، مايا إي. ماروشتشاك، ديفيد أوليفيلدت
الكتابة – المراجعة والتحرير: مكينزي كوهين، آنا-ماريا فيركالا، كارولينا فويت، مايا إي. ماروشتشاك، آنا باستوس، كريستينا بياسي، جوزيب جي. كاناديل، فيليب سياس، إيفرن لوبيز بلانكو، سوزان م. ناتالي، ديفيد أوليفيلدت، ستيفانو بوتر، بنيامين بولتر، بريندان م. روجرز، إدوارد أ. ج. شور، كلير تريت، مريت ر. توريتسكي، جينيفر واتس، غوستاف هوجيليوس
1. المقدمة
2. المواد والأساليب
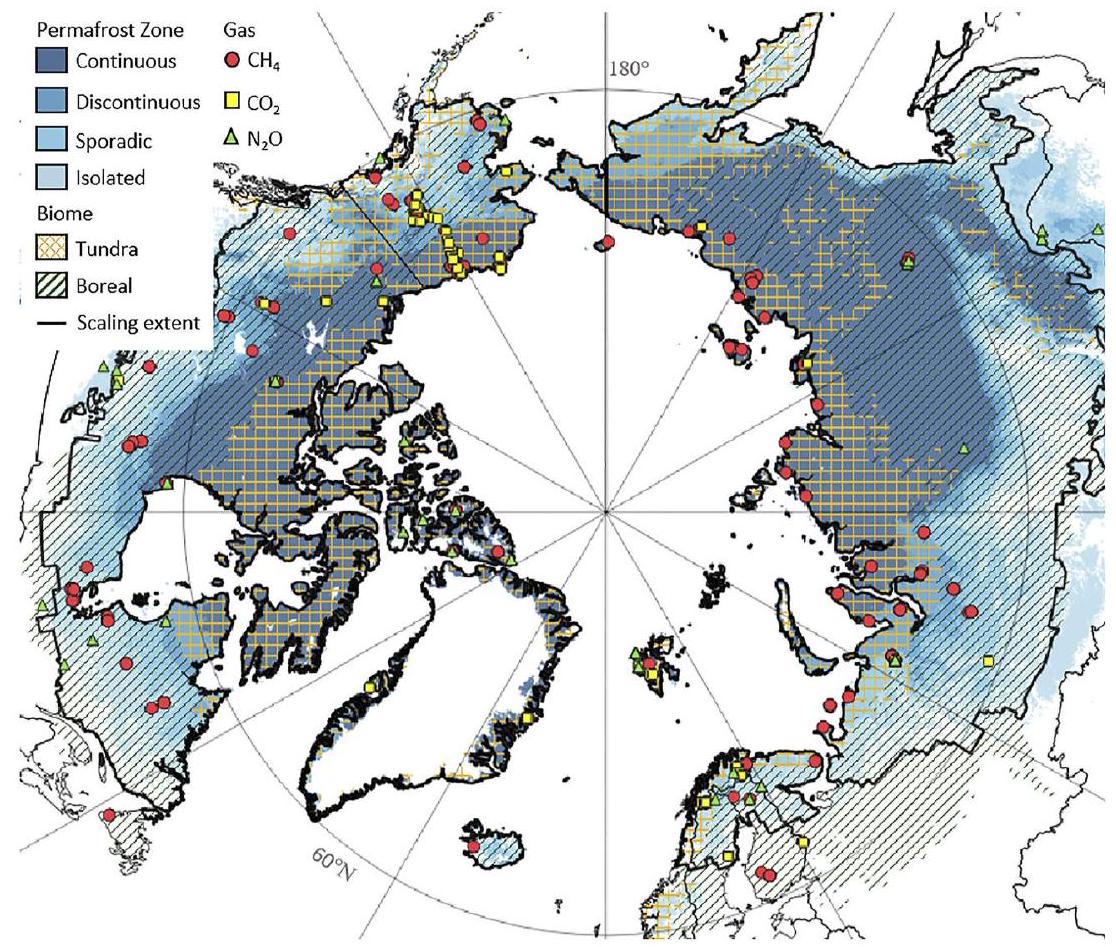
2.1. منطقة الدراسة
2.2. ميزانيات غازات الدفيئة من توسيع تدفقات النظام البيئي
استخدمنا قواعد بيانات التركيب الموجودة ومنتجات البيانات المصفوفة التي تم نشرها في السنوات الخمس الماضية لتقدير التدفقات المتوسطة السنوية ولفترة النمو لكل نوع من أنواع تغطية الأرض. جميع أرقام الميزانية مقدمة كوزن للكربون.
2.3. تدفقات غازات الدفيئة من أنواع تغطية الأرض البرية
- تشمل الأراضي الرطبة غير المتجمدة المستنقعات الخالية من التربة المتجمدة، والموائل، والأراضي الرطبة التي لا تحتوي على تربة متجمدة قريبة من السطح (انظر نظام تصنيف الأراضي الرطبة الكندية).
- الغابات الشمالية هي نظم بيئية غابية ذات تربة غير رطبة. تهيمن الأشجار الصنوبرية، ولكن الفئة تشمل أيضًا الأشجار المتساقطة في المناخات الأكثر دفئًا و/أو في بعض المواقع الجغرافية. قد تحتوي نظم الغابات الشمالية على التربة المتجمدة أو تكون خالية من التربة المتجمدة.
- الأراضي الرطبة المتجمدة هي نظم بيئية تحتوي على طبقات متجمدة قريبة من السطح وطبقات سميكة من الخث على السطح.
يشمل ذلك البالس، وهضاب الخث، والأجزاء المرتفعة من المستنقعات الجليدية ذات المركز العالي والمنخفض. عادةً ما تكون لديها ظروف أومبروتروفية تسبب ظروفًا فقيرة بالمغذيات. تهيمن على الغطاء النباتي الطحالب، وطحالب سفاجنوم، والشجيرات الخشبية، وأحيانًا غابات مخروطية نادرة. - التندرا الجافة تشمل النظم البيئية الخالية من الأشجار (كل من التندرا القطبية المنخفضة والتندرا الجبلية) التي تهيمن عليها النباتات العشبية أو الشجيرية. عادةً ما تحتوي نظم التندرا الجافة على طبقة من الجليد الدائم بالقرب من السطح. يتم تمييز التندرا الجافة عن المستنقعات الجليدية الدائمة من خلال تربتها العضوية الأرق.
)، ومن الأراضي الرطبة في التندرا من خلال تربتها المستنزفة (متوسط موقع مستوى المياه تحت سطح التربة). - الأراضي الرطبة في التندرا هي نظم بيئية بلا أشجار تحتوي على طبقة من الجليد الدائم بالقرب من السطح وظروف مشبعة أو مغمورة لجزء كبير من السنة. يمكن أن تكون الأراضي الرطبة في التندرا معدنية (
الخث) أو يحتوي على الخث ( الطين). يتميزون عن التندرا الجافة والمستنقعات المتجمدة بكونهم أكثر رطوبة ووجود هيدرولوجيا أكثر ديناميكية. تشمل الأراضي الرطبة في التندرا مناطق يمكن تصنيفها كمستنقعات تندرا في نظام تصنيف الأراضي الرطبة الكندي.
2.4. تدفقات غازات الدفيئة العمودية من المياه الداخلية
2.4.1. تدفقات غازات الدفيئة العمودية من الأنهار
2.4.2. تدفقات غازات الدفيئة العمودية من البحيرات
2.5. الاضطرابات – تدفقات غازات الدفيئة من الحرائق والذوبان المفاجئ
تم مناقشة المساهمة في إجمالي ميزانية غازات الدفيئة. بسبب نقص الملاحظات المباشرة حول تأثيرات الذوبان المفاجئ على
2.6. التدفقات الجانبية والانبعاثات الجيولوجية
3. النتائج والمناقشة
3.1. صافي توازن غازات الدفيئة من أنواع تغطية الأراضي البرية
غازات الدفيئة (
| منطقة |
|
|
|
|||||||
|
|
|
|
|
|||||||
| معنى | فترة الثقة 2.5% | فترة الثقة 97.5% | معنى | فترة الثقة 2.5% | فترة الثقة 97.5% | معنى | فترة الثقة 2.5% | فترة الثقة 97.5% | ||
| أغطية الأراضي المرتفعة والأراضي الرطبة | 17.05 | -٣٣٩.٥٩ | -835.5 | 156.3 | ٢٥.٦ | 14.7 | ٣٦.٤ | 0.55 | -0.03 | 1.1 |
| الغابات الشمالية | ٩ | -270.32 | -539.8 | -0.9 | -1.1 | -2.2 | 0.0 | 0.14 | -0.01 | 0.30 |
| الأراضي الرطبة غير المتجمدة | 1.6 | -69.4 | -124.7 | -14.2 | 20.6 | 14.3 | ٢٦.٩ | 0.07 | -0.03 | 0.17 |
| مستنقعات الجليد الدائم | 0.86 | -0.05 | -0.82 | 0.73 | 0.7 | 0.3 | 1.1 | 0.10 | -0.03 | 0.23 |
| التندرا الجافة | 5.2 | 2.9 | -147.6 | 153.5 | 2.1 | -0.4 | ٤.٥ | 0.23 | 0.04 | 0.42 |
| الأراضي الرطبة التندرا | 0.38 | -2.7 | -22.6 | 17.2 | 3.3 | 2.7 | 3.9 | 0.01 | 0.00 | 0.02 |
| جزء فرعي من ذوبان مفاجئ للأراضي الرطبة
|
0.72 | 19.3 | 12.6 | ٢٦.١ | 19.05 | 12.4 | ٢٥.٧ | غير متوفر | غير متوفر | غير متوفر |
| جزء فرعي من ذوبان مفاجئ على منحدر التلال المرتفعة
|
0.014 | 0.3 | 0.2 | 0.5 | ٤.١ | ٢.٤ | 5.7 | غير متوفر | غير متوفر | غير متوفر |
| المياه الداخلية | 1.4 | 230.6 | 132.4 | ٣٥٩.٨ | 9.4 | ٤.٥ | 13.1 | 0.0019 | 0.0008 | 0.0029 |
| أنهار | 0.12 | 164.4 | 107.3 | ٢٢٢.٥ | 2.3 | 1.6 | 2.9 | 0.0006 | 0.0004 | 0.0008 |
| بحيرات | 1.3 | 66.2 | ٢٥.١ | 137.3 | ٧.١ | 2.9 | 10.2 | 0.0012 | 0.0004 | 0.002 |
| الجزء الفرعي من بحيرات الذوبان المفاجئ في الأراضي المنخفضة
|
0.43 | 11.6 | 8.2 | 15.1 | 7.8 | ٥.٥ | 10 | غير متوفر | غير متوفر | غير متوفر |
| حرائق | 1.1 | 121.0 | 96.7 | 145.3 | 1.8 | 1.4 | 2.1 | 0.12 | 0.10 | 0.15 |
| شمالي | 0.96 | ١١١.٠ | ٨٧.٧ | ١٣٤.٣ | 1.6 | 1.3 | 2.0 | 0.113 | 0.089 | 0.137 |
| التندرا | 0.11 | 9.4 | ٥.٥ | ١٣.٣ | 0.14 | 0.08 | 0.20 | 0.009 | 0.005 | 0.014 |
| انبعاثات جيولوجية | غير متوفر | غير متوفر | غير متوفر | 1.5 | 1.2 | 1.8 | غير متوفر | غير متوفر | غير متوفر | |
| إجمالي توازن غازات الدفيئة | 11.98 | -606.4 | 661.4 | ٣٨.٣ | 21.8 | 53.4 | 0.67 | 0.07 | 1.25 | |
| التدفقات الجانبية | 94 | 79 | 111 | غير متوفر | غير متوفر | غير متوفر | 2.6 | 1.9 | 3.6 | |
| تدفق نهري | 78 | 70 | 87 | 1.0 | 0.9 | 1.1 | ||||
| تآكل السواحل | 15 | 9.2 | ٢٤ | 1.6 | 1.0 | 2.5 | ||||
| الإجمالي
|
١٠٦.٠ | -527.4 | 772.4 | 3.3 | 2.0 | ٤.٨ | ||||
23.3
انبعاثات غازات الدفيئة (GHGs-CO2) خلال موسم النمو (gs)
| منطقة |
|
|
المواقع (#) |
|
|||||||||
|
|
|
||||||||||||
|
|
المواقع (#) | معنى | فترة الثقة 2.5% | فترة الثقة 97.5% | المواقع (#) | معنى | فترة الثقة 2.5% | فترة الثقة 97.5% | معنى | فترة الثقة 2.5% | فترة الثقة 97.5% | ||
| أغطية الأراضي المرتفعة والأراضي الرطبة | 17.05 | 95 | -1,611 | -2148 | -1,074 | ٤٥٨ | 16 | ٨.٦ | ٢٣.٣ | ٤٥ | 0.273 | -0.019 | 0.572 |
| الغابات الشمالية | 9 | ٢٥ | -1,034 | -1,305 | -763 | 26 | -1.1 | -2.3 | 0 | ١٣ | 0.07 | -0.01 | 0.15 |
| الأراضي الرطبة غير المتجمدة
|
1.6 | 10 | -145 | -193 | -96 | 182 | ١٣ | 9.1 | 17 | 11 | 0.03 | -0.02 | 0.09 |
| مستنقعات الجليد الدائم | 0.86 | 2 | -54 | -139 | 31 | 79 | 0.50 | 0.20 | 0.70 | ٥ | 0.05 | -0.01 | 0.11 |
| التندرا الجافة | 5.2 | ٢٥ | -358 | -٤٨٢ | -234 | 62 | 1.4 | -0.3 | 2.9 | 16 | 0.11 | -0.02 | 0.21 |
| الأراضي الرطبة التندرا | 0.38 | ٣٣ | -20 | -29 | -234 | ١٠٩ | 2.1 | 1.7 | ٢٥ | 11 | 0.01 | 0.00 | 0.01 |
3.2. صافي توازن غازات الدفيئة من المياه الداخلية
بالنسبة لانبعاثات الأنهار، كانت البحيرات مصدرًا أضعف لـ
3.3. صافي توازن غازات الدفيئة الناتجة عن الاضطرابات
3.4. إجمالي انبعاثات الغازات الدفيئة، والكربون، وميزانيات النيتروجين
3.5. المصادر الرئيسية للغموض واتجاهات البحث
3.5.1. القيود في عدد الملاحظات
من إجمالي المساحة التي تغطيها الأنهار (Speetjens et al.، 2023). على الرغم من أن الأحواض الأصغر وفيرة للغاية، إلا أن تقديرات تدفقات غازات الدفيئة ليست محددة بشكل جيد لمنطقة التربة المتجمدة. سيسمح تحسين هذا الفهم بدمج تدفقات الأحواض الأصغر في التقديرات الرئيسية لتدفقات المياه الداخلية.
3.5.2. القيود المتعلقة بتصنيف الغطاء الأرضي
3.5.3. فهم محدود لتأثير الاضطرابات على ميزانية غازات الدفيئة
الدورات البيوجيوكيميائية العالمية
شكر وتقدير
4. الاستنتاجات
بيان توفر البيانات
References
Biskaborn, B. K., Smith, S. L., Noetzli, J., Matthes, H., Vieira, G., Streletskiy, D. A., et al. (2019). Permafrost is warming at a global scale. Nature Communications, 10(1), 1-11. https://doi.org/10.1038/s41467-018-08240-4
Bouskill, N. J., Mekonnen, Z., Zhu, Q., Grant, R., & Riley, W. J. (2022). Microbial contribution to post-fire tundra ecosystem recovery over the 21st century. Communications Earth & Environment, 3(1), 26. https://doi.org/10.1038/s43247-022-00356-2
Burke, E. J., Ekici, A., Huang, Y., Chadburn, S. E., Huntingford, C., Ciais, P., et al. (2017). Quantifying uncertainties of permafrost carbonclimate feedbacks. Biogeosciences, 14(12), 3051-3066. https://doi.org/10.5194/bg-14-3051-2017
Butterbach-Bahl, K., & Dannenmann, M. (2011). Denitrification and associated soil
Chadburn, S., Burke, E., Cox, P., Friedlingstein, P., Hugelius, G., & Westermann, S. (2017). An observation-based constraint on permafrost loss as a function of global warming. Nature Climate Change, 7(5), 340-344. https://doi.org/10.1038/nclimate3262
Chen, Y., Liu, F., Kang, L., Zhang, D., Kou, D., Mao, C., et al. (2021). Large-scale evidence for microbial response and associated carbon release after permafrost thaw. Global Change Biology, 27(14), 3218-3229. https://doi.org/10.1111/gcb. 15487
Ciais, P., Bastos, A., Chevallier, F., Lauerwald, R., Poulter, B., Canadell, P., et al. (2022). Definitions and methods to estimate regional land carbon fluxes for the second phase of the REgional Carbon Cycle Assessment and Processes Project (RECCAP-2). Geoscientific Model Development, 15(3), 1289-1316. https://doi.org/10.5194/gmd-15-1289-2022
Cole, J. J., Prairie, Y. T., Caraco, N. F., McDowell, W. H., Tranvik, L. J., Striegl, R. G., et al. (2007). Plumbing the global carbon cycle: Integrating inland waters into the terrestrial carbon budget. Ecosystems, 10(1), 172-185. https://doi.org/10.1007/s10021-006-9013-8
Denfeld, B. A., Baulch, H. M., del Giorgio, P. A., Hampton, S. E., & Karlsson, J. (2018). A synthesis of carbon dioxide and methane dynamics during the ice-covered period of northern lakes. Limnology and Oceanography Letters, 3(3), 117-131. https://doi.org/10.1002/lol2.10079
D’Imperio, L., Li, B. B., Tiedje, J. M., Oh, Y., Christiansen, J. R., Kepfer-Rojas, S., et al. (2023). Spatial controls of methane uptake in upland soils across climatic and geological regions in Greenland. Communications Earth & Environment, 4.1(1), 461. https://doi.org/10.1038/s43247-023-01143-3
D’Imperio, L., Nielsen, C. S., Westergaard-Nielsen, A., Michelsen, A., & Elberling, B. (2017). Methane oxidation in contrasting soil types: Responses to experimental warming with implication for landscape-integrated CH4 budget. Global Change Biology, 23(2), 966-976. https:// doi.org/10.1111/gcb. 13400
Genet, H., McGuire, A. D., Barrett, K., Breen, A., Euskirchen, E. S., Johnstone, J. F., et al. (2013). Modeling the effects of fire severity and climate warming on active layer thickness and soil carbon storage of black spruce forests across the landscape in interior Alaska. Environmental Research Letters, 8(4), 045016. https://doi.org/10.1088/1748-9326/8/4/045016
Gibson, C. M., Chasmer, L. E., Thompson, D. K., Quinton, W. L., Flannigan, M. D., & Olefeldt, D. (2018). Wildfire as a major driver of recent permafrost thaw in boreal peatlands. Nature Communications, 9(1), 3041. https://doi.org/10.1038/s41467-018-05457-1
Gil, J., Marushchak, M. E., Rütting, T., Baggs, E. M., Pérez, T., Novakovskiy, A., et al. (2022). Sources of nitrous oxide and the fate of mineral nitrogen in subarctic permafrost peat soils. Biogeosciences, 19(10), 2683-2698.
Grosse, G., Harden, J., Turetsky, M., McGuire, A. D., Camill, P., Tarnocai, C., et al. (2011). Vulnerability of high-latitude soil organic carbon in North America to disturbance. Journal of Geophysical Research, 116(G4), G00K06. https://doi.org/10.1029/2010jg001507
Hermesdorf, L., Elberling, B., D’Imperio, L., Xu, W., Lambæk, A., & Ambus, P. L. (2022). Effects of fire on CO2, CH4 and N2O exchange in a well-drained Arctic heath ecosystem. Global Change Biology.
Holgerson, M. A., & Raymond, P. A. (2016). Large contribution to inland water
Holloway, J. E., Lewkowicz, A. G., Douglas, T. A., Li, X., Turetsky, M. R., Baltzer, J. L., & Jin, H. (2020). Impact of wildfire on permafrost landscapes: A review of recent advances and future prospects. Permafrost and Periglacial Processes, 31(3), 371-382. https://doi.org/10.1002/ ppp. 2048
Hugelius, G., Ramage, J. L., Burke, E. J., Chatterjee, A., Smallman, T. L., Aalto, T., et al. (2023). Two decades of permafrost region CO2, CH4, and N2O budgets suggest a small net greenhouse gas source to the atmosphere. ESS Open Archive. https://doi.org/10.22541/essoar.169444320. 01914726/v1
Hugelius, G., Strauss, J., Zubrzycki, S., Harden, J. W., Schuur, E. A., Ping, C. L., et al. (2014). Estimated stocks of circumpolar permafrost carbon with quantified uncertainty ranges and identified data gaps. Biogeosciences, 11(23), 6573-6593. https://doi.org/10.5194/bg-11-6573-2014
Humborg, C., Mörth, C. M., Sundbom, M., Borg, H., Blenckner, T., Giesler, R., & Ittekkot, V. (2010). CO2 supersaturation along the aquatic conduit in Swedish watersheds as constrained by terrestrial respiration, aquatic respiration and weathering. Global Change Biology, 16(7), 1966-1978. https://doi.org/10.1111/j.1365-2486.2009.02092.x
Jafarov, E. E., Romanovsky, V. E., Genet, H., McGuire, A. D., & Marchenko, S. S. (2013). The effects of fire on the thermal stability of permafrost in lowland and upland black spruce forests of interior Alaska in a changing climate. Environmental Research Letters, 8(3), 035030. https://doi. org/10.1088/1748-9326/8/3/035030
Juncher Jørgensen, C., Lund Johansen, K. M., Westergaard-Nielsen, A., & Elberling, B. (2015). Net regional methane sink in High Arctic soils of northeast Greenland. Nature Geoscience, 8(1), 20-23. https://doi.org/10.1038/ngeo2305
Karlsson, J., Giesler, R., Persson, J., & Lundin, E. (2013). High emission of carbon dioxide and methane during ice thaw in high latitude lakes. Geophysical Research Letters, 40(6), 1123-1127. https://doi.org/10.1002/grl.50152
Kim, Y., & Tanaka, N. (2003). Effect of forest fire on the fluxes of CO2, CH4, and N2O in boreal forest soils, interior Alaska. Journal of Geophysical Research, 108(D1), 8154. https://doi.org/10.1029/2001JD000663
Kortelainen, P., Larmola, T., Rantakari, M., Juutinen, S., Alm, J., & Martikainen, P. J. (2020). Lakes as nitrous oxide sources in the boreal landscape. Global Change Biology, 26(3), 1432-1445. https://doi.org/10.1111/gcb. 14928
Kortelainen, P., Rantakari, M., Huttunen, J. T., Mattsson, T., Alm, J., Juutinen, S., et al. (2006). Sediment respiration and lake trophic state are important predictors of large
Köster, K., Köster, E., Berninger, F., Heinonsalo, J., & Pumpanen, J. (2018). Contrasting effects of reindeer grazing on CO2, CH4, and N2O fluxes originating from the northern boreal forest floor. Land Degradation & Development, 29(2), 374-381. https://doi.org/10.1002/ldr. 2868
Koven, C. D., Schuur, E. A. G., Schädel, C., Bohn, T. J., Burke, E. J., Chen, G., et al. (2015). A simplified, data-constrained approach to estimate the permafrost carbon-climate feedback. Philosophical Transactions of the Royal Society A: Mathematical, Physical & Engineering Sciences, 373(2054), 20140423. https://doi.org/10.1098/rsta. 2014.0423
Kuhn, M. A., Thompson, L. M., Winder, J. C., Braga, L. P., Tanentzap, A. J., Bastviken, D., & Olefeldt, D. (2021c). Opposing effects of climate and permafrost thaw on CH4 and CO2 emissions from northern lakes. AGU Advances, 2(4), e2021AV000515. https://doi.org/10.1029/ 2021av000515
Kuhn, M. A., Varner, R. K., Bastviken, D., Crill, P., MacIntyre, S., Turetsky, M., et al. (2021a). BAWLD-CH4: A comprehensive dataset of methane fluxes from boreal and arctic ecosystems. Earth System Science Data Discussions, 13(11), 1-56. https://doi.org/10.5194/essd-13-5151-2021
Lacroix, F., Zaehle, S., Caldararu, S., Schaller, J., Stimmler, P., Holl, D., et al. (2022). Mismatch of N release from the permafrost and vegetative uptake opens pathways of increasing nitrous oxide emissions in the high Arctic. Global Change Biology, 28(20), 5973-5990. https://doi.org/10. 1111/gcb. 16345
Lantuit, H., Overduin, P. P., Couture, N., Wetterich, S., Aré, F., Atkinson, D., et al. (2012). The Arctic Coastal Dynamics database: A new classification scheme and statistics on Arctic permafrost coastlines. Estuaries and Coasts, 35(2), 383-400. https://doi.org/10.1007/s12237-010-9362-6
Lauerwald, R., Regnier, P., Figueiredo, V., Enrich-Prast, A., Bastviken, D., Lehner, B., et al. (2019). Natural lakes are a minor global source of N2O to the atmosphere. Global Biogeochemical Cycles, 33(12), 1564-1581. https://doi.org/10.1029/2019GB006261
Lee, J., Oh, Y., Lee, S. T., Seo, Y. O., Yun, J., Yang, Y., et al. (2023). Soil organic carbon is a key determinant of
Li, G., Zhang, M., Pei, W., Melnikov, A., Khristoforov, I., Li, R., & Yu, F. (2022). Changes in permafrost extent and active layer thickness in the Northern Hemisphere from 1969 to 2018. Science of the Total Environment, 804, 150182. https://doi.org/10.1016/j.scitotenv.2021.150182
Liu, S. (2021). Monthly pCO2, gas transfer velocity and CO2 efflux rate in global streams and rivers (the GRADES river networks) [Dataset]. Dryad. https://doi.org/10.5061/dryad.d7wm37pz9
Liu, S., Kuhn, C., Amatulli, G., Aho, K., Butman, D. E., Allen, G. H., et al. (2022). The importance of hydrology in routing terrestrial carbon to the atmosphere via global streams and rivers. Proceedings of the National Academy of Sciences, 119(11), e2106322119. https://doi.org/10.1073/ pnas. 2106322119
Liu, Z., Kimball, J. S., Ballantyne, A. P., Parazoo, N. C., Wang, W. J., Bastos, A., et al. (2022). Respiratory loss during late-growing season determines the net carbon dioxide sink in northern permafrost regions. Nature Communications, 13(1), 1-13. https://doi.org/10.1038/s41467-022-33293-x
López-Blanco, E., Langen, P. L., Williams, M., Christensen, J. H., Boberg, F., Langley, K., & Christensen, T. R. (2022). The future of tundra carbon storage in Greenland – Sensitivity to climate and plant trait changes. Science of the Total Environment, 157385. https://doi.org/10.1016/ j.scitotenv. 2022
Mack, M. C., Walker, X. J., Johnstone, J. F., Alexander, H. D., Melvin, A. M., Jean, M., & Miller, S. N. (2021). Carbon loss from boreal forest wildfires offset by increased dominance of deciduous trees. Science, 372(6539), 280-283. https://doi.org/10.1126/science.abf3903
Marushchak, M. E., Kerttula, J., Diáková, K., Faguet, A., Gil, J., Grosse, G., et al. (2021). Thawing Yedoma permafrost is a neglected nitrous oxide source. Nature Communications, 12(1), 7107. https://doi.org/10.1038/s41467-021-27386-2
Marushchak, M. E., Pitkämäki, A., Koponen, H., Biasi, C., Seppälä, M., & Martikainen, P. J. (2011). Hot spots for nitrous oxide emissions found in different types of permafrost peatlands. Global Change Biology, 17(8), 2601-2614. https://doi.org/10.1111/j.1365-2486.2011.02442.x
Matson, A., Pennock, D., & Bedard-Haughn, A. (2009). Methane and nitrous oxide emissions from mature forest stands in the boreal forest, Saskatchewan, Canada. Forest Ecology and Management, 258(7), 1073-1083. https://doi.org/10.1016/j.foreco.2009.05.034
Matthews, E., Johnson, M. S., Genovese, V., Du, J., & Bastviken, D. (2020). Methane emission from high latitude lakes: Methane-centric lake classification and satellite-driven annual cycle of emissions. Scientific Reports, 10(1), 1-9. https://doi.org/10.1038/s41598-020-68246-1
McGuire, A. D., Christensen, T. R., Hayes, D., Heroult, A., Euskirchen, E., Kimball, J. S., et al. (2012). An assessment of the carbon balance of Arctic tundra: Comparisons among observations, process models, and atmospheric inversions. Biogeosciences, 9(8), 3185-3204. https://doi. org/10.5194/bg-9-3185-2012
McGuire, A. D., Lawrence, D. M., Koven, C., Clein, J. S., Burke, E., Chen, G., et al. (2018). Dependence of the evolution of carbon dynamics in the northern permafrost region on the trajectory of climate change. Proceedings of the National Academy of Sciences of the United States of America, 115(15), 3882-3887. https://doi.org/10.1073/pnas. 1719903115
Mishra, U., Hugelius, G., Shelef, E., Yang, Y., Strauss, J., Lupachev, A., et al. (2021). Spatial heterogeneity and environmental predictors of permafrost region soil organic carbon stocks. Science Advances, 7(9), eaaz5236. https://doi.org/10.1126/sciadv.aaz5236
Morishita, T., Hatano, R., & Desyatkin, R. V. (2007). N2O flux in Alas ecosystems formed by forest disturbance near Yakutsk, Eastern Siberia, Russia. Eurasian Journal of Forest Research, 10(1), 79-84.
Mörner, N.-A., & Etiope, G. (2002). Carbon degassing from the lithosphere, Global Planet. Change, 33(1-2), 185-203. https://doi.org/10.1016/ s0921-8181(02)00070-x
Muster, S., Riley, W. J., Roth, K., Langer, M., Cresto Aleina, F., Koven, C. D., et al. (2019). Size distributions of Arctic waterbodies reveal consistent relations in their statistical moments in space and time. Frontiers in Earth Science, 7, 5. https://doi.org/10.3389/feart.2019.00005
Natali, S. M., Watts, J. D., Rogers, B. M., Potter, S., Ludwig, S. M., Selbmann, A. K., et al. (2019). Large loss of CO2 in winter observed across the northern permafrost region. Nature Climate Change, 9(11), 852-857. https://doi.org/10.1038/s41558-019-0592-8
Obu, J., Westermann, S., Barboux, C., Bartsch, A., Delaloye, R., Grosse, G., et al. (2021). ESA permafrost climate change initiative (Permafrost_cci): Permafrost extent for the Northern Hemisphere, v3.0. NERC EDS Centre for Environmental Data Analysis. https://doi.org/10.5285/ 6e2091cb0c8b4106921b63cd5357c97c
Oh, Y., Zhuang, Q., Liu, L., Welp, L. R., Lau, M. C. Y., Onstott, T. C., et al. (2020). Reduced net methane emissions due to microbial methane oxidation in a warmer Arctic. Nature Climate Change, 10.4(4), 317-321. https://doi.org/10.1038/s41558-020-0734-z
Olefeldt, D., Hovemyr, M., Kuhn, M. A., Bastviken, D., Bohn, T. J., Connolly, J., et al. (2021). The boreal-Arctic wetland and lake dataset (BAWLD). Earth System Science Data, 13(11), 5127-5149. https://doi.org/10.5194/essd-13-5127-2021
Pallandt, M. M., Kumar, J., Mauritz, M., Schuur, E. A., Virkkala, A. M., Celis, G., et al. (2022). Representativeness assessment of the pan-Arctic eddy covariance site network and optimized future enhancements. Biogeosciences, 19(3), 559-583. https://doi.org/10.5194/bg-19-559-2022
Palmtag, J., Obu, J., Kuhry, P., Richter, A., Siewert, M. B., Weiss, N., et al. (2022). A high-spatial resolution soil carbon and nitrogen dataset for the northern permafrost region, based on circumpolar land cover upscaling. Earth System Science Data Discussions, 14(9), 1-28. https://doi. org/10.5194/essd-14-4095-2022
Pelletier, L., Strachan, I. B., Garneau, M., & Roulet, N. T. (2014). Carbon release from boreal peatland open water pools: Implication for the contemporary C exchange. Journal of Geophysical Research: Biogeosciences, 119(3), 207-222. https://doi.org/10.1002/2013jg002423
Potter, S., Cooperdock, S., Veraverbeke, S., Walker, X., Mack, M. C., Goetz, S. J., et al. (2022). Burned area and carbon emissions across northwestern boreal north America from 2001-2019. EGUsphere. https://doi.org/10.5194/egusphere-2022-364
Randerson, J. T., Liu, H., Flanner, M. G., Chambers, S. D., Jin, Y., Hess, P. G., et al. (2006). The impact of boreal forest fire on climate warming. Science, 314(5802), 1130-1132. https://doi.org/10.1126/science. 1132075
Rantanen, M., Karpechko, A. Y., Lipponen, A., Nordling, K., Hyvärinen, O., Ruosteenoja, K., et al. (2022). The Arctic has warmed nearly four times faster than the globe since 1979. Communications Earth & Environment, 3(1), 168. https://doi.org/10.1038/s43247-022-00498-3
Rasilo, T., Prairie, Y. T., & Del Giorgio, P. A. (2015). Large-scale patterns in summer diffusive CH 4 fluxes across boreal lakes, and contribution to diffusive C emissions. Global Change Biology, 21(3), 1124-1139. https://doi.org/10.1111/gcb. 12741
Repo, M. E., Susiluoto, S., Lind, S. E., Jokinen, S., Elsakov, V., Biasi, C., et al. (2009). Large
Rocher-Ros, G., Giesler, R., Lundin, E., Salimi, S., Jonsson, A., & Karlsson, J. (2017). Large lakes dominate CO2 evasion from lakes in an Arctic catchment. Geophysical Research Letters, 44(24), 12-254. https://doi.org/10.1002/2017g1076146
Runge, A., Nitze, I., & Grosse, G. (2022). Remote sensing annual dynamics of rapid permafrost thaw disturbances with LandTrendr. Remote Sensing of Environment, 268, 112752. https://doi.org/10.1016/j.rse.2021.112752
Saunois, M., Stavert, A. R., Poulter, B., Bousquet, P., Canadell, J. G., Jackson, R. B., et al. (2019). The global methane budget 2000-2017. Earth System Science Data Discussions, 1-136.
Schiller, C. L., & Hastie, D. R. (1996). Nitrous oxide and methane fluxes from perturbed and unperturbed boreal forest sites in northern Ontario. Journal of Geophysical Research, 101(D17), 22767-22774. https://doi.org/10.1029/96JD01620
Schulze, C., Sonnentag, O., Voigt, C., Thompson, L., van Delden, L., Heffernan, L., et al. (2023). Nitrous oxide fluxes in permafrost peatlands remain negligible after wildfire and thermokarst disturbance. Journal of Geophysical Research: Biogeosciences, 128(4), e2022JG007322. https://doi.org/10.1029/2022JG007322
Schuur, E. A. G., Abbott, B., Commane, R., Ernakovich, J., Euskirchen, E., Hugelius, G., et al. (2022). Permafrost and climate change: Carbon cycle feedbacks from a warming Arctic. Annual Review of Environment and Resources, 47, 28.1-28.29. https://doi.org/10.1146/annurev-environ-012220-011847
Schuur, E. A. G., Abbott, B. W., Bowden, W. B., Brovkin, V., Camill, P., Canadell, J. P., et al. (2011). High risk of permafrost thaw. Nature, 480(7375), 32-33. https://doi.org/10.1038/480032a
Schuur, E. A. G., Bockheim, J., Canadell, J., Euskirchen, E., Field, C. B., Goryachkin, S. V., et al. (2008). Vulnerability of permafrost carbon to climate change: Implications for the global carbon cycle. BioScience, 58(8), 701-714. https://doi.org/10.1641/b580807
Schuur, E. A. G., & Mack, M. C. (2018). Ecological response to permafrost thaw and consequences for local and global ecosystem services. Annual Review of Ecology, Evolution and Systematics, 49(1), 279-301. https://doi.org/10.1146/annurev-ecolsys-121415-032349
Schuur, E. A. G., McGuire, A. D., Grosse, G., Harden, J. W., Hayes, D. J., Hugelius, G., et al. (2015). Climate change and the permafrost carbon feedback. Nature, 520(7546), 171-179. https://doi.org/10.1038/nature14338
Schuur, E. A. G., Vogel, J. G., Crummer, K. G., Lee, H., Sickman, J. O., & Osterkamp, T. E. (2009). The effect of permafrost thaw on old carbon release and net carbon exchange from tundra. Nature, 459(7246), 556-559. https://doi.org/10.1038/nature08031
Sepulveda-Jauregui, A., Walter Anthony, K. M., Martinez-Cruz, K., Greene, S., & Thalasso, F. (2015). Methane and carbon dioxide emissions from 40 lakes along a north-south latitudinal transect in Alaska. Biogeosciences, 12(11), 3197-3223. https://doi.org/10.5194/bg-12-3197-2015
Serikova, S., Pokrovsky, O. S., Ala-Aho, P., Kazantsev, V., Kirpotin, S. N., Kopysov, S. G., et al. (2018). High riverine CO2 emissions at the permafrost boundary of Western Siberia. Nature Geoscience, 11, 825-829. https://doi.org/10.1038/s41561-018-0218-1
Simpson, I. J., Edwards, G. C., Thurtell, G. W., den Hartog, G., Neumann, H. H., & Staebler, R. M. (1997). Micrometeorological measurements of methane and nitrous oxide exchange above a boreal aspen forest. Journal of Geophysical Research, 102(D24), 29331-29341. https://doi.org/ 10.1029/97JD03181
Stanley, E. H., Casson, N. J., Christel, S. T., Crawford, J. T., Loken, L. C., & Oliver, S. K. (2016). The ecology of methane in streams and rivers: Patterns, controls, and global significance. Ecological Monographs, 86(2), 146-171. https://doi.org/10.1890/15-1027
Tarnocai, C., Canadell, J. G., Schuur, E. A., Kuhry, P., Mazhitova, G., & Zimov, S. (2009). Soil organic carbon pools in the northern circumpolar permafrost region. Global Biogeochemical Cycles, 23(2). https://doi.org/10.1029/2008gb003327
Terhaar, J., Lauerwald, R., Regnier, P., Gruber, N., & Bopp, L. (2021). Around one third of current Arctic Ocean primary production sustained by rivers and coastal erosion. Nature Communications, 12(1), 169. https://doi.org/10.1038/s41467-020-20470-z
Thornton, B. F., Wik, M., & Crill, P. M. (2016). Double-counting challenges the accuracy of high-latitude methane inventories. Geophysical Research Letters, 43(24), 12569-12577. https://doi.org/10.1002/2016GL071772
Treat, C. C., Bloom, A. A., & Marushchak, M. E. (2018). Nongrowing season methane emissions – A significant component of annual emissions across northern ecosystems. Global Change Biology, 24(8), 3331-3343. https://doi.org/10.1111/gcb. 14137
Turetsky, M. R., Abbott, B. W., Jones, M. C., Anthony, K. W., Olefeldt, D., Schuur, E. A. G., et al. (2020). Carbon release through abrupt permafrost thaw. Nature Geoscience, 13(2), 138-143. https://doi.org/10.1038/s41561-019-0526-0
Ueyama, M., Iwata, H., Nagano, H., Tahara, N., Iwama, C., & Harazono, Y. (2019). Carbon dioxide balance in early-successional forests after forest fires in interior Alaska. Agricultural and Forest Meteorology, 275, 196-207. https://doi.org/10.1016/j.agrformet.2019.05.020
Ullah, S., Frasier, R., Pelletier, L., & Moore, T. R. (2009). Greenhouse gas fluxes from boreal forest soils during the snow-free period in Quebec, Canada. Canadian Journal of Forest Research, 39(3), 666-680. https://doi.org/10.1139/x08-209
van der Werf, G. R., Randerson, J. T., Giglio, L., van Leeuwen, T. T., Chen, Y., Rogers, B. M., et al. (2017). Global fire emissions estimates during 1997-2016. Earth System Science Data, 9(2), 697-720. https://doi.org/10.5194/essd-9-697-2017
van Wees, D., van der Werf, G. R., Randerson, J. T., Rogers, B. M., Chen, Y., Veraverbeke, S., et al. (2022). Global biomass burning fuel consumption and emissions at 500 m spatial resolution based on the Global Fire Emissions Database (GFED). Geoscientific Model Development, 15(22), 8411-8437. https://doi.org/10.5194/gmd-15-8411-2022
Veraverbeke, S., Delcourt, C. J., Kukavskaya, E., Mack, M., Walker, X., Hessilt, T., et al. (2021). Direct and longer-term carbon emissions from arctic-boreal fires: A short review of recent advances. Current Opinion in Environmental Science & Health, 23, 100277. https://doi.org/10. 1016/j.coesh.2021.100277
Virkkala, A.-M., Natali, S. M., Rogers, B. M., Watts, J. D., Savage, K., Connon, S. J., et al. (2022). The ABCflux database: Arctic-boreal CO2 flux observations and ancillary information aggregated to monthly time steps across terrestrial ecosystems. Earth System Science Data, 14(1), 179-208. https://doi.org/10.5194/essd-14-179-2022
Virkkala, A.-M., Virtanen, T., Lehtonen, A., Rinne, J., & Luoto, M. (2018). The current state of CO2 flux chamber studies in the Arctic tundra: A review. Progress in Physical Geography: Earth and Environment, 42(2), 162-184. https://doi.org/10.1177/0309133317745784
Voigt, C., Marushchak, M. E., Abbott, B. W., Biasi, C., Elberling, B., Siciliano, S. D., et al. (2020a). Nitrous oxide emissions from permafrostaffected soils. Nature Reviews Earth & Environment, 1(8), 420-434. https://doi.org/10.1038/s43017-020-0063-9
Voigt, C., Marushchak, M. E., Lamprecht, R. E., Jackowicz-Korczyński, M., Lindgren, A., Mastepanov, M., et al. (2017). Increased nitrous oxide emissions from Arctic peatlands after permafrost thaw. Proceedings of the National Academy of Sciences, 114(24), 6238-6243. https://doi.org/ 10.1073/pnas. 1702902114
Voigt, C., Virkkala, A. M., Hould Gosselin, G., Bennett, K. A., Black, T. A., Detto, M., et al. (2023). Arctic soil methane sink increases with drier conditions and higher ecosystem respiration. Nature Climate Change, 13.10(10), 1095-1104. https://doi.org/10.1038/s41558-023-01785-3
Walker, X. J., Baltzer, J. L., Cumming, S. G., Day, N. J., Ebert, C., Goetz, S., et al. (2019). Increasing wildfires threaten historic carbon sink of boreal forest soils. Nature, 572(7770), 520-523. https://doi.org/10.1038/s41586-019-1474-y
Walter Anthony, K. M., Anthony, P., Grosse, G., & Chanton, J. (2012). Geologic methane seeps along boundaries of Arctic permafrost thaw and melting glaciers. Nature Geoscience, 5(6), 419-426. https://doi.org/10.1038/ngeo1480
Watts, J. D., Farina, M., Kimball, J. S., Schiferl, L. D., Liu, Z., Arndt, K. A., et al. (2023). Carbon uptake in Eurasian boreal forests dominates the high-latitude net ecosystem carbon budget. Global Change Biology, 29(7), 1870-1889. https://doi.org/10.1111/gcb. 16553
Whalen, S. C., Reeburgh, W. S., & Barber, V. A. (1992). Oxidation of methane in boreal forest soils – A comparison of 7 measures. Biogeochemistry, 16(3), 181-211. https://doi.org/10.1007/bf00002818
Wik, M., Varner, R. K., Anthony, K. W., MacIntyre, S., & Bastviken, D. (2016). Climate-sensitive northern lakes and ponds are critical components of methane release. Nature Geoscience, 9(2), 99-105. https://doi.org/10.1038/ngeo2578
Wilkerson, J., Dobosy, R., Sayres, D. S., Healy, C., Dumas, E., Baker, B., & Anderson, J. G. (2019). Permafrost nitrous oxide emissions observed on a landscape scale using the airborne eddy-covariance method. Atmospheric Chemistry and Physics, 19(7), 4257-4268. https://doi.org/10. 5194/acp-19-4257-2019
Yang, G., Peng, Y., Marushchak, M. E., Chen, Y., Wang, G., Li, F., et al. (2018). Magnitude and pathways of increased nitrous oxide emissions from uplands following permafrost thaw. Environmental Science & Technology, 52(16), 9162-9169. https://doi.org/10.1021/acs.est.8b02271
Yuan, Y., Zhuang, Q., Zhao, B., & Shurpali, N. (2023). Nitrous oxide emissions from pan-Arctic terrestrial ecosystems: A process-based biogeochemistry model analysis from 1969 to 2019. EGUsphere. [preprint]. https://doi.org/10.5194/egusphere-2023-1047
DOI: https://doi.org/10.1029/2023gb007953
Publication Date: 2024-04-01
RESEARCH ARTICLE
10.1029/2023GB007953
Special Section:
RECCAP2
Key Points:
- The region emitted
, and to the atmosphere between 2000 and 2020 - Based on the above, terrestrial ecosystems remained a
sink, but emissions from fires and inland waters largely offset the sink in vegetated ecosystems - When also including lateral fluxes, the complete C and N budgets of the permafrost region result in net sources of 144 (-506, 826; including
and and
Supporting Information:
Correspondence to:
justine.ramage@natgeo.su.se
Citation:
Accepted 29 FEB 2024
Author Contributions:
© 2024. The Authors.
The Net GHG Balance and Budget of the Permafrost Region (2000-2020) From Ecosystem Flux Upscaling
Abstract
The northern permafrost region has been projected to shift from a net sink to a net source of carbon under global warming. However, estimates of the contemporary net greenhouse gas (GHG) balance and budgets of the permafrost region remain highly uncertain. Here, we construct the first comprehensive bottom-up budgets of
Global Biogeochemical Cycles
Formal analysis: McKenzie Kuhn, AnnaMaria Virkkala, Carolina Voigt, Maija E. Marushchak, Gustaf Hugelius Funding acquisition: McKenzie Kuhn, Anna-Maria Virkkala, Carolina Voigt, Maija E. Marushchak, Christina Biasi, David Olefeldt, Brendan M. Rogers, Gustaf Hugelius Investigation: McKenzie Kuhn, AnnaMaria Virkkala, Carolina Voigt, Maija E. Marushchak, Gustaf Hugelius Methodology: McKenzie Kuhn, AnnaMaria Virkkala, Carolina Voigt, Maija E. Marushchak, David Olefeldt, Gustaf Hugelius
Project administration: Gustaf Hugelius Resources: McKenzie Kuhn, Carolina Voigt, Maija E. Marushchak, Christina Biasi, David Olefeldt, Stefano Potter, Brendan M. Rogers, Gustaf Hugelius
Supervision: Gustaf Hugelius Validation: McKenzie Kuhn, AnnaMaria Virkkala, Carolina Voigt, Maija E. Marushchak, Gustaf Hugelius Visualization: McKenzie Kuhn, AnnaMaria Virkkala, Carolina Voigt, Maija E. Marushchak
Writing – original draft: McKenzie Kuhn, Anna-Maria Virkkala, Carolina Voigt, Maija E. Marushchak, David Olefeldt
Writing – review & editing: McKenzie Kuhn, Anna-Maria Virkkala, Carolina Voigt, Maija E. Marushchak, Ana Bastos, Christina Biasi, Josep G. Canadell, Philippe Ciais, Efrèn LópezBlanco, Susan M. Natali, David Olefeldt, Stefano Potter, Benjamin Poulter, Brendan M. Rogers, Edward A. G. Schuur, Claire Treat, Merritt R. Turetsky, Jennifer Watts, Gustaf Hugelius
1. Introduction
2. Materials and Methods
2.1. Study Area
2.2. GHG Budgets From Ecosystem Flux Upscaling
We used existing synthesis databases and upscaled gridded data products published in the past 5 years to estimate annual and growing season mean fluxes per land cover type. All budget numbers are presented as the weight of C
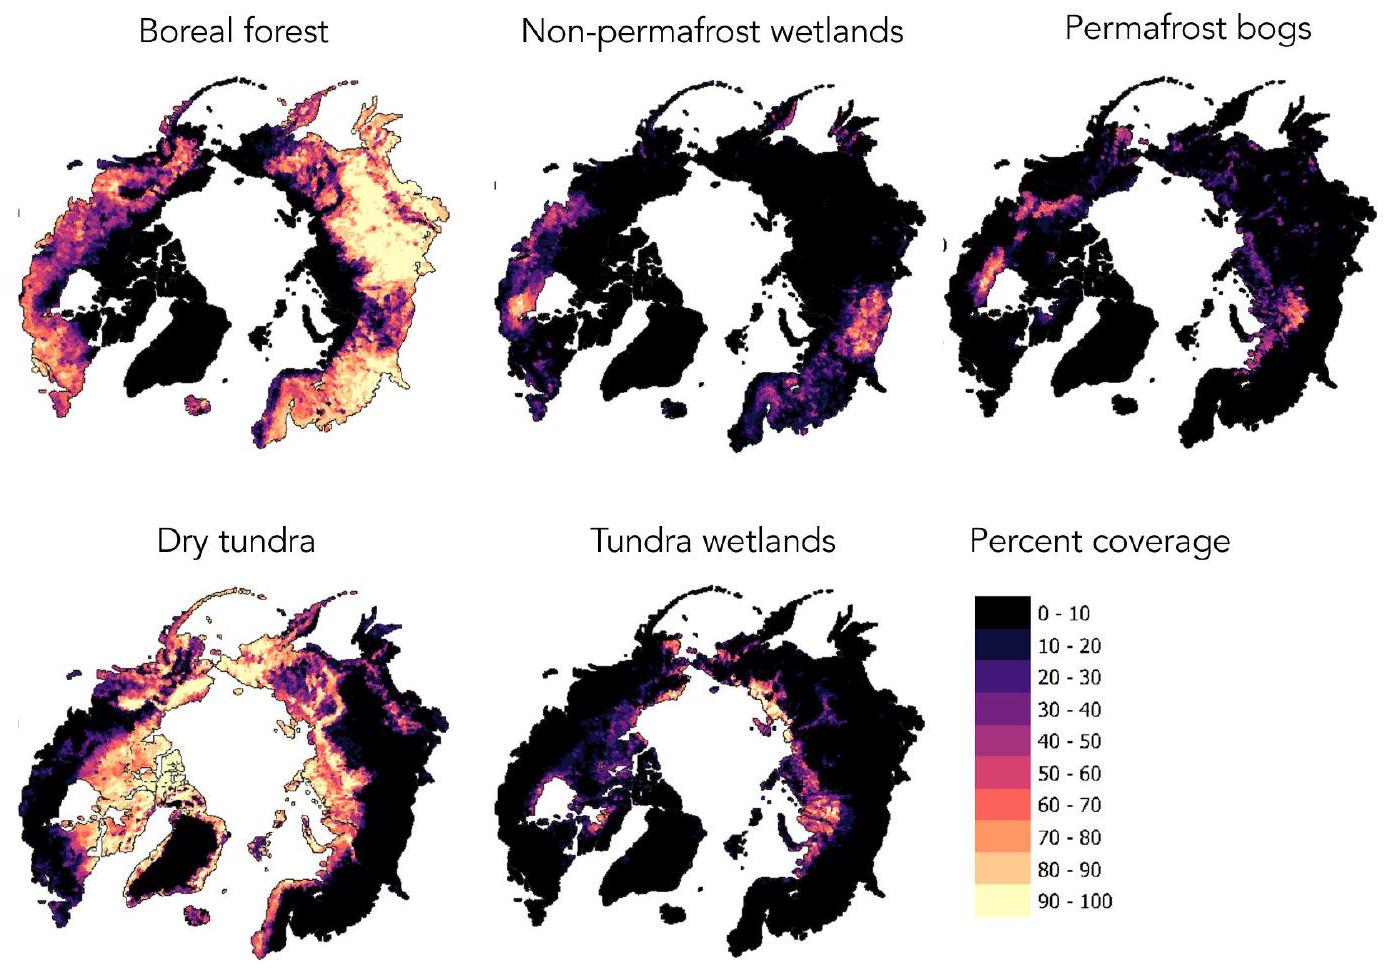
2.3. GHG Fluxes From Terrestrial Land Cover Types
- Non-permafrost Wetlands include permafrost free bogs, fens, and marshes with no near-surface permafrost (see Canadian Wetland Classification system).
- Boreal Forests are forested ecosystems with non-wetland soils. Coniferous trees are dominant, but the class also includes deciduous trees in warmer climates and/or certain landscape positions. Boreal forest ecosystems may have permafrost or be permafrost free.
- Permafrost Bogs are ecosystems with near surface permafrost and thick surface peat layers (
). This includes palsas, peat plateaus, and the elevated portions of high- and low-center polygonal permafrost bogs. They typically have ombrotrophic conditions that cause nutrient-poor conditions. The vegetation is dominated by lichens, Sphagnum mosses, woody shrubs, and sometimes sparse coniferous forest. - Dry Tundra include treeless ecosystems (both lowland arctic and alpine tundra) dominated by graminoid or shrub vegetation. Dry Tundra ecosystems generally have near-surface permafrost. Dry Tundra is differentiated from Permafrost Bogs by their thinner organic soil (
), and from Tundra Wetlands by their drained soils (average water table position below soil surface). - Tundra Wetlands are treeless ecosystems with near surface permafrost and saturated to inundated conditions for large parts of the year. Tundra Wetlands can both be mineral (
peat) or have peat ( peat). They are distinguished from Dry Tundra and Permafrost Bogs by being wetter and having more dynamic hydrology. Tundra Wetlands include areas that can be classified as tundra fen wetlands in the Canadian Wetland Classification System.
2.4. Vertical GHG Fluxes From Inland Waters
2.4.1. Vertical GHG Fluxes From Rivers
2.4.2. Vertical GHG Fluxes From Lakes
2.5. Disturbances-GHG Fluxes From Fires and Abrupt Thaw
contribution to the total GHG budget is discussed. Due to the lack of in situ observations of abrupt thaw impacts on
2.6. Lateral Fluxes and Geological Emissions
3. Results and Discussion
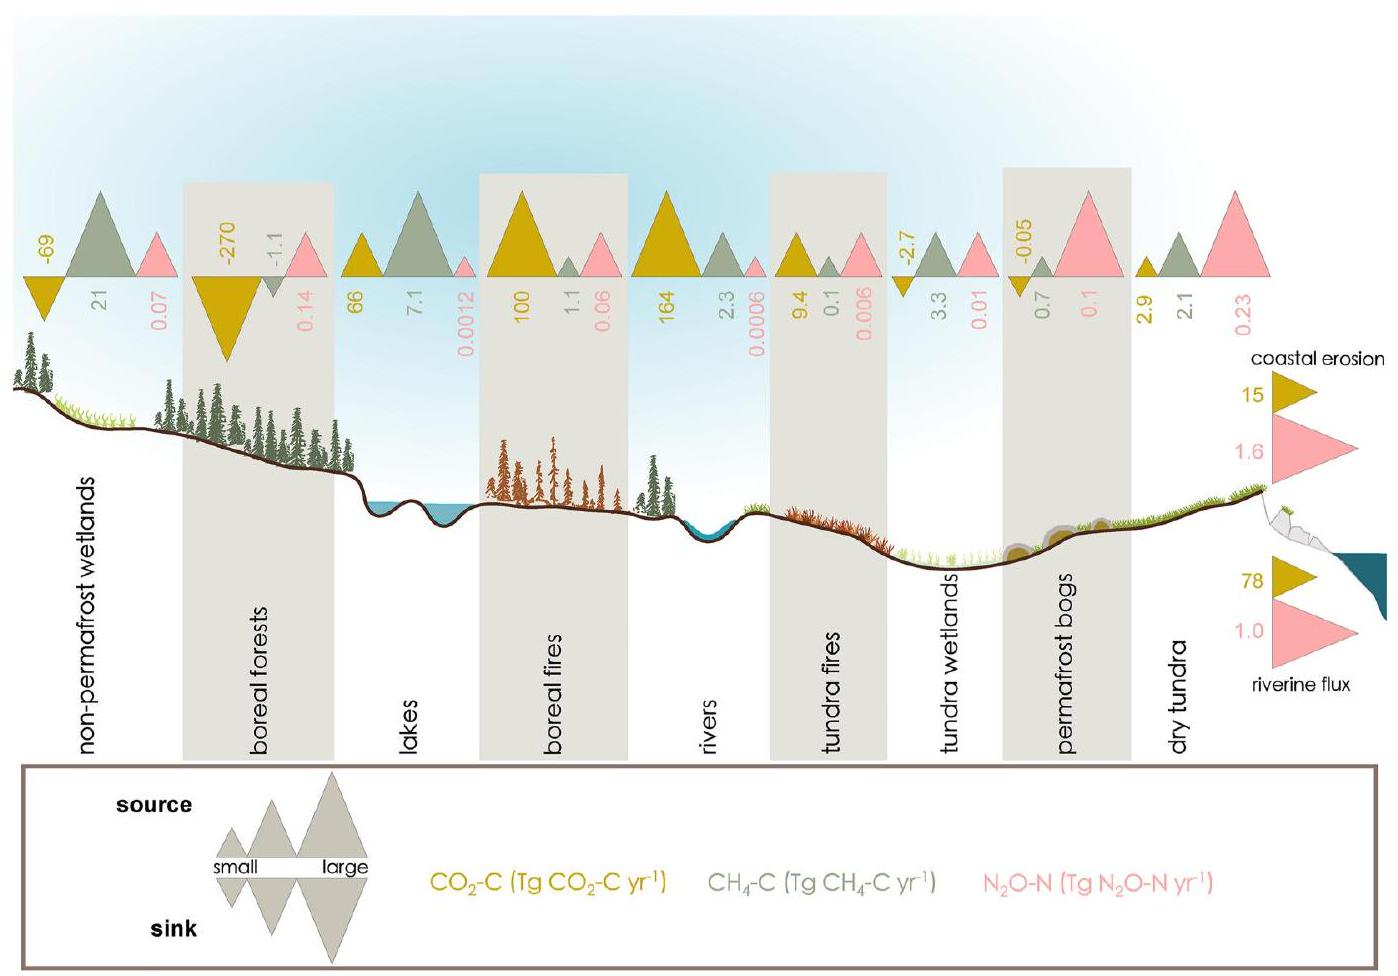
3.1. Net GHG Balance From Terrestrial Land Cover Types
Greenhouse gas (
| Area |
|
|
|
|||||||
|
|
|
|
|
|||||||
| Mean | 2.5% CI | 97.5% CI | Mean | 2.5% CI | 97.5% CI | Mean | 2.5% CI | 97.5% CI | ||
| Upland and wetland land covers | 17.05 | -339.59 | -835.5 | 156.3 | 25.6 | 14.7 | 36.4 | 0.55 | -0.03 | 1.1 |
| Boreal Forests | 9 | -270.32 | -539.8 | -0.9 | -1.1 | -2.2 | 0.0 | 0.14 | -0.01 | 0.30 |
| Non-permafrost Wetlands | 1.6 | -69.4 | -124.7 | -14.2 | 20.6 | 14.3 | 26.9 | 0.07 | -0.03 | 0.17 |
| Permafrost Bogs | 0.86 | -0.05 | -0.82 | 0.73 | 0.7 | 0.3 | 1.1 | 0.10 | -0.03 | 0.23 |
| Dry Tundra | 5.2 | 2.9 | -147.6 | 153.5 | 2.1 | -0.4 | 4.5 | 0.23 | 0.04 | 0.42 |
| Tundra Wetlands | 0.38 | -2.7 | -22.6 | 17.2 | 3.3 | 2.7 | 3.9 | 0.01 | 0.00 | 0.02 |
| Subfraction from wetland abrupt thaw
|
0.72 | 19.3 | 12.6 | 26.1 | 19.05 | 12.4 | 25.7 | NA | NA | NA |
| Subfraction from upland hillslope abrupt thaw
|
0.014 | 0.3 | 0.2 | 0.5 | 4.1 | 2.4 | 5.7 | NA | NA | NA |
| Inland waters | 1.4 | 230.6 | 132.4 | 359.8 | 9.4 | 4.5 | 13.1 | 0.0019 | 0.0008 | 0.0029 |
| Rivers | 0.12 | 164.4 | 107.3 | 222.5 | 2.3 | 1.6 | 2.9 | 0.0006 | 0.0004 | 0.0008 |
| Lakes | 1.3 | 66.2 | 25.1 | 137.3 | 7.1 | 2.9 | 10.2 | 0.0012 | 0.0004 | 0.002 |
| Subfraction from lowland abrupt thaw lakes
|
0.43 | 11.6 | 8.2 | 15.1 | 7.8 | 5.5 | 10 | NA | NA | NA |
| Fires | 1.1 | 121.0 | 96.7 | 145.3 | 1.8 | 1.4 | 2.1 | 0.12 | 0.10 | 0.15 |
| Boreal | 0.96 | 111.0 | 87.7 | 134.3 | 1.6 | 1.3 | 2.0 | 0.113 | 0.089 | 0.137 |
| Tundra | 0.11 | 9.4 | 5.5 | 13.3 | 0.14 | 0.08 | 0.20 | 0.009 | 0.005 | 0.014 |
| Geological emissions | NA | NA | NA | 1.5 | 1.2 | 1.8 | NA | NA | NA | |
| Total GHG balance | 11.98 | -606.4 | 661.4 | 38.3 | 21.8 | 53.4 | 0.67 | 0.07 | 1.25 | |
| Lateral fluxes | 94 | 79 | 111 | NA | NA | NA | 2.6 | 1.9 | 3.6 | |
| Riverine flux | 78 | 70 | 87 | 1.0 | 0.9 | 1.1 | ||||
| Coastal erosion | 15 | 9.2 | 24 | 1.6 | 1.0 | 2.5 | ||||
| Total
|
106.0 | -527.4 | 772.4 | 3.3 | 2.0 | 4.8 | ||||
23.3)
Growing Season (gs) Emissions of Greenhouse Gas (GHGs-CO2,
| Area |
|
|
Sites (#) |
|
|||||||||
|
|
|
||||||||||||
|
|
Sites (#) | Mean | 2.5% CI | 97.5% CI | Sites (#) | Mean | 2.5% CI | 97.5% CI | Mean | 2.5% CI | 97.5% CI | ||
| Upland and wetland land covers | 17.05 | 95 | -1,611 | -2148 | -1,074 | 458 | 16 | 8.6 | 23.3 | 45 | 0.273 | -0.019 | 0.572 |
| Boreal Forests | 9 | 25 | -1,034 | -1,305 | -763 | 26 | -1.1 | -2.3 | 0 | 13 | 0.07 | -0.01 | 0.15 |
| Non-permafrost Wetlands
|
1.6 | 10 | -145 | -193 | -96 | 182 | 13 | 9.1 | 17 | 11 | 0.03 | -0.02 | 0.09 |
| Permafrost Bogs | 0.86 | 2 | -54 | -139 | 31 | 79 | 0.50 | 0.20 | 0.70 | 5 | 0.05 | -0.01 | 0.11 |
| Dry Tundra | 5.2 | 25 | -358 | -482 | -234 | 62 | 1.4 | -0.3 | 2.9 | 16 | 0.11 | -0.02 | 0.21 |
| Tundra Wetlands | 0.38 | 33 | -20 | -29 | -234 | 109 | 2.1 | 1.7 | 25 | 11 | 0.01 | 0.00 | 0.01 |
3.2. Net GHG Balance From Inland Waters
In comparison to riverine emissions, lakes were a weaker source of
3.3. Net GHG Balance From Disturbances
3.4. Total GHGs, C, and N Budgets
3.5. Main Sources of Uncertainty and Research Directions
3.5.1. Limitations in the Number of Observations
of the total area covered by rivers (Speetjens et al., 2023). Although smaller catchments are highly abundant, estimates of GHG fluxes are not well constrained for the permafrost region. Improving this understanding will allow lateral flux integration of these smaller catchments in the main estimates of lateral fluxes from inland waters.
3.5.2. Limitations Related to the Land Cover Classification
3.5.3. Limited Understanding of the Impact of Disturbances on the GHG Budget
Global Biogeochemical Cycles
Acknowledgments
4. Conclusions
Data Availability Statement
References
Biskaborn, B. K., Smith, S. L., Noetzli, J., Matthes, H., Vieira, G., Streletskiy, D. A., et al. (2019). Permafrost is warming at a global scale. Nature Communications, 10(1), 1-11. https://doi.org/10.1038/s41467-018-08240-4
Bouskill, N. J., Mekonnen, Z., Zhu, Q., Grant, R., & Riley, W. J. (2022). Microbial contribution to post-fire tundra ecosystem recovery over the 21st century. Communications Earth & Environment, 3(1), 26. https://doi.org/10.1038/s43247-022-00356-2
Burke, E. J., Ekici, A., Huang, Y., Chadburn, S. E., Huntingford, C., Ciais, P., et al. (2017). Quantifying uncertainties of permafrost carbonclimate feedbacks. Biogeosciences, 14(12), 3051-3066. https://doi.org/10.5194/bg-14-3051-2017
Butterbach-Bahl, K., & Dannenmann, M. (2011). Denitrification and associated soil
Chadburn, S., Burke, E., Cox, P., Friedlingstein, P., Hugelius, G., & Westermann, S. (2017). An observation-based constraint on permafrost loss as a function of global warming. Nature Climate Change, 7(5), 340-344. https://doi.org/10.1038/nclimate3262
Chen, Y., Liu, F., Kang, L., Zhang, D., Kou, D., Mao, C., et al. (2021). Large-scale evidence for microbial response and associated carbon release after permafrost thaw. Global Change Biology, 27(14), 3218-3229. https://doi.org/10.1111/gcb. 15487
Ciais, P., Bastos, A., Chevallier, F., Lauerwald, R., Poulter, B., Canadell, P., et al. (2022). Definitions and methods to estimate regional land carbon fluxes for the second phase of the REgional Carbon Cycle Assessment and Processes Project (RECCAP-2). Geoscientific Model Development, 15(3), 1289-1316. https://doi.org/10.5194/gmd-15-1289-2022
Cole, J. J., Prairie, Y. T., Caraco, N. F., McDowell, W. H., Tranvik, L. J., Striegl, R. G., et al. (2007). Plumbing the global carbon cycle: Integrating inland waters into the terrestrial carbon budget. Ecosystems, 10(1), 172-185. https://doi.org/10.1007/s10021-006-9013-8
Denfeld, B. A., Baulch, H. M., del Giorgio, P. A., Hampton, S. E., & Karlsson, J. (2018). A synthesis of carbon dioxide and methane dynamics during the ice-covered period of northern lakes. Limnology and Oceanography Letters, 3(3), 117-131. https://doi.org/10.1002/lol2.10079
D’Imperio, L., Li, B. B., Tiedje, J. M., Oh, Y., Christiansen, J. R., Kepfer-Rojas, S., et al. (2023). Spatial controls of methane uptake in upland soils across climatic and geological regions in Greenland. Communications Earth & Environment, 4.1(1), 461. https://doi.org/10.1038/s43247-023-01143-3
D’Imperio, L., Nielsen, C. S., Westergaard-Nielsen, A., Michelsen, A., & Elberling, B. (2017). Methane oxidation in contrasting soil types: Responses to experimental warming with implication for landscape-integrated CH4 budget. Global Change Biology, 23(2), 966-976. https:// doi.org/10.1111/gcb. 13400
Genet, H., McGuire, A. D., Barrett, K., Breen, A., Euskirchen, E. S., Johnstone, J. F., et al. (2013). Modeling the effects of fire severity and climate warming on active layer thickness and soil carbon storage of black spruce forests across the landscape in interior Alaska. Environmental Research Letters, 8(4), 045016. https://doi.org/10.1088/1748-9326/8/4/045016
Gibson, C. M., Chasmer, L. E., Thompson, D. K., Quinton, W. L., Flannigan, M. D., & Olefeldt, D. (2018). Wildfire as a major driver of recent permafrost thaw in boreal peatlands. Nature Communications, 9(1), 3041. https://doi.org/10.1038/s41467-018-05457-1
Gil, J., Marushchak, M. E., Rütting, T., Baggs, E. M., Pérez, T., Novakovskiy, A., et al. (2022). Sources of nitrous oxide and the fate of mineral nitrogen in subarctic permafrost peat soils. Biogeosciences, 19(10), 2683-2698.
Grosse, G., Harden, J., Turetsky, M., McGuire, A. D., Camill, P., Tarnocai, C., et al. (2011). Vulnerability of high-latitude soil organic carbon in North America to disturbance. Journal of Geophysical Research, 116(G4), G00K06. https://doi.org/10.1029/2010jg001507
Hermesdorf, L., Elberling, B., D’Imperio, L., Xu, W., Lambæk, A., & Ambus, P. L. (2022). Effects of fire on CO2, CH4 and N2O exchange in a well-drained Arctic heath ecosystem. Global Change Biology.
Holgerson, M. A., & Raymond, P. A. (2016). Large contribution to inland water
Holloway, J. E., Lewkowicz, A. G., Douglas, T. A., Li, X., Turetsky, M. R., Baltzer, J. L., & Jin, H. (2020). Impact of wildfire on permafrost landscapes: A review of recent advances and future prospects. Permafrost and Periglacial Processes, 31(3), 371-382. https://doi.org/10.1002/ ppp. 2048
Hugelius, G., Ramage, J. L., Burke, E. J., Chatterjee, A., Smallman, T. L., Aalto, T., et al. (2023). Two decades of permafrost region CO2, CH4, and N2O budgets suggest a small net greenhouse gas source to the atmosphere. ESS Open Archive. https://doi.org/10.22541/essoar.169444320. 01914726/v1
Hugelius, G., Strauss, J., Zubrzycki, S., Harden, J. W., Schuur, E. A., Ping, C. L., et al. (2014). Estimated stocks of circumpolar permafrost carbon with quantified uncertainty ranges and identified data gaps. Biogeosciences, 11(23), 6573-6593. https://doi.org/10.5194/bg-11-6573-2014
Humborg, C., Mörth, C. M., Sundbom, M., Borg, H., Blenckner, T., Giesler, R., & Ittekkot, V. (2010). CO2 supersaturation along the aquatic conduit in Swedish watersheds as constrained by terrestrial respiration, aquatic respiration and weathering. Global Change Biology, 16(7), 1966-1978. https://doi.org/10.1111/j.1365-2486.2009.02092.x
Jafarov, E. E., Romanovsky, V. E., Genet, H., McGuire, A. D., & Marchenko, S. S. (2013). The effects of fire on the thermal stability of permafrost in lowland and upland black spruce forests of interior Alaska in a changing climate. Environmental Research Letters, 8(3), 035030. https://doi. org/10.1088/1748-9326/8/3/035030
Juncher Jørgensen, C., Lund Johansen, K. M., Westergaard-Nielsen, A., & Elberling, B. (2015). Net regional methane sink in High Arctic soils of northeast Greenland. Nature Geoscience, 8(1), 20-23. https://doi.org/10.1038/ngeo2305
Karlsson, J., Giesler, R., Persson, J., & Lundin, E. (2013). High emission of carbon dioxide and methane during ice thaw in high latitude lakes. Geophysical Research Letters, 40(6), 1123-1127. https://doi.org/10.1002/grl.50152
Kim, Y., & Tanaka, N. (2003). Effect of forest fire on the fluxes of CO2, CH4, and N2O in boreal forest soils, interior Alaska. Journal of Geophysical Research, 108(D1), 8154. https://doi.org/10.1029/2001JD000663
Kortelainen, P., Larmola, T., Rantakari, M., Juutinen, S., Alm, J., & Martikainen, P. J. (2020). Lakes as nitrous oxide sources in the boreal landscape. Global Change Biology, 26(3), 1432-1445. https://doi.org/10.1111/gcb. 14928
Kortelainen, P., Rantakari, M., Huttunen, J. T., Mattsson, T., Alm, J., Juutinen, S., et al. (2006). Sediment respiration and lake trophic state are important predictors of large
Köster, K., Köster, E., Berninger, F., Heinonsalo, J., & Pumpanen, J. (2018). Contrasting effects of reindeer grazing on CO2, CH4, and N2O fluxes originating from the northern boreal forest floor. Land Degradation & Development, 29(2), 374-381. https://doi.org/10.1002/ldr. 2868
Koven, C. D., Schuur, E. A. G., Schädel, C., Bohn, T. J., Burke, E. J., Chen, G., et al. (2015). A simplified, data-constrained approach to estimate the permafrost carbon-climate feedback. Philosophical Transactions of the Royal Society A: Mathematical, Physical & Engineering Sciences, 373(2054), 20140423. https://doi.org/10.1098/rsta. 2014.0423
Kuhn, M. A., Thompson, L. M., Winder, J. C., Braga, L. P., Tanentzap, A. J., Bastviken, D., & Olefeldt, D. (2021c). Opposing effects of climate and permafrost thaw on CH4 and CO2 emissions from northern lakes. AGU Advances, 2(4), e2021AV000515. https://doi.org/10.1029/ 2021av000515
Kuhn, M. A., Varner, R. K., Bastviken, D., Crill, P., MacIntyre, S., Turetsky, M., et al. (2021a). BAWLD-CH4: A comprehensive dataset of methane fluxes from boreal and arctic ecosystems. Earth System Science Data Discussions, 13(11), 1-56. https://doi.org/10.5194/essd-13-5151-2021
Lacroix, F., Zaehle, S., Caldararu, S., Schaller, J., Stimmler, P., Holl, D., et al. (2022). Mismatch of N release from the permafrost and vegetative uptake opens pathways of increasing nitrous oxide emissions in the high Arctic. Global Change Biology, 28(20), 5973-5990. https://doi.org/10. 1111/gcb. 16345
Lantuit, H., Overduin, P. P., Couture, N., Wetterich, S., Aré, F., Atkinson, D., et al. (2012). The Arctic Coastal Dynamics database: A new classification scheme and statistics on Arctic permafrost coastlines. Estuaries and Coasts, 35(2), 383-400. https://doi.org/10.1007/s12237-010-9362-6
Lauerwald, R., Regnier, P., Figueiredo, V., Enrich-Prast, A., Bastviken, D., Lehner, B., et al. (2019). Natural lakes are a minor global source of N2O to the atmosphere. Global Biogeochemical Cycles, 33(12), 1564-1581. https://doi.org/10.1029/2019GB006261
Lee, J., Oh, Y., Lee, S. T., Seo, Y. O., Yun, J., Yang, Y., et al. (2023). Soil organic carbon is a key determinant of
Li, G., Zhang, M., Pei, W., Melnikov, A., Khristoforov, I., Li, R., & Yu, F. (2022). Changes in permafrost extent and active layer thickness in the Northern Hemisphere from 1969 to 2018. Science of the Total Environment, 804, 150182. https://doi.org/10.1016/j.scitotenv.2021.150182
Liu, S. (2021). Monthly pCO2, gas transfer velocity and CO2 efflux rate in global streams and rivers (the GRADES river networks) [Dataset]. Dryad. https://doi.org/10.5061/dryad.d7wm37pz9
Liu, S., Kuhn, C., Amatulli, G., Aho, K., Butman, D. E., Allen, G. H., et al. (2022). The importance of hydrology in routing terrestrial carbon to the atmosphere via global streams and rivers. Proceedings of the National Academy of Sciences, 119(11), e2106322119. https://doi.org/10.1073/ pnas. 2106322119
Liu, Z., Kimball, J. S., Ballantyne, A. P., Parazoo, N. C., Wang, W. J., Bastos, A., et al. (2022). Respiratory loss during late-growing season determines the net carbon dioxide sink in northern permafrost regions. Nature Communications, 13(1), 1-13. https://doi.org/10.1038/s41467-022-33293-x
López-Blanco, E., Langen, P. L., Williams, M., Christensen, J. H., Boberg, F., Langley, K., & Christensen, T. R. (2022). The future of tundra carbon storage in Greenland – Sensitivity to climate and plant trait changes. Science of the Total Environment, 157385. https://doi.org/10.1016/ j.scitotenv. 2022
Mack, M. C., Walker, X. J., Johnstone, J. F., Alexander, H. D., Melvin, A. M., Jean, M., & Miller, S. N. (2021). Carbon loss from boreal forest wildfires offset by increased dominance of deciduous trees. Science, 372(6539), 280-283. https://doi.org/10.1126/science.abf3903
Marushchak, M. E., Kerttula, J., Diáková, K., Faguet, A., Gil, J., Grosse, G., et al. (2021). Thawing Yedoma permafrost is a neglected nitrous oxide source. Nature Communications, 12(1), 7107. https://doi.org/10.1038/s41467-021-27386-2
Marushchak, M. E., Pitkämäki, A., Koponen, H., Biasi, C., Seppälä, M., & Martikainen, P. J. (2011). Hot spots for nitrous oxide emissions found in different types of permafrost peatlands. Global Change Biology, 17(8), 2601-2614. https://doi.org/10.1111/j.1365-2486.2011.02442.x
Matson, A., Pennock, D., & Bedard-Haughn, A. (2009). Methane and nitrous oxide emissions from mature forest stands in the boreal forest, Saskatchewan, Canada. Forest Ecology and Management, 258(7), 1073-1083. https://doi.org/10.1016/j.foreco.2009.05.034
Matthews, E., Johnson, M. S., Genovese, V., Du, J., & Bastviken, D. (2020). Methane emission from high latitude lakes: Methane-centric lake classification and satellite-driven annual cycle of emissions. Scientific Reports, 10(1), 1-9. https://doi.org/10.1038/s41598-020-68246-1
McGuire, A. D., Christensen, T. R., Hayes, D., Heroult, A., Euskirchen, E., Kimball, J. S., et al. (2012). An assessment of the carbon balance of Arctic tundra: Comparisons among observations, process models, and atmospheric inversions. Biogeosciences, 9(8), 3185-3204. https://doi. org/10.5194/bg-9-3185-2012
McGuire, A. D., Lawrence, D. M., Koven, C., Clein, J. S., Burke, E., Chen, G., et al. (2018). Dependence of the evolution of carbon dynamics in the northern permafrost region on the trajectory of climate change. Proceedings of the National Academy of Sciences of the United States of America, 115(15), 3882-3887. https://doi.org/10.1073/pnas. 1719903115
Mishra, U., Hugelius, G., Shelef, E., Yang, Y., Strauss, J., Lupachev, A., et al. (2021). Spatial heterogeneity and environmental predictors of permafrost region soil organic carbon stocks. Science Advances, 7(9), eaaz5236. https://doi.org/10.1126/sciadv.aaz5236
Morishita, T., Hatano, R., & Desyatkin, R. V. (2007). N2O flux in Alas ecosystems formed by forest disturbance near Yakutsk, Eastern Siberia, Russia. Eurasian Journal of Forest Research, 10(1), 79-84.
Mörner, N.-A., & Etiope, G. (2002). Carbon degassing from the lithosphere, Global Planet. Change, 33(1-2), 185-203. https://doi.org/10.1016/ s0921-8181(02)00070-x
Muster, S., Riley, W. J., Roth, K., Langer, M., Cresto Aleina, F., Koven, C. D., et al. (2019). Size distributions of Arctic waterbodies reveal consistent relations in their statistical moments in space and time. Frontiers in Earth Science, 7, 5. https://doi.org/10.3389/feart.2019.00005
Natali, S. M., Watts, J. D., Rogers, B. M., Potter, S., Ludwig, S. M., Selbmann, A. K., et al. (2019). Large loss of CO2 in winter observed across the northern permafrost region. Nature Climate Change, 9(11), 852-857. https://doi.org/10.1038/s41558-019-0592-8
Obu, J., Westermann, S., Barboux, C., Bartsch, A., Delaloye, R., Grosse, G., et al. (2021). ESA permafrost climate change initiative (Permafrost_cci): Permafrost extent for the Northern Hemisphere, v3.0. NERC EDS Centre for Environmental Data Analysis. https://doi.org/10.5285/ 6e2091cb0c8b4106921b63cd5357c97c
Oh, Y., Zhuang, Q., Liu, L., Welp, L. R., Lau, M. C. Y., Onstott, T. C., et al. (2020). Reduced net methane emissions due to microbial methane oxidation in a warmer Arctic. Nature Climate Change, 10.4(4), 317-321. https://doi.org/10.1038/s41558-020-0734-z
Olefeldt, D., Hovemyr, M., Kuhn, M. A., Bastviken, D., Bohn, T. J., Connolly, J., et al. (2021). The boreal-Arctic wetland and lake dataset (BAWLD). Earth System Science Data, 13(11), 5127-5149. https://doi.org/10.5194/essd-13-5127-2021
Pallandt, M. M., Kumar, J., Mauritz, M., Schuur, E. A., Virkkala, A. M., Celis, G., et al. (2022). Representativeness assessment of the pan-Arctic eddy covariance site network and optimized future enhancements. Biogeosciences, 19(3), 559-583. https://doi.org/10.5194/bg-19-559-2022
Palmtag, J., Obu, J., Kuhry, P., Richter, A., Siewert, M. B., Weiss, N., et al. (2022). A high-spatial resolution soil carbon and nitrogen dataset for the northern permafrost region, based on circumpolar land cover upscaling. Earth System Science Data Discussions, 14(9), 1-28. https://doi. org/10.5194/essd-14-4095-2022
Pelletier, L., Strachan, I. B., Garneau, M., & Roulet, N. T. (2014). Carbon release from boreal peatland open water pools: Implication for the contemporary C exchange. Journal of Geophysical Research: Biogeosciences, 119(3), 207-222. https://doi.org/10.1002/2013jg002423
Potter, S., Cooperdock, S., Veraverbeke, S., Walker, X., Mack, M. C., Goetz, S. J., et al. (2022). Burned area and carbon emissions across northwestern boreal north America from 2001-2019. EGUsphere. https://doi.org/10.5194/egusphere-2022-364
Randerson, J. T., Liu, H., Flanner, M. G., Chambers, S. D., Jin, Y., Hess, P. G., et al. (2006). The impact of boreal forest fire on climate warming. Science, 314(5802), 1130-1132. https://doi.org/10.1126/science. 1132075
Rantanen, M., Karpechko, A. Y., Lipponen, A., Nordling, K., Hyvärinen, O., Ruosteenoja, K., et al. (2022). The Arctic has warmed nearly four times faster than the globe since 1979. Communications Earth & Environment, 3(1), 168. https://doi.org/10.1038/s43247-022-00498-3
Rasilo, T., Prairie, Y. T., & Del Giorgio, P. A. (2015). Large-scale patterns in summer diffusive CH 4 fluxes across boreal lakes, and contribution to diffusive C emissions. Global Change Biology, 21(3), 1124-1139. https://doi.org/10.1111/gcb. 12741
Repo, M. E., Susiluoto, S., Lind, S. E., Jokinen, S., Elsakov, V., Biasi, C., et al. (2009). Large
Rocher-Ros, G., Giesler, R., Lundin, E., Salimi, S., Jonsson, A., & Karlsson, J. (2017). Large lakes dominate CO2 evasion from lakes in an Arctic catchment. Geophysical Research Letters, 44(24), 12-254. https://doi.org/10.1002/2017g1076146
Runge, A., Nitze, I., & Grosse, G. (2022). Remote sensing annual dynamics of rapid permafrost thaw disturbances with LandTrendr. Remote Sensing of Environment, 268, 112752. https://doi.org/10.1016/j.rse.2021.112752
Saunois, M., Stavert, A. R., Poulter, B., Bousquet, P., Canadell, J. G., Jackson, R. B., et al. (2019). The global methane budget 2000-2017. Earth System Science Data Discussions, 1-136.
Schiller, C. L., & Hastie, D. R. (1996). Nitrous oxide and methane fluxes from perturbed and unperturbed boreal forest sites in northern Ontario. Journal of Geophysical Research, 101(D17), 22767-22774. https://doi.org/10.1029/96JD01620
Schulze, C., Sonnentag, O., Voigt, C., Thompson, L., van Delden, L., Heffernan, L., et al. (2023). Nitrous oxide fluxes in permafrost peatlands remain negligible after wildfire and thermokarst disturbance. Journal of Geophysical Research: Biogeosciences, 128(4), e2022JG007322. https://doi.org/10.1029/2022JG007322
Schuur, E. A. G., Abbott, B., Commane, R., Ernakovich, J., Euskirchen, E., Hugelius, G., et al. (2022). Permafrost and climate change: Carbon cycle feedbacks from a warming Arctic. Annual Review of Environment and Resources, 47, 28.1-28.29. https://doi.org/10.1146/annurev-environ-012220-011847
Schuur, E. A. G., Abbott, B. W., Bowden, W. B., Brovkin, V., Camill, P., Canadell, J. P., et al. (2011). High risk of permafrost thaw. Nature, 480(7375), 32-33. https://doi.org/10.1038/480032a
Schuur, E. A. G., Bockheim, J., Canadell, J., Euskirchen, E., Field, C. B., Goryachkin, S. V., et al. (2008). Vulnerability of permafrost carbon to climate change: Implications for the global carbon cycle. BioScience, 58(8), 701-714. https://doi.org/10.1641/b580807
Schuur, E. A. G., & Mack, M. C. (2018). Ecological response to permafrost thaw and consequences for local and global ecosystem services. Annual Review of Ecology, Evolution and Systematics, 49(1), 279-301. https://doi.org/10.1146/annurev-ecolsys-121415-032349
Schuur, E. A. G., McGuire, A. D., Grosse, G., Harden, J. W., Hayes, D. J., Hugelius, G., et al. (2015). Climate change and the permafrost carbon feedback. Nature, 520(7546), 171-179. https://doi.org/10.1038/nature14338
Schuur, E. A. G., Vogel, J. G., Crummer, K. G., Lee, H., Sickman, J. O., & Osterkamp, T. E. (2009). The effect of permafrost thaw on old carbon release and net carbon exchange from tundra. Nature, 459(7246), 556-559. https://doi.org/10.1038/nature08031
Sepulveda-Jauregui, A., Walter Anthony, K. M., Martinez-Cruz, K., Greene, S., & Thalasso, F. (2015). Methane and carbon dioxide emissions from 40 lakes along a north-south latitudinal transect in Alaska. Biogeosciences, 12(11), 3197-3223. https://doi.org/10.5194/bg-12-3197-2015
Serikova, S., Pokrovsky, O. S., Ala-Aho, P., Kazantsev, V., Kirpotin, S. N., Kopysov, S. G., et al. (2018). High riverine CO2 emissions at the permafrost boundary of Western Siberia. Nature Geoscience, 11, 825-829. https://doi.org/10.1038/s41561-018-0218-1
Simpson, I. J., Edwards, G. C., Thurtell, G. W., den Hartog, G., Neumann, H. H., & Staebler, R. M. (1997). Micrometeorological measurements of methane and nitrous oxide exchange above a boreal aspen forest. Journal of Geophysical Research, 102(D24), 29331-29341. https://doi.org/ 10.1029/97JD03181
Stanley, E. H., Casson, N. J., Christel, S. T., Crawford, J. T., Loken, L. C., & Oliver, S. K. (2016). The ecology of methane in streams and rivers: Patterns, controls, and global significance. Ecological Monographs, 86(2), 146-171. https://doi.org/10.1890/15-1027
Tarnocai, C., Canadell, J. G., Schuur, E. A., Kuhry, P., Mazhitova, G., & Zimov, S. (2009). Soil organic carbon pools in the northern circumpolar permafrost region. Global Biogeochemical Cycles, 23(2). https://doi.org/10.1029/2008gb003327
Terhaar, J., Lauerwald, R., Regnier, P., Gruber, N., & Bopp, L. (2021). Around one third of current Arctic Ocean primary production sustained by rivers and coastal erosion. Nature Communications, 12(1), 169. https://doi.org/10.1038/s41467-020-20470-z
Thornton, B. F., Wik, M., & Crill, P. M. (2016). Double-counting challenges the accuracy of high-latitude methane inventories. Geophysical Research Letters, 43(24), 12569-12577. https://doi.org/10.1002/2016GL071772
Treat, C. C., Bloom, A. A., & Marushchak, M. E. (2018). Nongrowing season methane emissions – A significant component of annual emissions across northern ecosystems. Global Change Biology, 24(8), 3331-3343. https://doi.org/10.1111/gcb. 14137
Turetsky, M. R., Abbott, B. W., Jones, M. C., Anthony, K. W., Olefeldt, D., Schuur, E. A. G., et al. (2020). Carbon release through abrupt permafrost thaw. Nature Geoscience, 13(2), 138-143. https://doi.org/10.1038/s41561-019-0526-0
Ueyama, M., Iwata, H., Nagano, H., Tahara, N., Iwama, C., & Harazono, Y. (2019). Carbon dioxide balance in early-successional forests after forest fires in interior Alaska. Agricultural and Forest Meteorology, 275, 196-207. https://doi.org/10.1016/j.agrformet.2019.05.020
Ullah, S., Frasier, R., Pelletier, L., & Moore, T. R. (2009). Greenhouse gas fluxes from boreal forest soils during the snow-free period in Quebec, Canada. Canadian Journal of Forest Research, 39(3), 666-680. https://doi.org/10.1139/x08-209
van der Werf, G. R., Randerson, J. T., Giglio, L., van Leeuwen, T. T., Chen, Y., Rogers, B. M., et al. (2017). Global fire emissions estimates during 1997-2016. Earth System Science Data, 9(2), 697-720. https://doi.org/10.5194/essd-9-697-2017
van Wees, D., van der Werf, G. R., Randerson, J. T., Rogers, B. M., Chen, Y., Veraverbeke, S., et al. (2022). Global biomass burning fuel consumption and emissions at 500 m spatial resolution based on the Global Fire Emissions Database (GFED). Geoscientific Model Development, 15(22), 8411-8437. https://doi.org/10.5194/gmd-15-8411-2022
Veraverbeke, S., Delcourt, C. J., Kukavskaya, E., Mack, M., Walker, X., Hessilt, T., et al. (2021). Direct and longer-term carbon emissions from arctic-boreal fires: A short review of recent advances. Current Opinion in Environmental Science & Health, 23, 100277. https://doi.org/10. 1016/j.coesh.2021.100277
Virkkala, A.-M., Natali, S. M., Rogers, B. M., Watts, J. D., Savage, K., Connon, S. J., et al. (2022). The ABCflux database: Arctic-boreal CO2 flux observations and ancillary information aggregated to monthly time steps across terrestrial ecosystems. Earth System Science Data, 14(1), 179-208. https://doi.org/10.5194/essd-14-179-2022
Virkkala, A.-M., Virtanen, T., Lehtonen, A., Rinne, J., & Luoto, M. (2018). The current state of CO2 flux chamber studies in the Arctic tundra: A review. Progress in Physical Geography: Earth and Environment, 42(2), 162-184. https://doi.org/10.1177/0309133317745784
Voigt, C., Marushchak, M. E., Abbott, B. W., Biasi, C., Elberling, B., Siciliano, S. D., et al. (2020a). Nitrous oxide emissions from permafrostaffected soils. Nature Reviews Earth & Environment, 1(8), 420-434. https://doi.org/10.1038/s43017-020-0063-9
Voigt, C., Marushchak, M. E., Lamprecht, R. E., Jackowicz-Korczyński, M., Lindgren, A., Mastepanov, M., et al. (2017). Increased nitrous oxide emissions from Arctic peatlands after permafrost thaw. Proceedings of the National Academy of Sciences, 114(24), 6238-6243. https://doi.org/ 10.1073/pnas. 1702902114
Voigt, C., Virkkala, A. M., Hould Gosselin, G., Bennett, K. A., Black, T. A., Detto, M., et al. (2023). Arctic soil methane sink increases with drier conditions and higher ecosystem respiration. Nature Climate Change, 13.10(10), 1095-1104. https://doi.org/10.1038/s41558-023-01785-3
Walker, X. J., Baltzer, J. L., Cumming, S. G., Day, N. J., Ebert, C., Goetz, S., et al. (2019). Increasing wildfires threaten historic carbon sink of boreal forest soils. Nature, 572(7770), 520-523. https://doi.org/10.1038/s41586-019-1474-y
Walter Anthony, K. M., Anthony, P., Grosse, G., & Chanton, J. (2012). Geologic methane seeps along boundaries of Arctic permafrost thaw and melting glaciers. Nature Geoscience, 5(6), 419-426. https://doi.org/10.1038/ngeo1480
Watts, J. D., Farina, M., Kimball, J. S., Schiferl, L. D., Liu, Z., Arndt, K. A., et al. (2023). Carbon uptake in Eurasian boreal forests dominates the high-latitude net ecosystem carbon budget. Global Change Biology, 29(7), 1870-1889. https://doi.org/10.1111/gcb. 16553
Whalen, S. C., Reeburgh, W. S., & Barber, V. A. (1992). Oxidation of methane in boreal forest soils – A comparison of 7 measures. Biogeochemistry, 16(3), 181-211. https://doi.org/10.1007/bf00002818
Wik, M., Varner, R. K., Anthony, K. W., MacIntyre, S., & Bastviken, D. (2016). Climate-sensitive northern lakes and ponds are critical components of methane release. Nature Geoscience, 9(2), 99-105. https://doi.org/10.1038/ngeo2578
Wilkerson, J., Dobosy, R., Sayres, D. S., Healy, C., Dumas, E., Baker, B., & Anderson, J. G. (2019). Permafrost nitrous oxide emissions observed on a landscape scale using the airborne eddy-covariance method. Atmospheric Chemistry and Physics, 19(7), 4257-4268. https://doi.org/10. 5194/acp-19-4257-2019
Yang, G., Peng, Y., Marushchak, M. E., Chen, Y., Wang, G., Li, F., et al. (2018). Magnitude and pathways of increased nitrous oxide emissions from uplands following permafrost thaw. Environmental Science & Technology, 52(16), 9162-9169. https://doi.org/10.1021/acs.est.8b02271
Yuan, Y., Zhuang, Q., Zhao, B., & Shurpali, N. (2023). Nitrous oxide emissions from pan-Arctic terrestrial ecosystems: A process-based biogeochemistry model analysis from 1969 to 2019. EGUsphere. [preprint]. https://doi.org/10.5194/egusphere-2023-1047