طيفية الصوت الضوئي المزدوجة المعززة بالتجويف Cavity-enhanced photoacoustic dual-comb spectroscopy

المجلة: Light Science & Applications، المجلد: 13، العدد: 1
DOI: https://doi.org/10.1038/s41377-023-01353-6
PMID: https://pubmed.ncbi.nlm.nih.gov/38177145
تاريخ النشر: 2024-01-05

طيفية الصوت الضوئي المزدوجة المعززة بالتجويف

زين وانغ تشينشوي نيي هاوجيا صن تشيانغ وانغ سيمون بوري باولو دي ناتالي و وي رين

الملخص

طيفية مزدوجة النبضات الضوئية (DCS)، التي تحول المعلومات الطيفية من نطاق التردد الضوئي إلى نطاق التردد الصوتي عبر تداخل متعدد الترددات، تتيح قياسات طيفية خالية من الخلفية بدقة عالية وعرض نطاق واسع. ومع ذلك، تظل حساسية الكشف محدودة بسبب انخفاض طاقة خطوط النبض الفردية وغياب الرنانات الصوتية العريضة النطاق. هنا، نطور DCS معززة بالحجرة الضوئية، التي تتغلب على هذه القيود من خلال استخدام حجرة ضوئية عالية الدقة لتكبير الطاقة لنبضات مزدوجة التردد ورنان صوتي عريض النطاق مع استجابة ترددية مسطحة. نحن نعرض قياسات طيفية عالية الدقة لكميات ضئيلة من و CO في نطاق الترددات C بالكامل للاتصالات. تُظهر الطريقة حد كشف أدنى من عند وقت القياس 100 ثانية، والذي يتوافق مع معامل الامتصاص المعادل للضوضاء قد يفتح نظام الكشف عن الغاز بالتصوير الصوتي المعزز بالتجويف المقترح آفاقًا جديدة للكشف عن الغازات بحساسية فائقة ودقة عالية وتعدد الأنواع مع تطبيقات واسعة النطاق.

مقدمة

منذ أولى عروضها قبل عقدين من الزمن لقد تطورت طيفية الجمع المزدوج (DCS) لتصبح أداة قوية في العديد من المجالات مثل الطيفية والميكروسكوبية. القياس الدقيق ليدار طيفي المراقبة البيئية ، وتقنيات الهولوجرافيا والتصوير الطيفي المتقدم . تلعب DCS دورًا مهمًا في الطيفية الجزيئية الحديثة عالية الدقة وعريضة النطاق، حيث تقوم بإجراء طيفية تحويل فورييه بسرعة دون استخدام أي أجزاء متحركة. في هذا الإعداد، يمر مشط تردد واحد عبر عينة غازية ليتم تحليلها ويتداخل مع كاشف ضوئي مع مشط آخر مقفل الطور بمعدل تكرار مختلف قليلاً. تتداخل النغمات المتعددة بين الأزواج
تولد خطوط المشط إشارة تداخلية، يمكن الوصول إليها بواسطة إلكترونيات الترددات الراديوية (RF) وتحويلها باستخدام تحويل فورييه لكشف طيف العينة. يمكن لنظام DCS الاستفادة الكاملة من دقة التردد وموثوقيتها، وعرض النطاق الترددي الواسع، ومعدل التكرار العالي لمصادر المشط المختلفة من أجل الطيفية عالية السرعة، وعالية الدقة، وعريضة النطاق. .
تقليدي يتم تنفيذ ذلك من خلال قياس شدة ضوء المشط المنقول بدقة باستخدام كاشف ضوئي سريع. يجب استخراج طيف الامتصاص من الإشارة الخلفية الكبيرة، وهو أمر ليس سهلاً خاصة بالنسبة للامتصاص الضعيف. مقارنةً بقياسات الامتصاص المباشرة، يمكن أيضًا إجراء DCS من خلال الاستفادة من تقنيات طيفية أخرى مثل الكشف الضوئي الصوتي والكشف الضوئي الحراري. تتيح قياسات الامتصاص غير المباشرة هذه الكشف عن طيف الجزيئات بدون خلفية، حيث يمكن فقط لخطوط المشط الممتصة بواسطة وسط الغاز أن تولد نغمات الضوضاء المتعددة الهيرودينية الصوتية/الحرارية.
على سبيل المثال، تم استخدام الطيف الضوئي الصوتي (PAS) على نطاق واسع في استشعار الغاز والتصوير ،
عادةً ما يستخدم ميكروفونًا لاكتشاف الموجات الصوتية، التي تتولد من الاسترخاء التصادمي غير الإشعاعي للجزيئات المثارة بعد امتصاص الضوء المعدل. أبلغ ساديك وآخرون عن أول نظام PAS باستخدام مشط ترددي وقاموا بتنفيذ مطياف تحويل فورييه (FTS) لتعديل شدة المشط الترددي. لإزالة الأجزاء الميكانيكية في FTS، تم مؤخرًا إثبات استخدام DCS الضوئي الصوتي لقياس غاز الأسيتيلين. وأفلام البوليمر في هذه التجارب لإثبات المفهوم، لا يزال من الضروري تحسين حساسية الكشف، أي أنه تم تحقيق حد أدنى للكشف (MDL) قدره 10 جزء في المليون. الكشف في وقت التسجيل من خلال استبدال الميكروفون بشوكة تذبذب كوارتز (QTF) ذات عامل جودة مرتفع، تم تطوير نظام قياس الطيف الضوئي الصوتي القائم على QTF لتحسين الحد الأدنى للكشف إلى 8.3 جزء في البليون. ومع ذلك، يجب أن تقع خطوط الجمع الناتجة ضمن عرض النطاق الترددي الضيق للغاية (عدة هرتز) لرنانة QTF، مما يحد بشكل كبير من عرض نطاق الكشف. لذلك، تم إعاقة القدرة على تحقيق الحساسية العالية وعرض النطاق الواسع في نظام الكشف الضوئي الصوتي بسبب نقص الضوء القوي من الجمع لتحفيز التأثير الضوئي الصوتي ورنانات الصوت العريضة لتضخيم جميع الموجات الصوتية الناتجة بشكل فعال.
في هذه الدراسة، نقدم تقنية الكشف الطيفي المعززة بالحجرة باستخدام الصوت الضوئي DCS للكشف فائق الحساسية، وعريض النطاق، وعالي الدقة، من خلال دمج تقنيتين متقدمتين للتغلب على العيوب المذكورة أعلاه. أولاً، من خلال استخدام رنان صوتي على شكل فلوت، نحقق الكشف الحساس بالصوت الضوئي مع نطاق ترددي يزيد عن 5 كيلوهرتز في نطاق الترددات الصوتية ثانيًا، يتيح حقن سلاسل الترددات المتزامنة في تجويف بصري عالي الجودة زيادة الطاقة داخل التجويف بعدة أوامر من حيث الحجم. وهذا يستفيد من عرض النطاق الترددي الواسع للكاشف الصوتي الجديد وزيادة قوة السلسلة المدهشة التي يوفرها التجويف البصري. في التجربة، نوضح تقنية التصوير الصوتي المعزز بالتجويف عالية الدقة لعدة أنواع من الغازات في الطور الغازي بما في ذلك و CO في نطاق التردد C بالكامل في الاتصالات مع حساسية فائقة بين تقنيات مطيافية مشط التردد المتطورة.

النتائج

مفهوم

مبدأ عمل قياس الصوت الضوئي المعزز بالحجرة موضح في الشكل 1a. يختلف عن قياس امتصاص المشط المزدوج في حجرة بصرية. يتطلب نظام التصوير الصوتي المعزز بالتجويف (DCS) أن يتم اقتران السلسلتين في تجويف واحد في نفس الوقت لتمكين توليد نغمات تداخل متعددة من السلسلتين داخل التجويف. بشرط أن تدخل كلتا السلسلتين إلى
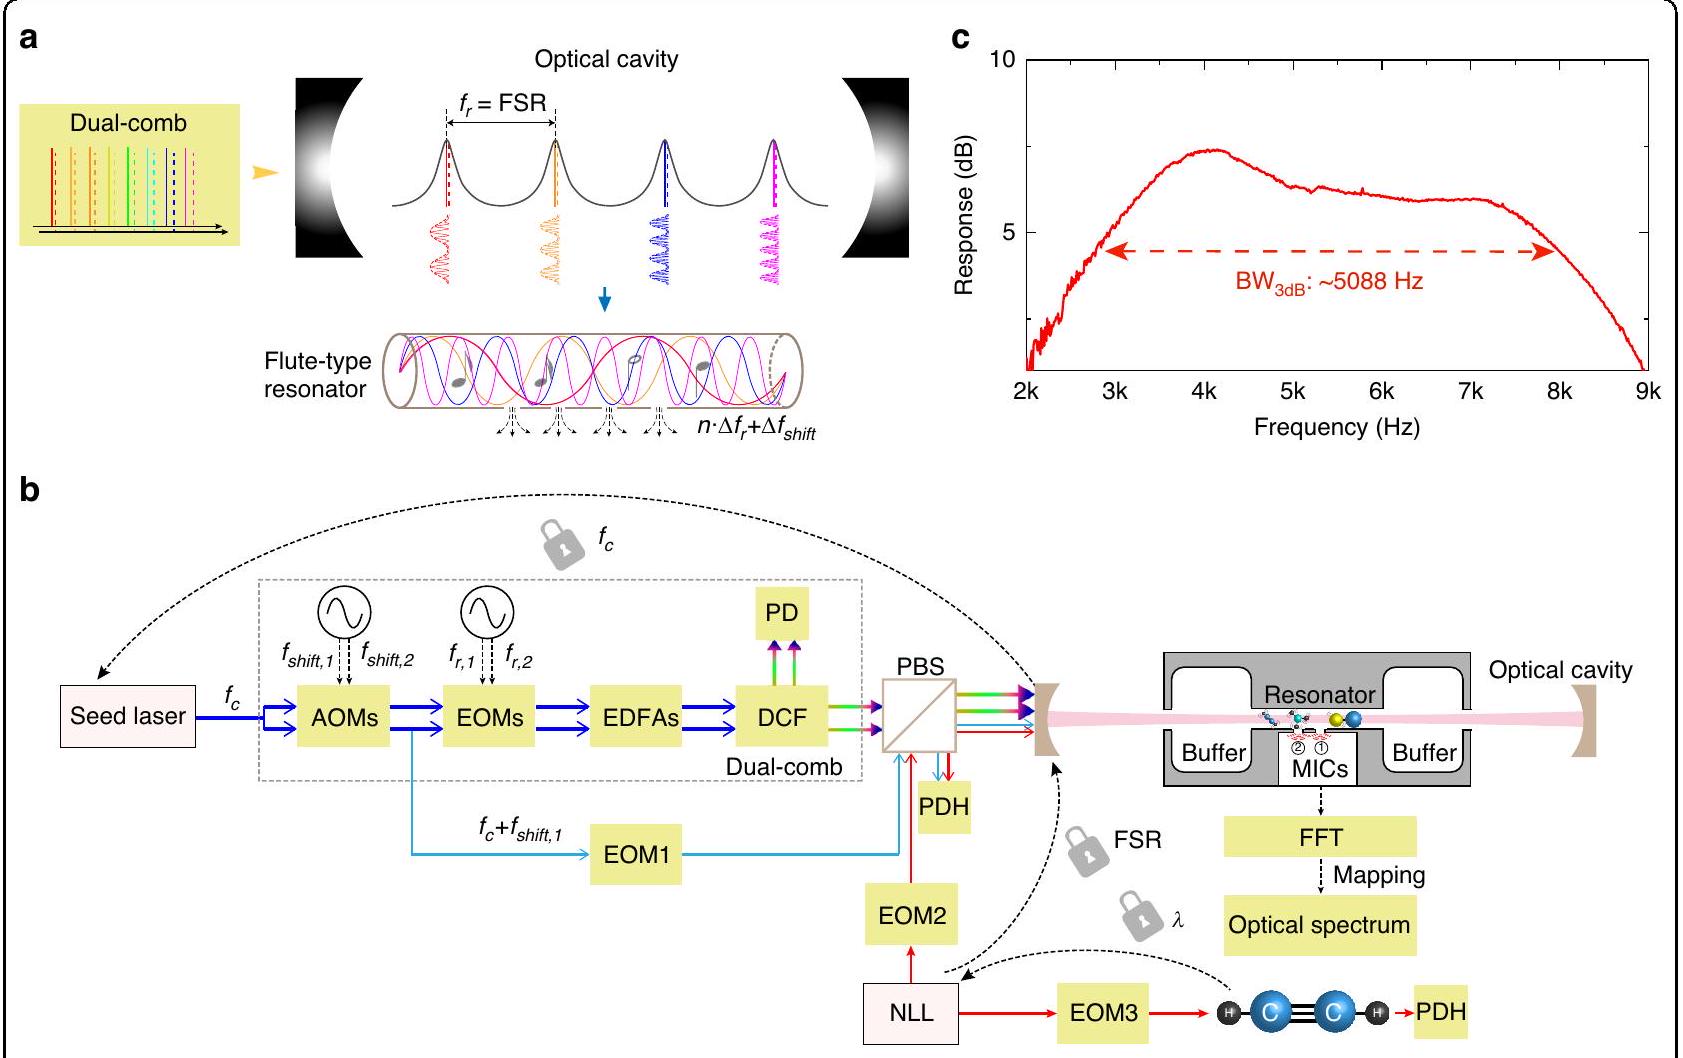
تعمل التجويف بشكل فعال لتعزيز الطاقة، حيث يتسبب التداخل المتعدد بين كل زوج من خطوط المشط في تعديل سعة خط المشط المعزز بالتجويف. بعد امتصاصها بواسطة الجزيئات المستهدفة، يؤدي ذلك إلى إثارة مئات أو آلاف من الموجات الصوتية بترددات متباعدة بشكل متساوٍ، تحددها فرق معدل التكرار. ) وتحولات التردد المركزي ( ) بين المشطين المتوافقين في الطور من الناحية المثالية، فإن الرنان الصوتي واسع النطاق والمفتوح، الذي يقع داخل التجويف البصري، يعزز جميع الموجات الصوتية لمزيد من الكشف الحساس.

إعداد

يوضح الشكل 1b المخطط العام للإعداد التجريبي. هنا يتم استخدام مصدر مزدوج للنبضات الكهروضوئية لأغراض العرض مع الأخذ في الاعتبار مرونته في ضبط معدل التكرار. ) وتردد الحامل البصري تُقدم مزيد من التفاصيل حول مصدر المشط الثنائي في الطرق. تشترك سلسلتان من مشطات التردد الناتجة عن نفس ليزر البذور المستمر (CW) في نفس التردد الحامل (غير الثابت). بالنسبة لإحدى سلسلتي مشطات التردد بمعدل تكرار ، قفل ليزر البذور ( ) إلى تجويف فابري-بروت المحاط في خلية غازية يمكّن من التداخل بين الخط المركزي للفرشاة ووضعية واحدة من التجويف، والتي يمكن تنفيذها باستخدام تقنية باوند-دريفير-هول (PDH) تتزاوج خطوط المشط الأخرى في التجويف عن طريق الضبط لكي يتطابق تمامًا مع النطاق الطيفي الحر (FSR، ) من التجويف البصري. للحصول على FSR ثابت زمنياً، يتم استخدام ليزر مستمر ذو عرض خط ضيق ومستقر (1531.58 نانومتر) كما هو موضح في الشكل 1b كوسيط بصري لتثبيت طول التجويف عن طريق قفل وضع التجويف على خط امتصاص من (الملاحظة التكميلية 1). ونتيجة لذلك، جميع خطوط المشط بمعدل تكرار مرتبة في توافق تام مع أوضاع التجويف، في حين أن نظير مصدر المشط المزدوج مع اختلاف طفيف في معدل التكرار ( ، حيث يمكن أن تدخل التجويف تلقائيًا. نحن نقدر فرقًا ضئيلًا ( في التخفيف النسبي لشدة الخطين المتداخلين في نفس وضع التجويف (الطرق). بالإضافة إلى ذلك، قمنا بإزالة التداخل المحتمل بين الحلقات الثلاثة للتأمين من خلال استخدام ترتيب استقطاب متعامد لضوء المشط والليزر المستمر واختيار ترددات تعديل بعناية للثلاثة EOMs المستخدمة لأغراض التأمين PDH (الملاحظة التكميلية 1).
يعمل كاشف الصوتيات العريض النطاق كعنصر رئيسي في نظام التصوير الصوتي بالليزر. مستلهمين من آلة الفلوت، قمنا بتصميم رنان صوتي عريض النطاق لتكبير العديد من الموجات الصوتية بترددات مميزة. كما هو موضح في الشكل 1ب، يتضمن رنان صوتي طولي (الطول: 35 مم؛ القطر الداخلي: 2 مم) في المنتصف،
الشكل 1: طيفية الصوت الضوئي المعززة بالحجرة باستخدام مزدوجة المشط. أ مفهوم نهج طيفية الصوت الضوئي المعززة بالحجرة. يتم ربط المشطين ثنائيي التردد في حجرة بصرية لتعزيز الطاقة عندما تتطابق جميع خطوط المشط بشكل مثالي مع أوضاع الحجرة. بعد امتصاص جزيئات الغاز المستهدفة، تولد التداخل المتعدد للمشطين الثنائيين داخل الحجرة موجات صوتية متعددة بترددات تحددها فرق معدلات التكرار. ) وتحولات التردد المركزي ( ). تم تصميم رنان صوتي من نوع الناي مع استجابة ترددية عريضة النطاق لتكبير الموجات الصوتية الضوئية المتولدة. ب الرسم التخطيطي للإعداد التجريبي. يستخدم مصدر الثنائي البصري الكهربائي ليزر بذور مستمر عند تردد بصري ، والذي ينقسم إلى فرعين ويتصل بالتوازي مع أزواج من المودولات الصوتية الضوئية (AOMs) للتحكم في تحولات التردد المركزي ( و ) ومعدلات التعديل الكهروضوئية (EOMs) للتحكم في معدلات التكرار و . يتم تضخيم النبضات الضوئية الناتجة بواسطة مضخمين من الألياف المدعومة باليوربيوم (EDFAs) ويتم إطلاقها في الاتجاه المعاكس إلى ألياف تعويض التشتت غير الخطية (DCF). يتم استخدام كاشف ضوئي (PD) مع مصدر المشط المزدوج لمراقبة طيف المرجع متعدد الترددات. يتم استخدام ثلاث حلقات قفل Pound-Drever-Hall (PDH) لمطابقة خطوط المشط مع أوضاع التجويف: يتم تعديل الليزر البذري المنزلق بواسطة AOM بواسطة EOM1 (19 ميجاهرتز) لتثبيت تردد الحامل ( ) بالنسبة لفراغ فابري-بروت؛ يتم تعديل عرض خط الليزر الضيق (NLL) بواسطة EOM2 ( 13 ميجاهرتز ) ليتزامن مع الفراغ البصري و بواسطة EOM3 ( 99 ميجاهرتز ) ليتزامن مع خط امتصاص عند 10 تور، على التوالي. يتم ترتيب الليزرين المستمرين في استقطاب متعامد مع ضوء المشط المزدوج لتجنب التداخل البصري، ويتم دمجهما عبر مقسم شعاع الاستقطاب (PBS) قبل دخولهم إلى التجويف البصري. يوجد الرنان الصوتي العريض النطاق داخل التجويف البصري لتكبير الموجات الصوتية ويستخدم ميكروفونان (MICs) للكشف عن الموجات الصوتية. ج استجابة التردد المميزة للرنان الصوتي العريض النطاق. يظهر الرنان عرض نطاق 3 ديسيبل (BW 5088 هرتز
متصل بحجمين عازلين (الطول: 17.5 مم؛ القطر الداخلي: 12 مم). يتم استخدام غلافين نهائيين لتغطية الأحجام العازلة، ويتم عمل ثقب مركزي (القطر: 2 مم) في كل غلاف للوصول البصري. للكشف عن الموجات الصوتية، يتم تثبيت ميكروفونين في الرنان الصوتي المركزي وتضاف الإشارات الكهربائية المتراكبة بواسطة دائرة جمع منخفضة الضوضاء. أخيرًا، يتم تحويل خرج الميكروفون إلى رقمية وتحويله إلى تحويل فورييه للحصول على طيف الفوتو acoustics. يجب ملاحظة أن جميع مولدات الإشارات وبطاقة جمع البيانات متزامنة مع ساعة روبيديوم للحفاظ على قفل طويل الأمد واستقرار القياس.
تمت مcharacterization استجابة التردد للرنان الصوتي العريض النطاق من خلال قياس الإشارة الصوتية الضوئية لـ باستخدام ليزر CW بترددات تعديل شدة متغيرة (الملاحظة التكميلية 2). كما هو موضح في الشكل 1c، يظهر الرنان الصوتي لدينا استجابة ترددية ممتازة ذات قمة مسطحة مع عرض نطاق (3 ديسيبل) يبلغ 5088 هرتز في نطاق الترددات من . هذا أوسع بعشرات المرات من الرنان الصوتي الطولي التقليدي ، وأكبر بأكثر من ثلاثة أوامر من الحجم من كما تم مناقشته لاحقًا، فإن مثل هذا الاستجابة العريضة النطاق تستفيد من دمج أوضاع صوتية من الدرجة العليا داخل الرنان الصوتي.
الشكل 2 مقارنة بين طيفي الفوتو أكوستيك ثنائي النطاق المحصل عليه مع وجود وبدون تجويف بصري. أ. إشارة فوتو أكوستيك DCS المعززة بالتجويف بتركيز 10 جزء في المليون. (اللوحة العلوية) وشدة الحادث المقابلة للثنائي الكمومي (اللوحة السفلية). ب إشارة تصوير صوتي ضوئي تمثيلية بمرور واحد لمستوى 5000 جزء في المليون (اللوحة العلوية) وشدة الحادث المقابلة للثنائي الكم (اللوحة السفلية). تم حساب القياسات على مدى 60 ثانية. تم تحويل مقياس التردد الصوتي (كيلوهرتز) إلى المجال البصري بناءً على عامل ضغط التردد وتردد الحامل خط امتصاص قوي لـ تمت ملاحظة خط عند 195.895 تيراهرتز وخط ضعيف عند 195.818 تيراهرتز في هذه النطاق الترددي.
عن طريق ملء في خلية الغاز عند الضغط الجوي (760 تور)، يتم توضيح إشارة التصوير الصوتي المعزز بالحجرة في اللوحة العلوية من الشكل 2a. يتوافق الملف الطيفي القوي عند 5 كيلوهرتز في مجال الترددات الصوتية مع خط من عند 195.895 تيراهرتز في المجال البصري. بالمقابل، قمنا أيضًا بإجراء القياس بمرور واحد باستخدام نفس مصدر الثنائي المزدوج والمذبذب الصوتي، ولكننا أزلنا المذبذب البصري من الإعداد. لاحظ أن التركيز أعلى بكثير (5000 جزء في المليون) من كان مطلوبًا تحقيق مستوى إشارة مشابه في الشكل 2ب. تم تسجيل طيفي المرجع المزدوج في اللوحتين السفليتين عندما تم قياس إشارة المرور الفردية وإشارة التعزيز التجاوي، على التوالي؛ حيث تظهر ملفات تعريف مشابهة في هذين القياسين. من خلال أخذ الفرق في سعة إشارة الصوت الضوئي وتركيز الغاز في الاعتبار، فإن استخدام مثل هذه التجاوي العالية الدقة يعزز بشكل كبير إشارة الموجات المزدوجة بمقدار 924. نحن نقدر متوسط قدرة الموجات داخل التجاوي بمقدار 130 مللي واط لكل زوج من خطوط الموجات (الطرق).

قياس متعدد الأنواع واسع النطاق

على نطاق الترددات C-band للاتصالات (1527.3-1569.7 نانومتر)، قمنا بإجراء قياسات DCS المعززة بالحجرة باستخدام الصوت الضوئي جزء في المليون و عند ضغط 760 تور، على التوالي. تم تسجيل القياس بمعدل أخذ عينات بيانات ودقة FFT تبلغ 1 هرتز. تم متوسط الطيف الضوئي الصوتي على مدى 60 ثانية لتحسين نسبة الإشارة إلى الضوضاء (SNR)، تلاها تطبيع السعة بواسطة المشط غير المنتظم-
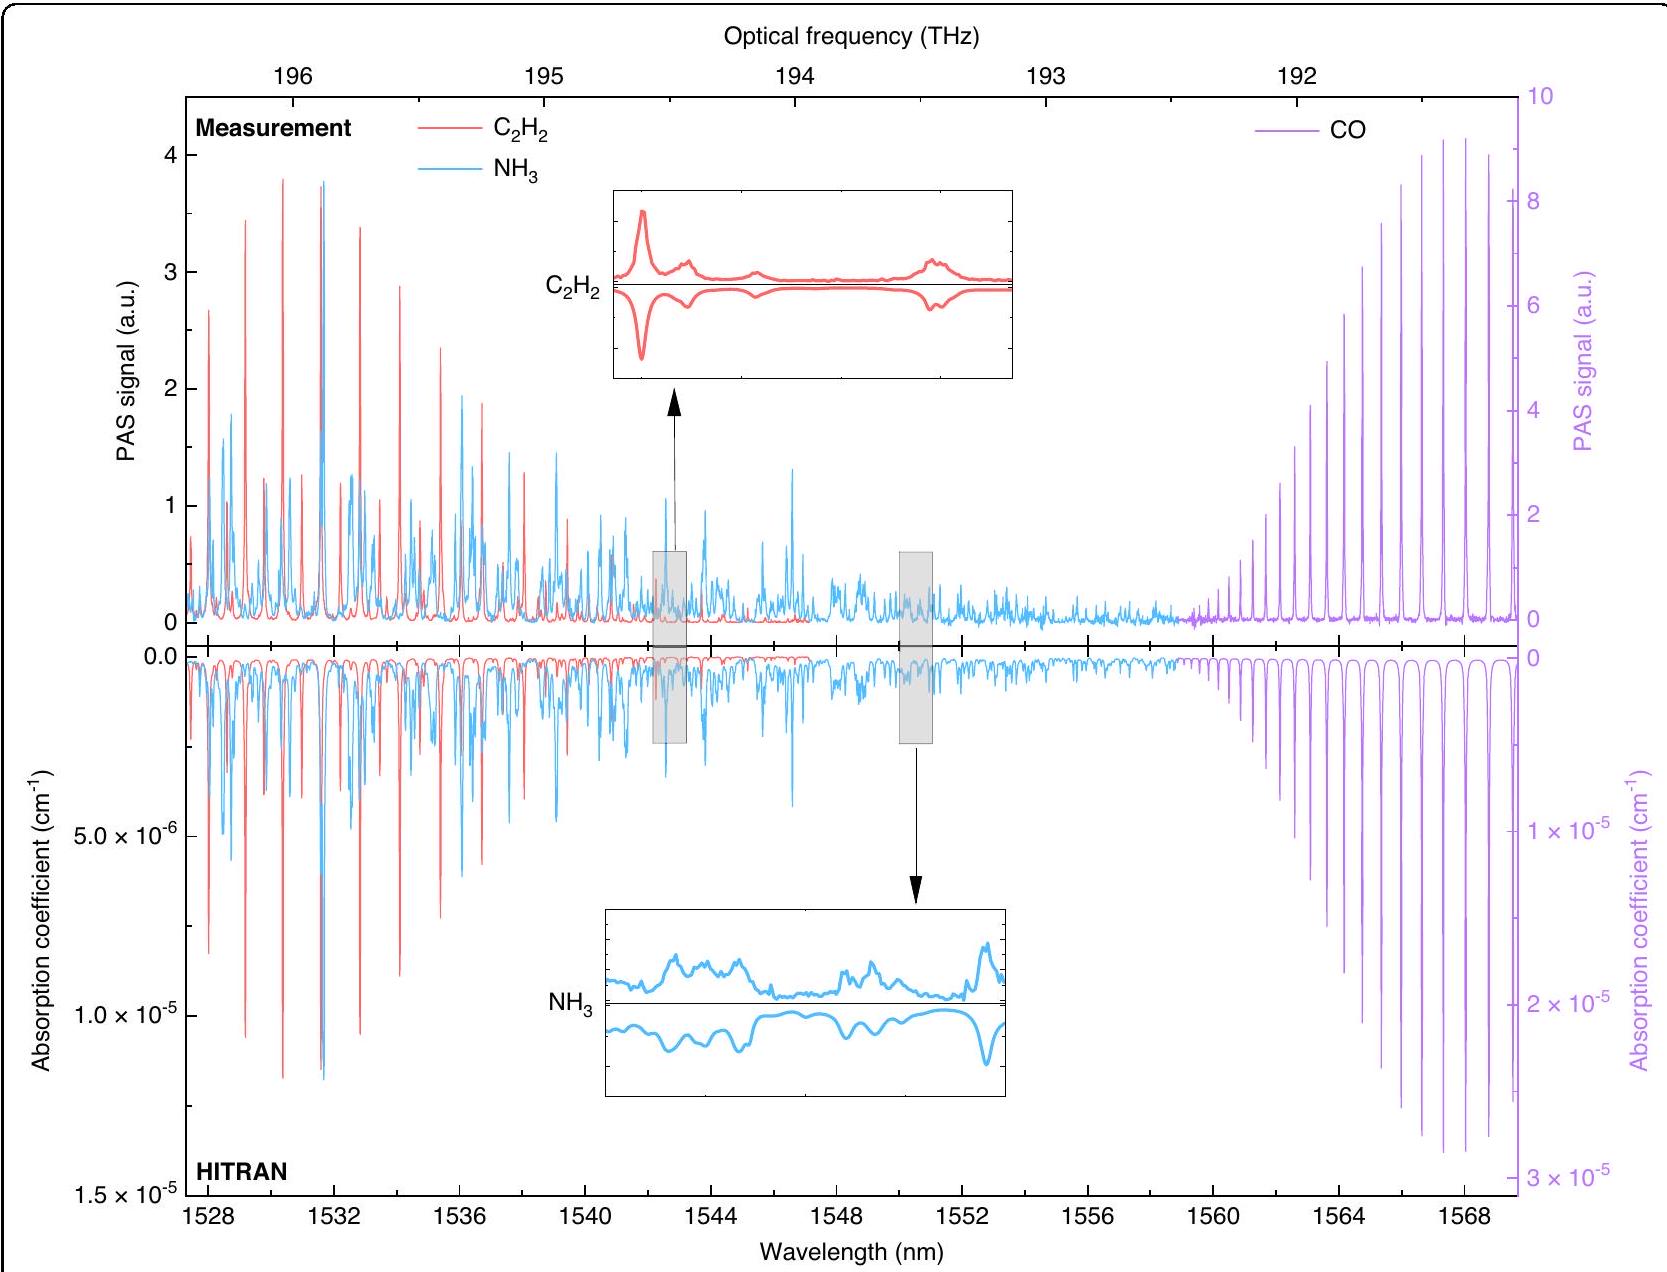
غلاف الطاقة، وتغير جودة التجويف على مدى طيفي واسع، واستجابة التردد للرنان الصوتي (الملاحظة التكميلية 3). توضح الشكل 3 الطيف الواسع بالكامل من خلال تجميع 41 طيفًا فوتو acoustics. طيف الفوتو acoustics و 21 طيفًا صوتيًا ضوئيًا لخلائط CO تم قياسها مع نسبة إشارة إلى ضوضاء (الطرق) تبلغ 5952 و 8621 و 347، على التوالي. جميع القياسات تتفق بشكل جيد مع أطياف الامتصاص المحاكاة باستخدام قاعدة بيانات HITRAN. . على وجه الخصوص، يُظهر الرسم البياني المرفق عدة خطوط ضعيفة جدًا من مع معاملات الامتصاص حوالي الجزيء متعدد الذرات يتميز بطيف تحت الأحمر معقد يحتوي على العديد من الخطوط المدمجة، والتي تم فصلها بشكل جيد بواسطة جهاز الطيف الخاص بنا كما هو موضح في الرسم البياني المرفق. لاحظ أن طيف الترددات العليا لثاني أكسيد الكربون في هذه النطاقات الطولية له قوة خط صغيرة جداً (معظمها أقل من جزيئات ))، الذي هو أوامر من الحجم أصغر من و .

الاستجابة الخطية وحدود الكشف

تم اختيار أقوى خط امتصاص لكل نوع لدراسة أداء استشعار الغاز. هنا درسنا خط من عند 195.895 تيراهرتز بقوة خط جزيئات يرجى ملاحظة أن جودة التجويف قد تتدهور بسبب الامتصاص الأقوى عند تركيز غاز أعلى بكثير، مما يؤثر على الاستجابة الخطية لمستشعرات الغاز المعززة بالتجويف. مع أخذ هذا العامل في الاعتبار، يوضح الشكل 4a سعة الإشارة الصوتية الضوئية كدالة لتركيز الغاز لـ
الشكل 3 طيف جزيئي واسع النطاق لعدة أنواع. قياس الطيف الضوئي المعزز بالحجرة باستخدام تقنية الصوتيات الضوئية. و يتم قياسه على نطاق C-band للاتصالات عند الضغط الجوي (760 تور). كما تم رسم المحاكاة الطيفية المستندة إلى قاعدة بيانات HITRAN للمقارنة. المقتطفات: توقيعات ضعيفة لـ و تم حلها بواسطة نظام التصوير الصوتي المعزز بالحجرة مزدوجة المشط
الشكل 4 النتائج التجريبية للاستجابة الخطية وحدود الكشف. أ تغير سعة التصوير الصوتي مع تركيز. يظهر النظام استجابة خطية جيدة مع قيمة تبلغ 0.9976، بعد التطبيع، يمكن أن تكون الخطية أفضل مع قيمة أعلى تبلغ 0.9984. تم حساب أشرطة الخطأ الرأسية (انحراف معياري 1-σ) من البيانات الخام، المأخوذة في فترة زمنية قدرها 60 ثانية. ب تحليل انحراف ألان-ويرل لـ الكشف. تم إجراء القياس عن طريق تسجيل استجابة النظام للغاز النقي لمدة ساعة مع تشغيل جميع حلقات القفل
المخاليط، مما يظهر استجابة خطية جيدة ( ). تم حساب شريط الخطأ العمودي ( الانحراف المعياري) من تغير سعة الذروة المكتسبة على مدى فترة زمنية قدرها 60 ثانية. يتم إجراء تحليل انحراف ألان-ويرل لتقييم الاستقرار على المدى الطويل وحدود الكشف عن طريق قياس الغاز الصفري (هنا لمدة ساعة. يتم تقييم إشارة التصوير الصوتي والضوضاء عند طاقة المشط المزدوجة 30 مللي واط وتردد صوتي مماثل قدره 5290 هرتز والذي يتوافق مع ذروة الامتصاص لـ عند 195.895 تيراهرتز (طرق). كما هو موضح في الشكل 4ب، يظهر مستشعرنا حد كشف أدنى (MDL) قدره 0.6 جزء في البليون لـ عند زمن متوسط قدره 100 ثانية، مما يتوافق مع معامل الامتصاص المكافئ للضوضاء (NEA) لـ . كما درسنا الخطوط المختلطة لـ عند 195.731 تيراهرتز مع قوة خطية لـ جزيئات ) وخط لـ CO عند 191.190 تيراهرتز مع قوة خطية لـ جزيئات . تم تقديم النتائج في الملاحظة التكميلية 4.

المناقشة

يلعب الرنان الصوتي من نوع الفلوت دورًا مهمًا في نظام التصوير الصوتي المعزز بالحجرة للكشف الصوتي واسع النطاق. هنا نناقش بإيجاز المعلمات التي تؤثر على استجابته الترددية؛ تم تقديم الهيكل التفصيلي للرنان الصوتي في الملاحظة التكميلية 2. يوضح الشكل 5أ استجابات التردد المختلفة لرنان طولي مفتوح النهاية مع أقطار داخلية متنوعة. الرنان الذي له قطر داخلي قدره 2 مم يثير المزيد من الأوضاع الصوتية عالية التردد. ثم تمت إضافة غطاءين نهائيين لتغطية أحجام التخفيف بقطر 12 مم؛ تم عمل ثقب مركزي للوصول البصري. كما هو موضح في الشكل 5ب، يؤدي ذلك إلى استجابة ترددية سلسة وعريضة. تساهم التهيئة التي تحتوي على ثقب أصغر (قطر) ) في الغطاء في استجابة ترددية أوسع (4108 هرتز في عرض النطاق). أخيرًا، مقارنةً بالميكروفون الفردي المثبت في الموضع المركزي كما هو موضح في الشكل 5أ و ب، قمنا بحفر ثقب آخر قريب (على بعد 6.5 مم) لتركيب الميكروفون الثاني. يتم جمع الإشارات الكهربائية الناتجة عن الميكروفونين بواسطة دائرة منخفضة الضوضاء مع النتائج المرسومة في الشكل 5ج، مما يظهر استجابة مسطحة مع زيادة عرض النطاق إلى 5088 هرتز. يتميز الرنان الصوتي التقليدي بمعامل Q قدره 38 وعرض نطاق قدره 150 هرتز. مثل هذا العرض الضيق يجعل من غير المناسب تضخيم موجات صوتية متعددة. بالمقارنة، يحتوي رنانا على عرض نطاق قدره 5088 هرتز، وهو أكبر بحوالي 34 مرة. من خلال استهداف استجابة ترددية مسطحة أوسع مع سعة إشارة أكبر، من الممكن تحسين هندسة الرنان الصوتي باستخدام تحليل العناصر المحدودة . من المثير أيضًا استكشاف الرنانات الصوتية ذات عرض النطاق الموجود عند ترددات أعلى لتقليل الضوضاء.
يثبت منصتنا إمكانية تعزيز طاقة المشط بشكل كبير من خلال ربط كلا المشطين في حجرة بصرية عالية الدقة. يعتمد التنفيذ الناجح على المطابقة واحد لواحد بين خط المشط ووضع الحجرة، مما يمكّن من التحكم الدقيق في درجتي حرية المشط و وطول الحجرة. تبلغ الطاقة الضوئية المتوسطة لكل زوج مشط داخل الحجرة 130 مللي واط في هذا العمل، والتي يمكن تعزيزها أكثر باستخدام حجرة عالية الدقة أو رنان ميكرون عالي معامل Q . نظرًا لأن الحقن المتزامن للمشطيين في الحجرة مطلوب للتغلب على التداخل المتعدد داخل الحجرة، قد يتسبب الرنين الأكثر حدة للحجرة عالية الدقة في بعض التوهين في شدة خط المشط الذي يبتعد قليلاً عن رنين الحجرة. من خلال تطبيق حجرة بصرية ذات دقة أكبر بعشر مرات (40780) ولكن تقليل طول الحجرة من 18 سم إلى 6 سم، يتضاعف FSR إلى 2.5 غيغاهرتز ويقل عرض وضع الحجرة إلى 61 كيلو هرتز. سيؤدي ذلك فقط إلى حدوث توهين طفيف (< 7%) لشدة المشط لخط المشط الذي يتجاوز 200 (طرق).
بالإضافة إلى ذلك، تفضل اكتشاف الغازات النادرة القياسات الطيفية في منطقة الأشعة تحت الحمراء المتوسطة. حيث يمكن توليد المشط المزدوج في الأشعة تحت الحمراء المتوسطة باستخدام توليد الفرق الترددي (DFG) لمشطي كهربائي بصري قريب من الأشعة تحت الحمراء ، يمكننا بسهولة توسيع الطريقة المقترحة في الدراسة الحالية لتطبيقات استشعار الغاز في الأشعة تحت الحمراء المتوسطة. على الرغم من أن أنواعًا أخرى من المشط في الأشعة تحت الحمراء المتوسطة قد تم اختراعها مؤخرًا ، يمكن للمرء أن يكرس جهوده لتحقيق التداخل الطيفي بين خطوط المشط ووضع الحجرة مع مراعاة الآليات المختلفة للتحكم في معلمات المشط. على سبيل المثال، تحتاج المشط في الأشعة تحت الحمراء المتوسطة التي تم إنشاؤها بواسطة عملية DFG إلى آليات إضافية للتوافق مع الحجرة البصرية. نوع آخر من المشط في الأشعة تحت الحمراء المتوسطة الذي تم إنشاؤه في المذبذبات البارامترية البصرية المضخمة بشكل متزامن (OPOs) يتطلب إلكترونيات إضافية لتثبيت فرق معدل التكرار والانزياح الحامل. بالنسبة لمشطي الليزر الكمي (QCL) ، يلزم وجود قفل حقن وحلقات قفل الطور لتثبيت تباعد المشط والانزياح الترددي بالكامل . لاحظ أن مشط QCL عادةً ما يكون له تباعد وضع قدره وهو أكثر ملاءمة للقياسات الطيفية للجزيئات الكبيرة. لذلك، على الرغم من أنه تم إثباته باستخدام مشط كهربائي بصري في هذا العمل، نتوقع أن يتم تحقيق نهجنا المعزز بالحجرة في PAS باستخدام مصادر مشط مستقرة بالكامل لتلبية الطلبات المختلفة.
في الختام، نقدم تقنية طيفية جديدة، التصوير الصوتي المعزز بالحجرة DCS، للكشف عن الجزيئات الحساسة للغاية، وعريضة النطاق، وعالية الدقة، وكشف الغازات النادرة. يظهر الرنان الصوتي عرض نطاق يتجاوز 5 كيلو هرتز، وهو أوسع بعشرات المرات من التقليدي و أضعاف أوسع من شوكة التوليف. مع كفاءة الربط
الشكل 5 توصيف أنواع مختلفة من الرنانات الصوتية.
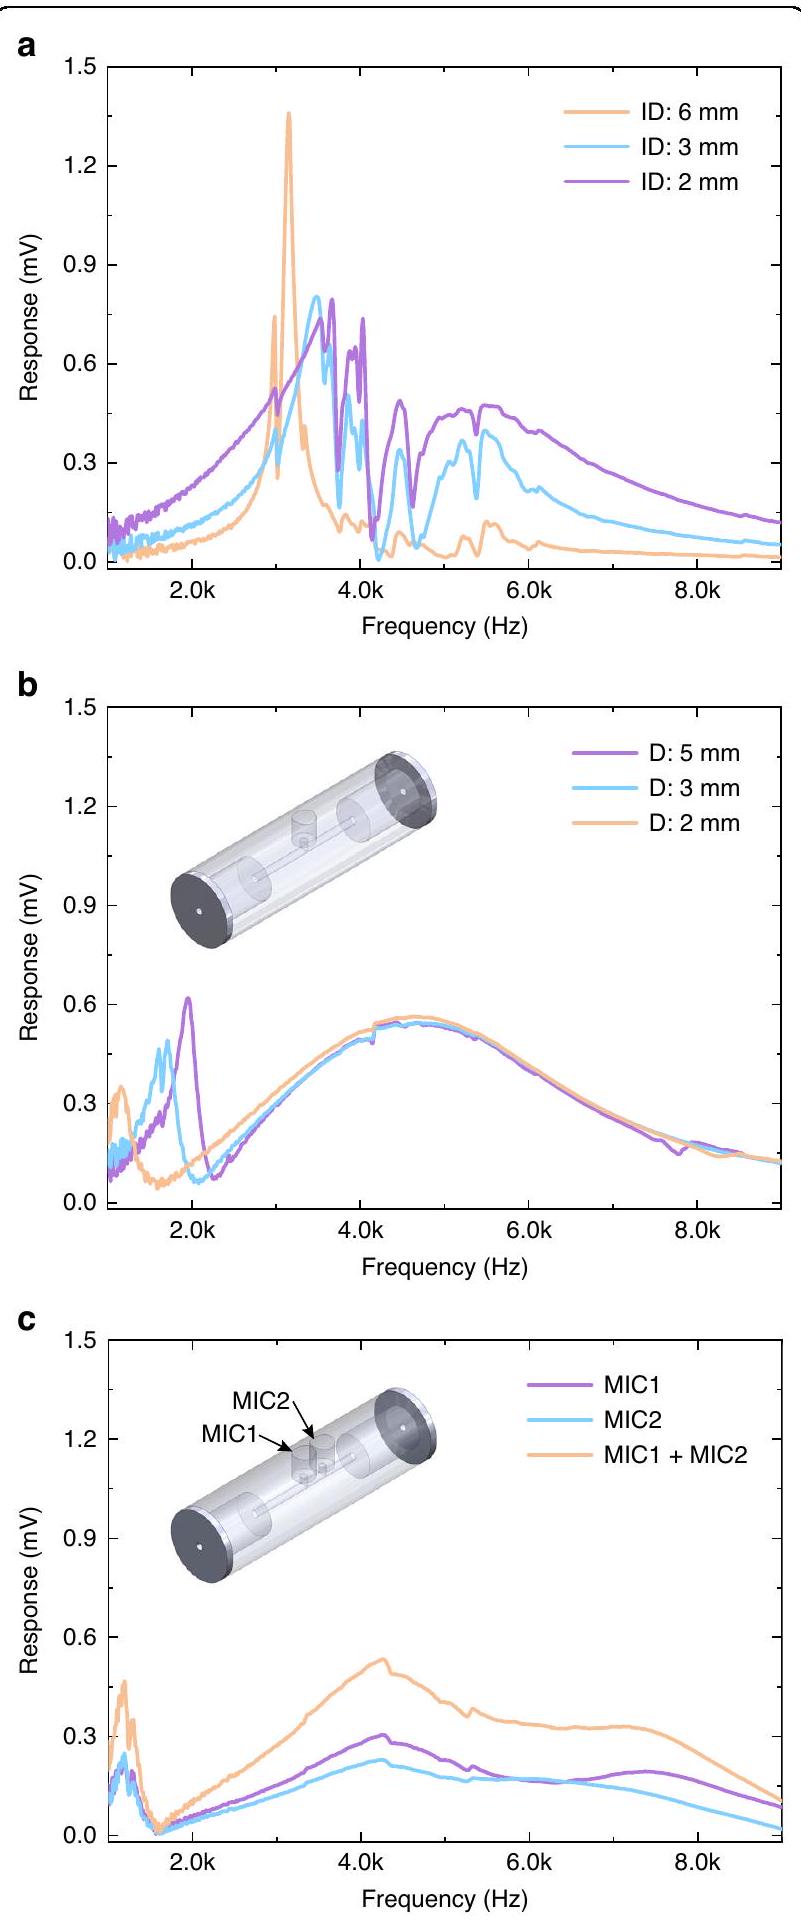
أ استجابات التردد للرنانات الصوتية التقليدية مع أقطار داخلية مختلفة (IDs). ب استجابات التردد للرنانات الصوتية التقليدية مع أغطية نهائية. يتم تثبيت قطر الرنان المركزي عند 2 مم، بينما يتنوع قطر (D) الثقوب المارة في الأغطية النهائية بين 2 و 5 مم. المقتطف: رسم ثلاثي الأبعاد للرنان الصوتي. ج استجابات التردد للرنان الصوتي من نوع الفلوت مع تكوينات مختلفة من الميكروفونات. المقتطف: رسم ثلاثي الأبعاد للرنان الصوتي
ما وراء ، تعزز الحجرة عالية الدقة الطاقة الضوئية لمئات من أزواج المشط في وقت واحد تقريبًا بثلاثة أوامر من حيث الحجم. بفضل الرنان الصوتي واسع النطاق والحجرة البصرية عالية الدقة، تمكن طريقتنا قياس DCS المعتمد على خط المشط لكميات ضئيلة من وCO في كامل نطاق C للاتصالات. مقارنةً بالنتائج الأخيرة للتصوير الصوتي وDCS الحراري الضوئي لـ ، قمنا بتحسين حساسية الكشف بشكل ملحوظ من ppm إلى مستوى فرعي من ppb. قد تمكن هذه الميزات الفريدة من DCS المعزز بالحجرة في التصوير الصوتي أداة تحليلية قوية للغاية للقياسات الطيفية واسعة النطاق، عالية الدقة وعالية الحساسية وتطبيقات استشعار الغاز.

المواد والطرق

مصدر المشط المزدوج

يتم تزويد المشط الكهربائي بواسطة ليزر ديود خارجي مستمر يبعث عند تردد ضوئي . يتم تقسيم ليزر البذور إلى فرعين، وكل منهما متصل بالتوازي مع AOM، مما يحول التردد البصري بمقدار 25 ميجاهرتز و25.0055 ميجاهرتز، على التوالي. وهذا يؤدي إلى تردد مركزي قدره 5.5 كيلو هرتز لملاحظات الضرب المتعددة. يتم توليد مشط التردد بواسطة تعديل الشدة باستخدام EOM، الذي يتم تشغيله بواسطة نبضات مدتها 50 بيكو ثانية بمعدلات تكرار قدرها 832.95250 ميجاهرتز و832.95253 ميجاهرتز، على التوالي. وبالتالي نحصل على تباعد ترددي قدره 30 هرتز لملاحظات الضرب المتعددة. بعد المرور عبر EDFAs، يتم إطلاق مشطي التردد في اتجاه مضاد إلى ألياف واحدة مع تعويض التشتت بطول 1 كم، وتشتت عادي مرتفع من ، وانحدار تشتت منخفض من لتوسيع الطيف. يتم خلط المشطين وتقسيمهما إلى شعاعين للكشف الصوتي الضوئي وتطبيع الطاقة، على التوالي.

تأثير عدم التطابق بين خط المشط ووضعية التجويف

تحدد دقة تجويف فابري-بروت المكون من مرآتين متطابقتين عاليتي الانعكاس بواسطة ، حيث هو الانعكاسية لمرآتي التجويف. من خلال قياس الانعكاسية باستخدام طريقة حلقة التجويف، فإن التجويف البصري المستخدم في هذا العمل له دقة قدرها 4078. بالنظر إلى طول التجويف البالغ 18 سم، يتم تحديد FSR ليكون ( ، حيث هو سرعة الضوء و هو طول التجويف). يمكن وصف وضعية التجويف بشكل خطي لورنتزي:
حيث و هما العرض الكامل عند نصف الحد الأقصى (FWHM) والانزياح الترددي بالنسبة لمركز خط وضعية التجويف، على التوالي. بالنسبة للتجويف البصري
المستخدم في هذا العمل، فإن FWHM لوضعية التجويف هو 204 كيلو هرتز عند الطول الموجي بالقرب من 1531 نانومتر. باختيار فرق تردد مركزي قدره 5.5 كيلو هرتز عبر AOMs وفرق تردد تكراري قدره 30 هرتز، فإن أكبر تردد بين ضربات المشط المتعددة هو 8.6 كيلو هرتز. بشرط أن يكون أحد قطارات مشط التردد في توافق تام مع وضعيات التجويف، فإن أقصى عدم تطابق ترددي بين نظير المشط المزدوج ووضعية التجويف هو 8.6 كيلو هرتز. ومن ثم، فإن هذا يتوافق مع تضعيف الشدة بمقدار فقط وفقًا للمعادلة (1).

تقييم طاقة المشط المزدوج داخل التجويف

يثبت مقارنة إشارة DCS ذات المرور الفردي والمُعززة بالتجويف في الشكل 2 تعزيزًا للطاقة بمقدار 924 مرة. الطاقة الواردة من مصدر المشط المزدوج هي 30 مللي واط، وإجمالي عدد أزواج خطوط المشط حوالي 213. ومن ثم، فإن الطاقة المتوسطة هي ( )/ لكل زوج من خطوط المشط. يؤدي التجويف البصري (دقة 4078 في الفراغ) نظريًا إلى تعزيز الطاقة داخل التجويف بمقدار 1299. بالنظر إلى تدهور الدقة الناتج عن 10 جزء في المليون ، يتم تقليل عامل تعزيز التجويف إلى 1016. ومن ثم، تشير مقارنة عامل التعزيز النظري والعامل التجريبي إلى كفاءة اقتران قدرها لضوء المشط المزدوج.

تقييم نسبة الإشارة إلى الضوضاء

تم اختيار أقوى خط امتصاص للنوع المستهدف لتقييم SNR للكشف عن الغاز الطيفي. في DCS الصوتي الضوئي المعزز بالتجويف لدينا، تقع الترددات الراديوية المقابلة لـ عند و6430 هرتز، على التوالي. يتم قياس الضوضاء بنفس الطريقة عن طريق ملء خلية الغاز بالغاز النقي .

الشكر والتقدير

تم دعم هذا البحث من قبل صندوق البحث العام (14209220، 14208221) وصندوق البحث التعاوني (C4002-22Y) من لجنة منح الجامعات، وصندوق الابتكار والتكنولوجيا (GHP/129/20SZ) من لجنة الابتكار والتكنولوجيا، منطقة هونغ كونغ الإدارية الخاصة، الصين؛ مؤسسة العلوم الطبيعية الوطنية الصينية (NSFC) (52122003، 62005267، 62375262). نود أن نشكر شركة بكين للتكنولوجيا شبه الموصلة المحدودة وشركة LaSense Technology Limited لتوفير كواشف ضوئية منخفضة الضوضاء والدارات الكهربائية. نشكر المناقشة المفيدة حول تصميم الرنانات الصوتية مع J. Wu في جامعة تشونغتشينغ. كما نشكر M. Hu من الأكاديمية الصينية للعلوم لمشاركته جهاز EOM.

تفاصيل المؤلف

قسم الهندسة الميكانيكية والأتمتة، الجامعة الصينية في هونغ كونغ، المناطق الجديدة، منطقة هونغ كونغ الإدارية الخاصة، الصين. المختبر الوطني الرئيسي للبصريات التطبيقية، معهد تشانغتشون للبصريات والميكانيكا الدقيقة والفيزياء، الأكاديمية الصينية للعلوم، 130033 تشانغتشون، الصين. CNR-INO-Istituto Nazionale di Ottica، وLENS-Laboratorio الأوروبي للطيف غير الخطي، 50019 سيستو فيورنتينو، إيطاليا

مساهمات المؤلف

Z.W. وW.R. وضعوا الفكرة، وصمموا التجارب، وناقشوا النتائج وأعدوا المخطوطة. Q.N. وH.S. وZ.W. بنوا الأنظمة و
أجروا التجارب. Q.W. ساعد في بناء مصدر مشط التردد. S.B. وP.D.N. ساعدوا في تقنية قفل PDH عالية الكفاءة. Q.N. أجرى تحليل البيانات. Z.W. وW.R. أشرفوا ونسقوا المشروع.

المصالح المتنافسة

يعلن المؤلفون عدم وجود مصالح متنافسة.
معلومات إضافية تحتوي النسخة الإلكترونية على مواد إضافية متاحة على https://doi.org/10.1038/s41377-023-01353-6.
تاريخ الاستلام: 1 أغسطس 2023 تاريخ المراجعة: 1 ديسمبر 2023 تاريخ القبول: 7 ديسمبر 2023
تم النشر عبر الإنترنت: 05 يناير 2024

References

  1. Lee, S. J. et al. Ultrahigh scanning speed optical coherence tomography using optical frequency comb generators. Jpn. J. Appl. Phys. 40, L878-L880 (2001).
  2. Keilmann, F., Gohle, C. & Holzwarth, R. Time-domain mid-infrared frequencycomb spectrometer. Opt. Lett. 29, 1542-1544 (2004).
  3. Schliesser, A. et al. Frequency-comb infrared spectrometer for rapid, remote chemical sensing. Opt. Express 13, 9029-9038 (2005).
  4. Yasui, T., Saneyoshi, E. & Araki, T. Asynchronous optical sampling terahertz time-domain spectroscopy for ultrahigh spectral resolution and rapid data acquisition. Appl. Phys. Lett. 87, 061101 (2005).
  5. Okubo, S. et al. Ultra-broadband dual-comb spectroscopy across 1.0-1.9 . Appl. Phys. Express 8, 082402 (2015).
  6. Ycas, G. et al. High-coherence mid-infrared dual-comb spectroscopy spanning 2.6 to . Nat. Photonics 12, 202-208 (2018).
  7. Muraviev, A. V. et al. Massively parallel sensing of trace molecules and their isotopologues with broadband subharmonic mid-infrared frequency combs. Nat. Photonics 12, 209-214 (2018).
  8. Ideguchi, T. et al. Coherent Raman spectro-imaging with laser frequency combs. Nature 502, 355-358 (2013).
  9. Dong, X. et al. Ultrafast time-stretch microscopy based on dual-comb asynchronous optical sampling. Opt. Lett. 43, 2118-2121 (2018).
  10. Baumann, E. et al. Spectroscopy of the methane band with an accurate midinfrared coherent dual-comb spectrometer. Phys. Rev. A 84, 062513 (2011).
  11. Zolot, A. M. et al. Broad-band frequency references in the near-infrared: accurate dual comb spectroscopy of methane and acetylene. J. Quant. Spectrosc. Radiat. Transf. 118, 26-39 (2013).
  12. Godbout, M., Deschênes, J. D. & Genest, J. Spectrally resolved laser ranging with frequency combs. Opt. Express 18, 15981-15989 (2010).
  13. Boudreau, S. et al. Chemical detection with hyperspectral lidar using dual frequency combs. Opt. Express 21, 7411-7418 (2013).
  14. Rieker, G. B. et al. Frequency-comb-based remote sensing of greenhouse gases over kilometer air paths. Optica 1, 290-298 (2014).
  15. Giorgetta, F. R. et al. Broadband phase spectroscopy over turbulent air paths. Phys. Rev. Lett. 115, 103901 (2015).
  16. Vicentini, E. et al. Dual-comb hyperspectral digital holography. Nat. Photonics 15, 890-894 (2021).
  17. Martín-Mateos, P., Khan, F. U. & Bonilla-Manrique, O. E. Direct hyperspectral dual-comb imaging. Optica 7, 199-202 (2020).
  18. Suh, M. G. et al. Microresonator soliton dual-comb spectroscopy. Science 354, 600-603 (2016).
  19. Villares, G. et al. Dual-comb spectroscopy based on quantum-cascade-laser frequency combs. Nat. Commun. 5, 5192 (2014).
  20. Ideguchi, T. et al. Kerr-lens mode-locked bidirectional dual-comb ring laser for broadband dual-comb spectroscopy. Optica 3, 748-753 (2016).
  21. Link, S. M. et al. Dual-comb spectroscopy of water vapor with a free-running semiconductor disk laser. Science 356, 1164-1168 (2017).
  22. Coddington, I., Newbury, N. & Swann, W. Dual-comb spectroscopy. Optica 3, 414-426 (2016).
  23. Wildi, T. et al. Photo-acoustic dual-frequency comb spectroscopy. Nat. Commun. 11, 4164 (2020).
  24. Friedlein, J. T. et al. Dual-comb photoacoustic spectroscopy. Nat. Commun. 11, 3152 (2020).
  25. Ren, X. Y. et al. Dual-comb optomechanical spectroscopy. Nat. Commun. 14, 5037 (2023).
  26. Wang, Q. et al. Dual-comb photothermal spectroscopy. Nat. Commun. 13, 2181 (2022).
  27. Wang, F. P. et al. Techniques to enhance the photoacoustic signal for trace gas sensing: a review. Sens. Actuators A: Phys. 345, 113807 (2022).
  28. Shi, J. et al. Hybrid optical parametrically-oscillating emitter at 1930 nm for volumetric photoacoustic imaging of water content. eLight 2, 6 (2022).
  29. Sadiek, I. et al. Optical frequency comb photoacoustic spectroscopy. Phys. Chem. Chem. Phys. 20, 27849-27855 (2018).
  30. Ren, X. Y. et al. Dual-comb quartz-enhanced photoacoustic spectroscopy. Photoacoustics 28, 100403 (2022).
  31. Bernhardt, B. et al. Cavity-enhanced dual-comb spectroscopy. Nat. Photonics 4, 55-57 (2010).
  32. Fleisher, A. J. et al. Coherent cavity-enhanced dual-comb spectroscopy. Opt. Express 24, 10424-10434 (2016).
  33. Hoghooghi, N. et al. Broadband coherent cavity-enhanced dual-comb spectroscopy. Optica 6, 28-33 (2019).
  34. Zhang, W. P. et al. Adaptive cavity-enhanced dual-comb spectroscopy. Photonics Res. 7, 883-889 (2019).
  35. Millot, G. et al. Frequency-agile dual-comb spectroscopy. Nat. Photonics 10, 27-30 (2016).
  36. Black, E. D. An introduction to Pound-Drever-Hall laser frequency stabilization. Am. J. Phys. 69, 79-87 (2001).
  37. Yin, X. K. et al. Ppb-level detection for decomposition based on a fiberamplified telecommunication diode laser and a background-gas-induced high-Q photoacoustic cell. Appl. Phys. Lett. 111, 031109 (2017).
  38. Lang, Z. T. et al. Fabry-Perot-based phase demodulation of heterodyne lightinduced thermoelastic spectroscopy. Light. Adv. Manuf. 4, 2689-9620 (2023).
  39. Gordon, I. E. et al. The HITRAN2016 molecular spectroscopic database. J. Quant. Spectrosc. Radiat. Transf. 203, 3-69 (2017).
  40. Wang, Z. et al. Ultrasensitive photoacoustic detection in a high-finesse cavity with Pound-Drever-Hall locking. Opt. Lett. 44, 1924-1927 (2019).
  41. Borri, S. et al. Intracavity quartz-enhanced photoacoustic sensor. Appl. Phys. Lett. 104, 091114 (2014).
  42. Wu, H. P. et al. Beat frequency quartz-enhanced photoacoustic spectroscopy for fast and calibration-free continuous trace-gas monitoring. Nat. Commun. 8, 15331 (2017).
  43. El-Busaidy, S. A. S. et al. Modelling of open photoacoustic resonators. Photoacoustics 18, 100161 (2020).
  44. Lee, H. et al. Chiral exceptional point and coherent suppression of backscattering in silicon microring with low loss Mie scatterer. eLight 3, 20 (2023).
  45. Yan, M. et al. Mid-infrared dual-comb spectroscopy with electro-optic modulators. Light Sci. Appl. 6, e17076 (2017).
  46. Griffith, A. G. et al. Silicon-chip mid-infrared frequency comb generation. Nat. Commun. 6, 6299 (2015).
  47. Guo, H. R. et al. Mid-infrared frequency comb via coherent dispersive wave generation in silicon nitride nanophotonic waveguides. Nat. Photonics 12, 330-335 (2018).
  48. Schwarz, B. et al. Monolithic frequency comb platform based on interband cascade lasers and detectors. Optica 6, 890-895 (2019).
  49. Adler, F. et al. Phase-stabilized, 1.5 W frequency comb at . Opt. Lett. 34, 1330-1332 (2009).
  50. Jouy, P. et al. Dual comb operation of quantum cascade laser frequency comb with 1 W optical power. Appl. Phys. Lett. 111, 141102 (2017).
  51. Consolino, L. et al. Fully phase-stabilized quantum cascade laser frequency comb. Nat. Commun. 10, 2938 (2019).

  1. Correspondence: Zhen Wang (wangzhen@link.cuhk.edu.hk) or Qiang Wang (wangqiang@ciomp.ac.cn) or Wei Ren (renwei@mae.cuhk.edu.hk) Department of Mechanical and Automation Engineering, The Chinese University of Hong Kong, New Territories, Hong Kong SAR, China
    State Key Laboratory of Applied Optics, Changchun Institute of Optics, Fine Mechanics and Physics, Chinese Academy of Sciences, 130033 Changchun, China
    Full list of author information is available at the end of the article These authors contributed equally: Zhen Wang, Qinxue Nie

Journal: Light Science & Applications, Volume: 13, Issue: 1
DOI: https://doi.org/10.1038/s41377-023-01353-6
PMID: https://pubmed.ncbi.nlm.nih.gov/38177145
Publication Date: 2024-01-05

Cavity-enhanced photoacoustic dual-comb spectroscopy

Zhen Wang , Qinxue Nie , Haojia Sun , Qiang Wang , Simone Borri , Paolo De Natale and Wei Ren

Abstract

Photoacoustic dual-comb spectroscopy (DCS), converting spectral information in the optical frequency domain to the audio frequency domain via multi-heterodyne beating, enables background-free spectral measurements with high resolution and broad bandwidth. However, the detection sensitivity remains limited due to the low power of individual comb lines and the lack of broadband acoustic resonators. Here, we develop cavity-enhanced photoacoustic DCS, which overcomes these limitations by using a high-finesse optical cavity for the power amplification of dual-frequency combs and a broadband acoustic resonator with a flat-top frequency response. We demonstrate high-resolution spectroscopic measurements of trace amounts of and CO in the entire telecommunications C-band. The method shows a minimum detection limit of at the measurement time of 100 s , corresponding to the noise equivalent absorption coefficient of . The proposed cavityenhanced photoacoustic DCS may open new avenues for ultrasensitive, high-resolution, and multi-species gas detection with widespread applications.

Introduction

Since its first demonstrations two decades ago , dualcomb spectroscopy (DCS) has evolved into a powerful tool in many fields such as spectroscopy and microscopy , precision metrology , spectral lidar , environmental monitoring , and advanced hyperspectral holography and imaging . Particularly, DCS plays an important role in modern high-precision and broadband molecular spectroscopy, which performs Fourier transform spectroscopy rapidly without using any moving parts. In this setup, one frequency comb passes through a gas sample to be analyzed and beats on a photodetector with a second phase-locked comb with a slightly different repetition rate. The multiheterodyne beats between pairs
of comb lines generate an interferometric signal, which is accessible by radio-frequency (RF) electronics and Fourier-transformed to reveal the sample’s spectrum. DCS can fully capitalize on the frequency resolution and accuracy, broad bandwidth, and high repetition rate of different types of comb sources for high-speed, ultrahighresolution and broadband spectroscopy .
Conventional is implemented by measuring the transmitted comb light intensity precisely using a fast photodetector. The absorption spectrum needs to be extracted from the large background signal, which is not a trivial task especially for weak absorbance. Compared to direct absorption measurements, DCS can also be performed by taking advantage of other spectroscopic techniques such as photoacoustic and photothermal detection . These indirect absorption measurements enable the background-free detection of molecular spectra, where only the comb lines absorbed by the gas medium can generate the photoacoustic/thermal multiheterodyne beatnotes.
For instance, photoacoustic spectroscopy (PAS), which has been widely used in gas sensing and imaging ,
normally uses a microphone to detect acoustic waves, which are generated by the non-radiative collisional relaxation of the excited molecules after absorbing the modulated light. Sadiek et al. reported the first PAS using a frequency comb and implemented a Fourier transform spectrometer (FTS) to modulate the intensity of the frequency comb . To eliminate the mechanical parts in FTS, photoacoustic DCS has been recently demonstrated for measuring gaseous acetylene and polymer films . In these proof-of-concept experiments, the detection sensitivity still needs to be improved, i.e., a minimum detection limit (MDL) of 10 ppm was achieved for detection at a recording time of . By replacing the microphone with a quartz tuning fork (QTF) that has a high Q-factor, the QTF-based photoacoustic DCS was developed to improve the MDL to 8.3 ppb . Nevertheless, the generated RF comb lines have to lie within the extremely narrow resonance bandwidth (several Hz) of the QTF, significantly limiting the detection bandwidth. Therefore, the capability of achieving the simultaneous high sensitivity and broad bandwidth for photoacoustic DCS has been hindered by lacking highpower comb light for exciting the photoacoustic effect and broadband acoustic resonators for amplifying all the generated acoustic waves effectively.
In this study, we introduce cavity-enhanced photoacoustic DCS for ultrasensitive, broadband, and highresolution spectroscopic detection, by combining two cutting-edge technologies to overcome the aforementioned shortcomings. First, employing a flute-type acoustic resonator, we realize sensitive photoacoustic detection with a bandwidth of more than 5 kHz in the audio frequency range of . Second, injecting the two trains of frequency combs simultaneously into a high-finesse optical cavity enables the intracavity power build-up by several orders of magnitude. This leverages the broad detection bandwidth of the novel acoustic resonator and the remarkable comb power enhancement afforded by the optical cavity. In the experiment, we demonstrate the high-resolution cavityenhanced photoacoustic DCS of multiple gas-phase species including and CO in the entire telecommunications C -band with an ultra-high sensitivity among the state-of-the-art frequency comb spectroscopy.

Results

Concept

The working principle of cavity-enhanced photoacoustic DCS is illustrated in Fig. 1a. Different from the dual-comb absorption measurement in an optical cavity , cavity-enhanced photoacoustic DCS requires the two combs to be coupled into a cavity simultaneously to enable the generation of intracavity dual-comb multiheterodyne beatnotes. Provided both combs enter the
cavity effectively for power enhancement, the multiheterodyne beating between each comb-line pair causes an amplitude modulation of the cavity-enhanced comb line. After absorption by the target molecules, this leads to the excitation of hundreds or thousands of acoustic waves with evenly spaced frequencies, determined by the repetition rate difference ( ) and central frequency shifts ( ) between the two phase-coherent combs . Ideally, a broadband and open-ended acoustic resonator, which is situated inside the optical cavity, further amplifies all the acoustic waves for more sensitive detection.

Setup

The schematic of the experimental setup is shown in Fig. 1b. Here an electro-optic dual-comb source is used for demonstration purposes considering its flexible tuning of repetition rate ( ) and optical carrier frequency . More details of the dual-comb source are provided in Methods. The two trains of frequency combs generated from the same continuous wave (CW) seed laser share the same (not constant) carrier frequency. For one train of the frequency combs with the repetition rate , locking the seed laser ( ) to the Fabry-Pérot cavity enclosed in a gas cell enables the overlap between the central comb line and one cavity mode, which can be conducted using the Pound-DreverHall (PDH) technique . The other comb lines are coupled into the cavity by tuning so that it perfectly matches the free spectral range (FSR, ) of the optical cavity. To obtain a temporally invariant FSR, a stable narrow-linewidth CW laser ( 1531.58 nm ) shown in Fig. 1b is employed as an optical intermedium to stabilize the cavity length by locking the cavity mode to an absorption line of (Supplementary Note 1). As a result, all the comb lines with repetition rate are arranged in perfect resonance with the cavity modes, whereas the counterpart of the dual-comb source with a slight difference in the repetition rate ( , where ) can enter the cavity automatically. We estimate a negligible difference ( ) in the relative intensity attenuation for the two comb lines coupled into the same cavity mode (Methods). Additionally, we eliminated the possible interference between the three locking loops by using an orthogonal polarization arrangement for the comb light and CW lasers and carefully selecting modulation frequencies for the three EOMs used for PDH locking purposes (Supplementary Note 1).
A broadband acoustic detector serves as a key element in photoacoustic DCS. Inspired by the flute instrument, we designed a broadband acoustic resonator to amplify many acoustic waves with distinct frequencies. As shown in Fig. 1b, it includes a longitudinal acoustic resonator (length: 35 mm ; inner diameter: 2 mm ) in the center,
Fig. 1 Cavity-enhanced photoacoustic dual-comb spectroscopy. a Concept of the cavity-enhanced photoacoustic DCS approach. The dualfrequency combs are coupled into an optical cavity for power enhancement when all the comb lines exhibit a perfect match with the cavity modes. After absorption by the target gas molecules, the multi-heterodyne of the intracavity dual-combs generates multiple acoustic waves with the frequencies determined by the difference of repetition rates ( ) and central frequency shifts ( ). A flute-type acoustic resonator with a broadband frequency response is designed to amplify the generated photoacoustic waves. b Schematic of the experimental setup. The electro-optic dual-comb source employs a CW seed laser at optical frequency , which is divided into two branches and connected in parallel with pairs of acousto-optic modulators (AOMs) to control the central frequency shifts ( and ) and electro-optic modulators (EOMs) to control the repetition rates and . The generated optical pulses are then amplified by two Erbium-doped fiber amplifiers (EDFAs) and counter-launched into a nonlinear dispersion compensated fiber (DCF). A photodetector (PD) is used with the dual-comb source to monitor the multiheterodyne reference spectrum. Three Pound-Drever-Hall (PDH) locking loops are used to match the comb lines with the cavity modes: the AOM-shifted seed laser is phase-modulated by EOM1 ( 19 MHz ) to stabilize the carrier frequency ( ) with respect to the Fabry-Pérot cavity; a narrow-linewidth laser (NLL) is phase-modulated by EOM2 ( 13 MHz ) to lock with the optical cavity and by EOM3 ( 99 MHz ) to lock with an absorption line of at 10 Torr , respectively. The two CW lasers are arranged in orthogonal polarization with the dual-comb light to avoid optical crosstalk, and combined via a polarization beam splitter (PBS) before entering the optical cavity. The broadband acoustic resonator is situated inside the optical cavity for acoustic wave amplification and two microphones (MICs) are used to detect the acoustic waves. c Characterized frequency response of the broadband acoustic resonator. The resonator shows a 3-dB bandwidth (BW ) of 5088 Hz
connected with two buffering volumes (length: 17.5 mm ; inner diameter: 12 mm ). Two end-caps are used to cover the buffering volumes, and a central through hole (diameter: 2 mm ) is made in each cap for optical access. For acoustic wave detection, two microphones are installed in the central acoustic resonator and the superimposed electrical signals are added by a low-noise summing circuit. Finally, the microphone output is digitized and Fourier-transformed to obtain the photoacoustic spectrum. It should be noted that all the signal generators and the data-acquisition card are synchronized to a rubidium clock to maintain long-term locking and measurement stability.
The frequency response of the broadband acoustic resonator was characterized by measuring the photoacoustic signal of using a CW laser at varied intensity modulation frequencies (Supplementary Note 2). As shown in Fig. 1c, our acoustic resonator shows an excellent flat-top frequency response with a bandwidth ( 3 dB ) of 5088 Hz in the frequency range of . This is tens of times broader than the traditional longitudinal acoustic resonator , and over three orders of magnitude larger than the . As discussed later, such a broadband response benefits from the merging of higher-order acoustic modes inside the acoustic resonator.
Fig. 2 Comparison of photoacoustic dual-comb spectra obtained with and without an optical cavity. a Representative cavity-enhanced photoacoustic DCS signal of 10 ppm (top panel) and the corresponding incident intensity of the dual-comb (bottom panel). b Representative single-pass photoacoustic DCS signal of 5000 ppm (top panel) and the corresponding incident intensity of the dual-comb (bottom panel). The measurements are averaged over 60 s . The acoustic frequency scale ( kHz ) is converted to the optical domain based on the frequency compression factor and the carrier frequency . A strong absorption line of at 195.895 THz and a weak line at 195.818 THz are observed in this frequency range
By filling in the gas cell at the atmospheric pressure ( 760 Torr ), the representative cavity-enhanced photoacoustic DCS signal is illustrated in the top panel of Fig. 2a. The strong spectral profile at 5 kHz in the acoustic frequency domain corresponds to the line of at 195.895 THz in the optical domain. In contrast, we also conducted the single-pass measurement by using the same dual-comb source and acoustic resonator, but removing the optical resonator from the setup. Note that a much higher concentration ( 5000 ppm ) of was required to achieve a similar signal level in Fig. 2b. The dual-comb reference spectra plotted in the two bottom panels were recorded when measuring the single-pass signal and the cavityenhanced signal, respectively; they show similar profiles in these two measurements. By taking into account the difference in the photoacoustic signal amplitude and gas concentration, the use of such a high-finesse cavity significantly enhances the dual-comb signal by a factor of 924. We estimate an average intracavity comb power of 130 mW for each pair of comb lines (Methods).

Broadband multi-species measurement

Over the telecommunications C-band (1527.3-1569.7 nm), we conducted cavity-enhanced photoacoustic DCS measurements of ppm and at the pressure of 760 Torr, respectively. The measurement was recorded with a data sampling rate of and FFT resolution of 1 Hz . The photoacoustic spectrum was averaged over 60 s to improve the signal-to-noise ratio (SNR), followed by the amplitude normalization by the non-uniform comb-
power envelope, the variation of cavity finesse over the wide spectral range, and the frequency response of the acoustic resonator (Supplementary Note 3). Figure 3 shows the entire wide spectra by stitching 41 photoacoustic spectra of photoacoustic spectra of and 21 photoacoustic spectra of CO mixtures measured with an SNR (Methods) of 5952, 8621 and 347, respectively. All the measurements are in good agreement with the simulated absorption spectra using the HITRAN database . In particular, the inset graph demonstrates several very weak lines of with absorption coefficients around . The polyatomic molecule features a complex infrared spectrum with many blended lines, which are well resolved by our spectrometer as shown in the inset graph. Note that the overtone spectrum of CO in this wavelength range has a very small line-strength (mostly below molecules )), which is orders of magnitude smaller than and .

Linear response and detection limit

The strongest absorption line of each species was selected to investigate the gas sensing performance. Here we studied the line of at 195.895 THz with a line-strength of molecules ). Note that the cavity finesse may degrade due to the stronger absorption at a much higher gas concentration, thus affecting the linear response of cavityenhanced gas sensors . With this factor taken into account, Fig. 4a plots the amplitude of the photoacoustic signal as a function of gas concentration for
Fig. 3 Broadband molecular spectra of multiple species. Cavity-enhanced photoacoustic DCS of and is measured over the telecommunications C-band at the atmospheric pressure ( 760 Torr ). The spectral simulation based on the HITRAN database is also plotted for comparison. Insets: weak signatures of and resolved by the cavity-enhanced photoacoustic dual-comb system
Fig. 4 Experimental results for linear response and detection limit. a Variation of the photoacoustic amplitude with concentration. The system shows a good linear response with an value of 0.9976 , after normalization, the linearity can be better with a higher value of 0.9984 . The vertical error bars (1-o standard deviation) are calculated from the raw data, taken in a time interval of 60 s . b Allan-Werle deviation analysis of detection. The measurement was conducted by recording the system response of pure for one hour with all locking loops turned on
mixtures, showing a good linear response ( ). The vertical error bar ( standard deviation) is calculated from the variation of the peak amplitude acquired over a time period of 60 s . The Allan-Werle deviation analysis is conducted to evaluate the long-term stability and detection limit by measuring zero gas (here for one hour. The photoacoustic signal and the noise are evaluated at the dual-comb power of 30 mW and the same acoustic frequency of 5290 Hz which corresponds to the absorption peak of at 195.895 THz (Methods). As illustrated in Fig. 4b, our sensor demonstrates a minimum detection limit (MDL) of 0.6 ppb for at the averaging time of 100 s , corresponding to the noise equivalent absorption (NEA) coefficient of . We also studied the blended lines of at 195.731 THz with a line-strength of molecules ) and the line of CO at 191.190 THz with a line-strength of molecules . The results are provided in Supplementary Note 4.

Discussion

The flute-type acoustic resonator plays a significant role in cavity-enhanced photoacoustic DCS for broadband acoustic detection. Here we briefly discuss the parameters affecting its frequency response; the detailed structure of the acoustic resonator is provided in Supplementary Note 2. Figure 5a illustrates the different frequency responses of an openended longitudinal resonator with varied inner diameters. The resonator with an inner diameter of 2 mm excites more high-frequency acoustic modes. Two end caps are then added to cover the buffering volumes with a diameter of 12 mm ; a central hole is made for optical access. As shown in Fig. 5b, it leads to a smooth and broadband frequency response. The configuration with a smaller hole diameter) in the cap contributes to a broader frequency response ( 4108 Hz in bandwidth). Finally, compared to the single microphone installed at the central position shown in Fig. 5a and b, we drilled another hole nearby ( 6.5 mm away) for the installation of the second microphone. The generated electrical signals by the two microphones are summed by a low-noise circuit with the results plotted in Fig. 5c, showing a flat-top response with an increased bandwidth of 5088 Hz . The traditional photoacoustic resonator is characterized by a Q-factor of 38 and bandwidth of 150 Hz . Such a narrow bandwidth makes it unsuitable for amplifying multiple acoustic waves. In comparison, our resonator has a bandwidth of 5088 Hz , which is about 34 times larger. By targeting a broader flat-top frequency response with a larger signal amplitude, it is possible to further optimize the geometry of the acoustic resonator using finite element analy . It is also interesting to explore acoustic resonators with bandwidths located at higher frequencies to reduce the noise.
Our platform proves the feasibility of significantly enhancing the comb power by coupling both frequency combs into a high-finesse optical cavity. The successful implementation relies on the one-to-one matching between the comb line and the cavity mode, enabled by the precise control of the comb’s two degrees of freedom and and the cavity length. The average optical power of each comb pair inside the cavity amounts to 130 mW in this work, which can be further enhanced by using a higher-finesse cavity or a high Q-factor microring resonator . As the simultaneous injection of dual combs into the cavity is needed for intracavity multi-heterodyne beating, the sharper resonance of the higher-finesse cavity may cause certain intensity attenuation for the comb line that is slightly off the cavity resonance. By applying an optical cavity with ten times larger finesse (40780) but reducing the cavity length from 18 cm to 6 cm , the FSR triples to 2.5 GHz and the cavity mode width reduces to 61 kHz . This will only cause a slight attenuation of (< 7%) of the comb intensity for the comb line index beyond 200 (Methods).
Additionally, trace gas detection favors spectral measurements in the mid-infrared region. As mid-infrared dual-combs can be generated using the difference frequency generation (DFG) of a near-infrared electro-optic comb , we can readily extend the method proposed in the current study to mid-infrared gas sensing applications. Although other types of mid-infrared frequency combs have been recently invented , one may devote to achieving the spectral overlap between the comb lines and cavity modes considering the different mechanisms of controlling the comb parameters. For instance, the midinfrared combs generated by the DFG process need extra mechanisms to match with the optical cavity. Another type of mid-infrared combs created in synchronously pumped optical parametric oscillators (OPOs) requires additional electronics to stabilize the repetition rate difference and carrier-envelope offset. For quantum-cascade-laser (QCL) frequency combs , injection locking and phase locking loops are needed to fully stabilize the comb spacing and frequency offset . Note that QCL combs normally have a mode spacing of which are more suitable for spectral measurements of large molecules. Hence, although demonstrated using electrooptic combs in this work, we expect our cavity-enhanced PAS approach can be realized using other fully stabilized comb sources to meet different demands.
In conclusion, we present a novel spectroscopic technique, cavity-enhanced photoacoustic DCS, for ultrasensitive, broadband, and high-resolution molecular spectroscopy and trace gas detection. The acoustic resonator shows a bandwidth beyond 5 kHz which is tens of times broader than the traditional one and times broader than the tuning fork. With a coupling efficiency
Fig. 5 Characterization of different types of acoustic resonators.
a Frequency responses of the traditional acoustic resonators with different inner diameters (IDs). b Frequency responses of the traditional acoustic resonators with end caps. The ID of the central resonator is fixed at 2 mm , while the diameter (D) of the through holes in the end caps is varied between 2 and 5 mm . Inset: 3D drawing of the acoustic resonator. c Frequency responses of the flutetype acoustic resonator with different configurations of microphones. Inset: 3D drawing of the acoustic resonator
beyond , the high-finesse cavity enhances the optical power of hundreds of comb pairs simultaneously by nearly three orders of magnitude. Benefiting from the broadband acoustic resonator and high-finesse optical cavity, our method enables the comb-line-resolved DCS measurement of trace amounts of and CO in the entire telecommunications C -band. Compared to the recent results of photoacoustic and photothermal DCS of , we have improved the detection sensitivity remarkably from ppm to sub-ppb level. These unique features of our cavity-enhanced photoacoustic DCS may enable a highly powerful analytical tool for broadband, high-precision and high-sensitivity spectroscopic measurements and gas sensing applications.

Materials and methods

Dual-comb source

The electro-optic comb is seeded by a CW external cavity diode laser emitting at optical frequency . The seed laser is divided into two branches and each is connected in parallel to an AOM shifting the optical frequency by 25 MHz and 25.0055 MHz , respectively. This leads to a center frequency of 5.5 kHz for the multiheterodyne beatnotes. The frequency comb is generated by intensity modulation using an EOM, which is driven by 50-ps pulses at the repetition rates of 832.95250 MHz and 832.95253 MHz , respectively. Thus we obtain a frequency spacing of 30 Hz for the multiheterodyne beats. After passing through EDFAs, the two frequency combs are counter-launched into a single dispersion compensated fiber with a length of 1 km , a high normal dispersion of , and a low dispersion slope of for spectral broadening. The two combs are mixed and split into two beams for photoacoustic detection and power normalization, respectively.

Influence of the mismatch between the comb line and cavity mode

The finesse of a Fabry-Pérot cavity consisting of two identical high-reflectivity mirrors is determined by , where is the reflectivity of the cavity mirrors. By measuring the reflectivity using the cavity-ring down method, the optical cavity used in this work has a finesse of 4078. Considering the cavity length of 18 cm , the FSR is determined to be ( , where is the speed of light and is the cavity length). The cavity mode can be described by a Lorentzian lineshape:
where and are the full width at half maximum (FWHM) and the frequency shift relative to the linecenter of the cavity mode, respectively. For the optical
cavity used in this work, the FWHM of the cavity mode is 204 kHz at the wavelength near 1531 nm . Selecting a center frequency difference of 5.5 kHz via AOMs and a repetition frequency difference of 30 Hz , the largest frequency among the dual-comb multiheterodyne beats is 8.6 kHz . Provided that one train of frequency combs is in perfect resonance with the cavity modes, the maximum frequency mismatch between the counterpart of the dualcomb and the cavity mode is 8.6 kHz . Hence, this corresponds to the intensity attenuation of only according to Eq. (1).

Evaluation of intracavity dual-comb power

The comparison of the single-pass and cavity-enhanced DCS signal in Fig. 2 proves a power enhancement of 924 times. The incident power of the dual-comb source is 30 mW and the total number of comb line pair is about 213. Hence, the average power is ( )/ for each pair of comb lines. The optical cavity (finesse 4078 in vacuum) theoretically leads to an intracavity power enhancement by a factor of 1299 . Considering the finesse degradation induced by 10 ppm , the cavity enhancement factor is reduced to 1016. Hence, the comparison of the theoretical enhancement factor and the experimental one indicates a coupling efficiency of for the dual-comb light.

Signal-to-noise ratio evaluation

The strongest absorption line of the target species is selected for evaluating the SNR of the spectroscopic gas detection. In our cavity-enhanced photoacoustic DCS, the corresponding radio frequencies for are located at and 6430 Hz , respectively. The noise is measured in the same way by filling the gas cell with pure .

Acknowledgements

This research was supported by the General Research Fund (14209220, 14208221) and Collaborative Research Fund (C4002-22Y) from the University Grants Committee, Innovation and Technology Fund (GHP/129/20SZ) from the Innovation and Technology Commission, Hong Kong SAR, China; National Natural Science Foundation of China (NSFC) (52122003, 62005267, 62375262). We would like to acknowledge Beijing Infrared Semiconductor Technology Co. LTD and LaSense Technology Limited for providing low-noise photodetectors and electrical circuits. We acknowledge the helpful discussion on the design of acoustic resonators with J. Wu at Chongqing University. We also acknowledge M. Hu from the Chinese Academy of Sciences for sharing the EOM device.

Author details

Department of Mechanical and Automation Engineering, The Chinese University of Hong Kong, New Territories, Hong Kong SAR, China. State Key Laboratory of Applied Optics, Changchun Institute of Optics, Fine Mechanics and Physics, Chinese Academy of Sciences, 130033 Changchun, China. CNR-INO-Istituto Nazionale di Ottica, and LENS-European Laboratory for Nonlinear Spectroscopy, 50019 Sesto Fiorentino, Italy

Author contributions

Z.W. and W.R. conceived the idea, designed the experiments, discussed the results and prepared the manuscript. Q.N., H.S., and Z.W. built the systems and
conducted the experiments. Q.W. assisted in building the frequency comb source. S.B. and P.D.N. assisted in the high-efficiency PDH locking technique. Q.N. conducted the data analysis. Z.W. and W.R. supervised and coordinated the project.

Competing interests

The authors declare no competing interests.
Supplementary information The online version contains supplementary material available at https://doi.org/10.1038/s41377-023-01353-6.
Received: 1 August 2023 Revised: 1 December 2023 Accepted: 7 December 2023
Published online: 05 January 2024

References

  1. Lee, S. J. et al. Ultrahigh scanning speed optical coherence tomography using optical frequency comb generators. Jpn. J. Appl. Phys. 40, L878-L880 (2001).
  2. Keilmann, F., Gohle, C. & Holzwarth, R. Time-domain mid-infrared frequencycomb spectrometer. Opt. Lett. 29, 1542-1544 (2004).
  3. Schliesser, A. et al. Frequency-comb infrared spectrometer for rapid, remote chemical sensing. Opt. Express 13, 9029-9038 (2005).
  4. Yasui, T., Saneyoshi, E. & Araki, T. Asynchronous optical sampling terahertz time-domain spectroscopy for ultrahigh spectral resolution and rapid data acquisition. Appl. Phys. Lett. 87, 061101 (2005).
  5. Okubo, S. et al. Ultra-broadband dual-comb spectroscopy across 1.0-1.9 . Appl. Phys. Express 8, 082402 (2015).
  6. Ycas, G. et al. High-coherence mid-infrared dual-comb spectroscopy spanning 2.6 to . Nat. Photonics 12, 202-208 (2018).
  7. Muraviev, A. V. et al. Massively parallel sensing of trace molecules and their isotopologues with broadband subharmonic mid-infrared frequency combs. Nat. Photonics 12, 209-214 (2018).
  8. Ideguchi, T. et al. Coherent Raman spectro-imaging with laser frequency combs. Nature 502, 355-358 (2013).
  9. Dong, X. et al. Ultrafast time-stretch microscopy based on dual-comb asynchronous optical sampling. Opt. Lett. 43, 2118-2121 (2018).
  10. Baumann, E. et al. Spectroscopy of the methane band with an accurate midinfrared coherent dual-comb spectrometer. Phys. Rev. A 84, 062513 (2011).
  11. Zolot, A. M. et al. Broad-band frequency references in the near-infrared: accurate dual comb spectroscopy of methane and acetylene. J. Quant. Spectrosc. Radiat. Transf. 118, 26-39 (2013).
  12. Godbout, M., Deschênes, J. D. & Genest, J. Spectrally resolved laser ranging with frequency combs. Opt. Express 18, 15981-15989 (2010).
  13. Boudreau, S. et al. Chemical detection with hyperspectral lidar using dual frequency combs. Opt. Express 21, 7411-7418 (2013).
  14. Rieker, G. B. et al. Frequency-comb-based remote sensing of greenhouse gases over kilometer air paths. Optica 1, 290-298 (2014).
  15. Giorgetta, F. R. et al. Broadband phase spectroscopy over turbulent air paths. Phys. Rev. Lett. 115, 103901 (2015).
  16. Vicentini, E. et al. Dual-comb hyperspectral digital holography. Nat. Photonics 15, 890-894 (2021).
  17. Martín-Mateos, P., Khan, F. U. & Bonilla-Manrique, O. E. Direct hyperspectral dual-comb imaging. Optica 7, 199-202 (2020).
  18. Suh, M. G. et al. Microresonator soliton dual-comb spectroscopy. Science 354, 600-603 (2016).
  19. Villares, G. et al. Dual-comb spectroscopy based on quantum-cascade-laser frequency combs. Nat. Commun. 5, 5192 (2014).
  20. Ideguchi, T. et al. Kerr-lens mode-locked bidirectional dual-comb ring laser for broadband dual-comb spectroscopy. Optica 3, 748-753 (2016).
  21. Link, S. M. et al. Dual-comb spectroscopy of water vapor with a free-running semiconductor disk laser. Science 356, 1164-1168 (2017).
  22. Coddington, I., Newbury, N. & Swann, W. Dual-comb spectroscopy. Optica 3, 414-426 (2016).
  23. Wildi, T. et al. Photo-acoustic dual-frequency comb spectroscopy. Nat. Commun. 11, 4164 (2020).
  24. Friedlein, J. T. et al. Dual-comb photoacoustic spectroscopy. Nat. Commun. 11, 3152 (2020).
  25. Ren, X. Y. et al. Dual-comb optomechanical spectroscopy. Nat. Commun. 14, 5037 (2023).
  26. Wang, Q. et al. Dual-comb photothermal spectroscopy. Nat. Commun. 13, 2181 (2022).
  27. Wang, F. P. et al. Techniques to enhance the photoacoustic signal for trace gas sensing: a review. Sens. Actuators A: Phys. 345, 113807 (2022).
  28. Shi, J. et al. Hybrid optical parametrically-oscillating emitter at 1930 nm for volumetric photoacoustic imaging of water content. eLight 2, 6 (2022).
  29. Sadiek, I. et al. Optical frequency comb photoacoustic spectroscopy. Phys. Chem. Chem. Phys. 20, 27849-27855 (2018).
  30. Ren, X. Y. et al. Dual-comb quartz-enhanced photoacoustic spectroscopy. Photoacoustics 28, 100403 (2022).
  31. Bernhardt, B. et al. Cavity-enhanced dual-comb spectroscopy. Nat. Photonics 4, 55-57 (2010).
  32. Fleisher, A. J. et al. Coherent cavity-enhanced dual-comb spectroscopy. Opt. Express 24, 10424-10434 (2016).
  33. Hoghooghi, N. et al. Broadband coherent cavity-enhanced dual-comb spectroscopy. Optica 6, 28-33 (2019).
  34. Zhang, W. P. et al. Adaptive cavity-enhanced dual-comb spectroscopy. Photonics Res. 7, 883-889 (2019).
  35. Millot, G. et al. Frequency-agile dual-comb spectroscopy. Nat. Photonics 10, 27-30 (2016).
  36. Black, E. D. An introduction to Pound-Drever-Hall laser frequency stabilization. Am. J. Phys. 69, 79-87 (2001).
  37. Yin, X. K. et al. Ppb-level detection for decomposition based on a fiberamplified telecommunication diode laser and a background-gas-induced high-Q photoacoustic cell. Appl. Phys. Lett. 111, 031109 (2017).
  38. Lang, Z. T. et al. Fabry-Perot-based phase demodulation of heterodyne lightinduced thermoelastic spectroscopy. Light. Adv. Manuf. 4, 2689-9620 (2023).
  39. Gordon, I. E. et al. The HITRAN2016 molecular spectroscopic database. J. Quant. Spectrosc. Radiat. Transf. 203, 3-69 (2017).
  40. Wang, Z. et al. Ultrasensitive photoacoustic detection in a high-finesse cavity with Pound-Drever-Hall locking. Opt. Lett. 44, 1924-1927 (2019).
  41. Borri, S. et al. Intracavity quartz-enhanced photoacoustic sensor. Appl. Phys. Lett. 104, 091114 (2014).
  42. Wu, H. P. et al. Beat frequency quartz-enhanced photoacoustic spectroscopy for fast and calibration-free continuous trace-gas monitoring. Nat. Commun. 8, 15331 (2017).
  43. El-Busaidy, S. A. S. et al. Modelling of open photoacoustic resonators. Photoacoustics 18, 100161 (2020).
  44. Lee, H. et al. Chiral exceptional point and coherent suppression of backscattering in silicon microring with low loss Mie scatterer. eLight 3, 20 (2023).
  45. Yan, M. et al. Mid-infrared dual-comb spectroscopy with electro-optic modulators. Light Sci. Appl. 6, e17076 (2017).
  46. Griffith, A. G. et al. Silicon-chip mid-infrared frequency comb generation. Nat. Commun. 6, 6299 (2015).
  47. Guo, H. R. et al. Mid-infrared frequency comb via coherent dispersive wave generation in silicon nitride nanophotonic waveguides. Nat. Photonics 12, 330-335 (2018).
  48. Schwarz, B. et al. Monolithic frequency comb platform based on interband cascade lasers and detectors. Optica 6, 890-895 (2019).
  49. Adler, F. et al. Phase-stabilized, 1.5 W frequency comb at . Opt. Lett. 34, 1330-1332 (2009).
  50. Jouy, P. et al. Dual comb operation of quantum cascade laser frequency comb with 1 W optical power. Appl. Phys. Lett. 111, 141102 (2017).
  51. Consolino, L. et al. Fully phase-stabilized quantum cascade laser frequency comb. Nat. Commun. 10, 2938 (2019).

  1. Correspondence: Zhen Wang (wangzhen@link.cuhk.edu.hk) or Qiang Wang (wangqiang@ciomp.ac.cn) or Wei Ren (renwei@mae.cuhk.edu.hk) Department of Mechanical and Automation Engineering, The Chinese University of Hong Kong, New Territories, Hong Kong SAR, China
    State Key Laboratory of Applied Optics, Changchun Institute of Optics, Fine Mechanics and Physics, Chinese Academy of Sciences, 130033 Changchun, China
    Full list of author information is available at the end of the article These authors contributed equally: Zhen Wang, Qinxue Nie