طيفية الفوتو acoustics الرنانة متعددة الترددات المعززة بالكوارتز Quartz-enhanced multiheterodyne resonant photoacoustic spectroscopy

المجلة: Light Science & Applications، المجلد: 13، العدد: 1
DOI: https://doi.org/10.1038/s41377-024-01425-1
PMID: https://pubmed.ncbi.nlm.nih.gov/38514679
تاريخ النشر: 2024-03-22

طيفية الفوتو acoustics الرنانة متعددة الترددات المعززة بالكوارتز

جيابنغ وانغ هونغبينغ وو أنجيلو سامباولو بييترو باتيميسكو فينتشينزو سبانيولو سووتانغ جيا (1) ولي دونغ

الملخص

تمديد طيفية المزدوجة (DCS) لتشمل جميع أطوال موجات الضوء، إلى جانب قدرتها على توفير نطاق ديناميكي فائق الاتساع ودقة طيفية فائقة، يجعلها مفيدة للغاية لمجموعة متنوعة من التطبيقات في الفيزياء والكيمياء وعلوم الغلاف الجوي وعلوم الفضاء، بالإضافة إلى التطبيقات الطبية. في هذا العمل، نبلغ عن تقنية مبتكرة من طيفية الصوت الضوئي الرنان المعزز بالكوارتز متعددة الترددات (QEMR-PAS)، حيث يتم تحويل استجابة تردد الضرب من المزدوجة إلى نطاق تردد الصوت. بهذه الطريقة، تعمل جزيئات الغاز كموحد بصري صوتي من خلال تأثير الصوت الضوئي، مما يولد موجات صوتية غير متجانسة. على عكس DCS التقليدية، حيث يتم الكشف عن موجة الضوء بواسطة جهاز استشعار ضوئي يعتمد على الطول الموجي، تستخدم QEMR-PAS شوكة تذبذب كوارتز (QTF) كجهاز تحويل صوتي عالي الجودة وتعمل بالتعاون مع كاشف حساس للطور لاستخراج المكون الصوتي الرنان من النغمات الصوتية غير المتجانسة المتعددة، مما يؤدي إلى تكوين بسيط ومنخفض التكلفة للأجهزة. تمكن هذه التقنية الجديدة QEMR-PAS الكشف عن DCS المستقل عن الطول الموجي لاستشعار الغاز، مما يوفر نطاق ديناميكي غير مسبوق يبلغ 63 ديسيبل، ودقة طيفية ملحوظة تبلغ 43 ميغاهيرتز. ) ، وامتصاص مكافئ بارز للضوضاء .

مقدمة

طيفية المشط المزدوج (DCS) هي أداة طيفية ناشئة تجمع بين فوائد طيفية امتصاص الليزر القابلة للتعديل والخصائص الرئيسية للطيفية التقليدية ذات النطاق العريض في منصة واحدة. . لقد اعتُبر أداة جذابة لها تأثير كبير في مجالات متنوعة. على سبيل المثال، تم تطبيق DCS على طيف الأشعة تحت الحمراء (IR) واسع النطاق. الميكروسكوبية القريبة المجال للحصول على دقة مكانية دون الطول الموجي قياس دقيق عالي لمراكز خطوط الجزيئات الهولوجرافيا الرقمية الطيفية غير الخطية ورصد غازات الدفيئة . بينما تواصل DCS
مع نضوجها، ستستمر قائمة تجارب وإثبات المفهوم والتطبيقات في التوسع.
DCS عمومًا يقوم بتحويل إشارات الاستجابة البصرية لزوجين من مشط التردد البصري إلى إشارات تداخل تردد الراديو من خلال أزواج النغمات الناتجة عن التداخل بين المشطين، مما يتغلب على عدم قدرة جهاز الاستقبال الضوئي على الاستجابة الفورية للتغيرات في شدة المجال الضوئي، والقيود المفروضة على دقة مشط واحد من قبل مطياف التشتت. علاوة على ذلك، يحقق DCS مطيافية تحويل فورييه دون الحاجة إلى المسح الميكانيكي. ومع ذلك، كانت التحديات المتعلقة باستخدام DCS لقياس الطيف الكهرومغناطيسي واضحة منذ وقت مبكر جدًا. أولاً، النطاق الديناميكي لجهاز الطيف الضوئي القائم على DCS مقيد بمستقبل الضوء الفردي الخاص به، حيث يمكنه تحمل قوة ضوئية محدودة فقط. مع وجود طاقة بصرية ثابتة، تصبح الطاقة الموزعة لكل سن من أسنان المشط أقل كلما زاد عدد الأسنان، مما يؤدي إلى انخفاض نسبة الإشارة إلى الضوضاء (SNR). بالإضافة إلى ذلك، يستقبل جهاز الاستقبال الضوئي جميع الضوضاء ضمن نطاق الكشف الخاص به، مما يؤدي إلى تدهور أدائه النهائي.
ثانياً، يتم تحديد دقة الطيف لجهاز الطيف القائم على DCS بواسطة عرض خط وضع الكم بالإضافة إلى نافذة الوقت التي يتم خلالها قياس الشكل الزمني. . بالنسبة لقياس الطيف الجزيئي في الطور الغازي في منطقة الطيف القريب من الأشعة تحت الحمراء (NIR)، فإن عرض خط الطيف الذي تم توسيعه بالضغط يقع ضمن نطاق . ومع ذلك، فإن عرض الخط لطيف دوبلر الموسع عند درجة حرارة الغرفة يقع ضمن نطاق في الطيفية الخالية من دوبلر، تمتلك الجزيئات الثقيلة أو العينات الباردة عرض خط أضيق حتى. من الناحية المثالية، يجب أن يكون تباعد أسنان المشط (تردد التكرار) مشابهًا للدقة الطيفية المطلوبة. لذلك، يجب أن يكون تباعد الأسنان قابلاً للتعديل على نطاق واسع لاستجواب جميع هذه الخطوط الطيفية. من ناحية أخرى، يمكن أن يؤدي توسيع حجم نافذة الوقت ليتناسب مع تباعد أسنان المشط الأضيق إلى زيادة مساهمة الضوضاء ووقت الاكتساب عندما يتم ملاحظة الغالبية العظمى من مكونات الإشارة. ثالثًا، حتى الآن، على الرغم من أن النطاق الطيفي لنظام DCS قد تمكن من تغطية 14 أوكتاف عبر نطاق التيراهيرتز (THz) والأشعة تحت الحمراء (IR) والنطاق المرئي. المستقبلات الضوئية المتاحة تجارياً المستخدمة للوصول إلى مناطق طيفية مختلفة، تعتمد على أنظمة مواد مختلفة، مثل السيليكون InGaAs ، و . يعني أن مشط التردد البصري في منطقة طيفية معينة يتطلب جهاز استقبال ضوئي مناسب. تم الإبلاغ عن نهج طيفية الصوت الضوئي المعتمد على تحويل فورييه لمشط التردد البصري لتحقيق طيفية تحويل فورييه عالية الدقة دون الحاجة إلى جهاز استقبال ضوئي. . ومع ذلك، مقارنةً بتقنية تعتمد على نظام التحكم الموزع، لا يزال هناك إمكانية لتحقيق مزيد من التقدم من حيث القياسات السريعة الخالية من المسح الميكانيكي.
بشكل إجمالي، يتراوح نطاق تردد الصوت المرجعي عادةً من 20 هرتز إلى 20 كيلو هرتز، حيث يتمتع بديناميات زمنية أبطأ من معدلات الاسترخاء الاهتزازي-الانتقالي النموذجية لجزيئات الغاز. وبالتالي، يمكن استخدام جزيئات الغاز كمحوّلات لتغيرات شدة الكهرومغناطيسية إلى موجات صوتية من خلال التأثير الضوئي الصوتي عندما يتم تحويل الإشارات الضوئية إلى نطاق تردد الصوت. يمكن بعد ذلك استخدام محول صوتي مثل الميكروفون، مع جزيئات الغاز، لتشكيل كاشف مزدوج يعتمد على تحويل الطاقة من ضوئية إلى صوتية إلى كهربائية. ميزة هذه الطريقة الضوئية الصوتية هي استقلاليتها عن الطول الموجي، مما يجعلها قابلة للتطبيق في قياسات الكومب المزدوج. يتراوح من الأشعة فوق البنفسجية (UV) إلى الأشعة تحت الحمراء المتوسطة (MIR)، وحتى التيراهيرتز (THz)، دون الحاجة إلى تبديل الكواشف. ومع ذلك، مشابهًا للقيود المفروضة من قبل جهاز استشعار ضوئي واحد في أنظمة DCS التقليدية، فإن استخدام ميكروفون واسع النطاق يفرض قيودًا على النطاق الديناميكي والدقة الطيفية النهائية، بسبب أخذ عينات جميع الإشارات الصوتية الضوئية في وقت واحد ونافذة الزمن لتحويل فورييه.
مؤخراً، تم استخدام شوكة التذبذب الكوارتزية (QTF)، التي تم اختراعها في الأصل كمعيار تردد للساعات الإلكترونية، على نطاق واسع
تستخدم ككواشف لموجات الصوت في الطيف الضوئي الصوتي . QTF هو عنصر بيزو كهربائي يحول تشوهه إلى فصل الشحنات الكهربائية، مما يمكّنه من اكتشاف موجات الضغط الصوتي الضعيفة الناتجة بين طرفيه، حيث يتفاعل الإشعاع الضوئي مع غاز ضئيل. صوتياً، يمتلك QTF هندسة رباعية القطب تجعله حساساً بشكل انتقائي للصوت الذي ينشأ في مساحة صغيرة بين طرفيه. تميل الموجات الصوتية من مصادر صوتية بعيدة إلى تحريك طرفي QTF في نفس الاتجاه، مما يؤدي إلى عدم وجود استجابة كهربائية. . تحدد هذه الخصائص مناعته الممتازة للضوضاء البيئية وأبسط تكوين. يتم إنتاج QTF بكميات كبيرة بتكلفة منخفضة جداً ( ) وقد ثبت أنه يعمل على نطاق واسع من درجات الحرارة من 1.56 كلفن (هيليوم فائق السيولة) إلى . يتمتع QTF بحجم صغير، مما يسمح بتحقيق وحدات كشف فائقة الصغر لتحليل عينات الغاز حتى بضع في الحجم .
يجمع دمج QTF و DCS في نطاق الترددات الصوتية تقنية جديدة من طيفية الصوت الضوئي الرنان المعزز بالكوارتز متعددة الترددات (QEMR-PAS)، والتي تتمتع بعدة مزايا مقارنةً بنظام DCS القائم على مستقبلات الضوء/الميكروفونات للكشف عن إشارات متعددة الترددات. يعتبر QTF محول صوتي رنان بدقة عالية مع خسائر داخلية منخفضة للغاية، مما يؤدي إلى عامل جودة مرتفع للغاية يتراوح من إلى . وبالتالي، يمكن تخزين الطاقة الصوتية في QTF، مما يلغي الحاجة إلى عناصر تعزيز صوتية إضافية، مثل خلايا المرور المتعددة كما أن عامل الجودة العالي جداً يوفر عرض نطاق الكشف لـ في مجال تردد الصوت، مما يمكّن من تصفية صوتية عالية الأداء أثناء تحويل الطاقة من البصري إلى الصوتي. علاوة على ذلك، كجهاز استشعار صوتي رنان، يلتقط QTF إشارة الرنين من إشارات متعددة الترددات، مما يوفر نطاق ديناميكي خطي كبير جداً من الضوضاء الحرارية إلى تشوه الانهيار الخاص بـ QTF، والذي يتوافق مع مستوى شدة الصوت من -17 ديسيبل إلى 46 ديسيبل (انظر الملاحظة التكميلية S1)، مما يغطي ستة أوامر من الحجم. ومع ذلك، يجب ملاحظة أنه تم الإبلاغ عن نهج حديث حيث يتم ضغط جميع خطوط المشط في الملف الشخصي الحاد للرنين لـ QTF، تليها تحويل فورييه. . لا تزال هذه الطريقة تعتمد على نظام DCS التقليدي، لكن QTF هو محول طاقة ذو نطاق ترددي ضيق للغاية، على عكس مستقبلات الضوء/الميكروفونات ذات النطاق العريض. وبالتالي، فإن عدد أسنان المشط التي يمكن استخدامها محدود بنطاق QTF الضيق. علاوة على ذلك، فإن متطلبات الدقة الناتجة عن كثافة أسنان المشط تفرض أيضًا متطلبات أعلى على الزمن المتماسك.
مختلف عن طريقة DCS التقليدية، يقوم QEMRPAS باستخراج المكون الترددي الذي يتناغم مع QTF من الأصوات المتعددة المتغايرة في كل مرة، مما يزيل قيود نافذة الزمن المفروضة بواسطة طريقة تحويل فورييه. وبالتالي، فإن QEMR-PAS لديه متطلبات تماسك متبادل أقل.
لأداة واحدة. من حيث الجهاز، يستخدم QEMR-PAS كاشف حساس للطور بسيط لمعالجة إشارة QTF بدلاً من جهاز تحويل فورييه المعقد. يعمل الكاشف الحساس للطور كمرشح كهربائي وعادة ما يحتوي على عرض النطاق الكهربائي أثناء تحويل الطاقة من الصوت إلى الكهرباء. إن تحقيق عرض النطاق الفائق الضيق في الصوتيات والإلكترونيات في الوقت نفسه يمكّن من الدقة الطيفية العالية في QEMR-PAS.
في هذه المخطوطة، نقدم إثبات مفهوم لتقنية QEMR-PAS. يتم تحويل استجابة تردد النبض من مشط مزدوج إلى نطاق تردد الصوت. تُستخدم مستويات طاقة جزيئات الغاز كمحوّلات بصرية صوتية، مما يولد إشارات صوتية متعددة الترددات. يتم استخدام QTF لـ “الاستماع” إلى الصوت المتناغم مع وضعه الانحنائي الأساسي من إشارات الترددات المتعددة وتحويله إلى إشارة تيار. مع هذا النهج، يتم تحقيق مطياف مشط مزدوج عالي الدقة وعريض النطاق ضمن مساحة صغيرة.

النتائج

توضيح للمفهوم

يتم توضيح مفهوم QEMR-PAS في الشكل 1. يتم غمر QTF في الغاز المستهدف، ويمر مشط مزدوج بين طرفي QTF، كما هو موضح في الشكل 1a. مكونات التردد البصري و من مجموعتين من خطوط التردد البصري في QEMR-PAS يتم إعطاؤها بواسطة
أين و تمثل معدلات التكرار للفرشاتين، على التوالي. هي تردد الحامل الضوئي، والذي يكون متطابقًا للفرشاتين عندما يتم توليدهما من نفس مصدر الليزر. يتم تحديد انزياح التردد الضوئي للفرشات بواسطة و مع كونه متغيرًا. الرقم الفرعي 1 و 2 يحددان المشطين، و يمثل ترتيب تعديل الكهروضوئية ومؤشرات خطوط المشط. يُفترض أن و عندما يتم دمج مشطين بصريًا، يمكن تفسير ذلك على أنه مشط تردد واحد، كما هو موضح في الشكل 1ب، مع تردد تعديل في القوة البصرية.
من الجدير بالذكر أن الفرق في معدلات التكرار والانزياح الترددي البصري للفرشاتين هو
تعيين صغير جدًا، أي، لكي تقع ترددات النبضات في نطاق ترددات الصوت، مما ينتج عنه مشط ترددات صوتية. بعد أن يتفاعل هذا المشط الترددي الصوتي مع الغاز المستهدف من خلال تأثير الصوت الضوئي، يتم توليد عدة موجات صوتية هيتردينية. يمكن اكتشاف الموجات الصوتية بواسطة QTF فقط عندما يتم استيفاء الشرط التالي.
أين هو تردد الرنين للوضع المرن الأساسي لجهاز QTF. قيمة للسلسلة يمكن الحصول عليه من خلال دمج المعادلة (4) والمعادلة (5).
ثم يجب أن يتم ضبطه لتلبية المعادلة (6) لأسنان مختلفة بالتتابع (كما هو مؤشر تزداد)، كما هو موضح بشكل تخطيطي في الشكل 1c. ونتيجة لذلك، يتم الكشف عن الإشارة الصوتية الناتجة عن كل سن من مجموعة الترددات الصوتية بالتتابع بواسطة QTF، ويمكن إعادة بناء الطيف الصوتي بالكامل.

إعداد

يتم تصوير الجهاز التجريبي لـ QEMR-PAS في الشكل 2a. يتم تقسيم شعاع الليزر المستمر (CW) إلى جزئين، يتم تغيير ترددهما بواسطة و على التوالي، باستخدام جهازين لتعديل الصوت البصري (AOM). يتم نقل كل شعاع عبر جهاز تعديل كهربائي بصري (EOM) لتوليد مشط تردد بصري بتردد تكرار و . ثم تعيد الشعاعان دمجهما لإنتاج مشط مزدوج. يتم إدخال جزء من طاقة المشط المزدوج إلى مضخم الألياف المدعومة باليربيوم (EDFA) وغرفة الغاز، بينما يصل الباقي إلى جهاز استقبال ضوئي كإشارة مرجعية. في غرفة الغاز، يتم إثارة الجزيئات المستهدفة بواسطة المشط المزدوج إلى حالة طاقة عالية، مما يؤدي إلى توليد عدة موجات صوتية هتردينية من خلال عملية استرخاء الاصطدام الدوري الجزيئي. يتم استخدام QTF مخصص (انظر الملاحظة التكميلية S2) للكشف عن الموجة الصوتية الرنانة من نغمات الصوت الهترديني المتعددة. يتم إرسال التيار الكهروضغطي الناتج إلى مضخم مسبق للتيار (PA) ليتم تحويله إلى إشارة جهد. يتم استخدام مضخم قفل رباعي (LIA-2) لفك تعديل إشارة خرج PA عند تردد رنين QTF. يتم إرسال خرج جهاز الاستقبال الضوئي إلى مضخم قفل رباعي آخر (LIA-1) كإشارة مرجعية، حيث يتم استخدام سعتها وطورها لتطبيع الإشارة ولتقليل تقلب الطور في النظام بسبب عدم التماثل بين المسارات الضوئية للمشطين (انظر الملاحظة التكميلية S3).
الشكل 1 توضيح لـ QEMR-PAS. أ. يتفاعل المشط المزدوج مع جزيئات الغاز ويولد نغمات صوتية هيرودين متعددة. يتم تعزيز النغمة الصوتية المتوافقة مع QTF ثم تحويلها إلى خرج كهربائي بواسطة QTF. ب. التحويل من مشط مزدوج بصري (في الأعلى) إلى مشط تردد صوتي (في الأسفل). يتم توضيح مثال على التحويل النزولي (في المنتصف) حيث يمثل الحامل التردد البصري، ويمثل الغلاف تردد التعديل في القدرة الضوئية. الخط الأحمر في مشط التردد الصوتي يتوافق مع تردد الرنين لـ QTF. ج. يستخدم QEMR-PAS QTF لاكتشاف الموجة الصوتية الناتجة عن التأثير الضوئي الصوتي. تمثل الأسنان الحمراء في مشط التردد الصوتي المكونات داخل نطاق استجابة QTF عند القيم المختلفة. ، والظل الرمادي هو منطقة استجابة تردد QTF

القياسات

لتقديم إثبات مفهوم لتقنية QEMR-PAS، يتم استخدام الخليط كعينة مستهدفة للكشف عن خط من نطاق الامتصاص. يتم استخدام ليزر وضع المعرض الهمس ذو عرض الخط الضيق مع قدرة إخراج تبلغ 10 مللي واط كليزر مستمر. تُظهر الشكل 2b إشارة خرج PA في المجال الزمني. تشير الموجة الشبيهة بالجيب إلى القدرة الممتازة لجهاز QTF في تصفية إشارات الصوت الرنانة بفضل عرض نطاقه الضيق للغاية. كإضافة، يتم رسم مجموعة تردد الصوت من خرج جهاز الاستقبال الضوئي في المجال الترددي، كما هو موضح في الشكل 2c. بالنظر إلى زمن الاستجابة من QTF ( تم ضبط وقت التكامل لـ LIA2 على 300 مللي ثانية، مع وقت اكتساب قدره ثانيتين لكل سن. نظرًا لاستخدام 32 سنًا في تجربتنا، كان إجمالي وقت الاكتساب 64 ثانية. إنه
يجدر بالذكر أن نسبة الإشارة إلى الضوضاء (SNR) تتعلق فقط بوقت التكامل بدلاً من وقت الاكتساب، حيث يتم استخدام الطريقة الحساسة للطور بدلاً من تحويل فورييه.
إعداد يحدد أي جزء من المشط الثنائي يتم اختياره. بالنسبة للكشف البصري عن المواد التحليلية، يمكن أن يتراوح النطاق الطيفي المختار من سن واحد إلى المشط بأكمله. للتوضيح، فإن 32 سنًا من المشط المجاورة للتردد السائد ( تم اختيار ( ). القوة البصرية الإجمالية للكمين المزدوج هي 320 مللي واط، وهو ما يعتبر مرتفعًا جدًا ليتم اكتشافه بواسطة مطياف الكمين المزدوج القائم على مستقبل ضوئي واحد. يتم إعطاء عامل الضغط بين محاور التردد الصوتي والبصري بواسطة . يتم عرض طيف الفوتو أكوستيك المكتسب في الشكل 2d، وتم تطبيعه على إشارة شدة السن الأولية المسجلة بواسطة LIA-1.
الشكل 2 المخطط والنتائج لإعداد QEMR-PAS. أ إعداد تجريبي لـ QEMR-PAS. يتم تقسيم ليزر الموجة المستمرة (CW) إلى شعاعين. يتم تعديل كل شعاع بواسطة معدل صوتي بصري (AOM) ومعدل كهربائي بصري (EOM). يتم تضخيم 99% من الضوء المدمج بواسطة مضخم ألياف مشبع باليربيوم (EDFA)، ويتم إرسال الباقي ( ) إلى جهاز استقبال ضوئي. يسجل مضخم القفل (LIA-1) تقلبات شدة الطيف والطور. يتم تضخيم الإشارة من QTF بواسطة مضخم مسبق (PA) ويتم فك تعديلها بواسطة مضخم القفل (LIA-2). يتم الحصول على البيانات بواسطة حاسوب شخصي (PC). ب إشارة بيزوالكترونية من QTF. لها شكل موجة جيبية حيث أن QTF يقيس فقط الموجة الصوتية الرنانة من الموجات الصوتية المتعددة. ج طيف تردد الصوت الناتج من تحويل مزدوج بصري. يتم الحصول على طيف تردد الصوت بواسطة محلل طيفي باستخدام إشارة الخرج من جهاز الاستقبال الضوئي. د طيف الامتصاص المعياري لغاز الأسيتيلين المكتسب بواسطة QEMR-PAS (نقاط زرقاء فاتحة) ومقارنته بنموذج هيترا (خط أسود صلب) عند الضغط ودرجة الحرارة العادية.
لتقييم النطاق الديناميكي للنظام، يتم قياس منحنى الاستجابة لـ QTF المخصص كدالة لتردد الإثارة، كما هو موضح في الشكل 3a. يتم ملاحظة قدرة التصفية الضيقة للغاية ( ) حول تردد الرنين لـ QTF البالغ 15849.4 هرتز، مما يؤدي إلى عامل قدره 15000. علاوة على ذلك، يظهر QTF استجابة خطية ممتازة عند تردد الرنين الخاص به من مستوى الضوضاء الحرارية ( ) إلى تقريبًا جهد الانهيار ( )، والذي تم التحقق منه تجريبيًا (انظر الملاحظة التكميلية S1). تشير النتيجة إلى أن النطاق الديناميكي لـ QTF لقياس شدة الصوت له مدى واسع يبلغ 63 ديسيبل. بعد ذلك، يتم إجراء تجربة قياس التركيز. يتم عرض إشارات ذروة QEMR-PAS لـ الخط في الشكل 3b كدالة لمستوى تركيز ، مما يوضح بنجاح العلاقة الخطية الممتازة بين تركيز الغاز وسعة إشارة QEMR-PAS ( قيمة 0.999). يتم عرض إشارات QEMR-PAS لمستويات التركيز المنخفضة من في الإطار الصغير في الشكل 3b.
يتم تعريف نسبة الإشارة إلى الضوضاء (SNR) على أنها نسبة القيمة المتوسطة لإشارات الذروة إلى قيمة انحرافها المعياري. عند أدنى تركيز يبلغ 40 جزء في المليون، تم تقدير SNR بـ ، مما يتوافق مع حد الكشف البالغ 4 جزء في المليون. لذلك، يتجاوز النطاق الديناميكي الخطي للنظام 40 ديسيبل، والذي يقتصر على مستويات تركيز الغاز التي تم تحقيقها خلال التجربة. لا يزال هناك احتياطي ديناميكي قدره 20 ديسيبل لاستقبال إشارة الصوت الأقوى.
تعتبر دقة الطيف لطيف معاد بناؤه واحدة من أهم المعلمات للتحليل الطيفي. تم قياس طيف متداخل من الأمونيا يتكون من ثلاث ميزات منفصلة بالقرب من 1531.68 نانومتر لتقييم دقة الطيف لـ QEMR-PAS، كما هو موضح في الشكل 4. من الجدير بالذكر أنه مع زيادة الضغط، يظهر إشارة الفوتو أكوستيك ارتفاعًا أوليًا يتبعه انخفاض لاحق. نظرًا لأننا نركز على الدقة، يتم تطبيع إشارة الفوتو أكوستيك إلى أعلى قيمة في الشكل 4. يتم استخدام ليزر وضع المعرض الهمس الذي يصدر حول 1531 نانومتر كمصدر للضوء مع عرض خط ليزر ضيق للغاية من
الشكل 3 النطاق الديناميكي لـ QEMR-PAS. أ منحنى استجابة التردد لـ QTF المخصص. إشارة QEMR-PAS كدالة لتركيز الغاز. تتراوح مستويات تركيز الأسيتيلين من 40 جزء في المليون إلى . يوضح الإطار الصغير على اليمين خطية QEMR-PAS عند التركيزات المنخفضة من 40 جزء في المليون إلى 200 جزء في المليون.
الشكل 4 أطياف QEMR-PAS للأمونيا المقاسة عند دقات طيفية وضغوط مختلفة. أ دقة الطيف 1 جيجاهرتز عند ضغط 670 تور. تتداخل ثلاث ميزات طيفية مع بعضها البعض. ب دقة الطيف 700 ميجاهرتز عند ضغط 200 تور. تفصل الميزة الثالثة تمامًا عن الأولين. ج دقة الطيف 43 ميجاهرتز عند ضغط 100 تور. الميزات الثلاث مفصولة جيدًا. يمثل المحور الأفقي تردد الإزاحة من 195.7368 تيراهرتز (1531.68 نانومتر)
بضع هرتز، والتي يمكن استخدامها لدراسة الحد الأقصى لدقة الطيف لـ QEMR-PAS. يتم إعادة بناء الطيف من بواسطة نظام QEMR-PAS عند 670 تور (الشكل 4a)، 200 تور (الشكل 4b) و100 تور (الشكل 4c). مع انخفاض الضغط، تفصل الميزات الثلاث لامتصاص تدريجيًا نتيجة لتضييق عرض كل ميزة. في الشكل 4a، يتم تعيين دقة الطيف للنظام إلى 1 جيجاهرتز، والتي تحدد مباشرة بواسطة تباعد الطيف. عند 200 تور (الشكل 4b)، يتم تعيين تباعد الطيف للنظام إلى 700 ميجاهرتز. عند هذا الضغط، تفصل ميزة الامتصاص التي تصل إلى تردد أعلى تمامًا عن الميزتين الأخريين. عند 100 تور، تكون الميزات الثلاث مفصولة جيدًا عن بعضها البعض، مع تعيين دقة الطيف إلى 43 ميجاهرتز (الشكل 4c). يظهر نظام QEMR-PAS القدرة على تمييز خطوط امتصاص الأمونيا عند الضغوط المنخفضة بسبب عرض النطاق الضيق للغاية
لـ QTF. نظريًا، تقتصر دقة الطيف لـ QEMR-PAS فقط على عرض خط الليزر. لم يتم اختبار دقة الطيف الأعلى (المعني بإعادة بناء الطيف لميزات الامتصاص الخالية من دوبلر).
يحتوي طيف التردد الضوئي المستخدم على 32 سنًا مرتبة بالتساوي على كلا الجانبين من التردد السائد مع تباعد طيف يبلغ 1 جيجاهرتز. لذلك، يمكن أن يغطي طيف التردد مدى ترددي يبلغ 31 جيجاهرتز، وهو أكبر بكثير من نطاقات التعديل الخالية من القفز النموذجية لليزر ثنائي الأشعة تحت الحمراء. إذا تم توفير المزيد من الترددات السائدة، يمكن تحقيق طيف واسع النطاق مع دقة طيفية عالية. وبالتالي، يتم استخدام ليزر ثنائي الأشعة في تجويف خارجي (ECDL). من خلال ضبط تردد ECDL بطريقة تدريجية، يمتد الطيف المزدوج تقريبًا 1 تيراهرتز. بالنسبة لـ خليط، يتم إجراء كل قياس QEMRPAS بدقة طيفية تبلغ 1 جيجاهرتز. يتم تطبيق خياطة الطيف للحصول على
الشكل 5 أطياف QEMR-PAS والمحاكاة للأسيتيلين من 194.73 تيراهرتز إلى . المنحنى الأزرق في الأعلى هو الأطياف المقاسة باستخدام QEMR-PAS، والمنحنى الأخضر في الأسفل هو الأطياف المحاكاة باستخدام قاعدة بيانات هيترا
الطيف الكامل، كما هو موضح في الشكل 5. خطوط الطيف في فرع P من نطاق من مفصولة جيدًا من 194.73 تيراهرتز إلى إلى 1539.54 نانومتر)، مما يظهر توافقًا جيدًا مع الأطياف المحاكاة باستخدام قاعدة بيانات هيترا.

تحليل الأداء

الكشف الحساس للطور، يختلف عن تحويل فورييه في DCS التقليدي، هو أداة قوية لتصفية الإشارات الجيبية الصغيرة من الضوضاء العشوائية، حتى في البيئات المزعجة للغاية. QTF هو محول صوتي رنان، وهو مناسب جدًا للعمل مع كاشف حساس للطور لإكمال التصفية الصوتية والكهربائية بالترتيب. في تقنية QEMRPAS، يعمل QTF كمرشح صوتي بعرض نطاق اكتشاف صوتي ضيق (عادة بضع هرتز)، مما يزيل الضوضاء الصوتية خارج عرض نطاق اكتشافه ويستخرج المكون الصوتي الرنان من الموجات الصوتية المتعددة. يمكّن الكاشف الحساس للطور بعد QTF عرض نطاق اكتشاف كهربائي ضيق للغاية (عادة 0.1 هرتز)، مما يقلل من الضوضاء الإلكترونية. وبالتالي، يتم الوصول إلى نسبة إشارة إلى ضوضاء عالية باستخدام تصفية عرض النطاق الضيق ذات المرحلتين في عمليات التحويل الضوئي الصوتي والكهربائي الصوتي، على التوالي.
يظهر تحليل الضوضاء الخلفية لـ QEMR-PAS أن مصدرين رئيسيين للضوضاء هما الضوضاء الحرارية المرتبطة بالتبدد الميكانيكي في QTF وضوضاء حرارية لمقاوم التغذية الراجعة (انظر الملاحظة التكميلية S4). في الوقت نفسه، تكون سعة إشارة QEMR-PAS متناسبة مع القدرة الضوئية للأسنان المعنية في توليد ملاحظة الضرب، و عامل QTF، وتركيز الأنواع المستهدفة، وعكسيًا مع تردد رنين QTF.
لذلك، يمكن التعبير عن SNR لـ QEMR-PAS على النحو التالي:
حيث هو ضوضاء جهد الرمز عند مخرج المضخم السابق، هو تركيز الأنواع المستهدفة، ، هي القوى الضوئية للأسنان المجاورة لأسنان المشطين، هي درجة الحرارة، هي المقاومة المكافئة لـ QTF، هي مقاومة الكسب للمضخم السابق، و هو ثابت بولتزمان.
بالنسبة لـ DCS التقليدي، يمكن كتابة SNR كـ :
حيث M هو عدد أسنان المشط، و هي القوى الضوئية للمشطين، NEP هو الطاقة المكافئة لضوضاء جهاز الاستقبال الضوئي، و هو زمن التوسيع. من خلال مقارنة المعادلات (7)، (9)، يزيل QEMR-PAS زمن التوسيع ، الذي يفرضه تحويل فورييه لتحليل الطيف الكامل. بدلاً من ذلك، يستخدم QEMR-PAS زمن التكامل لمضخم القفل (LIA) لكل سن. ومع ذلك، من المهم ملاحظة أن هذا لا يعني أن QEMR-PAS يحقق زمن اكتساب أسرع. في الواقع، في نطاق التردد الصوتي، يكون زمن اكتساب QEMR-PAS أطول مقارنة بمطياف ثنائي المشط RF بسبب تردده المنخفض . علاوة على ذلك، فإن QTF بقيمة Q عالية يؤدي إلى زمن تراكم أطول. تمثل أوقات الاكتساب الأطول تنازلاً بين النطاق الديناميكي، الحساسية، وتكلفة الكشف. علاوة على ذلك، مستويات الكشف في نطاق هيرتز/دون هيرتز في الصوتيات ( ) والإلكترونيات ( ) تحسن أيضًا SNR لـ QEMR-PAS. في DCS التقليدي، لا ينطبق SNR المحدود بضوضاء الطلقة، ولكن NEP لجهاز الاستقبال الضوئي يهيمن، وفقًا للمعادلة (9). من الواضح أن الطريق إلى SNR أعلى لـ DCS التقليدي هو زمن التوسيع الأطول و NEP الأقل.
للمقارنة، يمكن إعادة كتابة المعادلة (9) كـ:
على الرغم من وجود نفس العامل في المعادلات (7)، (10)، إلا أن نطاق قيمها مختلف بشكل كبير. في DCS التقليدي، لا يجلب الشدة العالية لقمة مشط التردد – الطبيعة الزمنية للنبضة الفائقة القصر – أي مزايا ولكنه يحد من النطاق الديناميكي لـ
الإشارة التداخلية من خلال تشبع جهاز استقبال ضوئي أو جهاز رقمي. على سبيل المثال، قد يكون لجهاز استقبال ضوئي معزز تجاري 100 ميجاهرتز InGaAs حد من (المعطاة من نسبة الحد الأقصى للطاقة القمة إلى NEP المدمجة عبر نطاق كشف قدره )، مما يحد من تحسين SNR الإضافي في DCS التقليدي. على العكس، يمكن أن يستفيد QEMR-PAS من مستويات الطاقة الضوئية العالية للمشط. أظهر عمل سابق أن مع تحفيز طاقة ضوئية 1.4 واط من ليزر CW أحادي الوضع ينبعث عند 1560 نانومتر، يمكن تحقيق حساسية كشف بمستوى ppb في مطيافية الصوت الضوئي المعزز بالكوارتز دون سلوك تشبعي، بفضل نطاق ديناميكي خطي كبير جدًا لـ QTF. هذا يعني أن طاقة سن في QEMR-PAS يمكن ضبطها حتى 1.4 واط لتحسين SNR.
الضوضاء الطورية التفاضلية بين المشطين غير مشمولة في المعادلات (7)، (9). حتى في المشطين المتماسكين، يوجد قاعدة ضوضاء طور متبقية على أي سن معين. ستساهم ضوضاء الطور عند ترددات فورييه أقل من تباعد الأسنان في تقلبات خط الأساس البطيئة، وتلك
الشكل 6 تحليل استقرار تباين ألان لنظام QEMR-PAS.
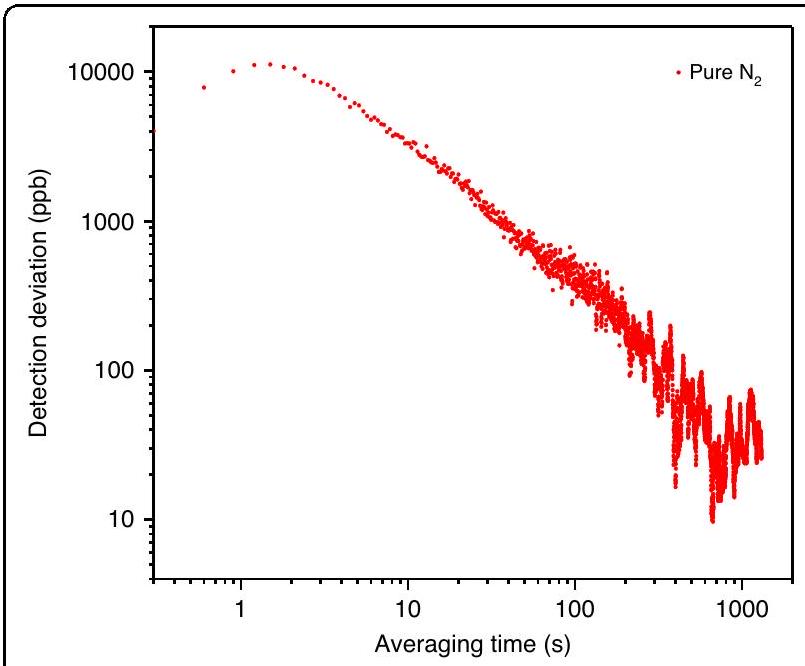
تمثل النقطة الحمراء بيانات تباين ألان لنظام QEMR-PAS عند التشغيل مع
سيؤثر تباعد الأسنان أعلاه على أسنان المشط المجاورة، مما يحد من SNR. في تجربتنا، تم استخدام تصحيح طور نشط في الوقت الحقيقي، مما يقلل من الضوضاء الطورية التفاضلية (انظر الملاحظة التكميلية S3).
لتقييم الاستقرار على المدى الطويل لنظام QEMR-PAS، تم إجراء تحليل تباين ألان لمكون سن المشط الرئيسي ( ) مع بينما يتم تغيير زمن التوسيع. تكشف النتائج الموضحة في الشكل 6 أن حساسية نظام QEMR-PAS يمكن تعزيزها من خلال تمديد زمن التوسيع. على وجه التحديد، تم تحقيق حد كشف مثالي قدره 50 ppb مع زمن توسع قدره 316 ثانية.
مقارنة جنبًا إلى جنب للأداء لـ DCS التقليدي، مطيافية الصوت الضوئي ثنائية التردد (DC-PAS) المعتمدة على ميكروفون و QEMR-PAS موضحة في الجدول 1. بالنسبة لـ DCS التقليدي، يتم اعتبار نوعين من أجهزة الاستقبال الضوئي، InGaAs لـ NIR-DCS و HgCdTe لـ MIR-DCS، لتغطية طيفية قدرها 0.8 و ، على التوالي. ومع ذلك، تقدم QEMR-PAS و DC-PAS كاشفات مستقلة عن الطول الموجي، مما يمكّن من الكشف الطيفي عبر نطاق واسع من UV إلى THz. يتم تحقيق ذلك من خلال الكشف عن الموجات الصوتية بدلاً من الاعتماد على الموجات الضوئية. بالنسبة للقياسات الكمية، في الحالات التي لا تتوفر فيها أجهزة استقبال ضوئي مناسبة لنطاق طول موجي معين، يمكن تنفيذ إشارة المرجع بدلاً من ذلك من خلال الكشف الصوتي الضوئي لامتصاص الجسم الأسود لقياس شدة الضوء. علاوة على ذلك، تتمتع تقنية QEMR-PAS بنطاق ديناميكي قدره 63 ديسيبل مع دقة طيفية قدرها 43 ميجاهرتز، وهو أفضل بعدة أوامر من حيث الحجم مقارنة بـ NIR-DCS و MIR-DCS و DC-PAS. يتم تحديد زمن التكامل الكلي من خلال ضرب 0.3 ثانية بعدد المشطين، مما ينتج عنه 9.6 ثانية. تم حساب الضوضاء المتوقعة ( ) لـ QEMR-PAS لتكون عند استبدال في المعادلة (8). القيمة المتوقعة تتفق تمامًا مع القيمة التجريبية لـ . مثل هذا المستوى من الضوضاء ينتج عنه امتصاص مكافئ للضوضاء (NEA) قدره ، وهو أفضل بمرتبة واحدة من حيث الحجم مقارنة بـ DC-PAS ونفس المرتبة مثل NIR-PAS و MIR-PAS. معامل امتصاص الضوضاء المكافئ المنظم (NNEA) هو .
الجدول 1 مقارنة أداء جنبًا إلى جنب بين DCS التقليدي و QEMR-PAS
التقنيات نوع الكاشف التغطية الطيفية للكاشف ( ) النطاق الديناميكي (ديسيبل) الدقة الطيفية (جيجاهرتز) زمن التوسيع (ثانية) حد الكشف (جزء في المليون) NEA ( )
NIR-DCS InGaAs 0.8-1.6 27 1 0.0025
MIR-DCS HgCdTe 3-10 22 0.5 2 المزيج: –
DC-PAS ميكروفون جميع النطاقات 45 1 1000
QEMR-PAS QTF جميع النطاقات 60 0.043 9.6

المناقشة

باختصار، يتطلب توسيع DCS لتغطية الطول الموجي العريض مع نطاق ديناميكي كبير ودقة طيفية عالية التخلص من قيود مبدأ وجهاز DCS التقليدي. هنا أظهرنا تقنية QEMR-PAS، حيث يقوم QTF بالكشف بشكل انتقائي عن مكون تردد الصوت لموجات الصوت المتعددة الناتجة عن مشط مزدوج من خلال التأثير الصوتي الضوئي. وبالتالي، تلغي تقنية QEMR-PAS الحاجة إلى أجهزة استقبال ضوئي تعتمد على الطول الموجي وتقلل من التعقيد الحسابي لتحويلات فورييه في DCS التقليدي. بدلاً من ذلك، تم استخدام QTF صغير وكاشف حساس للطور بسيط كجهاز تحويل صوتي وفلتر ضيق النطاق، مما يمكّن من تطوير مستشعر مدمج ومنخفض التكلفة يعتمد على QEMR-PAS. علاوة على ذلك، توفر تقنية QEMR-PAS طريقة كشف DCS مستقلة عن الطول الموجي. تظهر النتائج أن هذه التقنية الجديدة قادرة على توفير نطاق ديناميكي فائق الحجم قدره 63 ديسيبل ودقة طيفية فائقة الضيق قدرها 43 ميجاهرتز (أو ). من حيث NEA، هناك فقط تحسين بمرتبة واحدة مقارنة بـ DC-PAS. لكن لا يزال لدينا احتياطي في النطاق الديناميكي. ستجلب التطورات التكنولوجية لمشط التردد الضوئي مع طاقة متوسطة أعلى (طاقة نبضة عالية)، تصل إلى مستوى الواط ، فوائد هائلة لـ QEMR-PAS، والتي من المتوقع أن تؤدي إلى تحسين إضافي في حساسية الكشف من خلال استخدام مشط تردد ضوئي عالي الطاقة في المستقبل القريب.
من الجدير بالذكر أنه بينما يوفر استخدام QTF العديد من المزايا، بما في ذلك الاستجابة المستقلة عن الطول الموجي، النطاق الديناميكي الكبير، والحساسية العالية، فإنه يؤدي أيضًا إلى زمن اكتساب أطول للنظام بسبب القيمة العالية لـ QTF. في الدراسات المستقبلية، يمكن دمج تقنية QEMR-PAS المقترحة مع كشف تردد الضرب لتقليل زمن اكتساب النظام بشكل فعال. في الوقت نفسه، بينما يعتمد العرض الحالي لنظام QEMR-PAS على مشطات كهربائية بصرية، نعتقد اعتقادًا راسخًا أن QEMR-PAS يحمل وعدًا كبيرًا للتطبيق مع مشطات منتصف الأشعة تحت الحمراء لامتصاص الغاز الأقوى. يمكن تحقيق ذلك من خلال استخدام مشط تردد كهربائي بصري في منتصف الأشعة تحت الحمراء وتوظيف محولات صوتية بصرية مخصصة تعتمد على الجرمانيوم.

المواد والأساليب

مصدر المشط المزدوج

يتم استخدام ليزر CW يعمل بحرية لتوليد مشط مزدوج. يتم توفير تحويلات التردد الضوئي و بواسطة جهازين من المحولات الصوتية الضوئية، على التوالي. تفاوتت من إلى و . الترددات المعدلة لعمليتي تعديل الكهروضوئية هما و
، حيث تمثل تردد الرنين لـ QTF، تمثل العدد المحدد لأسنان المشط. جميع مصادر التعديل متزامنة معًا بمعيار تردد 10 ميجاهرتز لضمان التوافق المتبادل في عملية التعديل.

نظام QEMR-PAS

يمر ضوء المشط عبر غرفة الغاز و QTF. يتم استخدام QTF مخصص ( ) لتحقيق QEMR-PAS. يتم إدخال خرج الإشارة الكهربائية إلى مضخم مسبق، ثم يتم تعديلها بواسطة LIA-2. يتم استخدام LIA-1 لتعديل إشارة المرجع من جهاز استقبال الضوء. يتم إعطاء تقلبات الطور للنظام بواسطة LIA-1 وتستخدم للتزامن مع LIA-2. يتم إعطاء طيف الامتصاص المنظم بواسطة نسبة قيمة LIA-2 إلى قيمة LIA-1. يتم حساب القيمة النهائية لإشارة كل سن مشط كمتوسط على فترة الاكتساب.

حساب NNEA

يمكن تحديد معامل NNEA بواسطة الصيغة . هنا، تمثل القوة الإجمالية للمشطات، و هو عدد الخطوط الطيفية، مما يعطي القوة المتوسطة لكل خط طيفي ( 10 مللي واط ). يتم حساب معامل الامتصاص القابل للاكتشاف الأدنى، كـ ، المستمد من قاعدة بيانات HITRAN، عندما تكون طول موجة الامتصاص للغاز المستهدف وحدود الكشف للمستشعر معروفة. يتم تحديد عرض نطاق مرشح الإشارة الكهربائية كـ 0.59 هرتز عندما يتم تعيين ثابت الزمن وانحدار المرشح لـ LIA-2 كـ 300 مللي ثانية و 12 ديسيبل، على التوالي.

الشكر والتقدير

المشروع برعاية المؤسسة الوطنية للعلوم الطبيعية في الصين (NSFC) (الأرقام 62235010، 62175137، 62122045، 62075119)؛ صندوق شانشي للعلوم للعلماء الشباب المتميزين (20210302121003). يقر المؤلفون من قسم الفيزياء بجامعة باري بالدعم المالي من THORLABS GmbH ضمن مختبر الأبحاث المشترك PolySenSe.

تفاصيل المؤلف

المختبر الوطني الرئيسي للبصريات الكمومية وأجهزة البصريات الكمومية، معهد طيف الليزر، جامعة شانشي، تاييوان 030006، الصين. مركز الابتكار التعاوني للبصريات المتطرفة، جامعة شانشي، تاييوان 030006، الصين. مختبر PolySense، قسم الفيزياء، جامعة وبوليتكنيك باري، CNR-IFN، Via Amendola 173، 70126 باري، إيطاليا

مساهمات المؤلف

صمم J.W. و H.W. التجارب. أشرف S.J. و L.D. على المشروع. قام A.S. و P.P. و V.S. بتنفيذ التجارب المبلغ عنها. أجرى L.D. و H.W. التحليل التجريبي. أعد J.W. و H.W. و L.D. المخطوطة. تم تنفيذ جميع الأعمال تحت إشراف L.D.

توفر البيانات

يعلن المؤلفون أن جميع البيانات التي تدعم نتائج هذه الدراسة يمكن العثور عليها ضمن الورقة وملفات المعلومات التكميلية الخاصة بها. البيانات الإضافية التي تدعم نتائج هذه الدراسة متاحة من المؤلف المراسل (L.D.) عند الطلب المعقول.

تعارض المصالح

يعلن المؤلفون عدم وجود مصالح متنافسة.
المعلومات التكميلية النسخة الإلكترونية تحتوي على مواد تكميلية متاحة على https://doi.org/10.1038/s41377-024-01425-1.
تم الاستلام: 31 أكتوبر 2023 تم التنقيح: 11 مارس 2024 تم القبول: 12 مارس 2024
تم النشر عبر الإنترنت: 22 مارس 2024

References

  1. Coddington, I., Newbury, N. & Swann, W. Dual-comb spectroscopy. Optica 3, 414-426 (2016).
  2. Picqué, N. & Hänsch, T. W. Frequency comb spectroscopy. Nat. Photonics 13, 146-157 (2019).
  3. Schiller, S. Spectrometry with frequency combs. Opt. Lett. 27, 766-768, (2002).
  4. Okubo, S. et al. Near-infrared broadband dual-frequency-comb spectroscopy with a resolution beyond the Fourier limit determined by the observation time window. Opt. Express 23, 33184-33193, (2015).
  5. Hoghooghi, N. et al. Broadband 1-GHz mid-infrared frequency comb. Light Sci. Appl. 11, 264 (2022).
  6. Brehm, M., Schliesser, A. & Keilmann, F. Spectroscopic near-field microscopy using frequency combs in the mid-infrared. Opt. Expr. 14, 11222-11233 (2006).
  7. Pistore, V. et al. Self-induced phase locking of terahertz frequency combs in a phase-sensitive hyperspectral near-field nanoscope. Adv. Sci. 9, 2200410 (2022).
  8. Baumann, E. et al. Spectroscopy of the methane band with an accurate midinfrared coherent dual-comb spectrometer. Phys. Rev. A 84, 062513 (2011).
  9. Cassinerio, M. et al. Absolute dual-comb spectroscopy at by freerunning Er: fiber lasers. Appl. Phys. Lett. 104, 231102 (2014).
  10. Vicentini, E. et al. Dual-comb hyperspectral digital holography. Nat. Photonics 15, 890-894 (2021).
  11. Ideguchi, T. et al. Coherent Raman spectro-imaging with laser frequency combs. Nature 502, 355-358 (2013).
  12. Rieker, G. B. et al. Frequency-comb-based remote sensing of greenhouse gases over kilometer air paths. Optica 1, 290-298, (2014).
  13. Ycas, G. et al. Compact mid-infrared dual-comb spectrometer for outdoor spectroscopy. Opt. Express 28, 14740-14752, (2020).
  14. Wang, Q. et al. Dual-comb photothermal spectroscopy. Nat. Commun. 13, 2181 (2022).
  15. Coddington, I., Swann, W. & Newbury, N. Coherent dual-comb spectroscopy at high signal-to-noise ratio. Phys. Rev. A 82, 043817 (2010).
  16. Yasui, T. et al. Super-resolution discrete Fourier transform spectroscopy beyond time-window size limitation using precisely periodic pulsed radiation. Optica 2, 460-467, (2015).
  17. Demtröder, W. Laser Spectroscopy. (Heidelberg: Springer, 1982).
  18. Svanberg, S. Atomic and Molecular Spectroscopy: Basic Aspects and Practical Applications. (Heidelberg: Springer, 2012).
  19. Rösch, M. et al. On-chip, self-detected terahertz dual-comb source. Appl. Phys. Lett. 108, 171104 (2016).
  20. Muraviev, A. V. et al. Massively parallel sensing of trace molecules and their isotopologues with broadband subharmonic mid-infrared frequency combs. Nat. Photonics 12, 209-214 (2018).
  21. Sterczewski, L. A. et al. Terahertz hyperspectral imaging with dual chip-scale combs. Optica 6, 766-771 (2019).
  22. Wei, T. T. et al. High and flat spectral responsivity of quartz tuning fork used as infrared photodetector in tunable diode laser spectroscopy. Appl. Phys. Rev. 8, 041409 (2021).
  23. Sadiek, I. et al. Optical frequency comb photoacoustic spectroscopy. Phys. Chem. Chem. Phys. 20, 27849-27855 (2018).
  24. Wildi, T. et al. Photo-acoustic dual-frequency comb spectroscopy. Nat. Commun. 11, 1-6 (2020).
  25. Friedlein, J. T. et al. Dual-comb photoacoustic spectroscopy. Nat. Commun. 11, 3152 (2020).
  26. Kosterev, A. A. et al. Quartz-enhanced photoacoustic spectroscopy. Opt. Lett. 27, 1902-1904, (2002).
  27. Wu, H. P. et al. Beat frequency quartz-enhanced photoacoustic spectroscopy for fast and calibration-free continuous trace-gas monitoring. Nat. Commun. 8, 15331 (2017).
  28. Milde, T. et al. QEPAS sensor for breath analysis: a behavior of pressure. Appl. Opt. 57, C120-C127 (2018).
  29. Yi, H. M. et al. T-shape microresonator-based high sensitivity quartz-enhanced photoacoustic spectroscopy sensor. Opt. Express 20, 9187-9196, (2012).
  30. Kosterev, A. A. et al. Applications of quartz tuning forks in spectroscopic gas sensing. Rev. Sci. Instrum. 76, 043105 (2005).
  31. Blaauwgeers, R. et al. Quartz tuning fork: Thermometer, pressure-and viscometer for helium liquids. J. Low. Temp. Phys. 146, 537-562 (2007).
  32. Wu, H. P. et al. Enhanced near-infrared QEPAS sensor for sub-ppm level detection by means of a fiber amplified 1582 nm DFB laser. Sens. Actuators, B 221, 666-672 (2015).
  33. Cui, R. Y. et al. Generalized optical design of two-spherical-mirror multipass cells with dense multi-circle spot patterns. Appl. Phys. Lett. 116, 091103 (2020).
  34. Ren, X. Y. et al. Dual-comb quartz-enhanced photoacoustic spectroscopy. Photoacoustics 28, 100403 (2022).
  35. Schibli, T. R. et al. Optical frequency comb with submillihertz linewidth and more than 10 W average power. Nat. Photonics 2, 355-359 (2008).
  36. Cingöz, A. et al. Direct frequency comb spectroscopy in the extreme ultraviolet. Nature 482, 68-71 (2012).
  37. Yan, M. et al. Mid-infrared dual-comb spectroscopy with electro-optic modulators. Light Sci. Appl. 6, e17076 (2017).
  38. Martín-Mateos, P. et al. Frequency accurate coherent electro-optic dual-comb spectroscopy in real-time. Opt. Expr. 26, 9700-9713 (2018).
  39. Nitzsche, L. et al. Tunable dual-comb spectrometer for mid-infrared trace gas analysis from 3 to . Opt. Expr. 29, 25449-25461 (2021).

  1. Correspondence: Lei Dong (donglei@sxu.edu.cn)
    State Key Laboratory of Quantum Optics and Quantum Optics Devices, Institute of Laser Spectroscopy, Shanxi University, Taiyuan 030006, China
    Collaborative Innovation Center of Extreme Optics, Shanxi University, Taiyuan 030006, China
    Full list of author information is available at the end of the article These authors contributed equally: Jiapeng Wang, Hongpeng Wu.

Journal: Light Science & Applications, Volume: 13, Issue: 1
DOI: https://doi.org/10.1038/s41377-024-01425-1
PMID: https://pubmed.ncbi.nlm.nih.gov/38514679
Publication Date: 2024-03-22

Quartz-enhanced multiheterodyne resonant photoacoustic spectroscopy

Jiapeng Wang , Hongpeng Wu , Angelo Sampaolo , Pietro Patimisco , Vincenzo Spagnolo , Suotang Jia (1) and Lei Dong

Abstract

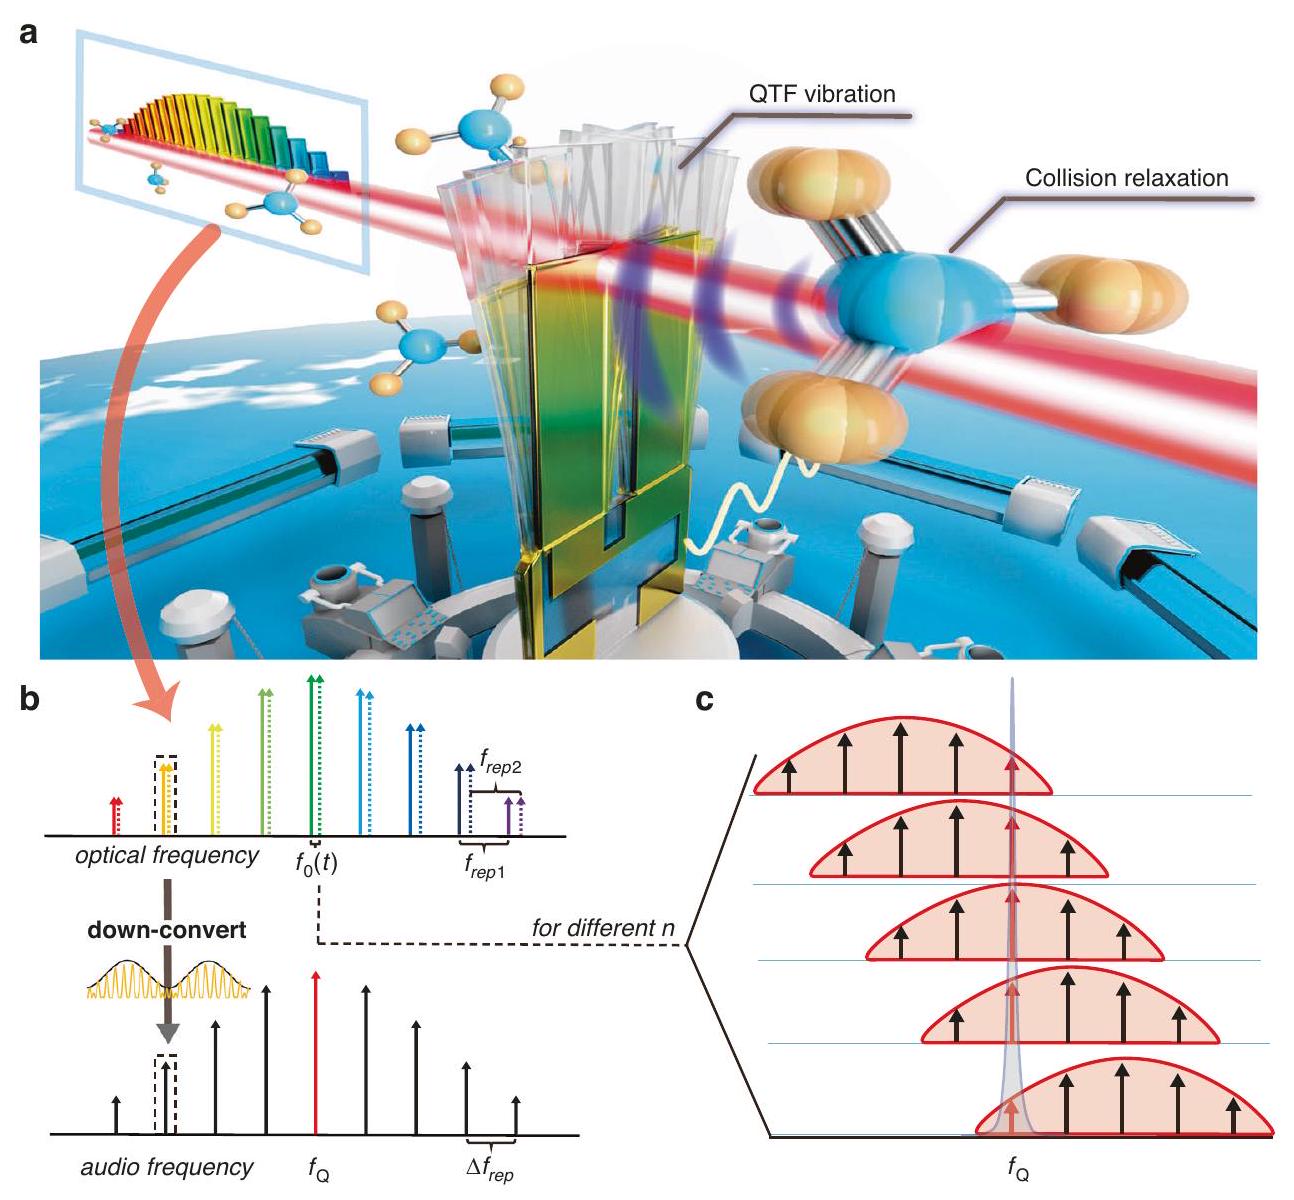
The extension of dual-comb spectroscopy (DCS) to all wavelengths of light along with its ability to provide ultralarge dynamic range and ultra-high spectral resolution, renders it extremely useful for a diverse array of applications in physics, chemistry, atmospheric science, space science, as well as medical applications. In this work, we report on an innovative technique of quartz-enhanced multiheterodyne resonant photoacoustic spectroscopy (QEMR-PAS), in which the beat frequency response from a dual comb is frequency down-converted into the audio frequency domain. In this way, gas molecules act as an optical-acoustic converter through the photoacoustic effect, generating heterodyne sound waves. Unlike conventional DCS, where the light wave is detected by a wavelengthdependent photoreceiver, QEMR-PAS employs a quartz tuning fork (QTF) as a high-Q sound transducer and works in conjunction with a phase-sensitive detector to extract the resonant sound component from the multiple heterodyne acoustic tones, resulting in a straightforward and low-cost hardware configuration. This novel QEMRPAS technique enables wavelength-independent DCS detection for gas sensing, providing an unprecedented dynamic range of 63 dB , a remarkable spectral resolution of 43 MHz (or ), and a prominent noise equivalent absorption of .

Introduction

Dual-comb spectroscopy (DCS) is an emerging spectroscopic tool that combines the benefits of tunable laser absorption spectroscopy with the main characteristics of conventional broadband spectroscopy into a single platform . It has been considered as an attractive tool with a significant impact in diverse fields. For example, DCS has been applied to ultra-broadband infrared (IR) spectroscopy , near-field microscopy for subwavelength spatial resolution , high-precision metrology of molecular line centers , digital holography , nonlinear spectroscopy , and greenhouse gas monitoring . As DCS continues to
mature, the list of proof-of-concept experiments and applications will continue to expand.
DCS generally down-converts the optical response signals of two optical frequency combs to the radio frequency heterodyne signals through the beat note pairs of the dualcomb, thus overcoming the photoreceiver’s inability to react immediately to changes in light field strength, and the limitation in a single comb’s resolution imposed by a dispersive spectrometer. Moreover, DCS accomplishes Fourier transform spectroscopy without mechanical scanning . However, the challenges of using DCS to measure broadband spectroscopy were clear from very early on. First, the dynamic range of a DCS-based spectrometer is restricted by its single photoreceiver since it can only withstand limited optical power . With a fixed optical power, the distributed power of each comb tooth becomes lower as the number of teeth increases, resulting in a low signal-to-noise ratio (SNR). In addition, a photoreceiver receives all noise within its detection bandwidth, deteriorating its ultimate
performance. Secondly, the spectral resolution of a DCSbased spectrometer is determined by the comb mode linewidth as well as the time window during which the temporal waveform is measured . For gas-phase molecular spectroscopy in the near-infrared spectroscopy (NIR) spectral region, the linewidth of a pressure-broadened spectral line is within the range of . However, the linewidth of a Doppler-broadened spectral line at room temperature is within the range of . In Doppler-free spectroscopy, heavy molecules or cold samples have an even narrower linewidth . Ideally, the comb tooth spacing (the repetition frequency) should be similar to the desired spectral resolution. Hence, the tooth spacing must be adjustable over a wide range to interrogate all these spectral lines. On the other hand, extending the time window size to match narrower comb tooth spacing can increase the noise contribution and acquisition time when the majority of the signal components are observed. Thirdly, so far, although the spectral span of DCS has been able to cover 14 octaves across the terahertz (THz), infrared (IR), and visible range , commercially available photoreceivers used to access different spectral regions, are based on different material systems, such as silicon ( ), InGaAs , and . It means that an optical frequency comb in a specific spectral region requires an appropriate photoreceiver. A Fourier-Transform based optical frequency comb photoacoustic spectroscopy approach is reported to achieve high-resolution Fouriertransform spectroscopy without the need for a photoreceiver . However, compared to DCS-based technology, there is still potential for further advancements in terms of mechanical scanning-free and rapid measurements.
In total, 20 Hz to 20 kHz is the commonly referenced audio frequency range, having slower temporal dynamics than the typical vibrational-translational relaxation rates of gas molecules. Thus, gas molecules can be used as converters of the electromagnetic intensity changes into sound waves through the photoacoustic effect when the optical signals are frequency down-converted to the audio frequency domain. A sound transducer such as a microphone can then be employed, together with gas molecules, to form a dual-comb detector based on optical-to-acoustic-to-electric energy conversion. The advantage of this photoacoustic method is its wavelength independence, therefore making it applicable in dual-comb measurements ranging from the ultraviolet (UV) to the mid-infrared (MIR), even to the terahertz (THz), without detector switching. However, similar to the limitations imposed by a single photoreceiver in conventional DCS, the use of a wideband microphone imposes restrictions on the dynamic range and the ultimate spectral resolution, due to the simultaneous sampling of all photoacoustic signals and the time window of the Fourier transform.
Recently, quartz tuning fork (QTF), originally invented as a frequency standard for electronic clocks, has been widely
used as sound wave detectors in photoacoustic spectroscopy . The QTF is a piezo-electric element that converts its deformation into the separation of electrical charges, enabling it to detect weak acoustic pressure waves generated between its two prongs, where optical radiation interacts with a trace gas. Acoustically, the QTF possesses a quadrupole geometry that makes it selectively sensitive to the sound originating in a small space between its prongs. Sound waves from distant acoustic sources tend to move the QTF prongs in the same direction, thus resulting in no electrical response . Such characteristics determine its excellent environmental noise immunity and the simplest configuration. The QTF is mass-produced at very low cost ( ) and has been proven to operate over a wide temperature range from 1.56 K (superfluid helium) to . The QTF has a small footprint, allowing the realization of ultra-compact detection modules for analyzing gas samples down to a few in volume .
The combination of QTF and DCS in the audio frequency domain gives rise to a new technique of quartz-enhanced multiheterodyne resonant photoacoustic spectroscopy (QEMR-PAS), which has several advantages over the pho-toreceiver/microphone-based DCS for detecting multiheterodyne signals. The QTF is a sharply resonant acoustic transducer with extremely low internal losses, causing a super-high Q factor ranging from to . Hence, the acoustic energy can be accumulated in the QTF, dispensing with additional sonic enhancement elements, such as multipass cells . The super-high Q factor also provides a detection bandwidth of in the audio frequency domain, enabling high-performance acoustic filtering during optical-to-acoustic energy conversion. Moreover, as a resonant acoustic transducer, the QTF picks up the resonance signal from the multiheterodyne signals, thus offering a super-large linear dynamic range from the thermal noise to the QTF’s breakdown deformation, corresponding to the sound intensity level from -17 dB to 46 dB (see Supplementary Note S1), covering six orders of magnitude. However, it should be noted that a recent approach has been reported where all the comb lines are compressed into the sharp resonance profile of a QTF, followed by Fourier transform . This method is still based on the conventional DCS scheme, but the QTF is an ultra-narrow bandwidth transducer, unlike a wideband photoreceiver/microphone. Consequently, the number of comb teeth that can be utilized is limited by the QTF’s narrow bandwidth. Moreover, the resolution requirements brought by dense comb teeth also impose higher demands on the coherent time.
Different from the conventional DCS method, QEMRPAS extracts the frequency component that resonated with the QTF from the multiple heterodyne sound tones every time, thus removing the time-window restriction imposed by the Fourier transform method. Hence, QEMR-PAS has a lower mutual-coherence requirement
for two combs. In terms of the device, QEMR-PAS employs a simple phase-sensitive detector for the QTF signal processing instead of a complex Fourier transform instrument. The phase-sensitive detector acting as an electrical filter commonly has a electrical bandwidth during acoustic-to-electric energy conversion. The simultaneous realization of the super-narrow bandwidths in acoustics and electronics enables the high spectral resolution of QEMR-PAS.
In this manuscript, we provide a proof-of-concept of the QEMR-PAS technique. The beat frequency response from a dual comb is down-converted to the audio frequency domain. The energy levels of gas molecules are used as optical-acoustic converters, generating multiheterodyne sound signals. A QTF is used to “listen” to the sound resonant with its fundamental flexural mode from the multiheterodyne signals and convert it into a current signal. With this approach, a large-dynamic-range, highresolution, broad-bandwidth dual-comb spectrometer is achieved within a small footprint.

Results

Illustration of concept

The QEMR-PAS concept is illustrated in Fig. 1. A QTF is immersed in target gas, and a dual comb passes between two prongs of the QTF, as shown in Fig. 1a. The optical frequency components and of two optical frequency combs in QEMR-PAS are given by
where and represent the repetition rates of the two combs, respectively. is the optical carrier frequency, which is identical for the two combs when they are generated from the same laser source. The optical frequency shift of the combs is determined by and , with being variable. The subscript 1 and 2 identify the two combs, and represents the modulation order of electro-optic modulation and the comb line indices. It is assumed that and . When two combs are optically combined, this can be interpreted as a single frequency comb, as shown in Fig. 1b, with a modulation frequency in optical power
It is worth noting that the difference in the repetition rates and the optical frequency shift of the two combs is
set very small, i.e., , so that the beat frequencies fall in the audio frequency domain, producing an audio frequency comb. After this audio frequency comb interacts with the target gas through the photoacoustic effect, multiple heterodyne sound waves are generated. The sound waves can be detected by the QTF only when the following condition is satisfied
where is the resonance frequency of the fundamental flexural mode of the QTF. The value of for the sequence can be obtained by combining Eq. (4) and Eq. (5).
Then must be adjusted to satisfy Eq. (6) for different teeth in succession (as the index increases), as schematically depicted in Fig. 1c. As a result, the photoacoustic signal generated by each tooth of the audio frequency comb is detected by the QTF in turn, and the entire photoacoustic spectrum can be reconstructed.

Setup

The experimental apparatus of QEMR-PAS is depicted in Fig. 2a. A continuous-wave (CW) laser beam is split into two parts, which are frequency shifted by and , respectively, using two acousto-optic modulators (AOM). Each beam is transmitted through an electrooptic modulator (EOM) to generate an optical frequency comb with a repetition frequency and . Then the two beams recombine to produce a dual comb. of the dual-comb power is introduced into an erbium-doped fiber amplifier (EDFA) and a gas chamber, while the rest reaches a photoreceiver as a reference signal. In the gas chamber, target molecules are excited by the dual comb to a high-energy state, then generating multiple heterodyne sound waves through the molecular periodic collision relaxation process. A custom QTF (see Supplementary Note S2) is used to detect the resonant sound wave from the multiple heterodyne sound tones. The generated piezo-electric current is sent to a transimpedance preamplifier (PA) to be converted into a voltage signal. A quadrature lock-in amplifier (LIA-2) is used to demodulate the PA output signal at the QTF resonance frequency. The output of the photoreceiver is sent to another quadrature lock-in amplifier (LIA-1) as a reference signal, whose amplitude and phase are used to normalize the signal and to suppress the phase fluctuation of the system due to the asymmetry between the optical paths of two combs (see Supplementary Note S3).
Fig. 1 Illustration of QEMR-PAS. a Dual comb interacts with gas molecules and generates multiple heterodyne acoustic tones. The acoustic tone resonant with the QTF is enhanced and then converted into an electrical output by the QTF. b Conversion from an optical dual comb (on top) to an audio frequency comb (on bottom). An example of down-conversion is demonstrated (in the middle) where the carrier represents the optical frequency, and the envelope represents the modulation frequency in optical power. The red comb line in the audio frequency comb corresponds to the resonance frequency of the QTF. c QEMR-PAS utilizes a QTF to detect the sound wave generated by the photoacoustic effect. The red teeth in the audio frequency combs represent the components within the QTF response bandwidth at the different , and the gray shadow is the area of the QTF frequency response

Measurements

To provide a proof-of-concept of the QEMR-PAS technique, a mixture is used as the target sample to detect the line of the absorption band. A narrow linewidth whispering gallery mode laser with an output power of 10 mW is used as the CW laser. Figure 2b shows the PA output signal in the time domain. The sinusoidal-like waveform indicates the excellent capability of the QTF for filtering out the resonant sound signals thanks to its ultra-narrow bandwidth. As a supplement, the audio frequency comb from the photoreceiver output is mapped in the frequency domain, as shown in Fig. 2c. Considering the response time of the QTF ( ), the integration time of LIA2 was set to 300 ms , with an acquisition time of 2 seconds for each tooth. Since the 32 comb teeth used in our experiment, the total acquisition time was 64 seconds. It is
worth noting that the signal-to-noise ratio (SNR) is only related to the integration time rather than the acquisition time, as the phase-sensitive method is employed instead of Fourier transform.
The setting of determines which part of the dual comb is selected. For the optical detection of the analytes, the selected spectral range can vary from one tooth to the whole comb. For demonstration, the 32 comb teeth adjacent to the dominant frequency ( ) were selected. The total optical power of the dual comb is 320 mW , which is too high to be detected by a single-photoreceiver-based dual-comb spectrometer. The compression factor between acoustic and optical frequency axes is given by . The acquired photoacoustic spectrum is shown in Fig. 2d, normalized to the initial tooth intensity signal recorded by LIA-1.
Fig. 2 Schematic and results of the QEMR-PAS setup. a Experimental setup of QEMR-PAS. A continuous-wave (CW) laser is split into two beams. Each beam is modulated by an acousto-optic modulator (AOM) and an electro-optic modulator (EOM). 99% of the combined light is amplified by an erbium-doped fiber amplifier (EDFA), and the rest ( ) is sent to a photoreceiver. A lock-in amplifier (LIA-1) records the comb intensity and phase fluctuations. The signal from a QTF is amplified by a pre-amplifier (PA) and demodulated by a lock-in amplifier (LIA-2). The data is acquired by a personal computer (PC). b Piezoelectric signal from the QTF. It has a sinusoidal wave shape since the QTF just measures the resonant sound wave from the multiple heterodyne sound waves. c Audio frequency comb generated through the down-conversion of the optical dual comb. The audio frequency comb is obtained by a spectrum analyzer using the output signal of the photoreceiver. d Normalized absorption spectrum of acetylene gas acquired by QEMR-PAS (light blue dots) and contrast with the Hitran model (solid black line) at normal pressure and temperature
To assess the dynamic range of the system, the response curve of the custom QTF as a function of the excitation frequency is measured, as shown in Fig. 3a. The ultranarrowband filtering capability ( ) is observed around the QTF’s resonance frequency of 15849.4 Hz , resulting in a factor of 15000 . Moreover, the QTF exhibits an excellent linear response at its resonance frequency from thermal noise level ( ) to nearly breakdown voltage ( ), which has been experimentally verified (see Supplementary Note S1). The result indicates that the dynamic range of the QTF for sound intensity measurement has a wide span of 63 dB . Subsequently, a concentration measurement experiment is carried out. The QEMR-PAS peak signals of the line are displayed in Fig. 3b as a function of the concentration level, which successfully demonstrates the excellent linear relationship between the gas concentration and QEMR-PAS signal amplitude ( value of 0.999 ). The QEMR-PAS signals for the low concentration levels from are shown in the inset of Fig. 3b.
The SNR is defined as the ratio of the mean value of the peak signals to the value of their standard deviation. At the lowest concentration of 40 ppm , an SNR of was estimated, corresponding to a detection limit of 4 ppm. Therefore, the linear dynamic range of the system exceeds 40 dB , which is restricted by the gas concentration levels achieved during the experiment. There is still a dynamic reserve of 20 dB to receive the stronger sound signal.
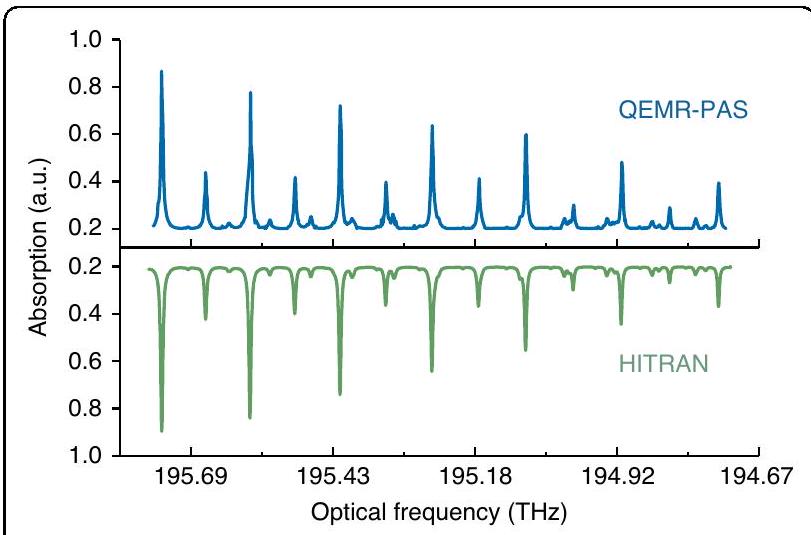
The spectral resolution of a reconstructed spectrum is one of the most important parameters for spectroscopic analysis. An overlapping spectrum of ammonia consisting of three discrete features near 1531.68 nm is measured to evaluate the QEMR-PAS spectral resolution, as shown in Fig. 4. It is noteworthy that, with an increase in pressure, the photoacoustic signal exhibits an initial rise followed by a subsequent decline. Since we are focusing on resolution, the photoacoustic signal is normalized to the highest value in Fig. 4. The whispering gallery mode laser emitting around 1531 nm is employed as the light source with an ultra-narrow laser linewidth of
Fig. 3 Dynamic range of QEMR-PAS. a Frequency response curve of the custom QTF. QEMR-PAS signal as a function of gas concentration. The acetylene concentration levels vary from 40 ppm to . The inset on the right demonstrates the QEMR-PAS linearity at low concentrations from, 40 ppm to 200 ppm
Fig. 4 QEMR-PAS spectra of ammonia measured at different spectral resolutions and pressures. a Spectral resolution of 1 GHz at the pressure of 670 Torr. Three spectral features overlap each other. b Spectral resolution of 700 MHz at the pressure of 200 Torr. The third feature completely separates from the first two. c Spectral resolution of 43 MHz at the pressure of 100 Torr. The three features are well separated. The horizontal axis represents the offset frequency from 195.7368 THz ( 1531.68 nm )
a few Hz , which can be utilized to study the ultimate limit to the spectral resolution of QEMR-PAS. The spectrum of is reconstructed by the QEMR-PAS system at 670 Torr (Fig. 4a), 200 Torr (Fig. 4b) and 100 Torr (Fig. 4c). With the pressure decreasing, the three absorption features gradually separate as a result of the linewidth narrowing of each feature. In Fig. 4a, the spectral resolution of the system is set to 1 GHz , which is directly determined by the comb spacing. At 200 Torr (Fig. 4b), the comb spacing of the system is set to 700 MHz . At this pressure, the absorption feature peaking at the higher frequency completely separates from the other two. At 100 Torr, the three features are well separated from each other, with the spectral resolution set to 43 MHz (Fig. 4c). The QEMR-PAS system exhibits the ability to distinguish the ammonia absorption lines at low pressures due to the ultra-narrow bandwidth
of the QTF. In theory, the QEMR-PAS spectral resolution is just limited by laser linewidth. Higher spectral resolution (meaningful for spectral reconstruction of Dopplerfree absorption features) has not been tested.
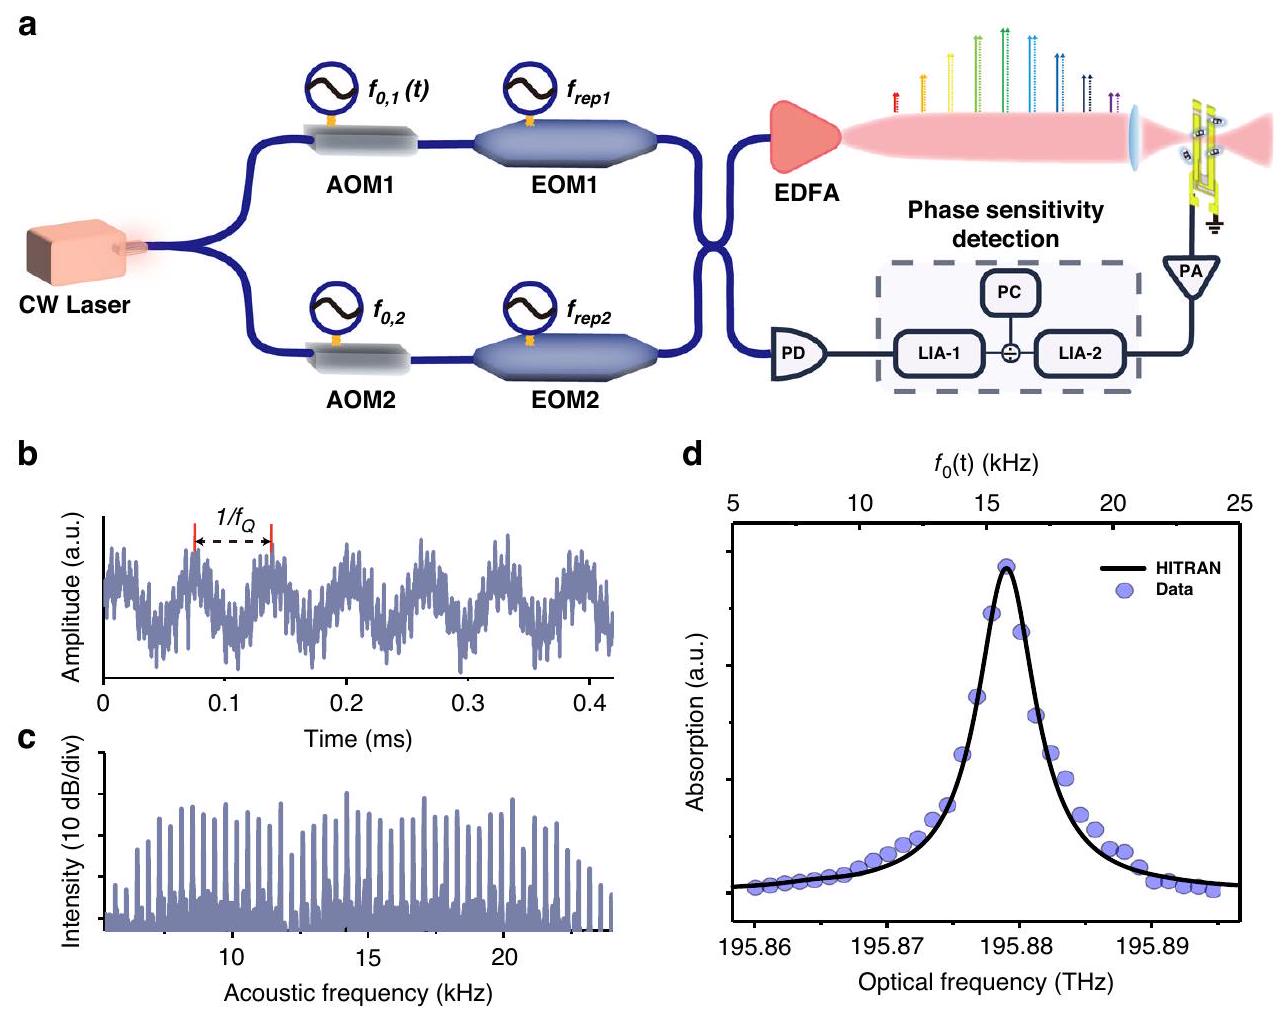
The employed optical frequency comb has 32 comb teeth evenly arranged on both sides of the dominant frequency with a comb spacing of 1 GHz . Therefore, the frequency comb can cover a frequency span of 31 GHz , significantly larger than the typical mode-hop-free tuning ranges of NIR diode lasers. If more dominant frequencies are provided, a broadband spectrogram with high spectral resolution can be achieved. Hence, an external cavity diode laser (ECDL) is employed. By tuning the ECDL frequency in a step-wise manner, the dual-comb spans nearly 1 THz . For a mixture, each QEMRPAS measurement is carried out with a spectral resolution of 1 GHz . The spectral stitching is applied to obtain the
Fig. 5 QEMR-PAS and simulated spectra of acetylene from 194.73 THz to . The blue curve on the top is the measured spectra using QEMR-PAS, and the green curve on the bottom is the simulated spectra using the Hitran database
entire spectrogram, as shown in Fig. 5. The P-branch spectral lines in band of are well-resolved from 194.73 THz to to 1539.54 nm ), showing a good agreement with the simulated spectra using the Hitran database.

Performance analysis

Phase-sensitive detection, different from the Fourier transform in conventional DCS, is a powerful tool for filtering small sinusoidal signals out of random noise, even in extremely noisy environments. The QTF is a resonant sound transducer, which is very suitable for working with a phase-sensitive detector to complete the acoustic and electrical filtering in order. In the QEMRPAS technique, the QTF acts as an audio filter with a narrow acoustic detection bandwidth (typically a few hertz), removing the acoustic noise outside of its detection bandwidth and extracting the resonant acoustic component from multiple heterodyne sound waves. The phase-sensitive detector after the QTF enables an extremely narrow electrical detection bandwidth (typically 0.1 Hz ), further reducing the electronic noise. Thus, a high SNR is reached using the two-stage narrow bandwidth filtering in the processes of optical-acoustic and acoustic-electric conversions, respectively.
A background noise analysis of QEMR-PAS shows that two primary noise sources are the thermal noise associated with mechanical dissipation in the QTF and the thermal noise of the feedback resistor (see Supplementary Note S4). At the same time, the signal amplitude of QEMR-PAS is proportional to the optical power of the two teeth involved in the generation of the beat note, the factor of QTF, the concentration of target species, and inversely proportional to the QTF resonance frequency.
Therefore, the SNR of QEMR-PAS can be expressed as:
where is the rms voltage noise at the pre-amplifier output, is the concentration of the target species, , are the optical powers of the two neighboring teeth of the two combs, is the temperature, is the equivalent resistor of the QTF, is the gain resistor of the pre-amplifier, and is Boltzmann constant.
For conventional DCS, the SNR can be written as :
where M is the number of comb teeth, and are the optical powers of the two combs, NEP is the photoreceiver’s noise equivalent power, and is the averaging time. By comparing Eqs. (7), (9), QEMR-PAS removes the averaging time , which is imposed by the Fourier transform for the full spectrum analysis. Instead, QEMR-PAS utilizes the integration time of the lock-in amplifier (LIA) for each tooth. However, it is important to note that this does not imply that QEMR-PAS achieves a faster acquisition time. In fact, in the acoustic frequency domain, the acquisition time of QEMR-PAS is longer compared to a RF dual-comb spectrometer due to its lower frequency . Furthermore, the QTF with a high Q value results in a longer accumulation time. The longer acquisition times represent a trade-off amongst the dynamic range, sensitivity, and detection cost. Moreover, Hertz/sub-Hertz levels of detection bandwidths in acoustics ( ) and electronics ( ) further improve the QEMR-PAS SNR. In conventional DCS, the shot-noiselimited SNR does not apply, but the photoreceiver’s NEP dominates, according to Eq. (9). Clearly, the route to a higher SNR for conventional DCS is the longer averaging time and the lower NEP.
For a comparison, the Eq. (9) can be rewritten as:
Although there is the same factor in Eqs. (7), (10), their range of values is significantly different. In conventional DCS, the high peak intensity of the frequency comb-the temporal nature of the ultrashort pulse-does not bring any advantages but limits the dynamic range of the
interferometric signal by saturating a photoreceiver or a digitizer. For example, a commercial 100 MHz InGaAs amplified photoreceiver might have a limited of (given by the ratio of the maximum peak power to the NEP integrated over a detection bandwidth of ), which limits further SNR improvement in conventional DCS. Conversely, QEMRPAS can benefit from the high optical power levels for comb. A previous work demonstrated that with a 1.4 W optical power excitation from a single mode CW laser emitting at 1560 nm , a detection sensitivity of ppb level can be achieved in quartz-enhanced photoacoustic spectroscopy without saturation behavior, thanks to a superlarge linear dynamic range of QTF. This means that a tooth power in QEMR-PAS can be set up to 1.4 W further to improve the SNR.
Differential phase noise between the combs is not involved in Eqs. (7), (9). Even in mutually coherent combs, a residual phase noise pedestal exists on any given tooth. Phase noise at Fourier frequencies below the tooth spacing will contribute to slow baseline variations, and those
Fig. 6 Allan variance stability analysis of the QEMR-PAS system.
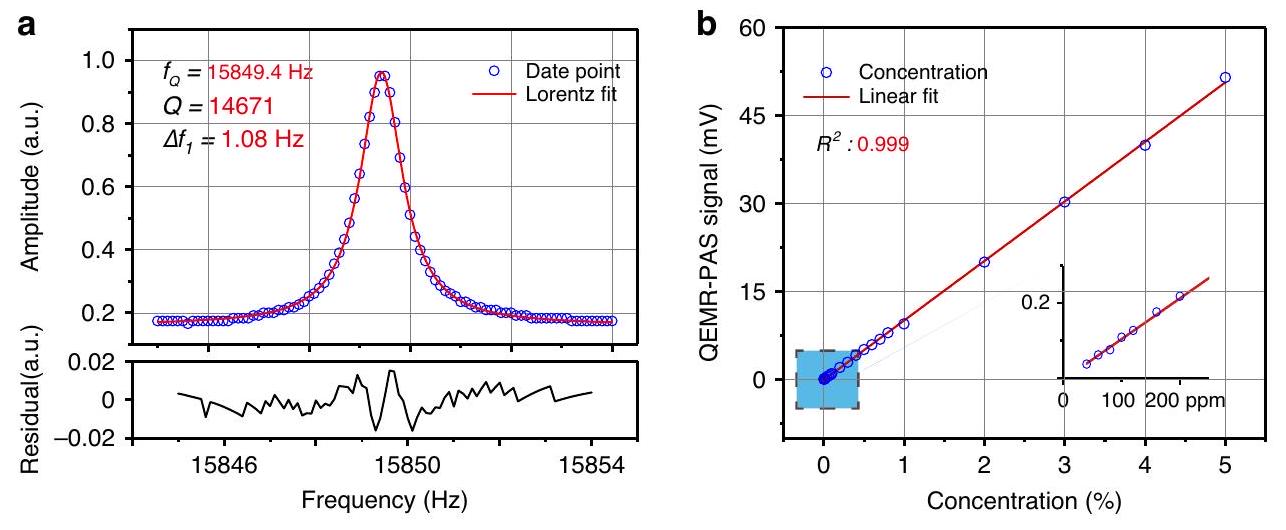
The red data point represents the Allan variance of the QEMR-PAS system when operating with pure
above tooth spacing will affect neighboring comb teeth, limiting the SNR. In our experiment, an active real-time phase correction was employed, suppressing the differential phase noise (see Supplementary Note S3).
To assess the long-term stability of the QEMR-PAS system, an Allan variance analysis for the main comb tooth component ( ) was conducted with pure while varying the averaging time. The results depicted in Fig. 6 reveal that the sensitivity of the QEMR-PAS system can be enhanced by extending the averaging time. Specifically, an optimal detection limit of 50 ppb was achieved with an averaging time of 316 s .
A side-by-side comparison of performance for conventional DCS, dual-frequency comb photoacoustic spectroscopy (DC-PAS) based on a microphone and QEMR-PAS is shown in Table 1. For conventional DCS, two types of photoreceivers, InGaAs for NIR-DCS and HgCdTe for MIR-DCS, are considered for a spectral coverage of 0.8 and , respectively. However, QEMR-PAS and DC-PAS offer wavelength-independent detectors, enabling spectral detection across a wide range from UV to THz. This is achieved by detecting sound wave rather than relying on optical waves. For quantitative measurements, in cases where suitable photoreceivers are unavailable for a specific wavelength range, the reference signal could be alternatively implemented through the photoacoustic detection of black-body absorption to measure the intensity of light. Furthermore, the QEMR-PAS technique has a dynamic range of 63 dB with a spectral resolution of 43 MHz , which is several orders of magnitude better than that of NIR-DCS, MIR-DCS and DC-PAS. The total integration time is determined by multiplying 0.3 s by the number of combs, which results in 9.6 s . The predicted noise ( ) of QEMRPAS is calculated to be when substituting into Eq. (8). The predicted value is in excellent agreement with the experimental value of . Such a noise level results in a noise equivalent absorption (NEA) of , which is one order of magnitude better than DC-PAS and same order as NIR-PAS and MIR-PAS. The corresponding normalized noise equivalent absorption coefficient (NNEA) is .
Table 1 Side-by-side performance comparison between conventional DCS and QEMR-PAS
Techniques Detector Type Spectral coverage of detector ( ) Dyna-mic range (dB) Spectral resolution (GHz) Avera-ging time (s) Detection limit (ppm) NEA ( )
NIR-DCS InGaAs 0.8-1.6 27 1 0.0025
MIR-DCS HgCdTe 3-10 22 0.5 2 Mixture: –
DC-PAS Microph-one All band 45 1 1000
QEMR-PAS QTF All band 60 0.043 9.6

Discussion

In summary, extending DCS to broadband wavelength coverage with a large dynamic range and a high spectral resolution requires getting rid of the constraints of the principle and device of conventional DCS. Here we demonstrated the QEMR-PAS technique, in which a QTF selectively detects an audio frequency component of multiple heterodyne sound waves generated by a dual comb through the photoacoustic effect. Hence, the QEMR-PAS technique eliminates the need for wavelength-dependent photoreceivers and reduces computational complexity of Fourier transforms in conventional DCS. Instead, a miniature QTF and a simple phasesensitive detector were employed as a sound transducer and a narrow band filter, which enables the development of a compact, low-cost sensor based on QEMR-PAS. Furthermore, the QEMR-PAS technique provides a wavelength-independent DCS detection method. The results show that this new technique is capable of providing an ultra-large dynamic range of 63 dB and ultranarrow spectral resolution of 43 MHz (or ). In terms of NEA, there is only an order of magnitude improvement over DC-PAS. But we still have a reserve in dynamic range. The technological developments of optical frequency combs with higher average power (high pulse energies), up to watt level , will bring huge benefits for QEMR-PAS, which is expected to lead to further improvement in detection sensitivity through the use of high power optical frequency comb in the near future.
It is worth noting that while utilizing a QTF offers several advantages, including wavelength-independent response, large dynamic range, and high sensitivity, it also results in a longer acquisition time for the system due to the high Q value of the QTF. In future studies, the proposed QEMR-PAS technique can be combined with beat frequency detection to effectively reduce the system’s acquisition time. Meanwhile, while the current demonstration of the QEMR-PAS system relies on electro-optic combs, we firmly believe that QEMR-PAS holds great promise for application with mid-infrared combs for stronger gas absorption. This can be achieved by utilizing mid-infrared electro-optic frequency comb and employing custom acousto-optic shifters based on germanium.

Materials and methods

Dual-comb source

A free-running CW laser is used to generate a dual comb. The optical frequency shifts and are provided by two acousto-optic modulators, respectively. varied from to and . The modulate frequencies of two electrooptic modulations are and
, where represents the resonance frequency of the QTF, represents the preset number of comb teeth. All modulation sources are synchronized together to a 10 MHz frequency standard to ensure mutual-coherence in the modulation process.

QEMR-PAS system

The comb light passes through the gas chamber and the QTF. A custom QTF ( ) is used to realize QEMR-PAS. The electrical signal output is introduced into a pre-amplifier, then demodulated by LIA-2. LIA-1 is used to demodulate the reference signal from the photoreceiver. The phase fluctuations of the system are given by LIA-1 and used to synchronize with LIA-2. The normalized absorption spectrum is given by the ratio of the value of LIA-2 to that of LIA-1. The final signal value of each comb tooth is averaged over the acquisition time.

Calculation of NNEA

The NNEA coefficient can be determined by the formula . Here, represents the total power of the combs, and is the number of spectral lines, yielding the average power for each spectral line ( 10 mW ). The minimum detectable absorption coefficient, is calculated as , sourced from the HITRAN database, when the absorption wavelength of the target trace gas and the detection limit of the sensor are known. The electrical filter bandwidth is determined as 0.59 Hz when the time constant and filter slope of the LIA-2 is set as 300 ms and 12 dB , respectively.

Acknowledgements

The project is sponsored by National Natural Science Foundation of China (NSFC) (Nos. 62235010, 62175137, 62122045, 62075119); The Shanxi Science Fund for Distinguished Young Scholars (20210302121003). The authors from Dipartimento Interateneo di Fisica di Bari acknowledge financial support from THORLABS GmbH within the PolySenSe Joint-research Laboratory.

Author details

State Key Laboratory of Quantum Optics and Quantum Optics Devices, Institute of Laser Spectroscopy, Shanxi University, Taiyuan 030006, China. Collaborative Innovation Center of Extreme Optics, Shanxi University, Taiyuan 030006, China. PolySense Lab, Dipartimento Interateneo di Fisica, University and Politecnico of Bari, CNR-IFN, Via Amendola 173, 70126 Bari, Italy

Author contributions

J.W. and H.W. designed the experiments. S.J. and L.D. supervised the project. A.S., P.P., V.S. performed the reported experiments. L.D. and H.W. conducted the experimental analysis. J.W., H.W. and L.D. prepared the manuscript. All the work has been carried out under the supervision of L.D.

Data availability

The authors declare that all data supporting the findings of this study can be found within the paper and its Supplementary information files. Additional data supporting the findings of this study are available from the corresponding author (L.D.) upon reasonable request.

Conflict of interest

The authors declare no competing interests.
Supplementary information The online version contains supplementary material available at https://doi.org/10.1038/s41377-024-01425-1.
Received: 31 October 2023 Revised: 11 March 2024 Accepted: 12 March 2024
Published online: 22 March 2024

References

  1. Coddington, I., Newbury, N. & Swann, W. Dual-comb spectroscopy. Optica 3, 414-426 (2016).
  2. Picqué, N. & Hänsch, T. W. Frequency comb spectroscopy. Nat. Photonics 13, 146-157 (2019).
  3. Schiller, S. Spectrometry with frequency combs. Opt. Lett. 27, 766-768, (2002).
  4. Okubo, S. et al. Near-infrared broadband dual-frequency-comb spectroscopy with a resolution beyond the Fourier limit determined by the observation time window. Opt. Express 23, 33184-33193, (2015).
  5. Hoghooghi, N. et al. Broadband 1-GHz mid-infrared frequency comb. Light Sci. Appl. 11, 264 (2022).
  6. Brehm, M., Schliesser, A. & Keilmann, F. Spectroscopic near-field microscopy using frequency combs in the mid-infrared. Opt. Expr. 14, 11222-11233 (2006).
  7. Pistore, V. et al. Self-induced phase locking of terahertz frequency combs in a phase-sensitive hyperspectral near-field nanoscope. Adv. Sci. 9, 2200410 (2022).
  8. Baumann, E. et al. Spectroscopy of the methane band with an accurate midinfrared coherent dual-comb spectrometer. Phys. Rev. A 84, 062513 (2011).
  9. Cassinerio, M. et al. Absolute dual-comb spectroscopy at by freerunning Er: fiber lasers. Appl. Phys. Lett. 104, 231102 (2014).
  10. Vicentini, E. et al. Dual-comb hyperspectral digital holography. Nat. Photonics 15, 890-894 (2021).
  11. Ideguchi, T. et al. Coherent Raman spectro-imaging with laser frequency combs. Nature 502, 355-358 (2013).
  12. Rieker, G. B. et al. Frequency-comb-based remote sensing of greenhouse gases over kilometer air paths. Optica 1, 290-298, (2014).
  13. Ycas, G. et al. Compact mid-infrared dual-comb spectrometer for outdoor spectroscopy. Opt. Express 28, 14740-14752, (2020).
  14. Wang, Q. et al. Dual-comb photothermal spectroscopy. Nat. Commun. 13, 2181 (2022).
  15. Coddington, I., Swann, W. & Newbury, N. Coherent dual-comb spectroscopy at high signal-to-noise ratio. Phys. Rev. A 82, 043817 (2010).
  16. Yasui, T. et al. Super-resolution discrete Fourier transform spectroscopy beyond time-window size limitation using precisely periodic pulsed radiation. Optica 2, 460-467, (2015).
  17. Demtröder, W. Laser Spectroscopy. (Heidelberg: Springer, 1982).
  18. Svanberg, S. Atomic and Molecular Spectroscopy: Basic Aspects and Practical Applications. (Heidelberg: Springer, 2012).
  19. Rösch, M. et al. On-chip, self-detected terahertz dual-comb source. Appl. Phys. Lett. 108, 171104 (2016).
  20. Muraviev, A. V. et al. Massively parallel sensing of trace molecules and their isotopologues with broadband subharmonic mid-infrared frequency combs. Nat. Photonics 12, 209-214 (2018).
  21. Sterczewski, L. A. et al. Terahertz hyperspectral imaging with dual chip-scale combs. Optica 6, 766-771 (2019).
  22. Wei, T. T. et al. High and flat spectral responsivity of quartz tuning fork used as infrared photodetector in tunable diode laser spectroscopy. Appl. Phys. Rev. 8, 041409 (2021).
  23. Sadiek, I. et al. Optical frequency comb photoacoustic spectroscopy. Phys. Chem. Chem. Phys. 20, 27849-27855 (2018).
  24. Wildi, T. et al. Photo-acoustic dual-frequency comb spectroscopy. Nat. Commun. 11, 1-6 (2020).
  25. Friedlein, J. T. et al. Dual-comb photoacoustic spectroscopy. Nat. Commun. 11, 3152 (2020).
  26. Kosterev, A. A. et al. Quartz-enhanced photoacoustic spectroscopy. Opt. Lett. 27, 1902-1904, (2002).
  27. Wu, H. P. et al. Beat frequency quartz-enhanced photoacoustic spectroscopy for fast and calibration-free continuous trace-gas monitoring. Nat. Commun. 8, 15331 (2017).
  28. Milde, T. et al. QEPAS sensor for breath analysis: a behavior of pressure. Appl. Opt. 57, C120-C127 (2018).
  29. Yi, H. M. et al. T-shape microresonator-based high sensitivity quartz-enhanced photoacoustic spectroscopy sensor. Opt. Express 20, 9187-9196, (2012).
  30. Kosterev, A. A. et al. Applications of quartz tuning forks in spectroscopic gas sensing. Rev. Sci. Instrum. 76, 043105 (2005).
  31. Blaauwgeers, R. et al. Quartz tuning fork: Thermometer, pressure-and viscometer for helium liquids. J. Low. Temp. Phys. 146, 537-562 (2007).
  32. Wu, H. P. et al. Enhanced near-infrared QEPAS sensor for sub-ppm level detection by means of a fiber amplified 1582 nm DFB laser. Sens. Actuators, B 221, 666-672 (2015).
  33. Cui, R. Y. et al. Generalized optical design of two-spherical-mirror multipass cells with dense multi-circle spot patterns. Appl. Phys. Lett. 116, 091103 (2020).
  34. Ren, X. Y. et al. Dual-comb quartz-enhanced photoacoustic spectroscopy. Photoacoustics 28, 100403 (2022).
  35. Schibli, T. R. et al. Optical frequency comb with submillihertz linewidth and more than 10 W average power. Nat. Photonics 2, 355-359 (2008).
  36. Cingöz, A. et al. Direct frequency comb spectroscopy in the extreme ultraviolet. Nature 482, 68-71 (2012).
  37. Yan, M. et al. Mid-infrared dual-comb spectroscopy with electro-optic modulators. Light Sci. Appl. 6, e17076 (2017).
  38. Martín-Mateos, P. et al. Frequency accurate coherent electro-optic dual-comb spectroscopy in real-time. Opt. Expr. 26, 9700-9713 (2018).
  39. Nitzsche, L. et al. Tunable dual-comb spectrometer for mid-infrared trace gas analysis from 3 to . Opt. Expr. 29, 25449-25461 (2021).

  1. Correspondence: Lei Dong (donglei@sxu.edu.cn)
    State Key Laboratory of Quantum Optics and Quantum Optics Devices, Institute of Laser Spectroscopy, Shanxi University, Taiyuan 030006, China
    Collaborative Innovation Center of Extreme Optics, Shanxi University, Taiyuan 030006, China
    Full list of author information is available at the end of the article These authors contributed equally: Jiapeng Wang, Hongpeng Wu.