علاقات ستوكيومترية طويلة الأمد متسقة بين المغذيات والكلوروفيل-أ عبر البحيرات الضحلة Consistent stoichiometric long-term relationships between nutrients and chlorophyll-a across shallow lakes

المجلة: Nature Communications، المجلد: 15، العدد: 1
DOI: https://doi.org/10.1038/s41467-024-45115-3
PMID: https://pubmed.ncbi.nlm.nih.gov/38280872
تاريخ النشر: 2024-01-27

علاقات ستوكيومترية طويلة الأمد متسقة بين المغذيات والكلوروفيل-أ عبر البحيرات الضحلة

تاريخ الاستلام: 31 يوليو 2023
تاريخ القبول: 15 يناير 2024
تاريخ النشر على الإنترنت: 27 يناير 2024

تحقق من التحديثات

دانيال غريبر © , مارك ج. مكارثي , توم شاتويل (ب) , ديترش بورشاردت (ب) , إريك جيبسن , مارتن سوندرغارد , توربن ل. لوريدسن & توماس أ. دافيدسون (1)

الملخص

تتعرض النظم البيئية المائية للتهديد بسبب الإثراء الناتج عن تلوث العناصر الغذائية. في البحيرات، يتسبب الإثراء في مجموعة من الآثار الضارة، مثل ازدهار الطحالب الضارة، وموت الأسماك، وزيادة انبعاثات الميثان. ومع ذلك، فإن الاستجابات الخاصة بالبحيرات للتغيرات في العناصر الغذائية متغيرة للغاية، مما يعقد إدارة الإثراء. قد تكون هذه الاستجابات الخاصة بالبحيرات ناتجة عن محركات عشوائية قصيرة الأمد تطغى على العلاقات الطويلة الأمد المستقلة عن البحيرات بين العوالق النباتية والعناصر الغذائية. هنا، نوضح أن هناك علاقات ستيوكيومترية قوية طويلة الأمد بين العناصر الغذائية والكلوروفيل أ (Chla) لمدة 5 سنوات من المتوسطات المتحركة البسيطة (SMA، الوسيط ) على طول تدرج نسب النيتروجين الكلي إلى الفوسفور الكلي (TN:TP). هذه العلاقات الستيوكيومترية متسقة عبر 159 بحيرة ضحلة (تعرف بعمق متوسط ) من قاعدة بيانات مفتوحة الوصول عبر القارات. نحسب بقايا SMA لمدة 5 سنوات لتقييم التغيرات قصيرة الأمد ونجد تباينًا كبيرًا في Chla قصير الأمد والذي يرتبط بشكل ضعيف بتركيزات العناصر الغذائية (الوسيط ). مع تمثيل البحيرات الضحلة 89% من بحيرات العالم، يمكن أن تحسن العلاقات الستيوكيومترية الطويلة الأمد المحددة إدارة العناصر الغذائية الكمية عالميًا في كل من البحيرات ومناطق تجمعها من خلال استراتيجية قائمة على نسبة العناصر الغذائية.

يتطلب التحكم في الإثراء إدارة الأحمال الخارجية من الفوسفور الكلي (TP) والنيتروجين الكلي (TN) إلى النظم البيئية للبحيرات . تم اقتراح أنماط عالمية من نمو العوالق النباتية الناقصة من N أو P، مع عتبات عند نسب TN:TP المولية < 20 لنقص N و لنقص P، بناءً بشكل أساسي على قياسات مختبرية موحدة . ومع ذلك، أظهرت بيانات مراقبة البحيرات اللحظية استجابات متغيرة لتغيرات تركيزات TN وTP عند نسب TN:TP مختلفة، والتي تم نسبها إلى اختلافات في خصائص البحيرة أو منطقة التجمع
الخصائص , مع عتبات واضحة تتراوح من TN:TP لنقص N و لنقص P . بسبب التباينات الكبيرة في العلاقات بين العناصر الغذائية والكلوروفيل (Chla) حتى بين مجموعات البحيرات المتجانسة، تم اقتراح تحويلات لوغاريتمية لوغاريتمية لـ ، وقد تم استخدامها لاكتشاف التغيرات في السيطرة الظاهرة لـ TN أو TP على كتلة العوالق النباتية . علاوة على ذلك، نظرًا لأن قياسات TN وTP وكتلة العوالق النباتية (مثل Chla) ليست مستقلة، غالبًا ما تعتبر العلاقات
تكرارية . من حيث ديناميات العناصر الغذائية، تتضمن العديد من برامج مراقبة البحيرات ومجموعات البيانات فقط تركيزات العناصر الغذائية الكلية وChla، والتي لا تتضمن معلومات عن توافر العناصر الغذائية أو ديناميات العناصر الغذائية الداخلية في البحيرة . بدون بيانات ميكانيكية تصف ديناميات العناصر الغذائية الداخلية والتوافر الحقيقي، غالبًا ما نترك مع بيانات العناصر الغذائية الكلية وChla التي يمكننا من خلالها تقييم العلاقات بين العناصر الغذائية والعوالق النباتية. نعتقد أنه من خلال فهم مصدر التباين العالي الخاص بالبحيرات في العلاقات بين العناصر الغذائية الكلية وChla، وخصائص التكرار الظاهر، يمكن تمييز الأنماط العالمية لعلاقات N وP مع نمو العوالق النباتية في النظم البيئية للبحيرات الضحلة.
اقترح ستراير وآخرون أن تحليلات الإشارات البيئية طويلة الأمد مناسبة لثلاث ظواهر: العمليات البطيئة، الأحداث النادرة، والعمليات الدقيقة. قد يكون الإثراء مثالًا رئيسيًا على عملية دقيقة، حيث تصبح الروابط بين Chla والعناصر الغذائية واضحة فقط على المدى الطويل بسبب التغيرات غير القابلة للتنبؤ من عام إلى عام
التغيرات الدقيقة . تساهم التقلبات العشوائية السنوية في عوامل مثل فترات خالية من الجليد، وتغيرات في تركيب العوالق النباتية، ومحتوى صبغة العوالق النباتية، وتأثيرات سلسلة الغذاء من الأعلى إلى الأسفل في تباين كبير في استجابات العوالق النباتية لتغيرات N أو P . من خلال فصل الإشارات طويلة الأمد عن نظيراتها قصيرة الأمد، يجب أن تظهر علاقة أوضح بين كتلة العوالق النباتية وتركيزات العناصر الغذائية (الشكل 1).
من خلال دمج تحليل الإشارات طويلة الأمد مع فهم أعمق لتكرارية العناصر الغذائية وChla، قد نكون قادرين على اكتشاف أنماط نمو مجتمع العوالق النباتية بشكل أفضل بالنسبة لـ TN وTP. على وجه التحديد، يجب أن تكون التكرارية صالحة فقط خلال موسم النمو، عندما قد يتم احتواء معظم مجموعة العناصر الغذائية الكلية داخل كتلة العوالق النباتية. خلال موسم النمو، يجب ألا تنطبق التكرارية إذا كان عنصر غذائي موجودًا بكثرة، كما هو موضح بواسطة لويس وورتسباو لعلاقة TP-Chla تحت فائض P. نقترح أن التكرارية وتراكم العناصر الغذائية لهما
استخراج المتوسطات المتحركة البسيطة لمدة 5 سنوات (SMA) وبقاياها
أخذ عينات عشوائية وارتباط بين Chla والعناصر الغذائية ضمن نوافذ TN:TP
الشكل 1 | الرسم البياني المفاهيمي لتحليلات البيانات التي تم إجراؤها ونتائجها المفترضة. استخدمنا متوسطات موسم النمو لسلاسل زمنية للبحيرات الضحلة لحساب المتوسطات المتحركة البسيطة لمدة 5 سنوات (SMA)، والتي تعمل كمرشح منخفض التمرير لاستخراج التغيرات طويلة الأمد. استخدمنا بقايا SMA لمدة 5 سنوات، المحسوبة على أنها ملاحظة موسم النمو مطروحًا منها SMA لنفس العام، كمرشح عالي التمرير لكشف التغيرات قصيرة الأمد . قمنا بتقييم أطوال SMA مختلفة ووجدنا أن 5 سنوات هي المثالية (انظر الطرق والمعلومات الإضافية للتفاصيل). قمنا بتصنيف البيانات إلى “نوافذ” TN:TP متداخلة لتقييم الرابط بين TN وTP وChla ضمن نطاقات مختلفة من TN:TP (B). هنا، استخدمنا اللوغاريتم الطبيعي لنسب TN:TP لأن النسب تتبع توزيع لوغاريتمي طبيعي . لكل نافذة TN:TP،
B
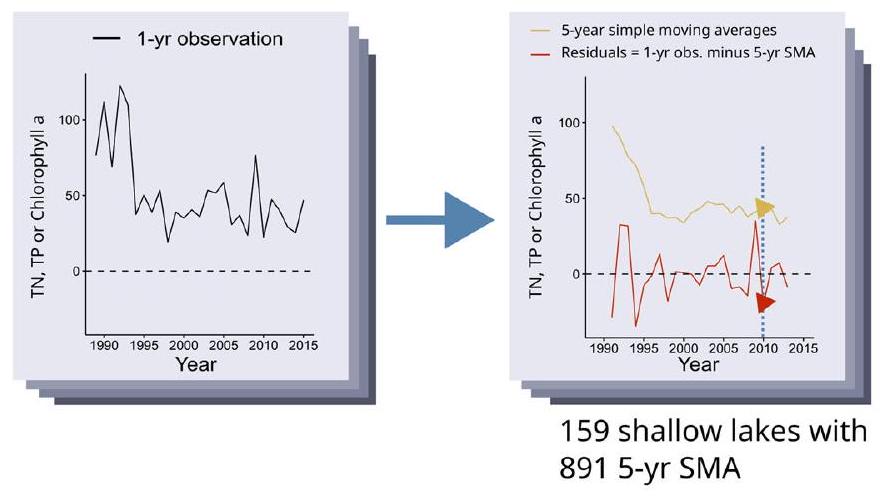
تقسيم إلى نوافذ نطاق TN:TP
D
SMA لمدة 5 سنوات، العناصر الغذائية الكلية مقابل Chla على طول TN:TP
تم أخذ عينات البيانات عشوائيًا 300 مرة باستخدام إجراء Bootstrap هرمي لاستبعاد الاعتماد الزمني للبيانات المأخوذة عشوائيًا . لكل عينة عشوائية، قمنا بحساب نماذج خطية عامة مع توزيع غاما (SMA لمدة 5 سنوات) أو نماذج خطية (بقايا SMA) للعلاقة بين Chla وTP و/أو TN، واستخرجنا ومعاملات النموذج ( ). تم عرض انحدارات النموذج و في النص الرئيسي، انظر الطرق والمعلومات الإضافية للتفاصيل حول Bootstrap ومعاملات النموذج الأخرى. نفترض انحدارات نموذج TP عالية، و وتركيزات منخفضة من العناصر الغذائية المائية التفاعلية في شكل فوسفور قابل للذوبان (SRP) عند نسب TN:TP أعلى، وانحدارات نموذج TN عالية، و وتركيزات منخفضة من N المائي التفاعلي على شكل نترات-N عند نسب TN:TP أقل (D).
متغير ستيوكيومتري، حيث يمكن أن تتراكم العناصر الغذائية المذابة عندما يكون امتصاص العوالق النباتية لعنصر غذائي مذاب مقيدًا بتوافر عنصر غذائي آخر (الشكل 1). في هذه الحالة، قد يتراكم العنصر الغذائي في الفائض النسبي في عمود الماء في شكل مذاب وتفاعلي . تتفق هذه الفكرة مع نماذج بيئية سابقة ، التي اقترحت حدود ستيوكيومترية لمحتويات خلايا العوالق النباتية من N وP اعتمادًا على تركيزات N وP في الماء، مع تراكم العناصر الغذائية التفاعلية إذا كانت هذه العناصر متاحة بكثرة. علاوة على ذلك، تفترض هذه المقاربة أن قياسات تركيزات أشكال العناصر الغذائية التفاعلية يمكن أن تلتقط التوافر الحقيقي للعناصر الغذائية في النظام إلى حد كبير. إذا كانت الأنماط المقترحة لتراكم وتوافر N وP النسبية مستقلة عن البحيرات، يجب أن تظهر علاقات عالمية بين TN وTP وأشكال العناصر الغذائية التفاعلية وChla على طول تدرج نسب TN:TP في البحيرات الضحلة.
نقترح أن الإشارات طويلة الأمد تلتقط الغالبية العظمى من الاعتماد الإحصائي لتركيزات الكلوروفيل (Chla) على تركيزات النيتروجين الكلي (TN) والفوسفور الكلي (TP)، وأن قوة العلاقات ومعاملات النموذج هي عالمية على طول تدرج TN:TP لمجموعة بيانات كبيرة وعالمية من البحيرات الضحلة (الشكل 1). إذا كانت معظم المعلومات حول العلاقات بين المغذيات وChla موجودة ضمن المتوسطات المتحركة البسيطة لمدة 5 سنوات، فإن التباين المتبقي من سنة إلى أخرى يجب ألا يكشف عن تغييرات منهجية في ميل النموذج أو ارتفاع يجب أن تظهر العلاقات طويلة الأمد بين تركيز الكلوروفيل (Chla) وتركيز النيتروجين الكلي (TN) أو الفوسفور الكلي (TP) خلال موسم النمو ميلًا أكثر حدة وثابتًا غير معتمد على البحيرة (الشكل 1). . بالإضافة إلى ذلك، يجب أن تشير النمط طويل الأمد إلى زيادة نسبة الأشكال غير العضوية والتفاعلية من النيتروجين والفوسفور خلال موسم النمو، عندما يكون هناك فائض من النيتروجين و/أو الفوسفور لنمو العوالق النباتية عند نسب TN:TP محددة (الشكل 1). من بين الأشكال غير العضوية والتفاعلية من النيتروجين، يعتبر الأمونيوم-ن الأكثر ملاءمة من الناحية الطاقية لنمو الطحالب. لكن قياسات التركيز نادرة وغير موثوقة بسبب تفاعليته البيولوجية بدلاً من ذلك، اخترنا النترات-N، لأنها أقل ملاءمة من الناحية الطاقية، وبالتالي أكثر عرضة للتراكم عند تركيزات قابلة للقياس، وأكثر احتمالاً للتراكم على مدى فترات طويلة. .
نستخدم البحيرات بعمق متوسط يبلغ 6 أمتار كحد أدنى ودون أي اختيار إضافي للبيانات. من خلال القيام بذلك، فإن تحليل بياناتنا يمثل الغالبية العظمى من بحيرات العالم؛ من بين 1.4 مليون بحيرة في قاعدة بيانات HydroLAKES العالمية. أقل عمقًا من 6 أمتار. استخدمنا هذا الحد لتقييم البحيرات الضحلة، التي غالبًا ما تكون متعددة الأنواع، حيث من المحتمل أن تكون عينات المياه من المغذيات والكلوروفيل أ تمثل العمود المائي بأكمله. .
في هذا العمل، نعرض علاقات طويلة الأمد متينة وشاملة بين المغذيات والكلوروفيل أ في البحيرات الضحلة، مما يدعم الرأي الحالي بأن التحكم المزدوج الدقيق في المغذيات بناءً على نسب المغذيات مطلوب لإدارة الإثراء المائي بكفاءة. لكي تنجح مثل هذه الاستراتيجيات، من الضروري إدارة كل من النيتروجين والفوسفور عبر منطقة الحوض بالكامل، مع اعتماد منظور شامل ومتكامل حول أحمال المغذيات والنسب. ومع ذلك، هناك حاجة إلى مزيد من التحقيق لتأكيد ما إذا كانت الأنماط الاستوكيومترية الملحوظة تمثل علاقة سببية متسقة بين مستويات المغذيات ونمو العوالق النباتية على المدى الطويل. إذا أكدت الدراسات المستقبلية نتائجنا، فإن العلاقات الاستوكيومترية المحددة ستتيح للمديرين التنبؤ بدقة بنتائج إدارة الإثراء على المدى الطويل، استنادًا إلى نسب وتركيزات TN:TP.

النتائج والمناقشة

عند دمج تركيزات TN و TP كمتغيرات تنبؤية في النماذج التراكمية، أظهرت SMAs على المدى الطويل، التي تمتد لخمس سنوات، العلاقات الأساسية بين TN و TP و Chla بوسيط مرتفع. (0.69-0.96 95% فترة الكثافة الأعلى (HDI)) لنماذج الخطية المضافة (الشكل 2C، انظر الملحق لمعيار معلومات أكايكي الذي يدعم هذا البيان). على الرغم من أن عدم اليقين في النماذج المضافة زاد
عند ، لا زلنا نجد وسيلة (الشكل 2C). عدم اليقين الأعلى حول يتم تقاسمها بين جميع النماذج عندما يكون TN:TP < 20 (الشكل 2A-C) ومن المحتمل أن يكون ذلك بسبب العدد الأقل من الملاحظات في هذا النطاق (16-64 ملاحظة لكل نموذج مقارنة بـ 18-158 ملاحظة لكل نموذج عندما يكون TN:TP > 20، انظر أيضًا SI).
كشفت انحدارات النماذج الإضافية عن سلوك نقطة تحول مع تغيير TN:TP (الشكل 3B، D). هنا، كانت انحدارات TP للنماذج الإضافية (الشكل 3B) في أقصى حد عند TN:TP > 50 (الوسيط = 381.5، 130.8-524.5 HDI)، مع انخفاض عند TN:TP < 50، وكانت انحدارات TP تعبر جزئيًا عن الصفر عند TN:TP < 20 (الوسيط = 43.4، -54-180.2 HDI). علاوة على ذلك، كشفت انحدارات النموذج الإضافي لـ TN عن سلوك واضح لنقطة التحول (الشكل 3D)، مع أعلى القيم عند TN:TP. (الوسيط = 54.9، 28.7-86.6 HDI)، انخفاض تدريجي لنسبة TN:TP من 20-50، وانحدارات النموذج قريبة باستمرار من الصفر عند TN:TP (الوسيط = 5.8، لم تتمكن الأساليب السابقة من تقييم ما إذا كان النيتروجين أو الفوسفور، أو كليهما، أو لا شيء من العناصر الغذائية مرتبطًا ارتباطًا وثيقًا بالكلوروفيل أ في النطاق بين TN:TP من 20-50. على النقيض من ذلك، تظهر نتائجنا أدلة تجريبية على الروابط الشاملة للمواد الغذائية المزدوجة مع الكلوروفيل أ (Chla) ضمن نطاق TN:TP لمدة 5 سنوات (الشكل 3). علاوة على ذلك، كانت الغالبية العظمى من ملاحظات SMA لمدة 5 سنوات لدينا (60%) (الشكل 3) بين TN:TP = 20-50، مما يشير إلى أن الروابط الغذائية المزدوجة مع الكلوروفيل أ هي السيناريو الأكثر شيوعًا في البحيرات. العمق المتوسط، الذي يتوافق مع تحليل عالمي عبر النظم البيئية لقيود المغذيات النسبية .
عند تضمين تركيز TP فقط كمتغير متنبئ، فإن العلاقات طويلة الأمد بين TP وChla تتفق أيضًا مع افتراضاتنا (الموضحة بشكل مفهومي في الشكل 1D) والأدبيات السابقة. . بالنسبة لـ TN:TP > 30، أنتجت نماذج TP – Chla وسيلة مؤشر التنمية البشرية (HDI)، الذي انخفض إلى متوسط مع عدم اليقين العالي ) لـ (الشكل 2A). هنا، أظهر تغيير الميل في نماذج TP – Chla سلوك نقطة التحول، حيث كانت ميول نموذج TP أحادي المغذيات مستقرة عند TN:TP > 30، وانخفضت دون ذلك، مع ميول جزء من حلول النموذج تعبر عن الصفر عند TN:TP < 15 (الشكل 3A). كما تم دعم دلالة نقص أو فائض TP النسبي من تقديرات نموذجنا من خلال تراكم SRP. على وجه التحديد، كانت تركيزات SRP الوسيطة لـ TN:TP و لـ TN:TP (الشكل 4A).
عند تضمين تركيز TN فقط كمتغير متنبئ لنماذج TN – Chla، لاحظنا أنماطًا غير متوقعة، ولكنها قد تكون كاشفة. كانت نسبة النماذج الخاصة بـ TN فقط (الشكل 2B) مرتفعة حتى عند TN:TP > 50، مما يتناقض مع الفائض النسبي المتوقع من النيتروجين والانهيار لـ (الشكل 1D). علاوة على ذلك، كشفت انحدارات نموذج TN-only عن عدم وجود سلوك نقطة تحول يدل على تغيير في فائض النيتروجين، ولكن كان هناك انخفاض مستمر ومتسق للغاية في الانحدار مع زيادة TN:TP (الشكل 3C). كما وجدنا ثنائية في تركيزات النترات-N عند TN:TP > 50، مع مجموعة صغيرة من البيانات تكشف عن تركيزات عالية من النترات-N تزيد عن ( من العينات)، ولكن معظم العينات تظهر تركيزات نترات-N (77%، الشكل 4B). بناءً على ذلك، يبدو أن عملية نزع النيتروجين كانت فعالة في إزالة النترات في الغالبية العظمى من البحيرات. ، وكان مسؤولاً عن الارتباط المنخفض بين TN و nitrate-N (انظر الملحق لرسم بياني يوضح TN – nitrate-N)، باستثناء تركيزات TN العالية جداً، كما تم إظهاره سابقاً في البحيرات الغنية بالمغذيات. بالنسبة للبيانات التي تحتوي على تركيزات منخفضة من النترات-N، اكتشفنا أيضًا تركيزات أقل من الكلوروفيل a، مما يشير إلى أن النيتروجين القابل للتفاعل قد تم استنفاده حتى عند نسب TN:TP العالية (الشكل 4B). وبالتالي، تشير البيانات إلى أن النيتروجين لم يكن متاحًا للفيتوبلانكتون عند نسب TN:TP العالية (الشكل 2B، الشكل 3C) كما يبدو أن الفوسفور كان متاحًا عند نسب TN:TP المنخفضة (الشكل 2A، الشكل 3A).
استنادًا إلى الأدلة التجريبية، نقترح أن تجمعات النيتروجين غير التفاعلية أو الأقل تفاعلية يجب أن تحتوي على النيتروجين غير المتاح لنمو العوالق النباتية عند نسب TN:TP العالية. من غير المحتمل أن تكون المادة العضوية الجزيئية الحية أو الميتة تجمعًا للتخزين، حيث أن النطاقات النموذجية للعوالق النباتية وبكتيري نسب N:P غير كافية لتفسير مثل هذه النسب العالية TN:TP. على النقيض من ذلك، فإن المادة العضوية الذائبة، وخاصة المادة البروتينية الذائبة، هي مرشح محتمل. في دراسة لأربعة
الشكل 2 | التباين المفسر النماذج الخطية المعممة. تم فصل القيم للتغيرات طويلة الأمد في البحيرات الضحلة بناءً على المتوسطات المتحركة البسيطة لمدة 5 سنوات (SMA) (A-C) والتغيرات قصيرة الأمد بناءً على بقايا SMA (D-F). تظهر النتائج من نماذج خطية عامة مع توزيعات غاما لمتوسطات SMA لمدة 5 سنوات ونماذج خطية مع توزيعات طبيعية لبقايا SMA للفوسفور الكلي (TP، ملغ/لتر، الألواح A، D)، النيتروجين الكلي (TN، ملغ/لتر، الألواح B، E)، أو نماذج إضافية من TP وTN (الألواح C، F) والكلوروفيل أ (Chla، ). هذه هي
تم رسمها مقابل المتوسط المولي TN:TP لكل مجموعة بيانات تم أخذ عينات عشوائية منها (انظر الشكل 1 لخطوات معالجة البيانات). كلما كانت النقاط أقل شفافية، زادت الحلول المتداخلة لـ تم العثور عليها بواسطة إجراء البوتستراب (مؤشرًا على خطأ ). الخط الأحمر هو متوسط الاستجابة بناءً على دالة LOESS. عينات لنماذج SMA لمدة 5 سنوات لأن جميع النماذج لم تتقارب ( ) و عينات لبقايا SMA (D-F).
في البحيرات، تم الحفاظ على البروتينات المذابة بشكل انتقائي على مدى عقود إلى قرون، ربما بسبب التحلل البكتيري والضوئي . علاوة على ذلك، في دراسة طويلة الأمد لبحيرة فلاتهاد، تم تفسير نسب TN:TP العالية في المياه المفتوحة (80-90) بشكل أفضل من خلال الحفاظ على النيتروجين على المدى الطويل في حوض النيتروجين العضوي المذاب . في حالتنا، كانت تركيزات TN مرتفعة عند TN:TP , وكانت في أقصى حد عند TN:TP > 100 (انظر SI، القسم 9، للتفاصيل). ومن ثم، قد يكون النيتروجين العضوي المذاب المقاوم خزانا كبيرا، ولكنه غالبا ما يتم تجاهله، للنيتروجين في البحيرات. بناءً على هذه الأدلة، نفترض مسارين بديلين لمصير النيتروجين في البحيرات ذات TN:TP العالية: (i) إما تراكم النيتروجين الزائد كنيترات-N في أقلية من البحيرات، أو (ii) الإزالة والتخزين
في مسار نزع النيتروجين-النيتروجين العضوي المذاب، مع تراكم النيتروجين العضوي المذاب المقاوم، على الأرجح البروتينات المذابة، في الغالبية العظمى من البحيرات (الشكل 3B). يشبه هذا المسار التخزيني المترابط مفهوم مضخة الكربون الميكروبية في المحيطات والتربة . علاوة على ذلك، حيث أن توفر الكربون العضوي غالبا ما يتحكم في كل من نزع النيتروجين وامتصاص النيتروجين البكتيري , فإن نسب الكربون العضوي المذاب: N قد تكون حاسمة لتحديد المسار السائد للنيتروجين على المدى الطويل.
جانب آخر مهم للصلة بين TN:TP واستنفاد النيتروجين هو الأهمية المحتملة لتثبيت النيتروجين بواسطة السيانوبكتيريا لتوفير النيتروجين لنمو العوالق النباتية. دراسة سابقة متعددة البحيرات
منحدرات نموذج SMA لمدة 5 سنوات
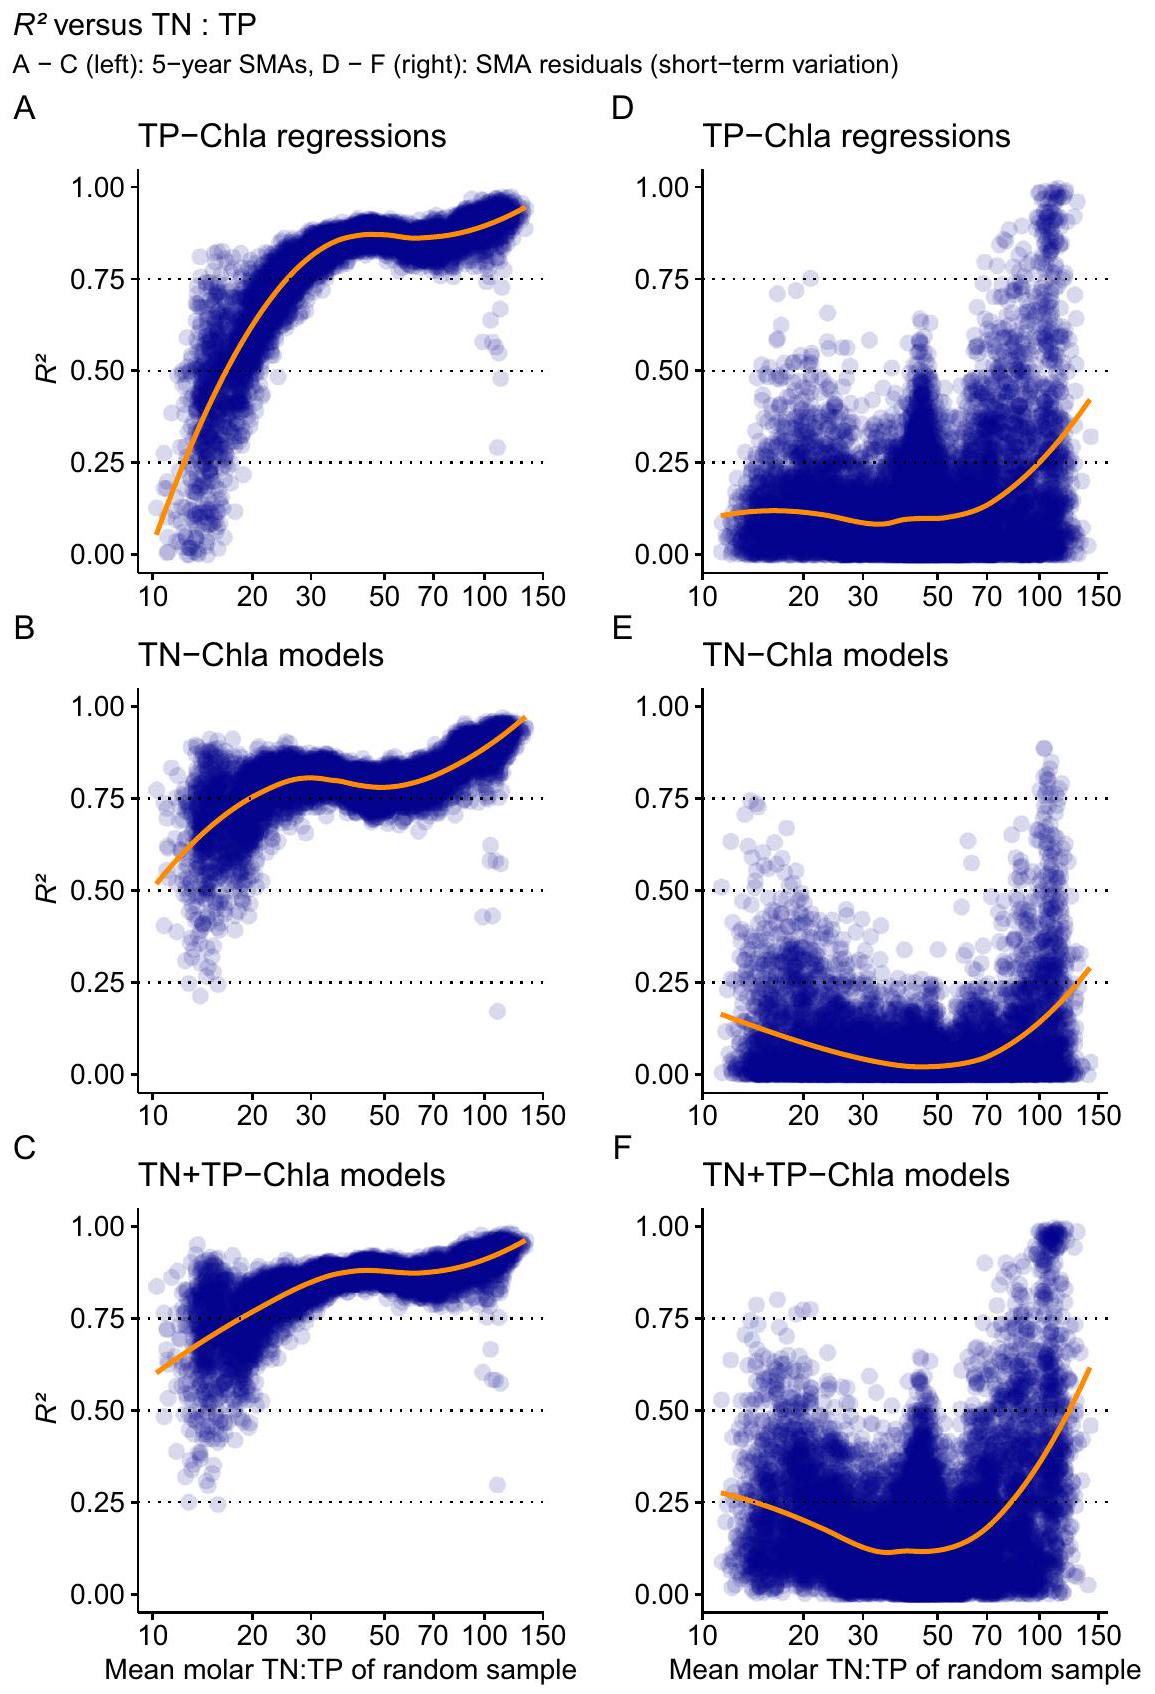
نماذج المغذيات الفردية والإضافية مقابل TN:TP
الشكل 3 | منحدرات النماذج الخطية العامة. يتم عرض قيم المنحدر لنماذج المغذيات الفردية والإضافية للتغيرات طويلة الأمد في البحيرات الضحلة بناءً على متوسطات الحركة البسيطة لمدة 5 سنوات (SMA) لـ TP (A، B) و TN (C، D) مقابل متوسط TN:TP المولي لكل مجموعة بيانات تم أخذ عينات عشوائية منها. تم عرض النتائج من
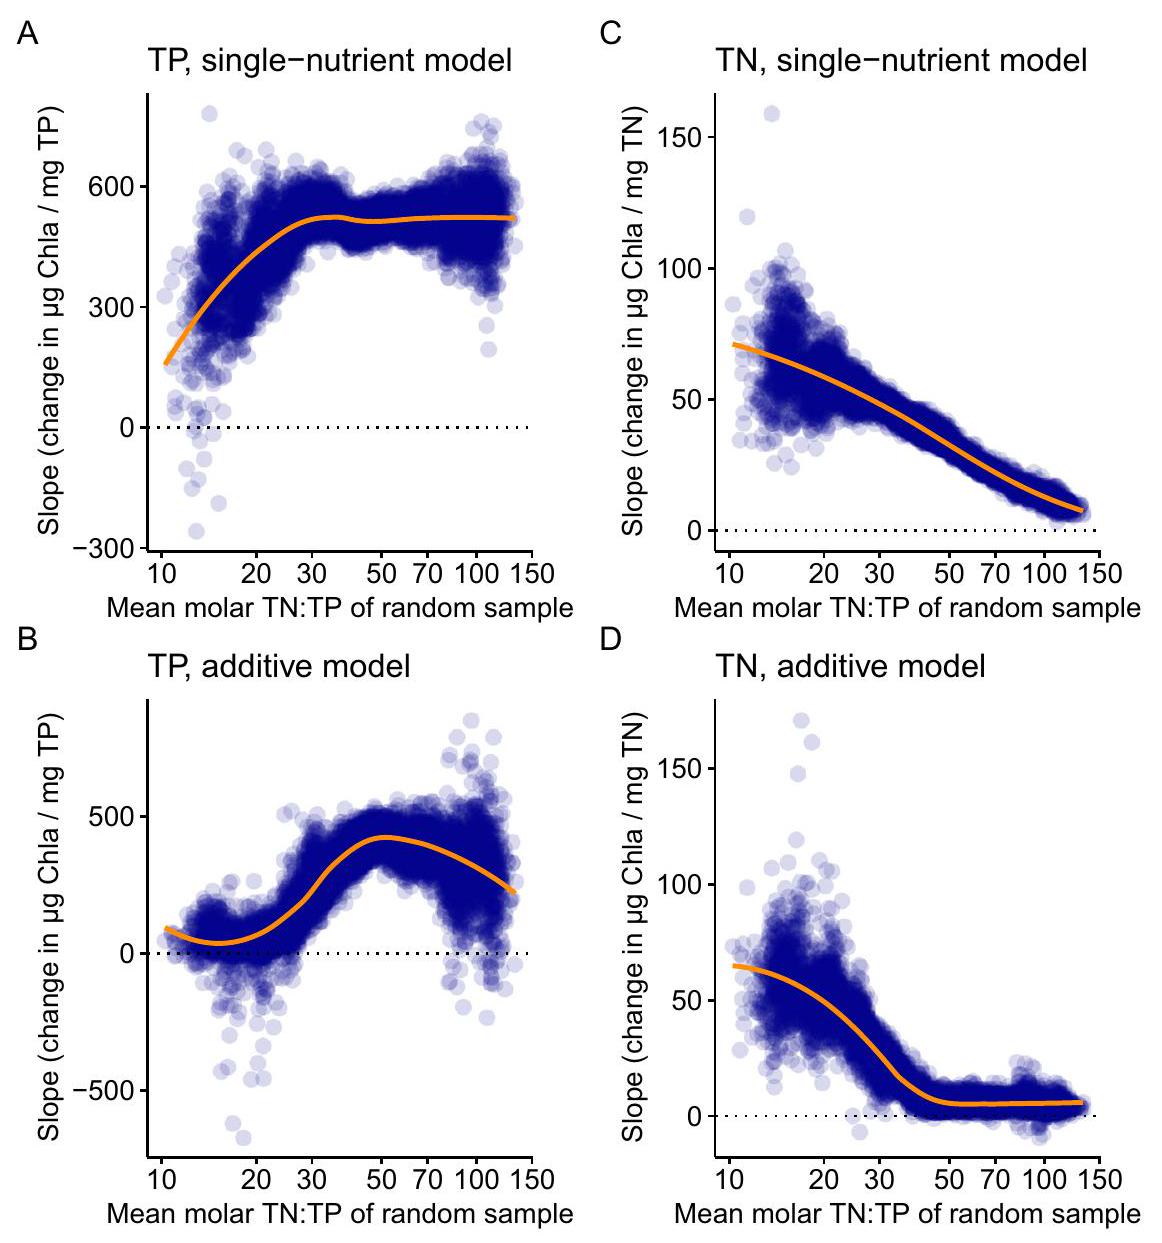
النماذج الخطية العامة مع توزيع غاما لـ Chla لمدة 5 سنوات. كلما كانت النقاط أقل شفافية، زادت الحلول المتداخلة التي تم العثور عليها للمنحدرات بواسطة إجراء bootstrap (مما يدل على خطأ المنحدرات). الخط البرتقالي هو متوسط الاستجابة بناءً على دالة LOESS. عينات.
كشفت عن أهمية نسبية أعلى لنزع النيتروجين مقارنة بتثبيت النيتروجين الجوي في الغالبية العظمى من البحيرات المدروسة . في دراستنا، ستؤدي معدلات تثبيت النيتروجين النسبية العالية إلى فائض نيتروجين طويل الأمد حتى عند نسب TN:TP المنخفضة , مما يتسبب في انخفاض مستمر وعدم وجود تغييرات منهجية في المنحدرات عبر نطاق TN:TP بالكامل، وهو ما لم نلاحظه (الشكل 2A، C). بدلاً من ذلك، ستدفع معدلات تثبيت النيتروجين العالية باستمرار مقارنة بنزع النيتروجين TN:TP باستمرار نحو فائض النيتروجين عند قيم أعلى من حوالي TN:TP > 50. مرة أخرى، لم نلاحظ ذلك، حيث كشفت دراستنا أن الغالبية العظمى من TN:TP كانت بين 20 و 50 ( من الملاحظات)، مما يدعم انتشار نزع النيتروجين.
من خلال استخراج متوسطات الحركة البسيطة لمدة 5 سنوات واستخدام إجراء bootstrap، كشفنا عن استجابة طويلة الأمد قوية وشاملة عبر 159 بحيرة ضحلة، مما يشير إلى علاقة ستيوكيومترية طويلة الأمد شائعة بين المغذيات و Chla، بغض النظر عن الاختلافات في تركيزات المغذيات، أو خصائص البحيرة، أو نوع الحوض. في المقابل، أظهرت التغيرات قصيرة الأمد المحتواة ضمن بقايا SMA معاملات ارتباط منخفضة (الوسيط , الشكل 2D-F). لذلك، فإن استمرار العلاقات القوية بين العوالق النباتية والمغذيات فقط في متوسطات الحركة البسيطة لمدة 5 سنوات (الشكل 2A-C) يدعم الأفكار المبكرة التي
التحكم في المغذيات للتغذية الزائدة على نطاق النظام البيئي هو عملية تدريجية . هذه القوة المتزايدة للرابط بين المغذيات والعوالق النباتية تزيل أيضًا الحاجة إلى تحويل تركيزات المغذيات وتركيزات الكتلة الحيوية للعوالق النباتية، وهو نهج تم استخدامه لاكتشاف التغيرات في روابط المغذيات-العوالق النباتية عند استخدام عينات فورية أو متوسطات قصيرة الأمد . ومع ذلك، قد يكون هذا الرابط طويل الأمد مفاجئًا حيث أن للعوالق النباتية أوقات جيل تتراوح من أيام إلى أسابيع. إن تأثير التغذية الزائدة يدوم لفترة أطول من زمن جيل العوالق النباتية يذكرنا بأبحاث سابقة، حيث تم اقتراح استجابة متأخرة للأنواع تجاه الاضطرابات على مدى عدة أجيال لتقليد التأثير الحقيقي للاضطراب . لذلك، قد تكشف المتوسطات متعددة السنوات عن آثار متأخرة للاضطرابات، ولكن أيضًا آثار السائقين المتغيرين ببطء مثل المناخ أو تغييرات حوض الأرض.
من بين جميع البحيرات الموجودة في قاعدة البيانات العالمية الكبيرة المفتوحة، كانت هناك 159 بحيرة فقط في منطقة المناخ المعتدل لديها بيانات طويلة الأمد كافية لتقييم العلاقات طويلة الأمد بين العوالق النباتية والمغذيات، مما يحد من استنتاجاتنا بالنسبة للبحيرات الضحلة في المناطق القطبية أو الاستوائية. بالنسبة للبحيرات خارج المنطقة المعتدلة، نفترض وجود علاقات ستيوكيومترية مماثلة بسبب التشابه في فسيولوجيا الطحالب. ومع ذلك، تشير الدراسات البحرية إلى عتبات متغيرة بسبب الاختلافات في تركيب مجتمع العوالق النباتية في مناطق المناخ المختلفة , وقد تنطبق آثار مماثلة في البحيرات.
المغذيات غير العضوية لمتوسطات الحركة البسيطة لمدة 5 سنوات
الشكل 4 | تركيزات المغذيات غير العضوية المذابة مقابل نسب TN:TP للبحيرات الضحلة. تم عرض الفوسفور التفاعلي القابل للذوبان (SRP) (A) وتركيزات نترات-N (NO3-N) (B) لكل متوسط حركة بسيطة لمدة 5 سنوات (SMA) مقابل نسبة TN:TP المولي لنفس البحيرة وSMA لمدة 5 سنوات. تستند البيانات إلى نفس السلاسل الزمنية مثل البيانات الأخرى، ولكن لم تكن بيانات SRP ونترات-N متاحة لـ
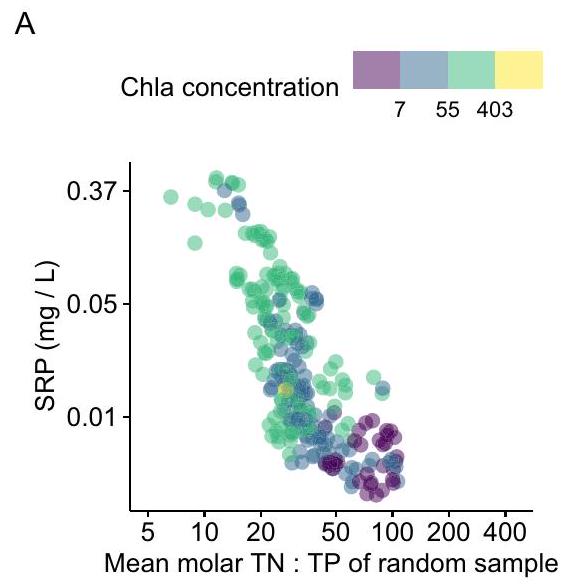
كل ملاحظة TN وTP. لذلك، تتضمن اللوحة A 278 ملاحظة من 37 بحيرة ضحلة، وتحتوي اللوحة B على 620 ملاحظة من 138 بحيرة ضحلة. تم تحويل المحاور إلى اللوغاريتمات لأن نسب TN:TP اتبعت توزيع لوغاريتمي طبيعي، ولجعل تركيزات SRP ونترات-N الصغيرة مرئية.
كانت هناك اختلافات كبيرة في تركيزات Chla وTN وTP في بيانات البقايا قصيرة الأمد. كانت هذه التغيرات قصيرة الأمد في البقايا تقريبًا نصف ما كانت عليه بالنسبة لمتوسطات الحركة البسيطة لمدة 5 سنوات. على وجه التحديد، يمكن التعبير عن تباين متوسطات الحركة البسيطة لمدة 5 سنوات وبقاياها كنطاق 95% من قيمها باستخدام HDI. بالنسبة لمتوسطات الحركة البسيطة لمدة 5 سنوات، كان نطاق HDI لـ Chla هو . بالنسبة لبيانات Chla قصيرة الأمد، كان نطاق HDI هو . بالمثل، بالنسبة لمتوسطات الحركة البسيطة لمدة 5 سنوات مقابل بقايا SMA، وجدنا نطاقات HDI من 2.7 مقابل و 0.27 مقابل لـ TN وTP، على التوالي.
قد يكون هذا التباين العالي المتبقي في Chla مرتبطًا بتغيرات في المعلمات غير الحية التي تتحكم في كتلة العوالق النباتية، مثل أجزاء النيتروجين والفوسفور المختلفة، وتأثيرات شبكة الغذاء . على سبيل المثال، يمكن أن يتفاوت افتراس الأسماك على الكلاودوسيرانات بشكل كبير بين السنوات بسبب الاختلافات في العوامل البيئية ويؤثر بشكل كبير على تركيزات Chla . قد يكون مصدر آخر للتغيرات قصيرة الأمد هو محتوى Chla للعوالق النباتية، والذي يمكن أن يتفاوت بشكل كبير داخل وبين الأنواع . علاوة على ذلك، يجب توضيح الروابط بين التغيرات في التحميل الخارجي والداخلي لـ و ، وأجزاءها القابلة للاستخدام البيولوجي المحددة لفهم التباين قصير الأمد بشكل أفضل. هنا، لا تلعب فقط آليات التحميل الداخلي المعروفة جيدًا للفوسفور، ولكن أيضًا النبضات قصيرة الأمد من التحميل الداخلي للنيتروجين، سواء من الرواسب أو عمود الماء ، دورًا مهمًا في التسبب في التغذية الزائدة والحفاظ عليها. قد يتم تجاهل هذه النبضات من خلال أخذ عينات نقطية غير متكررة من TN وTP. علاوة على ذلك، قد تكون الانحدارات الخطية البسيطة غير قادرة على كشف استجابات التغذية الزائدة قصيرة الأمد للسائقين الخارجيين. بدلاً من ذلك، قد تظهر هذه الاستجابات في سعة التذبذب قصيرة الأمد، والتغاير، والتزامن، وتكرار تباين المغذيات والعوالق النباتية، على غرار النتائج المتعلقة بالتغيرات قصيرة الأمد في دافنيا ومصادر غذائها في البحيرات . نقترح أن فك تشابك المصادر والآليات وراء التغيرات القصيرة الأجل التي تم الكشف عنها يتطلب قياسات تفصيلية عالية التردد لتوافر المغذيات الحقيقية، وكتلة العوالق النباتية، وهياكل شبكات الغذاء، مرتبطة بقياسات تدفق المغذيات الآلية. .
بعيدًا عن البحيرات، قد تحتوي العديد من الاستجابات البيئية الأخرى على مكونين زمنيّين: مكون قصير الأجل مرتبط بشبكات الغذاء الميكروبية أو تغييرات عشوائية قصيرة الأجل، ومكون طويل الأجل مرتبط بعوامل تتغير وفقًا لدورية أطول. لقد تم الشك في هذا المفهوم لعقود. – والعديد من الباحثين يستخدمون بشكل غريزي الاتجاهات طويلة الأجل لإزالة التغيرات القصيرة الأجل – لكننا وجدنا القليل من التحقيقات الدقيقة والمنهجية حول
المراقبة متعددة السنوات أو التجارب. استثناء ملحوظ هو دراسة حديثة أجراها كوسر وآخرون. ، الذين وجدوا أن 12 تجربة طويلة الأجل على النظم البيئية للمياه العذبة والبرية حول تركيب النباتات والحيوانات أظهرت استجابات متسقة للتلاعب التجريبي فقط على فترات تتجاوز عادة 10 سنوات. مع زيادة الوصول إلى بيانات بيئية طويلة الأجل عالية الدقة، قد تلهم دراستنا ودراسة كوسر وآخرون. مزيدًا من البحث باستخدام أساليب مشابهة لاستخراج الإشارات الزمنية وأخذ عينات من السلاسل الزمنية العشوائية.

استخدام العلاقات الاستوكيومترية طويلة الأجل في إدارة البحيرات وحوض المياه.

تقدم العلاقات طويلة الأجل بين المغذيات وChla التي تم الكشف عنها في هذه الدراسة دليلًا تجريبيًا على الاستقرار طويل الأجل الذي يتم مناقشته غالبًا في التحكم المزدوج بالمغذيات لكتلة العوالق النباتية ، وتقترح بقوة أن الاعتبارات الأخيرة للتحكم المزدوج بالمغذيات هي أفضل نهج لإدارة البحيرات لمعظم البحيرات الضحلة. ومع ذلك، فإن التحكم المزدوج بالمغذيات ليس سهل التنفيذ، حيث أن إدارة مدخلات N وP إلى البحيرات الضحلة تمثل تحديًا.
تتلقى العديد من البحيرات الضحلة إمدادات من المياه السطحية وهي جزء من شبكات مياه عذبة واسعة، حيث يأتي معظم N وP الخارجي من مصادر حوض المياه الهيدرولوجية. بالنسبة لـ P، كان التحكم في المصدر ناجحًا في تقليل التحميل من المصادر النقطية. ومع ذلك، غالبًا ما يظهر التحكم في المصادر المنتشرة لـ N وP نجاحًا محدودًا. نتيجة لذلك، هناك حاجة إلى حلول مستندة إلى الطبيعة مصممة بشكل جيد للاحتفاظ جسديًا وبيولوجيًا بـ و داخل التربة، والمناطق الضفاف، والأراضي الرطبة، والبرك، وشبكات الأنهار قبل دخولها إلى البحيرات، مع توفير آثار ثانوية مفيدة (مثل على التنوع البيولوجي) وتجنب الآثار الضارة (مثل زيادة انبعاثات غازات الدفيئة وتبادل التلوث). علاوة على ذلك، قد تكون نتائجنا قابلة للتطبيق أيضًا على البحيرات الأعمق، حيث نجد نتائج متشابهة للغاية عندما لا نقتصر فقط على البحيرات الضحلة في تحليل البيانات (انظر SI لتحليل بدون قطع عمق). ومع ذلك، تشكل البحيرات الأعمق جزءًا صغيرًا فقط من مجموعة البيانات، ونوصي بإجراء تحليل منفصل لمجموعة بيانات تتكون فقط من البحيرات الأعمق لتقييم ما إذا كانت أنماط مشابهة تظهر.
قد يوفر ربط المراقبة ونماذج النظم البيئية والتجارب أدلة آلية إضافية على أن الأنماط الاستوكيومترية التجريبية التي تم العثور عليها هنا تمثل رابطًا سببيًا بين المغذيات ونمو العوالق النباتية. إذا تم دعم نتائجنا من خلال دراسات إضافية، فإن العلاقات الاستوكيومترية التي تم العثور عليها في هذه الدراسة ست
تسمح للمديرين بإجراء توقعات طويلة الأجل لنجاح إدارة الإثراء بناءً على نسب TN:TP وتركيزاتها.

طرق

جمع البيانات

جمعنا البيانات من أكبر قاعدة بيانات عالمية للبحيرات متاحة حاليًا مفتوحة الوصول ، التي أضفنا إليها بيانات قدمها المركز الدنماركي للبيئة في جامعة آرهوس في قاعدة بيانات مفتوحة الوصول (https://odaforalle.au.dk، تم تنزيلها في فبراير 2022). جمعنا متوسط العمق وتركيزات Chla وTN وTP. قمنا بإجراء جميع تحليلات البيانات والإحصائيات في R، الإصدار .
شملنا جميع البحيرات التي يبلغ متوسط عمقها . مع هذا القطع، يمثل تحليل بياناتنا الغالبية العظمى من بحيرات العالم. من بين 1427688 بحيرة في قاعدة بيانات HydroLAKES العالمية أعمق من 6 م. استخدمنا القطع، حيث أن احتمال التطبق هو لعمق بحيرة متوسط قدره . وبالتالي، يمثل هذا القطع البحيرات التي لديها احتمال أعلى للخلط مقارنة بالتطبق، مما يؤدي إلى أن عينات المياه من المغذيات وChla يجب أن تكون أكثر تمثيلًا لعمود الماء بالكامل. لم يكن لدى جميع البحيرات في مجموعة بيانات المغذيات العالمية قيم عمق متوسطة ، لذا أضفنا أعماق متوسطة من قاعدة بيانات HydroLAKES إلى سلسلة بيانات المغذيات العالمية إذا لم تكن متاحة بالفعل. كانت هذه الطريقة تعتمد على الموقع الجغرافي للبحيرة باستخدام ومعرف البحيرة الفريد في قاعدة بيانات المغذيات العالمية . تضمنت قاعدة البيانات الدنماركية قيم العمق لجميع البحيرات، واستبعدنا المياه المالحة أو المالحة التي تحتوي على أكثر من . لم يتم إجراء أي تصفية بيانات أخرى، أو اكتشاف القيم الشاذة، أو الاستبعاد.
لم تحتوي قاعدة بيانات المغذيات العالمية على بيانات تركيز نترات-N أو SRP. لذلك، قمنا باستخراج هذه البيانات من قاعدة بيانات LAGOS-NE باستخدام حزمة LAGOSNE R (الإصدار 2.0.2، إصدار قاعدة البيانات 1.087.3) في (الإصدار 4.3.0)، والتي تحتوي على بيانات بحيرات من شمال شرق الولايات المتحدة. تم تضمين البحيرات من LAGOS-NE في قاعدة بيانات المغذيات العالمية. احتوت قاعدة البيانات الدنماركية على بيانات تركيز نترات-N وSRP. مرة أخرى، احتفظنا فقط بالبحيرات متوسط العمق، ولم يتم تطبيق أي تصفية بيانات أخرى.

حساب متوسطات موسم النمو والمتوسطات المتحركة البسيطة

لكل بحيرة وسنة، قمنا بحساب متوسطات موسم النمو لـ TN وTP وNitrate-N وSRP وChla إذا كانت هناك ثلاث ملاحظات أو أكثر متاحة خلال هذه الفترة في سنة معينة. بالنسبة لنصف الكرة الشمالي، استخدمنا مايو إلى سبتمبر كفترة نمو، وللنصف الجنوبي، استخدمنا نوفمبر إلى مارس. لم يتم تضمين أي بحيرات من المناطق الاستوائية في مجموعة البيانات النهائية بسبب نقص سلاسل البيانات طويلة الأجل.
بعد تقييم الطول المثالي للمتوسط المتحرك البسيط باستخدام المحاكاة وسلاسل البيانات الزمنية المتاحة، وجدنا أن المتوسطات المتحركة البسيطة لمدة 5 سنوات تزيل معظم التباين القصير الأجل مع الحفاظ على المعلومات طويلة الأجل سليمة والحفاظ على عدد كبير من سلاسل بيانات البحيرات في مجموعة البيانات (يرجى مراجعة SI للحصول على النهج التفصيلي). بناءً على متوسطات موسم النمو، قمنا بحساب جميع المتوسطات المتحركة البسيطة المتاحة لمدة 5 سنوات لكل بحيرة. ثم قمنا بحساب بقايا المتوسط المتحرك البسيط كمتوسط موسم النمو ناقص المتوسط المتحرك البسيط لمدة 5 سنوات لنفس السنة والبحيرة. بعد ذلك، استخدمنا المتوسط المتحرك البسيط لتقسيم سلسلة بيانات البحيرة إلى بيانات عالية التردد ومنخفضة التردد. تم استخدام هذا النهج سابقًا لسلسلة زمنية واحدة من العوالق النباتية في بحيرة، ، ووسعنا هذا النهج ليشمل سلاسل زمنية متعددة للبحيرات. ضمن SI، نقدم أدلة على فائدة هذا النهج لفصل الإشارات القصيرة والطويلة الأجل في بيانات السلاسل الزمنية.

الفصل إلى نطاقات مختلفة من نسب TN:TP

لتقييم تأثيرات TN أو TP على الارتباطات مع Chla عند نسب TN:TP مختلفة، قمنا بفصل بيانات المتوسط المتحرك البسيط لمدة 5 سنوات إلى ‘نوافذ’ TN:TP. أنشأنا 46 نافذة TN:TP ضمن نطاق من TN:TP المولي بين 1 و1808. تتبع نسب المغذيات توزيعًا لوغاريتميًا طبيعيًا، ، لذا تم تحويل نوافذ TN:TP إلى لوغاريتم (لوغاريتم طبيعي (ln)).
تراوحت النوافذ من إلى 7.5، مع عرض نافذة قدره وزيادة قدرها . تداخلت النوافذ؛ على سبيل المثال، كانت النافذة الأولى تتراوح من TN:TP من 1 إلى 3، وكانت النافذة الثانية تتراوح من 1.1 إلى 3.1، وهكذا. قمنا بتعيين المتوسط المتحرك البسيط لمدة 5 سنوات وبقايا المتوسط المتحرك البسيط إلى نوافذ TN:TP الخاصة بها (عادةً أكثر من واحدة، حيث تداخلت نوافذ TN:TP). لا تحتوي بقايا المتوسط المتحرك البسيط على بيانات نسب TN:TP المطلقة، لذا تم تعيينها بناءً على بيانات نسب TN:TP للمتوسط المتحرك البسيط لمدة 5 سنوات لنفس السنة والبحيرة.

الإحصائيات وإعادة أخذ العينات باستخدام طريقة البوتستراب

بمجرد تعيين البيانات إلى نوافذ TN:TP، قمنا بأخذ عينات عشوائية منها 300 مرة لكل نافذة TN:TP (13800 تكرار إجمالي) باستخدام إجراء بوتستراب هرمي. . باختصار، قمنا بأخذ عينات عشوائية مع الاستبدال على مستوى البحيرة، ثم أخذنا عينة عشوائية واحدة (إما متوسط موسم نمو واحد أو متوسط 5 سنوات SMA واحد) من كل بحيرة بدون استبدال حتى يتساوى عدد العينات مع عدد البحيرات في نافذة TN:TP المقابلة. لكل عينة عشوائية، قمنا بحساب نماذج خطية عامة (GLM، دالة glm، حزمة stats في R . استخدمنا Chla كمتغير تابع وبنينا نماذج باستخدام إما TN (نماذج TN – Chla)، TP (نماذج TP – Chla)، أو كليهما في نماذج إضافية (TN + TP – Chla). في GLMs، استخدمنا توزيع غاما كدالة ربط لمتوسط 5 سنوات SMA والتوزيع الطبيعي لـ Chla كدالة ربط لبقايا SMA (انظر SI لوصف مفصل لـ SMA، نافذة TN:TP وطرق bootstrap). احتفظنا فقط بتلك التكرارات حيث تقاربت جميع GLMs. من بين 13800 تكرار ممكن (46 نافذة TN:TP مضروبة في 300 تكرار لكل نافذة)، تقاربت النماذج لـ 9194 تكرار من SMAs لمدة 5 سنوات و لـ 13800 تكرار من بقايا SMA.
من التكرارات التي تقاربت فيها جميع GLMs، استخرجنا (كـ pseudo – انحراف النموذج/انحراف صفري)، معيار معلومات أكايك (AIC)، انحدارات النموذج وقطعها (فقط والانحدارات موضحة في المخطوطة الرئيسية، يرجى مراجعة SI للمتغيرات المستخرجة الأخرى). استخدمنا دلتا AIC بين نماذج SMA لمدة 5 سنوات لتحديد ما إذا كانت GLMs الإضافية أو التفاعلية لـ TN و TP كانت ذات جودة نموذج أعلى من تلك التي تستخدم فقط TN أو TP كمتغيرات تفسيرية (انظر SI لإجراءات اختيار النموذج). تم ملاحظة تحسين النموذج مع نماذج TN + TP Chla الإضافية، ولكن لم يتم الحصول على أي تحسين إضافي من خلال تضمين مصطلح تفاعلي. لذلك، نحن نعرض فقط النتائج لنماذج TN Chla، TP – Chla، و TN + TP – Chla. لتقييم تحسين النموذج من حيث لـ SMA لمدة 5 سنوات مقارنة ببقايا SMA، قمنا بمقارنة متوسط التوزيع وفترة الكثافة الأعلى 95% (HDI) .

البرمجيات والحزم

تم تحليل جميع البيانات في R، الإصدار 4.3.2 وجزئيًا (إجراء bootstrap والنماذج الخطية العامة) في جوليا، الإصدار 1.9.0، باستخدام كود تم تطويره من قبل المؤلفين. ضمن كود تحليل البيانات، تم استخدام حزم جوليا DataFrames (الإصدار 1.6.1)، FLoops (الإصدار 0.2.1)، DataFramesMeta (الإصدار 0.14.1)، GLM (الإصدار 1.9.0) والإحصائيات؛ بالإضافة إلى مجموعة حزم R tidyverse (الإصدار 2.0.0).
تم استخراج معلومات عن عدد البحيرات بعمق متوسط من مجموعة بيانات HydroLAKES باستخدام QGIS Desktop (الإصدار 3.34).
تم كتابة المخطوطة في Quarto Markdown (الإصدار 1.88.0) ضمن IDE VSCodium (الإصدار 1.79.0)، وباستخدام R (الإصدار 4.3.2). ضمن كود المخطوطة، تم إنشاء الرسوم البيانية باستخدام ggplot2 (الإصدار 3.4.4)، ggpubr (الإصدار 0.6.0)، ggtext (الإصدار 0.1.2)، وحزمة patchwork (الإصدار 1.1.3).

ملخص التقرير

معلومات إضافية عن تصميم البحث متاحة في ملخص تقرير Nature Portfolio المرتبط بهذه المقالة.

توفر البيانات

تستخدم هذه الدراسة بيانات مفتوحة الوصول من Filazzola وآخرون. (https://doi.org/ 10.5063/F1RV0M1S)، قاعدة بيانات LAGOS-NE (https://lagoslakes.org/ lagos-ne/)، قاعدة بيانات Danish Overladevandsdatabasen (https://odaforalle.au. ) ومن قاعدة بيانات HydroLAKES (https://www.hydrosheds. org/products/hydrolakes). جميع البيانات المستخدمة والمولدة في هذه الدراسة متاحة أيضًا هنا: https://git.ufz.de/graeber/long-term-nutrient-chla-links-shallow-lakes.

توفر الكود

روابط للبرمجيات المفتوحة الوصول المستخدمة وجميع الأكواد المطورة لهذه الدراسة متاحة هنا: https://git.ufz.de/graeber/long-term-nutrient-chla-links-shallow-lakes. جميع الأكواد المطورة لهذه الدراسة منشورة بموجب ترخيص BSD-3-Clause (يسمح بالوصول المفتوح واستخدام البرمجيات المجانية مع الاعتراف الكامل بحقوق الطبع والنشر الأصلية).

References

  1. Jeppesen, E. et al. Lake responses to reduced nutrient loading an analysis of contemporary long-term data from 35 case studies. Freshw. Biol. 50, 1747-1771 (2005).
  2. Paerl, H. W. et al. It takes two to Tango: When and where dual nutrient (N & P) reductions are needed to protect lakes and downstream ecosystems. Environ. Sci. Technol. 50, 10805-10813 (2016).
  3. Søndergaard, M., Lauridsen, T. L., Johansson, L. S. & Jeppesen, E. Nitrogen or phosphorus limitation in lakes and its impact on phytoplankton biomass and submerged macrophyte cover. Hydrobiologia 795, 35-48 (2017).
  4. Wurtsbaugh, W. A., Paerl, H. W. & Dodds, W. K. Nutrients, eutrophication and harmful algal blooms along the freshwater to marine continuum. WIREs Water 6, e1373 (2019).
  5. Guildford, S. J. & Hecky, R. E. Total nitrogen, total phosphorus, and nutrient limitation in lakes and oceans: Is there a common relationship? Limnol. Oceanogr. 45, 1213-1223 (2000).
  6. Moon, D. L., Scott, J. T. & Johnson, T. R. Stoichiometric imbalances complicate prediction of phytoplankton biomass in U.S. Lakes: Implications for nutrient criteria. Limnol. Oceanogr. 66, 2967-2978 (2021).
  7. Lewis, W. M. & Wurtsbaugh, W. A. Control of Lacustrine phytoplankton by nutrients: erosion of the phosphorus paradigm. Int. Rev. Hydrobiol. 93, 446-465 (2008).
  8. Dolman, A. M. & Wiedner, C. Predicting phytoplankton biomass and estimating critical N:P ratios with piecewise models that conform to Liebig’s law of the minimum. Freshw. Biol. 60, 686-697 (2015).
  9. McCarthy, M. J., Gardner, W. S., Lehmann, M. F. & Bird, D. F. Implications of water column ammonium uptake and regeneration for the nitrogen budget in temperate, eutrophic Missisquoi Bay, Lake Champlain (Canada/USA). Hydrobiologia 718, 173-188 (2013).
  10. McCarthy, M. J., Gardner, W. S., Lehmann, M. F., Guindon, A. & Bird, D. F. Benthic nitrogen regeneration, fixation, and denitrification in a temperate, eutrophic lake: Effects on the nitrogen budget and cyanobacteria blooms. Limnol. Oceanogr. 61, 1406-1423 (2016).
  11. Strayer, D. et al. Long-term ecological studies: An illustrated account of their design, operation, and importance to ecology. Occas. Publ. Inst. Ecosyst. Sci. 2, 1-36 (1986).
  12. Carpenter, S. R. & Leavitt, P. R. Temporal variation in a paleolimnological record arising from a trophic cascade. Ecology 72, 277-285 (1991).
  13. Kasprzak, P., Padisák, J., Koschel, R., Krienitz, L. & Gervais, F. Chlorophyll a concentration across a trophic gradient of lakes: An estimator of phytoplankton biomass? Limnologica 38, 327-338 (2008).
  14. Droop, M. R. Vitamin B12 and Marine Ecology. IV. The kinetics of uptake, growth and inhibition in Monochrysis Lutheri. J. Mar. Biol. Assoc. U. Kingd. 48, 689-733 (1968).
  15. Droop, M. R. The nutrient status of algal cells in continuous culture. J. Mar. Biol. Assoc. U. Kingd. 54, 825-855 (1974).
  16. Shatwell, T. & Köhler, J. Decreased nitrogen loading controls summer cyanobacterial blooms without promoting nitrogen-fixing taxa: Long-term response of a shallow lake. Limnol. Oceanogr. 64, S166-S178 (2019).
  17. Glibert, P. M. et al. Pluses and minuses of ammonium and nitrate uptake and assimilation by phytoplankton and implications for productivity and community composition, with emphasis on nitrogen-enriched conditions. Limnol. Oceanogr. 61, 165-197 (2016).
  18. Trommer, G., Poxleitner, M. & Stibor, H. Responses of lake phytoplankton communities to changing inorganic nitrogen supply forms. Aquat. Sci. 82, 22 (2020).
  19. Reed, M. H. et al. Effects of filtration timing and pore size on measured nutrient concentrations in environmental water samples. Limnol. Oceanogr.: Methods 21, 1-12 (2023).
  20. Massé, S., Botrel, M., Walsh, D. A. & Maranger, R. Annual nitrification dynamics in a seasonally ice-covered lake. PLOS ONE 14, eO213748 (2019).
  21. Small, G. E. et al. Rates and controls of nitrification in a large oligotrophic lake. Limnol. Oceanogr. 58, 276-286 (2013).
  22. Messager, M. L., Lehner, B., Grill, G., Nedeva, I. & Schmitt, O. Estimating the volume and age of water stored in global lakes using a geo-statistical approach. Nat. Commun. 7, 13603 (2016).
  23. Kirillin, G. & Shatwell, T. Generalized scaling of seasonal thermal stratification in lakes. Earth-Sci. Rev. 161, 179-190 (2016).
  24. Scott, J. T., McCarthy, M. J. & Paerl, H. W. Nitrogen transformations differentially affect nutrient-limited primary production in lakes of varying trophic state. Limnol. Oceanogr. Lett. 4, 96-104 (2019).
  25. Westphal, K., Musolff, A., Graeber, D. & Borchardt, D. Controls of point and diffuse sources lowered riverine nutrient concentrations asynchronously, thereby warping molar N:P ratios. Environ. Res. Lett. 15, 104009 (2020).
  26. Graeber, D. et al. Bioavailable DOC: Reactive nutrient ratios control heterotrophic nutrient assimilationAn experimental proof of the macronutrient-access hypothesis. Biogeochemistry 155, 1-20 (2021).
  27. Wachholz, A. et al. Stoichiometry on the edge – Humans induce strong imbalances of reactive C:N:P ratios in streams. Environ. Res. Lett. 18, 044016 (2023).
  28. Elser, J. J. et al. Global analysis of nitrogen and phosphorus limitation of primary producers in freshwater, marine and terrestrial ecosystems. Ecol. Lett. 10, 1135-1142 (2007).
  29. Seitzinger, S. et al. Denitrification across landscapes and waterscapes: a synthesis. Ecol. Appl. 16, 2064-2090 (2006).
  30. Holmroos, H., Hietanen, S., Niemistö, J. & Horppila, J. Sediment resuspension and denitrification affect the nitrogen to phosphorus ratio of shallow lake waters. Fundam. Appl. Limnol. 180, 193-205 (2012).
  31. Filstrup, C. T. & Downing, J. A. Relationship of chlorophyll to phosphorus and nitrogen in nutrient-rich lakes. Inland Waters 7, 385-400 (2017).
  32. Klausmeier, C. A., Litchman, E., Daufresne, T. & Levin, S. A. Optimal nitrogen-to-phosphorus stoichiometry of phytoplankton. Nature 429, 171-174 (2004).
  33. Godwin, C. M. & Cotner, J. B. What intrinsic and extrinsic factors explain the stoichiometric diversity of aquatic heterotrophic bacteria? ISME J. 12, 598-609 (2018).
  34. Goldberg, S. J. et al. Refractory dissolved organic nitrogen accumulation in high-elevation lakes. Nat. Commun. 6, 6347 (2015).
  35. Elser, J. J. et al. Sustained stoichiometric imbalance and its ecological consequences in a large oligotrophic lake. Proc. Natl Acad. Sci. 119, e2202268119 (2022).
  36. Jiao, N. et al. Microbial production of recalcitrant dissolved organic matter: Long-term carbon storage in the global ocean. Nat. Rev. Microbiol. 8, 593-599 (2010).
  37. Zhu, X., Jackson, R. D., DeLucia, E. H., Tiedje, J. M. & Liang, C. The soil microbial carbon pump: From conceptual insights to empirical assessments. Glob. Change Biol. 26, 6032-6039 (2020).
  38. Taylor, P. G. & Townsend, A. R. Stoichiometric control of organic carbon-nitrate relationships from soils to the sea. Nature 464, 1178-1181 (2010).
  39. Hansen, A. T., Dolph, C. L. & Finlay, J. C. Do wetlands enhance downstream denitrification in agricultural landscapes? Ecosphere 7, e01516 (2016).
  40. Schindler, D. W., Carpenter, S. R., Chapra, S. C., Hecky, R. E. & Orihel, D. M. Reducing phosphorus to curb lake eutrophication is a success. Environ. Sci. Technol. 50, 8923-8929 (2016).
  41. Scott, J. T. & McCarthy, M. J. Nitrogen fixation may not balance the nitrogen pool in lakes over timescales relevant to eutrophication management. Limnol. Oceanogr. 55, 1265-1270 (2010).
  42. Trautmann, N. M., McCulloch, C. E. & Oglesby, R. T. Statistical determination of data requirements for assessment of lake restoration programs. Can. J. Fish. Aquat. Sci. 39, 607-610 (1982).
  43. Tilman, D., May, R. M., Lehman, C. L. & Nowak, M. A. Habitat destruction and the extinction debt. Nature 371, 65-66 (1994).
  44. Weber, T. S. & Deutsch, C. Ocean nutrient ratios governed by plankton biogeography. Nature 467, 550-554 (2010).
  45. Jeppesen, E. et al. Structure, species richness and biodiversity in Danish lakes: Changes along a phosphorus gradient. Freshw. Biol. 45, 201-218 (2000).
  46. Boedecker, A. R., Niewinski, D. N., Newell, S. E., Chaffin, J. D. & McCarthy, M. J. Evaluating sediments as an ecosystem service in western Lake Erie via quantification of nutrient cycling pathways and selected gene abundances. J. Gt. Lakes Res. 46, 920-932 (2020).
  47. Hoffman, D. K., McCarthy, M. J., Boedecker, A. R., Myers, J. A. & Newell, S. E. The role of internal nitrogen loading in supporting non-N-fixing harmful cyanobacterial blooms in the water column of a large eutrophic lake. Limnol. Oceanogr. 67, 2028-2041 (2022).
  48. Koussoroplis, A.-M., Schälicke, S., Raatz, M., Bach, M. & Wacker, A. Feeding in the frequency domain: Coarser-grained environments increase consumer sensitivity to resource variability, covariance and phase. Ecol. Lett. 22, 1104-1114 (2019).
  49. Cusser, S., Helms, J. IV, Bahlai, C. A. & Haddad, N. M. How long do population level field experiments need to be? Utilising data from the 40-year-old LTER network. Ecol. Lett. 24, 1103-1111 (2021).
  50. EPA, U. Preventing Eutrophication: Scientific support for dual nutrient criteria. (2015).
  51. Westphal, K. et al. Multi-decadal trajectories of phosphorus loading, export, and instream retention along a catchment gradient. Sci. Total Environ. 667, 769-779 (2019).
  52. Kronvang, B. et al. Effects of policy measures implemented in Denmark on nitrogen pollution of the aquatic environment. Environ. Sci. Policy 11, 144-152 (2008).
  53. Hansen, A. T., Dolph, C. L., Foufoula-Georgiou, E. & Finlay, J. C. Contribution of wetlands to nitrate removal at the watershed scale. Nat. Geosci. 11, 127-132 (2018).
  54. Zak, D. et al. An Assessment of the multifunctionality of integrated buffer zones in Northwestern Europe. J. Environ. Qual. 48, 362-375 (2019).
  55. Filazzola, A. et al. A database of chlorophyll and water chemistry in freshwater lakes. Sci. Data 7, 310 (2020).
  56. R. Core Team. R: A Language and Environment for Statistical Computing. (R Foundation for Statistical Computing, 2023).
  57. QGIS Development Team. QGIS geographic information system. (2022).
  58. Soranno, P. A. et al. LAGOS-NE: A multi-scaled geospatial and temporal database of lake ecological context and water quality for thousands of US lakes. GigaScience 6, gix101 (2017).
  59. Isles, P. D. F. The misuse of ratios in ecological stoichiometry. Ecology 101, e03153 (2020).
  60. Ren, S. et al. Nonparametric bootstrapping for hierarchical data. J. Appl. Stat. 37, 1487-1498 (2010).
  61. Kruschke, J. Doing Bayesian Data Analysis: A Tutorial with R, JAGS, and Stan. (Academic Press, 2014).
  62. Davidson, T. A. et al. Bimodality and alternative equilibria do not help explain long-term patterns in shallow lake chlorophyll-a. Nat. Commun. 14, 398 (2023).

الشكر والتقدير

تم تمويل عمل D.G. و D.B. و T.S. من قبل الفترة الرابعة من التمويل الموجه للبرامج، جمعية هيلمهولتز لمراكز البحث الألمانية، مجال البحث الأرض والبيئة. تم تمويل M.J.M. من قبل منحة مجلس البحث الإستوني PRG1954. تم دعم E.J. من قبل برنامج TÜBITAK BIDEB2232 (المشروع 118C250). تم دعم M.S. من قبل صندوق بول ديو ينسن (مؤسسة Grundfos).

مساهمات المؤلفين

تم تصور الدراسة في البداية من قبل D.G. و T.A.D.، الذين طوروا أيضًا النهج الإحصائي. تم تطوير المنهجية ونص المخطوطة بشكل أكبر من قبل D.G. مع مساهمات من T.A.D، D.B.، T.S.، M.S.، E.J. و M.J.M حول طرق أخذ العينات، وآثار استنفاد المغذيات على مستوى النظام البيئي، وفيزيولوجيا وبيئة الطحالب، والكيمياء الحيوية للمغذيات لنهج الدراسة وتفسيرها؛ مع مزيد من المدخلات من T.A.D. و D.B. من وجهات نظر إدارة البحيرات والمناظر الطبيعية؛ ومساهمات من T.A.D، M.J.M.، T.S.، D.B.، E.J.، M.S. و T.L.L. حول الجوانب الفنية، وأثناء مرحلة الكتابة.

التمويل

تم تمكين وتنظيم تمويل الوصول المفتوح من قبل مشروع DEAL.

المصالح المتنافسة

يعلن المؤلفون عدم وجود مصالح متنافسة.

معلومات إضافية

معلومات إضافية النسخة الإلكترونية تحتوي على
المواد التكميلية المتاحة على
https://doi.org/10.1038/s41467-024-45115-3.
يجب توجيه المراسلات والطلبات للمواد إلى دانيال غرايبر.
معلومات مراجعة الأقران تشكر Nature Communications المراجع(ين) المجهول(ين) على مساهمتهم في مراجعة الأقران لهذا العمل. يتوفر ملف مراجعة الأقران.
معلومات إعادة الطبع والتصاريح متاحة على http://www.nature.com/reprints
ملاحظة الناشر تظل Springer Nature محايدة فيما يتعلق بالمطالبات القضائية في الخرائط المنشورة والانتماءات المؤسسية.
الوصول المفتوح هذه المقالة مرخصة بموجب ترخيص المشاع الإبداعي للاستخدام والمشاركة والتكيف والتوزيع وإعادة الإنتاج في أي وسيلة أو تنسيق، طالما أنك تعطي الائتمان المناسب للمؤلف(ين) الأصليين والمصدر، وتوفر رابطًا لترخيص المشاع الإبداعي، وتوضح ما إذا كانت هناك تغييرات قد تم إجراؤها. الصور أو المواد الأخرى من طرف ثالث في هذه المقالة مشمولة في ترخيص المشاع الإبداعي للمقالة، ما لم يُشار إلى خلاف ذلك في سطر ائتمان للمادة. إذا لم تكن المادة مشمولة في ترخيص المشاع الإبداعي للمقالة واستخدامك المقصود غير مسموح به بموجب اللوائح القانونية أو يتجاوز الاستخدام المسموح به، ستحتاج إلى الحصول على إذن مباشرة من صاحب حقوق الطبع والنشر. لعرض نسخة من هذا الترخيص، قم بزيارة http://creativecommons.org/ licenses/by/4.0/.
© المؤلف(ون) 2024

  1. قسم تحليل النظام البيئي المائي، مركز هيلمهولتز للبحث البيئي – UFZ، ماجدبورغ، ألمانيا. كرسي علم الأحياء المائية ومصايد الأسماك، جامعة إستونيا للعلوم الحياتية، تارту، إستونيا. قسم بحوث البحيرات، مركز هيلمهولتز للبحث البيئي – UFZ، ماجدبورغ، ألمانيا. قسم علوم البيئة، و WATEC، C.F. Møllers Allé 3، جامعة آرهوس، آرهوس، الدنمارك. مركز التعليم والبحث الصيني الدنماركي، بكين، الصين. مختبر علم المياه، قسم العلوم البيولوجية ومركز أبحاث وتنفيذ النظام البيئي، جامعة الشرق الأوسط التقنية، أنقرة، تركيا. معهد العلوم البحرية، جامعة الشرق الأوسط التقنية، مرسين، تركيا. معهد التحكم البيئي والتلوث لبحيرات الهضبة، مدرسة العلوم البيئية والبيئية، جامعة يونان، كونمينغ، الصين. البريد الإلكتروني: daniel.graeber@ufz.de

Journal: Nature Communications, Volume: 15, Issue: 1
DOI: https://doi.org/10.1038/s41467-024-45115-3
PMID: https://pubmed.ncbi.nlm.nih.gov/38280872
Publication Date: 2024-01-27

Consistent stoichiometric long-term relationships between nutrients and chlorophylla across shallow lakes

Received: 31 July 2023
Accepted: 15 January 2024
Published online: 27 January 2024

Check for updates

Daniel Graeber © , Mark J. McCarthy , Tom Shatwell (B) , Dietrich Borchardt (B) , Erik Jeppesen , Martin Søndergaard , Torben L. Lauridsen & Thomas A. Davidson (1)

Abstract

Aquatic ecosystems are threatened by eutrophication from nutrient pollution. In lakes, eutrophication causes a plethora of deleterious effects, such as harmful algal blooms, fish kills and increased methane emissions. However, lake-specific responses to nutrient changes are highly variable, complicating eutrophication management. These lake-specific responses could result from short-term stochastic drivers overshadowing lake-independent, long-term relationships between phytoplankton and nutrients. Here, we show that strong stoichiometric long-term relationships exist between nutrients and chlorophyll (Chla) for 5 -year simple moving averages (SMA, median ) along a gradient of total nitrogen to total phosphorus (TN:TP) ratios. These stoichiometric relationships are consistent across 159 shallow lakes (defined as average depth ) from a cross-continental, open-access database. We calculate 5-year SMA residuals to assess short-term variability and find substantial short-term Chla variation which is weakly related to nutrient concentrations (median ). With shallow lakes representing 89% of the world’s lakes, the identified stoichiometric long-term relationships can globally improve quantitative nutrient management in both lakes and their catchments through a nutrient-ratio-based strategy.

Controlling eutrophication requires managing external total phosphorus (TP) and total nitrogen (TN) loads to lake ecosystems . Universal patterns of N – or P -deficient phytoplankton growth have been proposed, with thresholds at molar TN:TP ratios < 20 for N deficiency and for P deficiency, primarily based on standardized laboratory measurements . However, snapshot lake monitoring data have shown variable responses to changes in TN and TP concentrations at different TN:TP ratios, which was attributed to differences in lake or catchment
characteristics , with apparent thresholds ranging from TN:TP for N deficiency and for P deficiency . Due to large variations in relationships between nutrients and chlorophyll (Chla) even among homogeneous lake sets, log-log transformations have been suggested for , and have been used to detect changes in apparent TN or TP control of phytoplankton biomass . Furthermore, since measurements of TN and TP and phytoplankton biomass (e.g., Chla) are not independent, relationships are often considered
tautologous . In terms of nutrient dynamics, many lake monitoring programs and datasets include only total nutrient concentrations and Chla, which do not include information on nutrient availabilities or lake internal nutrient dynamics . Without mechanistic data describing internal nutrient dynamics and true availability, we are often left with total nutrient and Chla data with which to evaluate nutrient and phytoplankton relationships. We believe that by understanding the source of lake-specific, high variability of total nutrient – Chla relationships, and characteristics of the apparent tautology, global patterns of N and P relationships with phytoplankton growth in shallow lake ecosystems can be discerned.
Strayer et al. suggested that long-term ecological signal analyses are suitable for three phenomena: slow processes, rare events, and subtle processes. Eutrophication may serve as a prime example of a subtle process, with links between Chla and nutrients becoming apparent only in the long term due to unpredictable year-to-year
variability obscuring subtle changes . Random annual fluctuations in factors such as ice-free periods, changes in phytoplankton composition, phytoplankton pigment content, and top-down food chain effects contribute to substantial variation in phytoplankton responses to N or P changes . By separating long-term signals from their shortterm counterparts, a clearer relationship between phytoplankton biomass and nutrient concentrations should emerge (Fig.1).
By integrating long-term signal analysis with a deeper understanding of the nutrient-Chla tautology, we may be able to better detect phytoplankton community growth patterns relative to TN and TP. Specifically, the tautology should only be valid during the growing season, when most of the total nutrient pool may be contained within phytoplankton biomass. Within the growing season, the tautology should not apply if a nutrient is present in excess, as illustrated by Lewis & Wurtsbaugh for the TP-Chla relationship under P excess. We suggest that the tautology and nutrient accumulation have a
Extraction of 5-year simple moving averages (SMA) and their residuals
Random sampling and correlation of Chla and nutrients within TN:TP windows
Fig. 1 | Conceptual diagram of the data analyses performed and their hypothesised results. We used growing season averages of shallow lake time series to calculate 5-year simple moving averages (SMA), which act as low-pass filter to extract long-term variation. We used the residuals of the 5 -year SMA, calculated as the growing season observation minus the SMA for the same year, as high-pass filter to reveal short-term variation . We evaluated different SMA lengths and found 5 years to be ideal (see methods and SI for details). We categorized the data into overlapping TN:TP “windows” to assess the link between TN, TP, and Chla within different ranges of TN:TP (B). Here, we used the natural logarithm of TN:TP ratios because ratios follow a log-normal distribution . For each TN:TP window,
B
Split into TN:TP range windows
D
5-yr SMA, total nutrients versus Chla along TN:TP
the data were randomly sampled 300 times using a hierarchical bootstrap procedure to preclude temporal dependence of the sampled data . For each random sample, we calculated generalized linear models with gamma distribution (5-year SMA) or linear models (SMA residuals) for the relationship between Chla and TP and/or TN, and extracted and model coefficients ( ). Model slopes and are shown in the main text, see Methods and SI for details on the bootstrap and other model coefficients. We hypothesize high TP model slopes, high and low concentrations of reactive pelagic in the form of soluble reactive phosphorus (SRP) at higher TN:TP, and high TN model slopes, high and low concentrations of reactive pelagic N as nitrate- N at lower TN:TP (D).
stoichiometric variant, where dissolved nutrients can accumulate when phytoplankton assimilation of a dissolved nutrient is constrained by the availability of another nutrient (Fig. 1). In this case, the nutrient in relative excess may accumulate in the water column in dissolved, reactive form . This notion agrees with previous ecological models , which have proposed stoichiometric limits to phytoplankton N and P cell contents depending on relative water N and P concentrations, with accumulation of reactive nutrients if these nutrients are available in excess. Furthermore, this approach assumes that concentration measurements of the reactive nutrient forms can capture the true nutrient bioavailability in the system to a large part. If the proposed patterns of relative N and P accumulation and availability are lake-independent, universal relationships between TN, TP, reactive nutrient forms and Chla should emerge along a gradient of TN:TP ratios in shallow lakes.
We propose that long-term signals capture the majority of statistical dependence of Chla concentrations on TN and TP concentrations, and that the strength of the relationships and model coefficients are universal along a TN:TP gradient for a large, global shallow lake dataset (Fig. 1). If most of the information about relationships between nutrients and Chla is contained within the 5 -year simple moving averages (SMA), then year-to-year residual variation should not reveal systematic changes in model slope or high . Long-term relationships between Chla and TN or TP concentration during the growing season should exhibit a consistent, lake-independent steeper slope (Fig. 1) . Additionally, the long-term pattern should indicate an increased proportion of inorganic, reactive forms of N and P during the growing season, when there is N and/or P excess for phytoplankton growth at specific TN:TP ratios (Fig. 1). Of the inorganic, reactive N forms, ammonium-N is most energetically favorable for algal growth , but concentration measurements are scarce and unreliable due to its bioreactivity . Instead, we chose nitrate-N, as it is less energetically favorable, and thus more prone to accumulate at measurable concentrations, and more likely to accumulate over long-term periods .
We use lakes with a cut-off of 6 m average depth and without any further data selection. By doing so, our data analysis is representative of the vast majority of the world’s lakes; of the 1.4 million lakes in the global HydroLAKES database are shallower than 6 m . We used this cutoff to assess shallow, often polymictic lakes where water samples of nutrients and Chla are likely to be representative of the entire water column .
In this work, we show robust, ubiquitous stoichiometric long-term relationships between nutrients and Chla in shallow lakes, supporting the current view that nuanced dual nutrient control based on nutrient ratios is required for efficiently managing lake eutrophication . For such strategies to succeed, it is crucial to manage both N and P across the entire catchment area, adopting a comprehensive and integrated perspective on nutrient loads and ratios . However, further investigation is necessary to confirm whether the observed stoichiometric patterns represent a consistent, causal relationship between nutrient levels and phytoplankton growth over the long term. If future studies validate our findings, the identified stoichiometric relationships will enable managers to accurately predict the outcomes of long-term eutrophication management, based on TN:TP ratios and concentrations.

Results and discussion

When combining TN and TP concentrations as predictor variables in additive models, the long-term, 5-year SMAs showed the underlying relationships between TN, TP and Chla with a high median (0.69-0.96 95% highest-density interval (HDI)) for the additive linear models (Fig. 2C, see SI for Akaike’s Information Criterion supporting this statement). Although uncertainty of the additive models increased
at , we still found a median (Fig. 2C). The higher uncertainty around is shared between all models for TN:TP < 20 (Fig. 2A-C) and is probably due to the smaller number of observations in this range (16-64 observations per model compared to 18-158 observations per model for TN:TP > 20, see also SI).
The slopes of the additive models revealed a tipping point behavior with change of TN:TP (Fig. 3B, D). Here, the TP slopes of the additive models (Fig. 3B) were maximal at TN:TP > 50 (median = 381.5, 130.8-524.5 HDI), with a decline at TN:TP < 50, and TP slopes partially crossing zero at TN:TP < 20 (median = 43.4, -54-180.2 HDI). Furthermore, the additive model slopes for TN revealed a clear tipping point behavior (Fig. 3D), with the highest values at TN:TP (median = 54.9, 28.7-86.6 HDI), a gradual decrease for TN:TP of 20-50, and model slopes consistently near zero at TN:TP (median = 5.8, ). Previous approaches have not been able to assess whether N or P , both, or neither nutrient is closely linked to Chla in the range between TN:TP of 20-50 . In contrast, our results show empirical evidence of ubiquitous dual-nutrient links to Chla for the 5-year SMAs within this TN:TP range (Fig. 3). Furthermore, the majority of our 5-year SMA observations (60%) (Fig. 3) were between TN:TP = 20-50, which suggests that dual-nutrient links to Chla are the most common scenario in lakes average depth, which is in agreement with a global cross-ecosystem analysis of relative nutrient limitation .
When only including TP concentration as the predictor variable, the long-term relationships of TP – Chla also agree with our assumptions (depicted conceptually in Fig. 1D) and previous literature . For TN:TP > 30, TP – Chla models produced a median HDI), which decreased to a median with high uncertainty ( ) for (Fig. 2A). Here, the slope change of the TP – Chla models revealed a tipping point behavior, where the singlenutrient TP model slopes were stable at TN:TP > 30, and decreased below that, with slopes of a portion of the model solutions crossing zero at TN:TP < 15 (Fig. 3A). The implication of relative TP deficiency or excess from our model estimates was also supported by the accumulation of SRP. Specifically, median SRP concentrations were for TN:TP and for TN:TP (Fig. 4A).
When only including TN concentration as the predictor variable for TN – Chla models, we observed unexpected, yet potentially revealing patterns. The of the TN-only models (Fig. 2B) was high even at TN:TP > 50, which contrasts with the expected relative N excess and breakdown of (Fig. 1D). Furthermore, the TN-only model slopes revealed no tipping point behavior indicative of change in N excess, but a continuous and highly consistent slope decrease with increasing TN:TP (Fig. 3C). We also found a dichotomy of nitrate-N concentrations at TN:TP > 50, with a small subset of data revealing high nitrate-N concentrations of more than ( of the samples), but most samples showing nitrate-N concentrations (77%, Fig. 4B). Based on this it seems that, in the majority of lakes, denitrification was efficient at removing nitrate- , and was responsible for the low correlation between TN and nitrate-N (see SI for a TN – nitrate-N scatterplot), except for very high TN concentrations, as was shown before for nutrient-rich lakes . For the data with low nitrate-N concentrations, we also detected lower Chla concentrations, indicating that potentially reactive N was depleted even at high TN:TP (Fig. 4B). Thus, the data suggests that N was not as available to phytoplankton at high TN:TP (Fig. 2B, Fig. 3C) as P seems to have been at low TN:TP (Fig. 2A, Fig. 3A).
Based on the empirical evidence, we propose that non-reactive or less reactive N pools must contain the N not accessible for phytoplankton growth at high TN:TP. Living or dead particulate organic matter is not a likely storage pool, as typical ranges of phytoplankton and bacterial cell N : P ratios are insufficient to account for such high TN:TP ratios. In contrast, dissolved organic matter, particularly dissolved proteinaceous matter, is a likely candidate. In a study of four
Fig. 2 | Explained variance of the generalised linear models. The values are separated for long-term variation in the shallow lakes based on 5-year simple moving averages (SMA) (A-C) and short-term variation based on SMA residuals (D-F). Shown are results from generalised linear models with gamma distributions for 5-year SMAs and linear models with normal distributions for SMA residuals for total phosphorus (TP, mg/L, panels A, D), total nitrogen (TN, mg/L, panels B, E), or additive models of TP and TN (panels C, F) and chlorophyll a (Chla, ). These are
plotted against the mean molar TN:TP of each randomly sampled dataset (see Fig. 1 for data processing steps). The less transparent the points, the more overlapping solutions for were found by the bootstrap procedure (indicating the error of ). The orange line is the mean response based on a LOESS function. samples for the 5-year SMAs because not all models converged ( ) and samples for the SMA residuals (D-F).
lakes, dissolved proteins were selectively preserved over decadal to centennial timescales potentially due to bacterial and photochemical degradation . Moreover, in a long-term study of Flathead Lake, high pelagic molar TN:TP ratios (80-90) were best explained by long-term N conservation in the dissolved organic N pool . In our case, TN concentrations were high at TN:TP , and were maximal at TN:TP > 100 (see SI, section 9, for details). Hence, refractory dissolved organic N may be a considerable, yet largely overlooked, N storage pool in lakes. Based on this evidence, we hypothesise two alternative pathways for the N fate in high TN:TP lakes: (i) either accumulation of excess N as nitrate- N in a minority of lakes, or (ii) removal and storage
in a coupled denitrification-dissolved organic N pathway, with accumulation of refractory dissolved organic N , likely dissolved proteins, in the majority of lakes (Fig. 3B). Such a coupled storage pathway resembles the microbial carbon pump concept in oceans and soils . Furthermore, as organic carbon availability often controls both denitrification and bacterial N assimilation , dissolved organic carbon: N ratios could be crucial for delineating the dominant long-term N pathway.
Another aspect important for the link between TN:TP and N depletion is the potential importance of N fixation by cyanobacteria for providing N to phytoplankton growth. An earlier multi-lake study
5-year SMA model slopes
Single-nutrient and additive models versus TN : TP
Fig. 3 | Slopes of the generalised linear models. Slope values are shown for singlenutrient and additive models for long-term variation in the shallow lakes based on 5-year simple moving averages (SMA) for TP (A, B) and TN (C, D) versus mean molar TN:TP of each randomly sampled dataset. Shown are results from
generalised linear models with gamma distribution of Chla for 5-year SMAs. The less transparent the points, the more overlapping solutions were found for the slopes by the bootstrap procedure (indicating the error of the slopes). The orange line is the mean response based on a LOESS function. samples.
revealed relatively higher importance of denitrification over atmospheric N fixation in the majority of studied lakes . In our study, high relative N fixation rates would lead to long-term N excess even at low TN:TP ratios , causing consistently low and no systematic slope changes across the entire TN:TP range, which we did not observe (Fig. 2A, C). Alternatively, constantly high rates of N fixation relative to denitrification would push TN:TP consistently towards N excess at higher values of approximately TN:TP > 50. Again, we did not observe this, as our study revealed that the majority of TN:TP were between 20 and 50 ( of the observations), supporting the prevalence of denitrification.
By extracting the 5-year SMAs and using a bootstrap procedure, we revealed a robust, ubiquitous long-term response across 159 shallow lakes, suggesting a common long-term stoichiometric relationship between nutrients and Chla, irrespective of differences in nutrient concentrations, lake characteristics, or catchment type. In contrast, the short-term variation contained within the SMA residuals showed low correlation coefficients (median , Fig. 2D-F). Therefore, the persistence of strong phytoplankton-nutrient relationships only in the 5-year SMAs (Fig. 2A-C) supports early ideas that
nutrient control of eutrophication at the ecosystem scale is a gradual process . This increased robustness of the link between nutrients and phytoplankton also removes the need to log transform nutrient concentrations and phytoplankton biomass concentration variables, an approach which has been used to detect changes in nutrientphytoplankton links when using snapshot samples or shorter-term means . However, this long-term link may be surprising as phytoplankton has generation times of days to weeks. That the effect of eutrophication is longer lasting than the generation time of phytoplankton is reminiscent of earlier research, where a a delayed response of species to disturbances over several generations has been proposed to mimic the true disturbance impact . Therefore, multi-year averages may reveal delayed effects of disturbances, but also effects of slowly changing drivers such as climate or terrestrial catchment changes.
Of all the lakes contained in the large open-access global database, only 159 lakes in the temperate climate zone had sufficient long-term data to assess long-term phytoplankton-nutrient relationships, limiting our conclusions for Arctic or tropical shallow lakes. For lakes outside the temperate zone, we assume similar stoichiometric relationships due to similarities in algal physiology. However, marine studies suggest shifted thresholds due to differences in phytoplankton community composition in different climate zones , and similar effects may apply in lakes.
Inorganic nutrients for 5-year SMAs
Fig. 4 | Dissolved inorganic nutrient concentrations versus TN:TP ratios of the shallow lakes. Shown are soluble reactive phosphorus (SRP) (A) and nitrate-N (NO3-N) (B) concentrations of each 5-year simple moving average (SMA) versus the molar TN:TP ratio of the same lake and 5-year SMA. Data are based on the same time series as the other data, but SRP and nitrate-N data were not available for
every TN and TP observation. Therefore, panel A includes 278 observations from 37 shallow lakes, and panel B includes 620 observations from 138 shallow lakes. The axes have been log-transformed since TN:TP ratios followed a log-normal distribution, and to make small SRP and nitrate-N concentrations visible.
Considerable variations in Chla, TN, and TP concentrations were present in residual short-term data. These short-term residual variations were approximately half has high as for the 5-year SMAs. Specifically, the variation of the 5 -year SMAs and their residuals can be expressed as the 95% range of their values using the HDI. For the 5-year SMAs, the HDI range of Chla was . For the short-term Chla data, the HDI range was . Similarly, for the 5 -year SMAs versus the SMA residuals, we found HDI ranges of 2.7 versus , and 0.27 versus for TN and TP, respectively.
This remaining high short-term variability in Chla may be related to variations in abiotic parameters controlling phytoplankton biomass, such as different N and P fractions, and to food web effects . For example, fish predation on cladocerans can vary widely between years due to differences in environmental factors and strongly affect Chla concentrations . Another source of short-term variation could be the Chla content of phytoplankton, which can vary widely within and between species . Furthermore, links between variability in external and internal loading of and , and their specific bioavailable fractions need to be elucidated to better understand short-term variability. Here, not only the well-established internal P loading mechanisms, but also short-term pulses of internal N loading, both from sediments and the water column , may play an important role in causing and maintaining eutrophication. Such pulses may be overlooked by infrequent spot sampling of TN and TP. Furthermore, simple linear regressions may be incapable of revealing short-term eutrophication responses to external drivers. Instead, these responses may emerge in short-term fluctuation amplitude, covariance, synchronicity, and frequency of the variability of nutrients and phytoplankton, analogous to findings for short-term variation of Daphnia and its food sources in lakes . We propose that disentangling the sources and mechanisms of the revealed short-term variation requires high-frequency, detailed measurements of true nutrient availabilities, phytoplankton biomass, and food web structures, linked to mechanistic nutrient flux measurements .
Beyond lakes, many other ecological responses may have two temporal components: a short-term component linked to microbial food webs or stochastic short-term changes, and a long-term component linked to factors with variability following a longer periodicity. This concept has been suspected for decades – and many researchers instinctively use long-term trends to remove short-term variation – but we found few rigorous, systematic investigations of
multi-year monitoring or experiments. One notable exception is a recent study by Cusser et al. , who found that 12 long-term freshwater and terrestrial ecosystem experiments on plant and animal composition exhibited consistent resposes to experimental manipulation only over periods typically exceeding 10 years. With increasing access to high-resolution long-term ecological data, our study and that of Cusser et al. may inspire further research using similar approaches to temporal signal extraction and random time series sampling.

Usage of long-term stoichiometric relationships in lake and catchment management

The long-term relationships between nutrients and Chla revealed in this study provide empirical evidence for the often debated long-term stability of dual nutrient control of phytoplankton biomass , and strongly suggest that recent considerations of dual nutrient control are the best approach to lake management for the majority of shallow lakes. However, dual nutrient control is not easily implemented, as managing N and P input to shallow lakes is challenging.
Many shallow lakes are supplied by surface waters and are part of extensive freshwater networks, where the majority of external N and P originates from hydrological catchment sources. For P , source control has been successful in reducing loading from point sources . However, diffuse N and P source control often demonstrates limited success . As a result, well-designed nature-based solutions are necessary to physically and biologically retain and within soils, riparian zones, wetlands, ponds, and stream networks before these enter lakes, while providing beneficial secondary effects (e.g. on biodiversity) and avoiding deleterious effects (e.g. increased greenhousegas emissions and pollution swapping) . Furthermore, our results may also be applicable for deeper lakes, as we find highly similar results when we do not only include shallow lakes in the data analysis (see SI for an analysis without depth cut-off). Yet, deeper lakes only comprise a small part of the dataset, and we recommend conducting a separate analysis for a dataset consisting of only deeper lakes to assess whether similar patterns appear.
Coupling monitoring, ecosystem models, and experiments may provide additional mechanistic evidence that the stoichiometric empirical patterns found here represent a causal link between nutrients and phytoplankton growth. If our findings are supported by further studies, the stoichiometric relationships found in this study will
allow managers to make long-term predictions of eutrophication management success based on TN:TP ratios and their concentrations.

Methods

Data collection

We collected data from the largest currently available open-access global lake database , to which we added data provided by the Danish Centre for Environment at the Aarhus University in an open-access database (https://odaforalle.au.dk, downloaded in February 2022). We collected average depth and concentrations of Chla, TN, and TP. We performed all data analyses and statistics in R , version .
We included all lakes with an average depth . With this cutoff, our data analysis represents the vast majority of the world’s lakes. Of the 1427688 lakes in the global HydroLAKES database are shallower than 6 m . We used the cutoff, since the probability of stratification is for an average lake depth of . Thus, this cut-off represents lakes with a higher probability of mixing than that of stratification, resulting in the fact that water samples of nutrients and Chla should more likely be representative of the entire water column. Not all lakes in the global nutrient dataset had mean depth values , so we added mean depths from the HydroLAKES database to the global nutrient data time series if not already available. This approach was based on geographical location of the lake using and the unique lake identifier in the global nutrient database . The Danish database included depth values for all lakes, and we excluded saline or brackish waters with more than . No other data filtering, outlier detection, or exclusion was performed.
The global nutrient database did not contain nitrate-N or SRP concentration data. Therefore, we extracted these data from the LAGOS-NE database using the LAGOSNE R package (version 2.0.2, database version 1.087.3) in (version 4.3.0), which contains lake data from the northeastern USA . The lakes from LAGOS-NE are included in the global nutrient database . The Danish database contained nitrateN and SRP concentration data. Again, we kept only lakes mean depth, and no other data filtering was applied.

Calculation of growing season means and simple moving averages

For each lake and year, we calculated growing season means for TN, TP, nitrate-N, SRP, and Chla if three or more observations were available within this period in a given year. For the Northern Hemisphere, we used May to September as the growing season, and for the Southern Hemisphere, we used November to March. No lakes from the tropics were included in the final dataset due to a lack of long-term data series.
After assessing the ideal SMA length by using simulations and the available time series data, we found that 5-year SMAs remove most of the short-term variability while keeping long-term information intact and keeping a high number of lake time series in the dataset (please see the SI for the detailed approach). Based on the growing season means, we calculated all available 5-year SMAs for each lake. We then calculated SMA residuals as the growing season mean minus the 5 -year SMA for the same year and lake. Subsequently, we used the SMA to split the lake time series into high-frequency and low-frequency data. This approach has been used previously for a single lake phytoplankton time series , and we extended this approach to multiple lake time series. Within the SI, we provide evidence for the usefulness of this approach to separate short- and long-term signals in time series data.

Separation into different TN:TP ratio ranges

To assess the effects of TN or TP on associations with Chla at different TN:TP, we separated the 5-year SMA data into TN:TP ‘windows’. We generated 46 TN:TP windows within a range of molar TN:TP between 1 and 1808. Nutrient ratios follow a log-normal distribution , so the TN:TP windows were log-transformed (natural logarithm (ln)). The
windows ranged from to 7.5, with a window width of and an increment of . The windows overlapped; for example, the first window had a range of TN:TP from 1 to 3 , and the second window ranged from 1.1 to 3.1, and so on. We assigned the 5-year SMA and SMA residuals to their TN:TP windows (usually more than one, since the TN:TP windows overlapped). The SMA residuals do not contain absolute TN:TP ratio data, so they were assigned based on TN:TP ratio data for the 5-year SMA for the same year and lake.

Statistics and bootstrap resampling

Once the data were assigned to TN:TP windows, we randomly sampled them 300 times per TN:TP window ( 13800 iterations in total) using a hierarchical bootstrap procedure . In short, we randomly sampled with replacement at the lake level, then randomly sampled one observation (either a single growing season average or a single 5-year SMA) from each lake without replacement until the number of samples equaled the number of lakes in the corresponding TN:TP window. For each random sample, we calculated generalised linear models (GLM, glm function, stats package in R . We used Chla as the dependent variable and built models using either TN (TN – Chla models), TP (TP Chla models), or both TN and TP in additive (TN + TP – Chla) models. In the GLMs, we used the gamma distribution as the link function for the 5-year SMA and the normal distribution of Chla as the link function for SMA residuals (see SI for detailed descriptions of the SMA, TN:TP windowing and bootstrapping approaches). We kept only those iterations where all GLMs converged. Of the 13800 possible iterations ( 46 TN:TP windows times 300 iterations per window), the models converged for 9194 iterations of the 5-year SMAs and for 13800 iterations of the SMA residuals.
From the iterations where all GLMs converged, we extracted (as pseudo – model deviance/zero deviance), Akaike’s information criterion (AIC), model slopes and intercepts (only and slopes are shown in the main manuscript, please see the SI for the other extracted variables). We used the delta AIC between models of the 5 -year SMA to determine whether additive or interactive GLMs of TN and TP had higher model quality than those using only TN or TP as explanatory variables (see SI for model selection procedures). Model improvement was observed with additive TN + TP Chla models, but no further improvement was obtained by including an interaction term. Therefore, we only show results for the TN Chla, TP – Chla, and TN + TP – Chla models. To assess model improvement in terms of for the 5-year SMA compared to SMA residuals, we compared the distribution mean and 95% highest density interval (HDI) .

Software and packages

All data was analysed in R , version 4.3.2 and partially (bootstrap procedure and generalized linear models) in Julia, version 1.9.0, using code developed by the authors. Within the data analysis code, Julia packages DataFrames (version 1.6.1), FLoops (version 0.2.1), DataFramesMeta (version 0.14.1), GLM (version 1.9.0) and Statistics were used; as well as the R package collection tidyverse (version 2.0.0).
Information about the number of lakes with average depth was extracted from the HydroLAKES dataset using QGIS Desktop (version 3.34).
The manuscript was written in Quarto Markdown (version 1.88.0) within the VSCodium IDE (version 1.79.0), and using R (version 4.3.2). Within the manuscript code, plots were generated with the ggplot2 (version 3.4.4), ggpubr (version 0.6.0), ggtext (version 0.1.2), and patchwork package (version 1.1.3).

Reporting summary

Further information on research design is available in the Nature Portfolio Reporting Summary linked to this article.

Data availability

This study uses open-access data from Filazzola et al. (https://doi.org/ 10.5063/F1RV0M1S), the LAGOS-NE database (https://lagoslakes.org/ lagos-ne/), the Danish Overladevandsdatabasen (https://odaforalle.au. ) and from the HydroLAKES database (https://www.hydrosheds. org/products/hydrolakes). All data used and generated in this study are also available here: https://git.ufz.de/graeber/long-term-nutrient-chla-links-shallow-lakes.

Code availability

Links to used open-access software and all code developed for this study are available here: https://git.ufz.de/graeber/long-term-nutrient-chla-links-shallow-lakes. All code developed for this study is published under the BSD-3-Clause License (allowing open access and free software usage with full recognition of the original copyright).

References

  1. Jeppesen, E. et al. Lake responses to reduced nutrient loading an analysis of contemporary long-term data from 35 case studies. Freshw. Biol. 50, 1747-1771 (2005).
  2. Paerl, H. W. et al. It takes two to Tango: When and where dual nutrient (N & P) reductions are needed to protect lakes and downstream ecosystems. Environ. Sci. Technol. 50, 10805-10813 (2016).
  3. Søndergaard, M., Lauridsen, T. L., Johansson, L. S. & Jeppesen, E. Nitrogen or phosphorus limitation in lakes and its impact on phytoplankton biomass and submerged macrophyte cover. Hydrobiologia 795, 35-48 (2017).
  4. Wurtsbaugh, W. A., Paerl, H. W. & Dodds, W. K. Nutrients, eutrophication and harmful algal blooms along the freshwater to marine continuum. WIREs Water 6, e1373 (2019).
  5. Guildford, S. J. & Hecky, R. E. Total nitrogen, total phosphorus, and nutrient limitation in lakes and oceans: Is there a common relationship? Limnol. Oceanogr. 45, 1213-1223 (2000).
  6. Moon, D. L., Scott, J. T. & Johnson, T. R. Stoichiometric imbalances complicate prediction of phytoplankton biomass in U.S. Lakes: Implications for nutrient criteria. Limnol. Oceanogr. 66, 2967-2978 (2021).
  7. Lewis, W. M. & Wurtsbaugh, W. A. Control of Lacustrine phytoplankton by nutrients: erosion of the phosphorus paradigm. Int. Rev. Hydrobiol. 93, 446-465 (2008).
  8. Dolman, A. M. & Wiedner, C. Predicting phytoplankton biomass and estimating critical N:P ratios with piecewise models that conform to Liebig’s law of the minimum. Freshw. Biol. 60, 686-697 (2015).
  9. McCarthy, M. J., Gardner, W. S., Lehmann, M. F. & Bird, D. F. Implications of water column ammonium uptake and regeneration for the nitrogen budget in temperate, eutrophic Missisquoi Bay, Lake Champlain (Canada/USA). Hydrobiologia 718, 173-188 (2013).
  10. McCarthy, M. J., Gardner, W. S., Lehmann, M. F., Guindon, A. & Bird, D. F. Benthic nitrogen regeneration, fixation, and denitrification in a temperate, eutrophic lake: Effects on the nitrogen budget and cyanobacteria blooms. Limnol. Oceanogr. 61, 1406-1423 (2016).
  11. Strayer, D. et al. Long-term ecological studies: An illustrated account of their design, operation, and importance to ecology. Occas. Publ. Inst. Ecosyst. Sci. 2, 1-36 (1986).
  12. Carpenter, S. R. & Leavitt, P. R. Temporal variation in a paleolimnological record arising from a trophic cascade. Ecology 72, 277-285 (1991).
  13. Kasprzak, P., Padisák, J., Koschel, R., Krienitz, L. & Gervais, F. Chlorophyll a concentration across a trophic gradient of lakes: An estimator of phytoplankton biomass? Limnologica 38, 327-338 (2008).
  14. Droop, M. R. Vitamin B12 and Marine Ecology. IV. The kinetics of uptake, growth and inhibition in Monochrysis Lutheri. J. Mar. Biol. Assoc. U. Kingd. 48, 689-733 (1968).
  15. Droop, M. R. The nutrient status of algal cells in continuous culture. J. Mar. Biol. Assoc. U. Kingd. 54, 825-855 (1974).
  16. Shatwell, T. & Köhler, J. Decreased nitrogen loading controls summer cyanobacterial blooms without promoting nitrogen-fixing taxa: Long-term response of a shallow lake. Limnol. Oceanogr. 64, S166-S178 (2019).
  17. Glibert, P. M. et al. Pluses and minuses of ammonium and nitrate uptake and assimilation by phytoplankton and implications for productivity and community composition, with emphasis on nitrogen-enriched conditions. Limnol. Oceanogr. 61, 165-197 (2016).
  18. Trommer, G., Poxleitner, M. & Stibor, H. Responses of lake phytoplankton communities to changing inorganic nitrogen supply forms. Aquat. Sci. 82, 22 (2020).
  19. Reed, M. H. et al. Effects of filtration timing and pore size on measured nutrient concentrations in environmental water samples. Limnol. Oceanogr.: Methods 21, 1-12 (2023).
  20. Massé, S., Botrel, M., Walsh, D. A. & Maranger, R. Annual nitrification dynamics in a seasonally ice-covered lake. PLOS ONE 14, eO213748 (2019).
  21. Small, G. E. et al. Rates and controls of nitrification in a large oligotrophic lake. Limnol. Oceanogr. 58, 276-286 (2013).
  22. Messager, M. L., Lehner, B., Grill, G., Nedeva, I. & Schmitt, O. Estimating the volume and age of water stored in global lakes using a geo-statistical approach. Nat. Commun. 7, 13603 (2016).
  23. Kirillin, G. & Shatwell, T. Generalized scaling of seasonal thermal stratification in lakes. Earth-Sci. Rev. 161, 179-190 (2016).
  24. Scott, J. T., McCarthy, M. J. & Paerl, H. W. Nitrogen transformations differentially affect nutrient-limited primary production in lakes of varying trophic state. Limnol. Oceanogr. Lett. 4, 96-104 (2019).
  25. Westphal, K., Musolff, A., Graeber, D. & Borchardt, D. Controls of point and diffuse sources lowered riverine nutrient concentrations asynchronously, thereby warping molar N:P ratios. Environ. Res. Lett. 15, 104009 (2020).
  26. Graeber, D. et al. Bioavailable DOC: Reactive nutrient ratios control heterotrophic nutrient assimilationAn experimental proof of the macronutrient-access hypothesis. Biogeochemistry 155, 1-20 (2021).
  27. Wachholz, A. et al. Stoichiometry on the edge – Humans induce strong imbalances of reactive C:N:P ratios in streams. Environ. Res. Lett. 18, 044016 (2023).
  28. Elser, J. J. et al. Global analysis of nitrogen and phosphorus limitation of primary producers in freshwater, marine and terrestrial ecosystems. Ecol. Lett. 10, 1135-1142 (2007).
  29. Seitzinger, S. et al. Denitrification across landscapes and waterscapes: a synthesis. Ecol. Appl. 16, 2064-2090 (2006).
  30. Holmroos, H., Hietanen, S., Niemistö, J. & Horppila, J. Sediment resuspension and denitrification affect the nitrogen to phosphorus ratio of shallow lake waters. Fundam. Appl. Limnol. 180, 193-205 (2012).
  31. Filstrup, C. T. & Downing, J. A. Relationship of chlorophyll to phosphorus and nitrogen in nutrient-rich lakes. Inland Waters 7, 385-400 (2017).
  32. Klausmeier, C. A., Litchman, E., Daufresne, T. & Levin, S. A. Optimal nitrogen-to-phosphorus stoichiometry of phytoplankton. Nature 429, 171-174 (2004).
  33. Godwin, C. M. & Cotner, J. B. What intrinsic and extrinsic factors explain the stoichiometric diversity of aquatic heterotrophic bacteria? ISME J. 12, 598-609 (2018).
  34. Goldberg, S. J. et al. Refractory dissolved organic nitrogen accumulation in high-elevation lakes. Nat. Commun. 6, 6347 (2015).
  35. Elser, J. J. et al. Sustained stoichiometric imbalance and its ecological consequences in a large oligotrophic lake. Proc. Natl Acad. Sci. 119, e2202268119 (2022).
  36. Jiao, N. et al. Microbial production of recalcitrant dissolved organic matter: Long-term carbon storage in the global ocean. Nat. Rev. Microbiol. 8, 593-599 (2010).
  37. Zhu, X., Jackson, R. D., DeLucia, E. H., Tiedje, J. M. & Liang, C. The soil microbial carbon pump: From conceptual insights to empirical assessments. Glob. Change Biol. 26, 6032-6039 (2020).
  38. Taylor, P. G. & Townsend, A. R. Stoichiometric control of organic carbon-nitrate relationships from soils to the sea. Nature 464, 1178-1181 (2010).
  39. Hansen, A. T., Dolph, C. L. & Finlay, J. C. Do wetlands enhance downstream denitrification in agricultural landscapes? Ecosphere 7, e01516 (2016).
  40. Schindler, D. W., Carpenter, S. R., Chapra, S. C., Hecky, R. E. & Orihel, D. M. Reducing phosphorus to curb lake eutrophication is a success. Environ. Sci. Technol. 50, 8923-8929 (2016).
  41. Scott, J. T. & McCarthy, M. J. Nitrogen fixation may not balance the nitrogen pool in lakes over timescales relevant to eutrophication management. Limnol. Oceanogr. 55, 1265-1270 (2010).
  42. Trautmann, N. M., McCulloch, C. E. & Oglesby, R. T. Statistical determination of data requirements for assessment of lake restoration programs. Can. J. Fish. Aquat. Sci. 39, 607-610 (1982).
  43. Tilman, D., May, R. M., Lehman, C. L. & Nowak, M. A. Habitat destruction and the extinction debt. Nature 371, 65-66 (1994).
  44. Weber, T. S. & Deutsch, C. Ocean nutrient ratios governed by plankton biogeography. Nature 467, 550-554 (2010).
  45. Jeppesen, E. et al. Structure, species richness and biodiversity in Danish lakes: Changes along a phosphorus gradient. Freshw. Biol. 45, 201-218 (2000).
  46. Boedecker, A. R., Niewinski, D. N., Newell, S. E., Chaffin, J. D. & McCarthy, M. J. Evaluating sediments as an ecosystem service in western Lake Erie via quantification of nutrient cycling pathways and selected gene abundances. J. Gt. Lakes Res. 46, 920-932 (2020).
  47. Hoffman, D. K., McCarthy, M. J., Boedecker, A. R., Myers, J. A. & Newell, S. E. The role of internal nitrogen loading in supporting non-N-fixing harmful cyanobacterial blooms in the water column of a large eutrophic lake. Limnol. Oceanogr. 67, 2028-2041 (2022).
  48. Koussoroplis, A.-M., Schälicke, S., Raatz, M., Bach, M. & Wacker, A. Feeding in the frequency domain: Coarser-grained environments increase consumer sensitivity to resource variability, covariance and phase. Ecol. Lett. 22, 1104-1114 (2019).
  49. Cusser, S., Helms, J. IV, Bahlai, C. A. & Haddad, N. M. How long do population level field experiments need to be? Utilising data from the 40-year-old LTER network. Ecol. Lett. 24, 1103-1111 (2021).
  50. EPA, U. Preventing Eutrophication: Scientific support for dual nutrient criteria. (2015).
  51. Westphal, K. et al. Multi-decadal trajectories of phosphorus loading, export, and instream retention along a catchment gradient. Sci. Total Environ. 667, 769-779 (2019).
  52. Kronvang, B. et al. Effects of policy measures implemented in Denmark on nitrogen pollution of the aquatic environment. Environ. Sci. Policy 11, 144-152 (2008).
  53. Hansen, A. T., Dolph, C. L., Foufoula-Georgiou, E. & Finlay, J. C. Contribution of wetlands to nitrate removal at the watershed scale. Nat. Geosci. 11, 127-132 (2018).
  54. Zak, D. et al. An Assessment of the multifunctionality of integrated buffer zones in Northwestern Europe. J. Environ. Qual. 48, 362-375 (2019).
  55. Filazzola, A. et al. A database of chlorophyll and water chemistry in freshwater lakes. Sci. Data 7, 310 (2020).
  56. R. Core Team. R: A Language and Environment for Statistical Computing. (R Foundation for Statistical Computing, 2023).
  57. QGIS Development Team. QGIS geographic information system. (2022).
  58. Soranno, P. A. et al. LAGOS-NE: A multi-scaled geospatial and temporal database of lake ecological context and water quality for thousands of US lakes. GigaScience 6, gix101 (2017).
  59. Isles, P. D. F. The misuse of ratios in ecological stoichiometry. Ecology 101, e03153 (2020).
  60. Ren, S. et al. Nonparametric bootstrapping for hierarchical data. J. Appl. Stat. 37, 1487-1498 (2010).
  61. Kruschke, J. Doing Bayesian Data Analysis: A Tutorial with R, JAGS, and Stan. (Academic Press, 2014).
  62. Davidson, T. A. et al. Bimodality and alternative equilibria do not help explain long-term patterns in shallow lake chlorophyll-a. Nat. Commun. 14, 398 (2023).

Acknowledgements

The work of D.G., D.B. and T.S. was funded by the Fourth Period of Programme-oriented Funding, Helmholtz Association of German Research Centres, Research Field Earth and Environment. M.J.M. was funded by Estonian Research Council grant PRG1954. E.J. was supported by the TÜBITAK program BIDEB2232 (project 118C250). M.S. was supported by Poul Due Jensens Fond (Grundfos Foundation).

Author contributions

The study was initially conceived by D.G. and T.A.D., who also developed the statistical approach. The methodology and manuscript text was further developed by D.G. with contributions from T.A.D, D.B., T.S., M.S., E.J. and M.J.M on sampling methods, and implications of ecosystemlevel nutrient depletion, algal physiology and ecology, and nutrient biogeochemistry for the study approach and interpretation; with further inputs from T.A.D. and D.B. from lake and landscape management perspectives; and contributions from T.A.D, M.J.M., T.S., D.B., E.J., M.S. and T.L.L. on technical aspects, and during the writing phase.

Funding

Open Access funding enabled and organized by Projekt DEAL.

Competing interests

The authors declare no competing interests.

Additional information

Supplementary information The online version contains
supplementary material available at
https://doi.org/10.1038/s41467-024-45115-3.
Correspondence and requests for materials should be addressed to Daniel Graeber.
Peer review information Nature Communications thanks the anonymous reviewer(s) for their contribution to the peer review of this work. A peer review file is available.
Reprints and permissions information is available at http://www.nature.com/reprints
Publisher’s note Springer Nature remains neutral with regard to jurisdictional claims in published maps and institutional affiliations.
Open Access This article is licensed under a Creative Commons Attribution 4.0 International License, which permits use, sharing, adaptation, distribution and reproduction in any medium or format, as long as you give appropriate credit to the original author(s) and the source, provide a link to the Creative Commons licence, and indicate if changes were made. The images or other third party material in this article are included in the article’s Creative Commons licence, unless indicated otherwise in a credit line to the material. If material is not included in the article’s Creative Commons licence and your intended use is not permitted by statutory regulation or exceeds the permitted use, you will need to obtain permission directly from the copyright holder. To view a copy of this licence, visit http://creativecommons.org/ licenses/by/4.0/.
© The Author(s) 2024

  1. Department Aquatic Ecosystem Analysis, Helmholtz-Centre for Environmental Research – UFZ, Magdeburg, Germany. Chair of Hydrobiology & Fisheries, Estonian University of Life Sciences, Tartu, Estonia. Department Lake Research, Helmholtz-Centre for Environmental Research – UFZ, Magdeburg, Germany. Department of Ecoscience, and WATEC, C.F. Møllers Allé 3, Aarhus University, Aarhus, Denmark. Sino-Danish Education and Research Centre, Beijing, China. Limnology Laboratory, Department of Biological Sciences and Centre for Ecosystem Research and Implementation, Middle East Technical University, Ankara, Turkey. Institute of Marine Sciences, Middle East Technical University, Mersin, Turkey. Institute for Ecological and Pollution Control of Plateau Lakes, School of Ecology and Environmental Science, Yunnan University, Kunming, China. e-mail: daniel.graeber@ufz.de