فك شفرة المشهد المكاني ومرونة الخلايا الليفية المثبطة للمناعة في سرطان الثدي Deciphering the spatial landscape and plasticity of immunosuppressive fibroblasts in breast cancer
على الرغم من أنه تم وصف تباين الخلايا الليفية المرتبطة بالسرطان (CAF) الإيجابية لـ FAP في سرطان الثدي، إلا أن مرونتها وتوزيعها المكاني لا يزالان غير مفهومة بشكل جيد. هنا، نقوم بتحليل استنتاج المسار، وفك تشفير النسخ الجينية المكانية على مستوى الخلية الواحدة، وإجراء اختبارات وظيفية لإنشاء خريطة متكاملة عالية الدقة لسرطان الثدي (BC)، مع التركيز على مجموعات CAF الإيجابية لـ FAP المرتبطة بالالتهابات والليفية العضلية (iCAF/myCAF). نحدد 10 مناطق خلوية مرتبطة بـ CAF الإيجابية لـ FAP، تُسمى EcoCellTypes، والتي تتوزع بشكل مختلف داخل الأورام. بما يتماشى مع تنظيمها المكاني، تدفع خلايا السرطان الانتقال من iCAF المرتبطة بإزالة السموم (Detox-iCAF) نحو myCAF المنتجة لمصفوفة خارج الخلية (ECM) المثبطة للمناعة (ECM-myCAF) عبر آلية تعتمد على DPP4 و YAP. بدورها، تقوم ECM-myCAF بتوجيه البلعميات TREM2+، وخلايا NK التنظيمية، وخلايا T لتحفيز EcoCellTypes المثبطة للمناعة، بينما ترتبط Detox-iCAF بالبلعميات FOLR2+ في EcoCellType الحامي للمناعة. تتراكم تحت مجموعات CAF الإيجابية لـ FAP بشكل مختلف وفقًا لحالة سرطان الثدي الغازي وتنبئ بتكرار غزو سرطان القناة في الموقع (DCIS)، مما قد يساعد في تحديد مرضى DCIS منخفضي المخاطر المؤهلين لتقليل العلاج.
سرطان الثدي (BC) هو واحد من أكثر أنواع السرطان شيوعًا بين النساء وسبب رئيسي للوفاة في الدول الغربية، على الرغم من التحسينات الأخيرة في اكتشافه المبكر وتطوير علاجات فعالة. يُعتبر سرطان الثدي مرضًا غير متجانس يُصنف من خلال التحليل النسيجي إلى ثلاثة أنواع رئيسية تظهر توقعات مختلفة: اللمعي (Lum)، HER2، والثلاثي السلبي (TN). من المهم أن نلاحظ أنه لا يوجد حتى الآن علامة حيوية للتنبؤ بتقدم سرطان الثدي من سرطان القنوات اللبنية في موضعه (DCIS) إلى سرطان الثدي الغازي (IBC). من المؤكد الآن أن الورم تلعب البيئة الدقيقة (TME) دورًا رئيسيًا في نمو الورم وتطوره. تتكون TME من الألياف المرتبطة بالسرطان (CAF) ، وخلايا المناعة المتسللة ، والخلايا البطانية ، والخلايا المحيطية المدمجة في المصفوفة خارج الخلوية (ECM) ، والتي تشارك في العديد من خطوات نمو الورم وانتشاره النقيلي. تشكل CAF واحدة من أكثر مكونات TME وفرة في الأورام الصلبة. بينما تم التقليل من شأنها لفترة طويلة ، فإن تباين CAF معترف به الآن بشكل جيد. في الواقع ، تم الكشف مؤخرًا عن عدة تجمعات من CAF في سرطان الثدي البشري بواسطة
دمج دراسة عدة علامات CAF بما في ذلك بروتين تنشيط الألياف (FAP) وعضلات ملساء-الأكتين (SMA) والإنتجرين (CD29)، من بين آخرين لقد حددنا سابقًا أربع مجموعات من خلايا الأنسجة الضامة، المشار إليها باسم CAF-S1 إلى CAF-S4 في سرطان الثدي.. مجموعة CAF-S1 الميوفيبروبلاستية (FAPسي دي 29 SMA ) و CAF-S4 الشبيهة بالأوعية الدموية (FAPسي دي 29سما، الذي تم تسليط الضوء عليه أيضًا من قبل آخرين كنوع مرتبط بالسرطان يُعرف باسم الشبيه المحيطي الوعائي أو CAP)تم اكتشافها في الأورام وتكون غنية في سرطان الثدي الثلاثي السلبي. تم تأكيد وجود هذه المجموعات المختلفة من خلايا الأنسجة الضامة السرطانية وخلايا الأنسجة الضامة السرطانية بواسطة العديد من الطرق، بما في ذلك تحليل الخلايا الفردية، وتم إثباتها في أنواع سرطانية أخرى وفي أنواع مختلفة..
تعتبر تجمعات الخلايا الليفية العضلية المساعدة مؤيدة للانتقال، وقد ارتبط محتواها بتقدم سرطان الثدي.على وجه الخصوص، تعزز تجمعات الخلايا الليفية العضلية CAF-S1 وCAP الشبيهة بالأوعية الدموية (CAF-S4) غزو الورم من خلال آليات تكاملية من خلال التأثير على خلايا الورم والمصفوفة خارج الخلوية المحيطة، على التوالي.بالإضافة إلى ذلك، تم ربط الخلايا الليفية FAP+CAF (أو CAF-S1) أيضًا ببيئة مثبطة للمناعة في أنواع مختلفة من الأورام.. في الواقع، تعزز FAP+ CAF تثبيط المناعة من خلال آليات متعددة: فهي تجذب الخلايا اللمفاوية التائية CD4+ CD25+، وتعزز بقائها، وتروج لتمايزها إلى خلايا T تنظيمية FOXP3+ (Tregs)، بينما تثبط في الوقت نفسه السمية الخلوية للخلايا التائية CD8+.علاوة على ذلك، تم إظهار أن FAP+ CAF تساهم في مقاومة العلاج المناعي في سرطانات الفئران والبشر.. نظرًا لأن FAP+ CAF أظهرت أنشطة مؤيدة للنقائل ومثبطة للمناعة، فقد افترضنا سابقًا أن هذه المجموعة قد تكون متغايرة في حد ذاتها وقمنا بإنتاج واحدة من أكثر بيانات تسلسل RNA أحادي الخلية حلاً (scRNA-seq) لـالسكان فيوجدنا أن مجموعة خلايا FAP+ CAF تتكون من 8 تجمعات خلوية، بما في ذلك ثلاث تجمعات التهابية (iCAF) وخمس تجمعات ليفية عضلية (myCAF).; تم التعرف على iCAF و myCAF سابقًا في سرطان القناة البنكرياسية الغدي (PDAC) استنادًا إلى الجينات المعبر عنها بشكل مختلف كما تم وصفه سابقًا بالتفصيلتتميز المجموعات الثلاث iCAF بمسار إزالة السموم (Detox-iCAF) ومسار إشارات الإنترلوكين (IL-iCAF) وIFN-استجابة بواسطة (IFN-iCAF). IFN-iCAF تعبر عن مستضد CD74 وقد تكون تذكيرًا محتملًا لمستضدات تقديم المستضد CAF (ap-CAF) التي تم تحديدها في سرطان البنكرياس الغدي.تتميز مجموعات myCAF الخمس بتعبير عالٍ عن الجينات التي تشفر بروتينات المصفوفة خارج الخلوية (ECM-myCAF)، TGFمسار الإشارة (TGF-myCAF)، شفاء الجروح (Wound-myCAF)، IFN-استجابة بواسطة (IFNmyCAF) ومسار الأكتين-الميوسين (acto-myCAF). ECM-myCAF و TGF-تتجمع تجمعات myCAF في BC الغنية بخلايا CD4+ T اللمفاوية الإيجابية لـ PD-1 و CTLA-4 و TIGIT، والتي تكون غنية بدورها في Tregs. من المهم أن ECM-myCAF و TGF-myCAF وعناقيد Wound-myCAF مرتبطة بالمقاومة الأولية للعلاج المناعي في مرضى الميلانوما وسرطان الرئة غير صغير الخلايا..
على الرغم من أن دور تجمعات FAP+ CAF في انتشار النقائل، وكبت المناعة، ومقاومة العلاجات المناعية قد تم إثباته الآن بشكل جيد، إلا أن موقعها المكاني، ومرونتها، والتفاعل المتبادل مع الخلايا المحيطة لا تزال أسئلة بلا إجابة. وقد كشفت الجهود لفهم التنظيم الخلوي في سرطان الثدي عن أنواع خلايا متزامنة في مجموعة بيانات تسلسل RNA الكمي.ومع ذلك، كانت هذه الدراسات تفتقر إلى السياق المكاني. علاوة على ذلك، تظل تقنيات التصوير المتعدد محدودة بعدد البروتينات الملونة ولا يمكنها تحديد حالات الخلايا المتنوعة. وقد وفرت تقنيات النسخ الجيني المكاني مؤخرًا وسيلة جديدة لسد هذه الفجوة.كمثال أول، أظهرت عدة دراسات حديثة أن خلايا المناعة ليست موزعة بشكل عشوائي في الأورام، بل منظمة في مناطق محددة، مما يسهل وظائفها ويمكن أن يتنبأ باستجابة العلاجات المناعية وتوقعات المرضى..
هنا، نجمع بين استنتاج المسار على مستوى الخلية الواحدة، وفك تشفير بيانات النسخ الجزيئي المكاني، والاختبارات الوظيفية باستخدام خلايا فايبروبلاست الموجبة لفئة FAP+ المعزولة من مرضى سرطان الثدي لكشف مرونة وتنظيم هذه الفايبروبلاستات في الفضاء مع أنواع خلايا أخرى، وبالتالي معالجة قيود الدراسات السابقة. نحن نفكك FAP+ CAF. المرونة والتواصل مع كل من خلايا السرطان وخلايا المناعة، ونحدد 10 وحدات خلوية مرتبطة بتجمعات FAP+ CAF المنظمة مكانيًا، والتي تُعرف باسم EcoCellTypes (ECT)، وتتكون من تجمعات FAP+ CAF محددة وموجودة بدقة داخل الأورام. تتضمن ECT المثبطة للمناعة والمسموح بها مناعيًا تجمعات FAP+ CAF محددة وسكان مناعي يقع على مسافات مختلفة من تجمعات الورم والأوعية الدموية. يتماشى مع التنظيم المكاني لهذه ECT المرتبطة بتجمعات FAP+ CAF، نلاحظ أن خلايا السرطان تعزز تمايز تجمع Detox-iCAF إلى تجمعات Wound-myCAF و ECM-myCAF من خلال آليات تعتمد على DPP4 و YAP1 سواء في المختبر أو في الجسم الحي. علاوة على ذلك، تكشف دراستنا أن تجمعات FAP+ CAF تلعب دورًا رئيسيًا في تنظيم ECT. في الواقع، Detox-iCAF و IL-iCAF و IFN-iCAF يجند المونوسيتات ويحفز نمط ماكروفاج مرتبط بالورم (TAM) إيجابي FOLR2، بينما ECM-myCAF وTGF-myCAF تعزز أنماط TREM2+ TAM و NKG2A+ NK التنظيمية. حيث تم ربط CAF مؤخرًا بالغزو في سرطان القنوات اللبنية في الموقع (DCIS).نحن نأخذ خطوة إضافية من خلال تحليل دور هذه الاختلافاتالعناقيد في تقدم سرطان الثدي. من خلال استخدام مجموعات داخلية وعامة من مرضى سرطان الثدي الذين يعانون من DCIS، نوضح أن محتوى مجموعة FAP+ Detox-iCAF ينخفض بشكل كبير من DCIS إلى IBC، مما يتماشى مع انتقالهم إلى ECMmyCAF. من المهم أيضًا أن نلاحظ أن انخفاض Detox-iCAF وارتفاع TGF-محتوى myCAF في DCIS عند التشخيص يتنبأ بعودة DCIS إلى IBC، بشكل مستقل عن الدرجة النووية أو النوع الجزيئي، مما يكشف عن عامل تنبؤي للعودة استنادًا إلى مجموعات FAP+CAF المحددة. ستساعد هذه النتائج في تحديد مرضى DCIS ذوي المخاطر المنخفضة للتقدم، الذين قد يستفيدون من تقليل العلاج.
النتائج
تم الكشف عن مرونة FAP+CAF من خلال التحليل الحاسوبي والاختبارات الوظيفية
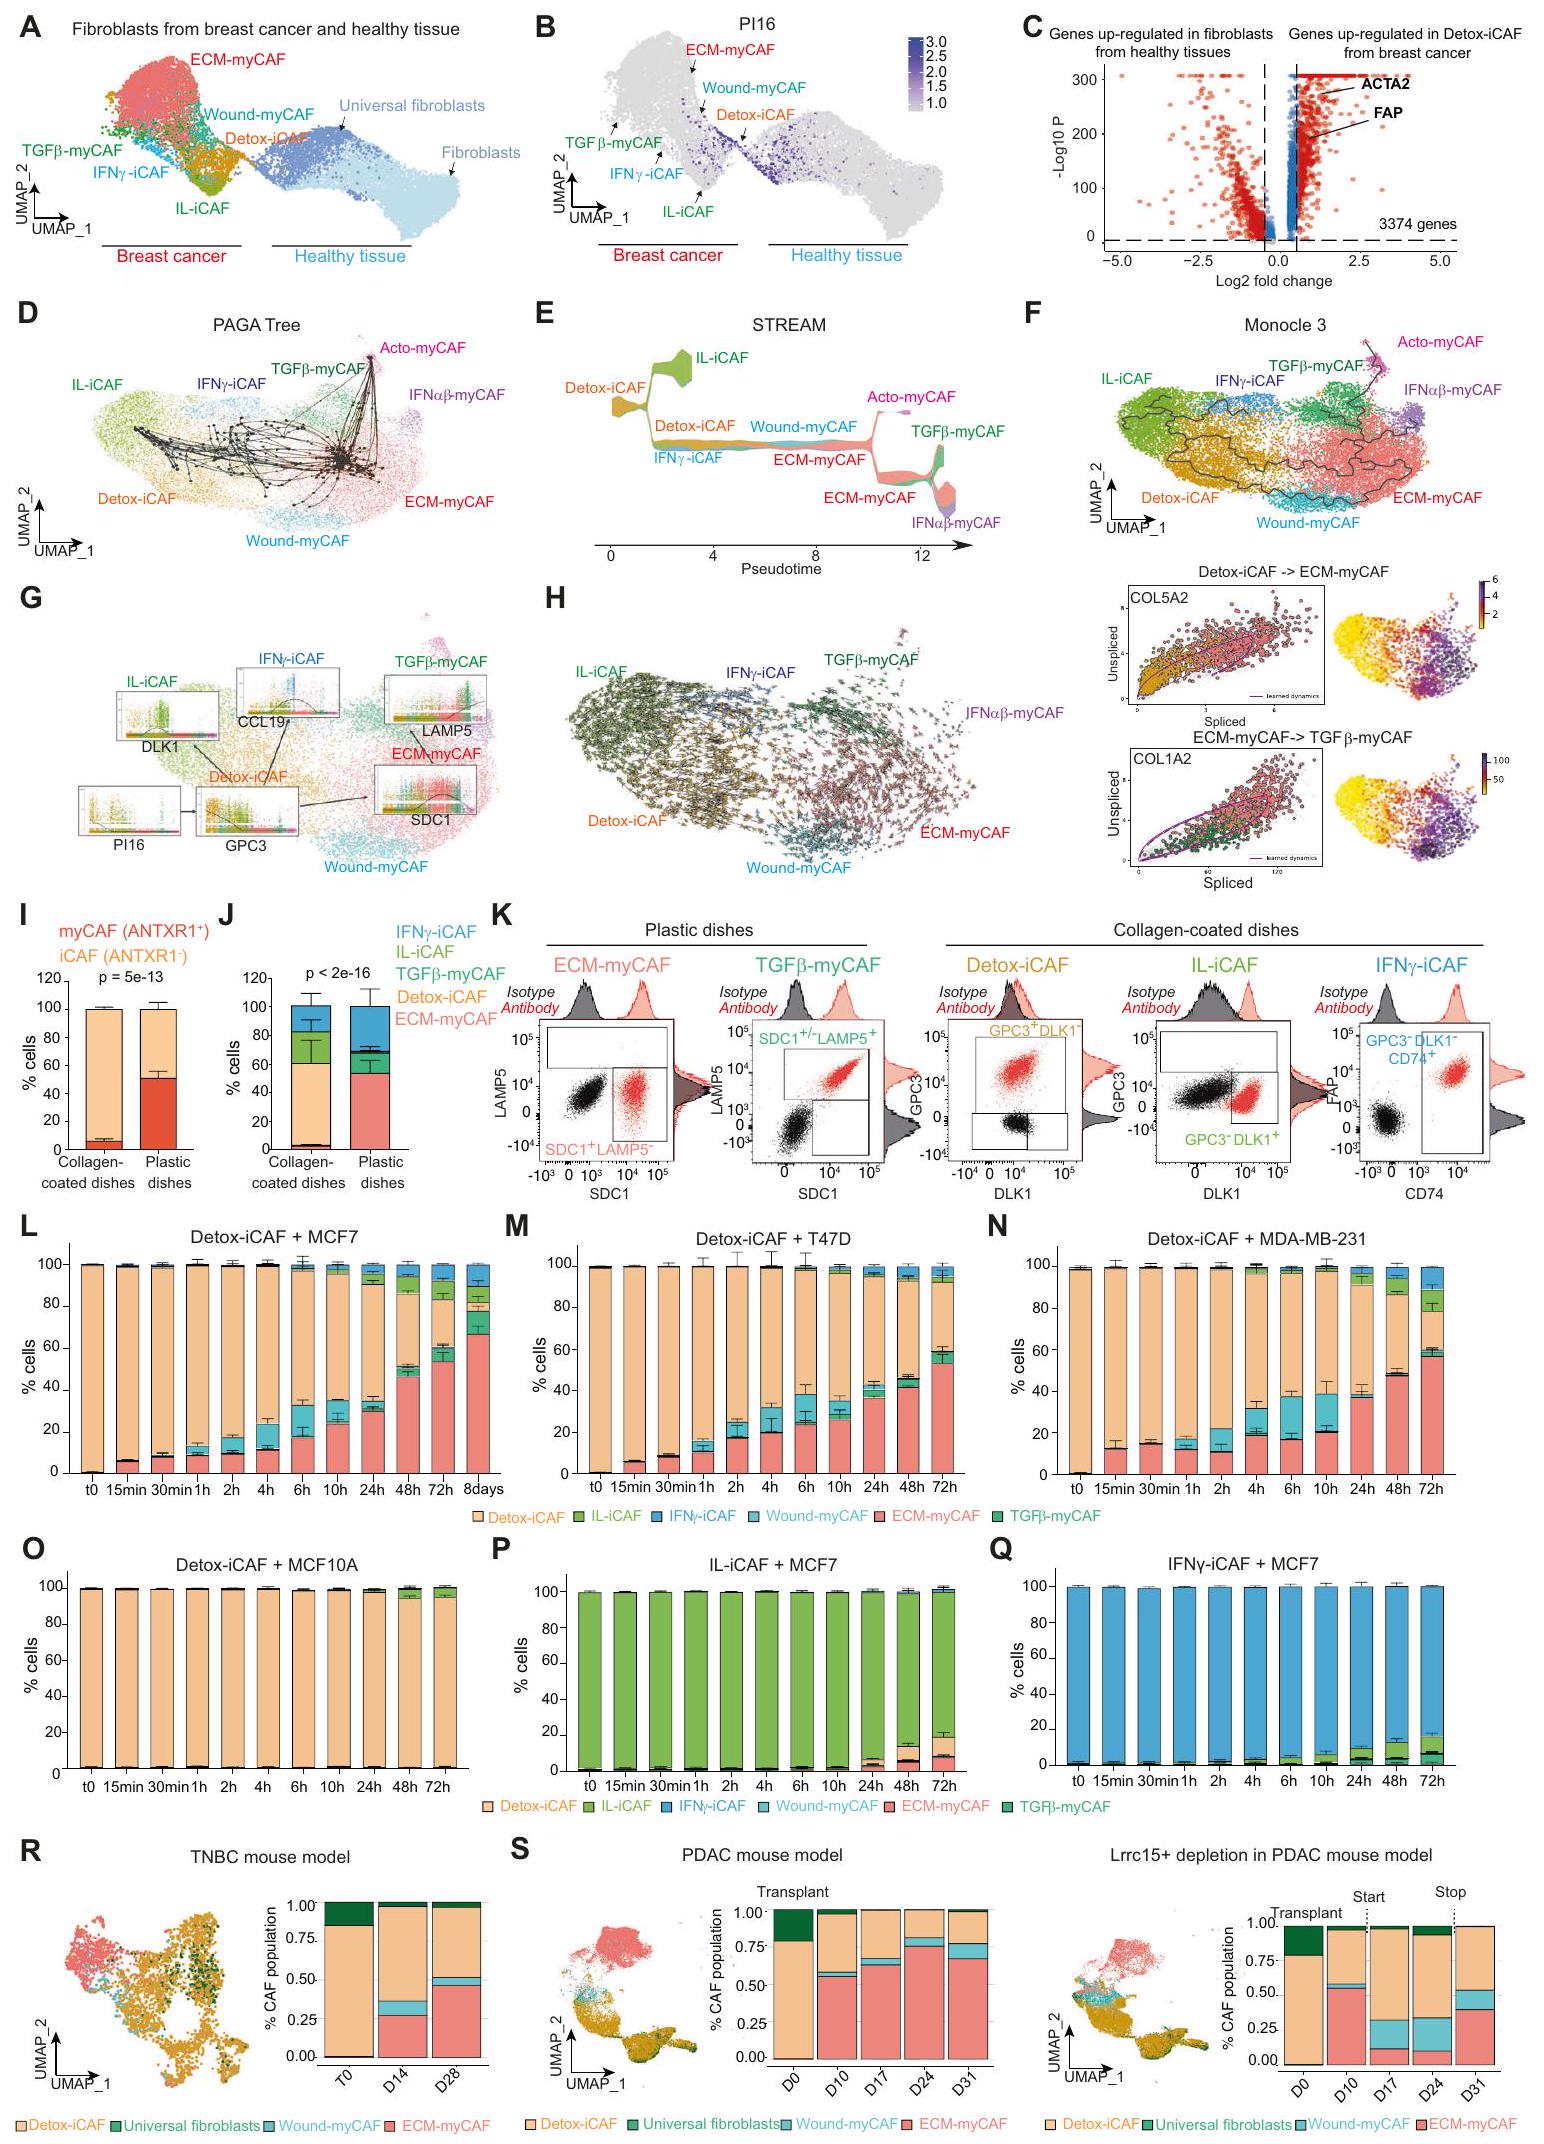
لقد حددنا سابقًا 8 مجموعات من خلايا CAF الإيجابية لـ FAP (CAF-S1) في سرطان الثدي (BC) بواسطة تسلسل RNA أحادي الخلية. (الشكل التوضيحي التكميلي 1A)، لكن أصل هذا التنوع في سرطان الثدي غير مفهوم بشكل جيد. افترضنا أن مجموعة معينة من خلايا الأنسجة الضامة المرتبطة بالسرطان FAP+CAF قد تكون خزانًا للمجموعات الأخرى. تماشيًا مع هذه الفرضية، وجدنا أن جزءًا من مجموعة DetoxiCAF احتفظ بتعبير PI16 (مثبط الببتيداز 16) الذي تم تحديده مؤخرًا كعلامة للأرومات الليفية العالمية.قمنا بالتحقق من هذه الملاحظات باستخدام مجموعات بيانات scRNA-seq العامة المستقلة من سرطان الثدي وعمليات تجميل الثدي الصحية.نقل العلامةمكننا من تأكيد وجود مجموعات FAP+ CAF المختلفة في BC، بالإضافة إلى مجموعتين من الخلايا الليفية من عمليات تجميل الثدي الصحية (الشكل 1A). ومن المثير للاهتمام أن مجموعة Detox-iCAF شكلت استمرارية نسخية مع الخلايا الليفية العالمية Pl16+ (الشكل 1B)، مما يشير إلى أن مجموعة FAP+ Detox-iCAF قد تكون خزانًا لمجموعات FAP+CAF الأخرى. نظرًا لأن Detox-iCAF أظهرت تشابهات نسخية مع الخلايا الليفية العالمية، سعينا لتأكيد أن مجموعة Detox-iCAF كانت مختلفة نسخيًا عن الخلايا الليفية الطبيعية. أكدت التحليلات التفاضلية بين الخلايا الليفية من الأنسجة الثديية الصحية وDetox-iCAF أن Detox-iCAF أظهرت عددًا كبيرًا من الجينات المرتفعة التعبير مقارنة بالخلايا الليفية الطبيعية، مثل FAP (الشكل 1C)، وهو ما يتماشى مع طريقة عزل CAF-S1 المعتمدة على علامة FAP.. لأخذ تضخم حجم العينة في بيانات scRNA-seq في الاعتبار، قمنا بتأكيد هذه النتيجة على مستوى العينة بعد إعادة بناء البسطة الزائفة (الشكل التوضيحي التكميلي 1C، انظر أيضًا “الطرق”، #”التحليل التفاضلي بين الخلايا الليفية من الأنسجة السليمة و Detox-iCAF”). للتحقيق في كيفية ظهور تنوع تجمعات FAP+ CAF، طبقنا عدة طرق لاستنتاج المسارات على مجموعة بيانات scRNA-seq الغنية بـ FAP+ CAF المعزولة من BC، مع تحديد تجمع Detox-iCAF كجذر للمسارات. شجرة PAGAكشفت التحولات من Detox-iCAF إلى IL-iCAF و IFN-عناقيد iCAF ومسار مباشر من Detox-iCAF إلى عناقيد ECMmyCAF، والتي بدورها أدت إلى TGF-مجموعة myCAF (الشكل 1D). طريقة استنتاج المسار STREAMكشف مشابه المسارات بين مجموعات FAP+ CAF المختلفة (الشكل 1E). بالإضافة إلى ذلك، اكتشف STREAM انتقالًا غير مباشر بين Detox-iCAF و ECM-myCAF من خلال مجموعة Wound-myCAF، فضلاً عن مسار من ECM-myCAF إلى IFN.-myCAF (الشكل 1E). Monocle3أعاد تلخيص شجرة PAGA وSTREAM من خلال اكتشاف كل من المسار المباشر بين مجموعات Detox-iCAF وECM-myCAF، و انتقال غير مباشر من خلال مجموعة Wound-myCAF (الشكل 1F). من مسارات Monocle3، قمنا بحساب الوقت الزائف عن طريق تثبيت المسار في Detox-iCAF (الشكل التكميلية 1D). وقد كشف ذلك عن فقدان مبكر للتعبير عن Pl16، تلاه بسرعة فقدان تدريجي للتعبير عن GPC3 في Detox-iCAF وزيادة تدريجية في التعبير عن DLK1 في IL-iCAF وCCL19 في IFNγ-iCAF (الشكل 1G)، GPC3 وDLK1 وCCL19.
الشكل 1 | تحليل الحوسبة لفينوم FAP+CAF في سرطان الثدي البشري. UMAP يجمع بين FAP+ CAF من سرطان الثدي (يسار) وخلايا الليف من أنسجة الثدي السليمة (صحيح، الخلايا)، ملونة حسب هوية الكتلة. ب تعبير جين Pl16. ج التعبير الجيني التفاضلي بين Detox-iCAF والليفوبلاستات الطبيعية.قيم من اختبار ويلكوكسون للرتب المزدوجة. باللون الأحمر، الجينات مع التعديلقيمةاستنتاجات المسار على مجموعة بيانات scRNA-seq الخاصة بـ BC FAP+ CAF من المرجع 10 تم استنتاجها بواسطة شجرة PAGA (10 عينة عشوائية) (D)، مسار STREAM يظهر نسبة التجمع على طول الزمن الزائف (E) وMonocleتعبير علامات مجموعة FAP+ CAF وفقًا لزمن مونوكلي 3 الزائف ومصنفة حسب هوية المجموعة.يسار، السرعات من scVelo على FAP+ CAF UMAP. يمين، صورة المرحلة المقطوعة/غير المقطوعة والتعبير على UMAP لجينات COL5A2 (أعلى) وCOL1A2 (أسفل). النسب المئوية لمجموعات iCAF (ANTXR1-) وmyCAF (ANTXR1+) بين FAP+ CAF المزروعة على أطباق مغطاة بالكولاجين أو أطباق بلاستيكية.تجارب مستقلة). القيمة من اختبار فيشر الدقيق ذو الجانبين. ج نفس الشيء كما في (I) لهوية مجموعة FAP+ CAF باستخدام علامات محددة بواسطة تحليل تدفق الخلايا ( ).
مخططات تدفق السيتومتر تظهر علامات السطح المحددة لمجموعة FAP+ CAF في FAP+CAF الأولية المفروزة. نسبة كل مجموعة FAP+CAF بين FAP+CAF (بيانات تدفق السيتومتر) بعد زراعة مشترك لـ Detox-iCAF مع MCF7. تشير نقاط الزمن إلى مدة الزراعة المشتركة.تجارب مستقلة). م-أ نفس الشيء كما ( ) لزراعة مشترك لـ Detox-iCAF مع T47D (M) و MDA-MB-231 (N) و MCF10A (O). نفس كما ( ) لزراعة IL-iCAF ( ) أو IFN -iCAF ( ) مع MCF7. جميع البيانات هي متوسطSEM.يسارًا، UMAP للخلايا الليفية من بيانات تسلسل RNA أحادي الخلية بعد حقن خلايا سرطان الثدي TN من المرجع 9 ملونة حسب هوية الخلية (الخلايا الليفية). صحيح، التقدير عند 0 و 14 و 28 يومًا بعد زراعة الورم. س نفس الشيء كما ( ) للخلايا الليفية من بيانات تسلسل RNA أحادي الخلية بعد الحقن تحت الجلد لسلالة خلايا سرطان البنكرياس في الفئران البرية ( الخلايا الليفية) (يسار) وفي فئران تم إدخال مستقبل سم الدفتيريا Lrrc15 (الخلايا) (يمين) من المرجع 42. التكميم بعد زراعة الورم فيو 31 يومًا. يتم توفير بيانات المصدر كملف بيانات المصدر. كونها علامات محددة لـ Detox-iCAF و IL-iCAF و IFN-عناقيد iCAF، على التوالي. بالإضافة إلى ذلك، يتم تعريف تعبير SDC1 و LAMP5 كعلامات محددة لـ ECM-myCAF و TGF-myCAF، على التوالي ) تم تنظيمها بشكل متسلسل في ECM-myCAF ثم في TGF عناقيد myCAF (الشكل 1G). للتحقق من اتجاه المسارات، استخدمنا معلومات التقطيع (الشكل 1H) من خلال استخدام طريقة سرعة RNA scVelo.أكدت تحليلات سرعة RNA اتجاهية الانتقالات، بما في ذلك Detox-iCAF إلى ECM-myCAF و ECM-myCAF إلى TGF.-myCAF (الشكل 1H، اليسار). علاوة على ذلك، كشفت سرعة RNA عن ديناميات أنماط التعبير الجيني، مثل تحفيز COL5A2 في Detox-iCAF للوصول إلى تعبير مستقر في ECM-myCAF وكبت COL1A2 في الانتقال من ECM-myCAF إلى TGF.-myCAF (الشكل 1 H، اليمين).
قمنا بعد ذلك بإجراء اختبارات وظيفية للتحقق من مسارات تجمعات FAP+CAF التي تم تحديدها في السليكو، وخاصة الانتقالات من DetoxiCAF إلى Wound-myCAF وECM-myCAF، حيث أن هذين التجمعين الأخيرين يشيران إلى مقاومة العلاج المناعي.للقيام بذلك، أنشأنا ثقافات أولية لمجموعات مختلفة من خلايا CAF الإيجابية لـ FAP (انظر “الطرق”، #”عزل وزراعة مجموعات FAP+ CAF الأولية”). أكدنا أن هذه الألياف كانت جميعها إيجابية لـ FAP، مع نسبة أعلى من مجموعات myCAF الإيجابية لـ ANTXR1+ FAP+ عند توسيعها على أطباق بلاستيكية ومن مجموعات iCAF الإيجابية لـ ANTXR1- FAP+ على أطباق مغطاة بالكولاجين (الشكل 1I والشكل التكميلية 1E، F)، كما لوحظ في PDAC.. باستخدام محددعلامات تجمع CAFوجدنا أن خلايا CAF الإيجابية لـ FAP الأولية التي تم توسيعها على الأطباق البلاستيكية كانت تتكون في المتوسط من 54% من ECMmyCAF (ANTXR1+ SDC1+ LAMP5-)،تي جي إف-myCAF (ANTXR1+ SDC1+/- LAMP5+) و 32% IFN-iCAF (ANTXR1- DLK1- GPC3- CD74+). في الوقت نفسه، تم زراعة FAP+ CAF على أطباق مغطاة بالكولاجين.ديتوكس-آي كاف (ANTXR1- DLK1+/- GPC3+)، 22% IL-آي كاف (ANTXR1- GPC3DLK1+) و 18% IFN-iCAF (ANTXR1-DLK1-GPC3-CD74+) (الشكل 1J والشكل التكميلي 1E، F). بعد ذلك، قمنا بعزل مجموعات FAP+ CAF النقية في المختبر. باستخدام العلامات المحددة المذكورة أعلاه، قمنا بفرز ECMmyCAF وTGF-قمنا بعزل مجموعات myCAF وزراعتها على أطباق بلاستيكية من جهة، وعزلنا Detox-iCAF وIL-iCAF وIFN.-تم تجميع مجموعات CAF واحتفظ بها على أطباق مغطاة بالكولاجين من ناحية أخرى (الشكل 1K). أكدنا بواسطة تحليل تدفق الخلايا (الشكل التوضيحي 1G) أن هذه المجموعات المختلفة من CAF+ FAP الأولية أظهرت نفس الملفات لكل علامة كما تم استخدامها لتوصيفها في عينات مرضى BC (الشكل التوضيحي 1H). كما قمنا بإجراء تسلسل RNA الكمي من كل مجموعة CAF وحققنا أن الملفات النسخية لمجموعات CAF-S1 المفروزة في المختبر مشابهة لتلك التي تم تحديدها في الأصل في المرضى. (الشكل التوضيحي التكميلي 1I).
استفدنا من هذه المجموعات المختلفة من FAP+ CAF في الثقافة لتحليل الآليات التي تحرك مرونتها وتوجه هويتها. بالنظر إلى أن مجموعة Detox-iCAF كانت جذر مسارات مجموعات FAP+CAF، افترضنا أن مجموعة Detox-iCAF يمكن أن تعطي انطلاقة لمجموعات أخرى من FAP+ CAF في وجود خلايا السرطان. لذلك قمنا بزراعة Detox-iCAF مع سلالة خلايا BC اللمعية MCF7 واختبرنا تأثير هذه الثقافة المشتركة على نمط Detox-iCAF في نقاط زمنية مختلفة (الشكل 1L والشكل التوضيحي 2A). لاحظنا زيادة فورية في نسبة ECM-myCAF في النقاط الزمنية المبكرة من الثقافة المشتركة ( )، تليها زيادة في محتوى Wound-myCAF (تبدأ عند . استمرت تجمعات ECM-myCAF و Wound-myCAF في الزيادة تدريجياً في النقاط الزمنية اللاحقة. هذه الاختبارات الوظيفية تتماشى مع المسارين اللذين تم تحديدهما في التحليل الحاسوبي، أي المسار المباشر من DetoxiCAF إلى ECM-myCAF والمسار غير المباشر الذي يمر عبر Wound-myCAF. في المراحل اللاحقة من الديناميكية (من 10 إلى 72 ساعة)، كان مستوى IFN-iCAF، IL-iCAF و TGF-myCAF زادت أيضًا، مما يؤكد مرة أخرى المسارات التي حددتها الأساليب الحاسوبية (الشكل 1L والشكل التوضيحي 2A). أخيرًا، في أحدث نقاط زمنية حركية (48 ساعة، 72 ساعة و8 أيام)، تراكمت مجموعة ECM-myCAF أكثر من مجموعة Wound-myCAF ومجموعة Detox-iCAF (الشكل 1L والشكل التوضيحي 2A). علاوة على ذلك، أكدت زراعة Detox-iCAF مع خطي خلايا سرطان الثدي البديلين (T47D وMDA-MB-231) الانتقالات من Detox-iCAF نحو ECM-myCAF في وجود خلايا السرطان (الشكل 1M، N والشكل التوضيحي 2B، C). من المهم أن الحفاظ على Detox-iCAF بمفردها (الشكل التوضيحي 2D) أو زراعتها مع خلايا الثدي الظهارية غير الورمية (MCF10A) (الشكل 10 والشكل التوضيحي 2E) لم يحفز Wound-myCAF أو ECM-myCAF، مما يظهر أن وجود خلايا السرطان مطلوب لتحفيز هذه المجموعات. علاوة على ذلك، وبما يتماشى مع المسارات، لم يكن IL-iCAF ولا IFN-iCAF التي تم زراعتها مع MCF7 تم تحويلها بكفاءة إلى تجمعات Wound-myCAF أو ECM-myCAF (الشكل 1P، Q والشكل التوضيحي 2F، G). لتأكيد هذه الملاحظات في الجسم الحي، استخدمنا مجموعات بيانات scRNA-seq المنشورة سابقًا، التي درست التغيرات في تركيبة TME بعد زراعة الورم في الفئران. (الشكل 1R، S). في هذه النماذج من الفئران، و تم زرع خلايا السرطان، تلاها أخذ عينات وتحليل تسلسل RNA الخلوي المفرد في نقاط زمنية مختلفة بعد الزرع. قمنا بعزل الخلايا الليفية من مجموعتي البيانات وسمينا المجموعات المختلفة باستخدام نقل العلامات، مما أدى إلى تحديد Detox-iCAF وWound-myCAF وECM-myCAF كمجموعات FAP+CAF الرئيسية في نماذج الفئران لسرطان الثدي وسرطان البنكرياس (الشكل التوضيحي 2H). في وقت زراعة خلايا السرطان، اكتشفنا محتوى عالٍ من مجموعة Detox-iCAF في مجموعتي البيانات (الشكل 1R، S). ومن المثير للاهتمام، أنه في النقاط الزمنية اللاحقة، لاحظنا فقدانًا تدريجيًا لمجموعة Detox-iCAF لصالح ECM-myCAF، وإلى حد أقل، Wound-myCAF في كل من الفئران المصابة بسرطان الثدي وسرطان البنكرياس (الشكل 1R، S، اليسار). كما تم تحديد LRRC15 كعلامة محددة لـ ECM-myCAF في سرطان الثدي البشري. (الشكل التوضيحي الإضافي 2I)، استفدنا من المنشور حديثًا نموذج الفأر لسرطان البنكرياس المعتمد على إدخال مستقبلات سم الدفتيرياللتحقيق في كيفية تطور تركيبة تجمعات FAP+ CAF بعد استنفاد ECM-myCAF في الجسم الحي. بما يتماشى مع المسارات، أدى الاستئصال الانتقائي لـ ECM-myCAF إلى تغيير في نسب تجمعات CAF-S1 لصالح تجمعات DetoxiCAF و Wound-myCAF (الشكل 1S، اليمين). علاوة على ذلك، عندما تم إيقاف الاستنفاد، لاحظنا عودة سريعة لـ ECM-myCAF مع انخفاض في كل من Detox-iCAF و Wound-myCAF (الشكل 1S،
وبالتالي، تتماشى هذه النتائج مع المسارات الحاسوبية بين مجموعات FAP+ CAF، حيث تُظهر أن خلايا السرطان تعزز التحول من مسار التهابية مرتبط بإزالة السموم (Detox-iCAF) إلى توقيع ليفي عضلي (ECM-myCAF) في FAP+ CAF سواء في المختبر أو في الجسم الحي.
تقوم خلايا السرطان بتحويل Detox-iCAF إلى ECM-myCAF من خلال آلية تعتمد على DPP4 و YAP1
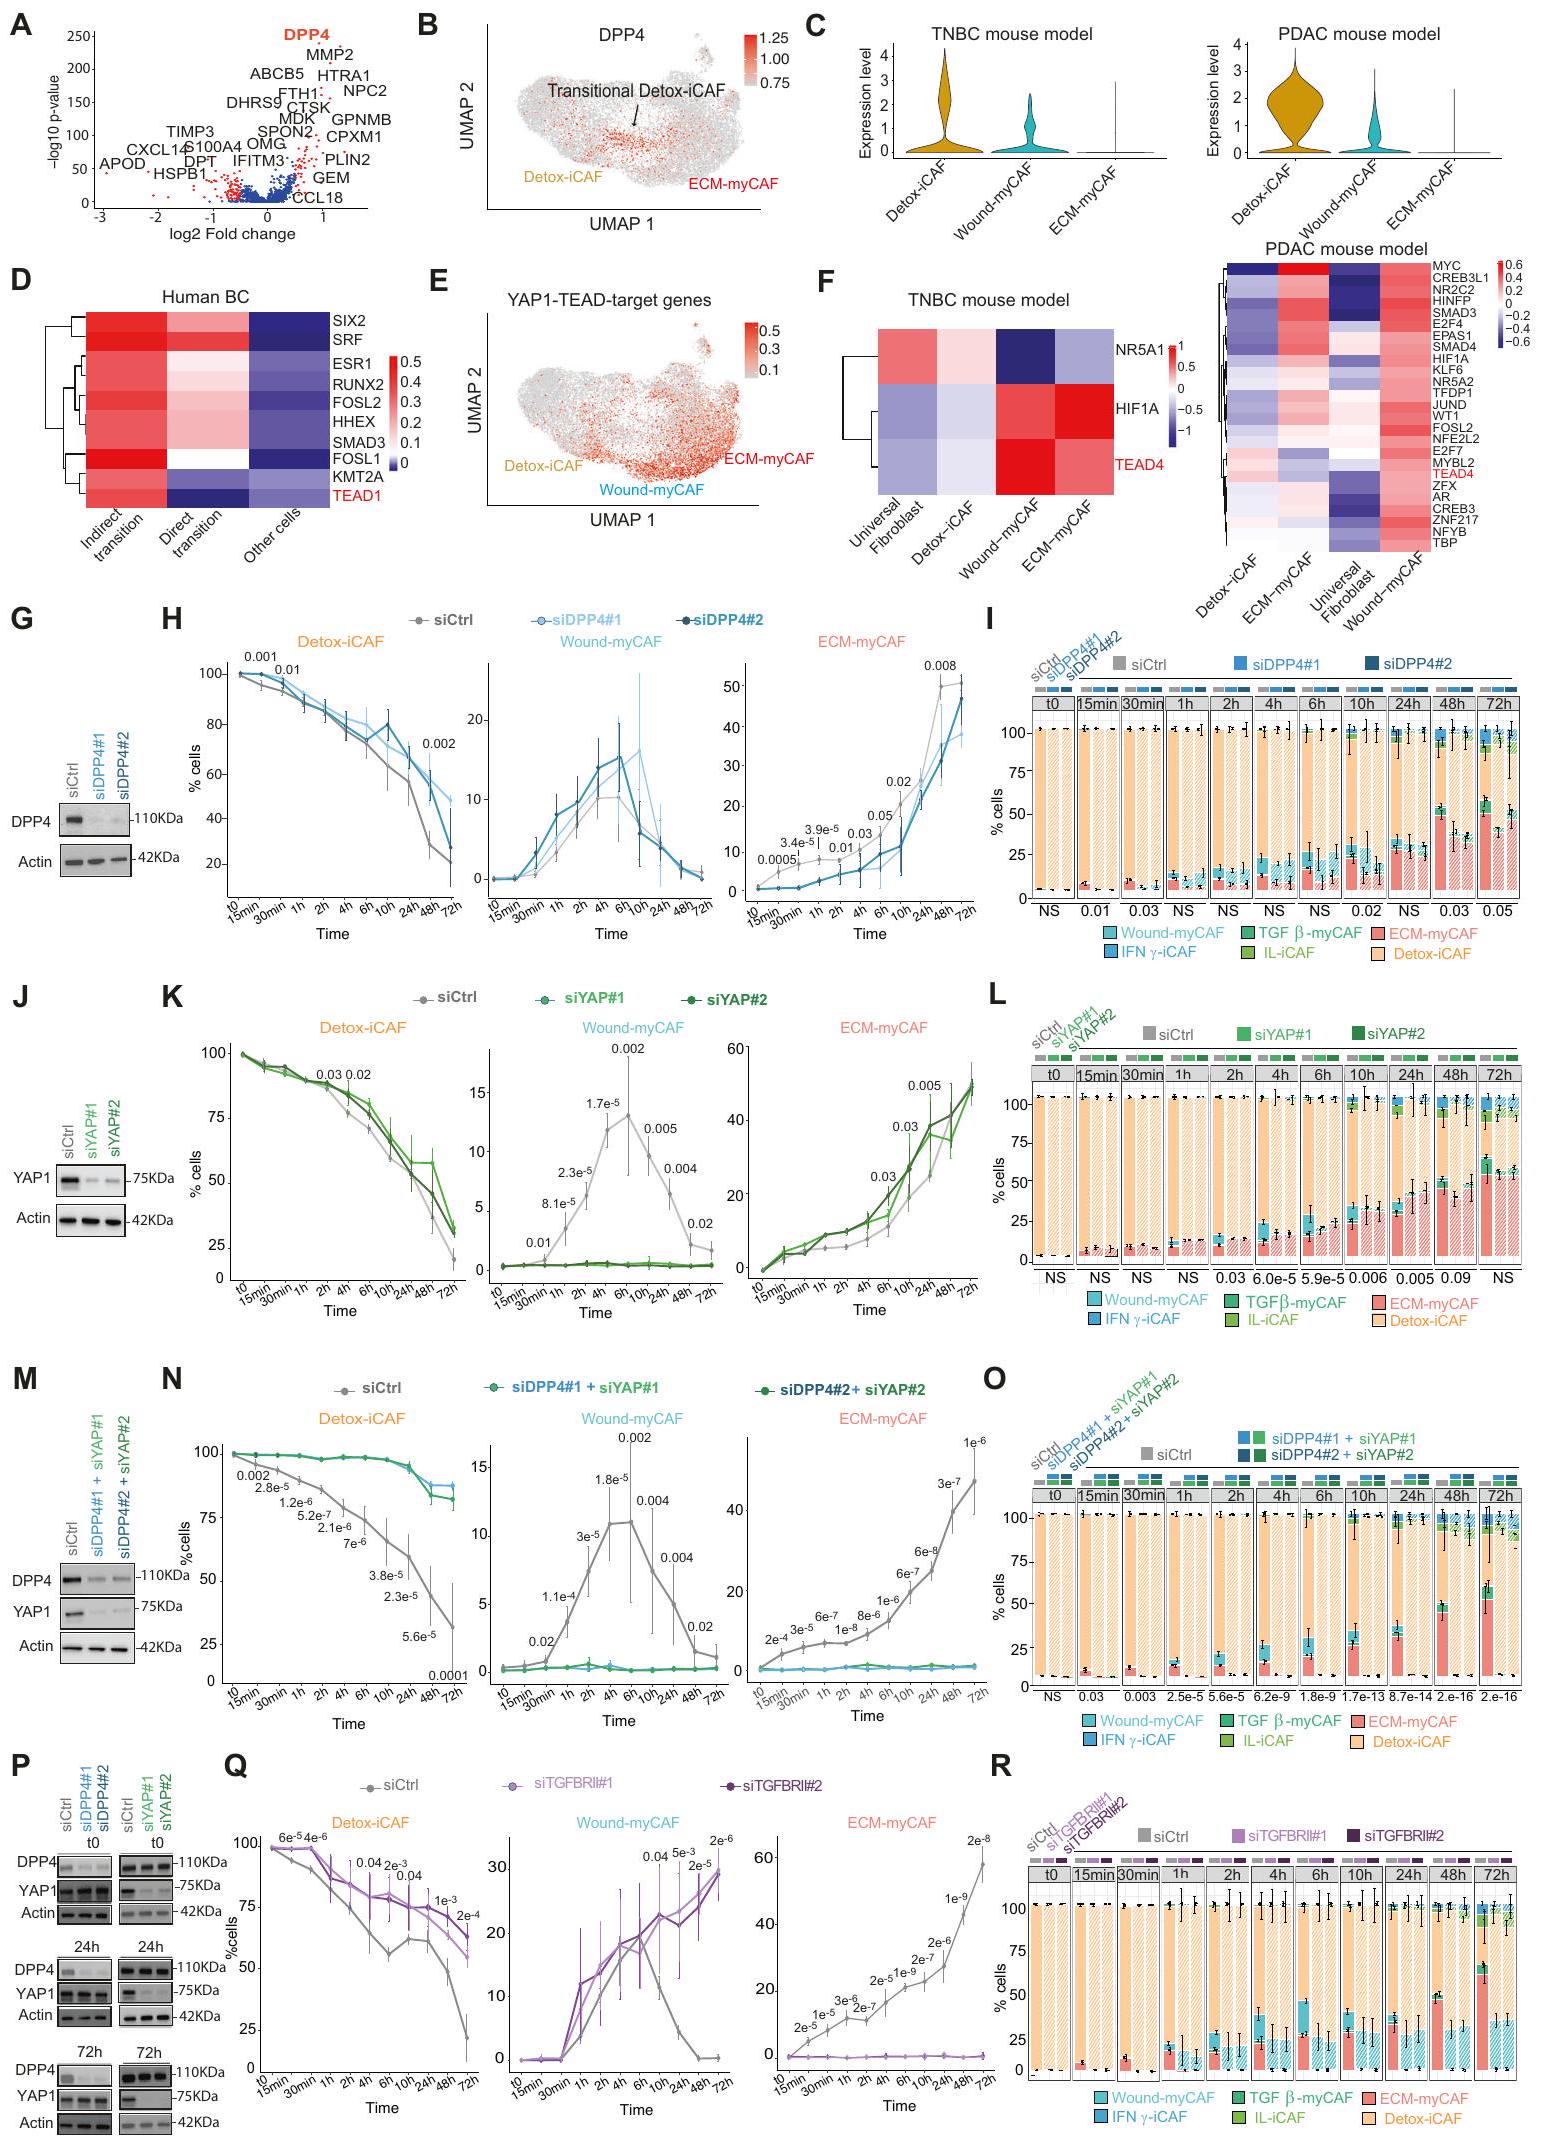
سعينا بعد ذلك لتوضيح الآليات الجزيئية المعنية في مرونة تجمعات CAF+ FAP، مع التركيز على الانتقال المباشر من Detox-iCAF إلى ECM-myCAF، والمسار غير المباشر عبر Wound-myCAF. قمنا أولاً بإجراء تحليل تفاضلي للجينات المعبر عنها بواسطة CAF+ FAP المعزولة من الانتقال المباشر مقابل جميع CAF+ FAP الأخرى من بيانات تسلسل RNA أحادي الخلية من سرطان الثدي البشري (الشكل التكميلية 2J). باستخدام هذا النهج، حددنا DPP4 (ديبيبتيديل ببتيداز 4) كأهم جين مرتفع التعبير في CAF+ FAP في الانتقال المباشر بين Detox-iCAF و ECM-myCAF (الشكل 2A، B). في مجموعتي بيانات scRNA-seq من نماذج الفئران TNBC و PDAC، كان تعبير DPP4 مرتفعًا أيضًا بشكل خاص في Detox-iCAF ولكنه انخفض تدريجيًا في تجمعات Wound-myCAF و ECM-myCAF (الشكل 2C). أظهرت الدراسات السابقة في أمراض أخرى أن تثبيط DPP4 يمكن أن يؤدي إلى تقليل التليف المرضي، مما يشير إلى أن DPP4 قد يلعب دورًا حاسمًا في تكوين الألياف العضلية.“، وتسليط الضوء على أهمية DPP4 في الانتقال المباشر من Detox-iCAF إلى ECM-myCAF. فيما يتعلق بالانتقال غير المباشر، حددنا 7 جينات مستهدفة لـ YAP1-TEAD (بروتين مرتبط بـ Yes – مجال تعزيز النسخ المرتبط) من بين أعلى 50 جينًا تم تنظيمها بشكل إيجابي في المسار غير المباشر عبر Wound-myCAF (الشكل التوضيحي التكميلي 2J). علاوة على ذلك، من خلال حساب درجات نشاط عوامل النسخ باستخدام دوروثياأكدنا أن نشاط TEAD قد زاد بشكل خاص في FAP+ CAF التي تمر بالانتقال غير المباشر في سرطان الثدي البشري (الشكل 2D، E)، وكذلك في WoundmyCAF في نماذج الفئران TNBC و PDAC (الشكل 2F).
اختبرنا بعد ذلك ما إذا كانت المسارات الجزيئية المعتمدة على DPP4 و TEAD متورطة في توليد ECM-myCAF من Detox-iCAF من خلال إجراء اختبارات وظيفية في المختبر. قمنا أولاً بتحليل تأثير كتم DPP4 (الشكل 2G) على مرونة تجمعات CAF+ FAP (الشكل 2H، I). منع كتم DPP4 زيادة محتوى ECM-myCAF في النقاط الزمنية المبكرة (15 و 30 دقيقة) وأخر الانتقال من Detox-iCAF إلى ECM-myCAF بعد 1 ساعة إلى 2 ساعة من الزراعة المشتركة (الشكل 2H، I). على النقيض من ذلك، لم يكن لتفعيل DPP4 أي تأثير على الانتقال نحو Wound-myCAF (الشكل 2H، I)، مما يؤكد أن DPP4 قد يكون متورطًا في الانتقال المباشر بين Detox-iCAF و ECM-myCAF ولكن ليس في المسار غير المباشر عبر Wound-myCAF. اختبرنا بعد ذلك تأثير عوامل النسخ TEAD على الانتقال غير المباشر. نظرًا لوجود أعضاء مختلفين من عائلة TEAD، قمنا بتعطيل المنشط المساعد TEAD YAP1. بينما لم يكن لكتم YAP1 (الشكل 2J) أي تأثير على زيادة ECM-myCAF في النقاط الزمنية المبكرة من الزراعة المشتركة (15 و 30 دقيقة)، فقد ألغى تقريبًا الانتقال من Detox-iCAF إلى Wound-myCAF الذي تم اكتشافه بعد 1 ساعة من الزراعة المشتركة تحت ظروف التحكم (الشكل 2K، L). علاوة على ذلك، في النقاط الزمنية 10 ساعات و 24 ساعة، كانت نسب خلايا ECM-myCAF أعلى عند كتم YAP1 مقارنة بالتحكم (الشكل 2K، L)، مما يشير إلى أن الانتقال المباشر من تجمعات Detox-iCAF إلى ECM-myCAF قد يعوض كتم YAP1. لذلك، اختبرنا فرضية وجود آلية تعويضية بين المسارين. على وجه التحديد، بحثنا فيما إذا كان كتم DPP4 قد تسبب في زيادة الانتقال غير المباشر المعتمد على YAP1، وعلى العكس، فيما إذا كان كتم YAP1 يؤدي إلى زيادة الانتقال المباشر المعتمد على DPP4. من المثير للاهتمام، أن تعطيل كل من DPP4 و YAP1 منع كلا من الانتقال المباشر من Detox-iCAF إلى ECM-myCAF والمسار غير المباشر عبر تجمع Wound-myCAF (الشكل 2M-O). علاوة على ذلك، يتماشى مع هذه الآلية التعويضية، ظل مستوى بروتين YAP1 دون تغيير عند تعطيل DPP4 ولم يتأثر مستوى بروتين DPP4 بتعطيل YAP1 طوال ديناميات الزراعة المشتركة مع خلايا السرطان (الشكل 2P)، مما يشير إلى أن ECM-myCAF يمكن أن يتم توليده من مسارين مختلفين وأن أحدهما يمكن أن يحل محل الآخر عندما يتم تعطيله. مجتمعة، تسلط هذه النتائج الضوء على الدور الحاسم لـ DPP4 و YAP1/TEAD في دفع ظهور ECM-myCAF من Detox-iCAF من خلال آليتين مستقلتين، مما يسلط الضوء على التفاعلات الجزيئية التي تكمن وراء هروب السرطان من المناعة.
استنادًا إلى بيانات حديثة تظهر أن محور TGF/TGFBR 2 يدفع تمايز LRRC15+ ECM-myCAF في نماذج الفئران PDACتساءلنا عما إذا كان يمكن أن يكون هذا المسار متورطًا في مرونة تجمعات CAF-S1. لاحظنا أولاً أن تحفيز TGF، الذي تم التحقق منه من خلال فسفرة عضو عائلة SMAD 2 (SMAD2)، زاد تدريجيًا من محتوى ECM-myCAF (الشكل التكميلي)، مما يشير إلى أنكافٍ لتعزيز الانتقال من Detox-iCAF إلى ECM-myCAF. بالمقابل، منع كتم TGFBRII في Detox-iCAF الانتقال من Detox-iCAF إلى ECM-myCAF في وجود خلايا السرطان (الشكل 2Q، R)، مما يؤكد أن TGFBR2 ضروري لهذا الانتقال. بشكل جماعي، تسلط هذه البيانات الضوء على دور مسار TGFالمعتمد على TGFBR2 في ظهور ECM-myCAF من Detox-iCAF. أخيرًا، قمنا بتقييم تأثير الوسط المشروط (CM) المشتق من خلايا سرطان MCF7 على Detox-iCAF ولاحظنا أن CM عزز الانتقال من Detox-iCAF إلى Wound-myCAF (الشكل التكميلي 2N، O). اختلف نمط التجمعات المستحثة بين تحفيز TGFو CM، مما يشير إلى أن CM يحتوي على جزيئات إشارة سرطانية أخرى بالإضافة إلىالتي تعزز هذا الانتقال المحدد وأن التأثير المعتمد علىيتطلب اتصالًا مباشرًا بين خلايا السرطان و Detox-iCAF.
التنظيم المكاني لتجمعاتفي سرطان الثدي
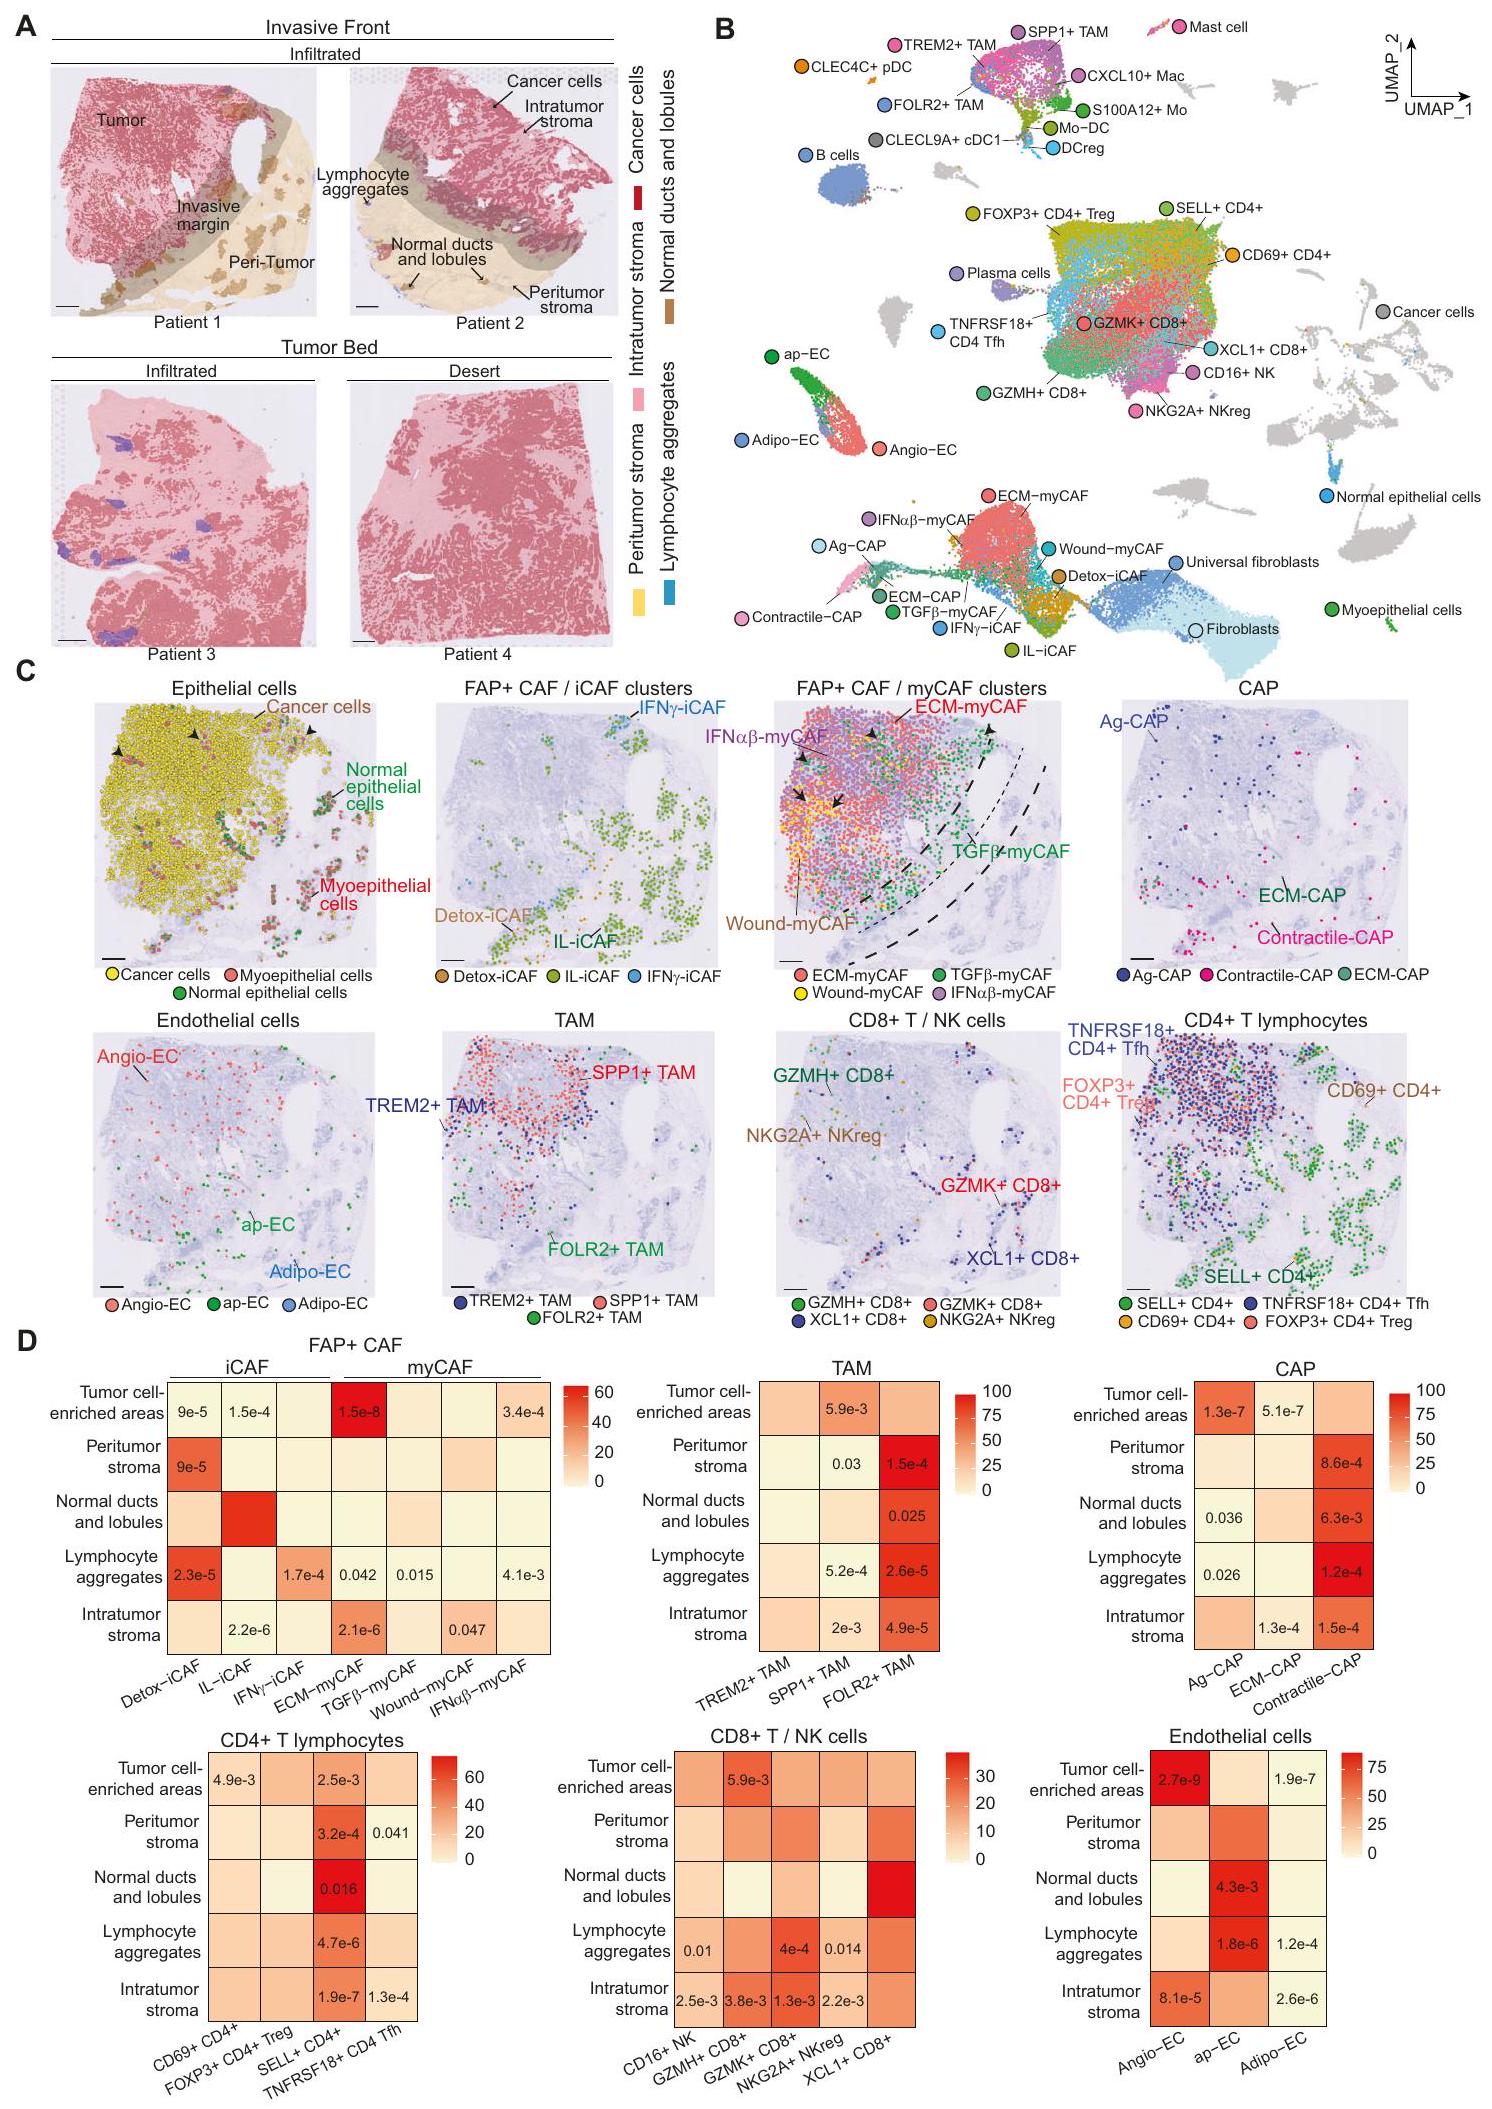
كان هدفنا التالي هو الحصول على رؤى حول مرونة تجمعات CAF+ FAP بناءً على تنظيمها المكاني في BC وتفاعلاتها مع الخلايا المحيطة. لذلك، قمنا بإجراء ترانسكريبتوميات مكانية على 4 نماذج لمعية (Lum) و 3 نماذج ثلاثية سالبة (TN) BC (الشكل التكميلي 3A). تم عزل ثلاثة مقاطع من سرير الورم و 4 عند الحافة الغازية، بناءً على التوصيفات المرضية (الشكل 3A). في المتوسط، قمنا بتسلسل 2391 نقطة لكل مقطع والتقاط 3896 جينًا لكل نقطة (الشكل التكميلي 3B). قمنا بتعزيز مجموعة البيانات هذه من خلال تحليل 10 مقاطع BC إضافية متاحة للجمهورتغطي 47,830 منطقة مكانية. مكنت التوصيفات الشكلية من تمييز الأورام، والحواف الغازية والأنسجة المحيطة (الشكل 3A). في حجرة الورم، ميز أطباء الأمراض الخلايا السرطانية، والستروما داخل الورم، وكذلك الفصوص والقنوات الطبيعية. في الأنسجة المحيطة، حدد أطباء الأمراض الفصوص والقنوات الطبيعية التي تحتوي على خلايا طلائية وميوبلاستية طبيعية محاطة بغشاء قاعدي وستروما شاحبة، بالإضافة إلى نسيج ضام بين الفصوص وتجمعات اللمفاويات (الشكل 3A). من أجل مزيد من التحليل، قمنا بنقل التوصيفات المرضية الرقمية إلى البيانات المكانية من خلال حساب مساحة كل توصيف مرضي تغطيه كل نقطة (الشكل التكميلي 3C-E). ثم قمنا برسم وتقدير وفرة أنواع الخلايا المختلفة في كلنقطة من خلال تطبيق طريقة التفكيك cell2location. كمدخل إلى cell2location، قمنا بحساب مصفوفة من أنواع الخلايا المرجعية من خلال إنشاء وتوصيف أطلس خلوي عالي الدقة لسرطان الثدي الذي بنيناه من بيانات scRNA-seq الجديدة المتولدة ومجموعات البيانات المتاحة للجمهور(الشكل التكميلي 4A، B). شمل هذا الأطلس 73,426 خلية عالية الجودة واحتوى على 39 نوعًا وحالة مختلفة من الخلايا، مما يمثل مشهدًا خلويًا شاملاً لسرطان الثدي (الشكل 3B والشكل التكميلي 4C). قمنا بتعريف هوية كل نوع خلية من خلال نقل العلامات (لتجمعات FAP+ CAFو CAP، الشكل التكميلي 4D) وتوصيفات قائمة على العلامات (الشكل التكميلي 4E). استخدمنا أيضًا ملفات تعريف تغير عدد النسخ (CNV) لتأكيد هوية الخلايا السرطانية (الشكل التكميلي 4F). لضمان أن أطلس سرطان الثدي لدينا كان مكتملًا، قمنا بنقل توصيفاتنا عالية الدقة إلى مجموعات بيانات scRNA-seq المستقلة الأخرى المنشورةوأكدنا أن جميع أنواع وحالات خلايا سرطان الثدي كانت مغطاة (الشكل التكميلي 4G).
بعد ذلك، قمنا بتفكيك بيانات الترانسكريبتوميات المكانية من 17 مقطع BC بدقة تشبه الخلية الواحدة من خلال تطبيق cell2locationباستخدام أطلس scRNA-seq BC لدينا كمرجع (الشكل 3C والشكل التكميلي 5A، B لمقاطع تم تفكيكها تمثيليًا). تم تأكيد العديد من أنواع الخلايا التي تم تحديدها من خلال التفكيك أولاً من قبل أطباء الأمراض من خلال الشكل (الشكل التكميلي 6A-C). كما اختبرنا RCTD و
SpatialDWLS، طريقتين أخريين من طرق التفكيك ذات الأداء العالي، وكلاهما أنتج نتائج متسقة تمامًا مع cell2location (الشكل التكميلي 6D، E). من المثير للاهتمام، أن التفكيك لمجموعات البيانات المكانية لسرطان الثدي كشف عن المواقع المحددة لأنواع الخلايا المختلفة وحالاتها، بما في ذلك تجمعات FAP+ CAF (الشكل 3D والشكل التكميلي 7). قمنا بتحليل إثراء كل حالة خلوية ضمن
الشكل 2 | تحديد انتقالات تعتمد على DPP4 و YAP-1 من Detox-iCAF إلى ECM-myCAF. رسم بياني بركاني يظهر التعبير الجيني التفاضلي في FAP+ CAF من الانتقال المباشر (الخلايا الحمراء في الشكل التكميلي 2J) مقارنةً بأخرى CAF من مجموعة بيانات scRNA-seq لسرطان الثديقيم من اختبار ويلكوكسون ذو الجانبين. باللون الأحمر، الجينات ذات القيمة المعدلةقيمة. B تعبير DPP4 في مجموعة فرعية من Detox-iCAF (Detox-iCAF الانتقالية). C تعبير DDP4 في تجمعات FAP+ CAF من بيانات scRNA-seq لسرطان الثدي (يسار) ونماذج الفئران PDAC (يمين). D عوامل النسخ الأكثر تغيرًا في CAF في الانتقال المباشر/غير المباشر وفي CAF الأخرى. E تعبير الجينات المستهدفة TEAD/YAP1 في تجمعات FAP+ CAF. F نفس الشيء كما في (D) لبيانات scRNA-seq من المرجع 9 (يسار) والمرجع 42 (يمين). G رسم بياني تمثيلي يظهر كتم DPP4 في Detox-iCAF في بداية الزراعة المشتركة ( ) من ثلاثة تجارب مستقلة. الأكتين هو التحكم الداخلي لتحميل البروتين. النسب المئوية لمجموعات Detox-iCAF و Wound-myCAF و ECM-myCAF بين FAP+CAF بعد زراعة MCF7 مع Detox-iCAF المثبط (siDPP4) أو بدون تثبيط (siCtrl) لـ DPP4 (تجارب مستقلة).قيم من توزيع ستودنت ذو الجانبيناختبار. نفس الشيء كما في (H) يظهر نسبة كل مجموعة FAP+ CAF مع/بدون كتم DPP4. قيم من اختبار فيشر الدقيق ذو الجانبين. ج نفس الشيء كما ( ) لتخفيض YAP1. ك نفس الشيء كما في (H) بعد زراعة MCF7 مع Detox-iCAF المخفف (siYAP1) أو بدون (siCtrl) لـ YAP1 ( ). L نفس الشيء كما في (I) مع/بدون كتم YAP1 . م نفس الشيء كما في (G) يظهر كتم DPP4 و YAP1. ن نفس الشيء كما في (H) بعد زراعة MCF7 مع Detox-iCAF المكمم (siDPP4/siYAP1) أو غير المكمم (siCtrl) لكلا من DPP4 و YAP1.. نفس كما ( ) مع/بدون تثبيط DPP4 و YAP1 ( ). التحليلات الغربية تظهر مستويات بروتين DPP4 و YAP1 في خلايا Detox-iCAF المثبطة إما لـ DPP4 أو YAP1 في ثلاث نقاط زمنية من التعايش مع MCF7. Q نفس ما هو موضح في (H) مع خلايا Detox-iCAF المثبطة (siTGFBRII) أو غير المثبطة (siCtrl) لـ TGFBRII. ). R نفس الشيء كما في (I) مع/بدون كتم TGFBRII ( ). جميع البيانات هي متوسط SEM. بيانات المصدر والدقةتُقدم القيم كملف بيانات المصدر. تم العثور على حُجرات مرضية مختلفة ووجد أن تجمعات Detox-iCAF وIL-iCAF تم اكتشافها بشكل رئيسي في الأنسجة الضامة المحيطة بالورم، مع زيادة تركيز Detox-iCAF في المناطق المحيطة بالأورام وIL-iCAF بالقرب من القنوات الطبيعية والفصوص (الشكل 3D). وُجد أن تجمعات اللمفاويات كانت غنية بشكل خاص في Detox-iCAF وIFN.-iCAF (الشكل 3D). بالمقابل، كانت مجموعة ECM-myCAF هي الأكثر وفرة من بين الفئات الداعمة التي تم اكتشافها في سرير الورم (الشكل 3D والشكل التوضيحي 7). TGFتم اكتشاف myCAF داخل حجرة الورم ولكن تم العثور عليها أيضًا بشكل متكرر بجوار الفصوص الطبيعية (الشكل 3C والشكل التكميلي 5B، الأسهم السوداء) وعند الهامش الغازي (الشكل 3C). من المثير للاهتمام أن WoundmyCAF لوحظت بشكل أساسي في أعشاش كبيرة من السدى داخل الورم (الشكل 3C والشكل التكميلي 5A، الأسهم السوداء)، بينما كانت المناطق المحتوية على خلايا الورم غنية بشكل خاص في ECM-myCAF وIFN.-myCAF (الشكل 3C، D). داخل سرير الورم، تمكنا من تمييز تجمعات FAP+ CAF عن خلايا السرطان من خلال الكشف عن التغيرات الجينومية. قمنا بتصوير تغيرات عدد النسخ على نطاق واسع (CNV) في الموقع من خلال تطبيق خوارزمية InferCNV على مقاطع الأنسجة ثم أكدنا أن CNV تم الكشف عنها في الخلايا التي تم التعرف عليها كخلايا سرطانية بواسطة طريقة التفكيك (الشكل التكميلية 8A). وهذا سمح لنا بالتحقق من أن الخلايا التي تم الكشف عنها في السدى داخل الورم لم تظهر أي إعادة ترتيب جينومي وكانت بالفعل CAF وليست خلايا ورمية ظهارية خضعت لانتقال ظهاري-ميزانشيمي.
أظهر تحليل تفكيك أقسام BC أيضًا أن تجمعات FAP + CAF كانت تقع بالقرب من أنواع خلايا أخرى. وبالمثل لـ ECM-myCAF، IFN-myCAF و TGF-تم الكشف عن تجمعات myCAF، وخلايا TAM الموجبة لـ TREM2 وخلايا TAM الموجبة لـ SPP1 داخل سرير الورم (الشكل 3C، D والشكل التوضيحي 7). تم الكشف عن خلايا TAM الموجبة لـ FOLR2 إما في السدى داخل الورم الغني بـ myCAF أو احتفظت عند الهامش الغازي (الشكل 3C، D). كانت خلايا CAP القابضة تهيمن في المناطق المحيطة بالأورام، بينما كانت خلايا AgCAP سائدة داخل الأورام (الشكل 3C، D والشكل التوضيحي 7). كما تم توزيع الخلايا البطانية بشكل مختلف: كانت خلايا Angio-EC غنية بشكل ملحوظ في أعشاش الأورام والسدى داخل الورم، بينما كانت خلايا ap-EC نادرة بشكل ملحوظ في الأورام ولكنها كانت غنية بشكل خاص في تجمعات اللمفاويات (الشكل 3D). من المثير للاهتمام، وجدنا أن المناطق الغنية بخلايا الورم والسدى داخل الورم كانت غنية بخلايا T الموجبة لـ GZMH+ CD8+، بينما أظهرت تجمعات اللمفاويات غنى في خلايا T اللمفاوية السابقة الموجبة لـ GZMK+ CD8+ (الشكل 3D). في الختام، كشفت عملية فك التشفير المكاني لشرائح BC عن أنماط محددة في التوزيع والتنظيم للخلايا السدوية والمناعية، مما يبرز التنظيم الهيكلي لمكونات TME التي تحدد المناطق النسيجية داخل شرائح BC.
تحليل غير خاضع للإشراف يكشف عن تركيبات خلوية مكانية مشتركة بين المرضى
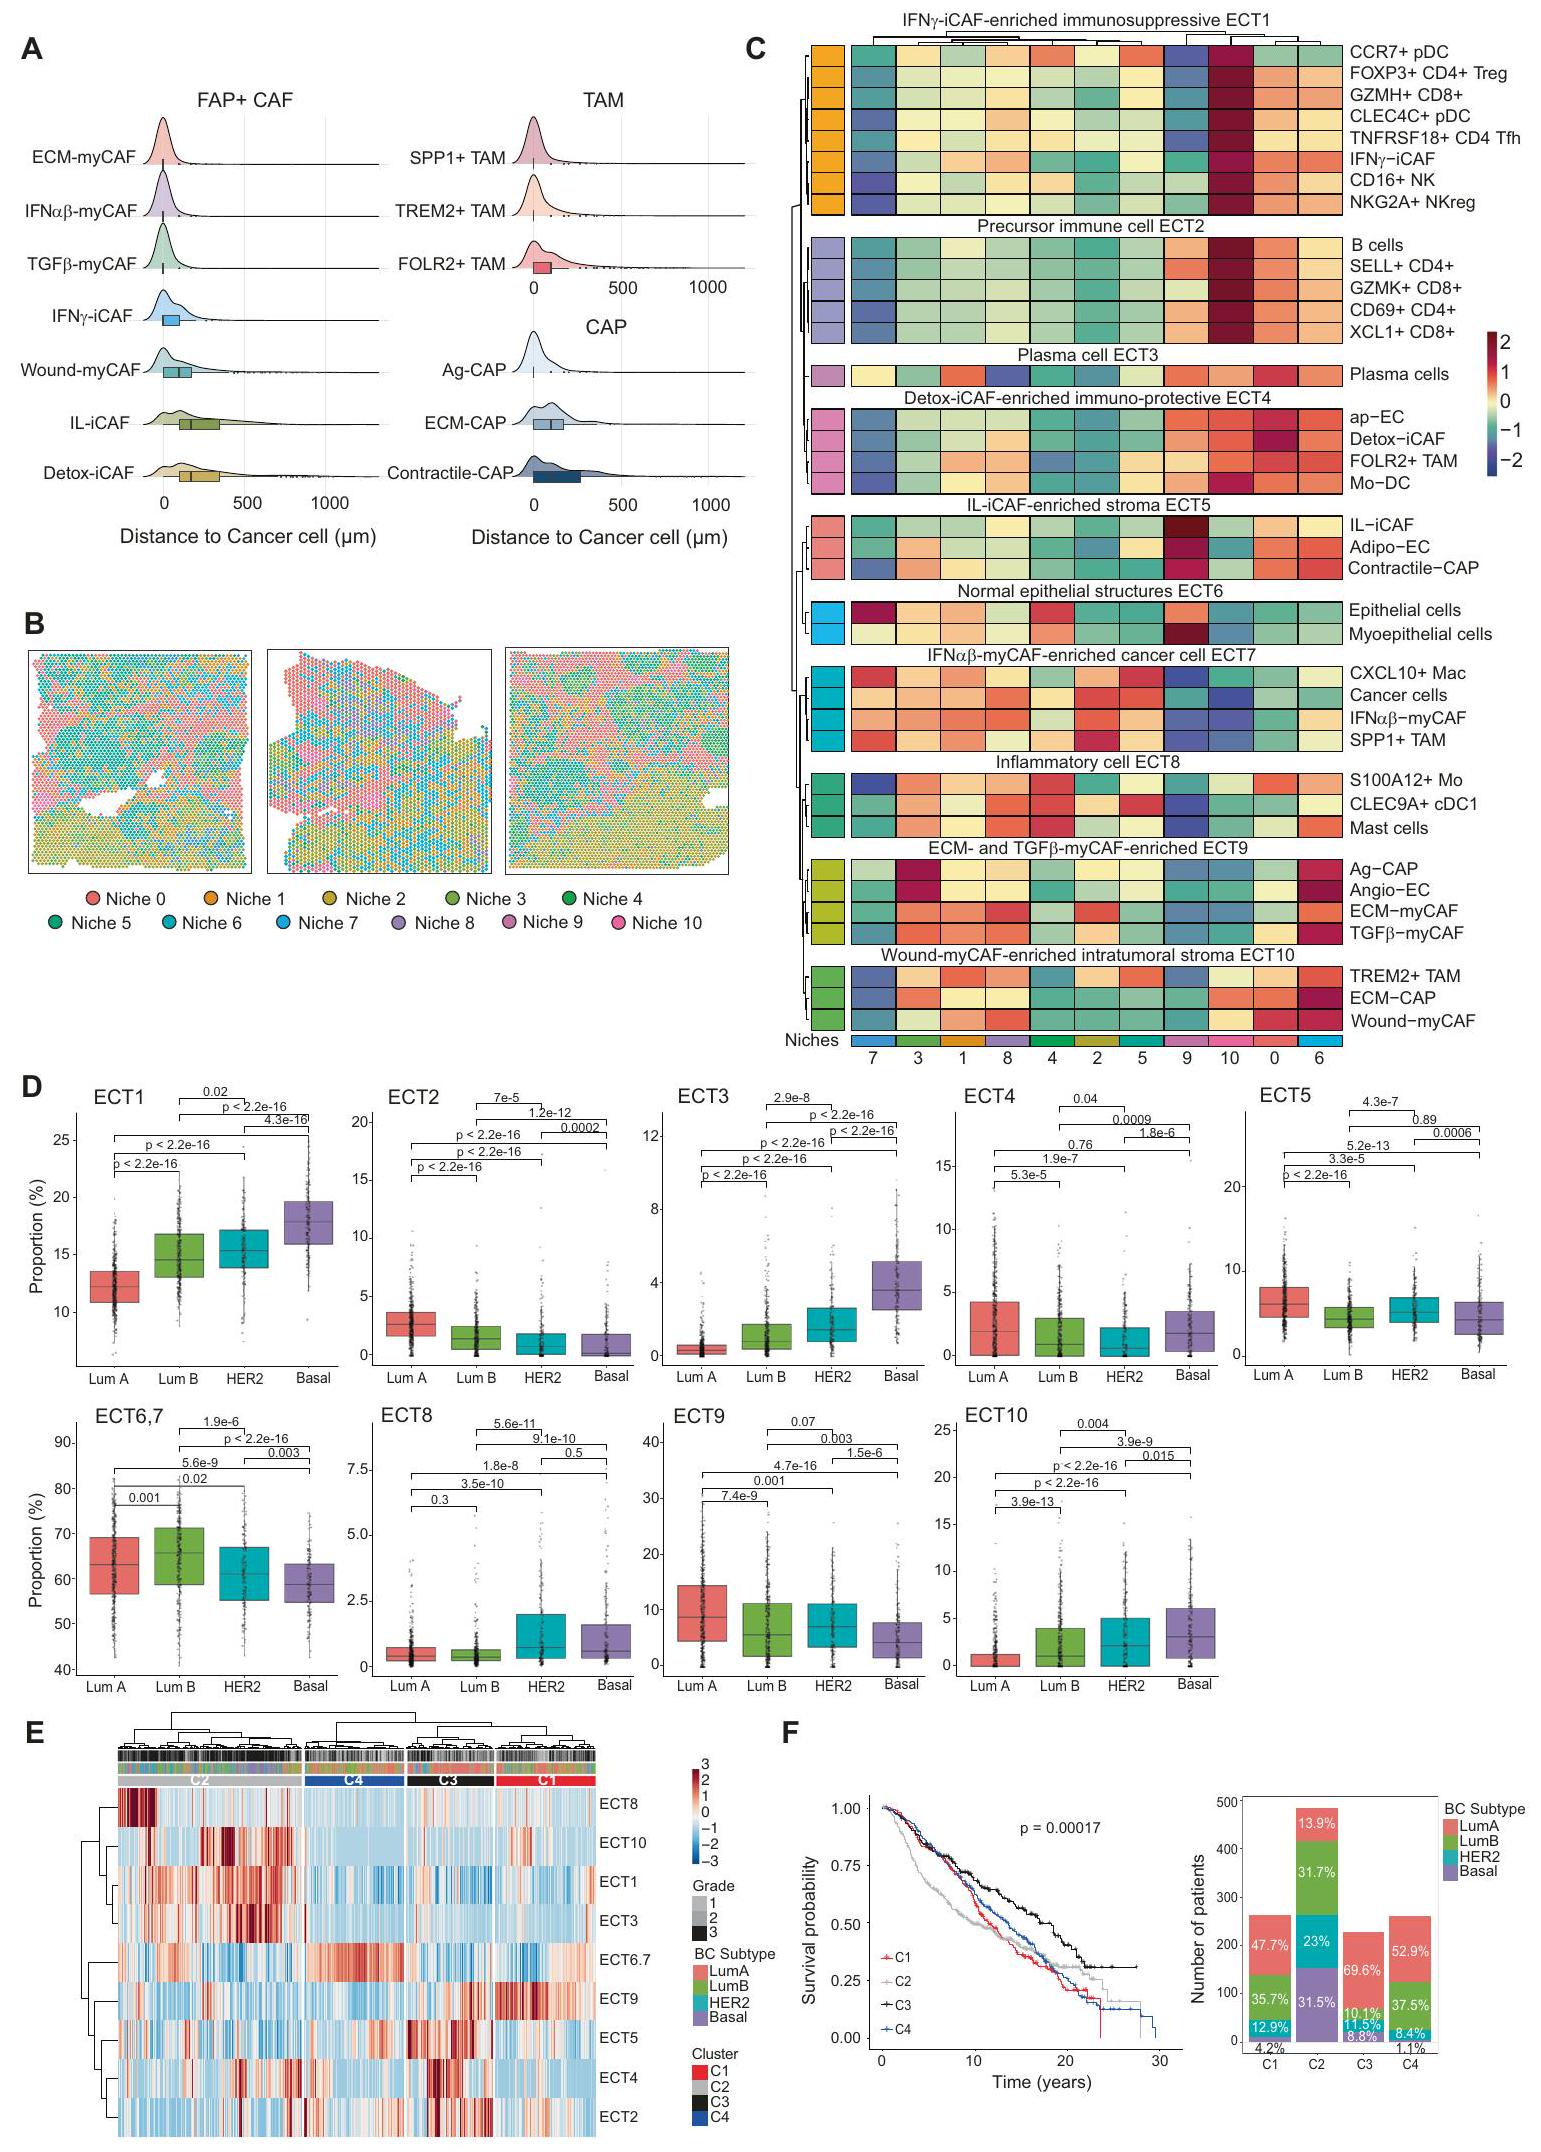
بينما لاحظنا التوزيع المحدد لكل نوع من الخلايا وحالتها في كل مريض، سعينا بعد ذلك لتحديد التراكيب الخلوية المحفوظة عبر المرضى. أولاً، قمنا بحساب أقرب المسافات التي تفصل بين أنواع الخلايا المختلفة في 17 مقطعًا من سرطان الثدي وكشفنا عن دقة توزيع مكونات TME المشتركة بين المرضى (الشكل 4A والشكل التوضيحي 8B). ECM-myCAF، IFN-ماي كاف، تي جي إفتم الكشف عن myCAF و SPP1+ TAM و TREM2+ TAM وخلايا اللمف التنظيمية (FOXP3+ CD4+ Treg و NKG2A+ NKreg) و Angio-EC في الجوار القريب من خلايا السرطان، بينما تم ملاحظة Wound-myCAF و IL-iCAF و Detox-iCAF و FOLR2+ TAM وخلايا T اللمفاوية السابقة (SELL+ CD4+ و XCL1+ CD8+ T cells) و ap-EC في مكان أبعد عن خلايا السرطان (الشكل 4A والشكل التكميلية 8B). وقد دفعنا هذا إلى تحديد المناطق التي تحتوي على تركيزات مماثلة من أنواع الخلايا عبر المرضى بطريقة غير خاضعة للإشراف (الشكل 4B و C). باختصار، قمنا بتطبيق تجميع Leiden.على رسم بياني لجيران الأقرب المصححين على دفعةتم بناء ذلك على مخرجات التفكيك لـ 17 قسمًا لتحديد مجتمعات من النقاط التي تشترك في تركيبة نوع الخلايا المماثلة عبر المرضى. باستخدام هذا النهج غير المراقب، حددنا 11 موطنًا مكانيًا يمكن تصورها مباشرة على الأقسام (الشكل 4B والشكل التكميلية 8C). كانت هذه المواطن تتكون من نقاط تشترك في إثراء نوع الخلايا ولكنها تظهر تنظيمًا مكانيًا مميزًا داخل الأنسجة. تساءلنا عما إذا كان يمكن استخدام مجموعة بيانات BC المكانية لدينا كمرجع لإسقاط المواطن الخلوية على أقسام BC جديدة. للقيام بذلك، استرجعنا 14 قسمًا من BC متاحة للجمهور.تم تحليلها بواسطة النسخ الجيني المكاني ولكنها تفتقر إلى تعليقات النيتش. بعد فك التشفير، قمنا ببناء تمثيل كامن باستخدام scANVI مع جميع الأقسام كمدخلات واستخدمنا قدرات نقل التسمية لـ scANVI لتقييم اكتشاف النيتش في الأقسام الجديدة (انظر “الطرق”، #”تعيين مرجع النيتش”). كشفت هذه الطريقة أننا تمكنا من إعادة تحديد النيتش المختلفة في أقسام سرطان الثدي الجديدة وأن التنظيم المكاني للنيتش المرسومة يعكس عن كثب النيتش الأصلية (الشكل التكميلية 8D، E). وبالتالي، أظهر هذا التحليل أن مجموعة بيانات سرطان الثدي المكاني لدينا يمكن أن تكون مرجعًا في الدراسات المستقبلية لرسم خرائط النيتش الخلوية لسرطان الثدي على بيانات جديدة. بعد ذلك، هدفنا إلى تحديد أنماط فريدة من أنواع الخلايا التي تتواجد بشكل تفضيلي ضمن نيتش محددة. للقيام بذلك، طبقنا التجميع الهرمي على متوسط وفرة أنواع الخلايا لكل نيتش. سمح لنا ذلك بتحديد 10 أنماط تواجد مشترك ضمن النيتش التي كانت مشتركة عبر الأقسام (الشكل 4C). نشير إلى هذه الأنماط التواجد المشترك باسم EcoCellTypes (ECT) والتي تعني نظام بيئي لأنواع الخلايا (انظر #”الطرق”، #”تحديد النيتش وECT”) (الشكل 4C). مثلت ECT أنواع الخلايا والحالات التي تتواجد معًا عبر مرضى سرطان الثدي ضمن نفس منطقة الورم (على سبيل المثال، كل منطقة تكون نيتش). من المثير للاهتمام أن بعض ECTs وُجدت معًا في نيتش محددة ولكن ليس في أخرى، مما يبرز أهمية هذه الطريقة لاكتشاف نمط التواجد المشترك المحدد للنيتش. وبالتالي، يحتوي كل ECT على تركيبة محددة من أنواع الخلايا أو الحالات الموجودة بالقرب من بعضها البعض، وقد حددنا ECT محددة غنية في مجموعات FAP+ CAF المختلفة. تم ملاحظة ECTs الأولى (ECT1-6) بشكل أساسي على مسافة من خلايا السرطان. أبرز “ECT4 الغني بـ Detox-iCAF المناعي الوقائي” التواجد المكاني المشترك لـ Detox-iCAF و ap-EC و Mo-DC و FOLR2+ TAM، والتي تتميز بموقعها في المنطقة المحيطة بالورم ولكن أيضًا داخل سرير الورم، مما يشكل نسيجًا شبيهًا بالنسيج المحيط بالورم داخل الورم. كان “ECT5 الغني بالنسيج الغني بـ IL-iCAF”، المكون من IL-iCAF و Adipo-EC و Contractile-CAP، يشمل الخلايا. أنواع مرتبطة بـ “الهياكل الظهارية الطبيعية ECT6″، التي تتكون من خلايا ظهارية طبيعية وخلايا ميوإيبيثيلية. كانت كل من ECT1 وECT2 غنية بخلايا المناعة. في الواقع، “IFN-iCAF-enriched ECT1″ المحتوي على أنواع خلايا مثبطة للمناعة بما في ذلك FOXP3+ Treg أو NKG2A+ NKreg، بينما “Precursor immune cell ECT2” احتوى على المزيد من حالات الخلايا السلفية أو الخلايا السامة مثل SELL+ CD4+ و GZMK+ CD8+ اللمفاويات التائية. ECT7-10 جمعت أنواع الخلايا مرتبط بقوة بخلايا السرطان. “IFN-myCAF-enriched خلايا السرطان ECT7″ شملت خلايا السرطان، IFN-myCAF، و SPP1+ TAM. من المثير للاهتمام أن “ECM و TGF-myCAF الغني ECT9″ تداخل أيضًا مكانيًا مع ECT7، مما يكشف عن قرب خلايا السرطان من ECM-myCAF، TGF-myCAF، Angio-EC، و Ag-CAP. أخيرًا، جمع “Wound-myCAF-enriched intratumoral stroma ECT10” بين Wound-myCAF و ECM-CAP و TREM2+ TAM.
الشكل 3 | التنظيم المكاني لبيئة سرطان الثدي. صور H&E لشرائح تمثيلية من سرطان الثدي Lum تم معالجتها بواسطة Visium وتم التعليق عليها من قبل أطباء الأمراض. تم تلوين مناطق الورم باللون الأحمر، مع خلايا الظهارة السرطانية باللون الأحمر الداكن والستروما داخل الورم باللون الأحمر الفاتح. تم تمييز الهوامش الغازية باللون الرمادي. تشمل الأنسجة الطبيعية المحيطة بالورم القنوات الطبيعية والفصوص باللون البني والستروما المحيطة بالورم باللون الأصفر. تجمعات الخلايا اللمفاوية T باللون الأزرق.أقسام إجمالية). قضبان القياس. خريطة UMAP لـ 73,426 خلية من 43 مريضًا (34 مريضًا بسرطان الثدي و9 متبرعين أصحاء) تشمل 39 نوعًا وحالة خلوية مختلفة وتكوّن أطلسًا خلوياً شاملاً لسرطان الثدي. C أظهر تحليل التفكيك بدقة تشبه الخلية الواحدة استنادًا إلى الأطلس الخلوي الموضح في (B) على مقطع تمثيلي لسرطان الثدي (انظر أيضًا الشكل التكميلية 5 لتحليل التفكيك لمقاطع إضافية من سرطان الثدي). كل نقطة تمثل خلية واحدة فقط والألوان المختلفة تمثل أنواع وخلايا متميزة. تشير الأسهم السوداء إلى الفصوص والقنوات الطبيعية (خلايا الظهارة) وتواجدها المشترك مع TGF.-myCAF (لوحة FAP + CAFمجموعات myCAF). الخطوط المتقطعة تحدد الهامش الغازي. قضبان القياسخريطة حرارية للنسبة المتوسطة لكل حالة خلوية ضمن نوع الخلايا المقابل داخل كل حجرة مرضية (مناطق غنية بخلايا الورم؛ السدى داخل الورم؛ السدى المحيط بالورم؛ تجمعات اللمفاويات والقنوات والفصوص الطبيعية)، كما هو موضح في (A). دقيقتظهر القيم للدلالة على ) إثراء (أحمر وبرتقالي) أو استنفاد (أصفر) (% المشار إليه على قضبان المقياس) لحالة خلوية مقارنةً بالآخرين ضمن توضيح مرضي معين. قيم من اختبار ويلكوكسون ذو الجانبين (واحد مقابل الكل) لمجموع الرتب. تم توفير بيانات المصدر كملف بيانات مصدر.
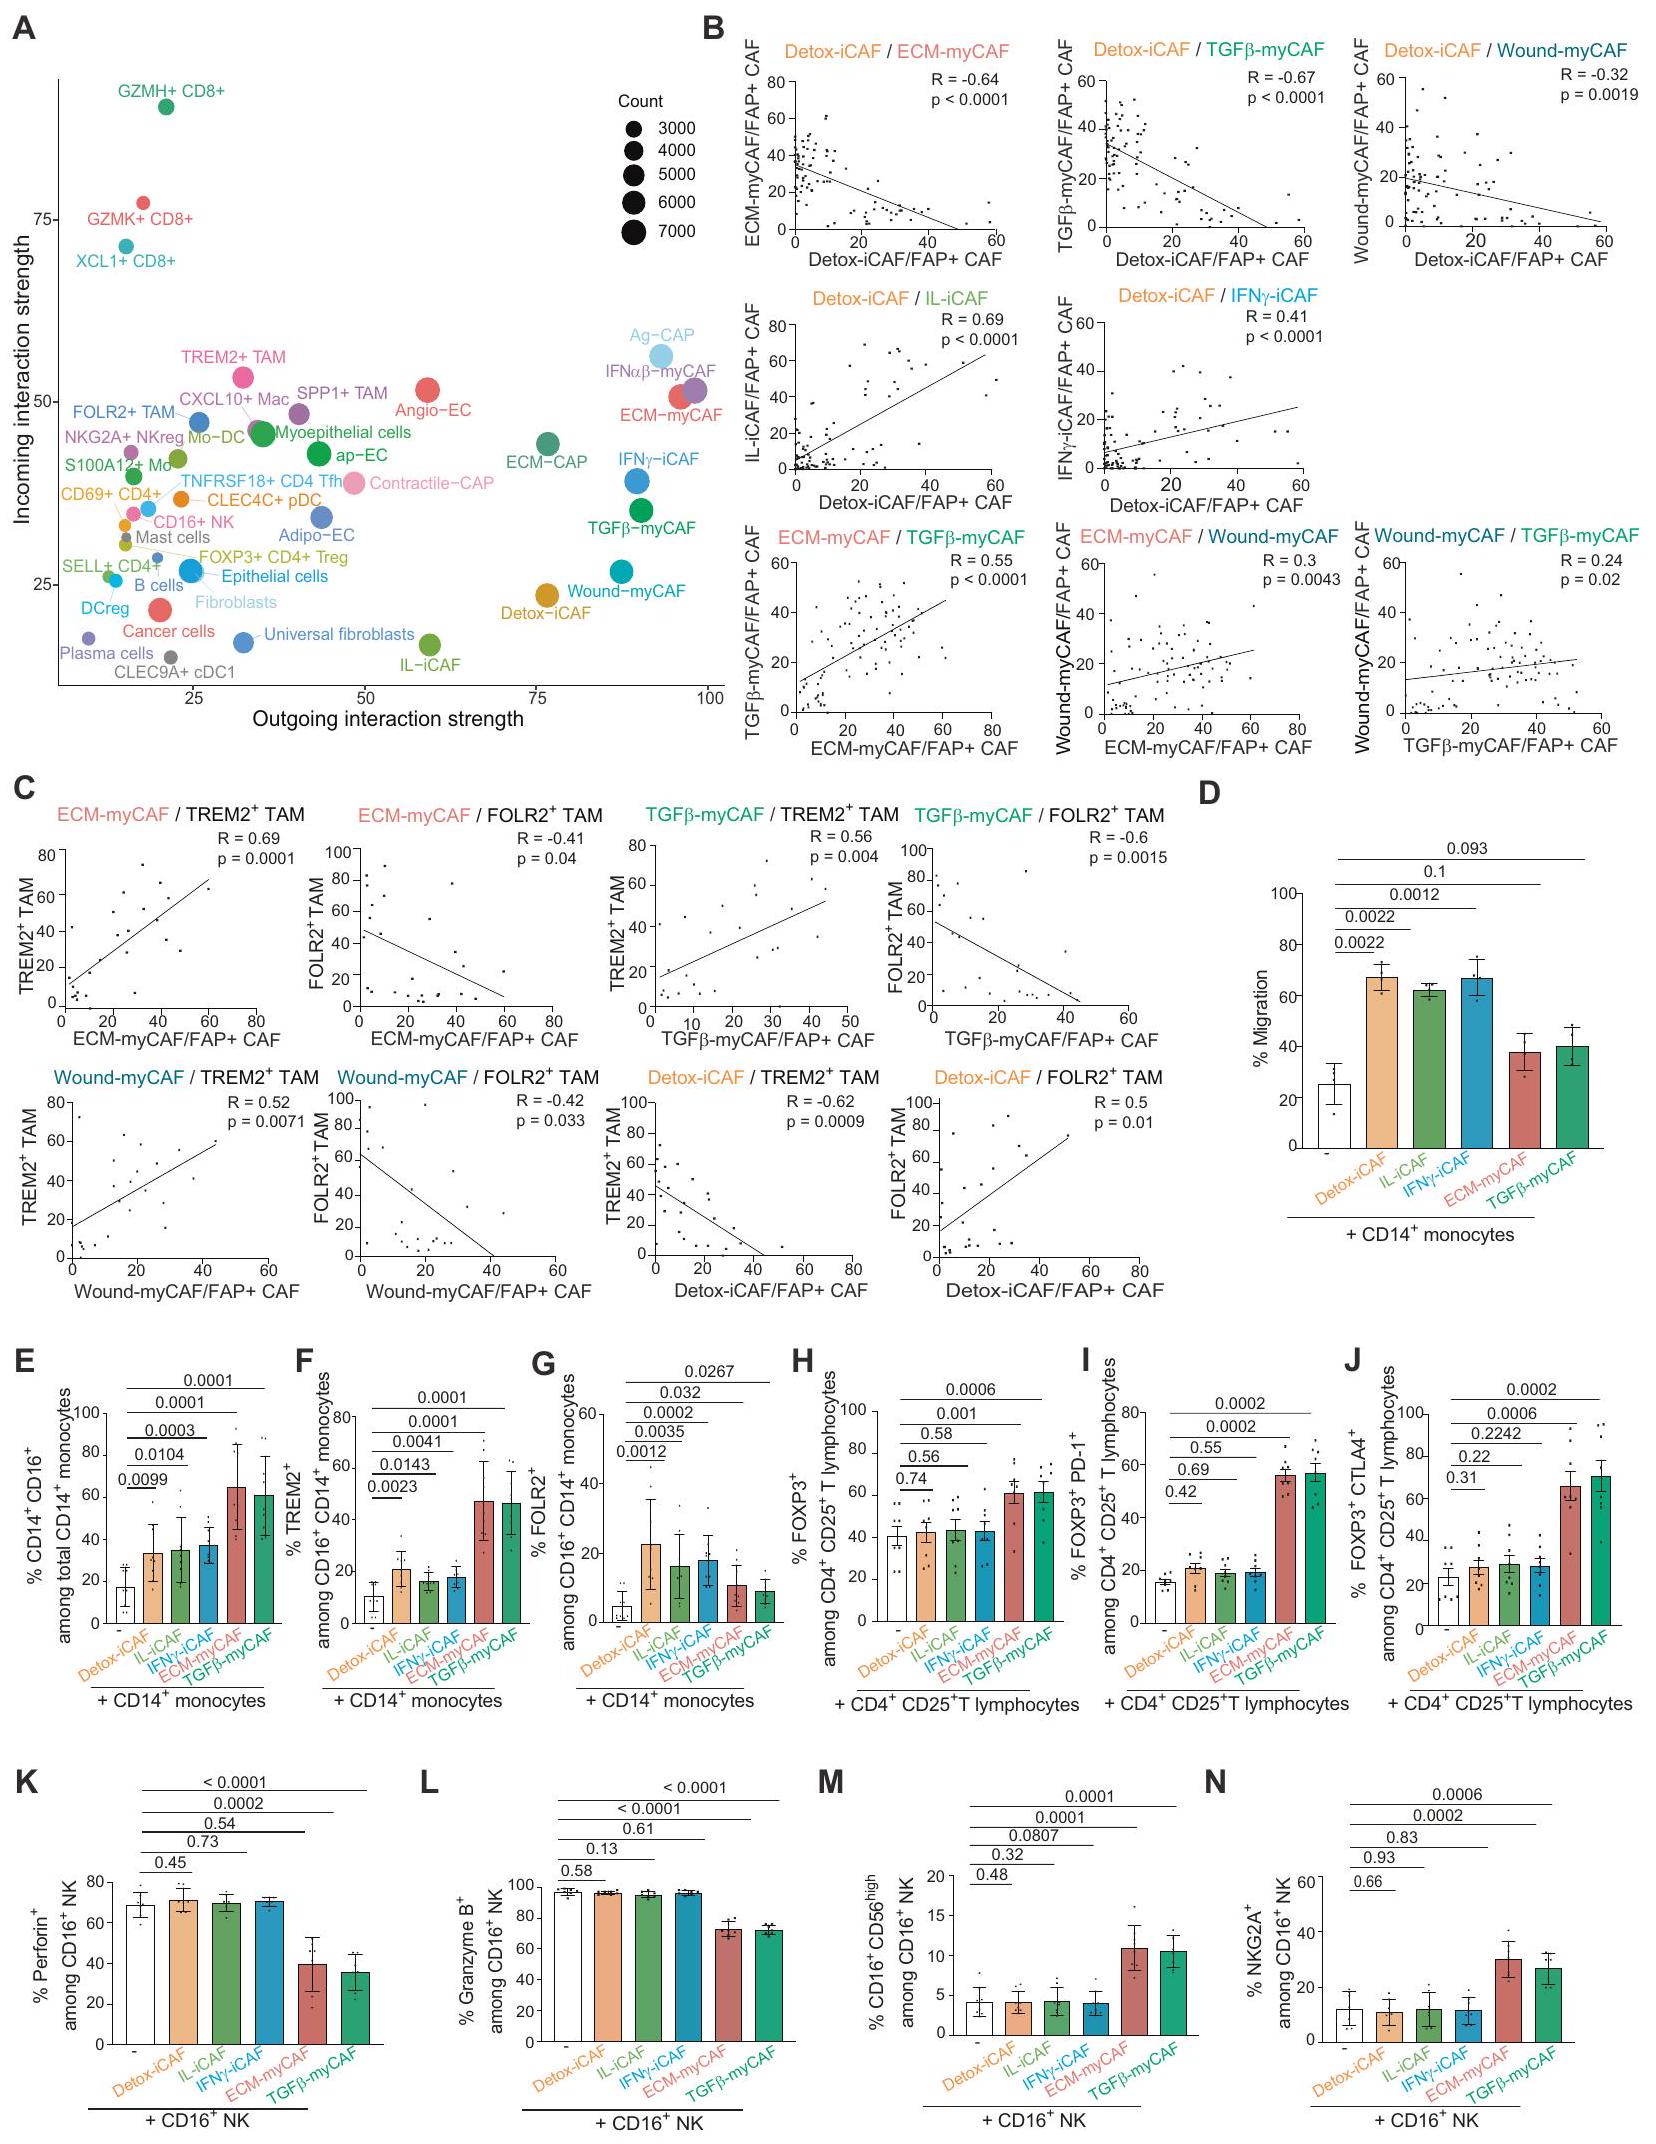
للتحقيق فيما إذا كانت تركيبة هذه ECT تختلف بين الأنماط الجزيئية لسرطان الثدي، قمنا بإجراء تحليل تفكيكي لبيانات النسخ الجيني من مجموعة METABRIC (487 Lum A، 368 Lum B، 193 HER2 و186 Basal-like TN BC) باستخدام BayesPrism.. من حيث المكونات المناعية، وجدنا أن سرطان الثدي من النوع Lum A أظهر نسبة أقل من الخلايا المثبطة للمناعة (ECT1) مقارنةً بـ Lum B وHER2 وBasal-like TN BC (الشكل 4D). وعلى العكس، عرض سرطان الثدي من النوع Lum A نسبة أعلى من خلايا CD4 T الساذجة، بالإضافة إلى الخلايا التائية السامة CD8+ (التي تشكل ECT2) مقارنةً بأنواع سرطان الثدي الأخرى. كما لاحظنا اختلافات كبيرة في المكون السدى: احتوى سرطان الثدي من النوع Lum A على المزيد من ECT5 (المكون من IL-iCAF وAdipo-EC وcontractile-CAP) وECT9 (ECMmyCAF وTGF“-myCAF، Ag-CAP) مقارنةً بـ Lum B و HER2 و Basal-like TN BC. في المقابل، كان ECT10 (Wound-myCAF، ECM-CAP و TREM2+ TAM) متزايدًا في Lum B و HER2 وخصوصًا وفيرًا في Basal-like TN BC، بينما تراكم ECT4 (Detox-iCAF، FOLR2+ TAM) في Lum A (الشكل 4D). من المRemarkably، سمح لنا تكوين ECT في BC بتصنيف المرضى إلى 4 مجموعات فرعية (C1 إلى C4) مع بقاء عام مختلف (الشكل 4E، F). كان المرضى في المجموعة الفرعية C2، الذين يتميزون بزيادة في ECT1 (مناعية مثبطة)، ECT3 (خلايا بلازمية) و ECT10 (TREM2+ TAM، Wound-myCAF)، يتكونون بشكل رئيسي من الأنماط الفرعية Basal-like TN (31.5%)، Lum B (31.7%) و HER2 (23%) وأظهروا أسوأ بقاء، كما هو متوقع. في المقابل، كانت المجموعة الفرعية C3 – الغنية بـ ECT2 (سلف المناعة، المؤثرات)، ECT4 (Detox، FOLR2+ TAM) و ECT5 (IL-iCAF، adipo-EC) – تتكون بشكل رئيسي من النمط الفرعي Lum A (69.6%) وأظهرت أفضل بقاء عام. كانت المجموعتان الفرعيتان C1 و C4 تتكونان بشكل رئيسي من المرضى اللوميناليين (Lum A و Lum B). بينما كان بقاءهم لمدة 5 سنوات جيدًا وقابلًا للمقارنة مع مجموعة C3 الفرعية، انخفضت توقعات المجموعتين الفرعيتين C1 و C4 بعد 5 سنوات. مقارنةً بالمجموعة الفرعية C3، يمكن تفسير هذه الفروق في البقاء جزئيًا من خلال زيادة المجموعة الفرعية C4 في BC Lum B و ECT6-7 (الخلايا الظهارية، IFN”.-myCAF، SPP1+ TAM) ووفرة مجموعة C1 من ECT9 (Angio-EC، ECM-myCAF، TGFmyCAF) (الشكل 4E، F). في الختام، كانت ECT مرتبطة بالبقاء العام لمرضى سرطان الثدي، والذي يرتبط بزيادة ECT في الأنماط الجزيئية لسرطان الثدي. لفهم التفاعل المتبادل بين كل نوع من الخلايا في هذه ECT المتميزة، استخدمنا طريقة CellChat.على خريطة BC لاستنتاج الاتصالات بين الخلايا. أظهر التحليل العالمي لمستقبلات الربط (L-R) لجميع أنواع الخلايا أن تجمعات FAP+CAF كانت المرسلة الرئيسية لإشارات L-R في البيئة المجاورة للورم (TME) (الشكل 5A)، مما يشير إلى أنها قد تلعب دورًا رئيسيًا في تنظيم ECT. علاوة على ذلك، زادت قوة الإشارات المرسلة والمستقبلة من FAP+CAF تدريجيًا من الألياف العالمية إلى ICAF وبلغت ذروتها مع ECM-myCAF، TGF.-myCAF و IFN-myCAF (الشكل 5A)، متبعة مسارات مشابهة لتلك الموصوفة أعلاه (الشكل 1). بالإضافة إلى ذلك، فإن عدد التفاعلات التي تم العثور عليها بين خلايا السرطان ومجموعات FAP+ CAF بواسطة CellChat عكست قربها المكاني في البيئة المجهرية للورم (TME). في الواقع، ECM-myCAF و IFN-myCAF أظهر أعلى أعداد من الإشارات المرسلة إلى خلايا السرطان والمستقبلة منها، بينما أظهرت ILiCAF وDetox-iCAF الأقل (الشكل التوضيحي التكميلي 8F). واحدة من أقوى التفاعلات التي تم اكتشافها بين تجمعات FAP+CAF وأنواع الخلايا الأخرى كانت مسار الإشارات المعتمد على الكولاجين، وخاصة في تجمعات myCAF (الشكل التوضيحي التكميلي 8G). هذا هو يتماشى ذلك مع التعبير العالي لبروتينات ECM في هذه الكتل من FAP+CAF ودور YAP1 في انتقال Detox-iCAF إلى كتل Wound- و ECM-myCAF. باختصار، قمنا بتعريف 10 ECT تميز التواجد المكاني المتزامن لأنواع خلايا مختلفة أو حالات خلايا في BC، وتفاعلاتها المتبادلة.
قمنا بعد ذلك بالتحقق من تركيبة ECT المناعي الحامي والمثبط للمناعة من خلال اختبار الرابط التبادلي بين التجمعات الخلوية الموجودة بالقرب من بعضها البعض. كان جزء من ECT4 الحامي يتكون من Detox-iCAF، والعدلات، وFOLR2+ TAM، بينما كان ECT المثبط للمناعة (ECT9 وECT10) يتكون من ECM-myCAF، وWound-myCAF، وTGF.-myCAF و TREM2+ TAM. كما هو متوقع من تركيبة ECT، باستخدام تحليل تدفق الخلايا من عينات BC (مجموعة مستقبلية، الجدول التكميلي 1)، لاحظنا أن DetoxiCAF أظهر ارتباطًا سلبيًا مع ECM-myCAF و TGF-myCAF، وWound-myCAF وارتباط إيجابي مع IL-iCAF وIFN iCAF في مرضى BC (الشكل 5B). وبالمثل، وبما يتماشى مع ECT9 وECT10، أكدنا وجود علاقة إيجابية بين ECM-myCAF وTGF-myCAF و Wound-myCAF. كما قمنا بالتحقق من تواجد الخلايا المشتركة في البيئة المثبطة للمناعة من خلال إظهار أن هذه الكتل من myCAF كانت مرتبطة إيجابياً مع TREM2+ TAM ومرتبطاً سلبياً مع FOLR2+ TAM (الشكل 5C). وبالمثل، أظهر محتوى Detox-iCAF ارتباطاً إيجابياً مع FOLR2+ TAM، متماشياً مع ECT4 المناعي الحامي، وارتباطاً سلبياً مع نسبة TREM2+ TAM (ECT10) (الشكل 5C). للتحقق مما إذا كانت كتل FAP+ CAF تعدل بنشاط هوية الخلايا المكونة للدم أو فقط تجذبها لتشكيل ECT، قمنا بإجراء اختبارات Transwell لاختبار جذب أحادية النواة نحو كتل FAP+ CAF المختلفة. أظهرت نتائجنا أن Detox-iCAF و IL-iCAF و IFNعززت iCAF هجرة وحيدات النواة، بينما ECM-myCAF وTGFلم يحدث ذلك في myCAF (الشكل 5D). عند زراعة مجموعات FAP+ CAF مع أحادية النواة CD14+، لاحظنا زيادة في نسبة الخلايا CD16+ بين أحادية النواة CD14+ (الشكل 5E والشكل التوضيحي 9A). بالإضافة إلى ذلك، ECM-myCAF و TGF-myCAF زاد بشكل كبير من نسبة البلعميات TREM2+ بين إجمالي خلايا CD14+ CD16+ النخاعية (الشكل 5F والشكل التوضيحي 9A)، بينما زادت Detox-iCAF و IL-iCAF و IFN -iCAF من محتوى البلعميات FOLR2+ (الشكل 5G والشكل التوضيحي 9A). تشير هذه النتائج إلى أن ECM-myCAF و TGF -myCAF تلعب دورًا نشطًا في تعديل هوية الأنماط الفرعية للنخاع لتشكيل البيئة المثبطة للمناعة، بينما تجذب Detox-iCAF العدلات وتسبب في ظهور نمط FOLR2+ لتشكيل البيئة الواقية للمناعة. كما اختبرنا تأثير تجمعات CAF-S1 على تمايز خلايا T اللمفاوية CD4+ CD25+ FOXP3+ في المختبر. لاحظنا أن ECMmyCAF و TGF -myCAF زادت من نسب خلايا T FOXP3+ بين مجموعة CD4+ CD25+، بينما لم يكن لتجمعات iCAF أي تأثير (الشكل 5H والشكل التوضيحي 9B). علاوة على ذلك، زادت ECMmyCAF و TGF -myCAF بشكل كبير من نسب خلايا T PD-1+ و CTLA4+ بين خلايا T FOXP3+ اللمفاوية (الشكل 5I و J والشكل التوضيحي 9B). نظرًا لهذا التأثير على العدلات وخلايا T، تساءلنا بعد ذلك عما إذا كانت بعض تجمعات CAF-S1 قد تؤثر أيضًا على نمط خلايا NK. من خلال زراعة تجمعات CAF+ FAP مع خلايا NK، أظهرنا أن ECM-myCAF و TGF -myCAF قللت من مستويات البيرفورين والجرانزيم B وزادت بشكل كبير
نسبة خلايا NK CD56 ومستويات NKG2A السطحية، مما أدى إلى تقليل السمية الخلوية لخلايا NK (الشكل 5K-N والشكل التوضيحي 9C). في الختام، ترتبط تجمعات CAF+ FAP بشكل مختلف مع ECT محدد في الموقع من خلال جذب وتعديل هوية خلايا المناعة في البشر .
تترافق تجمعات FAP+CAF المحددة مع غزو سرطان الثدي
تساءلنا بعد ذلك عما إذا كان يمكن ربط تكوين خلايا BC بخصائص غازية. للإجابة على هذا السؤال، قمنا بتحليل سلسلة من آفات سرطان القنوات في الموقع (DCIS) وآفات DCIS الدقيقة الغازية (MI-DCIS)
الشكل 4 | تحديد تركيبات الخلايا المكانية المشتركة عبر المرضى، والتي تسمى EcoCellTypes. A توزيع تجمعات FAP+ CAF و CAP و TAM وفقًا للمسافة إلى خلايا السرطان (في ). يتم حساب المسافات بين أقرب خلية سرطانية تم تحديدها بواسطة فك التشفير وتجمعات FAP+CAF و CAP و TAM في 17 مقطع. يتم تصنيف أنواع الخلايا بناءً على متوسط مسافتها إلى خلايا السرطان. B التوزيع المكاني لـ 11 بيئة خلوية في 3 مرضى BC تمثيليين. C خريطة حرارية تظهر متوسط تكوين نوع الخلايا لكل بيئة تم تحديدها في 17 مقطع. القيم مركزة ومقاسة لكل نوع خلية وحالة. يحدد التجميع الهرمي في الصفوف 10 مجموعات مختلفة من أنواع الخلايا المتزامنة في البيئات الخلوية المشار إليها باسم EcoCelltypes (ECT). D-F بيانات من مجموعة METABRIC
( مرضى BC). D نسب كل ECT في Lum A ( ) و Lum B ( ) و HER2 ( ) و Basal-like TN ( ) الأنماط الفرعية لسرطان الثدي. القيم من اختبار مان-ويتني. E خريطة حرارية وتجميع لجميع عينات BC (الأعمدة) من مجموعة METABRIC تظهر 4 مجموعات فرعية من المرضى ( , C3 = 227، C4 = 261) مع إثراء ECT مختلف. F يسار، منحنيات كابلان-ماير تظهر البقاء العام لـ 4 مجموعات فرعية من مرضى BC (C1-C4) مصنفة في الخريطة الحرارية. القيمة من اختبار لوغ-رانك. يمين، توزيع الأنماط الفرعية الجزيئية لسرطان الثدي ضمن المجموعات الفرعية الأربعة (C1-C4) من مرضى BC. في جميع مخططات الصندوق، تشير الخط المركزي وحدود الصندوق والشعيرات إلى الوسيط والرباعيات العليا والسفلى و النطاق الرباعي. يتم توفير بيانات المصدر كملف بيانات المصدر.
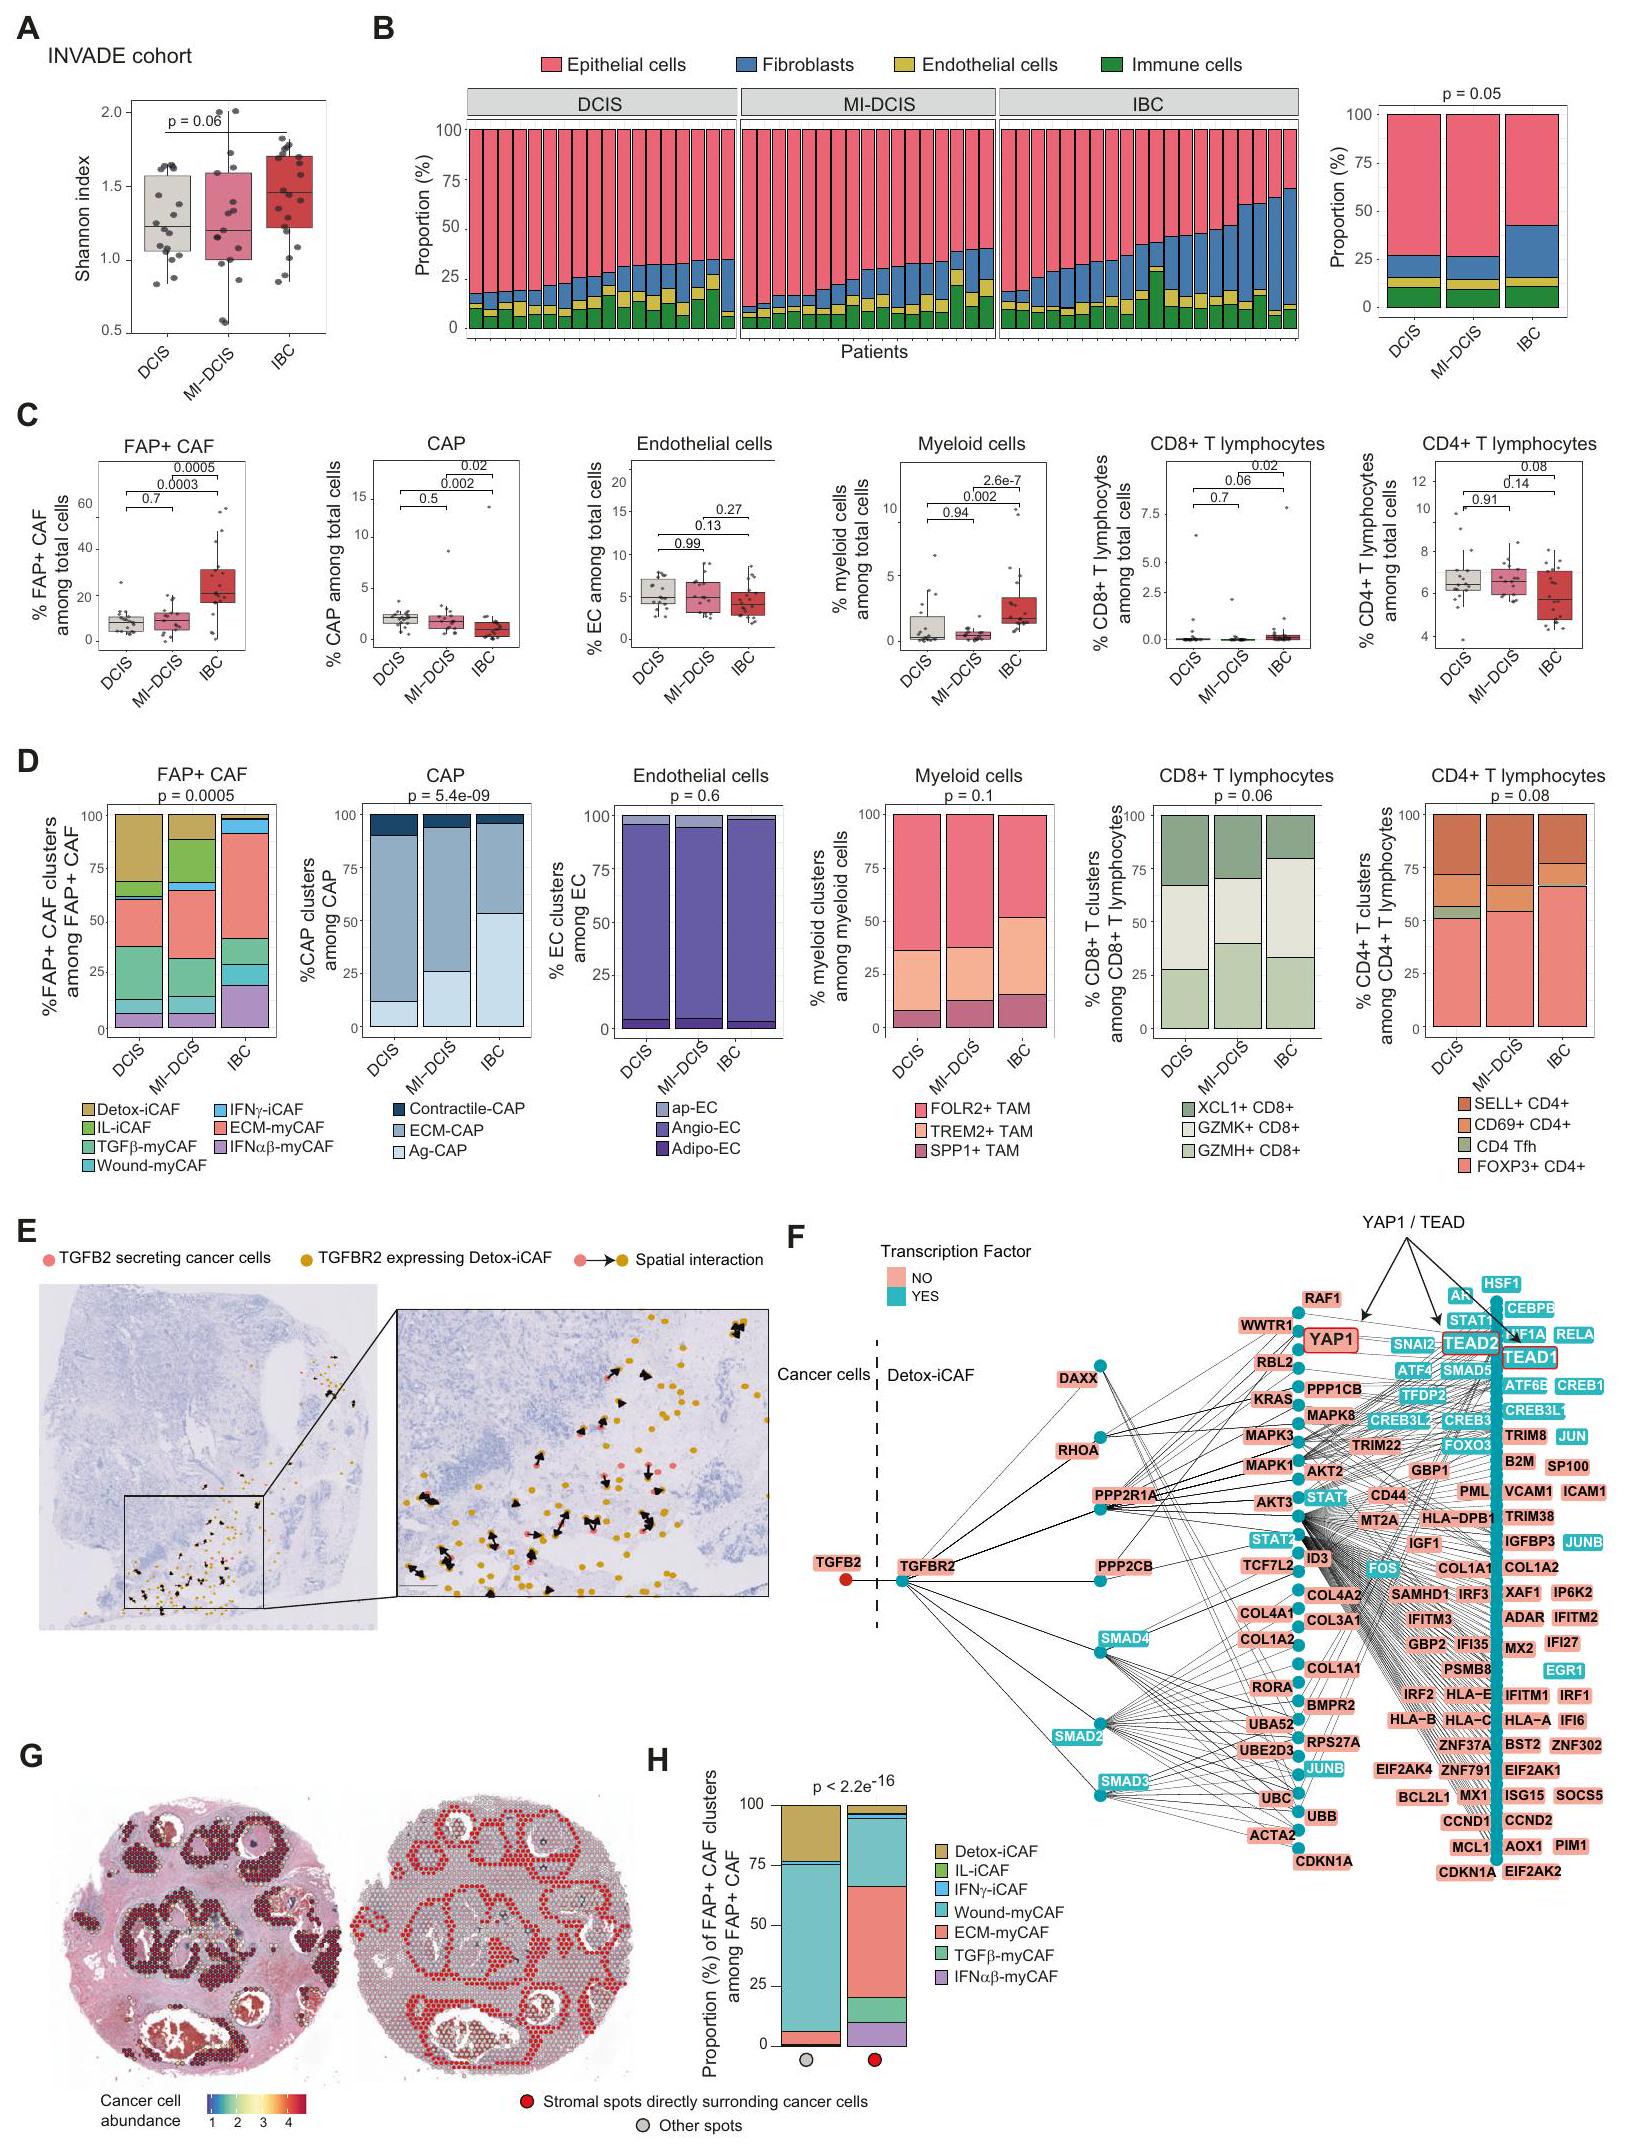
BC (أي آفات DCIS مع بؤر غازية لا تتجاوز 1 مم) وسرطان الثدي الغازي (IBC) (الجدول التوضيحي 2 لوصف مفصل لمجموعة INVADE). قمنا بإجراء تسلسل RNA الضخم (RNA-seq) على هذه الآفات وطبقنا BayesPrism لتحديد التجمعات الخلوية المختلفة التي تتكون منها الأورام. حددنا نسب الخلايا من خلال فك تشفير RNA-seq الضخم باستخدام أطلس خلايا BC الذي أنشأناه في هذه الدراسة (الموضح في الشكل 3B) كمرجع. أولاً، قمنا بتقييم تنوع نوع الخلايا العالمي لكل ورم من خلال حساب مؤشر شانون ولاحظنا أن IBC كانت أكثر تنوعًا من DCIS و MI-DCIS (الشكل 6A). من خلال تحليل نسبة الخلايا الظهارية والليفية والمناعية والبطانية في كل عينة، لاحظنا أن IBC تحتوي على المزيد من الخلايا الليفية مقارنة بعينات DCIS و MI-DCIS (الشكل 6B). كانت هذه الملاحظة مستقلة عن كثافة الورم بين أنواع سرطان الثدي الغازية (الشكل التوضيحي 10A) ومتسقة مع تحليل حديث لآفات DCIS و IBC . ثم حددنا نسبة كل نوع خلية وحالة خلوية تم تحديدها في أطلس BC الخاص بنا من خلال فك التشفير ولاحظنا أن تكوين نوع الخلايا كان مميزًا وفقًا لغازية BC (الشكل 6C و D والشكل التوضيحي 10B و C). على وجه الخصوص، لاحظنا تراكمًا كبيرًا للخلايا الليفية العالمية (المحددة في الأنسجة الصحية) في DCIS (الشكل التوضيحي 10C)، بينما كان الزيادة الكبيرة في الخلايا الليفية في IBC ناتجة بشكل رئيسي عن FAP+ CAF (الشكل 6C). فيما يتعلق بـ FAP+ CAF، احتوت الأورام ما قبل الغازية على نسبة أعلى من تجمعات iCAF مقارنة بالآفات الغازية، مع تراكم DCIS لمزيد من Detox-iCAF و MI-DCIS لمزيد من IL-iCAF (الشكل 6D والشكل التوضيحي 10C). كما أظهرت المراحل الثلاثة من سرطان الثدي الغازي محتويات myCAF مميزة، مع نسبة أعلى من TGF -myCAF في DCIS ومستويات مرتفعة من كل من ECM-myCAF و IFN -myCAF في IBC (الشكل 6D والشكل التوضيحي 10C). بالمقارنة مع DCIS و MIDCIS، أظهرت IBC تراكمًا في خلايا T اللمفاوية CD8+ وخلايا النخاع (خصوصًا في TREM2+ و SPP1+ TAM بدلاً من FOLR2+ TAM) (الشكل 6C و D) ولكن أعداد أقل من CAP (الشكل 6C). ضمن CAP، ارتبطت IBC بزيادة في وانخفاض في نسبة ECM-CAP (الشكل 6D والشكل التوضيحي 10C). كانت هذه التحولات في تكوين نوع الخلايا الملاحظة من DCIS إلى IBC متوافقة مع استنتاجات المسار والتحليل المكاني الموصوف أعلاه في دراستنا.
ثم قمنا بإجراء تحليل Ligand-Receptor المكاني باستخدام طريقة SpaTalk . حددنا TGFBR2 بين أعلى 10 مستقبلات معبر عنها بواسطة Detox-iCAF والتي يمكن أن تقود التفاعلات الرئيسية مع خلايا السرطان، متسقة مع الاختبارات الوظيفية الموضحة أعلاه والبيانات الحديثة التي تظهر أن محور TGF TGFBR 2 يعمل في ظهور LRRC15+ ECM-myCAF في نماذج الفئران PDAC . من المهم أن خلايا الورم عند الهامش الغازي، تواصلت مع Detox-iCAF من خلال زوج مستقبل-ليغاند TGF TGFBR 2 (الشكل 6E). بدورها، عند تحفيز TGFBR2، زادت Detox-iCAF من نشاط YAP1، كما تم تحديده بواسطة نهج رسم المعرفة القائم على عامل النسخ لمستقبل-ليغاند المطبق في SpaTalk (الشكل 6F) (انظر أيضًا “الطرق”، #”تحليل مستقبل-ليغاند”)، متسقة مع دور YAP1/TEAD في مرونة FAP+ CAF التي وصفناها أعلاه. لتقديم رؤى حول حقيقة أننا اكتشفنا عددًا أقل من ECM-myCAF والمزيد من Detox-iCAF في DCIS، قمنا بتحليل بيانات النسخ المكانية المتاحة للجمهور من مقطع DCIS (الشكل 6G,H). كشفت التحليلات أن موضع ECMmyCAF و TGF -myCAF و IFN -myCAF كان مقصورًا بشكل رئيسي على
طرف القنوات حول خلايا الورم. في المقابل، وُجد Wound-myCAF في السدى بين أعشاش الورم وبعيدًا عن خلايا السرطان، مما يشير إلى أن الاتصال المباشر مع خلايا السرطان لم يكن ضروريًا لتحفيزها (الشكل 6H). في الختام، تظهر نتائجنا أن هناك زيادة كبيرة في FAP+ CAF، وخاصة ECM-myCAF، في IBC مقارنة بـ DCIS.
تنبؤ نسب Detox-iCAF و TGF -myCAF بالتقدم من DCIS إلى IBC
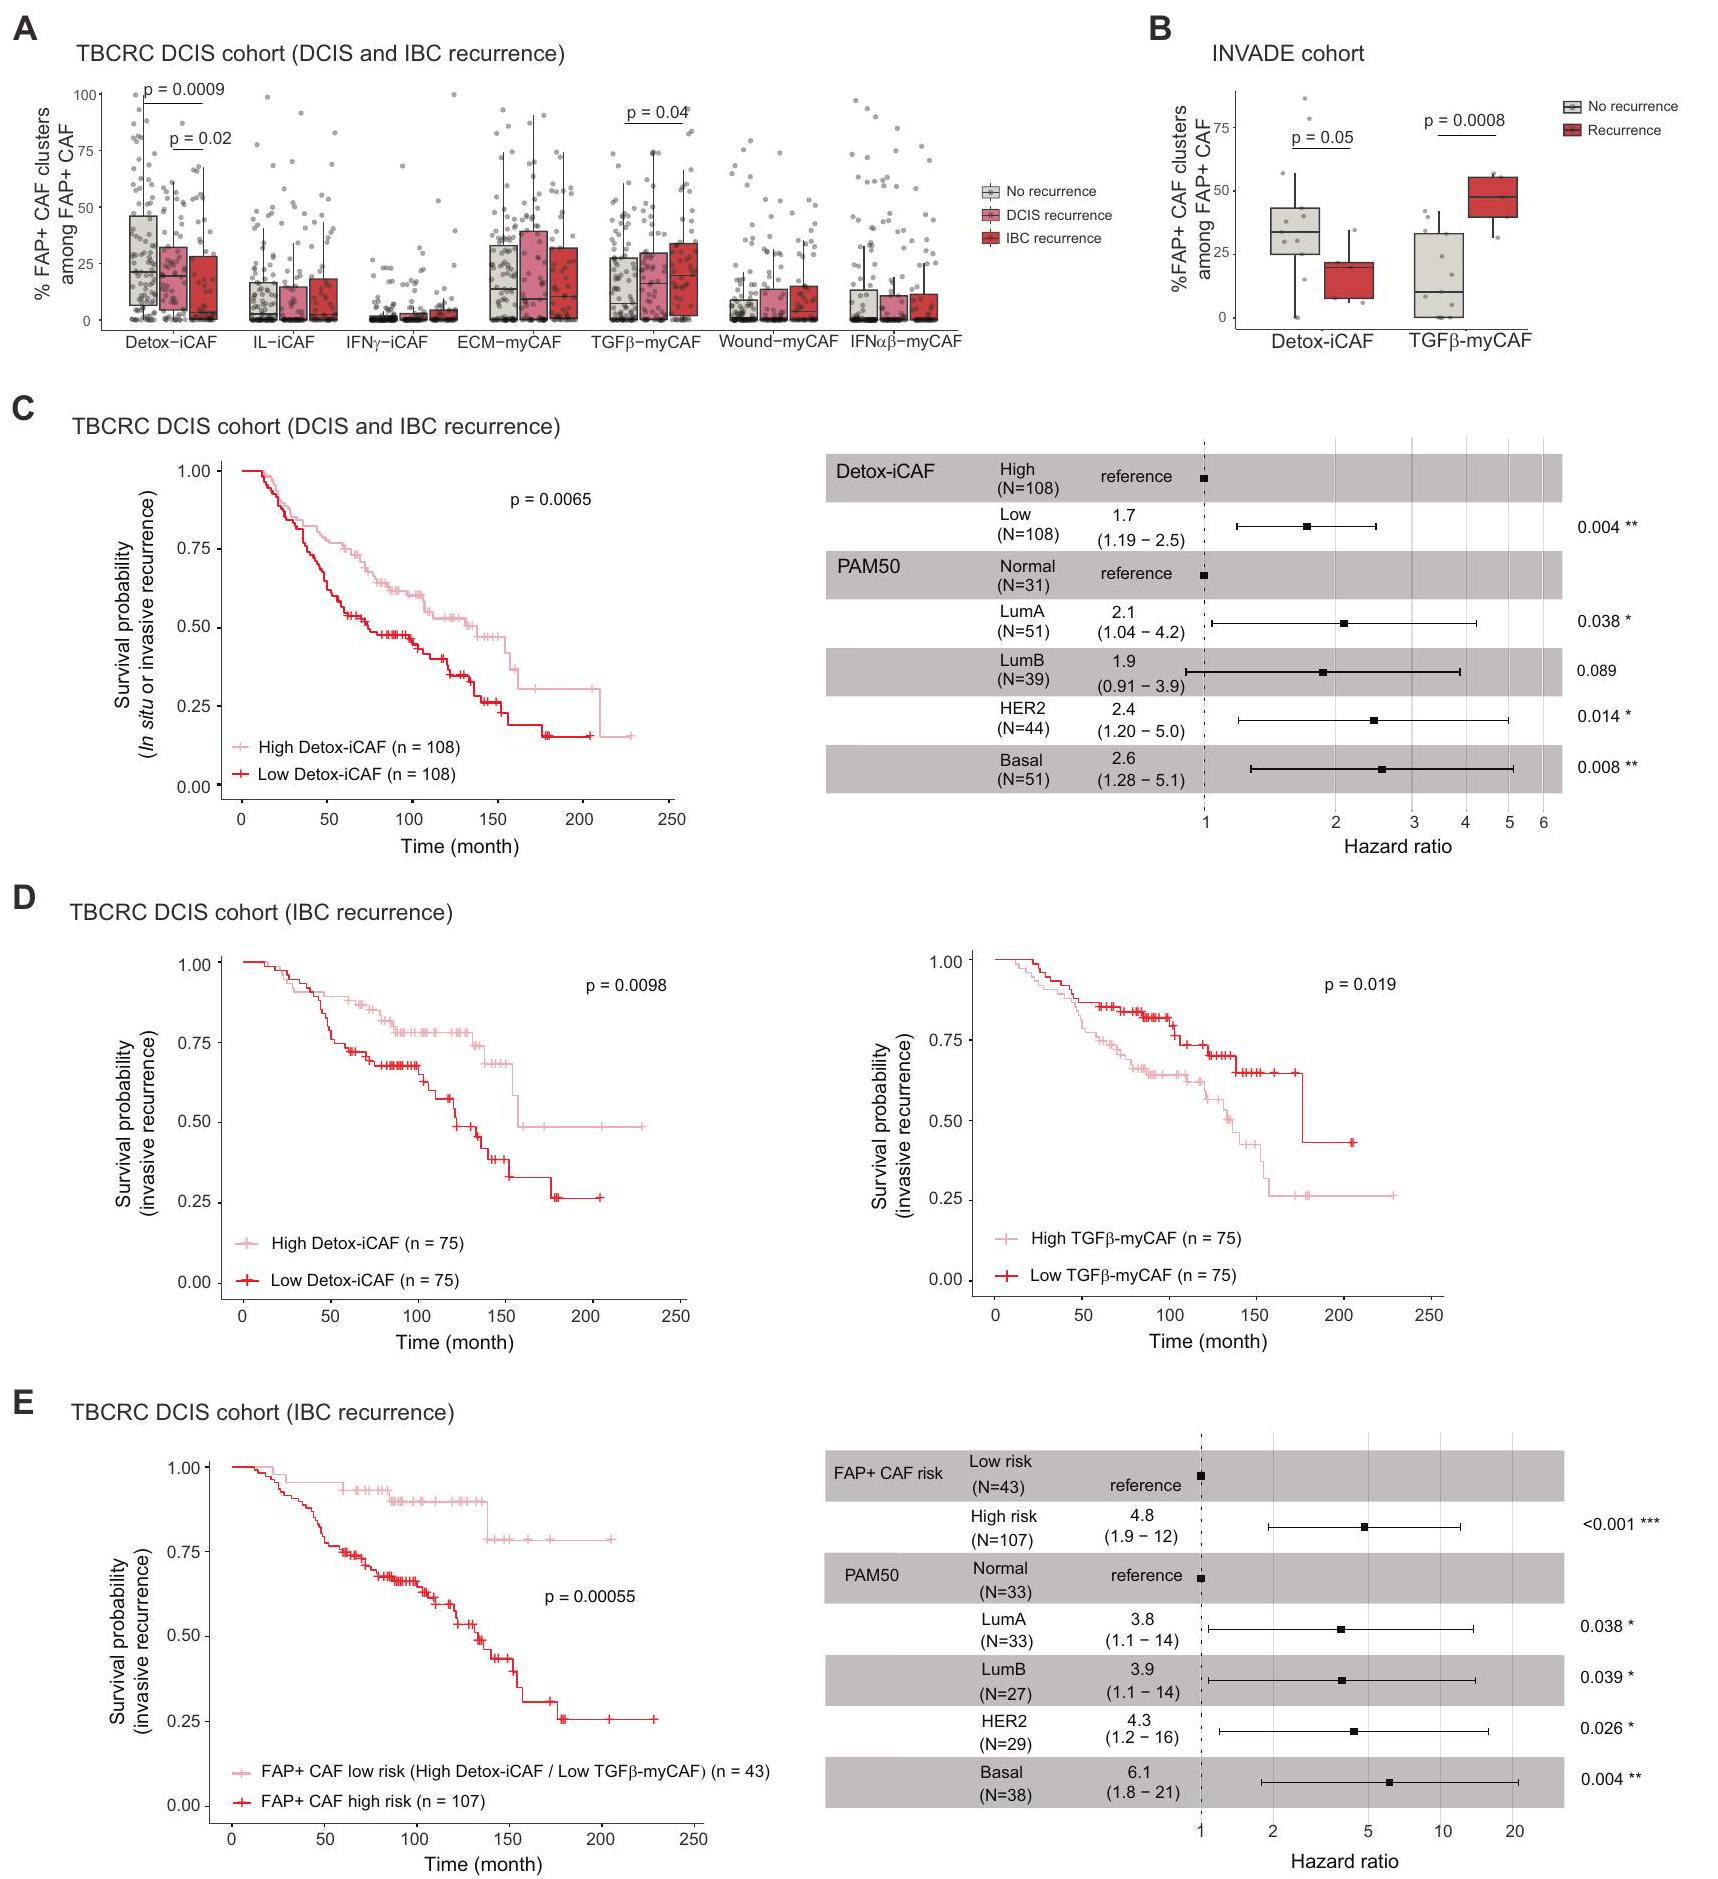
تساءلنا بعد ذلك عما إذا كان المحتوى في أنواع خلايا محددة في DCIS يمكن أن يرتبط بخطر التقدم. نظرًا لأن تكوين تجمعات FAP+ CAF مختلف في DCIS مقارنة بـ IBC، تساءلنا عما إذا كانت مستوياتها في DCIS عند التشخيص يمكن أن تتنبأ بعودة DCIS والتقدم إلى IBC. للإجابة على هذا السؤال، درسنا بيانات bulkRNAseq من مجموعة TBCRC 038 , بما في ذلك 216 مريضًا تم تشخيصهم بـ DCIS متطابقين في الدرجة والعمر عند التشخيص. من بينهم، أظهر 121 إما عودة DCIS ( ) أو عودة IBC ( ). من المثير للاهتمام أن مجموعة FAP+ CAF أظهرت فرقًا كبيرًا في التركيب بين المرضى الذين لديهم انتكاسات والذين ليس لديهم انتكاسات، بينما لم يُلاحظ أي تغيير كبير في مجموعات الخلايا السدوية والمناعية الأخرى (الشكل 7A والشكل التوضيحي 10D). في الواقع، كان لدى المرضى الذين عانوا من انتكاسة لاحقة في سرطان الثدي الغزير نسبة أقل بشكل ملحوظ من Detox-iCAF وزيادة في نسبة TGF. myCAF (الشكل 7A). حتى مع عدد أقل من المرضى، تمكنا من التحقق من هذه النتيجة في 18 مريضًا مصابًا بـ DCIS من مجموعة INVADE، حيث لم يظهر 13 مريضًا أي تكرار و5 مرضى تقدموا (الشكل 7B). بعد ذلك، سعينا لتقييم القيمة التنبؤية لـ DetoxiCAF و TGF.-محتوى myCAF في مرضى DCIS. توقعت التقسيم الوسيط للمرضى بناءً على محتوى Detox-iCAF بشكل كبير أي نوع من الانتكاسات، سواء كانت DCIS أو IBC (الشكل 7C، اليسار). من المهم أن تحليل الانحدار المتعدد المتغيرات Cox أظهر أن القيمة التنبؤية لـ Detox-iCAF على الانتكاسة كانت مستقلة عن تصنيف PAM50 (الشكل 7C، اليمين). حيث تم مطابقة مجموعة TBCRC 038 في البداية بناءً على الدرجةلم يكن التأثير التنبؤي لـ Detox-iCAF مشوشًا بالدرجة. عند التركيز على تكرار IBC، أكدنا أن مرضى DCIS الذين يتمتعون بزيادة في Detox-iCAF كانوا يحملون خطرًا أقل للتكرار الغازي (الشكل 7D، اليسار). بالإضافة إلى ذلك، كان المرضى الذين يتمتعون بزيادة في TGFكان لدى myCAF خطر أعلى لعودة IBC (الشكل 7D، اليمين). ثم افترضنا أن مرضى DCIS الذين يحملون مستويات عالية من DetoxiCAF ومستويات منخفضة من TGF-myCAF عند التشخيص قد يكون له خطر منخفض لعودة سرطان الثدي الغازي. في الواقع، عند النظر في هذين العاملين معًا، لاحظنا قيمة تنبؤية أكثر قوة مما كانت عليه عند النظر إليهما بشكل منفصل. سمحت لنا هذه التحليل بتحديد مجموعة فرعية من مرضى DCIS الذين قد يكون لديهم خطر أقل للتقدم الغازي (الشكل 7E). وبالتالي، تشير نتائجنا إلى أن تباين FAP+ CAF قد يكون عاملًا مهمًا في تقدم DCIS وتوفر رؤى أولية لمعالجة قضية العلاج المفرط في DCIS، حيث قد يستفيد المرضى الذين لديهم خطر منخفض من التقدم من تقليل العلاج.
نقاش
تقدم دراستنا رؤى حول التنظيم المكاني لبيئة الورم في سرطان الثدي مع التركيز على تنوع الخلايا الليفية المرتبطة بالورم FAP+ ومرونتها وتفاعلاتها مع الخلايا المحيطة. هنا، نقدم خريطة شاملة لـ مجموعات FAP+CAF المختلفة، من خلال دمج النسخ الجيني المكاني مع أطلس خلوي شامل يعتمد على بيانات scRNA-seq وتقدير تركيبات نوع الخلية وحالة الخلية على مستوى الخلية الفردية. استنادًا إلى كل من البيانات المفككة والتعليقات النسيجية، حددنا التنظيم المكاني لحالات وظيفية مختلفة من تجمعات FAP+ CAF، وخلايا T اللمفاوية وTAM، والتي تتراكم جميعها بشكل مختلف. داخل الورم (بالقرب من خلايا السرطان)، السدى داخل الورم والمساحة المحيطة بالورم. بهذه الطريقة، نقوم بتحديد موقع تجمعات CAF الإيجابية لـ FAP ونحدد 10 أنواع خلوية بيئية مرتبطة بـ CAF (ECT). مؤخرًا، تم تصنيف بيئتين دقيقتين متواجدتين معًا في سرطان البنكرياس القنوي.، التي تظهر اختلافات في تسلل المناعة وتراكم iCAF/myCAF. دراستنا تزيد من دقة
الشكل 5 | التفاعلات بين تجمعات FAP+ CAF والخلايا المناعية في سرطان الثدي. A مخطط مرسل ومستقبل مهيمن من CellChat يظهر قوة التفاعل الواردة والصادرة لكل نوع خلية تم تحديده في أطلس سرطان الثدي (73,426 خلية من 43 مريضًا). حجم كل دائرة يتناسب مع العدد الإجمالي للتفاعلات المهمة، ملونة حسب نوع الخلية. B مخططات مبعثرة مع خطوط انحدار خطية تظهر الارتباطات في محتوى تجمعات FAP+ CAF التي تم قياسها بواسطة تحليل التدفق الخلوي في سرطان الثدي (المرضى).قيم من اختبار ارتباط بيرسون ثنائي الاتجاه. ج نفس الشيء كما في (ب) تحليل الارتباطات بين المحتوى في ECM-myCAF و TGFmyCAF، Wound-myCAF و Detox-iCAF مع البلعميات TREM2+ أو FOLR2+. رسم بياني عمودي يوضح النسب المئوية (%) لهجرة الخلايا الوحيدة CD14+ بعد 6 ساعات من زراعة الخلايا المشتركة مع تجمعات FAP + CAF. البيانات هي متوسطSEMتجارب مستقلة).قيم من توزيع ستودنت ذي الجانبين اختبار. من خلايا المايلويد CD14+ CD16+ بين إجمالي المونوسيتات CD14+ بعد 24 ساعة من التعايش مع تجمعات CAF الإيجابية لـ FAP (استراتيجية التصفية المفصلة في الشكل التكميلية 9A). البيانات هي متوسط SEMقيم من توزيع ستودنت ذي الجانبين اختبار. نفس الشيء كما في (E) لـ
البلاعم TREM2+قيم من توزيع ستودنت ثنائي الجوانباختبار. G نفس الشيء كما في (E) لخلايا البلعمة FOLR2+.قيم من اختبار مان-ويتني ثنائي الجوانب. من خلايا T التنظيمية FOXP3+ بين الخلايا اللمفاوية T CD4+ CD25+ بعد 16 ساعة من الزراعة المشتركة مع تجمعات CAF الإيجابية لـ FAP (استراتيجية التصفية المفصلة في الشكل التكميلية 9B). البيانات هي متوسط SEMقيم من اختبار مان-ويتني ثنائي الجانب. أنا نفسلنسبة الخلايا اللمفاوية التائية PD-1+ FOXP3+.قيم من اختبار مان-ويتني ثنائي الجانب. ج نفس ما هو في (H) بالنسبة لنسبة الخلايا اللمفاوية T الإيجابية لـ CTLA-4 و FOXP3+قيم من اختبار مان-ويتني ثنائي الجانب. من Perforin+ بين إجمالي خلايا NK CD16+ بعد 24 ساعة من التعايش مع تجمعات FAP+CAF (استراتيجية التصفية المفصلة في الشكل التكميلية 9C). البيانات هي متوسط SEM. قيم من توزيع ستودنت ذو الجانبيناختبار. ل نفس الشيء كما ( ) لبروتين غرانزيم ب + خلايا NK.قيم من توزيع ستودنت ذو الجانبين اختبار. نفس الشيء كما في (K) لـ CD16 + CD56خلايا NK.قيم من توزيع ستودنت ذي الجانبين اختبار. ن نفس الشيء كما ( ) لخلايا NK الإيجابية لـ NKG2A.قيم من توزيع ستودنت ذو الجانبيناختبار. يتم توفير بيانات المصدر كملف بيانات المصدر.
تجمعات FAP+ CAF، ويصف التنظيم المكاني للبيئة المجهرية للورم (TME) في سرطان الثدي من خلال التحقيق المتزامن في توزيع 39 نوعًا وحالة خلوية مختلفة، بما في ذلك 7 مجموعات من FAP+ CAF. كما توسع نتائجنا على البيانات من دراسة حديثة، التي حددت 9 مجموعات من الأنواع الخلوية المتزامنة باستخدام مجموعة بيانات تسلسل RNA الكمي.. في الواقع، نوضح أن القرب المكاني لمجموعات FAP+ CAF المختلفة هو عامل حاسم في بيئة الورم، حيث تؤثر أنواع الخلايا المتزامنة بشكل مباشر على هوية بعضها البعض وبالتالي تشكل ECT مميزة (انظر النموذج، الشكل 8). بينما مجموعات FAP+ myCAF – وهي ECM-myCAF، TGF-myCAF و IFN-myCAF- تُلاحظ بالقرب من خلايا السرطان، بينما يتم اكتشاف مجموعة FAP+ Detox-iCAF حول الأوعية الدموية. تشير هذه التوزيعة المكانية المحددة إلى أصل مغلف لمجموعة Detox-iCAF، حيث يتم دفع مرونتها من خلال التفاعلات مع خلايا السرطان. هنا، نوضح أن مجموعة FAP+ Detox-iCAF يمكن أن تعمل كخزان قادر على إنتاج جميع مجموعات FAP+ CAF الأخرى. تحليل مسار الزمن الزائف الأخير في BC حدد حالة خلايا جذعية ميزنشيمية تتميز بتعبير ALDH1A1.جين يتم التعبير عنه بشكل كبير أيضًا في Detox-iCAF. ينخفض تعبير ALDH1A1 بينما يزيد تعبير COL1A1 عندما تنتقل الخلايا نحو حالة شبيهة بالليف العضلي.. هذا يتماشى مع المسارات التي حددناها بين مجموعات Detox-iCAF و ECM-myCAF. التوزيع المكاني المحدد لمجموعات FAP+ CAF يشير إلى أن السدى يمكن أن يشكل بنية الورم الداخلي، كما تم إظهاره مؤخرًا.. لقد أكدنا هذه الملاحظات وسلطنا الضوء على الآليات المعتمدة على YAP1 و DPP4. بينما تم إظهار أن تمايز الخلايا العضلية الليفية يتضمن تنشيط YAP1 في نماذج تليفية مختلفة.دورها في مرونة CAF أقل بكثير معرفة في BC. هنا، وجدنا أن مجموعة Detox-iCAF يمكن أن تؤدي إلى حالة myCAF المنشطة في وجود خلايا السرطان من خلال مسارين رئيسيين: انتقال غير مباشر يتم بواسطة مسار إشارة YAP1 يمر عبر مجموعة WoundmyCAF وانتقال مباشر يعتمد على DPP4 بين مجموعتي Detox-iCAF و ECM-myCAF (انظر النموذج، الشكل 8). كما تم الإشارة مؤخرًا إلى أن DPP4 له دور في الانتقال من الألياف الطبيعية إلى iCAF في الفئران.علاوة على ذلك، أظهرت الأدلة الجينية في نماذج الفئران لسرطان البنكرياس (PDAC) أن iCAF يمكن تحويلها إلى myCAF إيجابية LRRC15 (حيث أن LRRC15 هو علامة محددة لـ ECM-myCAF).عن طريق تنظيم مسار الإشارة المعتمد على TGFBR2. متسق مع هذه النتائج، YAP و TGF-يمكن أن تعمل مسارات الإشارة في وقت واحد لتعزيز الانتقال الخلوي لسلائف الخلايا الدهنية DPP4+ نحو الخلايا الليفية العضلية SMA+ DPP4-.. علاوة على ذلك، قدمنا هنا دقة مكانية لهذه التفاعلات من خلال استخدام SpaTalk وعرض TGF-التواصل الوسيط بين Detox-iCAF وخلايا السرطان عند الهامش الغازي مما يؤدي إلى تنشيط YAP1/TEAD. يتماشى ذلك مع الدراسات السابقة التي أظهرت أن الثقافة ثلاثية الأبعاد لنماذج PDAC الفأرية يمكن أن تعزز التحول بين iCAF و myCAF.لقد لاحظنا أن الألواح المغلفة بالكولاجين تزيد من نسبة iCAF. حيث وجدنا أن YAP1 هو لاعب رئيسي في الانتقال غير المباشر من Detox-iCAF إلى Wound-myCAF ومن ثم إلى ECM-myCAF، يمكننا أن نفترض أن الانخفاض الطفيف في الصلابة في الكولاجين- قد تفضل الأطباق المطلية الحفاظ على iCAF في الثقافة. وبالتالي، تكشف هذه الدراسات، بالإضافة إلى نتائجنا، أن تجمعات FAP+ CAF يمكن أن تتحول إلى بعضها البعض اعتمادًا على السياق المكاني والبيولوجي. لقد أظهرت مجموعات iCAF و myCAF أنها مرتبطة سلبًا في عينات المرضى ومفصولة مكانيًا في الأورام عبر السرطان البشري.. عملنا الحالي يخطو خطوة إضافية في حل تجمعات FAP+ CAF من خلال تحديد التوزيع المكاني لمجموعات FAP+ iCAF و myCAF المختلفة، وقربها من أنواع الخلايا الأخرى. كشفت تحليلاتنا الوظيفية أن Detox-iCAF، الموجود بشكل أساسي في السدى بين الفصوص، يمكن أن يؤدي إلى ECM-myCAF من خلال انتقالين، أحدهما مباشر والآخر غير مباشر عبر مجموعة Wound-myCAF. من الجدير بالذكر أن ECM-myCAF تكون قريبة بشكل منهجي من خلايا السرطان، بينما تكون Wound-myCAF موجودة بعيدًا. وهذا يشير إلى أن التفاعلات الجانبية بين Detox-iCAF وخلايا السرطان قد تكون مطلوبة للانتقال المباشر، بينما قد يؤدي الإشارات الجانبية إلى تحفيز المنطقة الأكبر من Wound-myCAF. يدعم ذلك تجاربنا التي تظهر أن وسائط خلايا السرطان المحضرة تحفز Wound-myCAF من Detox-iCAF ولكن ليس من ECM-myCAF، بينما يؤدي التشارك في الثقافة مع خلايا السرطان إلى تحفيز كلا النوعين. تدعم الملاحظات في DCIS هذه الفرضية، حيث حددنا ECM-myCAF بجوار أعشاش الورم مباشرة و Wound-myCAF بعيدًا. يتم تنظيم تجمعات FAP+CAF المحددة والخلايا المناعية مكانيًا في الأورام، مما يوفر رؤى حول تنظيم المناعة الذي يتوسطه FAP+ CAF. اكتشفنا التفاعل بين مجموعات FAP+ CAF المختلفة وأنواع الخلايا المناعية، مما يعدل هوية الخلايا المناعية وحالاتها، مما يبرز ECT المسموح به مناعيًا والمثبط للمناعة في BC. لقد أظهرنا سابقًا أن TGF-يمكن تحفيز myCAF من ECMmyCAF من خلال التفاعلات مع الخلايا اللمفاوية T. من المثير للاهتمام، وجدنا أن -myCAF غنية في المواقع المليئة بالخلايا المناعية في سرطان الثدي، بما في ذلك الحافة الغازية، وحول الأوعية الدموية داخل الورم، وحول الفصوص داخل الورم. كما نحدد ECT الغنية بـ DetoxiCAF وFOLR2+ TAM وap-EC. من المعروف أن FOLR2+ TAM قريبة من الأوعية الدموية المحيطة بالورم في. تتماشى هذه الملاحظات مع جذب Detox-iCAF للوحيدات وتفعيل برنامج TAM الإيجابي لـ FOLR2. يتمركز Detox-iCAF بالقرب من الأوعية الدموية الغنية بـ ap-EC، والتي تعبر عن علامات الأوردة اللمفاوية عالية البروز المرتبطة بالورم (TAHEV)، مما يشير إلى أن Detox-iCAF قد تلعب دورًا في التواصل مع ap-EC ونضوج TA-HEV. على النقيض من Detox-iCAF، ترتبط IL-iCAF بشكل أساسي بالهياكل الظهارية الطبيعية للثدي وتوجد في السدى داخل الفصوص الغني بـ Adipo-EC، بينما IFN-iCAF مرتبطة بتجمعات اللمفاويات وغنية في سرير الورم. لاحظنا أن IL-iCAF غير قادرة على التمايز إلى ECMmyCAF، مما يشير إلى أن الخلايا العضلية الليفية التي لوحظت في سرطان الثدي قد لا تكون مشتقة أساسًا من السدى داخل الفصيص. حيث أن السدى داخل الفصيص غير موجود في الفئران.، قد يفسر هذا لماذا لا يتم اكتشاف IL-iCAF في بيانات تسلسل RNA أحادي الخلية من نماذج الفئران. علاوة على ذلك، ECMmyCAF، IFN-myCAF و TGF-myCAF تتجمع داخل الحجرة الغازية، مع ECM-myCAF و IFN-myCAF في النهاية في محيط خلايا السرطان، بينما-myCAF مرتبطة بالتسلل المناعي وتوجد عند الهامش الغازي، حول الفصوص المتسللة داخل الورم أو الأوعية الدموية. يتماشى مع ملاحظاتنا، أظهرت الأعمال السابقة أن الميوفيبروبلاستات التي تعبر عن بودوبلانين (التي تت correspond إلى ECM-myCAF و IFN-myCAF) تتواجد بكثافة عند الواجهة مع خلايا السرطان حيث كانت الألياف غير النشطة وEC مستنفدعلاوة على ذلك، ECM-myCAF و TGF-myCAF تتواجد مع TREM2 + TAM وتقوم بنشاط بتحفيز برنامج TREM2 + TAM لإنشاء منطقة مثبطة للمناعة في سرير الورم. فيما يتعلق بهذا التنظيم المكاني، يتم اكتشاف ECM-myCAF بالقرب من الخلايا اللمفاوية CD8+ T المستنفدة والخلايا اللمفاوية CD4+ T المثبطة للمناعة FOXP3+. أخيرًا، تتوزع Wound-myCAF بشكل رئيسي في داخل الورم.
الشكل 6 | التركيب الخلوي لـ BC مرتبط بغزو الورم. A-D، H بيانات من مجموعة INVADE (مرضى سرطان الثدي)، بما في ذلك آفات سرطان القنوات اللبنية (DCIS) ( )، DCIS المجهري الغازي (MI-DCIS) (أي آفات DCIS مع بؤر غازية لا تتجاوز وسرطان الثدي الغازي (IBC) ). رسم بياني يوضح مؤشر شانون من نسب أنواع الخلايا في عينات DCIS و MI-DCIS و IBC.قيمة من اختبار مان-ويتني. رسوم بيانية بار تظهر التركيب النسبي للخلايا الظهارية، الخلايا الداعمة، الخلايا البطانية وخلايا المناعة لكل مريض (يسار) ووفقًا لحالة غزو سرطان الثدي (يمين).قيمة من اختبار كاي تربيع. ج. مخططات الصندوق لنسب الخلايا النسبية من FAP+CAF، CAP، الخلايا البطانية، الخلايا النخاعية والخلايا اللمفاوية في عينات DCIS وMI-DCIS وIBC.قيم من اختبار مان-ويتني. تظهر الرسوم البيانية D Bar النسب النسبية للتجمعات بين خلايا FAP+CAF وCAP والخلايا البطانية والخلايا النخاعية والخلايا اللمفاوية في عينات DCIS وMI-DCIS وIBC.قيم من اختبار فيشر الدقيق. الاتصالات من خلايا السرطان إلى Detox-iCAF التي تتوسطها TGF-تفاعل TGFBR 2 في الفضاء على قسم واحد. نقاط ملونة تمثل الخلايا من نوع معين تعبر إما عن مستقبل Detox-iCAF (باللون الأصفر) أو عن ligand لخلايا السرطان (باللون الأحمر). تبرز الأسهم الخلايا القريبة بما يكفي للتواصل من خلال ligand-المستقبل المحدد، كما تم استنتاجه بواسطة SpaTalk. شبكة من المسارات السفلية التي تم تنظيمها في Detox-iCAF بعد TGF.تفاعل 2TGFBR2 في القسم الموضح في (E) تم استنتاجه باستخدام الأطلس. يسار، وفرة خلايا السرطان في كل نقطة من قسم DCIS تم استنتاجها بواسطة فك التشفير. يمين، اختيار يدوي من قبل طبيب الأمراض النسيجية لنقاط في اتصال مباشر مع النقاط الغنية بخلايا السرطان (بالأحمر)؛ النقاط الأخرى البعيدة عن خلايا السرطان باللون الرمادي.رسم بياني عمودي يوضح النسب النسبية لمجموعات FAP+ CAF (المقيمة من خلال التحليل التفكيكي) في النقاط المحيطة مباشرة بالنقاط الغنية بخلايا السرطان (نقطة حمراء) مقارنة بالنقاط الأخرى (نقطة رمادية) في قسم DCIS. القيمة من اختبار فيشر الدقيق. في جميع الرسوم البيانية الصندوقية، تشير الخط المركزي وحدود الصندوق والشعيرات إلى الوسيط والرباعيات العليا والسفلى ونطاق الربيع الداخلي. يتم توفير بيانات المصدر كملف بيانات المصدر. الستروما، أبعد عن خلايا السرطان من أي مجموعات myCAF أخرى. بشكل جماعي، فإن التوزيع المكاني لجميع تجمعات FAP+ CAF متوافق مع مرونتها وتواصلها مع خلايا السرطان أو المناعة، ويكشف عن ECT المسموح به من قبل FAP+ CAF والمثبط للمناعة (انظر النموذج، الشكل 8). ومع ذلك، فإن غياب الألياف العادية في بيانات النسخ الجيني أحادي الخلية من BC – ربما بسبب العدد المحدود من الخلايا التي يمكن أخذ عينات منها – هو قيد في التحليل النسخي المكاني الذي يجب معالجته في الأعمال المستقبلية. سيساهم ذلك في فهم أفضل للعلاقة المكانية وتأثيراتها على مرونة تواصل Detox-iCAF والألياف العادية.
تظهر الملاحظات الأخيرة أن تقدم سرطان الثدي يتطلب كل من الميل الغازي لخلايا سرطان القنوات اللبنية غير الغازية وسموحة النسيج الداعم.. نتائجنا حول السدى تتماشى مع هذه الاكتشافات ولكنها تتقدم خطوة إلى الأمام من خلال إظهار دور مجموعات محددة من FAP+ CAF في الانتقال بين DCIS وIBC. في الواقع، وجدنا أن حالات سرطان الثدي الغازية كانت مرتبطة بشكل كبير بتراكم مجموعات محددة من FAP+CAF. يتم إثراء Detox-iCAF في DCIS ولكن نسبتهم تنخفض في MI-DCIS بينما تزداد مستويات IL-iCAF. على النقيض من ذلك، تتراكم IBC ECM-myCAF وIFN.-myCAF. قد يكون المحتوى المنخفض من ECM-myCAF في DCIS مرتبطًا بالهيكل المكاني لـ DCIS، الذي يقيد توطين خلايا السرطان وقد يحافظ على ECM-myCAF بشكل صارم عند محيط القنوات. من المثير للاهتمام، أننا اكتشفنا أن مستويات Detox-iCAF و TGF -myCAF عند التشخيص هي عوامل تنبؤية مستقلة للتقدم من DCIS إلى IBC. لقد أظهرنا سابقًا أن خلايا T يمكن أن تحفز الانتقال من ECM-myCAF إلى TGF -myCAF ، قد يفسر هذا لماذا تعتبر اللمفاويات T الموجودة عند الغشاء القاعدي القنوي، إلى حد ما، تنبؤية لحدوث تكرار أقصر في DCIS . تطوير علاجات تستهدف ECM-myCAF و TGF -myCAF و IFN -myCAF واستعادتها إلى حالة Detox-iCAF (أو ربما حالة شبيهة بالطبيعية) قد يكون وسيلة لتحسين بقاء المرضى. تبرز أهمية استراتيجيات علاجية بديلة تمنع تمايز ECM-myCAF، بدلاً من استنفادها، من خلال حقيقة أنها يمكن أن تعود بسرعة بعد استنفاد ECM-myCAF . تسلط نتائجنا الضوء على طريق واعد لتطوير استراتيجيات علاجية. في الواقع، تشير بياناتنا إلى أن العلاج المشترك الذي يستهدف كل من DPP4 و YAP1 في FAP+ CAF قد يكون ضروريًا لقمع ظهور مجموعات ECM-myCAF المناعية المثبطة و TGF -myCAF وبالتالي تحسين الاستجابة للعلاج المناعي في مرضى BC. قد تكون هذه المقاربة العلاجية مفيدة أيضًا في سياق أورام DCIS ذات المخاطر العالية للتقدم الغازي عند العلاج القياسي، التي حددنا أنها تعاني من استنفاد في Detox-iCAF وثراء في TGF -myCAF. وبالتالي، فإن منع الانتقال من DetoxiCAF إلى ECM- و TGF -myCAF قد يفيد هؤلاء المرضى بشكل خاص من خلال منع التقدم. بالإضافة إلى ذلك، قد يساعد تقييم محتوى Detox-iCAF و TGF -myCAF في DCIS عند وقت التشخيص في تحديد المرضى ذوي المخاطر المنخفضة من DCIS، وهو ما يزال غير مرضٍ باستخدام معايير الهيستوباثولوجيا القياسية. وبالتالي، يمكن أن تمهد نتائجنا الطريق لعلاج أكثر كفاءة وأمانًا في
خفض التصعيد في DCIS. أخيرًا، تم تحديد FAP كهدف جذاب لعلاج CAR-T بسبب دوره في تشكيل TME المثبط للمناعة، وهو عقبة رئيسية في علاج الأورام الصلبة. من خلال استهداف FAP+ CAF، يمكن لخلايا CAR-T تعطيل جيوب الأورام المثبطة للمناعة، مما يعزز في النهاية فعالية العلاج المناعي. ومع ذلك، فإن FAP+ CAF متغايرة للغاية وجزء من شبكة معقدة داخل TME. كما نوضح هنا، فإنها تساهم أيضًا في تشكيل جيوب حماية مناعية، مثل تلك المكونة من FAP+ Detox-iCAF و FOLR2+ TAM. وبالتالي، فإن التركيز الوحيد على القضاء على FAP+CAF قد يعطل عن غير قصد هذه الآليات الواقية ويعيق التأثير المناعي المقصود. في الختام، يتيح لنا دمج بيانات متعددة الأوميات في سياق مكاني تقديم أدلة حول هوية FAP+ CAF، وكيف تتغير حالة خلايا CAF المعينة بناءً على خلاياها المجاورة. من خلال فك تشفير النسخ الجزيئي المكاني، قمنا بتوصيف جيوب خلوية مختلفة تتكون من مجموعات FAP+ CAF محددة، مرتبطة بخلايا مناعية واقية أو مثبطة، غنية إما في الخلايا البطانية أو خلايا السرطان. وبالتالي، توفر دراستنا أطلسًا شاملًا محددًا مكانيًا لهياكل سكان FAP+ CAF في BC.
طرق
مجموعات مرضى BC: الشمول والأخلاقيات
تستند الدراسة المطورة هنا إلى عينات مأخوذة من بقايا جراحية متاحة بعد التحليلات الهيستوباثولوجية وغير المطلوبة للتشخيص. لا يوجد تداخل مع الممارسة السريرية. تم إجراء تحليل عينات الورم وفقًا للقانون الوطني المعني ومع الإرشادات الأخلاقية المعترف بها (إعلان هلسنكي) بشأن حماية الأشخاص المشاركين في البحث البيولوجي. تم إبلاغ جميع المرضى المصابين بـ BC الذين تم إدخالهم إلى معهد كوري بكتيب ترحيبي يوضح أن عيناتهم قد تُستخدم لأغراض البحث. وبالتالي، تم إبلاغ جميع المرضى الذين تم تضمينهم في دراستنا من قبل أطبائهم المعالجين بأن العينات البيولوجية التي تم جمعها من خلال الممارسة السريرية القياسية يمكن استخدامها لأغراض البحث وقد أعطوا موافقتهم المستنيرة. في حالة رفض المريض، الذي يمكن أن يتم التعبير عنه شفهيًا أو كتابيًا، لم يتم تضمين عينات الورم المتبقية في دراستنا. تم الموافقة على الإجراءات التجريبية البشرية لتحليل الميكروبيئة الورمية من قبل مجلس المراجعة المؤسسية ولجنة الأخلاقيات لمجموعة مستشفى معهد كوري (الموافقة 12 فبراير 2014) و CNIL (اللجنة الوطنية للمعلومات والحريات، رقم الموافقة: 1674356 الممنوحة 30 مارس 2013). مركز الموارد البيولوجية (BRC) هو جزء من قسم علم الأمراض في قسم الطب التشخيصي والعلاج الذي ترأسه الدكتورة أ. فينسنت-سالومون. BRC مخول بتخزين وإدارة العينات البيولوجية البشرية وفقًا للتشريعات الفرنسية. وقد أعلن BRC عن مجموعات عينات محددة يتم زيادتها باستمرار عند الحصول على استمارات موافقة المرضى (رقم الإعلان: DC-2008-57). يتبع BRC جميع القواعد الأخلاقية الوطنية والدولية المطلوبة حاليًا، بما في ذلك إعلان هلسنكي. كما تم اعتماد BRC من قبل AFNOR NFS-96-900 الجودة
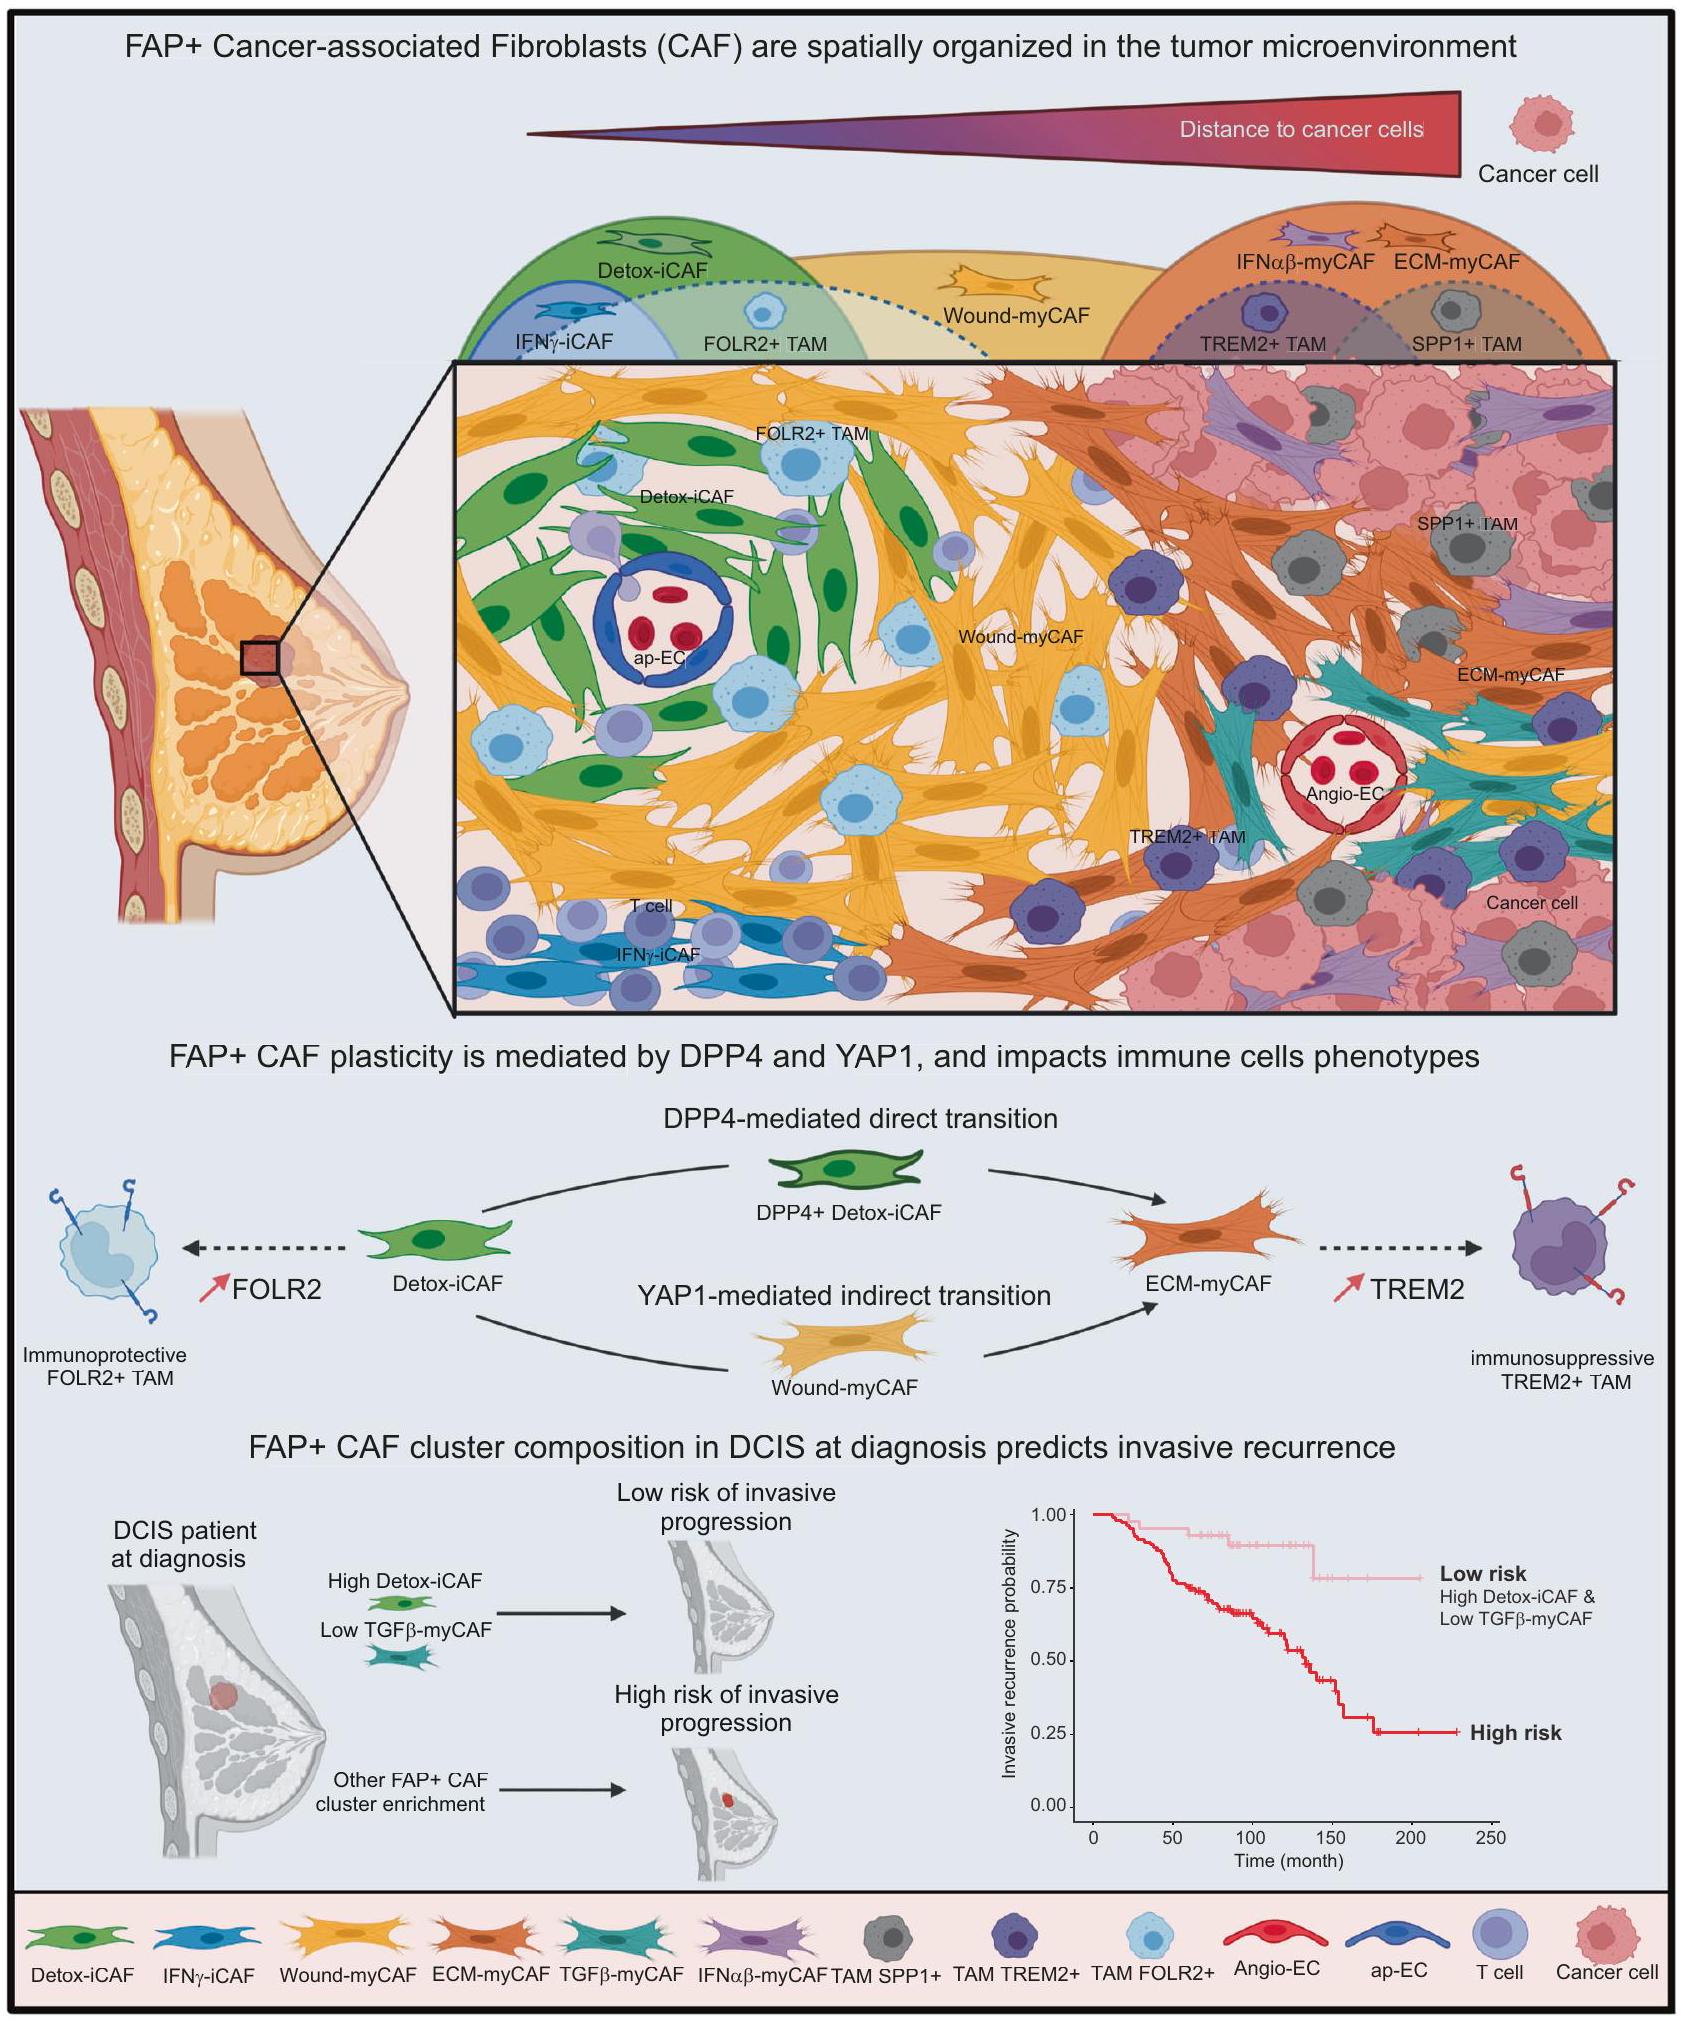
الشكل 8 | نموذج تخطيطي. تشكل تغايرية ومرونة CAF تنظيمًا هيكليًا للميكروبيئة الورمية في BC. في هذه الورقة، نصف التنظيم المكاني والمرونة والتفاعلات لمجموعات FAP+ CAF مع الخلايا المجاورة من خلال دمج تحليل بيانات الخلايا الفردية، النسخ الجزيئي المكاني والاختبارات الوظيفية. نحدد أنواع EcoCellTypes الخلوية المنظمة مكانيًا، والتي تقع بدقة داخل الأورام وتتكون من مجموعات FAP+ myCAF أو iCAF محددة. تؤدي المسافات إلى خلايا السرطان إلى تحفيز تدرج هويات مجموعات FAP+CAF. توجد Detox-iCAF حول الأوعية الدموية المكونة من ap-EC وقريبة من FOLR2+ TAM. تعمل Detox-iCAF كخزان ويمكن أن تعطي نشوء ECM-myCAF في وجود خلايا السرطان، إما بشكل مباشر أو غير مباشر من خلال مجموعة Wound-myCAF، من خلال آليات تعتمد على DPP4-
و YAP1/TEAD. تتوضع ECM-myCAF بالقرب من خلايا الورم، حيث يمكن أن تصل إلى نمط ظاهري TGF -myCAF في وجود اللمفاويات T. بالإضافة إلى ذلك، توجد TAM محددة في أراضٍ غنية بمجموعات FAP+ CAF مختلفة. بينما تكون FOLR2+ TAM قريبة من Detox-iCAF، فإن TREM2+ و SPP1+ TAM غنية في ECM-myCAF و IFN -myCAF و TGF -myCAF. تظهر بياناتنا أن التنظيم المكاني في أورام BC مرتبط بالتفاعلات المتبادلة لمجموعات FAP+ CAF مع خلايا السرطان والمناعة في مجالات مكانية محددة. من المهم، أننا نحدد أن المحتوى في Detox-iCAF و -myCAF عند تشخيص DCIS هو عامل تنبؤي لتكرار DCIS إلى سرطان الثدي الغازي. تم إنشاء الشكل باستخدام Biorender.com.
التسمية (مجددة وصالحة حاليًا حتى 2021). جميع العينات مجهولة الهوية عند وصولها من BRC إلى المختبر. بالإضافة إلى ذلك، تم الإعلان عن مجموعات BRC إلى CNIL (رقم الموافقة 1487390 الممنوحة في 28 فبراير 2011).
مجموعات BC المستقبلية. في هذه الدراسة، تم تعريف الأورام اللمعية (Lum) بناءً على صبغة المناعية (IHC) لمستقبلات الاستروجين والبروجستيرون (ER و PR). كانت القيمة الحدية المستخدمة لتعريف إيجابية مستقبلات الهرمونات هي من الخلايا الملونة. تم تمييز أورام Luminal A و Luminal B بناءً على مؤشر التكاثر (صبغة Ki67) مع تعريف Lum A كـ و Lum B مع Ki67 . تم تحديد الأورام الإيجابية HER2 بعد صبغة ERBB2 باستخدام إرشادات الجمعية الأمريكية لعلم الأورام السريري. تم تعريف النمط الظاهري TN على النحو التالي: ER- PR- ERBB2-. تتكون المجموعة المستقبلية 1 من 84 عينة BC طازجة قبل العلاج وتشمل Lum A ( ) و Lum B ( ) و HER2 ( ) و TN ( ). تم تحليل العينات بواسطة تحليل تدفق الخلايا لتوصيف مجموعات FAP+ CAF وتحت مجموعات خلايا المناعة. تتكون المجموعة المستقبلية 2 من 16 عينة BC طازجة قبل العلاج وتشمل Lum A ( ) و Lum B ( ) و HER2 ( تم جمع العينات وزراعتها في المختبر لعزل خطوط خلايا CAF الإيجابية لـ FAP الأولية. يتم وصف البيانات السريرية لهذين المجموعتين المحتملتين في الجدول التكميلي 1.
مجموعة INVADE. مجموعة INVADE هي سلسلة استعادية تضم 55 مريضًا، تم علاجهم في معهد كوري بين عامي 1992 و2014، وخضعوا لعملية جراحية بسبب سرطان الثدي قبل أي علاج. تشمل هذه المجموعة 18 حالة من حالات DCIS النقية، و17 حالة من حالات MI-DCIS (آفات DCIS مع بؤر غازية بحد أقصى 1 مم) و20 حالة من حالات IBC الأولية. تم جمع موافقات مستنيرة من المرضى لاستخدام الأنسجة لأغراض البحث، وتم الحصول على موافقة أخلاقية من مجلس المراجعة المؤسسية (مجموعة دراسة سرطان الثدي في معهد كوري) لاستخدام جميع العينات. تم إخفاء هوية جميع العينات قبل التحليل. تم وصف البيانات السريرية والمرضية الكاملة للسلسلة في الجدول التكميلي 2. تم إجراء مراجعة نسيجية للحالات وفقًا للمعايير الحالية من قبل خبراء في علم الأمراض الثديية. تم إجراء تقييم مناعي كيميائي لحالة ER وPR وHER2 وفقًا لتوصيات ASCO/CAP.تم تحديد الفئة الهيستومولكولية بناءً على IHC ومؤشر التكاثرتم الحصول على البيانات السريرية حول العلاج من السجلات الطبية الإلكترونية لمعهد كوري.
تحليل تفاضلي بين الخلايا الليفية من أنسجة الثدي السليمة وDetox-iCAF من سرطان الثدي
الجينات المعبر عنها بشكل مختلف بين الخلايا الليفية المعزولة من أنسجة الثدي السليمةوDetox-iCAF من سرطان الثديتم الحصول عليها باستخدام دالة FindMarkers من حزمة Seurat في R. للتحقق من النتيجة التي تم الحصول عليها ولأخذ تضخم حجم العينة في بيانات scRNA-seq في الاعتبار، تم أيضًا تجميع العد على مستوى الخلايا على مستوى العينة بعد إعادة البناء الزائف باستخدام حزمة muscat في R.تم الحصول على الجينات المعبر عنها بشكل مختلف على مستوى البسودو-بلوك باستخدام حزمة DESeq2 في R.
استنتاج المسار على بيانات تسلسل RNA أحادي الخلية
مسارات الخلايا المفردة على مجموعة بيانات CAF FAP+ البشريةتم حسابها باستخدام شجرة PAGA كما هو مُنفذ في حزمة R dyno الإصدار 0.1.1https://github.com/dynverse/dyno) مع وظيفة infertrajectory التي تزود مجموعة البيانات العادية التي تحتوي على 2000 من أكثر الجينات تغيرًا. بالنسبة لخطوة تقليل العينة، تم إجراء 10 تكرارات باستخدام عشوائيًا من إجمالي مجموعة بيانات FAP+CAF. كما استخدمنا طريقة Elpigraph المعتمدة على STREAM الإصدار 0.4.1بالنسبة لـ STREAM، تم تنفيذ خطوة تصفية الجينات باستخدام دالة تصفية الجينات مع تعيين المعامل min_num_cell إلى 5، تلتها خطوة اختيار الجينات المتغيرة باستخدام select_variable_genes والمعامل loess_frac المعين إلى 0.01. تم إعادة حساب UMAP ثلاثي الأبعاد باستخدام خفض الأبعاد. تم تهيئة هيكل الشجرة الأولي مع تعيين n_cluster إلى 10 وتم الحصول على الرسم البياني الرئيسي المرن عن طريق تعيين epg_alpha إلى 0.015 و epg_mu إلى 0.2 و epg_lambda إلى 0.02. رسم مسار Monocle3 (https://cole-trapnell-lab.github.io/تم إنتاج monocle3/) باستخدام دالة learn graph ورسمه باستخدام plot_cells مع المعلمات الافتراضية. تم تعيين جذر الوقت الزائف في مجموعة Pl16+ Detox-iCAF.
سرعة RNA
تم إجراء تحليلات سرعة FAP+CAF باستخدام حزم بايثون velocytohttp://velocyto.org) وإصدار scVelo 0.2.4 (https://scvelo. readthedocs.io/“). نظرًا لأن scVelo لا يصحح تأثير الدفعة، لم يكن من الممكن تطبيق هذه الطريقة بدقة على العينات المدمجة. لذلك، تم إجراء التحليل على بيانات تسلسل RNA أحادي الخلية (scRNA-seq) من خلايا CAF الإيجابية لفئة BC البشرية.من العينة التي تظهر أعلى مؤشر شانون فيما يتعلق بتمثيل مجموعة FAP+ CAF، كما تم تحديده بواسطة دالة التنوع من حزمة vegan. تم الحصول على ملفات Loom التي تحتوي على العدادات الخام المقطعة وغير المقطعة من كل ملف bam عن طريق تشغيل خط أنابيب سطر الأوامر velocyto مع المعلمات الافتراضية باستخدام الجينوم المرجعي البشري GRCh38. تم تطبيق scVelo على كل ملف Loom. تم تصفية البيانات وتطبيعها باستخدام filter_and_normalize باستخدام أعلى 2000 جين متغير وتم حساب اللحظات الأولى والثانية مع 30 مكونًا رئيسيًا (PC) و30 جارة. تم الحصول على الحل للنموذج الديناميكي الكامل عن طريق تشغيل كل من recover_dynamics وvelocity مع تعيين الوضع إلى الديناميكي.
توقيعات الجينات
تتكون توقيع جينات الهدف YAP1/TEAD من الجينات التالية التي تم تحديدها في الأدبيات على أنها مرتفعة التنظيم بواسطة YAP1/TEAD: ABHD2، BCAR4، BDNF، CHST3، CTGF، CYR61، DAB2، FMN2، FRY، GGH، GJA5، ITGB2، LHFP، LIFR، MFAP5، OLR1، PARVA، PDGFRL، PMP22، PRR16، PRSS23، PTGS2، PXDN، RASAL2، SCARA3، SMARCA1، SPARC، SPRED1، STXBP6.
تحليل نشاط عوامل النسخ
تم استخدام حزم R VIPER v1.32 و DoRothEA v1.10 لإجراء تحليل نشاط عوامل النسختم تضمين فقط الأنظمة التنظيمية ذات مستوى الثقة العالي (A وB وC) في التحليل. تم تحديد الأنظمة التنظيمية الغنية في كل مجموعة من مجموعات FAP+ CAF باستخدام وظيفة FindAllMarkers في Seurat. لتحديد عوامل النسخ المتورطة بشكل خاص في الانتقال المباشر مقابل غير المباشر، استعدنا أفضل عوامل النسخ التي أظهرت درجة متوسطة أعلى في الانتقال غير المباشر مقارنةً بكل من الانتقال المباشر والخلايا الأخرى. تم استخدام نهج مشابه لـ و مجموعات بيانات نموذج الفأر ذات متوسط درجة أعلى في Wound-myCAF مقارنة بـ Detox-iCAF و ECM-myCAF.
بناء أطلس مرجعي لسرطان الثدي
مراقبة الجودة والمعالجة. من أجل بناء أطلس BC، استعدنا 3 مجموعات بيانات scRNA-seq المعالجة المتاحة للجمهور.بدءًا من مصفوفات العد المصفاة المتاحة والتعليقات التوضيحية الأولية للخلايا من المؤلفين، قمنا بإعادة معالجة كل نوع من الخلايا بشكل فردي باستخدام حزمة R Seurat.. لبيانات من تم استرجاع عينات غير معالجة، وتم تصفية الخلايا ذات الجودة المنخفضة بناءً على توزيع QC الخاص بكل نوع من الخلايا. تم تطبيع البيانات الخاصة بكل نوع من الخلايا باستخدام اللوغاريتم الطبيعي وتمت معالجتها بالمعايير الافتراضية، ما لم يُذكر خلاف ذلك. بالنسبة لخلايا السرطان، والخلايا الليفية، والخلايا البطانية، وخلايا الصارية، احتفظنا بالخلايا التي تم الكشف عن أكثر من 1000 ميزة. بالنسبة لخلايا T، احتفظنا بالخلايا التي تم الكشف عن أقل من 3000 ميزة ولديها أكثر من 500 عد. بالنسبة لخلايا B، احتفظنا بالخلايا التي تم الكشف عن أكثر من 1000 ميزة وأقل من 20,000 عد. بالنسبة لمجموعة بيانات بال وآخرون.الخلايا من عينات صحية قبل انقطاع الطمث تحتوي على أكثر من 750 ميزة، أقل من 4000 ونسبة من النسخ الميتوكوندرية أقل منتم الحفاظ عليها. ثم تم استخراج الخلايا الليفية الطبيعية باستخدام تعبير الفيمنتين (VIM). في مجموعة بيانات وو وآخرون،
تم الاحتفاظ بخلايا T التي تم توضيحها من قبل المؤلفين لتحليلنا. تم معالجة الخلايا النخاعية بدقة تجميع تبلغ 0.3، وتم استبعاد مجموعتين تتميزان بعدد ميزات منخفض. تم توسيع الخلايا النخاعية بناءً على معرف المريض ومتغيرات nCount_RNA. في هذه الخطوة، تم توضيح جميع مجموعات البيانات (التي تحلل كل نوع من الخلايا) بشكل منفصل (انظر أدناه #”توضيح نوع الخلية”). ثم تم دمج جميع كائنات Seurat التي تم الحصول عليها، وتم تطبيعها لوغاريتمياً وتوسيعها. تم حساب تحليل المكونات الرئيسية (PCA) على 2500 من الجينات الأكثر تباينًا، وتم إنشاء UMAP على أول 30 مكونًا من PCA.
تسمية نوع الخلية. تقليل الأبعاد وتجمع لوفيان (دقة 0.3-0.5) يتبعه إما تسمية قائمة على العلامات أو نقل التسمية.تم استخدامها لوصف نوع الخلايا المختلفة. تم تحديد الخلايا الظهارية الطبيعية والخلايا العضلية الظهارية بين مجموعات EPCAM+ المشتركة بين المرضى استنادًا إلى تعبير TP63 وKIT، على التوالي، بينما كانت مجموعات خلايا السرطان خاصة بالمرضى بسبب إعادة ترتيب الجينوم الفريدة، كما هو متوقع. تم إنشاء ملفات تعريف CNV لتأكيد النمط الظاهري غير الورمي لأنواع الخلايا، مثل CAF، باستخدام InferCNV (انظر قسم “الترانسكريبتوميات المكانية”؛ “InferCNV على بيانات scRNA-seq والترانسكريبتوميات المكانية”). بالنسبة لوصف CAF، استخدمنا نقل العلامات من مجموعات بيانات FAP+ CAF وCAP الداخلية. تم تجميع الخلايا الليفية الطبيعية باستخدام خوارزمية لوفيان عند دقة 0.2 وتم وصفها استنادًا إلى تعبير PI16 وDermatopontin (DPT). وبالمثل، تم تجميع الخلايا البطانية عند دقة 0.2 وتم وصفها استنادًا إلى تحليل إثراء وظيفي باستخدام Enrich.للوصف الخاص بخلايا T، قمنا بدمج خلايا T من باستخدام FastMNN. تم الحصول على أوصاف خلايا T النهائية من خلال دمج نقل العلامات من ، والعلامات الكانونية وتجميع لوفيان عند دقة 0.7. تم الاحتفاظ فقط بخلايا T من BC في الأطلس لمزيد من التحليل. تم تجميع الخلايا النخاعية عند دقة 0.4 وتم معالجة المجموعة 0 وإعادة تجميعها عند دقة 0.5 لزيادة الدقة. أخيرًا، تم وصف المجموعات التي تم الحصول عليها استنادًا إلى الأدبيات تم وصف خلايا B، وخلايا البلازما، وخلايا الصارية استنادًا إلى تعبير MS4A1 وMZB1 وKIT، على التوالي. بالنسبة للتفكيك، تمت إزالة مجموعة الخلايا الدائرية لتجنب التعرف المتبادل بين الخلايا الطبيعية الدائرية وخلايا السرطان. استنادًا إلى كل هذه الأوصاف، حددنا مجموعات خلايا ليفية دقيقة، بما في ذلك 7 مجموعات FAP+CAF: Detox-iCAF، IL-iCAF، IFN iCAF، Wound-myCAF، ECM-myCAF، TGF -myCAF، IFN -myCAF؛ 3 مجموعات CAP: Contractile-CAP، ECM-CAP، Ag-CAP (CAP معالجة المستضد) و2 مجموعات خلايا ليفية طبيعية: PI16+ خلايا ليفية عالمية وPI16- خلايا ليفية. كما حددنا مجموعات مختلفة من الخلايا النخاعية، بما في ذلك 3 مجموعات من البلعميات المرتبطة بالورم APOE+ (TAM) (TREM2+ TAM؛ SPP1+ TAM؛ FOLR2+ TAM) وCXCL10+ البلعميات (Mac)، و4 مجموعات من خلايا التغصن (DC): DC مشتقة من وحيدات (Mo-DC)، CLECL9A+ DC تقليدية من النوع 1 (CLECL9A+ cDC1)، CCR7+ LAMP3+ IL3RA- DC (DCreg)، CLEC4C+ IL3RA+ DC بلازمي (pDC)؛ مجموعة واحدة من وحيدات S100A12+ (S100A12+Mo)؛ ومجموعة واحدة من خلايا الصارية (KIT+). من المثير للاهتمام، أن S100A12+ Mo وCXCL10+ البلعميات كانت من بين تجمعات الخلايا التي تعبر عن توقيع الجين الأكثر من خلايا مثبطة مشتقة من النخاع تم تعريف مجموعات اللمفاويات T كما يلي: 3 مجموعات CD8+: خلايا T CD8+ سابقة XCL1+ (XCL1+CD8+)، خلايا T CD8+ انتقالية GZMK+ (GZMK+CD8+)، خلايا T CD8+ متمايزة GZMH+ (GZMH+ CD8+)؛ 3 مجموعات CD4+: خلايا T CD4+ ذاكرة CD69+ (CD69+CD4+)، خلايا T CD4+ ساذجة SELL+ (SELL+ CD4+)، TNFRSF18+ خلايا T مساعدة جريبية (TNFRSF18+ CD4+ Tfh) وFOXP3+ خلايا Treg CD4+. تم تحديد مجموعتين NK أيضًا: NK سامة CD16+ GZMB+ (CD16+ NK) وNK مناعية CD16-NKG2A+/KLRC1+ (NKG2A+NKreg). كما حددنا مجموعتين من خلايا B اللمفاوية: اللمفاويات B وخلايا البلازما و3 مجموعات من خلايا البطانية (EC): EC تقديم المستضد ACKR1+ (ap-EC)، والتي قد تت correspond إلى الأوردة الوعائية عالية البطانية المرتبطة بالورم استنادًا إلى الأدبيات السابقة CXCL12+ VEGFC+ EC الت angiogenesis (Angio-EC) وCD36+ EC المرتبطة بتكوين الدهون (Adipo-EC)، كما تم تحديدها في دراسة حديثة أخيرًا، اكتشفنا 3 مجموعات ظهارية:
خلايا السرطان، خلايا الظهارة الطبيعية وخلايا العضلات الظهارية، استنادًا إلى تعبير العلامات وملف تعريف InferCNV. للتحقق من أن أطلس BC الخاص بنا يعيد تجميع جميع أنواع الخلايا من TME التي تم وصفها سابقًا، استعدنا مجموعتين مستقلتين من بيانات scRNAseq ، والتي لم تستخدم في بناء الأطلس (باستثناء خلايا T من ). ثم استخدمنا نقل العلامات من أطلس BC الخاص بنا كمرجع لوصف كل الخلايا من المجموعتين وولدنا مصفوفة ارتباك باستخدام حزمة pheatmap.
الترانسكريبتوميات المكانية
تحضير العينة. تم اختيار سبع عينات BC المجمدة استنادًا إلى هيكل الأنسجة وجودة RNA (RIN > 8). تم استخدام “شريحة تحسين الأنسجة المكانية و مجموعة المواد الكيميائية” (10X Genomics؛ #PN-1000193) بعد ذلك لتحسين ظروف النفاذية لأنسجة BC. باختصار، تم تثبيت الأقسام، وصبغها ثم تم نفاذها في نقاط زمنية مختلفة لالتقاط mRNA، وتم إجراء النسخ العكسي لتوليد cDNA مع علامة فلورية. تم اختيار وقت النفاذية الذي نتج عنه أعلى إشارة فلورية مع أقل انتشار خلفية. كان أفضل وقت نفاذية لأنسجة BC هو 18 دقيقة. تم قطع أقسام الكريوستات بسمك وتم وضعها على شرائح تعبير الجينات المكانية Visium (10X Genomics، PN-1000184). تم حاضنة الشريحة لمدة دقيقة واحدة عند ، ثم تم تثبيتها بالميثانول لمدة 30 دقيقة عند تلاها صبغ هيماتوكسيلين وإيوزين (H&E) وتم التقاط الصور تحت ميكروسكوب عالي الدقة. بعد التصوير، تم فصل الغطاء عن طريق holding الشريحة في الماء وتم تركيب الشريحة في كاسيت شريحة بلاستيكية. تم تنفيذ عملية تعبير الجينات المكانية، بما في ذلك نفاذية الأنسجة، وتخليق الشريط الثاني، وتكبير cDNA، وفقًا لتعليمات الشركة المصنعة (10X Genomics؛ #CG000239). تم تقييم جودة cDNA بعد ذلك باستخدام مجموعة Agilent عالية الحساسية للحمض النووي (Agilent، #5067-4626). تم بناء مكتبات الجينات المكانية باستخدام مجموعة بناء مكتبة Visium Spatial (10X Genomics، PN-1000184). تم استرداد بيانات الترانسكريبتوميات المكانية العامة المعالجة من موقع 10X Genomics (https://support.10xgenomics.com/spatial-gene-expression/datasets) ومن دراسة سابقة .
معالجة البيانات المكانية. باستخدام برنامج SpaceRanger v1.2.2 (10x Genomics)، تم فصل ملفات استدعاء القاعدة الخام (BCL) المكانية وتمت مطابقتها مع الجينوم المرجعي GRCh38. تم تنفيذ محاذاة أنماط بقع الشريحة المشفرة واختيار البقع في الأنسجة باستخدام Loupe Browser من 10x Genomics. تم معالجة مصفوفات العد الناتجة في Seurat v4.1.0 لـ التطبيع، والتوسيع، وتقليل الأبعاد.
التفكيك المكاني. تم إجراء التفكيك للأقسام المكانية باستخدام حزمة cell2location الإصدار المنفذة في Python3. تم استخدام أطلس BC الموصوف أعلاه لتقدير توقيعات أنواع الخلايا المرجعية باستخدام RegressionModel مع categorical_covariate_keys تم تعيينها إلى معرف المريض، وتم تعيين المعلمات الأخرى إلى القيم الافتراضية. لتجنب أي تحيز أثناء التفكيك المكاني لأنسجة BC، تم الاحتفاظ فقط بالخلايا من عينات الورم وليس الخلايا من جراحة تقليل الثدي لمجموع إجمالي من 37 نوعًا مختلفًا من الخلايا والحالات. تم الاحتفاظ بخلايا سرطان الثدي اللمعية للتفكيك. بالنسبة للتخطيط المكاني لأنواع الخلايا المختلفة، قدمنا كل قسم Visium بشكل فردي وضبطنا المعلمات الفائقة N_cells_per_location إلى 15 بعد الفحص اليدوي للشرائح وdetection_alpha إلى 200. قمنا بتعيين عدد العصور إلى 30,000. للتصور والتحليل اللاحق، قمنا بتجزئة مصفوفة q05_cell_abundance_w_sf من تفكيك cell2location عن طريق تقريب القيم لأعلى لكل نوع خلية، أو لأسفل لخلايا السرطان، استنادًا إلى أنواع الخلايا القابلة للتعرف بالميكروسكوب وأعداد الخلايا الملاحظة، كما تم تقييمها بواسطة طبيب الأمراض. تم رسم كل خلية مستنتجة باستخدام وظيفة مخصصة مشتقة من Seurat SpatialDimPlot، حيث تم تمثيل كل خلية كنقطة مليئة بلون يمثل نوع الخلية المقابل واهتزاز بمقدار 40 ميكرومتر داخل البقعة المكانية لتجنب التداخل.
للتفكيك باستخدام SpatialDWLS ، استخدمنا وظيفة runDWLSDeconv مع المعلمات الافتراضية المنفذة في Giotto. بالنسبة لـ RCTD , قمنا أولاً بإنشاء كائن RCTD وقمنا بفك تشفير القسم باستخدام دالة run.RCTD مع وضع وضع الازدواج على متعدد. من أجل تقدير تجمعات الخلايا في الحجرة المرضية، قمنا أولاً بجمع جميع الأقسام معًا وقمنا بتقدير عدد الخلايا في كل حجرة بشكل مستقل عن قسم الأصل وأجرينا اختبار فيشر بين تجمعات الخلايا بين أنواع الخلايا. ثم استخرجنا الحجرة المعنية من الأقسام وحسبنا النسب لكل قسم من تجمعات الخلايا بين نوع معين من الخلايا لكل حجرة. أنشأنا خريطة حرارية تعرض النسبة المتوسطة عبر القسم من نسبة كل تجمع خلوي. طبقنا اختبار ويلكوكسون واحد مقابل الكل لتقييم الثراء في حجرة مرضية لتجمع خلوي معين.
تحديد النيتش وECT
لتحديد مجموعات من أنواع الخلايا المتشابهة التي تتواجد معًا عبر أقسام BC التي تم تحليلها بواسطة Visium، قمنا بدمج مخرجات فك تشفير cell2location (q05_cell_abundance_w_sf) لكل قسم، وتحويل النسب المقدرة لأنواع الخلايا إلى نسب لوغاريتمية متساوية وخلق رسم بياني متوازن باستخدام دالة bbknn المطبقة في Scanpy (https://scanpy.readthedocs.io) مع المعلمات الافتراضية. لتحديد النقاط المكونة من أنواع خلايا مشابهة، طبقنا تجميع Leiden بدقة 0.6 على الرسم البياني الناتج. ثم حسبنا متوسط تكوين نوع الخلايا لكل مجموعة (تسمى النيتشات) وأنشأنا خريطة حرارية باستخدام حزمة pheatmap R. تم تطبيق تجميع هرمي على الصفوف (أنواع الخلايا والحالات) والأعمدة (النيتشات) أخيرًا باستخدام المسافة الإقليدية وطريقة تم تعيينها إلى Ward.D2. تم توسيط قيم الخريطة الحرارية وتعديلها حسب الصفوف.
ت annotations pathologist و quantifications. تم وضع علامات على الأقسام التي كانت فيها المسح عالي الدقة متاحة من قبل أطباء الأمراض باستخدام برنامج QuPath أو برنامج Loupe Browser (10X Genomics) وتم تعريف 5 ميزات مرضية رئيسية (الستروما المحيطة بالورم، الستروما داخل الورم، خلايا السرطان، تجمعات اللمفاويات والقنوات واللوبيات الطبيعية) بناءً على الشكل. تم تصدير التعليقات الناتجة كملف GeoJson، واستيرادها في R باستخدام دالة geojson_read من حزمة Geojsonio، ومعالجتها باستخدام حزمة sf R ونقلها إلى كل نقطة Visium لتقدير فك التشفير في كل منطقة. تم نقل الميزات المرضية إلى كل نقطة على أساس منطقة الأغلبية، باستثناء خلايا السرطان حيث تم نقل التعليق إذا كانت أكثر من من النقطة تغطي تعليق حجرة الظهارة الورمية. عندما لم تكن الصور الممسوحة من الأقسام العامة متاحة أو ذات جودة غير كافية ليتم وضع علامات عليها باستخدام QuPath، تم وضع علامات على النقاط باستخدام برنامج Loupe Browser.
InferCNV على بيانات scRNA-seq وبيانات النسخ المكانية. للتفريق بين خلايا السرطان والخلايا الطبيعية، تم استنتاج التغيرات في عدد النسخ باستخدام حزمة InferCNV R الإصدار 1.13.0. بالنسبة لبيانات scRNA-seq، تم استخدام الألياف الطبيعية كمرجع وخلايا الظهارة، تم استخدامها كاستعلام. تم تشغيل التحليل باستخدام cluster_by_groups تم تعيينه إلى True، وanalysis_mode تم تعيينه إلى subclusters، وإلا تم استخدام المعلمات الافتراضية. بالنسبة للبيانات المكانية، تم استخدام النقاط المعلّمة كـ Peritumor كمرجع. تم تشغيل التحليل باستخدام cluster_by_groups تم تعيينه إلى False، وanalysis_mode تم تعيينه إلى subclusters، وإلا تم استخدام المعلمات الافتراضية. ثم تم استيراد معلومات CNV إلى كائن Seurat باستخدام دالة add_to_seurat.
تحليل المسافات المكانية. لحساب توزيع المسافات بين كل نوع من الخلايا في الأقسام المختلفة، استخدمنا مصفوفة وفرة الخلايا المفككة. لكل نوع من الخلايا، حسبنا المسافة الإقليدية بين كل خلية مفككة مقارنة بجميع الخلايا الأخرى التي تنتمي إلى نوع آخر من الخلايا باستخدام
إحداثيات النقاط. اعتبرنا واحتفظنا بأقرب مسافة لكل خلية مرجعية.
تحليل ligand-receptor
تحليل scRNA-seq. تم إجراء تحليلات Ligand-Receptor باستخدام حزمة R CellChat الإصدار 1.4.0، مع قاعدة بيانات CellChatDB المقدمة. تم حساب الجينات والتفاعلات المفرطة التعبير باستخدام identifyOverExpressedGenes و identifyOverExpressedInteractions على التوالي، مع المعلمات الافتراضية. تم حساب احتمالات الاتصال باستخدام computeCommunProb مع طريقة trimean الافتراضية لحساب متوسط التعبير. تم تصفية اتصالات الخلايا باستخدام filterCommunication، وتم حساب احتمالية مسار الاتصال باستخدام computeCommunProbPathway مع المعلمات الافتراضية.
تحليل النسخ المكانية. تم إجراء تحليلات Ligand-Receptor المكانية باستخدام SpaTalk v1.0 . استخدمنا دالة dec_celltype لنقل مخرجات فك تشفير cell2location على كائن SpaTalk الذي تم إنشاؤه باستخدام createSpaTalk مع المعلمات الافتراضية. استخدمنا دالة set_expected_cell0 مع نتيجة وفرة الخلايا من cell2location للإشارة إلى عدد الخلايا لكل نقطة. ثم استخدمنا find_lr_path لاستنتاج اتصالات Ligand-Receptor من خلية إلى خلية و dec_cci للإشارة إلى أنواع الخلايا المعنية. أخيرًا، استعدنا تنشيط المسارات السفلية باستخدام get_lr_path ورسمنا النتيجة باستخدام plot_lr_path و plot_lrpair بالإشارة إلى الخلية المعنية باستخدام فتحة SpaTalk cellpair.
تخطيط مرجعي للنيتش
لتخطيط النيتشات على أقسام BC الجديدة، قمنا أولاً بإنشاء وتدريب نموذج scVI مع طبقتين باستخدام مخرجات فك التشفير لـ 17 قسمًا (الذي سمح لنا بتحديد النيتشات) و 14 قسمًا جديدًا من BC تم جمعها من . ثم قمنا بتحويل النموذج إلى نموذج scANVI باستخدام scvi.model.SCANVI.from_scvi_model وأشرنا إلى النيتشات كعلامة ذات اهتمام. قمنا بتدريب النموذج لمدة 20 دورة وأشرنا إلى 100 عينة لكل علامة. استخدمنا طريقة predict للنموذج لنقل علامات النيتش على الأقسام الجديدة، وأخيرًا قمنا بتصدير العلامة المتوقعة ورسمناها على الأقسام.
تحليل تكوين ECT في مجموعة METABRIC
لتحليل ثراء ECT في الأنماط الجزيئية لـ BC، استخدمنا خوارزمية BayesPrism لفك تشفير بيانات النسخ من مجموعة METABRIC. تم الحصول على مصفوفة التعبير المعدلة، والمعلومات السريرية وتصنيفات PAM50 من METABRIC (https://www.cbioportal.org/study/summary?id=brca_ metabric). تم الحفاظ على Luminal A ( )، Luminal B ( )، HER2 ( ) و Basal-like TN تم الحفاظ على مرضى BC من أجل التحليل. تم استخدام مصفوفة العد الخام لـ 73,426 خلية عالية الجودة من أطلس BC الخاص بنا كمدخلات للمعلومات السابقة. تم اشتقاق العلامات من تعليق 10 ECT الموضحة أعلاه. تم تجميع ECT6 و ECT7 لتجميع جميع أنواع خلايا الظهارة. تمت إزالة الجينات المشفرة للبروتينات الميتوكوندرية والريبوسومية حيث يتم التعبير عن هذه الجينات بكثافة عالية وليست مفيدة في تمييز أنواع الخلايا. تم أيضًا إزالة MALAT1 والجينات من chrX و chrY بناءً على إشارة من مؤلفي BayesPrism. لتقليل تأثيرات الدفعة وتسريع الحساب، قمنا بإجراء فك التشفير فقط على الجينات المشفرة للبروتين. تم استخدام المعلمات الافتراضية للتحكم في أخذ عينات Gibbs والتحسين. تم استرداد التقدير النهائي لنسبة نوع الخلايا في كل عينة RNA-seq جماعية باستخدام مصفوفة theta المحدثة واستخدمت للتحليل اللاحق. تم تصنيف الأورام من خلال تطبيق التجميع الهرمي على مصفوفة نسبة ECT التي تم الحصول عليها باستخدام مسافة الارتباط وطريقة Ward.D2 من حزمة pheatmap R. تم تقييم الفروق في البقاء العام بين 4 مجموعات من مرضى BC باستخدام تحليل Kaplan-Meier وإحصائيات اختبار log-rank باستخدام حزم survival و survminer R.
تحليل بيانات scRNA-seq من نماذج الفئران للثدي والبنكرياس
استعدنا مجموعتين من بيانات scRNA-seq المتاحة للجمهور (أرقام الوصول E-MTAB-12036 من EBI Biostudies و GSE149636 من Gene Expression Omnibus) من و نماذج الفئران. للسماح بإجراء مقارنات عبر الأنواع، قمنا بتحويل رموز جينات الفئران إلى نظيراتها البشرية. تم استرداد الجينات البشرية والفئران من قاعدة بيانات Ensembl GRCh38.p13 و GRCm38.p6، على التوالي. تم استخدام Seurat v4.3.0 لجميع التحليلات اللاحقة. تم تطبيع العد باستخدام دالة NormalizeData، ثم تم اختيار أعلى 2000 جين الأكثر تباينًا باستخدام دالة FindVariableFeatures بطريقة vst. تم تطبيق قياس البيانات باستخدام دالة ScaleData وتم إجراء تحليل المكونات الرئيسية باستخدام RunPCA. تم عزل العنقود الذي تم تصنيفه كخلايا ليفية من قبل المؤلفين لبيانات مجموعة PDAC.وتم اختيار الخلايا المعلّمة على أنها فيبروبلاستات S100A4+ لمجموعة بيانات سرطان الثدينقل العلامةتم استخدام أطلس سرطان الثدي كمرجع، وتم تطبيق ذلك، وتمت إزالة جميع الخلايا التي لم يتم تحديدها كخلايا ليفية باستخدام التعليقات التوضيحية التي تم الحصول عليها من خطوة نقل التسمية. بالنسبة لمجموعة بيانات سرطان البنكرياس، ومجموعة بيانات سرطان الثدي، استعدنا أخيرًا 35,508 و، على التوالي. من أجل تحديد عدد الخلايا في الفئران من النوع البري (WT) والفئران التي تم إدخال مستقبل سم الدفتيريا Lrrc15، تم الحفاظ على النقاط الزمنية والظروف التالية: فئران WT: Skin_WTnaive_Stroma، DO_NoTx_Stroma، D7_DTRneg_Stroma، D14_DTRneg_Stroma، D21_DTRpos_Stroma. مستقبل سم الدفتيريا Lrrc15: Skin_WTnaive_Stroma، DO_NoTx_Stroma، D7_DTRpos_Stroma، D14_DTRpos_Stroma، D21_DTRpos_Stroma.
تسلسل RNA الضخم من مجموعة INVADE
تم معالجة العينات المجمدة لاستخراج RNA باستخدام مجموعة (miRNeasy Mini Kit، Qiagen #217004) وفقًا لتعليمات الشركة المصنعة. تم تحليل سلامة وجودة RNA باستخدام نظام Agilent 4200 TapeStation. تم إعداد المكتبة وفقًا لبروتوكول إلومينا.مجموعة TruSeq Stranded mRNA وفقًا لتوصيات المورد. باختصار، كانت الخطوات الرئيسية في هذا البروتوكول على التوالي، بدءًا من من إجمالي RNA: تنقية الـ PolyA (المحتوية على جزيئات mRNA) باستخدام كريات مغناطيسية مرتبطة بأوليغو-تي، وتفتيت باستخدام أيونات ثنائية التكافؤ عند درجة حرارة عالية للحصول على قطع من تخليق cDNA، وأخيرًا ربط محولات إيلومينا وتكبير مكتبة cDNA بواسطة PCR. ثم تم إجراء التسلسل على جهاز تسلسل إيلومينا HiSeq2500 (75-bp مزدوج النهاية). تم إجراء تحليل الصور واستدعاء القواعد باستخدام تحليل إيلومينا في الوقت الحقيقي (RTA 2.1.3) مع الإعدادات الافتراضية. TopHat2 (v2.0.10)تم استخدامه لمحاذاة بيانات RNAseq الخام على الجينوم البشري (hg19) وعلى ترنسكريبتوم من تعليقات refSeq (نسخة أبريل 2015) مع المعلمات التالية: bowtie2 (v2. 1. 0)باستخدام معلمات sensitive و fr-firststrand لنوع المكتبة (بروتوكول محدد الشريط)، مما يسمح بحد أقصى من 2 اختلاف في البذور بطول 25 نقطة أساسية وفجوة تصل إلى 10 نقاط أساسية في المحاذاة، وحجم إنترون يتراوح بين 30 نقطة أساسية و 700 كيلوباز، مع متوسط حجم إدخال بين أزواج القراءة يبلغ 155 نقطة أساسية مع انحراف معياري قدره 80 نقطة أساسية. ثم تم حساب العد الخام من خلال النسخ المعاد بناؤها (26,093 جين)، باستخدام مجموعة أدوات Cufflinks (الإصدار 2.2.1).باستخدام المعلمات الافتراضية ووضع العزل. تتوفر بيانات العد الخام من مستودع بيانات Figshare (DOI: 10.6084/m9.figshare.21591351).
إعادة تحليل بيانات تسلسل RNA الشامل
تم تحليل خمسة وخمسين تسلسل RNA الكمي من مجموعة INVADE و216 تسلسل RNA الكمي من مجموعة TBCRC 038 باستخدام خوارزمية BayesPrism.تم استخدام مصفوفة العد الخام المكونة من 73,426 خلية عالية الجودة من أطلس BC الخاص بنا كمدخل للمعلومات السابقة. تم اشتقاق التسميات من توضيح 39 نوعًا وحالة من الخلايا المذكورة أعلاه. تم إزالة الجينات المشفرة للبروتينات الميتوكوندرية والريبوسومية حيث يتم التعبير عن هذه الجينات بمقدار عالٍ وليست مفيدة في تمييز أنواع الخلايا. MALAT1 وجينات من chrX تمت إزالة chrX و chrY أيضًا بناءً على إشارة من مؤلفي BayesPrism. لتقليل تأثيرات الدفعة وتسريع الحساب، قمنا بإجراء فك التشفير فقط على الجينات المشفرة للبروتين. تم استخدام المعلمات الافتراضية للتحكم في أخذ عينات جيبس والتحسين. تم استرداد التقدير النهائي لنسبة نوع الخلية في كل عينة RNA-seq جماعية باستخدام مصفوفة ثيتا المحدثة واستخدمت للتحليل اللاحق.
تحليل تدفق الخلايا لعينة BC
تم إدراج جميع الأجسام المضادة المستخدمة في دراستنا في الجدول التكميلي 3. تم جمع عينات سرطان الثدي البشرية الطازجة مباشرة بعد الفحص المجهري واختيار مناطق الاهتمام من قبل أخصائي الأمراض. تم تخزين عينات الورم في-وسيط مستقل وتم نقله إلى معهد البحث. تم معالجة جميع عينات الورم دون أي معرفة سابقة عن خلايا CAF وتسلل الخلايا المناعية. تم قطع العينات إلى قطع صغيرة (حوالي ) وهضم في -وسط مستقل (Gibco #18045-054) مُعزز بـمصل بشري (BioWest #54190-100)من الكولاجيناز I (سيغما #C0130)،من الهيالورونيداز (سيغما #H3506) ومن Dnase I (روش #11284932001) لمدة 45 دقيقة فيمع اهتزاز دائم (500 دورة في الدقيقة). ثم تم ترشيح الخلايا من خلالمنخل الخلايا (Fisher Scientific #223635447) وأعيد تعليقها في محلول PBS+ (PBS، Gibco #14190؛ EDTA 2 مليمول، Gibco #15575؛ مصل بشري 1%، BioWest #S4190-100). بعد الطرد المركزي، تم عد الخلايا باستخدام عداد خلايا بيكمان وأعيد تعليقها بتركيزإلى. تم تحضين الخلايا أولاً بصبغة Live/Dead (1:1000، BD Horizonصبغة Fixable Viability Stain 780، BD Biosciences، #565388 لمجموعات FAP+ CAF وصندوق صبغة Fixable Violet Dead Cell، Thermo Fisher، #L34955 لمجموعات TAM) لمدة 10 دقائق في درجة حرارة الغرفة (RT) لاستبعاد الخلايا غير القابلة للحياة. بعد غسل سريع بمحلول PBS+، تم صبغ تعليق الخلايا لمدة 20 دقيقة في درجة حرارة الغرفة بمزيج من الأجسام المضادة المحددة لكل نوع من الخلايا (كما هو موضح أدناه). ثم تم غسل الخلايا وتم الحصول عليها على جهاز BD LSRFortessa.محلل (BD Biosciences). لتحليل تدفق الخلايا، تم أولاً تصنيف الخلايا بناءً على حجمها (FSC-A) وخصائصها الحبيبية (SSC-A). ثم تم تحليل أنواع الخلايا في الجزء السلبي من Live/Dead وتم تعريفها على أنها ظهارية (EPCAM+)، دموية (CD45+)، بطانية (CD31+) وكريات دم حمراء (CD235a+). ثم يتم إضافة علامات سطحية محددة إلى مزيج الأجسام المضادة لتوصيف تجمعات CAF+ FAP وأنواع TAM الفرعية. بالنسبة لجميع تحليلات تدفق الخلايا، على الأقلتم تسجيل الأحداث لكل عينة. تم إجراء تعويضات باستخدام صبغة واحدة لمضاد IgG الفأري ومجموعة الجسيمات الضابطة السلبية (BD biosciences، #552843) مع كل جسم مضاد.
توصيف تجمعات CAF الإيجابية لـ FAP. تم استخدام العلامات لاستراتيجية التصفية التي تحدد تجمعات CAF الإيجابية لـ FAP (CAF-S1) بناءً على الجينات المعبر عنها بشكل مختلف، وقد تم وصفها بالتفصيل في إحدى منشوراتنا الأخيرة.. تم تعريف هذه العلامات المختلفة بناءً على المقارنات الزوجية لملفات التعبير من مجموعات FAP+ CAF التي ساعدتنا في تحديد جينات محددة لكل مجموعة. بالإضافة إلى ذلك، اعتبرنا البروتينات المعبر عنها على السطح التي كانت تتوفر لها أجسام مضادة تجارية مما يسمح بتحليل تدفق الخلايا وفرزها. لا يمكن استخدام هذه العلامات بشكل منفصل حيث يعتمد تحديد المجموعات على الجمع المتتالي لعلامات مختلفة، كما هو موضح أدناه. يعتمد تحديد مجموعات FAP+ CAF على الجمع بين هذه العلامات المختلفة التي تم اختبارها بشكل متتالي. باختصار، تم فصل FAP+CAF أولاً بناءً على مستوى بروتين ANTXR1 الذي ميز بين الألياف العضلية (myCAF، ANTXR1+) والالتهابية (iCAF، ANTXR1-). بعد ذلك، تم تمييز مجموعات myCAF ANTXR1+ وفقًا لمستويات بروتين SDC1 و LAMP5 و CD9. تم تعريف ANTXR1 + SDC1 + LAMP5 – كـ ECMmyCAF، وANTXR1+ LAMP5+ SDC1+/- كـ TGF.-myCAF و ANTXR1+ SDC1- LAMP5- CD9+ كـ Wound-myCAF. تم فصل تجمعات ANTXR1- iCAF باستخدام علامات GPC3 و DLK1 و CD74. تم تعريف ANTXR1- GPC3+ DLK1+/- كـ Detox-iCAF؛ و ANTXR1- GPC3- DLK1+ كـ
IL-iCAF و ANTXR1- GPC3- DLK1- CD74+ كـ IFN“-iCAF. للسماح بهذا التوصيف، تم صبغ الخلايا بمزيج من الأجسام المضادة يحتوي على anti-EpCAM-BV605 (1:50؛ BioLegend، # 324224)، anti-CD31PECy7 (1:100، BioLegend، #303118)، anti-CD45-BUV395 (1:20، BD Biosciences، #BD-563792)، anti-CD235a-PerCP/Cy5.5 (1:50، Biolegend، #349109)، anti-CD29-Alexa Fluor 700 (1:100، BioLegend، #303020)، anti-FAP-APC (1:100، R&D Systems، #MAB3715)، anti-ANTXR1-Alexa Fluor 405 (1:25، Novus Bio، #NB100-56585AF405)، anti-SDC1-BUV737 (1:25، BD Biosciences، #612834)، anti-LAMP5-PE (1:10، Miltenyi Biotec، #130-109-156)، anti-GPC3-Alexa Fluor 549 (R&D systems، 1:20، #FAB2119T)، anti-DLK1-Alexa Fluor 488 (R&D systems، 1:20، #FAB1144G)، anti-CD9-BV711 (BD Biosciences، 1:100، #743050) و anti-CD74-BV786 (BD Biosciences، 1:100، #743736). جميع الأجسام المضادة باستثناء FAP تم شراؤها مسبقًا مرتبطة بالأصباغ الفلورية. تم ربط الجسم المضاد الأساسي anti-FAP بصبغة فلورية باستخدام مجموعة تمييز Zenon APC Mouse IgG1 (1:100، Thermo Fisher Scientific، #Z25051). كانت الأجسام المضادة للتحكم في النوع لكل علامة CAF المستخدمة هي: iso-anti-CD29-Alexa Fluor 700 (جسم مضاد للتحكم في النوع Mouse IgG1 к Alexa Fluor 700، 1:100، BioLegend، #400144)، iso-anti-FAP-APC (Mouse IgG1 к جسم مضاد للتحكم، R&D Systems، 1:200، #MAB002)، iso-anti-ANTXR1-Alexa Fluor 405 (جسم مضاد مرتبط بـ Alexa Fluor 405 Mouse IgG1، 1:100، R&D systems، #IC002V)، iso-anti-SDC1-BUV737 (جسم مضاد للتحكم في النوع BUV737 Mouse IgG1 к؛ 1:100، BD Biosciences، #612758)، iso-anti-LAMP5-PE (جسم مضاد للتحكم في النوع PE human IgG1 REA، 1:10، Miltenyi Biotec #130-104-613)، iso-anti-GPC3-Alexa Fluor 549 (جسم مضاد للتحكم في النوع Mouse IgG2A المرتبط بـ Alexa Fluor594، 1:20، R&D systems، #IC003T)، iso-anti-DLK1-Alexa Fluor 488 (جسم مضاد للتحكم
“توصيف مجموعات TAM. من بين إجمالي خلايا الدم البيضاء CD45+، تم استخدام علامات CD3 وCD19 وCD56 لاستبعاد الخلايا اللمفاوية التائية (CD3+)، والخلايا اللمفاوية البائية (CD19+) وخلايا NK (CD56+). تم بعد ذلك توصيف مجموعات TAM كخلايا CD14+ CD16+ وتم تقييم نسبة البلعميات TREM2+ وFOLR2+. للقيام بذلك، تم صبغ تعليق الخلايا بمزيج من الأجسام المضادة يحتوي على anti-CD45-APCcy7 (1:50، BD Biosciences، #557833)، anti-CD3-Alexa Fluor 700 (1:50، BD Biosciences، #557943)، anti-CD14-Pecy7 (1:50، BD Biosciences، #557742)، anti-CD19-PercCPcy5.5 (1:50، BD Biosciences، #561295)، anti-CD16-BV650 (1:50، BD Biosciences، #563692)، anti-CD56-BUV395 (1:50، BD Biosciences، #563554)، anti-FOLR2-PE (1:50، Biolegend، #391704) وanti-TREM2-APC (الأجسام المضادة الأولية، 1:50، Novus Biologicals، #MAB17291). تم شراء جميع الأجسام المضادة مسبقًا مرتبطة بالأصباغ الفلورية، باستثناء TREM2. تم استخدام أجسام مضادة للتحكم في نوعية مجموعات البلعميات: iso-anti-CD16-BV650 (BV650 Mouse IgG1 к Isotype Control، 1:50، BD Biosciences، #563231)، iso-anti-CD56-BUV395 (BUV395 Mouse IgG2b к Isotype Control؛ 1:50، BD Biosciences، #563558)، iso-anti-CD14-Pecy7 (PE-Cy7 Mouse IgG2a к Isotype Control، 1:50، BD Biosciences، #557907)، iso-anti-FOLR2-PEC (PE Mouse IgG1 к Isotype Ctrl Antibody؛ 1:100، Biolegend، #400112) وiso-anti-TREM2-APC (Rat IgG2B Isotype Control، 1:50، Novus Biologicals، #MAB0061). للكشف عن TREM2، تم صبغ الخلايا لمدة 20 دقيقة في درجة حرارة الغرفة مع الجسم المضاد الثانوي (Rat F(ab)2 IgG APC-conjugated Antibody 1:50، Novus Biologicals،
تسلسل RNA أحادي الخلية CAP
عزل CAP من BC. تم عزل CAP من ثلاثة عينات رئيسية من BC (بقايا جراحية قبل أي علاج) باستخدام BDFACS.
فرز ARIA III (BD Biosciences). تم جمع الخلايا الجذعية مباشرة من غرفة العمليات بعد الفحص المجهري للعينات الجراحية واختيار مناطق الاهتمام من قبل أخصائي الأمراض. تم قطع العينات إلى قطع صغيرة (حوالي ) وهضمت في -وسط مستقل (Gibco #18045-054) مُعزز بـليبرس (روش #05401020001) ودي إنز I (روش #11284932001) لمدة 40 دقيقة فيمع الاهتزاز (180 دورة في الدقيقة). بعد الهضم، تم معالجة الخلايا وصبغها كما هو موضح أعلاه (#”تحليل تدفق الخلايا لعينة BC”). ثم تم تحديد ألياف CAP في الجزء السلبي من Live/Dead وتم تعريفها على أنها EPCAM- CD45- CD31- CD235a- FAP.سي دي 29.
تسلسل RNA أحادي الخلية CAP. عند العزل، تم جمع خلايا CAP مباشرة في أنابيب خالية من RNase (Thermo Fisher Scientific، #AM12450) مسبقة الطلاء بـ DMEM (GE Life Sciences، #SH30243.01) مضافًا إليه 10% FBS (Biosera، #1003/500). تم تنفيذ التقاط الخلايا الفردية، والتحلل، وبناء مكتبة cDNA باستخدام نظام Chromium من 10X Genomics، مع مجموعات الأدوات التالية: مجموعة مكتبة الخلايا الفردية 3′ & مجموعة كريات الهلام v2 (10X Genomics، #120237) ومجموعات شريحة الخلايا الفردية A (10X Genomics، #1000009). تم إنتاج كريات الهلام في المستحلب (GEM)، والترميز، وتنظيف النسخ العكسي بعد GEM، وتكبير cDNA وفقًا لتعليمات الشركة المصنعة. تم تحميل الخلايا وفقًا لذلك على شرائح الخلايا الفردية A من Chromium، وتم تنفيذ 12 دورة لتكبير cDNA. تم فحص جودة وكمية cDNA على جهاز تحليل البيولوجيا Agilent 2100 باستخدام مجموعة Agilent عالية الحساسية للحمض النووي (Agilent، #5067-4626) وتبعت عملية بناء المكتبة وفقًا لبروتوكول 10X Genomics. بعد ذلك، تم تشغيل المكتبات على جهاز Illumina HiSeq (للمرضى P1) وNovaSeq (للمرضى P2-3) بعمق تسلسل يبلغ 50,000 قراءة لكل خلية. تم معالجة البيانات الخام، بما في ذلك فصل ملفات استدعاء القاعدة الخام (BCL) إلى ملفات FASTQ، والمحاذاة، والترشيح، والترميز، وعدّ المعرفات الجزيئية الفريدة (UMI)، باستخدام خط أنابيب 10X Cell Ranger الإصدار 2.1.1. تم محاذاة القراءات إلى تجميع الجينوم البشري Homo sapiens GRCh38 (hg38). تم استخدام Seurat v.3.0.0 للتطبيع اللوغاريتمي، والتدرج، وتقليل الأبعاد، والتجميع باستخدام المعلمات الافتراضية. تم تصفية الخلايا ذات الجودة المنخفضة أولاً بناءً على توزيع الجينات الفريدة المكتشفة (عدد غير صفري). تم استبعاد الخلايا التي تم اكتشاف أقل من 200 جين أو أكثر من 4000 جين (للمريض 1)، أو أكثر من 4500 جين (للمرضى 2) أو أكثر من 3500 جين (للمريض 3). تم استبعاد الخلايا التي تحتوي على نسبة من الجينات الميتوكوندرية أعلى منتم التخلص منها. تم دمج العينات باستخدام دوال Seurat FindIntegrationAnchors و IntegrateData مع 30 مكونًا. تم تطبيق التجميع القائم على الرسم البياني باستخدام FindNeighbours.وظائف ) و FindClusters ( res = 0.4).
عزل وزراعة مجموعات FAP + CAF الأولية
تم قطع عينات BC الطازجة المستلمة بعد الجراحة إلى قطع من، ضعها إما في أطباق بتري بلاستيكية أو في أطباق بتري مغطاة بالكولاجين من النوع الأول بتركيز نهائي من (معهد البيوتكنولوجيا جاك بوي، #207050357) وزُرع في DMEM (جيبكو، #41966-029) مُدعّم بـمصل فتي (FBS) غير نشط بالحرارة (Biosera، #FB-1003-500) و1% ستربتوميسين وبنسيلين (Sigma، #p4333) لمدة 2-3 أسابيع فيتم تجديد الوسائط كل 3 أيام خلال مرحلة التوسعأسابيع. عندما وصلت الخلايا الليفية إلى 50% على الأقل من التلاصق، تم فصلها باستخدام TrypLE (جيبكو، #12605-010)، وتم طردها مركزيًا عندلمدة 5 دقائق وتم وضعها في أطباق بلاستيكية جديدة أو أطباق مغطاة بالكولاجين باستخدام DMEM المدعوم كما هو موضح أعلاه. لفصل مجموعات FAP+ CAF المختلفة، تم جمع الخلايا في كلا الحالتين بشكل منفصل وتم فرزها بواسطة BDFACS ARIA III باستخدام علامات سطحية محددة لمجموعات FAP+ CAF كما هو موضح في المرجع 10. لاستراتيجية فرز الخلايا، تم فصل FAP+ CAF المزروعة على الأطباق البلاستيكية بناءً على ANTXR1 و LAMP5 في مجموعتين متميزتين، ECMmyCAF (CD29+ FAP+ ANTXR1+ LAMP5-) و TGF-myCAF (CD29+
FAP+ ANTXR1+ LAMP5+). تم صبغ الخلايا بمزيج من الأجسام المضادة يحتوي على anti-CD29-Alexa Fluor 700 (1:100، BioLegend، #303020)، anti-FAP-APC (1:100، R&D Systems، #MAB3715)، anti-ANTXR1-AF405 (1:25، Novus Bio، #NB100-56585AF405) و anti-LAMP5-APC (1:10، Miltenyi Biotec، #130-109-204). قمنا بتطبيق استراتيجية مماثلة للخلايا المزروعة على أطباق مغطاة بالكولاجين. تم فرز FAP+ CAF في 3 مجموعات iCAF متميزة بناءً على ANTXR1 و GPC3 و CD74، والتي تم تعريفها كما يلي: Detox-iCAF (CD29+ FAP+ ANTXR1- GPC3+)، IL-iCAF (CD29+ FAP+ ANTXR1- GPC3-) و IFN-iCAF (CD29+ FAP+ ANTXR1- GPC3- CD74+). للقيام بذلك، تم صبغ الخلايا بمزيج من الأجسام المضادة يحتوي على anti-CD29-Alexa Fluor 700 (1:100، BioLegend، #303020)، anti-FAP-APC (1:100، R&D Systems، #MAB3715)، anti-ANTXR1-AF405 (1:25، Novus Bio، #NB100-56585AF405)، anti-GPC3AF700 (1:25، R&D systems، #FAB2119N) و anti-CD74-FITC (1:50، BD Biosciences، #555540). بعد الفرز، تم توسيع الخلايا في الثقافة فيفي وسط DMEM المدعوم كما هو مذكور أعلاه، في بيئة رطبة و الحاضنة، إما على أطباق بلاستيكية لـ ECM-myCAF و TGF-myCAF أو على أطباق مغطاة بالكولاجين لـ Detox-iCAF و ILiCAF و IFN-CAF. لتجنب أي تغيير في هوية مجموعة FAP+ CAF، تم الحفاظ على الخلايا الليفية في نفس ظروف الثقافة بعد الفرز. لم يتم إجراء أي تجارب باستخدام خطوط خلايا FAP+ CAF الأولية بعد المرور العاشر لتجنب شيخوخة الخلايا الليفية. باستخدام هذا البروتوكول، تم عزل عشرة خطوط خلايا مختلفة من عشرة مرضى مختلفين واستخدامها في التجارب الوظيفية. تم التحقق من هوية خلايا مجموعة FAP+ CAF باستخدام تقنية تحليل تدفق الخلايا باستخدام نفس مزيج الأجسام المضادة كما هو موضح أعلاه (#”توصيف مجموعات FAP+ CAF”).
توصيف هوية مجموعة CAF-S1 عند الزراعة بواسطة تسلسل RNA
لتحقق من هوية خلايا CAF الإيجابية لـ FAP التي تم فرزها بواسطة تسلسل RNA، تم استخراج RNA باستخدام مجموعة Qiagen miRNeasy (Qiagen، #217004) وفقًا لتعليمات الشركة المصنعة. تم إجراء استخراج RNA في نفس الوقت الذي تم فيه تحليل تدفق الخلايا. تم التحقق من سلامة وجودة RNA باستخدام مجموعة Agilent RNA 6000 nano (Agilent Technologies، #5067-1511). تم إعداد مكتبات cDNA باستخدام مجموعة TruSeq Stranded mRNA (Illumina، #20020594) تلتها عملية التسلسل على NovaSeq (Illumina). تم التحقق أولاً من الجودة العامة لبيانات التسلسل الخام باستخدام FastQC (v0.11.9). ثم تم محاذاة القراءات على قاعدة بيانات RNA الريبوسومي باستخدام bowtie (2.4.2) وعلى الجينوم المرجعي البشري (hg38) باستخدام STAR (2.7.6a). تم إجراء تحكمات إضافية على البيانات المحاذاة لاستنتاج اتجاه السلسلة (RSeQC 4.0.0)، التعقيد (Preseq 3.1.1)، التشبع القائم على الجينات، توزيع القراءات أو مستوى التكرار باستخدام حزمة Bioconductor R DupRadar. ثم تم استخدام البيانات المحاذاة لإنشاء مصفوفة عد نهائية تحتوي على جميع الجينات وجميع العينات. فقط الجينات التي تحتوي على قراءة واحدة على الأقل في على الأقلتم الاحتفاظ بجميع العينات لمزيد من التحليلات. تم إجراء عملية التطبيع والتحليل التفاضلي بين جميع مجموعات FAP+ CAF باستخدام حزمة DESeq2 في R. استخدمنا Detox-iCAF و IL-iCAF و IFNتوقيعات جينات -iCAFلتحديد درجة الإثراء في مجموعات Detox-iCAF وILiCAF وIFNg-iCAF مقارنة بمجموعات myCAF. تم استخدام برنامج تحليل إثراء مجموعة الجينات (GSEA) الإصدار 3.0 (معهد برود) مع المعلمات التالية: إحصائية الإثراء = “كلاسيكي”، مقياس تصنيف الجينات = “Signal2Noise.” تم إنشاء خريطة حرارية تبرز جينات علامة مجموعة CAF-S1 في تسلسل RNA الكمي بين مجموعات CAF-S1 المصنفة باستخدام حزمة R pheatmap مع تعيين التجميع إلى “ward.D2” والمسافة إلى “الارتباط”.
اختبارات وظيفية
عزل خلايا المناعة. تم عزل خلايا المناعة الأولية من الدم المحيطي لمانحين أصحاء (مع موافقة مستنيرة) تم الحصول عليها من “المؤسسة الفرنسية للدم” من خلال اتفاقية معهد كوري، باريس، فرنسا. باختصار، تم عزل خلايا الدم المحيطية الوحيدة النواة (PBMC) باستخدام Lymphoprep. (STEMCELL #07861) وتم عزل تجمعات خلايا المناعة بشكل انتقائي بواسطة فصل الخلايا المغناطيسي باستخدام مجموعات العزل المحددة (مجموعة عزل خلايا القاتل الطبيعي البشري، ميلتيني #130-092-657؛ كريات ميكروبي CD14 البشرية، ميلتيني #130-050-201؛ مجموعة عزل خلايا T التنظيمية CD4+ CD25+ البشرية، ميلتيني #130-091-301). من أجل تجارب الزراعة المشتركة،تم زراعة الألياف الليفية لكل مجموعة من خلايا CAF الإيجابية لـ FAP على أطباق 24 بئرًا في وسط DMEM المدعوم بـمصل جنين البقر المعطل حرارياً و1% بنسلين ستربتوميسين فيبين عشية وضحاها لتحقيق الالتزام الكامل. ثم تمت إزالة الوسط ومن DMEM المدعوم بـ FBS يحتوي على خلايا أو الخلايا الوحيدة CD14+تم إضافة الخلايا اللمفاوية T CD4+ CD25+. تم الحفاظ على الثقافات المشتركة لمدة 24 ساعة عندلخلايا NK والوحيدات ولمدة 16 ساعة فيلخلايا T اللمفاوية. من أجل تحليل تدفق السيتومتر، تم جمع الخلايا المناعية بعد الحضانة، وغسلها، وصبغها لمدة 10 دقائق في درجة حرارة الغرفة بصبغة LIVE/DEAD (1:1000، ثيرمو فيشر، #L34955) لاستبعاد الخلايا الميتة. ثم تم صبغ الخلايا لمدة 30 دقيقة في درجة حرارة الغرفة بمزيج يحتوي على أجسام مضادة محددة لتوصيف تجمعات الخلايا المناعية. تم تصنيف الخلايا أولاً بناءً على حجمها (FSC-A) ودرجة حبيبيتها (SSC-A). تم تحليل تجمعات TAM و NK على الجزء السلبي من Live/Dead وتم تعريفها على أنها خلايا نقي (CD45+CD3-CD19-CD14+)، NK (CD45+CD3-CD19-CD56+ CD16+/-) وخلايا T (CD45+ CD3+ CD4+). لتوصيف TAM، تم استرداد إجمالي عدد الخلايا، وتم تقييم نمط أحادية النواة بواسطة تدفق السيتومتر لمستويات بروتين CD16 و TREM2 و FOLR2 كما هو موضح أعلاه (“تحليل تدفق السيتومتر لعينات BC” # “توصيف TAM”). تم تمييز أحادية النواة CD14+ من خلايا CAF الإيجابية FAP بعد التحليل باستخدام صبغة CD45. لتوصيف NK، تم فصل الخلايا إلى مجموعتين فرعيتين وفقًا لـ CD56 و CD16 وتم تعريفها على أنها NK سامة للخلايا (CD16CD56 ) و NK غير السامة للخلايا (CD16CD56“تم تقييم نسبة NKG2A بين خلايا CD16+ بالإضافة إلى مستويات Granzyme B وPerforin. للقيام بذلك، تم استرداد الخلايا بعد زراعة مشتركة وتم صبغها بمزيج من الأجسام المضادة يحتوي على anti-CD45-APCcy7 (1:50، BD Biosciences، #557833)، anti-CD16-BV650 (1:50، BD Biosciences، #563692)، anti-CD56-BUV395 (1:50، BD Biosciences، #563554) وanti-NKG2A-BV786 (1:50، BD Biosciences، #747917). تم شراء جميع الأجسام المضادة مسبقًا مرتبطة بالأصباغ الفلورية. تم استخدام أجسام مضادة للتحكم في النوع: iso-anti-CD16-BV650 (BV650 Mouse IgG1 к Isotype Control، 1:50، BD Biosciences، #563231)، iso-anti-CD56-BUV395 (BUV395 Mouse IgG2b к Isotype Control، 1:50، BD Biosciences، #563558) وiso-anti-NKG2A-BV786 (BV786 Mouse IgG1 к Isotype Control، 1:50، BD Biosciences، #563330). بعد صبغ سطح الخلايا، تم تثبيت الخلايا في بارافورمالدهيد 4% (PFA) (Electron Microscopy Sciences، #15710) لمدة 15 دقيقة في درجة حرارة الغرفة. بعد خطوة غسل باستخدام PBS+، تم حضانة الخلايا مع مزيج من الأجسام المضادة يحتوي على anti-Granzyme B PE (1:50، BD Biosciences، #561142) وanti-perforin-AF488 (1:50، BD Biosciences، #563764). تم تعليق الأجسام المضادة في محلول PBS+ مضاف إليه 0.1% من Saponin (Sigma-Aldrich #S7900) وتم استخدام الأجسام المضادة للتحكم في النوع المقابل: iso-anti-Granzyme B PE (PE Mouse IgG1 к Isotype Control، 1:50، BD Biosciences، #555749) وiso-anti-Perforin-AF488 (Alexa Fluor 488 Mouse IgG2b к Isotype Control
لتوصيف خلايا T التنظيمية FOXP3+، تم جمع اللمفاويات T CD4+ CD25+ بعد زراعتها مع CAF وتم صبغها لمدة 30 دقيقة في درجة حرارة الغرفة باستخدام مزيج من الأجسام المضادة يحتوي على anti-CD45-APCcy7 (1:50، BD Biosciences، #557833)، anti-CD3-AF700 (1:50، BD Biosciences، #557943)، anti-CD4-APC (1:10، Miltenyi Biotec، #130-113-210)، anti-CD25-PE (1:20، Miltenyi Biotec، #130-113-282)، anti-PD-1-BUV737 (1:50، BD Biosciences، #612791) و anti-CTLA4-PEcy5 (1:50، BD Biosciences، #555854). تم استخدام أجسام مضادة للتحكم في النوع: iso-anti-CD25-PE (1:20، Miltenyi Biotec، 130-092-215)، iso-anti-PD-1-BUV737 (BUV737 Mouse IgG1، كتحكم في النوع؛ 1:50، BD Biosciences #564299) و iso-anti-CTLA4-PEcy5 (PE-Cy5 Mouse IgG2a، كتحكم في النوع؛ 1:50، BD Biosciences، #555575). تم استخدام مجموعة أدوات صبغ FOXP3 (eBioscience، #00-5523-00) للكشف عن بروتين FOXP3 داخل النواة. بعد التثبيت وبعد النفاذية لمدة ساعة واحدة في درجة حرارة الغرفة، تم تحضين الخلايا اللمفاوية T CD4+ CD25+ مع مضاد FOXP3-Alexa Fluor 488 (1:40، ثيرمو فيشر ساينتيفيك، #53-4776-42) لمدة 30 دقيقة في درجة حرارة الغرفة. كما تم استخدام التحكم المتناظر المقابل (تحكم إيزوتيب IgG2a من الجرذ (eBR2a)، أليكسا فلور 488، 1:200، eBiosciences، #53-4321-80).
اختبار هجرة ترانسويل
لإجراء اختبار هجرة CD14 +تم زرع الكتل في الغرفة السفلية من لوحة الترانسويلحجم المسام، كورنينغ HTS ترانسويل 24 بئر #CLS3413من DMEM المدعوم بـمصل بقري مفعّل بالحرارةالبنسلين ستربتوميسين عندبين عشية وضحاها. بعد التزام خلايا FAP+ CAF، الكريات البيضاء الأحادية CD14+ (الخلايا في حجمدي إم إي إم مدعوم بـتمت إضافة FBS) في الغرفة العلوية وتم تحضينها لمدة 6 ساعات فيبعد الحضانة، تم استرداد الخلايا الوحيدة CD14+ في الحجرة العليا والسفلى بشكل منفصل. في المجموع،منخرزات كربوكسيلية (Polyscience #18133) وDAPIتمت إضافة ) إلى كل عينة قبل العد. تم إجراء عد الخلايا بواسطة تقنية قياس التدفق باستخدام كرات دقيقة للتطبيع وتم تمثيلها كنسبة من الهجرة، محسوبة كنسبة عدد الخلايا في الحجرة السفلية إلى العدد الإجمالي للوحيدات.
تجربة إسكات باستخدام RNA صغير متداخل (siRNAs)
لتجربة RNA التداخل القصير (siRNA)،تم زراعة الخلايا الليفية الأولية من كل مجموعة في طبق 6 آبار وتم نقلها باستخدام 10 نانومتر من siRNA في نفس اليوم. تم حضن الخلايا المنقولة في DMEM المدعوم بـمصل العجل الجسدي المعطل حرارياً لمدة 72 ساعة عند و “. تم استخدام siRNA كتحكم هو ON-TARGETplus Nontargeting siRNA (تسلسل الهدف UGG-UUU-ACA-UGU-UGU-GUG-A، Dharmacon #D-001810-02-05). تم تنفيذ كتم YAP1 باستخدام siRNAs متميزة تستهدف YAP1 ((YAP1(1)S 5′-UGA-GAA-CAA-UGA-CGA-CCA-A-3′ و YAP1(1)AS 5′-UUG-GUC-GUC-AUU-GUU-CUC-A-3′ YAP1(2)”.5′-CCA-CCA-AGC-UAG-AUA-AAG-A-3′ و YAP1(2)AS 5′-CCA-CCA-AGC-UAG-AUA-AAG-A-3′). تم تحقيق كتم DPP4 أيضًا باستخدام نوعين مختلفين من siRNA تستهدف DPP4 (-CAC-UCU-AAC-UGA-UUA-CUU-A-3′ و 5′-CAA-GUU-GAG-UAC-CUC-CUU-A-3’، Horizon Discovery، #LQ-004181-00-0005). تم تنفيذ كتم TGFBRII باستخدام نوعين مختلفين من siRNA (-CAA-CAA-CGG-UGC-AGU-CAA-G-3′ و 5′-GAC-GAG-AAC-AUA-ACA-CUA-G-3′). تم إجراء عمليات النقل باستخدام مادة نقل DharmaFECT 2 (Horizon Discovery، #T-2005-01) وفقًا لتعليمات الشركة المصنعة. تم تحليل كفاءة كتم YAP1 و DPP4 بعد 72 ساعة بواسطة تقنية Western blot.
استخراج البروتين وويسترن بلوت
استخراج البروتين. تم غسل الخلايا بمحلول PBS البارد (جيبكو #14190) وتم تحللها بـمن محلول لايملي (بايو راد، #1610737) المضاف إليه DTT بتركيز نهائي قدره 50 مللي مول (ثيرمو ساينتيفيك، #11896744). تم تسخين العينات بعد ذلك عندلمدة 10 دقائق ثم تم استخدام الموجات فوق الصوتية لمدة 10 دقائق (دورات من ) وتم الطرد المركزي لمدة 10 دقائق عند فيتم تخزين مستخلص البروتين لفترة قصيرة في.
الويسترن بلوت. خمسة عشرتم تحميل البروتينات في جهاز NuPAGE Novexهلامات بيس تريس ميني (ثيرمو فيشر، #NP0321BOX). تم إجراء الهجرة لمدة ساعتين عند 120 فولت في 1X نو باجمخزن تشغيل MOPS SDS (لأجل جيلاتين Bis-Tris فقط) (Invitrogen، #NP0001) في الرحلان الكهربائي. ثم تم نقل البروتينات إلىغشاء النيتروسيليلوز (GE Healthcare #10600002) وتم حضنه طوال الليل فيمع الأجسام المضادة الأولية المناسبة: جسم مضاد بشري DPPIV/CD26 (1:000، R&D systems #AF1180)؛ جسم مضاد أحادي النسيلة من الأرانب YAP (D8H1X) (1:1000، Cell Signaling #14074)، أكتين (1:10.000؛ Sigma #A5441)، SMAD2 (D43B4) جسم مضاد أحادي النسيلة من الأرانب XP (1:1000، Cell signaling #5339)، جسم مضاد أحادي النسيلة من الأرانب الفوسفور-SMAD2 (Ser465/467) (1:1000، Cell signaling #3108) وTGFأجسام مضادة أحادية النسيلة للأرنب من النوع II (1:1000، إشارة الخلية) #41896). بعد عدة غسلات و1 ساعة من الحضانة باستخدام الأجسام المضادة الثانوية المرتبطة بالبيروكسيداز المناسبة (مختبرات جاكسون للأبحاث المناعية #115-035-003)، تم تصور البروتينات باستخدام كشف الكيمياء الضوئية المعزز (Western Lightning Plus-ECL، بيركن إلمر #NEL103E001EA). تم إجراء تحليلات المناعية باستخدام برنامج ImageJ.
خطوط خلايا سرطان الثدي البشري
تم زراعة خطوط خلايا سرطان الثدي MCF7 (ATCC #HTB-22) و MDA-MB-231 (ATCC #CRM-HTB-26) في وسط DMEM (Gibco، #41966-029) معزز بـ 10% FBS (Biosera، #FB-1003-500) و 1% ستربتوميسين وبنسلين (Sigma، #p4333). تم زراعة T47D (ATCC #HTB-133) في وسط RPMI (Gibco، #11875093) معزز بـ 10% FBS و 1% ستربتوميسين وبنسلين. تم زراعة MCF10A (ATCC #CRL-10317) في وسط DMEM/F12 (Gibco، #11320033) معزز بـ 10% FBS و 1% ستربتوميسين وبنسلين. تم الحفاظ على جميع الخلايا في بيئة رطبة. و الحاضنة. تم التحقق من هوية الخلية باستخدام طريقة تحليل الحمض النووي بواسطة تكرارات قصيرة متتالية (STR) (بروماجا # B9510).
التعايش الثقافي لـتجمعات مع خطوط خلايا سرطان الثدي
للتجارب المشتركة في الثقافة،الخلايا الليفية من Detox-iCAF أو IL-iCAF أو IFNتم زراعة تجمعات -iCAF في أطباق 6 آبار وتم حضنها طوال الليل في للسماح بترابط CAF على الألواح. في اليوم التالي، تم إضافة خلايا MCF7 (خلايا سرطان الثدي اللمعية)، T47D (خلايا سرطان الثدي اللمعية)، MDA-MB-231 (خلايا سرطان الثدي الثلاثي السلبية) أو MCF10 (خلايا ظهارية غير ورمية معزولة من نسيج الثدي) على زراعة CAF. تم جمع الخلايا بعد ذلك في نقاط زمنية مختلفة (كما هو موضح في الرسوم البيانية المقابلة)، وغسلها في PBS وصبغها لمدة 20 دقيقة في درجة حرارة الغرفة باستخدام نفس مزيج الأجسام المضادة كما هو موضح أعلاه (# “توصيف تجمعات CAF-S1”)، مع إضافة مضاد EPCAM-BV650 (1:100، Biolegend، #324224) لتمييز CAF عن الخلايا الظهارية بواسطة تحليل التدفق الخلوي. تم الحصول على العينات بعد ذلك على جهاز LSRFortessa.تم تحليل البيانات باستخدام جهاز التحليل (BD Biosciences) وبرنامج FlowJo 10.5.2.
تحفيز Detox-iCAF مع TGFووسط الثقافة المشتق من خلايا MCF-7
إجمالاً،تم زرع الخلايا الليفية من مجموعة Detox-iCAF في أطباق 6 آبار وتم حضنها طوال الليل في للسماح بالتلاصق الخلوي. في اليوم التالي، تم تحفيز الخلايا بـ من TGFأو الوسط المشروط المأخوذ من خلايا سرطان الثدي MCF-7 والمركز لمدة 5 دقائق عندلإزالة الحطام. تم جمع الخلايا بعد ذلك في نقاط زمنية مختلفة (t0-72 ساعة) لتحليل تدفق الخلايا كما هو موضح أعلاه (#”التعايش بين تجمعات CAF الإيجابية لـ FAP مع خط خلايا سرطان الثدي”).
التحليل الإحصائي
تم إجراء جميع التحليلات الإحصائية والتمثيل البياني للبيانات في بيئة Rhttps://cran.r-project.org، الإصدار 4.2.0) أو باستخدام برنامج GraphPad Prism (الإصدار 9.4.1). الاختبارات الإحصائية المستخدمة تتوافق مع توزيع البيانات: تم التحقق من التوزيع الطبيعي أولاً باستخدام اختبار شابيرو-ويلك، وتم تطبيق اختبارات ثنائية الجانب بارامترية أو غير بارامترية وفقًا للتوزيع الطبيعي، كما هو موضح في كل أسطورة شكل. الرموز للدلالة على الأهمية: ns، غير دال؛ *<0.05، **<0.01؛ ***<0.001؛ ****<0.0001.
ملخص التقرير
معلومات إضافية حول تصميم البحث متاحة في ملخص تقارير مجموعة نيتشر المرتبط بهذه المقالة.
توفر البيانات
بيانات تسلسل RNA أحادي الخلية الخام من CAP، وبيانات النسخ الجيني المكاني من مقاطع BC، وبيانات تسلسل RNA الكلي من مجموعة INVADE ومن الخلايا الليفية المزروعة التي تم إنشاؤها في هذه الدراسة متاحة على منصة أرشيف الجينوم والظواهر الأوروبية.https://ega-archive.org) تحت أرقام الوصول المتحكم بها: EGAS50000000220 و
Ohlund, D. et al. Distinct populations of inflammatory fibroblasts and myofibroblasts in pancreatic cancer. J. Exp. Med. 214, 579-596 (2017).
Bartoschek, M. et al. Spatially and functionally distinct subclasses of breast cancer-associated fibroblasts revealed by single cell RNA sequencing. Nat. Commun. 9, 5150 (2018).
Cremasco, V. et al. FAP delineates heterogeneous and functionally divergent stromal cells in immune-excluded breast tumors. Cancer Immunol. Res. 6, 1472-1485 (2018).
Givel, A. M. et al. miR200-regulated CXCL12beta promotes fibroblast heterogeneity and immunosuppression in ovarian cancers. Nat. Commun. 9, 1056 (2018).
Biffi, G. et al. IL1-induced JAK/STAT signaling is antagonized by TGFbeta to shape CAF heterogeneity in pancreatic ductal adenocarcinoma. Cancer Discov. 9, 282-301 (2019).
Elyada, E. et al. Cross-species single-cell analysis of pancreatic ductal adenocarcinoma reveals antigen-presenting cancer-associated fibroblasts. Cancer Discov. 9, 1102-1123 (2019).
Neuzillet, C. et al. Inter- and intra-tumoural heterogeneity in cancer-associated fibroblasts of human pancreatic ductal adenocarcinoma. J. Pathol. 248, 51-65 (2019).
Dominguez, C. X. et al. Single-cell RNA sequencing reveals stromal evolution into LRRC15(+) myofibroblasts as a determinant of
patient response to cancer immunotherapy. Cancer Discov. 10, 232-253 (2020).
Friedman, G. et al. Cancer-associated fibroblast compositions change with breast cancer progression linking the ratio of S100A4(+) and PDPN(+) CAFs to clinical outcome. Nat. Cancer 1, 692-708 (2020).
Kieffer, Y. et al. Single-cell analysis reveals fibroblast clusters linked to immunotherapy resistance in cancer. Cancer Discov. 10, 1330-1351 (2020).
Sebastian, A. et al. Single-cell transcriptomic analysis of tumorderived fibroblasts and normal tissue-resident fibroblasts reveals fibroblast heterogeneity in breast cancer. Cancers 12, 1307 (2020).
Hu, H. et al. Three subtypes of lung cancer fibroblasts define distinct therapeutic paradigms. Cancer Cell 39, 1531-1547.e10 (2021).
Wu, S. Z. et al. A single-cell and spatially resolved atlas of human breast cancers. Nat. Genet. 53, 1334-1347 (2021).
Foster, D. S. et al. Multiomic analysis reveals conservation of cancer-associated fibroblast phenotypes across species and tissue of origin. Cancer Cell 40, 1392-1406.e7 (2022).
Cords, L. et al. Cancer-associated fibroblast classification in single-cell and spatial proteomics data. Nat. Commun. 14, 4294 (2023).
Jain, S. et al. Single-cell RNA sequencing and spatial transcriptomics reveal cancer-associated fibroblasts in glioblastoma with protumoral effects. J. Clin. Invest. 133, e147087 (2023).
Costa, A. et al. Fibroblast heterogeneity and immunosuppressive environment in human breast cancer. Cancer Cell 33, 463-479.e10 (2018).
Pelon, F. et al. Cancer-associated fibroblast heterogeneity in axillary lymph nodes drives metastases in breast cancer through complementary mechanisms. Nat. Commun. 11, 404 (2020).
Bonneau, C. et al. A subset of activated fibroblasts is associated with distant relapse in early luminal breast cancer. Breast Cancer Res. 22, 76 (2020).
Hosaka, K. et al. Pericyte-fibroblast transition promotes tumor growth and metastasis. Proc. Natl Acad. Sci. USA 113, E5618-E5627 (2016).
Finak, G. et al. Stromal gene expression predicts clinical outcome in breast cancer. Nat. Med. 14, 518-527 (2008).
Toullec, A. et al. Oxidative stress promotes myofibroblast differentiation and tumour spreading. EMBO Mol. Med. 2, 211-230 (2010).
Kwa, M. Q., Herum, K. M. & Brakebusch, C. Cancer-associated fibroblasts: how do they contribute to metastasis? Clin. Exp. Metastasis 36, 71-86 (2019).
Vennin, C. et al. CAF hierarchy driven by pancreatic cancer cell p53-status creates a pro-metastatic and chemoresistant environment via perlecan. Nat. Commun. 10, 3637 (2019).
Hilmi, M., Nicolle, R., Bousquet, C. & Neuzillet, C. Cancerassociated fibroblasts: accomplices in the tumor immune evasion. Cancers 12, 2969 (2020).
Sahai, E. et al. A framework for advancing our understanding of cancer-associated fibroblasts. Nat. Rev. Cancer 20, 174-186 (2020).
Jungwirth, U. et al. Impairment of a distinct cancer-associated fibroblast population limits tumour growth and metastasis. Nat. Commun. 12, 3516 (2021).
Wang, Z. et al. Metastasis-associated fibroblasts: an emerging target for metastatic cancer. Biomark. Res. 9, 47 (2021).
Denton, A. E., Roberts, E. W., Linterman, M. A. & Fearon, D. T. Fibroblastic reticular cells of the lymph node are required for retention of resting but not activated CD8+ T cells. Proc. Natl Acad. Sci. USA 111, 12139-12144 (2014).
Takahashi, H. et al. Immunosuppressive activity of cancerassociated fibroblasts in head and neck squamous cell carcinoma. Cancer Immunol. Immunother. 64, 1407-1417 (2015).
Ruhland, M. K. et al. Stromal senescence establishes an immunosuppressive microenvironment that drives tumorigenesis. Nat. Commun. 7, 11762 (2016).
Yang, X. et al. FAP promotes immunosuppression by cancerassociated fibroblasts in the tumor microenvironment via STAT3CCL2 signaling. Cancer Res. 76, 4124-4135 (2016).
Zhang, Y. & Ertl, H. C. Depletion of FAP+ cells reduces immunosuppressive cells and improves metabolism and functions CD8+T cells within tumors. Oncotarget 7, 23282-23299 (2016).
Cohen, N. et al. Fibroblasts drive an immunosuppressive and growth-promoting microenvironment in breast cancer via secretion of Chitinase 3-like 1. Oncogene 36, 4457-4468 (2017).
Wu, S. Z. et al. Stromal cell diversity associated with immune evasion in human triple-negative breast cancer. EMBO J. 39, e104063 (2020).
Freeman, P. & Mielgo, A. Cancer-associated fibroblast mediated inhibition of CD8+ cytotoxic T cell accumulation in tumours: mechanisms and therapeutic opportunities. Cancers 12, 2687 (2020).
Baker, A. T., Abuwarwar, M. H., Poly, L., Wilkins, S. & Fletcher, A. L. Cancer-associated fibroblasts and T cells: from mechanisms to outcomes. J. Immunol. 206, 310-320 (2021).
Gorchs, L. & Kaipe, H. Interactions between cancer-associated fibroblasts and T cells in the pancreatic tumor microenvironment and the role of chemokines. Cancers 13, 2995 (2021).
Magagna, I. et al. CD73-mediated immunosuppression is linked to a specific fibroblast population that paves the way for new therapy in breast cancer. Cancers 13, 5878 (2021).
Feig, C. et al. Targeting CXCL12 from FAP-expressing carcinomaassociated fibroblasts synergizes with anti-PD-L1 immunotherapy in pancreatic cancer. Proc. Natl Acad. Sci. USA 110, 20212-20217 (2013).
Mariathasan, S. et al. TGFbeta attenuates tumour response to PDL1 blockade by contributing to exclusion of T cells. Nature 554, 544-548 (2018).
Krishnamurty, A. T. et al. LRRC15(+) myofibroblasts dictate the stromal setpoint to suppress tumour immunity. Nature 611, 148-154 (2022).
Qi, J. et al. Single-cell and spatial analysis reveal interaction of FAP(+) fibroblasts and SPP1(+) macrophages in colorectal cancer. Nat. Commun. 13, 1742 (2022).
Grout, J. A. et al. Spatial positioning and matrix programs of cancer-associated fibroblasts promote T-cell exclusion in human lung tumors. Cancer Discov. 12, 2606-2625 (2022).
Huang, H. et al. Mesothelial cell-derived antigen-presenting cancer-associated fibroblasts induce expansion of regulatory T cells in pancreatic cancer. Cancer Cell 40, 656-673.e7 (2022).
Stahl, P. L. et al. Visualization and analysis of gene expression in tissue sections by spatial transcriptomics. Science 353, 78-82 (2016).
Jackson, H. W. et al. The single-cell pathology landscape of breast cancer. Nature 578, 615-620 (2020).
Schurch, C. M. et al. Coordinated cellular neighborhoods orchestrate antitumoral immunity at the colorectal cancer invasive front. Cell 182, 1341-1359.e19 (2020).
Andersson, A. et al. Spatial deconvolution of HER2-positive breast cancer delineates tumor-associated cell type interactions. Nat. Commun. 12, 6012 (2021).
Leader, A. M. et al. Single-cell analysis of human non-small cell lung cancer lesions refines tumor classification and patient stratification. Cancer Cell 39, 1594-1609.e12 (2021).
Phillips, D. et al. Immune cell topography predicts response to PD1 blockade in cutaneous T cell lymphoma. Nat. Commun. 12, 6726 (2021).
Fridman, W. H. et al. B cells and tertiary lymphoid structures as determinants of tumour immune contexture and clinical outcome. Nat. Rev. Clin. Oncol. 19, 441-457 (2022).
Risom, T. et al. Transition to invasive breast cancer is associated with progressive changes in the structure and composition of tumor stroma. Cell 185, 299-310.e18 (2022).
Buechler, M. B. et al. Cross-tissue organization of the fibroblast lineage. Nature 593, 575-579 (2021).
Bassez, A. et al. A single-cell map of intratumoral changes during anti-PD1 treatment of patients with breast cancer. Nat. Med. 27, 820-832 (2021).
Pal, B. et al. A single-cell RNA expression atlas of normal, preneoplastic and tumorigenic states in the human breast. EMBO J. 40, e107333 (2021).
Stuart, T. et al. Comprehensive Integration of single-cell data. Cell 177, 1888-1902.e21 (2019).
Wolf, F. A. et al. PAGA: graph abstraction reconciles clustering with trajectory inference through a topology preserving map of single cells. Genome Biol. 20, 59 (2019).
Chen, H. et al. Single-cell trajectories reconstruction, exploration and mapping of omics data with STREAM. Nat. Commun. 10, 1903 (2019).
Trapnell, C. et al. The dynamics and regulators of cell fate decisions are revealed by pseudotemporal ordering of single cells. Nat. Biotechnol. 32, 381-386 (2014).
Cao, J. et al. The single-cell transcriptional landscape of mammalian organogenesis. Nature 566, 496-502 (2019).
Bergen, V., Lange, M., Peidli, S., Wolf, F. A. & Theis, F. J. Generalizing RNA velocity to transient cell states through dynamical modeling. Nat. Biotechnol. 38, 1408-1414 (2020).
Biffi, G. & Tuveson, D. A. Diversity and biology of cancerassociated fibroblasts. Physiol. Rev. 101, 147-176 (2021).
Ohm, B., Moneke, I. & Jungraithmayr, W. Targeting cluster of differentiation 26/dipeptidyl peptidase 4 (CD26/DPP4) in organ fibrosis. Br. J. Pharmacol. 40, 661-671 (2022).
Zhang, K. W. et al. Insight into the role of DPP-4 in fibrotic wound healing. Biomed. Pharmacother. 151, 113143 (2022).
Garcia-Alonso, L., Holland, C. H., Ibrahim, M. M., Turei, D. & SaezRodriguez, J. Benchmark and integration of resources for the estimation of human transcription factor activities. Genome Res. 29, 1363-1375 (2019).
Kleshchevnikov, V. et al. Cell2location maps fine-grained cell types in spatial transcriptomics. Nat. Biotechnol. 40, 661-671 (2022).
Cable, D. M. et al. Robust decomposition of cell type mixtures in spatial transcriptomics. Nat. Biotechnol. 40, 517-526 (2022).
Dong, R. & Yuan, G. C. SpatialDWLS: accurate deconvolution of spatial transcriptomic data. Genome Biol. 22, 145 (2021).
Li, B. et al. Benchmarking spatial and single-cell transcriptomics integration methods for transcript distribution prediction and cell type deconvolution. Nat. Methods 19, 662-670 (2022).
Traag, V. A., Waltman, L. & van Eck, N. J. From Louvain to Leiden: guaranteeing well-connected communities. Sci. Rep. 9, 5233 (2019).
Polanski, K. et al. BBKNN: fast batch alignment of single cell transcriptomes. Bioinformatics 36, 964-965 (2020).
Coutant, A. et al. Spatial transcriptomics reveal pitfalls and opportunities for the detection of rare high-plasticity breast cancer subtypes. Lab. Invest. 103, 100258 (2023).
Chu, T., Wang, Z., Pe’er, D. & Danko, C. G. Cell type and gene expression deconvolution with BayesPrism enables Bayesian
integrative analysis across bulk and single-cell RNA sequencing in oncology. Nat. Cancer 3, 505-517 (2022).
Jin, S. et al. Inference and analysis of cell-cell communication using CellChat. Nat. Commun. 12, 1088 (2021).
Shao, X. et al. Knowledge-graph-based cell-cell communication inference for spatially resolved transcriptomic data with SpaTalk. Nat. Commun. 13, 4429 (2022).
Strand, S. H. et al. Molecular classification and biomarkers of clinical outcome in breast ductal carcinoma in situ: analysis of TBCRC 038 and RAHBT cohorts. Cancer Cell 40, 1521-1536.e7 (2022).
Grunwald, B. T. et al. Spatially confined sub-tumor microenvironments in pancreatic cancer. Cell 184, 5577-5592.e18 (2021).
Ligorio, M. et al. Stromal microenvironment shapes the intratumoral architecture of pancreatic cancer. Cell 178, 160-175.e27 (2019).
Danenberg, E. et al. Breast tumor microenvironment structures are associated with genomic features and clinical outcome. Nat. Genet. 54, 660-669 (2022).
Martin, K. et al. PAK proteins and YAP-1 signalling downstream of integrin beta-1 in myofibroblasts promote liver fibrosis. Nat. Commun. 7, 12502 (2016).
Bobowski-Gerard, M. et al. Functional genomics uncovers the transcription factor BNC2 as required for myofibroblastic activation in fibrosis. Nat. Commun. 13, 5324 (2022).
Puerta Cavanzo, N. et al. Verteporfin ameliorates fibrotic aspects of Dupuytren’s disease nodular fibroblasts irrespective the activation state of the cells. Sci. Rep. 12, 13940 (2022).
Houthuijzen, J. M. et al. CD26-negative and CD26-positive tissueresident fibroblasts contribute to functionally distinct CAF subpopulations in breast cancer. Nat. Commun. 14, 183 (2023).
Merrick, D. et al. Identification of a mesenchymal progenitor cell hierarchy in adipose tissue. Science 364, eaav2501 (2019).
Shen, H. et al. The Hippo pathway links adipocyte plasticity to adipose tissue fibrosis. Nat. Commun. 13, 6030 (2022).
Mhaidly, R. & Mechta-Grigoriou, F. Inflammatory fibroblasts make rectal cancer resistant to radiation therapy. Cancer Cell 40, 122-124 (2022).
Nicolas, A. M. et al. Inflammatory fibroblasts mediate resistance to neoadjuvant therapy in rectal cancer. Cancer Cell 40, 168-184.e13 (2022).
Nalio Ramos, R. et al. Tissue-resident FOLR2(+) macrophages associate with CD8(+) T cell infiltration in human breast cancer. Cell 185, 1189-1207.e25 (2022).
McNally, S. & Stein, T. Overview of mammary gland development: a comparison of mouse and human. Methods Mol. Biol. 1501, 1-17 (2017).
Toss, M. S. et al. Prognostic significance of tumor-infiltrating lymphocytes in ductal carcinoma in situ of the breast. Mod. Pathol. 31, 1226-1236 (2018).
Wolff, A. C. et al. Human epidermal growth factor receptor 2 testing in breast cancer: American Society of Clinical Oncology/ College of American Pathologists Clinical Practice Guideline Focused Update. J. Clin. Oncol. 36, 2105-2122 (2018).
Goldhirsch, A. et al. Strategies for subtypes-dealing with the diversity of breast cancer: highlights of the St. Gallen International Expert Consensus on the Primary Therapy of Early Breast Cancer 2011. Ann. Oncol. 22, 1736-1747 (2011).
Crowell, H. L. et al. muscat detects subpopulation-specific state transitions from multi-sample multi-condition single-cell transcriptomics data. Nat. Commun. 11, 6077 (2020).
Albergante, L. et al. Robust and scalable learning of complex intrinsic dataset geometry via ElPiGraph. Entropy 22, 296 (2020).
Butler, A., Hoffman, P., Smibert, P., Papalexi, E. & Satija, R. Integrating single-cell transcriptomic data across different conditions, technologies, and species. Nat. Biotechnol. 36, 411-420 (2018).
Xie, Z. et al. Gene set knowledge discovery with Enrichr. Curr. Protoc. 1, e90 (2021).
Gueguen, P. et al. Contribution of resident and circulating precursors to tumor-infiltrating CD8(+) T cell populations in lung cancer. Sci. Immunol. 6, eabd5778 (2021).
Timperi, E. et al. Lipid-associated macrophages are induced by cancer-associated fibroblasts and mediate immune suppression in breast cancer. Cancer Res. 82, 3291-3306 (2022).
Alshetaiwi, H. et al. Defining the emergence of myeloid-derived suppressor cells in breast cancer using single-cell transcriptomics. Sci. Immunol. 5, eaay6017 (2020).
Asrir, A. et al. Tumor-associated high endothelial venules mediate lymphocyte entry into tumors and predict response to PD-1 plus CTLA-4 combination immunotherapy. Cancer Cell 40, 318-334.e19 (2022).
Geldhof, V. et al. Single cell atlas identifies lipid-processing and immunomodulatory endothelial cells in healthy and malignant breast. Nat. Commun. 13, 5511 (2022).
Bankhead, P. et al. QuPath: open source software for digital pathology image analysis. Sci. Rep. 7, 16878 (2017).
Kim, D. et al. TopHat2: accurate alignment of transcriptomes in the presence of insertions, deletions and gene fusions. Genome Biol. 14, R36 (2013).
Langmead, B. & Salzberg, S. L. Fast gapped-read alignment with Bowtie 2. Nat. Methods 9, 357-359 (2012).
شكر وتقدير
نحن ممتنون لليتيشيا فهرمان، شارلوت مارتينات وأندريا غونكالفيس لجمع البيانات السريرية للمرضى (SIRIC، INCa-DGOS4654)؛ لليتيشيا ليساج وأندريه نيكولاس لمساعدتهما في منصة علم الأمراض التجريبية وكورالي غويرين وليا غويونيت في مركز السيتومتر. تم دعم منصة ICGex NGS من قبل منح ANR-10-EQPX-03 (Equipex) وANR-10-INBS-09-08 (ائتلاف فرنسا الجينومي). يتم دعم H.C. من قبل مؤسسة البحث الطبي (FRM، رقم المنحة 13683)، وR.M. من قبل مؤسسة فرنسا (00119142/WB-2021-36276). G.G. وF.M.-G. هما علماء دائمون في إنسرم. يتم دعم Y.K. من قبل المعهد الوطني للسرطان وINCa (INCa-DGOS-9963؛ INCa-11692). تم دعم العمل التجريبي من خلال منح من الرابطة الوطنية لمكافحة السرطان (LNCC، التصنيف)، إنسرم (PC201317)، INCa (CaLYS INCa-11692، CAFHeros INCa-16101)، ITMO Cancer من Aviesan (إطار استراتيجية السيطرة على السرطان 2021-2030، Pre-Caution)، SIGN’it 2019 من مؤسسة ARC، TRANSCAN-3 ERA-NET CHRYSALIS (ARCPARTNTRANS2O22080005422) وماغنوليا (INCa-16786)، وANR كجزء من PIA فرنسا 2030 مع تمويل CASSIOPEIA RHU (ANR-21-RHUS-0002). تعترف F.M.-G. بـ “جمعية الشريط الوردي الفرنسية” و”مؤسسة سيمون وسينو ديل دوكا” لتخصيص جوائزهم الكبرى، بالإضافة إلى FRM لجائزة روزن وLNCC لجائزة دوكيسن. F.M.-G. ممتنة جدًا لجميع مموليها على دعمهم على مر السنين.
مساهمات المؤلفين
ف.م.-ج. تصور المشروع بالكامل وصمم مفهوم التجارب. ه.س. و ي.ك. نفذا جميع التحليلات البيوانفورماتية والإحصائية بمشاركة أ.م. ر.م. نفذ التجارب وجمع البيانات، مع ج.ج. و س.ر. أ.ف.-س. أنشأ مجموعات من المرضى، وقدم عينات بشرية وخبرة في تحليلات علم الأمراض، مع ل.د. الذي قام بتعليق أقسام سرطان الثدي. ر.ل.، ج.ج. و ر.م. نفذوا ترانسكريبتوميات مكانية في منصة علم الأمراض التجريبية التي ترأسها د.م. في قسم أ.ف.س. ف.ب. نفذ بيانات الخلايا المفردة من CAP من مرضى سرطان الثدي. إ.ر. قدمت خبرة في الخلايا النخاعية. س.ب. و م.ب. نفذا تسلسل الجيل الجديد. أ.ب. هو مدير المشروع و المساعدة في الحصول على التمويل. أشرف ف.م.-ج. على المشروع بأكمله وكتب الورقة مع هـ.س.، ي.ك. و ر.م.، مع اقتراحات من جميع المؤلفين.
المصالح المتنافسة
تلقى F.M.-G. دعمًا بحثيًا من Innate-Pharma وRoche وInstitut Roche وBristol-Myers-Squibb (BMS). حصل E.R. على منح من BMS وAstraZeneca وJanssen-Cilag وFonds Amgen France؛ ودعم سفر من BMS وHoffmann La Roche وAstraZeneca وMerck Sharp & Dohme. يعلن المؤلفون الآخرون عدم وجود أي تضارب محتمل في المصالح.
يجب توجيه المراسلات والطلبات للحصول على المواد إلى فاطمة مشتا-غريغوريou.
معلومات مراجعة الأقران تشكر مجلة Nature Communications كريستوفر هانلي والمراجعين الآخرين المجهولين على مساهمتهم في مراجعة هذا العمل. يتوفر ملف مراجعة الأقران.
معلومات إعادة الطباعة والتصاريح متاحة على http://www.nature.com/reprints ملاحظة الناشر: تظل شركة سبرينجر ناتشر محايدة فيما يتعلق بالمطالبات القضائية في الخرائط المنشورة والانتماءات المؤسسية.
الوصول المفتوح هذه المقالة مرخصة بموجب رخصة المشاع الإبداعي النسب 4.0 الدولية، التي تسمح بالاستخدام والمشاركة والتكيف والتوزيع وإعادة الإنتاج بأي وسيلة أو صيغة، طالما أنك تعطي الائتمان المناسب للمؤلفين الأصليين والمصدر، وتوفر رابطًا لرخصة المشاع الإبداعي، وتوضح ما إذا تم إجراء تغييرات. الصور أو المواد الأخرى من طرف ثالث في هذه المقالة مشمولة في رخصة المشاع الإبداعي الخاصة بالمقالة، ما لم يُشار إلى خلاف ذلك في سطر الائتمان للمواد. إذا لم تكن المادة مشمولة في رخصة المشاع الإبداعي الخاصة بالمقالة وكان استخدامك المقصود غير مسموح به بموجب اللوائح القانونية أو يتجاوز الاستخدام المسموح به، فستحتاج إلى الحصول على إذن مباشرة من صاحب حقوق الطبع والنشر. لعرض نسخة من هذه الرخصة، قم بزيارةhttp://creativecommons.org/رخصة/بواسطة/4.0/. (ج) المؤلف(ون) 2024
معهد كوري، مختبر الضغط والسرطان، فريق معتمد من الرابطة الوطنية لمكافحة السرطان، جامعة PSL للبحث، 26، شارع أولم، F-75248 باريس، فرنسا.إنسرم، U830، 26، شارع أولم، F-75005 باريس، فرنسا.قسم الطب التشخيصي والعلاج، مجموعة مستشفيات إينstitut كوري، 26، شارع أولم، F-75248 باريس، فرنسا.معهد كوري، جامعة PSL للبحث، منصة تسلسل الجيل التالي ICGex، 75005 باريس، فرنسا.معهد كوري، جامعة PSL للبحث، مبادرة الخلية الواحدة، 75005 باريس، فرنسا.قسم الأورام الطبية، مركز علاج السرطان المناعي، معهد كوري، 26، شارع أولم، F-75248 باريس، فرنسا.ساهم هؤلاء المؤلفون بالتساوي: هوجو كرويزر، رنا محيدلي، يان كيفر.البريد الإلكتروني: fatima.mechta-grigoriou@curie.fr
Although heterogeneity of FAP+ Cancer-Associated Fibroblasts (CAF) has been described in breast cancer, their plasticity and spatial distribution remain poorly understood. Here, we analyze trajectory inference, deconvolute spatial transcriptomics at single-cell level and perform functional assays to generate a high-resolution integrated map of breast cancer (BC), with a focus on inflammatory and myofibroblastic (iCAF/myCAF) FAP+ CAF clusters. We identify 10 spatially-organized FAP+ CAF-related cellular niches, called EcoCellTypes, which are differentially localized within tumors. Consistent with their spatial organization, cancer cells drive the transition of detoxification-associated iCAF (Detox-iCAF) towards immunosuppressive extracellular matrix (ECM)-producing myCAF (ECM-myCAF) via a DPP4- and YAP-dependent mechanism. In turn, ECM-myCAF polarize TREM2+ macrophages, regulatory NK and T cells to induce immunosuppressive EcoCellTypes, while Detox-iCAF are associated with FOLR2+ macrophages in an immuno-protective EcoCellType. FAP+ CAF subpopulations accumulate differently according to the invasive BC status and predict invasive recurrence of ductal carcinoma in situ (DCIS), which could help in identifying low-risk DCIS patients eligible for therapeutic de-escalation.
Breast cancer ( BC ) is one of the most frequent cancers in women and a major cause of death in western countries, despite recent improvements in its earlier detection and the development of effective therapies. BC is a heterogeneous disease classified by histological analysis into three main subtypes exhibiting distinct prognoses: luminal (Lum), HER2, and triple-negative (TN). It is important to note that there is still no biomarker to predict BC progression from ductal carcinoma in situ (DCIS) to invasive BC (IBC). It is now well established that the tumor
micro-environment (TME) plays a key role in tumor growth and progression. The TME is composed of cancer-associated fibroblasts (CAF), infiltrating immune cells, endothelial cells and pericytes embedded in extracellular matrix (ECM), involved in numerous steps of tumor growth and metastatic spread. CAF constitute one of the most abundant TME components in solid tumors. While underestimated for a long time, CAF heterogeneity is now well-recognized. Indeed, several CAF populations have been recently uncovered in human BC by
combining the study of multiple CAF markers including Fibroblast Activation Protein (FAP), Smooth Muscle- Actin (SMA) and Integrin (CD29), among others . We previously identified four CAF populations, referred to as CAF-S1 to CAF-S4 in BC . The myofibroblastic CAF-S1 population (FAP CD29 SMA ) and the perivascularlike CAF-S4 (FAP CD29 SMA , also highlighted by others as cancer-associated perivascular-like or CAP) are detected in tumors and enriched in TN BC. The existence of these different CAF and CAP populations was confirmed by numerous methods, including single cell analysis, and demonstrated in other cancer types and in various species .
Myofibroblastic CAF populations are pro-metastatic, and their content has been associated with BC progression . In particular, the myofibroblastic CAF-S1 and the perivascular-like CAP (CAF-S4) populations enhance tumor invasion through complementary mechanisms by acting on tumor cells and the surrounding ECM, respectively . In addition, FAP+CAF (or CAF-S1) fibroblasts have also been associated with an immunosuppressive environment in various tumor types . Indeed, FAP+ CAF promote immunosuppression through multiple mechanisms: they attract CD4+ CD25+ T lymphocytes, enhance their survival and promote their differentiation into FOXP3+ regulatory T lymphocytes (Tregs), while they simultaneously inhibit CD8+ T cell cytotoxicity . Moreover, FAP+ CAF have been shown to contribute to immunotherapy resistance in mouse and human cancers . As FAP+ CAF exhibited both pro-metastatic and immunosuppressive activities, we previously hypothesized that this population could itself be heterogenous and we generated one of the most resolutive single-cell RNA sequencing data (scRNA-seq) of the population in . We found that the FAP+ CAF population is composed of 8 cellular clusters, including three inflammatory (iCAF) and five myofibroblastic (myCAF) clusters ; iCAF and myCAF having been previously identified in pancreatic ductal adenocarcinoma (PDAC) . Based on differentially expressed genes as previously described in detail , the three iCAF clusters are characterized by detoxification pathway (Detox-iCAF), interleukin-signaling pathway (IL-iCAF) and IFN -mediated response (IFN -iCAF). IFN -iCAF express the CD74 antigen and are potentially reminiscent of the antigenpresenting CAF (ap-CAF) identified in PDAC . The five myCAF clusters are characterized by a high expression of genes coding ECM proteins (ECM-myCAF), TGF signaling pathway (TGF -myCAF), wound healing (Wound-myCAF), IFN -mediated response (IFN myCAF) and acto-myosin pathway (acto-myCAF) . ECM-myCAF and TGF -myCAF clusters accumulate in BC enriched in PD-1+, CTLA-4+, and TIGIT+ CD4+ T lymphocytes, themselves enriched in Tregs. Importantly, ECM-myCAF, TGF -myCAF and Wound-myCAF clusters are associated with primary resistance to immunotherapies in melanoma and non-small cell lung cancer patients .
Although the role of FAP+ CAF clusters in metastatic spread, immunosuppression and resistance to immunotherapies is now wellestablished, their spatial localization, plasticity and reciprocal crosstalk with surrounding cells remain unanswered questions. Efforts to understand the cellular organization in BC has revealed co-occurring cell types in bulk-RNAseq dataset , yet these studies lacked spatial context. Moreover, multiplex imaging techniques remain limited by the number of stained proteins and cannot identify diverse cell states. Spatial transcriptomics recently provided a new means to fulfill this lack . As first examples, several recent studies demonstrated that immune cells are not randomly distributed in tumors but organized into niches, which facilitate their functions and can predict response to immunotherapies and patient prognosis .
Here, we combine single-cell trajectory inference, deconvolution of spatial transcriptomics data and functional assays using primary FAP+ CAF isolated from BC patients to uncover the plasticity and spatial organization of these fibroblasts with other cell types, thus addressing the limitations of previous studies. We unravel FAP+ CAF
plasticity and crosstalk with both cancer and immune cells, and we identify 10 spatially-organized FAP+ CAF cluster-related cellular modules referred to as EcoCellTypes (ECT), which are composed of specific FAP+ CAF clusters and precisely localized within tumors. Immunosuppressive and immuno-permissive ECT comprise specific FAP+ CAF clusters and immune populations located at various distances from tumor aggregates and blood vessels. Consistent with the spatial organization of these FAP+ CAF cluster-related ECT, we observe that cancer cells promote the differentiation of the Detox-iCAF cluster into Wound-myCAF and ECM-myCAF clusters through DPP4- and YAP1dependent mechanisms both in vitro and in vivo. Furthermore, our study reveals that FAP+ CAF clusters play a key role in the organization of ECT. Indeed, Detox-iCAF, IL-iCAF and IFN -iCAF recruit monocytes and induce a FOLR2+ tumor-associated macrophage (TAM) phenotype, while ECM-myCAF and TGF -myCAF promote TREM2+ TAM and NKG2A+ regulatory NK phenotypes. As CAF have recently been associated with invasion in Ductal Carcinoma in Situ (DCIS) , we go a step further by analyzing the role of these different clusters in BC progression. By using in-house and public cohorts of BC patients with DCIS, we show that the FAP+ Detox-iCAF cluster content significantly decreases from DCIS to IBC, consistent with their transition into ECMmyCAF. Importantly, we also observe that low Detox-iCAF and high TGF -myCAF content in DCIS at diagnosis predicts the recurrence of DCIS into IBC, independently of nuclear grade or molecular subtype, thereby revealing a prognostic factor for recurrence based on specific FAP+CAF clusters. These findings will help in identifying DCIS patients with low-risk of progression, who might benefit from therapeutic deescalation.
Results
FAP+CAF plasticity revealed by in silico analysis and functional assays
We previously identified 8 clusters of FAP+ CAF (CAF-S1) in breast cancer (BC) by scRNA-seq (Supplementary Fig. 1A), but the origin of this heterogeneity in BC is poorly understood. We hypothesized that one particular FAP+CAF cluster might be the reservoir of the others. In line with this hypothesis, we found that part of the DetoxiCAF cluster retained PI16 (Peptidase Inhibitor 16) expression (Supplementary Fig. 1B) which has recently been identified as a marker of universal fibroblasts . We validated these observations using an independent public scRNA-seq datasets from BC and healthy mammoplasties . Label transfer enabled us to confirm the existence of the different FAP+ CAF clusters in BC, as well as 2 fibroblast clusters from healthy mammoplasties (Fig. 1A). Interestingly, the Detox-iCAF cluster formed a transcriptional continuum with Pl16+ universal fibroblasts (Fig. 1B), indicating that the FAP+ Detox-iCAF cluster might be the reservoir of the other FAP+CAF clusters. As DetoxiCAF showed transcriptional similarities with universal fibroblasts, we sought to confirm that the Detox-iCAF cluster was transcriptionally different from normal fibroblasts. Differential analysis between fibroblasts from healthy mammary tissue and Detox-iCAF confirmed that Detox-iCAF showed a large number of up-regulated genes compared to normal fibroblasts, such as FAP (Fig. 1C), consistent with the CAF-S1 isolation method based on FAP marker . To account for sample size inflation in scRNA-seq data, we confirmed this result at sample level after pseudo-bulk reconstruction (Supplementary Fig. 1C, see also “Methods”, #”Differential analysis between fibroblasts from healthy tissue and Detox-iCAF”). To investigate how FAP+ CAF cluster diversity emerged, we applied several trajectory inference methods on the FAP+ CAF-enriched scRNA-seq dataset isolated from BC, setting the Detox-iCAF cluster as the root of the trajectories. PAGA tree revealed transitions from the Detox-iCAF to IL-iCAF and IFN -iCAF clusters and a direct trajectory from the Detox-iCAF to the ECMmyCAF cluster, which in turn gave rise to the TGF -myCAF cluster (Fig. 1D). The trajectory inference method STREAM uncovered similar
trajectories between the different FAP+ CAF clusters (Fig. 1E). In addition, STREAM detected an indirect transition between Detox-iCAF and ECM-myCAF through the Wound-myCAF cluster, as well as a trajectory from ECM-myCAF to IFN -myCAF (Fig. 1E). Monocle3 recapitulated PAGA tree and STREAM by detecting both the direct trajectory between Detox-iCAF and ECM-myCAF clusters, and the
indirect transition through the Wound-myCAF cluster (Fig. 1F). From Monocle3 trajectories, we computed the pseudotime by rooting the trajectory in the Detox-iCAF (Supplementary Fig. 1D). This revealed an early loss of Pl16 expression, quickly followed by a progressive loss of GPC3 expression in Detox-iCAF and the gradual upregulation of DLK1 in IL-iCAF and CCL19 in IFNү-iCAF (Fig. 1G), GPC3, DLK1 and CCL19
Fig. 1 | In silico analysis of FAP+CAF plasticity in human breast cancer. A UMAP combining FAP+ CAF from BC (Left) and fibroblasts from healthy breast tissues (Right, cells), colored by cluster identity. B Pl16 gene expression. C Differential gene expression between Detox-iCAF and normal fibroblasts. values from two-sided Wilcoxon rank sum test. In red, genes with adjusted value . Trajectory inferences on BC FAP+ CAF scRNA-seq dataset from ref. 10 inferred by PAGA tree (10 random downsampling) (D), STREAM trajectory showing cluster proportion along pseudotime (E) and Monocle . G Expression of FAP+ CAF cluster markers according to Monocle 3 pseudotime and colored according to cluster identity. Left, velocities from scVelo on the FAP+ CAF UMAP. Right, spliced/unspliced phase portrait and expression on UMAP for COL5A2 (Top) and COL1A2 (Bottom) genes. I Percentages of iCAF (ANTXR1-) and myCAF (ANTXR1+) clusters among FAP+ CAF cultured on collagen-coated or plastic dishes ( independent experiments). value from two-sided Fisher’s Exact test. J Same as (I) for FAP+ CAF cluster identity using specific markers by flow cytometry ( ).
K Flow cytometry plots showing FAP+ CAF cluster-specific surface markers in sorted primary FAP+CAF.L Percentage of each FAP+CAF cluster among FAP+CAF (flow cytometry data) after co-culture of Detox-iCAF with MCF7. Timepoints indicate the duration of co-culture ( independent experiments). M-O Same as ( ) for co-culture of Detox-iCAF with T47D (M), MDA-MB-231 (N) and MCF10A (O). Same as ( ) for co-culture of IL-iCAF ( ) or IFN -iCAF ( ) with MCF7. All data are mean SEM. Left, UMAP of fibroblasts from scRNA-seq data following TN BC cell injection from ref. 9 colored by cell identity ( fibroblasts). Right, quantification at 0,14 and 28 days after tumor implantation. S Same as ( ) for fibroblasts from scRNA-seq data following subcutaneous injection of PDAC cell line in WT mice ( fibroblasts) (Left) and in Lrrc15-diphteria toxin receptor knock-in mice ( cells) (Right) from ref. 42 . Quantification after tumor implantation at and 31 days. Source data are provided as a Source Data file.
being specific markers of Detox-iCAF, IL-iCAF and IFN -iCAF clusters, respectively . In addition, SDC1 and LAMP5 expression (defined as specific markers of ECM-myCAF and TGF -myCAF, respectively ) were sequentially upregulated in the ECM-myCAF and then in the TGF myCAF clusters (Fig. 1G). To validate the directionality of the trajectories, we leveraged the splicing information (Fig. 1H) by using the RNA velocity method scVelo . RNA velocity analyses confirmed the directionality of the transitions, including Detox-iCAF to ECM-myCAF and ECM-myCAF to TGF -myCAF (Fig. 1H, Left). Moreover, RNA velocity revealed the dynamics of gene expression patterns, such as the induction of COL5A2 in the Detox-iCAF to reach stable expression in the ECM-myCAF and repression of COL1A2 in the transition from ECMmyCAF to TGF -myCAF (Fig. 1 H , Right).
We next performed functional assays to validate FAP+CAF cluster trajectories identified in silico, particularly the transitions from DetoxiCAF to Wound-myCAF and ECM-myCAF, as these two last clusters are indicative of immunotherapy resistance . To do so, we established primary cultures of the different FAP+ CAF clusters (see “Methods”, #”Isolation and culture of primary FAP+ CAF clusters”). We confirmed that these fibroblasts were all positive for FAP, with a higher percentage of ANTXR1+ FAP+ myCAF clusters when expanded on plastic dishes and of ANTXR1- FAP+ iCAF clusters on collagen-coated dishes (Fig. 1I and Supplementary Fig. 1E, F), as observed in PDAC . Using specific CAF cluster markers , we found that primary FAP+ CAF expanded on plastic dishes were composed on average of 54% ECMmyCAF (ANTXR1+ SDC1+ LAMP5-), TGF -myCAF (ANTXR1+ SDC1+/- LAMP5+) and 32% IFN -iCAF (ANTXR1- DLK1- GPC3- CD74+). Meanwhile, FAP+ CAF cultured on collagen-coated dishes were Detox-iCAF (ANTXR1- DLK1+/- GPC3+), 22% IL-iCAF (ANTXR1- GPC3DLK1+) and 18% IFN -iCAF (ANTXR1-DLK1-GPC3-CD74+) (Fig. 1J and Supplementary Fig. 1E, F). We next isolated pure FAP+ CAF clusters in vitro. By using the aforementioned specific markers, we sorted ECMmyCAF and TGF -myCAF clusters and cultured them on plastic dishes on the one hand, and we isolated Detox-iCAF, IL-iCAF and IFN -CAF clusters and kept them on collagen-coated dishes on the other hand (Fig. 1K). We confirmed by flow cytometry (Supplementary Fig. 1G) that these different primary FAP+ CAF clusters exhibited the same profiles for each marker as those used to characterize them in BC patient samples (Supplementary Fig. 1H). We also performed bulk RNA sequencing from each CAF population and validated that the transcriptomic profiles of the in vitro sorted CAF-S1 clusters are similar to those of the subpopulations originally identified in patients (Supplementary Fig. 1I).
We took advantage of these different primary FAP+ CAF clusters in culture to analyze the mechanisms driving their plasticity and guiding their identity. Considering that the Detox-iCAF cluster was the root of FAP+CAF cluster trajectories, we hypothesized that the DetoxiCAF cluster could give rise to other FAP+ CAF clusters in presence of cancer cells. We thus co-cultured Detox-iCAF in presence of the
luminal BC cell line MCF7 and tested the impact of this co-culture on Detox-iCAF phenotype at different timepoints (Fig. 1L and Supplementary Fig. 2A). We observed an immediate increase in the percentage of ECM-myCAF at early timepoints of the co-culture ( ), followed by an increase in the content of Wound-myCAF (starting at . ECM-myCAF and Wound-myCAF clusters kept increasing gradually at later timepoints. These functional assays are consistent with the two trajectories identified in silico, i.e. the direct trajectory from DetoxiCAF to ECM-myCAF and the indirect path going through WoundmyCAF. At later phases of the kinetic (from 10 to 72 h ), the level of IFN -iCAF, IL-iCAF and TGF -myCAF also increased, once again confirming the trajectories identified by in silico approaches (Fig. 1L and Supplementary Fig. 2A). Finally, at the latest kinetic timepoints ( 48 h , 72 h and 8 days), the ECM-myCAF cluster accumulated the most at the expense of the Wound-myCAF and Detox-iCAF clusters (Fig. 1L and Supplementary Fig. 2A). Moreover, co-culture of Detox-iCAF with two alternative breast cancer cell lines (T47D and MDA-MB-231) confirmed transitions from Detox-iCAF toward ECM-myCAF in presence of cancer cells (Fig. 1M, N and Supplementary Fig. 2B, C). Importantly, maintenance of Detox-iCAF alone (Supplementary Fig. 2D) or co-culture with non-tumoral breast epithelial cells (MCF10A) (Fig. 10 and Supplementary Fig. 2E) did not induce Wound-myCAF or ECM-myCAF, showing that the presence of cancer cells is required to induce these clusters. Moreover, consistent with the trajectories, neither IL-iCAF nor IFN -iCAF co-cultured with MCF7 were efficiently converted into Wound-myCAF or ECM-myCAF clusters (Fig. 1P, Q and Supplementary Fig. 2F, G). To confirm these observations in vivo, we leveraged previously published scRNA-seq datasets, which examined changes in TME composition following tumor implantation in mice (Fig. 1R, S). In these mouse models, and cancer cells were transplanted, followed by sampling and scRNA-seq at different timepoints after grafting. We isolated fibroblasts from the two datasets and annotated the different clusters using label transfer, thereby identifying Detox-iCAF, Wound-myCAF and ECM-myCAF as the main FAP+CAF clusters in these BC and PDAC mouse models (Supplementary Fig. 2H). At the time of cancer cell transplantation, we detected a high content of the Detox-iCAF cluster in the two datasets (Fig. 1R, S). Interestingly, at later timepoints, we observed a gradual loss of Detox-iCAF in favor of ECM-myCAF, and at a lesser extent, of Wound-myCAF in both BCand PDAC-bearing mice (Fig. 1R, S, Left). As LRRC15 was also identified as a specific marker of ECM-myCAF in human BC (Supplementary Fig. 2I), we took advantage of the recently published -diphteria toxin receptor knock-in PDAC mouse model to investigate how FAP+ CAF cluster composition evolved after ECM-myCAF depletion in vivo. In agreement with the trajectories, selective ablation of ECM-myCAF led to a shift in the proportions of CAF-S1 clusters in favor of DetoxiCAF and Wound-myCAF clusters (Fig. 1S, Right). Moreover, when depletion was halted, we observed a rapid resurgence of ECM-myCAF with a diminution of both Detox-iCAF and Wound-myCAF (Fig. 1S,
Right). Thus, consistent with in silico trajectories among FAP+ CAF clusters, these findings show that cancer cells promote a switch from a detoxification-associated inflammatory pathway (Detox-iCAF) to a myofibroblastic signature (ECM-myCAF) in FAP+ CAF both in vitro and in vivo.
Cancer cells convert Detox-iCAF into ECM-myCAF through a DPP4- and YAP1-dependent mechanism
We next sought to elucidate the molecular mechanisms involved in FAP+ CAF cluster plasticity, focusing on the direct transition from Detox-iCAF to ECM-myCAF, and the indirect path through WoundmyCAF. We first performed a differential analysis of the genes expressed by FAP+ CAF isolated from the direct transition versus all other FAP+ CAF from human BC single cell RNAseq data (Supplementary Fig. 2J). Using this approach, we identified DPP4 (Dipeptidyl Peptidase 4) as the main up-regulated gene in FAP+ CAF in the direct transition between Detox-iCAF and ECM-myCAF (Fig. 2A, B). In the two scRNA-seq datasets from TNBC and PDAC mouse models, DPP4 expression was also specifically upregulated in Detox-iCAF but progressively declined in the Wound-myCAF and ECM-myCAF clusters (Fig. 2C). Previous studies in other pathologies have demonstrated that inhibition of DPP4 can lead to reduced pathological fibrosis, which suggests that DPP4 may play a crucial role in myofibroblast formation , and highlight the pertinence of DPP4 in the direct transition from Detox-iCAF to ECM-myCAF. Regarding the indirect transition, we identified 7 YAP1-TEAD (Yes-Associated Protein-Transcriptional Enhanced Associate Domain)-target genes among the top-50 up-regulated genes in the indirect pathway via the Wound-myCAF (Supplementary Fig. 2J). Moreover, by computing transcription factor activity scores using Dorothea , we confirmed that TEAD activity was specifically increased in FAP+ CAF undergoing the indirect transition in human BC (Fig. 2D, E), as well as in the WoundmyCAF in TNBC and PDAC mouse models (Fig. 2F).
We next tested if DPP4- and TEAD-dependent molecular pathways were involved in the generation of ECM-myCAF from Detox-iCAF by performing functional assays in vitro. We first analyzed the impact of DPP4 silencing (Fig. 2G) on FAP+ CAF cluster plasticity (Fig. 2H, I). DPP4 silencing prevented the increase in ECM-myCAF content at early timepoints ( 15 and 30 min ) and delayed the transition from Detox-iCAF to ECM-myCAF after 1 h to 2 h of co-culture (Fig. 2 H , I). In contrast, DPP4 inactivation had no impact on the transition toward WoundmyCAF (Fig. 2H, I), confirming that DPP4 might be involved in the direct transition between Detox-iCAF and ECM-myCAF but not in the indirect path through Wound-myCAF. We next tested the impact of the TEAD transcription factors on the indirect transition. As there are different members of the TEAD family, we inactivated the TEAD coactivator YAP1. While YAP1 silencing (Fig. 2J) had no impact on the increase of ECM-myCAF at early timepoints of the co-culture (15 and 30 min ), it almost completely abolished the transition from DetoxiCAF to Wound-myCAF detected after 1 h of co-culture under control conditions (Fig. 2K, L). Moreover, at 10 h and 24 h timepoints, the percentages of ECM-myCAF cells were higher upon YAP1 silencing compared to controls (Fig. 2K, L), suggesting that the direct transition from Detox-iCAF to ECM-myCAF clusters might compensate YAP1 silencing. Therefore, we tested the hypothesis of a compensatory mechanism between the two trajectories. Specifically, we investigated whether DPP4 silencing caused an increase in YAP1-dependent indirect transition, and conversely, whether YAP1 silencing leads to increased DPP4-dependent direct transition. Interestingly, inactivation of both DPP4 and YAP1 blocked both the direct transition from Detox-iCAF to ECM-myCAF and the indirect path through the Wound-myCAF cluster (Fig. 2M-O). Moreover, consistent with this compensatory mechanism, YAP1 protein level remained unchanged upon DPP4 inactivation and DPP4 protein level was not affected by YAP1 inactivation throughout the kinetics of co-culture with cancer cells (Fig. 2P),
suggesting that ECM-myCAF can be generated by two different trajectories and that one can replace the other when one is inactivated. Taken together, these results highlight the crucial role of DPP4 and YAP1/TEAD in driving the emergence of ECM-myCAF from Detox-iCAF through two independent mechanisms, shedding light on the molecular interactions underlying cancer immune escape.
Based on recent data showing that the TGF /TGFBR 2 axis drives LRRC15+ ECM-myCAF differentiation in PDAC mouse models , we wondered if this pathway could be involved in CAF-S1 cluster plasticity. We first observed that TGF stimulation, validated by SMAD family member 2 (SMAD2) phosphorylation, gradually increased the ECMmyCAF content (Supplementary Fig. ), suggesting that is sufficient to promote the transition from Detox-iCAF to ECM-myCAF. Reciprocally, silencing of TGFBRII in Detox-iCAF prevented the transition from Detox-iCAF to ECM-myCAF in the presence of cancer cells (Fig. 2Q, R), confirming that TGFBR2 is necessary for this transition. Collectively, these data highlight the role of the TGF TGFBR2dependent pathway in the emergence of ECM-myCAF from DetoxiCAF. Finally, we evaluated the impact of conditioned medium (CM) derived from MCF7 cancer cells on Detox-iCAF and observed that CM promoted the transition from Detox-iCAF to Wound-myCAF (Supplementary Fig. 2N, O). The pattern of induced clusters differed between TGF and CM stimulation, suggesting that CM contains other secreted signaling molecules in addition to which promote this specific transition and that the -mediated effect requires direct contact between cancer cells and Detox-iCAF.
Spatial organization of clusters in breast cancer
Our next goal was to gain insights into FAP+ CAF cluster plasticity based on their spatial organization in BC and interactions with surrounding cells. Thus, we performed spatial transcriptomics on 4 luminal (Lum) and 3 triple negative (TN) BC (Supplementary Fig. 3A). Three sections were isolated from the tumor bed and 4 at the invasive margin, based on pathological annotations (Fig. 3A). On average, we sequenced 2391 spots per section and captured 3896 genes per spot (Supplementary Fig. 3B). We supplemented this dataset by analyzing 10 additional publicly available BC sections covering 47,830 spatial regions. Morphological annotations enabled us to differentiate tumors, invasive margins and peritumors (Fig. 3A). In the tumor compartment, pathologists distinguished cancer cells, intra-tumor stroma, as well as normal lobules and ducts. In peritumors, pathologists identified normal lobules and ducts containing normal epithelial and myoepithelial cells surrounded by basement membrane and paleal stroma, as well as interlobular conjunctive tissue and lymphocyte aggregates (Fig. 3A). For further analysis, we transferred the digital pathological annotations on the spatial data by computing the area of each pathological annotation covered by each spot (Supplementary Fig. 3C-E). We then mapped and estimated the abundance of the different cell types in each spot by applying the deconvolution method cell2location . As input to cell2location, we computed a matrix of reference cell types by generating and annotating a high-resolution BC cellular atlas that we built from newly generated BC scRNA-seq data and publicly available datasets (Supplementary Fig. 4A, B). This BC atlas comprised 73,426 high-quality cells and encompassed 39 different cell types and states, thereby representing a comprehensive BC cellular landscape (Fig. 3B and Supplementary Fig. 4C). We defined the identity of each cell type by label transfer (for FAP+ CAF and CAP clusters, Supplementary Fig. 4D) and marker-based annotations (Supplementary Fig. 4E). We also used Copy Number Variation (CNV) profiles to confirm cancer cell identity (Supplementary Fig. 4F). To ensure that our BC atlas was complete, we transferred our high-resolution annotations on other independent published BC scRNA-seq datasets and confirmed that all BC cell types and states were covered (Supplementary Fig. 4G).
We next deconvoluted spatial transcriptomics data from the 17 BC sections at single cell-like resolution by applying cell2location using our scRNA-seq BC atlas as reference (Fig. 3C and Supplementary Fig. 5A, B for representative deconvoluted sections). Several cell types identified by deconvolution were first morphologically confirmed by pathologists (Supplementary Fig. 6A-C). We also tested RCTD and
SpatialDWLS, two other top-performing deconvolution methods , both of which produced results entirely consistent with cell2location (Supplementary Fig. 6D, E). Interestingly, the deconvolution of BC spatial datasets revealed the specific localizations of different cell types and states, including FAP+ CAF clusters (Fig. 3D and Supplementary Fig. 7). We analyzed the enrichment of each cell state within
Fig. 2 | Identification of DPP4- and YAP-1-dependent transitions of Detox-iCAF into ECM-myCAF. A Volcano plot showing differential gene expression in FAP+ CAF from the direct transition (red cells in Supplementary Fig. 2J) compared to other CAF from the BC scRNA-seq dataset values from two-sided Wilcoxon rank sum test. In red, genes with adjusted value . B DPP4 expression in a subset of Detox-iCAF (transitional Detox-iCAF). C DDP4 expression in FAP+ CAF clusters from scRNA-seq data of BC (Left) and PDAC (Right) mouse models . D Topmost variable transcription factors in CAF in direct/indirect transition and in other CAF. E Expression of TEAD/YAP1-target genes in FAP+ CAF clusters. F Same as (D) for scRNA-seq data from ref. 9 (Left) and ref. 42 (Right). G Representative western blot showing DPP4 silencing in Detox-iCAF at the beginning of the co-culture ( ) from three independent experiments. Actin is internal control for protein loading. H Percentages of Detox-iCAF, Wound-myCAF and ECM-myCAF clusters among FAP+CAF after co-culture of MCF7 with Detox-iCAF silenced (siDPP4) or not (siCtrl)
for DPP4 ( independent experiments). values from two-sided Student’s test. I Same as (H) showing the fraction of each FAP+ CAF cluster with/without DPP4 silencing . values from two-sided Fisher’s Exact test. J Same as ( ) for YAP1 silencing. K Same as (H) after co-culture of MCF7 with Detox-iCAF silenced (siYAP1) or not (siCtrl) for YAP1 ( ). L Same as (I) with/without YAP1 silencing . M Same as (G) showing DPP4 and YAP1 silencing. N Same as (H) after coculture of MCF7 with Detox-iCAF silenced (siDPP4/siYAP1) or not (siCtrl) for both DPP4 and YAP1 . Same as ( ) with/without DPP4 and YAP1 silencing ( ). Western blots showing DPP4 and YAP1 protein levels in Detox-iCAF silenced either for DPP4 or YAP1 at 3 timepoints of the co-culture with MCF7. Q Same as (H) with Detox-iCAF silenced (siTGFBRII) or not (siCtrl) for TGFBRII ( ). R Same as (I) with/without TGFBRII silencing ( ). All data are mean SEM. Source data and exact values are provided as a Source Data file.
different pathological compartments and found that Detox-iCAF and IL-iCAF clusters were predominantly detected in the peritumor conjunctive tissue, with an enrichment of Detox-iCAF in peritumors and ILiCAF in close proximity with normal ducts and lobules (Fig. 3D). Lymphocyte aggregates were found to be specifically enriched in Detox-iCAF and IFN -iCAF (Fig. 3D). In contrast, the ECM-myCAF cluster was the most abundant stromal subpopulation detected in the tumor bed (Fig. 3D and Supplementary Fig. 7). TGF -myCAF were detected within the tumor compartment but also found frequently adjacent to normal lobules (Fig. 3C and Supplementary Fig. 5B, Black arrowheads) and at the invasive margin (Fig. 3C). Interestingly, WoundmyCAF were predominantly observed in large nests of intra-tumor stroma (Fig. 3C and Supplementary Fig. 5A, Black arrows), while tumor cell-containing areas were specifically enriched in ECM-myCAF and IFN -myCAF (Fig. 3C, D). Within the tumor bed, we were able to distinguish these FAP+ CAF clusters from cancer cells by detecting genomic alterations. We visualized large-scale copy number variation (CNV) in situ by applying the InferCNV algorithm on tissue sections and then confirmed that CNV were detected in cells identified as cancer cells by the deconvolution method (Supplementary Fig. 8A). This allowed us to validate that cells detected in the intra-tumor stroma did not show any genomic rearrangement and were indeed CAF and not epithelial tumor cells which underwent epithelial-tomesenchymal transition.
Deconvolution of BC sections also showed that FAP + CAF clusters were located in proximity to other cell types. Similarly to ECM-myCAF, IFN -myCAF and TGF -myCAF clusters, TREM2+ TAM and SPP1+ TAM cells were detected within the tumor bed (Fig. 3C, D and Supplementary Fig. 7). FOLR2+ TAM were either detected in the Wound-myCAF-enriched intra-tumor stroma or retained at the invasive margin (Fig. 3C, D). Contractile-CAP predominated in peritumors, while AgCAP were prevalent within tumors (Fig. 3C, D and Supplementary Fig. 7). Endothelial cells were also differentially distributed: Angio-EC were significantly enriched in tumor nests and intratumor stroma, while ap-EC were notably scarce in tumors but particularly enriched in lymphocyte aggregates (Fig. 3D). Interestingly, we found that tumorcell enriched areas and intratumor stroma were enriched in GZMH+ CD8+ T cells, while lymphocytes aggregates showed an enrichment in precursor GZMK+ CD8+ T lymphocytes (Fig. 3D). In conclusion, spatial deconvolution of the BC sections revealed specific patterns in the localization and organization of stromal and immune cells, highlighting a structured organization of the TME components which delineates histological regions within the BC sections.
Unsupervised analysis reveals shared spatial cellular compositions across patients
As we observed specific localization of each cell type and state in each patient, we next sought to define cellular compositions conserved across patients. Firstly we computed the closest distances separating the different cell types in the 17 BC sections and unraveled a precise
distribution of the TME components shared across patients (Fig. 4A and Supplementary Fig. 8B). ECM-myCAF, IFN -myCAF, TGF myCAF, SPP1+ TAM, TREM2+ TAM, regulatory lymphoid cells (FOXP3+ CD4+ Treg and NKG2A+ NKreg) and Angio-EC were detected in close vicinity to cancer cells, while Wound-myCAF, IL-iCAF, Detox-iCAF, FOLR2+ TAM, precursor T lymphocytes (SELL+ CD4+ and XCL1+ CD8+ T cells) and ap-EC were observed farther away from cancer cells (Fig. 4A and Supplementary Fig. 8B). This prompted us to identify areas with similar cell type enrichment across patients in an unsupervised manner (Fig. 4B, C). In brief, we applied Leiden clustering on a batch-corrected K-nearest neighbors’ graph built on the deconvolution output of the 17 sections to identify communities of spots that shared a similar cell type composition across patients. Using this unsupervised approach, we identified 11 spatial niches that could be visualized directly on sections (Fig. 4B and Supplementary Fig. 8C). These niches consisted of spots sharing similar cell type enrichment but exhibiting distinct spatial organization within the tissue. We wondered if our BC spatial dataset could be used as a reference to project the cellular niches on new BC sections. To do so, we retrieved 14 publicly available BC sections analyzed by spatial transcriptomics but lacking niche annotations. After deconvolution, we built a latent embedding using scANVI with all sections as input and used the label transfer capacities of scANVI to evaluate the detection of the niches in the new sections (see “Methods”, #”Niche reference mapping”). This approach revealed that we were able to re-identify the different niches in new BC sections and that the spatial organization of the mapped niches closely mirrored the original niches (Supplementary Fig. 8D, E). Thus, this analysis showed that our breast cancer spatial dataset can serve as reference in future studies to map BC cellular niches on new data. We next aimed to identify unique patterns of cell types that preferentially coexisted within specific niches. To do so, we applied hierarchical clustering on the mean abundance of cell types per niche. This allowed us to identify 10 co-localization patterns within the niches that were shared across sections (Fig. 4C). We refer to these colocalization patterns as EcoCellTypes (ECT) which stands for ecosystem of cell types (see #”Methods”, #”Niches and ECT identification”) (Fig. 4C). ECT represented cell types and states co-existing across BC patients within the same tumor area (e.g. each area being a niche). Interestingly, some ECTs were found together in specific niches but not others, highlighting the interest of this approach to discover nichespecific colocalization pattern. Thus, each ECT contains a specific composition of cell types or states localized in close proximity, and we identified specific ECT enriched in different FAP+ CAF clusters. The first ECTs (ECT1-6) were predominantly observed at distance from cancer cells. The “Detox-iCAF-enriched immuno-protective ECT4” highlighted the spatial co-occurrence of Detox-iCAF, ap-EC, Mo-DC, and FOLR2+ TAM, characterized by their localization in the peritumoral zone but also within the tumor bed, forming an intra-tumoral peritumor-like stroma. The “IL-iCAF-enriched stroma ECT5”, composed of IL-iCAF, Adipo-EC, and Contractile-CAP, encompassed cell
types associated with the “Normal epithelial structures ECT6”, formed by normal epithelial and myoepithelial cells. Both ECT1 and ECT2 were enriched in immune cells. Indeed, the “IFN -iCAF-enriched immunosuppressive ECT1″ contained immuno-suppressive cell types including FOXP3+ Treg or NKG2A+ NKreg, while the “Precursor immune cell ECT2” contained more precursor or cytotoxic cell states like SELL+ CD4+ and GZMK+ CD8+ T lymphocytes. ECT7-10 gathered cell types
strongly associated with cancer cells. The “IFN -myCAF-enriched cancer cell ECT7″ encompassed cancer cells, IFN -myCAF, and SPP1+ TAM. Interestingly, the “ECM- and TGF -myCAF-enriched ECT9″ also spatially overlapped with ECT7, revealing the proximity of cancer cells with ECM-myCAF, TGF -myCAF, Angio-EC, and Ag-CAP. Finally, the “Wound-myCAF-enriched intratumoral stroma ECT10” brought together Wound-myCAF, ECM-CAP, and TREM2+ TAM.
Fig. 3 | Spatial organization of breast cancer microenvironment. A H&E images of representative Lum BC sections processed by Visium and annotated by pathologists. Tumor areas are colored in red, with cancer epithelial cells in dark red and intra-tumor stroma in light red. Invasive margins are highlighted in gray. Normal peritumor tissues include normal ducts and lobules in brown and peritumor stroma in yellow. T lymphocyte aggregates are in blue. ( sections in total). Scale bars . B UMAP of 73,426 cells from 43 patients ( 34 BC patients and 9 healthy donors) encompassing 39 different cell types and states and composing a comprehensive BC cellular atlas. C Deconvolution at single cell-like resolution based on the cellular atlas showed in (B) on a representative BC section (see also Supplementary Fig. 5 for deconvolution of additional BC sections). Each dot shows
one single cell and the different colors represent distinct cell types and states. Black arrowheads indicate normal lobules and ducts (Panel epithelial cells) and their colocalization with TGF -myCAF (Panel FAP + CAF myCAF clusters). Dashed lines delineate the invasive margin. Scale bars . D Heatmap of the median proportion of each cell state among the corresponding cell type within each pathological compartment (Tumor cell-enriched areas; Intratumor stroma; Peritumor stroma; Lymphocyte aggregates and Normal ducts and lobules), as shown in (A). Exact values are shown for significant ( ) enrichment (red and orange) or depletion (yellow) (% indicated on scale bars) of a cell state compared to the others within a particular pathological annotation. values from two-sided Wilcoxon (one versus all) rank sum test. Source data are provided as a Source Data file.
To investigate if the composition of these ECT differed between BC molecular subtypes, we performed deconvolution of transcriptomic data from the METABRIC cohort ( 487 Lum A, 368 Lum B, 193 HER2 and 186 Basal-like TN BC) using BayesPrism . In terms of immune components, we found that Lum A BC exhibited a lower fraction of immuno-suppressive cells (ECT1) compared to Lum B, HER2, and Basal-like TN BC (Fig. 4D). Conversely, Lum A BC displayed a higher proportion of naive CD4 T cells, as well as precursor and cytotoxic CD8+ T lymphocytes (which constituted the ECT2) compared to the other BC subtypes. We also observed significant differences in the stromal compartment: Lum A BC contained more ECT5 (composed of IL-iCAF, Adipo-EC, contractile-CAP) and ECT9 (ECMmyCAF, TGF -myCAF, Ag-CAP) compared to Lum B, HER2 and Basallike TN BC. In contrast, ECT10 (Wound-myCAF, ECM-CAP and TREM2+ TAM) was enriched in Lum B and HER2 and particularly abundant in Basal-like TN BC, while ECT4 (Detox-iCAF, FOLR2+ TAM) accumulated in Lum A (Fig. 4D). Remarkably, ECT composition in BC allowed us to stratify patients into 4 subgroups (C1 to C4) with different overall survival (Fig. 4E, F). Patients in the C2 subgroup, with an enrichment in ECT1 (immuno-suppressive), ECT3 (plasma cells) and ECT10 (TREM2+ TAM, Wound-myCAF), were mainly composed of Basal-like TN (31.5%), Lum B (31.7%) and HER2 (23%) BC subtypes and showed the worst survival, as expected. In contrast, patients in the C3 subgroup-enriched in ECT2 (immune precursors, effectors), ECT4 (Detox, FOLR2+ TAM) and ECT5 (IL-iCAF, adipo-EC)-were mainly composed of the Lum A subtype (69.6%) and showed the best overall survival. The C1 and C4 subgroups were mainly composed of Luminal patients (Lum A and Lum B). While their 5 -year survival was good and comparable to that of the C3 subgroup, the prognosis of the C1 and C4 subgroups fell after 5 years. Compared to the C 3 subgroup, these survival differences could be explained in part by the C4 subgroup’s enrichment in Lum B BC and ECT6-7 (Epithelial cells, IFN -myCAF, SPP1+ TAM) and the C1 subgroup’s abundance of ECT9 (Angio-EC, ECM-myCAF, TGF myCAF) (Fig. 4E, F). In conclusion, ECT were associated with the overall survival of BC patients, which is linked to ECT-enrichment in BC molecular subtypes. To understand the reciprocal crosstalk between each cell type in these distinct ECT, we applied the CellChat method on the BC atlas to infer intercellular communications. Global ligandreceptor (L-R) analysis of all cell types revealed that FAP+CAF clusters were the main senders of L-R signals in the TME (Fig. 5A), suggesting they could play a key role in the ECT organization. Moreover, the strength of the signals sent and received by the FAP+ CAF increased progressively from universal fibroblasts to ICAF and reached a maximum with ECM-myCAF, TGF -myCAF, and IFN -myCAF (Fig. 5A), following similar trajectories as the one described above (Fig. 1). In addition, the number of interactions found between cancer cells and FAP+ CAF clusters by CellChat reflected their spatial proximity in the TME. Indeed, ECM-myCAF and IFN -myCAF displayed the highest numbers of signals sent to and received from cancer cells, while ILiCAF and Detox-iCAF showed the least (Supplementary Fig. 8F). One of the strongest interactions detected between FAP+CAF clusters and the other cell types was the collagen-dependent signaling pathway, in particular in the myCAF clusters (Supplementary Fig. 8G). This is
consistent with the high expression of ECM proteins in these FAP+CAF clusters and the role of YAP1 in the transition of Detox-iCAF into Wound- and ECM-myCAF clusters. In summary, we defined 10 ECT characterizing the spatial co-occurrence of different cell types or cell states in BC, and their reciprocal interactions.
We next validated the composition of immuno-protective and immuno-suppressive ECT by testing the correlative link between cellular populations located in close proximity. Part of the protective ECT4 was composed of Detox-iCAF, monocytes and FOLR2+ TAM, and the immuno-suppressive ECT (ECT9 and ECT10) of ECM-myCAF, Wound-myCAF, TGF -myCAF and TREM2+ TAM. As anticipated from ECT composition, using flow cytometry from BC samples (Prospective cohort, Supplementary Table 1), we observed that DetoxiCAF showed a negative correlation with ECM-myCAF, TGF -myCAF, and Wound-myCAF and a positive correlation with IL-iCAF and IFN iCAF in BC patients (Fig. 5B). Similarly, consistent with ECT9 and ECT10, we confirmed a positive correlation between ECM-myCAF, TGF -myCAF and Wound-myCAF. We also validated cell cooccurrence in the immuno-suppressive niche by demonstrating that these myCAF clusters were positively correlated with TREM2+ TAM and negatively correlated with FOLR2+ TAM (Fig. 5C). Similarly, Detox-iCAF content showed a positive correlation with FOLR2+ TAM, consistent with the immuno-protective ECT4, and a negative correlation with TREM2+ TAM proportion (ECT10) (Fig. 5C). To investigate if FAP+ CAF clusters actively modulated the identity of myeloid cells or only attracted them to form the ECT, we performed Transwell assays to test monocyte attraction toward different FAP+ CAF clusters. Our results demonstrated that Detox-iCAF, IL-iCAF, and IFN iCAF enhanced monocyte migration, while ECM-myCAF and TGF myCAF did not (Fig. 5D). Upon co-culture of FAP+ CAF clusters with CD14+ monocytes, we observed an increase in the proportion of CD16+ cells among CD14+ monocytes (Fig. 5E and Supplementary Fig. 9A). In addition, ECM-myCAF and TGF -myCAF strongly increased the proportion of TREM2+ macrophages among total CD14+ CD16+ myeloid cells (Fig. 5F and Supplementary Fig. 9A), while Detox-iCAF, IL-iCAF, and IFN -iCAF increased the content of FOLR2+ macrophages (Fig. 5G and Supplementary Fig. 9A). These findings suggest that ECM-myCAF and TGF -myCAF play an active role in modulating the identity of myeloid subtypes to form the immuno-suppressive niche, while Detox-iCAF attract monocytes and induce a FOLR2+ phenotype to form the immuno-protective niche. We also tested the impact of CAF-S1 clusters on the differentiation of CD4+ CD25+ FOXP3+ T lymphocytes in vitro. We observed that ECMmyCAF and TGF -myCAF increased the percentages of FOXP3+ T cells among the CD4+ CD25+ population, while iCAF clusters had no impact (Fig. 5H and Supplementary Fig. 9B). Moreover, ECMmyCAF and TGF -myCAF significantly increased the percentages of both PD-1+ and CTLA4+ T cells among FOXP3+ T lymphocytes (Fig. 5I, J and Supplementary Fig. 9B). Given this impact on monocytes and T cells, we next wondered whether some CAF-S1 clusters might also affect NK cell phenotype. By co-cultivating FAP+ CAF clusters with NK cells, we showed that ECM-myCAF and TGF -myCAF reduced perforin and granzyme B levels and significantly increased
the fraction of CD56 NK cells and their surface NKG2A levels, thereby decreasing NK cell cytotoxicity (Fig. 5K-N and Supplementary Fig. 9C). In conclusion, FAP+ CAF clusters are differentially associated with specific in situ ECT by attracting and modulating the identity of immune cells in human .
Specific FAP+CAF clusters are associated with breast cancer invasiveness
We next wondered if BC cellular composition could be associated with invasive properties. To address this question, we analyzed a series of Ductal Carcinoma in Situ (DCIS) lesions, micro-invasive DCIS (MI-DCIS)
Fig. 4 | Identification of shared spatial cellular compositions across patients, called EcoCellTypes. A Distribution of FAP+ CAF, CAP and TAM populations according to the distance to cancer cells (in ). Distances are computed between the closest cancer cell identified by deconvolution and FAP+CAF clusters, CAP and TAM in the 17 sections. Cell types are ranked based on their median distance to cancer cells. B Spatial distribution of 11 cellular niches in 3 representative BC patients. C Heatmap showing the mean cell type composition per niche identified on the 17 sections. Values are centered and scaled per cell type and state. Hierarchical clustering in rows defines 10 different groups of co-occurring cell types in the cellular niches referred to as EcoCelltypes (ECT). D-F Data from the METABRIC
cohort ( BC patients). D Proportions of each ECT in Lum A ( ), Lum B ( ), HER2 ( ) and Basal-like TN ( ) BC subtypes. values from Mann-Whitney test. E Heatmap and clustering of all BC samples (columns) from the METABRIC cohort showing 4 subgroups of patients ( , C3 = 227, C4 = 261) with different ECT enrichments. F Left, Kaplan-Meier curves showing overall survival of the 4 BC patient subgroups (C1-C4) stratified in the heatmap. value from Log-rank test. Right, Distribution of the BC molecular subtypes within the four subgroups (C1-C4) of BC patients. In all boxplot the center line, box limits and whiskers indicate the median, upper and lower quartiles and interquartile range. Source data are provided as a Source Data file.
BC (i.e. DCIS lesions with invasive foci not exceeding 1 mm ) and Invasive Breast Cancer (IBC) (Supplementary Table 2 for detailed description of the INVADE cohort). We performed bulk RNA sequencing (RNA-seq) on these lesions and applied BayesPrism to identify the different cellular populations comprising the tumors. We determined cellular proportions by deconvoluting the bulk RNA-seq using the BC cell atlas we built in this study (shown in Fig. 3B) as reference. Firstly, we evaluated the global cell type diversity of each tumor by computing the Shannon index and observed that IBC were more heterogenous than DCIS and MI-DCIS (Fig. 6A). By analyzing the proportion of epithelial, fibroblastic, immune and endothelial cells in each sample, we observed that IBC contained more fibroblasts compared with DCIS and MI-DCIS samples (Fig. 6B). This observation was independent of the tumor cellularity between the BC invasive types (Supplementary Fig. 10A) and consistent with a recent analysis of DCIS and IBC lesions . We next determined the proportion of each cell type and cell state identified in our BC atlas by deconvolution and observed that cell type composition was distinct according to BC invasiveness (Fig. 6C, D and Supplementary Fig. 10B, C). In particular, we observed a significant accumulation of universal fibroblasts (identified in healthy tissues) in DCIS (Supplementary Fig. 10C), while the significant increase in fibroblasts in IBC was mainly due to FAP+ CAF (Fig. 6C). Regarding the FAP+ CAF, pre-invasive tumors contained a higher proportion of iCAF clusters compared to invasive lesions, with DCIS accumulating more Detox-iCAF and MI-DCIS more IL-iCAF (Fig. 6D and Supplementary Fig. 10C). The three invasive BC stages also exhibited distinct myCAF contents, with higher proportion of TGF -myCAF in DCIS and elevated levels of both ECM-myCAF and IFN -myCAF in IBC (Fig. 6D and Supplementary Fig. 10C). In comparison to DCIS and MIDCIS, IBC showed an accumulation in CD8+ T lymphocytes and myeloid cells (particularly in TREM2+ and SPP1+ TAM rather than FOLR2+ TAM) (Fig. 6C, D) but lower numbers of CAP (Fig. 6C). Within the CAP, IBC was associated with an increase in and a decrease in the ECM-CAP fraction (Fig. 6D and Supplementary Fig. 10C). This shift in cell type composition observed from DCIS to IBC was in agreement with trajectory inferences and spatial analysis described above in our study.
We next performed spatial Ligand-Receptor analysis using the SpaTalk method . We identified TGFBR2 among the top-10 receptors expressed by Detox-iCAF which can drive key interactions with cancer cells, consistent with the functional assays shown above and recent data showing that the TGF TGFBR 2 axis acts in the emergence of LRRC15+ ECM-myCAF in PDAC mouse models . Importantly, tumor cells at the invasive margin, communicated with Detox-iCAF through the TGF TGFBR 2 ligand-receptor pair (Fig. 6E). In turn, upon TGFBR2 stimulation, Detox-iCAF increased YAP1 activity, as identified by the ligand-receptor transcription-factor knowledge-graph-based approach implemented in SpaTalk (Fig. 6F) (see also “Methods”, #”Ligand-receptor analysis”), consistent with the role of YAP1/TEAD in FAP+ CAF plasticity we described above. To provide insights on the fact that we detected fewer ECM-myCAF and more Detox-iCAF in DCIS, we analyzed publicly available spatial transcriptomic data from a DCIS section (Fig. 6G,H). The analysis revealed that the localization of ECMmyCAF, TGF -myCAF and IFN -myCAF was mainly restricted to the
periphery of the ducts around tumor cells. In contrast, Wound-myCAF were found in the stroma between tumor nests and far from cancer cells, suggesting that the direct contact with cancer cells was not necessary for their induction (Fig. 6H). In conclusion, our findings demonstrate that there is a significant increase in FAP+ CAF, particularly ECM-myCAF, in IBC compared to DCIS.
Detox-iCAF and TGF -myCAF proportions predict progression from DCIS to IBC
We next wondered whether the content in specific cell types in DCIS could be associated with risk of progression. As the composition of FAP+ CAF clusters is different in DCIS compared to IBC, we wondered whether their levels in DCIS at diagnosis could predict DCIS recurrence and progression to IBC. To address this question, we studied bulkRNAseq data from the TBCRC 038 cohort , including 216 patients diagnosed with DCIS matched on grade and age at diagnosis. Among them, 121 showed either a DCIS recurrence ( ) or an IBC recurrence ( ). Interestingly, the FAP+ CAF population displayed a significant difference in composition between patients with and without recurrences, while no significant change was observed in other stromal and immune cell populations (Fig. 7A and Supplementary Fig. 10D). Indeed, patients with a subsequent IBC recurrence had markedly less Detox-iCAF and an increased proportion of TGF myCAF (Fig. 7A). Even with a lower number of patients, we could still validate this result in the 18 DCIS patients from the INVADE cohort, where 13 patients showed no recurrence and 5 patients progressed (Fig. 7B). We next sought to evaluate the prognostic value of DetoxiCAF and TGF -myCAF content in DCIS patients. Median stratification of patients based on the Detox-iCAF content significantly predicted any type of recurrences, either DCIS or IBC (Fig. 7C, Left). Importantly, multivariate Cox regression analysis showed that the prognostic value of Detox-iCAF on recurrence was independent of PAM50 classification (Fig. 7C, Right). As the TBCRC 038 cohort was initially matched on the grade , the prognostic impact of Detox-iCAF was not confounded by grade. When focusing on IBC recurrence, we confirmed that DCIS patients enriched in Detox-iCAF harbored a lower risk of invasive recurrence (Fig. 7D, Left). In addition, patients enriched in TGF myCAF had a higher risk of IBC recurrence (Fig. 7D, Right). We then hypothesized that DCIS patients harboring both high levels of DetoxiCAF and low levels of TGF -myCAF at diagnosis may have a reduced risk of IBC recurrence. Indeed, when considering these two factors in combination, we observed a more robust prognostic value than when considering them separately. This analysis allowed us to identify a subgroup of DCIS patients with a potentially lower risk of invasive progression (Fig. 7E). Our findings thus suggest that FAP+ CAF heterogeneity might be an important factor in DCIS progression and provide preliminary insights for addressing the issue of overtreatment in DCIS, as patients with a low-risk of progression might benefit from therapeutic de-escalation.
Discussion
Our study provides insights into the spatial organization of the BC TME with a focus on FAP+ CAF diversity, plasticity and their interactions with surrounding cells. Here, we provide a comprehensive map of the
different FAP+CAF clusters, by integrating spatial transcriptomics with a comprehensive cell atlas based on scRNA-seq data and estimating cell-type and cell-state compositions at single cell level. Based on both deconvoluted data and histological annotations, we identified the spatial organization of different functional states of FAP+ CAF populations, T lymphocytes and TAM, all of which accumulate differentially
within the tumor (in proximity of cancer cells), the intratumor stroma and the peritumor space. By this way, we delineate FAP+ CAF cluster localization and identify 10 CAF-related EcoCellTypes (ECT). Recently, two co-existing sub-tumor microenvironments have been characterized in PDAC , which display differences in their immune infiltration and iCAF/myCAF accumulation. Our study increases the resolution of
Fig. 5 | Interactions between FAP+ CAF clusters and immune cells in BC. A CellChat dominant sender and receiver plot showing incoming and outgoing interaction strength for each cell type identified in the BC atlas ( 73,426 cells from 43 patients). The size of each circle corresponds to the total number of significant interactions, colored per cell type. B Scatter plots with linear regression lines showing correlations in the content of FAP+ CAF clusters quantified by flow cytometry in BC ( patients). values from two-sided Pearson’s correlation test. C Same as (B) analyzing correlations between the content in ECM-myCAF, TGF myCAF, Wound-myCAF and Detox-iCAF with TREM2+ or FOLR2+ macrophages in . D Bar plot showing the percentages (%) of migration of CD14+ monocytes after 6 h of transwell co-culture with FAP + CAF clusters. Data are mean SEM ( independent experiments). values from two-sided Student’s test. of CD14+ CD16+ myeloid cells among total CD14+ monocytes after 24 h of co-culture with FAP+ CAF clusters (Detailed gating strategy in Supplementary Fig. 9A). Data are mean SEM values from two-sided Student’s test. Same as (E) for
TREM2+ macrophages. values from two-sided Student’s test. G Same as (E) for FOLR2+ macrophages. values from two-sided Mann-Whitney test. of FOXP3+ regulatory T cells among CD4+ CD25+ T lymphocytes after 16 h of co-culture with FAP+ CAF clusters (Detailed gating strategy in Supplementary Fig. 9B). Data are mean SEM values from two-sided Mann-Whitney test. I Same as for the % of PD-1+ FOXP3+ T lymphocytes. values from two-sided Mann-Whitney test. J Same as (H) for the % of CTLA-4+ FOXP3+ T lymphocytes. values from two-sided Mann-Whitney test. of Perforin+ among total CD16+ NK cells after 24 h of coculture with FAP+CAF clusters (Detailed gating strategy in Supplementary Fig. 9C). Data are mean SEM . values from two-sided Student’s test. L Same as ( ) for Granzyme B + NK cells. values from two-sided Student’s test. Same as (K) for CD16 + CD56 NK cells. values from two-sided Student’s test. N Same as ( ) for NKG2A+ NK cells. values from two-sided Student’s test. Source data are provided as a Source Data file.
FAP+ CAF populations, and describes the spatial organization of the entire TME in BC by concomitantly investigating the distribution of 39 different cell types and states, including the 7 FAP+ CAF clusters. Our results also expand on data from a recent study, which identified 9 groups of co-occurring cell types using a bulk RNA-seq dataset . Indeed, we demonstrate that the spatial proximity of different FAP+ CAF clusters is a critical determinant of the TME, with co-occurring cell types directly influencing each other’s identity and thus shaping distinct ECT (see Model, Fig. 8). While the FAP+ myCAF clusters-namely ECM-myCAF, TGF -myCAF and IFN -myCAF-are observed in close proximity to cancer cells, the FAP+ Detox-iCAF cluster is detected around blood vessels. This specific spatial distribution suggests an adventitial origin of Detox-iCAF, with their plasticity driven by interactions with cancer cells. Here, we show that the FAP+ Detox-iCAF cluster can serve as a reservoir able to give rise to all the other FAP+ CAF clusters. A recent pseudotime trajectory analysis in BC defined a mesenchymal stem cell state characterized by ALDH1A1 expression , a gene also highly expressed in Detox-iCAF. ALDH1A1 expression decreases while that of COL1A1 increases when cells transition toward a myofibroblast-like state . This is in agreement with the trajectories we identified between Detox-iCAF and ECM-myCAF clusters. The specific spatial distribution of FAP+ CAF clusters suggests that stroma can shape the intratumor architecture, as recently shown . We confirmed these observations and shed light on YAP1 and DPP4dependent mechanisms. While myofibroblast differentiation has been shown to involve YAP1 activation in various fibrotic models , its role in CAF plasticity is much less known in BC. Here, we found that the Detox-iCAF cluster can give rise to the activated myCAF state in the presence of cancer cells through two main paths: an indirect transition mediated by the YAP1-signaling pathway passing through the WoundmyCAF cluster and a DPP4-dependent direct transition between Detox-iCAF and ECM-myCAF clusters (see Model, Fig. 8). DPP4 has also been recently implicated in the transition from normal fibroblasts to iCAF in mice . Moreover, genetic evidence in PDAC mouse models showed that iCAF can be converted into LRRC15+ myCAF (LRRC15 being a specific marker of ECM-myCAF ) by up-regulating the TGFBR2-dependent signaling pathway . Consistent with these findings, YAP- and TGF -signaling pathways can act simultaneously to promote a cellular transition of DPP4+ adipocyte progenitors toward DPP4- SMA+ myofibroblasts . Moreover, we have provided here a spatial resolution of these interactions by using SpaTalk and showing the TGF -mediated crosstalk between Detox-iCAF and cancer cells at the invasive margin leading to YAP1/TEAD activation. In line with previous studies showing that 3 -dimensional culture of mouse PDAC models can promote conversion between iCAF and myCAF , we observed that collagen-coated plates increase the proportion of iCAF. As we found that YAP1 is a key player in the indirect transition from Detox-iCAF to Wound-myCAF and subsequently to ECM-myCAF, we can hypothesize that the slight reduction of the stiffness in collagen-
coated dishes might favor iCAF maintenance in culture. Thus, these studies, as well as our results, reveal that FAP+ CAF populations can convert into one another depending on the spatial and biological context.
iCAF and myCAF clusters have been shown to be negatively correlated in patient samples and spatially segregated in tumors across human cancer . Our current work goes a step further in the resolution of FAP+ CAF populations by identifying the spatial distribution of the different FAP+ iCAF and myCAF clusters, and their proximity to other cell types. Our functional analysis revealed that Detox-iCAF, primarily located in the interlobular stroma, can give rise to ECM-myCAF through two transitions, one direct and one indirect via the Wound-myCAF cluster. Notably, ECM-myCAF are systematically close to cancer cells, while Wound-myCAF are located further away. This suggests that juxtacrine interactions between Detox-iCAF and cancer cells may be required for the direct transition, while paracrine signaling could induce the larger area of Wound-myCAF. This is supported by our experiments showing that cancer cells-conditioned media induce Wound-myCAF from Detox-iCAF but not ECM-myCAF, while co-culture with cancer cells induces both. Observations in DCIS support this hypothesis, as we identified ECM-myCAF directly adjacent to the tumor nests and Wound-myCAF farther away. Specific FAP+CAF clusters and immune cells are spatially organized in tumors, offering insights into FAP+ CAF-mediated immunoregulation. We uncovered the crosstalk between different FAP+ CAF clusters and immune cells subtypes, which modulates immune cell identity and states, highlighting immuno-permissive and immunosuppressive ECT in BC. We previously demonstrated that TGF -myCAF can be induced from ECMmyCAF through interactions with T lymphocytes . Interestingly, we found that -myCAF are enriched in immune infiltrated sites in BC , including the invasive margin, around intra-tumoral blood vessels, and around intra-tumoral lobules. We also identify ECT enriched in DetoxiCAF, FOLR2+ TAM and ap-EC. FOLR2+ TAM are known to be close to peritumoral blood vessels in . Consistent with these observations, Detox-iCAF attract monocytes and induce a FOLR2+ TAM program. Detox-iCAF are localized close to ap-EC-enriched blood vessels, which express markers of tumor-associated high endothelial venule (TAHEV), suggesting that Detox-iCAF may play a role in the crosstalk with ap-EC and TA-HEV maturation. In contrast to Detox-iCAF, IL-iCAF are primarily associated with normal breast epithelial structures and found in the intralobular stroma enriched in Adipo-EC, while IFN -iCAF are associated with lymphocyte aggregates and enriched in the tumor bed. We observed that IL-iCAF are not able to differentiate into ECMmyCAF, suggesting that myofibroblasts observed in BC might not be primarily derived from the intralobular stroma. As the intralobular stroma is not present in mice , this may explain why IL-iCAF are not detected in scRNA-seq data from mouse models. Moreover, ECMmyCAF, IFN -myCAF and TGF -myCAF accumulate within the invasive compartment, with ECM-myCAF and IFN -myCAF in the close
vicinity of cancer cells, while -myCAF are associated with immune infiltration and found at the invasive margin, around intratumoral infiltrated lobules or blood vessels. Consistent with our observations, previous work has shown that Podoplanin-expressing myofibroblasts (corresponding to ECM-myCAF and IFN -myCAF) are enriched at the interface with cancer cells where non-activated fibroblasts and EC were
depleted . Moreover, ECM-myCAF and TGF -myCAF colocalize with TREM2 + TAM and actively induce the TREM2 + TAM program to create an immunosuppressive area in the tumor bed. In relation to this spatial organization, ECM-myCAF are detected close to exhausted CD8+ T lymphocytes and immunosuppressive FOXP3+ CD4+ T lymphocytes. Finally, Wound-myCAF are mainly distributed in the intratumoral
Fig. 6 | BC cellular composition is associated with tumor invasiveness. A-D, H Data from the INVADE cohort ( BC patients), including Ductal Carcinoma in Situ (DCIS) lesions ( ), micro-invasive DCIS (MI-DCIS) (i.e. DCIS lesions with invasive foci not exceeding and Invasive Breast Cancer (IBC) ). A Boxplot showing Shannon index from cell type fractions in DCIS, MI-DCIS and IBC samples. value from Mann-Whitney test. B Bar plots showing the relative composition of epithelial, stromal, endothelial and immune cells per patient (Left) and according to BC invasive status (Right). value from chi-squared test. C Boxplots of the relative proportions of FAP+CAF, CAP, endothelial, myeloid and lymphoid cells in DCIS, MI-DCIS and IBC samples. values from Mann-Whitney test. D Bar plots showing the relative proportions of clusters among FAP+CAF, CAP, endothelial, myeloid and lymphoid cells in DCIS, MI-DCIS and IBC samples. values from Fisher’s exact test. E Communications from cancer cells to Detox-iCAF mediated by TGF -TGFBR 2 interaction in space on one section. Colored dots
represent cells from a given cell type expressing either the receptor for Detox-iCAF (in yellow) or the ligand for cancer cells (in red). Arrows highlight cells close enough to communicate through the selected ligand-receptor, as inferred by SpaTalk. F Network of downstream pathways upregulated in Detox-iCAF following TGF 2TGFBR2 interaction in the section shown in (E) inferred using the atlas. G Left, Cancer cell abundance in each spot of a DCIS section inferred by deconvolution. Right, Manual selection by a pathologist of spots in direct contact with cancer cellenriched spots (in red); other spots farther away from cancer cells are in gray. Bar plot showing the relative proportions of FAP+ CAF clusters (assessed by deconvolution) in spots directly surrounding cancer cell-enriched spots (red dot) compared to other spots (gray dot) in the DCIS section. value from Fisher’s exact test. In all boxplot the center line, box limits and whiskers indicate the median, upper and lower quartiles and interquartile range. Source data are provided as a Source Data file.
stroma, more distant from cancer cells than any other myCAF subsets. Collectively, the spatial distribution of all FAP+ CAF clusters is compatible with their plasticity and crosstalk with cancer or immune cells, and uncovers FAP+ CAF-immuno-permissive and immunosuppressive ECT (see Model, Fig. 8). However, the absence of normal fibroblasts in the single cell transcriptomic data from BC-potentially due to the limited number of cells that could be sampled-is a limitation in the spatial transcriptomic analysis that must be addressed in future work. This would contribute to a better understanding of the spatial relationship and the effects on the plasticity of Detox-iCAF and normal fibroblast crosstalk.
Recent observations show that BC progression requires both the invasive propensity of DCIS cancer cells and stroma permissiveness . Our results on stroma are consistent with these findings but go a step further by demonstrating the role of specific FAP+ CAF clusters in the transition between DCIS and IBC. Indeed, we found that BC invasive states were significantly associated with an accumulation of specific FAP+CAF clusters. Detox-iCAF are enriched in DCIS but their proportion decreases in MI-DCIS while IL-iCAF levels increase. In contrast, IBC accumulate ECM-myCAF and IFN -myCAF. The low ECM-myCAF content in DCIS might be linked to the spatial architecture of DCIS, which restricts cancer cell localization and could maintain ECM-myCAF strictly at the periphery of the ducts. Interestingly, we uncovered that the levels of Detox-iCAF and TGF -myCAF at diagnosis are independent prognostic factors of a progression from DCIS to IBC. We previously showed that T cells can induce the transition from ECM-myCAF into TGF -myCAF , this could explain why T lymphocytes localized at the ductal basal membrane are, to some extent, predictive of a shorter recurrence in DCIS . Developing treatments which target ECM-myCAF, TGF -myCAF and IFN -myCAF and restore them to a Detox-iCAF (or possibly a normal-like) state might be a means to improve patient survival. The importance of alternative therapeutic strategies blocking ECM-myCAF differentiation, rather than depleting them, is highlighted by the fact that they can quickly reappear after ECM-myCAF depletion . Our results highlight a promising avenue for the development of therapeutic strategies. Indeed, our data suggest that a combined therapy targeting both DPP4 and YAP1 in FAP+ CAF might be necessary to fully suppress the emergence of the immunosuppressive ECM-myCAF and TGF -myCAF clusters and therefore improve response to immunotherapies in BC patients. This therapeutic approach could also be useful in the context of DCIS tumors with a high-risk of invasive progression upon standard treatment, that we identified as having a depletion in Detox-iCAF and an enrichment in TGF -myCAF. Thus, blocking the transition from DetoxiCAF to ECM- and TGF -myCAF could particularly benefit these patients by preventing progression. In addition, assessment of the Detox-iCAF and TGF -myCAF content in DCIS at the time of diagnosis could help in identifying patients with low-risk DCIS, which is still quite unsatisfactory using standard histo-pathological criteria. Our findings could thus pave the way for more efficient and safer treatment de-
escalation in DCIS. Finally, FAP has been identified as an attractive target for CAR-T therapy because of its role in shaping the immunosuppressive TME, a major obstacle in the treatment of solid tumors. By targeting FAP+ CAF, CAR-T cells could disrupt tumor’s immunosuppressive niches, ultimately enhancing immunotherapy efficacy. Still, FAP+ CAF are highly heterogenous and part of a complex network within the TME. As we show here, they also contribute to the formation of immuno-protective niches, such as the one composed of FAP+ Detox-iCAF and FOLR2+ TAM. Thus, a singular focus on eliminating FAP+CAF may inadvertently disrupt these protective mechanisms and hinder the intended immunotherapeutic effect. In conclusion, combining multi-omic data in a spatial context enables us to provide clues on FAP+ CAF identity, and how a given CAF cell state changes based on its neighboring cells. By deconvoluting spatial transcriptomics, we characterized different cell niches composed of specific FAP+ CAF clusters, associated with immuno-protective or immuno-suppressive cells, enriched either in endothelial or cancer cells. Thus, our study provides a comprehensive spatially resolved atlas of FAP+ CAF populations-related architecture in BC.
Methods
Cohorts of BC patients: inclusion and ethics
The study developed here is based on samples taken from surgical residues available after histopathologic analyses and not required for diagnosis. There is no interference with clinical practice. Analysis of tumor samples was performed in accordance with the relevant national law and with recognized ethical guidelines (Declaration of Helsinki) on the protection of people taking part in biomedical research. All patients with BC hospitalized at Institut Curie received a welcome booklet explaining that their samples may be used for research purposes. All patients included in our study were thus informed by their referring oncologist that biological samples collected through standard clinical practice could be used for research purposes and they gave their informed consent. In case of patient refusal, which could be either orally expressed or written, residual tumor samples were not included in our study. Human experimental procedures for analyses of tumor microenvironment by F. MechtaGrigoriou’s lab were approved by the Institutional Review Board and Ethics committee of the Institut Curie Hospital group (approval February 12, 2014) and CNIL (Commission Nationale de l’informatique et des Libertés approval no.: 1674356 delivered March 30, 2013). The Biological Resource Centre (BRC) is part of the Pathology Department in the Diagnostic and Theragnostic Medicine Department headed by Dr. A. Vincent-Salomon. BRC is authorized to store and manage human biological samples according to French legislation. The BRC has declared defined sample collections that are continuously incremented as and when patient consent forms are obtained (declaration number: DC-2008-57). The BRC follows all currently required national and international ethical rules, including the Declaration of Helsinki. The BRC has also been accredited with the AFNOR NFS-96-900 quality
Fig. 8 | Schematic model. CAF heterogeneity and plasticity shape a structured organization of the tumor micro-environment in BC. In this paper, we describe spatial organization, plasticity and interactions of FAP+ CAF clusters with neighboring cells by combining analysis of single-cell data, spatial transcriptomics and functional assays. We identify spatially organized cellular EcoCellTypes, which are precisely localized within tumors and composed of specific FAP+ myCAF or iCAF clusters. Distances to cancer cells induce a gradient of FAP+CAF cluster identities. Detox-iCAF are found around blood vessels composed of ap-EC and in close proximity to FOLR2+ TAM. Detox-iCAF serve as a reservoir and can give rise to ECM-myCAF in presence of cancer cells, either directly or indirectly through the Wound-myCAF cluster, by DPP4-
and YAP1/TEAD-dependent mechanisms. ECM-myCAF localize close to tumor cells, where they can reach a TGF -myCAF phenotype in presence of T lymphocytes. In addition, specific TAM are found in different FAP+ CAF cluster-enriched territories. While FOLR2+ TAM are close to Detox-iCAF, TREM2+ and SPP1+ TAM are enriched in ECM-myCAF, IFN -myCAF and TGF -myCAF-enriched niches. Our data show that spatial organization in BC tumors is related to reciprocal interactions of FAP+ CAF clusters with cancer and immune cells in specific spatial domains. Importantly, we identify that the content in Detox-iCAF and -myCAF at DCIS diagnosis is a predictive factor for the recurrence of DCIS into invasive breast cancer. The figure was created with Biorender.com.
label (renewed and currently valid until 2021). All samples are pseudoanonymous when they arrive from the BRC in the lab. In addition, the BRC collections have been declared to the CNIL (approval no. 1487390 delivered February 28, 2011).
BC prospective cohorts. For this study, luminal (Lum) tumors were defined based on immunohistochemistry (IHC) staining for estrogen and progesterone receptors (ER and PR). The cutoff used to define hormone receptor positivity was of stained cells. Luminal A and Luminal B tumors were distinguished based on proliferation index (Ki67 staining) with Lum A defined as and Lum B with Ki67 . HER2 positive tumors were identified following ERBB2 immunostaining using American Society of Clinical Oncology guidelines. TN immunophenotype was defined as follows: ER- PR- ERBB2-. The prospective cohort 1 is composed of 84 fresh BC samples prior treatment and includes Lum A ( ), Lum B ( ), HER2 ( ) and TN ( ). Samples were analyzed by flow cytometry to characterize FAP+ CAF clusters and immune cell subpopulations. The prospective cohort 2 is composed of 16 fresh BC samples prior treatment and includes Lum A ( ), Lum B ( ) and HER2 ( ). Samples were collected and cultured in vitro to isolate primary FAP+ CAF cell lines. The clinical data of these two prospective cohorts are described in Supplementary Table 1.
INVADE cohort. The INVADE cohort is a retrospective series of 55 patients, who have been treated at Institut Curie between 1992 and 2014, and underwent surgery for a breast carcinoma prior to any treatment. This cohort includes 18 pure DCIS cases, 17 micro-invasive (MI-DCIS) cases (DCIS lesions with invasive foci of maximum 1 mm ) and 20 primary IBC cases. Informed patient consents for the use of tissues for research purposes were collected, and ethical approval from the Institutional Review Board (Institut Curie breast cancer study group) was obtained for the use of all specimens. All samples were anonymized before analysis. Complete clinico-pathological data of the series are described in Supplementary Table 2. Histopathological review of the cases was done in accordance with the current standards by expert breast pathologists. Immunohistochemical evaluation of ER, PR and HER2 status was performed according to the ASCO/CAP recommendations , and histomolecular class was determined on the basis of IHC and proliferation index . Clinical data on treatment were obtained from the Institut Curie electronic medical records.
Differential analysis between fibroblasts from healthy breast tissues and Detox-iCAF from breast cancer
Differentially expressed genes between fibroblasts isolated from healthy breast tissues and Detox-iCAF from breast cancer were obtained by using FindMarkers function from Seurat R package. To validate the result obtained and to account for sample size inflation in scRNA-seq data, cell-level counts were also aggregated at sample-level after pseudo-bulk reconstruction using muscat R package . Differentially expressed genes at pseudo-bulk level were then obtained using DESeq2 R package.
Trajectory inference on scRNA-seq data
Single-cell trajectories on the human BC FAP+ CAF dataset were computed using PAGA tree as implemented in R package dyno version 0.1.1 (https://github.com/dynverse/dyno) with the function infertrajectory supplying as input the normalized dataset containing the 2000 most variable genes. For the downsampling step, 10 iterations were done using randomly of the total FAP+CAF dataset. We also used the Elpigraph-based method STREAM version 0.4.1 . For STREAM, gene filtering step was done using function filter genes with the parameter min_num_cell set to 5, followed by a variable gene selection step with select_variable_genes and parameter loess_frac set to 0.01 . The 3 -dimension UMAP was recomputed using
dimension_reduction. The initial tree structure was seeded with n_cluster set to 10 and the elastic principal graph was obtained by setting epg_alpha to 0.015 , epg_mu to 0.2 and epg_lambda to 0.02 . Monocle3 trajectory graph (https://cole-trapnell-lab.github.io/ monocle3/) was produced using the function learn graph and plotted using plot_cells with default parameters. Root of the pseudotime was set in the Pl16+ Detox-iCAF cluster.
RNA velocity
FAP+CAF velocity analyses were done using Python packages velocyto (http://velocyto.org) and scVelo version 0.2.4 (https://scvelo. readthedocs.io/). As scVelo does not correct for batch effect, this method could not be accurately applied to merged samples. Analysis was therefore conducted on human BC FAP+ CAF scRNA-seq data from the sample showing the highest Shannon index regarding FAP+ CAF cluster representation, as determined by the R function diversity from the vegan package. Loom files containing raw spliced and unspliced counts from each bam files were obtained by running the velocyto command-line pipeline with default parameters using the human reference genome GRCh38. scVelo was applied on each Loom files. Data were filtered and normalized using filter_and_normalize using the top 2000 most variable genes and first and second moments were computed with 30 principal components (PC) and 30 neighbors. The solution to the full dynamical model was obtained by running both recover_dynamics and velocity with mode set to dynamical.
Gene signatures
YAP1/TEAD-target gene signature is composed of the following genes identified in literature as being up-regulated by YAP1/TEAD: ABHD2, BCAR4, BDNF, CHST3, CTGF, CYR61, DAB2, FMN2, FRY, GGH, GJA5, ITGB2, LHFP, LIFR, MFAP5, OLR1, PARVA, PDGFRL, PMP22, PRR16, PRSS23, PTGS2, PXDN, RASAL2, SCARA3, SMARCA1, SPARC, SPRED1, STXBP6.
Analysis of transcription factor activity
The VIPER v1.32 and DoRothEA v1.10 R packages were used to perform transcription factor activity analysis . Only Regulons with a high confidence level (A, B and C) were included in the analysis. Regulons enriched in each FAP+ CAF cluster were identified using the Seurat FindAllMarkers function. To identify transcription factors specifically implicated in the direct versus indirect transition, we recovered the top transcription factors, which displayed a higher mean score in the indirect transition compared to both the direct transition and the other cells. Similar approach was used for and mouse model datasets with a higher mean score in Wound-myCAF compared to Detox-iCAF and ECM-myCAF.
Building a reference breast cancer atlas
Quality control and processing. For construction of the BC atlas, we recovered 3 publicly available processed scRNA-seq datasets . Starting from the available filtered count matrices and initial cell annotations from the authors, we re-processed each cell type individually using the R package Seurat . For data from , treatment-naïve samples were retrieved, and low-quality cells were filtered based on the respective QC distribution for each cell type. Each cell type-specific dataset was log-normalized and scaled with default parameters, excepted if indicated otherwise. For cancer cells, fibroblasts, endothelial and mast cells, we kept cells with more than 1000 features detected. For T cells, we kept cells with less than 3000 features and having more than 500 counts detected. For B cells, we kept cells with more than 1000 features and less than 20,000 counts. For Pal et al. dataset , cells from healthy pre-menopausal samples with more than 750 features, less than 4000 and a percentage of mitochondrial transcript less than were conserved. Normal fibroblasts were then extracted using Vimentin (VIM) expression. In the Wu et al. dataset ,
T cells annotated by authors were kept for our analysis. Myeloid cells were processed with a clustering resolution of 0.3 , and two clusters characterized by low features counts were excluded. Myeloid cells were scaled on Patient ID and nCount_RNA variables. At this step, all datasets (analyzing each cell type) were separately annotated (see below #”Cell type annotation”). All Seurat object obtained were then merged, log normalized and scaled. A principal component analysis (PCA) was computed on the 2500 most variable genes, and the UMAP was generated on the first 30 components of the PCA.
Cell type annotation. Dimensionality reduction and Louvain clustering (resolution 0.3-0.5) followed by either a marker-based annotation or a label transfer were used to annotate the different cell type. Normal epithelial cells and myoepithelial cells were identified among EPCAM+ clusters shared across patients and based on TP63 and KIT expression, respectively, while cancer cell clusters were patient specific due to unique genomic rearrangements, as expected. CNV profiles were established to confirm non-tumoral phenotype of cell types, such as CAF, using InferCNV (see #”Spatial transcriptomics”; “InferCNV on scRNA-seq and spatial transcriptomic data”) section. For CAF annotations, we used label transfer from the in-house FAP+ CAF and CAP datasets. Normal fibroblasts were clustered using the Louvain algorithm at a resolution of 0.2 and annotated based on PI16 and dermatopontin (DPT) expression. Similarly, endothelial cells were clustered at a resolution of 0.2 and annotated based on functional enrichment analysis using Enrich . For annotation of T cells, we integrated the T cells from using FastMNN. Final T cell annotations were obtained by combining label transfer from , canonical markers and Louvain clustering at a resolution of 0.7 . Only T cells from BC were kept in the atlas for further analysis. Myeloid cells were clustered at resolution of 0.4 and cluster 0 was processed and re-clustered at resolution 0.5 to increase resolution. Finally, the obtained clusters were annotated based on literature . B cells, plasma cells and mast cells were annotated based on MS4A1, MZB1 and KIT expression, respectively. For the deconvolution, the cluster of cycling cells was removed to avoid cross-recognition of cycling normal cells with cancer cells. Based on all these annotations, we identified fine-grained fibroblast clusters, including 7 FAP+CAF clusters: Detox-iCAF, IL-iCAF, IFN iCAF, Wound-myCAF, ECM-myCAF, TGF -myCAF, IFN -myCAF; 3 CAP clusters: Contractile-CAP, ECM-CAP, Ag-CAP (Antigen-processing CAP) and 2 normal fibroblast clusters: PI16+ universal fibroblasts and PI16- fibroblasts. We also identified different clusters of myeloid cells, including 3 clusters of APOE+ tumor-associated macrophages (TAM) (TREM2+ TAM; SPP1+ TAM; FOLR2+ TAM) and CXCL10+ Macrophages (Mac), 4 dendritic cell (DC) clusters: Monocyte-derived DC (Mo-DC), CLECL9A+ conventional DC type 1 (CLECL9A+ cDC1), CCR7+ LAMP3+ IL3RA- DC (DCreg), CLEC4C+ IL3RA+ plasmacytoid DC (pDC); one S100A12+ monocyte (S100A12+Mo) cluster; and one cluster of mast cells (KIT+). Interestingly, S100A12+ Mo and CXCL10+ macrophages were the cell populations expressing the most the gene signature from myeloid-derived suppressor cells . Clusters of T lymphocytes were defined as followed: 3 CD8+ clusters: precursor XCL1+ CD8+ T cells (XCL1+CD8+), transitional GZMK+CD8+T cells (GZMK+CD8+), differentiated GZMH+ CD8+ T cells (GZMH+ CD8+); 3 CD4+ clusters: memory CD69+CD4+ T cells (CD69+CD4+), naïve SELL+CD4+ T cells (SELL+ CD4+), TNFRSF18+ CD4 T follicular helper (TNFRSF18+ CD4+ Tfh) and FOXP3+ CD4+ Treg. Two NK clusters were also identified: cytotoxic CD16+ GZMB+ NK (CD16+ NK) and immunoregulatory CD16-NKG2A+/KLRC1+NK (NKG2A+NKreg). We also identified two clusters of B lymphoid cells: B lymphocytes and plasma cells and three endothelial cell (EC) clusters: ACKR1+ antigen presenting EC (ap-EC), which might correspond to tumor-associated high-endothelial venules based on previous literature , CXCL12+ VEGFC+ Angiogenesis-EC (Angio-EC) and CD36+ adipogenesis-related EC (Adipo-EC), as also identified in a recent study . Finally, we detected 3 epithelial clusters:
cancer cells, normal epithelial cells and myoepithelial cells, based on marker expression and InferCNV profiling. To validate that our BC atlas recapitulated all the cell types from the TME previously described, we recovered two independent scRNAseq dataset , which were not used for the atlas construction (except T cells from ). We then used label transfer from our BC atlas as reference to annotate each cells from the two datasets and generated a confusion matrix using the package pheatmap.
Spatial transcriptomics
Sample preparation. Seven frozen BC samples were chosen based on tissue structure and RNA quality (RIN > 8). The “Visium Spatial Tissue Optimization Slide and Reagent Kit” (10X Genomics; #PN-1000193) was then used to optimize permeabilization conditions for BC tissues. Briefly, sections were fixed, stained and then permeabilized at different time points to capture mRNA, and the reverse transcription was performed to generate fluorescently labeled cDNA. The permeabilization time that resulted in the highest fluorescence signal with the lowest background diffusion was chosen. The best permeabilization time for BC tissue was 18 min . Cryostat sections of of thickness were cut and placed on Visium Spatial Gene Expression slides (10X Genomics, PN-1000184). The slide was incubated for 1 min at , then fixed with methanol for 30 min at followed by Hematoxylin and Eosin (H&E) staining and images were taken under a high-resolution microscope. After imaging, the coverslip was detached by holding the slide in water and the slide was mounted in a plastic slide cassette. The spatial gene expression process, including tissue permeabilization, second strand synthesis and cDNA amplification, was performed according to the manufacturer’s instructions (10X Genomics; #CG000239). cDNA quality was next assessed using Agilent High sensitivity DNA Kit (Agilent, #5067-4626). The spatial gene libraries were constructed using Visium Spatial Library Construction Kit (10X Genomics, PN-1000184). Processed public spatial transcriptomic data have been recovered from 10X Genomics website (https://support.10xgenomics.com/spatial-gene-expression/datasets) and from previous study .
Spatial data processing. Using SpaceRanger software v1.2.2 (10x Genomics), spatial raw base call (BCL) files were demultiplexed and mapped to the reference genome GRCh38. Alignment of the slide’s barcoded spot patterns and selection of spots in the tissue were performed using Loupe Browser from 10x Genomics. The resulting count matrices were processed in Seurat v4.1.0 for normalization, scaling, and dimension reduction.
Spatial deconvolution. Deconvolution of the spatial sections was done using the cell2location package version implemented in Python3. The BC atlas described above was used to estimate the reference cell type signatures using RegressionModel with categorical_covariate_keys set to patient ID, other parameters were set to default. To avoid any bias during spatial deconvolution of BC tissues only cells from tumor samples and not cells from reduction mammoplasties were conserved for a total of 37 different cell types and states. Luminal breast cancer cells were kept for deconvolution. For the spatial mapping of the different cell types, we supplied each Visium section individually and set the hyperparameters N_cells_per_location to 15 after manual examination of the slides and detection_alpha to 200. We set the number of epoch to 30,000 . For visualization and downstream analysis, we discretized the q05_cell_abundance_w_sf matrix from cell2location deconvolution by rounding the values up per cell type, or down for cancer cells, based on microscopely recognizable cell types and observed cell numbers, as assessed by a pathologist. Each inferred cell was plotted using a custom function derived from Seurat SpatialDimPlot, where each cell is represented by a point filled with a color representing the corresponding cell type and a jitter of 40 um within the spatial spot to avoid overplotting.
For deconvolution with SpatialDWLS , we used the function runDWLSDeconv with default parameters implemented in Giotto. For RCTD , deconvolution we first created a RCTD object and deconvoluted the section using the run.RCTD function with doublet mode set to multi. For quantification of cell clusters in pathological compartment, we first pulled all sections together and quantified the number of cells in each compartment independently from the section of origin and performed a fisher test between cellular clusters among the cell types. We then extracted the compartment of interest from the sections and computed the proportions for each section of cell clusters among a particular cell type per compartment. We generated a heatmap displaying the median proportion across the section of the percentage of each cellular cluster. We applied a Wilcoxon test one versus all to evaluate the enrichment in a pathological compartment of a particular cellular cluster.
Niche and ECT identification
To identify groups of similar co-occurring cell types across BC sections analyzed by Visium, we merged the cell2location deconvolution output (q05_cell_abundance_w_sf) for each section, transformed the estimated cell-type proportions into isometric log ratios and created a batch balanced k-NN graph using the bbknn function implemented in Scanpy (https://scanpy.readthedocs.io) with default parameters. To identify spots composed of similar cell types, we applied Leiden clustering at a resolution of 0.6 on the resulting graph. We then computed the average cell type composition per cluster (called niches) and we generated a heatmap using the pheatmap R package. A hierarchical clustering on rows (cell types and states) and columns (niches) was finally applied with Euclidean distance and method set to Ward.D2. Heatmap’s values were centered and scaled by rows.
Pathologist annotations and quantifications. Sections where the high-resolution scan was available were annotated by pathologists using the QuPath software or Loupe Browser software (10X Genomics) and defined 5 main pathological features (Peritumor stroma, Intratumor stroma, Cancer cells, Lymphocyte aggregates and Normal ducts and lobules) based on morphology. The resulting annotations were exported as a GeoJson file, imported in R with the geojson_read function from the Geojsonio package, processed with the sf R package and transferred to each Visium spot for deconvolution’s quantification in each area. Pathological features were transferred to each spot on a majority area basis, except for cancer cells where the annotation was transferred if more than of the spot covered the tumor epithelial compartment annotation. When the scanned images from public sections were not available or of insufficient quality to be annotated using QuPath, the spots were annotated using the Loupe Browser software.
InferCNV on scRNA-seq and spatial transcriptomic data. To discriminate cancer cells from normal cells, copy number variations were inferred using InferCNV R package version 1.13.0. For the scRNA-seq data, normal fibroblasts were used as reference and epithelial cells, were used as query. The analysis was run using cluster_by_groups set to True, analysis_mode set to subclusters, otherwise default parameters were used. For spatial data, the spots annotated as Peritumor were used as reference. The analysis was run using cluster_by_groups set to False, analysis_mode set to subclusters, otherwise default parameters were used. CNV information was then imported to the Seurat object using the add_to_seurat function.
Spatial distances analysis. To compute the distribution of distances between each cell type in the different sections, we used the discretized deconvolution cell abundance matrix. For each cell type, we computed the Euclidian distance between each deconvoluted cell compared to all other cells belonging to another cell type by using the
spot coordinates. We considered and kept the closest distance for each reference cell.
Ligand-receptor analysis
scRNA-seq analysis. Ligand-Receptor analyses were performed using the R package CellChat version 1.4.0, with the provided CellChatDB database. Overexpressed genes and interactions were computed with identifyOverExpressedGenes and identifyOverExpressedInteractions respectively, with default parameters. Communication probabilities were computed using computeCommunProb with the default trimean method for calculating the average expression. Filtering of the cell-cell communications was done using filterCommunication, and the communication pathway probability was computed using computeCommunProbPathway with default parameters.
Spatial transcriptomic analysis. Spatial Ligand-Receptor analyses were performed using SpaTalk v1.0 . We used the function dec_celltype to transfer the cell2location deconvolution output on the SpaTalk object created using createSpaTalk with default parameters. We used the function set_expected_cell0 with the result of cell2location cell abundance to indicate the number of cell per spot. We then used find_lr_path to infer cell-to-cell Ligand-Receptor communications and dec_cci to indicate the cell types of interest. Finally, we recovered activation of the downstream pathways using get_lr_path and plotted the result using plot_lr_path and plot_lrpair by indicating the cell implicated using the SpaTalk slot cellpair.
Niche reference mapping
To map the niches on new BC sections, we first created and trained a scVI model with two layers using the deconvolution output of the 17 sections (which allowed us to identify the niches) and the 14 new BC sections collected from . We then converted the model to an scANVI model using scvi.model.SCANVI.from_scvi_model and indicated the niches as the label of interest. We trained the model for 20 epochs and indicated 100 samples per label. We used the predict method of the model to transfer the niche labels on new sections, and finally exported the predicted label and plotted them on the sections.
Analysis of ECT composition in the METABRIC cohort
To analyze ECT enrichments in BC molecular subtypes, we used the BayesPrism algorithm to deconvolute transcriptomic data from the METABRIC cohort. Normalized expression matrix, clinical information and PAM50 subtype classifications were obtained from METABRIC (https://www.cbioportal.org/study/summary?id=brca_ metabric). Luminal A ( ), luminal B ( ), HER2 ( ) and Basal-like TN BC patients were conserved for the analysis. Raw count matrix of 73,426 high-quality cells from our BC atlas was used as input for prior information. Labels were derived from the annotation of 10 ECT described above. ECT6 and ECT7 were pooled to group all epithelial cell types. Mitochondrial and ribosomal protein coding genes were removed as these genes are expressed at high magnitude and not informative in distinguishing cell types. MALAT1 and genes from chrX and chrY were also removed following indication from BayesPrism’s authors. To reduce batch effects and speed up computation, we performed deconvolution only on protein coding genes. Default parameters to control Gibbs sampling and optimization were used. Final estimation of cell type fraction in each bulk RNA-seq sample was recovered using the updated theta matrix and used for downstream analysis. Stratification of tumors was done by applying hierarchical clustering on the matrix of ECT fraction obtained using correlation distance and Ward.D2 method from pheatmap R package. Differences in overall survival between the 4 subgroups of BC patients were assessed using Kaplan-Meier analysis and log-rank test statistics using the survival and survminer R packages.
Analysis of scRNA-seq data from breast and pancreatic mouse models
We recovered two publicly available scRNA-seq datasets (accession numbers E-MTAB-12036 from EBI Biostudies and GSE149636 from the Gene Expression Omnibus) from and mouse models. To allow for cross-species comparisons, we converted mouse gene symbols to their human counterparts. Human and mouse genes were recovered from Ensembl database GRCh38.p13 and GRCm38.p6, respectively. Seurat v4.3.0 was used for all subsequent analyses. Counts were log-normalized with NormalizeData function, then the top 2000 most variable genes were selected using FindVariableFeatures function with vst method. Scaling of the data was applied using ScaleData function and PCA was performed using RunPCA. The cluster annotated as fibroblasts by the authors was isolated for the PDAC dataset , and cells annotated as S100A4+ fibroblasts were selected for the BC dataset . Label transfer using the BC atlas as reference was then applied and all cells not identified as fibroblasts using the annotations obtained from the label transfer step were removed. For the PDAC dataset and BC dataset, we finally recovered respectively 35,508 and , respectively. For the quantification of cells in wild-type (WT) and Lrrc15-diphteria toxin receptor knock-in mice, the following timepoints and conditions were conserved: WT mice: Skin_WTnaive_Stroma, DO_NoTx_Stroma, D7_DTRneg_Stroma, D14_DTRneg_Stroma, D21_DTRpos_Stroma Lrrc15diphteria toxin receptor knock-in: Skin_WTnaive_Stroma, DO_NoTx_Stroma, D7_DTRpos_Stroma, D14_DTRpos_Stroma, D21_DTRpos_Stroma.
Bulk RNA-seq from INVADE cohort
Frozen samples were processed for RNA extraction using kit (miRNeasy Mini Kit, Qiagen #217004) following the manufacturer’s instructions. RNA integrity and quality were analyzed using Agilent 4200 TapeStation system. The library was prepared following the protocol of the Illumina TruSeq Stranded mRNA kit according to the supplier’s recommendations. Briefly, the key steps of this protocol were successively, starting from of total RNA: purification of PolyA (containing mRNA molecules) using magnetic beads attached to poly-T oligonucleotides, fragmentation using divalent cations at high temperature to obtain fragments of , cDNA synthesis, and finally ligation of Illumina adapters and amplification of the cDNA library by PCR. Sequencing was then performed on the Illumina HiSeq2500 sequencer (75-bp paired end). Image analysis and basecalling were performed using Illumina Real Time Analysis (RTA 2.1.3) with default settings. TopHat2 (v2.0.10) was used to align the raw RNAseq data on the human genome (hg19) and on a transcriptome from the refSeq annotations (April 2015 version) with the following parameters: bowtie2 (v2. 1. 0) using the sensitive and fr-firsttrand parameters for the library type (strand specific protocol), allowing up to 2 mismatches in the seed of 25 bp and a gap of up to 10 bp in alignment, an intron size between 30 bp and 700 kbp , with a mean insert size between read pairs of 155 bp with a standard deviation of 80 bp. Raw counts were then calculated by reconstructed transcripts (26,093 genes), using Cufflinks toolkit (v2.2.1) , using default parameters and stranded mode. Raw count data are available from the Figshare data repository (DOI: 10.6084/ m9.figshare.21591351).
Deconvolution of bulk RNA-seq data
Fifty-five Bulk RNA-seq from the INVADE cohort and 216 bulk RNA-seq from the TBCRC 038 cohort were deconvolved using BayesPrism algorithm version . Raw count matrix of 73,426 high-quality cells from our BC atlas was used as input for prior information. Labels were derived from the annotation of 39 cell types and states described above. Mitochondrial and ribosomal protein coding genes were removed as these genes are expressed at high magnitude and not informative in distinguishing cell types. MALAT1 and genes from chrX
and chrY were also removed following indication from BayesPrism’s authors. To reduce batch effects and speed up computation, we performed deconvolution only on protein coding genes. Default parameters to control Gibbs sampling and optimization were used. Final estimation of cell type fraction in each bulk RNA-seq sample was recovered using the updated theta matrix and used for downstream analysis.
Flow cytometry analysis of BC samples
All antibodies used in our study have been listed in Supplementary Table 3. Fresh human BC samples were collected directly after macroscopic examination and selection of areas of interest by a pathologist. Tumor samples were stored in -independent medium and transferred to the research institute. All tumor samples were processed without any previous knowledge about CAF and immune cell infiltration. Samples were cut into small pieces (around ) and digested in -independent medium (Gibco #18045-054) supplemented with human serum (BioWest #54190-100), of collagenase I (Sigma #C0130), of hyaluronidase (Sigma #H3506) and of Dnase I (Roche #11284932001) during 45 min at with permanent shaking ( 500 rpm ). Cells were then filtrated through a cell strainer (Fisher Scientific #223635447) and resuspended in PBS+ solution (PBS, Gibco #14190; EDTA 2 mM, Gibco #15575; Human Serum 1%, BioWest #S4190-100). After centrifugation, cells were counted using BeckmanCell Counter and resuspended to a concentration of to . Cells were first incubated with Live/Dead dye (1:1000, BD Horizon Fixable Viability Stain 780 dye, BD Biosciences, #565388 for FAP+ CAF clusters and Fixable Violet Dead Cell Stain Kit, Thermo Fisher, #L34955 for TAM subsets) for 10 min at room temperature (RT) to exclude non-viable cells. After a rapid washing with PBS+, cell suspension was then stained for 20 min at RT with an antibody mix specific pour each cell type (as detailed below). Cells were then washed and acquired on the BD LSRFortessa analyzer (BD biosciences). For flow cytometry analysis, cells were first gated based on their size (FSC-A) and granularity (SSC-A). Cell types were then analyzed on the Live/Dead negative fraction and defined as epithelial (EPCAM+), hematopoietic (CD45+), endothelial (CD31+) and red blood cells (CD235a+). Specific surface markers are then added to the antibody mix to characterize FAP+ CAF clusters and TAM subsets. For all flow cytometry analysis, at least events were recorded for each sample. Compensations were performed using single staining of antiMouse IgG and Negative control particle set (BD biosciences, #552843) with each antibody.
Characterization of FAP+ CAF clusters. The markers used for the gating strategy identifying FAP+ CAF (CAF-S1) clusters have been based on differentially expressed genes and described in detail in one of our recent publication . These different markers were defined based on pairwise comparisons of expression profiles from FAP+ CAF clusters that helped us to identify specific genes for each cluster. In addition, we considered surface expressed proteins for which commercially antibodies were available allowing both flow cytometry analysis and cell sorting. These markers cannot be used separately as the identification of the clusters relies on the successive combination of different markers, as described below. The identification of FAP+ CAF clusters relies on the combination of these different markers tested successively. In brief, FAP+CAF were first separated on the basis of the ANTXR1 protein level that distinguished myofibroblastic (myCAF, ANTXR1+) from inflammatory (iCAF, ANTXR1-). ANTXR1+ myCAF clusters were next distinguished according to SDC1, LAMP5, and CD9 protein levels. ANTXR1 + SDC1 + LAMP5 – were defined as ECMmyCAF, ANTXR1+ LAMP5+ SDC1+/- as TGF -myCAF and ANTXR1+ SDC1- LAMP5- CD9+ as Wound-myCAF. ANTXR1- iCAF clusters were separated using GPC3, DLK1 and CD74 markers. ANTXR1- GPC3+ DLK1+/- were defined as Detox-iCAF; ANTXR1- GPC3- DLK1+ as
IL-iCAF and ANTXR1- GPC3- DLK1- CD74+ as IFN -iCAF. To allow this characterization, cells were stained with an antibody cocktail containing anti-EpCAM-BV605 (1:50; BioLegend, # 324224), anti-CD31PECy7 (1:100, BioLegend, #303118), anti-CD45-BUV395 (1:20, BD Biosciences, #BD-563792), anti-CD235a-PerCP/Cy5.5 (1:50, Biolegend, #349109), anti-CD29-Alexa Fluor 700 (1:100, BioLegend, #303020), anti-FAP-APC (1:100, R&D Systems, #MAB3715), anti-ANTXR1-Alexa Fluor 405 (1:25, Novus Bio, #NB100-56585AF405), anti-SDC1-BUV737 (1:25, BD Biosciences, #612834), anti-LAMP5-PE (1:10, Miltenyi Biotec, #130-109-156), anti-GPC3-Alexa Fluor 549 (R&D systems, 1:20, #FAB2119T), anti-DLK1-Alexa Fluor 488 (R&D systems, 1:20, #FAB1144G), anti-CD9-BV711 (BD Biosciences, 1:100, #743050) and anti-CD74-BV786 (BD Biosciences, 1:100, #743736). All antibodies except FAP were purchased already conjugated with fluorescent dyes. Anti-FAP primary antibody was conjugated with fluorescent dye Zenon APC Mouse IgG1 labeling kit (1:100, Thermo Fisher Scientific, #Z25051). Isotype control antibodies for each CAF marker used were: iso-anti-CD29-Alexa Fluor 700 (Alexa Fluor 700 Mouse IgG1 к Isotype Ctrl Antibody, 1:100, BioLegend, #400144), iso-anti-FAP-APC (Mouse IgG1 к Isotype Control, R&D Systems, 1:200, #MAB002), iso-anti-ANTXR1Alexa Fluor 405 (Mouse IgG1 Alexa Fluor 405-conjugated Antibody, 1:100, R&D systems, #IC002V), iso-anti-SDC1-BUV737 (BUV737 Mouse IgG1 к Isotype Control; 1:100, BD Biosciences, #612758), iso-anti-LAMP5-PE (PE human IgG1 REA Control Antibody, 1:10, Miltenyi Biotec #130-104-613), iso-anti-GPC3-Alexa Fluor 549 (Mouse IgG2A Alexa Fluor594-conjugated Isotype Control, 1:20, R&D systems, #IC003T), iso-anti-DLK1-Alexa Fluor 488 (Mouse IgG2B Alexa Fluor488conjugated Isotype Control, 1:20, R&D systems, IC0041G), iso-anti-CD9-BV711 (BV711 Mouse IgG1 к Isotype Control, 1:100, BD Biosciences, #563044) and iso-anti-CD74-BV786 (BV786 Mouse IgG1 к Isotype Control, 1:100, BD Biosciences, #563330). The cut-offs for the gating for each marker was defined based on the isotype controls represented in black in the representative FACS plots in Supplementary Fig. 1.
Characterization of TAM subsets. Among total CD45+ hematopoietic cells, CD3, CD19 and CD56 markers were used to exclude T lymphocytes (CD3+), B lymphocytes (CD19+) and NK cells (CD56+). TAM subsets were next characterized as CD14+ CD16+ cells and the percentage of TREM2+ and FOLR2+ macrophages was then evaluated. To do so, cell suspension was stained with an antibody mix containing anti-CD45-APCcy7 (1:50, BD Biosciences, #557833), anti-CD3-Alexa Fluor 700 (1:50, BD Biosciences, #557943), anti-CD14-Pecy7 (1:50, BD Biosciences, #557742), anti-CD19-PercCPcy5.5 (1:50, BD Biosciences, #561295), anti-CD16-BV650 (1:50, BD Biosciences, #563692), anti-CD56-BUV395 (1:50, BD Biosciences, #563554), anti-FOLR2-PE (1:50, Biolegend, #391704) and anti-TREM2-APC (primary antibody, 1:50, Novus Biologicals, #MAB17291). All antibodies were purchased already conjugated with fluorescent dyes, except TREM2. Isotype control antibodies for macrophages subsets were used: iso-anti-CD16-BV650 (BV650 Mouse IgG1 к Isotype Control, 1:50, BD Biosciences, #563231), iso-anti-CD56-BUV395 (BUV395 Mouse IgG2b к Isotype Control; 1:50, BD Biosciences, #563558), iso-anti-CD14-Pecy7 (PE-Cy7 Mouse IgG2a к Isotype Control, 1:50, BD Biosciences, #557907), iso-anti-FOLR2-PEC (PE Mouse IgG1 к Isotype Ctrl Antibody; 1:100, Biolegend, #400112) and iso-anti-TREM2-APC (Rat IgG2B Isotype Control, 1:50, Novus Biologicals, #MAB0061). For TREM2 detection, cells were stained for 20 min at RT with secondary antibody (Rat F(ab)2 IgG APC-conjugated Antibody 1:50, Novus Biologicals, #F0105B). Depending on the size of the tumor samples and the number of cells obtained after digestion, we were able to analyze by flow cytometry the content in both macrophage subsets and CAF-S1 clusters per sample in 25 samples.
CAP scRNA-seq
Isolation of CAP from BC. CAP were isolated from a total of three primary BC (surgical residues prior to any treatment) by using BDFACS
ARIA III sorter (BD Biosciences). BC were collected directly from the operating room after surgical specimen macroscopic examination and selection of areas of interest by a pathologist. Samples were cut into small pieces (around ) and digested in -independent medium (Gibco #18045-054) supplemented with liberase (Roche #05401020001) and Dnase I (Roche #11284932001) for 40 min at with shaking ( 180 rpm ). After digestion, cells were processed and stained as described above (#”Flow Cytometry analysis of BC samples”). CAP fibroblasts were then gated on the Live/Dead negative fraction and defined as EPCAM- CD45- CD31- CD235a- FAP CD29 .
CAP scRNA-seq. Upon isolation, CAP cells were directly collected into RNase-free tubes (Thermo Fisher Scientific, #AM12450) precoated with DMEM (GE Life Sciences, #SH30243.01) supplemented with 10% FBS (Biosera, #1003/500). Single-cell capture, lysis, and cDNA library construction were performed using Chromium system from 10X Genomics, with the following kits: Chromium Single Cell 3′ Library & Gel Bead Kit v2 kit (10X Genomics, #120237) and Chromium Single Cell A Chip Kits (10X Genomics, #1000009). Generation of gel beads in Emulsion (GEM), barcoding, post GEM-reverse transcription cleanup and cDNA amplification were performed according to the manufacturer’s instructions. Cells were loaded accordingly on the Chromium Single cell A chips, and 12 cycles were performed for cDNA amplification. cDNA quality and quantity were checked on Agilent 2100 Bioanalyzer using Agilent High Sensitivity DNA Kit (Agilent, #5067-4626) and library construction followed according to 10X Genomics protocol. Libraries were next run on the Illumina HiSeq (for patients P1) and NovaSeq (for patients P2-3) with a depth of sequencing of 50,000 reads per cell. Processing of raw data, including demultiplexing of raw base call (BCL) files into FASTQ files, alignment, filtering, barcode, and Unique Molecular Identifiers (UMI) counting, were performed using 10X Cell Ranger pipeline version 2.1.1. Reads were aligned to Homo sapiens (human) genome assembly GRCh38 (hg38). Seurat v.3.0.0 was used for log normalization, scaling, dimensionality reduction and clustering using default parameters. Low-quality cells were first filtered out based on the distribution of the unique genes detected (nonzero count). Cells with less than 200 genes detected and more than 4000 genes detected (for patient 1), more than 4500 genes detected (for patients 2) or more than 3500 genes detected (for patient 3 ) were excluded. Cells with a fraction of mitochondrial genes higher than were discarded. Integration of the samples was done using Seurat functions FindIntegrationAnchors and IntegrateData with 30 components. Graph-based clustering was applied using FindNeighbours ( ) and FindClusters functions (res = 0.4).
Isolation and culture of primary FAP + CAF clusters
Fresh BC samples received after surgery were cut into fragments of , put either in plastic petri dishes or in petri dishes coated with type I collagen at a final concentration of (Institut De Biotechnologie Jacques Boy, #207050357) and cultured in DMEM (Gibco, #41966-029) supplemented with heat inactivated FBS (Biosera, #FB-1003-500) and 1% streptomycin and penicillin (Sigma, #p4333) for 2-3 weeks at . Media was renewed every 3 days during an expansion phase of weeks. When fibroblasts reached at least 50% of confluency, they were detached using TrypLE (Gibco, #12605-010), centrifuged at for 5 min and plated in new plastic plates or collagen-coated plates using DMEM supplemented as above. To separate the different FAP+ CAF clusters, cells in both conditions were collected separately and sorted by BDFACS ARIA III using FAP+ CAF cluster-specific surface markers described in ref. 10. For cell sorting strategy, FAP+ CAF cultured on plastic plates were separated based on ANTXR1 and LAMP5 in 2 distinct clusters, ECMmyCAF (CD29+ FAP+ ANTXR1+ LAMP5-) and TGF -myCAF (CD29+
FAP+ ANTXR1+ LAMP5+). Cells were stained with an antibody mix containing anti-CD29-Alexa Fluor 700 (1:100, BioLegend, #303020), anti-FAP-APC (1:100, R&D Systems, #MAB3715), anti-ANTXR1-AF405 (1:25, Novus Bio, #NB100-56585AF405) and anti-LAMP5-APC (1:10, Miltenyi Biotec, #130-109-204). We applied similar strategy for cells cultured on collagen-coated plates. FAP+ CAF were sorted in 3 distinct iCAF clusters based on ANTXR1, GPC3 and CD74, defined as followed: Detox-iCAF (CD29+ FAP+ ANTXR1- GPC3+), IL-iCAF (CD29+ FAP+ ANTXR1- GPC3-) and IFN -iCAF (CD29+ FAP+ ANTXR1- GPC3- CD74+). To do so, cells were stained with an antibody mix containing anti-CD29-Alexa Fluor 700 (1:100, BioLegend, #303020), anti-FAP-APC (1:100, R&D Systems, #MAB3715), anti-ANTXR1-AF405 (1:25, Novus Bio, #NB100-56585AF405), anti-GPC3AF700 (1:25, R&D systems, #FAB2119N) and anti-CD74-FITC (1:50, BD Biosciences, #555540). After sorting, cells were expanded in culture at in DMEM media supplemented as above, in a humidified and incubator, either on plastic dishes for ECM-myCAF and TGF -myCAF or on collagen-coated dishes for Detox-iCAF, ILiCAF and IFN -CAF. To avoid any change in FAP+ CAF cluster identity, fibroblasts were maintained in the same culture condition after sorting. All experiments using FAP+ CAF primary cell lines were not performed beyond passage 10 to avoid fibroblast senescence. Using this protocol, ten different cell lines from ten different patients were isolated and used for functional assays. Verification of the identity of FAP+ CAF cluster cells was determined by flow cytometry using the same antibody mix as detailed above (#”Characterization of FAP+ CAF clusters”).
Characterization of CAF-S1 cluster identity upon culture by RNA sequencing
To validate by RNA sequencing the identity of sorted FAP+ CAF cells, RNAs were extracted using Qiagen miRNeasy Kit (Qiagen, #217004) according to the manufacturer’s instructions. RNA extraction was performed at the same timepoint as flow cytometry analyses. Verification of RNA integrity and quality was performed using the Agilent RNA 6000 nano Kit (Agilent Technologies, #5067-1511). cDNA libraries were prepared using the TruSeq Stranded mRNA Kit (Illumina, #20020594) followed by sequencing on NovaSeq (Illumina). Overall quality of raw sequencing data was first checked using FastQC (v0.11.9). Reads were then aligned on a ribosomal RNA database using bowtie (2.4.2) and on the human reference genome (hg38) with STAR (2.7.6a). Additional controls on aligned data were performed to infer strandness (RSeQC 4.0.0), complexity (Preseq 3.1.1), gene-based saturation, read distribution or duplication level using Bioconductor R package DupRadar. The aligned data were then used to generate a final count matrix with all genes and all samples. Only genes with at least one read in at least of all samples were kept for further analyses. Normalization and differential analysis between all FAP+ CAF clusters were conducted with DESeq2 R package. We used Detox-iCAF, IL-iCAF and IFN -iCAF gene signatures to determine the enrichment score in Detox-iCAF, ILiCAF and IFNg-iCAF clusters compared to myCAF clusters. Gene Set Enrichment Analysis (GSEA) software version 3.0 (Broad Institute) was used with the following parameters: Enrichment statistic = ” classic”, Metric for ranking genes = “Signal2Noise.” A heatmap highlighting CAF-S1 cluster marker genes in the bulk RNAseq between sorted CAF-S1 clusters was generated using the R package pheatmap with clustering set to “ward.D2” and distance set to “correlation”.
Functional assays
Isolation of immune cells. Primary immune cells were isolated from peripheral blood of healthy donors (with informed consent) obtained from the “Etablissement Français du sang” through an approved convention with the Institut Curie, Paris, France. Briefly, peripheral blood mononuclear cells (PBMC) were isolated using Lymphoprep
(STEMCELL #07861) and immune cell populations were selectively isolated by magnetic cell separation using specific isolation Kits (Human Natural Killer Cell Isolation Kit, Miltenyi #130-092-657; Human CD14 Microbeads, Miltenyi #130-050-201; Human CD4+ CD25+ regulatory T cell Isolation Kit, Miltenyi #130-091-301). For co-culture experiments, fibroblasts of each FAP+ CAF cluster were plated on 24 -well plates in DMEM supplemented with heat-inactivated FBS and 1% Penicillin streptomycin at overnight for complete adherence. The medium was then removed and of DMEM supplemented with FBS containing cells or CD14+ monocytes or CD4+ CD25+ T lymphocytes were added. Co-cultures were maintained for 24 h at for NK cells and monocytes and for 16 h at for T lymphocytes. For flow cytometry analysis, immune cells were harvested after incubation, washed, and stained for 10 min at RT with LIVE/DEAD dye (1:1000, Thermo Fisher, #L34955) to exclude dead cells. Cells were then stained for 30 min at RT with a mix containing specific antibodies for the characterization of immune cell populations. Cells were first gated based on their size (FSC-A) and granularity (SSC-A). TAM and NK populations were analyzed on the Live/Dead negative fraction and defined as myeloid cells (CD45+CD3-CD19-CD14+), NK (CD45+CD3-CD19- CD56+ CD16+/-) and T cells (CD45+ CD3+ CD4+). For TAM characterization, total amount of cells was recovered, and monocyte phenotype was assessed by flow cytometry for CD16, TREM2 and FOLR2 protein levels as detailed above (“Flow cytometry analysis of BC samples” #”Characterization of TAM”). CD14+ monocytes were differentiated from FAP+ CAF cells after analysis using CD45 staining. For NK characterization, cells were separated in two subsets according to CD56 and CD16 and defined as cytotoxic NK (CD16 CD56 ) and noncytotoxic NK (CD16 CD56 ). The percentage of NKG2A among CD16+ cells as well as granzyme B and perforin levels were also evaluated. To do so, cells were recovered after co-culture and stained with an antibody mix containing anti-CD45-APCcy7 (1:50, BD Biosciences, #557833), anti-CD16-BV650 (1:50, BD Biosciences, #563692), anti-CD56-BUV395 (1:50, BD Biosciences, #563554) and anti-NKG2A-BV786 (1:50, BD Biosciences, #747917). All antibodies were purchased already conjugated with fluorescent dyes. Isotype control antibodies were used: iso-anti-CD16-BV650 (BV650 Mouse IgG1 к Isotype Control, 1:50, BD Biosciences, #563231), iso-anti-CD56-BUV395 (BUV395 Mouse IgG2b к Isotype Control, 1:50, BD Biosciences, #563558) and iso-anti-NKG2A-BV786 (BV786 Mouse IgG1 к Isotype Control, 1:50, BD Biosciences, #563330). After cell surface staining, cells were fixed in paraformaldehyde 4% (PFA) (Electron Microscopy Sciences, #15710) for 15 min at RT. After a washing step with PBS+, cells were incubated with an antibody mix containing anti-Granzyme B PE (1:50, BD Biosciences, #561142) and anti-perforin-AF488 (1:50, BD Biosciences, #563764). Antibodies are suspended in PBS+ solution supplemented with 0.1% of Saponin (Sigma-Aldrich #S7900) and corresponding isotype control antibodies were used: iso-anti-Granzyme B PE (PE Mouse IgG1 к Isotype Control, 1:50, BD Biosciences, #555749) and iso-anti-Perforin-AF488 (Alexa Fluor 488 Mouse IgG2b к Isotype Control; 1:50, BD Biosciences, #558716).
For characterization of FOXP3+ regulatory T cells, CD4+ CD25+ T lymphocytes were harvested after co-culture with CAF and stained for 30 min at RT with an antibody mix containing anti-CD45-APCcy7 (1:50, BD Biosciences, #557833), anti-CD3-AF700 (1:50, BD Biosciences, #557943), anti-CD4-APC (1:10, Miltenyi Biotec, #130-113-210), anti-CD25-PE (1:20, Miltenyi Biotec, # 130-113-282), anti-PD-1-BUV737 (1:50, BD Biosciences, #612791) and anti-CTLA4-PEcy5 (1:50, BD Biosciences, #555854). Isotype control antibodies were used: iso-anti-CD25-PE (1:20, Miltenyi Biotec, 130-092-215), iso-anti-PD-1-BUV737 (BUV737 Mouse IgG1, к Isotype Control; 1:50, BD Biosciences #564299) and iso-anti-CTLA4-PEcy5 (PE-Cy5 Mouse IgG2a, к Isotype Control; 1:50, BD Biosciences, #555575). FOXP3 staining buffer set kit (eBioscience, #00-5523-00) was used to detect intra-nuclear FOXP3 protein. After fixation
and permeabilization for 1 h at RT, CD4+ CD25+ T lymphocytes were incubated with anti-FOXP3-Alexa Fluor 488 (1:40, Thermo Fisher Scientific, #53-4776-42) for 30 min at RT. The corresponding isotype control (Rat IgG2a kappa Isotype Control (eBR2a), Alexa Fluor 488, 1:200, eBiosciences, #53-4321-80) was also used.
Transwell migration assay
For CD14 + migration assay, clusters were plated in the lower chamber of a transwell plate ( pore size, Corning HTS Transwell 24 wells #CLS3413) in of DMEM supplemented with heat-inactivated FBS and Penicillin streptomycin at overnight. After FAP+ CAF cell adherence, CD14+ monocytes ( cells in a volume of DMEM supplemented with FBS) were added in the upper chamber and incubated for 6 h at . After incubation, CD14+ monocytes in the upper and lower chamber were recovered separately. In total, of carboxylated beads (Polyscience #18133) and DAPI ( ) were added to each sample before counting. Cell counting was performed by Flow Cytometry using precision beads for normalization and represented as percentage of migration, calculated as the ratio of the cell number in the lower chamber by the total number of monocytes.
Silencing experiment using small-interference RNA (siRNAs)
For the short interfering RNA (siRNA) experiment, primary fibroblasts of each cluster were plated in a 6 well plate and transfected with 10 nM of siRNA the same day. Transfected cells were incubated in DMEM supplemented with heat inactivated FBS for 72 h at and . siRNA control used was ON-TARGETplus Nontargeting siRNA (Target sequence UGG-UUU-ACA-UGU-UGU-GUG-A, Dharmacon #D-001810-02-05). YAP1 silencing was performed with two distinct siRNAs targeting YAP1 ((YAP1(1)S 5′-UGA-GAA-CAA-UGA-CGA-CCA-A-3′ and YAP1(1)AS 5′-UUG-GUC-GUC-AUU-GUU-CUC-A-3′ YAP1(2) 5′-CCA-CCA-AGC-UAG-AUA-AAG-A-3′ and YAP1(2)AS 5′-CCA-CCA-AGC-UAG-AUA-AAG-A-3′). DPP4 silencing was also achieved using two different siRNA targeting DPP4 ( -CAC-UCU-AAC-UGA-UUA-CUU-A-3′ and 5′-CAA-GUU-GAG-UAC-CUC-CUU-A-3′, Horizon Discovery, #LQ-004181-00-0005). TGFBRII silencing was performed using two different siRNA ( -CAA-CAA-CGG-UGC-AGU-CAA-G-3′ and 5′-GAC-GAG-AAC-AUA-ACA-CUA-G-3′). Transfections were performed with DharmaFECT 2 Transfection Reagent (Horizon Discovery, #T-2005-01) according to manufacturer’s instructions. Efficient YAP1 and DPP4 silencing were analyzed after 72 h by western blot.
Protein extraction and western blot
Protein extraction. Cells were washed with cold PBS (Gibco #14190) and lyzed with of Laemmli buffer (BioRad, #1610737) supplemented with DTT at a final concentration of 50 mM (Thermo Scientific, #11896744). Samples were next heated at for 10 min and then sonicated for 10 min (cycles of ) and centrifuged during 10 min at at . The protein extract was short-term stored at .
Western blot. Fifteen of proteins were loaded into a NuPAGE Novex bis tris mini gels (Thermo Fisher, #NP0321BOX). The migration was performed for 2 h at 120 V in 1X NuPAGE MOPS SDS Running Buffer (for Bis-Tris Gels only) (Invitrogen, #NP0001) in electrophoresis. The proteins were then transferred to a nitrocellulose membrane (GE Healthcare #10600002) and incubated overnight at with the appropriate primary antibodies: Human DPPIV/CD26 Antibody (1:000, R&D systems #AF1180); Human YAP (D8H1X) Rabbit monoclonal antibody (1:1000, Cell Signaling #14074), Actin (1:10.000; Sigma #A5441), SMAD2 (D43B4) XP Rabbit monoclonal antibody (1:1000, Cell signaling #5339), phosphor-SMAD2 (Ser465/467) Rabbit monoclonal antibody (1:1000, Cell signaling #3108) and TGF -Receptor II Rabbit monoclonal antibody (1:1000, Cell signaling
#41896). After several washes and 1 h of incubation using appropriate peroxidase-conjugated secondary antibodies (Jackson ImmunoResearch Laboratories #115-035-003), the proteins were visualized using enhanced chemiluminescence detection (Western Lightning Plus-ECL, PerkinElmer #NEL103E001EA). Analyses of immunoblots were performed using ImageJ software.
Human breast cancer cell lines
MCF7 (ATCC #HTB-22) and MDA-MB-231 (ATCC #CRM-HTB-26) BC cell lines were cultured in DMEM (Gibco, #41966-029) supplemented with 10% FBS (Biosera, #FB-1003-500) and 1% streptomycin and penicillin (Sigma, #p4333). T47D (ATCC #HTB-133) were cultured in RPMI (Gibco, #11875093) supplemented with 10% FBS and 1% streptomycin and penicillin. MCF10A (ATCC #CRL-10317) were cultured in DMEM/ F12 (Gibco, #11320033) media supplemented with 10% FBS and 1% streptomycin and penicillin. All cells were maintained in a humidified and incubator. The cell identity was verified by using the Short Tandem Repeat (STR) DNA profiling (Promega # B9510) method.
Co-culture of clusters with breast cancer cell lines
For co-culture assays, fibroblasts from Detox-iCAF, IL-iCAF or IFN -iCAF clusters were plated in 6 -well plates and incubated overnight at to allow CAF adhesion on the plates. The next day, MCF7 (Lum BC cells), T47D (Lum BC cells), MDA-MB-231 (TN BC cells) or MCF10 (non-tumoral epithelial cells isolated from breast tissue) were added on CAF culture. Cells were next collected at different timepoints (as indicated on corresponding Figure plots), washed in PBS and stained for 20 min at RT with the same antibody mix as detailed above (#”Characterization of CAF-S1 clusters”), containing additionally anti-EPCAM-BV650 (1:100, Biolegend, #324224) to differentiate CAF from epithelial cells by flow cytometry. Samples were next acquired on the LSRFortessa analyzer (BD biosciences) and data were analyzed using FlowJo 10.5.2. software.
Stimulation of Detox-iCAF with TGF and MCF-7-derived conditioned medium
In total, fibroblasts from Detox-iCAF cluster were plated in 6-well plates and incubated overnight at to allow cell adherence. The next day, the cells were stimulated with of TGF or conditioned media collected from MCF-7 breast cancer cells and centrifuged for 5 min at to eliminate debris. Cells were next harvested at different timepoints (t0-72 h) for flow cytometry analysis as detailed above (#”Co-culture of FAP+ CAF clusters with BC cell line”).
Statistical analysis
All statistical analyses and graphical representation of data were performed in the R environment (https://cran.r-project.org, version 4.2.0) or using GraphPad Prism software (version 9.4.1). Statistical tests used are in agreement with data distribution: Normality was first checked using the Shapiro-Wilk test, and parametric or nonparametric twosided tests were applied according to normality, as indicated in each figure legend. Symbols for significance: ns, non-significant; *<0.05, **<0.01; ***<0.001; ****<0.0001.
Reporting summary
Further information on research design is available in the Nature Portfolio Reporting Summary linked to this article.
Data availability
Raw scRNA-seq from CAP, spatial transcriptomic from BC sections and bulk RNA-seq data from the INVADE cohort and from cultured fibroblasts generated in this study are available on European GenomePhenome Archive platform (https://ega-archive.org) under the controlled accession numbers: EGAS50000000220 and
Ohlund, D. et al. Distinct populations of inflammatory fibroblasts and myofibroblasts in pancreatic cancer. J. Exp. Med. 214, 579-596 (2017).
Bartoschek, M. et al. Spatially and functionally distinct subclasses of breast cancer-associated fibroblasts revealed by single cell RNA sequencing. Nat. Commun. 9, 5150 (2018).
Cremasco, V. et al. FAP delineates heterogeneous and functionally divergent stromal cells in immune-excluded breast tumors. Cancer Immunol. Res. 6, 1472-1485 (2018).
Givel, A. M. et al. miR200-regulated CXCL12beta promotes fibroblast heterogeneity and immunosuppression in ovarian cancers. Nat. Commun. 9, 1056 (2018).
Biffi, G. et al. IL1-induced JAK/STAT signaling is antagonized by TGFbeta to shape CAF heterogeneity in pancreatic ductal adenocarcinoma. Cancer Discov. 9, 282-301 (2019).
Elyada, E. et al. Cross-species single-cell analysis of pancreatic ductal adenocarcinoma reveals antigen-presenting cancer-associated fibroblasts. Cancer Discov. 9, 1102-1123 (2019).
Neuzillet, C. et al. Inter- and intra-tumoural heterogeneity in cancer-associated fibroblasts of human pancreatic ductal adenocarcinoma. J. Pathol. 248, 51-65 (2019).
Dominguez, C. X. et al. Single-cell RNA sequencing reveals stromal evolution into LRRC15(+) myofibroblasts as a determinant of
patient response to cancer immunotherapy. Cancer Discov. 10, 232-253 (2020).
Friedman, G. et al. Cancer-associated fibroblast compositions change with breast cancer progression linking the ratio of S100A4(+) and PDPN(+) CAFs to clinical outcome. Nat. Cancer 1, 692-708 (2020).
Kieffer, Y. et al. Single-cell analysis reveals fibroblast clusters linked to immunotherapy resistance in cancer. Cancer Discov. 10, 1330-1351 (2020).
Sebastian, A. et al. Single-cell transcriptomic analysis of tumorderived fibroblasts and normal tissue-resident fibroblasts reveals fibroblast heterogeneity in breast cancer. Cancers 12, 1307 (2020).
Hu, H. et al. Three subtypes of lung cancer fibroblasts define distinct therapeutic paradigms. Cancer Cell 39, 1531-1547.e10 (2021).
Wu, S. Z. et al. A single-cell and spatially resolved atlas of human breast cancers. Nat. Genet. 53, 1334-1347 (2021).
Foster, D. S. et al. Multiomic analysis reveals conservation of cancer-associated fibroblast phenotypes across species and tissue of origin. Cancer Cell 40, 1392-1406.e7 (2022).
Cords, L. et al. Cancer-associated fibroblast classification in single-cell and spatial proteomics data. Nat. Commun. 14, 4294 (2023).
Jain, S. et al. Single-cell RNA sequencing and spatial transcriptomics reveal cancer-associated fibroblasts in glioblastoma with protumoral effects. J. Clin. Invest. 133, e147087 (2023).
Costa, A. et al. Fibroblast heterogeneity and immunosuppressive environment in human breast cancer. Cancer Cell 33, 463-479.e10 (2018).
Pelon, F. et al. Cancer-associated fibroblast heterogeneity in axillary lymph nodes drives metastases in breast cancer through complementary mechanisms. Nat. Commun. 11, 404 (2020).
Bonneau, C. et al. A subset of activated fibroblasts is associated with distant relapse in early luminal breast cancer. Breast Cancer Res. 22, 76 (2020).
Hosaka, K. et al. Pericyte-fibroblast transition promotes tumor growth and metastasis. Proc. Natl Acad. Sci. USA 113, E5618-E5627 (2016).
Finak, G. et al. Stromal gene expression predicts clinical outcome in breast cancer. Nat. Med. 14, 518-527 (2008).
Toullec, A. et al. Oxidative stress promotes myofibroblast differentiation and tumour spreading. EMBO Mol. Med. 2, 211-230 (2010).
Kwa, M. Q., Herum, K. M. & Brakebusch, C. Cancer-associated fibroblasts: how do they contribute to metastasis? Clin. Exp. Metastasis 36, 71-86 (2019).
Vennin, C. et al. CAF hierarchy driven by pancreatic cancer cell p53-status creates a pro-metastatic and chemoresistant environment via perlecan. Nat. Commun. 10, 3637 (2019).
Hilmi, M., Nicolle, R., Bousquet, C. & Neuzillet, C. Cancerassociated fibroblasts: accomplices in the tumor immune evasion. Cancers 12, 2969 (2020).
Sahai, E. et al. A framework for advancing our understanding of cancer-associated fibroblasts. Nat. Rev. Cancer 20, 174-186 (2020).
Jungwirth, U. et al. Impairment of a distinct cancer-associated fibroblast population limits tumour growth and metastasis. Nat. Commun. 12, 3516 (2021).
Wang, Z. et al. Metastasis-associated fibroblasts: an emerging target for metastatic cancer. Biomark. Res. 9, 47 (2021).
Denton, A. E., Roberts, E. W., Linterman, M. A. & Fearon, D. T. Fibroblastic reticular cells of the lymph node are required for retention of resting but not activated CD8+ T cells. Proc. Natl Acad. Sci. USA 111, 12139-12144 (2014).
Takahashi, H. et al. Immunosuppressive activity of cancerassociated fibroblasts in head and neck squamous cell carcinoma. Cancer Immunol. Immunother. 64, 1407-1417 (2015).
Ruhland, M. K. et al. Stromal senescence establishes an immunosuppressive microenvironment that drives tumorigenesis. Nat. Commun. 7, 11762 (2016).
Yang, X. et al. FAP promotes immunosuppression by cancerassociated fibroblasts in the tumor microenvironment via STAT3CCL2 signaling. Cancer Res. 76, 4124-4135 (2016).
Zhang, Y. & Ertl, H. C. Depletion of FAP+ cells reduces immunosuppressive cells and improves metabolism and functions CD8+T cells within tumors. Oncotarget 7, 23282-23299 (2016).
Cohen, N. et al. Fibroblasts drive an immunosuppressive and growth-promoting microenvironment in breast cancer via secretion of Chitinase 3-like 1. Oncogene 36, 4457-4468 (2017).
Wu, S. Z. et al. Stromal cell diversity associated with immune evasion in human triple-negative breast cancer. EMBO J. 39, e104063 (2020).
Freeman, P. & Mielgo, A. Cancer-associated fibroblast mediated inhibition of CD8+ cytotoxic T cell accumulation in tumours: mechanisms and therapeutic opportunities. Cancers 12, 2687 (2020).
Baker, A. T., Abuwarwar, M. H., Poly, L., Wilkins, S. & Fletcher, A. L. Cancer-associated fibroblasts and T cells: from mechanisms to outcomes. J. Immunol. 206, 310-320 (2021).
Gorchs, L. & Kaipe, H. Interactions between cancer-associated fibroblasts and T cells in the pancreatic tumor microenvironment and the role of chemokines. Cancers 13, 2995 (2021).
Magagna, I. et al. CD73-mediated immunosuppression is linked to a specific fibroblast population that paves the way for new therapy in breast cancer. Cancers 13, 5878 (2021).
Feig, C. et al. Targeting CXCL12 from FAP-expressing carcinomaassociated fibroblasts synergizes with anti-PD-L1 immunotherapy in pancreatic cancer. Proc. Natl Acad. Sci. USA 110, 20212-20217 (2013).
Mariathasan, S. et al. TGFbeta attenuates tumour response to PDL1 blockade by contributing to exclusion of T cells. Nature 554, 544-548 (2018).
Krishnamurty, A. T. et al. LRRC15(+) myofibroblasts dictate the stromal setpoint to suppress tumour immunity. Nature 611, 148-154 (2022).
Qi, J. et al. Single-cell and spatial analysis reveal interaction of FAP(+) fibroblasts and SPP1(+) macrophages in colorectal cancer. Nat. Commun. 13, 1742 (2022).
Grout, J. A. et al. Spatial positioning and matrix programs of cancer-associated fibroblasts promote T-cell exclusion in human lung tumors. Cancer Discov. 12, 2606-2625 (2022).
Huang, H. et al. Mesothelial cell-derived antigen-presenting cancer-associated fibroblasts induce expansion of regulatory T cells in pancreatic cancer. Cancer Cell 40, 656-673.e7 (2022).
Stahl, P. L. et al. Visualization and analysis of gene expression in tissue sections by spatial transcriptomics. Science 353, 78-82 (2016).
Jackson, H. W. et al. The single-cell pathology landscape of breast cancer. Nature 578, 615-620 (2020).
Schurch, C. M. et al. Coordinated cellular neighborhoods orchestrate antitumoral immunity at the colorectal cancer invasive front. Cell 182, 1341-1359.e19 (2020).
Andersson, A. et al. Spatial deconvolution of HER2-positive breast cancer delineates tumor-associated cell type interactions. Nat. Commun. 12, 6012 (2021).
Leader, A. M. et al. Single-cell analysis of human non-small cell lung cancer lesions refines tumor classification and patient stratification. Cancer Cell 39, 1594-1609.e12 (2021).
Phillips, D. et al. Immune cell topography predicts response to PD1 blockade in cutaneous T cell lymphoma. Nat. Commun. 12, 6726 (2021).
Fridman, W. H. et al. B cells and tertiary lymphoid structures as determinants of tumour immune contexture and clinical outcome. Nat. Rev. Clin. Oncol. 19, 441-457 (2022).
Risom, T. et al. Transition to invasive breast cancer is associated with progressive changes in the structure and composition of tumor stroma. Cell 185, 299-310.e18 (2022).
Buechler, M. B. et al. Cross-tissue organization of the fibroblast lineage. Nature 593, 575-579 (2021).
Bassez, A. et al. A single-cell map of intratumoral changes during anti-PD1 treatment of patients with breast cancer. Nat. Med. 27, 820-832 (2021).
Pal, B. et al. A single-cell RNA expression atlas of normal, preneoplastic and tumorigenic states in the human breast. EMBO J. 40, e107333 (2021).
Stuart, T. et al. Comprehensive Integration of single-cell data. Cell 177, 1888-1902.e21 (2019).
Wolf, F. A. et al. PAGA: graph abstraction reconciles clustering with trajectory inference through a topology preserving map of single cells. Genome Biol. 20, 59 (2019).
Chen, H. et al. Single-cell trajectories reconstruction, exploration and mapping of omics data with STREAM. Nat. Commun. 10, 1903 (2019).
Trapnell, C. et al. The dynamics and regulators of cell fate decisions are revealed by pseudotemporal ordering of single cells. Nat. Biotechnol. 32, 381-386 (2014).
Cao, J. et al. The single-cell transcriptional landscape of mammalian organogenesis. Nature 566, 496-502 (2019).
Bergen, V., Lange, M., Peidli, S., Wolf, F. A. & Theis, F. J. Generalizing RNA velocity to transient cell states through dynamical modeling. Nat. Biotechnol. 38, 1408-1414 (2020).
Biffi, G. & Tuveson, D. A. Diversity and biology of cancerassociated fibroblasts. Physiol. Rev. 101, 147-176 (2021).
Ohm, B., Moneke, I. & Jungraithmayr, W. Targeting cluster of differentiation 26/dipeptidyl peptidase 4 (CD26/DPP4) in organ fibrosis. Br. J. Pharmacol. 40, 661-671 (2022).
Zhang, K. W. et al. Insight into the role of DPP-4 in fibrotic wound healing. Biomed. Pharmacother. 151, 113143 (2022).
Garcia-Alonso, L., Holland, C. H., Ibrahim, M. M., Turei, D. & SaezRodriguez, J. Benchmark and integration of resources for the estimation of human transcription factor activities. Genome Res. 29, 1363-1375 (2019).
Kleshchevnikov, V. et al. Cell2location maps fine-grained cell types in spatial transcriptomics. Nat. Biotechnol. 40, 661-671 (2022).
Cable, D. M. et al. Robust decomposition of cell type mixtures in spatial transcriptomics. Nat. Biotechnol. 40, 517-526 (2022).
Dong, R. & Yuan, G. C. SpatialDWLS: accurate deconvolution of spatial transcriptomic data. Genome Biol. 22, 145 (2021).
Li, B. et al. Benchmarking spatial and single-cell transcriptomics integration methods for transcript distribution prediction and cell type deconvolution. Nat. Methods 19, 662-670 (2022).
Traag, V. A., Waltman, L. & van Eck, N. J. From Louvain to Leiden: guaranteeing well-connected communities. Sci. Rep. 9, 5233 (2019).
Polanski, K. et al. BBKNN: fast batch alignment of single cell transcriptomes. Bioinformatics 36, 964-965 (2020).
Coutant, A. et al. Spatial transcriptomics reveal pitfalls and opportunities for the detection of rare high-plasticity breast cancer subtypes. Lab. Invest. 103, 100258 (2023).
Chu, T., Wang, Z., Pe’er, D. & Danko, C. G. Cell type and gene expression deconvolution with BayesPrism enables Bayesian
integrative analysis across bulk and single-cell RNA sequencing in oncology. Nat. Cancer 3, 505-517 (2022).
Jin, S. et al. Inference and analysis of cell-cell communication using CellChat. Nat. Commun. 12, 1088 (2021).
Shao, X. et al. Knowledge-graph-based cell-cell communication inference for spatially resolved transcriptomic data with SpaTalk. Nat. Commun. 13, 4429 (2022).
Strand, S. H. et al. Molecular classification and biomarkers of clinical outcome in breast ductal carcinoma in situ: analysis of TBCRC 038 and RAHBT cohorts. Cancer Cell 40, 1521-1536.e7 (2022).
Grunwald, B. T. et al. Spatially confined sub-tumor microenvironments in pancreatic cancer. Cell 184, 5577-5592.e18 (2021).
Ligorio, M. et al. Stromal microenvironment shapes the intratumoral architecture of pancreatic cancer. Cell 178, 160-175.e27 (2019).
Danenberg, E. et al. Breast tumor microenvironment structures are associated with genomic features and clinical outcome. Nat. Genet. 54, 660-669 (2022).
Martin, K. et al. PAK proteins and YAP-1 signalling downstream of integrin beta-1 in myofibroblasts promote liver fibrosis. Nat. Commun. 7, 12502 (2016).
Bobowski-Gerard, M. et al. Functional genomics uncovers the transcription factor BNC2 as required for myofibroblastic activation in fibrosis. Nat. Commun. 13, 5324 (2022).
Puerta Cavanzo, N. et al. Verteporfin ameliorates fibrotic aspects of Dupuytren’s disease nodular fibroblasts irrespective the activation state of the cells. Sci. Rep. 12, 13940 (2022).
Houthuijzen, J. M. et al. CD26-negative and CD26-positive tissueresident fibroblasts contribute to functionally distinct CAF subpopulations in breast cancer. Nat. Commun. 14, 183 (2023).
Merrick, D. et al. Identification of a mesenchymal progenitor cell hierarchy in adipose tissue. Science 364, eaav2501 (2019).
Shen, H. et al. The Hippo pathway links adipocyte plasticity to adipose tissue fibrosis. Nat. Commun. 13, 6030 (2022).
Mhaidly, R. & Mechta-Grigoriou, F. Inflammatory fibroblasts make rectal cancer resistant to radiation therapy. Cancer Cell 40, 122-124 (2022).
Nicolas, A. M. et al. Inflammatory fibroblasts mediate resistance to neoadjuvant therapy in rectal cancer. Cancer Cell 40, 168-184.e13 (2022).
Nalio Ramos, R. et al. Tissue-resident FOLR2(+) macrophages associate with CD8(+) T cell infiltration in human breast cancer. Cell 185, 1189-1207.e25 (2022).
McNally, S. & Stein, T. Overview of mammary gland development: a comparison of mouse and human. Methods Mol. Biol. 1501, 1-17 (2017).
Toss, M. S. et al. Prognostic significance of tumor-infiltrating lymphocytes in ductal carcinoma in situ of the breast. Mod. Pathol. 31, 1226-1236 (2018).
Wolff, A. C. et al. Human epidermal growth factor receptor 2 testing in breast cancer: American Society of Clinical Oncology/ College of American Pathologists Clinical Practice Guideline Focused Update. J. Clin. Oncol. 36, 2105-2122 (2018).
Goldhirsch, A. et al. Strategies for subtypes-dealing with the diversity of breast cancer: highlights of the St. Gallen International Expert Consensus on the Primary Therapy of Early Breast Cancer 2011. Ann. Oncol. 22, 1736-1747 (2011).
Crowell, H. L. et al. muscat detects subpopulation-specific state transitions from multi-sample multi-condition single-cell transcriptomics data. Nat. Commun. 11, 6077 (2020).
Albergante, L. et al. Robust and scalable learning of complex intrinsic dataset geometry via ElPiGraph. Entropy 22, 296 (2020).
Butler, A., Hoffman, P., Smibert, P., Papalexi, E. & Satija, R. Integrating single-cell transcriptomic data across different conditions, technologies, and species. Nat. Biotechnol. 36, 411-420 (2018).
Xie, Z. et al. Gene set knowledge discovery with Enrichr. Curr. Protoc. 1, e90 (2021).
Gueguen, P. et al. Contribution of resident and circulating precursors to tumor-infiltrating CD8(+) T cell populations in lung cancer. Sci. Immunol. 6, eabd5778 (2021).
Timperi, E. et al. Lipid-associated macrophages are induced by cancer-associated fibroblasts and mediate immune suppression in breast cancer. Cancer Res. 82, 3291-3306 (2022).
Alshetaiwi, H. et al. Defining the emergence of myeloid-derived suppressor cells in breast cancer using single-cell transcriptomics. Sci. Immunol. 5, eaay6017 (2020).
Asrir, A. et al. Tumor-associated high endothelial venules mediate lymphocyte entry into tumors and predict response to PD-1 plus CTLA-4 combination immunotherapy. Cancer Cell 40, 318-334.e19 (2022).
Geldhof, V. et al. Single cell atlas identifies lipid-processing and immunomodulatory endothelial cells in healthy and malignant breast. Nat. Commun. 13, 5511 (2022).
Bankhead, P. et al. QuPath: open source software for digital pathology image analysis. Sci. Rep. 7, 16878 (2017).
Kim, D. et al. TopHat2: accurate alignment of transcriptomes in the presence of insertions, deletions and gene fusions. Genome Biol. 14, R36 (2013).
Langmead, B. & Salzberg, S. L. Fast gapped-read alignment with Bowtie 2. Nat. Methods 9, 357-359 (2012).
Acknowledgements
We are grateful to Laetitia Fuhrmann, Charlotte Martinat and Andreia Goncalves for collecting clinical data of the patients (SIRIC, INCa-DGOS4654); Laetitia Lesage and André Nicolas for their help at the experimental pathology platform and Coralie Guerin and Lea Guyonnet at the cytometry core. The ICGex NGS platform was supported by the ANR-10-EQPX-03 (Equipex) and ANR-10-INBS-09-08 (France Genomic Consortium) grants. H.C. is supported by the Foundation for Medical Research (FRM, grant number 13683), and R.M. by the Foundation de France (00119142/WB-2021-36276). G.G. and F.M.-G. are permanent scientists at Inserm. Y.K. is supported by the Institut National du Cancer and INCa (INCa-DGOS-9963; INCa-11692). The experimental work was supported by grants from the Ligue Nationale Contre le Cancer (LNCC, Labelisation), Inserm (PC201317), INCa (CaLYS INCa-11692, CAFHeros INCa-16101), ITMO Cancer of Aviesan (2021-2030 cancer control strategy framework, Pre-Caution), SIGN’it 2019 from the Foundation ARC, the European TRANSCAN-3 ERA-NET CHRYSALIS (ARCPARTNTRANS2O22080005422) and Magnolia (INCa-16786), and the ANR as part of the PIA France 2030 with the funding of the CASSIOPEIA RHU (ANR-21-RHUS-0002). F.M.-G. acknowledges the “French Pink Ribbon Association” and the “Simone and Cino del Duca Foundation” for attribution of their respective Grand Prix, as well as the FRM for the Rozen Price and the LNCC for the Duquesne Price. F.M.-G. is very grateful to all her funders for providing support throughout the years.
Author contributions
F.M.-G. conceived all the project and designed the concept of experiments. H.C. and Y.K. performed all bioinformatic and statistical analyses with the participation of A.M. R.M. performed experiments and acquired data, together with G.G. and C.R. A.V.-S. built cohorts of patients, provided human samples and expertise in pathology analyses, together with L.D. who annotated BC sections. R.L., G.G. and R.M. performed spatial transcriptomics in the experimental pathology platform headed by D.M., in AVS’s department. F.P. performed the single cell data from CAP from BC patients. E.R. provided expertise on myeloid cells. S.B. and M.B. performed new generation sequencing. A.P. is project manager and
help in getting funding. F.M.-G. supervised the entire project and wrote the paper with H.C., Y.K. and R.M., with suggestions from all authors.
Competing interests
F.M.-G. received research support from Innate-Pharma, Roche, Institut Roche and Bristol-Myers-Squibb (BMS). E.R. received grants from BMS, AstraZeneca, Janssen-Cilag and Fonds Amgen France; and travel support from BMS, Hoffmann La Roche, AstraZeneca, Merck Sharp & Dohme. Other authors declare no potential conflict of interest.
Correspondence and requests for materials should be addressed to Fatima Mechta-Grigoriou.
Peer review information Nature Communications thanks Christopher Hanley and the other, anonymous, reviewer(s) for their contribution to the peer review of this work. A peer review file is available.
Reprints and permissions information is available at http://www.nature.com/reprints
Publisher’s note Springer Nature remains neutral with regard to jurisdictional claims in published maps and institutional affiliations.
Open Access This article is licensed under a Creative Commons Attribution 4.0 International License, which permits use, sharing, adaptation, distribution and reproduction in any medium or format, as long as you give appropriate credit to the original author(s) and the source, provide a link to the Creative Commons licence, and indicate if changes were made. The images or other third party material in this article are included in the article’s Creative Commons licence, unless indicated otherwise in a credit line to the material. If material is not included in the article’s Creative Commons licence and your intended use is not permitted by statutory regulation or exceeds the permitted use, you will need to obtain permission directly from the copyright holder. To view a copy of this licence, visit http://creativecommons.org/ licenses/by/4.0/.
(c) The Author(s) 2024
Institut Curie, Stress and Cancer Laboratory, Equipe Labélisée par la Ligue Nationale Contre le Cancer, PSL Research University, 26, Rue d’Ulm, F-75248 Paris, France. Inserm, U830, 26, Rue d’Ulm, F-75005 Paris, France. Department of Diagnostic and Theragnostic Medicine, Institut Curie Hospital Group, 26, Rue d’Ulm, F-75248 Paris, France. Institut Curie, PSL Research University, ICGex Next-Generation Sequencing Platform, 75005 Paris, France. Institut Curie, PSL Research University, Single Cell Initiative, 75005 Paris, France. Department of Medical Oncology, Center for Cancer Immunotherapy, Institut Curie, 26, Rue d’Ulm, F-75248 Paris, France. These authors contributed equally: Hugo Croizer, Rana Mhaidly, Yann Kieffer. e-mail: fatima.mechta-grigoriou@curie.fr