المجلة: Communications Biology، المجلد: 8، العدد: 1
DOI: https://doi.org/10.1038/s42003-025-07495-0
PMID: https://pubmed.ncbi.nlm.nih.gov/39825091
تاريخ النشر: 2025-01-17
DOI: https://doi.org/10.1038/s42003-025-07495-0
PMID: https://pubmed.ncbi.nlm.nih.gov/39825091
تاريخ النشر: 2025-01-17
فهم ترابط البكتين في جدران خلايا النبات
إيرابونوسي أوبوميغي (1)
البكتين هو مكون رئيسي من جدران خلايا النباتات. مدى ترابط سلاسل البكتين مع بعضها البعض يحدد خصائص حاسمة بما في ذلك قوة جدار الخلية، المسامية، وقدرة الجزيئات الصغيرة ذات الأهمية البيولوجية على الوصول إلى الخلية. على الرغم من أهميته، لا تزال هناك فجوات كبيرة في فهمنا، على المستوى الجزيئي، لكيفية تأثير روابط البكتين المتقاطعة على الخصائص الميكانيكية والفيزيائية لجدران الخلايا. تستخدم هذه الدراسة نهجًا متعدد التخصصات، يجمع بين محاكاة الديناميكا الجزيئية، والتحقيقات التجريبية، والنمذجة الرياضية، لتوضيح آلية ترابط البكتين المتقاطع وتأثيره على مسامية جدار الخلية. تتحدى الجوانب الحاسوبية من هذا العمل نموذج صندوق البيض السائد، مفضلة بدلاً من ذلك نموذج السحاب لترابط البكتين المتقاطع، بينما يبرز عملنا التجريبي التأثير الكبير لترابط البكتين المتقاطع على مسامية جدار الخلية. يعزز هذا العمل فهمنا الأساسي للكيمياء الحيوية التي تدعم هيكل ووظيفة جدار الخلية النباتية. هذه المعرفة لها تداعيات مهمة على التكنولوجيا الحيوية الزراعية، حيث تخبرنا عن الخصائص الكيميائية للبكتينات النباتية التي تناسب تحسين مقاومة المحاصيل وقابليتها لاستخراج الوقود الحيوي من خلال تعديل جدار الخلية.
على عكس خلايا الحيوانات، فإن خلايا النباتات محاطة بجدار خلوي، يوفر القوة والحماية، بينما يسمح بالنمو.
الخسائر في جميع أنحاء العالم
الخسائر في جميع أنحاء العالم
تتأثر جيلاتين البكتين بتكوين الروابط المتقاطعة بين سلاسل البكتين أو سلاسل السكر الجانبية لها. تمثل بكتينات الهوموغالكتورونان (HG) الغالبية العظمى من بكتين جدار الخلية، وتتصل بشكل أساسي ببعضها البعض عبر أيونات الكالسيوم.
في هذا العمل، استخدمنا نهجًا متعدد التخصصات لتسليط الضوء على آلية الربط المتقاطع للبكتين ولإقامة صلة بين بنية البكتين ومسامية جدار الخلية.
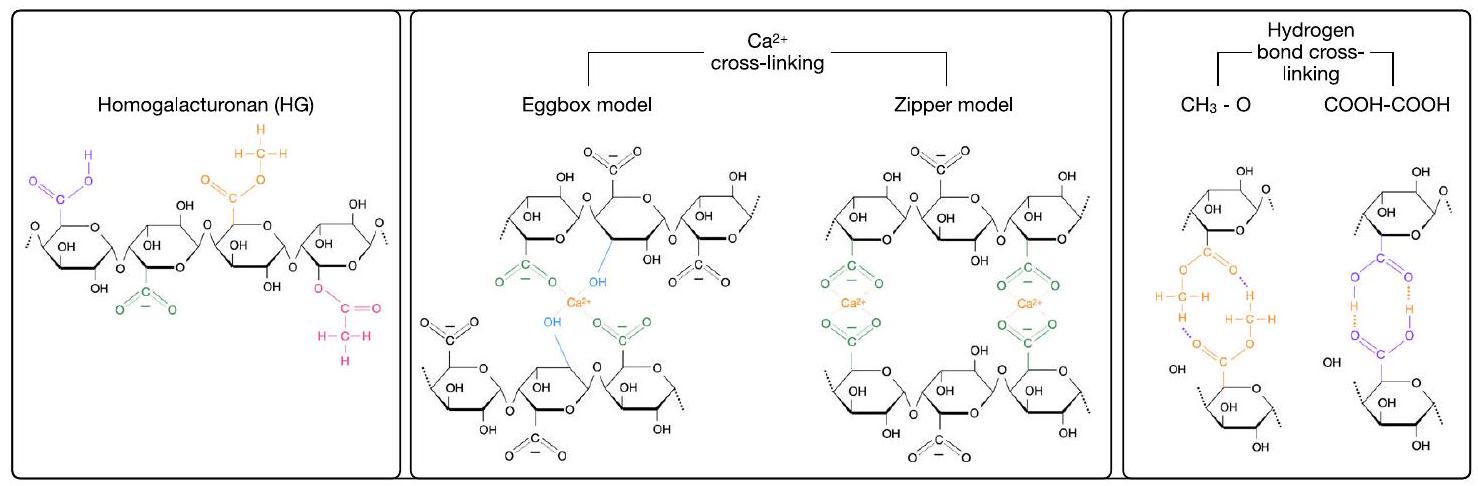
الشكل 1 | آليات الربط المتقاطع المختلفة لسلاسل الهيدروجيل. المجموعات الوظيفية المختلفة المعنية، وهي مجموعات الكربوكسيل المؤينة (-COOH)، ومجموعات الكربوكسيل غير المؤينة (-
نموذج صندوق البيض يُوجد عادةً في الأدبيات المتعلقة بربط البكتين، ويتضمن مجموعتين هيدروكسيل (-OH، أزرق فاتح) ومجموعتين –
نموذج صندوق البيض يُوجد عادةً في الأدبيات المتعلقة بربط البكتين، ويتضمن مجموعتين هيدروكسيل (-OH، أزرق فاتح) ومجموعتين –
على وجه التحديد، قمنا بالتحقيق في التفاصيل على المستوى الجزيئي لربط HG عبر المحاكاة الجزيئية، وقمنا بتحديد طاقة آليات الربط المختلفة. كما قمنا أيضًا بالتحقيق بشكل منهجي في علاقة الهيكل-الوظيفة بين تفعيل سلاسل HG وحركية تجميعها. تشير نتائجنا إلى أن نموذج “صندوق البيض” العريق قد لا يكون كافيًا لوصف
النتائج
المحاكاة الجزيئية
نموذج صندوق البيض لربط HG غير مدعوم. حيث أن أكثر المجالات البكتينية وفرة في جدران خلايا النباتات هو
تشير الكثير من الأدبيات الموجودة إلى أن هذه الجسور الكالسيومية تتضمن أيضًا مجموعتين هيدروكسيل (-OH). هذه الإمكانية، الموضحة في الشكل 1، تؤدي إلى ظهور ما يسمى بنموذج “صندوق البيض” لربط البكتين.
تم استخدام تشتت الأشعة السينية بزاوية صغيرة (SAXS) سابقًا للتحقيق في التفاصيل الهيكلية لـ
العمل على الأرابيدوبسيس
العمل على الأرابيدوبسيس
في الواقع، قد أثارت الأعمال الأخيرة تساؤلات حول صحة هذا النموذج لصالح نموذج “السحاب”.
في الحالات التي يمكن أن توجد فيها مجموعة الكربوكسيل من GalA في شكلها المؤين، من المعقول توقع بعض درجة من الروابط الهيدروجينية بين مجموعتين -COOH تنتميان إلى سلسلتين مختلفتين، دون الحاجة إلى تضمين
وبالتالي، يتم تحديد المسامية الناتجة عن شبكة البكتين داخل جدار الخلية من خلال تنافس آليات الربط المتقاطع المختلفة لـ HG. من أجل تقييم استقرار هذه الخيارات المختلفة للربط المتقاطع لسلاسل HG، قمنا بإجراء محاكاة ميتا ديناميكية. يتم مناقشة التفاصيل بشكل موسع في قسم “الطرق”: باختصار، الميتا ديناميكا هي تقنية حسابية لتحسين العينة تستفيد من محاكاة الديناميكا الجزيئية (MD) لإعادة بناء ملفات الطاقة الحرة بالنسبة لواحد أو أكثر من “المتغيرات الجماعية” – في هذه الحالة، درجات الحرية المحددة التي تصف عملية الربط المتقاطع. للبدء، قمنا بحساب عدد التنسيق الجاري من خلال محاكاة غير متحيزة (أي، دون تطبيق طريقة الميتا ديناميكا حتى لا نتلاعب بالتطور الزمني الطبيعي للنظام) لـ
من خلال محاكاة الميتا ديناميكا، قمنا بدراسة مكاسب الطاقة الحرة المرتبطة بتكوين
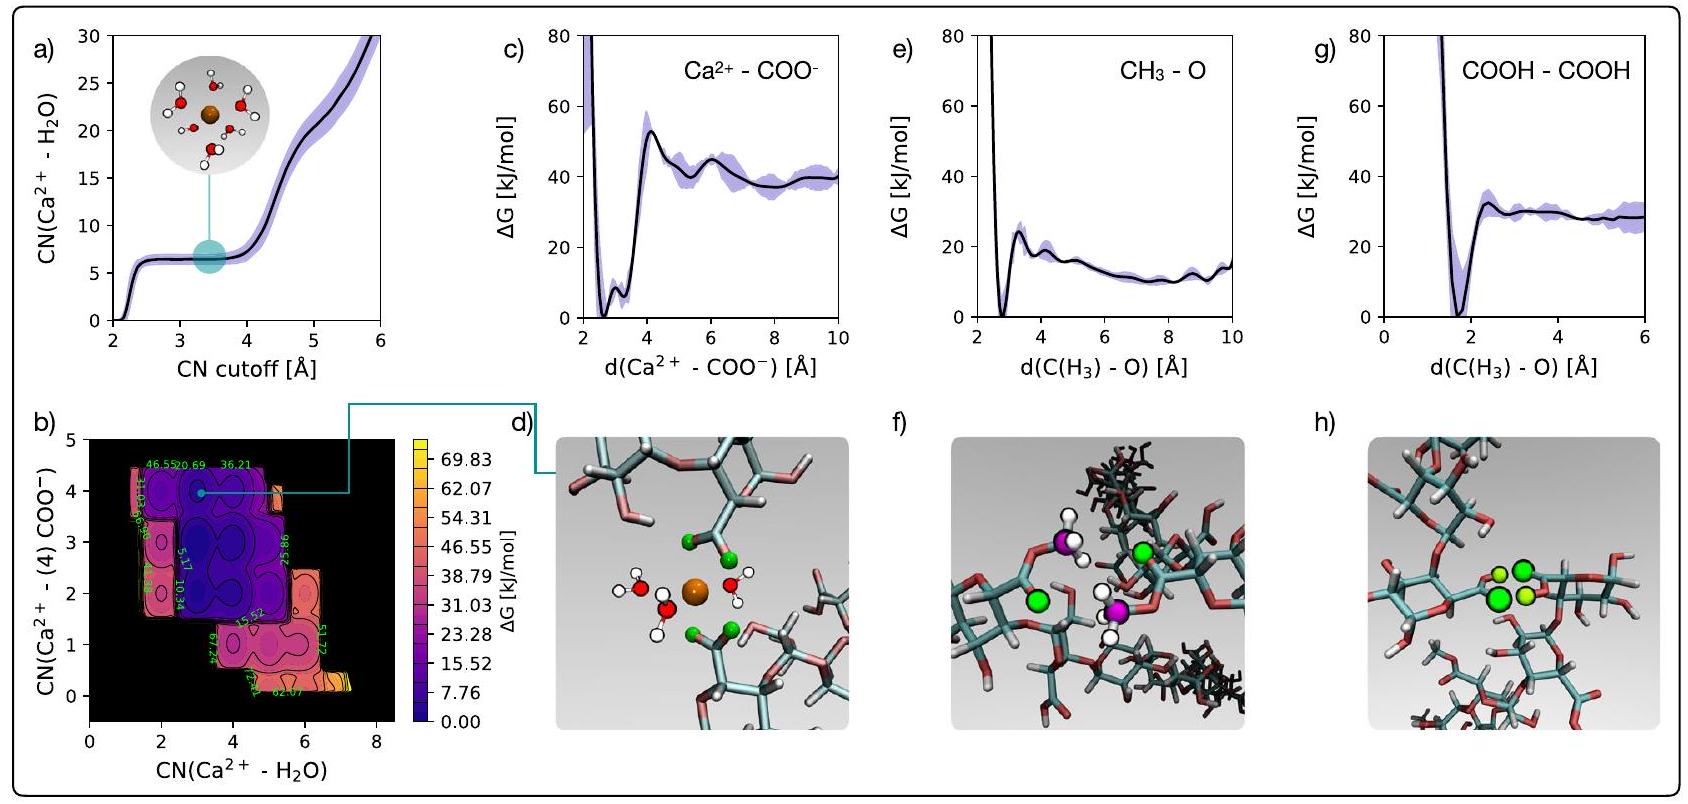
الشكل 2 | محاكاة الميتا ديناميكا لربط HG. أ متوسط عدد التنسيق المتحرك لـ
الذرات التي تنتمي إلى الاثنين
مجموعات الكربونيل، في حين أن عدد التنسيق لـ
مجموعات الكربونيل، في حين أن عدد التنسيق لـ
على النقيض من ذلك، يبدو أن الربط المتقاطع لـ HG عبر الروابط الهيدروجينية يستفيد من تفاعلات أضعف بكثير. يتم قياس ذلك من خلال ملفات الطاقة الحرة التي حصلنا عليها بالنسبة للربط المتقاطع عبر الروابط الهيدروجينية بين إما جالورونيك أسيد الميثيل إستر و -COOH، كما هو موضح في الشكل 2e و g، على التوالي. الروابط الهيدروجينية بين مجموعات -COOH أقوى بكثير من تلك الموجودة في مجموعات الكربوكسيل الميثيلية:
لذا، في ضوء هذه النتائج، نرى أن الآلية الرئيسية للتشابك المتقاطع للبيكتين منخفض الميثوكسي في الظروف الفسيولوجية للنباتات يجب أن تعتمد على –
لكن من المؤكد أنها ستؤدي إلى بكتين مرتبط بشكل أقل قوة مقارنة بـ
لكن من المؤكد أنها ستؤدي إلى بكتين مرتبط بشكل أقل قوة مقارنة بـ
أثر تفعيل HG على إمكانيته في الربط المتقاطع. للحصول على مزيد من الفهم حول حركيات الربط المتقاطع لـ HG، قمنا أيضًا بإجراء محاكاة غير متحيزة لتجمع سلاسل HG في الماء. على وجه الخصوص، اعتبرنا سلاسل HG تحتوي على 8 أو 40 وحدة GalA، واستكشفنا بشكل منهجي تأثير تفعيل وحدات GalA على الربط المتقاطع لـ HG. احتوت صناديق المحاكاة لدينا على ثماني سلاسل (إما بطول 8 أو 40 وحدة) تتميز بمجموعات -COOH البروتونية المختلفة.
نجد أن سلاسل HG التي تحتوي على D فقط تظهر أكبر مدى من الترابط المتقاطع، بينما سلاسل P التي تحتوي على P فقط ترتبط بشكل أقل فعالية، وسلاسل M التي تحتوي على M فقط ترتبط بشكل أقل من ذلك. هذه الاتجاه ليس فقط واضحًا من حيث العدد المتوسط للروابط المتقاطعة، ولكن عمر الروابط أطول بكثير لـ
الجدول 1 | الربط المتقاطع لـ HG كدالة للتوظيف
| نظام |
|
|
|
|
|
|
|
| بي بي بي بي بي بي بي بي | – | – | 9.91(32) | – | – | 1.43 | 6.03 |
| دي دي دي دي دي دي دي دي | 16.89 (32) | – | – | 8.02 | – | – | ٨ |
| MMMMMMMM | – | 6.06 (32) | – | – | 1.65 | – | 3.94 |
| دي دي بي دي بي | 9.44 (16) | – | 4.23 (16) | 7.37 | – | 1.52 | 7.74 |
| دي دي إم دي إم دي | 8.66 (16) | 1.71 (16) | – | 7.88 | 1.53 | – | 7.35 |
| دي بي دي بي دي بي | 8.51 (16) | – | 6.59 (16) | ٨.٦ | – | 1.62 | ٧.٥١ |
| DMDMDMDM | 9.09 (16) | 2.21 (16) | – | 5.53 | 1.97 | – | 6.98 |
| دي دي بي بي دي دي بي بي | 8.79 (16) | – | 4.72 (16) | 8.79 | – | 1.58 | 7.72 |
| دي دي إم إم دي دي إم إم | 8.46 (16) | 3.52 (16) | – | 8.43 | 1.57 | – | ٧.٥٤ |
| بي بي دي دي دي دي بي بي | 7.15 (16) | – | 3.56 (16) | ٥.٠٥ | – | 1.25 | ٥.٩٩ |
| MMDDDDMM | 8.16 (16) | 1.71 (16) | – | 7.11 | 1.33 | – | ٤.٨١ |
| دي دي بي بي بي بي دي دي | 10.59 (16) | – | 3.88 (16) | 7.96 | – | 1.68 | 7.53 |
| DDMMMMDD | 9.49 (16) | 2.98 (16) | – | 6.35 | 2.09 | – | 7.92 |
| DPPDDPPD | 9.77 (16) | – | 4.09 (16) | 6.69 | – | 2.11 | 7.78 |
| DMMDDMMD | 9.77 (16) | 1.75 (16) | – | 8.62 | 1.37 | – | 7.38 |
| PDDPPDDP | 8.46 (16) | – | 4.25 (16) | 6.2 | – | 1.41 | 7.56 |
| MDDMMDDM | 7.95 (16) | 5.56 (16) | – | 8.96 | 1.89 | – | 7.63 |
| دي دي دي دي بي بي بي بي | 6.52 (16) | – | 3.41 (16) | 3.62 | – | 1.51 | ٤.٨٦ |
| دي دي دي دي إم إم إم إم | 7.80 (16) | 2.40 (16) | – | 5.41 | 1.66 | – | 3.85 |
| dddd | 58.05 (160) | – | – | 10.99 | – | – | ٧.٩٥ |
| مممم | – | 1.81 (160) | – | – | 1.24 | – | 2.07 |
| dddp | ٣٢.٥١ (١٢٠) | – | 2.79 (40) | 10.68 | – | 1.49 | ٤.٥٢ |
| dddm | ٣٧.٩٥ (١٢٠) | 0.17 (40) | – | ١٦.٦٧ | 1.11 | – | ٥.٦١ |
| ddpd | ٣٦.١٢ (١٢٠) | – | 0.37 (40) | 12.41 | – | 1.04 | 6.07 |
| ddmd | ٢٩.١٤ (١٢٠) | 0.98 (40) | – | 10.67 | 1.66 | – | 6.54 |
| دي دي بي بي | ٣٢.٠٧ (٨٠) | – | 8.15 (80) | 11.93 | – | 1.94 | 5.14 |
| يوم شهر | ٢٤.٨٠ (٨٠) | 0.50 (80) | – | 14.49 | 1.24 | – | ٤.٣٧ |
| دي بي بي دي | ٢٩.٤٤ (٨٠) | – | 6.27 (80) | 15.91 | – | 1.59 | 3.26 |
| دي إم دي | ٢٨.٨٥ (٨٠) | 2.23 (80) | – | 11.00 | 1.90 | – | 3.44 |
| pddp | ٢١.٢٤ (٨٠) | – | 8.44 (80) | 11.06 | – | 1.69 | 3.17 |
| ميديم | 16.83 (80) | 0.92 (80) | – | 9.80 | 1.63 | – | 2.63 |
| دي بي دي بي | ٢٦.٦٨ (٨٠) | – | 10.37 (80) | 11.43 | – | 1.87 | 6.22 |
| دمدم | 31.44 (80) | 3.88 (80) | – | 14.63 | 1.61 | – | ٥.٣٩ |
| دي بي بي بي | 15.29 (40) | – | 14.96 (120) | 10.28 | – | 1.82 | ٣.٤٥ |
| ديمم | 13.12 (40) | 1.73 (120) | – | ٢٠.١٠ | 1.66 | – | 2.44 |
| pdpp | 12.24 (40) | – | 7.92 (120) | 14.53 | – | 1.45 | 1.93 |
| مدم | 14.46 (40) | 2.04 (120) | – | 18.8 | 1.36 | – | 2.00 |
احتوت صناديق المحاكاة لدينا على ثمانية سلاسل (إما بطول 8 وحدات أو 40 وحدة) تتميز بتوليفات مختلفة من مجموعات -COOH المؤينة (P أو p للسلاسل الطويلة 8 و40 وحدة على التوالي)، ومجموعات -COO- غير المؤينة (Dord للسلاسل الطويلة 8 و40 وحدة على التوالي) ومجموعات الكربوكسيل الميثيلية (
تمت مناقشة محاكاة الميتا ديناميكا أعلاه (وتم تلخيصها في الشكل 2). من حيث السلاسل المميزة بمزيج من وحدات D و M أو D و P، يبدو أن الكتل المكونة من 4 وحدات من وحدات مختلفة (مثل DDDDMMMM أو DDDDPPPP) تتشابك إلى حد أقل بكثير مقارنة بالسلاسل ذات التركيب نفسه حيث تكون الوحدات متناوبة على طول السلاسل (مثل DMDMDMDM أو DPDPDPDP). قد تشير هذه الاتجاهات إلى أن وحدات D المتناوبة قد تعزز من الروابط الهيدروجينية بين وحدات M أو P أيضًا. ومع ذلك، يبدو أن السلاسل المنتهية بوحدات D (أي DDPPPPDD أو DDMMMMDD) تتشابك إلى حد أكبر حتى من السلاسل المتناوبة بين D وأي من وحدات M أو P.
تمت مناقشة محاكاة الميتا ديناميكا أعلاه (وتم تلخيصها في الشكل 2). من حيث السلاسل المميزة بمزيج من وحدات D و M أو D و P، يبدو أن الكتل المكونة من 4 وحدات من وحدات مختلفة (مثل DDDDMMMM أو DDDDPPPP) تتشابك إلى حد أقل بكثير مقارنة بالسلاسل ذات التركيب نفسه حيث تكون الوحدات متناوبة على طول السلاسل (مثل DMDMDMDM أو DPDPDPDP). قد تشير هذه الاتجاهات إلى أن وحدات D المتناوبة قد تعزز من الروابط الهيدروجينية بين وحدات M أو P أيضًا. ومع ذلك، يبدو أن السلاسل المنتهية بوحدات D (أي DDPPPPDD أو DDMMMMDD) تتشابك إلى حد أكبر حتى من السلاسل المتناوبة بين D وأي من وحدات M أو P.
تتسق هذه النتائج عبر سلاسل من 8 وحدات و 40 وحدة: ومن المثير للاهتمام، أن عمر الـ
شكل.
جسور عبر سلاسل متعددة، دون الحاجة إلى إشراك أي مجموعة – OH في العملية (كما تم الترويج له بواسطة آلية “صندوق البيض”).
بشكل عام، تشير محاكياتنا إلى أن سلاسل الهيدروجيل تتشابك مع بعضها البعض وفقًا لآلية “السحاب” التي لا تُدخل التواءً كبيرًا داخل سلسلة الهيدروجيل. بالمقابل، نلاحظ أنه لكي تشارك مجموعات -OH في الجسور الكالسيومية وفقًا لنموذج “صندوق البيض”، يجب أن تتشوه سلاسل الهيدروجيل إلى حد كبير. هذه الاعتبارات، بينما توضح التفاصيل على المستوى الجزيئي لتشابك سلاسل الهيدروجيل، تشير أيضًا إلى أن دور الرقم الهيدروجيني بالإضافة إلى محتوى الكالسيوم داخل جدار الخلية قد يكون مفتاحًا لتحديد درجة التشابك الكلي في البكتين.
لفهم تأثير الربط المتقاطع لـ HG بشكل أفضل على مسامية جدار الخلية، نتوجه إلى القياسات التجريبية التي ستناقش في القسم التالي. نلاحظ في هذه المرحلة أن عددًا كبيرًا من الجينات تتحكم في ميثيليشن البكتين (وبالتالي، لديها القدرة على التأثير على الربط المتقاطع للبكتين) وأن التكرار في وظيفتها يعني أن الطفرات الجينية تتأثر بشكل كبير بفقدان وظيفة أي جين PME واحد.
لتجاوز هذه المشكلة مع إجراء تغييرات ملحوظة على ترابط البكتين، استخدمنا طفرات جينية مدروسة جيدًا من أرابيدوبسيس ثاليانا التي تظهر اختلافات نوعية في مجال RGII البكتيني ولكنها تظهر كميات غير متغيرة من البكتين ولا تعاني من أي عيب في التصاق الخلايا.
التحديد التجريبي لتمسّك جدار الخلية في طافرة ربط البكتين في جدار الخلية في الأرابيدوبسيس
مؤخراً، ليو وآخرون.
كان قياس الفلورية على مدى سلسلة من النقاط الزمنية، بدلاً من قياس نقطة نهاية واحدة، مركزياً في تعديلنا للتقنية، لكشف ديناميات العملية. على وجه التحديد، قمنا بوسم الغشاء البلازمي لقشور أوراق البشرة بصبغة فلورية FM4-64 وأدخلنا جزيء كواتش، وهو الأزرق الترباني. ثم قمنا بمراقبة انخفاض الفلورية الملحوظة للعينات على مدى فترة 15 دقيقة. كما يتضح من الصور في الشكل 4a، كانت مستويات الفلورية متشابهة بين النمطين الجينيين قبل تطبيق الكواتش، لكنها انخفضت بشكل أسرع في الطفرة sfr 8 مقارنة بالنمط البري. لاحظ أن هذه الفروق كانت ذات دلالة إحصائية في لحظة التطبيق (الوقت
أين
النمذجة الرياضية لقياسات المسامية
للحصول على مزيد من الفهم للجوانب الميكانيكية التي تدعم النتائج التجريبية المبلغ عنها في القسم السابق، قمنا بإنشاء نموذج رياضي بسيط، استنادًا إلى اعتبارات ديناميكا السوائل. المتغيرات والمعلمات المستخدمة في هذا القسم ملخصة في الجدول 2.
كما هو موضح في الشكل 5a، نعتبر جدار خلية بمساحة
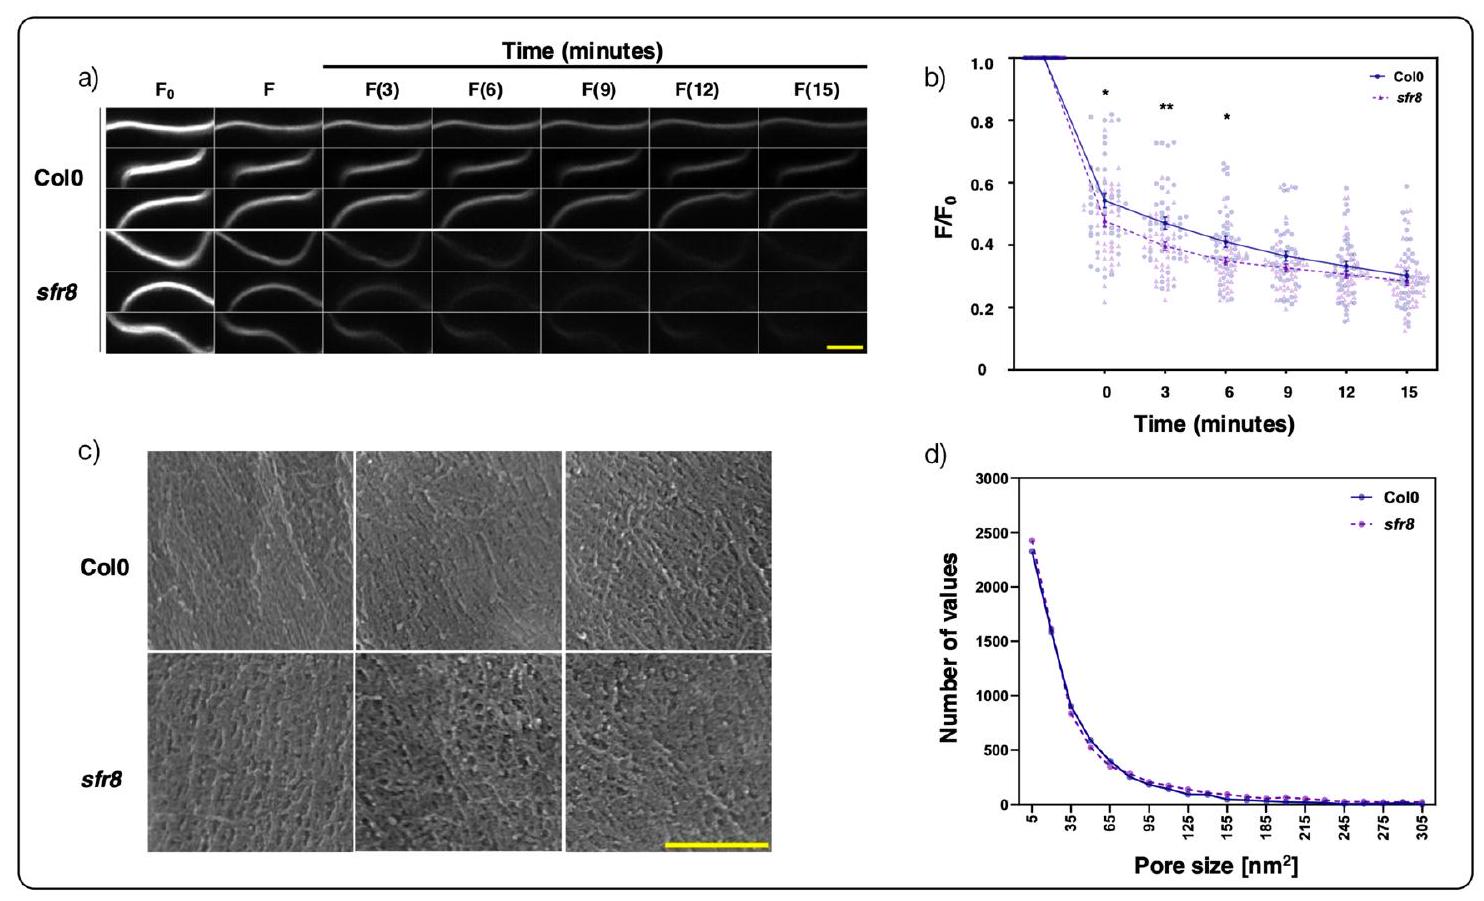
الشكل 4 | القياسات التجريبية لتمسّك جدار الخلية في أوراق النوع البري Col0 و sfr8 من الأرابيدوبسيس. أ تغيير في الفلورية لغشاء البلازما الملون بـ FM4-64 (انظر النص) لعينات جدار الخلية من Col0 و sfr8. تم عرض سلسلة زمنية من ثلاث صور فلورية تمثيلية لكل نقطة زمنية لكل جينotype. تم التقاط صور المجهر الضوئي قبل التوقف عن التفاعل.
المقارنات الإحصائية، تحليل التباين الثنائي مع اختبار المقارنات المتعددة لبونفيروني
التدرج عبره هو:
التدرج عبره هو:
يُفترض أن جدار الخلية هو وسط مسامي، يتميز بالمسامية
نفترض أيضًا أن المثبط يتبع الانتشار فيكي:
أين
من خلال دمج هذه المعادلات، نحصل على المعادلة التفاضلية العادية:
مع الحل
لديه مقياس زمني مميز
بعد أن وجدنا تركيز المثبط في الغشاء، يجب علينا الآن ربط ذلك بالفلوريسcence كما تم قياسه في التجارب. الفلوريسcence
الجدول 2|المتغيرات والمعلمات المستخدمة في النمذجة الرياضية لقياسات المسامية
| اسم | رمز | وحدات | قيمة مرجعية |
| الوقت |
|
س | |
| تركيز المثبط في الغشاء |
|
|
|
| تدفق الانتشار |
|
|
|
| شدة الفلورية |
|
– | |
| المسامية |
|
– | |
| التعقيد |
|
– |
|
| معامل معدل التبريد في الغشاء |
|
|
؟ |
| مقياس زمن التحلل |
|
س | ؟ |
| ثابت المنعش |
|
|
|
| معامل انتشار المثبط في الحمام | D |
|
|
| معامل انتشار المثبط في المسام |
|
|
|
| سمك الجدار |
|
م |
|
| سمك الغشاء |
|
م |
|
| تركيز المثبط في الحمام |
|
|
|
| منطقة العينة |
|
|
معروف |
معادلة ستيرن-فولمر
الذي مع (6) يعيد ترتيب إلى:
هذه هي الدالة المستخدمة لتناسب البيانات التجريبية المبلغ عنها في الشكل 5. نحن نناسب
في حالتنا، من هذا التناسب حصلنا على قيم لـ
لربط الالتواء بالمسامية، نستخدم تعبير بروغمان البسيط
حتى:
من الملاءمة المبلغ عنها في الشكل 5 نحصل على:
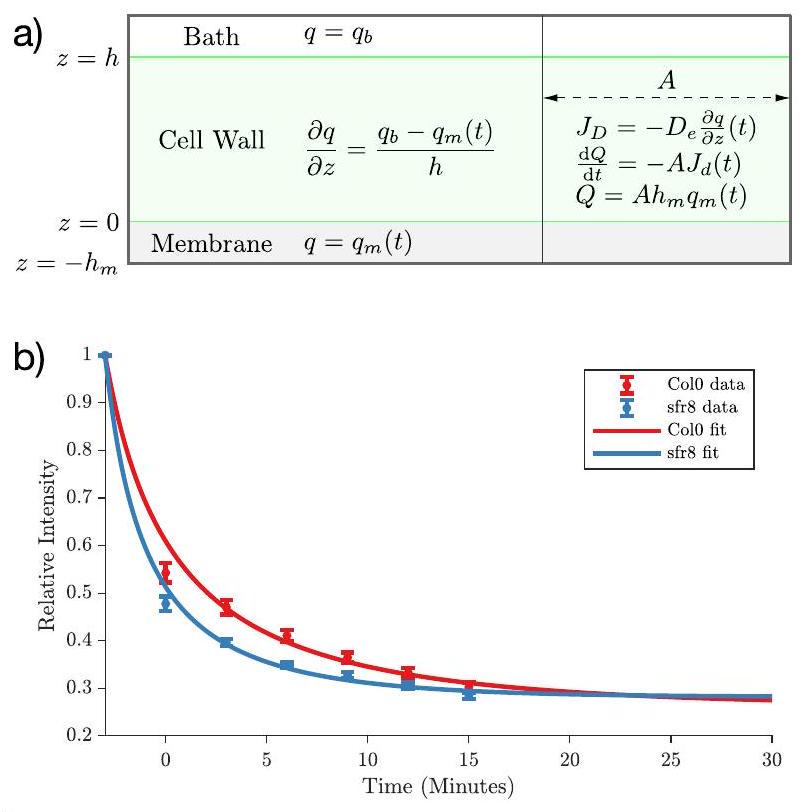
الشكل 5 | النمذجة الرياضية لقياسات المسامية. أ مخططات النموذج. المتغيرات والمعلمات ذات الصلة مذكورة في الجدول 2. ب ملاءمة البيانات التجريبية (انظر الشكل 4).
تشير هذه النتيجة إلى أن جدار الخلية للطافرة sfr 8 هو
ومع ذلك، على الرغم من بساطة نموذجنا، تشير نتائجنا إلى أن: (1) يمكن تفسير النتائج التجريبية دون الحاجة إلى إدخال أي آلية “حجب” تجعل المثبط عالقًا أو تسد مسام جدار الخلية.
نقاش
جدار الخلية النباتية هو هيكل معقد للغاية تحكمه العديد من التفاعلات بين البوليمرات الكربوهيدراتية والبروتينات الهيكلية بما في ذلك الإكستنسينات.
لفهم أفضل لما يشكل المسامية في جدران خلايا النبات، بدأنا مع وحدات بناء البكتين وفحصنا التفاعلات الجزيئية المحتملة بين سلاسل البكتين القادرة على ربط البكتين وجعله أقل مسامية. أضافت محاكاة الديناميكا الجزيئية لدينا أدلة إلى قضية ناشئة تدعم نموذج السحاب بدلاً من نموذج صندوق البيض الشائع المفضل لدى العديد من علماء الأحياء النباتية. ومن المثير للاهتمام أن محاكاة الديناميكا الجزيئية لدينا سلطت الضوء أيضًا على أهمية الرقم الهيدروجيني على الجدار و
الربط المتقاطع. هذه البيانات تتماشى مع الملاحظات التجريبية في المختبر التي تشير إلى أن تماسك الجيلاتين من البكتين وصلابته تعتمد على كليهما
الربط المتقاطع. هذه البيانات تتماشى مع الملاحظات التجريبية في المختبر التي تشير إلى أن تماسك الجيلاتين من البكتين وصلابته تعتمد على كليهما
بعد التحقيق في الأساس الجزيئي لطرق تجميع سلاسل البكتين وتفاعلها مع بعضها البعض، جمعنا بيانات تجريبية من نظام بيولوجي يتم فيه تغيير الربط المتقاطع للبكتين. استخدمنا قياسات تلاشي الفلورسنت المعتمدة على الزمن لتقييم كيفية تأثير الربط المتقاطع المعدل على مسامية جدار الخلية. أكدنا صحة هذه القياسات من خلال الملاحظات المباشرة عبر المجهر الإلكتروني الماسح، ونمذجة بيانات تلاشي الفلورسنت أيضًا. في حين أن الطفرات في نبات الأرابيدوبسيس في ميثيل ترانسفيراز البكتين HG متاحة ومن المتوقع أن تظهر ربطًا متقاطعًا معدلاً، إلا أنها تعاني من العديد من العيوب بما في ذلك النمو المتعثر وفقدان التصاق الخلايا.
للتحقيق في هذه الفرضية، استخدمنا نسخة معدلة من طريقة ت quenching الفلورية التي طورها ليو وآخرون.
من أجل تنظيم قياسات الفلورية التجريبية، وخاصة لتوضيح العمليات الفيزيائية التي تدعم النتائج، قمنا ببناء نموذج رياضي بسيط يستفيد من مفاهيم ديناميكا السوائل. تشير نتائجنا إلى أن تدفق جزيئات المثبط عبر جدار الخلية لا يسد المسام داخل شبكة البكتين؛ على الرغم من أنه في المستقبل، قد تتضمن التعديلات على هذا النموذج آلية “حجب”.
نقدم أيضًا مبررًا للاختيار التجريبي حتى الآن لقياس تدهور الفلورسنت في العينة في أقرب وقت ممكن بعد إدخال المثبط. وذلك لأن الفترات الزمنية المبكرة تعظم الفرق من حيث كفاءة التثبيط. أخيرًا، نوضح أن الاستجابات المختلفة من حيث الفلورسنت التي تثيرها عينات مختلفة يمكن تفسيرها من حيث مسامية العينات فقط.
تتيح القدرة على التنبؤ بالتفاعلات بين سلاسل البكتين في سياقات مختلفة وتوقع التغيرات في المسامية العديد من التطبيقات في تكنولوجيا الزراعة. تحدد بنية البكتين مستوى النجاح الذي قد تحققه الهجمات من الفطريات والجراثيم.
يجعل الجدار أكثر مسامية ويسهل الوصول إلى مغذيات الخلية
يجعل الجدار أكثر مسامية ويسهل الوصول إلى مغذيات الخلية
باختصار، سلطت هذه الدراسة الضوء على الديناميات المعقدة لربط البكتين وآثاره الناتجة على مسامية جدران خلايا النبات، مقدمة رؤى هامة عبر عدة مجالات. من خلال توضيح التفاعلات الجزيئية داخل سلاسل البكتين وتأثيرها على هيكل جدار الخلية، قمنا بتعزيز فهمنا لبيولوجيا النبات، لا سيما فيما يتعلق بنمو النبات، ومقاومة الأمراض، واستجابات الإجهاد. تسلط نتائجنا الضوء على الإمكانية المتاحة لتعديل هيكل البكتين لتعزيز مرونة المحاصيل ضد مسببات الأمراض والإجهاد غير الحيوي أو تحسين إمكانيات التحلل السكري، مما يشير إلى استراتيجيات جديدة لحماية المحاصيل وتحسينها. لا تعمق هذه الأبحاث متعددة التخصصات فهمنا الأساسي لكيمياء جدران خلايا النبات فحسب، بل تفتح أيضًا آفاقًا جديدة للابتكار الزراعي والاستدامة.
طرق
نمو النباتات
تم زراعة نباتات الأرابيدوبسيس تحت 12 ساعة من الضوء: 12 ساعة من الظلام في
قياسات المسامية
تم قياس الفلورية. تم تقييم مسامية جدار الخلية في قشور البشرة الورقية من خلال اختبار ت quenching الفلورية، وفقًا للطريقة التي وصفها ليو وآخرون في الأصل.
المجهر الإلكتروني. تم الحصول على المواد الكيميائية من سيغما، بول، المملكة المتحدة أو فيشر ساينتيفيك (ما لم يُذكر خلاف ذلك). تم وضع ورقة واحدة من نبات الأرابيدوبسيس عمره 5 أسابيع في محلول PEM.
تم نقله إلى مخزن PEM مع
تم نقله إلى مخزن PEM مع
محاكاة الديناميكا الجزيئية
تم إجراء محاكاة الديناميكا الجزيئية باستخدام GROMACS 5.1.3
تم إجراء محاكاة على مجموعة من الأنظمة ذات تركيبات سلاسل HG مختلفة (انظر الجدول 1). كل نظام يتكون من ثماني سلاسل متطابقة تحتوي على ثمانية بقايا لكل منها، والتي كانت إما مؤينة (P) أو غير مؤينة (D) أو ميثيل استرية (M). تحمل البقايا غير المؤينة شحنة سالبة (
للبحث بالتفصيل في طاقة التفاعلات المختلفة الموضحة في الشكل 1، لجأنا إلى الميتاديناميكا المدروسة.
محاكاة
محاكاة
تم تعيين معدل ترسيب الانحياز إلى 500 خطوة MD (ما يعادل 1 بيكوثانية) حيث أن زمن الاسترخاء الهيكلي لماء TIP4P عند درجة حرارة الغرفة والضغط هو من حيث
بينما لا يحمل مفهوم الزمن في محاكاة الميتا ديناميكا معنى فيزيائي مباشر (حيث أن تطور الزمن للنظام يتأثر بشدة بالتحيز الاصطناعي المقدم لأغراض استكشاف سطح الطاقة الحرة المعني)، كانت هذه الأوقات الطويلة للمحاكاة ضرورية لضمان التقارب الصحيح لسطح الطاقة الحرة الناتج. لتحقيق ذلك، قمنا بـ: (i.) مراقبة التغيرات في سطح الطاقة الحرة كدالة لزمن المحاكاة؛ (ii.) استكشاف تأثير تغيير ارتفاع وعرض جهد التحيز؛ (iii.) استخدام تقنية إعادة الوزن لتيواري وبارينيلو.
الإحصائيات وإمكانية التكرار. لقد قمنا بتضمين مناقشة حول إمكانية تكرار نتائجنا فيما يتعلق بكل جانب من جوانب منهجيتنا (انظر قسم الطرق). ربما يكون الجانب الأكثر حساسية في عملنا يتعلق بإمكانية تكرار نتائجنا من حيث محاكاة الديناميات الجزيئية لتجمعات HG (انظر الجدول 1). لهذا الغرض، قمنا بتضمين دليل مباشر على قوة هذه النتائج في المعلومات التكميلية. فيما يتعلق بقياسات الفلورية المبلغ عنها في الشكل 4ب، تم تقييم ثلاث مناطق منفصلة من الاهتمام (ROI) لكل قشرة جلدية (بمجموع 39 و42 ROI لـ Col 0 و sfr8، على التوالي). تم دمج البيانات من ثلاث تجارب منفصلة. للمقارنات الإحصائية، تم استخدام تحليل التباين ثنائي الاتجاه مع اختبار المقارنات المتعددة لبونفيروني.
في المحاكاة المبلغ عنها في الشكل 2، استخدمنا تقنية إعادة الوزن التي اقترحها تيوري وبارينيلو
في المحاكاة المبلغ عنها في الشكل 2، استخدمنا تقنية إعادة الوزن التي اقترحها تيوري وبارينيلو
ملخص التقرير
معلومات إضافية حول تصميم البحث متاحة في ملخص تقارير مجموعة ناتشر المرتبط بهذه المقالة.
توفر البيانات
جميع البيانات المرتبطة بهذه الدراسة متاحة من خلال مستودع GitHub عام الوصول (PEC_LINK،https://github.com/gcsosso/PEC_LINK. git). لقد ربطنا أيضًا إصدارًا من هذا المستودع بمستودع Zenodo (المتاح للجمهور أيضًا)، والذي حصلنا من خلاله على DOI دائم.
توفر الشيفرة
يمكن العثور على تفاصيل الأكواد المستخدمة في هذا العمل في قسم الطرق. لم يتم استخدام أي كود داخلي أو ملكي. فيما يتعلق بالجوانب الحاسوبية للعمل، نلاحظ أن كل من حزمتي GROMACS و PLUMED مفتوحة المصدر ومتاحة للجمهور.
تاريخ الاستلام: 8 أبريل 2024؛ تاريخ القبول: 8 يناير 2025؛
نُشر على الإنترنت: 17 يناير 2025
نُشر على الإنترنت: 17 يناير 2025
References
- Cosgrove, D. J. Growth of the plant cell wall. Nat. Rev. Mol. Cell Biol. 6, 850-861 (2005).
- Delmer, D., Dixon, R.A., Keegstra, K., Mohnen, D. The plant cell walldynamic, strong, and adaptable-is a natural shapeshifter. Plant Cell, 325. https://doi.org/10.1093/plcell/koad325 (2024).
- Caffall, K. H. & Mohnen, D. The structure, function, and biosynthesis of plant cell wall pectic polysaccharides. Carbohydr. Res. 344, 1879-1900 (2009).
- Baron-Epel, O., Gharyal, P. K. & Schindler, M. Pectins as mediators of wall porosity in soybean cells. Planta 175, 389-395 (1988).
- Fleischer, A., O’Neill, M. A. & Ehwald, R. The pore size of nongraminaceous plant cell walls is rapidly decreased by borate ester cross-linking of the pectic polysaccharide rhamnogalacturonan II1. Plant Physiol. 121, 829-838 (1999).
- Bidhendi, A. J. & Geitmann, A. Relating the mechanics of the primary plant cell wall to morphogenesis. J. Exp. Bot. 67, 449-461 (2016).
- Carpita, N., Sabularse, D., Montezinos, D. & Delmer, D. P. Determination of the pore size of cell walls of living plant cells. Science 205, 1144-1147 (1979).
- Pérez-Donoso, A. G., Sun, Q., Roper, M. C., Greve, L. C., Kirkpatrick, B. & Labavitch, J. M. Cell wall-degrading enzymes enlarge the pore size of intervessel pit membranes in healthy and Xylella fastidiosainfected grapevines. Plant Physiol. 152, 1748-1759 (2010).
- Savary, S., Willocquet, L., Pethybridge, S. J., Esker, P., McRoberts, N. & Nelson, A. The global burden of pathogens and pests on major food crops. Nat. Ecol. Evol. 3, 430-439 (2019).
- Adani, F., Papa, G., Schievano, A., Cardinale, G., D’Imporzano, G. & Tambone, F. Nanoscale structure of the cell wall protecting cellulose from enzyme attack. Environ. Sci. Technol. 45, 1107-1113 (2011).
- Wang, Y., Xu, X., Xue, H., Zhang, D. & Li, G. Physical-chemical properties of cell wall interface significantly correlated to the complex recalcitrance of corn straw. Biotechnol. Biofuels 14, 196 (2021).
- Grant, G. T., Morris, E. R., Rees, D. A., Smith, P. J. C. & Thom, D. Biological interactions between polysaccharides and divalent cations: The egg-box model. FEBS Lett. 32, 195-198 (1973).
- Zdunek, A., Pieczywek, P. M. & Cybulska, J. The primary, secondary, and structures of higher levels of pectin polysaccharides. Compr. Rev. Food Sci. Food Saf. 20, 1101-1117 (2021).
- Assifaoui, A. et al. Structural behaviour differences in low methoxy pectin solutions in the presence of divalent cations (Ca2+ and Zn2+): a process driven by the binding mechanism of the cation with the galacturonate unit. Soft Matter 11, 551-560 (2014).
- Poset, A. M. D., Zitolo, A., Cousin, F., Assifaoui, A. & Lerbret, A. Evidence for an egg-box-like structure in iron(II)-polygalacturonate hydrogels: a combined EXAFS and molecular dynamics simulation study. Phys. Chem. Chem. Phys. 22, 2963-2977 (2020).
- Pelloux, J., Rustérucci, C. & Mellerowicz, E. J. New insights into pectin methylesterase structure and function. Trends Plant Sci. 12, 267-277 (2007).
- Harholt, J., Suttangkakul, A. & Vibe Scheller, H. Biosynthesis of pectin. Plant Physiol. 153, 384-395 (2010).
- Wormit, A. & Usadel, B. The multifaceted role of pectin methylesterase inhibitors (PMEls). Int J. Mol. Sci. 19, 2878 (2018).
- O’Neill, M. A., Ishii, T., Albersheim, P. & Darvill, A. G. RHAMNOGALACTURONAN II: structure and function of a borate cross-linked cell wall pectic polysaccharide.Annu. Rev. Plant Biol. 55, 109-139 (2004).
- Rondeau-Mouro, C., Defer, D., Leboeuf, E. & Lahaye, M. Assessment of cell wall porosity in Arabidopsis thaliana by NMR spectroscopy. Int. J. Biol. Macromol. 42, 83-92 (2008).
- Liu, X. et al. Novel tool to quantify cell wall porosity relates wall structure to cell growth and drug uptake. J. Cell Biol. 218, 1408-1421 (2019).
- Fu, J., Thomas, H. R. & Li, C. Tortuosity of porous media: Image analysis and physical simulation. Earth Sci. Rev. 212, 103439 (2021).
- Du, J., Anderson, C. T. & Xiao, C. Dynamics of pectic homogalacturonan in cellular morphogenesis and adhesion, wall integrity sensing and plant development. Nat. Plants 8, 332-340 (2022).
- Plazinski, W. Molecular basis of calcium binding by polyguluronate chains. Revising the egg-box model. J. Comput Chem. 32, 2988-2995 (2011).
- Temple, H. et al. Golgi-localized putative S-adenosyl methionine transporters required for plant cell wall polysaccharide methylation. Nat. Plants 8, 656-669 (2022).
- Draget, K. I., Stokke, B. T., Yuguchi, Y., Urakawa, H. & Kajiwara, K. Small-angle X-ray scattering and rheological characterization of alginate gels. 3. alginic acid gels. Biomacromolecules 4, 1661-1668 (2003).
- Ventura, I., Jammal, J. & Bianco-Peled, H. Insights into the nanostructure of low-methoxyl pectin-calcium gels. Carbohydr. Polym. 97, 650-658 (2013).
- Shi, D.-C. et al. Boron-bridged RG-II and calcium are required to maintain the pectin network of the Arabidopsis seed mucilage ultrastructure. Plant Mol. Biol. 94, 267-280 (2017).
- Braccini, I. & Pérez, S. Molecular basis of Ca2+-induced gelation in alginates and pectins: the egg-box model revisited. Biomacromolecules 2, 1089-1096 (2001).
- Gilsenan, P. M., Richardson, R. K. & Morris, E. R. Thermally reversible acid-induced gelation of low-methoxy pectin. Carbohydr. Polym. 41, 339-349 (2000).
- Yoo, J., Wilson, J. & Aksimentiev, A. Improved model of hydrated calcium ion for molecular dynamics simulations using classical biomolecular force fields. Biopolymers 105, 752-763 (2016).
- Panter, P. E. et al. Cell wall fucosylation in Arabidopsis influences control of leaf water loss and alters stomatal development and mechanical properties. J. Exp. Bot. 74, 2680 (2023).
- Ishii, T. & Matsunaga, T. Pectic polysaccharide rhamnogalacturonan II is covalently linked to homogalacturonan. Phytochemistry 57, 969-974 (2001).
- Panter, P. E. et al. MUR1-mediated cell-wall fucosylation is required for freezing tolerance in Arabidopsis thaliana. N. Phytol. 224, 1518-1531 (2019).
- Bruna, M. & Chapman, S. J. Diffusion of finite-size particles in confined geometries. Bull. Math. Biol. 76, 947-982 (2014).
- Tartakovsky, D. M. & Dentz, M. Diffusion in porous media: phenomena and mechanisms. Transp. Porous Media 130, 105-127 (2019).
- Lakowicz, J.R. (ed). Principles of Fluorescence Spectroscopy. https:// doi.org/10.1007/978-0-387-46312-4 (Springer, 2006).
- Tjaden, B., Cooper, S. J., Brett, D. J., Kramer, D. & Shearing, P. R. On the origin and application of the Bruggeman correlation for analysing transport phenomena in electrochemical systems. Curr. Opin. Chem. Eng. 12, 44-51 (2016).
- Herterich, J. G., Griffiths, I. M. & Vella, D. Reproducing the pressure-time signature of membrane filtration: The interplay between fouling, caking, and elasticity. J. Membr. Sci. 577, 235-248 (2019).
- Castilleux, R., Plancot, B., Vicré, M., Nguema-Ona, E. & Driouich, A. Extensin, an underestimated key component of cell wall defence? Ann. Bot. 127, 709-713 (2021).
- Read, S.M., Bacic, A. Cell wall porosity and its determination. in Plant Cell Wall Analysis (eds Linskens, H.F., & Jackson, J.F.) 63-80. https:// doi.org/10.1007/978-3-642-60989-3_4 (Springer, 1996).
- Löfgren, C., Guillotin, S., Evenbratt, H., Schols, H. & Hermansson, A.M. Effects of calcium, pH, and blockiness on kinetic rheological behavior and microstructure of HM pectin gels. Biomacromolecules 6, 646-652 (2005).
- Yang, X. et al. Low methoxyl pectin gelation under alkaline conditions and its rheological properties: Using NaOH as a pH regulator. Food Hydrocoll. 79, 560-571 (2018).
- Phyo, P., Gu, Y. & Hong, M. Impact of acidic pH on plant cell wall polysaccharide structure and dynamics: insights into the mechanism of acid growth in plants from solid-state NMR. Cellulose 26, 291-304 (2019).
- Mouille, G. et al. Homogalacturonan synthesis in Arabidopsis thaliana requires a golgi-localized protein with a putative methyltransferase domain. Plant J. 50, 605-614 (2007).
- Kim, S.-J., Held, M. A., Zemelis, S., Wilkerson, C. & Brandizzi, F. CGR2 and CGR3 have critical overlapping roles in pectin methylesterification and plant growth in Arabidopsis thaliana. Plant J. 82, 208-220 (2015).
- Du, J. et al. Mutations in the pectin methyltransferase QUASIMODO2 influence cellulose biosynthesis and wall integrity in Arabidopsis. Plant Cell 32, 3576-3597 (2020).
- O’Neill, M. A., Eberhard, S., Albersheim, P. & Darvill, A. G. Requirement of borate cross-linking of cell wall rhamnogalacturonan II for Arabidopsis growth. Science 294, 846-849 (2001).
- Bellincampi, D., Cervone, F., Lionetti, V. Plant cell wall dynamics and wall-related susceptibility in plant-pathogen interactions. Front. Plant Sci. 5, 228 (2014).
- Forand, A. D. et al. With a little help from my cell wall: structural modifications in pectin may play a role to overcome both dehydration stress and fungal pathogens. Plants 11, 385 (2022).
- Vogel, J. P., Raab, T. K., Schiff, C. & Somerville, S. C. PMR6, a pectate lyase-like gene required for powdery mildew susceptibility in Arabidopsis. Plant Cell 14, 2095-2106 (2002).
- Tenhaken, R. Cell wall remodeling under abiotic stress. Front. Plant Sci. 5, 771 (2015).
- Panter, P.E., Panter, J.R., Knight, H. Impact of cell-wall structure and composition on plant freezing tolerance. In Annual Plant Reviews Online 607-642. https://doi.org/10.1002/9781119312994.apr0746 (John Wiley & Sons, 2020).
- Wu, H.-C., Bulgakov, V. P. & Jinn, T.-L. Pectin methylesterases: cell wall remodeling proteins are required for plant response to heat stress. Front. Plant Sci. 9, 1612 (2018).
- Yang, Z.-B., Eticha, D., Rao, I. M. & Horst, W. J. Alteration of cell-wall porosity is involved in osmotic stress-induced enhancement of
aluminium resistance in common bean (Phaseolus vulgaris L.). J. Exp. Bot. 61, 3245 (2010). - Dang, Z. et al. The Fragile culm19 (FC19) mutation largely improves plant lodging resistance, biomass saccharification, and cadmium resistance by remodeling cell walls in rice. J. Hazard. Mater. 458, 132020 (2023).
- Salesse-Smith, C. E. et al. Greater mesophyll conductance and leaf photosynthesis in the field through modified cell wall porosity and thickness via AtCGR3 expression in tobacco. Plant Biotechnol. J. 22, 2504-2517 (2024).
- Wu, H. & Li, Z. Nano-enabled agriculture: How do nanoparticles cross barriers in plants? Plant Commun. 3, 100346 (2022).
- Li, X. & Zhao, Z. Time domain-NMR studies of average pore size of wood cell walls during drying and moisture adsorption. Wood Sci. Technol. 54, 1241-1251 (2020).
- Loqué, D., Scheller, H. V. & Pauly, M. Engineering of plant cell walls for enhanced biofuel production. Curr. Opin. Plant Biol. 25, 151-161 (2015).
- Wang, Y., Xu, X., Xue, H., Zhang, D., Li, G. Recalcitrance of corn straw significantly correlated to the heterogeneity in physicochemical properties of cell wall. Res. Sq. https://doi.org/10.21203/rs.3.rs-605820/v1 (2021).
- Liu, X., Pomorski, T. G. & Liesche, J. Non-invasive quantification of cell wall porosity by fluorescence quenching microscopy. Bio. Protoc. 9, 3344 (2019).
- Ibata, H., Nagatani, A. & Mochizuki, N. Perforated-tape epidermal detachment (PED): a simple and rapid method for isolating epidermal peels from specific areas of Arabidopsis leaves. Plant Biotechnol. 30, 497-502 (2013).
- Schindelin, J. et al. Fiji: an open-source platform for biological-image analysis. Nat. Methods 9, 676-682 (2012).
- Sugimoto, K., Williamson, R. E. & Wasteneys, G. O. New techniques enable comparative analysis of microtubule orientation, wall texture, and growth rate in intact roots of Arabidopsis. Plant Physiol. 124, 1493-1506 (2000).
- Hojat, N., Gentile, P., Ferreira, A. M. & Šiller, L. Automatic pore size measurements from scanning electron microscopy images of porous scaffolds. J. Porous Mater. 30, 93-101 (2023).
- Abraham, M. J. et al. Gromacs: high performance molecular simulations through multi-level parallelism from laptops to supercomputers. SoftwareX 1-2, 19-25 (2015).
- Guvench, O. et al. CHARMM additive all-atom force field for carbohydrate derivatives and its utility in polysaccharide and carbohydrate- protein modeling. J. Chem. Theory Comput. 7, 3162-3180 (2011).
- Lawrence, C. P. & Skinner, J. L. Flexible TIP4P model for molecular dynamics simulation of liquid water. Chem. Phys. Lett. 372, 842-847 (2003).
- Abascal, J.L.F., Sanz, E., Fernández, R.G., Vega, C. A potential model for the study of ices and amorphous water: TIP4P/Ice. J. Chem. Phys. 122, 234511 (2005).
- Lee, H. Interactions of antifreeze proteins in TIP4P / Ice water and their dependence on force fields. PLoS ONE 07, 1-17 (2018).
- Mochizuki, K. & Molinero, V. Antifreeze glycoproteins bind reversibly to ice via hydrophobic groups. J. Am. Chem. Soc. 140, 4803-4811 (2018).
- Sosso, C. G. et al. Unravelling the origins of ice nucleation on organic crystals. Chem. Sci. 9, 8077-8088 (2018).
- Mayne, D. Q. A stochastic steepest-descent algorithm. J. Optim. Theory Appl. 59, 307-323 (1988).
- Bussi, G., Donadio, D. & Parrinello, M. Canonical sampling through velocity rescaling. J. Chem. Phys. 126, 1-7 (2007).
- Berendsen, H. J. C., Postma, J. P. M., van Gunsteren, W. F., DiNola, A. & Haak, J. R. Molecular dynamics with coupling to an external bath. J. Chem. Phys. 81, 3684-3690 (1984).
- Laio, A. & Parrinello, M. Escpaing free-energy minima. PNAS 99, 12562-12566 (2002).
- Barducci, A. & Bussi, G. Well-tempered metadynamics: a smoothly converging and tunable free- energy method. Phys. Rev. Lett. 100, 1-4 (2008).
- Tribello, G. A., Bonomi, M., Branduardi, D., Camilloni, C. & Bussi, G. PLUMED 2: new feathers for an old bird. Comput. Phys. Commun. 185, 604-613 (2014).
- Gallo, P. & Rovere, M. Relation between the two-body entropy and the relaxation time in supercooled water. Phys. Rev. E 91, 012107 (2015).
- Tiwary, P. & Parrinello, M. A time-independent free energy estimator for metadynamics. J. Phys. Chem. B 119, 736-742 (2015).
- McHugh, M. L. Multiple comparison analysis testing in ANOVA. Biochem. Med. 21, 203-209 (2011).
- Sosso, G.C. PEC_LINK. Accessed: 2025-01-08 (2024). https:// zenodo.org/records/14366068
شكر وتقدير
تم دعم هذا العمل من قبل مجلس بحوث العلوم البيولوجية والتكنولوجيا الحيوية (BBSRC) منحة “فهم تكوين الجليد في النباتات: إيجاد طرق جديدة لتحمل التجمد (Plantlce)” (BB/N015559/1). تم تمويل N.R. من خلال منحة تدريب الدكتوراه من BBSRC (BB/M011186/1). يتم تمويل P.L.J. عبر مركز تدريب EPSRC في نمذجة الأنظمة غير المتجانسة (HetSys، رقم المنحة EP/S022848/1). يقر J.E.S بالدعم من EPSRC بموجب المنح EP/W031426/1 و EP/S029966/1 و EP/P031684/1. يقر I.J.P. و F.B. و G.C.S. بامتنان باستخدام خدمة الحوسبة الفائقة الوطنية ARCHER2 في المملكة المتحدة.https://www.archer2.ac.uk)، والتي تم الوصول إليها عبر اتحاد HecBioSim (المشروع e676)، الممول من قبل EPSRC (رقم المنحة EP/X035603/1). كما يود I.J.P. و G.C.S. أن يعربا عن امتنانهما لاستخدام SULIS، الذي تم تمويله من قبل EPSRC (EP/T022108/1)، عبر اتحاد HPC Midlands+. كما يود I.P. و F.B. و G.C.S. أن يعبروا عن شكرهم لمرافق الحوسبة عالية الأداء المقدمة من منصة تكنولوجيا البحث في الحوسبة العلمية (SCRTP) في جامعة ووريك. كما يود H.K و T.J.H و I.O. أن يعربوا عن شكرهم لأندرو إيسكاوسكاس على المناقشات الحاسمة/ المفيدة حول التحليل الإحصائي لقياسات SEM.
مساهمات المؤلفين
قام كل من ج.س.، هـ.ك، ت.ج.هـ، إ.ع. و إ.ج.ب. بتصور البحث. قام إ.ج.ب، ف.ب. و ج.س. بتنفيذ وتحليل محاكاة الديناميكا الجزيئية والديناميكا الميتا. قام ب.ل.ج، ج.س. و ج.إ.س. بتصميم وتطبيق وتحليل النموذج الرياضي القائم على ديناميكا السوائل. قام إ.ع.، ت.ج.هـ، هـ.ك. و م.و.ج. بتصميم الدراسات التجريبية. قام إ.ع. و ن.ر. بتوسيع المنهجية و
تم إجراء اختبارات المسامية المعتمدة على الفلورية. قام C.K.I. بتطوير منهجية SEM وأجرى، مع I.O.، قياسات EM. ساهم I.O. وI.J.P. وP.L.J. وF.B. وT.J.H. وJ.E.S. وH.K. وG.C.S. في كتابة المخطوطة.
تم إجراء اختبارات المسامية المعتمدة على الفلورية. قام C.K.I. بتطوير منهجية SEM وأجرى، مع I.O.، قياسات EM. ساهم I.O. وI.J.P. وP.L.J. وF.B. وT.J.H. وJ.E.S. وH.K. وG.C.S. في كتابة المخطوطة.
المصالح المتنافسة
يعلن المؤلفون عدم وجود مصالح متنافسة.
معلومات إضافية
معلومات إضافية النسخة الإلكترونية تحتوي على مواد إضافية متاحة في
https://doi.org/10.1038/s42003-025-07495-0.
https://doi.org/10.1038/s42003-025-07495-0.
يجب توجيه المراسلات والطلبات للحصول على المواد إلى هيذر نايت أو غابرييل سي. سوسو.
تشكر مجلة Communications Biology دوودو وان والمراجعين الآخرين المجهولين على مساهمتهم في مراجعة الأقران لهذا العمل. المحررون الرئيسيون: كاليا جورجيفا. يتوفر ملف مراجعة الأقران.
معلومات إعادة الطبع والتصاريح متاحة علىhttp://www.nature.com/reprints
ملاحظة الناشر: تظل Springer Nature محايدة فيما يتعلق بالمطالبات القضائية في الخرائط المنشورة والانتماءات المؤسسية.
الوصول المفتوح: هذه المقالة مرخصة بموجب رخصة المشاع الإبداعي للاستخدام الدولي 4.0، والتي تسمح بالاستخدام والمشاركة والتكيف والتوزيع وإعادة الإنتاج بأي وسيلة أو صيغة، طالما أنك تعطي الائتمان المناسب للمؤلفين الأصليين والمصدر، وتوفر رابطًا لرخصة المشاع الإبداعي، وتوضح ما إذا تم إجراء تغييرات. الصور أو المواد الأخرى من طرف ثالث في هذه المقالة مشمولة في رخصة المشاع الإبداعي للمقالة، ما لم يُذكر خلاف ذلك في سطر الائتمان للمادة. إذا لم تكن المادة مشمولة في رخصة المشاع الإبداعي للمقالة وكان استخدامك المقصود غير مسموح به بموجب اللوائح القانونية أو يتجاوز الاستخدام المسموح به، ستحتاج إلى الحصول على إذن مباشرة من صاحب حقوق الطبع والنشر. لعرض نسخة من هذه الرخصة، قم بزيارةhttp://creativecommons.org/licenses/by/4.0/.
© المؤلفون 2025
© المؤلفون 2025
- ¹قسم علوم الحياة ومركز ديرم لتحسين المحاصيل، جامعة ديرم، ديرم، المملكة المتحدة. ²قسم الكيمياء، جامعة ووريك، كوفنتري، المملكة المتحدة.
معهد الرياضيات بجامعة ووريك، كوفنتري، المملكة المتحدة. □ البريد الإلكتروني:p.h.knight@durham.ac.uk;g.sosso@warwick.ac.uk
Journal: Communications Biology, Volume: 8, Issue: 1
DOI: https://doi.org/10.1038/s42003-025-07495-0
PMID: https://pubmed.ncbi.nlm.nih.gov/39825091
Publication Date: 2025-01-17
DOI: https://doi.org/10.1038/s42003-025-07495-0
PMID: https://pubmed.ncbi.nlm.nih.gov/39825091
Publication Date: 2025-01-17
Understanding pectin cross-linking in plant cell walls
Irabonosi Obomighie (1)
Pectin is a major component of plant cells walls. The extent to which pectin chains crosslink with one another determines crucial properties including cell wall strength, porosity, and the ability of small, biologically significant molecules to access the cell. Despite its importance, significant gaps remain in our comprehension, at the molecular level, of how pectin cross-links influence the mechanical and physical properties of cell walls. This study employs a multidisciplinary approach, combining molecular dynamics simulations, experimental investigations, and mathematical modelling, to elucidate the mechanism of pectin cross-linking and its effect on cell wall porosity. The computational aspects of this work challenge the prevailing egg-box model, favoring instead a zipper model for pectin cross-linking, whilst our experimental work highlights the significant impact of pectin cross-linking on cell wall porosity. This work advances our fundamental understanding of the biochemistry underpinning the structure and function of the plant cell wall. This knowledge has important implications for agricultural biotechnology, informing us about the chemical properties of plant pectins that are best suited for improving crop resilience and amenability to biofuel extraction by modifying the cell wall.
Unlike animal cells, plant cells are surrounded by a cell wall, which provides strength and protection, whilst allowing growth
losses worldwide
losses worldwide
Pectin gelation is affected by cross-links forming between pectin chains or their sugar side chains. Homogalacturonan (HG) pectins, which represent the majority of cell-wall pectin, primarily cross-link to one another via calcium ions (
In this work, we have leveraged a multidisciplinary approach to shed light onto the mechanism of cross-linking of pectin and to establish a connection between the structure of pectin and the porosity of the cell wall.
Fig. 1 | Different cross-linking mechanisms for HG chains. The different functional groups involved, namely protonated carboxyl groups (-COOH), deprotonated carboxyl groups (-
egg-box model is commonly found in the literature revolving around pectin crosslinking, and involves two hydroxyl (- OH , light blue) groups and two –
egg-box model is commonly found in the literature revolving around pectin crosslinking, and involves two hydroxyl (- OH , light blue) groups and two –
Specifically, we have investigated the molecular-level details of HG crosslinking via molecular simulations, quantifying the energetics of different cross-linking mechanisms. We have also systematically investigated the structure-function relationship between the functionalisation of HG chains and the kinetics of their aggregation. Our results suggests that the venerable “egg-box” model might not be adequate to describe the
Results
Molecular simulations
The egg-box model of HG cross-linking is not supported. As the most abundant pectic domain in plant cell walls is
Much of the existing literature suggests that these calcium bridges involve two hydroxyl (-OH) groups as well. This possibility, illustrated in Fig. 1, leads to the emergence of the so-called “egg-box” model for pectin cross-linking
Small-angle X-ray scattering (SAXS) has been previously employed to investigate the structural details of
work on arabidopsis
work on arabidopsis
In fact, recent work has called into question the validity of this model in favour of a “zipper” model
In cases where the carboxyl group of GalA would be found in its protonated form, it is reasonable to expect some degree of hydrogen bonding between two – COOH groups belonging to different chains, without the need to involve a
Thus, the resulting porosity of the pectin network within the cell wall is determined by a competition of different HG cross-linking mechanisms. In order to assess the stability of these different cross-linking options for HG chains, we performed metadynamics simulations. The details are discussed at length in the “Methods” section: in short, metadynamics is an enhanced sampling computational technique that leverages molecular dynamics (MD) simulations to reconstruct the free energy profiles relative to one or more “collettive variables”-in this case, specific degrees of freedom that describe the cross-linking process. To begin with, we have computed by means of unbiased simulations (i.e., without applying the metadynamics method so as not to tamper with the natural time evolution of the system) the running coordination number for
Via metadynamics simulations, we have investigated the free energy gain associated with the formation of a single
Fig. 2 | Metadynamics simulations of HG cross-linking. a Running average coordination number of
atoms belonging to the two
carbonyl groups, whilst the coordination number of the
carbonyl groups, whilst the coordination number of the
In contrast, cross-linking of HG via hydrogen bonding seems to be leveraging much weaker interactions. This is quantified by the free energy profiles we have obtained relative to cross-linking via hydrogen bonding between either methyl-esterified GalA and – COOH groups, reported in Fig. 2e, g, respectively. The hydrogen bonding between – COOH groups is significantly stronger than that methylated carboxyl groups:
Thus, in light of these results we argue that the main cross-linking mechanism for low methoxyl pectin in physiological conditions for plants must rely on –
but they are bound to result in less strongly linked pectin compared to the
but they are bound to result in less strongly linked pectin compared to the
Impact of HG functionalisation on its cross-linking potential. To gain further insight into the kinetics of the HG cross-linking, we have also performed unbiased simulations of the aggregation of HG chains in water. In particular, we have considered HG chains containing either 8 or 40 GalA units, and we have systematically explored the impact of the functionalisation of the GalA units on the HG cross-linking. Our simulation boxes contained eight chains (either 8 – or 40 -unit long) featuring different combination of protonated -COOH groups (
We find that D-only HG chains show the greatest extent of crosslinking, whilst P -only chains link much less effectively, and M-only chains even less so. This trend is not only evident in terms of the average number of cross-links, but the lifetime of the links is substantially longer for the
Table 1 | HG cross-linking as a function of functionalisation
| System |
|
|
|
|
|
|
|
| PPPPPPPP | – | – | 9.91(32) | – | – | 1.43 | 6.03 |
| DDDDDDDD | 16.89 (32) | – | – | 8.02 | – | – | 8 |
| MMMMMMMM | – | 6.06 (32) | – | – | 1.65 | – | 3.94 |
| DDPDPPDP | 9.44 (16) | – | 4.23 (16) | 7.37 | – | 1.52 | 7.74 |
| DDMDMMDM | 8.66 (16) | 1.71 (16) | – | 7.88 | 1.53 | – | 7.35 |
| DPDPDPDP | 8.51 (16) | – | 6.59 (16) | 8.6 | – | 1.62 | 7.51 |
| DMDMDMDM | 9.09 (16) | 2.21 (16) | – | 5.53 | 1.97 | – | 6.98 |
| DDPPDDPP | 8.79 (16) | – | 4.72 (16) | 8.79 | – | 1.58 | 7.72 |
| DDMMDDMM | 8.46 (16) | 3.52 (16) | – | 8.43 | 1.57 | – | 7.54 |
| PPDDDDPP | 7.15 (16) | – | 3.56 (16) | 5.05 | – | 1.25 | 5.99 |
| MMDDDDMM | 8.16 (16) | 1.71 (16) | – | 7.11 | 1.33 | – | 4.81 |
| DDPPPPDD | 10.59 (16) | – | 3.88 (16) | 7.96 | – | 1.68 | 7.53 |
| DDMMMMDD | 9.49 (16) | 2.98 (16) | – | 6.35 | 2.09 | – | 7.92 |
| DPPDDPPD | 9.77 (16) | – | 4.09 (16) | 6.69 | – | 2.11 | 7.78 |
| DMMDDMMD | 9.77 (16) | 1.75 (16) | – | 8.62 | 1.37 | – | 7.38 |
| PDDPPDDP | 8.46 (16) | – | 4.25 (16) | 6.2 | – | 1.41 | 7.56 |
| MDDMMDDM | 7.95 (16) | 5.56 (16) | – | 8.96 | 1.89 | – | 7.63 |
| DDDDPPPP | 6.52 (16) | – | 3.41 (16) | 3.62 | – | 1.51 | 4.86 |
| DDDDMMMM | 7.80 (16) | 2.40 (16) | – | 5.41 | 1.66 | – | 3.85 |
| dddd | 58.05 (160) | – | – | 10.99 | – | – | 7.95 |
| mmmm | – | 1.81 (160) | – | – | 1.24 | – | 2.07 |
| dddp | 32.51 (120) | – | 2.79 (40) | 10.68 | – | 1.49 | 4.52 |
| dddm | 37.95 (120) | 0.17 (40) | – | 16.67 | 1.11 | – | 5.61 |
| ddpd | 36.12 (120) | – | 0.37 (40) | 12.41 | – | 1.04 | 6.07 |
| ddmd | 29.14 (120) | 0.98 (40) | – | 10.67 | 1.66 | – | 6.54 |
| ddpp | 32.07 (80) | – | 8.15 (80) | 11.93 | – | 1.94 | 5.14 |
| ddmm | 24.80 (80) | 0.50 (80) | – | 14.49 | 1.24 | – | 4.37 |
| dppd | 29.44 (80) | – | 6.27 (80) | 15.91 | – | 1.59 | 3.26 |
| dmmd | 28.85 (80) | 2.23 (80) | – | 11.00 | 1.90 | – | 3.44 |
| pddp | 21.24 (80) | – | 8.44 (80) | 11.06 | – | 1.69 | 3.17 |
| mddm | 16.83 (80) | 0.92 (80) | – | 9.80 | 1.63 | – | 2.63 |
| dpdp | 26.68 (80) | – | 10.37 (80) | 11.43 | – | 1.87 | 6.22 |
| dmdm | 31.44 (80) | 3.88 (80) | – | 14.63 | 1.61 | – | 5.39 |
| dppp | 15.29 (40) | – | 14.96 (120) | 10.28 | – | 1.82 | 3.45 |
| dmmm | 13.12 (40) | 1.73 (120) | – | 20.10 | 1.66 | – | 2.44 |
| pdpp | 12.24 (40) | – | 7.92 (120) | 14.53 | – | 1.45 | 1.93 |
| mdmm | 14.46 (40) | 2.04 (120) | – | 18.8 | 1.36 | – | 2.00 |
Our simulation boxes contained eight chains (either 8 – or 40-unit long) featuring different combinations of protonated -COOH groups (P or p for 8- and 40-unit long chains, respectively), de-protonated -COO- groups (Dord for 8 – and 40 -unit long chains, respectively) and methylated carboxyl groups (
metadynamics simulations discussed above (and summarised in Fig. 2). In terms of the chains characterised by a mixture of either D and M or D and P units, it appears that 4 -unit “blocks” of different units (e.g., DDDDMMMM or DDDDPPPP) cross-link to a much lesser extent if compared to chains with the same composition where however the units are alternating along the chains (e.g., DMDMDMDM or DPDPDPDP). This trend might indicate that alternating D units might favour hydrogen bonding between M or P units as well. However, it seems that chains terminated by D units (i.e., DDPPPPDD or DDMMMMDD) cross-link to an even greater extent than chains alternating D and either M or P units.
metadynamics simulations discussed above (and summarised in Fig. 2). In terms of the chains characterised by a mixture of either D and M or D and P units, it appears that 4 -unit “blocks” of different units (e.g., DDDDMMMM or DDDDPPPP) cross-link to a much lesser extent if compared to chains with the same composition where however the units are alternating along the chains (e.g., DMDMDMDM or DPDPDPDP). This trend might indicate that alternating D units might favour hydrogen bonding between M or P units as well. However, it seems that chains terminated by D units (i.e., DDPPPPDD or DDMMMMDD) cross-link to an even greater extent than chains alternating D and either M or P units.
These results are consistent across 8 -unit and 40 -unit chains: interestingly, the lifetime of the
Fig.
bridges across multiple chains, without the need to involve any – OH group in the process (as advocated by the “egg-box” mechanism).
Overall, our simulations suggest that HG chains cross-link to each other according to this “zipper” mechanism that does not introduce significant torsion within the HG chain. In contrast, we note that for the -OH groups to be involved in the calcium bridges according to the “egg-box” model, the HG chains must distort to a significant extent. These considerations, whilst elucidating the molecular-level details of the cross-linking of HG chains, also suggest that the role of pH as well as the content of calcium within the cell wall might be key to determine the overall degree of cross-linking in pectin.
To better understand the influence of HG cross-linking on the porosity of the cell wall, we turn to the experimental measurements discussed in the next section. We remark at this stage that a large number of genes control pectin methyl esterification (and thus, have the potential to affect pectin cross-linking) and redundancy in their function means that genetic mutants are largely unaffected by loss of function of any single PME gene
To circumvent this issue whilst making appreciable alterations to pectin cross-linking, we have used a well-studied genetic mutant of Arabidopsis thaliana which exhibits qualitative differences in its RGII pectic domain but shows unaltered amounts of pectin and no defect in cell adhesion
Experimental determination of the cell wall porosity in an arabidopsis cell-wall pectin cross-linking mutant
Recently, Liu et al.
Central to our modification of the technique was the measurement of fluorescence over a series of time points, rather than through a single endpoint measurement, to reveal the dynamics of the process. Specifically, we labelled the plasma membrane of epidermal leaf peels with the fluorescent dye FM4-64 and introduced a quencher molecule, trypan blue. We then monitored the decline of the observed florescence of the samples over a 15 min period. As can be seen from the images in Fig. 4a, fluorescence levels were similar between the two genotypes before quencher application but declined more rapidly in the sfr 8 mutant than in the wild type. Note that this difference was significant at the moment of application (time
where
Mathematical modelling of the porosity measurements
To gain further insight into the mechanistic aspects underpinning the experimental results reported in the previous section, we have constructed a minimalist mathematical model, based on fluid dynamics considerations. The variables and parameters used in this section are summarised in Table 2.
As illustrated in Fig. 5a, we consider a cell wall of area
Fig. 4 | Experimental measurements of the cell wall porosity in Col0 wild type and sfr8 arabidopsis leaves. a Change in the fluorescence of the FM4-64-stained plasma membrane (see text) for Col0 and sfr 8 cell wall samples. A time series of three representative fluorescence images reported for each point in time for each genotype are shown. The optical microscopy images were taken before quenching (
statistical comparisons, a two-way ANOVA with Bonferroni’s multiple comparisons test
gradient across it is:
gradient across it is:
The cell wall is assumed to be a porous medium, characterised by porosity
We also assume that the quencher follows Fickian diffusion:
where
Combining these equations, we get the ordinary differential equation:
with solution
This has characteristic timescale
Having found the concentration of the quencher in the membrane, we must now relate this to the fluorescence as measured in the experiments. The fluorescence
Table 2|Variables and parameters utilised in the mathematical modelling of the porosity measurements
| Name | Symbol | Units | Reference Value |
| Time |
|
s | |
| Concentration of quencher in membrane |
|
|
|
| Diffusional flux |
|
|
|
| Fluorescence intensity |
|
– | |
| Porosity |
|
– | |
| Tortuosity |
|
– |
|
| Quencher rate coefficient in membrane |
|
|
? |
| Decay timescale |
|
s | ? |
| Quencher constant |
|
|
|
| Diffusion coefficient of quencher in bath | D |
|
|
| Diffusion coefficient of quencher in pore |
|
|
|
| Wall thickness |
|
m |
|
| Membrane thickness |
|
m |
|
| Concentration of quencher in bath |
|
|
|
| Sample area |
|
|
known |
Stern-Volmer equation
which with (6) rearranges to:
This is the function used for the fitting of the experimental data reported in Fig. 5. We fit
In our case, from this fit we have obtained values for
To relate the tortuosity to the porosity, we use the simple Bruggeman expression
so that:
From the fit reported in Fig. 5 we get:
Fig. 5 | Mathematical modelling of the porosity measurements. a Schematics of the model. The relevant variables and parameters are reported in Table 2. b Fitting of the experimental data (see Fig. 4).
This result indicates that the cell wall of the sfr 8 mutant is
Nevertheless, despite the simplicity of our model, our results indicate that: (i.) the experimental results can be explained without the need of introducing any “blocking” mechanism for the quencher to get stuck in and/ or occlude the pores of the cell wall
Discussion
The plant cell wall is a highly complex structure governed by numerous interactions between carbohydrate polymers and structural proteins including extensins
To gain a better understanding of what shapes porosity in plant cell walls, we began with the pectin building blocks and examined the possible molecular interactions between pectin chains that are capable of crosslinking pectin and making it less porous. Our MD simulations added evidence to an emerging case to be made for a zipper model rather than the popular egg box model favoured by many plant biologists. Interestingly, our MD simulations also highlighted the importance of pH on the wall and
cross-linking. These data are consistent with experimental observations in vitro that pectin gelling and firmness is dependent upon both
cross-linking. These data are consistent with experimental observations in vitro that pectin gelling and firmness is dependent upon both
Having investigated the molecular basis for the different ways pectin chains can aggregate and interact with one another, we gathered experimental data from a biological system in which pectin cross-linking is altered. We used time-dependent fluorescence quenching measurements to assess how altered cross-linking affected the porosity of cell wall. We confirmed the validity of these measurements with direct observations via SEM and we modelled the fluorescence quenching data as well. Whilst arabidopsis mutants in HG pectin methyltransferases are available and would be predicted to exhibit altered crosslinking, these suffer from numerous defects including stunted growth and a loss of cell adhesion
To investigate this hypothesis, we used a modified version of the fluorescence quenching method developed by Liu et al.
In order to rationalise the experimental fluorescence measurements, and particularly to elucidate the physical processes underpinning the results, we have built a straightforward mathematical model leveraging fluid dynamics concepts. Our results suggests that the flux of the quencher molecules through the cell wall does not occlude the pores within the pectin network; although in future, modifications to this model which include a “blocking mechanism”
We also provide a justification for the up-to-now empirical choice of measuring the fluorescence decay within the sample as soon as possible after having introduced the quencher. This is because the early time regimes maximise the difference in terms of quenching efficiency. Finally, we demonstrate that the different responses in terms of fluorescence elicited by different samples can be explained in terms of the porosity of the samples alone.
The ability to predict the interactions between pectin chains in different contexts and forecast changes in porosity has many applications in agritechnology. Pectin structure determines the level of success attacking fungal and bacterial pathogens may have
render the wall more porous and facilitate access to the cell’s nutrients
render the wall more porous and facilitate access to the cell’s nutrients
In summary, this study shed light on the intricate dynamics of pectin cross-linking and its consequential effects on plant cell wall porosity, offering significant insights across multiple disciplines. By elucidating the molecular interactions within pectin chains and their impact on cell wall structure, we have advanced our understanding of plant biology, particularly in relation to plant growth, disease resistance, and stress responses. Our findings highlight the potential for manipulating pectin structure to enhance crop resilience against pathogens and abiotic stress or improve saccharification potential, pointing to novel strategies for crop protection and improvement. This cross-disciplinary research not only deepens our fundamental understanding of plant cell wall chemistry but also opens new avenues for agricultural innovation and sustainability.
Methods
Growth of plants
Arabidopsis plants were grown under 12 h light: 12 h dark at
Porosity measurements
Fluorescence measurements. The porosity of the cell wall in leaf epidermal peels was assessed through a fluorescence quenching assay, following the method originally described by Liu et al.
Electron microscopy. Chemicals were obtained from Sigma, Poole, UK or Fisher Scientific (unless otherwise stated). A single leaf from a 5 -week old arabidopsis plant was placed in PEM buffer
was transferred to PEM buffer with
was transferred to PEM buffer with
Molecular dynamics simulations
Molecular dynamics simulations were performed in GROMACS 5.1.3
Simulations have been run on a range of systems with different HG chain compositions (see Table 1). Each system consisted of eight identical chains with eight residues each, which were either protonated (P), deprotonated (D), or methylesterified (M). Deprotonated residues carry a negative (
To investigate in detail the energetics of the different interactions illustrated in Fig. 1, we have resorted to well-tempered metadynamics
simulations
simulations
The deposition rate of the bias was set to 500 MD steps (equivalent to 1 ps ) as the structural relaxation time of TIP4P water at room temperature and pressure is of the order of
Whilst the concept of time in metadynamics simulations does not have a direct physical meaning (as the time evolution of the system is heavily influenced by the artificial bias introduced for the purposes of exploring the free energy surface of interest), such long simulation times were necessary to ensure the proper convergence of the resulting free energy surface. To this end, we have: (i.) monitored the changes of the free energy surface as a function of the simulation time; (ii.) explored the impact of varying the height and width of the bias potential; (iii.) utilised the reweighing technique of Tiwary and Parrinello
Statistics and Reproducibility. We have included a discussion of the reproducibility of our results with respect to every aspect of our methodology (see the Methods section). Perhaps the most delicate aspect of our work concerns the reproducibility of our results in terms of the molecular dynamics simulations of HG aggregates (see Table 1). To this end, we have included direct evidence of the robustness of these results in the Supplementary Information. With respect to the fluorescence measurements reported in Fig. 4b, three separate regions of interest (ROI) were assessed per epidermal peel (for a total of 39 and 42 ROI for Col 0 and sfr8, respectively). The data were combined from three separate experiments. For statistical comparisons, a two-way ANOVA with Bonferroni’s multiple comparisons test
simulations reported in Fig. 2, we have utilized the reweighing technique of Tiwary and Parrinello
simulations reported in Fig. 2, we have utilized the reweighing technique of Tiwary and Parrinello
Reporting summary
Further information on research design is available in the Nature Portfolio Reporting Summary linked to this article.
Data availability
All of the data associated with this study are available via a publicly accessible GitHub repository (PEC_LINK, https://github.com/gcsosso/PEC_LINK. git). We have also linked a release of said repository to a Zenodo repository (also publicly accessible), for which we have obtained a permanent DOI
Code availability
The details of the codes utilized in this work can be found in the Methods section. No in-house or proprietary code has been utilized. With respect to the computational aspects of the work, we remark that both the GROMACS and the PLUMED packages are open source and publicly available.
Received: 8 April 2024; Accepted: 8 January 2025;
Published online: 17 January 2025
Published online: 17 January 2025
References
- Cosgrove, D. J. Growth of the plant cell wall. Nat. Rev. Mol. Cell Biol. 6, 850-861 (2005).
- Delmer, D., Dixon, R.A., Keegstra, K., Mohnen, D. The plant cell walldynamic, strong, and adaptable-is a natural shapeshifter. Plant Cell, 325. https://doi.org/10.1093/plcell/koad325 (2024).
- Caffall, K. H. & Mohnen, D. The structure, function, and biosynthesis of plant cell wall pectic polysaccharides. Carbohydr. Res. 344, 1879-1900 (2009).
- Baron-Epel, O., Gharyal, P. K. & Schindler, M. Pectins as mediators of wall porosity in soybean cells. Planta 175, 389-395 (1988).
- Fleischer, A., O’Neill, M. A. & Ehwald, R. The pore size of nongraminaceous plant cell walls is rapidly decreased by borate ester cross-linking of the pectic polysaccharide rhamnogalacturonan II1. Plant Physiol. 121, 829-838 (1999).
- Bidhendi, A. J. & Geitmann, A. Relating the mechanics of the primary plant cell wall to morphogenesis. J. Exp. Bot. 67, 449-461 (2016).
- Carpita, N., Sabularse, D., Montezinos, D. & Delmer, D. P. Determination of the pore size of cell walls of living plant cells. Science 205, 1144-1147 (1979).
- Pérez-Donoso, A. G., Sun, Q., Roper, M. C., Greve, L. C., Kirkpatrick, B. & Labavitch, J. M. Cell wall-degrading enzymes enlarge the pore size of intervessel pit membranes in healthy and Xylella fastidiosainfected grapevines. Plant Physiol. 152, 1748-1759 (2010).
- Savary, S., Willocquet, L., Pethybridge, S. J., Esker, P., McRoberts, N. & Nelson, A. The global burden of pathogens and pests on major food crops. Nat. Ecol. Evol. 3, 430-439 (2019).
- Adani, F., Papa, G., Schievano, A., Cardinale, G., D’Imporzano, G. & Tambone, F. Nanoscale structure of the cell wall protecting cellulose from enzyme attack. Environ. Sci. Technol. 45, 1107-1113 (2011).
- Wang, Y., Xu, X., Xue, H., Zhang, D. & Li, G. Physical-chemical properties of cell wall interface significantly correlated to the complex recalcitrance of corn straw. Biotechnol. Biofuels 14, 196 (2021).
- Grant, G. T., Morris, E. R., Rees, D. A., Smith, P. J. C. & Thom, D. Biological interactions between polysaccharides and divalent cations: The egg-box model. FEBS Lett. 32, 195-198 (1973).
- Zdunek, A., Pieczywek, P. M. & Cybulska, J. The primary, secondary, and structures of higher levels of pectin polysaccharides. Compr. Rev. Food Sci. Food Saf. 20, 1101-1117 (2021).
- Assifaoui, A. et al. Structural behaviour differences in low methoxy pectin solutions in the presence of divalent cations (Ca2+ and Zn2+): a process driven by the binding mechanism of the cation with the galacturonate unit. Soft Matter 11, 551-560 (2014).
- Poset, A. M. D., Zitolo, A., Cousin, F., Assifaoui, A. & Lerbret, A. Evidence for an egg-box-like structure in iron(II)-polygalacturonate hydrogels: a combined EXAFS and molecular dynamics simulation study. Phys. Chem. Chem. Phys. 22, 2963-2977 (2020).
- Pelloux, J., Rustérucci, C. & Mellerowicz, E. J. New insights into pectin methylesterase structure and function. Trends Plant Sci. 12, 267-277 (2007).
- Harholt, J., Suttangkakul, A. & Vibe Scheller, H. Biosynthesis of pectin. Plant Physiol. 153, 384-395 (2010).
- Wormit, A. & Usadel, B. The multifaceted role of pectin methylesterase inhibitors (PMEls). Int J. Mol. Sci. 19, 2878 (2018).
- O’Neill, M. A., Ishii, T., Albersheim, P. & Darvill, A. G. RHAMNOGALACTURONAN II: structure and function of a borate cross-linked cell wall pectic polysaccharide.Annu. Rev. Plant Biol. 55, 109-139 (2004).
- Rondeau-Mouro, C., Defer, D., Leboeuf, E. & Lahaye, M. Assessment of cell wall porosity in Arabidopsis thaliana by NMR spectroscopy. Int. J. Biol. Macromol. 42, 83-92 (2008).
- Liu, X. et al. Novel tool to quantify cell wall porosity relates wall structure to cell growth and drug uptake. J. Cell Biol. 218, 1408-1421 (2019).
- Fu, J., Thomas, H. R. & Li, C. Tortuosity of porous media: Image analysis and physical simulation. Earth Sci. Rev. 212, 103439 (2021).
- Du, J., Anderson, C. T. & Xiao, C. Dynamics of pectic homogalacturonan in cellular morphogenesis and adhesion, wall integrity sensing and plant development. Nat. Plants 8, 332-340 (2022).
- Plazinski, W. Molecular basis of calcium binding by polyguluronate chains. Revising the egg-box model. J. Comput Chem. 32, 2988-2995 (2011).
- Temple, H. et al. Golgi-localized putative S-adenosyl methionine transporters required for plant cell wall polysaccharide methylation. Nat. Plants 8, 656-669 (2022).
- Draget, K. I., Stokke, B. T., Yuguchi, Y., Urakawa, H. & Kajiwara, K. Small-angle X-ray scattering and rheological characterization of alginate gels. 3. alginic acid gels. Biomacromolecules 4, 1661-1668 (2003).
- Ventura, I., Jammal, J. & Bianco-Peled, H. Insights into the nanostructure of low-methoxyl pectin-calcium gels. Carbohydr. Polym. 97, 650-658 (2013).
- Shi, D.-C. et al. Boron-bridged RG-II and calcium are required to maintain the pectin network of the Arabidopsis seed mucilage ultrastructure. Plant Mol. Biol. 94, 267-280 (2017).
- Braccini, I. & Pérez, S. Molecular basis of Ca2+-induced gelation in alginates and pectins: the egg-box model revisited. Biomacromolecules 2, 1089-1096 (2001).
- Gilsenan, P. M., Richardson, R. K. & Morris, E. R. Thermally reversible acid-induced gelation of low-methoxy pectin. Carbohydr. Polym. 41, 339-349 (2000).
- Yoo, J., Wilson, J. & Aksimentiev, A. Improved model of hydrated calcium ion for molecular dynamics simulations using classical biomolecular force fields. Biopolymers 105, 752-763 (2016).
- Panter, P. E. et al. Cell wall fucosylation in Arabidopsis influences control of leaf water loss and alters stomatal development and mechanical properties. J. Exp. Bot. 74, 2680 (2023).
- Ishii, T. & Matsunaga, T. Pectic polysaccharide rhamnogalacturonan II is covalently linked to homogalacturonan. Phytochemistry 57, 969-974 (2001).
- Panter, P. E. et al. MUR1-mediated cell-wall fucosylation is required for freezing tolerance in Arabidopsis thaliana. N. Phytol. 224, 1518-1531 (2019).
- Bruna, M. & Chapman, S. J. Diffusion of finite-size particles in confined geometries. Bull. Math. Biol. 76, 947-982 (2014).
- Tartakovsky, D. M. & Dentz, M. Diffusion in porous media: phenomena and mechanisms. Transp. Porous Media 130, 105-127 (2019).
- Lakowicz, J.R. (ed). Principles of Fluorescence Spectroscopy. https:// doi.org/10.1007/978-0-387-46312-4 (Springer, 2006).
- Tjaden, B., Cooper, S. J., Brett, D. J., Kramer, D. & Shearing, P. R. On the origin and application of the Bruggeman correlation for analysing transport phenomena in electrochemical systems. Curr. Opin. Chem. Eng. 12, 44-51 (2016).
- Herterich, J. G., Griffiths, I. M. & Vella, D. Reproducing the pressure-time signature of membrane filtration: The interplay between fouling, caking, and elasticity. J. Membr. Sci. 577, 235-248 (2019).
- Castilleux, R., Plancot, B., Vicré, M., Nguema-Ona, E. & Driouich, A. Extensin, an underestimated key component of cell wall defence? Ann. Bot. 127, 709-713 (2021).
- Read, S.M., Bacic, A. Cell wall porosity and its determination. in Plant Cell Wall Analysis (eds Linskens, H.F., & Jackson, J.F.) 63-80. https:// doi.org/10.1007/978-3-642-60989-3_4 (Springer, 1996).
- Löfgren, C., Guillotin, S., Evenbratt, H., Schols, H. & Hermansson, A.M. Effects of calcium, pH, and blockiness on kinetic rheological behavior and microstructure of HM pectin gels. Biomacromolecules 6, 646-652 (2005).
- Yang, X. et al. Low methoxyl pectin gelation under alkaline conditions and its rheological properties: Using NaOH as a pH regulator. Food Hydrocoll. 79, 560-571 (2018).
- Phyo, P., Gu, Y. & Hong, M. Impact of acidic pH on plant cell wall polysaccharide structure and dynamics: insights into the mechanism of acid growth in plants from solid-state NMR. Cellulose 26, 291-304 (2019).
- Mouille, G. et al. Homogalacturonan synthesis in Arabidopsis thaliana requires a golgi-localized protein with a putative methyltransferase domain. Plant J. 50, 605-614 (2007).
- Kim, S.-J., Held, M. A., Zemelis, S., Wilkerson, C. & Brandizzi, F. CGR2 and CGR3 have critical overlapping roles in pectin methylesterification and plant growth in Arabidopsis thaliana. Plant J. 82, 208-220 (2015).
- Du, J. et al. Mutations in the pectin methyltransferase QUASIMODO2 influence cellulose biosynthesis and wall integrity in Arabidopsis. Plant Cell 32, 3576-3597 (2020).
- O’Neill, M. A., Eberhard, S., Albersheim, P. & Darvill, A. G. Requirement of borate cross-linking of cell wall rhamnogalacturonan II for Arabidopsis growth. Science 294, 846-849 (2001).
- Bellincampi, D., Cervone, F., Lionetti, V. Plant cell wall dynamics and wall-related susceptibility in plant-pathogen interactions. Front. Plant Sci. 5, 228 (2014).
- Forand, A. D. et al. With a little help from my cell wall: structural modifications in pectin may play a role to overcome both dehydration stress and fungal pathogens. Plants 11, 385 (2022).
- Vogel, J. P., Raab, T. K., Schiff, C. & Somerville, S. C. PMR6, a pectate lyase-like gene required for powdery mildew susceptibility in Arabidopsis. Plant Cell 14, 2095-2106 (2002).
- Tenhaken, R. Cell wall remodeling under abiotic stress. Front. Plant Sci. 5, 771 (2015).
- Panter, P.E., Panter, J.R., Knight, H. Impact of cell-wall structure and composition on plant freezing tolerance. In Annual Plant Reviews Online 607-642. https://doi.org/10.1002/9781119312994.apr0746 (John Wiley & Sons, 2020).
- Wu, H.-C., Bulgakov, V. P. & Jinn, T.-L. Pectin methylesterases: cell wall remodeling proteins are required for plant response to heat stress. Front. Plant Sci. 9, 1612 (2018).
- Yang, Z.-B., Eticha, D., Rao, I. M. & Horst, W. J. Alteration of cell-wall porosity is involved in osmotic stress-induced enhancement of
aluminium resistance in common bean (Phaseolus vulgaris L.). J. Exp. Bot. 61, 3245 (2010). - Dang, Z. et al. The Fragile culm19 (FC19) mutation largely improves plant lodging resistance, biomass saccharification, and cadmium resistance by remodeling cell walls in rice. J. Hazard. Mater. 458, 132020 (2023).
- Salesse-Smith, C. E. et al. Greater mesophyll conductance and leaf photosynthesis in the field through modified cell wall porosity and thickness via AtCGR3 expression in tobacco. Plant Biotechnol. J. 22, 2504-2517 (2024).
- Wu, H. & Li, Z. Nano-enabled agriculture: How do nanoparticles cross barriers in plants? Plant Commun. 3, 100346 (2022).
- Li, X. & Zhao, Z. Time domain-NMR studies of average pore size of wood cell walls during drying and moisture adsorption. Wood Sci. Technol. 54, 1241-1251 (2020).
- Loqué, D., Scheller, H. V. & Pauly, M. Engineering of plant cell walls for enhanced biofuel production. Curr. Opin. Plant Biol. 25, 151-161 (2015).
- Wang, Y., Xu, X., Xue, H., Zhang, D., Li, G. Recalcitrance of corn straw significantly correlated to the heterogeneity in physicochemical properties of cell wall. Res. Sq. https://doi.org/10.21203/rs.3.rs-605820/v1 (2021).
- Liu, X., Pomorski, T. G. & Liesche, J. Non-invasive quantification of cell wall porosity by fluorescence quenching microscopy. Bio. Protoc. 9, 3344 (2019).
- Ibata, H., Nagatani, A. & Mochizuki, N. Perforated-tape epidermal detachment (PED): a simple and rapid method for isolating epidermal peels from specific areas of Arabidopsis leaves. Plant Biotechnol. 30, 497-502 (2013).
- Schindelin, J. et al. Fiji: an open-source platform for biological-image analysis. Nat. Methods 9, 676-682 (2012).
- Sugimoto, K., Williamson, R. E. & Wasteneys, G. O. New techniques enable comparative analysis of microtubule orientation, wall texture, and growth rate in intact roots of Arabidopsis. Plant Physiol. 124, 1493-1506 (2000).
- Hojat, N., Gentile, P., Ferreira, A. M. & Šiller, L. Automatic pore size measurements from scanning electron microscopy images of porous scaffolds. J. Porous Mater. 30, 93-101 (2023).
- Abraham, M. J. et al. Gromacs: high performance molecular simulations through multi-level parallelism from laptops to supercomputers. SoftwareX 1-2, 19-25 (2015).
- Guvench, O. et al. CHARMM additive all-atom force field for carbohydrate derivatives and its utility in polysaccharide and carbohydrate- protein modeling. J. Chem. Theory Comput. 7, 3162-3180 (2011).
- Lawrence, C. P. & Skinner, J. L. Flexible TIP4P model for molecular dynamics simulation of liquid water. Chem. Phys. Lett. 372, 842-847 (2003).
- Abascal, J.L.F., Sanz, E., Fernández, R.G., Vega, C. A potential model for the study of ices and amorphous water: TIP4P/Ice. J. Chem. Phys. 122, 234511 (2005).
- Lee, H. Interactions of antifreeze proteins in TIP4P / Ice water and their dependence on force fields. PLoS ONE 07, 1-17 (2018).
- Mochizuki, K. & Molinero, V. Antifreeze glycoproteins bind reversibly to ice via hydrophobic groups. J. Am. Chem. Soc. 140, 4803-4811 (2018).
- Sosso, C. G. et al. Unravelling the origins of ice nucleation on organic crystals. Chem. Sci. 9, 8077-8088 (2018).
- Mayne, D. Q. A stochastic steepest-descent algorithm. J. Optim. Theory Appl. 59, 307-323 (1988).
- Bussi, G., Donadio, D. & Parrinello, M. Canonical sampling through velocity rescaling. J. Chem. Phys. 126, 1-7 (2007).
- Berendsen, H. J. C., Postma, J. P. M., van Gunsteren, W. F., DiNola, A. & Haak, J. R. Molecular dynamics with coupling to an external bath. J. Chem. Phys. 81, 3684-3690 (1984).
- Laio, A. & Parrinello, M. Escpaing free-energy minima. PNAS 99, 12562-12566 (2002).
- Barducci, A. & Bussi, G. Well-tempered metadynamics: a smoothly converging and tunable free- energy method. Phys. Rev. Lett. 100, 1-4 (2008).
- Tribello, G. A., Bonomi, M., Branduardi, D., Camilloni, C. & Bussi, G. PLUMED 2: new feathers for an old bird. Comput. Phys. Commun. 185, 604-613 (2014).
- Gallo, P. & Rovere, M. Relation between the two-body entropy and the relaxation time in supercooled water. Phys. Rev. E 91, 012107 (2015).
- Tiwary, P. & Parrinello, M. A time-independent free energy estimator for metadynamics. J. Phys. Chem. B 119, 736-742 (2015).
- McHugh, M. L. Multiple comparison analysis testing in ANOVA. Biochem. Med. 21, 203-209 (2011).
- Sosso, G.C. PEC_LINK. Accessed: 2025-01-08 (2024). https:// zenodo.org/records/14366068
Acknowledgements
This work has been supported by the Biotechnology and Biological Sciences Research Council (BBSRC) grant “Understanding ice formation in plants: finding new routes to freezing tolerance (Plantlce)” (BB/N015559/1). N.R. was funded by a BBSRC Doctoral Training Partnership studentship (BB/ M011186/1). P.L.J. is funded via the EPSRC CDT in Modelling of Heterogeneous Systems (HetSys, grant number EP/S022848/1). J.E.S acknowledges support from the EPSRC under grants EP/W031426/1, EP/ S029966/1 and EP/P031684/1. I.J.P., F.B. and G.C.S. gratefully acknowledge the usage of the ARCHER2 UK National Supercomputing Service (https://www.archer2.ac.uk), which we have accessed via the HecBioSim consortium (project e676), funded by the EPSRC (Grant No. EP/ X035603/1). I.J.P. and G.C.S. also gratefully acknowledge the use of SULIS, which was funded by the EPSRC (EP/T022108/1), via the HPC Midlands+ Consortium. I.P., F.B. and G.C.S. would also like to acknowledge the highperformance computing facilities provided by the Scientific Computing Research Technology Platform (SCRTP) at the University of Warwick. H.K, T.J.H. and I.O. would like to acknowledge Andrew Iskauskas for crucial/ helpful discussions on statistical analysis of SEM measurements.
Author contributions
G.C.S., H.K, T.J.H., I.O. and I.J.P. conceived the research. I.J.P., F.B. and G.C.S. performed and analysed the molecular dynamics and metadynamics simulations. P.L.J., G.C.S. and J.E.S. devised applied and analysed the fluid dynamics-based mathematical model. I.O., T.J.H., H.K. and M.W.G. devised the experimental studies. I.O. and N.R. extended the methodology and
performed the fluorescence-based porosity assays. C.K.I. developed the SEM methodology and performed, together with I.O., the EM measurements. I.O., I.J.P., P.L.J., F.B., T.J.H., J.E.S., H.K. and G.C.S. contributed to writing the manuscript.
performed the fluorescence-based porosity assays. C.K.I. developed the SEM methodology and performed, together with I.O., the EM measurements. I.O., I.J.P., P.L.J., F.B., T.J.H., J.E.S., H.K. and G.C.S. contributed to writing the manuscript.
Competing interests
The authors declare no competing interests.
Additional information
Supplementary information The online version contains supplementary material available at
https://doi.org/10.1038/s42003-025-07495-0.
https://doi.org/10.1038/s42003-025-07495-0.
Correspondence and requests for materials should be addressed to Heather Knight or Gabriele C. Sosso.
Peer review information Communications Biology thanks Duoduo Wang and the other, anonymous, reviewer(s) for their contribution to the peer review of this work. Primary Handling Editors: Kaliya Georgieva. A peer review file is available.
Reprints and permissions information is available at http://www.nature.com/reprints
Publisher’s note Springer Nature remains neutral with regard to jurisdictional claims in published maps and institutional affiliations.
Open Access This article is licensed under a Creative Commons Attribution 4.0 International License, which permits use, sharing, adaptation, distribution and reproduction in any medium or format, as long as you give appropriate credit to the original author(s) and the source, provide a link to the Creative Commons licence, and indicate if changes were made. The images or other third party material in this article are included in the article’s Creative Commons licence, unless indicated otherwise in a credit line to the material. If material is not included in the article’s Creative Commons licence and your intended use is not permitted by statutory regulation or exceeds the permitted use, you will need to obtain permission directly from the copyright holder. To view a copy of this licence, visit http://creativecommons.org/licenses/by/4.0/.
© The Author(s) 2025
© The Author(s) 2025
- ¹Department of Biosciences and Durham Centre for Crop Improvement Technology, Durham University, Durham, UK. ²Department of Chemistry, University of Warwick, Coventry, UK.
Warwick Mathematics Institute, University of Warwick, Coventry, UK. □ e-mail: p.h.knight@durham.ac.uk; g.sosso@warwick.ac.uk