قوة طويلة المدى تعتمد على الشحنة تدفع التجميع المخصص للمادة في المحلول A charge-dependent long-ranged force drives tailored assembly of matter in solution
من المتوقع عمومًا أن تعيد التفاعلات بين الأجسام المشحونة في المحلول تجسيد مبدئين مركزيين من مبادئ الكهرومغناطيسية: (1) الأجسام المشحونة بشكل مشابه تتنافر، و(2) تفعل ذلك بغض النظر عن إشارة شحنتها الكهربائية. هنا نثبت تجريبيًا أن المذيب يلعب دورًا حاسمًا لم يُرَ من قبل في التفاعلات بين الجسيمات، والأهم من ذلك، أن التفاعلات في الطور السائل يمكن أن تكسر تناظر عكس الشحنة. نوضح أنه في المحلول المائي، يمكن للجسيمات المشحونة سلبًا أن تجذب عن بُعد بينما تتنافر الجسيمات المشحونة إيجابيًا. في المذيبات التي تظهر عكسًا في ثنائي القطب الجزيئي الصافي عند واجهة، مثل الكحوليات، نجد أن العكس يمكن أن يكون صحيحًا: قد تجذب الجسيمات المشحونة إيجابيًا بينما تتنافر السلبية. تظل الملاحظات قائمة عبر مجموعة واسعة من كيمياء السطح: من السيليكا غير العضوية والجسيمات البوليمرية إلى الأسطح المغلفة بالبوليمرات الكهربائية والبوليببتيدات في المحلول المائي. نظرية التفاعلات بين الجسيمات التي تستدعي هيكلة المذيب عند واجهة تلتقط الملاحظات. دراستنا تؤسس آلية واجهية نانوية يمكن أن تؤدي من خلالها جزيئات المذيب إلى قوة قوية وطويلة المدى في المحلول، مع تداعيات فورية لمجموعة من العمليات الجزيئية والجسيمية عبر مقاييس الطول مثل التجميع الذاتي، التجلط، التبلور، تكثف الجزيئات الحيوية، التراكم، والانفصال الطوري.
التفاعل الدقيق بين الأجسام في المرحلة السائلة يؤثر على سلوك وتنظيم وخصائص الأنظمة من المقاييس النانوية إلى المقاييس الأكبر، وبالتالي يدعم ثروة من الظواهر الطبيعية. إن فهمنا وحدسنا للتفاعل بين الجسيمات المشحونة كهربائيًا في المحلول مستند إلى مبدأ مركزي من الكهرومغناطيسية الكلاسيكية الذي ينص على أن القوة بين الشحنات من نفس النوع ليست فقط طاردة عند جميع المسافات، ولكنها أيضًا متناظرة بالنسبة لإشارة الشحنة. على سبيل المثال، لأنه من المتوقع أن الأجسام المشحونة بنفس الشحنة في الفراغ تتنافر بغض النظر عما إذا كانت إشارة الشحنة التي تحملها إيجابية أو سلبية، فإن التوقع هو أن الجسيمات المشحونة بنفس الشحنة في المحلول يجب أن تتنافر أيضًا بشكل أحادي، خاصة على المدى البعيد حيث يكون جذب فان der Waals (vdW) ضعيفًا جدًا ليكون له تأثير كبير. تؤثر على التفاعل العام. هذه الرؤية هي سمة مميزة لنظرية ديرجاكين-لاندو-فيروي-أوفر بيك (DLVO)، وهي حجر الزاوية في علم المستحلبات..
ومع ذلك، توجد استثناءات واضحة ومبنية على أسس قوية للقواعد في وجود الأيونات متعددة التكافؤ.وبشكل خاص الأنظمة التي تتضمن كميات كبيرة من الشحنة الكهربائية وفي وسائط ذات ثابت عازل منخفضلكن على مر العقود، كانت هناك تقارير متسقة عن الجذب بين الجسيمات ذات الشحنات المماثلة من مقاييس النانومتر إلى الميكرومتر، على سبيل المثال، الأحماض النووية، والليبوزومات، والبوليمرات، والجسيمات الغروية في الوسائط المائية التي تحتوي على تركيزات منخفضة من الملح أحادي التكافؤ – حيث من المتوقع أن تكون نظرية DLVO سارية – قد أفلتت من التفسير.ليس من المستغرب أن هذا التباين المستمر بين التجربة والنظرية قد حظي باهتمام كبير في الأدبيات النظرية..
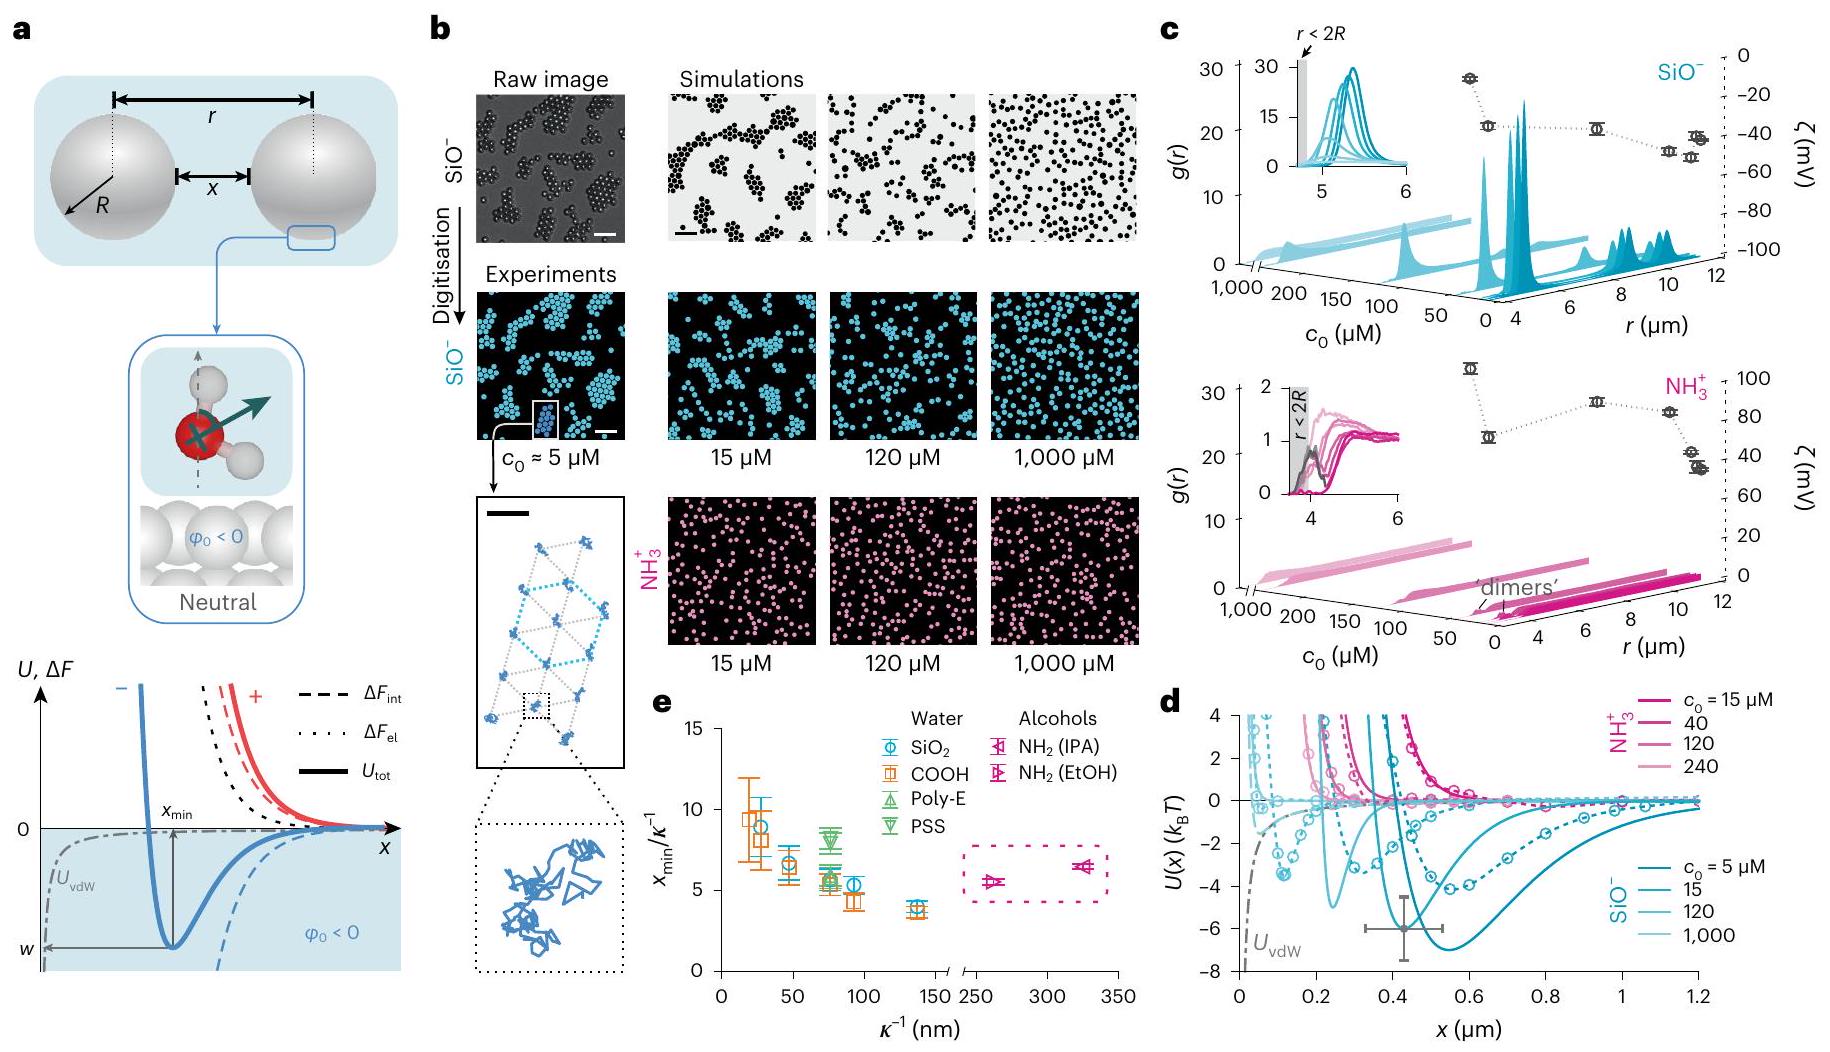
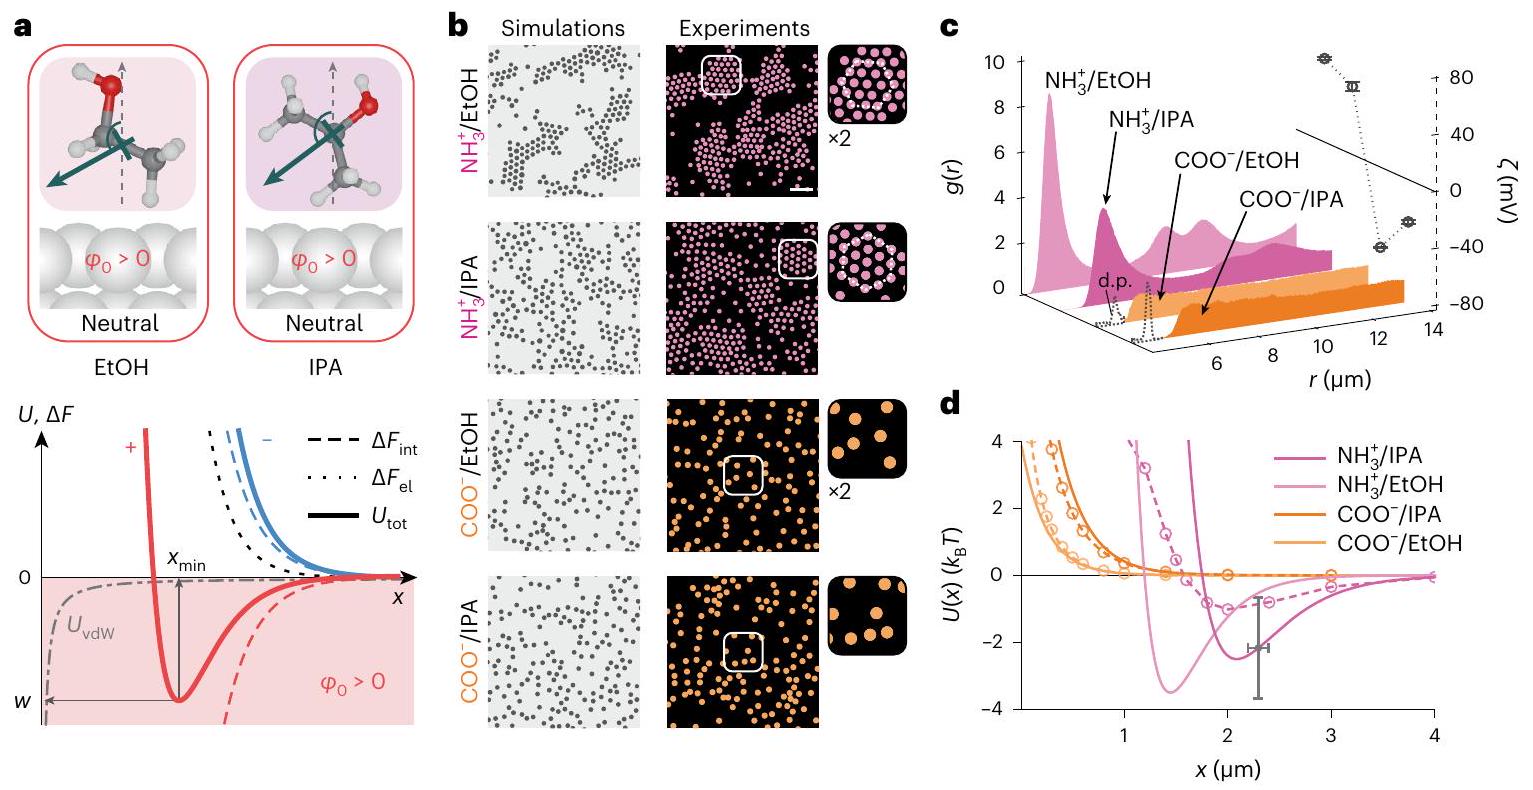
الشكل 1 | يمكن أن تكسر التفاعلات بين الجسيمات في المحلول تناظر عكس الشحنة. أ، تمثيلات تخطيطية لكرتين متفاعلتين (أعلى)، وللاتجاه السائد المتوسط لجزيئات الماء بالقرب من سطح غير مشحون (وسط). أسفل: مساهمات مختلفة في إجمالي طاقة التفاعل الحرة للجسيمات المشحونة إيجابياً (الخطوط الحمراء) والمشحونة سلبياً (الخطوط الزرقاء): النفور الكهروستاتيكي، (خط متقطع أسود؛ ينطبق على كلا علامتي الشحنة)؛ مساهمة الاستحلاب الواجهية، يعتمد على إشارة الشحنة (الخطوط المتقطعة)؛ الطاقة الكلية للتفاعل، (الخطوط الصلبة)؛ ومساهمة vdW، (خط رمادي منقط؛ ينطبق على الحالتين). لـ (على سبيل المثال، في الماء) قد تظهر الجسيمات المشحونة سلبياً حد أدنى في من العمقفي حالة انفصال (خط أزرق صلب)، والجسيمات المشحونة إيجابياً تتنافر بشكل متزايد (خط أحمر صلب) (المعلومات التكميلية، القسم 3.1). جزيئات السيليكا المشحونة سلبياًدوائر زرقاء،تشكل تجمعات hcp في الماء اعتمادًا على تركيز الملح، (الصف الأوسط). قضبان القياس، . في الزاوية السفلى اليسرى: مسارات الجسيمات في مجموعة واحدة على مدى فترة 30 ثانية. شريط القياس، جزيئات السيليكا الأمينية المشحونة إيجابياً (دوائر وردية،في الماء لا تشكل تجمعات بغض النظر عن (الصف السفلي). الصور التي تم الحصول عليها باستخدام المجهر الضوئي الساطع (الأشكال التكميلية 3 و 25) ورقمت لتسهيل العرض. لقطات محاكاة BD لـ تفاعلات الجسيمات (الأعلى). ج، دوال كثافة الاحتمال الشعاعي المقاسة،، من أجل (الأعلى) و الجسيمات (أسفل)، بما في ذلك قياسات الجهد زتا (; رموز دائرية) لتغييرتوضح أشرطة الخطأس.د لثلاث قياسات. الإضافات: الذروة الصغيرة حوليعكس جزيئات ‘دايمر’ في العينة. د، تم استنتاج إمكانيات التفاعل الزوجي، (خطوط صلبة)، لـ (أزرق) و جزيئات (وردية). محسوبةالمنحنيات كما هو موضح في المرجع 27 والمعلومات التكميلية، الأقسام 3.2 و3.3 (خطوط منقطة مع رموز؛ انظر الجدول التكميلية 1 لقيم المعلمات). تشير أشرطة الخطأ إلى عدم اليقين المقدر لـعلى قطر الجسيمفي (الشكل التوضيحي التكميلي 18). e، رسم بياني لـ ضد لجزيئات سلبية مختلفة في الماء وجزيئات إيجابية في الكحول تظهر أن (الشكل 5). تمثل أشرطة الخطأ عدم اليقين في في، متوسطًا على جميع أنواع الجسيمات.
تستند النظريات الحالية إلى وصف مستمر للمذيب يتجاهل التفاصيل الدقيقة مثل الطبيعة الجزيئية للمذيب، وهيكله وتفاعلاته، خاصة عند الواجهة مع جزيء أو جزيئات.على الرغم من النجاح العام لنظريات الحقل المتوسط الكلاسيكية، والنظريات المستمرةيبدو من الواضح بشكل متزايد أن الطبيعة الجزيئية للماء يجب أن تلعب دورًا حاسمًا في مجموعة من الظواهر السطحية في المرحلة المائية.لقد اقترحنا مؤخرًا أن سلوك المذيب الجزيئي عند واجهة ما يمكن أن يسهم بشكل كبير في الطاقة الحرة للتفاعل الكلية بين جسمين يقتربان ويحملان شحنة كهربائية. (الشكل 1أ). على وجه الخصوص، بالنسبة للمادة المشحونة في الماء، اقترح نموذجنا أن هذه المساهمة يمكن أن تكون كبيرة بما يكفي ليس فقط لمواجهة التنافر الكهروستاتيكي بين الجسيمات، بل يمكن أن تتجاوز ذلك، مما يغير إشارة القوة بين الجسيمات للجسيمات المشحونة سلبًا، مما يجعلها جذابة بشكل صافي. يمكن بالتالي اعتبار السلوك الاتجاهي للمذيب الواجهاتي كمخزن للطاقة الحرة التي يمكن استغلالها من خلال التفاعل بين الجسيمات، حتى عند المسافات الكبيرة (الشكل 1أ). كما اقترحنا أن هذه المساهمة من الطاقة الحرة الواجهاتية تؤدي إلى قوة يمكن أن تُعطى إشارتها وحجمها من حيث جهد كهربائي واجهاتي، ، ذلك يعتمد على طبيعة المذيب، معللماء عند واجهة (المراجع 27-29) (الشكل 1أ؛ انظر المعلومات التكميلية، القسم 3.1 للحصول على التفاصيل).
الاتجاهات التجريبية الرئيسية التي اقترحها نموذج الذوبان الواجهاتي هي: (1) كسر تناظر عكس الشحنة في التفاعلات بين الجسيمات، على سبيل المثال، قد تجذب الجسيمات المشحونة سلبًا في الماء، بينما تدفع الجسيمات الموجبة؛ (2) قد يؤدي استخدام مذيب مختلف إلى عكس هذا الاتجاه، أي أن الجسيمات الموجبة قد تجذب بينما تدفع السلبية؛ و(3) يجب أن تعتمد شدة مساهمة الذوبان في التفاعل بين الجسيمات بشكل كبير على درجة الحموضة في المحلول. هنا نبلغ عن اختبارات تجريبية شاملة لمساهمة المذيب الواجهاتي في التفاعلات بعيدة المدى في المحلول. نحن نثبت أن المذيب يمكن أن يقدم مساهمة كبيرة في التفاعل بين الجسيمات ويمكن أن يقود بشكل غير بديهي إلى تشكيل عفوي لترتيبات منظمة من الجسيمات المتشابهة الشحنة في المحلول. علاوة على ذلك، يمكن أن يكون لكل من إشارة وحجم هذه المساهمة في الطاقة الحرة تأثير حاسم على قدرة نظام الجسيمات على التجميع الذاتي، ومن المهم أن نوضح أنه يمكن ضبطهما بعناية باستخدام مجموعة متنوعة من المعلمات المعتمدة على الجسيمات والمحلول.
قياس التفاعلات بين الجسيمات في تعليق ثنائي الأبعاد
قمنا بإجراء مجموعة من التجارب على التعليق الثنائي الأبعاد (2D) للجزيئات الغروية في المحلول ودرسنا اعتماد التفاعل بين الجزيئات على خصائص النظام مثل الرقم الهيدروجيني وقوة الأيونات في الإلكتروليت، وشحنة الجزيئات وكيميائها، وعلى التركيب الجزيئي للمذيب. لاحظنا التركيب المكاني للتعليق باستخدام المجهر الضوئي في مجال الضوء الساطع (المعلومات التكميلية، القسم 1.5 والشكل التكميلية 3) وقمنا ببناء توزيعات كثافة الاحتمال الشعاعي.من الإحداثيات المكانية للجسيمات في سلسلة من الصور. لاستنتاج شكل التفاعل بين الجسيمات الأساسية، قمنا بإجراء محاكاة الديناميات البراونية (BD) لتفاعلات الجسيمات مع إمكانيات إدخال متنوعة،، مع افتراض الإضافة الزوجية للتفاعلات، وتم توليد محاكاة الوظائف (المعلومات التكميلية، الأقسام 2.1 و 3.4). هنا، يمثل الفصل بين الجسيمات بين الكرات ذات نصف القطر، عند فصل بين السطوح (الشكل 1أ). سمح لنا عملية تكرارية بتحديد إمكانيات الزوج التي كانت متسقة نوعياً مع البيانات التجريبية (الشكل 1ب، الصف العلوي؛ الأشكال التكميلية 18-24 والجداول التكميلية 2-12). كما قمنا بمقارنة هذه الإمكانيات المستنتجة تجريبياً مع إجمالي طاقة التفاعل الحرة، ، تم حسابه لزوج من الجسيمات المتطابقة باستخدام نموذج الترطيب السطحي (خطوط منقطة مع رموز في الأشكال 1 و 2 و 5، انظر المعلومات التكميلية، الأقسام 3.2 و 3.3). كما هو موضح في معادلات المعلومات التكميلية (5)-(9)، فإن تغيير قيمة في النموذج النظري قد يؤدي إلى حسابهذا مثير للاشمئزاز بحت، جذاب بحت، أو دالة غير أحادية تظهر حد أدنى من العمقعند فصل بين السطوحقيم المعلمات لجميع المنحنيات المحسوبة في هذه الدراسة موضحة في الجدول التكميلي 1.
الجزيئات السلبية تجذب والجزيئات الإيجابية تنفر في الماء
قمنا أولاً بفحص نظام من جزيئات السيليكا الغروية بقطر اسميموزعة في الماء المنزوع الأيونات مع تقدير لقوة الأيونات الخلفية لـالجهد الكهربائي المقاس (جهد زيتا) في محيط سطح الجسيم،يشير إلى شحنة سطحية سلبية قوية ناتجة عن كثافة عالية من مجموعات السيلانول السطحية المؤينة. تتنبأ نظرية DLVO بوجود تنافر قوي بين الجسيمات في هذه الظروف، مما يعني ملاحظة توزيع عشوائي للجسيمات في شكل ثنائي الأبعاد. وبخلاف هذا التوقع البديهي، لاحظنا أن الجسيمات تجمعت تلقائيًا في مجموعات مستقرة، تعيد تنظيم نفسها ببطء، ومعبأة بشكل قريب سداسي (hcp) تتميز بفصل بين السطوح من حيث ، تشارك أوجه التشابه مع التقارير السابقة (الشكل 1ب، الألواح الوسطى، والفيديو التكميلي 1). هناهو طول ديباي الذي يقيس معدل التناقص المكاني لشدة التفاعلات الكهروستاتيكية، وفي محلول من الأيونات أحادية التكافؤ يمكن التعبير عنه بالنانو متر بواسطة، مع في M. الهيكل المكاني للتجمعات، ووجود فراغات كبيرة بين التجمعات، يوحي بوجود تفاعل جذبي قوي وطويل المدى بين الجسيمات ذات الشحنة المماثلة. يتم تعويض هذا الجذب بواسطة تنافر على مدى أقصر، مما يؤدي إلى ظهور حد أدنى مستقر لإمكانات الزوج عند مسافات كبيرة نسبياً.المقاستظهر الملفات قمم دورية ذات ارتفاع متناقص، تعكس الهيكل الداخلي المنظم للتجمعات ذات الحجم المحدود – وهي توقيع مميز للتفاعلات الجذابة بين الجزيئات في المحلول (الشكل 1c، اللوحة العلوية). تحاكي التفاعلات بين الجزيئات (لقطات في الشكل 1b، الصف العلوي) واتفق مع المحسوبالمنحنيات التي تلتقط كل من الموقع المستنتج تجريبياً للنقاط الدنيا،، وعمقها، (الشكل 1 د (معلومات إضافية، القسم 3.2). هنا هو ثابت بولتزمان و هو درجة الحرارة المطلقة. التجارب التي أجريت لـ على السيليكا المشحونة سلبًا والجزيئات المكلورة أظهرت اتجاهات مشابهة.
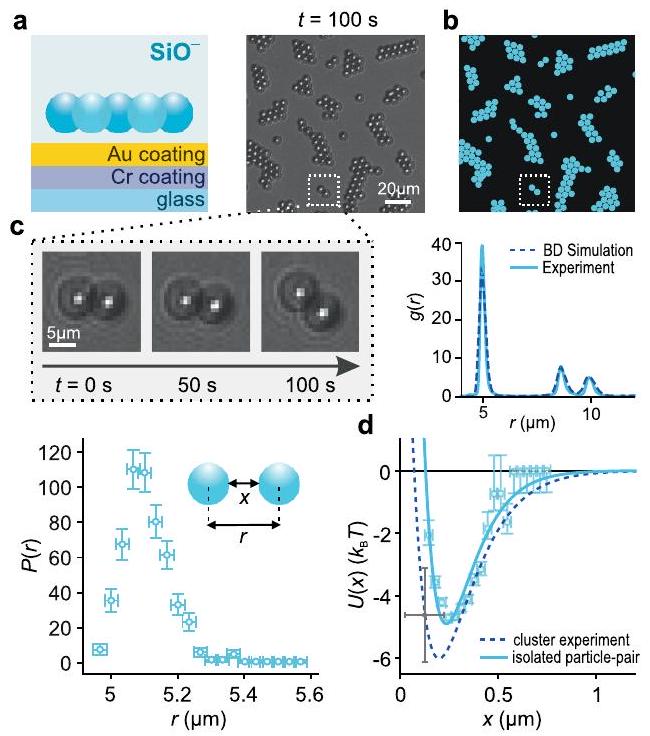
تظهر إمكانيات التفاعل المقاسة لزوجين معزولين من الجسيمات المتفاعلة توافقًا جيدًا مع و القيم المستنتجة من تجارب المجموعة (الشكل البياني الإضافي 1a-d، الشكل البياني التكميلية 12 والمعلومات التكميلية، القسم 4.2). هذا يؤكد أن تشكيل الكتل الملحوظ ينشأ من جهد زوجي يحمل بالفعل مكونًا جذابًا كبيرًا، بدلاً من التفاعلات الجماعية في نظام من الجسيمات الطاردة فقط.. علاوة على ذلك، وبخلاف الاقتراحات السابقة المتعلقة بجذب الشحنات المتشابهة، نجد أن الجذب بعيد المدى غير متأثر بخصائص السطح للزجاج المغطي الأساسي. (الشكل 1a-d من البيانات الموسعة والمعلومات التكميلية، القسم 4.4) الذي يتفق مع القياسات السابقة للتفاعلات الجذابة بين الأزواج في المحلول الكثيف ومع التوقعات النظرية من نموذج الترطيب السطحي لاحظ أن عيوب معالجة الصور البصرية لا تلعب أي دور في قياساتنا لحدود التفاعل الثنائي. (الشكل 1e-h من البيانات الموسعة، والمعلومات التكميلية، القسم 4.3).
عند الانتقال إلى التجارب على جزيئات السيليكا الأمينية الموجبة الشحنة تحت نفس الظروف، وجدنا أن الجزيئات ظلت موزعة عشوائيًا في المحلول كما هو متوقع لتفاعل بين الجزيئات يعتمد فقط على التنافر (الشكل 1ب، الصف الأدنى والفيديو التكميلي 1). تم قياس كانت الملفات الشخصية خالية نسبيًا من الملامح، ويفتقر بشكل قاطع إلى الهيكل الدوري المميز للتجمعات المنظمة (الشكل 1c، اللوحة السفلية). المعنية تشير الملفات إلى تناقص متزايد في النفور بما يتماشى جيدًا مع الملفات المحسوبة من نموذج الترطيب الواجهاتي (الشكل 1d). الغياب الملحوظ لحد أدنى بعيد المدى فيإن الجاذبية الضعيفة للجسيمات الموجبة تتناقض مع الجاذبية القوية الملحوظة للجسيمات السالبة، وتقترح أن المذيب هو المسؤول عن هذا الانحراف النوعي الملحوظ عن توقع تناظر عكس الشحنة في التفاعلات بين الجسيمات.
تحكم درجة الحموضة في حجم القوة بعيدة المدى
بعد ذلك استكشفنا تأثير الرقم الهيدروجيني على التفاعل بين جزيئات السيليكا. تحمل أسطح السيليكا مجموعة متنوعة من مجموعات السيلانول القابلة للتأين التي تتميز بكثافات عددية مختلفة وقيم بين 2 و 11 مما يعني نطاق واسع من الرقم الهيدروجيني الذي قد تخضع فيه المجموعات القابلة للتأين على السطح لتغيير فيمدى تأينهاقمنا بدراسة تشكيل الكتل في السيليكا عند قوة أيونية ثابتة مع تغير الرقم الهيدروجيني من 4 إلى 10 واستنتجنا القيمة لـفي كل حالة. بينمايشير إلى عمق الحد الأدنى في جاذبية زوج الجهد، نأخذلزوجة جاذبية نقية. بالنسبة للسليكا، وجدنا أنه على الرغم من أن حجمانخفض بشكل ملحوظ مع زيادة الرقم الهيدروجيني، لكنه ظل كبيرًا.حتى عند ارتفاع (الشكل 2d والفيديو التكميلي 2). يحدث هذا على الرغم من أن التفاعل الكهروستاتيكي، من المتوقع أن تنمو في الحجم مع زيادة الرقم الهيدروجيني، مما يعاكس تدريجياً مساهمة الواجهة الجذابة التي نتوقع أن تضعف في الوقت نفسه كما. هناتشير إلى الجهد الكهربائي السطحي للجسيم (انظر المعلومات التكميلية، القسم 3.1 للتفاصيل). من المهم أننا وجدنا أن الملاحظات يمكن تفسيرها نوعياً ضمن نموذج الترطيب الواجهاتي (الشكل 2a، d، الألواح العلوية، المعلومات التكميلية، القسم 3.5 والفيديو التكميلية 2).
لاستكشاف تأثير الرقم الهيدروجيني بشكل كمي، قمنا بدراسة سلوك جزيئات راتنج الميلاتونين الكربوكسيلي (COOH) حيث تنشأ الشحنة من مجموعات الكربوكسيل المميزة بـلقد لاحظنا حدًا أقصى واضحًافي نطاق، في توافق نوعي مع الاتجاه المتوقع لـكما هو موضح في المعادلة (9) من المعلومات التكميلية والمناقشة بشكل أعمق في المعلومات التكميلية (الشكل 2أ، د، اللوحات الوسطى، المعلومات التكميلية، القسم 3.5 والفيديو التكميلية 3).
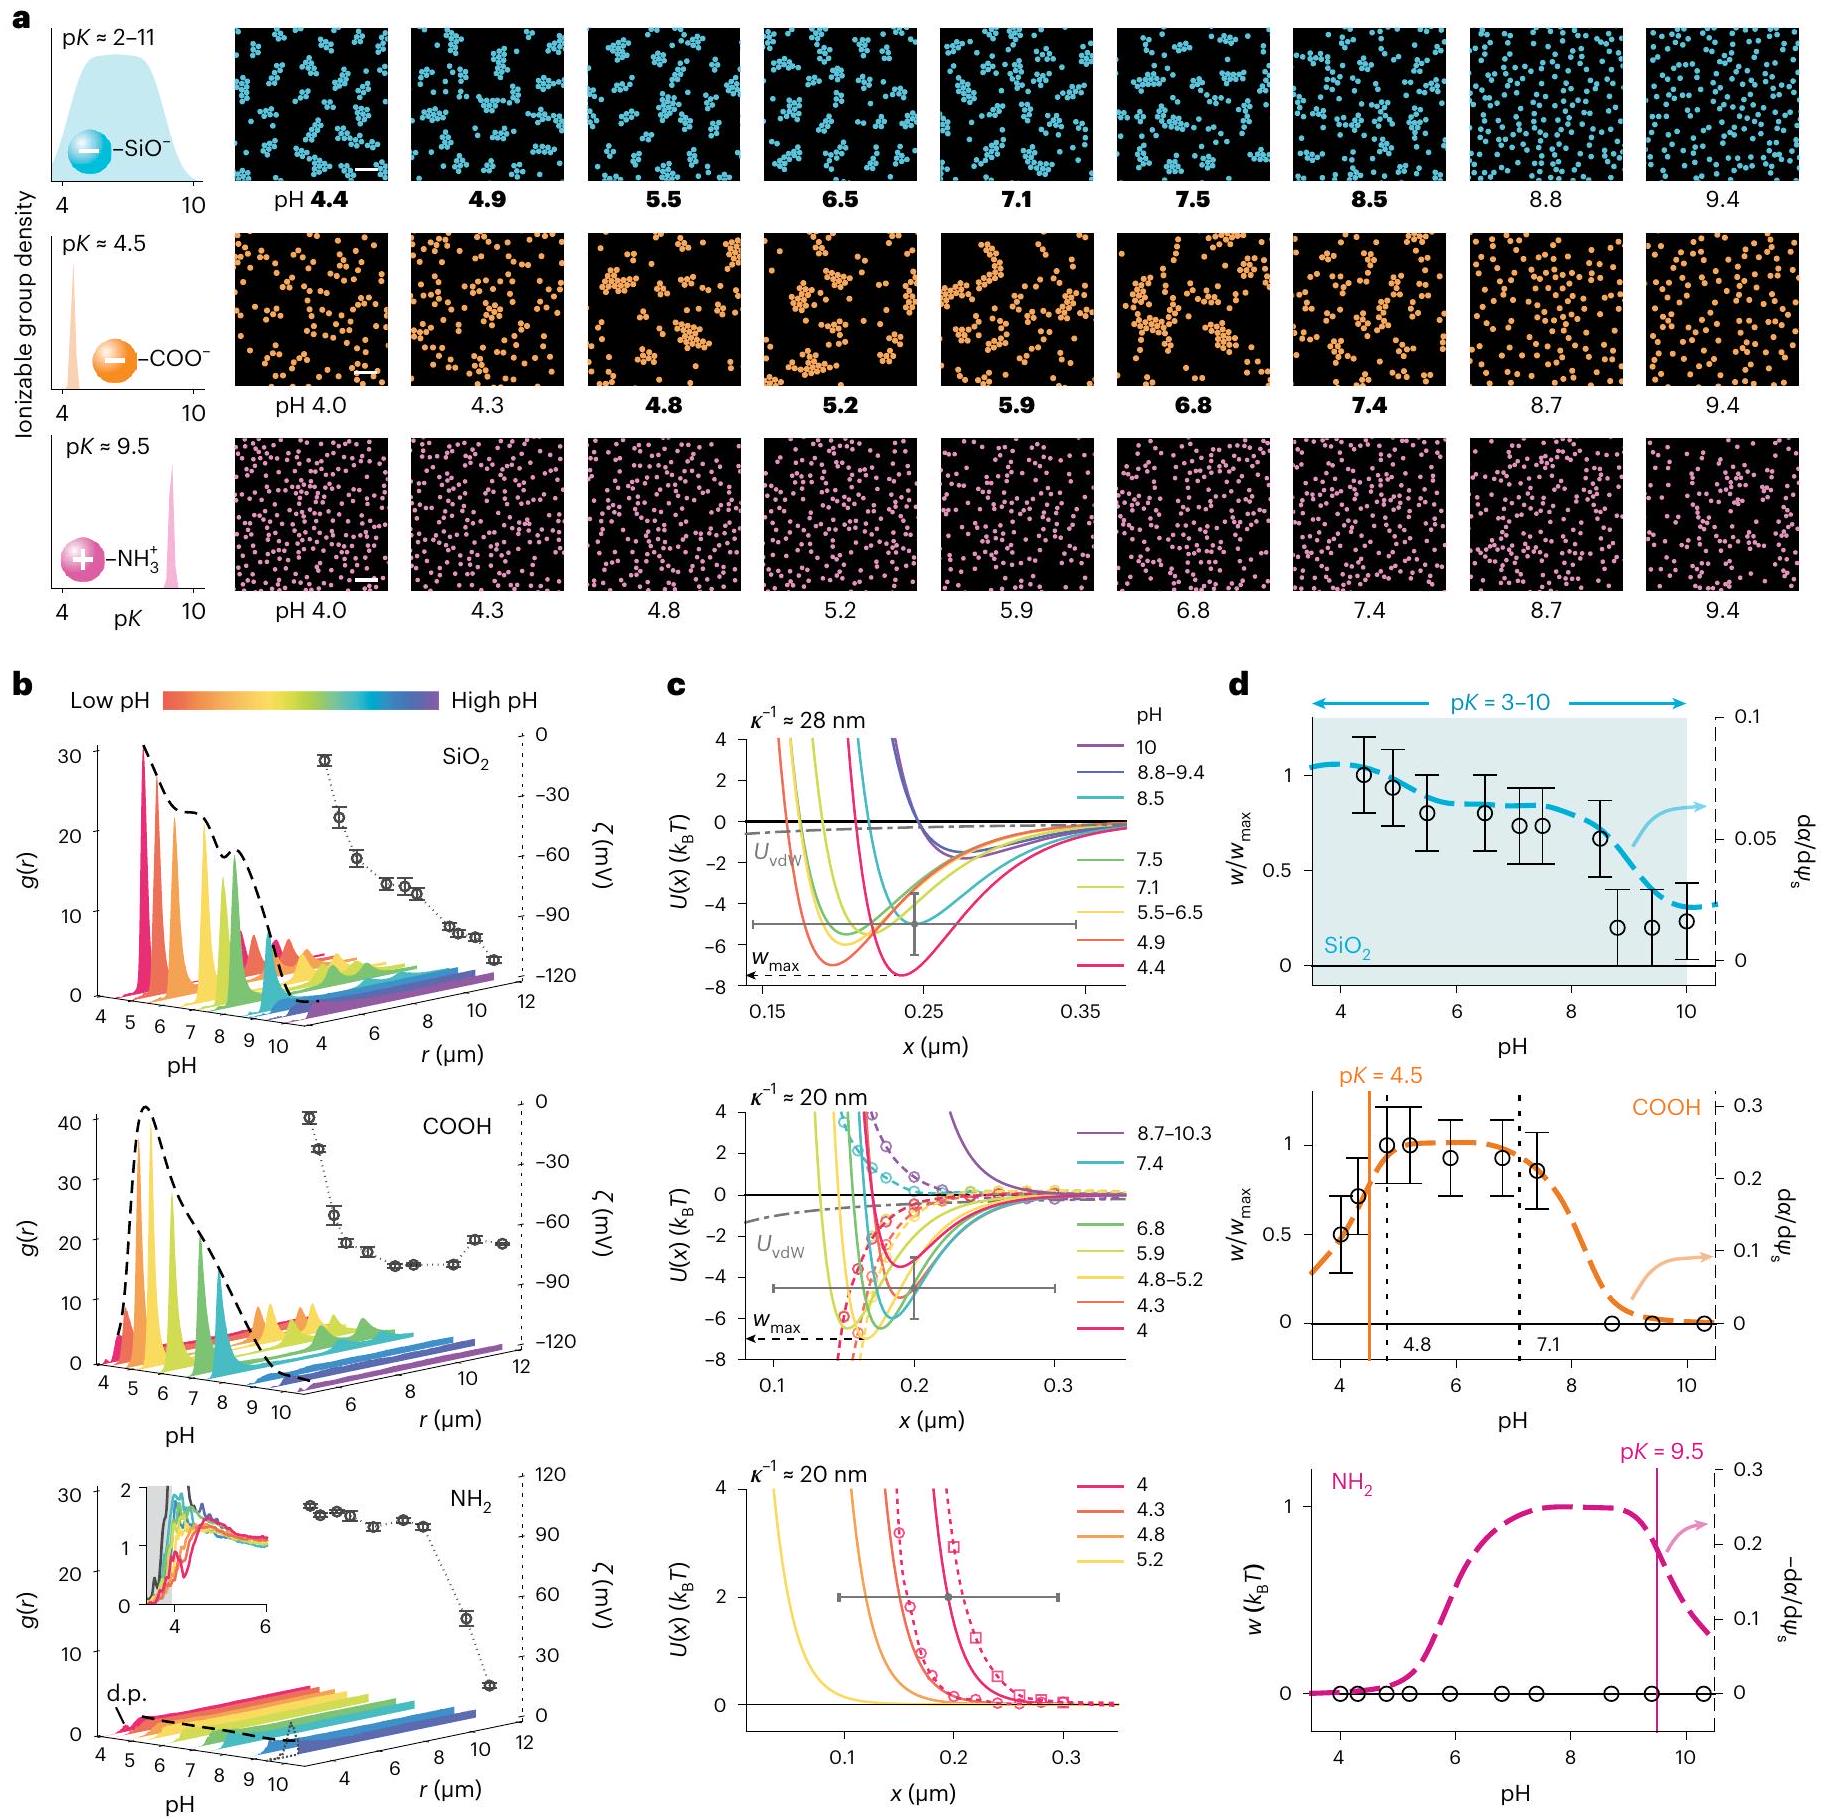
الشكل 2 | ضبط التفاعل بين الجسيمات باستخدامفي الحل. لقطات هيكل التعليق الغروي كدالة لـ pH لجزيئات السيليكا (الأعلى)، وجزيئات الحمض الكربوكسيلي (الوسط)، وجزيئات السيليكا الأمينية (الأسفل)، مع الحفاظ على تركيز الملح ثابتًا في كل سلسلة بيانات: و شريط القياس،تشير القيم بالخط العريض إلى الرقم الهيدروجيني الذي يتم عنده ملاحظة تكوين تجمعات hcp.دوال كثافة الاحتمال الشعاعية (المنحنيات) وقياس زيتاالجهود (الرموز) كدالة لـ pH لجميع أنواع الجسيمات الثلاثة. تمثل أشرطة الخطأ المتوسطالانحراف المعياري من ثلاث قياسات. الارتفاع المتزايد لقمة الديمر (d.p.) مع زيادة الرقم الهيدروجيني للجزيئات الإيجابية يدل على زيادة التصاق الجزيئات بسبب تفريغ المجموعات الأيونية الأساسية القابلة للتأين (اللوحة السفلية). ج،الملفات الشخصية مستنتج من القياساتالملفات (الخطوط الصلبة؛ الأشكال التكميلية 20-22 والجداول التكميلية 4-8)، النظريةالمنحنيات (الخطوط المتقطعة مع الرموز) تم حسابها كما هو موضح في المرجع 27 والمعلومات التكميلية، الأقسام 3.2 و3.3 (انظر الجدول التكميلية 1 لقيم المعلمات)، ومساهمة للمقارنة (خط رمادي متقطع ومخطط). تشير إلى الحد الأقصى للعمق المستنتج للحد الأدنى الملحوظ تجريبيًا في كل حالة. تشير أشرطة الخطأ إلى عدم اليقين المقدر لـ في قطر الجسيمات وفي (الأشكال التكميلية 20-22). د، مخططات تقارن الاتجاهات كدالة لـ pH في الكمية المستنتجة تجريبياً (الرموز، المحور الأيسر) مع ذلك من تم تحديده باستخدام معادلة المعلومات التكميلية (9) (المنحنيات المتقطعة، المحور الأيمن). انظر الشكل التكميلية 25 لجميع بيانات الصور الخام.
بعد ذلك، قمنا بدراسة سلوك جزيئات السيليكا الأمينية المشحونة إيجابيًا والتي تحمل كثافة عالية من مجموعات الأمين. ) من الاسمي لم نلاحظ تشكيل تجمعات في الجسيمات الإيجابية. على مدى نطاق pH بالكامل (الشكل 2 أ، اللوحة السفلية والفيديو التكميلي 4). في الواقع،تعكس المنحنيات قوى التنافر بين الجسيمات القوية عند المسافات الكبيرة التي كانت الأقوى عند القيم المنخفضة لـ (الشكل 2ب،
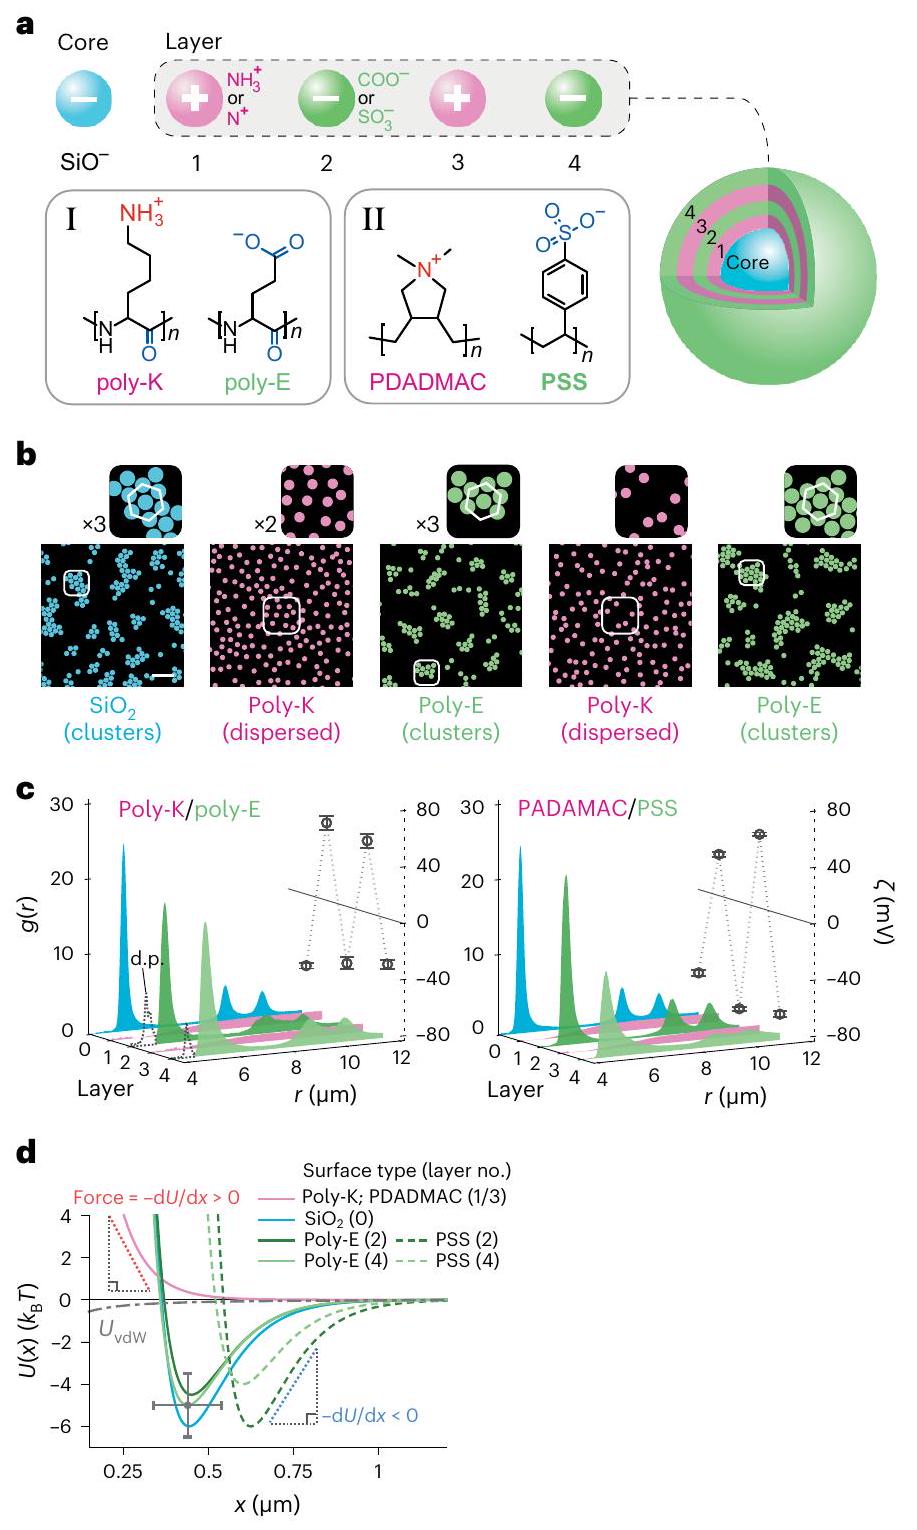
الشكل 3 | تعتمد إشارة القوة بعيدة المدى على إشارة شحنة الجسيمات المتفاعلة. أ، أعلى: تصوير تخطيطي لجسيم سيليكا مغطى بشكل متسلسل يعرض أربع طبقات متسلسلة مع إشارة متناوبة لشحنة الطلاء. أسفل: الهياكل الكيميائية للبولي ببتيدات المشحونة (بولي-ك وبولي-إي) والبوليمرات الكهربائية (PDADMAC وPSS) المستخدمة في الطلاء طبقة تلو الأخرى لجسيمات السيليكا. ب، صور لهيكل تعليق الجسيمات بعد كل إجراء طلاء باستخدام البولي ببتيدات المشحونة. مقياس الرسم،. انظر الأشكال التكميلية 23 و 25 لبيانات البوليمرات الكهربائية، بما في ذلك طلاءات PEI/PSS، والصور الخام. ج، دوال كثافة الاحتمال الشعاعيوقيس الجهد الزتاوي كدالة لعدد الطلاء أو الطبقة لطلاءات البوليببتيد (يسار) وطلاءات البوليمر الكهربائي (يمين). تمثل أشرطة الخطأ المتوسطس.د. من ثلاث قياسات. تؤكد الإشارة المتناوبة لقيم جهد زيتا لكل طبقة طلاء جديدة تغيير إشارة شحنة الجسيم. د،الملفات المستنتجة من القياساتملفات تعريف للجسيمات ذات الشحنات الموجبة (المنحنى الوردي) والطلاءات ذات الشحنات السالبة (المنحنيات الزرقاء والخضراء) مع أرقام الطبقات بين قوسين (الشكل التكميلي 23 والجداول التكملية 9-11). على المدى الطويل (الجزئيات المشحونة سلبياً (كثافة الشحنة ) تظهر جاذبية تشير إلى أن القوة بين الجسيمات جذابة، أي، بينما العكس صحيح بالنسبة للجسيمات المشحونة إيجابيًا ) حيث نستنتج لكل الانفصالات، التي تتفق نوعياً مع نظرية DLVO. تم إجراء جميع التجارب فيتوضح أشرطة الخطأ الشكوك المقدرة لـفي قطر الجسيمفي (الشكل التوضيحي 23). اللوحة السفلية). تحت ظروف أكثر قلوية التي يوفرها، الشحنة الصافية على الجسيمات تنخفض بسبب إزالة البروتونات تدريجياً من مجموعات الأمين. يرتبط هذا التفريغ لمجموعات الأمين بتقليل الجهد الزتاوي المقاس وضعف التنافر بين الجسيمات (الشكل 2ب، اللوحة السفلية)، لكن لم يتم ملاحظة تكوين تجمعات مستقرة ومنظمة أبداً (الشكل 2أ-ج). هذه النطاق من قيم الرقم الهيدروجيني (يمكن مقارنتها مع نطاق pH المعادل من 5-7 لجزيئات الكربوكسيل حيث لاحظنا في الواقع أكثر الكتل استقرارًا التي تتميز بأعمق القيم الدنيا في طاقة التفاعل (الأكبر ) الناتج عن القوة الجذابة بعيدة المدى. حصلنا على نتائج مماثلة لجزيئات السيليكا المغلفة بالبوليمرات الكهربية الموجبة مثل بولي إيثيلين إيمين (PEI) (الشكل التكميلي 16). وبالتالي نجد أن الاعتماد المقاس على الرقم الهيدروجيني للتفاعلات بين الجزيئات – لكلا شحنتي الجزيئات ومجموعة من الكيميائيات السطحية – يحمل توقيعات رئيسية لمساهمة الطاقة الحرة في الإذابة، مما يوفر تحققًا حاسمًا لآلية تفاعل تستدعي هيكلة المذيب المعتمدة على الشحنة عند واجهة الصلب والسائل.
التبديل المتسلسل بين الجذب والنبذ
للتعمق أكثر في تأثير الكيمياء السطحية على التفاعل بين الجسيمات، قمنا بدراسة سلوك أسطح بولي ستيرين سلفونات (PSS) السالبة الشحنة. تعتبر مجموعات حمض الستيرين السلفوني المعزولة شديدة الحموضة في المحلول الحر. ) ولكن من المتوقع أن تتميز بـ في سياق العمود الفقري للبلمرقمنا بإنتاج جزيئات السيليكا المغلفة بـ PSS باستخدام طريقة ترسيب فيلم البوليمر الكهربائي طبقة تلو الأخرى.. قمنا أولاً بتغطية جزيئات السيليكا بطبقة من بوليمر كلوريد بولي (داياليل ديميثيل أمونيوم) (PDADMAC) الموجب الشحنة، مما غير إشارة جهد زتا من إلىلم تعد جزيئات السيليكا المغلفة بـ PDADMAC تشكل تجمعات في المحلول (الشكل 3). ثم قمنا بتغليف جزيئات السيليكا المغلفة بـ PDADMAC بطبقة من PSS، مما غير الجهد الزتاوي من حوالي +40 مللي فولت إلى -70 مللي فولت. وجدنا أن نظام الجزيئات المغلفة بـ PSS شكل تجمعات مستقرة في المحلول عند، مما يشير إلى إعادة ظهور الجاذبية بين الجسيمات على مسافات طويلة، مشابهة لجسيمات السيليكا غير المطلية. ثم قمنا بتغطية هذه الجسيمات PSS بشكل متسلسل بطبقات متناوبة من PDADMAC و PSS، مؤكدين على إشارة شحنة الجسيم بعد كل إجراء طلاء باستخدام قياسات الجهد الزتاوي. وجدنا باستمرار أن الجاذبية بين الجسيمات على مسافات طويلة يمكن تشغيلها وإيقافها اعتمادًا على إشارة شحنة الطلاء السطحي الأحدث. تم تقديم بيانات من أربع طبقات من الطلاء المتسلسل في الشكل 3 (فيديو تكميلي 5). تم الحصول على نتائج مماثلة مع الطلاءات المتناوبة من PEI الموجب الشحنة و PSS السالب الشحنة (الأشكال التكميلية 23 و 25). تم إجراء جميع تجارب طلاء البوليمرات الكهربية في (الشكل 3 والشكل التكميلي 23).
للاستمرار في استكشاف عمومية ظاهرة ‘التجمع الذاتي للشحنات المماثلة’ ، وجهنا انتباهنا إلى فحص تفاعلات الطلاءات السطحية للبولي ببتيد على جزيئات السيليكا. يتم استخدام بولي-ليسين هيدروبروميد (بولي-K) وبولي-جلوتاميك أسيد صوديوم (بولي-E) بشكل روتيني كطلاءات سطحية، مما ينتج عنه أسطح مشحونة إيجابياً وسلبياً بسبب مجموعات السلسلة الجانبية الأمينية ( ) والكربوكسيلية ( ) المؤينة، على التوالي. هنا مرة أخرى وجدنا أنه بينما كانت الأسطح المشحونة إيجابياً تدفع كما هو متوقع (مشابهة للجزيئات المطلية بـ PEI و PDADMAC)، أظهرت أسطح بولي-E جاذبات بعيدة المدى مشابهة لجزيئاتنا الكربوكسيلية (الشكل 3d). مرة أخرى تمكنا من التناوب بشكل متكرر بين الجاذبات والدفع في تعليق الجزيئات عن طريق طلاء الجزيئات بشكل متسلسل بطبقات من بولي-K وبولي-E، وهو اكتشاف يحمل دلالات قوية لتفاعلات البروتينات.
تظهر التجارب أعلاه أن الأسطح السيليكا المشحونة سلبياً ( )، وجزيئات راتنج الميلاتين الكربوكسيلية ( )، و
البولي ستيرين سلفونات ( ) والأسطح المطلية بالبولي جلوتامات ( ) المعلقة في الماء تدعم جاذبات بين الجزيئات بعيدة المدى عندما يكون الرقم الهيدروجيني للمحلول ضمن نطاق حوالي 3 وحدات فوق لمجموعات الشحن المؤينة. بالمقابل، تظهر الجزيئات المشحونة إيجابياً دفعاً قوياً بغض النظر عن كيمياء السطح، ولا توجد أدلة على جاذب بعيد المدى على مدى كامل الرقم الهيدروجيني المختبر.
‘المنطق الكيميائي’ في تشكيل الكتل
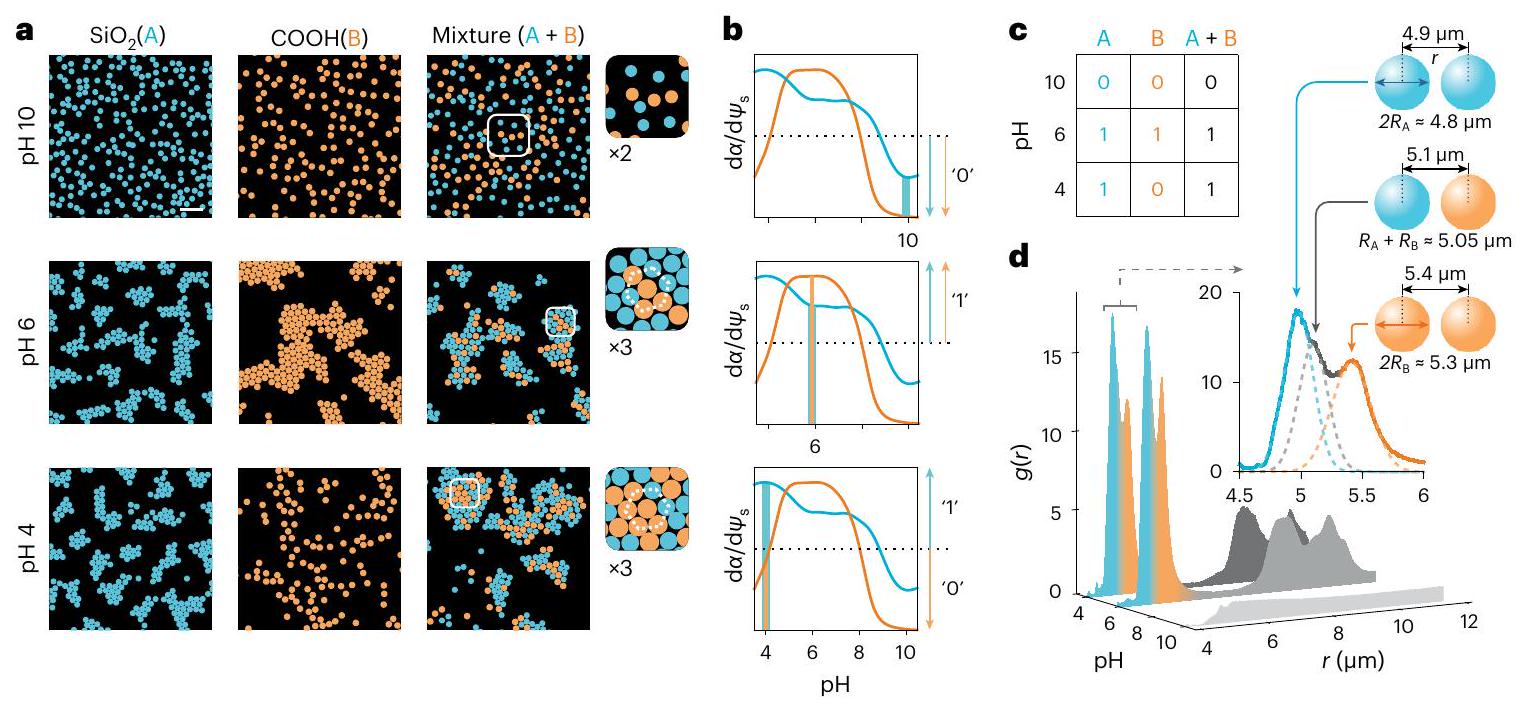
بعد ذلك، أجرينا تجارب على خلطات من الجزيئات ذات الكيمياء السطحية المختلفة ولاحظنا طبيعة البلورات المتكونة. لم تظهر التعليقات التي تحتوي على جزيئات COOH و أي تشكيل للكتل عند قيم الرقم الهيدروجيني العالية، مشابهة لكل من الأنواع النقية، كما هو متوقع (الشكل 4a، الأعلى). عند قيم الرقم الهيدروجيني حيث يُعرف أن كل نوع يشكل كتل في الحالة النقية (الشكل 2)، وجدنا أن الخلطة شكلت أيضاً كتل hcp تتكون من كلا النوعين من الجزيئات مع توقيعات في تعكس كلا من أحجام الجزيئات (الشكل 4a، الوسط والشكل 4d). ثم أجرينا تجارب عند حيث لا تشكل جزيئات COOH النقية كتل، ولكن جزيئات تتجمع. من المثير للاهتمام، وجدنا أنه بدلاً من استبعاد الأنواع COOH غير المتجمعة، عرض النظام كتل hcp مستقرة تحتوي على كلا النوعين من الجزيئات (الشكل 4a، الأسفل وفيديو إضافي 6). يمكن تفسير جميع هذه الملاحظات ضمن نموذج الترطيب السطحي المقترح لتفاعلات الجزيئات (المعلومات الإضافية، القسم 3.6). على وجه التحديد، يبدو أنه يكفي أن يكون نوع واحد من الجزيئات في نظام تنظيم الشحن لكي تظهر جاذبة بين الجزيئات المشحونة المماثلة كيميائياً (الشكل 4b،c).
لذا نظهر أن الكيمياء المماثلة أو المتطابقة ليست شرطاً لجاذبية بين الجزيئات، ولكن أن حالة الشحن الكهربائي للمجموعات تدعم قوة ذات طابع عام وقابل للتعديل يحتفظ بمعنى واسع. ببساطة، قد تدخل الخصائص الكيميائية للجزيء
في فيزياء التفاعل عبر لمجموعات الشحن المؤينة. قد تحمل هذه الملاحظات دلالات لمشكلة فصل الطور البيولوجي، على سبيل المثال، حيث تشارك جزيئات RNA الحمضية بشدة في تشكيل الكتل في الخلطات التي تشمل أنواع جزيئية مشحونة أخرى مثل البروتينات . لتأكيد الاتصال بمشكلة تكثيف الجزيئات البيولوجية، يمكن رؤية جزيئات السيليكا في الكتل (الشكل 4a، الأسفل) على أنها تعمل كـ ‘دعامة’، بينما تعمل الجزيئات الكربوكسيلية كـ ‘عملاء .
الجاذبية الذاتية السلبية في الماء تتغير في الكحوليات
ثم تثار السؤال بشكل طبيعي عما إذا كان نوع عدم التماثل في الشحن الذي لوحظ لتفاعل الجزيئات في الماء يمكن أن يتغير في مذيب مختلف بسبب اختلافات في سلوك الجزيئات الاتجاهية عند الواجهة. أولاً، أكدنا أن جزيئات السيليكا المشتقة من الأمين المشحونة إيجابياً المعلقة في الإيثانول والإيزوبروبانول (IPA) عرضت إمكانيات زيتا إيجابية (الشكل 5c). نتذكر أن هذه الجزيئات ظلت متوزعة جيداً عند تعليقها في الماء (الأشكال 1 و 2). ومع ذلك، في الإيثانول و IPA، وجدنا أن الجزيئات المشحونة إيجابياً شكلت كتل بلورية مستقرة، تعرض توزيعات تذكر بالتفاعلات الجذابة التي تُواجه عادةً لجزيئات السيليكا المشحونة سلبياً في الماء (الشكل 5b،c وفيديو إضافي 7). من ناحية أخرى، ظلت الجزيئات الكربوكسيلية المشحونة سلبياً متوزعة جيداً في كلا الكحولين، ولم تشكل كتل وكررت نوعياً الملاحظات على الجزيئات المشحونة إيجابياً في الماء.
تظهر المحاكاة الجزيئية للإيثانول و IPA بالفعل أن المكون العادي للثنائي الجزيئي المتوسط يمكن أن يُعكس بالنسبة لذلك من الماء الجزيئي عند سطح محايد؛ أي، تتجه الجزيئات السطحية بحيث تشير مجموعاتها الميثيلية ( ) الأكثر كرهًا للماء نحو سطح محايد (الشكل 5a والشكل الإضافي 8b؛ المعلومات الإضافية، القسم 2.2) . تعطي هذه الاتجاهات الجزيئية جاذبية سطحية
الشكل 5 | الجاذبية الذاتية السلبية في الماء تتحول إلى جاذبية ذاتية إيجابية في الكحوليات. أ، الأعلى: تظهر محاكاة MD للإيثانول و IPA عند سطح غير مشحون أن هذه الجزيئات تتجه في المتوسط مع مجموعاتها الميثيلية تشير قليلاً نحو الواجهة وذرات الأكسجين السالبة الشحنة تشير نحو الكتلة، مما يعطي جاذبية سطحية . على عكس الماء، تشير لحظة الثنائي الجزيئي السطحية المتوسطة (السهم الأخضر) نحو السطح. الأسفل: مساهمات مختلفة في إجمالي طاقة التفاعل الحرة للجزيئات الإيجابية (الخطوط الحمراء) والسلبية (الخطوط الزرقاء): الدفع الكهروستاتيكي، (الخط المنقط الأسود؛ ينطبق على كلا الشحنتين)؛ مساهمة الترطيب السطحي، (الخط المنقط، مختلف للإيجابي والسالب)؛ إجمالي طاقة التفاعل، (الخطوط الصلبة)؛ ومساهمة vdW، (الخط المنقط الرمادي؛ ينطبق على كلا الحالتين). عندما ، قد تعرض الجزيئات المشحونة إيجابياً حدًا أدنى في عند فصل الجزيئات (الخط الأحمر الصلب)، بينما تدفع الجزيئات المشحونة سلبياً بشكل أحادي، دون عرض حد أدنى (الخط الأزرق الصلب) (المعلومات الإضافية، القسم 3.1). ب، اليمين: تظهر التجارب أن جزيئات السيليكا المشتقة من الأمين المشحونة إيجابياً (الوردي) تشكل
كتل hcp، بينما لا تشكل الجزيئات الكربوكسيلية المشحونة سلبياً (البرتقالي) كتل في الكحوليات. شريط القياس، . انظر الشكل الإضافي 25 للصور الخام. اليسار: تستعيد محاكاة BD مع إمكانيات تفاعل الزوج المناسبة الهيكل المعلق الذي لوحظ تجريبياً. ج، دوال كثافة الاحتمال الشعاعي المقاسة، ، للجزيئات المشحونة إيجابياً (درجات من الوردي) والجزيئات المشحونة سلبياً (درجات من البرتقالي) في الكحوليات، بما في ذلك إمكانيات زيتا المقاسة (رموز دائرية) لكل حالة. تشير أشرطة الخطأ إلى انحراف معياري لثلاث قياسات. تتوافق التجارب مع القيم المقاسة لـ (انظر الجدول الإضافي 12 للتفاصيل). د، إمكانيات تفاعل الزوج المستنتجة من البيانات التجريبية من محاكاة BD (الخطوط الصلبة) للجزيئات السلبية (البرتقالي) والجزيئات الإيجابية (الوردي) (انظر الشكل الإضافي 24 والجدول الإضافي 12 للتفاصيل). منحنيات المحسوبة كما هو موصوف في المرجع 27 والمعلومات الإضافية، الأقسام 3.2 و 3.3 (الخطوط المنقطة مع الرموز؛ انظر الجدول الإضافي 1 لقيم المعلمات). تشير أشرطة الخطأ إلى تقديرات عدم اليقين لـ في قطر الجزيء و في (الشكل الإضافي 24).
إمكانية الترطيب عند شحنة سطحية صفرية لها علامة إيجابية، أي، ، مما يشير إلى جاذبية بين الجزيئات الإيجابية في نموذجنا. وقد اقترحت المحاولات لاستكشاف الجهد الكهربائي السطحي تجريبياً سلوكًا اتجاهيًا مشابهًا وانعكاسًا في علامة للكحوليات عند الواجهات مقارنة بالماء . علاوة على ذلك، يتم التقاط منحنيات المستنتجة تجريبياً نوعياً من خلال حسابات كما هو موضح في الشكل 5d، مما ينتج عنه معلمات نموذج معقولة من الناحية الفيزيائية (الفيديو التكميلي 7، المعلومات التكميلية، القسم 3.3 والجدول التكميلي 1).
الذوبان السطحي وتكثف الجزيئات الحيوية
أخيرًا، مستلهمين من التكوين العفوي للتجمعات القابلة للتعديل في الكريات الدقيقة ذات الشحنات المماثلة في المحلول، نفحص تداعيات هذه القوة الطويلة المدى للتذويب على تشكيل المكثفات القابلة للعكس على المستوى الجزيئي تحت ظروف فسيولوجية، والتي تُواجه بشكل واسع، على سبيل المثال، في مشكلة فصل الطور السائل-السائل في علم الأحياء. قمنا ببناء نموذج بسيط لبروتين على شكل كرة تحمل مجموعات قابلة للتأين على السطح مكشوفة للمذيب (الشكل 6أ) وفحصنا طاقة التفاعل بين الزوجين، ، لجزيئين كرويين مشحونين يحملان خمس مجموعات حمض الجلوتاميك القابلة للتأين ( )، مغمور في محلول إلكتروليتي يحتوي على ملح أحادي التكافؤ بتركيز في النطاق في نطاق pH من 5.5 إلى 8 (الشكل 6، الشكل التكميلي 10 والمعلومات التكميلية، القسم 3.7). قمنا بتحليل الإشارة والحجم الإجمالي إمكانات التفاعل،، كما هو موضح في معادلة المعلومات التكميلية (5)، عند مسافة سطحية اسمية قدرهابين الجزيئات.
لقد لاحظنا أن التنافر الكهروستاتيكي بين الجسيمات، الذي ينعكس فيمن المتوقع أن يكون كبيرًا على مدى نطاق pH وتركيز الملح المدروس، حيث تحمل الجزيئات شحنة صافية كبيرة (من نفس الإشارة) (الشكل 6ب). ومن المثير للاهتمام، عند إضافة المساهمة السطحية إلى الطاقة الحرة الكلية، وجدنا أن التفاعل يمكن أن يتحول بشكل ملحوظ إلى جذاب (أي، بالنسبة للفصل اللانهائي)، خاصة عند القوة الأيونية المنخفضة وعند قيم pH أعلى من المجموعات المشحونة (الشكل التكميلي 10 والمعلومات التكميلية، القسم 3.7). ثم قمنا بتقدير ملف منحنى التعايش الذي يحدد أجزاء من فضاء المعلمات حيث قد يحدث فصل الطور من المناطق التي تبقى فيها الجزيئات موزعة بشكل جيد. وجدنا أن النموذج الواجهاتي يقترح تشكيل غير بديهي لقطرات من الجزيئات المشحونة بنفس الشحنة عند تركيزات الملح تصل إلىوعند قيم pH تصل إلى (الشكل 6ج، اللوحة اليمنى والمعلومات التكميلية، القسم 3.7). لقد تم الإبلاغ عن مثل هذا السلوك بالفعل للبروتينات التي تحمل شحنة سالبة صافية.على سبيل المثال، بروتين الخميرة البريّة Sup35 المشحون سلبياً والذي يحمل فائضاً صافياً من ستة أحماض أمينية حمضية (حمض الأسبارتيك وحمض الغلوتاميك) مقارنة بعدد السلاسل الجانبية القاعدية (الليسين والأرجينين) في المجال الذي يتحكم في استجابته لفصل الطور (الشكل التكميلي 10I)ومع ذلك، فإن نموذج من نوع DLVO لنفس التفاعل لن يلتقط الاتجاهات التجريبية المبلغ عنها لـ Sup35 (الشكل 6c، اللوحة اليسرى ومعلومات إضافية، القسم 3.7).
الشكل 6 | يمكن أن تؤدي القوة المعتمدة على الشحنة إلى تشكيل تكثفات بيولوجية جزيئية. أ، تمثيل تخطيطي لقطرات التكثف البيولوجي الجزيئي المتكونة من جزيئات البروتين الممثلة ككرات ذات نصف قطرتحمل شحنة كهربائية سالبة تعادل فائضًا صافيًا من خمس مجموعات حمض الجلوتاميك. تمثل الخطوط الزرقاء والحمراء احتمالين مختلفين نوعيًا للتفاعل. (على سبيل المثال، أو ) لزوج من الجزيئات المتفاعلة حيث هو قيمة طاقة التفاعل عند فصل بين السطحينفي أي من السيناريوهين.يسار: تصل الشحنة الجزيئية المحسوبة إلى أقصى قيمتها منفيويظل سلبياً بشكل كبير على نطاق واسع من قيم pH. اليمين: حساب طاقة التفاعل الكهروستاتيكييشير إلى تفاعل طارد صافي بين جزيئين عند الرقم الهيدروجيني المعني وrange.c، اليسار: تطبيق عتبة طاقة التفاعل الثنائي لتكوين القطرات منإلى القيمة المحسوبة لـلا نحصل على أي مؤشر لفصل الطور من منظور DLVO. اليمين: تضمين مساهمة الطاقة الحرة للذوبان في جهد التفاعل.يولد منحنى التعايش (الخط الأسود) الذي يعرض اعتماد تكوين القطرات على درجة الحموضة وتركيز الملح مشابهًا للملاحظات التجريبية (انظر المعلومات التكميلية، القسم 3.7 للحصول على التفاصيل).
الخاتمة
تقدم هذه الدراسة أدلة قوية لرؤية مختلفة تمامًا للتفاعلات بين الجسيمات والجزيئات، مع تداعيات عامة على التجميع الذاتي وتجمع المادة في المحلول، ذات صلة حتى، على سبيل المثال، بأصل الحياة.يمكن أن يؤدي العمل المتضافر للشحنة الكهربائية عند واجهة وبنية الترطيب المحلية إلى ظهور ‘قوة الكهروذوبان’ بين الأجسام في المحلول. كقاعدة عامة، يمكن توقع جذب بين الجسيمات المتطابقة، والتي يُفترض أنها طاردة، عندما يكون هناك توافق في إشارة الجهد الكهربائي على الواجهة،في مذيب معين، يتطابق ذلك مع إشارة شحنة الجسيم. تستدعي الملاحظات إعادة تقييم المفاهيم النموذجية في التفاعلات البيومولكولية، على سبيل المثال، أن تمتد بولي-E سالبة الشحنة في البروتينات تدفع بشكل قاطع في المحلول، وهو ما لا ينطبق بالضرورة اعتمادًا على درجة الحموضة في المحلول (الشكل 2، اللوحات الوسطى). قد تواجه الجزيئات ذات الشحنات المتشابهة في المحلول في الواقع تأثيرًا مضادًا للحدس قويًا وطويل المدى. الجذب، حتى في ظل الظروف الفسيولوجية. هذه النتائج لها تداعيات إضافية على التفاعلات في خلطات المذيبات، وفي المحاليل التي تحتوي على إضافات مثل الزويتريون، والأوزمولات، والبوليات، أو جزيئات أخرى محايدة كهربائياً بشكل عام والتي لا يُتوقع أن تؤثر بشكل كبير على التفاعل الكهروستاتيكي بحد ذاته.يمكن أن تؤثر الأنواع الجزيئية المحايدة كهربائيًا في المحلول على هيكل الترطيب عند الواجهة بسبب الإلكتروليت النقي، وبالتالي تعديل التفاعل الكلي بين الجسيمات المشحونة. قد يُكتشف أن المفهوم المستدعى هنا للتفاعلات بين الجسيمات والتفاعلات بين الجزيئات على مسافات أطول يمكن أن ينطبق أيضًا على التفاعلات داخل الجزيئات والتغيرات الشكلية المرتبطة بعمليات على مقياس النانومتر مثل طي الجزيئات البيولوجية. أخيرًا، توفر نتائجنا دليلًا على القدرة على استكشاف إشارة ومقدار الجهد الكهربائي عند الواجهة بسبب المذيب، والذي كان يُعتقد سابقًا أنه لا يمكن قياسه..
المحتوى عبر الإنترنت
أي طرق، مراجع إضافية، ملخصات تقارير Nature Portfolio، بيانات المصدر، بيانات موسعة، معلومات إضافية، شكر وتقدير، معلومات مراجعة الأقران؛ تفاصيل مساهمات المؤلفين والمصالح المتنافسة؛ وبيانات توفر البيانات والرموز متاحة علىhttps://doi.org/10.1038/s41565-024-01621-5.
References
Derjaguin, B. V. & Landau, L. Theory of the stability of strongly charged lyophobic sols and of the adhesion of strongly charged particles in solutions of electrolytes. Acta Physicochim. (USSR) 14, 30-59 (1941).
Verwey, E. J. W. & Overbeek, J. T. G. Theory of the Stability of Lyophobic Colloids (Elsevier, 1948).
Trefalt, G., Palberg, T. & Borkovec, M. Forces between colloidal particles in aqueous solutions containing monovalent and multivalent ions. Curr. Opin. Colloid Interface Sci. 27, 9-17 (2017).
Rau, D. C. & Parsegian, V. A. Direct measurement of the intermolecular forces between counterion-condensed DNA double helices. Evidence for long range attractive hydration forces. Biophys. J. 61, 246-259 (1992).
Kjellander, R., Marcelja, S., Pashley, R. M. & Quirk, J. P. Double-layer ion correlation forces restrict calcium clay swelling. J. Phys. Chem. 92, 6489-6492 (1988).
Levin, Y. Electrostatic correlations: from plasma to biology. Rep. Prog. Phys. 65, 1577-1632 (2002).
Haro-Perez, C. et al. Dynamic arrest in charged colloidal systems exhibiting large-scale structural heterogeneities. Phys. Rev. Lett. 102, 018301 (2009).
Krishnan, M., Moench, I. & Schwille, P. Spontaneous stretching of DNA in a two-dimensional nanoslit. Nano Lett. 7, 1270-1275 (2007).
Klug, A., Franklin, R. E. & Humphreysowen, S. P. F. The crystal structure of tipula iridiscent virus as determined by Bragg reflection of visible light. Biochim. Biophys. Acta 32, 203-219 (1959).
Kepler, G. M. & Fraden, S. Attractive potential between confined colloids at low ionic-strength. Phys. Rev. Lett. 73, 356-359 (1994).
Grier, D. G. A surprisingly attractive couple. Nature 393, 621-623 (1998).
Baksh, M. M., Jaros, M. & Groves, J. T. Detection of molecular interactions at membrane surfaces through colloid phase transitions. Nature 427, 139-141 (2004).
Ito, K., Yoshida, H. & Ise, N. Void structure in colloidal dispersions. Science 263, 66-68 (1994).
Matsuoka, H., Schwahn, D. & Ise, N. Observation of cluster formation in polyelectrolyte solutions by small-angle neutron scattering. 1. A steep upturn of the scattering curves from solutions of sodium poly(styrenesulfonate) at scattering vectors below . Macromolecules 24, 4227-4228 (1991).
Larsen, A. E. & Grier, D. G. Like-charge attractions in metastable colloidal crystallites. Nature 385, 230-233 (1997).
Musheev, M. U., Kanoatov, M., Retif, C. & Krylov, S. N. Stable DNA aggregation by removal of counterions. Anal. Chem. 85, 10004-10007 (2013).
Tata, B. V. R., Mohanty, P. S. & Valsakumar, M. C. Bound pairs: direct evidence for long-range attraction between like-charged colloids. Solid State Commun. 147, 360-365 (2008).
Langmuir, I. The role of attractive and repulsive forces in the formation of tactoids, thixotropic gels, protein crystals and coacervates. J. Chem. Phys. 6, 873-896 (1938).
Sogami, I. & Ise, N. On the electrostatic interaction in macroionic solutions. J. Chem. Phys. 81, 6320-6332 (1984).
vanRoij, R. & Hansen, J. P. Van der Waals-like instability in suspensions of mutually repelling charged colloids. Phys. Rev. Lett. 79, 3082-3085 (1997).
Sader, J. E. & Chan, D. Y. C. Long-range electrostatic attractions between identically charged particles in confined geometries: an unresolved problem. J. Colloid Interface Sci. 213, 268-269 (1999).
Ray, J. & Manning, G. S. Formation of loose clusters in polyelectrolyte solutions. Macromolecules 33, 2901-2908 (2000).
Chremos, A. & Douglas, J. F. Communication: Counter-ion solvation and anomalous low-angle scattering in salt-free polyelectrolyte solutions. J. Chem. Phys. 147, 241103 (2017).
Gonella, G. et al. Water at charged interfaces. Nat. Rev. Chem. 5, 466-485 (2021).
Nagata, Y., Ohto, T., Backus, E. H. G. & Bonn, M. Molecular modeling of water interfaces: from molecular spectroscopy to thermodynamics. J. Phys. Chem. B 120, 3785-3796 (2016).
Kung, W., González-Mozuelos, P. & De La Cruz, M. O. Nanoparticles in aqueous media: crystallization and solvation charge asymmetry. Soft Matter 6, 331-341 (2010).
Kubincová, A., Hünenberger, P. H. & Krishnan, M. Interfacial solvation can explain attraction between like-charged objects in aqueous solution. J. Chem. Phys. 152, 104713 (2020).
Behjatian, A., Walker-Gibbons, R., Schekochihin, A. A. & Krishnan, M. Nonmonotonic pair potentials in the interaction of like-charged objects in solution. Langmuir 38, 786-800 (2022).
Walker-Gibbons, R., Kubincová, A., Hünenberger, P. H. & Krishnan, M . The role of surface chemistry in the orientational behavior of water at an interface. J. Phys. Chem. B 126, 4697-4710 (2022).
Winter, E. M. & Groves, J. T. Surface binding affinity measurements from order transitions of lipid membrane-coated colloidal particles. Anal. Chem. 78, 174-180 (2006).
Gomez, E. W., Clack, N. G., Wu, H. J. & Groves, J. T. Like-charge interactions between colloidal particles are asymmetric with respect to sign. Soft Matter 5, 1931-1936 (2009).
Polin, M., Grier, D. G. & Han, Y. Colloidal electrostatic interactions near a conducting surface. Phys. Rev. E 76, 041406 (2007).
Crocker, J. C. & Grier, D. G. When like charges attract: the effects of geometrical confinement on long-range colloidal interactions. Phys. Rev. Lett. 77, 1897-1900 (1996).
Baumgartl, J. R., Arauz-Lara, J. L. & Bechinger, C. Like-charge attraction in confinement: myth or truth? Soft Matter 2, 631 (2006).
Darlington, A. M. & Gibbs-Davis, J. M. Bimodal or trimodal? The influence of starting pH on site identity and distribution at the low salt aqueous/silica interface. J. Phys. Chem. C. 119, 16560-16567 (2015).
Macias-Romero, C., Nahalka, I., Okur, H. I. & Roke, S. Optical imaging of surface chemistry and dynamics in confinement. Science 357, 784-787 (2017).
Ninham, B. W. & Parsegian, V. A. Electrostatic potential between surfaces bearing ionizable groups in ionic equilibrium with physiologic saline solution. J. Theor. Biol. 31, 405-428 (1971).
Dong, H. T., Du, H. B., Wickramasinghe, S. R. & Qian, X. H. The effects of chemical substitution and polymerization on the values of sulfonic acids. J. Phys. Chem. B 113, 14094-14101 (2009).
Polymenidou, M. The RNA face of phase separation. Science 360, 859-860 (2018).
Wadsworth, G. M. et al. RNAs undergo phase transitions with lower critical solution temperatures. Nat. Chem. 15, 1693-1704 (2023).
Parchure, A. et al. Liquid-liquid phase separation facilitates the biogenesis of secretory storage granules. J. Cell Biol. 221, e202206132 (2022).
Reif, M. M. & Hünenberger, P. H. Origin of asymmetric solvation effects for ions in water and organic solvents investigated using molecular dynamics simulations: the Swain acity-basity scale revisited. J. Phys. Chem. B 120, 8485-8517 (2016).
Paluch, M. Electrical properties of free surface of water and aqueous solutions. Adv. Colloid Interface Sci. 84, 27-45 (2000).
Randles, J. E. B. Structure at the free surface of water and aqueous electrolyte solutions. Phys. Chem. Liq. 7, 107-179 (1977).
Trasatti, S. Interfacial behaviour of non-aqueous solvents. Electrochim. Acta 32, 843-850 (1987).
Franzmann, T. M. et al. Phase separation of a yeast prion protein promotes cellular fitness. Science 359, 47-54 (2018).
Poudyal, R. R., Pir Cakmak, F., Keating, C. D. & Bevilacqua, P. C. Physical principles and extant biology reveal roles for RNA-containing membraneless compartments in origins of life chemistry. Biochemistry 57, 2509-2519 (2018).
Govrin, R., Schlesinger, I., Tcherner, S. & Sivan, U. Regulation of surface charge by biological osmolytes. J. Am. Chem. Soc. 139, 15013-15021 (2017).
Lyklema, J. H. Interfacial potentials: measuring the immeasurable? Substantia 1, 75-93 (2017).
Publisher’s note Springer Nature remains neutral with regard to jurisdictional claims in published maps and institutional affiliations.
Open Access This article is licensed under a Creative Commons Attribution 4.0 International License, which permits use, sharing, adaptation, distribution and reproduction in any medium or format, as long as you give appropriate credit to the original author(s) and the source, provide a link to the Creative Commons licence, and indicate if changes were made. The images or other third party material in this article are included in the article’s Creative Commons licence, unless indicated otherwise in a credit line to the material. If material is not included in the article’s Creative Commons licence and your intended use is not permitted by statutory regulation or exceeds the permitted use, you will need to obtain permission directly from the copyright holder. To view a copy of this licence, visit http://creativecommons. org/licenses/by/4.0/.
(c) The Author(s) 2024
طرق
طرق تجريبية
تحضير تعليقات الجسيمات لقياسات المجهر. في تجاربنا، ندرس سلوك ثلاثة أنواع متميزة من الكريات المجهرية ذات كيميائيات سطحية مختلفة. تشمل الفئات الثلاث الرئيسية من الجسيماتجزيئات (مختبرات بانغ)، جزيئات سيليكا مشتقة من الأمين (“المشار إليه بـ ‘ ‘ أو ‘ في النص) (جزيئات دقيقة) مع تقديرمحتوى المجموعةوالميلامين الفورمالديهايد المكلور“المشار إليه بـ ‘” أو ‘في النص) جزيئات (جزيئات دقيقة) تحتوي على مجموعة كربوكسيل منتوزيعات حجم الجسيمات المقدمة من قبل الشركة المصنعة موضحة في الشكل التكميلية 1.
للتجارب علىوجزيئات COOH في محلول مائي، تم شطف الجزيئات أولاً (تدوير مركزي وإعادة تعليق) في ماء منزوع الأيونات. بعد ذلك، تم حضنها في 5 مللي مول من NaOH (محلول (ألفا أيسر) لمدة 10 دقائق. بعد ذلك، تم طردها مركزيًا وإعادة تعليقها في إلكتروليت مائي بقوة أيونية مطلوبة حوالي ست مرات حتى تقارب الموصلية الكهربائية للمحلول الطافي تلك الخاصة بالإلكتروليت النقي. تجدر الإشارة إلى أنه بشكل عام، فإن معالجة NaOH ليست ضرورية، والتعرض طوال الليل للمياه المنزوعة الأيونات مع الشطف اللاحق في المياه المنزوعة الأيونات هو علاج فعال بنفس القدر قبل تجارب التكتل (الشكل التكميلي 11). ومع ذلك، كانت معالجة NaOH ضرورية لملاحظة تكتل قوي في جزيئات COOH. تم شطف الجسيمات أولاً في الماء منزوع الأيونات ثم أعيد تعليقها عدة مرات في محلول إلكتروليت مائي حتى تقارب الموصلية السائلة المقاسة تلك الخاصة بالإلكتروليت النقي. تم إجراء عملية الصوتنة على التعليق في الحالات التي لوحظ فيها عدد كبير من الجسيمات ‘الملتصقة’. إن وجود الجسيمات الملتصقة في البيانات التجريبية يؤدي إلى ظهور قمم ‘ثنائية’ صغيرة عند المسافات بين الجسيمات.في المقاسالتي لا يمكن القضاء عليها تمامًا (مشار إليها بـ ‘d.p.’ في الأشكال 2b و3c و5c). في التجارب على خلطات منوجزيئات COOH (الشكل 4)، تم خلط النوعين من الجزيئات في البداية عندنسبة، ثم تم حضنها في محلول NaOH بتركيز 10 مللي مول لمدة 10 دقائق. بعد ذلك كانت الإجراءات كما هو موصوف أعلاه.
للتجارب على المشتتات الغروية في الكحوليات،تمت أولاً طرد الجسيمات باستخدام الطرد المركزي وإعادة تعليقها في الماء المنزوع الأيونات، تلا ذلك إعادة تعليقها في الإيثانول ( ، سيغما-ألدريتش) أو IPA ( تمت عملية الطرد المركزي وإعادة التعليق عدة مرات حتى ت converged قيمة توصيل السائل الطافي إلى تلك المقاسة للكحول النقي. تم طرد جزيئات COOH أولاً ثم إعادة تعليقها في الماء المقطر، تلتها إعادة التعليق في الإيثانول، وأخيرًا إعادة التعليق في الإيثانول أو IPA للقياسات.
تحضير وتوصيف محاليل الإلكتروليت. من أجل التجارب التي تفحص اعتماد التفاعلات بين الجسيمات على القوة الأيونية للإلكتروليت (الشكل 1)، تم استخدام تركيزات مختلفة من NaCl.تم تحضير محلول (ألفا أيسر) في ماء منزوع الأيونات؛ تتوافق الموصلية المقاسة لهذه المحاليل مع تركيز خلفي من الأيونات أحادية التكافؤ منتم تحديد القوة الأيونية لمختلف محاليل الإلكتروليت في تجاربنا من قياسات الموصلية الكهربائية،تمت العملية باستخدام مقياس التوصيل (inoLab Cond 7110). تم استخدام منحنى المعايرة للحلول القياسية لهذا الغرض (الشكل التوضيحي 2).
لتحويل الموصلية الكهربائية المقاسة إلى تركيز ملح خلفي في الكحوليات، استخدمنا نفس علاقة المعايرة كما هو موضح في الشكل التوضيحي 2، ولكن قمنا بتصحيح التركيزات المستنتجة لزوجة الكحول كما اقترح في الأعمال السابقة. (قيم اللزوجة المستخدمة للإيثانول و IPA كانت 1.1 cP و 2.4 cP على التوالي، انظر المعلومات التكميلية، القسم 1.2).
في التجارب التي تستكشف اعتماد تفاعلات الجسيمات على الرقم الهيدروجيني (الشكل 2)، تم ضبط الرقم الهيدروجيني للكهارل إلى المستوى المطلوب القيمة عن طريق إضافة إما HCl (99.999%، ألفا أيسر) أو محلول تريس (، كارل روث)، إلى الماء المقطر. أدت إضافة الحمض أو عامل التخفيف إلى الماء المقطر إلى رفع موصلية المحلول إلى قيمة تتراوح بين 1 واعتمادًا على قيمة الرقم الهيدروجيني المستهدفة. بالنسبة للتجارب التي أجريت عند قيم pH متغيرة، تم الحفاظ على قوة الأيونات في الإلكتروليت ثابتة (ضمن عبر النطاق الكامل لدرجة الحموضة في سلسلة تجريبية معينة من خلال إضافة كمية متغيرة من NaCl. تم اعتبار قيمة pH للمحلول المائي كمتوسط ثلاث قياسات متتالية باستخدام مقياس pH (Horiba PH-33). تم استنتاج pH لعينات الكحول النقي من خلال استقراء قيم pH المقاسة لخلائط الماء والكحول (الشكل التوضيحي التكميلي 2b).
تغطية طبقة تلو الأخرى لجزيئات السيليكا باستخدام البوليببتيدات والبوليمرات الكهربائية. في التجارب المعروضة في الشكل 3، استخدمنا تغطيات متناوبة من البوليمرات الكهربائية الموجبة والسالبة على السطح العادي.الجزيئات. تم تطبيق الطلاءات في أزواج من تركيبات البوليمرات الكهربية المشحونة إيجابياً وسلبيًا: بولي-ك (; سيغما) و بولي-إي ( ; سيغما); PDADMAC ( 200,000-350,000؛ ألدريتش) و PSS (; ألدريتش)، وأخيرًا، PEI (; سيغما) و PSS.
لتغطية الجسيمات، عاديتم أولاً طرد الجسيمات باستخدام الطرد المركزي وإعادة تعليقها في الماء المنزوع الأيونات، تلا ذلك الحضانة في محلول NaOH بتركيز 5 مللي مول لمدة 10 دقائق، ثم إعادة تعليقها في الماء المنزوع الأيونات، وتكرار عملية إعادة التعليق حتى تتقارب موصلية السائل الفائق مع موصلية الماء المنزوع الأيونات. ثم تم حضانة الجسيمات المغسولة في محلول البوليمر الكهربائي عندلمدة 20 دقيقة مع التحريك العرضي لتحسين الخلط. تم طرد الجزيئات المغلفة في جهاز الطرد المركزي وإعادة تعليقها في الماء المنزوع الأيونات لإزالة أي بوليمر زائد وتم تكرار إجراء إعادة التعليق حتى لم يعد هناك تغيير في موصلية السائل الفائق. تم تطبيق طبقات لاحقة من الطلاءات البوليمرية من خلال تكرار إجراء الطلاء الموضح أعلاه مع البوليمر الكهربائي المعاكس المقابل. تم تأكيد إشارة شحنة السطح لكل طبقة طلاء من خلال قياسات جهد زيتا (Zetasizer Nano Z، مالفرن باناليتيكال).
تحضير الكوفيت وتحميل العينة. استخدمنا كوفيت زجاجية ذات قاع مصقول بعمق 1 مم.ستارنا ساينتيفيك)، كما هو موضح في الشكل التكميلي 3ب، لجميع قياسات المجهر الفيديوي. تم تنظيف الكوفيت باستخدام محلول بيرانا.خليط من حمض الكبريتيك المركز ومحلول بيروكسيد الهيدروجين) ثم تم شطفه جيدًا بالماء المنزوع الأيونات. توفر الكوبيت الزجاجية بشكل طبيعي سطحًا مشحونًا سلبًا في الماء والإيثانول وIPA للتجارب مع الجسيمات المشحونة سلبًا. بالنسبة للتجارب مع الجسيمات المشحونة إيجابًا، تم طلاء الكوبيت بالكامل بـتمت معالجة محلول PEI، وشطفه وتجفيفه تحت النيتروجين لتوفير طبقة رقيقة من طلاء البوليمر الموجب الشحنة. لتحميل الكوفيت، تم نقل محلول الجسيمات المحضر بعناية إلى البئر باستخدام ماصة وتم إغلاقه بشريحة الغطاء بحيث كانت الجهاز خالية من فقاعات الهواء ومتماسكة بواسطة القوة الشعرية.
الميكروسكوبية. تم بناء المجهر الضوئي باستخدام صمام ثنائي باعث للضوء (LED) بطول موجي 470 نانومتر (M470L4، ThorLabs)،عدسة موضوعية (Olympus UPlanSApo) وكاميرا مرتبطة بالشحن (DCU223M، ThorLabs) لتسجيل الصور (الشكل التكميلي 3). تم وضع حامل العينة على منصة متوازنة بعناية في الاتجاهين العمودي والأفقي (AMA027، ThorLabs). بعد استقرار الجسيمات بالكامل في التعليق إلى مستوى قريب من السطح السفلي للأنبوب، والذي يستغرق عادة حوالي دقيقتين، تم ضبط التركيز بحيث تم ملاحظة أقصى شدة واضح لجميع الجسيمات. تم إجراء جميع القياسات بعد الاستقرار الكامل. تم ضبط شدة LED بحيث لا تتجاوز أقصى شدة للجسيمات المضيئة القيمة المشبعة للكاميرا، مما يتيح تحديد موقع الجسيمات بدقة.
تسجيل الفيديو ومعالجة البيانات. تم التقاط صور متسلسلة لتعليق الجسيمات الغروية ثنائية الأبعاد باستخدام برنامج ThorCam بمعدل إطار ثابت قدره 5 أو 10 أو 30 إطارًا في الثانية لمدة 150-500 إطارًا باستخدام زمن تعريضتمت معالجة الصور بناءً على طريقة التناظر الشعاعي باستخدام إطار تتبع الجسيمات TrackNTrace، حيث يتم الكشف عن الحد الأقصى لمركز الجسيم.دقة تحديد الموقع لثابتجسيم خلال قياس مدته 100 ثانية في وقت تعرض قدره وُجد أنه كما هو موضح في الشكل التوضيحي 4. في تحليل الصور التجريبية، تم استخراج إحداثيات جميع مراكز الجسيمات من الإطارات المسجلة، ومنحنى دالة التوزيع الشعاعيتم حسابها ومتوسطها على جميع الصور. لتمييز واضح بين التجارب على الجسيمات ذات الشحنات المختلفة في ثلاثة مذيبات مختلفة، تم رقمنة الصور المسجلة وتلوينها بألوان زائفة (المعلومات التكميلية، القسم 1.6 والشكل التكميلية 3). كانت كفاءة اكتشاف الجسيمات المتوسطة على جميع التجارب >98%.
طرق المحاكاة
محاكاة BD لتفاعلات الجسيمات. قمنا بإجراء محاكاة BD لتوزيع ثنائي الأبعاد من الكرات التي تتفاعل من خلال جهد مدخل مختار بشكل مناسب باستخدام حزمة BROWNIAN في برنامج LAMMPS.استنتجنا إمكانيات التفاعل الزوجي المطلوبة،، مما يدعم البيانات التجريبية من خلال تغيير الجهد المدخل إلى محاكاة BD. وبالتالي، قمنا بإنشاء دوال توزيع الاحتمالات الشعاعية المحاكاة،، التي تطابقت مع القياسات التجريبية. يتم تقديم التحقق ومزيد من المناقشة حول إعداد ومحاكاة BD في المعلومات التكميلية، القسم 2.1. تم توفير مثال على المدخلات والملفات اللازمة للمحاكاة في مستودع Figshare الخاص بنا، المتاح على:https://doi.org/10.6084/m9.figshare.c.6132003.
افترضنا إمكانية تفاعل ثنائيةمن الشكل:هنا يمثل الحد الأول الطاقة الحرة للتفاعل الكهروستاتيكية الطاردة بشكل عام،، مع والمصطلح الثاني، تشير إلى مساهمة الطاقة الحرة الناتجة عن الترطيب السطحيلاحظ أنيمثل الحد الثالث جذب فان دير فالس بين جزيئات السيليكا في المحلول، حيث استخدمنا التعبير في المرجع 55.
تم إجراء محاكاة BD مع الأخذ في الاعتبار التوزيع المتعدد الذي تم تحديده تجريبيًا في حجم الجسيمات كما هو موضح في الشكل التكميلي 1. وهذا يعني أنه على مستوى المحاكاة يتم أخذ في الاعتبار نصف قطر الجسيم المتغير إلى أدنى مستوى من التقريب (أي أن جهد التفاعل يبقى ثابتًا ومستقلاً عن حجم الجسيمات، وهو ما لن يكون صحيحًا في الممارسة العملية). باستخدام قيمة ثابت هامكروجدنا أنقدم مساهمة صغيرة ) إلى الطاقة التفاعلية الكلية عند المسافات الكبيرة، أي، بالنسبة لغالبية التجارب في هذا العمل. ومع ذلك، بالنسبة للتجارب عند تركيزات ملح أعلى (؛ الشكل 1د)، يمكن أن تسهم تفاعلات فان دير واهل بشكل أكبرإلى التفاعل عند الفواصل، ولهذا السبب تم تضمينه في تعبيرنا عن عند نمذجة هذه القياسات.
المقاس تجريبيًايوفر المنحنى تقديرًا لموقع الحد الأدنى في الجهد الثنائي.. في المعلومات التكميلية المعادلة (6)، طول الشاشة والذي يُعرف من تركيز الملح المقاس. ثم نستخدم قيمة تجريبية لطاقة التفاعل الحرة عند الحد الأدنى،للحصول على قيم أولية للمعلمات و كمدخلات لإمكانات التفاعل الثنائي،، باستخدام معادلة المعلومات التكميلية (4)، حيث أخذناكما هو مقترح في المرجع 28. نلاحظ، مع ذلك، أن هذه النسبة ليست متطلبًا صارمًا وأنه يمكننا أيضًا اعتبارها كمعامل حر ينتج مجموعة بديلة من المعلمات. و التي يمكن أن توفر توافقًا نوعيًا جيدًا بنفس القدر مع البيانات التجريبية (انظر، على سبيل المثال، الجدول التكميلي 5).
تم تهيئة تكوينات الجسيمات لمحاكاة BD من خلال وضع الجسيمات بشكل عشوائي فيصندوق المحاكاة الذي أعاد إنتاج كثافة الجسيمات التجريبيةجسيمات ). تم اشتقاق التوزيع المتعدد الأبعاد للجسيمات المستنسخة من توزيع حجم الشركة المصنعة لكل نوع من الجسيمات، كما هو موضح في الشكل التوضيحي 1. تم تطبيق حدود دورية في الأبعاد بينماتم الاحتفاظ بالبعد محدودًا. الـتم تثبيت إحداثيات المستحلبات على ارتفاع ثابت طوال فترة المحاكاة، مما يضمن نظامًا ثنائي الأبعاد وبالتالي يحاكي التجربة. تم إجراء محاكاة الديناميكا البراونية بافتراض أن التفاعلات بين الجسيمات يمكن اعتبارها مضافة بشكل ثنائي (تم مناقشتها بمزيد من التفصيل في النص الرئيسي وفي المعلومات التكميلية، القسم 3.4)
تمت مراقبة تقارب الطاقة الكامنة لكل جزيء في محاكاة BD الخاصة بنا على مر الزمن (الشكل التكميلي 5). تم استخدام مواقع الجزيئات لحساب المحاكاة النهائية.تم جمع البيانات بمجرد أن وصلت قيمة الطاقة الكامنة إلى قيمة ثابتة، بعدمن وقت المحاكاة في تجربة تتضمن جذبًا قويًاعمق بئر يبلغ عدة (الشكل التوضيحي التكميلي 5). الاتفاق بين المحاكاة والتجربةتم تقييم s لزوج إدخال تجريبي – إمكانية التفاعلوقيمة عمق البئرتم تعديلها في محاكاة BD اللاحقة إذا لزم الأمر، للحصول على أفضل تطابق نهائي محاكى مع البيانات التجريبية. سمح لنا هذا الإجراء باستنتاج الشكل الوظيفي لإمكانات التفاعل الثنائي الأساسية.قادر على التقاط القياسات التجريبية.
محاكاة الديناميكا الجزيئية للكحوليات عند الواجهات. الجهد الكهربائي الزائد الناتج عن توجيه جزيئات المذيب عند واجهة، أو مطلوب كمدخل لنموذج الذوبان الواجهى لحساب النظريالمنحنيات (المعلومات التكميلية، القسم 3.2). لتقديركنتيجة لكثافة الشحنة الكهربائية السطحية،قمنا بإجراء محاكاة الديناميكا الجزيئية (MD) باستخدام كود GROMACS MDقمنا بدراسة سلوك طور المذيب عند تلامسه مع سطح نموذجي مكون من ذرات الأكسجين في إعداد مكثف ذو لوحين متوازيين، كما تم وصفه بشكل موسع في الأعمال السابقة.ملفات الإدخال النموذجية، ومعلمات مجال القوة، والرمز الخاص بتحليل المحاكاة التي تم إجراؤها في هذه الدراسة متاحة في مستودع Figshare الخاص بنا:https://doi.org/10.6084/m9.figshare.c.6132003.
قبل إجراء محاكاة MD في إعداد المكثف، قمنا أولاً بإجراء محاكاة أولية لصندوق يحتوي على 7500 جزيء IPA، بدون ذرات جدار المكثف، تحت ضغط ثابت، تم الحفاظ عليه باستخدام طريقة ربط الضغط بارينيلو-رحمن. طول الصندوق فيتم السماح له بالتقلب مع الحفاظ علىالأبعاد ثابتة لتلك الخاصة بجدران المكثف ذات المساحة الثابتة. تم بعد ذلك وضع هذه الطبقة المتوازنة من المذيب بين صفائح المكثف المكونة من ذرات الأكسجين المقيدة موضعياً التي تدعم فقط تفاعلات لينارد-جونز (الشكل التوضيحي 7). في محاكياتنا، تم تحديد معلمات جزيئات IPA باستخدام حقل القوة CHARMM36.. كما في الأعمال السابقة، الألواح هيفي المنطقة ويفصل بينهماوسط المذيب في اتجاه . هذا يضمن أن أي تذبذبات في كثافة المذيب أو ملفات لحظة ثنائي القطب تحقق خصائص شبيهة بالكتلة في موقع مافي منتصف المكثف. تم تعيين مجموعة فرعية من الذرات التي تنتمي إلى الطبقة الأولى في كل جدار (المتلامسة مباشرة مع المذيب) عشوائيًا بشحنة إيجابية (اللوحة اليسرى) أو شحنة سلبية (اللوحة اليمنى) لتوليد مجال كهربائي بقوة محددة داخل الصندوق مع الحفاظ على الحياد الكهربائي داخل الصندوق. يوفر نظام المكثف في الوقت نفسه تقديرات لـلكلا القيم الإيجابية والسلبية لـويقدم نظامًا محددًا جيدًا لمقارنة الحلول عند سطح ماكروسكوبي مع نموذج الكهروستاتيكا المستمر.
بعد ذلك، تم إجراء جولة ثانية من التوازن لنظام المكثف بالكامل، بما في ذلك جدران المكثف، وتضمنت تشغيل NVT قصير مع منظم حرارة لإعادة تسريع السرعة، تلاه 500 بيكوثانية في مجموعة NPT حيث فقط كان يُسمح لأبعاد الصندوق بالتقلب، مع الحفاظ علىالأبعاد ثابتة. هذا ضمن الحفاظ على جزيئات المذيب عند الكثافة الصحيحة طوال الوقت صندوق المحاكاة. بعد اتباع هذه الإجراءات، تم إجراء عمليات إنتاج MD لمدة 20 نانوثانية في مجموعة NVT مع كتابة إطارات المسار كل 20 بيكوثانية. تم استخدام طريقة شبكة الجسيمات إيوالد لتقييم التفاعلات الكهروستاتيكية بعيدة المدى باستخدامتباعد الشبكة وقطع نطاق قصير. تم تنعيم تفاعلات لينارد-جونز على مدى باستخدام دالة التبديل المعتمدة على القوة. قمنا بتعديلأبعاد الصندوق بعامل 2 لجمع إيوالد فقط وتم تطبيق تصحيح 3dc لياه وبيركوفيتش لإزالة الاستقطاب الاصطناعي الناتج عن ثنائيات القطب المجاورة.تم تحليل توجيه جزيئات المذيب كدالة للمسافة من الجدران للحصول علىالقيم التي تم استخدامها في حساب مصطلح الطاقة الحرة على الواجهة،كما تم وصفه سابقًا.
ملفات المحاكاة والرموز المستخدمة لتحليل البيانات التجريبية والمحاكاة متاحة من مستودع Figshare الخاص بنا على:https://doi. org/10.6084/m9.figshare.c.6132003.
References
Kokot, G., Bespalova, M. I. & Krishnan, M. Measured electrical charge of in polar and nonpolar media. J. Chem. Phys. 145, 194701 (2016).
Stein, S. C. & Thiart, J. TrackNTrace: a simple and extendable open-source framework for developing single-molecule localization and tracking algorithms. Sci. Rep. 6, 37947 (2016).
Parthasarathy, R. Rapid, accurate particle tracking by calculation of radial symmetry centers. Nat. Methods 9, 724-726 (2012).
Thompson, A. P. et al. LAMMPS—a flexible simulation tool for particle-based materials modeling at the atomic, meso, and continuum scales. Comput. Phys. Commun. 271, 108171 (2022).
Hamaker, H. C. The London-van der Waals attraction between spherical particles. Physica 4, 1058-1072 (1937).
Valmacco, V. et al. Dispersion forces acting between silica particles across water: influence of nanoscale roughness. Nanoscale Horiz. 1, 325-330 (2016).
Ackler, H. D., French, R. H. & Chiang, Y.-M. Comparisons of Hamaker constants for ceramic systems with intervening vacuum or water: from force laws and physical properties. J. Colloid Interface Sci. 179, 460-469 (1996).
Abraham, M. J. et al. GROMACS: high performance molecular simulations through multi-level parallelism from laptops to supercomputers. SoftwareX 1-2, 19-25 (2015).
Vanommeslaeghe, K. et al. CHARMM general force field: a force field for drug-like molecules compatible with the CHARMM all-atom additive biological force fields. J. Comput. Chem. 31, 671-690 (2009).
Yeh, I.-C. & Wallqvist, A. On the proper calculation of electrostatic interactions in solid-supported bilayer systems. J. Chem. Phys. 134, 055109 (2011).
Yücel, H. & Okumuşoğlu, N. T. A new tracking algorithm for multiple colloidal particles close to contact. J. Phys. Condens. Matter 29, 465101 (2017).
شكر وتقدير
يشكر المؤلفون P. Hünenberger و R. Netz و H. Frost و A. Baldwin و C. Robinson على المناقشات المثيرة، و A. Lawrence على المساهمات المبكرة في التجارب. تم توفير التمويل من قبل المجلس الأوروبي للبحث (ERC) تحت برنامج البحث والابتكار Horizon 2020 التابع للاتحاد الأوروبي برقم 724180.
مساهمات المؤلفين
أجرى S.W. جميع التجارب. قام R.W.-G. بإجراء وتحليل المحاكاة. قام S.W. و R.W.-G. بتحليل البيانات والمشاركة في إعداد المخطوطة. ساهم B.W. و M.F. في التجارب. صمم M.K. البحث، وأجرى النمذجة النظرية وكتب المخطوطة.
البيانات الموسعة الشكل 1 | قياس مباشر لإمكانات التفاعل الثنائي على أزواج معزولة من الجسيمات المشحونة سلبًا في الماء. (أ) تخطيط
لجسيمات COOH مع المسافة من مركز إلى مركز والفصل بين السطوح المشار إليهما بـوعلى التوالي (يسار). تظهر التجارب على تعليق مخفف من الجسيمات (حوالي عامل 2 أقل من تجارب الكتل) عددًا كبيرًا من ‘الأزواج المرتبطة’ المعزولة، والتي تتفاعل بقوة وتقع على بعد عدة ميكرومترات من الجسيمات المجاورة الأخرى كما هو موضح (يمين). (و) لقطات فيديو رقمية لجسيمين من جسيمات COOH المتفاعلة بقطرعلى مدى فترة 50 ثانية. تتميز صور الجسيمات بمنطقة ساطعة مكثفة في المركز، محاطة بحلقة داكنة ونمط انكسار مرتبط. (ز)رسم بياني لزوج متفاعل من الجسيمات (الإدراج) تم تحديده باستخدام كود تتبع الجسيمات TrackNTrace الذي يستخدم طريقة التناظر الشعاعي، أي طريقة تتبع الجسيمات المستخدمة في جميع التجارب في هذا العمل.البيانات المتعلقة بـ(الرموز) مصحوبة بمنحنى ملائم (خط برتقالي صلب). تم اشتقاق أشرطة الخطأ علىقيم كل من النقاط المقاسة من تقدير ضوضاء اللقطة (انظر القسم الإضافي 4.2). يمكن مقارنة الخط البرتقالي الصلب مع الملاءمات لـالبيانات التي تم الحصول عليها من خلال تطبيق تصحيحات مختلفة على المسافات بين الجسيمات المقاسة،، وفقًا للمرجع 61 (خط منقط أزرق) والمرجع 32 (خط منقط أخضر). جميع الملاءمات لـالبيانات هي على شكل المعادلة S6 وتفاصيلها موضحة في الشكل الإضافي 13. يظهر التوافق الجيد بين المنحنيات المختلفة أن طرق تصحيح تتبع الجسيمات لها تأثير ضئيل على عمق البئر المستنتجوقيم إمكانات التفاعل الثنائي الأساسية. (ح) رسم بياني للاختلاف المتوقعبين الفصل الحقيقي والمقاس بين الجسيمات كدالة لـ، لنظامنا التجريبي، باستخدام طريقة المرجع 32 (انظر القسم الإضافي 4.3). الخطأ الأقصى في المسافة بين الجسيمات المستنتجةمقارنة بدقة التحديد ويحدث عند فصل بين الجسيمات يتوافق مع مسافة الاقتراب الأقرب.
مختبر الكيمياء الفيزيائية والنظرية، قسم الكيمياء، جامعة أكسفورد، أكسفورد، المملكة المتحدة.معهد كافلي لاكتشاف النانو، أكسفورد، المملكة المتحدة. ³ساهم هؤلاء المؤلفون بالتساوي: سيدا وانغ، روان ووكر-جيبونز.البريد الإلكتروني:madhavi.krishnan@chem.ox.ac.uk
The interaction between charged objects in solution is generally expected to recapitulate two central principles of electromagnetics: (1) like-charged objects repel, and (2) they do so regardless of the sign of their electrical charge. Here we demonstrate experimentally that the solvent plays a hitherto unforeseen but crucial role in interparticle interactions, and importantly, that interactions in the fluid phase can break charge-reversal symmetry. We show that in aqueous solution, negatively charged particles can attract at long range while positively charged particles repel. In solvents that exhibit an inversion of the net molecular dipole at an interface, such as alcohols, we find that the converse can be true: positively charged particles may attract whereas negatives repel. The observations hold across a wide variety of surface chemistries: from inorganic silica and polymeric particles to polyelectrolyte- and polypeptide-coated surfaces in aqueous solution. A theory of interparticle interactions that invokes solvent structuring at an interface captures the observations. Our study establishes a nanoscopic interfacial mechanism by which solvent molecules may give rise to a strong and long-ranged force in solution, with immediate ramifications for a range of particulate and molecular processes across length scales such as self-assembly, gelation and crystallization, biomolecular condensation, coacervation, and phase segregation.
The delicate interplay of interactions between objects in the fluid phase influences the behaviour, organization and properties of systems from nanometric to more macroscopic size and length scales and thus underpins a wealth of natural phenomena. Our understanding and intuition of the interaction between electrically charged particles in solution is grounded in a central principle from classical electromagnetics which dictates that the force between charges of the same sign is not only repulsive at all separations but is also symmetric with respect to the sign of the charge. For example, because like-charged objects in vacuum are expected to repel regardless of whether the sign of the charge they carry is positive or negative, the expectation is that like-charged particles in solution must also monotonically repel, particularly at long range where the van der Waals (vdW) attraction is too weak to substantially
influence the overall interaction. This view is a hallmark of the Derjaguin-Landau-Verwey-Overbeek (DLVO) theory, a cornerstone of colloid science .
Nonetheless, clear and well-founded exceptions to the rule exist in the presence of multivalent ions and in particular regimes involving high magnitudes of electrical charge and in low dielectric constant media .But over the decades, consistent reports of attraction between like-charged particles from the nanometre to micrometre scales in size and range, for example, nucleic acids, liposomes, polymers and colloidal particles in aqueous media containing low concentrations of monovalent salt-where DLVO theory is expected to hold-have evaded explanation . Not surprisingly, this persistent divergence between experiment and theory has received considerable attention in the theoretical literature .
Fig. 1 | Interparticle interactions in solution can break charge-reversal symmetry. a, Schematic representations of two interacting spheres (top), and of the dominant average orientation of water molecules near an uncharged surface (middle). Bottom: Various contributions to the total interaction free energy for positively (red lines) and negatively charged (blue lines) particles: electrostatic repulsion, (black dotted line; applies to both signs of charge); interfacial solvation contribution, , depends on the sign of charge (dashed lines); total interaction energy, (solid lines); and the vdW contribution, (dashed-dotted grey line; applies to both cases). For (for example, in water) negatively charged particles may display a minimum in of depth at a separation (solid blue line), and positively charged particles repel monotonically (red solid line) (Supplementary Information, section 3.1).
b, Negatively charged silica particles ( , blue circles, ) form hcp clusters in water depending on salt concentration, (middle row). Scale bars, . Inset, bottom left: trajectories of particles in a single cluster over a period of 30 s . Scale bar, . Positively charged aminated silica particles
( , pink circles, ) in water do not form clusters regardless of (bottom row). Images acquired using bright-field microscopy (Supplementary Figs. 3 and 25) and digitized to facilitate presentation. BD simulation snapshots for particle interactions (top). c, Measured radial probability density functions, , for (top) and particles (bottom), including measured zeta potentials ( ; circular symbols) for varying . Error bars denote s.d for three measurements. Insets: the small peak around reflects particle ‘dimers’ in the sample. d, Inferred pair-interaction potentials, (solid lines), for (blue) and particles (pink). Calculated curves as described in ref. 27 and Supplementary Information, sections 3.2 and 3.3 (dashed lines with symbols; see Supplementary Table 1 for parameter values). Error bars denote estimated uncertainties of on particle diameter and in (Supplementary Fig. 18). e, Plot of versus for various negative particles in water and positive particles in alcohols shows that (Fig. 5). Errors bars represent an uncertainty of in , averaged over all particle types.
Standing theories invoke a continuum description of the solvent which overlooks finer-grained detail such as the molecular nature of the solvent, and its structure and interactions, particularly at an interface with a molecule or a particle . Despite the general success of classical mean-field, continuum theories , it is becoming increasingly clear that the molecular nature of water ought to play a defining role in a host of interfacial phenomena in the aqueous phase . We recently suggested that the behaviour of the molecular solvent at an interface can make a substantial contribution to the total interaction free energy of two approaching objects carrying electrical charge (Fig. 1a). In particular, for charged matter in water, our model suggested that this contribution could be large enough not only to counteract the interparticle Coulombic repulsion but could even overwhelm it, changing the sign of the interparticle force for negatively charged particles, turning it net attractive. The orientational behaviour of the interfacial solvent could therefore be viewed as a store of free energy that can be tapped by the interparticle interaction, even at large separations (Fig. 1a). We further suggested that this interfacial free energy contribution results in a force whose sign and magnitude may be given in terms of an interfacial electrical potential, , that depends on the nature of the solvent, with for water at an interface (refs. 27-29) (Fig. 1a; see Supplementary Information, section 3.1 for details).
The main experimental trends suggested by the interfacial solvation model are: (1) the breaking of charge-reversal symmetry in interparticle interactions, for example, negatively charged particles may attract in water, whereas positive particles repel; (2) the use of a different solvent may reverse this trend, that is, positive particles may attract whereas negatives repel; and (3) the magnitude of the solvation contribution to the interparticle interaction should depend strongly on the pH in solution. Here we report on comprehensive experimental tests of the contribution of the interfacial solvent to long-range interactions in solution. We demonstrate that the solvent can make a large contribution to the interparticle interaction and can counterintuitively drive the spontaneous formation of ordered assemblies of like-charged particles in solution. Furthermore, both the sign and magnitude of this free-energy contribution can have a decisive impact on the ability of a system of particles to self-assemble, and crucially we show that they are both amenable to careful tuning using a variety of particle- and solution-dependent parameters.
Measuring interparticle interactions in a two-dimensional suspension
We performed a range of experiments on two-dimensional (2D) suspensions of colloidal particles in solution and examined the dependence of the interparticle interaction on system properties such as pH and ionic strength of the electrolyte, particle charge and chemistry, and on the solvent molecular structure. We observed the spatial structure of the suspension using bright-field optical microscopy (Supplementary Information, section 1.5 and Supplementary Fig. 3) and constructed radial probability density distributions, , from the spatial coordinates of particles in a series of images. To infer the form of the underlying interparticle interaction, we performed Brownian dynamics (BD) simulations of interparticle interactions with various input potentials, , assuming pairwise additivity of the interactions, and generated simulated functions (Supplementary Information, sections 2.1 and 3.4). Here, denotes the interparticle separation between spheres of radius , at an intersurface separation (Fig. 1a). An iterative process permitted us to identify pair-potentials that were qualitatively consistent with the experimental data (Fig. 1b, top row; Supplementary Figs. 18-24 and Supplementary Tables 2-12). We also compared these experimentally inferred pair-potentials with a total interaction free energy, , calculated for a pair of identical particles using the interfacial solvation model (dashed lines with symbols in Figs. 1, 2 and 5, see Supplementary Information, sections 3.2 and 3.3). As implied by Supplementary Information equations (5)-(9), varying the value of in the theoretical model may result in a calculated that is purely repulsive, purely attractive, or a non-monotonic function displaying a minimum of depth at an intersurface separation . Parameter values for all calculated curves in this study are given in Supplementary Table 1.
Negative particles attract and positives repel in water
We first examined a system of colloidal silica particles of nominal diameter dispersed in deionized water with an estimated background ionic strength of . The measured electrical potential (zeta potential) in the vicinity of the particle surface, , is indicative of a strongly negative surface charge arising from a high density of ionized surface silanol groups. DLVO theory predicts strong interparticle repulsions under these conditions, implying the observation of a randomly dispersed 2D distribution of particles. In marked departure from this intuitive expectation, we noted that the particles spontaneously self-assembled into stable, slowly reorganizing, hexagonally close packed (hcp) clusters characterized by an intersurface separation of the order of , sharing similarities with previous reports (Fig. 1b, middle panels, and Supplementary Video 1). Here is the Debye length which is a measure of the spatial decay rate of the magnitude of electrostatic interactions, and in a solution of monovalent ions can be given in nanometers by , with in M . The spatial structure of the clusters, and the presence of large voids between clusters, implies the presence of a strong, long-ranged attractive interaction between particles of like charge. This attraction is counteracted by a repulsion at shorter range, giving rise to a stable pair-potential minimum at comparatively large separations . The measured profiles present periodic peaks of diminishing height, reflecting the ordered internal structure of finite-sized clusters-a characteristic signature of attractive interparticle interactions in solution (Fig. 1c, top panel). Simulations of interparticle interactions (snapshots in Fig. 1b, top row) and the corresponding inferred agree with calculated curves which capture both the experimentally inferred location of the minima, , and their depth, (Fig. 1 d (Supplementary Information, section 3.2). Here is Boltzmann’s constant and is the absolute temperature. Experiments performed for on negatively charged silica and carboxylated particles displayed similar trends.
Interaction potentials measured for isolated pairs of interacting particles display good agreement with the and values inferred from the ensemble experiments (Extended Data Fig. 1a-d, Supplementary Fig. 12 and Supplementary Information, section 4.2). This confirms that the observed cluster formation stems from a pair-potential that indeed carries a substantial attractive component, rather than from collective interactions in a system of purely repulsive particles . Furthermore, in contrast to previous suggestions concerning like-charge attraction, we find that the long-ranged attraction is unaffected by the surface properties of the underlying coverglass (Extended Data Fig. 1a-d and Supplementary Information, section 4.4) which agrees with previous measurements of attractive pair interactions in bulk solution and with theoretical expectations from the interfacial solvation model . Note that optical image processing artefacts play no role in our measurements of pair-interaction minima (Extended Data Fig. 1e-h, and Supplementary Information, section 4.3).
Turning to experiments on positively charged aminated silica particles under the same conditions, we found that particles remained randomly dispersed in solution as expected for a purely repulsive interparticle interaction (Fig. 1b, lowest row and Supplementary Video 1). The measured profiles were relatively featureless, and categorically devoid of the periodic structure characteristic of ordered clusters (Fig. 1c, lower panel). The corresponding profiles imply monotonically decaying repulsions in good agreement with the profiles calculated from the interfacial solvation model (Fig. 1d). The conspicuous absence of a long-ranged minimum in for positive particles contrasts with the strong attraction observed for negative particles, and suggests that the solvent is responsible for this striking qualitative departure from the expectation of charge-reversal symmetry in interparticle interactions.
pH controls the magnitude of the long-ranged force
Next we explored the influence of pH on the interaction between silica particles. Silica surfaces carry a variety of ionizable silanol groups that are characterized by different number densities and highly disparate values between 2 and 11 which implies a wide range of pH over which the surface ionizable groups may undergo a change in , their extent of ionization . We examined cluster formation in silica at a fixed ionic strength with pH varying from 4 to 10 and inferred the value of in each case. While denotes the depth of the minimum in an attractive pair-potential, we take for a purely repulsive pair-potential. For silica, we found that although the magnitude of decreased markedly with increasing pH , it remained substantial even at high (Fig. 2d and Supplementary Video 2). This occurs despite the fact that the electrostatic interaction, , is expected to grow in magnitude with increasing pH , progressively counteracting an attractive interfacial contribution that we expect to simultaneously weaken as . Here denotes the electrical surface potential of the particle (see Supplementary Information, section 3.1 for details). Importantly, we found that the observations can be qualitatively explained within the interfacial solvation model (Fig. 2a,d, top panels, Supplementary Information, section 3.5 and Supplementary Video 2).
To quantitatively explore the effect of pH , we examined the behaviour of carboxylated melamine resin ( COOH ) particles where the charge arises from carboxyl groups characterized by a nominal . We observed a clear maximum in the range of , in qualitative agreement with the trend expected for , as given by Supplementary Information equation (9) and discussed further in the Supplementary Information (Fig. 2a,d, middle panels, Supplementary Information, section 3.5 and Supplementary Video 3).
Fig. 2 | Tuning the interparticle interaction using the in solution.
a, Snapshots of colloidal suspension structure as a function of pH for silica particles (top), carboxylic acid particles (middle) and aminated silica particles (bottom), holding salt concentration constant in each data series: and . Scale bars, . Bold values indicate the pH at which hcp cluster formation is observed. , Radial probability density functions (curves) and measured zeta potentials (symbols) as a function of pH for all three particle types. Error bars represent mean s.d. from three measurements. The increasing height of the ‘dimer-peak’ (d.p.) with increasing pH for positive particles is indicative of increased sticking of particles due to discharging of the basic ionizable groups (bottom panel). c, profiles
inferred from measured profiles (solid lines; Supplementary Figs. 20-22 and Supplementary Tables 4-8), theoretical curves (dashed lines with symbols) calculated as described in ref. 27 and Supplementary Information, sections 3.2 and 3.3 (see Supplementary Table 1 for parameter values), and contribution for comparison (dashed-dotted grey line). denotes the maximum inferred depth of the experimentally observed minimum in each case. Error bars denote estimated uncertainties of in particle diameter and in (Supplementary Figs. 20-22). d, Plots comparing trends as a function of pH in the experimentally inferred quantity (symbols, left axis) with that of determined using Supplementary Information equation (9) (dashed curves, right axis). See Supplementary Fig. 25 for all raw image data.
Next, we examined the behaviour of positively charged aminated silica particles carrying a high density of amino groups ( ) of nominal . We did not observe cluster formation in positive particles
over the entire range of pH (Fig. 2a, bottom panel and Supplementary Video 4). In fact the curves reflected robust interparticle repulsions at large distances that were strongest at low values of (Fig. 2b,
Fig. 3 | The sign of the long-ranged force depends on the sign of charge of the interacting particles. a, Top: schematic depiction of a sequentially coated silica particle displaying four serial layers with alternating sign of coating charge. Bottom: chemical structures of charged polypeptides (poly-K and poly-E) and polyelectrolytes (PDADMAC and PSS) used for layer-by-layer coating of silica particles. b, Images of particle suspension structure following each coating procedure using charged polypeptides. Scale bar, . See Supplementary Figs. 23 and 25 for polyelectrolyte data, including PEI/PSS coatings, and raw images. c, Radial probability density functions and measured zeta potentials as a function of coating or layer number for polypeptide (left) and polyelectrolyte coatings (right). Error bars represent mean s.d. from three measurements. The alternating sign of zeta-potential values for each new coating layer confirms the change in sign of the particle charge. d, profiles inferred from measured profiles for particles with positively charged (pink curve) and negatively charged coatings (blue and green curves) with layer numbers in parentheses (Supplementary Fig. 23 and Supplementary Tables 9-11). At long range ( ), negatively charged particles (charge density ) display an attraction which implies that the interparticle force is attractive, that is, , whereas the converse is true for positively charged particles ( ) where we infer for all separations, which agrees qualitatively with DLVO theory. All experiments were performed at . Error bars denote estimated uncertainties of in particle diameter and in (Supplementary Fig. 23).
bottom panel). Under more alkaline conditions given by , the net charge on the particles decreases due to gradual deprotonation of the amino groups. This discharging of the amino groups correlates with a reduction in measured zeta potential and a consequent weakening of the interparticle repulsion (Fig. 2b, bottom panel), but the formation of stable, ordered clusters was never observed (Fig. 2a-c). This range of pH values ( ) may be contrasted with the equivalent pH range of 5-7 for carboxyl particles where we in fact observed the most stable clusters characterized by the deepest minima in interaction energy (largest ) generated by the long-ranged attractive force. We obtained similar results for silica particles coated with positively charged polyelectrolytes such as polyethyleneimine (PEI) (Supplementary Fig. 16). Thus we find that the measured pH dependence of interparticle interactions-for both signs of particle charge and a range of surface chemistries-carries key signatures of the solvation free-energy contribution, furnishing crucial validation of an interaction mechanism invoking charge-dependent solvent structuring at the solid-liquid interface.
Sequential switching between attraction and repulsion
To further probe the influence of surface chemistry on the interparticle interaction we examined the behaviour of negatively charged polystyrene sulfonate (PSS) surfaces. Isolated styrene sulfonic acid groups are highly acidic in free solution ( ) but are expected to be characterized by in the context of a polymer backbone . We produced PSS-coated silica particles using the layer-by-layer polyelectrolyte film deposition method . We first coated silica particles with a layer of positively charged poly(diallyldimethylammonium chloride) (PDADMAC) polymer, which switched the sign of the zeta potential from to . PDADMAC-coated silica particles in solution no longer formed clusters (Fig. 3). We then further coated PDADMAC-coated silica particles with a layer of PSS, which altered the zeta potential from approximately +40 mV to -70 mV . We found that the system of PSS-coated particles formed stable clusters in solution at , indicating the reappearance of long-ranged interparticle attractions, similar to uncoated silica particles. We then proceeded to sequentially coat these PSS particles with alternating layers of PDADMAC and PSS, confirming the sign of the particle charge after each coating procedure using zeta potential measurements. We consistently found that the long-ranged interparticle attraction could be switched on and off depending on the sign of charge of the most recent surface coating. Data from four layers of sequential coating are presented in Fig. 3 (Supplementary Video 5). Similar results were obtained with alternating coatings of positively charged PEI and negatively charged PSS(Supplementary Figs. 23 and 25). All polyelectrolyte coating experiments were performed at (Fig. 3 and Supplementary Fig. 23).
To continue exploring the generality of the ‘like-charge selfassembly’ phenomenon we turned our attention to the examination of the interactions of polypeptide surface coatings on silica particles. Poly-L-lysine hydrobromide (poly-K) and poly-L-glutamic acid sodium salt (poly-E) polypeptides are routinely used as surface coatings, generating positively and negatively charged surfaces on account of their ionized amino ( ) and carboxyl ( ) side-chain groups, respectively. Here again we found that whereas positively charged lysine surfaces repelled as expected (similar to PEI- and PDADMAC-coated particles), poly-E surfaces displayed long-ranged attractions similar to our carboxyl particles (Fig. 3d). Once again we were able to repeatedly alternate between attractions and repulsions in the particle suspension by sequentially coating the particles with poly-K and poly-E layers, a finding that carries strong implications for interactions in proteins.
The above experiments show that negatively charged silica surfaces ( ), carboxylated melamine resin particles ( ),
polystyrene sulfonate ( ) and polyglutamate ( ) coated polypeptide surfaces suspended in water support long-ranged interparticle attractions when the pH of the solution lies within a range of about 3 units above the of the ionizable groups. In contrast, positively charged particles display robust repulsions regardless of surface chemistry, and no evidence of a long-ranged attraction over the entire range of pH tested.
‘Chemical logic’ in cluster formation
Next, we performed experiments on mixtures of particles of different surface chemistry and observed the nature of the crystallites formed. Suspensions containing both COOH particles and particles displayed no cluster formation at high pH values, similar to each of the pure species, as expected (Fig. 4a,top). At pH values where each species is known to form clusters in the pure state (Fig. 2), we found that the mixture also formed hcp clusters composed of both species of particle with signatures in the reflecting both particle sizes (Fig. 4a, middle and Fig. 4d). We then performed experiments at where pure COOH particles do not form clusters, but particles do cluster. Interestingly, we found that rather than exclude the non-cluster-forming COOH species, the system displayed stable hcp clusters containing both types of particles (Fig. 4a, bottom and Supplementary Video 6). All these observations can be explained within the proposed interfacial solvation model of interparticle interactions (Supplementary Information, section 3.6). Specifically, it appears sufficient for one species of particle to be in the charge-regulating regime for an attraction between chemically dissimilar like-charged particles to manifest (Fig. 4b,c).
Thus we show that similar or identical chemistry is not a requirement for interparticle attraction, but that the electrical charge-state of the groups underpins a force with a general and tunable character that holds in a broad sense. Simply put, chemical properties of the particle
may enter the physics of the interaction via the of the ionizable groups. These observations could carry implications for the biological phase separation problem, for example, where strongly acidic RNA molecules participate in cluster formation in mixtures involving other charged molecular species such as proteins . To emphasize the connection with the biomolecular condensation problem, the silica particles in the clusters (Fig. 4a, bottom) may be seen to act as the ‘scaffold’, while the carboxyl particles act as ‘clients .
Negative self-attraction in water changes sign in alcohols
The question then naturally arises as to whether the type of charge asymmetry observed for the interparticle interaction in water could be altered in a different solvent on account of differences in molecular orientational behaviour at an interface. We first confirmed that positively charged amine-derivatized silica particles suspended in ethanol and isopropanol (IPA) displayed positive zeta potentials (Fig. 5c). We recall that these particles remained well dispersed when suspended in water (Figs. 1 and 2). In ethanol and IPA however, we found that positively charged particles formed stable crystalline clusters, displaying distributions reminiscent of attractive interactions generally encountered for negatively charged silica particles in water (Fig. 5b,c and Supplementary Video 7). Negatively charged carboxylated particles, on the other hand, remained well dispersed in both alcohols, did not form clusters and qualitatively echoed observations on positively charged particles in water.
Molecular simulations of ethanol and IPA indeed show that the normal component of the average molecular dipole can be inverted with respect to that of molecular water at a neutral surface; that is, interfacial molecules orient such that their comparatively hydrophobic methyl ( ) groups point towards a neutral surface (Fig. 5a and Supplementary Fig. 8b; Supplementary Information, section 2.2) . This molecular orientation gives an interfacial
Fig. 5 | Negative self-attraction in water switches to positive self-attraction in alcohols. a, Top: MD simulations of ethanol and IPA at an uncharged surface show that these molecules orient on average with their methyl groups pointing slightly towards the interface and their electronegative oxygen atoms pointing towards the bulk, giving an interfacial potential . Unlike water, the average interfacial molecular dipole moment (green arrow) points towards the surface. Bottom: various contributions to the total interaction free energy for positive (red lines) and negative (blue lines) particles: electrostatic repulsion, (black dotted line; applies to both signs of charge); interfacial solvation contribution, (dashed line, different for positive and negative); total interaction energy, (solid lines); and the vdW contribution, (dashed-dotted grey line; applies to both cases). When , positively charged particles may display a minimum in at an interparticle separation (solid red line), whereas negatively charged particles repel monotonically, displaying no minimum (solid blue line) (Supplementary Information, section 3.1). b, Right: experiments show that positively charged aminated silica particles (pink) form
hcp clusters, whereas negatively charged carboxylated particles (orange) do not form clusters in alcohols. Scale bar, . See Supplementary Fig. 25 for raw images. Left: BD simulations with appropriate input pair-interaction potentials recover the experimentally observed suspension structure.c, Measured radial probability density functions, , for positively charged particles (shades of pink) and negatively charged particles (shades of orange) in alcohols, including measured zeta potentials (circular symbols) for each case. Error bars denote s.d for three measurements. Experiments correspond to measured values of (see Supplementary Table 12 for details). d, Pair interaction potentials inferred for the experimental data from BD simulations (solid lines) for negative particles (orange) and positive particles (pink) (see Supplementary Fig. 24 and Supplementary Table 12 for details). Calculated curves as described in ref. 27 and Supplementary Information, sections 3.2 and 3.3 (dashed lines with symbols; see Supplementary Table 1 for parameter values). Error bars denote estimated uncertainties of in particle diameter and in (Supplementary Fig. 24).
solvation potential at zero surface charge that has a positive sign, that is, , which would suggest attraction between positive particles in our model. Attempts to experimentally probe the interfacial electrical potential have indeed suggested similar orientational behaviour and an inversion in sign of for alcohols at interfaces compared to water . Furthermore, the experimentally inferred curves are qualitatively captured by calculations of , as shown in Fig. 5d, yielding physically plausible model parameters (Supplementary Video 7, Supplementary Information, section 3.3 and Supplementary Table 1).
Interfacial solvation and biomolecular condensation
Finally, inspired by the spontaneous formation of tuneable clusters in like-charged microspheres in solution, we examine the implications of this long-ranged solvation force for the formation of reversible condensates at the molecular scale under physiological conditions, broadly encountered, for example, in the liquid-liquid phasesegregation problem in biology. We constructed a simple model of a protein as a sphere carrying surface-ionizable groups exposed to the solvent (Fig. 6a) and examined the pair-interaction energy, , of two spherical, charged molecules carrying five ionizable glutamic acid groups ( ), immersed in an electrolyte containing monovalent salt at a concentration in the range in the pH range 5.5-8 (Fig. 6, Supplementary Fig. 10 and Supplementary Information, section 3.7). We analysed the sign and magnitude of the total
interaction potential, , given by Supplementary Information equation (5), at a nominal intersurface distance of between the molecules.
We noted that the interparticle electrostatic repulsion, reflected in , is expected to be substantial over the range of pH and salt concentration considered since the molecules carry substantial net charge (of the same sign) (Fig. 6b). Interestingly, upon adding the interfacial contribution to the total free energy we found that the interaction could be expected to turn distinctly attractive (that is, relative to infinite separation), particularly at lower ionic strength and at pH values higher than the of the charged groups (Supplementary Fig. 10 and Supplementary Information, section 3.7). We then estimated the profile of a coexistence curve demarcating parts of the parameter space where phase separation may occur from regions where the molecules remain well dispersed. We found that the interfacial model suggests the counterintuitive formation of condensates of like-charged molecules at salt concentrations up to and at pH values as high as (Fig. 6c, right panel and Supplementary Information, section 3.7). Such behaviour has in fact been reported for proteins carrying net negative charge , for example, the negatively charged wild-type yeast protein Sup35 which carries a net excess of six acidic amino acids (aspartic and glutamic acids) over the number of basic side chains (lysine and arginine) in the domain that controls its phase-segregation response (Supplementary Fig. 10I) . A DLVO-type model of the same interaction, however, would not capture the experimental trends reported for Sup35 (Fig. 6c, left panel and Supplementary Information, section 3.7).
Fig. 6 | The charge-dependent solvation force can drive the formation of biomolecular condensates. a, Schematic representation of biomolecular condensate droplets formed from protein molecules depicted as spheres of radius carrying a negative electrical charge equivalent to a net surplus of five glutamic acid groups. Blue and red lines present two possible, qualitatively different interaction potentials (for example, or ) for a pair of interacting molecules where is the value of interaction energy at an intersurface separation of in either scenario. , Left: the calculated molecular charge attains its maximum value of at and remains substantially negative over a broad range of pH values. Right: calculation of the electrostatic interaction energy suggests a net repulsive interaction between two molecules for the relevant pH and range.c, Left: applying a pairwise interaction energy threshold for droplet formation of to the calculated value of we obtain no indication of phase separation from a DLVO perspective. Right: inclusion of the solvation free-energy contribution in the interaction potential yields a coexistence curve (black line) which displays pH and salt concentration dependence of droplet formation similar to the experimental observations (see Supplementary Information, section 3.7 for details).
Conclusion
This study provides compelling evidence for a profoundly different view of interparticle and intermolecular interactions with general implications for self-assembly and clustering of matter in solution, relevant even, for example, to the origin of life . The concerted action of electrical charge at an interface and the local interfacial solvation structure can give rise to an ‘electrosolvation force’ between objects in solution. As a rule of thumb, interparticle attraction between identical, nominally repulsive particles may be expected when the sign of the interfacial electrical potential, , in a particular solvent matches that of the sign of charge of the particle. The observations call for a re-evaluation of archetypal notions in biomolecular interactions, for example, that negatively charged poly-E stretches in proteins repel unequivocally in solution, which does not necessarily hold depending on the pH in solution (Fig. 2, middle panels). Like-charged molecules in solution may in fact experience a counterintuitive strong and long-ranged
attraction, even under physiological conditions. These results have further ramifications for interactions in solvent mixtures, and in solutions containing additives such as zwitterions, osmolytes, polyols or other overall electrically neutral molecules that are not expected to strongly influence the electrostatic interaction per se . Net-neutral molecular species in solution may alter the interfacial solvation structure due to the pure electrolyte and thus modify the total interaction between charged particles. The concept invoked here for longer-ranged interparticle and intermolecular interactions may well be found to hold for intramolecular interactions and conformational changes associated with nanometre-scale processes such as biomolecular folding. Finally, our findings provide evidence for the ability to probe the sign and magnitude of the interfacial electrical potential due to the solvent, previously believed to be immeasurable .
Online content
Any methods, additional references, Nature Portfolio reporting summaries, source data, extended data, supplementary information, acknowledgements, peer review information; details of author contributions and competing interests; and statements of data and code availability are available at https://doi.org/10.1038/s41565-024-01621-5.
References
Derjaguin, B. V. & Landau, L. Theory of the stability of strongly charged lyophobic sols and of the adhesion of strongly charged particles in solutions of electrolytes. Acta Physicochim. (USSR) 14, 30-59 (1941).
Verwey, E. J. W. & Overbeek, J. T. G. Theory of the Stability of Lyophobic Colloids (Elsevier, 1948).
Trefalt, G., Palberg, T. & Borkovec, M. Forces between colloidal particles in aqueous solutions containing monovalent and multivalent ions. Curr. Opin. Colloid Interface Sci. 27, 9-17 (2017).
Rau, D. C. & Parsegian, V. A. Direct measurement of the intermolecular forces between counterion-condensed DNA double helices. Evidence for long range attractive hydration forces. Biophys. J. 61, 246-259 (1992).
Kjellander, R., Marcelja, S., Pashley, R. M. & Quirk, J. P. Double-layer ion correlation forces restrict calcium clay swelling. J. Phys. Chem. 92, 6489-6492 (1988).
Levin, Y. Electrostatic correlations: from plasma to biology. Rep. Prog. Phys. 65, 1577-1632 (2002).
Haro-Perez, C. et al. Dynamic arrest in charged colloidal systems exhibiting large-scale structural heterogeneities. Phys. Rev. Lett. 102, 018301 (2009).
Krishnan, M., Moench, I. & Schwille, P. Spontaneous stretching of DNA in a two-dimensional nanoslit. Nano Lett. 7, 1270-1275 (2007).
Klug, A., Franklin, R. E. & Humphreysowen, S. P. F. The crystal structure of tipula iridiscent virus as determined by Bragg reflection of visible light. Biochim. Biophys. Acta 32, 203-219 (1959).
Kepler, G. M. & Fraden, S. Attractive potential between confined colloids at low ionic-strength. Phys. Rev. Lett. 73, 356-359 (1994).
Grier, D. G. A surprisingly attractive couple. Nature 393, 621-623 (1998).
Baksh, M. M., Jaros, M. & Groves, J. T. Detection of molecular interactions at membrane surfaces through colloid phase transitions. Nature 427, 139-141 (2004).
Ito, K., Yoshida, H. & Ise, N. Void structure in colloidal dispersions. Science 263, 66-68 (1994).
Matsuoka, H., Schwahn, D. & Ise, N. Observation of cluster formation in polyelectrolyte solutions by small-angle neutron scattering. 1. A steep upturn of the scattering curves from solutions of sodium poly(styrenesulfonate) at scattering vectors below . Macromolecules 24, 4227-4228 (1991).
Larsen, A. E. & Grier, D. G. Like-charge attractions in metastable colloidal crystallites. Nature 385, 230-233 (1997).
Musheev, M. U., Kanoatov, M., Retif, C. & Krylov, S. N. Stable DNA aggregation by removal of counterions. Anal. Chem. 85, 10004-10007 (2013).
Tata, B. V. R., Mohanty, P. S. & Valsakumar, M. C. Bound pairs: direct evidence for long-range attraction between like-charged colloids. Solid State Commun. 147, 360-365 (2008).
Langmuir, I. The role of attractive and repulsive forces in the formation of tactoids, thixotropic gels, protein crystals and coacervates. J. Chem. Phys. 6, 873-896 (1938).
Sogami, I. & Ise, N. On the electrostatic interaction in macroionic solutions. J. Chem. Phys. 81, 6320-6332 (1984).
vanRoij, R. & Hansen, J. P. Van der Waals-like instability in suspensions of mutually repelling charged colloids. Phys. Rev. Lett. 79, 3082-3085 (1997).
Sader, J. E. & Chan, D. Y. C. Long-range electrostatic attractions between identically charged particles in confined geometries: an unresolved problem. J. Colloid Interface Sci. 213, 268-269 (1999).
Ray, J. & Manning, G. S. Formation of loose clusters in polyelectrolyte solutions. Macromolecules 33, 2901-2908 (2000).
Chremos, A. & Douglas, J. F. Communication: Counter-ion solvation and anomalous low-angle scattering in salt-free polyelectrolyte solutions. J. Chem. Phys. 147, 241103 (2017).
Gonella, G. et al. Water at charged interfaces. Nat. Rev. Chem. 5, 466-485 (2021).
Nagata, Y., Ohto, T., Backus, E. H. G. & Bonn, M. Molecular modeling of water interfaces: from molecular spectroscopy to thermodynamics. J. Phys. Chem. B 120, 3785-3796 (2016).
Kung, W., González-Mozuelos, P. & De La Cruz, M. O. Nanoparticles in aqueous media: crystallization and solvation charge asymmetry. Soft Matter 6, 331-341 (2010).
Kubincová, A., Hünenberger, P. H. & Krishnan, M. Interfacial solvation can explain attraction between like-charged objects in aqueous solution. J. Chem. Phys. 152, 104713 (2020).
Behjatian, A., Walker-Gibbons, R., Schekochihin, A. A. & Krishnan, M. Nonmonotonic pair potentials in the interaction of like-charged objects in solution. Langmuir 38, 786-800 (2022).
Walker-Gibbons, R., Kubincová, A., Hünenberger, P. H. & Krishnan, M . The role of surface chemistry in the orientational behavior of water at an interface. J. Phys. Chem. B 126, 4697-4710 (2022).
Winter, E. M. & Groves, J. T. Surface binding affinity measurements from order transitions of lipid membrane-coated colloidal particles. Anal. Chem. 78, 174-180 (2006).
Gomez, E. W., Clack, N. G., Wu, H. J. & Groves, J. T. Like-charge interactions between colloidal particles are asymmetric with respect to sign. Soft Matter 5, 1931-1936 (2009).
Polin, M., Grier, D. G. & Han, Y. Colloidal electrostatic interactions near a conducting surface. Phys. Rev. E 76, 041406 (2007).
Crocker, J. C. & Grier, D. G. When like charges attract: the effects of geometrical confinement on long-range colloidal interactions. Phys. Rev. Lett. 77, 1897-1900 (1996).
Baumgartl, J. R., Arauz-Lara, J. L. & Bechinger, C. Like-charge attraction in confinement: myth or truth? Soft Matter 2, 631 (2006).
Darlington, A. M. & Gibbs-Davis, J. M. Bimodal or trimodal? The influence of starting pH on site identity and distribution at the low salt aqueous/silica interface. J. Phys. Chem. C. 119, 16560-16567 (2015).
Macias-Romero, C., Nahalka, I., Okur, H. I. & Roke, S. Optical imaging of surface chemistry and dynamics in confinement. Science 357, 784-787 (2017).
Ninham, B. W. & Parsegian, V. A. Electrostatic potential between surfaces bearing ionizable groups in ionic equilibrium with physiologic saline solution. J. Theor. Biol. 31, 405-428 (1971).
Dong, H. T., Du, H. B., Wickramasinghe, S. R. & Qian, X. H. The effects of chemical substitution and polymerization on the values of sulfonic acids. J. Phys. Chem. B 113, 14094-14101 (2009).
Polymenidou, M. The RNA face of phase separation. Science 360, 859-860 (2018).
Wadsworth, G. M. et al. RNAs undergo phase transitions with lower critical solution temperatures. Nat. Chem. 15, 1693-1704 (2023).
Parchure, A. et al. Liquid-liquid phase separation facilitates the biogenesis of secretory storage granules. J. Cell Biol. 221, e202206132 (2022).
Reif, M. M. & Hünenberger, P. H. Origin of asymmetric solvation effects for ions in water and organic solvents investigated using molecular dynamics simulations: the Swain acity-basity scale revisited. J. Phys. Chem. B 120, 8485-8517 (2016).
Paluch, M. Electrical properties of free surface of water and aqueous solutions. Adv. Colloid Interface Sci. 84, 27-45 (2000).
Randles, J. E. B. Structure at the free surface of water and aqueous electrolyte solutions. Phys. Chem. Liq. 7, 107-179 (1977).
Trasatti, S. Interfacial behaviour of non-aqueous solvents. Electrochim. Acta 32, 843-850 (1987).
Franzmann, T. M. et al. Phase separation of a yeast prion protein promotes cellular fitness. Science 359, 47-54 (2018).
Poudyal, R. R., Pir Cakmak, F., Keating, C. D. & Bevilacqua, P. C. Physical principles and extant biology reveal roles for RNA-containing membraneless compartments in origins of life chemistry. Biochemistry 57, 2509-2519 (2018).
Govrin, R., Schlesinger, I., Tcherner, S. & Sivan, U. Regulation of surface charge by biological osmolytes. J. Am. Chem. Soc. 139, 15013-15021 (2017).
Lyklema, J. H. Interfacial potentials: measuring the immeasurable? Substantia 1, 75-93 (2017).
Publisher’s note Springer Nature remains neutral with regard to jurisdictional claims in published maps and institutional affiliations.
Open Access This article is licensed under a Creative Commons Attribution 4.0 International License, which permits use, sharing, adaptation, distribution and reproduction in any medium or format, as long as you give appropriate credit to the original author(s) and the source, provide a link to the Creative Commons licence, and indicate if changes were made. The images or other third party material in this article are included in the article’s Creative Commons licence, unless indicated otherwise in a credit line to the material. If material is not included in the article’s Creative Commons licence and your intended use is not permitted by statutory regulation or exceeds the permitted use, you will need to obtain permission directly from the copyright holder. To view a copy of this licence, visit http://creativecommons. org/licenses/by/4.0/.
(c) The Author(s) 2024
Methods
Experimental methods
Preparation of particle suspensions for microscopy measurements. In our experiments we study the behaviour of three distinct types of microspheres with different surface chemistries. The three main classes of particle involve particles (Bangs Laboratories), amine-derivatized silica particles ( , referred to as ‘ ‘ or ‘ ‘ in the text) (microParticles) with an estimated group content of , and carboxylated melamine formaldehyde ( , referred to as ‘ or ‘ in the text) particles (microParticles) with a carboxyl group content of . The particle size distributions provided by the manufacturer are shown in Supplementary Fig. 1.
For experiments on and COOH particles in aqueous solution, particles were first rinsed (centrifuged and resuspended) in deionized water. Next, they were incubated in 5 mM NaOH ( , Alfa Aesar) solution for 10 min . Following this, they were centrifuged and resuspended in aqueous electrolyte of the required ionic strength around six times until the measured electrical conductivity of the supernatant solution converged to that of the pure electrolyte. Note that in general NaOH treatment is not essential, and overnight exposure to deionized water with subsequent rinsing in deionized water is an equally effective treatment prior to clustering experiments (Supplementary Fig. 11). However, NaOH pretreatment was necessary to observe strong clustering in COOH particles. particles were first rinsed in deionized water and then resuspended multiple times in aqueous electrolyte solution until the measured supernatant conductivity converged to that of the pure electrolyte. The suspension was further sonicated for cases in which a large population of ‘sticking’ particles were observed. The presence of stuck particles in the experimental data gives rise to small ‘dimer’ peaks at interparticle separations in the measured which cannot be entirely eliminated (indicated as ‘d.p.’ in Figs. 2b, 3c and 5c). In experiments on mixtures of and COOH particles (Fig. 4), the two types of particles were initially mixed at a ratio, then incubated in 10 mM NaOH solution for 10 min . Thereafter the procedures were the same as described above.
For experiments on colloidal dispersions in alcohols, particles were first centrifuged and resuspended in deionized water, followed by resuspension in either ethanol ( , Sigma-Aldrich) or IPA ( , Sigma-Aldrich). The process of centrifugation and resuspension was repeated multiple times until the value of the supernatant conductivity converged to that measured for the pure alcohol. COOH particles were first centrifuged and resuspended in deionized water, followed by resuspension in ethanol, and final resuspension in either ethanol or IPA for measurements.
Preparation and characterization of electrolyte solutions. For experiments examining the dependence of interparticle interactions on the ionic strength of the electrolyte (Fig.1), various concentrations of NaCl ( , Alfa Aesar) solution were prepared in deionized water; the measured conductivity of these solutions corresponds to a background concentration of monovalent ions of . The ionic strength of the various electrolyte solutions in our experiments was determined from measurements of electrical conductivity, , performed with a conductivity meter (inoLab Cond 7110). A calibration curve of standard solutions was used for this purpose (Supplementary Fig. 2).
To convert the measured electrical conductivity to a background salt concentration in alcohols, we used the same calibration relationship as for aqueous electrolytes as shown in Supplementary Fig. 2, but corrected the inferred concentrations for the viscosity of the alcohol as suggested in previous work (the viscosity values used for ethanol and IPA were 1.1 cP and 2.4 cP , respectively, see Supplementary Information, section 1.2).
In experiments exploring the pH dependence of interparticle interactions (Fig. 2), the pH of the electrolyte was adjusted to the desired
value by adding either HCl (99.999%, Alfa Aesar) or a Tris buffer ( , Carl Roth), to deionised water. Addition of acid or buffering agent to deionized water raised the conductivity of the solution to a value between 1 and depending on the target pH value. For experiments performed at variable pH , ionic strength in the electrolyte was maintained constant (to within ) across the entire range of pH in a given experimental series via the addition of a variable amount of NaCl . The pH value of the aqueous solution was taken as the mean value of three consecutive measurements using a pH meter (Horiba PH-33). The pH of pure alcohol samples was inferred by extrapolation of pH values measured for water-alcohol mixtures (Supplementary Fig. 2b).
Layer-by-layer coating of silica particles with polypeptides and polyelectrolytes. In the experiments presented in Fig. 3, we used alternating coatings of positively and negatively charged polyelectrolytes on plain particles. Coatings were applied in the following pairs of combinations of positively and negatively charged polyelectrolytes: poly-K ( ; Sigma) and poly-E ( ; Sigma); PDADMAC ( , 200,000-350,000; Aldrich) and PSS ( ; Aldrich), and finally, PEI ( ; Sigma) and PSS.
To coat the particles, plain particles were first centrifuged and resuspended in deionized water, followed by incubation in 5 mM NaOH solution for 10 min , resuspension in deionized water, and repetition of the resuspension process until the supernatant conductivity converged to that of deionized water. The rinsed particles were then incubated in the polyelectrolyte solution at for 20 min with occasional vortexing to improve mixing. The coated particles were centrifuged and resuspended in deionized water to remove any excess polymer and the resuspension procedure repeated until the conductivity of the supernatant no longer changed. Subsequent layers of polymer coatings were applied by repeating the coating procedure described above with the corresponding oppositely charged polyelectrolyte. The sign of the surface charge of each coating layer was confirmed by zeta-potential measurements (Zetasizer Nano Z, Malvern Panalytical).
Cuvette preparation and sample loading. We used a glass cuvette with a polished flat-well of 1 mm depth ( , Starna Scientific), as shown in Supplementary Fig. 3b, for all video microscopy measurements. The cuvette was cleaned with piranha solution ( mixture of concentrated sulfuric acid and hydrogen peroxide solution) and then rinsed thoroughly with deionized water. A glass cuvette naturally provides a negatively charged surface in water, ethanol and IPA for experiments with negatively charged particles. For experiments with positively charged particles, the entire cuvette was coated with PEI solution, rinsed and dried under nitrogen to provide a thin layer of positively charged polymer coating. To load the cuvette, the prepared particle solution was carefully pipetted into the well and sealed with the cover slide such that the device was free of air bubbles and held together by capillary force.
Microscopy. The optical microscope was constructed using a 470 nm light-emitting diode (LED) (M470L4, ThorLabs), a objective (Olympus UPlanSApo) and a charge-coupled device camera (DCU223M, ThorLabs) for recording images (Supplementary Fig. 3). The sample holder was placed onto a carefully balanced pitch and roll platform (AMA027, ThorLabs). Following complete settling of particles in suspension to a plane near the bottom surface of the cuvette, which typically takes about 2 min , the focus was adjusted such that a clear intensity maximum was observed for all particles. All measurements were performed after complete settling. The intensity of the LED was adjusted such that the intensity maxima of illuminated particles did not exceed the saturation value of the camera, enabling accurate particle localization.
Video recording and data processing. Sequential images of the 2D suspension of colloidal particles were taken with ThorCam software at a constant frame rate of 5,10 or 30 frames per second for 150-500 frames using an exposure time of . The images were processed based on the radial symmetry method using the TrackNTrace particle-tracking framework, where the particle centre maximum is detected . The localization precision for a static particle during a 100 s measurement at an exposure time of was found to be , as shown in Supplementary Fig. 4. In the analysis of experimental images, coordinates of all particle centres were extracted from the recorded frames, and the radial distribution function curve calculated and averaged over all images. To clearly distinguish between experiments on particles with different signs of particle charge in three different solvents, the recorded images were digitized and false-coloured (Supplemenetary Information, section 1.6 and Supplementary Fig. 3). The average particle detection efficiency over all experiments was >98%.
Simulation methods
BD simulations of interparticle interactions. We performed BD simulations of a 2D distribution of spheres interacting via an appropriately chosen input potential using the BROWNIAN package in the LAMMPS software . We inferred the required pair-interaction potentials, , underpinning the experimental data by varying the input potential to the BD simulations. We thus generated simulated radial probability distribution functions, , that matched the experimentally measurements. Validation and further discussion of the BD simulation set-up and approach are provided in Supplementary Information, section 2.1. Example input and necessary simulation files are provided in our Figshare repository, available at:https://doi.org/10.6084/ m9.figshare.c.6132003.
We assumed a pairwise interaction potential of the form: . Here the first term represents the overall repulsive electrostatic free energy of interaction, , with and the second term, , denotes the free-energy contribution arising from interfacial solvation . Note that . The third term represents the vdW attraction between silica particles in solution, for which we have used the expression in ref. 55.
BD simulations were performed by taking into account the experimentally determined polydispersity in particle size as shown in Supplementary Fig. 1. This implies that at the simulation level a variable particle radius is taken into account to the lowest level of approximation (that is, the interaction potential remains fixed and independent of the size of the particles, which would not be true in practice). Using a value of the Hamaker constant we found that made a small contribution ( ) to the total interaction energy at large separations, , that is, for the majority of experiments in this work . However, for experiments at higher salt concentrations ( ; Fig. 1d), the vdW interaction can make a more substantial contribution to the interaction at separations , and for this reason it was included in our expression for when modelling these measurements.
The experimentally measured curve provides an estimate of the the location of the minimum in the pair potential . In Supplementary Information equation (6), the screening length , which is known from the measured salt concentration. We then use a trial value of the interaction free energy at the minimum, , to obtain initial values for the parameters and as inputs for the pair-interaction potential, , using Supplementary Information equation (4), where we have taken , as suggested in ref. 28. We note, however, that this ratio is not a strict requirement and that we may also treat it as a free parameter which yields an alternate set of parameters and that can provide equally good qualitative agreement with the experimental data (see, for example, Supplementary Table 5).
Particle configurations for the BD simulations were initialized via random particle placement in a simulation box that reproduced the experimental particle density ( particles ). The polydispersity of the simulated colloids was drawn from the manufacturer’s size distribution for each particle type, as shown in Supplementary Fig. 1. Periodic boundaries were applied in the dimensions while the dimension was held finite. The coordinate of the colloids were fixed at a constant height throughout the simulation, ensuring a 2D system and thus mimicking the experiment. BD simulations were performed assuming that the interactions between the particles may be regarded as pairwise additive (discussed further in the main text and in Supplementary Information, section 3.4)
Convergence of the potential energy per particle in our BD simulations was monitored over time (Supplementary Fig. 5). Particle positions used for the calculation of the final simulated s were collected once the value of the potential energy reached a stationary value, after of simulation time in a run involving a strongly attractive of a well depth of several (Supplementary Fig. 5). Agreement between the simulated and the experimental s was assessed for a trial input pair-interaction potential and the value of the well depth adjusted in subsequent BD simulations if required, to obtain a final simulated best match with the experimental data. This procedure permitted us to infer the functional form of an underlying pair-interaction potential capable of capturing the experimentally measured .
Molecular dynamics simulations of alcohols at interfaces. The excess electrical potential due to the orientation of solvent molecules at an interface, or , is required as an input to the interfacial solvation model to calculate theoretical curves (Supplementary Information, section 3.2). To estimate as a function of surface electrical charge density, , we performed molecular dynamics (MD) simulations with the GROMACS MD code . We examined the behaviour of a solvent phase in contact with a model surface composed of oxygen atoms in a parallel-plate capacitor set-up, as described extensively in previous work . Example input files, force-field parameters and code for the analysis of the simulations performed in this study are available in our Figshare repository:https://doi.org/10.6084/m9.figshare.c.6132003.
Prior to running MD simulations in the capacitor set-up, we first ran preliminary simulations of a box of 7,500 IPA molecules, without the capacitor wall atoms, under constant pressure, maintained with the Parrinello-Rahman pressure-coupling method. The length of the box in was allowed to fluctuate while keeping the dimensions fixed to those of the capacitor walls of fixed area. This equilibrated slab of solvent was then sandwiched between capacitor plates comprised of positionally restrained oxygen atoms that only support Lennard-Jones interactions (Supplementary Fig. 7). In our simulations, IPA molecules were parametrized with the CHARMM36 force field . As in previous work, the plates are in area and are separated by of solvent medium in the direction . This ensures that any oscillations in the solvent density or dipole moment profiles attain bulk-like properties at a location in the middle of the capacitor. A subset of the atoms belonging to the first layer in each wall (in direct contact with the solvent) was randomly assigned a positive (left plate) or a negative charge (right plate) to generate an electric field of specific strength in the box while maintaining electroneutrality within the box. The capacitor system simultaneously yields estimates of for both positive and negative values of and provides a well-defined system for comparing solvation at a macroscopic surface with a continuum electrostatics model.
Next, a second round of equilibration was carried out for the entire capacitor system, including the capacitor walls, and consisted of a short NVT run with a velocity-rescaling thermostat, followed by 500 ps in an NPT ensemble where only the dimension of the box was allowed to fluctuate, keeping the the dimensions fixed. This ensured that solvent molecules were maintained at the correct density throughout
the simulation box. Following this procedure, production MD runs of 20 ns duration were performed in an NVT ensemble with trajectory frames written every 20 ps . The particle mesh Ewald method was used to evaluate the long-range electrostatic interactions using a grid spacing and a short-range cut-off of . The Lennard-Jones interactions were smoothed over the range of using the force-based switching function. We scaled the dimension of the box by a factor 2 for Ewald summation only and applied the 3dc correction of Yeh and Berkowitz to remove artificial polarization induced by neighbouring image dipoles . The orientation of solvent molecules as a function of distance from the walls was analysed to yield values that were used in the calculation of the interfacial free energy term, , as previously described .
Simulation files and code used to analyse the experimental and simulated data are available from our Figshare repository at: https://doi. org/10.6084/m9.figshare.c.6132003.
References
Kokot, G., Bespalova, M. I. & Krishnan, M. Measured electrical charge of in polar and nonpolar media. J. Chem. Phys. 145, 194701 (2016).
Stein, S. C. & Thiart, J. TrackNTrace: a simple and extendable open-source framework for developing single-molecule localization and tracking algorithms. Sci. Rep. 6, 37947 (2016).
Parthasarathy, R. Rapid, accurate particle tracking by calculation of radial symmetry centers. Nat. Methods 9, 724-726 (2012).
Thompson, A. P. et al. LAMMPS—a flexible simulation tool for particle-based materials modeling at the atomic, meso, and continuum scales. Comput. Phys. Commun. 271, 108171 (2022).
Hamaker, H. C. The London-van der Waals attraction between spherical particles. Physica 4, 1058-1072 (1937).
Valmacco, V. et al. Dispersion forces acting between silica particles across water: influence of nanoscale roughness. Nanoscale Horiz. 1, 325-330 (2016).
Ackler, H. D., French, R. H. & Chiang, Y.-M. Comparisons of Hamaker constants for ceramic systems with intervening vacuum or water: from force laws and physical properties. J. Colloid Interface Sci. 179, 460-469 (1996).
Abraham, M. J. et al. GROMACS: high performance molecular simulations through multi-level parallelism from laptops to supercomputers. SoftwareX 1-2, 19-25 (2015).
Vanommeslaeghe, K. et al. CHARMM general force field: a force field for drug-like molecules compatible with the CHARMM all-atom additive biological force fields. J. Comput. Chem. 31, 671-690 (2009).
Yeh, I.-C. & Wallqvist, A. On the proper calculation of electrostatic interactions in solid-supported bilayer systems. J. Chem. Phys. 134, 055109 (2011).
Yücel, H. & Okumuşoğlu, N. T. A new tracking algorithm for multiple colloidal particles close to contact. J. Phys. Condens. Matter 29, 465101 (2017).
Acknowledgements
The authors thank P. Hünenberger, R. Netz, H. Frost, A. Baldwin and C. Robinson for stimulating discussions, and A. Lawrence for early contributions to experiments. Funding was provided by the European Research Council (ERC) under the European Union’s Horizon 2020 research and innovation programme number 724180.
Author contributions
S.W. performed all experiments. R.W.-G. performed and analysed simulations. S.W. and R.W.-G. analysed the data and participated in manuscript preparation. B.W. and M.F. contributed to experiments. M.K. designed the research, performed theoretical modelling and wrote the manuscript.
Extended Data Fig. 1 | Direct measurement of pair-interaction potentials on isolated pairs of negatively charged particles in water. (a) Schematic
of COOH particles with centre-to-centre distance and intersurface separation denoted by and respectively (left). Experiments on a dilute suspension of particles (approximately factor 2 lower than for the cluster experiments) display a large number of isolated, strongly interacting ‘bound pairs’ of particles located several micrometres from other neighbouring particles as indicated (right). (f) Digital video microscopy snapshots of a single pair of interacting COOH particles of diameter over a period of 50 s . The particle images are characterised by a bright intense region at the centre, surrounded by a dark ring and associated diffraction pattern. (g) plot of an interacting pair of particles (inset) determined using the TrackNTrace particle tracking code employing the radial symmetry method , that is the particle tracking method used in all experiments in this work. data corresponding to measured (symbols) accompanied by a fit curve (solid orange line). Error bars on values for each of the measured points are derived from a shot-noise estimate (see Supplementary Section 4.2). The solid orange line may be compared with fits to data obtained by applying two different corrections to the measured interparticle distances, , according to ref. 61 (blue dashed line) and ref. 32 (green dashed line). All fits of data are to the form of Eq. S6 and details are outlined in Supplementary Fig. 13. Good agreement between the various curves shows that particle-tracking correction methods have a negligible effect on the inferred well depth and values of the underlying pair interaction potential. (h) Plot of the expected difference between the true and measured interparticle separation as a function of , for our experimental system, using the method of ref. 32 (see Supplementary Section 4.3). The maximum error in the inferred interparticle distance is comparable with the localisation accuracy and occurs at an interparticle separation corresponding to the distance of nearest approach .
Physical and Theoretical Chemistry Laboratory, Department of Chemistry, University of Oxford, Oxford, UK. The Kavli Institute for Nanoscience Discovery, Oxford, UK. ³These authors contributed equally: Sida Wang, Rowan Walker-Gibbons. e-mail: madhavi.krishnan@chem.ox.ac.uk