كشف إعادة هيكلة المحفز وتكوينه أثناء اختزال النترات الكهربائي من خلال المجهر الطيفي والتشغيلي المرتبط Revealing catalyst restructuring and composition during nitrate electroreduction through correlated operando microscopy and spectroscopy
تغيرت الهياكل والتركيبات في المحفزات الكهربائية أثناء التفاعل، مما يمكن أن يؤدي بدوره إلى إنشاء مراحل نشطة/انتقائية جديدة. إن تحديد هذه التغيرات أمر بالغ الأهمية لتحديد كيفية تأثير الشكل على الخصائص الحفازة، لكن الآليات التي تشكل بها ظروف التشغيل حالة عمل المحفز لا تزال غير مفهومة تمامًا. في هذه الدراسة، نوضح باستخدام المجهر الطيفي المرتبط في ظروف التشغيل أنه مع وجود تعريف واضح…تتطور المكعبات تحت ظروف تفاعل اختزال النترات الكهروكيميائي، وتتكون أنماط محفزات مميزة اعتمادًا على الجهد المطبق والبيئة الكيميائية. من خلال مطابقة المزيد من الأطر الزمنية للتغيرات الشكلية التي تم ملاحظتها عبر مجهر الإلكترون الناقل في الخلية السائلة الكهروكيميائية مع معلومات الحالة الكيميائية الزمنية التي تم الحصول عليها من مجهر الأشعة السينية الناعمة في حالة التشغيل، وطيف الامتصاص بالأشعة السينية الصلبة، وطيف رامان، نكشف أنيمكن تثبيته حركيًا جنبًا إلى جنب مع النحاس المعدني لفترات طويلة تحت ظروف مختزلة معتدلة بسبب تكوين هيدروكسيد السطح. أخيرًا، نوضح كيف يؤثر التفاعل بين الإلكتروليت والمح catalyst على انتقائية الأمونيا.
تفاعلات التحويل الكيميائي الكهروتحفيزي مثل تفاعل تقليل ثاني أكسيد الكربونوتفاعل اختزال النتراتتعتبر أساسية لتقدم حلول الطاقة الخضراء المختلفة. ومع ذلك، قد يكون من الصعب تحديد الأنواع النشطة من المحفزات في هذه التفاعلات، حتى عندما يُفترض أن الحالة المعدنية هي المرحلة المستقرة، لأن المحفز يمكن أن يغير حالته الأكسيدية أثناء التفاعل وفقًا للمؤثرات الخارجية. على الرغم من أن مخططات بوربايكسيمكن استخدامها لتبرير حالة الأكسدة/الطور المستقر عند مختلف الجهود المطبقة ودرجات الحموضة، وهي مخططات توازن لا تأخذ في الاعتبار حركيات الانتقالات الاختزالية والأكسدة وتأثيرها. غير شكل المحفز. على سبيل المثال، لا تتضمن المعلومات حول كيفية حدوث تحولات الأكسيد إلى المعدن، وكيف يمكن أن تعيد الوجوه المختلفة تشكيلها بشكل مختلف تحت نفس ظروف التفاعل، وكيف يمكن أن تؤثر التفاعلات بين المحفزات والكهارل على سطح المحفز، أو كيف يمكن أن تؤدي الوسائط التفاعلية والمنتجات إلى تغييرات إضافية.
التحدي هنا ذو شقين. أولاً، يجب توضيح الشكل الوظيفي للمحفز الكهربائي. ثانياً، يجب فك تأثير التغيرات الشكلية الملحوظة على الأداء التحفيزي. هناك فقط عدد قليل من الطرقالتي يمكن أن تصور
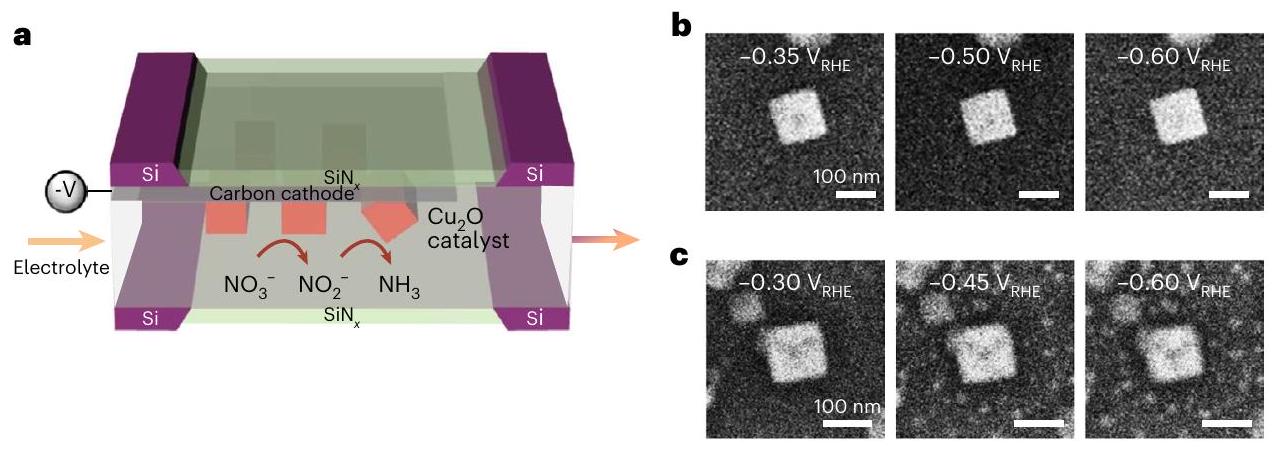
الشكل 1 | الاختلافات في إعادة الهيكلةالعوامل المساعدة بين و الـ خلال مسح الفولتمترية الخطية الأولية. أ، مخطط لتكوين تجربة EC-TEM حيثتم ترسيب المسبق على القطب العامل لشريحة EC-TEM قبل التجربة. ب، ج، لقطات تظهر إعادة هيكلةالمكعبات كما لوحظت بواسطة EC-TEM أثناء قياس الجهد الخطيالشروط
فيدرجة الحموضة 7 (الفيديو التوضيحي 1) (ب) وتسلسل الصور الذي يصف سلوك المكعبات المتماثلة في التركيب تحتالظروف فيمشبعدرجة الحموضة 6.8 في نطاق الجهد المطبق المماثل (الفيديو التكميلي 2) (ج). تدفق الإلكترونات المستخدم في هذه التجارب هو. ديناميات إعادة هيكلة النانو لمحفز ومتابعة المحفز كدالة للجهد المطبق وظروف الإلكتروليت. من الأكثر تحديًا حتى حل الحالة الكيميائية المحلية لهذه الميزات لأن معظم التقنيات التشغيلية لاستخراج المعلومات الكيميائية، مثل مطيافية رامان ومطيافية امتصاص الأشعة السينية (XAS)، هي طرق ‘عريضة الشعاع’، حيث تكون البيانات إشارة جماعية مستمدة من منطقة كبيرة تم فحصها. هذه الفجوة بين التصوير على النانو والمطيافية المتوسطة تحد من قدرتنا على تفسير كيف يؤثر شكل المحفز على الأداء العام لهذه التفاعلات المعقدة ولكن المهمة.
اليستحق الذكر بين التفاعلات المختلفة للتحويل الكهروكيميائي من حيث الأسئلة المتعلقة بمرحلة المحفز الكهربي العامل أثناء التفاعل. أولاً وقبل كل شيء، يقدم هذا التفاعل استراتيجية واعدة للتخفيف من تلوث المياه العذبة الناتج عن جريان الأسمدة الزراعية والنفايات الصناعية.وقد تم دراسته أيضًا لإمكاناته في إنتاج (المراجع 9-11)، مادة كيميائية صناعية هامة ومرشح لنقل الهيدروجين الأخضر. على الرغم من أن النحاس هو واحد من أكثر المواد المحفزة كهربائيًا التي تم دراستها لـبسبب طاقة امتصاص النترات المثلىسواء كان النحاس المعدنيأكاسيد النحاس أوواجهة الأكسيدهي الأنواع الرئيسية للاختيارظل التكوين غير محسوم إلى حد كبير. وفقًا لرسم برباكسيجب أن تكون المرحلة المعدنية للنحاس هي المرحلة المستقرة تحت الظروف النموذجيةالظروف، لكن الدراسات التي استخدمت مطيافية رامان في الموقع اقترحت أن هناك مرحلة أكسيد قد توجد أثناء التفاعلالنحاس وأكاسيده معروفة أيضًا بأنها عرضة للنقش.وتعديل الواجهةبواسطة. علاوة على ذلك، تم الإبلاغ عن أن يمكن أن يقود إلى انحلال ونمو جديد لمحفزات النحاس ذات الذرة الواحدةوتجمع الكتل الصغيرة في جزيئات نانوية أكبر.
في هذه الدراسة، نستخدم مجهر الإلكترون الناقل في الخلية السائلة الكهروكيميائية (EC-TEM) مصحوبًا بتحقيقات متعددة الأنماط المرتبطة في الوقت الفعلي والتي تشمل مجهر الأشعة السينية الناقل في الخلية السائلة الكهروكيميائية (EC-TXM)، وXAS في الوقت الفعلي، وطيف رامان في الوقت الفعلي لنفس المحفزات الأولية لرؤية كيف تتغير البنية والتركيب في الوقت الحقيقي.تتطور المكعبات كدالة للجهد المطبق خلال. وجدنا أن شكل المحفز الكهربائي العامل تحدده ثلاث عمليات: (1) ذوبان ، (2) إعادة ترسيب النحاس من معقدات النحاس القابلة للذوبان و (3) تقليل النحاس المعدني. كما اكتشفنا وجود تداخل بينمع النحاس المعدني لفترات تفاعل ممتدة، مما يوفر رؤى حول الأنواع النحاسية النشطة خلال.
لأجل تجارب المجهر أثناء التشغيل، قمنا بإعدادمكعبات على القطب الكهربائي الكربوني في EC-TEM رقائق عبر الترسيب الكهربائيكما هو موضح بشكل تخطيطي في الشكل 1أ. المادة المحضرةتبلغ متوسط حجم المكعبات 250 نانومتر وتتكون من ستةالوجوه دون التعرض للوجوه الثانوية الأخرى مثل أو (الشكل التوضيحي 1). جميع الفولتية المشار إليها في هذه الورقة مرجعة ضد القطب الكهربائي ثم تم تحويله إلى مقياس القطب الهيدروجيني القابل للعكس (RHE) باستخدام معادلة نيرنست ودرجة الحموضة الكلية للإلكتروليت. ومن المثير للاهتمام أن تسلسل الصور يظهر أن المكعبات لا تخضع لتغيير واضح في نمط نموذجيإلكتروليت لـ (الشكل 1ب) خلال المسح المحتمل الأولي نحو الجهود الكاثودية. وفقًا لرسم بوراكس، فإن الجهد الكهروكيميائي لتحويل إلى النحاس المعدني هوفي محلول ذو pH 7 (المراجع 20، 21) والنحاس المعدني هو الطور المستقر أدناهفما بعد، وبالتالييجب أن يتحول مباشرة إلى النحاس المعدني عند الجهود الزائدة الأعلى في المسح. استقرار الـ المكعبات ملحوظة لأن هذه التحولات الأكسدة والاختزال عادة ما تؤدي إلى تغييرات شكلية. للمقارنة، الشكل 1c يصور مكعب تحتالشروط فيمشبعبجهد مشابه لذلك المطبق فيتجربة. كما أبلغنا سابقًاتتعرض المكعبات الأخيرة للتفتيت مع إعادة ترسيب جزيئات صغيرة، وهو سلوك يختلف عن المكعبات الأكثر استقرارًا من الناحية الشكلية.تم الحصول على عينات عند نفس الجهود المطبقة. يتم عرض منحنيات الفولتمترية ذات المسح الخطي التي تم الحصول عليها خلال هذين التجربتين في الشكل التكميلية 1.
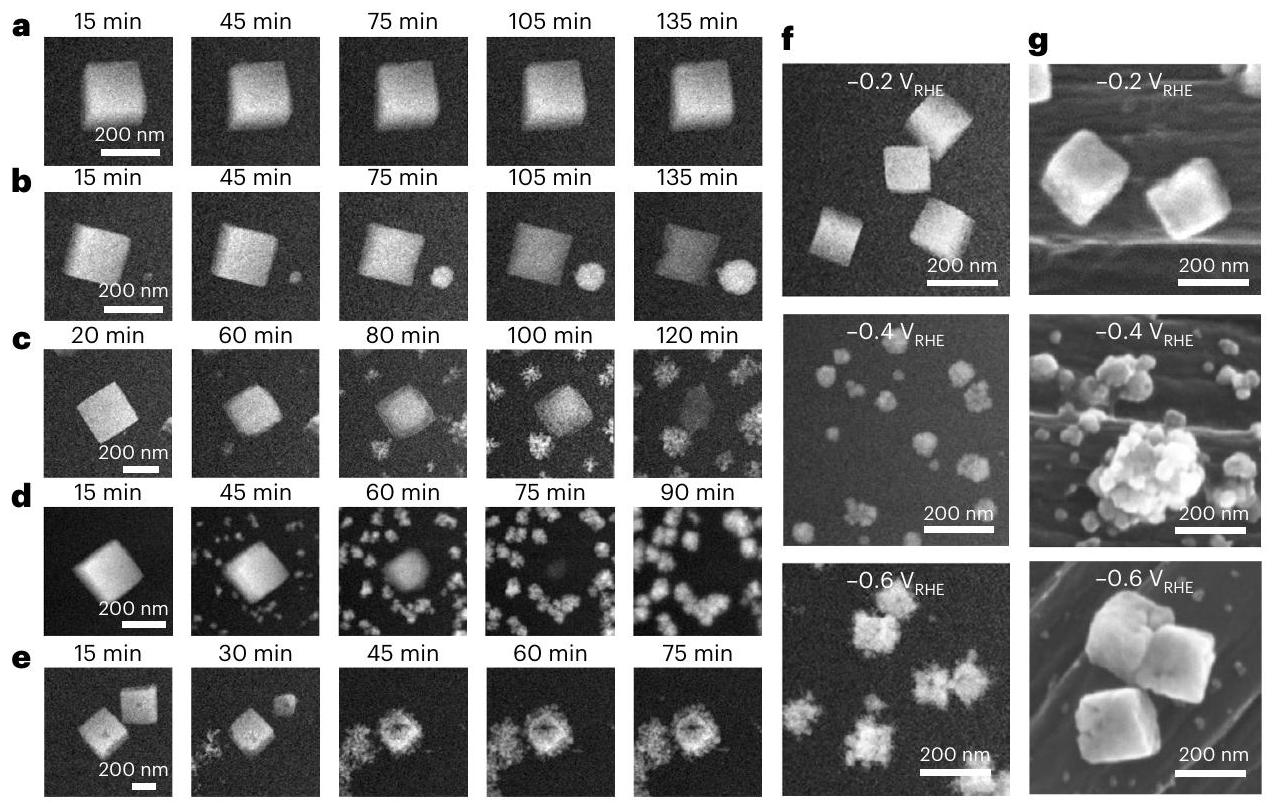
بعد ذلك، درسنا هذهمكعبات بشكل منهجي عند إمكانيات مستدامة مختلفة منإلى (الشكل 2أ-هـ) لاستكشاف المزيد من استقرارها الشكلي خلال . لهذه التجارب المطولة، اعتمدنا بروتوكول تصوير متقطع (حيث تم التقاط الصور بفواصل زمنية قدرها 15 دقيقة مع إيقاف شعاع الإلكترون بقية الوقت) لتقليل الذوبان الناتج عن الشعاع. المكعبات (انظر المناقشة في الملاحظة التكميلية 1) وضمان أن ديناميات إعادة هيكلة المحفز التي نستخرجها من البيانات المجمعة دقيقة قدر الإمكان. تُظهر ملفات التيار الكهروكيميائي على مر الزمن عند كل جهد تم قياسه في هذه التجارب EC-TEM في الشكل التكميلية 3. (الشكل 2أ)، كانت المكعبات مستقرة خلال فترة ملاحظتنا بالكامل، دون ملاحظة أي إعادة هيكلة ملحوظة. من -0.2 إلىالذوبان/إعادة الترسيب هو المسار الرئيسي لإعادة الهيكلة. عنداستمرت الشكل المكعب لمدة تقارب 135 دقيقة (الشكل 2ب)، بينما ذاب المكعب تمامًا بعد 140 دقيقة عند (الشكل 2ج) وبعد 90 دقيقة عند (الشكل 2د). يتم تفسير التباين الأخف لسطح المكعب في الشكل 2ج مقارنةً بوسط المكعب عند 60 و80 دقيقة من خلال أن زوايا المكعب وحوافه تم حفرها أولاً. التباين الأضعف للذوبان تشير المقارنة بين المكعبات ونمو جزيئات النحاس النانوية إلى أن المكعبات الذائبة كانت لا تزال في شكل أكسيد.
الشكل 2 | إعادة هيكلة تعتمد على الجهد والزمنمكعبات تم ملاحظتها باستخدام EC-TEM. أ-هـ، سلسلة زمنية تشغيلية لـ EC-TEMإعادة هيكلة المكعب تم الحصول عليها مع التصوير المتقطع في (ج)، و خلال التفاعل في الأوقات المحددة فيتم استخدام عينة جديدة عند كل جهد مطبق.
تدفق الإلكترونات المستخدم في هذه التجارب هومقارنة صور ما بعد التفاعل للتجارب في الموقع وخارج الموقع: صور EC-TEM بعد ساعتين عند كل جهد محدد (f)، وصور SEM لـمكعبات تم ترسيبها كهربائياً على ورق الكربون وتفاعلت على الطاولة لمدة ساعتين عند نفس الجهود المطبقة (غ).
اثنانتم التقاط المكعبات في الصور المأخوذة في (الشكل 2e). انكمش مكعب واحد وأعيد تشكيله إلى مكعب أصغر مع فراغ في المركز ثم أصبح أكثر خشونة بسبب ارتباط جزيئات نانوية صغيرة بسطحه، بينما ذاب مكعب آخر تمامًا في نفس الإطار الزمني. كما نبرز أن شدة المكعبات في صور TEM التي تم الحصول عليها من -0.3 إلىتنخفض تدريجياً، في حين أن شدة المكعب عندأكثر إشراقًا، مما يوحي بأن الإطار الشبيه بالمكعب فيهو معدني. علاوة على ذلك، فإن التفاعل بين الذوبان/إعادة الترسيب والتقليل المباشر عند الجهود الكاثودية الأكثر يعني أن أشكال المحفزات النهائية لمسبقات الأكسيد تختلف اعتمادًا على الجهد المطبق.
بعد ذلك، كررنا الـتجارب في خلية من نوع H معمكعبات تم ترسيبها كهربائياً على ورق الكربون لمقارنة اتساق نتائج EC-TEM مقابل هندسات التفاعل القياسية. الشكل 2f,g يظهر صوراً بتكبير منخفض لعناصر من تجارب EC-TEM مع صور مجهر إلكتروني مسح ضوئي (SEM) لعناصر مستخرجة من تجارب الخلايا من النوع H بعد ساعتين من التفاعل عند ثلاثة جهدات مطبقة مختلفة. و أنماط حيود الإلكترون المأخوذة من العينات المستخرجة بعد التفاعل تظهر أن المكعبات لم تخضع لإعادة هيكلة واسعة النطاق فيوابقَبينما تفاعلت العينات عندكانت في الغالب معدنية (الشكل التوضيحي 4). وعلى العكس، تفاعلت العينات عندعرض مزيج من المتبقي وهياكل النحاس المعدني (الأشكال التكميلية 4-6). الفروق الشكلية بين العينة بعد التفاعل في خلية من نوع H عند -0.4 ودعم إضافي بأن المحفزات تعيد هيكلتها بالفعل من خلال مسارات مختلفة كما هو موضح في تجارب EC-TEM الخاصة بنا. كما تظهر قياسات مطيافية الكتلة بالتحليل الطيفي المقترن بالحث للقطب الكهربائي والإلكتروليت في الخلية من النوع H بعد التفاعل أن ذوبان النحاس يحدث عند جميع الجهود المطبقة (الشكل التوضيحي 7). لذلك، تشير هذه التجارب إلى أنتخضع المكعبات لذوبان تدريجي تحتالظروف، التي تؤدي بدورها إلى إعادة ترسيب الجسيمات المعدنية في أماكن أخرى على القطب العامل بأشكال وأحجام يتم تعديلها بواسطة الجهد المطبق.
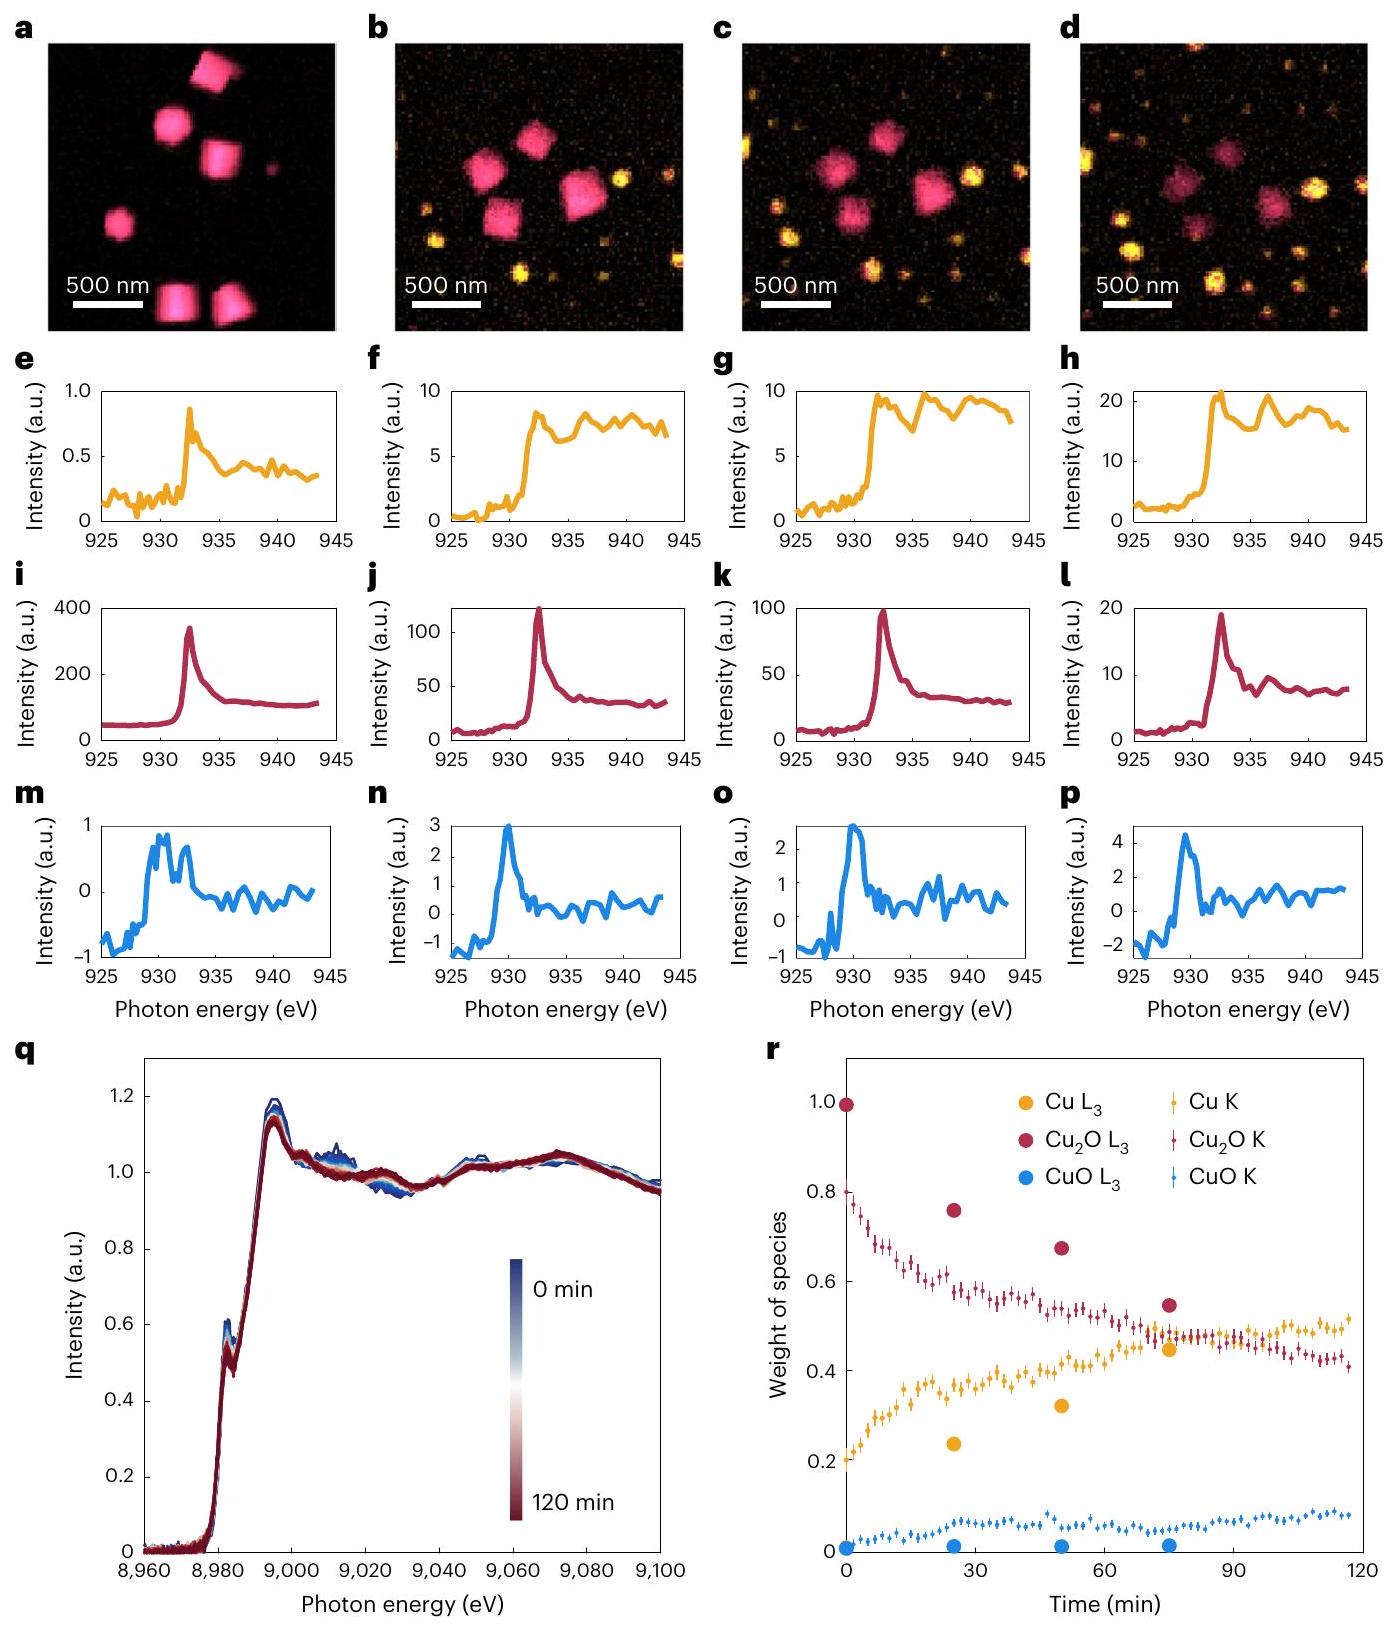
للحصول بشكل غير ملتبس على حالة الأكسدة للنوع الحفاز الموجود أثناء التفاعل واستبعاد إمكانية أن تم التعرف عليه خارج موطنهالطور هو نتيجة إعادة الأكسدة أثناء العودة إلى جهد الدائرة المفتوحة (OCP)، قمنا بإجراء قياسات EC-TXM أثناء التشغيل على مكعبات من خلال نقل حامل EC-TEM الخاص بنا إلى TXM في منشأة BESSY II السنكروترونية كما هو موضح في الشكل التوضيحي 8. هذه الترتيبات الفريدة تحافظ على نفس بيئة التفاعل بين التجربتين، بينما تتيح قياسات زمنية دقيقة لامتصاص حواف النحاس تحت جهد مطبق دون التأثير على تدفق الإلكتروليت المستمر لأن الأشعة السينية تتعرض للتخفيف بشكل أقل بواسطة الإلكتروليت والأغشية المحيطة مقارنة بالإلكترونات. وبالتالي، يمكن تتبع تطور تركيبة المحفزات الكهروكيميائية خلالتظهر الشكل 3أ-د التطور الزمني المحسوب لـالعوامل المساعدة خلالفيكما لوحظ بواسطة EC-TXM في شكل الخرائط الملونة التي تم إعادة بنائها من مجموعة صور XAS باستخدام تقنية الملاءمة الخطية (LCF). مُصوَّر باللون الأحمر والنحاس المعدني باللون الأصفر. تُظهر الخرائط أن والنحاس هما الطوران السائدان الموجودان طوال فترة وأن أكسيد النحاس والمراحل المعدنية تتواجدان تحت ظروف تفاعل محددة، ولكنها مفصولة مكانيًا. كما تم الكشف عن CuO (باللون الأزرق) ولكنه موجود فقط بكميات صغيرة وليس مرئيًا بوضوح من الخرائط. يتم عرض الأطياف المتحللة المقابلة في الشكل 3e-p، حيث تمثل الخطوط الصفراء والحمراء والزرقاء الأنواع المختلفة من النحاس. تمثل المساهمة الإجمالية للأطياف الفردية في الشكل 3e-p كمية (سمك) كل نوع، مما يشير إلى أن محتوى الأنواع المعدنية من النحاس يزداد (الشكل 3e-h) خلال التفاعل، بينماتنخفض (الشكل 3i-p). يتم مناقشة تفاصيل جمع البيانات ومعالجتها في الملاحظة التكميلية 3. والأهم من ذلك، تؤكد هذه النتائج على الحركية البطيئة للتقليل للكبيرةمكعبات فيالإلكتروليت، وأن المرحلة المعدنية تتشكل عندما يعيد ترسيب الأنواع النحاسية المذابة على القطب العامل بسبب الجهد الاختزالي المستخدم.
لقد تحققنا أيضًا من أن الانخفاض البطيء في مكعبات أكسيد النحاس يمتد إلى أحجام تفاعل أكبر من خلال قياسات XAS الصعبة أثناء التشغيل للعينات المودعة كهربائيًا على ورق الكربون في خلية XAS الكهروكيميائية التي قمنا ببنائها.. في الشكل 3q، نرسم التغيرات في حالات التكافؤ لحد النحاس K (من 8,950 إلى 9,105 إلكترون فولت) التي كانت
الشكل 3 | ربط التطور الشكلي بالتغيرات في الحالة الكيميائية لـالمحفزات السابقة خلالمع قياسات TXM و XANES أثناء التشغيل. أ-د، المحفزات النحاسية المتطورة مكانيًا وزمنيًا وحالاتها التكافؤية كما لوحظت باستخدام TXM. خريطة ملونة لـ المكعبات والعوامل الحفازة من النحاس المعاد ترسيبها قبل التفاعل في حالتها الجافة الأصلية (أ)، وبعد و استحواذ TXM علىفي. نحاس-شدة XAS عند الحافة المستخرجة من كومات صور TXM في الأشكال a-d، المدمجة من بكسلات فردية في المناطق الملونة من الصور ثم مفككة إلى ثلاثة مكونات حيث تتوافق الأطياف الملونة مع النحاس (الأصفر) (هـ-ط) (أحمر) (i-l) و CuO (أزرق) (m-p)؛ الحالة الأصلية (e,i,m) ، وبعد و ، قياس XANES عند حافة النحاس Kفي. يشير شريط الألوان إلى وقت الحصول على طيف XAS المعني من بداية القياسات. ر، التطور الزمني في أوزان النحاس، وأنواع CuO التي تم الحصول عليها من خلال ملاءمة النحاس و K الحواف المستخرجة من TXM في حالة التشغيل و XANES في حالة التشغيل، على التوالي. تشير أشرطة الخطأ في مجموعة بيانات XANES إلى الأخطاء المعيارية لإجراء التناسب. تم الحصول عليه من XAS أثناء التشغيل. يتم استخراج وزن حالة الفلز النحاسي من تحليل التركيب الخطي (LCF) لهيكل امتصاص الأشعة السينية بالقرب من الحافة (XANES) لمحفز النحاس المستمد من الأكسيد الذي تم جمعه عند جهد ثابت منفيالإلكتروليت. كما هو موضح في الشكل 3ر، فإن نسبةانخفضت، لكنها لم تختف تمامًا، بعد أكثر من ساعتين من التحليل الكهربائي، بينما زادت نسبة النحاس المعدني بشكل متناسب، في النهاية إلى ما يقرب مننسبة. تتفق نتائج XANES مع استمرار والتطور المستمر لأنواع النحاس التي تم رؤيتها في EC-TEM (الشكل 2c) و EC-TXM (الحواف في الشكل 3r) تؤدي إلىتم الكشف أيضًا عن كميات دقيقة من نوع CuO خلال التجربة. التغيرات في تظهر أوزان الأنواع الثلاثة مع مرور الوقت اتجاهات مشابهة في كل من TXM و XAS، مما يؤكد أن النتائج التي نحصل عليها في خلايا EC-TEM تتجاوز بالفعل إلى مجموعة أكبر من جزيئات المحفز.
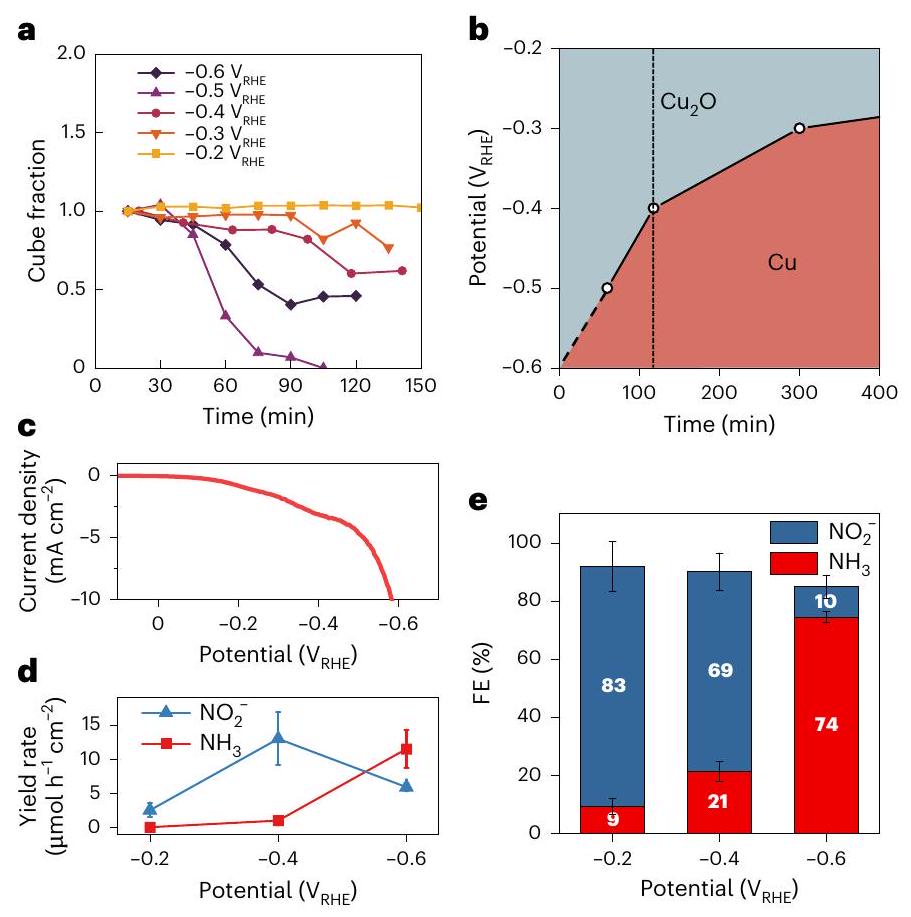
هذا الاتفاق العام بين الطرق المختلفة والهندسات التجريبية يعني أنه يمكننا استخدام تسلسلات صور TEM في الموقع لت quantifying معدلات الذوبان وإعادة الإيداع المعتمدة على الجهد. طريقتنا لاستخراج الكسر من صور EC-TEM والتحليل الإضافي للجزيئات المعاد إيداعها موصوفة في الملاحظة التكميلية 4. كما هو موضح في الشكل 4a، فإن كسر المكعب ينخفض مع مرور الوقت بمعدل متزايد مع انخفاض الجهد من -0.2 إلىالعينة فيينحرف عن هذا الاتجاه (أرجواني داكن
الشكل 4 | التطور الزمني لمراحل النحاس الأكسيدي والمعدني وتأثيره علىالانتقائية. أ، يتم حساب نسب المكعبات داخل صور EC-TEM عن طريق قسمة مساحة المكعبات المتفاعلة عند الزمنمنطقة المشروع الأولية لـالمحفزات السابقة عند الزمن 0 .ب، رسم يوضح المرحلة الرئيسية للنحاس عند إمكانيات مختلفة وأوقات تفاعل مختلفة. الخط الصلب يشير إلى الوقت المقدر لتقليل حجم الـمكعب بواسطة. الخط العمودي المتقطع يدل على ساعتين من . الخط المتقطع المائل يستنتج من 60 دقيقة عند إلى 0 دقيقة عندكأول صورة تم الحصول عليها بعد 15 دقيقة فيالتجربة تشير بالفعل إلى تقليل المكعب. ج، قياس الجهد الخطي للجهد الكهربائي المودع.مكعبات على ورق الكربون مقاسة من 0.1 إلى. د، هـ، معدل العائد من و (د) و الـ FE من المنتجات (هـ) في و تشير أشرطة الخطأ في (د، هـ) إلى الانحراف المعياري لثلاث قياسات مستقلة.
خط) بسبب التخفيض المباشر لـإلى النحاس المعدني. في الشكل 4ب، نستخدم معدل ذوبان المكعب لتقديرنسبة النحاس عند جهد معين واستخدامها لتصور المرحلة السائدة (>50%) في أوقات مختلفة. نقارن أيضًانسبة النحاس معنشاط التحويل (كثافة التيار) والانتقائية (الكفاءة فاراداي (FE)) التي تم الحصول عليها من قياساتنا الكهروكيميائية على الطاولة. في الشكل 4c، نرسم مخطط الجهد الخطي.مكعبات تم إعدادها على ورق الكربون، وفي الشكل 4d، e، نعرض توزيع منتجاتها كدالة للجهود المطبقة. تم قياس معدل العائد ونسبة الكفاءة نحوكانت أعلى بكثير عندأقل من -0.2 و، مما يوحي بأن التغيير في الانتقائية الحفزية مرتبط بمعدل التحويل الأسرع من أكسيد إلى معدن في (الشكل 4ب).
بعد ذلك، قمنا بإجراء دراسات EC-TEM في تركيبات مختلفة من الإلكتروليت لتوضيح الآلية وراءالتثبيت. الشكل التكميلي 9a وb يصف التجارب باستخدام النقي و (أي تقليل النيتريت)، على التوالي. في كلا الحالتين، تصرفت المكعبات بشكل مشابه لسلوكها في ، حيث تقلصت تدريجياً في الحجم حتى تتفتت/تقلص خلال فترات التفاعل الأطول، مما يعني أنالاستقرار مرتبط بـالالكتروليت الداعم وليس المتفاعل. ومع ذلك، كانت إعادة الترسيب أقل بكثير فيمن فينظائرها التي تحتوي على -نحن نعزو هذا الاختلاف إلى كيفية اختلاف الرقم الهيدروجيني المحلي أثناء الاختزال الكهربائي في وجود وغياب الأنواع. تحت الجهود الكاثودية المطبقة، يزداد الرقم الهيدروجيني على سطح المحفز الكهربي مع تكوين أيونات الهيدروكسيل بسبب تقليص، على سبيل المثال،و. على وجه الخصوص، يؤدي ذلك إلى تيارات أعلى وبالتالي زيادة حادة في الرقم الهيدروجيني المحلي مقارنةً عندما يحدث فقط اختزال الهيدروجين. يمكن أن تجعل هذه العملية الرقم الهيدروجيني لمحلول إلكتروليتي محايد يتجاوز 12 (مرجع 34)، مما يحفز تكوين هيدروكسيدات النحاس القابلة للذوبان. للتحقيق في تأثير الرقم الهيدروجيني للإلكتروليت، قمنا بإجراء تجارب في 0.1 م.حيث تم زيادة الرقم الهيدروجيني إلى 10 عن طريق إضافة NaOH. كما هو موضح في الشكل التكميلي 9c، فقد غير ذلك كمية إعادة الترسيب الملحوظة. أخيرًا، لاستكشاف تأثير أيونات الأمونيوم، قمنا عمدًا بإضافةإلىحمل الإلكتروليت، مما أدى إلى إعادة هيكلة سريعة للمكعبات كما هو موضح في الشكل التكميلي 9d.
لشرح هذه النتائج، نعتبر استقرار الطور للنحاس كدالة لـ pH وفي وجودسلسلة معقدة من التفاعلات تشمل كيمياء الأحماض والقواعد المختلفة،تكون الرواسب وتكوين الأيونات المعقدة معروفان لـنظام (الملاحظة التكميلية 5). على وجه التحديد، التوازن بين الحالة الصلبة و الـ يعتمد التعقيد علىتركيز، معتفضيل الترسيب عند التركيزات المنخفضة بسبب ضعف الذوبانية لـ (المرجع 36). نفترض أن الانخفاض البطيء الملحوظ قد يكون نتيجة لسطح مؤقتالتكوين الناتج عن ارتفاع درجة الحموضة عند الواجهة خلالقد تكون التشكيلات أكثر ملاءمة فيبسبب عدم قدرة الإلكتروليت على تخفيف الزيادة في الرقم الهيدروجيني المحلي الناتجة عن الاختزال الكهربائي، مقارنةً بـالإلكتروليت المستخدم في، مما أدى إلى الاختلافات في سلوكيات إعادة الهيكلة. للتحقق من هذه الفرضية، درسنا التغيرات الكيميائية التي تحدث على سطح الـمكعبات مع قياسات رامان التشغيلية.
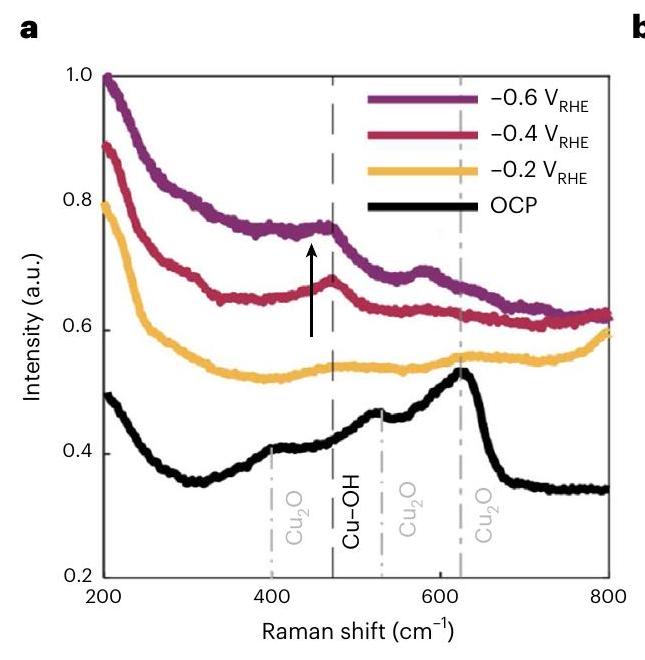
تظهر الشكل 5a نتائج التجارب عند جهد ثابت تم إجراؤها باستخدام مكعبات تم ترسيبها كهربائياً على ألواح من الكربون الزجاجي. عند جهد الدائرة المفتوحة، يظهر طيف رامان ثلاث ميزات من الأطياف المركزية عند 415 و520 و، على التوالي، والتي تتوافق بشكل جيد مع القيم المبلغ عنها لـ (المراجع 38، 39). عندما تم تطبيقه، شدة الطيف عند 520 وانخفضت مع مرور الوقت لكنها استمرت في الوجود، وهو ما يتماشى مع الذوبان التدريجي لـ. في ذروة جديدة عندبدأت تظهر، بينما الذروة فيمُسطّح، مما يدل على انتقال الأكسيد إلى المعدن. عندالأشرطة المميزة لـكانت أقل وضوحًا وظهرت نطاقات ضعيفة إضافية عند 450 و475 و. الفرقة حول يمكن تعيينه إلىاهتزاز أو (المرجع 40)، بينما الذروة عند غالبًا ما يُنسب إلى CuO (المرجع 38) أو أنواع الأكسجين الممتصة على النحاس. تشير هذه النتائج إلى تشكيل مرحلة أكسيد أو هيدروكسيد مؤقتة خلال التحليل الكهربائي، وهو ما تدعمه أيضًا الوجود الممتد لـالتوقيعات والضعيف ولكن المستمرتوقيعات في قياسات EC-TXM وXAS أثناء التشغيل في الشكل 3. ومع ذلك، كان من الصعب الحصول على توقيعات رامان للامتصاصات مع هذه العينات بسبب التحميل المنخفض نسبيًا للمكعبات التي تمكنا من ترسيبها كهربائيًا وتداخل نطاقات D/G لدعم الكربون الزجاجي مع نطاقات الامتصاص السطحية، مما يحد من نسب الإشارة إلى الضوضاء في تلك النطاقات. لذلك، قمنا بتكرار قياسات رامان مع مكعبات تم ترسيبها كهربائيًا بتحميل أعلى على ورق الكربون لتحسين نسب الإشارة إلى الضوضاء لتحديد الأنواع الممتصة على السطح أو الأنواع الوسيطة في محيط القطب الكهربائي. يتم مناقشة هذه النتائج في الملاحظة التكميلية 6.
ومن ثم، نصل إلى آلية إعادة هيكلة، موضحة في الشكل 5ب، وفقًا لها تتشكل الهيدروكسيدات السطحية أولاً علىالمكعبات بسبب زيادة الرقم الهيدروجيني الناتجة عن التحليل الكهربائي، مما يؤخر اختزال الأكسيد. اللاحقالإنتاج وزيادة درجة الحموضة الناتجة عن الاستمرارثم زعزعة هذه الطبقة الهيدروكسيدية وتشكيل معقدات النحاس القابلة للذوبان، مما يؤدي إلى بدء تطور المحفز من خلال إعادة ترسيب من اختزال معقد النحاس أو تجمع الجسيمات النانوية المهاجرة. كما أجرينا المزيد من تجارب EC-TEM للتحقق من أن حركيات إعادة الهيكلة المتأخرة تمتد إلى أشكال مسبقة أخرى للمحفز. يصف الشكل التكميلي 10 التطور خلال الـمنأوكتاهيدرات مقطوعة وإطارات معدنية تم إنشاؤها بواسطة
الشكل 5 | استكشاف تغييرات كيمياء السطح فيمكعبات باستخدام مطيافية رامان أثناء التشغيل ومخطط يوضح إعادة هيكلة المحفز التي تتوسطها تكوين أكسيد/هيدروكسيد. أ، طيف رامان أثناء التشغيل لـمكعبات تم ترسيبها كهربائياً على الكربون الزجاجي تم قياسها خلالفيفي OCP، و تم رسم متوسط القياسات الـ 12.
تقليل مسبق لـالمكعبات. كلا العينتين مستقران خلال مرحلة التفاعل المبكرة. مع مرور الوقت، لوحظ إعادة ترسيب مشابهة لتلك التي شوهدت في المكعبات فيالأوكتاهيدرا، في حين كان من الملحوظ أن إعادة الترسيب كانت قليلة مع الإطارات المعدنية، ربما بسبب حدوث ذوبان أقل عندما نبدأ من المحفزات المعدنية.
تظهر التجارب المرتبطة بالمجهرية والطيفية المقدمة هنا إذن أن شكل المحفزات النحاسية خلالفي درجة حموضة معينة، يتم التحكم في ذلك من خلال تفاعل معقد يعتمد على الزمن والجهد الكهربائي لثلاث عمليات: (1) ذوبان أكاسيد وهيدروكسيدات، (2) إعادة ترسيب المعادن و(3) اختزال المحفزات الأكسيدية. وفقًا لرسم بوراكس.النحاس المعدني هو النوع المستقر الوحيد تحت الجهود المحددة ودرجة الحموضة في تجاربنا، لكننا أظهرنا أن الأطوار الأكسيدية والمعدنية يمكن أن تتواجد معًا لفترات طويلة وعلى نطاق واسع من الجهود المطبقة، مما له تداعيات خطيرة من حيث تحديد الأنواع النشطة لإنتاجلقد تم الاقتراح سابقًااستنادًا إلى قياسات الطيفية أثناء التشغيل لمسبقات CuO، أنالواجهات مسؤولة عنإنتاج، ولكن هذه الطرق لا يمكنها التمييز بين توزيع هذه الأنواع على النانو. كما أظهرنا في هذا العمل، فإن وجود كلا التوقيعين الطيفيين في قياسات متوسط المجموعة لا يعني بالضرورة أن المرحلتين متصلتان مكانيًا. علاوة على ذلك، لقد أثبتنا أن مراحل النحاس المعدني والنحاس الأكسيدي المنفصلة يمكن أن تستمر لفترات طويلة عند إمكانيات كاثودية معتدلة (أقل من )، وأن هناك وفرة متبقية عالية من في قياسات XAS أثناء التشغيل كانت تت correspond إلى مستوى منخفضكفاءة الإنتاج في بيانات التحليل الكهربائي لعينات مكافئة. تحسينالانتقائية مع زيادة الطابع المعدني العام للعناصر تشير بالتالي إلى أن النحاس المعدني، بدلاً من، هي المرحلة النشطة للإنتاج، تماشيًا مع الأعمال الأخيرة حول الموضوع. في هذه الحالة، الاستقرار القوي لـالمكعبات وحركتها البطيئة في تقليل الكينتيك المستخدمة غالبًاالالكتروليت الحامل ضار بـالإنتاج عن طريق تأخير بدء الانتقاءتشكيل.
من خلال إظهار السلوكيات المتنوعة التي يمكن استنباطها في إلكتروليتات مختلفة وتحت مجموعة من ظروف التفاعل، يوضح عملنا أيضًا الحاجة الملحة للانتباه إلى كيفية تأثير الإلكتروليت على إعادة هيكلة المحفزات واستقرار المراحل الأكسيدية والهيدروكسيدية والمعدنية قبل أن نحاول تعميم النتائج.
السهم يبرز القمة عندتمت القياسات باستخدام عينة جديدة لكل جهد محتمل. الرسم التخطيطي يصف آليات إعادة الهيكلة المحتملة اعتمادًا على الجهد الكاثودي المطبق وكيفيةقد يكون التوازن هو الذي يتحكم في عملية الذوبان/إعادة الترسيب. عبر دراسات وتفاعلات مختلفة. حتى الآن، كانت وصف تأثيرات الإلكتروليت في التحليل الكهربائي محصورة إلى حد كبير في تأثيرات امتصاص الكاتيونات. وإعادة الهيكلة الناتجة عن الأنيونات الهاليدية العدوانية بينما كانت الدراسات حول الرقم الهيدروجيني تركزت على تأثيره على آليات التفاعل والانتقائيةوليس استقرار مرحلة المحفز. سيكون من الضروري إجراء عمل مجهرية إضافي كبير، مثل الذي تم تقديمه هنا، لفصل تأثير التحول الشكلي المدفوع بالكهارل عن التغيرات الإلكترونية والكيميائية المرتبطة التي تم فهمها بشكل أفضل. علاوة على ذلك، لا تزال النماذج الحاسوبية الحالية غير قادرة على تفسير تأثير الكهارل المعقد الصريح على إعادة هيكلة المحفز وتأثيره المرتبط على إنشاء مواقع نشطة. ستتطلب الجهود المبذولة لتحسين هذه النماذج وتطوير النظرية التي تصف العمليات الكهروكيميائية بلا شك تمثيلات أكثر دقة لأسطح المحفز الديناميكية. التحدي هنا جاد لأن الفهم الميكانيكي النظري يجب أن يأخذ في الاعتبار عمليتين ديناميكيتين تحدثان في الوقت نفسه، وهما العملية التي يخضع لها مادة المحفز والأخرى التي تختبرها المتفاعلات، وكلاهما مرتبطان ومدفوعان بالجهد الكيميائي المحلي.. تكشف نتائجنا التي تظهر تواجد الأطوار المتزامنة أيضًا عن إمكانية أن تكون أنواع مختلفة مسؤولة عن تنشيط خطوات محددة من تفاعل التحويل (على سبيل المثال، أكسيد لـإلىوالمعدن لـإلىلذا، نتوقع أن تلعب الأساليب التشغيلية التي تتضمن المجهر الكيميائي المحلول ضمن التحقيقات الطيفية متعددة الأوضاع، كما هو موضح هنا، دورًا حيويًا في تعزيز فهم العمليات الكهروكيميائية من خلال توفير طريق لرسم خريطة لهذه التعقيدات.
باختصار، كشفت قياسات EC-TEM و EC-TXM أثناء التشغيل أن الأشكال الهندسية لـالمحفزات السابقة خلالوأن مسارات تطورها حساسة لزمن التفاعل، والجهد المطبق، وطبيعة الإلكتروليت. كما هو متوقع، فإن معدل اختزال الأكسيد يتسارع مع زيادة الجهود السلبية المطبقة، ولكن يمكن أن تتواجد مراحل الأكسيد والمعادن المنفصلة مكانيًا على مدى أوقات تفاعل ممتدة تحت جهود مختزلة معتدلة. والأهم من ذلك، أن حركيات عمليات إعادة الهيكلة المختلفة، التي تم الكشف عنها هنا، تحدد الشكل النهائي للمحفزات. تشير نتائجنا أيضًا إلى أن طبيعة الإلكتروليت يمكن أن تُدخل تغييرات في الانتقائية تعتمد على الزمن في المراحل المبكرة من إعادة هيكلة المحفز، مما سيساعد في حل الجدل المستمر بشأن الحالة النشطة للنحاس من أجل الانتقائية.الإنتاج.
أخيرًا، يؤثر هذا العمل على فهمنا لكيفية تطور المحفزات الكهربائية تحت ظروف التفاعل من خلال اكتشاف استقرار أكسيد وهيدروكسيد النحاس. بالإضافة إلى ذلك، كشفنا عن تباينات هيكلية وكيميائية محلية تتطور تحت ظروف العمل الكهروكيميائية، حتى على عينة مسبقة التحفيز تم تصنيفها في البداية من حيث الحجم والشكل والتوزيع التركيبي الضيق. وبالتالي، تؤكد نتائجنا على الحاجة إلى طرق التصنيف أثناء التشغيل لإقامة روابط بين الخصائص الهيكلية والتركيبية للمواد تحت بيئات التفاعل المحددة والمحفزات الخارجية وأدائها الكهروكيميائي.
المحتوى عبر الإنترنت
أي طرق، مراجع إضافية، ملخصات تقارير Nature Portfolio، بيانات المصدر، بيانات موسعة، معلومات تكميلية، شكر وتقدير، معلومات مراجعة الأقران؛ تفاصيل مساهمات المؤلفين والمصالح المتنافسة؛ وبيانات توفر البيانات والرموز متاحة علىhttps://doi.org/10.1038/s41563-024-02084-8.
References
Gao, D., Arán-Ais, R. M., Jeon, H. S. & Roldan Cuenya, B. Rational catalyst and electrolyte design for electroduction towards multicarbon products. Nat. Catal. 2, 198-210 (2019).
Popović, S. et al. Stability and degradation mechanisms of copper-based catalysts for electrochemical reduction. Angew. Chem. Int. Ed. 59, 14736-14746 (2020).
Yang, J. et al. Potential-driven restructuring of Cu single atoms to nanoparticles for boosting the electrochemical reduction of nitrate to ammonia. J. Am. Chem. Soc. 144, 12062-12071(2022).
Hu, Q. et al. Reaction intermediate-mediated electrocatalyst synthesis favors specified facet and defect exposure for efficient nitrate-ammonia conversion. Energy Environ. Sci. 14, 4989-4997 (2021).
Pourbaix, M. Atlas of Electrochemical Equilibria in Aqueous Solutions (National Association of Corrosion Engineers, 1974).
Bergmann, A. & Roldan Cuenya, B. Operando insights into nanoparticle transformations during catalysis. ACS Catal. 9, 10020-10043 (2019).
Zhu, Y., Wang, J., Chu, H., Chu, Y.-C. & Chen, H. M. In situ/ operando studies for designing next-generation electrocatalysts. ACS Energy Lett. 5, 1281-1291 (2020).
Wang, Z., Richards, D. & Singh, N. Recent discoveries in the reaction mechanism of heterogeneous electrocatalytic nitrate reduction. Catal. Sci. Technol. 11, 705-725 (2021).
Jiao, F. & Xu, B. Electrochemical ammonia synthesis and ammonia fuel cells. Adv. Mater. 31, 1805173 (2019).
van Langevelde, P. H., Katsounaros, I. & Koper, M. T. M. Electrocatalytic nitrate reduction for sustainable ammonia production. Joule 5, 290-294 (2021).
Jung, W. & Hwang, Y. J. Material strategies in the electrochemical nitrate reduction reaction to ammonia production. Mater. Chem. Front. 5, 6803-6823 (2021).
Valera-Medina, A., Xiao, H., Owen-Jones, M., David, W. I. F. & Bowen, P. J. Ammonia for power. Prog. Energy Combust. Sci. 69, 63-102 (2018).
Chen, J. G. et al. Beyond fossil fuel-driven nitrogen transformations. Science 360, eaar6611 (2018).
Bae, S. E., Stewart, K. L. & Gewirth, A. A. Nitrate adsorption and reduction on in acidic solution. J. Am. Chem. Soc. 129, 10171-10180 (2007).
Zhou, N. et al. Potential-induced synthesis and structural identification of oxide-derived Cu electrocatalysts for selective nitrate reduction to ammonia. ACS Catal. 13, 7529-7537 (2023).
Anastasiadou, D. et al. Morphology changes of catalysts during nitrate electroreduction to ammonia. ChemCatChem 15, e202201503 (2023).
Costa, G. F. et al. Identifying the active site of for electrocatalytic nitrate reduction reaction to ammonia. Chem. Catal. 4, 100850 (2024).
Bai, L. et al. Electrocatalytic nitrate and nitrite reduction toward ammonia using nanocubes: active species and reaction mechanisms. J. Am. Chem. Soc. 146, 9665-9678 (2024).
Wang, Y., Zhou, W., Jia, R., Yu, Y. & Zhang, B. Unveiling the activity origin of a copper-based electrocatalyst for selective nitrate reduction to ammonia. Angew. Chem. Int. Ed. 59, 5350-5354 (2020).
Celante, V. G. & Freitas, M. B. J. G. Electrodeposition of copper from spent Li-ion batteries by electrochemical quartz crystal microbalance and impedance spectroscopy techniques. J. Appl. Electrochem. 40, 233-239 (2010).
Puigdomenech, I. & Taxén, C. Thermodynamic Data for Copper. Implications for the Corrosion of Copper under Repository Conditions (Svensk Kärnbränslehantering, 2000).
Hoar, T. P. & Rothwell, G. P. The potential/pH diagram for a copper-water-ammonia system: its significance in the stress-corrosion cracking of brass in ammoniacal solutions. Electrochim. Acta 15, 1037-1045 (1970).
Siegfried, M. J. & Choi, K.-S. Elucidating the effect of additives on the growth and stability of surfaces via shape transformation of pre-grown crystals. J. Am. Chem. Soc. 128, 10356-10357 (2006).
Luo, Q., Mackay, R. A. & Babu, S. V. Copper dissolution in aqueous ammonia-containing media during chemical mechanical polishing. Chem. Mater. 9, 2101-2106 (1997).
Fu, X. et al. Alternative route for electrochemical ammonia synthesis by reduction of nitrate on copper nanosheets. Appl. Mater. Today 19, 100620 (2020).
Schroder, D., Schwarz, H., Wu, J. & Wesdemiotis, C. Long-lived dications of and do exist! Chem. Phys. Lett. 3343, 258-264 (2001).
Ducéré, J. M., Goursot, A. & Berthomieu, D. Comparative density functional theory study of the binding of ligands to and : influence of the coordination and oxidation state. J. Phys. Chem. A 109, 400-408 (2005).
Grosse, P., Yoon, A., Rettenmaier, C., Chee, S. W. & Roldan Cuenya, B. Growth dynamics and processes governing the stability of electrodeposited size-controlled cubic Cu catalysts. J. Phys. Chem. C 124, 26908-26915 (2020).
Grosse, P. et al. Dynamic transformation of cubic copper catalysts during electroreduction and its impact on catalytic selectivity. Nat. Commun. 12, 6736 (2021).
Li, Y. et al. Electrochemically scrambled nanocrystals are catalytically active for -to-multicarbons. Proc. Natl Acad. Sci. USA 117, 9194-9201 (2020).
Yoon, A., Poon, J., Grosse, P., Chee, S. W. & Roldan Cuenya, B. Iodide-mediated Cu catalyst restructuring during electroreduction. J. Mater. Chem. A 10, 14041-14050 (2022).
Velasco-Vélez, J. J. et al. On the activity/selectivity and phase stability of thermally grown copper oxides during the electrocatalytic reduction of . ACS Catal. 10, 11510-11518 (2020).
Timoshenko, J. & Roldan Cuenya, B. In situ/operando electrocatalyst characterization by X-ray absorption spectroscopy. Chem. Rev. 121, 882-961 (2021).
Nobial, M., Devos, O., Mattos, O. R. & Tribollet, B. The nitrate reduction process: a way for increasing interfacial pH . J. Electroanal. Chem. 600, 87-94 (2007).
Monteiro, M. C. O. & Koper, M. T. M. Measuring local pH in electrochemistry. Curr. Opin. Electrochem. 25, 100649 (2021).
Johnson, A. R., McQueen, T. M. & Rodolfa, K. T. Species distribution diagrams in the copper-ammonia system: an updated and expanded demonstration illustrating complex equilibria. J. Chem. Educ. 82, 408-414 (2005).
Giannopoulou, I., Panias, D. & Paspaliaris, I. Electrochemical modeling and study of copper deposition from concentrated ammoniacal sulfate solutions. Hydrometallurgy 99, 58-66 (2009).
Deng, Y., Handoko, A. D., Du, Y., Xi, S. & Yeo, B. S. In situ Raman spectroscopy of copper and copper oxide surfaces during electrochemical oxygen evolution reaction: identification of oxides as catalytically active species. ACS Catal. 6, 2473-2481 (2016).
Niaura, G. Surface-enhanced Raman spectroscopic observation of two kinds of adsorbed ions at copper electrode. Electrochim. Acta 45, 3507-3519 (2000).
Chan, H. Y. H., Takoudis, C. G. & Weaver, M. J. Oxide film formation and oxygen adsorption on copper in aqueous media as probed by surface-enhanced Raman spectroscopy. J. Phys. Chem. B 103, 357-365 (1999).
Bodappa, N. et al. Early stages of electrochemical oxidation of and polycrystalline Cu surfaces revealed by in situ Raman spectroscopy. J. Am. Chem. Soc. 141, 12192-12196 (2019).
Moura de Salles Pupo, M. & Kortlever, R. Electrolyte effects on the electrochemical reduction of . ChemPhysChem 20, 2926-2935 (2019).
Marcandalli, G., Monteiro, M. C. O., Goyal, A. & Koper, M. T. M. Electrolyte effects on electrochemical reduction to CO. Acc. Chem. Res. 55, 1900-1911 (2022).
Nitopi, S. et al. Progress and perspectives of electrochemical reduction on copper in aqueous electrolyte. Chem. Rev. 119, 7610-7672 (2019).
Katsounaros, I. & Kyriacou, G. Influence of the concentration and the nature of the supporting electrolyte on the electrochemical reduction of nitrate on tin cathode. Electrochim. Acta 52, 6412-6420 (2007).
Aran-Ais, R. M. et al. Structure- and electrolyte-sensitivity in electroreduction. Acc. Chem. Res. 51, 2906-2917 (2018).
Chee, S. W., Lunkenbein, T., Schlögl, R. & Roldán Cuenya, B. Operando electron microscopy of catalysts: the missing cornerstone in heterogeneous catalysis research? Chem. Rev. 123, 13374-13418 (2023).
Publisher’s note Springer Nature remains neutral with regard to jurisdictional claims in published maps and institutional affiliations.
Open Access This article is licensed under a Creative Commons Attribution 4.0 International License, which permits use, sharing, adaptation, distribution and reproduction in any medium or format, as long as you give appropriate credit to the original author(s) and the source, provide a link to the Creative Commons licence, and indicate if changes were made. The images or other third party material in this article are included in the article’s Creative Commons licence, unless indicated otherwise in a credit line to the material. If material is not included in the article’s Creative Commons licence and your intended use is not permitted by statutory regulation or exceeds the permitted use, you will need to obtain permission directly from the copyright holder. To view a copy of this licence, visit http://creativecommons. org/licenses/by/4.0/.
(c) The Author(s) 2025
¹Department of Interface Science, Fritz-Haber Institute of the Max-Planck Society, Berlin, Germany. Department of X-ray Microscopy, Helmholtz-Zentrum Berlin, Berlin, Germany. Present address: Shell Global Energy Solution International BV, Amsterdam, Netherlands. Present address: Department of Chemical and Pharmaceutical Sciences, University of Trieste, Trieste, Italy. Present address: College of Chemistry and Chemical Engineering, Xiamen University, Xiamen, China. Present address: Technological Convergence Center, Korea Institute of Science and Technology (KIST), Seoul, Republic of Korea. □ e-mail: swchee@fhi-berlin.mpg.de; roldan@fhi-berlin.mpg.de
طرق
تحضير العينة
التم تخليق المكعبات (250 نانومتر) على ألواح الكربون الزجاجي المصقول (الزجاجي، SPI) وورق الكربون والقطب الكربوني لشرائح Hummingbird Scientific EC-TEM باستخدام بروتوكول ترسيب كهربائي قمنا بتطويره سابقًا.يتكون محلول الترسيب من خليط من 5 مللي مول من كبريتات النحاس خماسية الماء ، سيغما-ألدريتش) و 12.5 مللي مول من كلوريد البوتاسيوم ( KCl ، سيغما-ألدريتش). بعد التخليق، تم شطف العينات بالماء النقي ثم استخدمت في تجارب.
تحضير الإلكتروليت لتقليل النترات
المحلول الكهربائي المستخدم في تجارب اختزال النترات هو محلول مائي من (خالي من الماء، سوبرابور (سيغما-ألدريتش، ريجنت بلس، ).
تشغيل EC-TEM
تم إجراء تجارب EC-TEM في جهاز تيتان TEM من شركة ثيرمو فيشر ساينتيفيك بجهد 300 كيلوفولت، وتم تشغيله في وضع STEM مع تيار بروب الإلكترون.حامل الخلية السائلة المستخدم هو حامل TEM للكيمياء الكهربية السائلة من شركة هامينغبيرد ساينتيفيك مع قطب كهربائي مضاد من البلاتين وإلكترود المرجع. يتم إنتاج شرائح EC-TEM العلوية والسفلية للخلايا بواسطة Hummingbird Scientific وكلاهما يحتوي على-نوافذ غشاء نيتريد السيليكون بسماكة. تم استخدام شرائح سفلية مع فواصل بسمك 250 نانومتر لهذه التجارب. بعد تجميع الخلايا، تم توصيل الحامل بجهاز قياس الجهد Biologic SP-200 لإجراء تجارب الكيمياء الكهربائية. تم قياس الجهود مقابل جهاز مصغرمرجع مدمج داخل الحامل.
خلال تجميع الخلايا، تم ملء حامل TEM مسبقًا بـ 0.1 محل لملء المسار السائل بالكامل بالإلكتروليت. بعد تحميله في جهاز TEM، تم ضخ الإلكتروليت بشكل إضافي عبر الحامل بمعدل تدفق قدرهباستخدام حقنة مملوءة بـومضخة حقن. قياس الجهد الخطي من -0.5 إلى (تكرر مرتين) تم أداؤه لأول مرة بمعدل مسح قدره لتحديد جهد البداية لـولضمان أن الجهد المطبق كان متسقًا بين التجارب. ثم تم متابعة هذه القياسات بقياسات الكرونوأمبيرومترية لمدة تصل إلى ساعتين عند، -0.5 و تم استخدام عينة جديدة من المحفز وإلكتروليت جديد في كل جهد مطبق وظروف إلكتروليت.
لأجل هذه التجارب EC-TEM، تم دائمًا إجراء التصوير في الموقع تحت ظروف وجود الإلكتروليت في الخلية، كما تم تحديده من تباين الصورة. كما تم الحفاظ على تدفق الإلكترونات عندوتحت في جميع الأوقات لتقليل العيوب الناتجة عن شعاع الإلكترون. الصور المكتسبة لها حجم صورةبكسلات. خلال التصوير المتقطع، تم الحصول على الصور كل 15 دقيقة مع إيقاف شعاع الإلكترون بينهما. تم إجراء تقسيم الصورة لأفلام EC-TEM باستخدام الوظائف المدمجة والبرمجة النصية في MATLAB (انظر الملاحظة التكميلية 4 للحصول على التفاصيل).
تحليل المنتج والكشف
تم إجراء تجارب الكيمياء الكهربائية لتحليل المنتجات والتصوير الخارجي باستخدام جهاز قياس الجهد الكهربائي Autolab (PGSTAT 302N) وخلايا كهربائية من نوع H مصنوعة خصيصًا، حيث كانت المقصورات الكاثودية والأنودية مفصولة بغشاء تبادل الأنيونات (Selemion AMV، AGC). الإلكترود المضاد هو شبكة من البلاتين.شبكة ) والقطب المرجعي خالٍ من التسرب القطب الكهربائي (LF-1، ألفاتيك، جهد 0.198 فولت مقابل القطب الهيدروجيني القياسي). تم ملء حجرة الأنود (مع القطب المضاد) بـالإلكتروليت؛ تم ملء حجرة الكاثود (مع القطب العامل) بـإلكتروليت. تم إزالة الهواء من المحاليل الأنودية والكاثودية قبل التجارب عن طريق نفخ الأرجون بشكل مستمر. ) مع معدل التدفق (برونكهورست). تم إجراء الفولتمترية ذات المسح الخطي بمعدل مسحتم استخدامه مرة أخرى للتحقق من الجهد المطبق، وتم الحفاظ على العينات عند جهد ثابت (الكرونوأمبيرومترية) لمدة ساعتين لتحليل توزيع المنتجات. تم الحفاظ على تدفق ثابت من الأرجون ( ) تم استخدامه للحفاظ على الجو الخامل أثناء الكرونوأمبرو متري.
تم استخدام مطياف الأشعة فوق البنفسجية والمرئية (Agilent Cary 60) للكشف عن كميات الأمونيا والنتريت في الإلكتروليت وقياسها وفقًا للإجراءات التي تم وضعها سابقًا في الأدبيات.تم تخفيف الإلكتروليت السائل أولاً ليتناسب مع نطاق الكشف المناسب للتحليل الطيفي لكل مادة تحليلية، ثم تم قياس امتصاص العينة في النطاق.
تم استخدام طريقة إندوفينول الأزرق لتحديد (المراجع 48، 49)، ومجموعة اختبار النيتريت التجارية (الضوئية 0.002تم استخدام (Spectroquant، Merck) لتحديد كمية النيتريت. بالنسبة لذلك، تم إضافة 3 مل من الإلكتروليت المخفف إلى قنينة زجاجية تحتوي على 35 ملغ من المسحوق الأبيض من المجموعة. يمكن العثور على تفاصيل حول التحديد الكمي في الملاحظة التكميلية 2.
قياس TEM و SEM خارج الموقع
تم أيضًا إجراء تصوير TEM خارج الموقع باستخدام جهاز Thermo Fisher Scientific 300 kV Titan TEM لمقارنات قبل وبعد التفاعل. في كلا الحالتين، تم فحص شرائح EC-TEM في جهاز TEM باستخدام حامل Tomography من Hummingbird Scientific. بالنسبة لتحليل ما بعد التفاعل، تم أولاً شطف شرائح EC-TEM في ماء نقي للغاية بعد تفكيكها من حامل EC-TEM، ثم تم نقلها على الفور إلى جهاز TEM لتقليل تعرضها للهواء. تم إجراء تصوير SEM خارج الموقع للعينات الكتلية باستخدام جهاز Thermo Fisher Scientific Apreo SEM.
قياس EC-TXM أثناء التشغيل
تم إجراء تجارب EC-TXM في وضع التشغيل في خط الأشعة U41-TXM في BESSY II (برلين، ألمانيا). كان حجم الشعاعبدقة اسمية تبلغ 20 نانومتر. تم جمع مجموعات الصور باستخدام كاشف مرتبط بالشحن عند 1,340 بكسل.بكسل ووقت تعريض قدره 1 ثانية لكل طاقة. تم استخدام شق مونوكروماتور بعرض 10 نانومتر. تم مراقبة شدة الإشعاع الساقط وضبطها للحفاظ على عدد الفوتونات ثابتًا.عدد العدات لكل بكسل) في منطقة الخلفية (بدون عينة) عندما يكون السائل ممتلئًا بالكامل. تم الحصول على مجموعات الصور أثناء مسح طاقات الشعاع من 926 إلى 965 إلكترون فولت، والتي شملت كل من النحاس و حواف.
تم استخدام حامل الكيمياء الكهربائية Hummingbird Scientific أيضًا للقياسات التشغيلية، وتم التحكم في الجهد المطبق باستخدام جهاز قياس الجهد Biologic. كانت الإلكترود المرجعي عبارة عن إلكترود بلاتيني مزيف على الشريحة، وكان الإلكترود المضاد من البلاتين. ثم تم معايرة الجهد المرجعي مقابل جهاز خارجي.القطب الكهربائي لضمان تطبيق جهد قابل للمقارنة مع تجارب EC-TEM.
يمكن العثور على تفاصيل حول معالجة البيانات، بما في ذلك المحاذاة الدقيقة، وطرح الخلفية، وتطبيع البيانات، ومتوسط الطيف، وLCF للصور الطيفية الفائقة في الملاحظة التكميلية 2.
أوبيراندو XAS
إجراء تجارب مطيافية امتصاص الأشعة السينية ذات الدقة الزمنية عند حافة النحاس K ) تم تنفيذها في خط الشعاع P64 من سينكروترون PETRA III (هامبورغ، ألمانيا) في وضع XAFS السريع. تم مراقبة شدة الإشعاع الساقط بواسطة غرفة تأين غازية مملوءة بالنيتروجين النقي. تم استخدام غرف تأين إضافية للحصول على طيف من رقائق النحاس في وضع النقل لأغراض المعايرة في بداية كل مسح XAFS سريع. كان حجم الشعاع أقل من تم جمع بيانات XAS في وضع الفلورية باستخدام كاشف سيليكون مسطح مزروع محمي بمعدل طيف واحد في الثانية وطيف واحد كل 5 ثواني.
استخدمنا خلية كيميائية كهربائية ذات حجرة واحدة مصنوعة في المنزللأجل هذه التجارب باستخدام XAS في حالة التشغيل. تم تدفق الأرجون إلى حجرة الغاز عند. الـتم تحضير المكعبات على إلكترود ورق الكربون وتم تدوير الإلكتروليت باستمرار عبر الخلية باستخدام مضخة بيرستالتية ذات قناتين. تم التحكم في الجهد المطبق باستخدام جهاز قياس الجهد من بيولوجيك.
تم استخراج البيانات ومعايرتها باستخدام برنامج JAQ لخط الشعاع P64. تم إجراء مزيد من معالجة البيانات وتحليل طيف XANES وفقًا للإجراءات الموضحة سابقًا في المرجع 50.
قياس رامان أثناء التشغيل
تم إجراء تجارب رامان أثناء التشغيل باستخدام مجهر رامان كونفوكالي من رينيشاو (InVia Reflex) وهدف غمر مائي مع مسافة عمل طويلة (لايكا للميكروأنظمة؛تم اختيار عدسة ذات فتحة عددية 0.9. تم حماية العدسة من الإلكتروليت بواسطة فيلم من التفلون (دو بونت؛ سمك الفيلم 0.013 مم). ثم تم استخدام قطرة من الماء لطرد الهواء بين الفيلم والعدسة لمطابقة معامل الانكسار لضمان إثارة فعالة وجمع إشارة رامان.
تم إجراء القياسات الكهروكيميائية في خلية طيف كهروكيميائية مصنوعة يدويًا من مادة التفلون ومتحكم بها بواسطة جهاز قياس الجهد Biologic SP-240. كانت الخلية مزودة بقطب مرجعي (خالي من التسرب)، ألفاتيك)، قطب مضاد (حلقة من البلاتين)، وقطب عمل مع المحفز المودع كهربائياً على الكربون الزجاجي. 15 مل من الأرجون المنقىتم استخدام المحلول كإلكتروليت. بالنسبة للتجارب على الكربون الزجاجي الموضحة في الشكل 5، استخدمنا ليزر بزاوية 785 نانومتر معقوة الليزرخلال التجربة، تم الحصول على طيف رامان كل 5 دقائق على مدى ساعة واحدة من التفاعل.
توفر البيانات
يعلن المؤلفون أن البيانات التي تدعم نتائج هذه الدراسة متاحة ضمن الورقة وملفات المعلومات التكميلية الخاصة بها. تتوفر ملفات البيانات الخام التي تم إنشاؤها خلال هذه الدراسة من المؤلفين المراسلين عند الطلب المعقول.
References
Andersen, S. Z. et al. A rigorous electrochemical ammonia synthesis protocol with quantitative isotope measurements. Nature 570, 504-508 (2019).
Wang, Y., Wang, C., Li, M., Yu, Y. & Zhang, B. Nitrate electroreduction: mechanism insight, in situ characterization, performance evaluation, and challenges. Chem. Soc. Rev. 50, 6720-6733 (2021).
Jeon, H. S. et al. Selectivity control of Cu nanocrystals in a gas-fed flow cell through pulsed electroreduction. J. Am. Chem. Soc. 143, 7578-7587 (2021).
شكر وتقدير
تشكر A.Y. و C.Z. مؤسسة ألكسندر فون هومبولت (AvH) على دعمهم من خلال منحة أبحاث ما بعد الدكتوراه من AvH. ويعرب L.B. عن تقديره للدعم المقدم من زمالة التنقل المبكر لما بعد الدكتوراه (P2ELP2_199800) من المؤسسة الوطنية السويسرية للعلوم. وتُعرب F.Y. عن شكرها لمجلس المنح الدراسية الصيني لرعايته لها.
دكتوراه. تم تمويل هذا العمل جزئيًا من قبل وزارة التعليم والبحث الفيدرالية الألمانية (BMBF) بموجب منحة Catlab (O3EW0015B)، ومؤسسة الأبحاث الألمانية (DFG) بموجب رقم المشروع 406944504-SPP 2080 واستراتيجية التميز في ألمانيا – EXC 2008-390540038 UniSysCat. كما يشكر A.Y. أيضًا منح الأبحاث المبكرة للنساء في العلوم SPP 2080 ‘DynaKat’ على التمويل الجزئي. نحن ممتنون جدًا لـ A. Herzog و U. Hejral و A. Bergmann و S.-Y. Fu على وقتهم ومساعدتهم في قياسات وقت الأشعة السينية XAS و TXM. كما نعترف بـ A. Martini و C. Scheurer على مناقشاتهم المفيدة فيما يتعلق بتحليل بيانات TXM، و E. Ortega على مساعدته في بعض تحليلات بيانات TEM و W. Wachsmann على قياسات مطيافية الكتلة المتصلة بالتحريض. أخيرًا، نشكر مركز هيلمهولتز برلين للمواد والطاقة (برلين، ألمانيا)، و DESY (هامبورغ، ألمانيا)، أعضاء جمعية هيلمهولتز HGF، على تخصيص وقت مخصص لأشعة السنكروترون.
مساهمات المؤلفين
A.Y. و S.W.C. و B.R.C. تصوروا المشروع، خططوا للتجارب وكتبوا المخطوطة. أعد A.Y. العينات، وأجرى دراسات EC-TEM التشغيلية ودراسات EC-TXM التشغيلية، وتحليل TEM خارج الموقع و SEM خارج الموقع، وحلل البيانات. قاس L.B. الانتقائية وحلل البيانات الكهروكيميائية. ساعد F.Y. في إعداد العينات وأجرى بعض تجارب EC-TEM التشغيلية. قدم F.F. الإلهام الأولي للمشروع وطور البروتوكول التجريبي لقياسات خلايا النوع H وتحليل المنتجات. أجرى C.Z. و L.B. قياسات رامان التشغيلية وحللا النتائج. خطط M.R. و J.T. وجمعا بيانات XAS التشغيلية وأجريا التحليل والتفسير. خطط C.P. و S.W. قياسات EC-TXM التشغيلية مع A.Y. و S.W.C.، وعملا على TXM وساعدا في تحليل بيانات TXM.
التمويل
تم توفير تمويل الوصول المفتوح من قبل جمعية ماكس بلانك.
Revealing catalyst restructuring and composition during nitrate electroreduction through correlated operando microscopy and spectroscopy
Received: 30 August 2023
Accepted: 14 November 2024
Published online: 24 January 2025
Check for updates
Aram Yoon , Lichen Bai , Fengli Yang , Federico Franco , Chao Zhan , Martina Rüscher , Janis Timoshenko , Christoph Pratsch , Stephan Werner (D) , Hyo Sang Jeon , Mariana Cecilio de Oliveira Monteiro , See Wee Chee & Beatriz Roldan Cuenya ®
Electrocatalysts alter their structure and composition during reaction, which can in turn create new active/selective phases. Identifying these changes is crucial for determining how morphology controls catalytic properties but the mechanisms by which operating conditions shape the catalyst’s working state are not yet fully understood. In this study, we show using correlated operando microscopy and spectroscopy that as well-defined cubes evolve under electrochemical nitrate reduction reaction conditions, distinct catalyst motifs are formed depending on the applied potential and the chemical environment. By further matching the timescales of morphological changes observed via electrochemical liquid cell transmission electron microscopy with time-resolved chemical state information obtained from operando transmission soft X-ray microscopy, hard X-ray absorption spectroscopy and Raman spectroscopy, we reveal that can be kinetically stabilized alongside metallic copper for extended durations under moderately reductive conditions due to surface hydroxide formation. Finally, we rationalize how the interaction between the electrolyte and the catalyst influences the ammonia selectivity.
Electrocatalytic chemical conversion reactions such as the carbon dioxide reduction reaction and the nitrate reduction reaction are key to the advancement of various green energy solutions. However, it can be difficult to identify the active catalyst species in these reactions, even when the metallic state is supposed to be the stable phase, because the catalyst can change its oxidation state during reaction according to external stimuli. Although Pourbaix diagrams can be used to rationalize the stable oxidation state/phase at different applied potentials and pHs , they are equilibrium diagrams which do not consider the kinetics of redox transitions and their effect
on catalyst morphology. For example, they do not include information about how oxide-to-metal transformations occur, how different facets can reconstruct differently under the same reaction conditions, how interactions between the catalysts and the electrolyte can alter catalyst surface, or how reaction intermediates and products may lead to further changes.
The challenge here is twofold. First, one must elucidate the working morphology of the electrocatalyst. Second, one needs to disentangle the impact the observed morphological changes have on catalytic performance. There are only a few methods that can visualize the
Fig. 1 | Differences in the restructuring of catalysts between the and the during initial linear sweep voltammetry scan. a, Schematic of the EC-TEM experimental configuration in which the precatalyst was electrodeposited on the working electrode of an EC-TEM chip prior to the experiment. b,c, Snapshots showing the restructuring of cubes as observed by operando EC-TEM during linear sweep voltammetry under conditions
in , pH 7 (Supplementary Video 1) (b) and an image sequence describing the behaviour of identically synthesized cubes under conditions in -saturated , pH 6.8 at a similar applied potential range (Supplementary Video 2) (c). The electron flux used in these experiments is .
nanoscale restructuring dynamics of a catalyst and follow the catalyst as a function of the applied potential and electrolyte conditions. It is even more challenging to resolve the local chemical state of these features because most operando techniques for extracting chemical information, such as Raman spectroscopy and X-ray absorption spectroscopy (XAS), are ‘broad beam’ methods, where the data are an ensemble signal derived from a large probed region. This gap between nanoscale imaging and ensemble-averaging spectroscopy limits our ability to rationalize how catalyst morphology impacts the overall performance of these complex but important reactions.
The is noteworthy among the various electrochemical conversion reactions in terms of the questions regarding its working electrocatalyst phase during the reaction. Foremost, this reaction offers a promising strategy for mitigating freshwater pollution from agricultural fertilizer run-off and industrial waste , and has also been studied for its potential to produce (refs. 9-11), an important industrial chemical and a candidate carrier for green hydrogen . Although copper is one of the most-studied electrocatalyst materials for the due to its optimal nitrate adsorption energy , whether metallic copper , copper oxides or a oxide interface are the key species for selective formation has remained largely unresolved. According to the Pourbaix diagram ,the metallic phase of copper should be the stable phase under typical conditions, but studies using in situ Raman spectroscopy suggested that an oxide phase might exist during the reaction . Copper and its oxides are also known to be susceptible to etching and facet modification by . Furthermore, it has been reported that the can drive the dissolution and regrowth of single-atom copper catalysts , and the clustering of small aggregates into larger nanoparticles (NPs) .
In this study, we use electrochemical liquid cell transmission electron microscopy (EC-TEM) accompanied by correlated multimodal operando investigations that include electrochemical liquid cell transmission X-ray microscopy (EC-TXM), operando XAS and operando Raman spectroscopy of the same precatalysts to visualize in real time how the structure and composition of cubes evolve as a function of the applied potential during the . We found that the working electrocatalyst morphology was determined by three processes: (1) the dissolution of , (2) the redeposition of copper from soluble copper complexes and (3) the reduction of to metallic copper. We also discovered a coexistence of with metallic copper for extended reaction durations, thereby providing insight into the copper species active during the .
For the operando microscopy experiments, we prepared welldefined cubes on the carbon working electrode of the EC-TEM
chips via electrodeposition as shown schematically in Fig. 1a. The as-prepared cubes have an average size of 250 nm and consist of six facets without the exposure of other minor facets such as or (Supplementary Fig. 1). All voltages indicated in this paper are referenced against a electrode and then converted to the reversible hydrogen electrode scale (RHE) using the Nernst equation and the bulk pH of the electrolyte. Intriguingly, the image sequences show that the cubes do not undergo obvious change in a typical electrolyte for the (Fig. 1b) during the initial potential sweep towards cathodic potentials. According to the Pourbaix diagram, the redox potential for the transformation of to metallic copper is in a solution with pH 7 (refs. 20,21) and metallic copper is the stable phase below onwards, and therefore should reduce directly to metallic copper at the higher overpotentials of the sweep. The stability of the cubes is remarkable because these redox transformations usually lead to morphological changes. For comparison, Fig. 1c depicts a cube under conditions in -saturated at a potential similar to that applied in the experiment. As we reported previously , the latter cubes undergo fragmentation together with the redeposition of small particles, a behaviour that differs from the morphologically much more stable samples at the same applied potentials. The linear sweep voltammograms acquired during these two experiments are shown in Supplementary Fig.1.
Next, we studied these cubes systematically at different sustained potentials from to (Fig. 2a-e) to probe further their morphological stability during the . For these extended experiments, we adopted an intermittent imaging protocol (in which images were captured at 15 min intervals with the electron beam blanked the rest of the time) to minimize beam-induced dissolution of the cubes (see discussion in Supplementary Note 1) and ensure that the catalyst restructuring kinetics we extract from the collected data are as accurate as possible. The electrochemical current profiles over time at each potential measured in these EC-TEM experiments are shown in Supplementary Fig. 3. At (Fig. 2a), the cubes were stable during our entire observation, with no notable restructuring observed. From -0.2 to , dissolution/redeposition is the main restructuring pathway. At , the cubic form persisted for almost 135 min (Fig. 2b), while the cube completely dissolved after 140 min at (Fig. 2c) and after 90 min at (Fig. 2d). The lighter contrast of the cube exterior in Fig. 2c compared with the middle of the cube at 60 and 80 min is explained by the cube corners and edges being etched first. The weaker contrast of the dissolving cubes compared with that of the growing Cu NPs also suggests that the dissolving cubes were still in oxide form.
Fig. 2 | Potential- and time-dependent restructuring of cubes observed with EC-TEM. a-e, Operando EC-TEM time series of cube restructuring acquired with intermittent imaging at (c), and during the reaction at the indicated times in . A new sample was used at each applied potential.
The electron flux used in these experiments is , Comparison of postreaction images of in situ and ex situ experiments: EC-TEM images after 2 h at each designated potential (f), and SEM images of cubes electrodeposited on carbon paper and reacted on the benchtop for 2 h at the same applied potentials (g).
Two cubes were captured in the images acquired at (Fig. 2e). One cube shrank and restructured into a smaller cube with a void in the centre and then became rougher due to small NPs attaching to its surface, while another completely dissolved within the same time frame. We also highlight that the intensity of the cubes in the TEM images obtained from -0.3 to gradually decrease, whereas the intensity of the cube at is brighter, implying that the cube-like frame at is metallic. Moreover, the interplay of dissolution/ redeposition and direct reduction at the more cathodic potentials means that the terminal catalyst morphologies of oxide precatalysts vary depending on the applied potential.
Next, we repeated the experiments in an H-type cell with cubes electrodeposited on carbon paper to compare the consistency of the EC-TEM results versus standard reaction geometries. Figure 2f,g shows lower-magnification images of samples from the EC-TEM experiments with scanning electron microscopy (SEM) images of samples extracted from H -type cell experiments after 2 h of reaction at three different applied potentials, and . Electron diffraction patterns taken from samples extracted after the reaction show that the cubes did not undergo extensive restructuring at and remain , whereas samples reacted at were largely metallic (Supplementary Fig. 4). Conversely, samples reacted at show a mixture of residual and metallic copper structures (Supplementary Figs. 4-6). The morphological differences between the sample after reaction in the H -type cell at -0.4 and further support that the catalysts indeed restructure through different pathways as described by our EC-TEM experiments. Inductively coupled plasma mass spectrometry measurements of the electrode and the electrolyte in the H-type cell after reaction also show that copper dissolution occurs at all the applied potentials (Supplementary Fig. 7). Therefore, these experiments indicate that the cubes undergo a gradual dissolution under conditions, which in turn leads to the redeposition of metallic particles elsewhere on the working electrode with shapes and sizes that are modulated by the applied potential.
To obtain unambiguously the oxidation state of the catalyst species present during reaction and rule out the possibility that the
ex situ identified phase is the result of reoxidation during the return to open circuit potential (OCP), we performed operando EC-TXM measurements on the cubes by transferring our EC-TEM holder into a TXM at the BESSY II synchrotron facility as illustrated in Supplementary Fig. 8. This unique arrangement maintains the same reaction environment between the two experiments, while enabling time-resolved operando measurements of copper absorption edges under applied potential without compromising the sustained electrolyte flow because X-rays are attenuated less by the electrolyte and enclosing membranes than electrons. Thus, the evolution of the electrocatalysts’ composition can be tracked during the . Figure 3a-d shows the time-resolved evolution of the catalysts during the at as observed by EC-TXM in the form of the coloured maps that were reconstructed from a XAS image stack using linear combination fitting (LCF) . is depicted in red and metallic copper in yellow. The maps show that and copper are the dominant phases present for the duration of the and that the oxide and metallic phases coexist under specific reaction conditions, but are spatially separated. CuO is also detected (blue) but is present only in small quantities and is not clearly visible from the maps. The corresponding decomposed spectra are shown in Fig. 3e-p, where the yellow, red and blue lines represent the respective copper species. The total contribution of the individual spectra in Fig. 3e-p represents the amount (thickness) of each species, which indicates that the content of metallic copper species increases (Fig. 3e-h) during the reaction, whereas decreases (Fig.3i-p). Details of the data acquisition and processing are discussed in Supplementary Note 3. Most importantly, these results confirm the sluggish reduction kinetics of the large cubes in the electrolyte, and that the metallic phase forms when the dissolved copper species redeposit on the working electrode due to the reductive potential employed.
We further verified that the slow reduction of the copper oxide cubes extends to larger reaction volumes with operando hard XAS measurements of samples electrodeposited on carbon paper in our home-built electrochemical XAS cell . In Fig. 3q, we plot the changes in the copper K-edge valence states (from 8,950 to 9,105 eV) that were
Fig. 3 | Correlating the morphological evolution with changes in the chemical state of the precatalysts during the with operando TXM and XANES measurements. a-d, Spatially and temporally evolving copper catalysts and their valence states as observed with TXM. Coloured map of cubes and redeposited copper catalysts before reaction in their original dry state (a), and after and of TXM acquisition at in . , Copper -edge XAS intensity extracted from the TXM image stacks in a-d, integrated over from individual pixels in the coloured areas of the images and then decomposed into three components
where the coloured spectra correspond to copper (yellow) (e-h), (red) (i-l) and CuO (blue) (m-p); original state (e,i,m), and after and , Copper K-edge XANES measured at in . The colour bar denotes the acquisition time of the respective XAS spectra from the start of the measurements. r, Temporal evolution in the weights of copper, and CuO species obtained by fitting the copper and K edges obtained from operando TXM and operando XANES, respectively. The error bars in the XANES dataset refer to the standard errors of the fitting procedure.
obtained from operando XAS. The weight of the copper valence state is extracted by LCF of the X-ray absorption near-edge structure (XANES) of the oxide-derived copper catalyst collected at a constant potential of in electrolyte. As seen in Fig. 3r, the fraction of decreased, but did not completely disappear, after more than 2 h of electrolysis, while the fraction of metallic copper increased correspondingly, eventually to almost a ratio of . The XANES results agree with the persistence of and the continual evolution of the copper species seen in the EC-TEM (Fig. 2c) and EC-TXM ( edges in Fig. 3r) results at . Minute amounts of the CuO species were also detected during the experiment. The changes in the
weights of the three species over time exhibit similar trends in both TXM and XAS, confirming that the results we obtain in the EC-TEM cells indeed extrapolate to a larger ensemble of catalyst particles.
This overall agreement between different methods and experimental geometries means that we can use the in situ TEM image sequences to quantify the potential-dependent dissolution and redeposition rates. Our method for fraction extraction from the EC-TEM images and additional analysis of the redeposited particles is described in Supplementary Note 4. As shown in Fig. 4a, the cube fraction decreases over time at an increasing rate as the potential decreases from -0.2 to . The sample at deviates from this trend (dark purple
Fig. 4 | Temporal evolution of oxidic and metallic copper phases and its impact on selectivity. a, The fractions of the cubes within the EC-TEM images are calculated by dividing the area of the reacted cubes at time by the initial projected area of precatalysts at time 0 .b, Plot depicting the majority copper phase at different applied potentials and reaction times. The solid line indicates the estimated time to reduce the size of a cube by . The vertical dashed line denotes 2 h of the . The diagonal dash line extrapolates from 60 min at to 0 min at as the first image acquired at 15 min in the experiment already indicates cube reduction. c, Linear sweep voltammetry of electrodeposited cubes on carbon paper measured from 0.1 to . d, e, The yield rate of and (d) and the FE of products (e) at and . The error bars in d,e indicate the s.d. of three independent measurements.
line) because of the direct reduction of to metallic copper. In Fig. 4b, we use the cube dissolution rate to estimate the :Cu ratio at a certain potential and use it to visualize the majority phase (>50%) at different times. We further compare the : Cu ratio with conversion activity (current density) and selectivity (Faradaic efficiency (FE)) obtained from our benchtop electrochemistry measurements. In Fig. 4c, we plot the linear sweep voltammogram of the cubes prepared on carbon paper, and in Fig. 4d,e, we show their product distribution as a function of the applied potentials. The measured yield rate and the FE towards were much higher at than at -0.2 and , implying that the change in catalytic selectivity is related to the faster rate of oxide to metal conversion at (Fig. 4b).
Next, we performed EC-TEM studies in various electrolyte compositions to elucidate the mechanism behind stabilization. Supplementary Fig. 9a,b describes experiments using pure and (that is, nitrite reduction), respectively. In both cases, the cubes behaved similarly to their behaviour in the , during which they gradually reduced in size until they fragment/reduce at longer reaction durations, which means the stability is related to the supporting electrolyte and not the reactant. Redeposition was, however, much less in than in its -containing counterparts. We attribute this difference to how the local pH during electroreduction differs in the presence and absence of species. Under applied cathodic potentials, the pH at the electrocatalyst surface increases as hydroxyl ions form due to the reduction of, for example, and . In particular, the results in higher currents and consequently a steeper rise in the local pH compared with when only hydrogen reduction takes place. This process can bring the pH of a neutral electrolyte to above 12 (ref. 34), triggering the formation of soluble copper hydroxides. To investigate the effect of electrolyte pH, we further performed experiments in 0.1 M where the pH was increased to 10 by adding NaOH . As shown in Supplementary Fig. 9c, this altered the amount of redeposition observed. Finally, to probe the influence of ammonium ions, we deliberately added to the carrie electrolyte, which led to rapid restructuring of the cubes as shown in Supplementary Fig.9d.
To explain these results, we consider the phase stability of copper as a function of pH and in the presence of . A complex series of reactions encompassing different acid-base chemistries, precipitation and complex ion formation are known for the system (Supplementary Note 5). Specifically, the equilibrium between solid and the complex depends on the concentration, with precipitation being favoured at low concentrations due to the poor solubility of (ref. 36). We hypothesize that the sluggish reduction observed may be the result of transient surface formation induced by the interfacial pH rise in the course of the formation may also be more favourable in , due to the electrolyte’s inability to buffer the increase in local pH from electroreduction , as compared to the electrolyte used in , thereby leading to the differences in restructuring behaviours. To validate this hypothesis, we studied the chemical changes taking place on the surface of the cubes with operando Raman spectroscopy measurements.
Figure 5a shows the results of experiments at constant applied potentials performed with cubes electrodeposited on glassy carbon plates. At OCP, the Raman spectrum shows three features of bands centred at 415,520 and , respectively, which are in good agreement with the reported values of (refs. 38,39 ). When was applied, the band intensity at 520 and decreased over time but continued to persist, which is consistent with the gradual dissolution of . At , a new peak at started to emerge, while the peak at flattened, indicating oxide to metal transition. At , the characteristic bands of were less pronounced and additional weak bands emerged at 450,475 and . The band around can be assigned to the vibration or (ref. 40), while the peak at is often assigned to CuO (ref. 38) or adsorbed oxygen species on copper . These results suggest the formation of a transient intermediate oxide or hydroxide phase during electrolysis, which is also supported by the extended presence of signatures and the weak but persistent signatures in the EC-TXM and operando XAS measurements in Fig. 3. It was, however, difficult to obtain the Raman signatures of absorbates with these samples due to the relatively low loading of the cubes that we were able to electrodeposit and the overlap of the D/G bands of the glassy carbon support with surface absorbate bands, which limits the signal-to-noise ratios at those bands. Thus, we repeated the Raman measurements with cubes electrodeposited at higher loading on carbon paper to improve the signal-to-noise ratios to identify surface adsorbed species or intermediate species in the vicinity of electrode. These results are discussed in Supplementary Note 6.
Hence, we arrive at a restructuring mechanism, illustrated in Fig. 5b, according to which surface hydroxides first form on the cubes due to the pH increase induced by electrolysis, which delays the oxide reduction. The subsequent production and added pH rise from continued then destabilize this hydroxide layer and form soluble copper complexes, thereby initiating catalyst evolution via redeposition from copper complex reduction or the aggregation of migrating NPs. We also performed more EC-TEM experiments to check that the delayed restructuring kinetics extend to other precatalyst geometries. Supplementary Fig. 10 describes the evolution during the of truncated octahedra and metallic frames created by
Fig. 5 | Probing surface chemistry changes in cubes using operando Raman spectroscopy and schematic detailing catalyst restructuring mediated by oxide/ hydroxide formation. a, Operando Raman spectra of cubes electrodeposited on glassy carbon measured during the in at OCP, and . The average of the 12 measurements is plotted.
prereducing the cubes. Both samples are stable during early-stage reaction. With more time, redeposition similar to that seen in the cubes was observed in the octahedra, whereas little redeposition was noticeable with the metallic frames, probably due to less dissolution occurring when we start from metallic precatalysts.
The correlated microscopy and spectroscopy experiments presented here therefore indicate that the morphology of the copper catalysts during the at a given pH is governed by a complex, time- and potential-dependent interplay of three processes: (1) dissolution of oxide and hydroxide species, (2) metal redeposition and (3) oxide catalyst reduction. According to the Pourbaix diagram , metallic copper is the only stable species under the specific applied potentials and pH of our experiments, but we have shown that oxidic and metallic phases can coexist over extended durations and over a broad range of applied potentials, which has serious implications in terms of determining the active species for producing . It has been suggested previously , based on operando spectroscopy measurements of CuO precatalysts, that interfaces are responsible for production , but these methods cannot differentiate the distribution of these species on the nanoscale. As we have shown in this work, the presence of both spectroscopic signatures in ensemble-averaging measurements does not necessarily mean that the two phases are spatially connected. Furthermore, we have demonstrated that the decoupled metallic copper and copper-oxide phases can persist for extended durations at mild cathodic potentials (less than ), and that a high residual abundance of in the operando XAS measurements corresponded to a low production efficiency in our electrolysis data of equivalent samples. The improvement of selectivity with increasing overall metallic character of the samples therefore suggests that metallic copper, rather than , is the active phase for producing , in agreement with recent work on the topic . In this case, the strong stability of the cubes and their sluggish reduction kinetics in the often-used carrier electrolyte are detrimental to production by delaying the onset of selective formation.
By showing the diverse behaviours that can be elicited in different electrolytes and under a range of reaction conditions, our work also illustrates the critical need to pay attention to how the electrolyte can influence the restructuring of catalysts and the stability of oxide, hydroxide and metallic phases before we attempt to generalize results
The arrow highlights the peak at . The measurements were conducted with a fresh specimen for each potential.b, Schematic describing the possible restructuring mechanisms depending on the applied cathodic potential and how the equilibrium may be controlling the dissolution/ redeposition process.
across different studies and reactions. So far, the description of electrolyte effects in electrolysis has been largely confined to cation adsorption effects and restructuring induced by aggressive halide anions , whereas studies of pH had focused on its impact on reaction mechanisms and selectivity , and not catalyst phase stability. Substantial additional microscopy work, such as the one presented here, will be required to separate the impact of electrolyte-driven morphological transformation from the much better understood associated electronic and chemical changes. Furthermore, current computational models still cannot rationalize the impact of an explicit complex electrolyte on the catalyst restructuring and its associated influence on the creation of active sites. Efforts to improve these models and advance the theory describing electrocatalytic processes will undoubtedly require more accurate representations of dynamic catalyst surfaces. The challenge here is serious because theoretical mechanistic insight must consider two simultaneously occurring dynamic processes, namely one that the catalyst material undergoes and another that the reactants experiences, both of which are coupled and driven by the local chemical potential . Our results revealing phase coexistence also open the possibility that different species may be responsible for activating specific steps of the conversion reaction (for instance, oxide for to and metal for to ). Hence, we expect operando approaches that incorporate chemically resolved microscopy within multimodal spectroscopic investigations, as demonstrated here, to play a vital role in moving forward the understanding of electrocatalytic processes by providing a path towards mapping such complexity.
In summary, operando EC-TEM and EC-TXM measurements have revealed that the morphologies of precatalysts during the and their evolutionary pathways are sensitive to the reaction time, applied potential and the nature of the electrolyte. As expected, the rate of oxide reduction accelerates with increasing negative applied potentials, but spatially separated oxide and metallic phases can coexist over extended reaction times under moderately reductive potentials. More importantly, the kinetics of the different restructuring processes, which have been unveiled here, determine the final morphology of the catalysts. Our results also indicate that the nature of the electrolyte can introduce time-dependent selectivity changes in the early stages of the catalyst restructuring, which will help resolve ongoing controversies regarding the active state of copper for selective production.
Finally, this work impacts our understanding of how electrocatalysts evolve under reaction conditions through the discovery of copper oxide and hydroxide stability. In addition, we revealed local structural and chemical heterogeneities that develop under electrochemical working conditions, even on a precatalyst sample initially characterized by a narrow size, shape and compositional distribution. Thus, our findings emphasize the need for operando characterization methods to establish connections between materials’ structural and compositional characteristics under specific reaction environments and external stimuli and their electrocatalytic performance.
Online content
Any methods, additional references, Nature Portfolio reporting summaries, source data, extended data, supplementary information, acknowledgements, peer review information; details of author contributions and competing interests; and statements of data and code availability are available at https://doi.org/10.1038/s41563-024-02084-8.
References
Gao, D., Arán-Ais, R. M., Jeon, H. S. & Roldan Cuenya, B. Rational catalyst and electrolyte design for electroduction towards multicarbon products. Nat. Catal. 2, 198-210 (2019).
Popović, S. et al. Stability and degradation mechanisms of copper-based catalysts for electrochemical reduction. Angew. Chem. Int. Ed. 59, 14736-14746 (2020).
Yang, J. et al. Potential-driven restructuring of Cu single atoms to nanoparticles for boosting the electrochemical reduction of nitrate to ammonia. J. Am. Chem. Soc. 144, 12062-12071(2022).
Hu, Q. et al. Reaction intermediate-mediated electrocatalyst synthesis favors specified facet and defect exposure for efficient nitrate-ammonia conversion. Energy Environ. Sci. 14, 4989-4997 (2021).
Pourbaix, M. Atlas of Electrochemical Equilibria in Aqueous Solutions (National Association of Corrosion Engineers, 1974).
Bergmann, A. & Roldan Cuenya, B. Operando insights into nanoparticle transformations during catalysis. ACS Catal. 9, 10020-10043 (2019).
Zhu, Y., Wang, J., Chu, H., Chu, Y.-C. & Chen, H. M. In situ/ operando studies for designing next-generation electrocatalysts. ACS Energy Lett. 5, 1281-1291 (2020).
Wang, Z., Richards, D. & Singh, N. Recent discoveries in the reaction mechanism of heterogeneous electrocatalytic nitrate reduction. Catal. Sci. Technol. 11, 705-725 (2021).
Jiao, F. & Xu, B. Electrochemical ammonia synthesis and ammonia fuel cells. Adv. Mater. 31, 1805173 (2019).
van Langevelde, P. H., Katsounaros, I. & Koper, M. T. M. Electrocatalytic nitrate reduction for sustainable ammonia production. Joule 5, 290-294 (2021).
Jung, W. & Hwang, Y. J. Material strategies in the electrochemical nitrate reduction reaction to ammonia production. Mater. Chem. Front. 5, 6803-6823 (2021).
Valera-Medina, A., Xiao, H., Owen-Jones, M., David, W. I. F. & Bowen, P. J. Ammonia for power. Prog. Energy Combust. Sci. 69, 63-102 (2018).
Chen, J. G. et al. Beyond fossil fuel-driven nitrogen transformations. Science 360, eaar6611 (2018).
Bae, S. E., Stewart, K. L. & Gewirth, A. A. Nitrate adsorption and reduction on in acidic solution. J. Am. Chem. Soc. 129, 10171-10180 (2007).
Zhou, N. et al. Potential-induced synthesis and structural identification of oxide-derived Cu electrocatalysts for selective nitrate reduction to ammonia. ACS Catal. 13, 7529-7537 (2023).
Anastasiadou, D. et al. Morphology changes of catalysts during nitrate electroreduction to ammonia. ChemCatChem 15, e202201503 (2023).
Costa, G. F. et al. Identifying the active site of for electrocatalytic nitrate reduction reaction to ammonia. Chem. Catal. 4, 100850 (2024).
Bai, L. et al. Electrocatalytic nitrate and nitrite reduction toward ammonia using nanocubes: active species and reaction mechanisms. J. Am. Chem. Soc. 146, 9665-9678 (2024).
Wang, Y., Zhou, W., Jia, R., Yu, Y. & Zhang, B. Unveiling the activity origin of a copper-based electrocatalyst for selective nitrate reduction to ammonia. Angew. Chem. Int. Ed. 59, 5350-5354 (2020).
Celante, V. G. & Freitas, M. B. J. G. Electrodeposition of copper from spent Li-ion batteries by electrochemical quartz crystal microbalance and impedance spectroscopy techniques. J. Appl. Electrochem. 40, 233-239 (2010).
Puigdomenech, I. & Taxén, C. Thermodynamic Data for Copper. Implications for the Corrosion of Copper under Repository Conditions (Svensk Kärnbränslehantering, 2000).
Hoar, T. P. & Rothwell, G. P. The potential/pH diagram for a copper-water-ammonia system: its significance in the stress-corrosion cracking of brass in ammoniacal solutions. Electrochim. Acta 15, 1037-1045 (1970).
Siegfried, M. J. & Choi, K.-S. Elucidating the effect of additives on the growth and stability of surfaces via shape transformation of pre-grown crystals. J. Am. Chem. Soc. 128, 10356-10357 (2006).
Luo, Q., Mackay, R. A. & Babu, S. V. Copper dissolution in aqueous ammonia-containing media during chemical mechanical polishing. Chem. Mater. 9, 2101-2106 (1997).
Fu, X. et al. Alternative route for electrochemical ammonia synthesis by reduction of nitrate on copper nanosheets. Appl. Mater. Today 19, 100620 (2020).
Schroder, D., Schwarz, H., Wu, J. & Wesdemiotis, C. Long-lived dications of and do exist! Chem. Phys. Lett. 3343, 258-264 (2001).
Ducéré, J. M., Goursot, A. & Berthomieu, D. Comparative density functional theory study of the binding of ligands to and : influence of the coordination and oxidation state. J. Phys. Chem. A 109, 400-408 (2005).
Grosse, P., Yoon, A., Rettenmaier, C., Chee, S. W. & Roldan Cuenya, B. Growth dynamics and processes governing the stability of electrodeposited size-controlled cubic Cu catalysts. J. Phys. Chem. C 124, 26908-26915 (2020).
Grosse, P. et al. Dynamic transformation of cubic copper catalysts during electroreduction and its impact on catalytic selectivity. Nat. Commun. 12, 6736 (2021).
Li, Y. et al. Electrochemically scrambled nanocrystals are catalytically active for -to-multicarbons. Proc. Natl Acad. Sci. USA 117, 9194-9201 (2020).
Yoon, A., Poon, J., Grosse, P., Chee, S. W. & Roldan Cuenya, B. Iodide-mediated Cu catalyst restructuring during electroreduction. J. Mater. Chem. A 10, 14041-14050 (2022).
Velasco-Vélez, J. J. et al. On the activity/selectivity and phase stability of thermally grown copper oxides during the electrocatalytic reduction of . ACS Catal. 10, 11510-11518 (2020).
Timoshenko, J. & Roldan Cuenya, B. In situ/operando electrocatalyst characterization by X-ray absorption spectroscopy. Chem. Rev. 121, 882-961 (2021).
Nobial, M., Devos, O., Mattos, O. R. & Tribollet, B. The nitrate reduction process: a way for increasing interfacial pH . J. Electroanal. Chem. 600, 87-94 (2007).
Monteiro, M. C. O. & Koper, M. T. M. Measuring local pH in electrochemistry. Curr. Opin. Electrochem. 25, 100649 (2021).
Johnson, A. R., McQueen, T. M. & Rodolfa, K. T. Species distribution diagrams in the copper-ammonia system: an updated and expanded demonstration illustrating complex equilibria. J. Chem. Educ. 82, 408-414 (2005).
Giannopoulou, I., Panias, D. & Paspaliaris, I. Electrochemical modeling and study of copper deposition from concentrated ammoniacal sulfate solutions. Hydrometallurgy 99, 58-66 (2009).
Deng, Y., Handoko, A. D., Du, Y., Xi, S. & Yeo, B. S. In situ Raman spectroscopy of copper and copper oxide surfaces during electrochemical oxygen evolution reaction: identification of oxides as catalytically active species. ACS Catal. 6, 2473-2481 (2016).
Niaura, G. Surface-enhanced Raman spectroscopic observation of two kinds of adsorbed ions at copper electrode. Electrochim. Acta 45, 3507-3519 (2000).
Chan, H. Y. H., Takoudis, C. G. & Weaver, M. J. Oxide film formation and oxygen adsorption on copper in aqueous media as probed by surface-enhanced Raman spectroscopy. J. Phys. Chem. B 103, 357-365 (1999).
Bodappa, N. et al. Early stages of electrochemical oxidation of and polycrystalline Cu surfaces revealed by in situ Raman spectroscopy. J. Am. Chem. Soc. 141, 12192-12196 (2019).
Moura de Salles Pupo, M. & Kortlever, R. Electrolyte effects on the electrochemical reduction of . ChemPhysChem 20, 2926-2935 (2019).
Marcandalli, G., Monteiro, M. C. O., Goyal, A. & Koper, M. T. M. Electrolyte effects on electrochemical reduction to CO. Acc. Chem. Res. 55, 1900-1911 (2022).
Nitopi, S. et al. Progress and perspectives of electrochemical reduction on copper in aqueous electrolyte. Chem. Rev. 119, 7610-7672 (2019).
Katsounaros, I. & Kyriacou, G. Influence of the concentration and the nature of the supporting electrolyte on the electrochemical reduction of nitrate on tin cathode. Electrochim. Acta 52, 6412-6420 (2007).
Aran-Ais, R. M. et al. Structure- and electrolyte-sensitivity in electroreduction. Acc. Chem. Res. 51, 2906-2917 (2018).
Chee, S. W., Lunkenbein, T., Schlögl, R. & Roldán Cuenya, B. Operando electron microscopy of catalysts: the missing cornerstone in heterogeneous catalysis research? Chem. Rev. 123, 13374-13418 (2023).
Publisher’s note Springer Nature remains neutral with regard to jurisdictional claims in published maps and institutional affiliations.
Open Access This article is licensed under a Creative Commons Attribution 4.0 International License, which permits use, sharing, adaptation, distribution and reproduction in any medium or format, as long as you give appropriate credit to the original author(s) and the source, provide a link to the Creative Commons licence, and indicate if changes were made. The images or other third party material in this article are included in the article’s Creative Commons licence, unless indicated otherwise in a credit line to the material. If material is not included in the article’s Creative Commons licence and your intended use is not permitted by statutory regulation or exceeds the permitted use, you will need to obtain permission directly from the copyright holder. To view a copy of this licence, visit http://creativecommons. org/licenses/by/4.0/.
(c) The Author(s) 2025
¹Department of Interface Science, Fritz-Haber Institute of the Max-Planck Society, Berlin, Germany. Department of X-ray Microscopy, Helmholtz-Zentrum Berlin, Berlin, Germany. Present address: Shell Global Energy Solution International BV, Amsterdam, Netherlands. Present address: Department of Chemical and Pharmaceutical Sciences, University of Trieste, Trieste, Italy. Present address: College of Chemistry and Chemical Engineering, Xiamen University, Xiamen, China. Present address: Technological Convergence Center, Korea Institute of Science and Technology (KIST), Seoul, Republic of Korea. □ e-mail: swchee@fhi-berlin.mpg.de; roldan@fhi-berlin.mpg.de
Methods
Specimen preparation
The cubes ( 250 nm ) were synthesized on polished glassy carbon (vitreous, SPI) plates, carbon paper and the carbon electrode of Hummingbird Scientific EC-TEM chips using an electrodeposition protocol we previously developed . The deposition solution consists of a mixture of 5 mM copper sulfate pentahydrate ( , Sigma-Aldrich) and 12.5 mM of potassium chloride ( KCl , Sigma-Aldrich). After the synthesis, the samples were rinsed with ultrapure water and then used for the subsequent experiments.
Electrolyte preparation for nitrate reduction
The electrolyte used for nitrate reduction experiments is an aqueous solution of (anhydrous, , Suprapur) (Sigma-Aldrich, ReagentPlus, ).
Operando EC-TEM
The EC-TEM experiments were performed in a Thermo Fisher Scientific 300 kV Titan TEM operated in STEM mode with an electron probe current of . The liquid cell holder used is a Hummingbird Scientific Bulk Liquid Electrochemistry TEM holder with a platinum counter-electrode and a reference electrode. The EC-TEM top and bottom chips for the cells are produced by Hummingbird Scientific and both have -thick silicon nitride membrane windows. Bottom chips with 250 nm spacers are used for these experiments. After cell assembly, the holder was then connected to a Biologic SP-200 potentiostat for electrochemistry experiments. The potentials were measured against a miniature reference that is integrated within the holder.
During cell assembly, the TEM holder was prefilled with 0.1 M solution to fill the entire fluid path with electrolyte. After loading into the TEM, electrolyte was further pumped through the holder at a flow rate of using a syringe filled with and a syringe pump. Linear sweep voltammetry from -0.5 to (repeated twice) was first performed at a scan rate of to determine the onset potential for the and to ensure that the applied potential was consistent between experiments. These measurements were then followed up by chronoamperometry measurements for up to 2 h at , -0.5 and . A new catalyst specimen and fresh electrolyte were used at each applied potential and electrolyte condition.
For these EC-TEM experiments, in situ imaging was always performed under conditions with electrolyte in the cell, as determined from the image contrast. The electron flux was also maintained at and below at all times to minimize electron-beam-induced artefacts. The acquired images have an image size of pixels. During intermittent imaging, the images were acquired every 15 min with the electron beam blanked in between. The image segmentation for the EC-TEM movies was performed using built-in functions and scripting in MATLAB (see Supplementary Note 4 for details).
product analysis and detection
The electrochemistry experiments for product analysis and ex situ imaging were conducted using an Autolab potentiostat (PGSTAT 302N) and a custom-made H -type electrochemical cell, in which the cathodic and anodic compartments were separated by an anion-exchange membrane (Selemion AMV, AGC). The counter-electrode is a platinum gauze ( mesh ) and the reference electrode is a leak-free electrode (LF-1, Alvatek, potential 0.198 V versus standard hydrogen electrode). The anodic compartment (with counter-electrode) was filled with electrolyte; the cathodic compartment (with the working electrode) was filled with electrolyte . The anodic and cathodic solutions were deaerated before the experiments by continuously bubbling argon (grade ) with a flow rate
(Bronkhorst). Linear sweep voltammetry performed at a scan rate of was again used to verify the applied potential, and the samples were maintained at constant potential (chronoamperometry) for 2 h for product distribution analysis. A constant argon flow ( ) was used to maintain the inert atmosphere during chronoamperometry.
An ultraviolet-visible spectrometer (Agilent Cary 60) was used to detect and quantify the amounts of ammonia and nitrite in the electrolyte according to procedures previously established in the literature . The liquid electrolyte was first diluted to match the suitable detection range for spectrophotometric analysis of each analyte, and then the sample absorbance was measured in the range .
The indophenol blue method was used for the determination of (refs. 48,49), and a commercial nitrite test kit (photometric 0.002, Spectroquant, Merck) was used for nitrite quantification. For the latter, 3 ml of the diluted electrolyte was added to a glass vial containing 35 mg of white powder from the kit. Details on quantification can be found in Supplementary Note 2.
Ex situ TEM and SEM measurement
The ex situ TEM imaging was also performed with the Thermo Fisher Scientific 300 kV Titan TEM for before-and-after reaction comparisons. In both cases, the EC-TEM chips were inspected in the TEM using a Hummingbird Scientific Tomography holder. For after-reaction analysis, the EC-TEM chips were first rinsed in ultrapure water after they were disassembled from the EC-TEM holder, and then immediately transferred into the TEM to minimize air exposure. The ex situ SEM imaging of the bulk samples was performed using a Thermo Fisher Scientific Apreo SEM.
Operando EC-TXM measurement
Operando EC-TXM experiments were conducted at the U41-TXM beamline in BESSY II (Berlin, Germany). The beam size was with a nominal resolution of 20 nm . The image stacks were collected using a charge-coupled device detector at 1,340 pixel pixel and an exposure time of 1 s per energy. A 10 nm monochromator slit was used. The intensity of the incident radiation was monitored and adjusted to have a photon count constant ( counts per pixel) at the background area (no specimen) when liquid is fully filled. Image stacks were acquired as the beam energies were scanned from 926 to 965 eV , which encompassed both copper and edges.
The Hummingbird Scientific electrochemistry holder was also used for the operando measurements and the applied potential was controlled with a Biologic potentiostat. The reference electrode was a platinum pseudo-reference on the chip and the counter-electrode was platinum. The reference potential was then calibrated against an external electrode to ensure that a potential comparable to the EC-TEM experiments was applied.
Details regarding the data processing, including accurate alignment, background subtraction, data normalization, spectra averaging and LCF of the hyperspectral images can be found in Supplementary Note 2.
Operando XAS
Operando time-resolved X-ray absorption fine-structure spectroscopy (XAFS) experiments at the copper K edge ( ) were performed at the P64 beamline of the PETRA III synchrotron (Hamburg,Germany) in quick XAFS mode. The intensity of the incident radiation was monitored by a gas ionization chamber filled with pure nitrogen. Additional ionization chambers were used to acquire spectra of a copper foil in transmission mode for calibration purposes at the beginning of each quick XAFS scan. The beam size was less than . The XAS data were collected in fluorescence mode using a passivated implanted planar silicon detector at rates of one spectrum per second and one spectrum per 5 s .
We used a home-made single-compartment electrochemical cell for these operando XAS experiments. Argon was flowed into the gas compartment at . The cubes were prepared on a carbon paper electrode and the electrolyte was continuously circulated through the cell using a double-channel peristaltic pump. The applied potential was controlled with a Biologic potentiostat.
Data extraction and calibration were performed using the JAQ software of the P64 beamline. Further data processing and analysis of the XANES spectra were performed according to the procedures described previously in ref. 50 .
Operando Raman measurement
The operando Raman experiments were performed using a Renishaw (InVia Reflex) confocal Raman microscope and a water immersion objective with a long working distance (Leica Microsystems; ; numerical aperture, 0.9 ) was chosen. The objective was protected from the electrolyte by a Teflon film (DuPont; film thickness, 0.013 mm ). Then, a drop of water was used to drive away the air between the film and the objective to match the refractive index to ensure efficient excitation and collection of the Raman signal.
The electrochemical measurements were performed in a home-built spectroelectrochemical cell made of Teflon and controlled by a Biologic SP-240 potentiostat. The cell was equipped with a reference electrode (leak-free , Alvatek), a counter-electrode (platinum ring), and a working electrode with the catalyst electrodeposited on glassy carbon. A 15 ml argon-purged solution was used as an electrolyte. For the experiments on glassy carbon described in Fig. 5, we used a 785 nm laser with laser power . During the experiment, the Raman spectra were acquired every 5 min over 1 h of reaction.
Data availability
The authors declare that the data supporting the findings of this study are available within the paper and its Supplementary Information files. The raw data files generated over the course of this study are available from the corresponding authors upon reasonable request.
References
Andersen, S. Z. et al. A rigorous electrochemical ammonia synthesis protocol with quantitative isotope measurements. Nature 570, 504-508 (2019).
Wang, Y., Wang, C., Li, M., Yu, Y. & Zhang, B. Nitrate electroreduction: mechanism insight, in situ characterization, performance evaluation, and challenges. Chem. Soc. Rev. 50, 6720-6733 (2021).
Jeon, H. S. et al. Selectivity control of Cu nanocrystals in a gas-fed flow cell through pulsed electroreduction. J. Am. Chem. Soc. 143, 7578-7587 (2021).
Acknowledgements
A.Y. and C.Z. thank the Alexander von Humboldt Foundation (AvH) for supporting them with an AvH postdoctoral research grant. L.B. acknowledges the support from the Early Postdoc Mobility Fellowship (P2ELP2_199800) of the Swiss National Science Foudation. F.Y. acknowledges the Chinese Scholarship Council for sponsoring her
PhD. This work was partially funded by the German Federal Ministry for Education and Research (BMBF) under the grant Catlab (O3EW0015B), the Deutsche Forschungsgemeinschaft (DFG, German Research Foundation) under project number 406944504-SPP 2080 and Germany’s Excellence Strategy-EXC 2008-390540038 UniSysCat. A.Y. also thanks the SPP 2080 ‘DynaKat’ Early Career Research Scholarships for Female Scientists for partial funding. We are very grateful to A. Herzog, U. Hejral, A. Bergmann and S.-Y. Fu for their time and help with the XAS and TXM beamtime measurements. We further acknowledge A. Martini and C. Scheurer for their helpful discussions with regards to analysis of the TXM data, E. Ortega for his help with some of the TEM data analysis and W. Wachsmann for the inductively coupled plasma mass spectrometry measurements. Finally, we thank the Helmholtz-Zentrum Berlin für Materialien und Energie (Berlin, Germany), and DESY (Hamburg, Germany), members of the Helmholtz Association HGF, for the allocation of dedicated synchrotron radiation beamtime.
Author contributions
A.Y., S.W.C. and B.R.C. conceived the project, planned the experiments and wrote the manuscript. A.Y. prepared specimens, conducted the operando EC-TEM studies and operando EC-TXM studies, ex situ TEM and ex situ SEM analysis, and analysed the data. L.B. measured the selectivity and analysed the electrochemical data. F.Y. assisted with the sample preparation and performed some of the operando EC-TEM experiments. F.F. provided the initial inspiration for the project and developed the experimental protocol for H-type cell measurements and product analysis. C.Z. and L.B. conducted operando Raman measurements and analysed the results. M.R. and J.T. planned and collected the operando XAS data and performed the analysis and interpretation. C.P. and S.W. planned the operando EC-TXM measurements with A.Y. and S.W.C., operated the TXM and helped with analysis of the TXM data. M.C.d.O.M. and H.S.J. were involved in the XAS measurements and helped with analysis and interpretation of the results.
Funding
Open access funding provided by Max Planck Society.
Correspondence and requests for materials should be addressed to See Wee Chee or Beatriz Roldan Cuenya.
Peer review information Nature Materials thanks Judith Yang and the other, anonymous, reviewer(s) for their contribution to the peer review of this work.