DOI: https://doi.org/10.1057/s41599-024-02887-9
تاريخ النشر: 2024-03-06
مقالة
كيف تؤثر اهتمام الحكومات المحلية بالبيئة على التنمية الخضراء الإقليمية؟ أدلة تجريبية من الحكومات المحلية في الصين
الملخص
نظرًا للتقدم المستمر في بناء بيئات مستدامة في الصين، فإن الدور الذي تلعبه الحكومة المركزية الصينية كالجسم الرئيسي لتعزيز التنمية الخضراء يستحق الدراسة. لأن بناء الحضارة البيئية في الصين قد تقدم بشكل ثابت. وقد أولت الحكومات على جميع المستويات في الصين أولوية لتطوير الحضارة البيئية كجانب رئيسي من جوانب النمو الإقليمي. ومع ذلك، لا يزال التأثير الفعلي وآليات التأثير لهذا البناء تتطلب مزيدًا من التحقيق. يقوم هذا البحث ببناء مؤشر اهتمام الحكومة بالبيئة باستخدام تكرار الكلمات الموجودة في تقرير عمل الحكومة. ويستخدم نموذج الفرق الطويل لدراسة تأثير وآلية اهتمام الحكومة بالبيئة على كفاءة المدن الخضراء، وانبعاثات الكربون، وجودة الهواء. تظهر النتائج أن اهتمام الحكومة بالبيئة يمكن أن يحسن الكفاءة الخضراء وجودة الهواء، ولكنه يمكن أن يؤدي أيضًا إلى زيادة انبعاثات الكربون، ويكون التأثير واضحًا بشكل خاص في المناطق الشرقية والغربية من البلاد. وذلك لأن تركيز الحكومة على البيئة يؤثر بشكل كبير على اللوائح البيئية والتقدم التكنولوجي، ويتأثر مباشرة بالتحيز المالي والضغط المالي. بناءً على النتائج، نقدم بعض الاقتراحات السياسية التي يجب على الحكومات المحلية تحسين شدة التنظيم البيئي المحلي، وتشجيع الابتكار في التكنولوجيا الخضراء، وتوفير ظروف مشجعة للتنمية البيئية، وإقامة رؤية استراتيجية طويلة الأجل. إن النتائج في هذه الدراسة لها آثار على تعزيز تنفيذ حماية البيئة من قبل الحكومات المحلية وتطوير المجتمعات المستدامة في الصين.
مقدمة
التركيز على البيئة. يأخذ في الاعتبار الاختلافات في المدن والمناطق. كما نقوم بدراسة كيفية تأثير التركيز البيئي للحكومة على العلاقة بين الضغط المالي والتحيز. من خلال بناء الإيرادات المالية كمتغير آلي، وتأخير المتغيرات التفسيرية، وتنظيم متغيرات السيطرة الحضرية، وإزالة صدمات السياسات، تصل هذه الدراسة إلى استنتاجات موثوقة إلى حد معقول مع الأخذ في الاعتبار صعوبات الاندماج في النموذج.
مراجعة الأدبيات وتحليل آلية النقل
النتائج، يمكن أن تشير العديد من المؤشرات إلى سمات مميزة. لتقييم المستوى الإجمالي للتنمية الخضراء، من المهم النظر في عدة مؤشرات لأنظمة التنمية الخضراء الإقليمية. علاوة على ذلك، من المهم إجراء بحث شامل حول الآثار الملموسة للواقعين الاقتصادي والاجتماعي وآليات تأثيرهما.
تصميم البحث التجريبي
نفترض أن هناك:
تأخذ الحكومة في الاعتبار التركيز المحدود على القضايا البيئية. أخيرًا، يتم استخدام الدخل المالي كمتغير آلي عند إجراء تحليل الانحدار باستخدام طريقة المربعات الصغرى الثنائية (2SLS) لمعالجة مشاكل الاندماج بشكل أكبر.
الابتكار وتمكين الشركات من تعزيز كفاءة الموارد. يلاحظ دونغ (دونغ وآخرون 2014) أن تحسين الجودة البيئية يتماشى مع مسار التقدم التكنولوجي. سيؤدي تحسين الجودة البيئية إلى تأثير “الازدحام” على الإنتاجية الاقتصادية، مما يدفع الشركات إلى إعادة توجيه تركيزها نحو التقدم التكنولوجي لتلبية متطلبات تحسين الجودة البيئية. عندما تصل التكنولوجيا النظيفة إلى مستوى كبير من الكثافة، يمكن أن تكون هناك علاقة مفيدة للطرفين بين الجودة البيئية والنمو الاقتصادي. تظهر أبحاث يانغ (يانغ وآخرون 2023) أن اللوائح البيئية تؤثر على كفاءة انبعاثات الكربون من التقنيات الخضراء المبتكرة والمحسنة.
إنشاء المؤشرات الرئيسية والحقائق النموذجية
باستخدام ثلاثة مؤشرات: كفاءة المساحات الخضراء الحضرية، انبعاثات الكربون الحضرية، وجودة الهواء الحضرية.
| فهرس | متغير | وحدة |
| فهرس الإدخال | مدخلات العمل | عشرة آلاف شخص |
| رأس المال | عشرة آلاف يوان | |
| مدخلات الطاقة | عشرة آلاف كيلوواط ساعة | |
| الناتج المتوقع | الناتج المحلي الإجمالي الحقيقي | عشرة آلاف يوان |
| مخرجات غير مرغوب فيها | انبعاثات ثاني أكسيد الكبريت الصناعية تصريف المياه العادمة الصناعية | عشرة آلاف طن |
| انبعاث السخام الصناعي | طن |
الجدول 2 الكلمات الرئيسية ذات الأهمية البيئية.
فئة تلوث البيئة: التلوث، تصريف الملوثات، الطلب الكيميائي على الأكسجين، ثاني أكسيد الكبريت، ثاني أكسيد الكربون، المواد الجسيمية، PM2.5، النيتروجين الأموني، أكسيد النيتروجين، تلوث الهواء، الملوثات، الغبار، سقوط الغبار، النفايات، القمامة، الانبعاثات، الهواء، الطلب الكيميائي على الأكسجين، ثاني أكسيد الكبريت، ثاني أكسيد الكربون، PM10، الضباب، غازات الدفيئة
فئة استهلاك الطاقة: استهلاك المياه، استهلاك الطاقة، الاستهلاك، الموارد، الحفظ، التكثيف، الطاقة، الطاقة الجديدة، الطاقة النظيفة، الفحم إلى الكهرباء، الفحم إلى الغاز، التدفئة المركزية، إعادة التدوير، إعادة التدوير، الطاقة المتجددة
التنمية المنسقة وحوكمة البيئة: تنسيق حماية البيئة، التنمية التعاونية، التعاون
الحوكمة، التعاون الإداري، المشاركة العامة، منطقة الحدود، المشاركة، النقل، الوقاية المشتركة، التنظيم المشترك، الحوكمة المشتركة، التنمية المنسقة الإقليمية، الحوكمة المتكاملة لمناطق الأحواض، التعاون الإقليمي، المزايا التكميلية، التعاون المربح للطرفين، الترويج المشترك، الحماية والتعاون، تنظيم التلوث التعاوني، المستدام
فصول أخرى: السماء الزرقاء، المياه الصافية، الأرض النقية، المساحات الخضراء، الغابة، طول النهر، نظام طول النهر، طول البحيرة، نظام طول البحيرة، الأخضر، الأبيض، القابل للعيش، زراعة الأشجار، إعادة التحريج، المياه الصافية والجبال الخضراء، السماء الزرقاء والسحب البيضاء، الحاجز البيئي، الحفاظ على المياه، الحفاظ على المياه والتربة، التنمية، التربة، إعادة الأراضي الزراعية إلى الغابات، الغابة الطبيعية
مفهوم التنمية: الاقتصاد منخفض الكربون، الاقتصاد الدائري، الاقتصاد الأخضر، منطقة عرض الحضارة البيئية، المدينة البيئية
الإنتاج الأخضر: استهلاك الطاقة العالي، توفير الطاقة وتقليل الانبعاثات، الري الموفّر للمياه، توفير المياه الصناعية، التصنيع الأخضر، تقليل الاستهلاك، تلوث المصادر غير النقطية الزراعية
الحياة الخضراء: النفايات المنزلية، الاستهلاك الأخضر، السفر الأخضر، ثورة المراحيض
البيئة الخضراء: استعادة الغابات، إعادة التحريج، الحفاظ على المياه، الجبال الخضراء
بناء النظام: الوقاية والتنظيم المشترك، التشريع المحلي، المشاركة العامة، آلية الإشراف البيئي، الحوكمة الخضراء
النتائج التجريبية والتحليل
| الجدول 3 الإحصاءات الوصفية لبيانات اللوحة. | ||||
| متغير | ملاحظات | المتوسط | الحد الأدنى | الحد الأقصى |
| GML | 2912 | 1.003387 | 0.8810029 | 1.147856 |
| الكربون | 2628 | 804.9686 | 31.2451 | 7685.485 |
| PM | 2912 | 42.51906 | 17.93062 | 86.34021 |
| الحكومة | 2896 | 87.31285 | 25 | 161 |
| متغير | (1) | (2) | (3) | (4) | (5) |
| جي | جي | جي | هذا | هذا | |
| جي إي آي | 0.000211*** (4.35) | 0.000159*** (3.77) | 0.000159*** (4.74) | 4.617*** (4.95) | 3.398*** (4.77) |
| سي سي في | لا | نعم | نعم | لا | نعم |
| PFE | نعم | نعم | نعم | نعم | نعم |
| PLC | نعم | نعم | لا | نعم | نعم |
| CLC | لا | لا | نعم | لا | لا |
|
|
2952 | ٢٦٨٣ | ٢٦٨٣ | ٢٦٦٣ | ٢٦٦٣ |
|
|
0.052 | 0.053 | 0.053 | 0.587 | 0.700 |
| متغير | (6) | (7) | (8) | (9) |
| جي | PM2.5 | PM2.5 | PM2.5 | |
| جي إي آي | 3.398*** (3.58) | -0.0764*** (-4.65) | -0.0475*** (-5.15) | -0.0475*** (-5.46) |
| سي سي في | لا | لا | نعم | نعم |
| PFE | نعم | نعم | نعم | نعم |
| PLC | نعم | نعم | نعم | لا |
| CLC | لا | لا | لا | نعم |
|
|
٢٦٦٣ | 2952 | ٢٦٨٣ | ٢٦٨٣ |
|
|
0.700 | 0.534 | 0.669 | 0.669 |
| *** ذو دلالة عند مستوى 1%. | ||||
| متغير | (1) | (2) | (3) | (4) | (5) |
| جي | جي | جي | هذا | هذا | |
| جي إي آي | 0.000112*** (3.16) | 0.000133*** (3.27) | 0.000155 *** (3.81) | 3.373*** (4.51) | 3.025*** (4.43) |
| لا بأس | 0.0279*** (3.83) | 1.222 (0.01) | |||
| BPC | 0.0196*** (9.53) | 262.0*** (2.87) | |||
| SCP | 0.0110*** (4.83) | ||||
| يو سي في | نعم | نعم | نعم | نعم | نعم |
| PFE | نعم | نعم | نعم | نعم | نعم |
|
|
2673 | 2673 | 2673 | ٢٦٥٣ | ٢٦٥٣ |
| ر
|
0.072 | 0.073 | 0.057 | 0.٦٩٩ | 0.703 |
| منطقة التجريب الشاملة للبيانات الكبيرة الوطنية NBD، مشروع التجريب للاتصالات عالية السرعة BPC في الصين، مشروع المدينة الذكية SCP، المتغيرات الحضرية للتحكم UCV. *** ذو دلالة عند مستوى 1%. | |||||
| متغير | (6) | (7) | (8) | (9) |
| هذا | PM2.5 | PM2.5 | PM2.5 | |
| جي إي آي | 3.374*** (4.61) | -0.0388*** (3.16) | -0.0428*** (-3.57) | -0.0483*** (-4.87) |
| لا بأس | -5.670*** (-5.07) | |||
| BPC | -4.192*** (-4.64) | |||
| SCP | 1.465 (0.01) | -0.288 (-0.25) | ||
| يو سي في | نعم | نعم | نعم | نعم |
| PFE | نعم | نعم | نعم | نعم |
|
|
٢٦٥٣ | 2673 | 2673 | 2673 |
|
|
0.699 | 0.072 | 0.073 | 0.057 |
| *** ذو دلالة عند مستوى 1%. | ||||
نحو تطوير صديق للبيئة، وإيكولوجي، ومنخفض الكربون، ودائري. لتقليل تأثير السياسات المحتملة الأخرى، تم تقييد البيانات في هذا البحث فقط بالفترة التي تلت التأسيس الرسمي لمفهوم التنمية الخضراء في عام 2015، مما يلغي أي تدخل محتمل من سياسات أخرى. بعد تقليص الإطار الزمني، تظل البيانات في الجدول 7 ذات دلالة إحصائية وتظهر اتساقًا مع النص السابق، مما يشير إلى قوة النتائج.
| متغير | (1) | (2) | (3) | ||
| جنرال إلكتريك | CE | PM2.5 | |||
| جي إي آي | 0.000133*** (2.68) | 2.386** (2.02) | -0.0468*** (4.00) | ||
| CCV | نعم | نعم | نعم | ||
| ICV | نعم | نعم | نعم | ||
| PFE | نعم | نعم | نعم | ||
| ن | ٢٤٠٦ | 2401 | ٢٤٠٩ | ||
|
|
0.071 | 0.590 | 0.674 | ||
|
|||||
| متغير | (1) | (2) | (3) |
| جنرال إلكتريك | CE | PM2.5 | |
| جي إي آي | 0.000181** (2.68) | 2.616* (2.02) | -0.0377*** (4.00) |
| سي سي في | نعم | نعم | نعم |
| ICV | نعم | نعم | نعم |
| PFE | نعم | نعم | نعم |
|
|
1350 | 1340 | 1350 |
|
|
0.074 | 0.655 | 0.655 |
| ***، **، * دالة عند مستوى 1% و 5% و 10% على التوالي. | |||
| متغير | (1) | (2) | (3) | (4) | (5) | (6) |
| جنرال إلكتريك | CE | PM2.5 | 2SLS | 2SLS | 2SLS | |
| جي إي آي |
|
3.347*** (4.49) | -0.0578*** (-5.03) | 0.00345** (2.00) | 261.6** (2.37) | -0.264*** (-2.91) |
| CCV | نعم | نعم | نعم | نعم | نعم | نعم |
| ICV | نعم | نعم | نعم | نعم | نعم | نعم |
| PFE | نعم | نعم | نعم | نعم | نعم | نعم |
|
|
2413 | ٢٣٩٥ | 2413 | ٢٦٨٣ | ٢٦٦٣ | ٢٦٨٣ |
| ر
|
0.047 | 0.698 | 0.666 | -2.903 | -18.602 | 0.533 |
|
|
||||||
| متغير | (1) | (2) | (3) |
| جنرال إلكتريك | CE | PM2.5 | |
| جي إي آي | 0.0002629*** (4.81) | 1.562433* (1.86) |
|
| ل.جي | 0.0000557 (1.13) | 0.814216* (1.63) | 0.0238789*** (-4.34) |
| ل. جي | -0.1487794** (-1.90) | ||
| ل.س | 1.47587*** (4.41) | ||
| ل. م. | 0.7173992*** (28.39) | ||
| متغير التحكم | نعم | نعم | نعم |
| AR(2) | 0.2274 | 0.1364 | 0.7853 |
| سارغان | 0.0000 | 0.0000 | 0.0000 |
|
|
2405 | 2126 | 2405 |
| ***، **، * دالة عند مستوى 1%، 5% و 10% على التوالي. | |||
تحليل آلية تركيز الحكومة على التنفيذ البيئي
| متغير | (1) | (2) | (3) | (4) | (5) | (6) |
| جنرال إلكتريك | CE | PM2.5 | جنرال إلكتريك | CE | PM2.5 | |
| البنك الأوروبي للاستثمار | -0.0000268 (-0.22) | 2.441 (1.69) | -0.0287 (-1.57) | |||
| سما | 0.000176*** (4.39) | 1.846*** (2.82) | -0.0504*** (-5.14) | |||
| سي سي في | نعم | نعم | نعم | نعم | نعم | نعم |
| PFE | نعم | نعم | نعم | نعم | نعم | نعم |
| PLC | نعم | نعم | نعم | نعم | نعم | نعم |
|
|
398 | 398 | 398 | 2285 | 2265 | 2285 |
|
|
0.042 | 0.963 | 0.788 | 0.03 | 0.211 | 0.680 |
*** ذو دلالة عند مستوى
| متغير | (1) | (2) | (3) | (4) | (5) | (6) |
| جنرال إلكتريك | CE | PM2.5 | جنرال إلكتريك | CE | PM2.5 | |
| EAIE | 0.000180* (2.14) | 5.130*** (5.17) | -0.0261* (-1.98) | |||
| CEA | 0.0000791 (1.17) | 1.311 (1.73) | -0.0265 (-1.69) | |||
| سي سي في | نعم | نعم | نعم | نعم | نعم | نعم |
| PFE | نعم | نعم | نعم | نعم | نعم | نعم |
| PLC | نعم | نعم | نعم | نعم | نعم | نعم |
| ن | 841 | 841 | 841 | 775 | 775 | 775 |
| ر
|
0.086 | 0.832 | 0.676 | 0.053 | 0.555 | 0.693 |
***، * دالة عند مستوى 1% و 10% على التوالي.
المتغيرات لقياس التقدم التكنولوجي. من المحتمل أن تؤثر المدينة التي قامت باستثمارات كبيرة في التكنولوجيا وتمتلك العديد من براءات الاختراع الخضراء بشكل إيجابي على التقدم التكنولوجي. كلما زادت استثمارات المدينة في البحث والتكنولوجيا، زادت قدرتها على إظهار تركيزها على التقدم التكنولوجي. تظهر نتائج الانحدار المقدمة في الجدول 12 علاقة إيجابية كبيرة بين التركيز البيئي للحكومة وعدد براءات الاختراع الخضراء ومؤشر البحث والتطوير. وفقًا للجدول 12، يمكن أن يعزز التركيز على البيئة من قبل الحكومات المحلية تقدم التكنولوجيا الإقليمية ويزيد من الاهتمام بالتكنولوجيا من قبل المدن. وهذا يوضح أيضًا تأثير التركيز البيئي للحكومة على التقدم التكنولوجي. التقدم التكنولوجي أمر حاسم للمدن لتحقيق التنمية المستدامة بيئيًا والازدهار الاقتصادي.
تحليل موسع
| متغير | (1) | (2) | (3) | (4) | (5) | (6) |
| جنرال إلكتريك | CE | PM2.5 | جنرال إلكتريك | CE | PM2.5 | |
| واي | 0.000147** (2.75) | 3.098** (3.01) | -0.0736*** (-6.56) | |||
| ناي | 0.000361 (1.14) | 7.039 (2.30) | -0.0632 (-2.02) | |||
| CCV | نعم | نعم | نعم | نعم | نعم | نعم |
| PFE | نعم | نعم | نعم | نعم | نعم | نعم |
| PLC | نعم | نعم | نعم | نعم | نعم | نعم |
|
|
728 | 718 | 728 | ٣٣٩ | ٣٢٩ | ٣٣٩ |
|
|
0.032 | 0.385 | 0.482 | 0.038 | 0.560 | 0.489 |
| متغير | (1) | (2) | (3) |
| غرفة الطوارئ | WER | كن | |
| جي إي آي | 66.53* (1.95) | 0.347 (1.62) | 88.70* (1.66) |
| CCV | نعم | نعم | نعم |
| يو إف إي | نعم | نعم | نعم |
| PLC | نعم | نعم | نعم |
|
|
٢٦٨٣ | 1068 | 1350 |
|
|
-27.196 | -0.928 | -23.104 |
- يعتبر ذا دلالة عند مستوى 10%.
| متغير | (1) | (2) | (3) |
| NGI | نجوم | RD | |
| جي إي آي | 361.3** (2.31) | 291.6** (2.26) | 0.00277** (2.26) |
| سي سي في | نعم | نعم | نعم |
| يو إف إي | نعم | نعم | نعم |
| PLC | نعم | نعم | نعم |
|
|
٢٦٨١ | ٢٦٨١ | ٢٦٨٣ |
|
|
-52.283 | -69.235 | -17.594 |
| عدد الاختراعات الخضراء NGI، عدد نماذج المنفعة الخضراء NGUM. ** ذو دلالة عند 5%. | |||
| متغير | (1) | (2) | ||
| فيسبوك | FP | |||
| جي إي آي × إف بي | 0.00484** (2.27) | |||
| جي إي آي
|
0.00499*** (3.49) | |||
| CCV | نعم | نعم | ||
| UFE | نعم | نعم | ||
| PLC | نعم | نعم | ||
|
|
2632 | ٢٦٨٢ | ||
|
|
0.407 | 0.603 | ||
|
||||
ومع ذلك، لا تزال هيكل الصناعة ذات الانبعاثات الكربونية العالية منتشرة على نطاق واسع في الصين. يستمر السياحة في لعب دور كبير في التنمية الاقتصادية لبلدنا، حيث تساهم بشكل كبير في إيرادات الضرائب الحكومية المحلية. يجب على الحكومات المحلية أن تأخذ في الاعتبار الآثار الفورية على الاقتصاد ودخل الضرائب (ما وشوان 2022)، مما يدعم المزيد من النتائج المتنوعة التي تم العثور عليها في تحليل التباين في المقالات السابقة (الجداول 14-17).
الخاتمة وآثار السياسات
قد يكون لها تأثير أقل. قد تتسامح أو تقبل بعض الأماكن مثل هذه الحوادث على المدى القصير، مما يؤدي إلى زيادة انبعاثات الكربون في المنطقة. يجب أن تستمر الدراسات المستقبلية في هذا الموضوع في فحص تأثير عناصر مثل الضغط المالي والتحيز المالي على اهتمام الحكومة، ولكن يجب أيضًا استكشاف تأثير الحكومات المحلية على اتخاذ القرارات المتعلقة بالتنمية المتنوعة. توفر نتائج هذه الدراسة رؤى قيمة للحكومة الصينية في تنفيذ السياسات البيئية وتحقيق عملية تنفيذ متوازنة. بالإضافة إلى ذلك، فإن هذه النتائج لها تداعيات سياسية كبيرة لتحسين البيئة الإيكولوجية في الصين وتعزيز التنمية المستدامة الخضراء.
يجب على الحكومات المحلية أن تمتلك فهماً شاملاً لأهمية الحفاظ على البيئة والتنمية المستدامة. في حين أن التفضيل المالي لإعطاء الأولوية للبيئة قد يؤدي إلى ضغوط مالية فورية، فإن الفوائد على المدى الطويل تتجاوز بشكل كبير العيوب. يجب على الصين أن تتخلى بشكل حاسم عن نهج التنمية الذي يعطي الأولوية للتلوث ومعالجته لاحقاً، وبدلاً من ذلك، يجب أن تتبنى مبدأ تقدير الموارد الطبيعية النقية لتعزيز التنمية المحلية المستدامة.
توفر البيانات
تاريخ الاستلام: 15 سبتمبر 2023؛ تاريخ القبول: 22 فبراير 2024؛
نُشر على الإنترنت: 06 مارس 2024
References
Albrizio S, Kozluk T, Zipperer V (2017) Environmental policies and productivity growth: Evidence across industries and firms. J Environ Econ Manag 81:209-226
Bai X, Sun X (2021) lmpact of Internet Development on Total Factor Carbon Productivity: Inducedby Cost. Innov, or Demand? China Popul,Resour Environ 31(10):105-117
Bi S, Shao L, Tu C, Lai W, Cao Y, Jin H (2023) Achieving carbon neutrality: the effect of China pilot Free Trade Zone policy on green technology innovation. Environ Sci Pollut Res Int 30(17):50234-50247
Birdsall N, Wheeler D (1993) Trade Policy and Industrial Pollution in Latin America: Where Are the Pollution Havens. J Environ Dev 2:1
Cao G, Liu J, Tao L (2021) Examining the role of air quality in shaping the landscape of China’s internal migration: Phase characteristics, push and pull effects. Geograph Res 40(01):199-212
Chen S, Zhang J, Liu C (2021) Environmental Regulation, Financing Constraints, and Enterprise Emission Reduction: Evidence from Pollution Levy Standards Adjustment. J Financial Res 09:51-71
Cui J, Zhang J, Zheng Y (2018) Carbon Pricing Induces Innovation: Evidence from China’s Regional Carbon Market Pilots. AEA Papers Proc 108:453-457
Da Y, Dan L (2023) Digital Economy, Structural Dividend and Green Total Factor Productivity. J Southwest Minzu Univ(Humanities Soc Sci) 44(03):107-118
Daron A, Philippe A, Leonardo B, David H (2012) The Environment and Directed Technical Change. Am Econ Rev 102:1
Dong Z, Xiao C, Wang L (2014) Direction of Technological Progress. Scale Urban Land Use Environ Qual Econ Res J 49(10):111-124
Gong Y (2018) Influences of environmental regulation on China’s green economic growth: based on an analysis to 30 provinces with panel data. Urban Probl 08:68-78
Gray WB (1987) The Cost of Regulation: OSHA, EPA and the Productivity Slowdown. Am Econ Rev 77:5
Hong Z (2008) The lmpact of Environmental Regulation on Industrial Technologica Innovation-An Empirical Research Based on the Panel Data from China. Ind Econ Res 03:35-40
Hu L, Yang X (2022) Fiscal Expenditure of Environmental Protection, Fiscal Pressure and Green Development. Soft Sci 37(09):1-13
Jalil A, Mahmud SF (2009) Environment Kuznets curve for CO2 emissions: A cointegration analysis for China. Energy Policy 37(12):5167-5172
Jing M, Wu L (2022) Study on the Impact of Smart City Pilot on Urban Green Innovation: Analysis Based on TOE Framework. Urban Probl 12:66-76
Jorgenson DW, Wilcoxen PJ (1990) Environmental Regulation and U.S. Economic Growth. RAND J Econ 21:2
Liu B, Ying Z, Li Y (2022) Influence Mechanism of Internet Development on Urban Green Innovation: An Analysis from the Perspective of Patents. China Popul,Resour Environ 32(06):104-112
Ma E, Xuan Y (2022) Fiscal Pressure, Energy Consumption and Carbon Emissions: A Quasi Natural Experiment Based on the Educational Authority Reform. Financ Trade Econ 43(06):48-63
Mani M, Wheeler D (1998) In Search of Pollution Havens? Dirty Industry in the World Economy, 1960 to 1995. J Environ Dev 7:3
Porter ME (1991) America’s Green Strategy. Sci Am 264(4):168
Porter ME, Linde CVD (1995) Toward a New Conception of the EnvironmentCompetitiveness Relationship. J Econ Perspect 9(4):97-118
The Xinhua News Agency (2022) Proposal of the Central Committee of the Communist Party of China on Formulating the 14th Five-Year Plan for National Economic and Social Development and the long-range Goals for the next five years. https://www.gov.cn/zhengce/2020-11/03/content_5556991.htm
Qi L, Xiao S, Liu Y (2022) The lmpact of Government Environmental Policy on Ecological Efficiency: A Quasi-Natural Experiment Based on Ecological Civilization Demonstration. J Xi’ Jiaotong Univ(Soc Sci) 42(03):61-70
RCB (1990) Strategic Interaction among Nations: Negotiable and Non-Negotiable Trade Barriers. Canadian J Econ/Revue canadienne d’Economique, 23(1):42-60
Sun Y, Ding W, Yang Z, Yang G, Du J (2020) Measuring China’s regional inclusive green growth. Sci Total Environ 713:136367
Sun Z, Chen B, Chu Z, Han W (2021) Evolutionary Game Analysis on Carbon Emission Regulation to PromoteEnterprise Low-carbon Technology Innovation From the Perspective of Government Regulation. J Ind Technol Econ 40(12):103-112
Tian M, Ming L, Wu Q (2021) Population Aging, Financial Pressure and Expenditure Bias of Basic Public Services. Northwest Popul J 42(04):103-113
Tu Z, Dian J, Zhang W (2021) Emission Reduction of the Heavily Polluting Industrial Enterprises: Coercion” or “Inducement”? The Evaluation Based on TCZ and ETS Policy. J China Univ Geosci(Soc Sci Ed) 21(03):90-109
Wang Y, Xia L (2023) Promoting or lnhibiting: The lmpact of Government R&D Subsidies on the Green Innovation Performance of Firms. China Ind Econ 02:131-149
Wang Y, Yang H, Guan G (2023) Carbon Emissions, Energy Consumption and Economic Growth: Mediating Effect Model Based on Chinese Provincial Panel Data. J Appl Stat Manag 1(1):1-15
Wang Y, Zhang S, Hao J (2019) Air Pollution Control in China: Progress. Chall Future Pathw Res Environ Sci 32(10):1755-1762
Wei J, Jiang J (2018) Green Finance Expenditure: Theory and Practice Reflection on the Deepening Green Development Proposed by the 19th National Congress of CPC. Contemp Financ Econ 12:26-36
Wu H, Xu J (2023) Impact of green finance on carbon emission efficiency in China: An empirical study based on dynamic spatial panel model. Soc Sci Res 06:84-92
Wu J, Guo Z (2016) Research on the Convergence of Carbon Dioxide Emissions in China: A Continuous Dynamic Distribution Approach. Stat Res 33(01):54-60
Xu X, Ma G (2023) Digital Economy, Environmental Regulation and Industrial Transformation. Stat Decis 39(05):119-124
Yang H, Zhong S, Li L (2023) Green Technology Innovation and Carbon Emission Efficiency: An Impact Mechanism Analysis and Rebound Effect. Sci Technol Prog Policy 40(08):99-107
Yang Z (2022) Research on the influencing factors of living energy consumption and carbon emissions based on spatiotemporal model. J Combinatorial Optim 45:1
Yu Y, Ping W (2021) Study on Urban Green Total Factor Productivity Measurement in China. Ecol Econ 37(03):43-52
Zhang J, Qu Y, Zhang Y, Li X, Miao X (2019) Effects of FDI on the Efficiency of Government Expenditure on Environmental Protection Under Fiscal Decentralization: A Spatial Econometric Analysis for China. Int J Environ Res Public Health 16(14):2496
Zhang Z, Meng L, Qing Y (2021) Examining the External Antecedents of Innovative Work Behavior: The Role of Government Support for Talent Policy. Int J Environ Res Public Health 18(3):1213
Zhe Z, Tan J (2022) Research on the Carbon Emission Effect of Local Fiscal Expenditure in China: An Empirical Analysis Based on the Moderating Effect of New Urbanizatior. Collected Essays Financ Econ 11:41-50
مساهمات المؤلفين
المصالح المتنافسة
الموافقة الأخلاقية
الموافقة المستنيرة
معلومات إضافية
معلومات إعادة الطبع والإذن متاحة على http://www.nature.com/reprints
ملاحظة الناشر تظل Springer Nature محايدة فيما يتعلق بالمطالبات القضائية في الخرائط المنشورة والانتماءات المؤسسية.
© المؤلفون 2024
DOI: https://doi.org/10.1057/s41599-024-02887-9
Publication Date: 2024-03-06
ARTICLE
How does the environmental attention of local governments affect regional green development? Empirical evidence from local governments in China
Abstract
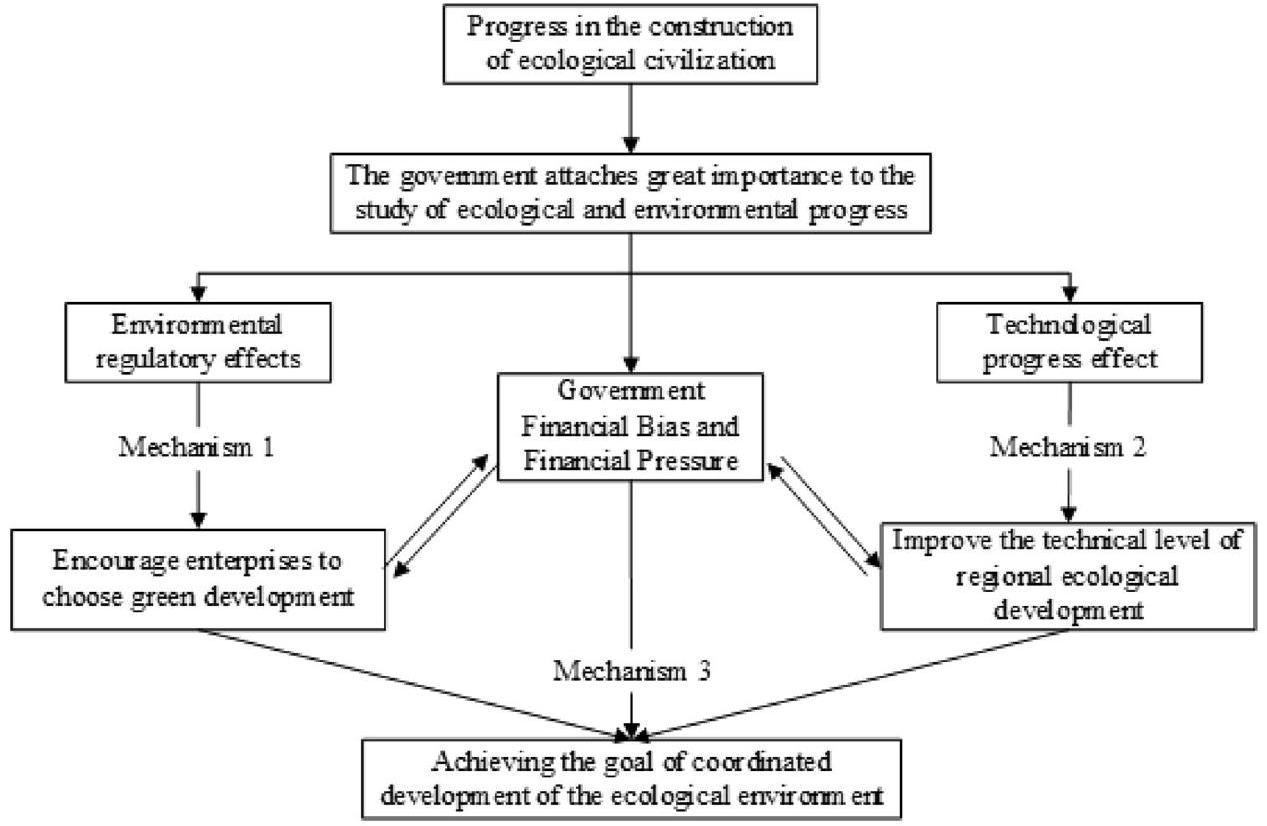
Due to the continuous progress of constructing sustainable environments in China, the role played by the Chinese central government as the main body for promoting green development is worth studying. Because China’s ecological civilization building has been steadily progressing. Governments at all levels in China have prioritised the development of environmental civilization as a key aspect of regional growth. However, the actual impact and mechanisms of influence of this construction still require further investigation. This paper constructs a government environmental attention index using word frequency found in the Report on the Work of the Government. It uses a long difference model to study the impact and mechanism of government environmental attention on urban green efficiency, carbon emissions and air quality. The results show that the government’s ecological attention can improve green efficiency, and air quality, but it can also lead to increased carbon emissions, and the impact is particularly evident in the eastern and western regions of the country. This is because the government’s emphasis on the environment significantly impacts on environmental regulations and technological progress, and is directly influenced by fiscal bias and financial pressure. Given the results, we put forward some policy suggestions that local governments should improve the intensity of local environmental regulation, encourage green technology innovation, provide encouraging conditions for environmental development, and establish a long-term strategic vision. The findings in this study has implications for promoting the implementation of local governments’ environmental protection and the development of sustainable societies in China.
Introduction
environmental emphasis. It takes into account the variations in cities and regions. We also examine how the government’s environmental focus affects the relationship between fiscal pressure and bias. By building fiscal revenue as an instrumental variable, lagging explanatory variables, regulating urban control variables, and removing policy shocks, this work reaches reasonably trustworthy conclusions while taking into account the endogeneity difficulties in the model.
Literature review and transmission mechanism analysis
results, many indications can convey distinct attributes. To assess the total level of green development, it is important to consider several indicators of regional green development systems. Moreover, it is important to perform comprehensive research on the tangible effects of economic and social realities and their influencing mechanisms.
Empirical research design
we assume that there is:
account the government’s limited focus on environmental issues. Finally, fiscal income is leveraged as an instrumental variable when carrying out 2SLS regression to further address endogeneity problems.
innovation and empower companies to enhance resource efficiency. Dong (Dong et al. 2014) observes that enhancing environmental quality aligns with the trajectory of technological advancement. Enhancing environmental quality will result in a “crowding out” impact on economic productivity, prompting businesses to redirect their focus on technology advancements to meet the demands of environmental quality enhancement. When clean technology reaches a significant level of intensity, there can be a mutually beneficial relationship between environmental quality and economic growth. Yang’s research (Yang et al. 2023) demonstrates that environmental regulations have an impact on the efficiency of carbon emissions from innovative and enhanced green technologies.
Construction of main indicators and typical facts
using three indicators: urban green efficiency, urban carbon emissions, and urban air quality.
| Index | Variable | Unit |
| Input index | Labor input | Ten thousand people |
| Capital stock | Ten thousand yuan | |
| Energy input | Ten thousand KWH | |
| Expected output | Real GDP | Ten thousand yuan |
| Undesirable output | Industrial SO2 emissions Discharge of industrial wastewater | Ten thousand tons ton |
| Industrial soot emission | ton |
Table 2 Keywords of environmental importance.
Environmental pollution category: Pollution, Pollutant discharge, Chemical oxygen demand, Sulfur dioxide, Carbon dioxide, Particulate matter, the PM2.5, Ammonia nitrogen, Nitrogen oxide, Air pollution, Pollutants, Dust, Dust fall, Waste, Garbage, Emissions, Air, Chemical oxygen demand, Sulfur dioxide, Carbon dioxide, the PM10, Haze, Greenhouse gases
Energy consumption category: Water consumption, Energy consumption, Consumption, Resources, Conservation, Intensification, Energy, New energy, Clean energy, Coal to electricity, Coal to gas, Central heating, Recycling, Recycling, Renewable
Coordinated development and environmental governance: Environmental protection coordination, Collaborative development, Collaborative
governance, Departmental cooperation, Public participation, Border area, Sharing, Transfer, Joint prevention, Joint regulation, Joint governance, Regional coordinated development, Integrated watershed governance, Regional cooperation, Complementary advantages, Win-win cooperation, Joint promotion, Protection and cooperation, Collaborative pollution regulation, Sustainable
Other classes: Blue sky, Clear water, Pure land, Green space, Forest, River length, River length system, Lake length, Lake length system, Green, White, Livable, Tree planting, Afforestation, Clear water and green mountains, Blue sky and white clouds, Ecological barrier, Water conservation, Water and soil conservation, Development, Soil, Returning farmland to forest, Natural forest
Development concept: Low-carbon economy, Circular economy, Green economy, Ecological civilisation demonstration zone, Ecological city
Green production: High energy consumption, Energy saving and emission reduction, Water-saving irrigation, Industrial water-saving, Green manufacturing, Consumption reduction, Agricultural nonpoint source pollution
Green Life: Household waste, Green consumption, Green travel, Toilet revolution
Green ecology: Forest restoration, Afforestation, Water conservation, Green mountains
System construction: Joint prevention and regulation, Local legislation, Public participation, Environmental supervision mechanism, Green governance
Empirical results and analysis
| Table 3 Descriptive statistics of panel data. | ||||
| Variable | Obs | Mean | Min | Max |
| GML | 2912 | 1.003387 | 0.8810029 | 1.147856 |
| Carbon | 2628 | 804.9686 | 31.2451 | 7685.485 |
| PM | 2912 | 42.51906 | 17.93062 | 86.34021 |
| Gov | 2896 | 87.31285 | 25 | 161 |
| Variable | (1) | (2) | (3) | (4) | (5) |
| Ge | Ge | Ge | Ce | Ce | |
| GEI | 0.000211*** (4.35) | 0.000159*** (3.77) | 0.000159*** (4.74) | 4.617*** (4.95) | 3.398*** (4.77) |
| CCV | No | Yes | Yes | No | Yes |
| PFE | Yes | Yes | Yes | Yes | Yes |
| PLC | Yes | Yes | No | Yes | Yes |
| CLC | No | No | Yes | No | No |
|
|
2952 | 2683 | 2683 | 2663 | 2663 |
|
|
0.052 | 0.053 | 0.053 | 0.587 | 0.700 |
| Variable | (6) | (7) | (8) | (9) |
| Ge | PM2.5 | PM2.5 | PM2.5 | |
| GEI | 3.398*** (3.58) | -0.0764*** (-4.65) | -0.0475*** (-5.15) | -0.0475*** (-5.46) |
| CCV | No | No | Yes | Yes |
| PFE | Yes | Yes | Yes | Yes |
| PLC | Yes | Yes | Yes | No |
| CLC | No | No | No | Yes |
|
|
2663 | 2952 | 2683 | 2683 |
|
|
0.700 | 0.534 | 0.669 | 0.669 |
| *** is significant at the level of 1%. | ||||
| Variable | (1) | (2) | (3) | (4) | (5) |
| Ge | Ge | Ge | Ce | Ce | |
| GEI | 0.000112*** (3.16) | 0.000133*** (3.27) | 0.000155 *** (3.81) | 3.373*** (4.51) | 3.025*** (4.43) |
| NBD | 0.0279*** (3.83) | 1.222 (0.01) | |||
| BPC | 0.0196*** (9.53) | 262.0*** (2.87) | |||
| SCP | 0.0110*** (4.83) | ||||
| UCV | Yes | Yes | Yes | Yes | Yes |
| PFE | Yes | Yes | Yes | Yes | Yes |
|
|
2673 | 2673 | 2673 | 2653 | 2653 |
| R
|
0.072 | 0.073 | 0.057 | 0.699 | 0.703 |
| NBD National Big Data comprehensive Pilot Zone, BPC Broadband Pilot in China, SCP Smart City Pilot, UCV Urban Control Variable. *** is significant at the level of 1%. | |||||
| Variable | (6) | (7) | (8) | (9) |
| Ce | PM2.5 | PM2.5 | PM2.5 | |
| GEI | 3.374*** (4.61) | -0.0388*** (3.16) | -0.0428*** (-3.57) | -0.0483*** (-4.87) |
| NBD | -5.670*** (-5.07) | |||
| BPC | -4.192*** (-4.64) | |||
| SCP | 1.465 (0.01) | -0.288 (-0.25) | ||
| UCV | Yes | Yes | Yes | Yes |
| PFE | Yes | Yes | Yes | Yes |
|
|
2653 | 2673 | 2673 | 2673 |
|
|
0.699 | 0.072 | 0.073 | 0.057 |
| *** is significant at the level of 1%. | ||||
towards environmentally friendly, ecological, low-carbon, and circular development. To minimise the influence of other prospective policies, the data in this research are restricted to only the period following the official establishment of the concept of green development in 2015, hence eliminating any potential interference from other policies. Upon reducing the temporal window, the data in Table 7 remain statistically significant and exhibit consistency with the preceding text, thus indicating the robustness of the results.
| Variable | (1) | (2) | (3) | ||
| GE | CE | PM2.5 | |||
| GEI | 0.000133*** (2.68) | 2.386** (2.02) | -0.0468*** (4.00) | ||
| CCV | Yes | Yes | Yes | ||
| ICV | Yes | Yes | Yes | ||
| PFE | Yes | Yes | Yes | ||
| N | 2406 | 2401 | 2409 | ||
|
|
0.071 | 0.590 | 0.674 | ||
|
|||||
| Variable | (1) | (2) | (3) |
| GE | CE | PM2.5 | |
| GEI | 0.000181** (2.68) | 2.616* (2.02) | -0.0377*** (4.00) |
| CCV | Yes | Yes | Yes |
| ICV | Yes | Yes | Yes |
| PFE | Yes | Yes | Yes |
|
|
1350 | 1340 | 1350 |
|
|
0.074 | 0.655 | 0.655 |
| ***, **, * are significant at the level of 1%, 5% and 10% respectively. | |||
| Variable | (1) | (2) | (3) | (4) | (5) | (6) |
| GE | CE | PM2.5 | 2SLS | 2SLS | 2SLS | |
| GEI |
|
3.347*** (4.49) | -0.0578*** (-5.03) | 0.00345** (2.00) | 261.6** (2.37) | -0.264*** (-2.91) |
| CCV | Yes | Yes | Yes | Yes | Yes | Yes |
| ICV | Yes | Yes | Yes | Yes | Yes | Yes |
| PFE | Yes | Yes | Yes | Yes | Yes | Yes |
|
|
2413 | 2395 | 2413 | 2683 | 2663 | 2683 |
| R
|
0.047 | 0.698 | 0.666 | -2.903 | -18.602 | 0.533 |
|
|
||||||
| Variable | (1) | (2) | (3) |
| GE | CE | PM2.5 | |
| GEI | 0.0002629*** (4.81) | 1.562433* (1.86) |
|
| L.GEI | 0.0000557 (1.13) | 0.814216* (1.63) | 0.0238789*** (-4.34) |
| L. GE | -0.1487794** (-1.90) | ||
| L.CE | 1.47587*** (4.41) | ||
| L. PM | 0.7173992*** (28.39) | ||
| Control variable | Yes | Yes | Yes |
| AR(2) | 0.2274 | 0.1364 | 0.7853 |
| Sargan | 0.0000 | 0.0000 | 0.0000 |
|
|
2405 | 2126 | 2405 |
| ***, **, * are significant at the level of 1%, 5% and 10% respectively. | |||
Analysis of the mechanism of government emphasis on environmental implementation
| Variable | (1) | (2) | (3) | (4) | (5) | (6) |
| GE | CE | PM2.5 | GE | CE | PM2.5 | |
| EIB | -0.0000268 (-0.22) | 2.441 (1.69) | -0.0287 (-1.57) | |||
| SMEA | 0.000176*** (4.39) | 1.846*** (2.82) | -0.0504*** (-5.14) | |||
| CCV | Yes | Yes | Yes | Yes | Yes | Yes |
| PFE | Yes | Yes | Yes | Yes | Yes | Yes |
| PLC | Yes | Yes | Yes | Yes | Yes | Yes |
|
|
398 | 398 | 398 | 2285 | 2265 | 2285 |
|
|
0.042 | 0.963 | 0.788 | 0.03 | 0.211 | 0.680 |
*** is significant at the level of
| Variable | (1) | (2) | (3) | (4) | (5) | (6) |
| GE | CE | PM2.5 | GE | CE | PM2.5 | |
| EAIE | 0.000180* (2.14) | 5.130*** (5.17) | -0.0261* (-1.98) | |||
| CEA | 0.0000791 (1.17) | 1.311 (1.73) | -0.0265 (-1.69) | |||
| CCV | Yes | Yes | Yes | Yes | Yes | Yes |
| PFE | Yes | Yes | Yes | Yes | Yes | Yes |
| PLC | Yes | Yes | Yes | Yes | Yes | Yes |
| N | 841 | 841 | 841 | 775 | 775 | 775 |
| R
|
0.086 | 0.832 | 0.676 | 0.053 | 0.555 | 0.693 |
***, * are significant at the level of 1%, and 10% respectively.
variables to measure technological advancement. A city that has made substantial investments in technology and holds numerous green patents is likely to generate a positive impact on technological advancement. The greater the amount of a city’s investment in research and technology is, the more it can demonstrate its focus on technological advancement. The regression results presented in Table 12 demonstrate a substantial positive relationship between the government’s environmental emphasis and both the number of green patents and the RD index. According to Table 12, a focus on the environment by local governments can enhance the advancement of regional technology and increase attention on technology by cities. This further demonstrates the impact of the government’s environmental focus on technological progress. Technological advancement is crucial for cities to attain environmentally sustainable and economically prosperous development.
Extended analysis
| Variable | (1) | (2) | (3) | (4) | (5) | (6) |
| GE | CE | PM2.5 | GE | CE | PM2.5 | |
| WAIE | 0.000147** (2.75) | 3.098** (3.01) | -0.0736*** (-6.56) | |||
| NAIE | 0.000361 (1.14) | 7.039 (2.30) | -0.0632 (-2.02) | |||
| CCV | Yes | Yes | Yes | Yes | Yes | Yes |
| PFE | Yes | Yes | Yes | Yes | Yes | Yes |
| PLC | Yes | Yes | Yes | Yes | Yes | Yes |
|
|
728 | 718 | 728 | 339 | 329 | 339 |
|
|
0.032 | 0.385 | 0.482 | 0.038 | 0.560 | 0.489 |
| Variable | (1) | (2) | (3) |
| ER | WER | SER | |
| GEI | 66.53* (1.95) | 0.347 (1.62) | 88.70* (1.66) |
| CCV | Yes | Yes | Yes |
| UFE | Yes | Yes | Yes |
| PLC | Yes | Yes | Yes |
|
|
2683 | 1068 | 1350 |
|
|
-27.196 | -0.928 | -23.104 |
- is significant at the level of 10%.
| Variable | (1) | (2) | (3) |
| NGI | NGUM | RD | |
| GEI | 361.3** (2.31) | 291.6** (2.26) | 0.00277** (2.26) |
| CCV | Yes | Yes | Yes |
| UFE | Yes | Yes | Yes |
| PLC | Yes | Yes | Yes |
|
|
2681 | 2681 | 2683 |
|
|
-52.283 | -69.235 | -17.594 |
| NGI Number of Green Inventions, NGUM Number of Green Utility Models. ** is significant at 5%. | |||
| Variable | (1) | (2) | ||
| FB | FP | |||
| GEI×FB | 0.00484** (2.27) | |||
| GEI
|
0.00499*** (3.49) | |||
| CCV | Yes | Yes | ||
| UFE | Yes | Yes | ||
| PLC | Yes | Yes | ||
|
|
2632 | 2682 | ||
|
|
0.407 | 0.603 | ||
|
||||
environment. Nevertheless, the prevalence of a high-carbon emission industrial structure remains very widespread in China. Tourism continues to play a significant role in the economic development of our country, contributing substantially to local government tax revenue. Local governments must consider the immediate effects on the economy and tax income (Ma and Xuan 2022), which further supports the diverse outcomes found in the heterogeneity analysis of previous articles (Tables 14-17).
Conclusion and policy implications
have a lesser effect. Certain places may even tolerate or accept such occurrences in the short term, leading to an increase in carbon emissions within the region. Future studies on this topic should not only continue to examine the impact of elements such as financial pressure and fiscal bias on the government’s attention but also explore the influence of local governments on decisionmaking related to diversified development. The findings of this study provide valuable insights for the Chinese government in implementing environmental policies and achieving a balanced implementation process. Additionally, these findings have significant policy implications for optimising China’s ecological environment and promoting green sustainable development:
tax revenue and economic expansion and instead adopt a more forward-thinking approach. Local governments must possess a comprehensive understanding of the significance of environmental conservation and sustainable development. While the fiscal preference for prioritising the environment may result in immediate financial strain, the long-term benefits significantly surpass the drawbacks. China must decisively abandon the development approach of prioritising pollution and addressing it later, and instead adopt the principle of valuing pristine natural resources to foster sustainable local development.
Data availability
Received: 15 September 2023; Accepted: 22 February 2024;
Published online: 06 March 2024
References
Albrizio S, Kozluk T, Zipperer V (2017) Environmental policies and productivity growth: Evidence across industries and firms. J Environ Econ Manag 81:209-226
Bai X, Sun X (2021) lmpact of Internet Development on Total Factor Carbon Productivity: Inducedby Cost. Innov, or Demand? China Popul,Resour Environ 31(10):105-117
Bi S, Shao L, Tu C, Lai W, Cao Y, Jin H (2023) Achieving carbon neutrality: the effect of China pilot Free Trade Zone policy on green technology innovation. Environ Sci Pollut Res Int 30(17):50234-50247
Birdsall N, Wheeler D (1993) Trade Policy and Industrial Pollution in Latin America: Where Are the Pollution Havens. J Environ Dev 2:1
Cao G, Liu J, Tao L (2021) Examining the role of air quality in shaping the landscape of China’s internal migration: Phase characteristics, push and pull effects. Geograph Res 40(01):199-212
Chen S, Zhang J, Liu C (2021) Environmental Regulation, Financing Constraints, and Enterprise Emission Reduction: Evidence from Pollution Levy Standards Adjustment. J Financial Res 09:51-71
Cui J, Zhang J, Zheng Y (2018) Carbon Pricing Induces Innovation: Evidence from China’s Regional Carbon Market Pilots. AEA Papers Proc 108:453-457
Da Y, Dan L (2023) Digital Economy, Structural Dividend and Green Total Factor Productivity. J Southwest Minzu Univ(Humanities Soc Sci) 44(03):107-118
Daron A, Philippe A, Leonardo B, David H (2012) The Environment and Directed Technical Change. Am Econ Rev 102:1
Dong Z, Xiao C, Wang L (2014) Direction of Technological Progress. Scale Urban Land Use Environ Qual Econ Res J 49(10):111-124
Gong Y (2018) Influences of environmental regulation on China’s green economic growth: based on an analysis to 30 provinces with panel data. Urban Probl 08:68-78
Gray WB (1987) The Cost of Regulation: OSHA, EPA and the Productivity Slowdown. Am Econ Rev 77:5
Hong Z (2008) The lmpact of Environmental Regulation on Industrial Technologica Innovation-An Empirical Research Based on the Panel Data from China. Ind Econ Res 03:35-40
Hu L, Yang X (2022) Fiscal Expenditure of Environmental Protection, Fiscal Pressure and Green Development. Soft Sci 37(09):1-13
Jalil A, Mahmud SF (2009) Environment Kuznets curve for CO2 emissions: A cointegration analysis for China. Energy Policy 37(12):5167-5172
Jing M, Wu L (2022) Study on the Impact of Smart City Pilot on Urban Green Innovation: Analysis Based on TOE Framework. Urban Probl 12:66-76
Jorgenson DW, Wilcoxen PJ (1990) Environmental Regulation and U.S. Economic Growth. RAND J Econ 21:2
Liu B, Ying Z, Li Y (2022) Influence Mechanism of Internet Development on Urban Green Innovation: An Analysis from the Perspective of Patents. China Popul,Resour Environ 32(06):104-112
Ma E, Xuan Y (2022) Fiscal Pressure, Energy Consumption and Carbon Emissions: A Quasi Natural Experiment Based on the Educational Authority Reform. Financ Trade Econ 43(06):48-63
Mani M, Wheeler D (1998) In Search of Pollution Havens? Dirty Industry in the World Economy, 1960 to 1995. J Environ Dev 7:3
Porter ME (1991) America’s Green Strategy. Sci Am 264(4):168
Porter ME, Linde CVD (1995) Toward a New Conception of the EnvironmentCompetitiveness Relationship. J Econ Perspect 9(4):97-118
The Xinhua News Agency (2022) Proposal of the Central Committee of the Communist Party of China on Formulating the 14th Five-Year Plan for National Economic and Social Development and the long-range Goals for the next five years. https://www.gov.cn/zhengce/2020-11/03/content_5556991.htm
Qi L, Xiao S, Liu Y (2022) The lmpact of Government Environmental Policy on Ecological Efficiency: A Quasi-Natural Experiment Based on Ecological Civilization Demonstration. J Xi’ Jiaotong Univ(Soc Sci) 42(03):61-70
RCB (1990) Strategic Interaction among Nations: Negotiable and Non-Negotiable Trade Barriers. Canadian J Econ/Revue canadienne d’Economique, 23(1):42-60
Sun Y, Ding W, Yang Z, Yang G, Du J (2020) Measuring China’s regional inclusive green growth. Sci Total Environ 713:136367
Sun Z, Chen B, Chu Z, Han W (2021) Evolutionary Game Analysis on Carbon Emission Regulation to PromoteEnterprise Low-carbon Technology Innovation From the Perspective of Government Regulation. J Ind Technol Econ 40(12):103-112
Tian M, Ming L, Wu Q (2021) Population Aging, Financial Pressure and Expenditure Bias of Basic Public Services. Northwest Popul J 42(04):103-113
Tu Z, Dian J, Zhang W (2021) Emission Reduction of the Heavily Polluting Industrial Enterprises: Coercion” or “Inducement”? The Evaluation Based on TCZ and ETS Policy. J China Univ Geosci(Soc Sci Ed) 21(03):90-109
Wang Y, Xia L (2023) Promoting or lnhibiting: The lmpact of Government R&D Subsidies on the Green Innovation Performance of Firms. China Ind Econ 02:131-149
Wang Y, Yang H, Guan G (2023) Carbon Emissions, Energy Consumption and Economic Growth: Mediating Effect Model Based on Chinese Provincial Panel Data. J Appl Stat Manag 1(1):1-15
Wang Y, Zhang S, Hao J (2019) Air Pollution Control in China: Progress. Chall Future Pathw Res Environ Sci 32(10):1755-1762
Wei J, Jiang J (2018) Green Finance Expenditure: Theory and Practice Reflection on the Deepening Green Development Proposed by the 19th National Congress of CPC. Contemp Financ Econ 12:26-36
Wu H, Xu J (2023) Impact of green finance on carbon emission efficiency in China: An empirical study based on dynamic spatial panel model. Soc Sci Res 06:84-92
Wu J, Guo Z (2016) Research on the Convergence of Carbon Dioxide Emissions in China: A Continuous Dynamic Distribution Approach. Stat Res 33(01):54-60
Xu X, Ma G (2023) Digital Economy, Environmental Regulation and Industrial Transformation. Stat Decis 39(05):119-124
Yang H, Zhong S, Li L (2023) Green Technology Innovation and Carbon Emission Efficiency: An Impact Mechanism Analysis and Rebound Effect. Sci Technol Prog Policy 40(08):99-107
Yang Z (2022) Research on the influencing factors of living energy consumption and carbon emissions based on spatiotemporal model. J Combinatorial Optim 45:1
Yu Y, Ping W (2021) Study on Urban Green Total Factor Productivity Measurement in China. Ecol Econ 37(03):43-52
Zhang J, Qu Y, Zhang Y, Li X, Miao X (2019) Effects of FDI on the Efficiency of Government Expenditure on Environmental Protection Under Fiscal Decentralization: A Spatial Econometric Analysis for China. Int J Environ Res Public Health 16(14):2496
Zhang Z, Meng L, Qing Y (2021) Examining the External Antecedents of Innovative Work Behavior: The Role of Government Support for Talent Policy. Int J Environ Res Public Health 18(3):1213
Zhe Z, Tan J (2022) Research on the Carbon Emission Effect of Local Fiscal Expenditure in China: An Empirical Analysis Based on the Moderating Effect of New Urbanizatior. Collected Essays Financ Econ 11:41-50
Author contributions
Competing interests
Ethical approval
Informed consent
Additional information
Reprints and permission information is available at http://www.nature.com/reprints
Publisher’s note Springer Nature remains neutral with regard to jurisdictional claims in published maps and institutional affiliations.
© The Author(s) 2024
College of Economics, Sichuan Agricultural University, Chengdu 611134, China. email: fuyong666a@163.com