DOI: https://doi.org/10.1186/s40854-025-00772-1
تاريخ النشر: 2025-03-03
كيف تدفع المالية الرقمية انتقال الطاقة؟ منظور قائم على الاستثمار الأخضر
bqlin@xmu.edu.cn; bqlin2004@vip.sina.com
الملخص
تعتبر الاستثمارات الخضراء (Gls) في صناعة الطاقة ضرورية لدفع الانتقال إلى الطاقة النظيفة وتعزيز الاستدامة البيئية. في عصر الاقتصاد الرقمي، لم يتم إعطاء اهتمام كافٍ لتأثير المالية الرقمية (DF) على Gls في الشركات العاملة في مجال الطاقة، مما قد يؤدي إلى التقليل من تأثيرها. استخدمت دراستنا نموذج التأثيرات الثابتة ذات الاتجاهين، حيث قمنا بتحليل بيانات من 108 شركة طاقة مدرجة من 2011 إلى 2020، للتحقيق تجريبيًا في تأثير DF على GIs في صناعة الطاقة في الصين. كانت نتائج البحث كما يلي: (1) يمكن أن يؤدي زيادة وحدة واحدة في DF إلى تحسين كثافة GIs في صناعة الطاقة عن طريق تخفيف قيود التمويل، وزيادة التدفق النقدي، وتصحيح عدم تطابق التمويل. (2) لدى DF تأثير عتبة كبير على GIs، حيث أن اللوائح البيئية القائمة على الحوافز السوقية والأوامر والسيطرة لها عتبات تبلغ 16.98 و0.98 على التوالي. (3) أداء GI للشركات الكبيرة المملوكة للدولة في المناطق ذات الفوائد السوقية الأعلى يستفيد أكثر من DF. اقترحنا اقتراحات سياسية مخصصة وفقًا لهذه النتائج.
المقدمة
في سياق تغير المناخ العالمي والحاجة الملحة للانتقال إلى الطاقة الخضراء (Engel-Cox وChapman 2023؛ Kou et al. 2024)، من الضروري أن تحقق الصين، أكبر مستهلك للطاقة في العالم، تقدمًا نحو مستقبل طاقة مستدام (Lee وLee 2022؛ Dong et al. 2023؛ Sun et al. 2023a). ومع ذلك، لا تزال حصة الصين من الطاقة الخضراء منخفضة وغير موزعة بشكل متساوٍ (Zhao et al. 2011؛ Dato 2018؛ Gao et al. 2024). في عام 2021، شكل استهلاك الطاقة الأحفورية في الصين
مراجعة الأدبيات
المالية الرقمية والاستثمارات الخضراء
(Pata et al. 2022؛ Zhang et al. 2023b). تشير GIs إلى تخصيص الموارد المالية لمشاريع تتماشى مع الطاقة المستدامة، وتعزيز كفاءة الطاقة، وتقليل الكربون، والتقنيات الصديقة للبيئة (Chen وMa 2021؛ Zhang et al. 2024). تعتبر DF نموذجًا ماليًا مبتكرًا يحظى باهتمام كبير (Bakhsh et al. 2023، 2024a)، مع منتجاته المالية المتطورة وكفاءة الخدمة المحسنة (Ding et al. 2023؛ Wang et al. 2023؛ Razzaq وYang 2023) التي قد تحدث ثورة في GIs.
اللوائح البيئية والاستثمارات الخضراء
ملخص
يستكشف البحث بشكل أساسي تأثير التمويل المباشر على المبادرات الخضراء من منظور خطي. ومع ذلك، أشارت الدراسات الحديثة إلى أن أنظمة الإدارة لها تأثير عتبة على المبادرات الخضراء (هوانغ ولي 2021؛ وانغ وآخرون 2022). وبالتالي، قد يكون تأثير التمويل المباشر على المبادرات الخضراء غير خطي تحت مستويات مختلفة من أنظمة الإدارة. بالإشارة إلى الأدبيات، ركزنا على الشركات الصينية في مجال الطاقة واستكشفنا تأثير العتبة للتمويل المباشر على المبادرات الخضراء من منظور أنظمة الإدارة.
تحليل الآلية النظرية
تأثير التمويل المباشر على المبادرات الخضراء في الشركات الطاقية
التمويل المباشر، قيود التمويل، والمبادرات الخضراء
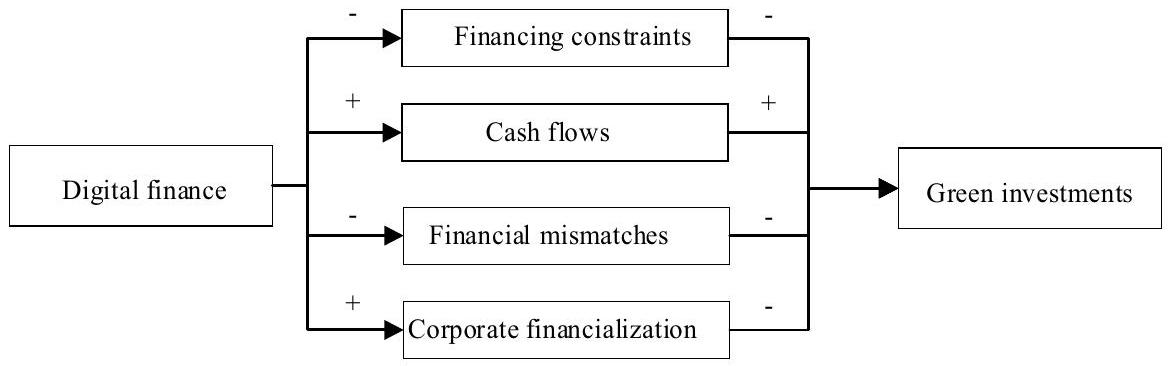
التمويل المباشر، التدفقات النقدية، والمبادرات الخضراء
التمويل المباشر، عدم تطابق التمويل، والمبادرات الخضراء
التمويل المباشر، المالية المؤسسية، والمبادرات الخضراء
تأثير العتبة لأنظمة الإدارة
IER
سي إي آر
معايير صارمة. في هذه الحالة، قد تركز شركات الطاقة أكثر على خفض تكاليف الإنتاج بدلاً من توسيع المبادرات الخضراء، مما يضعف تأثير الإطار التنظيمي على المبادرات الخضراء. علاوة على ذلك، يمكن أن يخلق تهديد العقوبات بسبب عدم الامتثال ثقافة تجنب المخاطر داخل شركات الطاقة، مما يثني عن التجريب بالتقنيات الخضراء المبتكرة أو الاستثمارات حيث تسعى الشركات لتجنب العواقب القانونية أو الإدارية المحتملة. في مثل هذا السيناريو، قد يكون تأثير الإطار التنظيمي على تمويل وتعزيز المبادرات الخضراء محدودًا حيث تصبح الشركات أكثر تحفظًا في استراتيجياتها البيئية. وبالتالي، عندما يتجاوز الإطار التنظيمي عتبة معينة، قد يضعف التأثير الإيجابي للإطار التنظيمي على المبادرات الخضراء في شركات الطاقة.
تصميم البحث
بيانات
المتغيرات
المتغير التابع
المتغير المستقل
المتغيرات الوسيطة
متغيرات العتبة
متغيرات التحكم
المنهجية
نموذج أساسي
نماذج الوساطة
| متغير | ملاحظة | معنى | الانحراف المعياري | من | ماكس | الانحراف | التفرطح | جارك-بيرا |
| جي آي | ١٠٨٠ | 1.368 | 2.652 | 0.000 | 14.700 | ٢.٩٣٦ | ١٢.٣٧٤ | ٥٥٠٥.٨٥٢ |
| DF | ١٠٨٠ | ٢٢٥٫٧٤٧ | ٩٨.٨٣٦ | ٢٤.٥١٠ | ٤١٧.٨٧٥ | -0.252 | 2.272 | ٣٥٫٢٨٠ |
| نادي كرة القدم | ١٠٨٠ | -3.778 | 0.335 | -4.304 | -2.353 | 1.750 | 7.753 | ١٥٦٧.٨٤٥ |
| CF | ١٠٨٠ | 44.531 | ١٢٢.٧٢٢ | 0.554 | ٩٥١.٣٣٠ | ٥.٧٤٥ | ٣٨.٥٤٦ | 62,799.220 |
| إف إم | ١٠٨٠ | 0.077 | 0.543 | -1.000 | ٢.٥٣٩ | 1.154 | 7.243 | ١٠٤٩.٨٤٦ |
| CFI | ١٠٨٠ | ٢٠.٣٢٤ | ١٤٫٤٥٩ | 2.038 | 73.647 | 1.514 | ٥.٤٢١ | 676.351 |
| IER | ١٠٨٠ | ٥.٣٥٠ | 7.085 | 0.000 | 18.250 | 0.626 | 1.504 | 171.248 |
| شهادة المطابقة | ١٠٨٠ | 0.770 | 0.158 | 0.348 | 0.996 | -0.637 | ٢.٩١٢ | 73.387 |
| إس | ١٠٨٠ | 8.322 | 1.492 | ٥.٤٦٠ | 13.009 | 0.616 | ٣.٤٠٩ | 75.830 |
| أوه | ١٠٨٠ | 0.833 | 0.373 | 0.000 | 1.000 | -1.789 | ٤.٢٠٠ | 640.894 |
| دا | ١٠٨٠ | ٥٣.٠٤٩ | ١٦.٤٨٦ | 12.148 | 86.543 | -0.333 | ٢.٦٣٥ | 25.955 |
| كاليفورنيا | ١٠٨٠ | 0.432 | 0.555 | 0.014 | ٤.٢١٩ | ٤.٢٨٤ | ٢٦.٤٨٧ | ٢٨,١٢٧.٢٤١ |
| هراء | ١٠٨٠ | 10.000 | 2.279 | ٦٫٠٠٠ | 17.000 | 0.956 | 3.692 | 186.057 |
| INS | ١٠٨٠ | 50.223 | ١٢.٤٤٠ | ٣٢.٥٠٠ | ٨٣٫٩٠٠ | 1.162 | 3.868 | ٢٧٦.٩٤٨ |
| تعليم | ١٠٨٠ | ١٣٫٢٠٠ | 0.552 | 10.950 | 14.016 | -1.216 | 5.668 | 586.478 |
| مار | ١٠٨٠ | 8.458 | 1.836 | ٣.٥٨٠ | 11.673 | -0.521 | 2.703 | 52.829 |
نماذج العتبة
النتائج التجريبية والمناقشة
الإحصائيات الوصفية
الانحدار الأساسي
| متغير | M1 | M2 | M3 | M4 |
| جل | جي آي | جي آي | جي آي | |
| DF | 0.0335*** | 0.0307*** | 0.0335*** | 0.0335*** |
| (4.04) | (3.74) | (٤.٠٠) | (3.96) | |
| إس | 0.1155 | 0.1269 | 0.1269 | |
| (0.80) | (0.88) | (1.00) | ||
| أوه | 2.3491*** | 2.4292*** | 2.4292*** | |
| (3.24) | (3.31) | (2.86) | ||
| دا | 0.0393*** | 0.0390*** | 0.0390*** | |
| (4.59) | (4.53) | (4.07) | ||
| كاليفورنيا | 0.0713 | 0.0845 | 0.0845 | |
| (0.43) | (0.51) | (0.53) | ||
| هراء | -0.0375 | -0.0230 | -0.0230 | |
| (-0.54) | (-0.33) | (-0.36) | ||
| INS | -0.0546** | -0.0546** | ||
| (-1.99) | (-1.97) | |||
| تعليم | -0.6417 | -0.6417 | ||
| (-0.50) | (-0.48) | |||
| مار | -0.0788 | -0.0788 | ||
| (-0.45) | (-0.46) | |||
| ثابت | -6.1855*** | -10.2195*** | 0.7371 | 0.7371 |
| (-3.31) | (-4.22) | (0.04) | (0.04) | |
| شركة FE | ✓ | ✓ | ✓ | ✓ |
| سنة FE | ✓ | ✓ | ✓ | ✓ |
|
|
0.440 | 0.460 | 0.464 | 0.464 |
| ملاحظة | ١٠٨٠ | ١٠٨٠ | ١٠٨٠ | ١٠٨٠ |
اختبارات المتانة
مشكلة الاندماج الذاتي
- قمنا بتضمين المتغيرات البيئية كمتغير تحكم لتقليل تأثير المتغيرات المفقودة في نموذجنا. تم تفصيل طريقة قياس المتغيرات البيئية في الجدول 9 من الملحق. تُعرض نتائج الانحدار بعد دمج المتغيرات البيئية في M1 من الجدول 3. بناءً على بحث Bu et al. (2024)، قمنا بتضمين تأثيرات ثابتة مشتركة من الدرجة العليا للزمن والصناعة، مما يتيح مزيدًا من التحكم في تأثير العوامل المتغيرة مع الزمن على مستوى الصناعة. يتم تلخيص النتائج في M2 من الجدول 3.
- نظرًا للتداخل المحتمل للسببية العكسية على نتائجنا، قمنا بتأخير المتغير المستقل بفترة واحدة للتحليل الانحداري (جيانغ وآخرون 2022ب). تتيح لنا هذه الطريقة الكشف عن العلاقة السببية بين المتغيرات بدقة أكبر، وتظهر نتائج الانحدار في M3 من الجدول 3.
- قمنا بتوظيف طريقة فعالة من خطوتين لتعميم لحظات لتناول مشكلة التداخل بشكل أفضل. أولاً، استخدمنا المستوى المتوسط من DF في المقاطعات المجاورة كأول متغير آلي (IV) لـ
(جيانغ وآخرون 2022أ)، المسمى Sur_DF، لأن عمليات DF تظهر عمومًا تواصلًا عابرًا للمناطق بشكل كبير. وبالتالي، قد يؤثر مستوى تطوير DF وجودة الخدمة في المقاطعات المجاورة على المنطقة المحلية. في الوقت نفسه، لا يؤثر مستوى DF في المناطق المجاورة بشكل مباشر على قرارات GI لشركات الطاقة المحلية، مما يوفر لنا IV فعالة لتقليل تأثير التداخل. ثانيًا، قمنا بإنشاء متغير Bartik كـ IV إضافي (تابيليني 2020؛ حسن وآخرون 2020). يتم حساب هذا المتغير كمنتج لمؤشر DF الإقليمي المتأخر والفرق من الدرجة الأولى في مؤشر DF الوطني على مر الزمن، مما يلتقط التغيرات الديناميكية.
| متغير | M1 جي | M2 جي | M3 جي | M4 DF | M5 جي |
| DF | 0.0332*** (3.57) | 0.0254*** (2.76) | 0.0647*** (3.79) | ||
| DF_1 | 0.0284*** (2.92) | ||||
| سور_دي إف | 1.0338*** (22.32) | ||||
| بارتيك_الرابع | 0.0020*** (2.87) | ||||
| ثابت | 0.6771 (0.04) | 14.8046 (0.78) | -8.4745 (-0.43) | 127.3052 (1.51) | -3.0787 (-0.16) |
| تحكم | ✓ | ✓ | ✓ | ✓ | ✓ |
| شركة FE | ✓ | ✓ | ✓ | ✓ | ✓ |
| سنة FE | ✓ | ✓ | ✓ | ✓ | ✓ |
| صناعة × سنة FE | ✓ | ||||
| أندرسون إل إم | 155.735*** | ||||
| كراج-دونالد والد ف | ٢٦٥٫٧٠٠ | ||||
|
|
0.464 | 0.573 | 0.485 | 0.481 | |
| ملاحظة | ١٠٨٠ | ١٠٨٠ | 972 | 972 | 972 |
استبدال المتغيرات المستقلة
استبدال المتغيرات التابعة
استبدال النموذج
اختبارات القوة الأخرى
تحليل الآلية
| متغير | M1 | M2 | M3 | M4 | M5 |
| جي آي | جي آي | جل | جي آي | جي آي | |
| DF | 0.0345*** | 2.6386*** | 0.1784*** | 0.0354*** | 0.0302*** |
| (3.19) | (3.19) | (3.38) | (3.38) | (3.61) | |
| ثابت | 0.8999 | 5.3530 | -18.2045 | ٢٨.٣٤٦٥ | 3.4191 |
| (0.05) | (0.32) | (-0.14) | (1.33) | (0.20) | |
| تحكم | ✓ | ✓ | ✓ |
|
✓ |
| شركة FE | ✓ | ✓ |
|
|
✓ |
| سنة FE | ✓ | ✓ |
|
✓ | ✓ |
|
|
0.467 | 0.463 | 0.486 | 0.490 | |
| ملاحظة | 1070 | ١٠٨٠ | ١٠٨٠ | ١٠٨٠ | 972 |
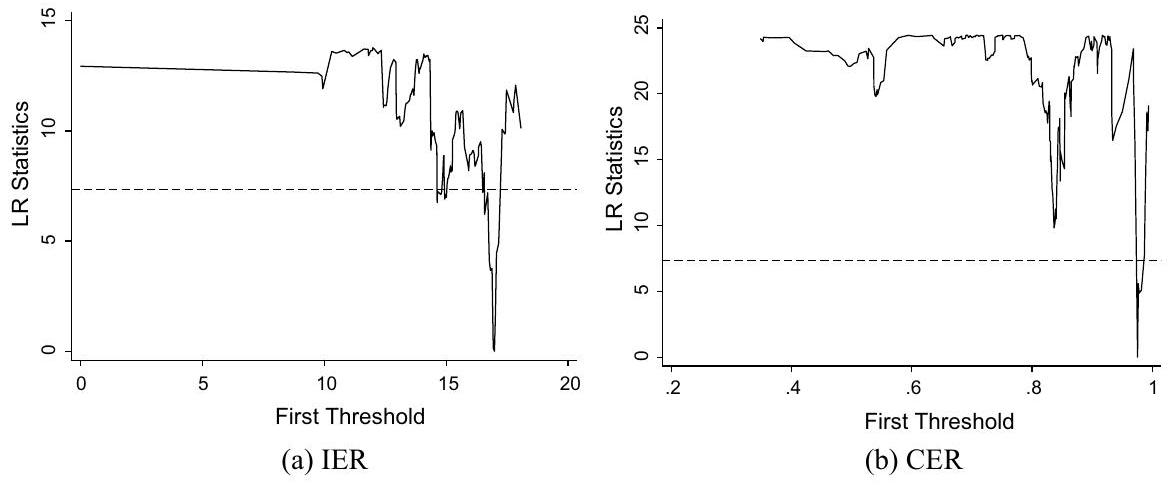
أثر العتبة
اختبار تأثير العتبة
تحليل نتائج انحدار تأثير العتبة
| متغير | M1 FC | M2 CF | إم 3 إف إم | M4 CFI |
| DF | 0.0014*** | 0.7274*** | -0.0025** | -0.0183 |
| (7.39) | (3.56) | (-1.97) | (-0.85) | |
| ثابت | -4.0381*** | 519.4478** | 0.9264 | ٢٤.٣٤٨٣ |
| (-12.70) | (2.12) | (0.32) | (0.48) | |
| تحكم | ✓ | ✓ | ✓ |
|
| شركة FE | ✓ | ✓ | ✓ |
|
| سنة FE | ✓ | ✓ | ✓ |
|
|
|
0.988 | 0.879 | 0.592 | 0.850 |
| ملاحظة | ١٠٨٠ | ١٠٨٠ | ١٠٨٠ | ١٠٨٠ |
| متغيرات العتبة | عتبة واحدة | عتبة مزدوجة | قيمة العتبة | فترة الثقة 95% | ||
| قيمة F |
|
قيمة F |
|
|||
| IER | 12.76 | 0.027 | 3.24 | 0.707 | 16.9802 | [16.7459, 17.0240] |
| شهادة المطابقة | ٢٢.٦٣ | 0.003 | 14.19 | 0.193 | 0.9755 | [0.9731, 0.9761] |
| متغير | M1 | M2 |
| جي آي | جل | |
| DF | 0.0314**(IER
|
|
| (2.52) | (3.01) | |
| 0.0247*(IER > 16.9802) | 0.0398***(CER > 0.9755) | |
| (1.97) | (2.77) | |
| ثابت | ٤.٠٣٦١ | 7.2842 |
| (0.17) | (0.30) | |
| تحكم | ✓ | ✓ |
| شركة FE | ✓ | ✓ |
| سنة FE | ✓ | ✓ |
|
|
0.0936 | 0.0947 |
| ملاحظة | ١٠٨٠ | ١٠٨٠ |
تحليل التباين
الملكية
حجم المؤسسة
| متغير | الملكية | حجم المؤسسة | مستوى التسويق | |||
| M1 | M2 | M3 | M4 | M5 | M6 | |
| SOE | NSOE | لي | المؤسسات الصغيرة والمتوسطة | حمير | لمار | |
| DF | 0.0355*** | 0.0148 | 0.0262*** | 0.0317 | 0.0310** | 0.0323 |
| (3.69) | (1.04) | (2.97) | (1.09) | (2.27) | (1.02) | |
| ثابت | 12.4834 | -42.0629 | -3.2788 | -43.9853 | -7.1121 | -21.1086 |
| (0.64) | (-1.13) | (-0.19) | (-0.67) | (-0.19) | (-0.75) | |
| تحكم | ✓ | ✓ | ✓ | ✓ | ✓ | ✓ |
| شركة FE | ✓ | ✓ | ✓ | ✓ | ✓ |
|
| سنة FE | ✓ | ✓ | ✓ | ✓ | ✓ | ✓ |
|
|
0.467 | 0.482 | 0.521 | 0.542 | 0.494 | 0.457 |
| ملاحظة | ٩٠٠ | 180 | ٨٨٧ | 193 | 706 | 374 |
مستوى التسويق
الخاتمة، الآثار السياسية، والقيود
الاستنتاجات
آثار السياسة
- نظرًا للتأثير الإيجابي للتمويل الرقمي على الاستثمارات الخضراء في قطاع الطاقة، يجب على الحكومة تسريع تطوير التمويل الرقمي. على وجه الخصوص، يمكن للحكومة زيادة تغطية التمويل الرقمي من خلال تعزيز بناء البنية التحتية ونشر المعرفة حول التمويل الرقمي. كما يمكنها تعميق استخدام التمويل الرقمي من خلال تحسين المنتجات والخدمات المالية الرقمية وتحسين النظام التنظيمي. بالإضافة إلى ذلك، يمكن للحكومة تعزيز مستويات الرقمنة من خلال تشجيع الابتكار التكنولوجي وتسهيل تبادل البيانات والانفتاح. علاوة على ذلك، يجب عليها تشجيع التوجه البيئي للتمويل الرقمي والسيطرة على المخاطر البيئية المرتبطة به. من خلال صياغة وتنظيم محتوى ومعايير ومخاطر التمويل الرقمي، تجعل الحكومة التمويل الرقمي إشارة فعالة لآليات تخصيص الموارد في سوق الاستثمارات الخضراء.
- تشير نتائج أبحاثنا إلى أن مستوى معتدل من الموارد البيئية (ERs) أكثر ملاءمة لتحقيق التأثير الإيجابي للتمويل الأخضر (DF) على الاستثمارات الخضراء (GIs) في قطاع الطاقة. لذلك، يجب على الحكومة تحسين آلية الدعم البيئي الحالية، مثل تحديد حدود الدعم وتعزيز الإشراف على استخدام الدعم، لمنع سلوكيات البحث عن الريع وسوء استخدام الأموال بشكل فعال. يمكن للحكومة أيضًا اتخاذ تدابير لتخفيف الضغط على الشركات فيما يتعلق بتقليل الانبعاثات، مثل صياغة سياسات ذات صلة تسمح للشركات بتعويض نسبة معينة من أهداف تقليل الانبعاثات الخاصة بها من خلال الاستثمارات الخضراء الجديدة. تشجع هذه السياسات الشركات على زيادة الاستثمارات الخضراء وتخفيف العبء الاقتصادي عليها خلال عملية تقليل الانبعاثات.
- نظرًا للاختلافات في تأثير DF على GIs في أنواع مختلفة من مؤسسات الطاقة، يجب على الحكومة صياغة سياسات تحفيزية مستهدفة. على سبيل المثال، يمكن للحكومة إنشاء صناديق خاصة لدعم الشركات الكبيرة المملوكة للدولة في بدء الابتكار التكنولوجي واستكشاف النماذج في DF. في الوقت نفسه، يجب تطوير منصات خدمات مالية رقمية لتوفير خدمات مالية رقمية مريحة للمؤسسات المملوكة للدولة والشركات الصغيرة والمتوسطة، مما يعزز قدراتها في GI. كما يجب على الحكومة الاستمرار في تشجيع الإصلاحات الموجهة نحو السوق في سوق الطاقة، لضمان أن تكاليف تقليل الانبعاثات لمؤسسات الطاقة تنعكس بالكامل في المعاملات القائمة على السوق، مما يقلل من ضغط تكاليفها لتقليل الانبعاثات.
القيود
الملحق أ
انظر الجدول 9.
| نوع | أسماء المتغيرات | اختصارات | حساب | مصدر | وحدة |
| المتغير التابع | الاستثمارات الخضراء | جي آي | الاستثمارات الخضراء / إجمالي الأصول × 100 | سيارة | % |
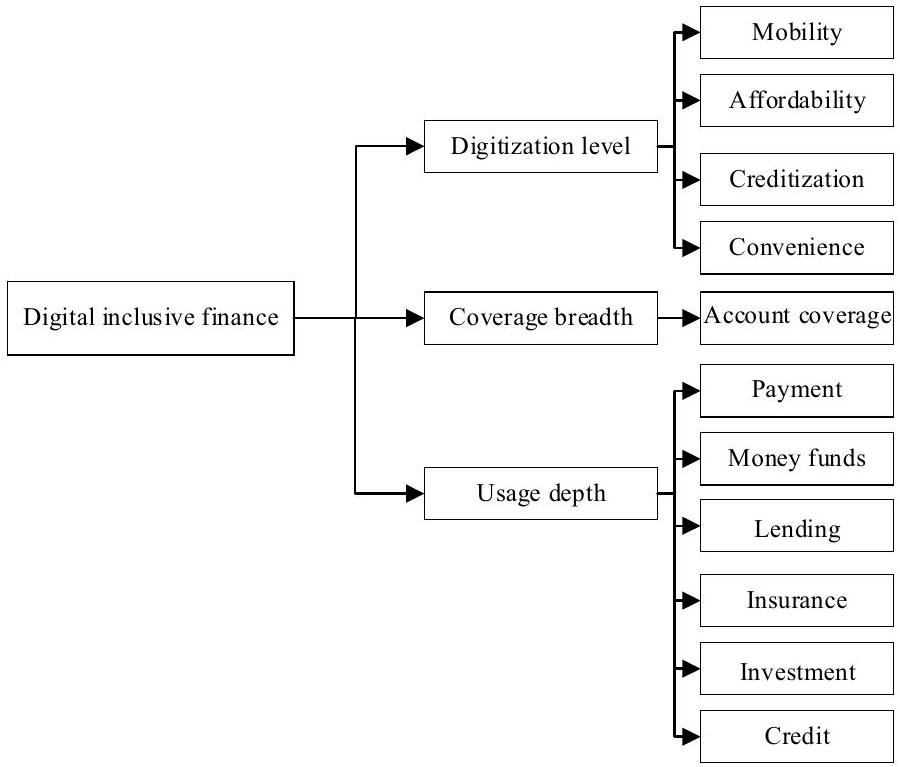
| المتغير المستقل | التمويل الرقمي | DF | مؤشر التمويل الشامل الرقمي | جامعة بكين | – |
| المتغيرات الوسيطة | قيود التمويل | نادي كرة القدم | مؤشر SA | CSMAR | – |
| التدفق النقدي | CF | النقد وما في حكمه
|
سيارة | 100 مليون يوان | |
| عدم تطابق مالي | إف إم | (سعر الفائدة الخاص بالشركة – متوسط سعر الفائدة في الصناعة) / متوسط سعر الفائدة في الصناعة | CSMAR | – | |
| التمويل المؤسسي | CFI | الأصول المالية / إجمالي الأصول × 100 | سيارة | % | |
| متغيرات العتبة | تنظيم بيئي قائم على حوافز السوق | IER | لوغاريتم (دعم الحوكمة البيئية + 1) | سيارة | – |
| تنظيم بيئي قائم على الأوامر والسيطرة | شهادة المطابقة | فهرس شامل لمؤشر تلوث البيئة | سي إس واي | – | |
| متغيرات التحكم | حجم المؤسسة | إس | Ln (عدد الموظفين) | سيارة | – |
| الملكية | أوه | إذا كانت الشركة مملوكة للدولة، فإن المتغير
|
CSMAR | – | |
| قدرة | دا | إجمالي الالتزامات / إجمالي الأصول × 100 | سيارة | % | |
| نسبة النقد | كاليفورنيا | النقد وما في حكمه / الالتزامات المتداولة | سيارة | – | |
| حجم المجلس | هراء | إجمالي عدد أعضاء المجلس | سيارة | أشخاص | |
| الهيكل الصناعي | INS | نسبة القطاع الثالث في الناتج المحلي الإجمالي | سي إي آي سي | % | |
| مستوى التعليم | تعليم | Ln (عدد الطلاب الجامعيين) | سي إي آي سي | – | |
| مستوى التسويق | مار | مؤشر تسويق السوق المقدم من NERI | نيري | – |
الاختصارات
| جلز | الاستثمارات الخضراء |
| DF | التمويل الرقمي |
| غرف الطوارئ | التشريعات البيئية |
| IER | تنظيم بيئي قائم على الحوافز السوقية |
| شهادة المطابقة | تنظيم بيئي قائم على الأوامر والسيطرة |
| الرابع | متغير آلي |
| الشركات المملوكة للدولة | المؤسسات المملوكة للدولة |
| المنظمات غير الربحية | المؤسسات غير المملوكة للدولة |
| لي | الشركات الكبيرة |
| المؤسسات الصغيرة والمتوسطة | المؤسسات الصغيرة والمتوسطة |
| حمير | مستوى عالٍ من التسويق |
| لمار | مستوى منخفض من التسويق |
شكر وتقدير
مساهمات المؤلفين
التمويل
توفر البيانات والمواد
الإعلانات
المصالح المتنافسة
تم الاستلام: 30 يناير 2024 تم القبول: 14 فبراير 2025
تم النشر عبر الإنترنت: 03 مارس 2025
References
Bakhsh S, Zhang W, Ali K, Anas M (2023) Can digital financial inclusion facilitate renewable energy consumption? Evidence from nonlinear analysis. Energy Environ. https://doi.org/10.1177/0958305X231204029
Bakhsh S, Zhang W, Ali K, Anas M (2024a) Transition towards environmental sustainability through financial inclusion, and digitalization in China: evidence from novel quantile-on-quantile regression and wavelet coherence approach. Technol Forecast Soc Change 198:123013. https://doi.org/10.1016/j.techfore.2023.123013
Bakhsh S, Zhang W, Ali K, Anas M (2024b) Energy transition and environmental stability prospects for OECD economies: the prominence role of environmental governance, and economic complexity: does the geopolitical risk matter? J Environ Manage 354:120358. https://doi.org/10.1016/j.jenvman.2024.120358
Bakhsh S, Zhang W, Ali K, Oláh J (2024c) Strategy towards sustainable energy transition: the effect of environmental governance, economic complexity and geopolitics. Energy Strategy Rev 52:101330. https://doi.org/10.1016/j.esr. 2024.101330
Cao Y, Liu J, Yu Y, Wei G (2020) Impact of environmental regulation on green growth in China’s manufacturing industrybased on the Malmquist-Luenberger index and the system GMM model. Environ Sci Pollut Res 27:41928-41945. https://doi.org/10.1007/s11356-020-10046-1
Chen Y, Ma Y (2021) Does green investment improve energy firm performance? Energy Policy 153:112252. https://doi. org/10.1016/j.enpol.2021.112252
Chen G, Wei B, Zhu R (2022) The impact of environmental subsidy on the performance of corporate environmental responsibility: evidence from China. Front Environ Sci 10:972328. https://doi.org/10.3389/fenvs.2022.972328
Cheng Z, Kong S (2022) The effect of environmental regulation on green total-factor productivity in China’s industry. Environ IMPACT Assess Rev 94:106757. https://doi.org/10.1016/j.eiar.2022.106757
Chi Y, Hu N, Lu D, Yang Y (2023) Green investment funds and corporate green innovation: from the logic of social value. Energy Econ 119:106532. https://doi.org/10.1016/j.eneco.2023.106532
Dato
Deng J, Liu Y (2022) Does digital finance reduce the employment in the finance industry? Evidence from China FINANCE Res Lett 48:102994. https://doi.org/10.1016/j.frl.2022.102994
Ding Q, Huang J, Chen J (2023) Does digital finance matter for corporate green investment? Evidence from heavily polIuting industries in China. Energy Econ 117:106476. https://doi.org/10.1016/j.eneco.2022.106476
Dong K, Wang J, Ren X (2023) Does Internet development have a spatial fluctuation spillover effect on green total factor productivity in China? A spatial-SAR-ARCH model. Manag Environ Qual Int J 34:741-770. https://doi.org/10.1108/ MEQ-08-2022-0226
Du W, Li M, Wang F (2020) Role of rent-seeking or technological progress in maintaining the monopoly power of energy enterprises: an empirical analysis based on micro-data from China. Energy 202:117763. https://doi.org/10.1016/j. energy.2020.117763
Du K, Cheng Y, Yao X (2021) Environmental regulation, green technology innovation, and industrial structure upgrading: the road to the green transformation of Chinese cities. Energy Econ 98:105247. https://doi.org/10.1016/j.eneco. 2021.105247
Engel-Cox JA, Chapman A (2023) Accomplishments and challenges of metrics for sustainable energy, population, and economics as illustrated through three countries. Front Sustain Energy Policy. https://doi.org/10.3389/fsuep.2023. 1203520
Fan Y, Chen ST (2022) Research on the effects of digital inclusive finance on the efficiency of financial resource allocation. Front Environ Sci 10:957941. https://doi.org/10.3389/fenvs.2022.957941
Ferreira P, Loures L, Nunes J, Brito P (2018) Are renewable energy stocks a possibility to diversify portfolios considering an environmentally friendly approach? The view of DCCA correlation coefficient. Phys -Stat Mech ITS Appl 512:675681. https://doi.org/10.1016/j.physa.2018.08.108
Guo Q, Wu Z, Ding C et al (2023) An empirical analysis of the nexus between digital financial inclusion, industrial structure distortion, and China’s energy intensity. Environ Sci Pollut Res 30:49397-49411. https://doi.org/10.1007/ s11356-023-25323-y
Gupta G, Mahakud J (2019) Alternative measure of financial development and investment-cash flow sensitivity: evidence from an emerging economy. Financ Innov 5:1. https://doi.org/10.1186/s40854-018-0118-9
Hai B, Yin X, Xiong J, Chen J (2022) Could more innovation output bring better financial performance? The role of financial constraints. Financ Innov 8:6. https://doi.org/10.1186/s40854-021-00309-2
Hasan I, Hoi C-K, Wu Q, Zhang H (2020) Is social capital associated with corporate innovation? Evidence from publicly listed firms in the US. J Corp Fin 62:101623. https://doi.org/10.1016/j.jcorpfin.2020.101623
Hassan ST, Batool B, Sadiq M, Zhu B (2022) How do green energy investment, economic policy uncertainty, and natural resources affect greenhouse gas emissions? A Markov-switching equilibrium approach. Environ IMPACT Assess Rev 97:106887. https://doi.org/10.1016/j.eiar.2022.106887
He L, Zhang L, Zhong Z et al (2019) Green credit, renewable energy investment and green economy development: empirical analysis based on 150 listed companies of China. J Clean Prod 208:363-372. https://doi.org/10.1016/j.jclep ro.2018.10.119
Hu W-Q, Zhao J, Zhao L (2023) Does enhancing environmental regulation promote corporate green investment? Evidence from China. Energy Environ 34:3265-3291. https://doi.org/10.1177/0958305X221122931
Huang L, Lei Z (2021) How environmental regulation affect corporate green investment: evidence from China. J Clean Prod 279:123560. https://doi.org/10.1016/j.jclepro.2020.123560
Javeed SA, Latief R, Cai X, San Ong T (2024) Digital finance and corporate green investment: a perspective from institutional investors and environmental regulations. J Clean Prod 446:141367. https://doi.org/10.1016/j.jclepro. 2024. 141367
Jiang S, Liu X, Liu Z et al (2022a) Does green finance promote enterprises’ green technology innovation in China? Front Environ Sci 10:981013. https://doi.org/10.3389/fenvs.2022.981013
Jiang Y, Guo C, Wu Y (2022b) Does digital finance improve the green investment of Chinese listed heavily polluting companies? The perspective of corporate financialization. Environ Sci Pollut Res 29:71047-71063. https://doi.org/10. 1007/s11356-022-20803-z
Jin XM, Mai Y, Cheung AWK (2022) Corporate financialization and fixed investment rate: evidence from China. Finance Res Lett 48:102898. https://doi.org/10.1016/j.frl.2022.102898
Kim B, Kim SW, Park KS (2021) Promoting supplier’s environmental innovation via emission taxation. Int J Prod Econ 240:108240. https://doi.org/10.1016/j.jjpe.2021.108240
Kock N, Lynn GS (2012) Lateral collinearity and misleading results in variance-based SEM: an illustration and recommendations. J Assoc Inf Syst 13:546-580. https://doi.org/10.17705/1jais. 00302
Kong T, Sun R, Sun G, Song Y (2022) Effects of digital finance on green innovation considering information asymmetry: an empirical study based on Chinese listed firms. Emerg Mark Fin Trade 58:4399-4411. https://doi.org/10.1080/15404 96X.2022.2083953
Kou G, Pamucar D, Yuksel S et al (2024) Evaluation of multidimensional carbon neutrality policies in transportation using a novel quantum picture fuzzy rough modeling. IEEE Trans Eng Manag 71:7681-7700. https://doi.org/10.1109/TEM. 2024.3374385
Li G, Zhang R, Feng S, Wang Y (2022a) Digital finance and sustainable development: evidence from environmental inequality in China. Bus Strategy Environ 31:3574-3594. https://doi.org/10.1002/bse. 3105
Li X, Shao X, Chang T, Albu LL (2022b) Does digital finance promote the green innovation of China?s listed companies? Energy Econ 114:106254. https://doi.org/10.1016/j.eneco.2022.106254
Li C, Wang Y, Zhou Z et al (2023a) Digital finance and enterprise financing constraints: structural characteristics and mechanism identification. J Bus Res 165:114074. https://doi.org/10.1016/j.jbusres.2023.114074
Li X, Wang S, Lu X, Guo F (2023b) Quantity or quality? The effect of green finance on enterprise green technology innovation. Eur J Innov Manag. https://doi.org/10.1108/EJIM-03-2023-0208
Liao F, Hu Y, Xu S (2022) How do environmental subsidies affect the environmental performance of heavily polluting enterprises: evidence from China. Econ Res-Ekon Istraz. https://doi.org/10.1080/1331677X.2022.2160777
Lin B, Xie Y (2023a) Positive or negative? R&D subsidies and green technology innovation: evidence from China’s renewable energy industry. Renew Energy 213:148-156. https://doi.org/10.1016/j.renene.2023.06.011
Lin B, Xie Y (2023b) The impact of government subsidies on capacity utilization in the Chinese renewable energy industry: Does technological innovation matter? Appl Energy 352:121959. https://doi.org/10.1016/j.apenergy.2023. 121959
Lin B, Xie Y (2024a) The role of venture capital in determining the total factor productivity of renewable energy enterprises: In the context of government subsidy reduction. Energy Econ 132:107454. https://doi.org/10.1016/j.eneco. 2024.107454
Liu R, He L, Liang X et al (2020) Is there any difference in the impact of economic policy uncertainty on the investment of traditional and renewable energy enterprises? – A comparative study based on regulatory effects. J Clean Prod 255:120102. https://doi.org/10.1016/j.jclepro.2020.120102
Liu J, Wang Z, Zhu W (2021a) Does privatization reform alleviate ownership discrimination? Evidence from the Split-share structure reform in China*. J Corp Fin 66:101848. https://doi.org/10.1016/j.jcorpfin.2020.101848
Liu L, Jiang J, Bian J et al (2021b) Are environmental regulations holding back industrial growth? Evidence from China. J Clean Prod 306:127007. https://doi.org/10.1016/j.jclepro.2021.127007
Liu X, Nie Z, Li B (2022) Financial mismatch and default risk: evidence from chinese nonfinancial listed private enterprises. Emerg Mark Fin Trade 58:852-862. https://doi.org/10.1080/1540496X.2021.1926235
Liu S, Liu H, Chen X (2023) Does environmental regulation promote corporate green investment? Evidence from China’s new environmental protection law. Environ Dev Sustain. https://doi.org/10.1007/s10668-023-03933-3
Muganyi T, Yan L, Yin Y et al (2022) Fintech, regtech, and financial development: evidence from China. Financ Innov 8:29. https://doi.org/10.1186/s40854-021-00313-6
Pan X, Ai B, Li C et al (2019) Dynamic relationship among environmental regulation, technological innovation and energy efficiency based on large scale provincial panel data in China. Technol Forecast Soc Change 144:428-435. https:// doi.org/10.1016/j.techfore.2017.12.012
Pata UK, Yilanci V, Zhang Q, Shah SAR (2022) Does financial development promote renewable energy consumption in the USA? Evidence from the Fourier-wavelet quantile causality test. Renew Energy 196:432-443. https://doi.org/10. 1016/j.renene.2022.07.008
Qu S, Wang J, Li Y, Wang K (2023) How does risk-taking affect the green technology innovation of high-tech enterprises in China: the moderating role of financial mismatch. Environ Sci Pollut Res 30:23747-23763. https://doi.org/10.1007/ s11356-022-23820-0
Razzaq A, Yang X (2023) Digital finance and green growth in China: appraising inclusive digital finance using web crawler technology and big data. Technol Forecast Soc Change 188:122262. https://doi.org/10.1016/j.techfore.2022.122262
Shabir M, Jiang P, Bakhsh S, Zhao Z (2021) Economic policy uncertainty and bank stability: threshold effect of institutional quality and competition. Pac-Basin Fin J 68:101610. https://doi.org/10.1016/j.pacfin.2021.101610
Song M, Wang S, Zhang H (2020) Could environmental regulation and R&D tax incentives affect green product innovation? J Clean Prod 258:120849. https://doi.org/10.1016/j.jclepro.2020.120849
Song H, Li M, Yu K (2021) Big data analytics in digital platforms: how do financial service providers customise supply chain finance? Int J Oper Prod Manag 41:410-435. https://doi.org/10.1108/IJOPM-07-2020-0485
Sun G, Li G, Dilanchiev A, Kazimova A (2023a) Promotion of green financing: role of renewable energy and energy transition in China. Renew Energy 210:769-775. https://doi.org/10.1016/j.renene.2023.04.044
Sun G, Li T, Ai Y, Li Q (2023b) Digital finance and corporate financial fraud. Int Rev Financ Anal 87:102566. https://doi.org/ 10.1016/j.irfa.2023.102566
Ta H, Liu J, Mao J, Wu J (2020) The effects of emission trading system on corporate innovation and productivity-empirical evidence from China’s SO2 emission trading system. Environ Sci Pollut Res 27:21604-21620. https://doi.org/10.1007/ s11356-020-08566-x
Tabellini M (2020) Gifts of the immigrants, woes of the natives: lessons from the age of mass migration. Rev Econ Stud 87:454-486. https://doi.org/10.1093/restud/rdz027
Taghizadeh-Hesary F, Yoshino N (2019) The way to induce private participation in green finance and investment. Finance Res Lett 31:98-103. https://doi.org/10.1016/j.frl.2019.04.016
Tang X, Ding S, Gao X, Zhao T (2022) Can digital finance help increase the value of strategic emerging enterprises? Sustain Cities Soc 81:103829. https://doi.org/10.1016/j.scs.2022.103829
Tong L, JabbourBelgacem CJCSB et al (2022) Role of environmental regulations, green finance, and investment in green technologies in green total factor productivity: empirical evidence from Asian region. J Clean Prod 380:134930. https://doi.org/10.1016/j.jclepro.2022.134930
Wang H, Zhang R (2022) Effects of environmental regulation on CO2 emissions: an empirical analysis of 282 cities in China. Sustain Prod Consum 29:259-272. https://doi.org/10.1016/j.spc.2021.10.016
Wang K, Mi Z, Wei Y-M (2019) Will pollution taxes improve joint ecological and economic efficiency of thermal power industry in China?: A DEA-based materials balance approach. J Ind Ecol 23:389-401. https://doi.org/10.1111/jiec. 12740
Wang Z, Wang N, Hu X, Wang H (2022) Threshold effects of environmental regulation types on green investment by heavily polluting enterprises. Environ Sci Eur 34:26. https://doi.org/10.1186/s12302-022-00606-2
Wang W, Gao P, Wang J (2023) Nexus among digital inclusive finance and carbon neutrality: evidence from companylevel panel data analysis. Resour Policy 80:103201. https://doi.org/10.1016/j.resourpol.2022.103201
Wei Y, Wang L, Zhang H (2023) Digital finance and pollution: firm-level evidence from China. J Glob Inf Manag 31:321183. https://doi.org/10.4018/JGIM. 321183
Wu Y, Huang S (2022) The effects of digital finance and financial constraint on financial performance: firm-level evidence from China’s new energy enterprises. Energy Econ 112:106158. https://doi.org/10.1016/j.eneco.2022.106158
Wu W, Yang S, Li A et al (2024) Does interest rate liberalization affect corporate green investment? Energy Econ 131:107377. https://doi.org/10.1016/j.eneco.2024.107377
Xiao Y, Lin M, Wang L (2024) Impact of green digital finance on sustainable development: evidence from China’s pilot zones. Financ Innov 10:10. https://doi.org/10.1186/s40854-023-00552-9
Xie L, Li Z, Ye X, Jiang Y (2021) Environmental regulation and energy investment structure: empirical evidence from China’s power industry. Technol Forecast Soc CHANGE 167:120690. https://doi.org/10.1016/j.techfore.2021.120690
Yan W, Wang Y, Zheng S et al (2023) Nonlinear impact of the digital inclusive finance on enterprise technological innovation based on the AK Model and PSTR empirical analysis. J Glob Inf Manag 31:320191. https://doi.org/10.4018/JGIM. 320191
Yi R, Wang H, Lyu B, Xia Q (2023) Does venture capital help to promote open innovation practice? Evidence from China. Eur J Innov Manag 26:1-26. https://doi.org/10.1108/EJIM-03-2021-0161
Yu M, Deng X (2021) The inheritance of marketization level and regional human capital accumulation: evidence from China. Finance Res Lett 43:102268. https://doi.org/10.1016/j.frl.2021.102268
Yu M, Tsai F-S, Jin H, Zhang H (2022) Digital finance and renewable energy consumption: evidence from China. Financ Innov 8:58. https://doi.org/10.1186/s40854-022-00362-5
Yu X, Dilanchiev A, Bibi S (2024) Enhancing labor productivity as a key strategy for fostering green economic growth and resource efficiency. HELIYON 10:e24640. https://doi.org/10.1016/j.heliyon.2024.e24640
Zhang DY, Kong Q (2022) Green energy transition and sustainable development of energy firms: an assessment of renewable energy policy. Energy Econ 111:106060. https://doi.org/10.1016/j.eneco.2022.106060
Zhang MM, Wang Q, Zhou D, Ding H (2019) Evaluating uncertain investment decisions in low-carbon transition toward renewable energy. Appl Energy 240:1049-1060. https://doi.org/10.1016/j.apenergy.2019.01.205
Zhang Y, Song Y, Zou H (2022) Non-linear effects of heterogeneous environmental regulations on industrial relocation: do compliance costs work? J Environ Manage 323:116188. https://doi.org/10.1016/j.jenvman.2022.116188
Zhang Z, Wang J, Feng C, Chen X (2023a) Do pilot zones for green finance reform and innovation promote energy savings? Evidence from Chin Energy Econ 124:106763. https://doi.org/10.1016/j.eneco.2023.106763
Zhang Z, Zhang Y, Zhao M et al (2023b) What is the global causality among renewable energy consumption, financial development, and public health? New perspective of mineral energy substitution. Resour Policy 85:104036. https:// doi.org/10.1016/j.resourpol.2023.104036
Zhang W, Bakhsh S, Ali K, Anas M (2024) Fostering environmental sustainability: an analysis of green investment and digital financial inclusion in China using quantile-on-quantile regression and wavelet coherence approach. Gondwana Res 128:69-85. https://doi.org/10.1016/j.gr.2023.10.014
Zhao Y, Su K (2022) Economic policy uncertainty and corporate financialization: evidence from China. Int Rev Financ Anal 82:102182. https://doi.org/10.1016/j.irfa.2022.102182
Zhao Z-Y, Zuo J, Fan L-L, Zillante G (2011) Impacts of renewable energy regulations on the structure of power generation in China – A critical analysis. Renew Energy 36:24-30. https://doi.org/10.1016/j.renene.2010.05.015
Zhong W, Jiang T (2021) Can internet finance alleviate the exclusiveness of traditional finance? evidence from Chinese P2P lending markets. Finance Res Lett 40:101731. https://doi.org/10.1016/j.frl.2020.101731
ملاحظة الناشر
و -إحصائيات بين قوسين و -إحصائيات بين قوسين و -إحصائيات بين قوسين و -إحصائيات بين قوسين و -إحصائيات بين قوسين
DOI: https://doi.org/10.1186/s40854-025-00772-1
Publication Date: 2025-03-03
How does digital finance drive energy transition? A green investment-based perspective
bqlin@xmu.edu.cn; bqlin2004@vip.sina.com
Abstract
Green investments (Gls) in the energy industry are crucial for driving a clean energy transition and fostering environmental sustainability. In the digital economy era, insufficient attention has been paid to digital finance’s (DF’s) influence on Gls in energy enterprises, potentially underestimating its impact. Our study utilized a two-way fixedeffects model, analyzing data from 108 listed energy firms from 2011 to 2020, to empirically investigate the influence of DF on GIs in China’s energy industry. The research findings are as follows: (1) An increase of one unit in DF can improve the intensity of GIs in the energy industry by
JEL Classification: G23, Q30, Q56
Introduction
Literature review
Digital finance and green investments
(Pata et al. 2022; Zhang et al. 2023b). GIs refer to allocating financial resources to projects aligned with sustainable energy, energy efficiency enhancement, carbon reduction, and environmentally friendly technologies (Chen and Ma 2021; Zhang et al. 2024). DF is an innovative financial model garnering significant attention (Bakhsh et al. 2023, 2024a), with its cutting-edge financial products and enhanced service efficiency (Ding et al. 2023; Wang et al. 2023; Razzaq and Yang 2023) potentially revolutionizing GIs.
Environmental regulations and green investments
Summary
transformation in the energy sector is crucial. Therefore, more research on the role of GIs in the energy industry is necessary. Second, research primarily explores DF’s impact on GIs from a linear perspective. However, recent studies have indicated that ERs have a threshold effect on GIs (Huang and Lei 2021; Wang et al. 2022). Thus, DF’s impact on GIs may be nonlinear under different ER levels. Referring to the literature, we focused on Chinese energy enterprises and explored the threshold effect of DF on GIs from an ER perspective.
Theoretical mechanism analysis
The impact of DF on Gls in energy enterprises
DF, financing constraints, and Gls
DF, cash flows, and Gls
DF, financial mismatches, and Gls
DF, corporate financialization, and Gls
Threshold effect of ERs
IER
CER
stringent ERs. In this case, energy enterprises may focus more on lowering production costs rather than expanding GIs, weakening DF’s effect on GIs. Furthermore, the threat of penalties for noncompliance can create a culture of risk aversion within energy companies, discouraging experimentation with innovative green technologies or investments as firms seek to avoid potential legal or administrative consequences. In such a scenario, the impact of DF on financing and promoting GIs may be limited as enterprises become more conservative in their environmental strategies. Consequently, when CER surpasses a particular threshold, DF’s positive influence on GIs in energy firms may weaken.
Research design
Data
Variables
Dependent variable
Independent variable
Mediating variables
Threshold variables
Control variables
Methodology
Basic model
Mediation models
| Variable | Obs | Mean | Std. dev | Min | Max | Skewness | Kurtosis | Jarque-Bera |
| GI | 1080 | 1.368 | 2.652 | 0.000 | 14.700 | 2.936 | 12.374 | 5505.852 |
| DF | 1080 | 225.747 | 98.836 | 24.510 | 417.875 | -0.252 | 2.272 | 35.280 |
| FC | 1080 | -3.778 | 0.335 | -4.304 | -2.353 | 1.750 | 7.753 | 1567.845 |
| CF | 1080 | 44.531 | 122.722 | 0.554 | 951.330 | 5.745 | 38.546 | 62,799.220 |
| FM | 1080 | 0.077 | 0.543 | -1.000 | 2.539 | 1.154 | 7.243 | 1049.846 |
| CFI | 1080 | 20.324 | 14.459 | 2.038 | 73.647 | 1.514 | 5.421 | 676.351 |
| IER | 1080 | 5.350 | 7.085 | 0.000 | 18.250 | 0.626 | 1.504 | 171.248 |
| CER | 1080 | 0.770 | 0.158 | 0.348 | 0.996 | -0.637 | 2.912 | 73.387 |
| ES | 1080 | 8.322 | 1.492 | 5.460 | 13.009 | 0.616 | 3.409 | 75.830 |
| OW | 1080 | 0.833 | 0.373 | 0.000 | 1.000 | -1.789 | 4.200 | 640.894 |
| DA | 1080 | 53.049 | 16.486 | 12.148 | 86.543 | -0.333 | 2.635 | 25.955 |
| CA | 1080 | 0.432 | 0.555 | 0.014 | 4.219 | 4.284 | 26.487 | 28,127.241 |
| BS | 1080 | 10.000 | 2.279 | 6.000 | 17.000 | 0.956 | 3.692 | 186.057 |
| INS | 1080 | 50.223 | 12.440 | 32.500 | 83.900 | 1.162 | 3.868 | 276.948 |
| EDU | 1080 | 13.200 | 0.552 | 10.950 | 14.016 | -1.216 | 5.668 | 586.478 |
| MAR | 1080 | 8.458 | 1.836 | 3.580 | 11.673 | -0.521 | 2.703 | 52.829 |
Threshold models
Empirical results and discussion
Descriptive statistics
Baseline regression
| Variable | M1 | M2 | M3 | M4 |
| Gl | GI | GI | GI | |
| DF | 0.0335*** | 0.0307*** | 0.0335*** | 0.0335*** |
| (4.04) | (3.74) | (4.00) | (3.96) | |
| ES | 0.1155 | 0.1269 | 0.1269 | |
| (0.80) | (0.88) | (1.00) | ||
| OW | 2.3491*** | 2.4292*** | 2.4292*** | |
| (3.24) | (3.31) | (2.86) | ||
| DA | 0.0393*** | 0.0390*** | 0.0390*** | |
| (4.59) | (4.53) | (4.07) | ||
| CA | 0.0713 | 0.0845 | 0.0845 | |
| (0.43) | (0.51) | (0.53) | ||
| BS | -0.0375 | -0.0230 | -0.0230 | |
| (-0.54) | (-0.33) | (-0.36) | ||
| INS | -0.0546** | -0.0546** | ||
| (-1.99) | (-1.97) | |||
| EDU | -0.6417 | -0.6417 | ||
| (-0.50) | (-0.48) | |||
| MAR | -0.0788 | -0.0788 | ||
| (-0.45) | (-0.46) | |||
| Constant | -6.1855*** | -10.2195*** | 0.7371 | 0.7371 |
| (-3.31) | (-4.22) | (0.04) | (0.04) | |
| Firm FE | ✓ | ✓ | ✓ | ✓ |
| Year FE | ✓ | ✓ | ✓ | ✓ |
|
|
0.440 | 0.460 | 0.464 | 0.464 |
| Obs | 1080 | 1080 | 1080 | 1080 |
Robustness tests
Endogeneity problem
- We included ERs as the control variable to reduce the impact of omitted variables in our model. The measurement method for ERs is detailed in Appendix Table 9. The regression results after incorporating ERs are presented in M1 of Table 3. Following the research of Bu et al. (2024), we included higher-order joint fixed effects for time and industry, further controlling the influence of time-varying factors at the industry level. The outcomes are summarized in M2 of Table 3.
- Considering the potential interference of reverse causality on our results, we lagged the independent variable by one period for regression (Jiang et al. 2022b). This method enables us to reveal the causal relationship between the variables more accurately, and the regression results are shown in M3 of Table 3.
- We employed a two-step efficient generalized method of moments to address the endogeneity problem better. First, we utilized the average level of DF in neighboring provinces as the first instrumental variable (IV) for
(Jiang et al. 2022a), labeled as Sur_DF, because DF operations generally demonstrate high cross-regional interconnectivity. Thus, the level of DF development and service quality in neighboring provinces may impact the local area. Simultaneously, the level of DF in neighboring regions does not directly impact the GI decisions of local energy enterprises, providing us with an effective IV for reducing the impact of endogeneity. Second, we constructed a Bartik variable as additional IV (Tabellini 2020; Hasan et al. 2020). This variable is calculated as the product of the lagged provincial DF index and the firstorder difference in the national DF index over time, capturing the dynamic changes
| Variable | M1 GI | M2 GI | M3 GI | M4 DF | M5 GI |
| DF | 0.0332*** (3.57) | 0.0254*** (2.76) | 0.0647*** (3.79) | ||
| DF_1 | 0.0284*** (2.92) | ||||
| Sur_DF | 1.0338*** (22.32) | ||||
| Bartik_IV | 0.0020*** (2.87) | ||||
| Constant | 0.6771 (0.04) | 14.8046 (0.78) | -8.4745 (-0.43) | 127.3052 (1.51) | -3.0787 (-0.16) |
| Control | ✓ | ✓ | ✓ | ✓ | ✓ |
| Firm FE | ✓ | ✓ | ✓ | ✓ | ✓ |
| Year FE | ✓ | ✓ | ✓ | ✓ | ✓ |
| Industry × Year FE | ✓ | ||||
| Anderson LM | 155.735*** | ||||
| Cragg-Donald Wald F | 265.700 | ||||
|
|
0.464 | 0.573 | 0.485 | 0.481 | |
| Obs | 1080 | 1080 | 972 | 972 | 972 |
Substitution of the independent variables
Substitution of the dependent variables
Replacement of the model
Other robustness tests
Mechanism analysis
| Variable | M1 | M2 | M3 | M4 | M5 |
| GI | GI | Gl | GI | GI | |
| DF | 0.0345*** | 2.6386*** | 0.1784*** | 0.0354*** | 0.0302*** |
| (3.19) | (3.19) | (3.38) | (3.38) | (3.61) | |
| Constant | 0.8999 | 5.3530 | -18.2045 | 28.3465 | 3.4191 |
| (0.05) | (0.32) | (-0.14) | (1.33) | (0.20) | |
| Control | ✓ | ✓ | ✓ |
|
✓ |
| Firm FE | ✓ | ✓ |
|
|
✓ |
| Year FE | ✓ | ✓ |
|
✓ | ✓ |
|
|
0.467 | 0.463 | 0.486 | 0.490 | |
| Obs | 1070 | 1080 | 1080 | 1080 | 972 |
Threshold effect
Threshold effect test
Analysis of the threshold effect regression results
| Variable | M1 FC | M2 CF | M3 FM | M4 CFI |
| DF | 0.0014*** | 0.7274*** | -0.0025** | -0.0183 |
| (7.39) | (3.56) | (-1.97) | (-0.85) | |
| Constant | -4.0381*** | 519.4478** | 0.9264 | 24.3483 |
| (-12.70) | (2.12) | (0.32) | (0.48) | |
| Control | ✓ | ✓ | ✓ |
|
| Firm FE | ✓ | ✓ | ✓ |
|
| Year FE | ✓ | ✓ | ✓ |
|
|
|
0.988 | 0.879 | 0.592 | 0.850 |
| Obs | 1080 | 1080 | 1080 | 1080 |
| Threshold variables | Single threshold | Double threshold | Threshold value | 95% confidence interval | ||
| F-value |
|
F-value |
|
|||
| IER | 12.76 | 0.027 | 3.24 | 0.707 | 16.9802 | [16.7459, 17.0240] |
| CER | 22.63 | 0.003 | 14.19 | 0.193 | 0.9755 | [0.9731, 0.9761] |
| Variable | M1 | M2 |
| GI | Gl | |
| DF | 0.0314**(IER
|
|
| (2.52) | (3.01) | |
| 0.0247*(IER > 16.9802) | 0.0398***(CER > 0.9755) | |
| (1.97) | (2.77) | |
| Constant | 4.0361 | 7.2842 |
| (0.17) | (0.30) | |
| Control | ✓ | ✓ |
| Firm FE | ✓ | ✓ |
| Year FE | ✓ | ✓ |
|
|
0.0936 | 0.0947 |
| Obs | 1080 | 1080 |
Heterogeneity analysis
Ownership
Enterprise size
| Variable | Ownership | Enterprise size | Marketization level | |||
| M1 | M2 | M3 | M4 | M5 | M6 | |
| SOE | NSOE | LE | SME | HMAR | LMAR | |
| DF | 0.0355*** | 0.0148 | 0.0262*** | 0.0317 | 0.0310** | 0.0323 |
| (3.69) | (1.04) | (2.97) | (1.09) | (2.27) | (1.02) | |
| Constant | 12.4834 | -42.0629 | -3.2788 | -43.9853 | -7.1121 | -21.1086 |
| (0.64) | (-1.13) | (-0.19) | (-0.67) | (-0.19) | (-0.75) | |
| Control | ✓ | ✓ | ✓ | ✓ | ✓ | ✓ |
| Firm FE | ✓ | ✓ | ✓ | ✓ | ✓ |
|
| Year FE | ✓ | ✓ | ✓ | ✓ | ✓ | ✓ |
|
|
0.467 | 0.482 | 0.521 | 0.542 | 0.494 | 0.457 |
| Obs | 900 | 180 | 887 | 193 | 706 | 374 |
Marketization level
Conclusion, policy implications, and limitations
Conclusions
Policy implications
- Given the positive impact of DF on GIs in the energy sector, the government should accelerate the development of DF. Specifically, the government can increase DF coverage by strengthening infrastructure construction and disseminating DF knowledge. It can also deepen the usage of DF by optimizing digital financial products and services and improving the regulatory system. Additionally, the government can enhance digitalization levels by promoting technological innovation and facilitating data sharing and openness. Furthermore, it must encourage DF’s environmental orientation and control and restrain its environmental risks. By formulating and regulating DF businesses’ content, standards, and environmental risks, the government makes DF an effective signal of resource allocation mechanisms in the GI market.
- Our research results indicate that a moderate level of ERs is more conducive to exerting the positive impact of DF on GIs in the energy sector. Therefore, the government should further optimize the existing environmental subsidy mechanism, such as setting subsidy caps and strengthening the supervision of subsidy usage, to prevent rent-seeking behaviors and the misuse of funds effectively. The government can also take measures to ease the pressure on enterprises regarding emission reduction, such as formulating relevant policies that allow enterprises to offset a corresponding proportion of their emission reduction targets with their newly added GIs. Such policies encourage enterprises to increase GIs and lessen their economic burden during emission reduction.
- Given the differences in DF’s impact on GIs in different types of energy enterprises, the government must formulate targeted incentive policies. For example, the government can establish special funds to support state-owned large energy firms in initiating technological innovation and model exploration in DF. At the same time, digital financial service platforms should be developed to provide convenient digital financial services for NSOEs and SMEs, enhancing their GI capabilities. The government also must continue to encourage market-oriented reforms of the energy market, ensuring that the emission reduction costs of energy enterprises are fully reflected in market-based transactions, reducing their cost pressure for emission reduction.
Limitations
Appendix A
See Table 9.
| Type | Variable names | Abbreviations | Calculation | Source | Unit |
| Dependent variable | Green investments | GI | Green investments/total assets × 100 | CAR | % |
| Independent variable | Digital finance | DF | Digital inclusive finance index | Peking University | – |
| Mediating variables | Financing constraints | FC | SA index | CSMAR | – |
| Cash flow | CF | Cash and cash equivalents/
|
CAR | 100 million yuan | |
| Financial mismatch | FM | (Corporate interest rate -industry average interest rate)/industry average interest rate | CSMAR | – | |
| Corporate financialization | CFI | Financial assets/ total assets × 100 | CAR | % | |
| Threshold variables | Market incentivebased environmental regulation | IER | Ln (Environmental governance subsidy + 1) | CAR | – |
| Command-and-control environmental regulation | CER | A comprehensive index of environmental pollution index | CSY | – | |
| Control variables | Enterprise size | ES | Ln (Number of employees) | CAR | – |
| Ownership | OW | If a firm is stateowned, then the variable
|
CSMAR | – | |
| ability | DA | Total liabilities/ total assets × 100 | CAR | % | |
| Cash ratio | CA | Cash and cash equivalents/current liabilities | CAR | – | |
| Board size | BS | Total number of board members | CAR | Persons | |
| Industrial structure | INS | The proportion of tertiary industry in GDP | CEIC | % | |
| Education level | EDU | Ln (Number of undergraduate students) | CEIC | – | |
| Marketization level | MAR | Marketization index provided by NERI | NERI | – |
Abbreviations
| Gls | Green investments |
| DF | Digital finance |
| ERs | Environmental regulations |
| IER | Market incentive-based environmental regulation |
| CER | Command-and-control-based environmental regulation |
| IV | Instrumental variable |
| SOEs | State-owned enterprises |
| NSOEs | Non-state-owned enterprises |
| LEs | Large enterprises |
| SMEs | Small and medium-sized enterprises |
| HMAR | High marketization level |
| LMAR | Low marketization level |
Acknowledgements
Author contributions
Funding
Availability of data and materials
Declarations
Competing interests
Received: 30 January 2024 Accepted: 14 February 2025
Published online: 03 March 2025
References
Bakhsh S, Zhang W, Ali K, Anas M (2023) Can digital financial inclusion facilitate renewable energy consumption? Evidence from nonlinear analysis. Energy Environ. https://doi.org/10.1177/0958305X231204029
Bakhsh S, Zhang W, Ali K, Anas M (2024a) Transition towards environmental sustainability through financial inclusion, and digitalization in China: evidence from novel quantile-on-quantile regression and wavelet coherence approach. Technol Forecast Soc Change 198:123013. https://doi.org/10.1016/j.techfore.2023.123013
Bakhsh S, Zhang W, Ali K, Anas M (2024b) Energy transition and environmental stability prospects for OECD economies: the prominence role of environmental governance, and economic complexity: does the geopolitical risk matter? J Environ Manage 354:120358. https://doi.org/10.1016/j.jenvman.2024.120358
Bakhsh S, Zhang W, Ali K, Oláh J (2024c) Strategy towards sustainable energy transition: the effect of environmental governance, economic complexity and geopolitics. Energy Strategy Rev 52:101330. https://doi.org/10.1016/j.esr. 2024.101330
Cao Y, Liu J, Yu Y, Wei G (2020) Impact of environmental regulation on green growth in China’s manufacturing industrybased on the Malmquist-Luenberger index and the system GMM model. Environ Sci Pollut Res 27:41928-41945. https://doi.org/10.1007/s11356-020-10046-1
Chen Y, Ma Y (2021) Does green investment improve energy firm performance? Energy Policy 153:112252. https://doi. org/10.1016/j.enpol.2021.112252
Chen G, Wei B, Zhu R (2022) The impact of environmental subsidy on the performance of corporate environmental responsibility: evidence from China. Front Environ Sci 10:972328. https://doi.org/10.3389/fenvs.2022.972328
Cheng Z, Kong S (2022) The effect of environmental regulation on green total-factor productivity in China’s industry. Environ IMPACT Assess Rev 94:106757. https://doi.org/10.1016/j.eiar.2022.106757
Chi Y, Hu N, Lu D, Yang Y (2023) Green investment funds and corporate green innovation: from the logic of social value. Energy Econ 119:106532. https://doi.org/10.1016/j.eneco.2023.106532
Dato
Deng J, Liu Y (2022) Does digital finance reduce the employment in the finance industry? Evidence from China FINANCE Res Lett 48:102994. https://doi.org/10.1016/j.frl.2022.102994
Ding Q, Huang J, Chen J (2023) Does digital finance matter for corporate green investment? Evidence from heavily polIuting industries in China. Energy Econ 117:106476. https://doi.org/10.1016/j.eneco.2022.106476
Dong K, Wang J, Ren X (2023) Does Internet development have a spatial fluctuation spillover effect on green total factor productivity in China? A spatial-SAR-ARCH model. Manag Environ Qual Int J 34:741-770. https://doi.org/10.1108/ MEQ-08-2022-0226
Du W, Li M, Wang F (2020) Role of rent-seeking or technological progress in maintaining the monopoly power of energy enterprises: an empirical analysis based on micro-data from China. Energy 202:117763. https://doi.org/10.1016/j. energy.2020.117763
Du K, Cheng Y, Yao X (2021) Environmental regulation, green technology innovation, and industrial structure upgrading: the road to the green transformation of Chinese cities. Energy Econ 98:105247. https://doi.org/10.1016/j.eneco. 2021.105247
Engel-Cox JA, Chapman A (2023) Accomplishments and challenges of metrics for sustainable energy, population, and economics as illustrated through three countries. Front Sustain Energy Policy. https://doi.org/10.3389/fsuep.2023. 1203520
Fan Y, Chen ST (2022) Research on the effects of digital inclusive finance on the efficiency of financial resource allocation. Front Environ Sci 10:957941. https://doi.org/10.3389/fenvs.2022.957941
Ferreira P, Loures L, Nunes J, Brito P (2018) Are renewable energy stocks a possibility to diversify portfolios considering an environmentally friendly approach? The view of DCCA correlation coefficient. Phys -Stat Mech ITS Appl 512:675681. https://doi.org/10.1016/j.physa.2018.08.108
Guo Q, Wu Z, Ding C et al (2023) An empirical analysis of the nexus between digital financial inclusion, industrial structure distortion, and China’s energy intensity. Environ Sci Pollut Res 30:49397-49411. https://doi.org/10.1007/ s11356-023-25323-y
Gupta G, Mahakud J (2019) Alternative measure of financial development and investment-cash flow sensitivity: evidence from an emerging economy. Financ Innov 5:1. https://doi.org/10.1186/s40854-018-0118-9
Hai B, Yin X, Xiong J, Chen J (2022) Could more innovation output bring better financial performance? The role of financial constraints. Financ Innov 8:6. https://doi.org/10.1186/s40854-021-00309-2
Hasan I, Hoi C-K, Wu Q, Zhang H (2020) Is social capital associated with corporate innovation? Evidence from publicly listed firms in the US. J Corp Fin 62:101623. https://doi.org/10.1016/j.jcorpfin.2020.101623
Hassan ST, Batool B, Sadiq M, Zhu B (2022) How do green energy investment, economic policy uncertainty, and natural resources affect greenhouse gas emissions? A Markov-switching equilibrium approach. Environ IMPACT Assess Rev 97:106887. https://doi.org/10.1016/j.eiar.2022.106887
He L, Zhang L, Zhong Z et al (2019) Green credit, renewable energy investment and green economy development: empirical analysis based on 150 listed companies of China. J Clean Prod 208:363-372. https://doi.org/10.1016/j.jclep ro.2018.10.119
Hu W-Q, Zhao J, Zhao L (2023) Does enhancing environmental regulation promote corporate green investment? Evidence from China. Energy Environ 34:3265-3291. https://doi.org/10.1177/0958305X221122931
Huang L, Lei Z (2021) How environmental regulation affect corporate green investment: evidence from China. J Clean Prod 279:123560. https://doi.org/10.1016/j.jclepro.2020.123560
Javeed SA, Latief R, Cai X, San Ong T (2024) Digital finance and corporate green investment: a perspective from institutional investors and environmental regulations. J Clean Prod 446:141367. https://doi.org/10.1016/j.jclepro. 2024. 141367
Jiang S, Liu X, Liu Z et al (2022a) Does green finance promote enterprises’ green technology innovation in China? Front Environ Sci 10:981013. https://doi.org/10.3389/fenvs.2022.981013
Jiang Y, Guo C, Wu Y (2022b) Does digital finance improve the green investment of Chinese listed heavily polluting companies? The perspective of corporate financialization. Environ Sci Pollut Res 29:71047-71063. https://doi.org/10. 1007/s11356-022-20803-z
Jin XM, Mai Y, Cheung AWK (2022) Corporate financialization and fixed investment rate: evidence from China. Finance Res Lett 48:102898. https://doi.org/10.1016/j.frl.2022.102898
Kim B, Kim SW, Park KS (2021) Promoting supplier’s environmental innovation via emission taxation. Int J Prod Econ 240:108240. https://doi.org/10.1016/j.jjpe.2021.108240
Kock N, Lynn GS (2012) Lateral collinearity and misleading results in variance-based SEM: an illustration and recommendations. J Assoc Inf Syst 13:546-580. https://doi.org/10.17705/1jais. 00302
Kong T, Sun R, Sun G, Song Y (2022) Effects of digital finance on green innovation considering information asymmetry: an empirical study based on Chinese listed firms. Emerg Mark Fin Trade 58:4399-4411. https://doi.org/10.1080/15404 96X.2022.2083953
Kou G, Pamucar D, Yuksel S et al (2024) Evaluation of multidimensional carbon neutrality policies in transportation using a novel quantum picture fuzzy rough modeling. IEEE Trans Eng Manag 71:7681-7700. https://doi.org/10.1109/TEM. 2024.3374385
Li G, Zhang R, Feng S, Wang Y (2022a) Digital finance and sustainable development: evidence from environmental inequality in China. Bus Strategy Environ 31:3574-3594. https://doi.org/10.1002/bse. 3105
Li X, Shao X, Chang T, Albu LL (2022b) Does digital finance promote the green innovation of China?s listed companies? Energy Econ 114:106254. https://doi.org/10.1016/j.eneco.2022.106254
Li C, Wang Y, Zhou Z et al (2023a) Digital finance and enterprise financing constraints: structural characteristics and mechanism identification. J Bus Res 165:114074. https://doi.org/10.1016/j.jbusres.2023.114074
Li X, Wang S, Lu X, Guo F (2023b) Quantity or quality? The effect of green finance on enterprise green technology innovation. Eur J Innov Manag. https://doi.org/10.1108/EJIM-03-2023-0208
Liao F, Hu Y, Xu S (2022) How do environmental subsidies affect the environmental performance of heavily polluting enterprises: evidence from China. Econ Res-Ekon Istraz. https://doi.org/10.1080/1331677X.2022.2160777
Lin B, Xie Y (2023a) Positive or negative? R&D subsidies and green technology innovation: evidence from China’s renewable energy industry. Renew Energy 213:148-156. https://doi.org/10.1016/j.renene.2023.06.011
Lin B, Xie Y (2023b) The impact of government subsidies on capacity utilization in the Chinese renewable energy industry: Does technological innovation matter? Appl Energy 352:121959. https://doi.org/10.1016/j.apenergy.2023. 121959
Lin B, Xie Y (2024a) The role of venture capital in determining the total factor productivity of renewable energy enterprises: In the context of government subsidy reduction. Energy Econ 132:107454. https://doi.org/10.1016/j.eneco. 2024.107454
Liu R, He L, Liang X et al (2020) Is there any difference in the impact of economic policy uncertainty on the investment of traditional and renewable energy enterprises? – A comparative study based on regulatory effects. J Clean Prod 255:120102. https://doi.org/10.1016/j.jclepro.2020.120102
Liu J, Wang Z, Zhu W (2021a) Does privatization reform alleviate ownership discrimination? Evidence from the Split-share structure reform in China*. J Corp Fin 66:101848. https://doi.org/10.1016/j.jcorpfin.2020.101848
Liu L, Jiang J, Bian J et al (2021b) Are environmental regulations holding back industrial growth? Evidence from China. J Clean Prod 306:127007. https://doi.org/10.1016/j.jclepro.2021.127007
Liu X, Nie Z, Li B (2022) Financial mismatch and default risk: evidence from chinese nonfinancial listed private enterprises. Emerg Mark Fin Trade 58:852-862. https://doi.org/10.1080/1540496X.2021.1926235
Liu S, Liu H, Chen X (2023) Does environmental regulation promote corporate green investment? Evidence from China’s new environmental protection law. Environ Dev Sustain. https://doi.org/10.1007/s10668-023-03933-3
Muganyi T, Yan L, Yin Y et al (2022) Fintech, regtech, and financial development: evidence from China. Financ Innov 8:29. https://doi.org/10.1186/s40854-021-00313-6
Pan X, Ai B, Li C et al (2019) Dynamic relationship among environmental regulation, technological innovation and energy efficiency based on large scale provincial panel data in China. Technol Forecast Soc Change 144:428-435. https:// doi.org/10.1016/j.techfore.2017.12.012
Pata UK, Yilanci V, Zhang Q, Shah SAR (2022) Does financial development promote renewable energy consumption in the USA? Evidence from the Fourier-wavelet quantile causality test. Renew Energy 196:432-443. https://doi.org/10. 1016/j.renene.2022.07.008
Qu S, Wang J, Li Y, Wang K (2023) How does risk-taking affect the green technology innovation of high-tech enterprises in China: the moderating role of financial mismatch. Environ Sci Pollut Res 30:23747-23763. https://doi.org/10.1007/ s11356-022-23820-0
Razzaq A, Yang X (2023) Digital finance and green growth in China: appraising inclusive digital finance using web crawler technology and big data. Technol Forecast Soc Change 188:122262. https://doi.org/10.1016/j.techfore.2022.122262
Shabir M, Jiang P, Bakhsh S, Zhao Z (2021) Economic policy uncertainty and bank stability: threshold effect of institutional quality and competition. Pac-Basin Fin J 68:101610. https://doi.org/10.1016/j.pacfin.2021.101610
Song M, Wang S, Zhang H (2020) Could environmental regulation and R&D tax incentives affect green product innovation? J Clean Prod 258:120849. https://doi.org/10.1016/j.jclepro.2020.120849
Song H, Li M, Yu K (2021) Big data analytics in digital platforms: how do financial service providers customise supply chain finance? Int J Oper Prod Manag 41:410-435. https://doi.org/10.1108/IJOPM-07-2020-0485
Sun G, Li G, Dilanchiev A, Kazimova A (2023a) Promotion of green financing: role of renewable energy and energy transition in China. Renew Energy 210:769-775. https://doi.org/10.1016/j.renene.2023.04.044
Sun G, Li T, Ai Y, Li Q (2023b) Digital finance and corporate financial fraud. Int Rev Financ Anal 87:102566. https://doi.org/ 10.1016/j.irfa.2023.102566
Ta H, Liu J, Mao J, Wu J (2020) The effects of emission trading system on corporate innovation and productivity-empirical evidence from China’s SO2 emission trading system. Environ Sci Pollut Res 27:21604-21620. https://doi.org/10.1007/ s11356-020-08566-x
Tabellini M (2020) Gifts of the immigrants, woes of the natives: lessons from the age of mass migration. Rev Econ Stud 87:454-486. https://doi.org/10.1093/restud/rdz027
Taghizadeh-Hesary F, Yoshino N (2019) The way to induce private participation in green finance and investment. Finance Res Lett 31:98-103. https://doi.org/10.1016/j.frl.2019.04.016
Tang X, Ding S, Gao X, Zhao T (2022) Can digital finance help increase the value of strategic emerging enterprises? Sustain Cities Soc 81:103829. https://doi.org/10.1016/j.scs.2022.103829
Tong L, JabbourBelgacem CJCSB et al (2022) Role of environmental regulations, green finance, and investment in green technologies in green total factor productivity: empirical evidence from Asian region. J Clean Prod 380:134930. https://doi.org/10.1016/j.jclepro.2022.134930
Wang H, Zhang R (2022) Effects of environmental regulation on CO2 emissions: an empirical analysis of 282 cities in China. Sustain Prod Consum 29:259-272. https://doi.org/10.1016/j.spc.2021.10.016
Wang K, Mi Z, Wei Y-M (2019) Will pollution taxes improve joint ecological and economic efficiency of thermal power industry in China?: A DEA-based materials balance approach. J Ind Ecol 23:389-401. https://doi.org/10.1111/jiec. 12740
Wang Z, Wang N, Hu X, Wang H (2022) Threshold effects of environmental regulation types on green investment by heavily polluting enterprises. Environ Sci Eur 34:26. https://doi.org/10.1186/s12302-022-00606-2
Wang W, Gao P, Wang J (2023) Nexus among digital inclusive finance and carbon neutrality: evidence from companylevel panel data analysis. Resour Policy 80:103201. https://doi.org/10.1016/j.resourpol.2022.103201
Wei Y, Wang L, Zhang H (2023) Digital finance and pollution: firm-level evidence from China. J Glob Inf Manag 31:321183. https://doi.org/10.4018/JGIM. 321183
Wu Y, Huang S (2022) The effects of digital finance and financial constraint on financial performance: firm-level evidence from China’s new energy enterprises. Energy Econ 112:106158. https://doi.org/10.1016/j.eneco.2022.106158
Wu W, Yang S, Li A et al (2024) Does interest rate liberalization affect corporate green investment? Energy Econ 131:107377. https://doi.org/10.1016/j.eneco.2024.107377
Xiao Y, Lin M, Wang L (2024) Impact of green digital finance on sustainable development: evidence from China’s pilot zones. Financ Innov 10:10. https://doi.org/10.1186/s40854-023-00552-9
Xie L, Li Z, Ye X, Jiang Y (2021) Environmental regulation and energy investment structure: empirical evidence from China’s power industry. Technol Forecast Soc CHANGE 167:120690. https://doi.org/10.1016/j.techfore.2021.120690
Yan W, Wang Y, Zheng S et al (2023) Nonlinear impact of the digital inclusive finance on enterprise technological innovation based on the AK Model and PSTR empirical analysis. J Glob Inf Manag 31:320191. https://doi.org/10.4018/JGIM. 320191
Yi R, Wang H, Lyu B, Xia Q (2023) Does venture capital help to promote open innovation practice? Evidence from China. Eur J Innov Manag 26:1-26. https://doi.org/10.1108/EJIM-03-2021-0161
Yu M, Deng X (2021) The inheritance of marketization level and regional human capital accumulation: evidence from China. Finance Res Lett 43:102268. https://doi.org/10.1016/j.frl.2021.102268
Yu M, Tsai F-S, Jin H, Zhang H (2022) Digital finance and renewable energy consumption: evidence from China. Financ Innov 8:58. https://doi.org/10.1186/s40854-022-00362-5
Yu X, Dilanchiev A, Bibi S (2024) Enhancing labor productivity as a key strategy for fostering green economic growth and resource efficiency. HELIYON 10:e24640. https://doi.org/10.1016/j.heliyon.2024.e24640
Zhang DY, Kong Q (2022) Green energy transition and sustainable development of energy firms: an assessment of renewable energy policy. Energy Econ 111:106060. https://doi.org/10.1016/j.eneco.2022.106060
Zhang MM, Wang Q, Zhou D, Ding H (2019) Evaluating uncertain investment decisions in low-carbon transition toward renewable energy. Appl Energy 240:1049-1060. https://doi.org/10.1016/j.apenergy.2019.01.205
Zhang Y, Song Y, Zou H (2022) Non-linear effects of heterogeneous environmental regulations on industrial relocation: do compliance costs work? J Environ Manage 323:116188. https://doi.org/10.1016/j.jenvman.2022.116188
Zhang Z, Wang J, Feng C, Chen X (2023a) Do pilot zones for green finance reform and innovation promote energy savings? Evidence from Chin Energy Econ 124:106763. https://doi.org/10.1016/j.eneco.2023.106763
Zhang Z, Zhang Y, Zhao M et al (2023b) What is the global causality among renewable energy consumption, financial development, and public health? New perspective of mineral energy substitution. Resour Policy 85:104036. https:// doi.org/10.1016/j.resourpol.2023.104036
Zhang W, Bakhsh S, Ali K, Anas M (2024) Fostering environmental sustainability: an analysis of green investment and digital financial inclusion in China using quantile-on-quantile regression and wavelet coherence approach. Gondwana Res 128:69-85. https://doi.org/10.1016/j.gr.2023.10.014
Zhao Y, Su K (2022) Economic policy uncertainty and corporate financialization: evidence from China. Int Rev Financ Anal 82:102182. https://doi.org/10.1016/j.irfa.2022.102182
Zhao Z-Y, Zuo J, Fan L-L, Zillante G (2011) Impacts of renewable energy regulations on the structure of power generation in China – A critical analysis. Renew Energy 36:24-30. https://doi.org/10.1016/j.renene.2010.05.015
Zhong W, Jiang T (2021) Can internet finance alleviate the exclusiveness of traditional finance? evidence from Chinese P2P lending markets. Finance Res Lett 40:101731. https://doi.org/10.1016/j.frl.2020.101731
Publisher’s Note
and -statistics in parentheses and -statistics in parentheses and -statistics in parentheses and -statistics in parentheses and -statistics in parentheses