يعتمد غسيل الكلى لمرض الكلى المزمن (CKD) على أجهزة الوصول الوعائي (VA)، مثل الناسور الشرياني الوريدي (AVF)، والغرسات (AVG)، أو القسطرات، للحفاظ على تدفق الدم. ومع ذلك، فإن تضيق الأوعية الدموية التقدمي غير المتوقع بسبب تكوين النسيج الجديد أو الانسداد الكامل الناتج عن thrombosis الحاد لا يزال السبب الرئيسي لفشل VA الناضجة. على الرغم من جهود التدخل الجراحي العاجل، فإن نقص أداة موثوقة للكشف المبكر يقلل بشكل كبير من نتائج المرضى ومعدلات البقاء على قيد الحياة. تقدم هذه الدراسة جهازًا ناعمًا وقابلًا للارتداء يراقب تدفق الدم باستمرار للكشف المبكر عن فشل VA. باستخدام قياس الحرارة الهوائية، تقيس المستشعرات المدمجة بشكل غير جراحي التغيرات في التدفق في الأوعية الكبيرة. تظهر اختبارات الطاولة مع نماذج AVF وAVG توافقًا مع محاكاة تحليل العناصر المحدودة (FEA)، بينما تظهر التجارب البشرية وتجارب الخنازير قبل السريرية حساسية الجهاز. يمكن أن يمكّن التكيف اللاسلكي من المراقبة في المنزل، مما يحسن الكشف عن مضاعفات VA وزيادة البقاء على قيد الحياة لدى مرضى CKD.
تمثل غسيل الكلى الخيار العلاجي الأكثر شيوعًا لمرض الكلى المزمن (CKD)، حيث تشكل عبئًا صحيًا بقيمة 32 مليار دولار أمريكي يؤثر على حوالي 800 مليون مريض حول العالم.تشمل الممارسة الحالية جلسات فردية في عيادات متخصصة تستمر لمدة 48 ساعة، تتكرر. مرات أسبوعيًا للحفاظ على تصفية الدم و توازن داخلييتطلب المرضى الذين يخضعون لعلاج منتظم تدخلًا جراحيًا لإنشاء وصول وعائي (VA) في الساعد أو الجزء العلوي من الذراع (الشكل 1). يتضمن ذلك إنشاء ناسور (اتصال) بين شريان مختار ووريد قريب لإنشاء ناسور شرياني وريدي (AVF)، أو زراعة أنبوب صناعي بين الشريان و
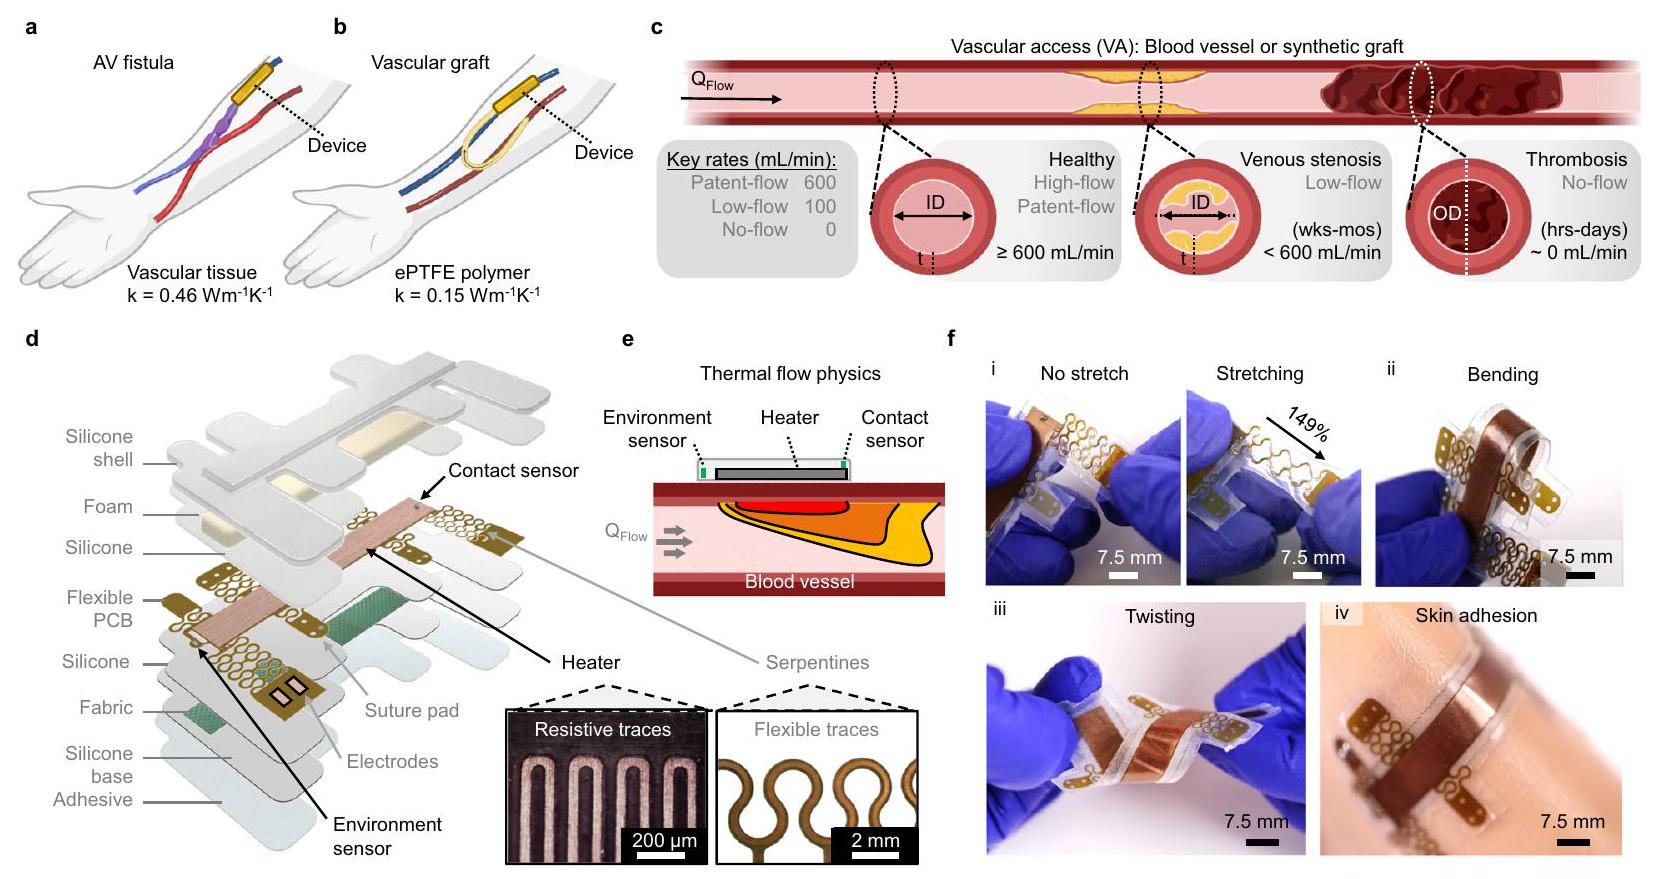
الشكل 1 | مستشعر تدفق حراري قابل للارتداء لاكتشاف تضيق الوصول الوعائي (VA). أ، ب مخطط لناسور VA (أ) وغرسة صناعية (ب) مع الأجهزة المثبتة. ج مخطط لVA صحي وفشل VA بسبب تضيق وريدي مزمن أو تجلط حاد. معدل التدفق الرئيسي ( ) يتم تعريف المصطلحات. عرض مفصل للجهاز المغلف، الذي يحتوي على سخان مزدوج الجوانب مع حساسات حرارية لمراقبة اتصال الجهاز بالأنسجة والظروف البيئية. مكبر بصري تظهر الصور آثار سخانات مقاومة وسادات خياطة مرنة للتطبيق الوعائي المباشر. قضبان القياس،و 2 مم. e مخطط لفيزياء تدفق الحرارة لجهاز الاستشعار الأنيمومتري المقترح. f صور كاميرا للجهاز المرن للاستخدام على الجلد وعلى الأوعية. عروض توضيحية لـ (i) التمدد المتعرج، (ii) الانحناء، (iii) الالتواء، و (iv) الالتصاق المتوافق بالجلد الاصطناعي. شريط القياس، 7.5 مم. وريد لإنشاء ترقيع شرياني وريدي (AVG) (الشكل 1 أ، ب). هذه الوصلة تتيح تدفق ضغط الدم الشرياني العالي إلى الوريد، مما يضمن تدفق الدم الكافي اللازم للوصول إلى غسيل الكلى. سريرياً، تتطلب الشرايين السليمة قطرًا داخليًا (ID)عمق الأنسجة ( ) من (معظمها ) ومعدل تدفق حجمي ( ) من (الشكل 1ج) خلال هذه الدراسة، تم تناول VA الصحية وغير الصحية ذات الأهمية الفسيولوجيةيُعرَف بأنه تدفق براءات الاختراع ( ، تدفق منخفض ودون تدفق (الشكل 1 ج، الجدول التكميلي 1). بشكل محدد، تركز دراساتنا على اكتشاف التغيرات في التدفق تحت هذه الظروف ذات التدفق المفتوح.
تميل الناسور الوريدي إلى أن تدوم لفترة أطول وتكون أقل عرضة للعدوى والتخثر مقارنةً بالطعوم الاصطناعية، لكنها تتطلب شهورًا لتكتمل نضوجها للاستخدام في الغسيل الكلوي.. على العكس، يمكن استخدام الطعوم للغسيل الكلوي خلال أيام من الزرع ولكنها تتطلب مراقبة طويلة الأمد وعمليات مراجعة متكررة. كلا الطريقتين تعانيان من معدلات عالية من العطل والفشل غير المتوقعين المنسوبين إلى تضيق الأوردة.يحدث تضيق الوريد بشكل شائع في الناسور، ويتميز بتضيق الأوعية (التضيق) أو الانسداد الكامل بسبب فرط تنسج البطانة الداخلية والتليف، الذي يتطور على مدى أسابيع إلى أشهر. بالإضافة إلى ذلك، فإن thrombosis، الشائعة مع الطعوم الوعائية، تؤدي إلى انسداد حاد خلال ساعات إلى أيام. لذلك، فإن الكشف المبكر عن فشل الوصول الوريدي أمر حاسم للتدخلات في الوقت المناسب (مثل إزالة الجلطة) لمنع الفشل الدائم. إن عدم وجود أجهزة موثوقة وبسيطة لمراقبة تدفق الدم لتمديد عمر الوصول الوريدي لدى مرضى الفشل الكلوي المزمن الذين يخضعون لغسيل الكلى يمثل حاجة صحية غير ملباة.
التقييم المباشر لتدفق الشرايين الوريدية يمثل المؤشر الأكثر فائدة لتمرير الطعوم/الناسور. لذلك، فإن استخدام جهاز موثوق لقراءات تدفق الدم في الوقت الحقيقي داخل الشرايين الوريدية سيعزز بشكل كبير مستوى الرعاية لهؤلاء المرضى. تشمل الطرق القياسية لتقييم تدفق الشرايين الوريدية الموجات فوق الصوتية، والتخفيف الحراري، والقياس الحجمي، وقياسات ضغط الدم (الجدول التكميلي 2). كانت الأساليب السابقة تتراوح بين أجهزة استشعار بيزوكهربائية/سعوية قابلة للزرع لمراقبة تدفق الطعوم الشريانية الوريدية.أظهرت أجهزة الاستشعار البصرية القابلة للارتداء التي تقيم نفاذية الشرايين البصرية نتائج مختلطة.تقنيات قابلة للزراعة ركز على مفهوم الطعم الذكي، كما يتضح من دراسة حديثة تطور مستشعر بيزوإلكتريك بطول 2 سم يلتف حول السطح الخارجي لطعم PTFE.. ومع ذلك، فإن نتائج الاختبارات خارج الجسم لا تعكس تمامًا التدفق الفسيولوجي المتوقع داخل طعم الشرايين. جهاز غير جراحي آخر قابل للارتداء (Graftworx) يجمع بين قياس التسارع والتصوير الضوئي متعدد القنوات مع خوارزمية خاصة لتقييم صلاحية الطعم، ومستويات الهيموغلوبين، والهيماتوكريت بشكل مستمر في طعم الشرايين.؛ ومع ذلك، فإن هذا الجهاز يفشل في قياس أدناه جهاز استشعار تدفق الأوعية الدموية عالي الحساسية وغير الجراحي القادر على اكتشاف التغيرات في نفاذية الشرايين الوريدية عبر أنظمة التدفق ذات الصلة الفسيولوجية سيؤسس نموذجًا جديدًا في معايير الرعاية لمرضى الغسيل الكلوي.
تقدم الأعمال الأخيرة مع حساسات تدفق الكالوريمتر غير الغازية بديلاً واعدًا للتقنيات السابقة.تطوير مستشعر قائم على قياس السعرات الحرارية في البشرة لظروف تدفق منخفضة للغايةفي مرضى استسقاء الرأس الذين لديهم تحويلات بطينية-صفاقية، يمثل ذلك أول استخدام سريري لأجهزة استشعار حرارية.. ومع ذلك، فإن قياس السعرات الحرارية غير مناسب للبيئات ذات التدفق العالي الموجودة في الشرايين الفموية الصحية نظرًا لحساسيتها المنخفضة عند مستويات عالية.نطاقات الكشف الضيقة، والغموض في تباينات التدفق (استجابة غير أحادية الاتجاه). علاوة على ذلك، تتطلب محاذاة دقيقة للجهاز مع قناة التدفق الخاصة به (مثل الوعاء). بالمقابل، توفر أجهزة الاستشعار الأنيومترية بناءً مبسطًا (سخان ومجس مدمجان) ويمكنها تحمل انحرافات طفيفة ناتجة عن المستخدم.. يجب أن يظهر الجهاز المثالي للكشف عن تضيق الشرايين الفقرية: (1) دقة عالية، (2) زمن استجابة ذي صلة فسيولوجيًا بالدقائق، و(3) حساسية لتدفق ذي صلة فسيولوجيًا. لتلبية هذه المتطلبات في استشعار التدفق، نقدم جهاز استشعار تدفق حراري قابل للارتداء وغير جراحي لمراقبة نفاذية الشرايين الفقرية. يعد الجهاز المعياري المصمم لقياسات الجلد والأوعية، جنبًا إلى جنب مع الاختبار في نموذج حيواني كبير، دراسة لإثبات المفهوم. يتيح تحسين الشكل الهندسي للجهاز استجواب مجموعة واسعة من ( ) في نماذج الطاولة من VAF و VAG. نحن نزيد الحساسية بشكل أكبر لتحقيق ردود فعل فورية في وجود
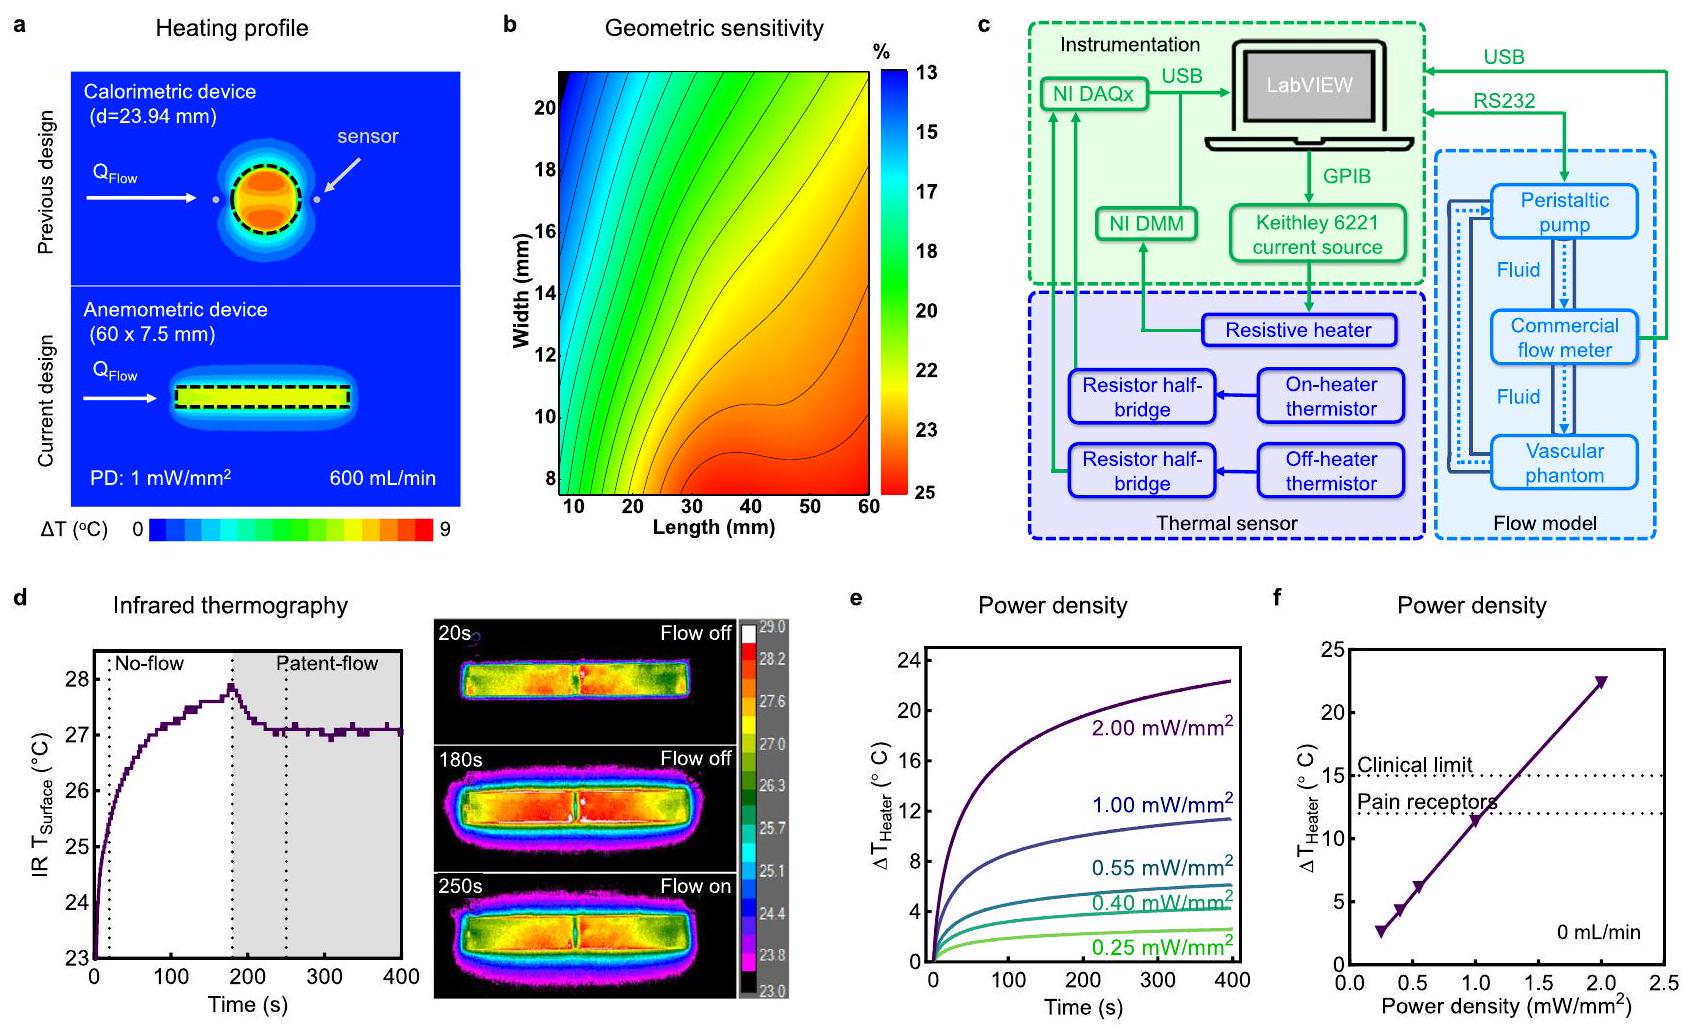
الشكل 2 | تصميم وتوصيف أجهزة استشعار التدفق القابلة للارتداء. أ محاكاة FEA لملفات الحرارة مقارنةً بمستشعر حراري مثبت على البشرة (الأعلى، التصميم السابق) ومستشعر أنيمومتري (الأسفل، التصميم الحالي)، مع مناطق سخانات ثابتة منتُجرى المحاكاة والتجارب تحت ظروف تدفق براءة الاختراع عند سخان PD لـ. محاكاة FEA لحساسية السخان بالنسبة لتعديل طول وعرض السخان. ج مخطط كتلي للأدوات، مستشعر تدفق الحرارة، وتدفق الأوعية على الطاولة.
نموذج في التجارب. د التصوير الحراري بالأشعة تحت الحمراء لتشغيل السخان في ظروف عدم التدفق والتدفق المصرح به. تظهر الصور المختارة تبريدًا صافيًا عند 250 ثانية (تدفق مصرح به) مقارنة بـ 180 ثانية (عدم التدفق). هـ تحليل مسار الوقت لدرجة حرارة السخان في ظروف عدم التدفق عند , و ( تكرارات تقنية). السخان في حالة الاستقرار المقابلة بعد 400 ثانية كدالة لـ PD. تشير الخطوط المنقطة إلى تنشيط مستقبلات الألم وحدود الجرعات السريرية. يتم تقديم البيانات كقيم متوسطة ± SEM. يتم توفير بيانات المصدر كملف بيانات مصدر.
من التغيرات الفسيولوجية الصعبة. تظهر الدراسات الحية القوية اكتشاف تدفق دقيق في الوقت الحقيقي عبر سيناريوهات تدفق مختلفة، بما في ذلك حقن المحاليل الفسيولوجية بواسطة القسطرة مع درجات حرارة متغيرة، مما يخلق نزيفًا وعائيًا يتبعه تجلط، مما يؤدي إلى تضيق وعائي تدريجي وأحداث إعادة تدفق، وظهور تجلط في الوقت الحقيقي.
النتائج
جهاز استشعار قابل للارتداء لاكتشاف التدفق في الوصول الوعائي
تظهر الشكل 1د مخططًا تفصيليًا لتصميم جهاز استشعار تدفق VA. تتكون لوحة الدائرة المطبوعة المرنة (f-PCB) من سخان نحاسي مزدوج الجوانب مع مصدر بوليميد داخلي (PI)، وحساسين من نوع معامل درجة الحرارة السلبية (NTC)، ووسادات خياطة معيارية تتصل عبر ثعابين PI مرنة للتطبيق الوعائي المباشر. يعزز تغليف الإلكترونيات في EcoFlex-30، جنبًا إلى جنب مع طبقة من قماش الألياف الزجاجية الرقيقة جدًا (), المرونة والمتانة الميكانيكية، على التوالي. تلتصق الأجهزة بسطح الأنسجة المختبرة باستخدام لاصق آمن على الجلد من السيليكون/الأكريلات . طبقة من رغوة البولي يوريثين (PU) العازلة (5 مم) وطبقة سيليكون EcoFlex الحد الأدنى موضوعة فوق وتحت f-PCB، على التوالي، لتحسين وتوجيه الموصلية الحرارية (k) نحو الأنسجة. توضح الرسوم ثلاثية الأبعاد Micro-CT الطبقات المختلفة لهذه الأجهزة المغلفة (الشكل التكميلي 1).
نقيس العالية باستخدام مبدأ الأنيمومترية (الشكل 1هـ). يتطلب ذلك استخدام سخان نحاسي مزدوج الجوانب كمنشط لتسخين الجلد وكحساس لقياس درجة حرارة سطح الجلد. نظرًا لأن الدم في الأوعية تحت الجلد يمتص وينقل الطاقة الحرارية، مما يعمل كخزان حرارة، هناك علاقة أحادية بين درجة حرارة سطح الجلد وتدفق الدم، مما يشير إلى أن زيادة التدفق تؤدي إلى انخفاض في درجة حرارة الجلد. بالإضافة إلى ذلك، يتم دمج حساس بيئي لمراقبة التغيرات المحلية في درجات حرارة الدم المار، ويتم دمج حساس اتصال في الجزء العلوي من السخان، نحو حافة الجهاز، لتقييم الاتصال المتوافق وإمكانية الفصل عند واجهة الجهاز والأنسجة. بشكل خاص، يؤدي الاتصال السيئ إلى نقطة ساخنة يمكن لحساس الاتصال اكتشافها بسبب نقص النقل الحراري من السخان إلى مجرى الدم. توضح معالجة الأجهزة المغلفة (الشكل 1و) بدون طبقة رغوة مرونة الجهاز ومرونته، مما يسمح بالالتصاق المتوافق على الأسطح المنحنية والناعمة.
تصميم جهاز استشعار تدفق الأنيمومترية وتوصيفه
يمكن أن يؤدي تحليل العناصر المحدودة (FEA) على نموذج VA إلى تحسين وتوصيف هندسة الجهاز وآلية استشعار التدفق (الشكل 2). يوضح الشكل 2أ مقارنة لملفات درجة الحرارة عند سطح الأنسجة لكل من جهاز دائري (أعلى) بناءً على التصاميم الحرارية السابقة ، والجهاز الأنيمومتري المستطيل (أسفل) المقدم في هذه الدراسة. تمتلك كلا الجهازين نفس مساحة سطح السخان ()، وتتعرض لظروف تدفق مصرح به. يظهر الجهاز الحراري اختلافًا طفيفًا في التوصيل الحراري بين الحساسات العليا والسفلى، على الرغم من التبريد الملحوظ على طول مسار تدفق الدم. نظرًا للاستجابة غير الأحادية لمقاييس الحرارة ، فإن نقص التباين قد يشير إلى ظروف تدفق عالية أو عدم تدفق. بالإضافة إلى ذلك، تعتمد هذه الآلية بشكل كبير على محاذاة الحساسات بدقة على طول مسار التدفق، مما قد يكون من الصعب رؤيته للمرضى ذوي البشرة السميكة. للتغلب على هذه التحديات، نلجأ إلى الأنيمومترية التي تقدم استجابة أحادية قوية للتخفيف الحراري بالنسبة لـ . يتم تعريف حساسية التدفق لجهاز سخان الأنيمومتر أو
حساس الاتصال كدالة لتغير درجة الحرارة في ظل ظروف تدفق منخفضة وصحية، باستخدام المعادلة التالية:
حيث و تمثل حالة الاستقرار بعد 400 ثانية من التسخين عند أو ، على التوالي. توضح خريطة الكنتور لهذه الحساسية في الشكل 2ب تأثير هندسة السخان على الحساسية، المحسوبة باستخدام المعادلة 1. يؤدي تغيير الشكل من سخان دائري إلى مستطيل وإطالته عند مساحة سطح ثابتة () إلى زيادة هذه الحساسية (الشكل التكميلي 2)، حيث يتم توجيه المزيد من الحرارة فوق الوعاء الدموي بدلاً من الأنسجة المحيطة. تكشف محاكاة FEA لأشكال مختلفة عند VA ذات الصلة فسيولوجيًا عن أفضل تأثير لتبديد الحرارة مع سخان ، الهندسة المستخدمة لجميع الأجهزة التجريبية في هذه الدراسة. توضح توزيعات درجة الحرارة في FEA على سطح الجلد وجدار الوعاء الدموي بعد 400 ثانية من التسخين المزيد من مزايا هذه الهندسة (الأشكال التكملية 3 و4).
تظهر قياسات FEA المحلية عبر سطح السخان أعلى حساسية تدفق في أبعد موقع سفلي، والذي اخترناه كموقع لحساس الاتصال لدينا (الشكل التكميلي 5). يظهر هذا المكون اعتمادًا أقوى على اتصال الجهاز والأنسجة مقارنة بالسخان، كما تشير حسابات المقاومة الحرارية، مما يسمح لنا بتمييز بين الالتصاق الجيد والسيئ. تعرض الشكل 2ج والشكل التكميلي 6 نظام مراقبة تدفق الطاولة، بما في ذلك (ط) التحكم في الجهاز بواسطة برنامج LabVIEW مخصص لتزويد تيار مباشر للسخان ومراقبة قيم الجهد والمقاومة المعتمدة على درجة الحرارة، (2) الدوائر الأمامية التناظرية لمكونات الاستشعار الحراري، و(3) نموذج تدفق وعائي على الطاولة يتحكم في من خلال نموذج وعائي وهمي. نحسب عدم اليقين في قياسات درجات الحرارة، الناشئة عن تقلبات إمدادات الطاقة في هذه الأجهزة (الطرق التكملية والجدول التكميلي 3). توضح التصوير الحراري بالأشعة تحت الحمراء (IR) في الشكل 2د تطبيق التيار المباشر والتسخين الناتج عن الجول لسخان على جهاز مثبت بشكل متوافق على جلد وهمي من السيليكون. يضمن أثر مقاوم مستمر، يحل محل مجموعة كثيفة من المقاومات المثبتة على السطح في الأنظمة السابقة، تسخينًا موحدًا مكانيًا ومرونة الجهاز. يؤدي بدء ظروف التدفق المصرح به عند 180 ثانية تحت الجلد إلى انخفاض في درجة حرارة IR السطحية.
تسهل معايرات الجهاز تحويل التغيرات المقاسة في المقاومة من السخان والحساسات إلى قياسات درجة الحرارة (الأشكال التكملية 7-9). يتم تحويل قيم مقاومة السخان إلى درجة حرارة وفقًا لمعامل درجة الحرارة الإيجابي للمقاومة للنحاس (). ترتبط قيم المقاومة المسجلة لكل حساس NTC بدرجة الحرارة وفقًا لمعادلة ستاينهارت-هارت الموسعة:
حيث هي درجة الحرارة، و هي المقاومة المقاسة، و هي المقاومة المرجعية عند ، و، وD هي معاملات التناسب (الشكل التكميلي 9). تتضمن البروتوكول القياسي لكل تجربة تسخين 120 ثانية من التوازن بدون تسخين، 400 ثانية من التسخين، 400 ثانية من عدم التسخين، وتطبيق فلتر تمرير منخفض على جميع البيانات (الأشكال التكملية 10 و11)، مما يضمن دقة التجربة وقابليتها للتكرار. تعرض الشكل 2هـ قياسات السخان عند تطبيق تيار مباشر بكثافة طاقة متغيرة (، و). تظهر ارتفاعات درجة الحرارة في حالة الاستقرار (المعرفة بأنها 400 ثانية، ما لم يُذكر خلاف ذلك) اعتمادًا خطيًا على PD في ظل ظروف عدم التدفق (الشكل 2و). تستخدم التجارب اللاحقة PD من ، مما يضمن أن التسخين الأقصى في ظل ظروف عدم التدفق يبقى أقل من
عتبة تنشيط مستقبلات الألم الحرارية العالية (TRPV2 ) وضمن الحدود الآمنة للأجهزة الجلدية السريرية . تؤكد تداخل درجات حرارة السخان وحساس الاتصال في ظل عدم التدفق، جنبًا إلى جنب مع تقليل الضوضاء الناتجة عن الحمل الحراري، كفاءة العزل الحراري للطبقة الرغوية المدمجة (الشكل التكميلي 12).
تجارب على الطاولة مع جلد وهمي ونماذج AVF
الشكل 3 يحلل تأثيرات مرونة الأوعية، وأبعاد المواد، والجلد على استشعار التدفق الحراري. نموذجين وهميين، يمثلان ناسور الشرايين الوريدية والتطعيم، يتضمنان مستوى عالٍ منوعاء بيوميمي ومنخفضطعم وعائي من ePTFE الطبي، على التوالي (الشكل 3 أ والشكل التكميلي 13). كلا الوعائين محاطان بطبقة جلد بشرية بالغة تحاكي الطبيعة.” )، حيث يتم تركيب الجهاز لاستشعار تدفق الحرارة. يتم تلخيص الخصائص الفيزيائية والحرارية لكل مكون من مكونات نموذج الفانتوم في الجدول التكميلي 4. تم تقديم حساسية التدفق لكل من نماذج الفانتوم على الطاولة في الشكل 3b والشكل التكميلي 14. يتم استشعار التدفق النسبي في حالة الاستقرار (تظهر استجابة ثنائية قوية في كلا النموذجين بين ظروف التدفق المفتوح وعدم التدفق. تُظهر محاكاة العناصر المحدودة توافقًا جيدًا مع هذه القيم التجريبية، مع زيادة الحساسية عند تدفقات ذات صلة بالمرض.في الأوعية البيوميميتية (الشكل 3c). بالإضافة إلى ذلك، تساعد أول 20 ثانية من التسخين في تمييز تأثير توصيل جدار الوعاء، مما يساعد في التمييز بين الناسور عالي التوصيل و الطعم منخفض التوصيل (الشكل التكميلي 15).
بعد ذلك، نستكشف التغييرات في وعاء VA و ID كدالة لإعادة تشكيل الأنسجة (مثل تضيق الوريد الذي يؤدي إلى زيادة سمك الجدار والتضيق). تكشف قياسات كل من التوافق الحيوي والأوعية المأخوذة من الطعوم عن استجابات ثنائية النمط مع زيادة ، مما يتوافق مع زيادة في ضغط السوائل الحيوية (الشكل 3d). يظهر الوعاء البيوميميتي زيادة أحادية كبيرة في القطر الخارجي (OD) وانخفاض فيبينما يظهر وعاء الطعم مرونة محدودة. تكشف محاكاة تحليل العناصر المحدودة لاستجابة السخان تحت تدفق براءة الاختراع (الشكل 3e) عن اعتماد ضئيل على قطر الوعاء ولكن اعتماد قوي على، حيث إن مقاومة التوصيل لجدار الوعاء (أكثر حساسية للأبعاد من مقاومة الحمل المرتبطة بقطر الوعاءتستند اشتقاقات هذه القيم إلى وجود ملف سرعة متطور بالكامل في النظام اللزج.بشكل عام، مرونة أعلى، تقليل“، وزيادة k في الوعاء البيوميميتي فوق الطعوم تحسن بشكل كبير من نقل الحرارة وحساسية التدفق ( مقابل 1%، على التوالي، في الشكل 3c).
لفهم تأثير القياسات عبر الجلد، نقوم بتطبيق طبقة جلدية ( ) للسفن الوهمية تحت ظروف براءة الاختراع الثنائية مع تدفق وعدم تدفق (الشكل 3f والشكل التكميلي 16). تحت ظروف عدم التدفق، تعمل طبقة الجلد المضافة كخزان حراري (انظر الأسهم السوداء). يظهر تحليل الميل بين ظروف عدم التدفق وظروف التدفق أن مقاومة الحرارة من الجلد تقلل الحساسية. عندما يتم زيادة عمق الأنسجة إلى 6 مم، مما يمثل الحد الأقصى لسمك الأنسجة لبراءة اختراع VA، تنخفض الحساسية المعتمدة على التدفق من (الشكل 3ج) إلى (الشكل التكميلي 17). بغض النظر، فإن التغيرات في ترطيب سطح الأنسجة لا تؤثر على نتائجنا، حتى بعد 9 دورات حرارية (الشكل التكميلي 18). ويعزى ذلك إلى الأبعاد الكبيرة للسخانات وأوقات التشغيل المطولة التي تتيح قياسات عميقة للأنسجة ( ) وتخفيف تأثير اختلاف البشرة الموصلية الحرارية. نحن نوضح أيضًا الكشف الموثوق عن الظواهر العابرةالتغيرات تحت ظروف الحالة المستقرة الحرارية (SS) باستخدام عدة جولات تدفق (التناوب بين 600 و ) (الشكل 3g).
تطبيق جهاز استشعار تدفق VA في الجسم الحي
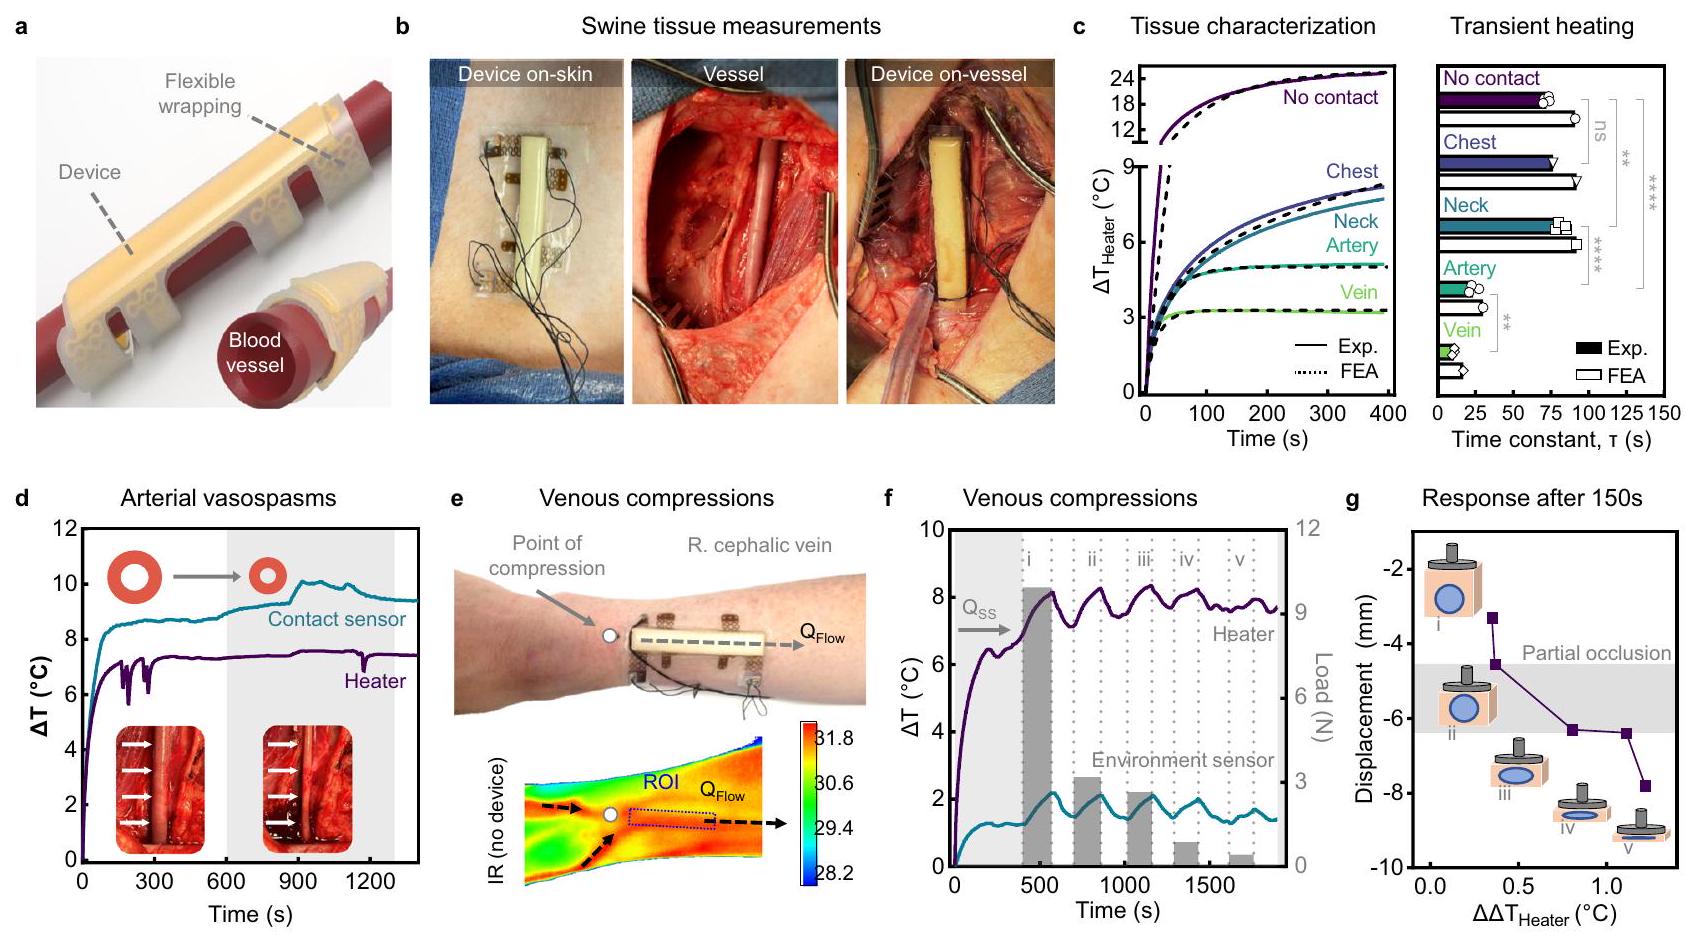
تقدم الدراسات على الحيوانات الكبيرة التي تشمل الخنازير تطابقًا قريبًا مع الأوعية الدموية والفسيولوجيا البشرية.. علاوة على ذلك، تمتلك شرايين الفخذ في الخنازير هندسات مكافئة وديناميات تدفق الدم مشابهة لتلك الموجودة في الناسور البشري (انظر الجدول التكميلي 5). إن عمق الأنسجة الزائدة في شرايين الفخذ لدينا ومع ذلك، يتطلب ذلك على متن السفينة
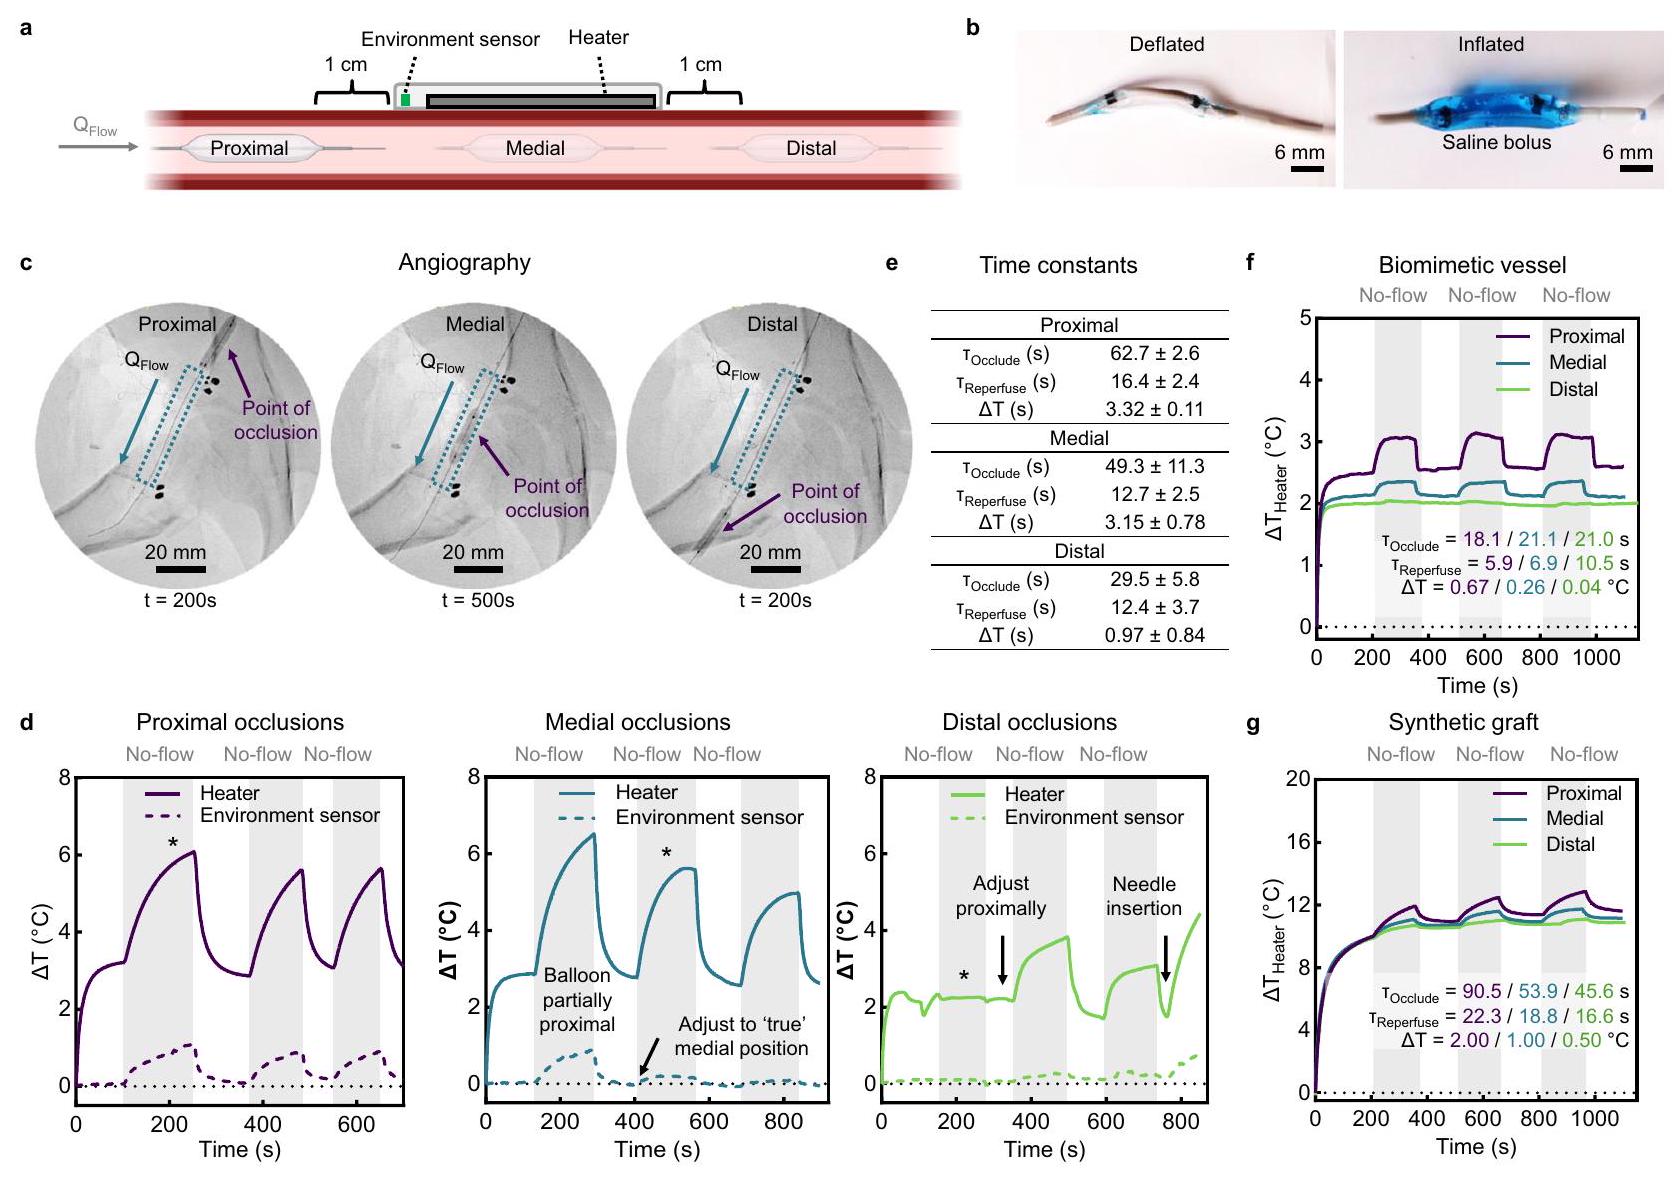
الشكل 4 | تطبيق الجهاز ومراقبته في الخنازير. أ صورة توضح لف الجهاز بشكل متوافق حول الأوعية الدموية المنحنية باستخدام لفائف مرنة. ب صور كاميرا توضح تطبيق جهاز محاط على الجلد (يسار)، والشريان الفخذي المكشوف في خنزير قبل تطبيق الجهاز (وسط)، وبعد تثبيت الجهاز على الشريان الفخذي (يمين). ج القياسات الحرارية (يسار) وثوابت الزمن (يمين) مع عدم الاتصال، والصدر، والعنق، والأنسجة الشريانية والوريدية موضحة للبيانات التجريبية ومحاكاة العناصر المحدودة. ثابت الزمنيُعرَّف بأنه الوقت المنقضي عندما يكون هناك تغير في حالة السخانيصلمن (لا تواصل ورقبةالتكرارات الفنية، الصدرالتكرارات الفنية، الوريد والشريانالتكرارات الفنية، التي تم جمعها لاثنين من الخنازير باستثناء قياسات الصدر). د قياسات الجهاز قبل وأثناء (المظلل) التشنجات الوعائية. الصورة المرفقة تظهر الشريان الفخذي قبل وأثناء الانقباض. هـ-ز على الجسم عرض تدفق الدم المتنوع باستخدام جهاز ملتصق على البشرة فوق الوريد السباتي. صورة الكاميرا (e) للذراع مع الجهاز المثبت وصورة الأشعة تحت الحمراء المقابلة لدرجات حرارة سطح الجلد تحت نفس ظروف العلاج بدون الجهاز. تم الإشارة إلى نقطة الضغط على بعد 1 سم من الجهاز واتجاه تدفق الدم. قياسات حرارية على مدى الزمن (f) مع السخان ومستشعر البيئة تظهر التسخين إلىأكثر من 400 ثانية، تليها انسدادات يدوية وأحداث إعادة تدفق لمدة 150 ثانية لكل منها. يتم رسم الأحمال الضاغطة المتغيرة على المحور الأيمن. يتم الإبلاغ عن الاستجابة كتغيير في السخان.بعد كل 150 ثانية من الضغط الوريدي (ج) مع منطقة الانسداد الجزئي المشار إليها (المظللة). تشغيل الجهاز عندتُعرض البيانات كقيم متوسطةSEM.تحليل التباين الأحادي العادي مع اختبار Šídák بعد التحليل للمقارنات الزوجية. يتم توفير بيانات المصدر كملف بيانات مصدر. التوصيل الحراري. إعادة التروية عند 240 ثانية تسبب انخفاضًا كبيرًا في درجة الحرارة يتماشى مع استعادة تدفق الدم.
تقييم تقلبات البيئة على استشعار التدفق
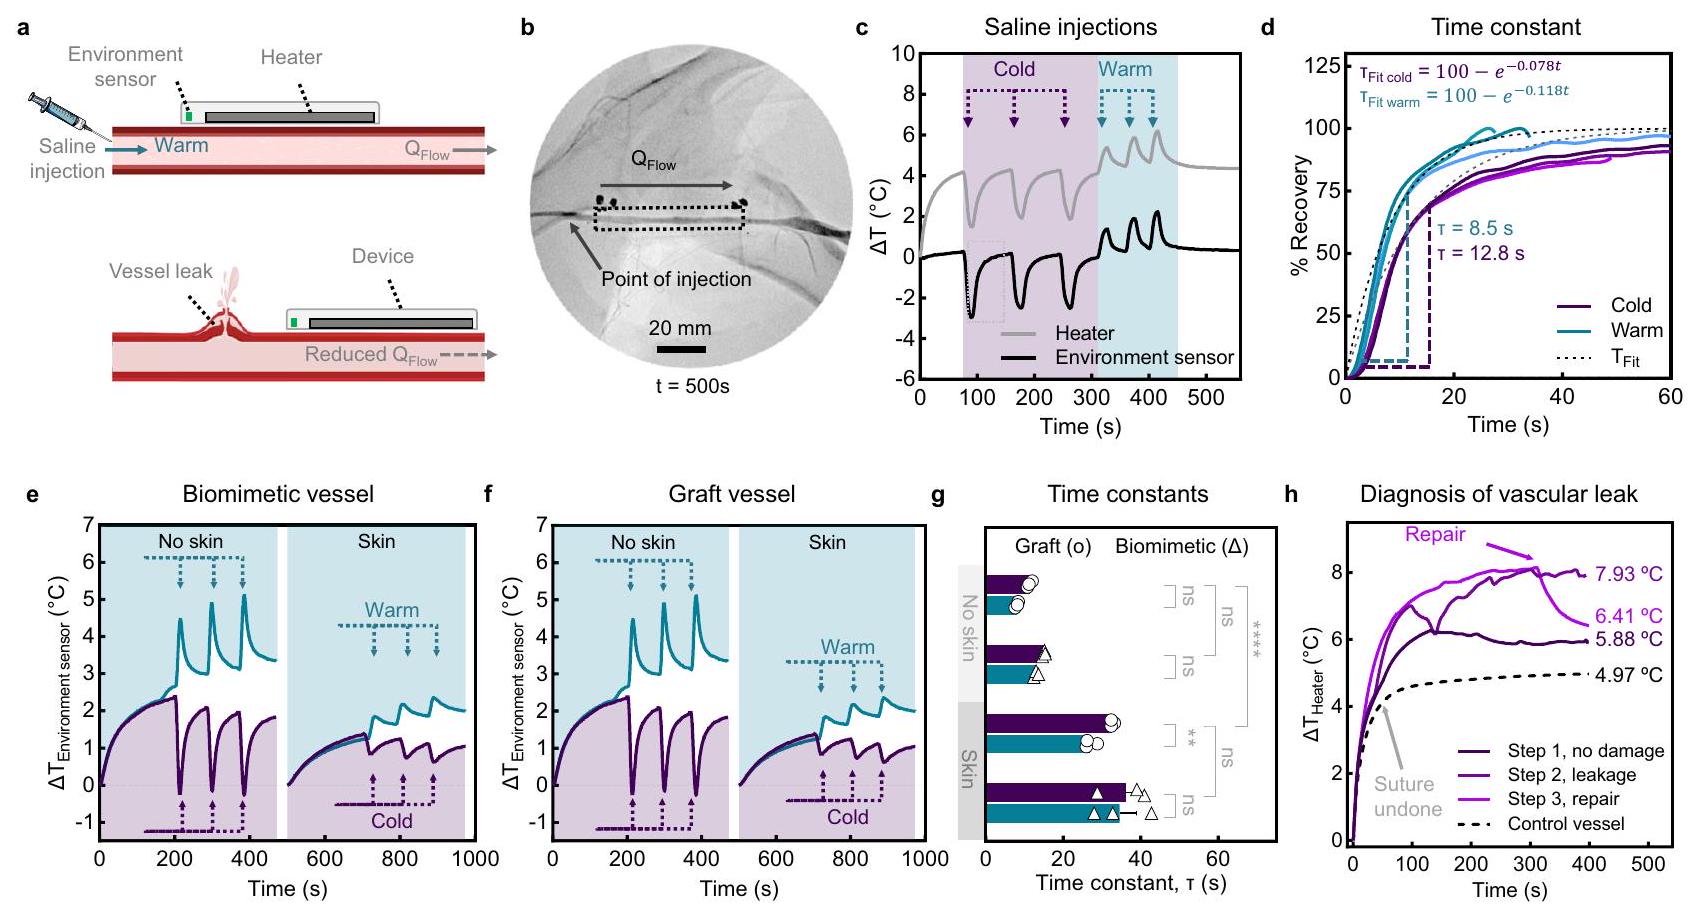
بعد ذلك، نحقق في حساسية الجهاز للتقلبات السريعة والمحلية في درجة حرارة الدم وتدفقه القريب من الجهاز (الشكل 5). حقنات متتالية من البرد في المنطقة القريبة من الجهاز ) ودافئ ( تظهر حقن المحاليل الملحية في تجويف الشريان من طرف قسطرة تصوير الأوعية الموضوعة بالقرب من موقع القياس تغييرًا فوريًا في درجات حرارة السخان والمستشعر، يتبعه استعادة درجات حرارة سطح الوعاء.إلى قيم الحالة المستقرة (الشكل 5ب، ج). يعطي التناسب الأسي لملفات الاسترداد من مستشعر البيئة المفصول (الشكل 5د والشكل التكميلية 28) ثوابت زمنية لمدة 8.5 ثانية و 12.8 ثانية للحقن الدافئ والبارد، على التوالي. يكشف نموذج الطاولة للوعاء البيوميميتي والطعم الاصطناعي (الشكل 5e، f)، مع أو بدون طبقة جلدية، عن اتجاهات مماثلة للحقن الدافئ ( ) وبارد حقن ملحية. ومن الجدير بالذكر أن الثوابت الزمنية للسفينة البيوميميتية ( و تتطابق بشكل وثيق مع نموذج الخنازير (الشكل 5g). يؤخر التشتت الحراري من خلال الجلد أوقات الاستجابة بمعدل يقارب ثلاثة أضعاف عند تطبيق الجهاز على الجلد. نلاحظ اتجاهات مماثلة مع نموذج الطعوم ذات الكفاءة المنخفضة. تم استبعاد انحراف الخط الأساسي من خلال قياسات درجات حرارة الغرفة المحيطة، والسوائل الحيوية المتداولة، والمحلول الملحي (الشكل التكميلية 29). علاوة على ذلك، تكشف الاختبارات الموازية مع الأجهزة على الأوعية الضابطة (مثل الوريد الوداجي المجاور والأوعية الفرعية على الطاولة) أن تأثيرات تدفق الدم المجاورة لا تؤثر على القياسات المحلية (الشكل التكميلية 30). بعد ذلك، نستجوب استجابة الجهاز للتغيرات الحادة في تدفق الدم على نموذج للنزيف الوعائي وإعادة التروية كتطبيق متقدم (الشكل 5 أ و هـ). سخان في حالة مستقرةزيادة من (الخطوة 1) تحت ظروف تدفق براءة الاختراع إلى (الخطوة 2) عند إزالة الغرز . لم يتم اكتشاف هذا التغيير الدراماتيكي بواسطة مستشعر البيئة (الشكل التكميلي 31)، مما يظهر أن إمداد الدم، وليس درجة حرارته، هو ما يتغير خلال الخطوة 2. عند إصلاح الوريد (الخطوة 3، 310 ثانية)، السخانتنخفض بسرعة عند إعادة استعادة تدفق الدم. تؤكد هذه الدراسات حساسية جهازنا للتغيرات المحلية في درجة حرارة الدم تحت ظروف إصابة الأوعية الدموية، بغض النظر عن نوع الوعاء أو وجود حاجز جلدي. وهذا يشير إلى أن تقنيتنا قد تكون مفيدة سريرياً للكشف الفوري عن النزيف الداخلي.
تقييم قدرة الجهاز على استشعار التدفق في نموذج خنازير لانسداد الأوعية الدموية
نقوم بتوصيل قسطرة بالون عبر الجلد داخل الشريان الفخذي العام لمحاكاة تغييرات هيموديناميكية كبيرة أثناء تضخم البالون المتغير مما يخلق تضيقًا أو انسدادًا كاملًا (الشكل 6). يتم تصور تضخم البالون في المواقع القريبة والوسطى والبعيدة بالنسبة لموقع الجهاز (الشكل 6أ، ب) باستخدام تصوير الأوعية الرقمية (الشكل 6ج) وقياسات تصوير الموجات فوق الصوتية دوبلر (الشكل التكميلي 32). تكشف تشغيل الجهاز أثناء انسدادات متتالية (تضخم البالون) وإعادة التروية (تفريغ البالون) ( كل) (الشكل 6د) عن استجابات تعتمد على الموقع. في الموقع القريب، يؤدي تضخم البالون الوعائي إلى ارتفاع سريع في قيم مستشعر السخان والبيئة . يتسبب الانسداد في الموقع الأوسط في انخفاض الإشارة من البيئة
الشكل 5 | تقييم في الجسم للتغيرات السريعة في درجة الحرارة المحلية في الدم. أ توضيحات تخطيطية توضح الاضطرابات المحلية في درجة حرارة الدم المتدفقة والإمداد، من خلال حقن محلول ملحي وتمزقات وعائية، على التوالي. تحدث الحقن بمقدار 30 مل من محلول ملحي بارد ودافئ في الشريان بالقرب من الجهاز المثبت. تصوير الأوعية للشريان غير المسدود مع الجهاز المثبت، ونقطة الحقن، واتجاه التدفق موضح. ج استشعار التدفق في الجسم واستجابة سريعة للحقن المتتالية. د ملفات استرداد النسبة لحقن المحلول الملحي البارد والدافئ تم ملاءمتها بشكل أسي للحصول على ثوابت زمنية تبلغ 12.8 ثانية و8.5 ثانية، على التوالي، للوصول إلى ظروف شبه مستقرة تعرف بأنها من . هـ نمذجة على الطاولة لحقن المحلول الملحي البارد ( ) أو الدافئ ( ) عبر وعاء بيوميمتيك في تدفق مفتوح بدون وبدون طبقة جلدية بيوميمتيك. البيانات المقابلة مع طعم صناعي. ثوابت زمنية للوح ( ) ( تكرارات فنية ثلاث مرات لكل نماذج وعائية). ح بيانات مسار الزمن لفقدان الدم الوريدي وإصلاح خنزير (هـ). الوريد الوداجي يظهر اختلافات في الاستشعار تحت (الخطوة 1) عدم وجود ضرر، (الخطوة 2) تسرب بعد إزالة الغرز، و(الخطوة 3) الإصلاح من خلال ظروف إغلاق وريدي. يظهر الاستشعار المتزامن للوعاء الضابط غير المتضرر خلال الخطوة 2 عدم وجود استجابة نظامية. PD للجهاز هو لجميع التجارب. يتم تقديم البيانات كقيم متوسطة SEM. , . تحليل التباين ثنائي الاتجاه مع اختبار Šídák بعد ذلك للمقارنات الزوجية بين الحقن الدافئة والباردة في كل نموذج شبح. يتم تطبيق اختبار Tukey بعد ذلك للمقارنات بين الطعم والوعاء البيوميمتيك، مع وبدون طبقة جلدية. يتم توفير بيانات المصدر كملف بيانات مصدر.
المستشعر كحركة دم غير مسدودة تتسبب في تبريد المستشعر. إعادة التمركز من موقع قريب قليلاً إلى موقع وسطي خلال تكرار الدورة الثانية أظهر بشكل أفضل هذه الظاهرة. الانسدادات البعيدة أقل وضوحًا والتي نعزوها إلى التدفق المتبقي عبر الدورة الجانبية. تعكس التعديلات الطفيفة في الموقع المساهمات المتغيرة للشرايين المتفرعة في التروية المحلية، كما يتضح من ملفات الاستجابة المعدلة خلال كل حدث انسداد بعيد. بشكل عام، نلاحظ اتجاهًا نحو انخفاض الثوابت الزمنية للانسدادات ( ) وحرارة حيث ينتقل موقع التضيق من موقع قريب إلى موقع بعيد (الشكل 6هـ). تظهر القياسات الضابطة على وعاء مجاور غير مسدود عدم وجود اعتماد على المدى الطويل (الشكل التكميلي 33).
للتحقق من النتائج من دراسات الخنازير، نقوم بإنشاء تضيق مشابه في الأوعية البيوميمتيك والطعم (الشكل 6و، ز والشكل التكميلي 34). من المهم ملاحظة أن هذه النماذج لا تعيد إنتاج الضغط الإيجابي في الأوعية الدموية الشبيهة بالبشر. في غياب التدفق أثناء الانسدادات القريبة، ينهار الوعاء البيوميمتيك الناعم ويفقد الاتصال بالجهاز. استجابة ثنائية النمط مع مستشعر البيئة توضح ذلك بسبب تفريغ الوعاء التدريجي أثناء الانسدادات القريبة، تليها قفزة بيانات عندما يعيد الوعاء التضخم مع التدفق (الشكل التكميلي 35). للحفاظ على ضغط سائل إيجابي، يتم إجراء انسدادات جزئية فقط ( ) للوعاء البيوميمتيك في الشكل 6و. تمتلك أوعية الطعم الاصطناعية معامل مرونة أعلى وبالتالي لا تتعرض لهذا الانهيار. بشكل عام، نلاحظ اتجاهات مشابهة لبيانات في الجسم، مع كون حجم الاستجابة هو الأعلى والأدنى للانسدادات القريبة والبعيدة، على التوالي. تظهر بيانات الأوعية في الجسم والخنازير وبيانات الأوعية على الطاولة اعتمادًا قويًا على موقع انسداد الأوعية بالنسبة للثوابت الزمنية.
الكشف في الوقت الحقيقي عن انسداد الأوعية وملاءمة الجهاز القابل للارتداء
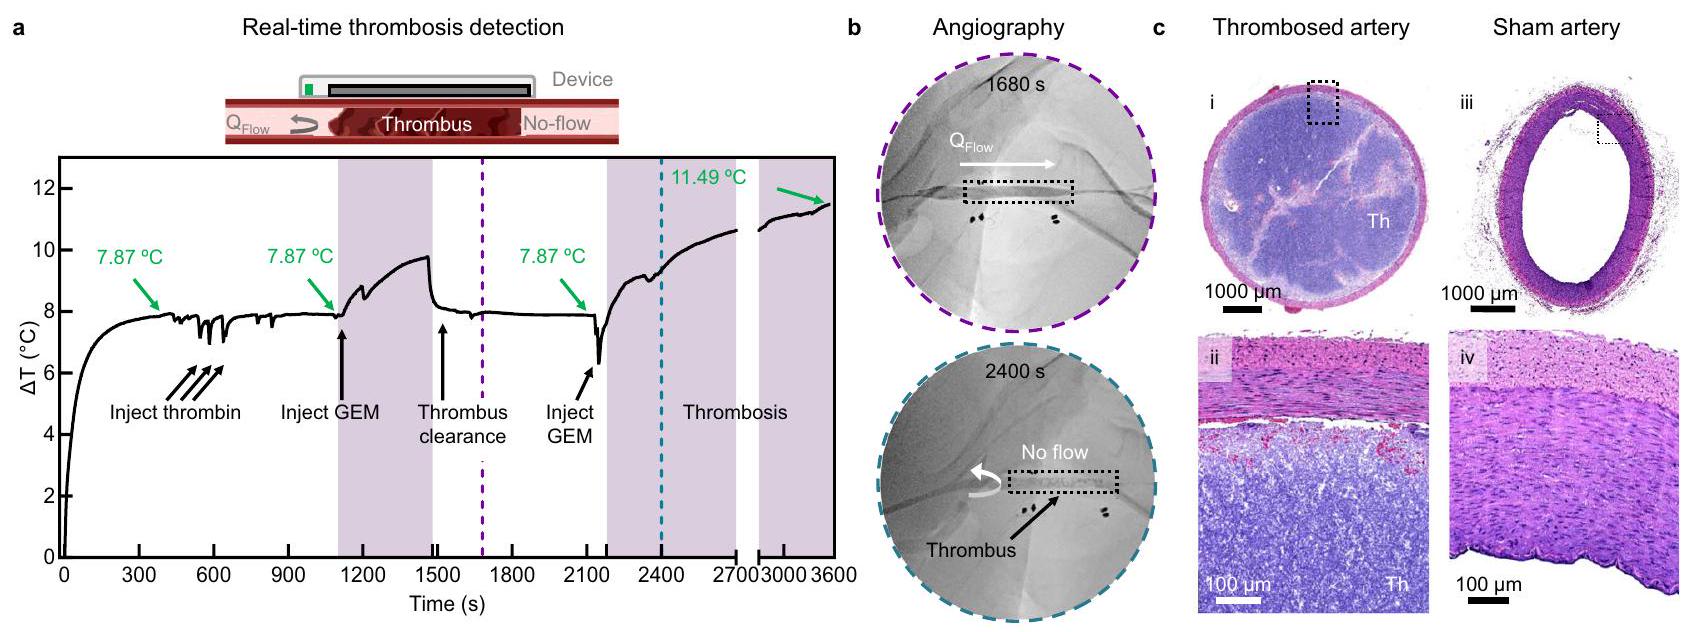
العرض النهائي لقدرات جهازنا هو الكشف في الوقت الحقيقي عن التخثر، وهو أكثر أنماط فشل VA شيوعًا وغير المتوقع في المرضى الذين يتلقون غسيل الكلى (الشكل 7). نقوم بتحفيز انسداد وعائي حاد داخل جزء من الشريان الفخذي باستخدام نهج قسطرة موجهة داخل الأوعية دقيق التوغل. كانت الحقن الأولية مع الثومبين غير ناجحة في توليد خثرة، على الأرجح بسبب الهيبارين المضاد للتخثر المتداول في مجرى الدم. تحفز الحقن اللاحقة لمادة جل embolic (GEM، Obsidio ) الوعاء تشكيل الخثرة في الشريان (الشكل التكميلي 36). بعد التوازن (300 ثانية)، يقوم الجهاز بالكشف عن الحقن، والتخثر، وأحداث إعادة التروية (الشكل 7أ). نلاحظ أن إشارة السخان ترتد بدقة إلى درجات حرارة التدفق قبل الانسداد عند إزالة المادة embolic باستخدام قسطرة شفط. تولد إعادة حقن GEM خثرة كاملة وزيادة سريعة في إشارة السخان. توثق الصور الشعاعية المرتبطة عند 1680 ثانية و2400 ثانية الموقع الوعائي غير المسدود (تدفق مفتوح) في البداية والموقع المسدود لاحقًا (عدم التدفق)، على التوالي (الشكل 7ب والشكل التكميلي 2-3).
أخيرًا، نقوم بتقييم ملاءمة أجهزة استشعار التدفق الحراري لدينا. تسمح إرشادات سلامة FDA بزيادة درجات الحرارة المحلية عند واجهة الجلد والجهاز تصل إلى ، مما يتوافق مع زيادة قدرها فوق درجة حرارة الجلد الطبيعية . تظهر قياساتنا في الجسم زيادة قدرها أثناء التشغيل العادي للجهاز على الأنسجة مع تدفق دم تحتها، والتي لا تتجاوز إرشادات الحد السريري IEC للأجهزة التي تتصل بالأنسجة . علاوة على ذلك، تظهر التقييمات النسيجية للأنسجة المحصودة عدم وجود تغيير ملحوظ
الشكل 6 | تقييم في الجسم لتدفق الوسيط بواسطة انسدادات قسطرة البالون. أ توضيح تخطيطي يوضح الانسدادات المحلية في المواقع القريبة والوسطى والبعيدة عن جهاز استشعار التدفق. ب صور لقسطرة البالون المنفوخة والمفرغة. ج-هـ انسدادات شريانية في الجسم وأحداث إعادة التروية في نموذج خنزير. ج تصوير الأوعية للانسدادات في المواقع القريبة والوسطى والبعيدة عن الجهاز المثبت. تم الإشارة إلى نقطة الانسداد واتجاه التدفق بالأسهم. د استشعار التدفق في الوقت الحقيقي أثناء انسدادات متتالية (عدم التدفق) وإعادة التروية (تدفق مفتوح) في كل موقع ( تكرار فني تم قياسه ثلاث مرات). تشير النجوم (*) إلى الوقت الذي تم فيه تسجيل الصور الشعاعية في (ج). هـ. جدول يلخص
الثوابت الزمنية للانسداد ( )، إعادة التروية ( )، واستجابة السخان للانسداد ( تكرارات فنية، متوسط ± SD). و، ز استشعار التدفق في الوقت الحقيقي أثناء انسدادات متتالية ( للبيوميمتيك مقابل للطعم) وأحداث إعادة التروية (تدفق مفتوح) مع الوعاء البيوميمتيك (و) والطعم الوعائي (ز) في كل موقع ( تكرارات فنية تم قياسها ثلاث مرات). تلخص بيانات الإدراج الثوابت الزمنية لـ ، وحرارة بعد الانسداد في كل موقع. PD هو لجميع التجارب. يتم تقديم البيانات كقيم متوسطة SEM. يتم توفير بيانات المصدر كملف بيانات مصدر.
في الوعاء أو شكل الجلد، على الرغم من التنشيط المستمر (الشكل 7ج والأشكال التكملية 37-38).
المناقشة
تظهر هذه الدراسة جهاز استشعار تدفق حراري يراقب بدقة التغيرات الديناميكية الدموية في الوصول الوعائي الذي لوحظ في مرضى الفشل الكلوي المزمن الذين يتلقون غسيل الكلى، بما في ذلك فترة الاستجابة التكيفية خلال نضوج الناسور الشرياني الوريدي، تضيق الأوعية، الأحداث التخثرية الحادة، أو الفشل الكامل. مقارنةً بالتقارير السابقة، يظهر جهازنا استجابة أحادية الاتجاه لتغيرات التدفق مع زيادة الحساسية كدالة لتضيق الأوعية. من خلال نمذجة شاملة تعتمد على التدفق لكل من الناسورات والطعوم، نوضح كيف تؤثر مادة الوعاء والهندسة على حساسية الجهاز. نتخيل أن هذه المنصة ستراقب تضيق الأوردة التدريجي في الناسور أو ظهور التخثر السريع في الطعم، وكلاهما من الأوضاع السريرية الرئيسية لفشل الوصول الوعائي الانسدادي. من الناحية المثالية، يمكن لجهاز استشعار تدفق حراري قابل للارتداء اكتشاف المشكلات في المنزل أو في بيئة سريرية عامة، مثل أثناء غسيل الكلى. يحدد المراقبة المباشرة لتطبيع درجة الحرارة خلال التدابير التصحيحية معيارًا جديدًا للرعاية لمرضى غسيل الكلى في العيادة وفي المنزل. من الناحية النظرية، يمكن أن تجد هذه المنصة الحساسة تطبيقات للمستخدمين التاليين: (1) المرضى الذين يشاركون في الرعاية الذاتية لتحديد وإخراج جلطة تتشكل يدويًا دون الحاجة إلى جراحة طارئة، (2) الجراحون الذين يصلحون تمزقًا أو يزيلون جلطة، و/أو (3) العاملون في الرعاية الصحية المكلفون بمنع تسرب الدم أثناء علاج الغسيل الكلوي.
القيود
كما تشير القياسات التجريبية ونتائج المحاكاة، فإن منحنيات درجة الحرارة تعتمد بشكل ضعيف نسبيًا على معدل التدفق في نظام التدفق العالي. وبالتالي، من الناحية العملية، قد يكون الخطأ التجريبي الناتج عن التقلبات البيئية أو أشكال الضوضاء الأخرى كبيرًا في مثل هذه الحالات. إحدى الطرق المستقبلية للاستكشاف تستغل أجهزة استشعار التدفق المتكاملة والمتجاورة، للسماح بالقياسات التفاضلية، مع تقليل الحساسية للضوضاء. اعتبار آخر في الاستخدام العملي هو أن القياسات المستمرة لفترات طويلة قد تؤدي إلى آثار سلبية للتسخين التراكمي. نظرًا لأن التغيرات السريعة في التدفق غير متوقعة، في الممارسة العملية، ستتم القياسات في وضع دورة عمل منخفضة، ربما مرة كل ساعتين. بهذه الطريقة، يمكن تجاهل التسخين التراكمي. بدلاً من ذلك، يمكن تحسين دقة القياس باستخدام التبريد بدلاً من التسخين، ببساطة لأن التغيرات العتبية في درجة الحرارة لتفعيل مستقبلات الألم أكبر للتبريد.
ستستخدم النسخ المستقبلية من هذا الجهاز تفعيلًا نبضيًا وضغطًا منخفضًا لتقليل استهلاك الطاقة وتغيير درجة الحرارة الكلي بشكل أكبر. يمكن أن تمنع دمج تغذية راجعة من المستشعرات في حلقة مغلقة التفعيل المفرط في ظروف عدم التدفق وتمكن من التفعيل العابر.
الشكل 7 | الكشف الحي عن انسداد الشريان الفخذي في نموذج خنزير. رسم تخطيطي لتصوير انسداد وعائي كامل بسبب التخثر في وعاء دموي مثبت في جهاز. تمثيل لقياس تدفق الحرارة في الوقت الحقيقي قبل وبعد انسداد الأوعية الدموية بواسطة القسطرة باستخدام مادة جل embolic (GEM) لمحاكاة التخثر.الحيوانات).صور الأوعية الدموية الرقمية المأخوذة عند 1680 ثانية و2400 ثانية، تظهر تدفقًا مفتوحًا عند 1680 ثانية وعدم تدفق عند 2400 ثانية. التدفق يتم تصوير جهاز الاستشعار بخطوط متقطعة وألواح أقطاب داكنة، وموقع الجلطة موضح بسهم أسود، واتجاه التدفق موضح بسهم أبيض. ج صور مجهرية تمثيلية لشرائح الهستولوجيا للشريان الفخذي المسدود والشاهد عند تكبير منخفض (i، ii) وعالي (iii، iv) (الحيوانات). يتم الإشارة إلى الدم المتخثر بـ Th. الـ PD هومقاييس، 100 أوتُقدم بيانات المصدر كملف بيانات مصدر. تحت التدفق. ستعتمد هذه الأجهزة على المعلومات من مستشعرات الاتصال والبيئة لتحديد ما إذا كانت التعديلات الفيزيائية للجهاز الملتصق أو إعادة معايرة درجات حرارة الأنسجة الأساسية ضرورية، قبل إجراء قياسات التدفق. بالنسبة للتطبيقات القابلة للارتداء فقط، حيث لا يكون تركيب الأوعية ضروريًا، يمكننا تقليل حجم جهازنا الحالي بشكل كبير من خلال إزالة وسادات الخياطة/الأقطاب المعلقة. ستركز جهود التصغير الإضافية على زيادة مرونة جهاز flexPCB من خلال تقسيم أقسام السخان وأقسام التثبيت باستخدام لولبيات مرنة لتمكين التصاق الجهاز على الأوعية المتعرجة. سيكون تقصير طول السخان الكلي مفيدًا أيضًا في السيناريوهات التي تتفاوت فيها أعماق الأنسجة السطحية على طول الوعاء. نتخيل جهازًا قابلًا للارتداء بدون أسلاك يقيس باستمرار نفاذية الأوعية الدموية مستفيدًا من مكونات تجارية منخفضة التكلفة (بطارية ليثيوم أيون قابلة لإعادة الشحن، دوائر إدارة الطاقة المتكاملة، واجهة تماثلية، ودائرة تحكم نشطة لمكونات المحرك في الدائرة) ودمج بنية نظام بلوتوث منخفض الطاقة (BLE) للسماح بنقل البيانات بسلاسة أثناء الأنشطة اليومية للمستخدم.
طرق
تصنيع مستشعر تدفق الحرارة
فيلم مركب من طبقات النحاس/البولي أميد/النحاس، Pyralux AP8535R، شركة دو بونت) عملت كركيزة لجهاز استشعار VA. تم معالجة الفيلم بواسطة ليزر فوق بنفسجي (Protolaser U4، LPKF) من خلال إزالة طبقات النحاس، مما نمط المسارات، وألواح الربط، والفتحات غير المطلية. مقسم نحاسي هيكليتم دمجه داخل مركز المحرك لأخذ في الاعتبار مجالات المسح المتداخلة. تم غسل متتابع في سائل التدفق المصنوع من الفولاذ المقاوم للصدأ (Worthington Inc)، والماء المقطر، والإيزوبروبانول (Fisher Scientific) لتحضير لوحة الدوائر المطبوعة المرنة (fPCB) لتجميع المكونات عن طريق إزالة الأكسيدات السطحية المتبقية. تم إنشاء اتصال كهربائي موصل من خلال ثقوب التوصيل بين طبقات النحاس في fPCB باستخدام سلك مرن رفيع (36 AWG Copper Stranded Wire، Calmont Inc.). ربطت مادة لاصقة غير موصلة (Loctite 3621، Henkel) المكونات المثبتة على السطح ميكانيكياً بـ fPCB، وتم إنشاء اتصال كهربائي بين الثيرمستورات المثبتة على السطح (NTCG063JF103FT، TDK Corporation، اليابان) والألواح النحاسية باستخدام لحام إعادة التدفق مع معجون لحام منخفض الحرارة (4900 P SAC305، MG Chemicals).
التغليف واللاصق الجلدي
تم صب (بوليمر) ميثيل ميثاكريلات (PMMA) بواسطة الدوران ) ومخبوزة ( لإنتاج فيلم هيدروفوبي صلب ) لتسهيل إزالة الجهاز المغلف عن طريق التقشير بعناية. بدأت عملية التغليف عن طريق الصب الدوراني ( طبقة رقيقة ) من البولي سيليكون المسبق (1:1، إيكوفليكس 00-30، سموذ-أون إنك، الولايات المتحدة الأمريكية) على سطح PMMA، مع إضافة قماش ألياف زجاجية رقيق برفقطبقة، مما يسمح لها بالاستقرار ببطء وامتصاص السيليكون غير المعالج (30 ثانية)، والخبز على لوحة ساخنة للتجفيف.طبقة أخرى من البوليمر السيليكوني المسبقتم صبها بالدوران ( )، تم إضافة الفPCB وضغطه برفق في طبقة السيليكون من الأعلى في درجة حرارة الغرفة (3 دقائق) لإزالة فقاعات الهواء، تلا ذلك الخبز ( ) لعلاج. تم تطبيق بوليمر السيليكون الطازج بشكل زائد لتغطية الجهاز ووضعه في جهاز تفريغ ( 2 دقيقة ) لملء وإزالة الفجوات الهوائية، ثم تم تدويره ( ) لإزالة الزائد، وخبز ( ) لإنشاء طلاء جهاز محدد . الأجهزة في هذه الخطوةسُمك) تم استخدامه في الأشكال 1 و 2 لإظهار المرونة أو للتوصيف الحراري بالأشعة تحت الحمراء، على التوالي. تم عزل الأجهزة المستخدمة في قياس التدفق على الطاولة وفي الجسم بطبقة من رغوة البولي يوريثان (DRX3011، Dynarex CuraFoam، الولايات المتحدة الأمريكية) التي تم قطعها بالليزر إلى أشكال محددة.وعولج برذاذ مقاوم للماء (275619، راست أوليم، الولايات المتحدة الأمريكية). باختصار، تم دهن طبقة رقيقة من الإيبوكسي المرن (سيل-بولي، سموذ-أون إنك، الولايات المتحدة الأمريكية) على سطح السيليكون، وتم ضغط طبقة الرغوة يدويًا فوق الجهاز المغلف، وسمح لها بالتصلب (15 دقيقة) في درجة حرارة الغرفة. تم طلاء السيليكون المسبق الطلاء حديثًا. ) وتم علاجها في درجة حرارة الغرفة ( 20 دقيقة ) لتوليد طبقة علوية محاطة ومقاومة للماء تمت إزالة الأجهزة العاملة المغلفة من الشرائح المطلية بـ PMMA وقطعها على طول مخطط الفPCB معتداخل. للاختبار على الأنسجة وعلى الطاولة وفي الجسم الحي،شكل الليزر (أنظمة الليزر العالمية، الولايات المتحدة الأمريكية) مخططًا للاصق طبي متاح تجاريًا (3 M 2477 P) مع بناء من السيليكون والأكريلات مزدوج الجوانب، والذي تم لصقه بأسفل السيليكون للجهاز المغلف. سمح تقشير مادة الغلاف على اللاصق الأكريلات المواجه للجلد قبل تطبيق الأنسجة بالاتصال المتوافق للجهاز.
ميكرو-CT
تم إجراء تصوير ميكروCT باستخدام SkyScan 1276 (Bruker، كونتيش، بلجيكا) باستخدام فلتر من الألمنيوم والنحاس، ومصدر أشعة سينية تم ضبطه على تيار. تم الحصول على كتل الصور باستخدام 600 مللي ثانية
تعرض، عند حجم البكسل، دوران عند خطوات الدوران، مع متوسط إطارين. تم إعادة بناء كتل الصور ثلاثية الأبعاد باستخدام برنامج NRecon وخادم InstaRecon CBR (الإصدار 1.7.4.6، Bruker، كونتيش، بلجيكا) بعد التعديل للحركات العشوائية، وتصحيح صلابة الشعاع، وتقليل عيوب الحلقة، والتنعيم. تم تصور عرض ثلاثي الأبعاد لكومات التصوير باستخدام برنامج CTVox (الإصدار 3.3. O r1383، Bruker، كونتيش، بلجيكا).
تحليل العناصر المحدودة
تم استخدام البرنامج التجاري Fluent (الإصدار 2020 R2) للتحقيق في الاستجابة الحرارية في الأنسجة الناتجة عن التشغيل الحراري للجهاز، كما تم الإبلاغ عنه سابقًا. كانت التحليلات ثلاثية الأبعاد وعابرة، تأخذ في الاعتبار انتقال الحرارة في السوائل والمواد الصلبة عند درجة حرارة محيطة. تم بناء نموذجين محاكاة استنادًا إلى الإعدادات التجريبية التي تم مناقشتها في هذه المخطوطة. تضمن النموذج الأول الأنسجة، والأوعية، والسوائل، والجهاز، مع وجود الجهاز في تكوين مستوٍ فوق الأنسجة. تضمن النموذج الثاني الأوعية فقط، والسوائل والجهاز، مع انحناء الجهاز حول الوعاء مباشرة. تم تقسيم السائل داخل الوعاء باستخدام عناصر سداسية دقيقة، مما يضمن دقة الحسابات. كانت الطاقة الموردة إلى المنطقة المسخنة من المستشعر تتطابق مع القيم التجريبية (، و، و)، وتم تسجيل درجة حرارة السطح العلوي بالكامل من المستشعر. كانت الجدران الخارجية عازلة باستثناء مدخل ومخرج السائل لكل نموذج. تم ضبط درجات حرارة السائل والمواد الصلبة الأولية على 300 كلفن. تم الحفاظ على مدخل السائل عند معدل تدفق كتلة ثابت (
) طوال مدة محاكاة واحدة. كانت المعلمات الحرارية الرئيسية المستخدمة في المحاكاة تشمل الموصلية الحرارية، والسعة الحرارية النوعية، والكثافة، كما هو موضح في الجدول التكميلي 4. عرفت محاكاة التجارب على الطاولة الماء كسائل، وجلد SynDaver كأنسجة، ووعاء SynDaver أو ePTFE كمواد الناسور أو الطعوم المقابلة، على التوالي. استخدمت محاكاة الدراسات الحية معلمات دم الإنسان، والجلد، ومواد الأوعية كمدخلات نموذجية. تم تغيير المعلمات الهندسية مثل قطر الوعاء، والسماكة، والعمق داخل الجلد لكل محاكاة لتتناسب مع الظروف التجريبية في هذه المخطوطة.
تحليل النقل الحراري باستخدام دائرة حرارية مكافئةتم بناء دائرة مقاومة حرارية (TRC) لتحليل النقل الحراري من جهاز التسخين عبر جدار الوعاء إلى تدفق السائل في الوعاء (الأشكال التكميلية 5 و24). نظرًا لأن طبقة الحدود الحرارية في التدفق تطورت على طول جهاز التسخين بطول 60 مم، اعتُبر جهاز التسخين كعناصر بطول 20 مم لتصوير انتقال الحرارة المختلفة عند الأجزاء الأولية (جهاز التسخين، 0)، والمتوسطة (جهاز التسخين، م)، والمستشعر (المستشعر) من جهاز التسخين. كانت العناصر الثلاثة لها إدخال حرارة متطابقة (Q) من جهاز التسخين. تم نقل غالبية الحرارة المدخلة (Q) عبر الجهاز، وواجهة الجهاز-الوعاء، وجدار الوعاء وأخيرًا تم نقلها إلى تدفق السائل. تم فقدان باقي الحرارة إلى البيئة عبر الحمل الحراري الطبيعي. تم حساب مقاومات الحرارة لكل حاجز نقل حرارة كقيم مقاومة حرارية في الجدول. تم حساب مقاومة الحرارة المتعقبة () من مسارات مقاومة النحاس لجهاز التسخين بواسطة، حيث كانت هي طول العنصر، و كانت الموصلية المكافئة لجهاز التسخين، و كانت مساحة مقطع جهاز التسخين، و كانت مساحة الاتصال بين كل عنصر والوعاء. كانت مقاومة الجهاز الحرارية () من جهاز التسخين إلى واجهة الجهاز-الوعاء هي، حيث كانت هي سماكة مسار الجهاز و كانت الموصلية المكافئة للمسار. كانت مقاومة جدار الوعاء هي، حيث كانت هي سماكة جدار الوعاء و كانت الموصلية الحرارية للوعاء تعتمد على أبعاد ومواد الوعاء. تم تقدير فقدان الحرارة إلى البيئة من التجارب. تم حساب مقاومة الحمل الحراري بناءً على
معامل انتقال الحرارة في منطقة الدخول الحرارية لتدفق أنبوب هيدروليكي متطور بالكامل كانت مقاومة الحرارة للحمل الحراري هي، حيث كانت، ID، x. من خلال حل الدائرة الحرارية المكافئة، تم الحصول على درجات حرارة العناصر الثلاثة. كانت درجة حرارة جهاز التسخين هي متوسط درجات حرارة العناصر الثلاثة،. كان المستشعر في نهاية جهاز التسخين له درجة حرارة. من خلال مطابقة درجات الحرارة من تحليل الدائرة والتجربة، تم الحصول على بين الجهاز والوعاء، يتراوح من (اتصال جيد) و (اتصال ضعيف) اعتمادًا على جودة الاتصال.
جمع البيانات والأدوات
يحدث جمع البيانات المتزامن لجهازين من خلال الناقل التسلسلي العالمي (USB) وواجهة الناقل العامة (GPIB) مع جهاز كمبيوتر محمول مضيف (Thinkpad T560، Lenovo). يتكون النظام بالكامل من مصدرين تيار مستمر (6220/2182 A، Tektronix Keithley)، واثنين من أجهزة القياس الرقمية متعددة الأرقام (DMM، USB-4065، National Instruments)، وجهاز I/O متعدد الوظائف (USB-6212 DAQx) (الشكل التكميلي 6). يتم تحويل مقاومات الثيرمستور المكتسبة إلى جهد باستخدام مقسم جهد (تكوين جسر مقاوم نصف) لإنشاء علاقة نسبية بين مقاومة الثيرمستور وإخراج الجهد. تم التحكم في جميع الأدوات والبيانات وتسجيلها عبر واجهة مخصصة (LabVIEW 2018، National Instruments)، ومعالجتها باستخدام خوارزميات مخصصة (MATLAB R2022b، Mathworks). يتم الحصول على عينات الجهد بتردد عينة 5 هرتز.
تصفية الإشارة وتحليل البيانات
تظهر حسابات كثافة الطيف الطاقي التي تظهر بشكل أساسي ضوضاء منخفضة التردد في الشكل التكميلي 11. تم تطبيق فلتر تمرير منخفض (فلتر باتروورث من الدرجة الثانية غير محدود) عند 0.04 هرتز على إشارات الجهد الخام لإزالة أي توقيعات عالية التردد. يزيل تصفية الطور الصفري أي تأخير طوري متأصل وضوضاء 60 هرتز المحيطة المتعلقة بالقياسات الحرارية. يتطلب تحليل البيانات لكل جهاز تحويل المقاومات المقاسة من مستشعرين ومشغل واحد (جهاز التسخين) إلى درجات حرارة ثم إلى. ما لم يُذكر خلاف ذلك، يتم حساب الثوابت الزمنية كزمن الوصول إلى ظروف شبه مستقرة تُعرف بأنها من قيم عند.
معايرة جهاز التسخين والمستشعر
تمت معايرة مقاومات جهاز التسخين والمستشعر على لوحة تسخين، محاطة بحاجز يحد من الحمل الحراري، إلى درجات حرارة تم قياسها بواسطة التصوير بالأشعة تحت الحمراء (A6255sc، أنظمة FLIR) وقراءات الثيرموكوبل (HH374، Omega Engineering Inc.). تم ضبط قيم الانبعاثية بالأشعة تحت الحمراء () لكل مادة جهاز باستخدام لوحة التسخين المعروفة وقراءات الثيرموكوبل (الأشكال التكميلية 7-8). تم لصق الأجهزة على لوحة تسخين متوازنة عند درجات حرارة متغيرة لمدة 10 دقائق، ثم تم تزويد جهاز التسخين بـ. تم جمع قياسات الجهد من جهاز التسخين والمستشعرات باستخدام DMM وDAQx، على التوالي، على فترات 20 ثانية (5 هرتز عينة) في ثلاث نسخ لكل جهاز ( أجهزة). تم تحويل الجهود إلى مقاومات ورسمها كدالة لدرجة الحرارة المقاسة. تم حساب معاملات التناسب للمستشعرات باستخدام معادلة ستاينهارت-هارت (الشكل التكميلي 9). تمت مقارنة المعايرات لجهاز التسخين والمستشعرات مع التناسبات الأدبية باستخدام معامل درجة حرارة المقاومة (TCR) للنحاس () ومواصفات الشركة المصنعة للثيرمستورات، على التوالي.
نماذج تدفق الأوعية على الطاولة
تم التحكم في التدفق من خلال نماذج الأوعية الوهمية باستخدام مضخة دافعة (M6-3L، U.S. Solid M6-3L) وتمت مراقبتها باستخدام مقياس تدفق توربيني متصل (FTB312، Omega) عند تمثيل الدم
،،، و. تم استخدام حمام مائي متداول المحافظة علىدرجة حرارة الدم الاصطناعي المحاكى. كانت الأشكال الوعائية تتكون من إما وعاء بيوميميتيك (SKU 131200، سيندافير) أو طعم وعائي من ePTFE بدرجة طبية (جور-تيكس) )، مع أو بدون طبقة محيطة من الجلد البيوميميتي (SKU 141500، سيندافر) (الشكل التكميلي 13 والجدول التكميلي 4). توسيع الأوعية كدالة لـ تم قياسه باستخدام ميكرومتر خارجي رقمي (IP65، ميتوتويو)، وتم قياس ضغط السائل الداخلي باستخدام مقياس ضغط سائل متصل في مواقع قريبة وبعيدة عن الوعاء المعني. تم لصق الأجهزة بشكل متوافق على سطح نموذج الأوعية الدموية على طول مسار التدفق، مع وجود مستشعر البيئة في الجهة القريبة، تحت (على سبيل المثال، ). بروتوكول الاستشعار الحراري القياسي تضمن خطوة توازن حراري بدون حرارة ( 120 ثانية )، خطوة تسخين ( 400 ثانية )، وخطوة تبريد بدون حرارة ( 400 ثانية ) (الشكل التكميلي 10). ما لم يُذكر خلاف ذلك، تم تشغيل السخانات عند .
حقن الملح على سطح الطاولة وانسدادات
تم استخدام حقن محلول ملحي على سطح العمل وانسداد قسطرة البالون باستخدام وعاء فرعي متفرع لتركيب جهاز تحكم ثانوي لإجراء قياسات متزامنة خلال التجارب المحلية على الوعاء الرئيسي (الشكل التكميلي 29). كان مدخل حقن المحلول الملحي يقع على بعد 4 سم بعيدًا عن الفرع الوعائي و4 سم قريبًا من موقع الجهاز. تم استخدام مسبار حراري رباعي القنوات (HH374، أوميغا) لمراقبة درجة حرارة الغرفة المحيطة، والسوائل الحيوية المتداولة، وسطح نموذج الأوعية، والمحلول الملحي المحقون (1x PBS). قبل الحقن، تم استخدام محلول ملحي بارد.تم تخزينه في فريزر، وملح دافئتم حضنه في حمام مائي ساخن. تم حقن 30 مل على مدى 10 ثوانٍ من محلول ملحي بارد أو دافئ في السائل الحيوي المتداول. ) تم تنفيذها ثلاث مرات بفواصل زمنية قدرها 85 ثانية (200، 285، 370 ثانية لتسخين الجهاز). تم محاكاة الانسداد من خلال تضخيم قسطرة بالون انسداد Sceptor C (BC0415C، MicroVention Inc.) مع محلول ملحي يحتوي على صبغة غذائية زرقاء للرؤية. لضمان انسداد كامل للأوعية الاختبارية، تم تغليف البالون المنفوخ في طبقة رقيقة.تم إجراء انسدادات لمدة 150 ثانية ثلاث مرات في المواقع 1 سم قريبة، أو وسط، أو 1 سم بعيدة عن الجهاز بفواصل زمنية قدرها 300 ثانية (200، 500، 800 ثانية تسخين للجهاز).
نموذج الخنازير في الجسم الحي
خنزيران يوركشاير ذكر (مزارع S&S، برينتوود، كاليفورنيا) يزنتم تحضيرها مسبقًا باستخدام حقن عضلي بجرعة 5 ملغ لكل كغ من تيلتامين-زولازيبام (تيلازول، زويتس، نيوجيرسي، الولايات المتحدة الأمريكية)، و2 ملغ لكل مل من زيلزين (فيدكو إنك، ميزوري، الولايات المتحدة الأمريكية)، و0.02 ملغ لكل كغ من جليكوبيرولات (وايذ، نيوجيرسي، الولايات المتحدة الأمريكية) تلاها إدخال أنبوب التنفس. تم وضع الحيوانات في وضعية الاستلقاء، وتم الحفاظ على التخدير باستخدام الاستنشاق منإيزوفلوران عندمعدل التدفقخلال الإجراء، تخطيط القلب الكهربائي، تشبع الأكسيموغلوبين عبر الجلد ( )، نهاية الزفير تمت مراقبة وتوثيق التركيز، ونسبة الأكسجين الملهم، ودرجة حرارة الجسم الأساسية بشكل مستمر. تم إجراء الوصول إلى الشريان السباتي المشترك تحت توجيه الموجات فوق الصوتية (Butterfly iQ +، شبكة Butterfly Inc. غيلفورد، كونيتيكت) لوضع غلاف شرياني بحجم 5 فرنش (Cook Medical، إنديانا، الولايات المتحدة الأمريكية) تلاه إدخال قسطرة Cobra بحجم 5 فرنش (Cook Medical، إنديانا، الولايات المتحدة الأمريكية). تم وضع القسطرة بالقرب من الشريان الفخذي، وتم إجراء تصوير الأوعية الرقمية باستخدام الأشعة السينية الجوالة (OEC Elite C-Arm، GE HealthCare، شيكاغو، إلينوي) على الجانب الجراحي المعني في البداية. باستخدام الموجات فوق الصوتية، تم تحديد الشريان الفخذي والوريد وتتبعهم على الجلد الذي يغطي الأوعية. على سلك توجيه بحجم 0.035 بوصة (Glidewire، تيرومو، نيوجيرسي، الولايات المتحدة الأمريكية)، تم تم توصيل قسطرة توسيع البالون موستانغ بقياس المليمتر (بوسطن ساينتيفيك) بشكل محوري إلى الشريان الفخذي تحت توجيه الأشعة السينية. تم إجراء تصوير بالموجات فوق الصوتية دوبلر قياسي للشريان الفخذي باستخدام محول الموجات فوق الصوتية (Butterfly iQ+، شبكة باترفلاي، غيلفورد، كونيتيكت) فيعن طريق تطبيق المحول مباشرة على الجلد فوق منطقة الشريان لتأكيد انسداد الشريان أو نفاذيته بدقة عالية باستخدام وضع B، أو دوبلر الملون للقياس سرعة التدفق. تم إجراء تصوير الأوعية الرقمية بالتخفيض (DSA) بمعدل 8 إطارات في الثانية باستخدام حقن 10 ملتخفيف عامل التباين آيوهكسول بمحلول ملحي فيزيولوجي (أومنيباك،; جي إي هيلث كير); في الذي تم إدارته عبر القسطرة الشريانية. تم وضع مستشعر تدفق الحرارة أمام الشريان الفخذي على طول 6 سم. كانت وسادات الخياطة على المستشعر (الشكل 1د) ملفوفة حول الشريان الفخذي. تم خياطة الوسادات معًا باستخدامخياطة حريرية تسمح بملاءمة مريحة ولكن غير ضاغطة حول الشريان. بعد الحصول على جميع القياسات المناسبة، تم euthanized الحيوان.
تقييم عبر الجلد لتدفق الأوعية الدموية
تم تتبع الشريان السباتي المشترك والوريد الوداجي على الجلد باستخدام الموجات فوق الصوتية، ثم تم وضع مستشعر التدفق على الجلد فوق المواقع المحددة باستخدام فيلم لاصق. كانت بروتوكولات تشغيل الجهاز القياسية تتضمن خطوة توازن حراري بدون حرارة.خطوة تسخينللكشف، وخطوة تبريد بدون حرارة (الشكل التوضيحي 10). ما لم يُذكر خلاف ذلك، تم تشغيل السخانات عندتم ربط قياسات تدفق التحكم باستخدام الموجات فوق الصوتية بالبيانات المستمدة من مستشعر التدفق.
تقييم تدفق الأوعية الدموية تحت الجلد
لتحقيق قياسات تدفق عبر الجلد والتحقق من تأثير الجلدعلى دقة المستشعر، قمنا بوضع مستشعر التدفق مباشرة فوق الوعاء بعد التعرض الجراحي. تم تحديد حزمة الشريان والوريد الفخذي وتتبعها باستخدام الموجات فوق الصوتية وبالتحسس، حيث تختفي نبضات الجزء السطحي من الشريان السافن الداخلي في طية الجلد بين عضلة الغراسيليس وعضلة السارتوريوس. تم إجراء شق جلدي سطحي طوله 7 سم في الفخذ فوق هذه النقطة لتجنب إلحاق الضرر عن غير قصد بالأوعية السافنية الداخلية باستخدام الكي الكهربائي، وتم تشريح الأنسجة تحت الجلد باستخدام مقصات ذات طرف غير حاد. تم تقسيم اللفافة بين عضلة السارتوريوس وعضلة الغراسيليس فوق موقع اختراق الأوعية السافنية الداخلية، أولاً باستخدام ملقط جراحي صغير ذو طرف غير حاد ثم باللمس. تم فصل مجموعتي العضلات باستخدام مِرَتِق أنسجة صغير ذاتي الاحتفاظ مع الحرص على عدم إلحاق الضرر بالعصب الفخذي والأوعية. تم كشف الشريان والوريد باستخدام التشريح غير الحاد، وتم كشف الوريد الفخذي مباشرة أسفل الشريان وداخل العصب الفخذي. 3-4 قطرات منتم تطبيق الليدوكائين في محلول متساوي التوتر على سطح الشريان والوريد الفخذي لمنع التشنج الوعائي. تم استخدام المقص للدخول إلى الغلاف وتم تشريح الشريان الفخذي. تم إعطاء جرعة منتم إعطاء الهيبارين (مايلان، بنسلفانيا، الولايات المتحدة الأمريكية) عن طريق الوريد لتحفيز مضادات التخثر. تم تعديل مضادات التخثر للوصول إلى وقت تخثر مفعل يزيد عن 200 ثانية باستخدام نظام iSTAT (مختبرات أبوت، إلينوي، الولايات المتحدة الأمريكية). بعد التعرض، تم وضع المستشعر فوق الشريان وثبته بخيوط تمر عبر الأنسجة الرخوة على كلا طرفي الوعاء. تم توثيق تدفق الدم بعد موقع مستشعر التدفق باستخدام قراءة دوبلر بالموجات فوق الصوتية عند الخط الأساسي وبعد تحفيز انسداد جزئي أو كامل. تم تعديل تضخم البالون للحصول على قيم دوبلر من ، أو ترتبط مع البيانات المستمدة من مستشعر التدفق. هذا مهم لتأكيد حساسية قراءة مستشعر التدفق باستخدام طريقة معتمدة سريريًا. تم تكرار جمع بيانات التدفق 3 مرات مع تفريغ البالون بعد كل قراءة. تم حقن المحقنة (30 مل على مدى 10 ثوانٍ) إما باردة ( ) ودافئ ( المحلول الملحي من خلال القسطرة إلى الشريان (درجة حرارة السطح ) تم تنفيذها ثلاث مرات بفواصل زمنية قدرها 85 ثانية ( تم استخدام تصوير الأوعية تحت تدفق مفتوح لتصور طرف القسطرة، الموضوعةقريبًا من موقع الجهاز داخل الشريان الفخذي للخنازير، قبل الحقن. تم محاكاة الجلطات عن طريق حقن مادة جل embolic (GEM، Obsidio) داخل الشريان بواسطة القسطرة في موقع الجهاز. كانت بروتوكولات تشغيل الجهاز القياسية تتكون من خطوة توازن حراري بدون حرارة.خطوة التسخينللكشف، وخطوة التبريد بدون حرارة (400 ثانية) (الشكل التوضيحي 10). ما لم يُذكر خلاف ذلك، تم تشغيل السخانات عندفي نهاية كل تجربة، تم استئصال الجلد وقطعة الوعاء التي تم تطبيق مستشعر التدفق عليها لإجراء الفحوصات النسيجية.
قياسات الساعد والانسدادات المتغيرة
تم إجراء دراسات على الجسم (بروتوكول IRB STU0020542، مستشفى نورث وسترن ميموريال، شيكاغو، إلينوي) بموافقة مستنيرة من المشارك. تم لصق الأجهزة على الجلد فوق الوريد السباتي الأيمن (الذي يمكن رؤيته من خلال الجلد). أكدت التصوير الحراري بالأشعة تحت الحمراء مسار وموقع هذا الوعاء. تم تثبيت الجانب الأكريلي من اللاصق على الجلد، وتم السماح للجهاز بالتوازن لمدة ثلاث دقائق. تضمنت بروتوكول تشغيل الجهاز القياسي خطوة توازن حراري بدون حرارة (120 ثانية)، تلتها خطوة تسخين مستمرة عند PD منتم إجراء انسدادات يدوية وإعادة تدفق للوريد السباتي عن طريق ضغط الوعاء من خلال الجلد باستخدام مسبار بلاستيكي. )، تليها إفراج عند 90 ثانية و150 ثانية من التسخين. كانت نقطة الضغط (POC) هيقريبًا من الجهاز. تم إجراء تجارب متطابقة في نفس الموقع باستخدام كاميرا الأشعة تحت الحمراء في غياب الجهاز لمراقبة التغيرات الحرارية في سطح الجلد حيث تعرضت الأوعية الدموية لاضطرابات في تدفق الدم. تم محاكاة أحداث الانسداد وإعادة التروية بشكل آلي باستخدام جهاز اختبار الشد (Mark-10، ESM303) مزود بوحدة اختبار بقدرة 100 نيوتن وهندسة لوحات متوازية بسمك 10 مم لتطبيق أحمال قوة متغيرة (10.0،، أو 0.4 نيوتن لمدة 150 ثانية تليها 150 ثانية عند 0 نيوتن).
علم الأمراض النسيجية
تم تثبيت الأنسجة المستأصلة في الفورمالين المخفف بنسبة 10% ومعالجتها للتضمين في الشمع باستخدام بروتوكول قياسي. تم صبغ مقاطع الأنسجة بصبغة هيماتوكسيلين وإيوزين، كما تم وصفه سابقًا.للحكم على إصابة الأوعية الدموية، تم إجراء تقييم مرفولوجي على مقاطع مقطوعة بشكل متسلسل بواسطة مشغل غير مطلع على الدراسة.
الإحصائيات وإمكانية التكرار
لم يتم استخدام أي طريقة إحصائية لتحديد حجم العينة مسبقًا. لم يتم استبعاد أي بيانات من التحليلات. لم تكن التجارب عشوائية. لم يكن هناك أي إخفاء في هذه الدراسة. استخدمت هذه الدراسة ستة أجهزة معايرة تم استخدامها بالتبادل عبر كل تجربة دون تحيز، وشملت الدراسات الحيوانية خنزيرين.
ملخص التقرير
معلومات إضافية حول تصميم البحث متاحة في ملخص تقارير مجموعة نيتشر المرتبط بهذه المقالة.
توفر البيانات
جميع البيانات التي تدعم نتائج هذه الدراسة متاحة ضمن المقالة وملفاتها التكميلية. يمكن توجيه أي طلبات إضافية للحصول على معلومات إلى المؤلفين المراسلين. تم توفير بيانات المصدر وملفات جمع البيانات المخصصة باستخدام LabVIEW مع هذه الورقة. تم توفير بيانات المصدر مع هذه الورقة.
توفر الشيفرة
تم رفع السكريبتات ذات الصلة بـ MATLAB لتحليل البيانات ومعالجة الإشارات إلى Code Ocean (DOI: 10.24433/CO.5920840.v1). الكود لحسابات FEA متاح من Y.D.
References
Perlman, R. L. et al. Quality of life in chronic kidney disease (ckd): a cross-sectional analysis in the renal research institute-ckd study. Am. J. Kidney Dis. 45, 658-666 (2005).
Choi, H. S. et al. Trends in the incidence and prevalence of endstage renal disease with hemodialysis in entire korean population: a nationwide population-based study. Med. (Baltim.) 100, e25293 (2021).
Pastan, S. & Bailey, J. Dialysis therapy. N. Engl. J. Med. 338, 1428-1437 (1998).
Himmelfarb, J. & Ikizler, T. A. Hemodialysis. N. Engl. J. Med. 363, 1833-1845 (2010).
Queeley, G. L. & Campbell, E. S. Comparing treatment modalities for end-stage renal disease: A meta-analysis. Am. Health Drug Benefits 11, 118-127 (2018).
Pockros, B. M., Finch, D. J. & Weiner, D. E. Dialysis and total health care costs in the united states and worldwide: the financial impact of a single-payer dominant system in the us. J. Am. Soc. Nephrol. 32, 2137-2139 (2021).
Rivara, M. B. et al. Extended-hours hemodialysis is associated with lower mortality risk in patients with end-stage renal disease. Kidney Int. 90, 1312-1320 (2016).
Tandon, T., Sinha, A. D. & Agarwal, R. Shorter delivered dialysis times associate with a higher and more difficult to treat blood pressure. Nephrol. Dial. Transpl. 28, 1562-1568 (2013).
Lacson, E. & Brunelli, S. M. Hemodialysis treatment time: a fresh perspective. Clin. J. Am. Soc. Nephrol. 6, 2522-2530 (2011).
Oliver, M. J. The science of fistula maturation. J. Am. Soc. Nephrol. 29, 2607-2609 (2018).
Clinical practice guidelines for vascular access. Am. J. Kidney Dis. 48, S176-S247 (2006).
Al-Jaishi, A. A., Liu, A. R., Lok, C. E., Zhang, J. C. & Moist, L. M. Complications of the arteriovenous fistula: a systematic review. J. Am. Soc. Nephrol. 28, 1839-1850 (2017).
Salman, L. et al. A multicenter randomized clinical trial of hemodialysis access blood flow surveillance compared to standard of care: the hemodialysis access surveillance evaluation (hase) study. Kidney Int. Rep. 5, 1937-1944 (2020).
MacRae, J. M. et al. Arteriovenous access failure, stenosis, and thrombosis. Can. J. Kidney Health Dis. 3, 2054358116669126 (2016).
Natta, L. et al. Soft and flexible piezoelectric smart patch for vascular graft monitoring based on aluminum nitride thin film. Sci. Rep. 9, 8392 (2019).
Neville, R. F., Gupta, S. K. & Kuraguntla, D. J. Initial in vitro and in vivo evaluation of a self-monitoring prosthetic bypass graft. J. Vasc. Surg. 65, 1793-1801 (2017).
Kersjes, R., Liebscher, F., Spiegel, E., Manoli, Y. & Mokwa, W. An invasive catheter flow sensor with on-chip cmos readout electronics for the on-line determination of blood flow. Sens. Actuators Phys. 54, 563-567 (1996).
Miller, F., Thambidorai, S., Kuraguntla, D. & Gupta, S. Wearable device for continuous, noninvasive monitoring of vascular access health and fluid status in hemodialysis patients. J. Am. Coll. Cardiol. 75, 1282 (2020).
Signore, M. A. et al. Fabrication and characterization of aln-based flexible piezoelectric pressure sensor integrated into an implantable artificial pancreas. Sci. Rep. 9, 17130 (2019).
Kwon, K. et al. An on-skin platform for wireless monitoring of flow rate, cumulative loss and temperature of sweat in real time. Nat. Electron. 4, 302-312 (2021).
Krishnan, S. R. et al. Continuous, noninvasive wireless monitoring of flow of cerebrospinal fluid through shunts in patients with hydrocephalus. npj Digital Med. 3, 29 (2020).
Krishnan, S. R. et al. Epidermal electronics for noninvasive, wireless, quantitative assessment of ventricular shunt function in patients with hydrocephalus. Sci. Transl. Med. 10, eaat8437 (2018).
Webb, R. C. et al. Epidermal devices for noninvasive, precise, and continuous mapping of macrovascular and microvascular blood flow. Sci. Adv. 1, e1500701 (2015).
Klinker, L. et al. Balloon catheters with integrated stretchable electronics for electrical stimulation, ablation and blood flow monitoring. Extrem. Mech. Lett. 3, 45-54 (2015).
Lu, D. et al. Implantable, wireless, self-fixing thermal sensors for continuous measurements of microvascular blood flow in flaps and organ grafts. Biosens. Bioelectron. 206, 114145 (2022).
Tian, Y. et al. Self-adaptive epidermal blood flow sensor for highflux vascular access monitoring of hemodialysis patients npj Flexible Electronics 8, 62 (2024).
Madhvapathy, S. R. et al. Advanced thermal sensing techniques for characterizing the physical properties of skin. Appl. Phys. Rev. 9, 041307 (2022).
Lamas, J. A., Rueda-Ruzafa, L. & Herrera-Pérez, S. Ion channels and thermosensitivity: trp, trek, or both? Int. J. Mol. Sci. 20, 2371 (2019)
Dirler, J., Winkler, G. & Lachenmeier, D. W. What temperature of coffee exceeds the pain threshold? Pilot study of a sensory analysis method as basis for cancer risk assessment. Foods 7, 83 (2018)
ISO. Medical Electrical Equipment-Part 1: General Requirements For Basic Safety and Essential Performance https://www.iso.org/ standard/59536.html (2020).
Bergman, T. L. & Lavine, A. S. Fundamentals of Heat and Mass Transfer 8th edn, Vol. 1072 (Wiley, 2017).
Madhvapathy, S. R. et al. Reliable, low-cost, fully integrated hydration sensors for monitoring and diagnosis of inflammatory skin diseases in any environment. Sci. Adv. 6, eabd7146 (2020).
Madhvapathy, S. R. et al. Epidermal electronic systems for measuring the thermal properties of human skin at depths of up to several millimeters. Adv. Funct. Mater. 28, 1802083 (2018).
White, F. C., Roth, D. M. & Bloor, C. M. The pig as a model for myocardial ischemia and exercise. Lab Anim. Sci. 36, 351-356 (1986).
Sauerbrey, A. et al. Establishment of a swine model for validation of perfusion measurement by dynamic contrast-enhanced magnetic resonance imaging. BioMed. Res. Int. 2014, 390506 (2014).
Kordzadeh, A., Chung, J. & Panayiotopoulos, Y. P. Cephalic vein and radial artery diameter in formation of radiocephalic arteriovenous fistula: a systematic review. J. Vasc. Access 16, 506-511 (2015).
FDA. Transdermal and Topical Delivery Systems-Product Development and Quality Considerations Guidance for Industry. https:// www.fda.gov/media/132674/download (2019).
Qiu, L., Ouyang, Y., Feng, Y., Zhang, X. & Wang, X. In vivo skin thermophysical property testing technology using flexible thermosensor-based method. Int. J. Heat. Mass Transf. 163, 120550 (2020).
Albadawi, H. et al. Nanocomposite hydrogel with tantalum microparticles for rapid endovascular hemostasis. Adv. Sci. 8, 2003327 (2021).
شكر وتقدير
استخدم هذا العمل معهد النانو الدولي (IIN) ومؤسسة كيك وولاية إلينوي، من خلال IIN. يعترف R.O. بالدعم من المعاهد الوطنية للصحة (RO1CA257558، RO1HL140951، R01DK130566، R01HL165176 و R01HL137193) وجائزة الباحث السريري من عيادة مايو. يعترف H.M.A بالدعم من المعهد الوطني للاضطرابات العصبية والسكتة الدماغية التابع للمعاهد الوطنية للصحة بموجب رقم الجائزة F31NS115422. يعترف Y.D. بالدعم من مؤسسة العلوم الطبيعية في شنغهاي (23ZR1428600). يشكر A.S.C جامعة كاليفورنيا ومنحة بحث هيئة التدريس من UCSB على الدعم المالي. نشكر معهد كويري-سيمبسون للإلكترونيات الحيوية على دعم هذا العمل. المؤلفون ممتنون لنتاشا كاو على التحرير. ومساعدة في التدقيق اللغوي. المحتوى هو مسؤولية المؤلفين فقط ولا يمثل بالضرورة الآراء الرسمية للمعاهد الوطنية للصحة. تم إنشاء الأشكال 1c و6a و7a جزئيًا باستخدام فنون سيرفيير الطبية، المرخصة بموجب CC BY 4.0 (https://creativecommons.org/licenses/by/4.0/) وتم تعديلها في PowerPoint. الشكل 1أ، ب، والشكل التكميلية 26أ تم إنشاؤها في BioRender. كارليني، أ. (2024) https://BioRender.com/k53c078وتم تعديله في PowerPoint.
مساهمات المؤلفين
كان R.O. و J.A.R. مشاركين في تصور الدراسة. طرح H.A. و Y.H. و R.O. و J.A.R. و A.S.C. أسئلة علمية وصمموا التجارب. صمم V.K. و A.R. و A.S.C. بروتوكولات استحواذ البيانات الخاصة. قام A.S.C. بتصنيع الأجهزة، وأجرى تجارب على الطاولة، وحلل البيانات. قام Y.D. و T.Y. بإجراء محاكاة حسابية، وحللا البيانات. قام H.A. و R.J.F. و Z.Z. و R.O. بإجراء جراحات على نماذج الخنازير وحللوا الصور السريرية. قام H.M.A. و A.S.C. بإجراء قياسات للأجهزة على نماذج الخنازير. أنشأ C.C. رسومات ثلاثية الأبعاد. كتب A.S.C. المخطوطة. حصل H.M.A. و R.O. و J.A.R. على التمويل.
يجب توجيه المراسلات والطلبات للحصول على المواد إلى يونغغانغ هوانغ، رحمي أوكلي، جون أ. روجرز أو أندريا س. كارليني.
معلومات مراجعة الأقران تشكر مجلة Nature Communications جون هو، والمراجع (المراجعين) الآخرين المجهولين على مساهمتهم في مراجعة هذا العمل. يتوفر ملف مراجعة الأقران.
ملاحظة الناشر: تظل شركة سبرينجر ناتشر محايدة فيما يتعلق بالمطالبات القضائية في الخرائط المنشورة والانتماءات المؤسسية.
الوصول المفتوح هذه المقالة مرخصة بموجب رخصة المشاع الإبداعي النسب 4.0 الدولية، التي تسمح بالاستخدام والمشاركة والتكيف والتوزيع وإعادة الإنتاج بأي وسيلة أو صيغة، طالما أنك تعطي الائتمان المناسب للمؤلفين الأصليين والمصدر، وتوفر رابطًا لرخصة المشاع الإبداعي، وتوضح إذا ما تم إجراء تغييرات. الصور أو المواد الأخرى من طرف ثالث في هذه المقالة مشمولة في رخصة المشاع الإبداعي الخاصة بالمقالة، ما لم يُشار إلى خلاف ذلك في سطر الائتمان للمواد. إذا لم تكن المادة مشمولة في رخصة المشاع الإبداعي الخاصة بالمقالة وكان استخدامك المقصود غير مسموح به بموجب اللوائح القانونية أو يتجاوز الاستخدام المسموح به، فسيتعين عليك الحصول على إذن مباشرة من صاحب حقوق الطبع والنشر. لعرض نسخة من هذه الرخصة، قم بزيارةhttp://creativecommons.org/رخصة/بواسطة/4.0/. (ج) المؤلف(ون) 2024
المختبر الوطني الرئيسي لنظام الميكانيكا والاهتزاز، كلية الهندسة الميكانيكية، جامعة جياو تونغ في شنغهاي، شنغهاي، الصين.مختبر شنغهاي الرئيسي للتصنيع الرقمي للهياكل رقيقة الجدران، جامعة شنغهاي جياو تونغ، شنغهاي، الصين.قسم الهندسة الميكانيكية، جامعة نورث وسترن، إيفانستون، إلينوي، الولايات المتحدة الأمريكية.معهد كويري سيمبسون للبيوإلكترونيات، جامعة نورث وسترن، إيفانستون، إلينوي، الولايات المتحدة الأمريكية.قسم الهندسة الطبية الحيوية، جامعة نورث وسترن، إيفانستون، إلينوي، الولايات المتحدة الأمريكية.مدرسة هندسة المادة والنقل والطاقة، جامعة ولاية أريزونا، تمبي، أريزونا، الولايات المتحدة الأمريكية.قسم الأشعة الوعائية والتداخلية، مايو كلينك، سكوتسديل، أريزونا، الولايات المتحدة الأمريكية.مختبر الهندسة المستوحاة من المرضى، مايو كلينك، سكوتسديل، أريزونا، الولايات المتحدة الأمريكية.رئيس فخري، قسم جراحة الأوعية الدموية والجراحة الوعائية الداخلية، مايو كلينك، فينيكس، أريزونا، الولايات المتحدة الأمريكية.كلية فاينبرغ للطب، جامعة نورث وسترن، شيكاغو، إلينوي، الولايات المتحدة الأمريكية.مستشفى ماساتشوستس العام، بوسطن، ماساتشوستس، الولايات المتحدة الأمريكية.قسم علوم المواد والهندسة، جامعة نورث وسترن، إيفانستون، إلينوي، الولايات المتحدة الأمريكية.قسم الهندسة المدنية والبيئية، جامعة نورث وسترن، إيفانستون، إلينوي، الولايات المتحدة الأمريكية.معهد سيمبسون كويري، جامعة نورث وسترن، إيفانستون، إلينوي، الولايات المتحدة الأمريكية.قسم الكيمياء، جامعة نورث وسترن، إيفانستون، إلينوي، الولايات المتحدة الأمريكية.قسم جراحة الأعصاب، جامعة نورث وسترن، إيفانستون، إلينوي، الولايات المتحدة الأمريكية.قسم الهندسة الكهربائية وهندسة الحاسوب، جامعة نورث وسترن، إيفانستون، إلينوي، الولايات المتحدة الأمريكية.قسم علوم الحاسوب، جامعة نورث وسترن، إيفانستون، إلينوي، الولايات المتحدة الأمريكية.قسم الكيمياء والبيوكيمياء، جامعة كاليفورنيا في سانتا باربرا، سانتا باربرا، كاليفورنيا، الولايات المتحدة الأمريكية.برنامج متعدد التخصصات في علوم الحياة الكمية، جامعة كاليفورنيا في سانتا باربرا، سانتا باربرا، كاليفورنيا، الولايات المتحدة الأمريكية.مركز البوليمرات والمواد العضوية، جامعة كاليفورنيا في سانتا باربرا، سانتا باربرا، كاليفورنيا 93106، الولايات المتحدة الأمريكية.هؤلاء المؤلفون ساهموا بالتساوي: يونغغانغ هوانغ، رحمي أوكلا، جون أ. روجرز، أندريا س. كارليني. البريد الإلكتروني:y-huang@northwestern.edu; Oklu.Rahmi@mayo.edu; jrogers@northwestern.edu; acarlini@ucsb.edu
A soft thermal sensor for the continuous assessment of flow in vascular access
Received: 19 February 2024
Accepted: 18 November 2024
Published online: 02 January 2025
Check for updates
Yujun Deng , Hany M. Arafa , Tianyu Yang , Hassan Albadawi , Richard J. Fowl , Zefu Zhang , Viswajit Kandula , Ashvita Ramesh , Chase Correia , Yonggang Huang , Rahmi Oklu , John A. Rogers 4,5,10,12,14,15,16,17,18,22 & Andrea S. Carlini □
Abstract
Hemodialysis for chronic kidney disease (CKD) relies on vascular access (VA) devices, such as arteriovenous fistulas (AVF), grafts (AVG), or catheters, to maintain blood flow. Nonetheless, unpredictable progressive vascular stenosis due to neointimal formation or complete occlusion from acute thrombosis remains the primary cause of mature VA failure. Despite emergent surgical intervention efforts, the lack of a reliable early detection tool significantly reduces patient outcomes and survival rates. This study introduces a soft, wearable device that continuously monitors blood flow for early detection of VA failure. Using thermal anemometry, integrated sensors noninvasively measure flow changes in large vessels. Bench testing with AVF and AVG models shows agreement with finite element analysis (FEA) simulations, while human and preclinical swine trials demonstrate the device’s sensitivity. Wireless adaptation could enable at-home monitoring, improving detection of VArelated complications and survival in CKD patients.
Hemodialysis represents the most prevalent treatment option for chronic kidney disease (CKD), constituting a 32 billion USD healthcare burden affecting an estimated 800 million patients worldwide . The current practice involves single sessions at specialized clinics lasting 48 h , repeated times weekly to maintain blood filtration and
homeostasis . Patients undergoing regular treatment require surgical intervention to create a vascular access (VA) in the forearm or upper arm (Fig. 1). This involves establishing an anastomosis (connection) between a selected artery and nearby vein to create an arteriovenous fistula (AVF), or implanting a synthetic tube between the artery and
Fig. 1 | Wearable thermal flow sensor for detection of vascular access (VA) stenosis. a, b Diagram of VA fistula (a) and synthetic graft (b) with mounted devices. c Schematic of a healthy VA and VA failure by chronic venous stenosis or acute thrombosis. Key flow rate ( ) terminology is defined. d Exploded view of encapsulated device, containing a double-sided heater with thermal sensors to monitor device-tissue contact and environmental conditions. Magnified optical
images show resistive heater traces and flexible suture pads for direct vascular application. Scale bars, and 2 mm . e Schematic of thermal flow physics of the proposed anemometric sensing device. f Camera images of the flexible device for use on-skin and on-vessel. Demonstrations of (i) serpentine stretching, (ii) bending, (iii) twisting, and (iv) conformal adhesion to artificial skin. Scale bar, 7.5 mm .
vein to create an arteriovenous grafts (AVG) (Fig. 1a, b). This connection enables high arterial blood pressure to flow into the vein, ensuring adequate blood flow necessary for dialysis access. Clinically, healthy VAs require an inner diameter (ID) , a tissue depth ( ) of (most are ), and a volumetric flow rate ( ) of (Fig. 1c) . Throughout this study, physiologically relevant healthy and unhealthy VA is defined as patent-flow ( ), lowflow , and no-flow (Fig. 1c inset, Supplementary Table 1). Specifically, our studies focus on detecting flow changes below these patent-flow conditions.
VA fistulas tend to last longer and are less prone to infection and clotting than synthetic grafts, but require months to mature fully for dialysis use . Conversely, grafts can be employed for dialysis within days of implantation but necessitate long-term monitoring and frequent revision surgeries. Both approaches suffer from high unpredictable dysfunction and failure rates attributed to venous stenosis . Venous stenosis commonly occurs in fistulas, characterized by vascular narrowing (stenosis) or complete blockage due to neointimal hyperplasia and fibrosis, which develops over weeks to months. Additionally, thrombosis, common with vascular grafts, results in acute occlusion within hours to days. Therefore, early detection of VA failure is crucial for timely interventions (e.g., thrombectomy) to prevent permanent failure. The lack of reliable, simple blood flow monitoring devices to prolong VA life in CKD patients undergoing hemodialysis represents an unmet healthcare need.
Direct assessment of VA flow represents the most useful indicator of graft/fistula patency. Therefore, deploying a reliable device for realtime blood flow readings within the VA would significantly enhance the standard of care for these patients. Standard modes of VA flow assessment include ultrasound, thermodilution, plethysmography, and blood pressure measurements (Supplementary Table 2). Previous approaches, ranging from implantable piezoelectric/capacitive sensors monitoring VA graft flow to wearable optical sensors assessing VA patency, have shown mixed outcomes . Implantable techniques
focus on the concept of a smart graft, exemplified by a recent study developing a 2 cm long piezoelectric sensor wrapping around the extraluminal surface of a PTFE graft . However, ex vivo results do not fully capture the expected physiological flow within a VA graft. Another noninvasive wearable device (Graftworx) combines accelerometry and multichannel photoplethysmography with a proprietary algorithm to continuously assess graft patency, hemoglobin, and hematocrit levels in a VA ; however, this device fails to quantify below . A highly sensitive, noninvasive vascular flow sensor capable of detecting changes in VA patency across physiologically relevant flow regimes will establish a new paradigm in the standard of care for dialysis patients.
Recent work with noninvasive calorimetric flow sensors present a promising alternative to previous technologies . The development of an epidermal calorimetry-based sensor for ultralow flow conditions in hydrocephalus patients with ventriculoperitoneal shunts marks the first clinical deployment of thermal sensors . However, calorimetry is unsuitable for the high flow environments inherent in healthy VAs given their diminished sensitivity at high , narrow detection ranges, and ambiguity to flow variations (nonmonotonic response). Moreover, they require precise alignment of the device with its flow conduit (e.g., vessel). In contrast, anemometric sensors offer a simplified construction (integrated heater and sensor) and can tolerate minor user-induced misalignment . An ideal device for detecting VA stenosis should demonstrate: (1) high precision, (2) a physiologically relevant response time in minutes, and (3) sensitivity to physiologically relevant flow. To meet these flow sensing requirements, we present a wearable, noninvasive, thermal anemometric flow sensing device for monitoring VA patency. A modular device designed for both skin and vessel measurements, along with testing in a large animal model, serves as a proof-of-concept study. Geometric optimization enables the device to interrogate a wide range of ( ) in benchtop models of VAF and VAG. We further increase sensitivity to achieve instantaneous feedback in the presence
Fig. 2 | Design and characterization of wearable flow sensing devices. a FEA simulations of temperature profiles comparing an epidermally mounted thermal (top, previous design) and anemometric (bottom, current design) based sensor, with fixed heater areas of . Simulations and experiments are performed under patent-flow conditions at heater PD of . FEA simulations of heater sensitivity with respect to heater length and width modulation. c Block diagram of instrumentation, thermal flow sensor, and benchtop vascular flow
model in experiments. d IR thermography of heater actuation under no-flow and patent-flow conditions. Selected images show net cooling at 250 s (patent-flow) as compared to 180 s (no-flow). e Time course analysis of heater temperature under no-flow conditions at , and ( technical replicates). Corresponding steady-state heater after 400 s as a function of PD. Dotted lines indicate pain receptor activation and clinical dosing limits. Data are presented as mean values ± SEM. Source data are provided as a Source Data file.
of challenging physiological changes. Robust in vivo studies demonstrate accurate flow detection in real-time across various flow scenarios, including catheter-mediated injection of physiological solutions with variable temperatures, creating vascular hemorrhage followed by hemostasis, inducing stepwise vascular stenosis and reperfusion events, and real-time onset of thrombosis.
Results
Wearable sensor for the detection of flow in vascular access
Figure 1d displays a detailed diagram of the VA flow sensing device design. The flexible printed circuit board (f-PCB) comprises a doublesided Cu heater with an internal polyimide (PI) source, two negative temperature coefficient (NTC) sensors, and modular suture pads that connect via flexible PI serpentines for direct vascular application. Encapsulation of the electronics in EcoFlex-30, along with an ultrathin fiberglass fabric layer ( ), enhances flexibility and mechanical robustness, respectively. Devices adhere to the test tissue surface using a sacrificial silicone/acrylate skin-safe adhesive . An insulating polyurethane (PU) foam layer ( 5 mm ) and a minimal EcoFlex silicone layer are positioned above and below the f-PCB, respectively, to optimize and direct thermal conductivity ( k ) towards the tissue. Micro-CT 3D renderings depict the different layers of these encapsulated devices (Supplementary Fig. 1).
We measure high using the principle of anemometry (Fig. 1e). This requires the use of a double-sided Cu heater as an actuator to heat the skin and as a temperature sensor to measure the temperature of the skin surface. Since blood in the subcutaneous vessels absorbs and transfers thermal energy, acting as a heat sink, there is a monotonic relationship between skin surface temperature
and blood flow, indicating that an increase in flow results in a decrease in skin temperature. Additionally, an environmental sensor is integrated to monitor local changes in passing blood temperatures, and a contact sensor is integrated on top of the heater, towards the device’s edge, to assess conformal contact and potential delamination at the device-tissue interface. Specifically, poor contact results in a hotspot that the contact sensor can detect due to the lack of thermal transport from the heater into the bloodstream. Manipulation of encapsulated devices (Fig. 1f) without a foam layer demonstrates the device’s flexibility and elasticity, allowing for conformal adhesion onto curved and soft surfaces.
Design of anemometric flow sensing device and characterization
Finite element analysis (FEA) on a VA model enables optimizing and characterization of the device’s geometry and flow sensing mechanism (Fig. 2). Figure 2a illustrates a comparison of temperature profiles at the tissue surface for both a circular device (top) based on previous calorimetric designs , and the rectangular anemometric device (bottom) presented in this study. Both devices possess the same heater surface area ( ), and are subjected to patent-flow conditions. The calorimetric device exhibits minimal thermal anisotropy between the upstream and downstream sensors, despite noticeable cooling along the blood flow path. Due to the non-monotonic response of calorimeters , lack of anisotropy could indicate high or no-flow conditions. Additionally, this mechanism heavily relies on accurate sensor alignment along the flow path, which can be difficult to see for patients with thicker skin. To overcome these challenges, we turn to anemometry which, offers a robust monotonic response to thermal dilution relative to . Flow sensitivity for an anemometric device heater or
contact sensor is defined as a function of temperature change under low-flow and healthy flow conditions, using the following equation:
where and represent the steady-state after 400 s heating at or , respectively. A contour map of these sensitivities in Fig. 2b illustrates the impact of heater geometry on sensitivity, calculated using Eq. 1. Changing the shape from a circular to a rectangular heater and elongating it at a fixed surface area ( ) increases this sensitivity (Supplementary Fig. 2), as more heat is directed above the blood vessel rather than to surrounding tissues. FEA simulations of various geometries at physiologically relevant VA reveals the best thermal dissipation effect with a heater, the geometry employed for all experimental devices in this study. FEA temperature distributions on the skin surface and blood vessel wall after 400 s of heating further illustrates the advantage of this geometry (Supplementary Figs. 3 and 4).
Localized FEA measurements across the heater surface show the highest flow sensitivity at the furthest downstream location, which we chose as the location for our contact sensor (Supplementary Fig. 5). This component exhibits a stronger dependence on device-tissue contact than the heater, as indicated by thermal resistance calculations, allowing us to distinguish between good and poor conformal adhesion. Figure 2c and Supplementary Fig. 6 display the benchtop flow monitoring system, including (i) instrument control by a custom LabVIEW program for supplying direct current to the heater and monitoring temperature-dependent voltage and resistance values, (ii) analog front-end circuitry for the thermal sensing components, and (iii) a benchtop vascular flow model controlling through a vascular phantom. We calculate a uncertainty in temperatures measurements, arising from power supply variations in these instruments (Supplementary Methods and Supplementary Table 3). Infrared (IR) thermography in Fig. 2d demonstrates the application of direct current and subsequent joule heating of a heater on a device conformally mounted atop a silicone phantom skin. A continuous resistive trace, replacing the dense array of surface-mounted resistors in previous systems, ensures spatially uniform heating and device pliability. Initiating patent-flow conditions at 180 s beneath the skin causes a drop in surface IR temperature.
Device calibrations facilitate the conversion of measured resistance changes from the heater and sensors to temperature measurements (Supplementary Figs. 7-9). Heater resistance values are converted to temperature according to the positive temperature coefficient of resistance for copper ( ). Recorded resistance values for each NTC sensor are related to temperature according to the extended Steinhart-Hart equation:
where is temperature, is measured resistance, is the reference resistance at , and , and D are fitting coefficients (Supplementary Fig. 9). The standard protocol for each heating experiment involves 120 s of equilibration without heating, 400 s of heating, 400 s of no heating, and applying a low pass filter to all data (Supplementary Figs. 10 and 11), ensuring experimental precision and reproducibility. Figure 2e displays heater measurements upon application of direct current at variable power density ( , and ). Steady-state temperature rises (defined as 400 s , unless otherwise stated) exhibit a linear dependence on PD under no-flow conditions (Fig. 2f). Subsequent experiments utilize a PD of , ensuring that maximal heating under no-flow conditions remain below the
threshold for high heat pain receptor activation (TRPV2 ) and within safe limits for clinical dermal devices . Coalescence of heater and contact sensor temperatures under no-flow, along with reduced noise from air convection, confirms the integrated foam layer’s efficient thermal insulation (Supplementary Fig. 12).
Benchtop experiments with phantom skin and AVF models
Figure 3 analyzes the impacts of vascular flexibility, material dimensions, and skin on thermal flow sensing. Two phantom models, representing a VA fistula and graft, incorporate a high biomimetic vessel and a low medical grade ePTFE vascular graft, respectively (Fig. 3a and Supplementary Fig. 13). Both vessels are enveloped by a biomimetic adult human skin layer ( ), atop which the device mounts for thermal flow sensing. Physical and thermal properties of each phantom model component are summarized in Supplementary Table 4. Flow sensitivities for both benchtop phantom models are presented in Fig. 3b and Supplementary Fig. 14. The relative flow sensing at steady-state ( ) exhibits a robust binary response in both phantoms between patent-flow and no-flow conditions. FEA simulations shows good agreement with these experimental values, with increasing sensitivity at disease-relevant flows in the biomimetic vessels (Fig. 3c). Additionally, the first 20 s of heating help distinguish the impact of vessel wall conduction, aiding in the differentiation between a high k fistula and a low k graft (Supplementary Fig. 15).
Next, we explore changes in VA vessel and ID as a function of tissue remodeling (e.g., venous stenosis-induced wall thickening and stenosis). Measurements of both biomimetic and graft vessel compliance reveal bimodal responses to increasing , corresponding to an increase in biofluid pressure (Fig. 3d). The biomimetic vessel shows a significant monotonic increase in outer diameter (OD) and decrease in , while the graft vessel exhibits limited compliance. FEA simulations of heater response under patent-flow (Fig. 3e) reveal negligible dependence on vessel OD but a strong dependence on , as the vessel wall’s conductive resistance ( ) is more dimension-sensitive than the vessel diameter-related convective resistance ( ). Derivations of these values assume a fully developed velocity profile in the laminar regime . Overall, higher flexibility, reduced , and increased k of the biomimetic vessel over the graft significantly improve heat transport and flow sensitivity ( vs. 1%, respectively, in Fig. 3c).
To understand the impact of transcutaneous measurements, we apply a skin layer ( ) to both phantom vessels under binary patent-flow and no-flow conditions (Fig. 3f and Supplementary Fig. 16). Under no-flow conditions, the added skin layer acts as a heat sink (see black arrows). Slope analysis between no-flow and patent-flow conditions shows that thermal impedance from skin does reduce sensitivity. When this tissue depth is increased to 6 mm , representing the maximal tissue thickness for a patent VA, flow-dependent sensitivity drops from (Fig. 3c) to (Supplementary Fig. 17). Regardless, variations in tissue surface hydration do not impact our results, even after 9 thermal cycles (Supplementary Fig. 18). This is attributed to the large heater dimensions and prolonged actuation times that enable deep tissue measurements ( ) and negate the impact of varying epidermal thermal conductivities . We further demonstrate reliable detection of transient changes under thermal steady state (SS) conditions using multiple flow sweeps (cycling between 600 and ) (Fig. 3g).
In vivo application of the VA flow sensing device
Large animal studies involving swine provide a close match to human vasculature and physiology . Moreover, their femoral arteries possess equivalent geometries and blood flow dynamics to that of human fistulas (see Supplementary Table 5). The excess tissue depths of our swine femoral arteries , however, necessitate on-vessel
Fig. 4 | In vivo device application and monitoring in swine. a Image illustrating conformal wrapping of device around curved vasculature using flexible wrappings. b Camera images depicting an encapsulated device application on the skin (left), the exposed femoral artery in a swine before device application(middle), and after the device is mounted on the femoral artery (right). c Thermal measurements (left) and time constants (right) with no contact, chest, neck, artery, and vein tissues are depicted for experimental data and FEA simulations. Time constant is defined as the elapsed time when the heater transient reaches of (no contact and neck technical replicates, chest technical replicates, vein and artery technical replicates, collected for two pigs with the exception of chest measurements). d Device measurements prior to and during (shaded) vasospasms. Inset photograph shows the femoral artery before and during contraction. e-g On-body
demonstration of varied blood flow using a device epidermally adhered over the cephalic vein. Camera image (e) of arm with mounted device and corresponding IR image of skin surface temperatures under the same treatment conditions without the device. The point of compression at 1 cm distal to device and direction of blood flow are indicated. Time-course thermal measurements (f) with the heater and environment sensor show heating to over 400 s , followed by manual occlusions and reperfusion events for 150 s each. Variable compressive loads are plotted on the right axis. Response reported as change in heater after each 150 s of venous compression (g) with the region of partial occlusion indicated (shaded). Device operation at . Data are presented as mean values SEM. . Ordinary one-way ANOVA with Šídák post hoc for pairwise comparisons. Source data are provided as a Source Data file.
convection. Reperfusion at 240 s causes a significant drop in temperature consistent with restored blood flow.
Assessment of environmental fluctuation on flow sensing
Next, we investigate device sensitivity to rapid, local fluctuations in blood temperature and flow proximal to the device (Fig. 5). Sequential proximal injections of cold ( ) and warm ( ) saline boluses into the arterial lumen from an angiographic catheter tip positioned proximally to the measurement site show an immediate change in heater and sensor temperatures, followed by recovery of vessel surface temperatures ( ) to steady-state values (Fig. 5b, c). Exponential fitting of recovery profiles from the decoupled environment sensor (Fig. 5d and Supplementary Fig. 28) yields time constants of 8.5 s and 12.8 s for warm and cold injections, respectively. Benchtop modeling of the biomimetic vessel and synthetic graft (Fig. 5e, f), with or without a skin layer, reveals similar trends for warm ( ) and cold saline injections. Notably, time constants for the biomimetic vessel ( and ) closely match those of the swine model (Fig. 5g). Thermal dissipation through skin delays response times approximately three-fold when the device is applied to skin. We observe similar trends with the low k graft model. Baseline drift is ruled out by measurements of ambient room, circulating biofluid, and saline temperatures (Supplementary Fig. 29). Furthermore, parallel testing with devices on control vessels (e.g., neighboring jugular vein and benchtop tributary vessels) reveal that adjacent blood flow effects do not impact local measurements (Supplementary Fig. 30). We next interrogate the device response to acute changes in
blood flow on a model for vascular hemorrhage and reperfusion as an advanced application (Fig. 5a and h). Steady-state heater increase from (Step 1) under patent-flow conditions to (Step 2) upon suture removal . This dramatic change is not detected with the environment sensor (Supplementary Fig. 31), showing that blood supply, and not its temperature, is altered during Step 2. Upon venous repair (Step 3, 310 s ), heater drops rapidly when reestablishing blood flow. These studies underscore the sensitivity of our device to local changes in blood temperature under vascular injury conditions, regardless of vessel type or the presence of a skin barrier. This suggest our technology may be clinically useful for real-time detection of internal hemorrhages.
Assessing the device’s flow sensing capability in a swine model of endovascular occlusion
We percutaneously deliver a balloon catheter inside the common femoral artery to simulate significant hemodynamic changes during variable balloon inflation creating stenoses or complete occlusion (Fig. 6). Balloon inflation at proximal, medial, and distal positions relative to the device location (Fig. 6a, b) are visualized with digital subtraction angiography (Fig. 6c) and Doppler ultrasound imaging measurements (Supplementary Fig. 32). Device actuation during successive occlusion (balloon inflation) and reperfusion (balloon deflation) events ( each) (Fig. 6d) reveal position-dependent responses. At the proximal location, vascular balloon inflation triggers a rapid rise in heater and environment sensor values. Occlusion at the medial position causes a diminished signal from the environment
Fig. 5 | In vivo assessment of local, rapid, temperature changes in the blood. a Schematics illustrating local perturbations to upstream blood temperature and supply, through saline injections and vascular tears, respectively. Injections with 30 mL of cold and warm saline in the artery occur proximal to the mounted device. Angiogram of unobstructed artery with mounted device, point of injection, and direction of flow indicated. c In vivo flow sensing and rapid response to successive injections. d Percent recovery profiles for cold and warm saline injections fitted with an exponential form to yield time constants of 12.8 s and 8.5 s , respectively, to reach quasi-steady-state conditions defined as of . e Benchtop modeling of cold ( ) or warm ( ) saline injections through a biomimetic vessel at patent-flow without and with a biomimetic skin layer. Corresponding data with a synthetic graft. Time constants for panels ( ) ( technical replicates in triplicate per vascular models). h Time course data of venous exsanguination and repair of a swine (e). jugular vein showing differences in sensed under (step 1) no damage, (step 2) leakage following suture removal, and (step 3) repair through venous closure conditions. Simultaneous sensing of undamaged control vessel during step 2 shows no systemic response. Device PD is for all runs. Data are presented as mean values SEM. , . Two-way ANOVA with Šídák post hoc for pairwise comparisons of warm and cold injections into each phantom model. Tukey post hoc test is applied for comparisons between the graft and biomimetic vessel, with and without a skin layer. Source data are provided as a Source Data file.
sensor as unobstructed blood movement upstream cools the sensor. Repositioning to a medial from a slightly proximal position during the second cycle repeat better demonstrated this phenomenon. Distal occlusions are less apparent which we attribute to residual flow through collateral circulation. Minimal position adjustments reflect variable contributions of branched arteries to local perfusion, as shown by altered response profiles during each distal occlusion event. Overall, we observe a trend of decreasing time constants for occlusions ( ) and heater as the site of stenosis transitions from a proximal to a distal position (Fig. 6e). Control measurements on an unobstructed neighboring vessel show no long-range dependence (Supplementary Fig. 33).
To validate the findings from the swine studies, we generate similar stenoses in benchtop biomimetic and graft vessels (Fig. 6f, g and Supplementary Fig. 34). It is important to note that these models do not reproduce positive pressure in human-like vasculature. In the absence of flow during proximal occlusions, the soft biomimetic vessel collapses and loses contact with the device. A bimodal response with the environment sensor exemplifies this due to progressive vessel deflation during proximal occlusions, followed by a data spike as the vessel re-inflates with flow (Supplementary Fig. 35). To maintain positive fluid pressure, only partial occlusions ( ) of the biomimetic vessel are performed in Fig. 6f. Synthetic graft vessels possess a higher modulus and thus do not experience this collapse. Overall, we observe similar trends to the in vivo data, with the response magnitude being highest and lowest for proximal and distal occlusions, respectively. Both in vivo swine and benchtop vessel data show a strong dependence on the location of vascular occlusion relative to time constants.
Real-time detection of vascular occlusion and wearable device biocompatibility
A final demonstration of our device capabilities is the real-time detection of thrombosis, which is the most common and unpredictable mode of VA failure in patients receiving dialysis (Fig. 7). We induce an acute vascular occlusion within a segment of the femoral artery using a minimally invasive catheter-directed endovascular approach. Initial injections with thrombin are unsuccessful in generating a thrombus, likely due to anticoagulative heparin circulating in the bloodstream. Subsequent injection of gel embolic material (GEM, Obsidio ) vessel induces clot formation in the artery (Supplementary Fig. 36). Following equilibration ( 300 s ), the device we detects injection, thrombosis, and reperfusion events (Fig. 7a). We note that heater signal accurately rebounds to pre-embolization flow temperatures upon removal of the embolic material using a suction catheter. Reinjection of GEM generates a full thrombus and rapid increase in heater signal. Associated angiograms at 1680 s and 2400 s document the initial unobstructed (patent-flow) and later obstructed (no-flow) vascular site, respectively (Fig. 7b and Supplementary Movie 2-3).
Finally, we assess the biocompatibility of our thermal flow sensing devices. FDA safety guidelines allow an increase in local temperatures at the skin-device interface of up to , which corresponds to a increase over normal skin temperature . Our in vivo measurements show an increase of during normal device operation on tissues with underlying blood flow, which does not exceed IEC clinical limit guidelines for devices in contact with tissue . Furthermore, histological evaluation of harvested tissues show no remarkable change
Fig. 6 | In vivo assessment of flow-mediated by balloon catheter occlusions. a Schematic illustrating local occlusions at positions proximal, medial, and distal to the flow sensing device. b Images of deflated and inflated balloon catheter. c-e In vivo arterial occlusions and reperfusion events in a swine model. c Angiography of occlusions at locations proximal, medial, and distal to the mounted device. The point of occlusion and direction of flow are indicated with arrows. d Real-time flow sensing during successive occlusion (no-flow) and reperfusion (patent-flow) events at each location ( technical replicate measured in triplicate). Asterisks (*) indicate the time at which angiograms in (c) were recorded. e. Table summarizing
time constants for occlusion ( ), reperfusion ( ), and heater response to occlusion ( technical replicates, mean ± SD). f, g Real-time flow sensing during successive occlusions ( for biomimetic vs for graft) and reperfusion (patent-flow) events with the biomimetic vessel (f) and vascular graft (g) at each location ( technical replicates measured in triplicate). Inset data summarizes time constants for , and heater after occlusion at each location. The PD is for all experiments. Data are presented as mean values SEM. Source data are provided as a Source Data file.
in the vessel or skin morphology, despite continuous activation (Fig. 7c and Supplementary Figs. 37-38).
Discussion
This study demonstrates a thermal flow sensing device that accurately monitors hemodynamic alterations in a vascular access observed in CKD patients receiving dialysis, including the adaptive response period during AVF maturation, vascular stenosis, acute thrombotic events, or complete failure. Compared with previous reports, our device demonstrates a monotonic response to flow changes with increasing sensitivity as a function of vascular stenosis. Through comprehensive flow-dependent benchtop modeling of both fistulas and grafts, we demonstrate how vessel material and geometry affect device sensitivity. We envision this platform to monitor progressive venous stenosis in a fistula or the rapid onset of thrombosis in a graftboth are primary clinical modes of obstructive VA failure. Ideally, a wearable thermal flow sensing device can detect problems at home or in a general clinical setting, such as during dialysis. Direct observation of temperature normalization during corrective measures establishes a new standard of care for dialysis patients in the clinic and at home. In theory, this sensitive feedback platform could find applications for the following users: (1) patients engaging in self-care to identify and manually extrude a forming clot without emergency surgery, (2)
surgeons fixing a tear or clearing a clot, and/or (3) healthcare workers tasked with preventing blood leakage during dialysis therapy.
Limitations
As indicated by experimental measurements and simulation results, the temperature curves depend relatively weakly on flow rate in the regime of high flow rate. Thus, from a practical standpoint, experimental error due to environmental fluctuations or other forms of noise could be significant in such cases. One future approach to explore exploits co-integrated, adjacent flow sensors, to allow for differential measurements, with decreased sensitivity to noise. Another consideration in practical use is that continuous measurements for long periods of time may lead to adverse effects of cumulative heating. Because rapid changes in flow are not expected, in practice, the measurements will be performed in a low duty cycle mode, perhaps once every one 2 h . In this way, cumulative heating can be neglected. Alternatively, the measurement accuracy can be improved by use of cooling rather than heating, simply because the threshold changes in temperature for activating pain receptors are larger for cooling.
Future iterations of this device will utilize lower PD and pulsed actuation to further reduce power consumption and total temperature change. Incorporation of closed-loop sensor feedback can prevent overactuation under no-flow conditions and enable transient actuation
Fig. 7 | In vivo detection of femoral artery occlusion in a swine model.
a Schematic depiction of complete vascular occlusion due to thrombosis in a device-mounted blood vessel. Representative real-time thermal flow sensing before and after catheter mediated vascular occlusion using gel embolic material (GEM) to simulate thrombosis. ( animals). Digital subtraction angiograms taken at 1680 s and 2400 s , depicting patent-flow at 1680 s and no-flow at 2400 s . The flow
sensing device is depicted with a dashed outline and dark electrode pads, thrombus location is depicted with a black arrow, and the direction of flow is depicted with a white arrow. c Representative microscopy images of histology sections of thrombosed and sham control femoral artery at low (i, ii) and high magnifications (iii, iv) ( animals). Thrombosed blood is denoted as Th. The PD is . Scale bars, 100 or . Source data is provided as a Source Data file.
under flow. These devices will rely on information from contact and environment sensors to decide if physical adjustments of the adhered device or recalibration of baseline tissue temperatures is necessary, prior to making flow measurements. For wearable-only applications, where vessel mounting is not necessary, we can significantly reduce the form factor of our current device by removing pendant suture/ electrode pads. Further miniaturization efforts will focus on increased flexibility of the device flexPCB by segmentation of the heater and anchoring sections with flexible serpentines to enable device adhesion over tortuous VAs. Shortening the overall heater length will also be advantageous in scenarios where superficial tissue depths vary along the vessel. We envision a wireless, wearable device that continuously measures VA patency exploiting low-cost commercial components (rechargeable Li ion battery, power management integrated circuits, analog front end, and active control circuitry for the actuator components of the circuit) and the integration of a Bluetooth low energy (BLE) system architecture to allow for seamless data transfer during normal user activities.
Methods
Fabrication of the thermal flow sensor
A laminate composite film of copper/polyimide/copper ( , Pyralux AP8535R, DuPont Inc.) served as the substrate for the VA sensing device. An ultraviolet laser (Protolaser U4, LPKF) processed the film by ablating the copper layers, which patterned the traces, bond pads, and unplated vias. A structural copper divider was integrated within the center of the actuator to account for overlapping scan fields. Successive washes in stainless steel liquid flux (Worthington Inc), deionized water, and isopropanol (Fisher Scientific) prepared the resulting flexible printed circuit board (fPCB) for component population by removing remaining surface oxides. Thin flexible wire ( 36 AWG Copper Stranded Wire, Calmont Inc.) established an electrically conductive connection through via holes between the copper layers of the fPCB. A non-conductive epoxy (Loctite 3621, Henkel) mechanically bonded the surface mount components to the fPCB and reflow soldering with low-temperature solder paste ( 4900 P SAC305, MG Chemicals) established electrical contact between the surface mount thermistors (NTCG063JF103FT, TDK Corporation, Japan) and the copper pads to wired data acquisition electronics.
Encapsulation and skin adhesive
(Poly)methyl methacrylate (PMMA) was spin-cast ( ) and baked ( ) to generate a solid hydrophobic film ( ) to facilitate encapsulated device removal by careful peeling. Encapsulation began by spin-casting ( ) a thin layer ( ) of silicone prepolymer (1:1, Ecoflex 00-30, Smooth-On Inc., USA) onto the PMMA surface, gently adding a thin fiberglass fabric layer, allowing it to slowly settle and wick in the uncured silicone ( 30 s ), and baking on a hotplate to cure ( ). Another layer of silicone prepolymer was spin-casted ( ), the fPCB was added and gently compressed into the silicone layer from above at room temperature ( 3 min ) to remove air bubbles, followed by baking ( ) to cure. Fresh silicone prepolymer was applied in excess to coat the device and placed in a vacuum desiccator ( 2 min ) to fill and remove air gaps, spun ( ) to remove excess, and baked ( ) to generate a defined device coating . Devices at this step thick) were used in Figs. 1 and 2 to demonstrate flexibility or for IR thermal characterization, respectively. Devices for benchtop and in vivo flow sensing were further insulated with a layer of polyurethane foam (DRX3011, Dynarex CuraFoam, USA) that were laser cut into defined geometries and treated with waterproofing spray (275619, RustOleum, USA). Briefly, a thin layer of flexible epoxy (Sil-Poxy, Smooth-On Inc., USA) was smeared onto the silicone surface, the foam layer was manually compressed on top of the encapsulated device, and allowed to cure ( 15 min ) at room temperature. Fresh silicone prepolymer spincoated ( ) and cured at room temperature ( 20 min ) to generate an encapsulated, water-resistant topcoat . Encapsulated working devices were peeled away from PMMA-coated slides and cut along the fPCB outline with overlap. For on-tissue benchtop and in vivo testing, a laser (Universal Laser Systems, USA) formed the outline of a commercially available medical-grade adhesive (3 M 2477 P) with a double-sided silicone-acrylate construction , which was bonded to the bottom silicone of the encapsulated device. Peeling back the liner material on the skin-facing acrylate adhesive prior to tissue application allowed for conformal device contact.
Micro-CT
MicroCT imaging was performed using SkyScan 1276 (Bruker, Kontich, Belgium) using an aluminum and copper filter, an X-ray source set at current. Image stacks were acquired using 600 ms
exposure, at pixel size, rotation at rotation steps, with two frames averaging. The 3D image stacks were reconstructed using NRecon software and InstaRecon CBR Server (version 1.7.4.6, Bruker, Kontich, Belgium) after adjustment for random movements, beamhardening correction, ring artifact reduction, and smoothing. 3D rendering of the imaging stacks was visualized using CTVox software (version 3.3. O r1383, Bruker, Kontich, Belgium).
Finite-element analysis
The commercial software Fluent ( 2020 R2 version) was used to investigate the thermal response in tissues caused by thermal actuation of the device, as previously reported . Analyses were threedimensional and transient, accounting for heat transfer in fluids and solids at ambient temperature. Two simulation models were constructed based on experimental setups discussed in this manuscript. The first model incorporated tissue, vessel, fluid, and device, with the device situated in a planar configuration above the tissue. The second model comprised only the vessel, fluid and device, with the device curved around the vessel directly. The fluid within the vessel was discretized using fine hexahedral elements, thereby ensuring the accuracy of the calculations. Power delivered to the heated area of the sensor matched experimental values ( , and ), and the temperature of the entire upper surface of the sensor was recorded . The outer walls were adiabatic except for the fluid inlet and outlet of each model. Initial temperatures of the fluid and solids were set to 300 K . The fluid inlet was maintained at a constant mass flow rate ( ) throughout the duration of a single simulation. Key thermal parameters used in the simulation included thermal conductivity, specific heat capacity, and density, as shown in Supplementary Table 4. Simulations of benchtop experiments defined water as the fluid, SynDaver skin as the tissue, and SynDaver vessel or ePTFE as the corresponding fistula or graft materials, respectively. Simulations of in vivo studies utilized human blood, skin, and vessel material parameters as model inputs. Geometric parameters such as vessel diameter, thickness, and depth within skin were varied for each simulation to match experimental conditions in this manuscript.
Thermal transport analysis using a thermal equivalent circuit
A thermal resistance circuit (TRC) was built to analyze the thermal transport from the heater device through the vessel wall to the fluid flow in the vessel (Supplementary Figs. 5 and 24). Since the thermal boundary layer in the flow developed along the 60 mm long heater device, the heater was considered as three 20 mm long elements to depict different heat convection at the initial (Heater, 0 ), medium (Heater,m), and sensor (sensor) parts of the heater. The three elements had identical heat input (Q) from the heater device. The majority of the input heat (Q) was transferred through the device, device-vessel interface, vessel wall and finally convected to the fluid flow. The rest of the heat was lost into the environment via natural air convection. Thermal impedances of each heat transfer barrier were calculated as thermal resistances in the table. The trace thermal resistance ( ) of the heater Cu resistive traces was calculated by , where was the element length, was the equivalent k of the heater, was the heater cross-section area, and was the contact area between each element and the vessel. The device thermal resistance ( ) from the heater to the device-vessel interface was , where was the device trace thickness and was the trace equivalent k . The thermal resistance of the vessel wall was , where was the vessel wall thickness and was the vessel thermal conductivity depending on the vessel dimension and material. The heat loss to environment was estimated from experiments. The flow convective resistance was calculated based on
the heat transfer coefficient correlation , ID, x in the thermal entry region of a hydraulically fully developed pipe flow The thermal resistance of heat convection was , where , ID, x. Solving for the thermal equivalent circuit, the three elements’ temperatures were obtained. The heater temperature was the average of the three elements temperatures, . The sensor at the end of the heater had the temperature . By matching the temperatures from the circuit analysis and the experiment, between the device and vessel was obtained, ranging from (good contact) and (poor contact) depending on the contact quality .
Data acquisition and instrumentation
Simultaneous data acquisition for two devices occurs through the universal serial bus (USB) and general-purpose Interface Bus (GPIB) with a host laptop (Thinkpad T560, Lenovo). The entire system consists of two DC current sources (6220/2182 A, Tektronix Keithley), two 6.5-digit digital multimeters (DMM, USB-4065, National Instruments), and a multifunction I/O device (USB-6212 DAQx) (Supplementary Fig. 6). Acquired thermistor resistances are converted to a voltage using a potential divider (resistor half-bridge configuration) to create a ratiometric relationship between thermistor resistance and voltage output. All instrumentation and data were controlled and recorded via a custom interface (LabVIEW 2018, National Instruments), and processed with custom algorithms (MATLAB R2022b, Mathworks). Voltage samples are acquired at a sampling frequency of 5 Hz .
Signal filtering and data analysis
Power spectral density calculations showing primarily low-frequency noise appear in Supplementary Fig. 11. A low pass filter (second order Butterworth infinite impulse filter) at 0.04 Hz was applied to the raw voltage signals to remove any high-frequency signatures. Zero-phase filtering removes any inherent phase lag and ambient 60 Hz noise related to thermal measurements. Data analysis of each device requires the conversion of measured resistances from two sensors and one actuator (Heater) into temperatures and then into . Unless otherwise stated, time constants are calculated as the time it takes to reach quasi-steady-state conditions defined as of values at a given .
Heater and sensor calibration
The heater and sensor resistances were calibrated on a hotplate, surrounded by an air convection limiting barrier, to temperatures measured by IR imaging (A6255sc, FLIR Systems) and thermocouple readings (HH374, Omega Engineering Inc.). IR emissivity ( ) values for each device material were fitted using the known hotplate and thermocouple readings (Supplementary Figs. 7-8). Devices were adhered to a hotplate equilibrated at variable temperatures for 10 min , then was supplied to the heater. Voltage measurements from the heater and sensors were collected with the DMM and DAQx, respectively, over 20 s intervals ( 5 Hz sampling) in triplicate for each device ( devices). Voltages were converted into resistances and plotted as a function of measured temperature. Fitting coefficients for the sensors were calculated using the Steinhart-Hart equation (Supplementary Fig. 9). Calibrations for the heater and sensors were compared with literature fits using the temperature coefficient of resistance (TCR) of copper ( ) and manufacturer specifications for the thermistors, respectively.
Benchtop vascular flow models
Flow through vascular phantom models was controlled with a peristaltic pump (M6-3L, U.S. Solid M6-3L) and monitored using an in-line turbine flow meter (FTB312, Omega) at representative blood , , and . A recirculating water bath maintained at simulated artificial blood temperature. Vascular phantoms consisted of either a biomimetic vessel (SKU 131200, SynDaver) or medical grade ePTFE vascular graft (Gore-Tex ), with or without a surrounding layer of biomimetic skin (SKU 141500, SynDaver) (Supplementary Fig. 13 and Supplementary Table 4). Vessel expansion as a function of was measured with a digital outside micrometer (IP65, Mitutoyo), and internal fluid pressure was measured with an in-line fluid pressure gauge at positions both immediately proximal and distal to the vessel of interest. Devices were conformally adhered on the vascular phantom surface along the path of flow, with the environment sensor situated proximally, under a fixed (e.g., ). The standard thermal sensing protocol consisted of a no-heat thermal equilibration step ( 120 s ), heating step ( 400 s ), and no-heat cooling step ( 400 s ) (Supplementary Fig. 10). Unless otherwise specified, heaters were actuated at .
Benchtop saline injections and occlusions
Benchtop saline injections and balloon catheter occlusions utilized a branched tributary vessel for mounting a secondary control device for simultaneous measurements during local experiments on the primary vessel (Supplementary Fig. 29). The inlet for saline injections was situated 4 cm distal to the vascular branch and 4 cm proximal to the device location. A 4-channel thermoprobe (HH374, Omega) was used to monitor ambient room, circulating biofluid, vascular phantom surface, and injected saline (1x PBS) temperatures. Prior to injections, cold saline was stored in a freezer, and warm saline was incubated in a heated water bath. Syringe injections ( 30 mL over 10 s ) of either cold or warm saline into the circulating biofluid ( ) were performed in triplicate at 85 s intervals (200, 285, 370 s device heating). Occlusions were simulated through inflation of a Sceptor C occlusion balloon catheter (BC0415C, MicroVention Inc.) with saline containing blue food dye for visualization. To ensure full occlusion of test vessels, the deflated balloon was encapsulated in a thin layer of EcoFlex 30. Occlusions for 150 s were performed in triplicate at positions 1 cm proximal, medial, or 1 cm distal from the device at 300 sec intervals (200, 500, 800 s device heating).
In-vivo Swine model
Two male Yorkshire swine (S&S Farms, Brentwood, CA) weighing were premedicated using intramuscular injection of 5 mg kg-1 tiletamine-zolazepam (Telazol, Zoetis, NJ, USA), 2 mg ml-1 xylazine (Vedco inc., MO, USA), and 0.02 mg kg-1 glycopyrrolate (Wyeth, NJ, USA) followed by endotracheal intubation. Animals were placed in a supine position, and anesthesia was maintained using inhalation of isoflurane at flow rate of . Throughout the procedure, electrocardiogram, transcutaneous oxyhemoglobin saturation ( ), end-tidal concentration, inspired oxygen fraction, and core temperature were continuously monitored and documented. Ultrasound-guided (Butterfly iQ + , Butterfly Network Inc. Guilford, CT) common carotid access was performed to place a 5 French artery sheath (Cook Medical, IN, USA) followed by the introduction of a 5 French Cobra catheter (Cook Medical, IN, USA). The catheter was positioned proximal to the femoral artery, and digital subtraction angiography of the respective surgical side was performed at baseline using a floor-mounted mobile fluoroscope (OEC Elite C-Arm, GE HealthCare, Chicago, IL). Using ultrasound, the femoral artery and vein were identified and traced on the skin overlying the vessels. Over a 0.035 -inch guidewire (Glidewire, Terumo, NJ, USA), a millimeter mustang balloon dilatation catheter (Boston Scientific) was coaxially delivered to the femoral artery under fluoroscopic guidance. Standard Doppler ultrasound imaging of the femoral artery was performed with an ultrasound transducer (Butterfly iQ+, Butterfly Network Inc. Guilford, CT) at by applying the transducer directly onto the skin over the artery region to confirm arterial occlusion or patency with high specificity using B-mode, or color Doppler to measure
flow velocity. Digital subtraction angiography (DSA) at 8 frames per second acquisition was performed using a 10 mL injection of dilution of iohexol contrast agent with physiologic saline (Omnipaque, ; GE HealthCare); at that was administered via the intra-arterial catheter. The thermal flow sensor was placed immediately anterior to the femoral artery over a length of 6 cm . The suture pads on the sensor (Fig. 1d) were wrapped around the femoral artery. The pads were sutured together with silk suture allowing a nonconstricting but snug fit around the artery. After all appropriate measurements were obtained, the animal was euthanized.
Transdermal assessment of vascular flow
The common carotid artery and the jugular vein were traced on the skin using ultrasound then the flow sensor was placed over the skin over the marked locations using an adhesive film. The standard device operation protocol consisted of a no-heat thermal equilibration step , a heating step for sensing, and a no-heat cooling step (Supplementary Fig. 10). Unless otherwise specified, heaters were actuated at . Control flow measurements using ultrasound were correlated to the data obtained from the flow sensor.
Subcutaneous assessment of vascular flow
To validate transdermal flow measurements and verify the effect of skin on the sensor accuracy, we placed the flow sensor directly over the vessel following surgical exposure. The femoral artery and veins bundle were identified and traced on ultrasound and by palpation, where the pulsation of the superficial part of the medial saphenous artery disappears in the skin fold between the gracilis and sartorius muscle. A 7 cm longitudinal superficial skin incision in the groin cranial to this point was made to avoid inadvertently damaging the medial saphenous vessels was made using electrocautery, and the subcutaneous tissues were dissected down using blunt-tip scissors. The fascia division of the sartorius and gracilis muscle was divided cranial to the penetration site of the medial saphenous vessels, first with small blunt-tip surgical forceps and then digitally. The two muscle groups were separated with a small self-retaining tissue retractor while taking care not to damage the femoral nerve and vessels. The artery and vein were exposed using blunt dissection, and the femoral vein was exposed just below and medial to the artery and femoral nerve. 3-4 drops of lidocaine in isotonic solution were applied to the surface of the femoral artery and vein to prevent vasospasm. Scissors were used to enter the sheath and the femoral artery was dissected. A bolus of Heparin (Mylan, PA, USA) was administered intravenously to induce anticoagulation. Anticoagulation was titrated to reach an activated clotting time of over 200 s using an iSTAT system (Abbot Laboratories, IL, USA). After exposure, the sensor was then placed on top of the artery and fixed with sutures passed through soft tissue on both ends of the vessel. Blood flow distal to the flow sensor location was documented using ultrasound Doppler reading at baseline and after inducing partial or complete occlusion. The balloon inflation was adjusted to obtain Doppler values of , or correlating with data acquired from the flow sensor. This is important to confirm the sensitivity of the flow sensor reading using a clinically approved modality. Flow data acquisition was repeated 3 times with deflation of the balloon after each reading. Syringe injections ( 30 mL over 10 s ) of either cold ( ) and warm ( ) saline through the catheter into the artery (surface temperature ) were performed in triplicate at 85 sec intervals ( device heating). Angiography of the vessel under patent-flow was used to visualize the catheter tip, positioned proximal to the device location inside the swine femoral artery, before infusions. Thromboses were simulated by catheter mediated intra-arterial infusion of gel embolic material (GEM, Obsidio) at the device location. The standard device operation protocol consisted of a no-heat thermal equilibration step , heating step for sensing, and no-heat cooling step
(400 s) (Supplementary Fig. 10). Unless otherwise specified, heaters were actuated at . At the conclusion of each experiment, the skin and the vessel segment that has the flow sensor application was explanted for histopathology.
Forearm measurements and variable occlusions
On-body studies (IRB Protocol STU0020542, Northwestern Memorial Hospital, Chicago, IL) were carried out with informed consent from the participant. Devices were epidermally adhered over the right cephalic vein (visible through skin). IR thermography confirmed the path and location of this vessel. The acrylate side of the adhesive was mounted on the skin, and the device was allowed to equilibrate for three minutes. The standard device operation protocol consisted of a no-heat thermal equilibration step ( 120 s ), followed by a continuous heating step at PD of . Manual occlusions and reperfusions of the cephalic vein were conducted by compression of the vessel through the skin with a plastic probe ( ), followed by a release at 90 s and 150 s of heating. The point of compression (POC) was proximal to the device. Identical experiments were conducted at the same location with the IR camera in the absence of the device to observe thermal changes in the skin surface as vasculature experienced blood flow disturbances. Automated occlusion and reperfusion events were simulated with a tensile tester (Mark-10, ESM303) equipped with a 100 N test module and 10 mm parallel plate geometry to apply variable force loads (10.0, , or 0.4 N for 150 s followed by 150 s at 0 N ).
Histopathology
Explanted tissues were fixed in 10% buffered formalin and processed for paraffin embedding using a standard protocol. Tissue sections were stained with H&E, as previously described . To rule for vascular injury, morphometric evaluation was performed on serially cut sections by an operator blinded to the study.
Statistics and reproducibility
No statistical method was used to predetermine sample size. No data were excluded from the analyses. The experiments were not randomized. There was no blinding in this study. This study employed six calibrated devices used interchangeably across each experiment without bias, and animal studies involved two swine.
Reporting summary
Further information on research design is available in the Nature Portfolio Reporting Summary linked to this article.
Data availability
All data supporting the findings of this study are available within the article and its supplementary files. Any additional requests for information can be directed to the corresponding authors. Source data and custom LabVIEW data acquisition files are provided with this paper. Source data are provided with this paper.
Code availability
Relevant MATLAB scripts for data analysis and signal processing are uploaded to Code Ocean (DOI: 10.24433/CO.5920840.v1). Code for FEA calculations are available from Y.D.
References
Perlman, R. L. et al. Quality of life in chronic kidney disease (ckd): a cross-sectional analysis in the renal research institute-ckd study. Am. J. Kidney Dis. 45, 658-666 (2005).
Choi, H. S. et al. Trends in the incidence and prevalence of endstage renal disease with hemodialysis in entire korean population: a nationwide population-based study. Med. (Baltim.) 100, e25293 (2021).
Pastan, S. & Bailey, J. Dialysis therapy. N. Engl. J. Med. 338, 1428-1437 (1998).
Himmelfarb, J. & Ikizler, T. A. Hemodialysis. N. Engl. J. Med. 363, 1833-1845 (2010).
Queeley, G. L. & Campbell, E. S. Comparing treatment modalities for end-stage renal disease: A meta-analysis. Am. Health Drug Benefits 11, 118-127 (2018).
Pockros, B. M., Finch, D. J. & Weiner, D. E. Dialysis and total health care costs in the united states and worldwide: the financial impact of a single-payer dominant system in the us. J. Am. Soc. Nephrol. 32, 2137-2139 (2021).
Rivara, M. B. et al. Extended-hours hemodialysis is associated with lower mortality risk in patients with end-stage renal disease. Kidney Int. 90, 1312-1320 (2016).
Tandon, T., Sinha, A. D. & Agarwal, R. Shorter delivered dialysis times associate with a higher and more difficult to treat blood pressure. Nephrol. Dial. Transpl. 28, 1562-1568 (2013).
Lacson, E. & Brunelli, S. M. Hemodialysis treatment time: a fresh perspective. Clin. J. Am. Soc. Nephrol. 6, 2522-2530 (2011).
Oliver, M. J. The science of fistula maturation. J. Am. Soc. Nephrol. 29, 2607-2609 (2018).
Clinical practice guidelines for vascular access. Am. J. Kidney Dis. 48, S176-S247 (2006).
Al-Jaishi, A. A., Liu, A. R., Lok, C. E., Zhang, J. C. & Moist, L. M. Complications of the arteriovenous fistula: a systematic review. J. Am. Soc. Nephrol. 28, 1839-1850 (2017).
Salman, L. et al. A multicenter randomized clinical trial of hemodialysis access blood flow surveillance compared to standard of care: the hemodialysis access surveillance evaluation (hase) study. Kidney Int. Rep. 5, 1937-1944 (2020).
MacRae, J. M. et al. Arteriovenous access failure, stenosis, and thrombosis. Can. J. Kidney Health Dis. 3, 2054358116669126 (2016).
Natta, L. et al. Soft and flexible piezoelectric smart patch for vascular graft monitoring based on aluminum nitride thin film. Sci. Rep. 9, 8392 (2019).
Neville, R. F., Gupta, S. K. & Kuraguntla, D. J. Initial in vitro and in vivo evaluation of a self-monitoring prosthetic bypass graft. J. Vasc. Surg. 65, 1793-1801 (2017).
Kersjes, R., Liebscher, F., Spiegel, E., Manoli, Y. & Mokwa, W. An invasive catheter flow sensor with on-chip cmos readout electronics for the on-line determination of blood flow. Sens. Actuators Phys. 54, 563-567 (1996).
Miller, F., Thambidorai, S., Kuraguntla, D. & Gupta, S. Wearable device for continuous, noninvasive monitoring of vascular access health and fluid status in hemodialysis patients. J. Am. Coll. Cardiol. 75, 1282 (2020).
Signore, M. A. et al. Fabrication and characterization of aln-based flexible piezoelectric pressure sensor integrated into an implantable artificial pancreas. Sci. Rep. 9, 17130 (2019).
Kwon, K. et al. An on-skin platform for wireless monitoring of flow rate, cumulative loss and temperature of sweat in real time. Nat. Electron. 4, 302-312 (2021).
Krishnan, S. R. et al. Continuous, noninvasive wireless monitoring of flow of cerebrospinal fluid through shunts in patients with hydrocephalus. npj Digital Med. 3, 29 (2020).
Krishnan, S. R. et al. Epidermal electronics for noninvasive, wireless, quantitative assessment of ventricular shunt function in patients with hydrocephalus. Sci. Transl. Med. 10, eaat8437 (2018).
Webb, R. C. et al. Epidermal devices for noninvasive, precise, and continuous mapping of macrovascular and microvascular blood flow. Sci. Adv. 1, e1500701 (2015).
Klinker, L. et al. Balloon catheters with integrated stretchable electronics for electrical stimulation, ablation and blood flow monitoring. Extrem. Mech. Lett. 3, 45-54 (2015).
Lu, D. et al. Implantable, wireless, self-fixing thermal sensors for continuous measurements of microvascular blood flow in flaps and organ grafts. Biosens. Bioelectron. 206, 114145 (2022).
Tian, Y. et al. Self-adaptive epidermal blood flow sensor for highflux vascular access monitoring of hemodialysis patients npj Flexible Electronics 8, 62 (2024).
Madhvapathy, S. R. et al. Advanced thermal sensing techniques for characterizing the physical properties of skin. Appl. Phys. Rev. 9, 041307 (2022).
Lamas, J. A., Rueda-Ruzafa, L. & Herrera-Pérez, S. Ion channels and thermosensitivity: trp, trek, or both? Int. J. Mol. Sci. 20, 2371 (2019)
Dirler, J., Winkler, G. & Lachenmeier, D. W. What temperature of coffee exceeds the pain threshold? Pilot study of a sensory analysis method as basis for cancer risk assessment. Foods 7, 83 (2018)
ISO. Medical Electrical Equipment-Part 1: General Requirements For Basic Safety and Essential Performance https://www.iso.org/ standard/59536.html (2020).
Bergman, T. L. & Lavine, A. S. Fundamentals of Heat and Mass Transfer 8th edn, Vol. 1072 (Wiley, 2017).
Madhvapathy, S. R. et al. Reliable, low-cost, fully integrated hydration sensors for monitoring and diagnosis of inflammatory skin diseases in any environment. Sci. Adv. 6, eabd7146 (2020).
Madhvapathy, S. R. et al. Epidermal electronic systems for measuring the thermal properties of human skin at depths of up to several millimeters. Adv. Funct. Mater. 28, 1802083 (2018).
White, F. C., Roth, D. M. & Bloor, C. M. The pig as a model for myocardial ischemia and exercise. Lab Anim. Sci. 36, 351-356 (1986).
Sauerbrey, A. et al. Establishment of a swine model for validation of perfusion measurement by dynamic contrast-enhanced magnetic resonance imaging. BioMed. Res. Int. 2014, 390506 (2014).
Kordzadeh, A., Chung, J. & Panayiotopoulos, Y. P. Cephalic vein and radial artery diameter in formation of radiocephalic arteriovenous fistula: a systematic review. J. Vasc. Access 16, 506-511 (2015).
FDA. Transdermal and Topical Delivery Systems-Product Development and Quality Considerations Guidance for Industry. https:// www.fda.gov/media/132674/download (2019).
Qiu, L., Ouyang, Y., Feng, Y., Zhang, X. & Wang, X. In vivo skin thermophysical property testing technology using flexible thermosensor-based method. Int. J. Heat. Mass Transf. 163, 120550 (2020).
Albadawi, H. et al. Nanocomposite hydrogel with tantalum microparticles for rapid endovascular hemostasis. Adv. Sci. 8, 2003327 (2021).
Acknowledgements
This work made use of the International Institute for Nanotechnology (IIN), the Keck Foundation and the State of Illinois, through the IIN. R.O. acknowledges support from NIH (RO1CA257558, RO1HL140951, R01DK130566, R01HL165176 and R01HL137193) and the Mayo Clinic Clinician Investigator Award. H.M.A acknowledges support from the National Institute of Neurological Disorders and Stroke of the National Institutes of Health under Award No. F31NS115422. Y.D. acknowledges support from the Natural Science Foundation of Shanghai (23ZR1428600). A.S.C thanks the University of California and a UCSB Faculty Research Grant for financial support. We thank the Querrey-Simpson Institute for Bioelectronics for support of this work. The authors are grateful to Natasha Cao for editing
and proofreading assistance. The content is solely the responsibility of the authors and does not necessarily represent the official views of the National Institutes of Health. Figures 1c, 6a, and 7a were partly generated using Servier Medical Art, licensed under CC BY 4.0 (https:// creativecommons.org/licenses/by/4.0/) and modified in PowerPoint. Figure 1a, b, and Supplementary Fig. 26a were created in BioRender. Carlini, A. (2024) https://BioRender.com/k53c078 and modified in PowerPoint.
Author contributions
R.O. and J.A.R. were involved in the conception of the study. H.A., Y.H., R.O., J.A.R., and A.S.C. asked scientific questions and designed the experiments. V.K., A.R., and A.S.C. designed proprietary data acquisition protocols. A.S.C. fabricated devices, performed benchtop experiments, and analyzed the data. Y.D. and T.Y. performed computational simulations, and analyzed the data. H.A., R.J.F., Z.Z., and R.O. performed swine model surgeries and analyzed clinical imaging. H.M.A. and A.S.C. performed device measurements on swine models. C.C. generated 3D graphic renderings. A.S.C. wrote the manuscript. H.M.A., R.O., and J.A.R. acquired funding.
Correspondence and requests for materials should be addressed to Yonggang Huang, Rahmi Oklu, John A. Rogers or Andrea S. Carlini.
Peer review information Nature Communications thanks John Ho, and the other, anonymous, reviewer(s) for their contribution to the peer review of this work. A peer review file is available.
Publisher’s note Springer Nature remains neutral with regard to jurisdictional claims in published maps and institutional affiliations.
Open Access This article is licensed under a Creative Commons Attribution 4.0 International License, which permits use, sharing, adaptation, distribution and reproduction in any medium or format, as long as you give appropriate credit to the original author(s) and the source, provide a link to the Creative Commons licence, and indicate if changes were made. The images or other third party material in this article are included in the article’s Creative Commons licence, unless indicated otherwise in a credit line to the material. If material is not included in the article’s Creative Commons licence and your intended use is not permitted by statutory regulation or exceeds the permitted use, you will need to obtain permission directly from the copyright holder. To view a copy of this licence, visit http://creativecommons.org/ licenses/by/4.0/.
(c) The Author(s) 2024
State Key Laboratory of Mechanical System and Vibration, School of Mechanical Engineering, Shanghai Jiao Tong University, Shanghai, China. Shanghai Key Laboratory of Digital Manufacture for Thin-walled Structure, Shanghai Jiao Tong University, Shanghai, China. Department of Mechanical Engineering, Northwestern University, Evanston, IL, USA. Querrey Simpson Institute for Bioelectronics, Northwestern University, Evanston, IL, USA. Department of Biomedical Engineering, Northwestern University, Evanston, IL, USA. School for Engineering of Matter, Transport and Energy, Arizona State University, Tempe, AZ, USA. Division of Vascular and Interventional Radiology, Mayo Clinic, Scottsdale, AZ, USA. The Laboratory for Patient-Inspired Engineering, Mayo Clinic, Scottsdale, AZ, USA. Chair Emeritus, Division of Vascular and Endovascular Surgery, Mayo Clinic, Phoenix, AZ, USA. Feinberg Medical School, Northwestern University, Chicago, IL, USA. Massachusetts General Hospital, Boston, MA, USA. Department of Materials Science and Engineering, Northwestern University, Evanston, IL, USA. Department of Civil and Environmental Engineering, Northwestern University, Evanston, IL, USA. Simpson Querrey Institute, Northwestern University, Evanston, IL, USA. Department of Chemistry, Northwestern University, Evanston, IL, USA. Department of Neurological Surgery, Northwestern University, Evanston, IL, USA. Department of Electrical and Computer Engineering, Northwestern University, Evanston, IL, USA. Department of Computer Science, Northwestern University, Evanston, IL, USA. Department of Chemistry and Biochemistry, University of California at Santa Barbara, Santa Barbara, CA, USA. Interdisciplinary Program in Quantitative Biosciences, University of California at Santa Barbara, Santa Barbara, CA, USA. Center for Polymers and Organic Solids, University of California at Santa Barbara, Santa Barbara, CA 93106, USA. These authors contributed equally: Yonggang Huang, Rahmi Oklu, John A. Rogers, Andrea S. Carlini. e-mail: y-huang@northwestern.edu; Oklu.Rahmi@mayo.edu; jrogers@northwestern.edu; acarlini@ucsb.edu